Tracking Emissions and Mitigation Actions: Current Practice in ...
87
Tracking Emissions and Mitigation Actions: Current Practice in China, Germany, Italy, and the United States CPI Working Paper Climate Policy Initiative Pat Hogan Angela Falconer Valerio Micale Alex Vasa Yuqing Yu Xiaolu Zhao February 2012
-
Upload
khangminh22 -
Category
Documents
-
view
3 -
download
0
Transcript of Tracking Emissions and Mitigation Actions: Current Practice in ...
Tracking Emissions and Mitigation Actions: Current Practice in China, Germany, Italy, and the United States
CPI Working Paper
Climate Policy InitiativePat HoganAngela FalconerValerio MicaleAlex VasaYuqing YuXiaolu Zhao
February 2012
About CPIClimate Policy Initiative (CPI) is a policy effectiveness analysis and advisory organization whose mission is to assess, diagnose, and support the efforts of key governments around the world to achieve low-carbon growth.
CPI is headquartered in San Francisco and has offices around the world, which are affiliated with distinguished research institutions. Offices include: CPI at Tsinghua, affiliated with the School of Public Policy and Management at Tsinghua University; CPI Berlin, affiliated with the Department for Energy, Transportation, and the Environment at DIW Berlin; CPI Rio, affiliated with Pontifical Catholic University of Rio (PUC-Rio); and CPI Venice, affiliated with Fondazione Eni Enrico Mattei (FEEM). CPI is an independent, not-for-profit organization that receives long-term funding from George Soros.
DescriptorsSector
Region
Keywords
All
China, Germany, Italy, United States
MRV, Institutions
ContentsIntroduction 1
Background ....................................................................................................................................................................................................... 1CPI Global MRV Survey .............................................................................................................................................................................. 1Why Track Emissions and Mitigation Actions? ............................................................................................................................... 2International Drivers of Domestic MRV ............................................................................................................................................... 2
China 7Key Points ......................................................................................................................................................................................................... 71.1 Introduction ................................................................................................................................................................................................ 71.2 Tracking Emissions: Inventories within the National Communications ........................................................................... 81.3 Tracking Mitigation Actions: Annual Progress Reports, SME System and the Top 1000 Enterprises ..............11
Germany 20Key Points .......................................................................................................................................................................................................202.1 Introduction .............................................................................................................................................................................................202.2 Tracking National Emissions: the National System of Emissions (NaSE) .....................................................................222.3 Tracking Mitigation Actions: the Integrated Energy and Climate Program and the EU Monitoring
Mechanism ............................................................................................................................................................................................28
Italy 35Key Points ....................................................................................................................................................................................................... 353.1 Introduction .............................................................................................................................................................................................363.2 Tracking Emissions: National Inventory ......................................................................................................................................383.3 Tracking Mitigation Actions: National Reporting, International Reporting and Individual Measures .............42
United States 47Key Points .......................................................................................................................................................................................................474.1 Introduction ............................................................................................................................................................................................ 484.2 Tracking Emissions: National Inventory and EPA Reporting Rule .................................................................................. 504.3 Tracking Mitigation Actions: National Communication and Individual Measures...................................................55
Summary 62
Acronyms 66
References 69
Endnotes 74
iA CPI Working Paper
Tracking Emissions and Mitigation Actions February 2012
iA CPI Working Paper
Executive SummaryConcerns about climate change have prompted many nations to track their greenhouse gas (GHG) emissions and the impact of their efforts to reduce those emissions. Domestic systems to measure, report, and verify (MRV) GHG emissions and mitigation outcomes help countries meet their domestic policy objectives by informing the development, tracking progress in implementation, and evaluating the outcomes of climate mitigation policies. Domestic MRV systems can also build trust among nations, provide confidence in the effectiveness of international agreements, and inform the design of such agreements.
This report represents the first stage of a broader CPI effort to characterize, evaluate, and draw insights from existing domestic MRV systems for emissions and mitigation actions in four of the major emitters – China, Italy, Germany, and the United States. It surveys the systems already in place in these countries, describes the practices and institutions involved, and highlights common objectives that all four countries are pursuing. An upcoming CPI study will evaluate these MRV systems using common criteria.
Based on our initial research, the following are key observations regarding the domestic MRV systems operating in China, Germany, Italy, and the United States. Country-specific observations follow.
Emissions• Systems for energy data collection and the estimation of energy-related emissions are
well-established. This is not surprising given the long-running strategic interest in energy issues in each of these countries, and the historical need for robust energy statistics to inform related policy decisions. Energy use also accounts for the majority of GHG emissions in these countries, and the measurement infrastructure already in place to collect energy statistics can be readily adapted to estimating emissions.
• Emissions are calculated in a fairly consistent manner in all of these countries, in accordance with internationally accepted methodologies.
Mitigation actions• For mitigation actions, studies of anticipated emission reductions are more common
than studies of the actual emission reductions achieved, both at the individual policy and national policy portfolio level. The cost-effectiveness of mitigation actions is not systematically assessed. Assessment methodologies are diverse, varying across agencies, sectors, and types of mitigations actions. None of the countries in this study apply standard methods to assess the outcomes of the full portfolio of their mitigation actions.
• Existing capacities for MRV of emissions and mitigation outcomes vary substantially. International commitments are an important driver of both the existence and design of domestic MRV systems. Generally, those countries with binding international mitigation commitments, such as Germany and Italy, are doing more to MRV the outcomes of their mitigation actions.
iiA CPI Working Paper
Tracking Emissions and Mitigation Actions February 2012
ChinaEmissions• China’s initial National Communication, submitted in 2004, included its first GHG
inventory, covering 1994 emissions. China will release its second National Communication in 2012, which will include a more developed inventory covering 2005 emissions of all six primary GHGs.
• While China’s early MRV efforts were largely in response to international drivers, its systems are increasingly oriented to supporting domestic policies and programs.
• China’s institutional capacity to monitor emissions has developed substantially since its first National Communication. This has been driven in part by the infrastructure China has developed for its Statistics Indicators, Monitoring, and Examination (SME) system.
Mitigation actions• China has published three annual progress reports on its climate policies and mitigation
actions (2008-2010). These reports provide increasingly detailed descriptions and assessments of mitigation actions and outcomes. However they provide little information on the sources of data and methodologies for assessing mitigation outcomes.
• China’s most significant mitigation actions are the policies and measures established to achieve its national energy-intensity targets. The SME system is China’s primary vehicle for tracking progress towards these targets; its principal functions are to measure, report, and verify energy intensity data and track policy implementation.
GermanyEmissions• Germany has completed eight comprehensive national GHG inventories. It has a
centralized inventory program and has built substantial institutional capacity and expertise in the Federal Environment Agency (UBA).
• Installation-, technology-, and sector-specific data is not made public but is available to UNFCCC reviewers.
• The UBA maintains a rigorous system for quality assurance/quality control and uncertainty analysis. Inventory improvement plans capture issues identified in the external verification of methods and calculations by UNFCCC review teams and quality issues that cannot be addressed immediately so that they can be addressed in the subsequent reporting period.
Mitigation actions• Germany’s climate protection programs have evolved and expanded over time. The level
of monitoring of individual policies varies. • There is no comprehensive guidance on the data sources and methodologies that should
be used to track the outcomes of each mitigation action. Monitoring is fragmented among the responsible ministries and agencies and is coordinated jointly by the Ministry of Environment and the Ministry of Economics and Technology.
• Continuous mandatory reporting systems, such as for the feed-in tariff, have strengthened institutional and technical capacity for ex-post evaluation of renewables policy.

iiiA CPI Working Paper
Tracking Emissions and Mitigation Actions February 2012
ItalyEmissions• Italy’s GHG inventory system is well developed, underpinned by strong institutional
capacity and expertise within the Institute of Environmental Protection and Research (ISPRA) and the long- standing National Statistical System (NSS). Estimates are improved using entity level reporting under the EU Emissions Trading System and strong cooperation between ISPRA and a number of governmental and research institutions, industrial associations, and industries.
• National statistics and country specific emission factors are used in almost all emission estimates. Plant specific emission factors are also used where available. The most advanced IPCC methodological approach (Tier 3) is used for the energy industries sector; Tier 2 in most other sectors; and Tier 1 for particularly difficult subsectors, such as agriculture and land use, land-use change, and forestry.
• ISPRA is planning a number of improvements to the inventory, in particular in the LULUCF, agriculture and waste sectors. A National Land Use Inventory has recently been completed and will improve inventory estimates, and a National Registry for Carbon Sinks is in development.
• Quality assurance and quality control procedures are well developed but have room for improvement in terms of uncertainty analysis and independent review.
Mitigation actions• A cross-governmental Technical Committee on GHG emissions annually assesses the
implementation status of climate change measures. The Committee’s outputs are not publicly available.
• Beyond the national inventory, there is no comprehensive system in place for tracking the emissions outcomes or cost-effectiveness of the overall portfolio of mitigation actions, nor guidelines for evaluating individual policy outcomes. Instead, MRV procedures are defined within individual policy legislation and rarely provide direct information on GHG savings.
• National communications to the UNFCCC and related reporting to the European Commission serve as the only consistent vehicles for comprehensive reporting of mitigation actions in Italy.
• Limited external verification of mitigation action monitoring and reporting takes place.
United StatesEmissions• Having completed 15 comprehensive GHG inventories, the United States has a well-
established inventory program with substantial institutional capacity and expertise. The agencies that support the inventory, such as the U.S. Energy Information Administration (EIA), are characterized by strong relevant sectoral expertise and a long history of data collection and analysis.
• All of the data and methods underlying the United States’ GHG inventory estimates are publicly available and free online.
• Most of the data in the U.S. inventory is verified using internal cross-checks of different data sets and a comprehensive system of quality assurance/quality control and
ivA CPI Working Paper
Tracking Emissions and Mitigation Actions February 2012
uncertainty analysis procedures. Energy data in particular is considered reliable, in part because it is trusted by the energy industry itself.
• The U.S. is implementing a new entity-level GHG reporting requirement that will cover approximately 90% of national emissions. This new system will complement the existing inventory program and inform future policy decisions.
Mitigation actions• The U.S. has no consistent, government-wide methodology for evaluating the emission
outcomes of mitigation actions, though the new Greenhouse Gas Reporting Program may provide some indication of overall impact both in aggregate and at the sub-sector level. Mitigation policies are tracked individually by their respective implementing agencies according to the MRV rules governing each policy. Agencies develop their own means of estimating emission outcomes.
• Many of the policies listed as mitigation actions in the U.S. National Communications do not have GHG emissions mitigation as an original or primary objective.
• Policy-level verification requirements are generally more developed for mandatory regulations and in some cases include sampling and testing of regulated products (e.g. appliances) and certification by third party auditors. However, many U.S. mitigation actions are voluntary programs that rely on self-reported data and uncertain verification requirements.
• The U.S. has mechanisms in place for general oversight of agency and policy performance, including climate policies. These include the role played by the Government Accountability Office, which reviews policy outcomes at Congress’ request.
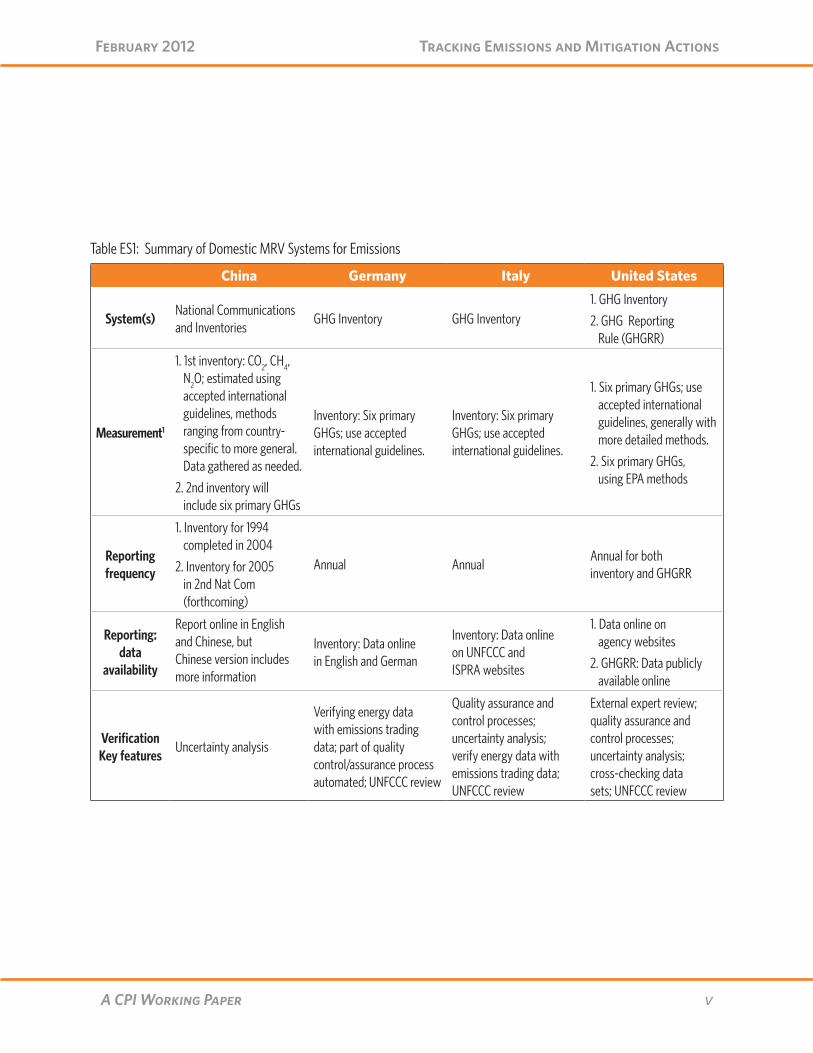
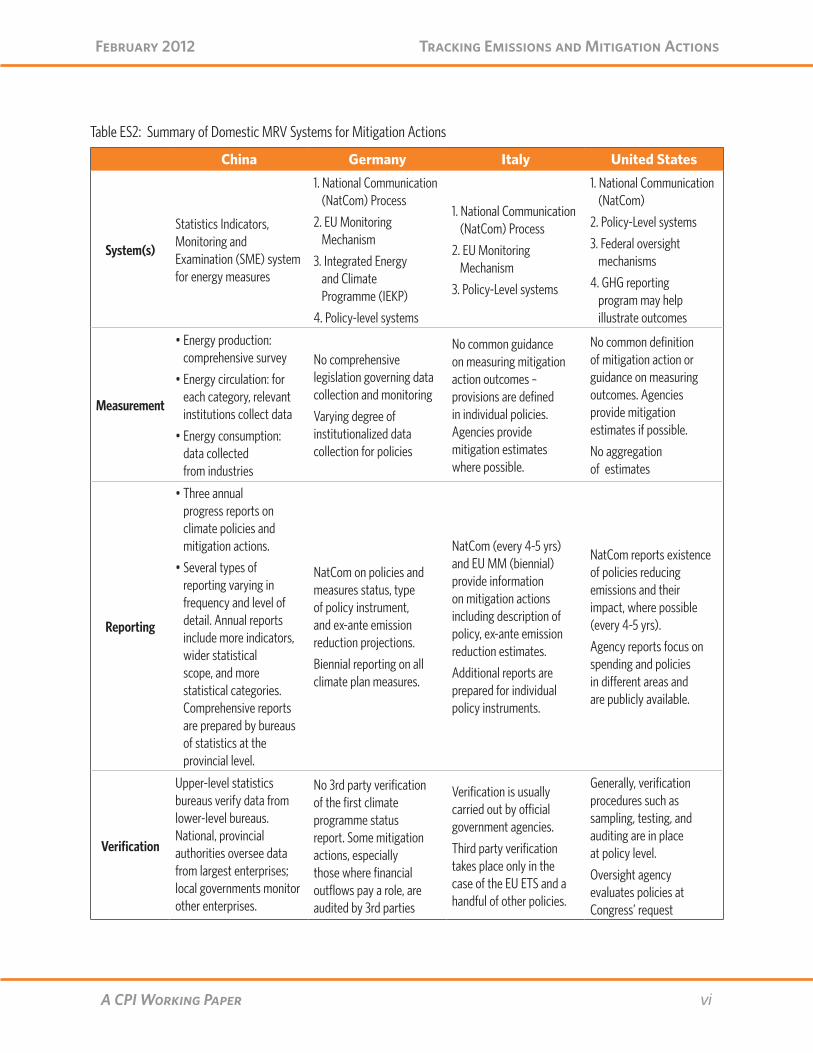
Tables ES1 and ES2 summarize the key features of the domestic MRV systems in each of these countries. More detailed versions of both tables appear in the conclusion of this report.
In the next phase of this study, CPI will evaluate the extent to which these domestic MRV systems help these countries meet their domestic policy and other objectives. This evaluation will identify good practices and gaps in existing systems. Results will be published later in 2012.
In the final phase of this project, CPI will assess the extent to which these systems meet emerging domestic and international needs, and how they might inform the design of future international requirements. We expect this comparison to yield valuable insights into shared challenges, opportunities, and areas for collaboration.
vA CPI Working Paper
Tracking Emissions and Mitigation Actions February 2012
China Germany Italy United States
System(s)National Communications and Inventories
GHG Inventory GHG Inventory 1. GHG Inventory
2. GHG Reporting Rule (GHGRR)
Measurement1
1. 1st inventory: CO2, CH4, N2O; estimated using accepted international guidelines, methods ranging from country-specific to more general. Data gathered as needed.
2. 2nd inventory will include six primary GHGs
Inventory: Six primary GHGs; use accepted international guidelines.
Inventory: Six primary GHGs; use accepted international guidelines.
1. Six primary GHGs; use accepted international guidelines, generally with more detailed methods.
2. Six primary GHGs, using EPA methods
Reporting frequency
1. Inventory for 1994 completed in 2004
2. Inventory for 2005 in 2nd Nat Com (forthcoming)
Annual AnnualAnnual for both inventory and GHGRR
Reporting: data
availability
Report online in English and Chinese, but Chinese version includes more information
Inventory: Data online in English and German
Inventory: Data online on UNFCCC and ISPRA websites
1. Data online on agency websites
2. GHGRR: Data publicly available online
Verification Key features
Uncertainty analysis
Verifying energy data with emissions trading data; part of quality control/assurance process automated; UNFCCC review
Quality assurance and control processes; uncertainty analysis; verify energy data with emissions trading data; UNFCCC review
External expert review; quality assurance and control processes; uncertainty analysis; cross-checking data sets; UNFCCC review
Table ES1: Summary of Domestic MRV Systems for Emissions
viA CPI Working Paper
Tracking Emissions and Mitigation Actions February 2012
China Germany Italy United States
System(s)
Statistics Indicators, Monitoring and Examination (SME) system for energy measures
1. National Communication (NatCom) Process
2. EU Monitoring Mechanism
3. Integrated Energy and Climate Programme (IEKP)
4. Policy-level systems
1. National Communication (NatCom) Process
2. EU Monitoring Mechanism
3. Policy-Level systems
1. National Communication (NatCom)
2. Policy-Level systems
3. Federal oversight mechanisms
4. GHG reporting program may help illustrate outcomes
Measurement
• Energy production: comprehensive survey
• Energy circulation: for each category, relevant institutions collect data
• Energy consumption: data collected from industries
No comprehensive legislation governing data collection and monitoring
Varying degree of institutionalized data collection for policies
No common guidance on measuring mitigation action outcomes – provisions are defined in individual policies. Agencies provide mitigation estimates where possible.
No common definition of mitigation action or guidance on measuring outcomes. Agencies provide mitigation estimates if possible.
No aggregation of estimates
Reporting
• Three annual progress reports on climate policies and mitigation actions.
• Several types of reporting varying in frequency and level of detail. Annual reports include more indicators, wider statistical scope, and more statistical categories. Comprehensive reports are prepared by bureaus of statistics at the provincial level.
NatCom on policies and measures status, type of policy instrument, and ex-ante emission reduction projections.
Biennial reporting on all climate plan measures.
NatCom (every 4-5 yrs) and EU MM (biennial) provide information on mitigation actions including description of policy, ex-ante emission reduction estimates.
Additional reports are prepared for individual policy instruments.
NatCom reports existence of policies reducing emissions and their impact, where possible (every 4-5 yrs).
Agency reports focus on spending and policies in different areas and are publicly available.
Verification
Upper-level statistics bureaus verify data from lower-level bureaus. National, provincial authorities oversee data from largest enterprises; local governments monitor other enterprises.
No 3rd party verification of the first climate programme status report. Some mitigation actions, especially those where financial outflows pay a role, are audited by 3rd parties
Verification is usually carried out by official government agencies.
Third party verification takes place only in the case of the EU ETS and a handful of other policies.
Generally, verification procedures such as sampling, testing, and auditing are in place at policy level.
Oversight agency evaluates policies at Congress’ request
Table ES2: Summary of Domestic MRV Systems for Mitigation Actions

1A CPI Working Paper
Tracking Emissions and Mitigation Actions February 2012
Introduction
BackgroundAgainst the backdrop of growing global concern about climate change, many countries – including all the major emitters – are examining the drivers of and trends in their greenhouse gas (GHG) emissions and are taking action to reduce those emissions. While the nature of these national actions varies widely, all are supported by domes-tic systems to measure, report, and verify (MRV) emissions and mitigation actions. These MRV systems help countries meet their domestic policy objectives by informing the development, tracking progress in implementation, and evaluat-ing the outcomes of climate mitigation policies. Weak MRV systems hamper efforts to target policy interventions, enforce existing standards, and improve performance over time.
Domestic MRV systems also help countries fulfill their international commitments. While interna-tional negotiations to date have focused on the need for and development of global MRV rules and institutions, domestic MRV systems can also help improve transparency, build trust among nations, and ultimately provide confidence in the effectiveness of international agreements. Domestic systems may also provide useful lessons for developing effective global MRV systems.
Despite their importance and relevance to inter-national discussions, there has been relatively little comparative analysis of domestic MRV practices. Recent research and collaboration efforts have begun to identify gaps in domes-tic MRV capacity in some countries, providing important platforms for international learning.2 Most research to date has focused on the design of international MRV regimes, however, with little systematic analysis of the MRV systems that already exist for both emissions and mitigation actions across developed and developing coun-tries. As a result, there is relatively low aware-ness and understanding of the systems already in place; whether these systems are sufficient
to meet respective national goals in these coun-tries; what’s working well and opportunities for improvement; how countries can learn from each other’s successes; and, ultimately, how well exist-ing domestic MRV systems position countries to meet emerging international needs.
CPI Global MRV Survey This report represents the first stage of a broader CPI effort to help answer the questions raised above. This project will characterize, evaluate, and compare existing domestic MRV systems for emissions and mitigation actions in four of the major emitters – China, Italy, Germany, and the United States – in which CPI is building local expertise and relationships with national institutions. These four countries vary in impor-tant ways, spanning developed and developing countries, parties and non-parties to the Kyoto Protocol, and have different types of mitigation policies and measures underway. This descriptive survey not only illustrates the diversity of national MRV systems, practices and institutions, but it also highlights that all countries are pursuing some common objectives. We expect comparison to yield valuable insights into shared challenges, opportunities, and areas for collaboration.
In the next stage of this study, CPI will evalu-ate these domestic MRV systems by applying common criteria to determine the extent to which they meet the basic objectives of national MRV systems. We also aim to identify best practices and gaps in existing systems. In the final phase of this project, CPI will assess the extent to which these systems meet emerging domestic and inter-national needs and how they might inform the design of future international requirements.
This background paper begins by defining MRV and laying out the rationale for domestic systems for tracking GHG emissions and mitigation actions. It then describes each country’s domestic systems.
2A CPI Working Paper
Tracking Emissions and Mitigation Actions February 2012
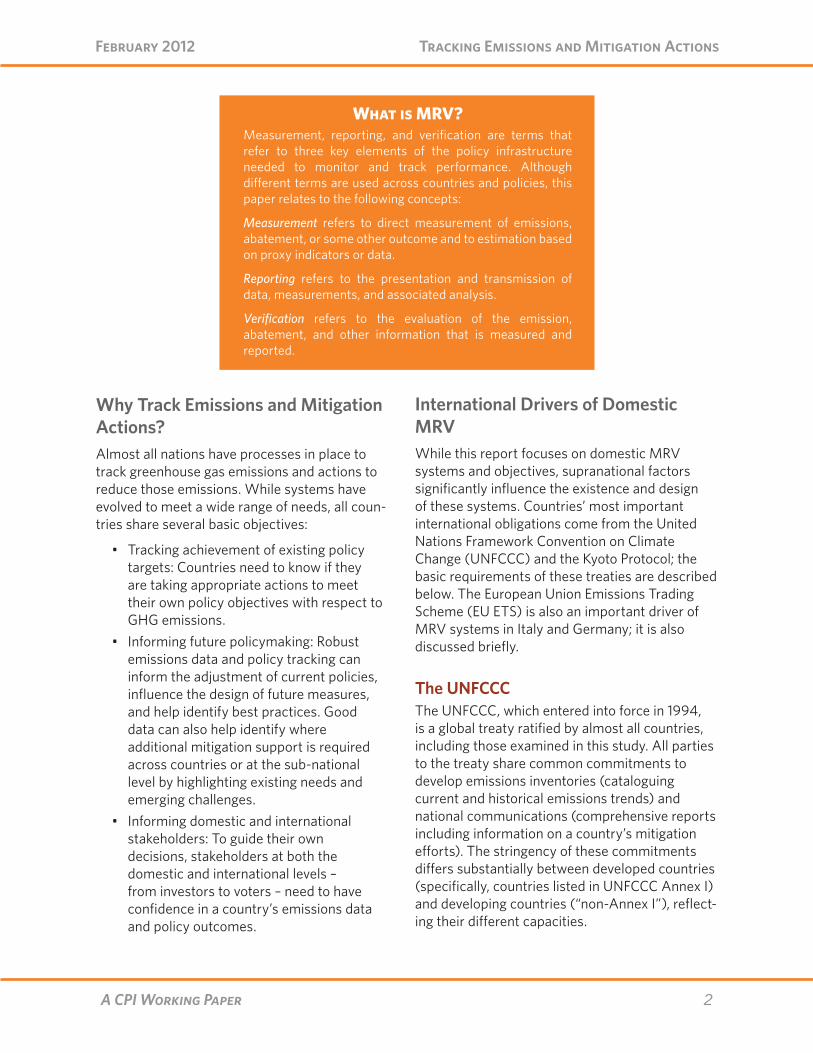
Why Track Emissions and Mitigation Actions? Almost all nations have processes in place to track greenhouse gas emissions and actions to reduce those emissions. While systems have evolved to meet a wide range of needs, all coun-tries share several basic objectives:
• Tracking achievement of existing policy targets: Countries need to know if they are taking appropriate actions to meet their own policy objectives with respect to GHG emissions.
• Informing future policymaking: Robust emissions data and policy tracking can inform the adjustment of current policies, influence the design of future measures, and help identify best practices. Good data can also help identify where additional mitigation support is required across countries or at the sub-national level by highlighting existing needs and emerging challenges.
• Informing domestic and international stakeholders: To guide their own decisions, stakeholders at both the domestic and international levels – from investors to voters – need to have confidence in a country’s emissions data and policy outcomes.
International Drivers of Domestic MRVWhile this report focuses on domestic MRV systems and objectives, supranational factors significantly influence the existence and design of these systems. Countries’ most important international obligations come from the United Nations Framework Convention on Climate Change (UNFCCC) and the Kyoto Protocol; the basic requirements of these treaties are described below. The European Union Emissions Trading Scheme (EU ETS) is also an important driver of MRV systems in Italy and Germany; it is also discussed briefly.
The UNFCCCThe UNFCCC, which entered into force in 1994, is a global treaty ratified by almost all countries, including those examined in this study. All parties to the treaty share common commitments to develop emissions inventories (cataloguing current and historical emissions trends) and national communications (comprehensive reports including information on a country’s mitigation efforts). The stringency of these commitments differs substantially between developed countries (specifically, countries listed in UNFCCC Annex I) and developing countries (“non-Annex I”), reflect-ing their different capacities.
What is MRV? Measurement, reporting, and verification are terms that refer to three key elements of the policy infrastructure needed to monitor and track performance. Although different terms are used across countries and policies, this paper relates to the following concepts:
Measurement refers to direct measurement of emissions, abatement, or some other outcome and to estimation based on proxy indicators or data.
Reporting refers to the presentation and transmission of data, measurements, and associated analysis.
Verification refers to the evaluation of the emission, abatement, and other information that is measured and reported.

3A CPI Working Paper
Tracking Emissions and Mitigation Actions February 2012
Emissions Inventory Development and National Communications under the UNFCCCTwo documents developed by the Intergovern-mental Panel on Climate Change (IPCC) underpin GHG emissions inventory development:
• Revised 1996 IPCC Guidelines for National Greenhouse Gas Inventories, which describes methodologies for estimating emissions, and
• Good Practice Guidance and Uncertainty Management in National Greenhouse Gas Inventories, which describes procedures for quality assurance and quality control (QA/QC) and for analyzing uncertainty within inventory emissions estimates.
Some countries have also begun incorporating methodologies from the 2006 IPCC Guidelines for National Greenhouse Gas Inventories, which revises the 1996 Guideline but has not yet been endorsed by the Conference of Parties under the UNFCCC.
The IPCC Guidelines provide different approaches for estimating emissions and sinks for six general source categories: energy; industrial processes; solvent use; agriculture; land use, land-use change and forestry (LULUCF); and waste. While methodologies differ in complexity, all coun-tries calculate emissions using the same basic approach. This approach involves summing the products of 1) activity data (which measures the occurrence of activities that produce GHGs) for each source category and 2) GHG emissions factors (emissions per unit of activity).
For each source category, the IPCC guidelines include multiple estimation methodologies. ‘Tier 1 methods’ are relatively simple, relying on national-level activity data and default average emission factors. These are used where more specific data is unavailable. Tiers 2 and 3 are more detailed:2 Tier 2 methods are generally used to develop country- and technology-specific emissions estimates, while Tier 3 methods rely on more detailed models for particular gases or on facility-level measurement.
Beyond these common guidelines and methods, Annex I and non-Annex I country inventory com-mitments differ in some important respects, as summarized in Table 1 below.
In addition to developing inventories, all parties are required to periodically submit national com-munications that describe emissions trends and climate mitigation and adaptation efforts. As with inventories, the requirements for these com-munications differ for developed and developing countries (see Table 1).
The Kyoto ProtocolThe Kyoto Protocol to the UNFCCC is a binding agreement under which 37 developed coun-tries and the European Community (including Germany and Italy but not the United States) have taken on the following additional specific commitments:
• Binding national emissions targets and international monitoring and reporting requirements to verify the achievement of these targets.
• National inventory systems with more specific structural requirements than those required by UNFCCC and penalties for non-compliance with those requirements.
Expert review teams can issue a “question of implementation” in their reports if a Party appears to be in violation of a particular commit-ment. Questions of implementation can be issued for late submission of progress reports or for incomplete implementation of the national inven-tory system. The Compliance Committee can suspend non-compliant countries from participa-tion in the Kyoto market mechanisms (Interna-tional Emissions Trading, the Clean Development Mechanism, and Joint Implementation).3
Most developing countries are parties to the Kyoto Protocol, however, they are not subject to these specific commitments.

4A CPI Working Paper
Tracking Emissions and Mitigation Actions February 2012
The four countries discussed in this report fall into three categories according to these interna-tional agreements: UNFCCC Annex I countries that have ratified the Kyoto Protocol (Italy and Germany); Annex I countries that have not ratified the protocol (United States); and Non-Annex I parties to the UNFCCC and the Kyoto Protocol (China). Table I1 below summarizes each coun-try’s current international obligations in light of these commitments.
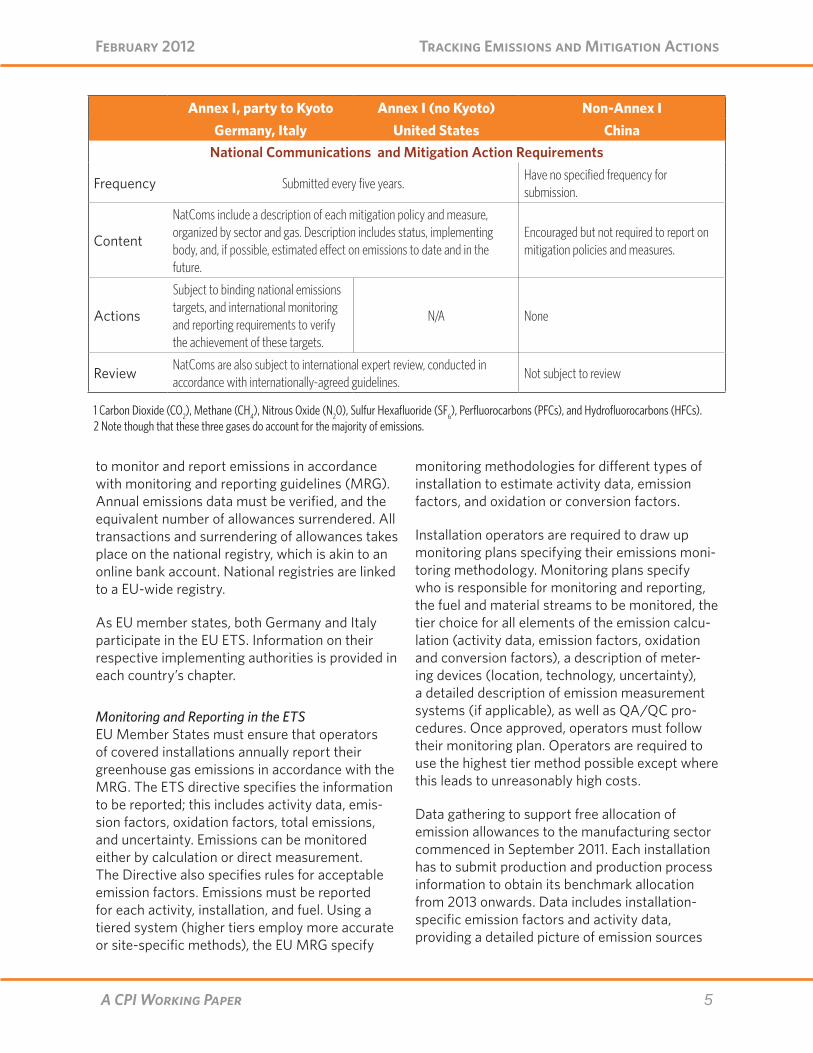
Table I.1: Summary of International Commitments under the UNFCCC and Kyoto Protocol
EU Emissions Trading System Overview The EU Emissions Trading System is an EU-wide cap-and-trade policy that limits GHG emissions from electricity generators and industrial facilities. The rules governing the system are adopted at the EU-level, but Member States are responsible for implementation within their borders. Domestic authorities thus carry out permitting and verifica-tion. The EU ETS requires covered installations
Annex I, party to Kyoto Annex I (no Kyoto) Non-Annex IGermany, Italy United States China
GHG Inventory requirements
Frequency Submit annual inventories to the UNFCCC in an electronic format.No set frequency (most have completed only one communication); can be submitted in hard copy.
Coverage
Trends in emissions of the six primary GHGs1, from 1990 to the most recent year for which data is available; includes sectoral background data.
Kyoto inventory systems have additional structural detail.
Trends in emissions of the six primary GHGs from 1990 to the most recent year for which data is available; includes sectoral background data.
Trends in emissions for CO2, CH
4, and
N2O only, with estimates for other gases
encouraged but not required2 from 1990 or 1994 for the first inventory and 2000 or later for the second; sectoral background data is not required.
Standards Use both the IPCC Guidelines and Good Practice Guidance and thoroughly document emissions estimation methods and data sources.
Use IPCC Guidelines; use of the Good Practice Guidance encouraged but not required. Documentation of methodologies is encouraged.
Methods Generally adopt higher-tier methods. Generally adopt lower-tier methods.
Review
Subject to annual review by expert teams following agreed upon review guidelines. At least once every five years, inventory systems are subject to a more detailed in-country review.
Parties to the Kyoto Protocol are subject to more rigorous review, and if review teams determine a Party’s inventory report or system is deficient, the Party may be judged to be out of compliance and subject penalties
Subject to annual review by expert teams following agreed upon review guidelines. At least once every five years, inventory systems are subject to a more detailed in-country review.
Not subject to review.
5A CPI Working Paper
Tracking Emissions and Mitigation Actions February 2012
Annex I, party to Kyoto Annex I (no Kyoto) Non-Annex IGermany, Italy United States China
National Communications and Mitigation Action Requirements
Frequency Submitted every five years.Have no specified frequency for submission.
Content
NatComs include a description of each mitigation policy and measure, organized by sector and gas. Description includes status, implementing body, and, if possible, estimated effect on emissions to date and in the future.
Encouraged but not required to report on mitigation policies and measures.
Actions
Subject to binding national emissions targets, and international monitoring and reporting requirements to verify the achievement of these targets.
N/A None
Review NatComs are also subject to international expert review, conducted in accordance with internationally-agreed guidelines.
Not subject to review
1 Carbon Dioxide (CO2), Methane (CH4), Nitrous Oxide (N20), Sulfur Hexafluoride (SF6), Perfluorocarbons (PFCs), and Hydrofluorocarbons (HFCs).2 Note though that these three gases do account for the majority of emissions.
to monitor and report emissions in accordance with monitoring and reporting guidelines (MRG). Annual emissions data must be verified, and the equivalent number of allowances surrendered. All transactions and surrendering of allowances takes place on the national registry, which is akin to an online bank account. National registries are linked to a EU-wide registry.
As EU member states, both Germany and Italy participate in the EU ETS. Information on their respective implementing authorities is provided in each country’s chapter.
Monitoring and Reporting in the ETSEU Member States must ensure that operators of covered installations annually report their greenhouse gas emissions in accordance with the MRG. The ETS directive specifies the information to be reported; this includes activity data, emis-sion factors, oxidation factors, total emissions, and uncertainty. Emissions can be monitored either by calculation or direct measurement. The Directive also specifies rules for acceptable emission factors. Emissions must be reported for each activity, installation, and fuel. Using a tiered system (higher tiers employ more accurate or site-specific methods), the EU MRG specify
monitoring methodologies for different types of installation to estimate activity data, emission factors, and oxidation or conversion factors.
Installation operators are required to draw up monitoring plans specifying their emissions moni-toring methodology. Monitoring plans specify who is responsible for monitoring and reporting, the fuel and material streams to be monitored, the tier choice for all elements of the emission calcu-lation (activity data, emission factors, oxidation and conversion factors), a description of meter-ing devices (location, technology, uncertainty), a detailed description of emission measurement systems (if applicable), as well as QA/QC pro-cedures. Once approved, operators must follow their monitoring plan. Operators are required to use the highest tier method possible except where this leads to unreasonably high costs.
Data gathering to support free allocation of emission allowances to the manufacturing sector commenced in September 2011. Each installation has to submit production and production process information to obtain its benchmark allocation from 2013 onwards. Data includes installation-specific emission factors and activity data, providing a detailed picture of emission sources

6A CPI Working Paper
Tracking Emissions and Mitigation Actions February 2012
from the manufacturing sectors covered under EU ETS. In turn, this will improve the quality of national inventories as emissions data calculated in national statistics can be compared to actual emissions in EU ETS installations.
National RegistriesEach EU Member State, plus Norway, Iceland, and Liechtenstein, has a national ETS registry; this is an electronic database used to administer EU ETS emissions allowances and Kyoto Proto-col units. The registry records the allocation of EU ETS allowances at the national and individual account level, as well as annual verified emissions from installations and transfers of allowances performed by account holders. In this way, the registry also provides the platform for the annual reconciliation of allowances against verified emissions.
National registries also provides the public with access to information and reports on each par-ticipant and on the performance of the trading scheme. All national registries are connected to the Community Transaction Log (CITL) and the UNFCCC’s International Transaction Log (ITL), which ensure adherence to the market rules of the EU ETS and the Kyoto Protocol respectively. CITL data - including installation-level verified emissions data and allocated and surrendered allowances - is published annually on the EU Commission website. Beginning in 2012, ETS operations will be centralized into a single EU registry. This new registry will be operated by the Commission and will replace all EU ETS registries currently hosted by individual Member States.
Verification in the ETSAnnual emissions and activity data submitted by operators, as well as monitoring methodologies, are subject to mandatory independent verifica-tion. The EU is moving toward a more centralized verification system: while national authorities currently accredit verifiers, the Commission will be empowered to do so in the future.
The remainder of this paper describes exist-ing domestic MRV systems for emissions and
mitigation actions in China, Germany, Italy, and the United States.
• Chapter 1, China, describes the institu-tional arrangements and key climate and energy policies in China. It then describes the processes behind China’s first and second GHG inventories and national communications, how they are both evolving, the recent efforts to summarize mitigation policies and actions and to assess their outcomes. The last section covers China’s Statistical Indicator, Monitoring, and Examination system for energy and its relationship to China’s energy intensity targets and other goals.
• Chapter 2, Germany, lays out Germany’s major policy goals for energy and climate. It then describes the history and process of its GHG inventory – the National System of Emissions – followed by overviews of its systems of MRV for mitigation efforts under the Integrated Energy and Climate Program and the EU Monitoring Mechanism.
• Chapter 3, Italy, introduces Italy’s climate policy goals and describes its national inventory system. It then reviews Italy’s systems to measure, report, and verify its mitigation action outcomes both domesti-cally and internationally, as well as how MRV applies to some specific policies.
• Chapter 4, United States, describes the U.S. inventory system for GHGs, as well as its new program for entity-level GHG reporting. It then identifies general patterns in how the U.S. measures, reports, and verifies its mitigation actions, as well as how MRV applies to some of its key policies. The chapter concludes with an overview of the government oversight bodies relevant to climate policy.
The final chapter summarizes the essential fea-tures of MRV design across these countries and makes some preliminary general observations about domestic MRV systems for emissions and mitigation actions.

7A CPI Working Paper
Tracking Emissions and Mitigation Actions February 2012
China
Key Points
Emissions• China’s initial National Communication,
submitted in 2004, included its first GHG inventory, covering 1994 emissions. China will release its second National Com-munication in 2012, which will include a more developed inventory covering 2005 emissions of all six primary GHGs.
• While China’s early MRV efforts were largely in response to international drivers, its systems are increasingly oriented to supporting domestic policies and programs.
• China’s institutional capacity to monitor emissions has developed substantially since its first National Communica-tion. This has been driven in part by the infrastructure China has developed for its Statistics Indicators, Monitoring, and Examination (SME) system.
Mitigation actions• China has published three annual
progress reports on its climate policies and mitigation actions (2008-2010). These reports provide increasingly detailed descriptions and assessments of mitigation actions and outcomes. However they provide little information on the sources of data and methodologies for assessing mitigation outcomes.
• China’s most significant mitigation actions are the policies and measures established to achieve its national energy-intensity targets. The SME system is China’s primary vehicle for tracking progress towards these targets; its principal functions are to measure, report, and verify energy intensity data and track policy implementation.
1.1 IntroductionThe State Council (China’s highest governing body) manages the development of Five-Year Plans (FYPs), which set the country’s develop-ment and economic goals. FYPs provide the basic framework for all key policies and measures, including those on climate and energy. The 11th FYP (covering the period 2006-2010) set a legally binding target to reduce national energy intensity by 20% from 2005 levels by 2010. This is by far the most significant policy related to GHG emis-sion reductions that have been implemented.
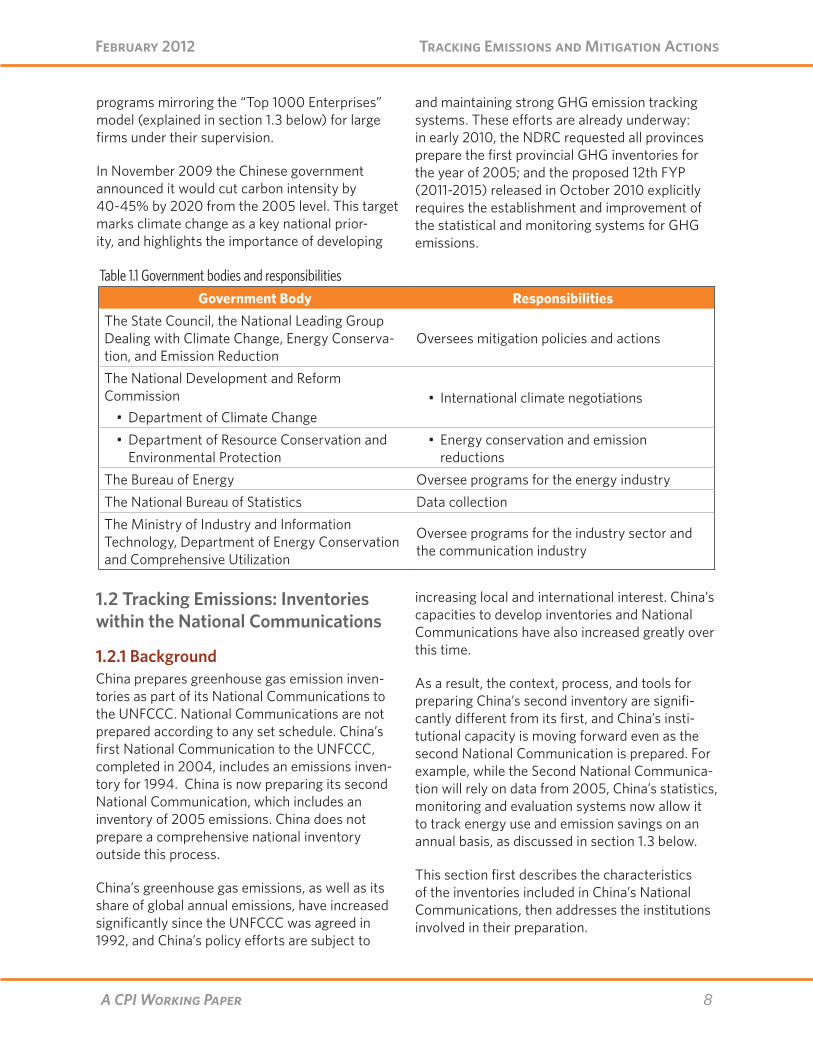
China has therefore established a series of institutions to develop and implement programs to achieve its climate and energy goals. In 2007, the State Council formed the National Leading Group to Address Climate Change, Energy Conservation, and Emissions Reductions to guide China’s responses to climate change. The National Leading Group is China’s highest govern-ment body that oversees mitigation policies and actions and is led by Premier Wen Jiabao, along with several Vice Premiers and State Councilors. China’s National Development and Reform Com-mission (NDRC) is the lead ministry on climate and energy matters, and it administers programs to fulfill the 20% target. Within the NDRC, the Department of Climate Change has an important role in international climate negotiations, and the Department of Resource Conservation and Envi-ronmental Protection deals with energy conser-vation and emission reduction. A range of other agencies oversee sectoral programs, data collec-tion, and other functions (see Table 1.1).
Over the course of the 11th FYP, the NDRC assigned individual energy intensity targets to each of China’s provinces and monitored their progress. The NDRC also developed and super-vised a number of national-level programs, such as the Top 1000 Enterprises Program, the Renew-able Energy Program, and a set of Industry Energy Efficiency Standards. At the sub-national level, targets were further disaggregated. Provinces assigned targets to the cities and counties in their jurisdiction and administered provincial and local
8A CPI Working Paper
Tracking Emissions and Mitigation Actions February 2012
programs mirroring the “Top 1000 Enterprises” model (explained in section 1.3 below) for large firms under their supervision.
In November 2009 the Chinese government announced it would cut carbon intensity by 40-45% by 2020 from the 2005 level. This target marks climate change as a key national prior-ity, and highlights the importance of developing
and maintaining strong GHG emission tracking systems. These efforts are already underway: in early 2010, the NDRC requested all provinces prepare the first provincial GHG inventories for the year of 2005; and the proposed 12th FYP (2011-2015) released in October 2010 explicitly requires the establishment and improvement of the statistical and monitoring systems for GHG emissions.
Table 1.1 Government bodies and responsibilitiesGovernment Body Responsibilities
The State Council, the National Leading Group Dealing with Climate Change, Energy Conserva-tion, and Emission Reduction
Oversees mitigation policies and actions
The National Development and Reform Commission •Department of Climate Change
• International climate negotiations
•Department of Resource Conservation and Environmental Protection
• Energy conservation and emission reductions
The Bureau of Energy Oversee programs for the energy industry The National Bureau of Statistics Data collectionThe Ministry of Industry and Information Technology, Department of Energy Conservation and Comprehensive Utilization
Oversee programs for the industry sector and the communication industry
1.2 Tracking Emissions: Inventories within the National Communications
1.2.1 BackgroundChina prepares greenhouse gas emission inven-tories as part of its National Communications to the UNFCCC. National Communications are not prepared according to any set schedule. China’s first National Communication to the UNFCCC, completed in 2004, includes an emissions inven-tory for 1994. China is now preparing its second National Communication, which includes an inventory of 2005 emissions. China does not prepare a comprehensive national inventory outside this process.
China’s greenhouse gas emissions, as well as its share of global annual emissions, have increased significantly since the UNFCCC was agreed in 1992, and China’s policy efforts are subject to
increasing local and international interest. China’s capacities to develop inventories and National Communications have also increased greatly over this time.
As a result, the context, process, and tools for preparing China’s second inventory are signifi-cantly different from its first, and China’s insti-tutional capacity is moving forward even as the second National Communication is prepared. For example, while the Second National Communica-tion will rely on data from 2005, China’s statistics, monitoring and evaluation systems now allow it to track energy use and emission savings on an annual basis, as discussed in section 1.3 below.
This section first describes the characteristics of the inventories included in China’s National Communications, then addresses the institutions involved in their preparation.
9A CPI Working Paper
Tracking Emissions and Mitigation Actions February 2012
1.2.2 The GHG inventories
(a) China’s Inventory in the First National CommunicationChina’s first inventory includes CO2, CH4, and N2O emissions for the year 1994 from energy, industrial processes, agriculture, waste, and land-use change and forestry. Emission estimates were prepared using methods from all three IPCC tiers based on the availability of information and relevance of the emission source. Data was based on existing official statistics from the State Sta-tistical Bureau, as well as industrial associations and relevant professional institutions. Where no official data was available, extensive surveys
were developed, including for industrial boilers, coal quality, methane emissions from coal mines, cement and lime enterprises, and methane emis-sions from rice fields. Some experts have noted that China’s initial inventory did not account for some important energy related emissions, such as underground coal-seam fires, which may rep-resent a significant amount of unreported emis-sions (Mintzer & Valencia, 2010).
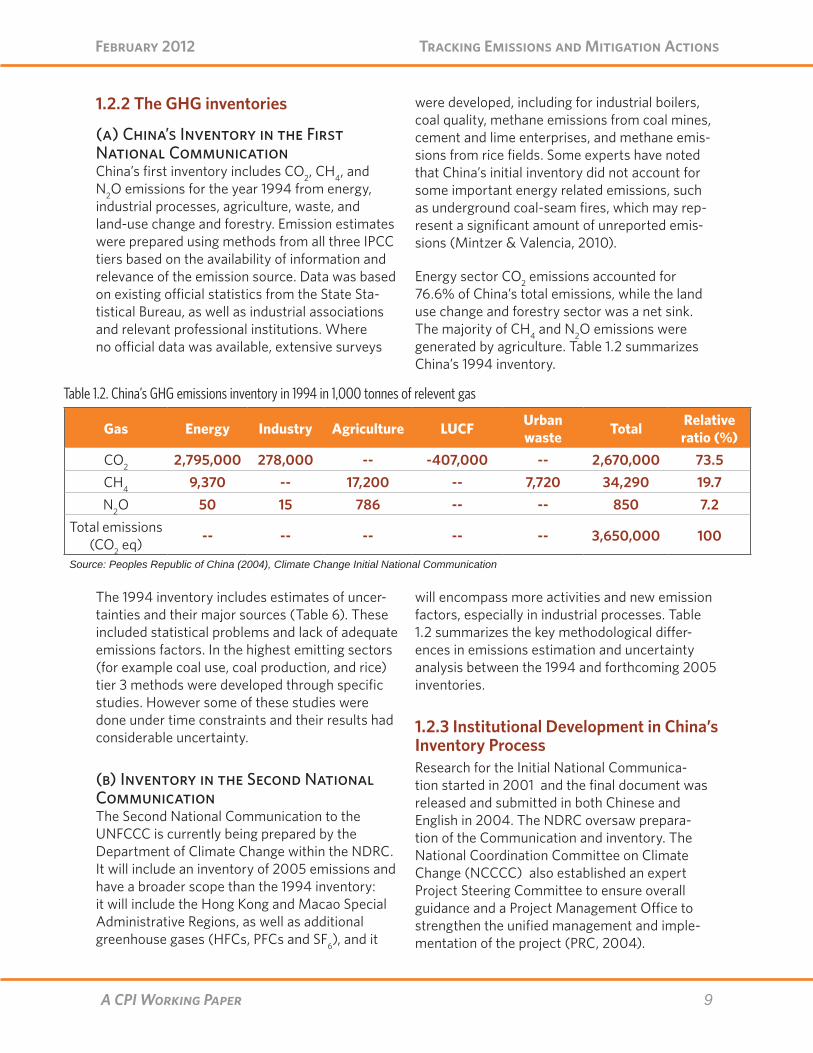
Energy sector CO2 emissions accounted for 76.6% of China’s total emissions, while the land use change and forestry sector was a net sink. The majority of CH4 and N2O emissions were generated by agriculture. Table 1.2 summarizes China’s 1994 inventory.
Table 1.2. China’s GHG emissions inventory in 1994 in 1,000 tonnes of relevent gas
Gas Energy Industry Agriculture LUCF Urban waste Total Relative
ratio (%)CO2 2,795,000 278,000 -- -407,000 -- 2,670,000 73.5CH4 9,370 -- 17,200 -- 7,720 34,290 19.7N2O 50 15 786 -- -- 850 7.2
Total emissions (CO2 eq) -- -- -- -- -- 3,650,000 100
Source: Peoples Republic of China (2004), Climate Change Initial National Communication
The 1994 inventory includes estimates of uncer-tainties and their major sources (Table 6). These included statistical problems and lack of adequate emissions factors. In the highest emitting sectors (for example coal use, coal production, and rice) tier 3 methods were developed through specific studies. However some of these studies were done under time constraints and their results had considerable uncertainty.
(b) Inventory in the Second National CommunicationThe Second National Communication to the UNFCCC is currently being prepared by the Department of Climate Change within the NDRC. It will include an inventory of 2005 emissions and have a broader scope than the 1994 inventory: it will include the Hong Kong and Macao Special Administrative Regions, as well as additional greenhouse gases (HFCs, PFCs and SF6), and it
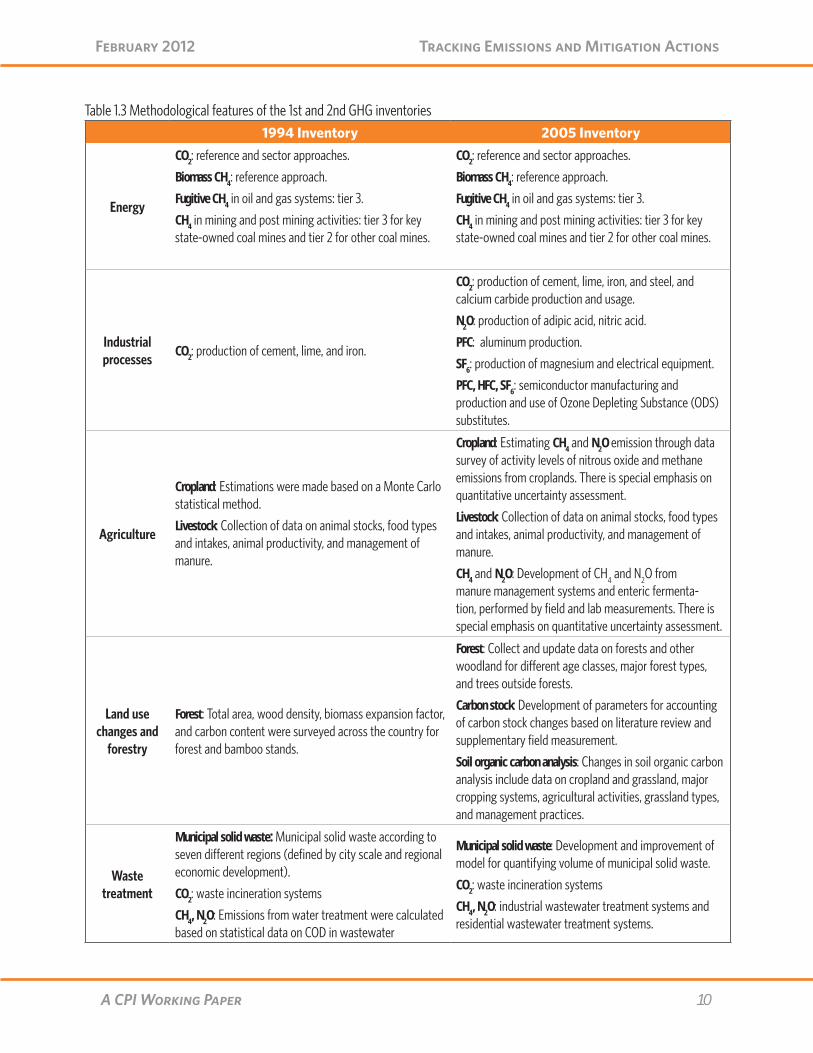
will encompass more activities and new emission factors, especially in industrial processes. Table 1.2 summarizes the key methodological differ-ences in emissions estimation and uncertainty analysis between the 1994 and forthcoming 2005 inventories.
1.2.3 Institutional Development in China’s Inventory ProcessResearch for the Initial National Communica-tion started in 2001 and the final document was released and submitted in both Chinese and English in 2004. The NDRC oversaw prepara-tion of the Communication and inventory. The National Coordination Committee on Climate Change (NCCCC) also established an expert Project Steering Committee to ensure overall guidance and a Project Management Office to strengthen the unified management and imple-mentation of the project (PRC, 2004).
10A CPI Working Paper
Tracking Emissions and Mitigation Actions February 2012
1994 Inventory 2005 Inventory
Energy
CO2: reference and sector approaches.
Biomass CH4: reference approach.
Fugitive CH4 in oil and gas systems: tier 3.
CH4 in mining and post mining activities: tier 3 for key state-owned coal mines and tier 2 for other coal mines.
CO2: reference and sector approaches.
Biomass CH4: reference approach.
Fugitive CH4 in oil and gas systems: tier 3.
CH4 in mining and post mining activities: tier 3 for key state-owned coal mines and tier 2 for other coal mines.
Industrial processes
CO2: production of cement, lime, and iron.
CO2: production of cement, lime, iron, and steel, and calcium carbide production and usage.
N2O: production of adipic acid, nitric acid.
PFC: aluminum production.
SF6: production of magnesium and electrical equipment.
PFC, HFC, SF6: semiconductor manufacturing and production and use of Ozone Depleting Substance (ODS) substitutes.
Agriculture
Cropland: Estimations were made based on a Monte Carlo statistical method.
Livestock: Collection of data on animal stocks, food types and intakes, animal productivity, and management of manure.
Cropland: Estimating CH4 and N2O emission through data survey of activity levels of nitrous oxide and methane emissions from croplands. There is special emphasis on quantitative uncertainty assessment.
Livestock: Collection of data on animal stocks, food types and intakes, animal productivity, and management of manure.
CH4 and N2O: Development of CH4 and N2O from manure management systems and enteric fermenta-tion, performed by field and lab measurements. There is special emphasis on quantitative uncertainty assessment.
Land use changes and
forestry
Forest: Total area, wood density, biomass expansion factor, and carbon content were surveyed across the country for forest and bamboo stands.
Forest: Collect and update data on forests and other woodland for different age classes, major forest types, and trees outside forests.
Carbon stock: Development of parameters for accounting of carbon stock changes based on literature review and supplementary field measurement.
Soil organic carbon analysis: Changes in soil organic carbon analysis include data on cropland and grassland, major cropping systems, agricultural activities, grassland types, and management practices.
Waste treatment
Municipal solid waste: Municipal solid waste according to seven different regions (defined by city scale and regional economic development).
CO2: waste incineration systems
CH4, N2O: Emissions from water treatment were calculated based on statistical data on COD in wastewater
Municipal solid waste: Development and improvement of model for quantifying volume of municipal solid waste.
CO2: waste incineration systems
CH4, N2O: industrial wastewater treatment systems and residential wastewater treatment systems.
Table 1.3 Methodological features of the 1st and 2nd GHG inventories
11A CPI Working Paper
Tracking Emissions and Mitigation Actions February 2012
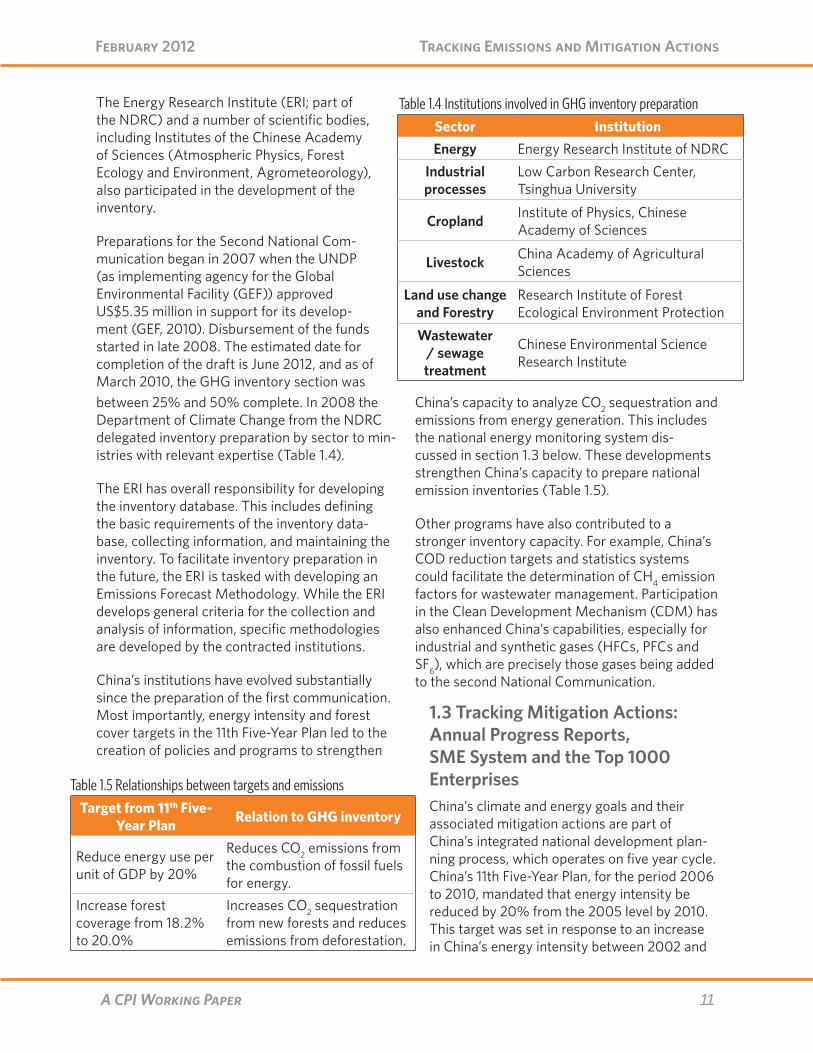
between 25% and 50% complete. In 2008 the Department of Climate Change from the NDRC delegated inventory preparation by sector to min-istries with relevant expertise (Table 1.4).
The ERI has overall responsibility for developing the inventory database. This includes defining the basic requirements of the inventory data-base, collecting information, and maintaining the inventory. To facilitate inventory preparation in the future, the ERI is tasked with developing an Emissions Forecast Methodology. While the ERI develops general criteria for the collection and analysis of information, specific methodologies are developed by the contracted institutions.
China’s institutions have evolved substantially since the preparation of the first communication. Most importantly, energy intensity and forest cover targets in the 11th Five-Year Plan led to the creation of policies and programs to strengthen
Table 1.4 Institutions involved in GHG inventory preparationSector InstitutionEnergy Energy Research Institute of NDRC
Industrial processes
Low Carbon Research Center, Tsinghua University
Cropland Institute of Physics, Chinese Academy of Sciences
Livestock China Academy of Agricultural Sciences
Land use change and Forestry
Research Institute of Forest Ecological Environment Protection
Wastewater / sewage treatment
Chinese Environmental Science Research Institute
China’s capacity to analyze CO2 sequestration and emissions from energy generation. This includes the national energy monitoring system dis-cussed in section 1.3 below. These developments strengthen China’s capacity to prepare national emission inventories (Table 1.5).
Other programs have also contributed to a stronger inventory capacity. For example, China’s COD reduction targets and statistics systems could facilitate the determination of CH4 emission factors for wastewater management. Participation in the Clean Development Mechanism (CDM) has also enhanced China’s capabilities, especially for industrial and synthetic gases (HFCs, PFCs and SF6), which are precisely those gases being added to the second National Communication.
The Energy Research Institute (ERI; part of the NDRC) and a number of scientific bodies, including Institutes of the Chinese Academy of Sciences (Atmospheric Physics, Forest Ecology and Environment, Agrometeorology), also participated in the development of the inventory.
Preparations for the Second National Com-munication began in 2007 when the UNDP (as implementing agency for the Global Environmental Facility (GEF)) approved US$5.35 million in support for its develop-ment (GEF, 2010). Disbursement of the funds started in late 2008. The estimated date for completion of the draft is June 2012, and as of March 2010, the GHG inventory section was
Target from 11th Five-Year Plan Relation to GHG inventory
Reduce energy use per unit of GDP by 20%
Reduces CO2 emissions from the combustion of fossil fuels for energy.
Increase forest coverage from 18.2% to 20.0%
Increases CO2 sequestration from new forests and reduces emissions from deforestation.
Table 1.5 Relationships between targets and emissions
1.3 Tracking Mitigation Actions: Annual Progress Reports, SME System and the Top 1000 EnterprisesChina’s climate and energy goals and their associated mitigation actions are part of China’s integrated national development plan-ning process, which operates on five year cycle. China’s 11th Five-Year Plan, for the period 2006 to 2010, mandated that energy intensity be reduced by 20% from the 2005 level by 2010. This target was set in response to an increase in China’s energy intensity between 2002 and
12A CPI Working Paper
Tracking Emissions and Mitigation Actions February 2012
2005. With energy production and use account-ing for the majority of China’s emissions, the energy-intensity target was the most significant national objective relevant to greenhouse gas mitigation over this period.
Looking forward, China’s 40—45% carbon inten-sity target is by far the most important mitigation goal for the next decade. In its 12th FYP (2011-2015) proposal, the Chinese Communist Party explicitly requires the establishment and improve-ment of the statistical and monitoring systems for GHG emissions. This will assist in allocating responsibility for carbon-intensity reductions to local governments, and in tracking local and national progress towards their respective targets.
The State Council established a target-respon-sibility mechanism to achieve the 20% energy-intensity reduction during the 11th FYP. This mechanism set specific goals for provincial governments and major enterprises and linked achievement of those goals to the career pros-pects of provincial officers and enterprise leaders. Implementation of the carbon-intensity reduction target will most likely adopt a similar approach.
The Statistical Indicator, Monitoring, and Exami-nation (SME) system was then established to track enterprise, provincial, and national imple-mentation of specific policies and programs, as well as progress towards the relevant energy-intensity goals. It remains to be seen whether a similar system shall be developed for implement-ing the carbon-intensity target.
1.3.1 Annual Progress Reporting for the National Climate Change ProgrammeChina began publishing regular reports on its climate policies and mitigation actions 5 years ago. The evolution of these reports show climate mitigation is becoming increasingly important to China – it is expanding the scope of its policies and measures and building capacity to track the progress and outcomes of those actions.
The first comprehensive assessment report, the National Assessment Report on Climate Change, was released in 2006. This laid out a series of
mitigation policy recommendations – including projected mitigation outcomes from those poli-cies – based on a thorough review and analysis of the impacts of climate changes on China.
China’s National Climate Change Programme (published in 2007) marked the beginning of China’s systematic reporting on its mitigation actions. While the report primarily described China’s emission conditions and principles for addressing climate issues, it laid out a suite of domestic policies since 1980s that might be considered as climate mitigation actions. These included energy efficiency improvement, low-carbon and renewable resources development, reforestation and ecosystem restoration, popula-tion growth control, enhancement of institutional capacity, climate-related research capacity build-ing, and promoting public climate change aware-ness. The report also provided some numerical projections of mitigation outcomes, and pre-sented sectoral mitigation policies and actions.
The three most recent progress reports, China’s Policies and Actions for Addressing Climate Change (released in 2008, 2009, and 2010), contain increasingly detailed information and span all sectors and gases. Local climate change policies and actions and sector-level actions appear in the two most recent reports.
The 2008 report presented mitigation policies and actions in six main categories: adjustment and optimization of industrial structures; energy conservation and energy efficiency improvement; developing renewable energy sources; promot-ing circular economy for emission reductions; reducing emissions from the agricultural sector; increasing carbon sequestration through affores-tation; and intensifying climate-related research and development. The projected results of these policies and measures were largely presented in terms of amount of coal saved rather than direct estimates of greenhouse gas emissions reduced or avoided.
The 2009 report focused more explicitly on climate policies and outcomes, and emphasized the role of the mandatory energy-conservation
13A CPI Working Paper
Tracking Emissions and Mitigation Actions February 2012
and emission-reduction targets in generat-ing emission reductions. The report provided quantitative assessments of more than half of the mitigation actions, although only a few included estimates of emission reductions. Local climate actions were covered, including the creation of provincial-level climate change leading groups, and a number of provincial climate change pro-grams. The 2009 report highlighted the estab-lishment of the SME system as a part of China’s institutional capacity building to address climate change.
The 2010 annual report is the most compre-hensive. Energy-saving and energy efficiency improvement remain the most important areas of mitigation action. A key new measure is the low-carbon provinces and cities demonstra-tion project. Institutional capacity continues to improve, with the development of statistics, monitoring, and information systems to track emissions at the national, provincial and sectoral levels; some provinces and cities preparing emis-sion inventories; and some provincial-level emis-sion monitoring stations established on a trial basis. The report includes a new chapter sum-marizing measures taken by key industrial sectors that have led to notable amounts of coal savings; in a few cases estimated emission reductions are also provided.
While the level of detail in these reports is increasing, the reports do not set out a trans-parent and systematic analytical framework for assessing mitigation outcomes. The data sources and methods used to assess outcomes are not presented, making it difficult to evaluate the esti-mated coal- and emission-savings. The 2009 and 2010 reports provide information on government investments in many mitigation actions, however the reports do not assess the cost-effectiveness of those actions. It is unclear whether the reports and policy assessments have gone through an internal or external review process; no informa-tion on this is provided.
1.3.2 China’s Energy Intensity Targets and the Statistics, Monitoring, and Examination Systems
BackgroundThe SME system was formulated by the NDRC and other relevant ministries in 2007. Three key documents provide the basis for the system:
1. the Plan to implement the statistics indicators system of energy consumption per unit of GDP,
2. the Plan to implement the monitoring system of energy consumption per unit of GDP, and
3. the Plan to implement the examination system of energy consumption per unit of GDP.
In 2007, the NDRC released general guidelines for the SME system to measure, report, and verify energy intensity data and track mitigation actions. In developing the SME system, China emphasized the role of energy statistics in energy conserva-tion, environment protection, and a balanced development of GDP and energy use. The State Council implemented the SME systems in 2008.
Since then, the NDRC has annually announced each province’s energy conservation progress. NDRC calculates and reports national energy savings and greenhouse gas emissions mitiga-tion achieved under the 11th FYP. According to data released in March 2011, China decreased its energy intensity by 19.1% from 2005 levels by 2010, achieving cumulative energy savings of 630Mtce and emission reductions of 1460 Mt CO2 during the 11th FYP period (NDRC, 2011).
Data CollectionThe Plan to implement the statistics indicators system of energy consumption per unit of GDP forms the basis for China’s energy data collec-tion. The statistics indicators system covers three areas—energy production, energy circulation (transmission and distribution) among provinces, and energy consumption. It has three overarching goals: 1) to improve the quality of China’s energy statistics relating to inter-regional circulation, 2) to expand the statistical scope to enterprises below the statistical scale (i.e., annual revenue below 5 million RMB), and 3) to increase the
14A CPI Working Paper
Tracking Emissions and Mitigation Actions February 2012
coverage of energy products and energy types. The data collection methodologies and the government bodies involved in each of the three areas are explained below.
(a) Energy ProductionThe National Bureau of Statistics (NBS) collects energy production data through a full survey approach (i.e., it investigates each subject indi-vidually). Energy producers must report produc-tion data quarterly to the NBS. Statistical surveys cover coal production, coal storage, coal sales, and electricity production.
Different requirements apply depending on the size of the enterprise: those above the statisti-cal scale (annual revenue above 5 million RMB) provide production data for all fuel types; those below the statistical scale (annual revenue of 5 million RMB or less) provide data for only two kinds of energy products (coal and electricity)
due to capability and resource limits. The SME has broadened and deepened data collection: pre-viously, large enterprises provided data on fewer energy products and small enterprises were not included in the survey at all.
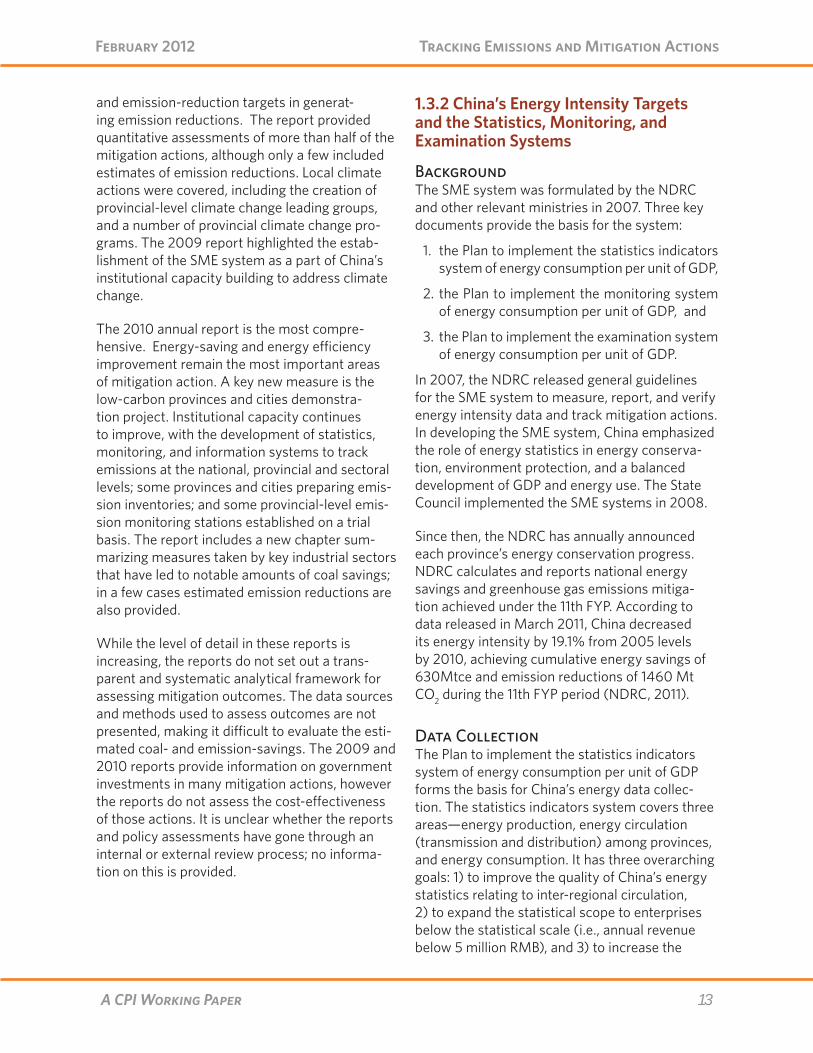
(b) Energy CirculationData collection related to energy circulation (Table 1.6) is more complex than for energy production. It covers six categories of energy (coal, crude oil, oil products, natural gas, electric-ity, and other energy types). Different institutions are responsible for data collection across these categories. For example, the China Coal Trade and Development Association (CCTDA) is in charge of collecting data on inter-regional coal circulation. The SME expanded the scope of data collection from key coal mines to all coal produc-tion and circulation enterprises. Enterprises report regional coal sales quarterly to the CCTDA, and the CCTDA adopts a full survey approach.
Sector Data collection Institution Methodology Report frequency
Coal
Expand coverage from key coal mines to all coal production and circulation enterprises. Coal sale data is collected by regions.
CCTDA Full survey Quarterly
Oil products
Inter-regional data comes from the purchase, sales, and storage data of wholesale and retail enterprises.•Wholesales: all enterprises
ratifies by MOC.• Retails: Enterprises ratified by
governments.
NBS Full survey Quarterly
Crude oil
Inter-regional flow is calculated from custom statistics and energy statistical reports of industrial enterprises.
NBS Calculation
• ProductionMonthly
production report
Monthly
• PurchaseQuarterly
energy con-sumption report
Quarterly
• Import Custom import & export report Quarterly
Table 1.6 Collection of energy circulation data
15A CPI Working Paper
Tracking Emissions and Mitigation Actions February 2012
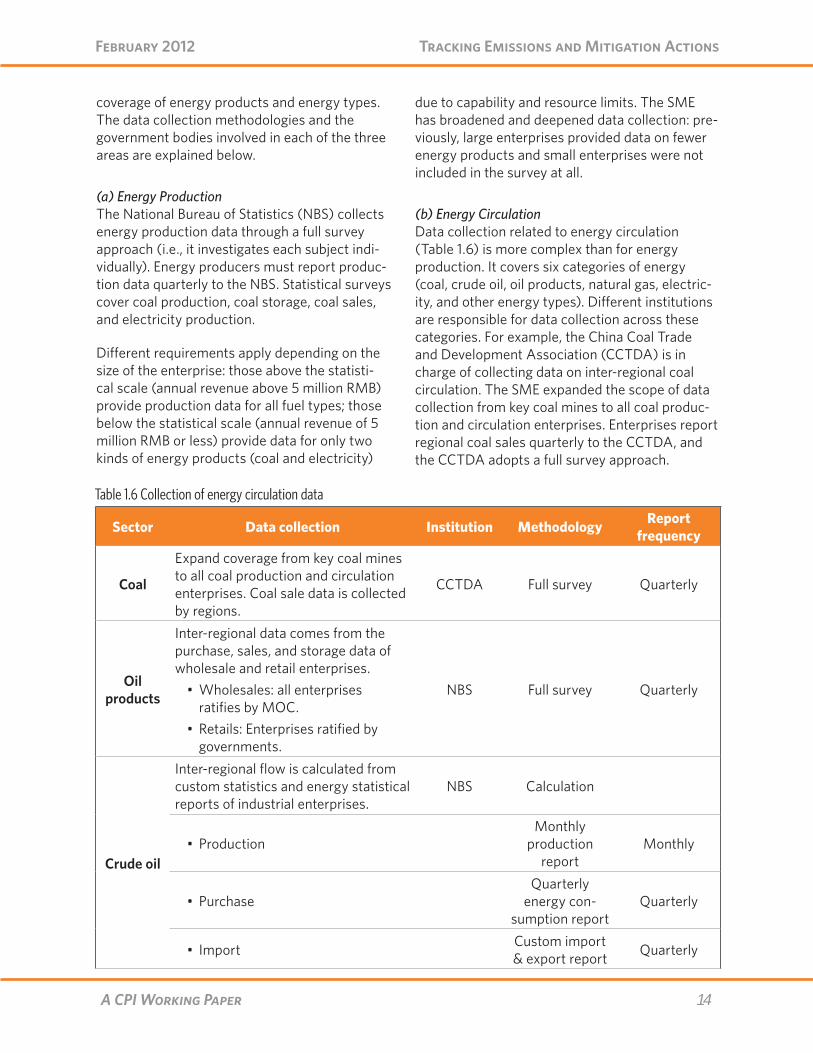
Sector Data collection Institution Methodology Report frequency
Natural Gas
Inter-regional flow in and flow out of natural gas.
3 petroleum companies Not available Quarterly
Electricity Inter-regional transmission and distri-bution of electricity. CEC Full survey Monthly
Other energy
Inter-regional flow is calculated from custom statistics and statistics from industrial enterprises.
NBS Not available N/A
NBS = National Bureau of StatisticsCCTDA = China Coal Trade & Development AssociationMOC = Ministry of CommerceCEC = China Electricity Council
(c) Energy ConsumptionFor energy consumption, data is collected from primary sectors (farming, forestry, animal hus-bandry, fishery, and water conservancy), second-ary sectors (industry and construction), tertiary sectors (transport, storage and post, and cater-ing), and residential consumption (urban and rural).
Data on enterprises above the statistical scale is collected using a full survey approach (i.e., each subject is investigated individually). For
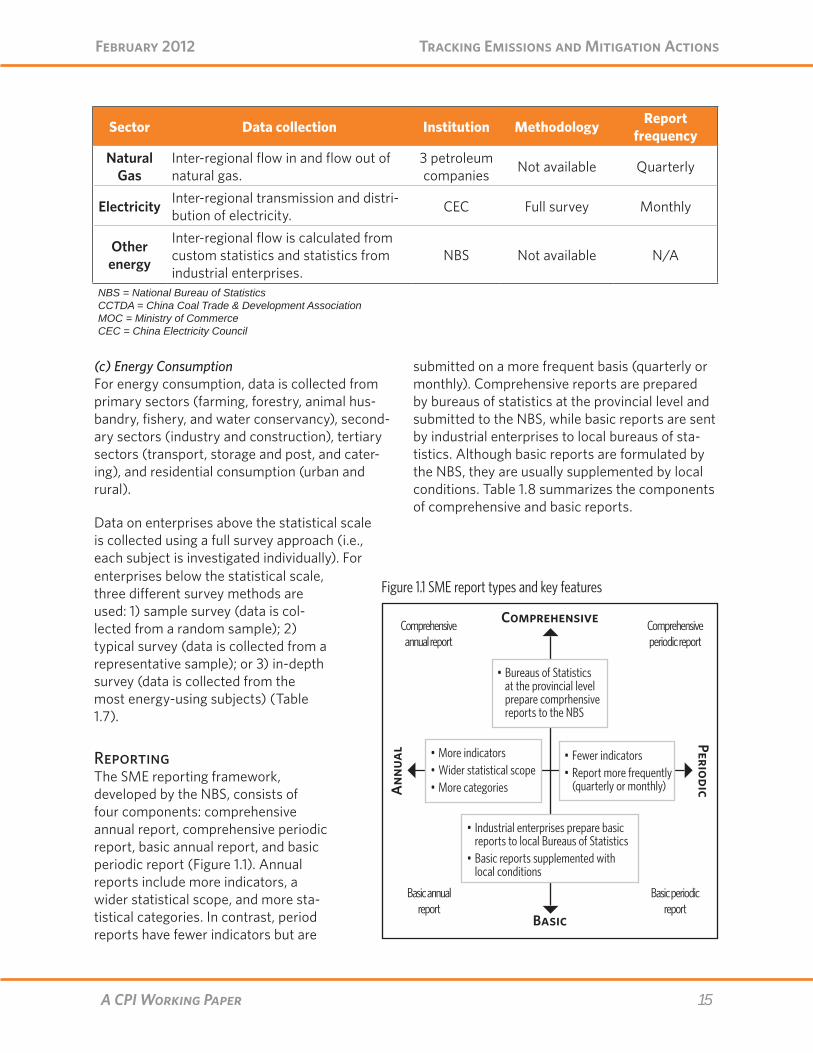
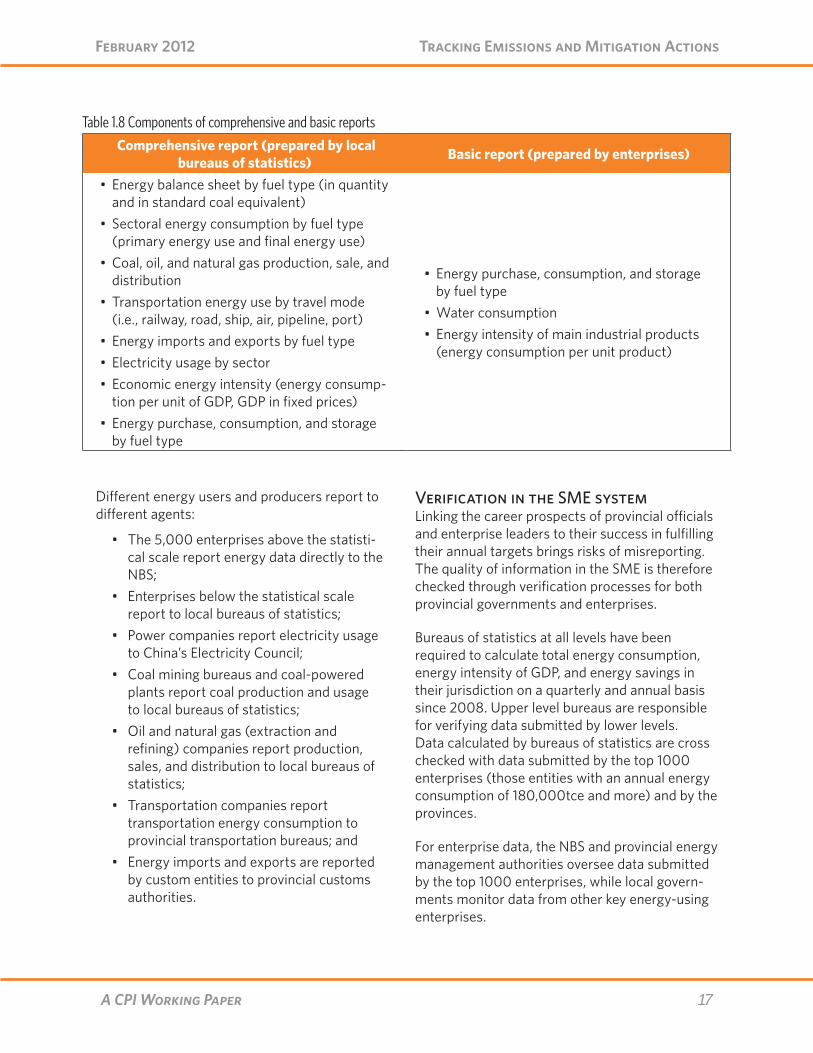
submitted on a more frequent basis (quarterly or monthly). Comprehensive reports are prepared by bureaus of statistics at the provincial level and submitted to the NBS, while basic reports are sent by industrial enterprises to local bureaus of sta-tistics. Although basic reports are formulated by the NBS, they are usually supplemented by local conditions. Table 1.8 summarizes the components of comprehensive and basic reports.
Comprehensive
Basic
PeriodicAnn
ual
Comprehensive annual report
Comprehensive periodic report
Basic annual report
Basic periodic report
• Bureaus of Statistics at the provincial level prepare comprhensive reports to the NBS
• Industrial enterprises prepare basic reports to local Bureaus of Statistics
• Basic reports supplemented with local conditions
• More indicators• Wider statistical scope• More categories
• Fewer indicators• Report more frequently
(quarterly or monthly)
Figure 1.1 SME report types and key featuresenterprises below the statistical scale, three different survey methods are used: 1) sample survey (data is col-lected from a random sample); 2) typical survey (data is collected from a representative sample); or 3) in-depth survey (data is collected from the most energy-using subjects) (Table 1.7).
ReportingThe SME reporting framework, developed by the NBS, consists of four components: comprehensive annual report, comprehensive periodic report, basic annual report, and basic periodic report (Figure 1.1). Annual reports include more indicators, a wider statistical scope, and more sta-tistical categories. In contrast, period reports have fewer indicators but are

16A CPI Working Paper
Tracking Emissions and Mitigation Actions February 2012
Sector Data collection Institution Methodology Report Frequency
The Primary SectorFarming, Forestry,
Animal Husbandry, Fishery, & Water
Conservancy
Consumption of coal, gasoline, diesel oil, and electricity NBS In-depth Annually
The Secondary Sector
Industry (including non-energy use)
Enterprises above the statistical scale: Develop survey catalogs for renewables, low heat value fuels, and industrial wastes and develop statistics indicators for residual heat and pressure
NBS Full Quarterly
Enterprises below the statistical scale: Establish statistics systems NBS Sample Quarterly
Construction MHUD1 Full Every 5 yearsThe Tertiary Sector
Transport, Storage, and
Post
Rail, air, pipeline
Consumption of coal, gasoline, diesel oil, fuel oil, and electricity
MOR, local railway council, CAAC, and the top 3 petroleum
companies2
Full Quarterly
Road, ship, port
For commercial transportation enterprises: Establish coherent and standardized investigation system
NBS Full Annually
For individuals: Calculate con-sumption according to energy use per vehicle and the number of registered vehicles in transporta-tion administrative departments
NBS Typical Annually
Catering
Big catering enterprises (more than 40 employees and annual revenue of 2 million RMB and more): Establish survey systems for coal, coal gas, natural gas, and electricity
NBS Full Quarterly
Medium and small catering enterprises: calculate energy consumption
NBS Sample Quarterly
Residential Consumption Urban and Rural consumption NBS Sample Quarterly
1 MHUD is Ministry of Housing and Urban-rural Development2 MOR is Ministry of Railway; CAAC is Civil aviation administration of China
Table 1.7 Data collection of energy consumption
17A CPI Working Paper
Tracking Emissions and Mitigation Actions February 2012
Different energy users and producers report to different agents:
• The 5,000 enterprises above the statisti-cal scale report energy data directly to the NBS;
• Enterprises below the statistical scale report to local bureaus of statistics;
• Power companies report electricity usage to China’s Electricity Council;
• Coal mining bureaus and coal-powered plants report coal production and usage to local bureaus of statistics;
• Oil and natural gas (extraction and refining) companies report production, sales, and distribution to local bureaus of statistics;
• Transportation companies report transportation energy consumption to provincial transportation bureaus; and
• Energy imports and exports are reported by custom entities to provincial customs authorities.
Verification in the SME systemLinking the career prospects of provincial officials and enterprise leaders to their success in fulfilling their annual targets brings risks of misreporting. The quality of information in the SME is therefore checked through verification processes for both provincial governments and enterprises.
Bureaus of statistics at all levels have been required to calculate total energy consumption, energy intensity of GDP, and energy savings in their jurisdiction on a quarterly and annual basis since 2008. Upper level bureaus are responsible for verifying data submitted by lower levels. Data calculated by bureaus of statistics are cross checked with data submitted by the top 1000 enterprises (those entities with an annual energy consumption of 180,000tce and more) and by the provinces.
For enterprise data, the NBS and provincial energy management authorities oversee data submitted by the top 1000 enterprises, while local govern-ments monitor data from other key energy-using enterprises.
Table 1.8 Components of comprehensive and basic reports Comprehensive report (prepared by local
bureaus of statistics) Basic report (prepared by enterprises)
• Energy balance sheet by fuel type (in quantity and in standard coal equivalent)
• Sectoral energy consumption by fuel type (primary energy use and final energy use)
•Coal, oil, and natural gas production, sale, and distribution
• Transportation energy use by travel mode (i.e., railway, road, ship, air, pipeline, port)
• Energy imports and exports by fuel type• Electricity usage by sector• Economic energy intensity (energy consump-
tion per unit of GDP, GDP in fixed prices) • Energy purchase, consumption, and storage
by fuel type
• Energy purchase, consumption, and storage by fuel type
•Water consumption • Energy intensity of main industrial products
(energy consumption per unit product)
18A CPI Working Paper
Tracking Emissions and Mitigation Actions February 2012
The process of verifying provincial energy saving data has two steps: (1) each province submits a self-evaluation report to the NDRC, (2) the NDRC forms an expert team to perform an on-site examination of each province’s energy saving progress, and then (3) cross checks the on-site examination results with data provided by the NBS.
To ensure the quality of GDP data, three groups of indicators are used: 1) indicators related to the level of GDP (i.e., the share of citizen saving increase in GDP, the share of various taxes in value-added of the secondary and tertiary sector, and the share of public finance revenue in GDP), 2) indicators related to the growth rate of GDP (i.e., the growth rate of taxes, the growth rate of loans, and the growth rate of household dispos-able income), and 3) indicators related to the value-added of the tertiary sector. To justify the amount of total energy consumption and to cross check with each province’s self-submitted data, local bureaus of statistics review the following five indicators:
1. the share of electricity in total energy use;
2. the share of energy consumed by enterprises above the statistical scale in total energy use;
3. transformation efficiency of thermal power, heating supply, coal washing, coking, petroleum refining, and gas works;
4. the growth rate of energy consumed by the primary, secondary, and tertiary sectors respectively and the corresponding growth rate of each sector’s value-added; and
5. production volume of main products, as well as energy consumption per product.
In addition to employing statistical methods to improve data quality, the NDRC and provincial government authorities perform onsite examina-tions at both the provincial and enterprise levels.
Provincial governments submit their annual self-evaluations to the NDRC on their progress in meeting energy saving targets before the end of March. The NDRC and relevant ministries orga-nize an evaluation team with energy experts from industry and research institutes to conduct onsite verification of self-evaluated reports by the end of May. After the evaluation team finishes onsite verification, the NDRC and NBS aggregate data and prepare annual reports, which are submit-ted to the State Council for approval. Finally, the NDRC publishes the reports on its website and the State Council allocates rewards and penalties according to each province’s completion of its targets.
1.3.3 The Top 1000 Enterprises ProgramThe Top 1000 Enterprises program was launched in 2006 to support China’s 20% energy intensity reduction target. Enterprises in nine energy inten-sive industries with total annual energy consump-tion above 180,000 tce in 2004 were targeted by the program. To monitor the program’s progress, various government entities lead on different tasks (Table 1.9).
Before the end of January, each of the Top 1000 enterprises submit an annual self-assessment report to provincial governments. Provincial governments organize an evaluation team with energy experts from industry and research institutes to conduct an on-site evaluation of each enterprise. The evaluation team prepares an evaluation report for each Top 1000 enterprise, which is submitted to the provincial govern-ment and the NDRC before the end of March. At the national level, the NDRC convenes another evaluation team to verify provincial results. After the evaluation team finishes onsite verification, the NDRC and NBS aggregate data and publish annual reports of the Top 1000 enterprises.
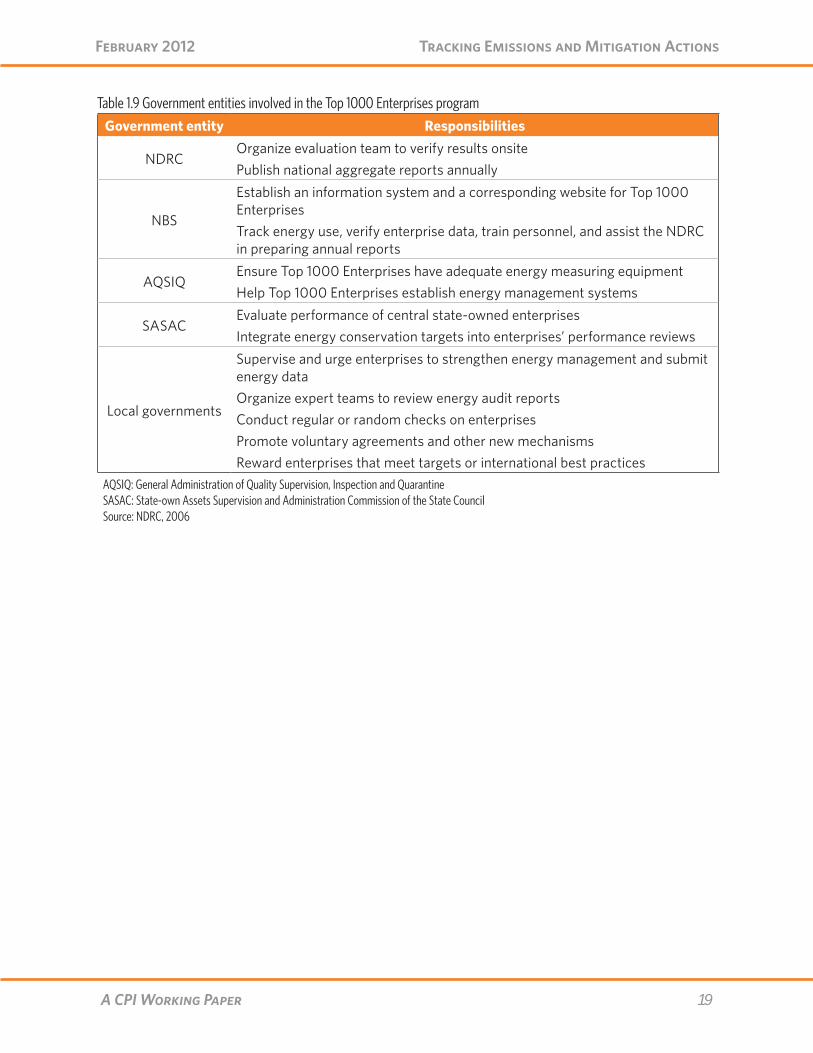
19A CPI Working Paper
Tracking Emissions and Mitigation Actions February 2012
Table 1.9 Government entities involved in the Top 1000 Enterprises programGovernment entity Responsibilities
NDRCOrganize evaluation team to verify results onsitePublish national aggregate reports annually
NBS
Establish an information system and a corresponding website for Top 1000 EnterprisesTrack energy use, verify enterprise data, train personnel, and assist the NDRC in preparing annual reports
AQSIQEnsure Top 1000 Enterprises have adequate energy measuring equipment Help Top 1000 Enterprises establish energy management systems
SASACEvaluate performance of central state-owned enterprisesIntegrate energy conservation targets into enterprises’ performance reviews
Local governments
Supervise and urge enterprises to strengthen energy management and submit energy dataOrganize expert teams to review energy audit reportsConduct regular or random checks on enterprisesPromote voluntary agreements and other new mechanismsReward enterprises that meet targets or international best practices
AQSIQ: General Administration of Quality Supervision, Inspection and QuarantineSASAC: State-own Assets Supervision and Administration Commission of the State CouncilSource: NDRC, 2006

20A CPI Working Paper
Tracking Emissions and Mitigation Actions February 2012
Germany
Key Points
Emissions• Germany has completed nine compre-
hensive national GHG inventories. It has a centralized inventory program and has built substantial institutional capacity and expertise in the Federal Environment Agency (UBA).
• Installation-, technology-, and sector-specific data are not made public but are available to UNFCCC reviewers.
• The UBA maintains a rigorous system for quality assurance/quality control and uncertainty analysis. Issues identified by UNFCCC review teams enter into inventory improvement plans and are either addressed immediately or in the subsequent reporting period.
Mitigation actions• Germany’s climate protection programs
have evolved and expanded over time. The level of monitoring of individual policies varies.
• There is no comprehensive guidance on the data sources and methodologies that should be used to track the outcomes of each mitigation action. Monitoring is fragmented among the responsible ministries and agencies and is coordi-nated jointly by the Ministry of Environ-ment and the Ministry of Economics and Technology.
• Reporting to the European Commission and UNFCCC focuses on ex-ante modeling of expected emission impacts rather than calculations of actual emission reductions achieved.
• Continuous mandatory reporting systems, such as for the feed-in tariff, have strengthened institutional and technical capacity for ex-post evaluation of renewables policy.
2.1 IntroductionGermany has committed to medium and long-term climate protection goals at the domestic, EU, and global levels. Germany committed to reduce its GHG emissions to 21% below 1990 levels by 2008-2012 as part of the EU burden-sharing arrangement under the Kyoto Protocol. In 2008, Germany announced its domestic Integrated Energy and Climate Program (IEKP), including a target to reduce emissions to 40% below 1990 levels by 2020. This program has been strength-ened twice: first in 2010 by the Energy Concept (which provided a clear long-term trajectory to reduce emissions by 80-95% by 2050 and specified renewable energy and energy efficiency targets); and again in 2011 by the laws to trans-form the energy system(energy transformation laws).
To meet these commitments the German govern-ment supplements EU-wide policies like the EU ETS with a suite of domestic mitigation actions, such as the renewable energy support scheme, support for energy efficient buildings retrofit, and a CO2 strategy for motor vehicles. Beyond the IEKP, German industry has also made voluntary commitments to reduce emissions. Key govern-ment agencies and their responsibilities are set out in Table 2.1.
The principal system in place for tracking emis-sions is the National System of Emissions (NaSE). The NaSE follows IPCC Good Practice Guidance and provides the basis for the GHG Inventory and National Inventory Report prepared under the UNFCCC and associated European Union Kyoto Protocol requirements. The NaSE is coordinated by the Emissions Situation Division of the UBA.
The main domestic system for tracking prog-ress of mitigation actions was until 2010 the biennial IEKP status report, which is supported by monitoring reports for individual IEKP miti-gation actions such as the feed-in-tariff. The 2010 Energy Concept established a schedule for monitoring measures every three years. The Federal Ministry for the Environment (BMU) and the Federal Ministry of Economics and Technol-ogy (BMWi) are the leading ministries for both

21A CPI Working Paper
Tracking Emissions and Mitigation Actions February 2012
the IEKP and the Energy Concept. Germany also reports on mitigation actions every two years under the European Monitoring Mechanism and every four years in its National Communication to the UNFCCC.
Germany’s international and domestic track-ing systems for GHG emissions and mitigation actions are summarized in Table 2.2.
Government Body Responsibilities
Federal GovernmentGerman Chancellor and Federal Ministers make up the Federal cabinet.The cabinet has executive power.
German Bundestag (parliament) Federal legislative body. The federal government reports to the German Bundestag.
Bundesrat (made up of Länder Ministries)
Legislative body made up of representatives of German States (Länder).Some Länder enact regional climate protection programs.Länder report on energy balances and CO2 emissions.24
Federal Ministry for the Environment, Nature Conservation,
and Nuclear Safety (BMU)
Proposes and coordinates climate change and renewable support policies and changes to the nuclear law. Works in consultation with the Ministry of Economics and Technology.Responsibility for reporting on waste and biomass emissions.Current and future responsibility for reporting on renewable energy deployment and feed-in-tariff experience.
Federal Ministry of Economics and Technology (BMWi)
Leads energy sector legal reform, such as electricity grid expansion, and changes to public procurement.Responsibility for reporting on energy, industrial processes, and solvent emissions.Future responsibility for reporting on grid expansion, expansion of the power plant park, reinvestments, and energy efficiency
Federal Ministry of Transport, Building and Rural Development
(BMVBS)
Responsible for transport, buildings, and infrastructure, including reforms to strengthen low-carbon urban development and energy efficiency.Responsibility for reporting for transport emissions.
Federal Ministry of Food, Agriculture, and Consumer
Protection (BMELV)
Responsibility for reporting on agriculture and land use, land use change, and forestry (LULUCF) emissions/sequestration.Responsible for preparing the standardized reporting tables under Article 7 of the Kyoto Protocol on LULUCF and CRF tables for agriculture and LULUCF.
Federal Ministry of Finance (BMF)Responsible for reforms to the Federal special fund on Energy and Climate, energy taxes for industry, and tax deductions to support the thermal retrofit of residential buildings.
Federal Ministry of Defense (BMVg) Responsibility for GHG reporting on military transport and energy use.
Table 2.1: Key Government Institutions and Responsibilities in Germany

22A CPI Working Paper
Tracking Emissions and Mitigation Actions February 2012
Government Body Responsibilities
Federal Environment Agency (UBA) Single National Entity coordinating and compiling the national inventory report.
Federal Statistical Office (Destatis) Responsible for data collection. Länder Statistical Offices provide data to the Federal Statistical Office.
Working Group on Energy Balances (AGEB)
Consortium of research institutes and industry associations that prepares the energy balances on the basis of official statistical and industry association data.
2.2 Tracking National Emissions: the National System of Emissions (NaSE)Germany compiles and submits annual emission inventories under the UNFCCC. In addition to meeting Germany’s international commitments, the stated national goals of inventory preparation are:
• to allow the UNFCCC secretariat to verify the development of the inventory data using independent third-parties;
• to allow the EU, as an individual Party to the Kyoto Protocol, to report aggregated EU GHG data of the EU Member States;
• to allow the Single National Entity to identify gaps and improvement possibili-ties in an annual inventory plan; and
• to allow actors within the National System of Emissions to improve the inventory within the different source categories.25
The NaSE was institutionally established in 2007 at the ministerial level under the leadership of the BMU. The NaSE is coordinated by the Single National Entity, a team within the UBA’s Emissions Situation Division. The Single National Entity sets the framework for fulfilling the UNFCCC require-ments of transparent, consistent, complete,
comparable, and accurate GHG inventories by:26
• planning, preparing, and archiving inventories;
• describing the various inventories in the inventory reports and carrying out quality control and assurance;
• serving as a central point of contact;• coordinating and informing all partici-
pants in the National System;• identifying institutions to be integrated
into the National System; and• implementing the quality system of
emissions (described in section 2.2.3 below).
Inventory preparation requires personnel and infrastructure at both the UBA and at other insti-tutions involved. Fifty UBA experts participate in the inventory preparation process. Total costs are difficult to estimate, as these resources are not used exclusively for inventory preparation. The budget for third-party experts and research projects for GHG inventory preparation and methodological training in 2011 was € 810,000. In comparison, the total budget of the UBA in 2010 was about € 100 million.27
Domestic EU-level UNFCCCGHG Inventory National Inventory Report, Common Reporting Format tables, KP-LULUCF reporting
Frequency Annually
Policy evaluation IEKP and Energy Concept EU Monitoring Mechanism National Communication
Frequency Every 2 years/every 3 years Every 2 years Every 3-5 years (as decided by the Conference of Parties)
Table 2.2: Overview of MRV mechanisms at the domestic, EU and international level
23A CPI Working Paper
Tracking Emissions and Mitigation Actions February 2012
2.2.1 Emissions measurement The Single National Entity and responsible UBA experts need to collect data for all IPCC source categories (energy, industrial processes, solvent use, agriculture, land use, land use change and forestry (LULUCF),28 and waste) and corresponding sub-source and sink categories. Data collection com-prises the following steps:
• defining requirements,• determining the source-category-specific
quality criteria for the data,• requesting data from data providers
(carried out by the relevant expert groups), and
• receipt of data.
The main data management tool for all informa-tion necessary to calculate emissions (methods, activity rates, and emission factors) is the Central System Emissions (CSE). The CSE automates emission calculations based on activity rate and emission factor inputs. It has been used since 2002 and is the main tool for the Single National Entity to fulfill the UNFCCC requirements of transparency, consistency, completeness, com-parability, and accuracy. The calculated emis-sions are automatically exported to standardised reporting tables. At the same time, the data is archived within the CSE. The Single National Entity supports the other UBA departments in safe-guarding the actual data flow through agree-ments with industrial associations.
Measurement systems for the major emitting sectors are set out below.
Energy accounted for 81% of German GHG emissions in 2009.29 Activity data (or “energy balances”) are prepared by the Working Group on Energy Balances (AGEB). The Working Group includes members from the German Institute of Economic Research (DIW Berlin) and Energy Environment Forecast Analysis (EEFA). Data comes from the Federal Statistical Office (Des-tatis), industrial and energy associations (coal, petroleum, gas, and electricity), and, for renew-ables, the Centre for Solar Energy and Hydrogen-Research Baden-Württemberg (ZSW).
Destatis collects and provides emission-relevant activity data, particularly for industrial sectors and combustion installations. The statistical office generally collects data through primary surveys,30 but in some instances uses secondary surveys, i.e. data previously collected for other purposes. The federal office relies on survey collection and aggregation by the Statistical offices of the Länder.31 Survey recipients are legally mandated to report their data and can be fined up to €5,000 for deliberately false, incomplete, or late reports, as well as for non-disclosure.32 Surveys can be submitted electronically or by post. The elec-tronic survey system includes some basic quality assurance functions, such as automatic internal consistency checks, but it cannot identify egre-gious reporting errors.33
AGEB reports energy production and energy source consumption data from stationary com-bustion installations, transport, the residential and agriculture sectors, and industry installations.34
The satellite balance, published along with the energy balances, includes data on the generation and consumption of renewable energies. Energy data is presented in natural units (e.g. tons for fuels, m³ for gases, kilowatt hours for electrical power),35 then aggregated into standard energy units (e.g. joules and tons of coal equivalents).36
Emission factors for energy were developed through a UBA-commissioned research project in 2004. Emission factor data is based on operator data, literature research, association statistics, and UBA expertise.37 Uncertainties are assessed using the IPCC Good Practice Guidelines and expert assessment.38 Emission factors are peri-odically updated via research projects to take technological changes into account.39 The energy balances are publicly accessible online in spread-sheet form in both German and English.
Transport sector emissions are calculated with the TREMOD model (based on bottom-up, Tier-2/3 approach). The model distributes consump-tion among individual vehicle and road categories. The relevant emissions are calculated within the CSE database.
24A CPI Working Paper
Tracking Emissions and Mitigation Actions February 2012
Industrial processes accounted for 8% of total GHG emissions in Germany in 2009. Activity data for the mineral industry are obtained primar-ily from industry association statistics. Similarly, for each industrial process (e.g. cement, lime, soda ash, bitumen, glass, and asphalt), the UBA experts receive data from the corresponding industry associations. A minor share of the data is collected through the monitoring system for the voluntary self-commitment of German industry (NIR, 2011); industry transmits this data to the UBA.
The Federal Statistical Agency receives and aggregates data from Länder statistical offices, which collect and compile data through surveys at the Länder level. The Federal Statistical Agency then transmits the information to the Single National Entity.
In general, emission factors are calculated by UBA experts based on commissioned research proj-ects, though sometimes IPCC default values are used.
Agriculture accounted for 8% of national emis-sions in 2009.40 Data is collected by the Federal Statistical Office and by the von Thünen Institute (vTI). Where data is unavailable, estimates rely on figures from literature (for example, for crop residues and recommended fertilizer quantities) and expert assessments (e.g. for techniques for storing farm fertilizers). Most calculations are based on highly differentiated activity data from national sources. For some source categories, default emission factors from the 1996 and 2006 IPCC Guidelines, or the EMEP/EEA manual of the United Nations Economic Commission for Europe (UN ECE) are used.
Land use, land use change, and forestry (LULUCF) accounted for 2% of net national emissions.41 Data for changes in carbon stocks in forest biomass (accounting for 2% net sequestration) is collected from Germany’s National Forest Inven-tories (BWI) and the Forestfund database using the IPCC Good Practice Guidance for Land-Use, Land-use Change and Forestry (GPG-LULUCF, IPCC, 2003).
The LULUCF inventory is prepared by the vTI. Within the vTI, the Institute for Forest Ecology and Forest Inventory is responsible for the forest land category and the Institute of Agricultural Climate Research is responsible for the remaining five land use categories.42
LULUCF data is collected according to different methodologies. Area data on forests is collected from the first and second forest inventory (BWI 1 & 2) for the Old German Länder and by remote sensing and the second forest inventory for the New German Länder. Biomass data for the Old German Länder is based on BWI 1 & 2 and the 2008 inventory study; for the New Länder it is based on the data repository, the BWI 2, and the 2008 inventory study. Forest soil data is prepared using a mix of country-specific methodologies and IPCC standards. For Cropland, Grassland, Wetlands, Settlements, and Unused lands, area data from 2000 forward has been provided by the digital official topographic-cartographic infor-mation system (ATKIS) landscape model and is extrapolated for previous years. For biomass data in the aforementioned source categories (all but forests), a mix of Destatis agricultural statistics (harvest data), IPCC default, the mean harvest, and expert assessment is used.43 Soil data is pro-vided by a mix of the digital soil map, ATKIS, and national emissions factors.
The 2011 NIR includes a schedule for improv-ing the system for estimating LULUCF by 2013, including standardization of the LULUCF report-ing system, elimination of double counting from mixing different methodologies, and maintaining consistency between KP and UNFCCC reporting. Some of these issues have been identified previ-ously by UNFCCC expert review.44
Waste The Federal Statistical Office publishes detailed, disaggregated time series activity data for the waste sector. Emission factors and other parameters for calculating emissions from land-fills, waste treatment, and composting are taken from national studies and research reports com-missioned by UBA. For certain issues (e.g., half-life selection), UBA consults external experts.45 GHG emissions from waste are calculated in line
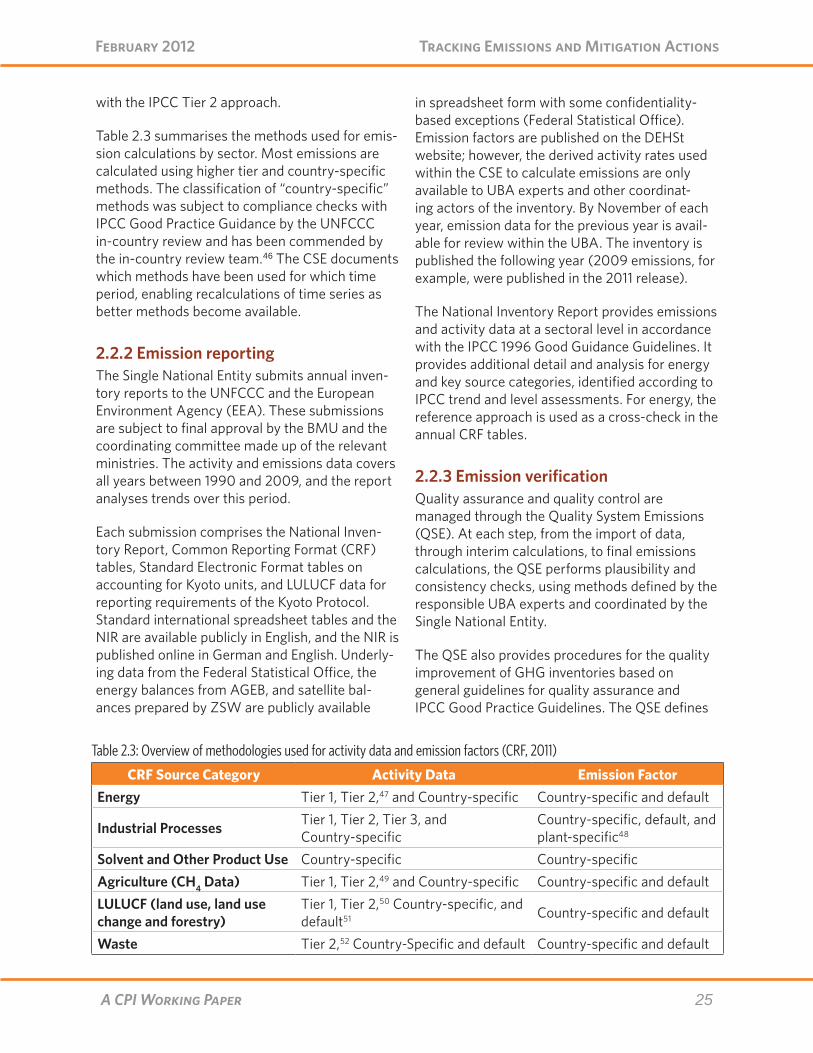
25A CPI Working Paper
Tracking Emissions and Mitigation Actions February 2012
with the IPCC Tier 2 approach.
Table 2.3 summarises the methods used for emis-sion calculations by sector. Most emissions are calculated using higher tier and country-specific methods. The classification of “country-specific” methods was subject to compliance checks with IPCC Good Practice Guidance by the UNFCCC in-country review and has been commended by the in-country review team.46 The CSE documents which methods have been used for which time period, enabling recalculations of time series as better methods become available.
2.2.2 Emission reportingThe Single National Entity submits annual inven-tory reports to the UNFCCC and the European Environment Agency (EEA). These submissions are subject to final approval by the BMU and the coordinating committee made up of the relevant ministries. The activity and emissions data covers all years between 1990 and 2009, and the report analyses trends over this period.
Each submission comprises the National Inven-tory Report, Common Reporting Format (CRF) tables, Standard Electronic Format tables on accounting for Kyoto units, and LULUCF data for reporting requirements of the Kyoto Protocol.
Standard international spreadsheet tables and the NIR are available publicly in English, and the NIR is published online in German and English. Underly-ing data from the Federal Statistical Office, the energy balances from AGEB, and satellite bal-ances prepared by ZSW are publicly available
in spreadsheet form with some confidentiality-based exceptions (Federal Statistical Office). Emission factors are published on the DEHSt website; however, the derived activity rates used within the CSE to calculate emissions are only available to UBA experts and other coordinat-ing actors of the inventory. By November of each year, emission data for the previous year is avail-able for review within the UBA. The inventory is published the following year (2009 emissions, for example, were published in the 2011 release).
The National Inventory Report provides emissions and activity data at a sectoral level in accordance with the IPCC 1996 Good Guidance Guidelines. It provides additional detail and analysis for energy and key source categories, identified according to IPCC trend and level assessments. For energy, the reference approach is used as a cross-check in the annual CRF tables.
2.2.3 Emission verification Quality assurance and quality control are managed through the Quality System Emissions (QSE). At each step, from the import of data, through interim calculations, to final emissions calculations, the QSE performs plausibility and consistency checks, using methods defined by the responsible UBA experts and coordinated by the Single National Entity.
The QSE also provides procedures for the quality improvement of GHG inventories based on general guidelines for quality assurance and IPCC Good Practice Guidelines. The QSE defines
CRF Source Category Activity Data Emission FactorEnergy Tier 1, Tier 2,47 and Country-specific Country-specific and default
Industrial Processes Tier 1, Tier 2, Tier 3, and Country-specific
Country-specific, default, and plant-specific48
Solvent and Other Product Use Country-specific Country-specificAgriculture (CH4 Data) Tier 1, Tier 2,49 and Country-specific Country-specific and defaultLULUCF (land use, land use change and forestry)
Tier 1, Tier 2,50 Country-specific, and default51 Country-specific and default
Waste Tier 2,52 Country-Specific and default Country-specific and default
Table 2.3: Overview of methodologies used for activity data and emission factors (CRF, 2011)
26A CPI Working Paper
Tracking Emissions and Mitigation Actions February 2012
responsibilities and quality objectives for data collection, calculation of emissions and relevant uncertainties, and confirmation that objectives were reached. Where objectives are not reached, the QSE prescribes measures for future improve-ment in subsequent NIR submissions (NIR, 2009).
Data evaluation occurs annually, building on the international expert review coordinated by the UNFCCC Secretariat. The responsible UBA experts evaluate the data using the review report by the UNFCCC secretariat, key source catego-ries, data in the CSE, CRF tables, aggregation and allocation rules between the CSE and the CRF, and source-category-specific information that has been received in the meantime by the single national entity.
The UBA conducts verification activities via 1) comparison of German EU ETS installations with emissions calculated from the energy balances and 2) biennial expert workshops on specific source categories. In addition, Germany com-pares its emissions factors for some sources with those used in other countries and organises cross-country expert workshops on emission estimation methodologies.
New EU ETS requirements for the manufactur-ing sector (outlined in the Introduction chapter) require installations to provide information on production levels as well as emissions. This data provides the basis for installation-specific emis-sion factors and activity data and will improve the accuracy of emission sources from the manufac-turing sectors covered under EU ETS. In turn, this improves the quality of the inventory, as emis-sions data calculated via the energy balances and the CSE can be compared to actual monitored emissions in EU ETS installations.
Quality Control and Quality ImprovementsThe QSE implements quality control (QC) and quality assurance (QA) plans. The plans are executed with respect to the specific roles of participants in the inventory preparation process and, if necessary, to specific source categories. The plans are combined with QC and QA check-lists, which specify quality objectives. Compliance with objectives is either confirmed or non-compliance is justified where these objectives are not attained. Where review results cannot be implemented immediately, they become part of the improvement plan for future work. The improvement plan is thus a set of measures to be taken for the next reporting cycle. About 50 UBA employees and external staff are involved in emis-sions reporting and in the QA/QC process.
Some QSE quality control measures are per-formed and documented automatically in the CSE. Data entry and processing occur in the CSE, which enhances transparency and enables completeness checks, magnitude checks, and automated data-quality control measures through the QSE.
Uncertainty assessmentUncertainties arise in the data collection process; estimates are aggregated after the inventory has been completed. Usually the uncertainties in activity rates and emission factors are assessed by experts of the CSE and are converted to uncer-tainties in emissions. Generally, uncertainties are determined using Tier 1 methods, though Tier 2 methods are applied every three years.
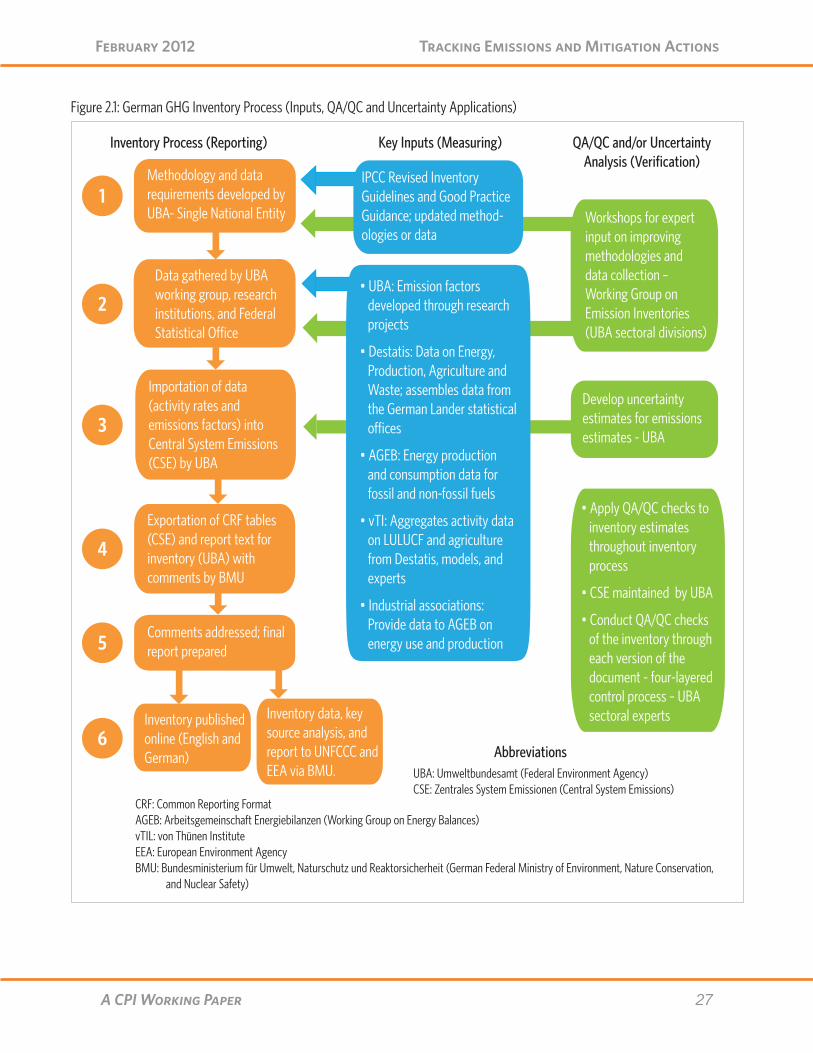
27A CPI Working Paper
Tracking Emissions and Mitigation Actions February 2012
Figure 2.1: German GHG Inventory Process (Inputs, QA/QC and Uncertainty Applications)
28A CPI Working Paper
Tracking Emissions and Mitigation Actions February 2012
2.3 Tracking Mitigation Actions: the Integrated Energy and Climate Program and the EU Monitoring Mechanism
2.3.1 BackgroundGermany has a long history of undertaking climate protection measures, starting in 1990 with the founding of the inter-ministerial group, “CO2 Reduction.” Germany’s first national climate protection program began in 2000; this was revised in 2005; followed by the Integrated Energy and Climate Program (IEKP) in 2007; the Energy Concept in 2010; and most recently the 2011 laws to transform the energy system. The timeframe and ambition of Germany’s plans have increased over time. The 2005 national climate protection program established mitigation actions aimed at reaching Germany’s 21% Kyoto target (for the period 2008-12). The Integrated Energy and Climate Program (IEKP), adopted in 2008, implemented twenty-nine mitigation actions (mainly in the energy sector) focused on reduc-ing GHG emissions to 40% below 1990 levels by 2020. The Energy Concept of 2010 was estab-lished to provide long-term emission reduction goals and renewable energy deployment goals through the year 2050. The Energy Concept of 2010 is strengthened by the energy transfor-mation laws of 2011, which schedule a faster phase-out of nuclear power and accelerate the deployment of renewables and energy efficiency measures.
Beyond tracking national emissions in its inven-tory, Germany has no single MRV system to estimate the impact of its mitigation actions. A comprehensive system has been discussed for the IEKP but has not yet been established; in the meantime, the UBA prepared an interim status report in response to a BMU mandate. This report, however, did not involve inter-ministerial consultation with ministries such as BMWi and BMVBS. A number of specific systems to track the impact of mitigation actions exist under the IEKP, Energy Concept, and energy transformation laws; BMU and BMWi have overall responsibility for these.
Germany’s domestic MRV systems are supple-mented by biennial UBA progress reports under the EU Monitoring Mechanism, and the four-yearly National Communications to the UNFCCC. These regional and global reporting systems have more limited scope than Germany’s domestic systems – they focus on describing the mitiga-tion actions have been implemented or adopted rather than quantifying what those actions have achieved. These reports rely heavily on the ex-ante estimates of the expected mitigation outcomes of policies and to some extent on the inventory and the CSE. The basis of data for these reports is the CSE, which is used for GHG inven-tory, and on model calculations such as the EU projection report.53
The sections below describe differences between domestic, EU, and UNFCCC reporting systems.
Tracking progress of 2011 energy transformation lawsThe energy transformation laws were proposed and adopted in summer 2011. The package foresees annual monitoring of nuclear power phase-out, renewable energy deployment and energy efficiency improvement measures. The exact structure of the monitoring is not described. The following institutions are mentioned as potential competent entities to be involved in the monitoring:
• Working Group on Energy Balances• Federal Statistical Office• Federal Network Agency• Federal Environment Agency• Federal Cartel Office (Competition
Authority)• Federal Office of Economics and Export
Control
Under the new energy laws, the Economics and Technology Minister shall report on grid expan-sion, expansion of the power plant park, reinvest-ments, and energy efficiency. The Environment Minister shall report on the deployment of renew-able energies. On the basis of this information, the federal government informs the German
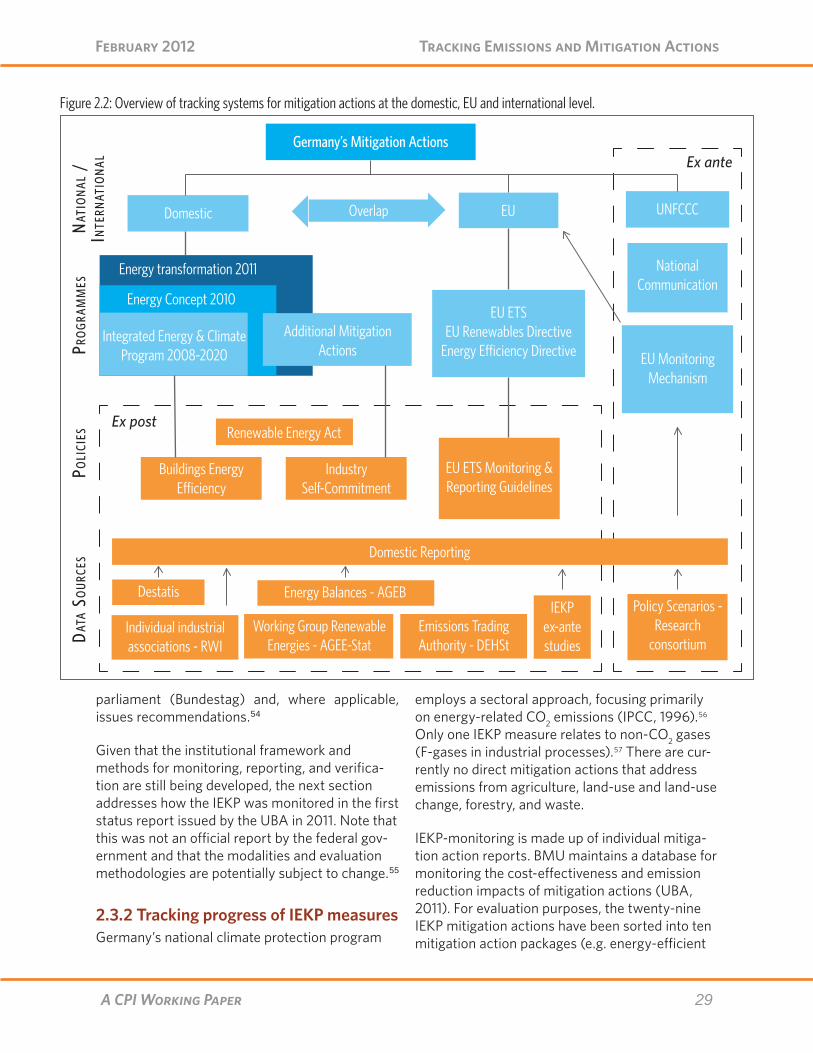
29A CPI Working Paper
Tracking Emissions and Mitigation Actions February 2012
parliament (Bundestag) and, where applicable, issues recommendations.54
Given that the institutional framework and methods for monitoring, reporting, and verifica-tion are still being developed, the next section addresses how the IEKP was monitored in the first status report issued by the UBA in 2011. Note that this was not an official report by the federal gov-ernment and that the modalities and evaluation methodologies are potentially subject to change.55
2.3.2 Tracking progress of IEKP measuresGermany’s national climate protection program
employs a sectoral approach, focusing primarily on energy-related CO2 emissions (IPCC, 1996).56 Only one IEKP measure relates to non-CO2 gases (F-gases in industrial processes).57 There are cur-rently no direct mitigation actions that address emissions from agriculture, land-use and land-use change, forestry, and waste.
IEKP-monitoring is made up of individual mitiga-tion action reports. BMU maintains a database for monitoring the cost-effectiveness and emission reduction impacts of mitigation actions (UBA, 2011). For evaluation purposes, the twenty-nine IEKP mitigation actions have been sorted into ten mitigation action packages (e.g. energy-efficient
Figure 2.2: Overview of tracking systems for mitigation actions at the domestic, EU and international level.

30A CPI Working Paper
Tracking Emissions and Mitigation Actions February 2012
buildings and GHG avoidance in the transport sector). The data for each individual mitigation action come either from legally prescribed moni-toring reports or from ad-hoc calculations by the UBA or other responsible agencies.
The general features of the IEKP status report are set out below and the feed-in-tariff is discussed as a specific example.
MonitoringThe first IEKP status report used ex-ante projec-tions and continuously collected data to evalu-ate the progress of individual mitigation actions. Ex-ante studies (that is, studies conducted before the IEKP took effect) project potential emis-sion reductions and costs of the individual IEKP mitigation actions. Ex-post studies and monitor-ing reports are generated according to the legal requirement for monitoring the progress of some individual mitigation actions. Some of these are based on research projects commissioned by the responsible government entity, such as BMWi, BMU, or UBA. Comparison of the IEKP ex-ante projections and monitored data reveals the prog-ress and future potential of individual mitigation actions and provides a solid basis for evaluating the effectiveness of the mitigation actions.
Rather than relying on a single study, the IEKP status report draws on six separate ex-ante studies: three by government agencies and three by external analytic groups. Most of these studies project emission reductions for each individual IEKP mitigation action, and one quanti-fies the potential costs of each mitigation action. A separate ex-ante study, the Policy Scenarios, is used to develop the projection report for the EU Monitoring Mechanism (see Box below); this study estimates the emission reductions for a ‘with-measures’ and a ‘with-additional measures’ scenario.
All six ex-ante projection studies used for the IEKP evaluation are one-time studies released in either 2007 or 2008, and all are based on modeling and commissioned by the UBA or third parties (e.g. political parties or NGOs). The divergence between the studies’ projections stems from the
different modeling methods and different draft versions of the mitigation action legal texts used in the analysis. The projection studies do not account for the recent economic downturn.
Reporting Some IEKP mitigation actions include legal requirements for the periodic monitoring of prog-ress. These monitoring studies are the main input for the overall IEKP status report. Other mitigation actions are reviewed on an ad hoc basis through studies commissioned by UBA. These individual monitoring and experience reports are avail-able on the responsible ministries’ or agencies’ websites, but they are not grouped on an IEKP or climate-protection-specific website or internet portal. Where monitoring reports are mandatory, the data is published mostly in report and spread-sheet format with some ready-made download-able graphs illustrating development over time.
The first IEKP report is available online in German. The IEKP report conducted by the UBA at the instruction of the BMU focuses on national miti-gation actions. Reporting on EU-level programs such as the EU ETS is explicitly excluded, as it is subject to separate MRV arrangements.58 The IEKP report, however, has been prepared at the instruction of the BMU in the absence of defined modalities for monitoring GHG mitigation actions.
VerificationThe IEKP status report was neither indepen-dently verified, nor reviewed by other government agencies; consultation was limited to relevant UBA expert divisions. In contrast, official reports are prepared in consultation with all relevant ministries.59
Tracking progress of Germany’s feed in tariffThe German feed-in-tariff (EEG) is a principal mitigation action of the IEKP. The tariff drives investment in renewable energy (principally solar) and incentivizes its deployment. Under the EEG, renewable energy projects are guaranteed access to the electricity grid, and electricity providers
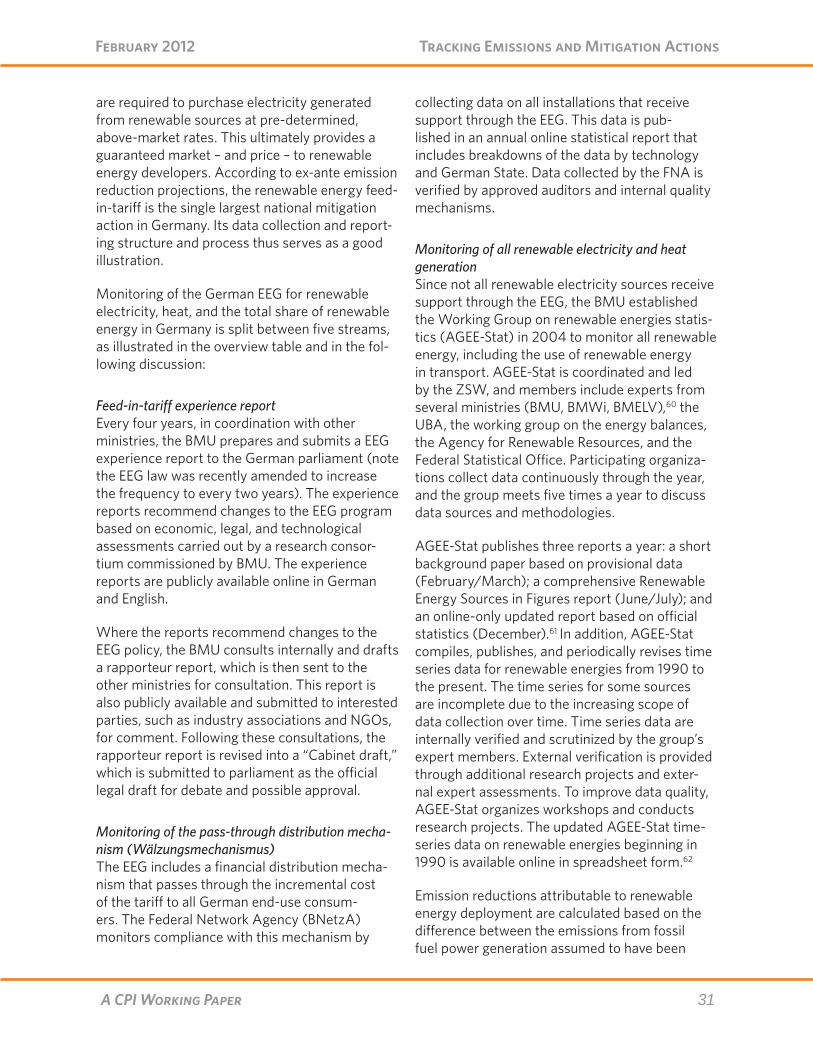
31A CPI Working Paper
Tracking Emissions and Mitigation Actions February 2012
are required to purchase electricity generated from renewable sources at pre-determined, above-market rates. This ultimately provides a guaranteed market – and price – to renewable energy developers. According to ex-ante emission reduction projections, the renewable energy feed-in-tariff is the single largest national mitigation action in Germany. Its data collection and report-ing structure and process thus serves as a good illustration.
Monitoring of the German EEG for renewable electricity, heat, and the total share of renewable energy in Germany is split between five streams, as illustrated in the overview table and in the fol-lowing discussion:
Feed-in-tariff experience reportEvery four years, in coordination with other ministries, the BMU prepares and submits a EEG experience report to the German parliament (note the EEG law was recently amended to increase the frequency to every two years). The experience reports recommend changes to the EEG program based on economic, legal, and technological assessments carried out by a research consor-tium commissioned by BMU. The experience reports are publicly available online in German and English.
Where the reports recommend changes to the EEG policy, the BMU consults internally and drafts a rapporteur report, which is then sent to the other ministries for consultation. This report is also publicly available and submitted to interested parties, such as industry associations and NGOs, for comment. Following these consultations, the rapporteur report is revised into a “Cabinet draft,” which is submitted to parliament as the official legal draft for debate and possible approval.
Monitoring of the pass-through distribution mecha-nism (Wälzungsmechanismus)The EEG includes a financial distribution mecha-nism that passes through the incremental cost of the tariff to all German end-use consum-ers. The Federal Network Agency (BNetzA) monitors compliance with this mechanism by
collecting data on all installations that receive support through the EEG. This data is pub-lished in an annual online statistical report that includes breakdowns of the data by technology and German State. Data collected by the FNA is verified by approved auditors and internal quality mechanisms.
Monitoring of all renewable electricity and heat generationSince not all renewable electricity sources receive support through the EEG, the BMU established the Working Group on renewable energies statis-tics (AGEE-Stat) in 2004 to monitor all renewable energy, including the use of renewable energy in transport. AGEE-Stat is coordinated and led by the ZSW, and members include experts from several ministries (BMU, BMWi, BMELV),60 the UBA, the working group on the energy balances, the Agency for Renewable Resources, and the Federal Statistical Office. Participating organiza-tions collect data continuously through the year, and the group meets five times a year to discuss data sources and methodologies.
AGEE-Stat publishes three reports a year: a short background paper based on provisional data (February/March); a comprehensive Renewable Energy Sources in Figures report (June/July); and an online-only updated report based on official statistics (December).61 In addition, AGEE-Stat compiles, publishes, and periodically revises time series data for renewable energies from 1990 to the present. The time series for some sources are incomplete due to the increasing scope of data collection over time. Time series data are internally verified and scrutinized by the group’s expert members. External verification is provided through additional research projects and exter-nal expert assessments. To improve data quality, AGEE-Stat organizes workshops and conducts research projects. The updated AGEE-Stat time-series data on renewable energies beginning in 1990 is available online in spreadsheet form.62
Emission reductions attributable to renewable energy deployment are calculated based on the difference between the emissions from fossil fuel power generation assumed to have been
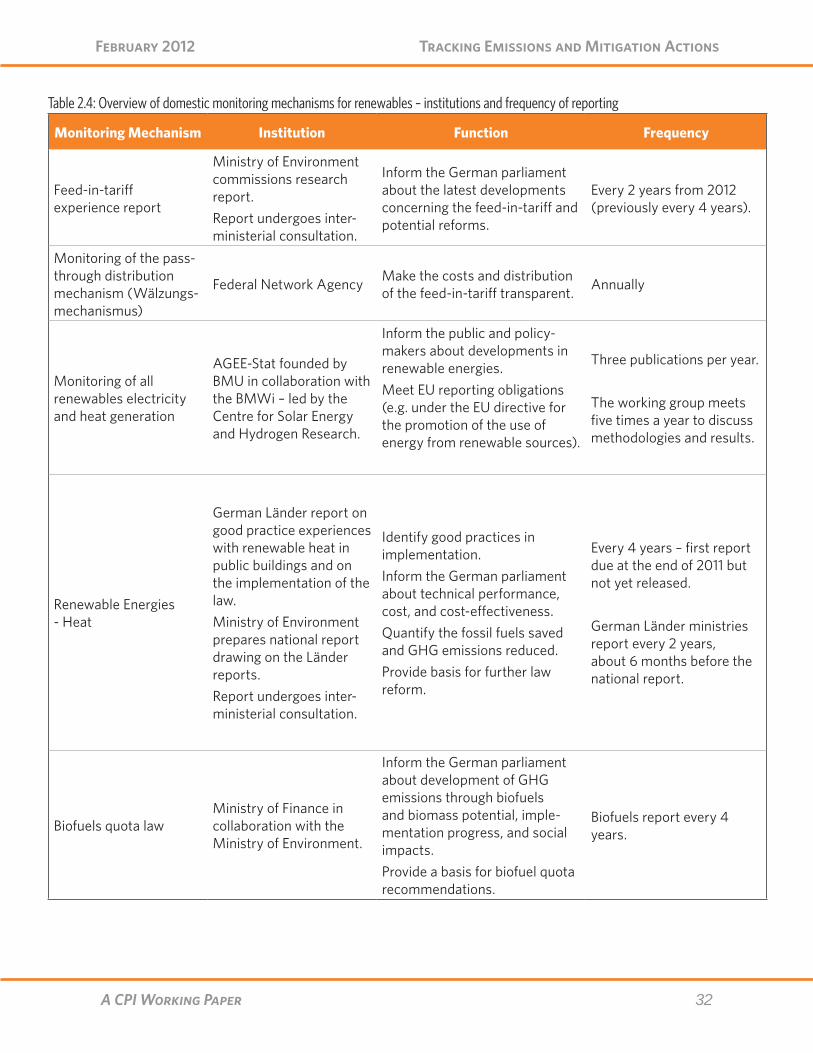
32A CPI Working Paper
Tracking Emissions and Mitigation Actions February 2012
Table 2.4: Overview of domestic monitoring mechanisms for renewables – institutions and frequency of reporting
Monitoring Mechanism Institution Function Frequency
Feed-in-tariff experience report
Ministry of Environment commissions research report.Report undergoes inter-ministerial consultation.
Inform the German parliament about the latest developments concerning the feed-in-tariff and potential reforms.
Every 2 years from 2012 (previously every 4 years).
Monitoring of the pass-through distribution mechanism (Wälzungs-mechanismus)
Federal Network Agency Make the costs and distribution of the feed-in-tariff transparent. Annually
Monitoring of all renewables electricity and heat generation
AGEE-Stat founded by BMU in collaboration with the BMWi – led by the Centre for Solar Energy and Hydrogen Research.
Inform the public and policy-makers about developments in renewable energies.Meet EU reporting obligations (e.g. under the EU directive for the promotion of the use of energy from renewable sources).
Three publications per year.
The working group meets five times a year to discuss methodologies and results.
Renewable Energies - Heat
German Länder report on good practice experiences with renewable heat in public buildings and on the implementation of the law.Ministry of Environment prepares national report drawing on the Länder reports.Report undergoes inter-ministerial consultation.
Identify good practices in implementation.Inform the German parliament about technical performance, cost, and cost-effectiveness. Quantify the fossil fuels saved and GHG emissions reduced. Provide basis for further law reform.
Every 4 years – first report due at the end of 2011 but not yet released.
German Länder ministries report every 2 years, about 6 months before the national report.
Biofuels quota law Ministry of Finance in collaboration with the Ministry of Environment.
Inform the German parliament about development of GHG emissions through biofuels and biomass potential, imple-mentation progress, and social impacts.Provide a basis for biofuel quota recommendations.
Biofuels report every 4 years.

33A CPI Working Paper
Tracking Emissions and Mitigation Actions February 2012
displaced and the life cycle emissions of the relevant renewable energy technology. The UBA uses emission factors from the Central System of Emissions (CSE) and in some cases data from two additional databases (GEMIS and ECOInvent).
2.3.3 Tracking progress for the EU Monitoring MechanismGermany submits a progress report under the EU Monitoring Mechanism every two years. The content of this report is also used in the National Communication to the UNFCCC, including a list of mitigation actions, their objectives, and the quan-tification of potential emission reductions. The National Communication is due every three to five years, depending on the decision of the Confer-ence of the Parties to the UNFCCC. A standard template is used by all EU Member States, allow-ing easy cross-country comparison. Germany submitted its most recent projection report in May 2011. No changes occurred between the pro-jections submitted in 2009 and 2011 due to a then ongoing discussion about the nuclear phase-out and uncertainty about policies to be adopted the in case of an earlier phase-out (UBA, 2011b).
The EU report has broader coverage than the IEKP system. It includes EU-level policies operating in Germany (e.g. the EU ETS) and covers all emit-ting sectors except LULUCF. It also examines the interaction between EU and national policies. The
report provides mitigation projections for a large number of mitigation actions through 2020. The “cousin” of the original progress report, the Policy Scenarios (Politikszenarien) in the EU report esti-mate scenarios up to the year 2030.
According to current EU monitoring require-ments, no ex-post analysis of mitigation actions is necessary.63
The report provides basic descriptive informa-tion on each mitigation action (including name and objective, status of implementation, type of instrument (economic, fiscal, regulatory)64, targeted sector,65 and greenhouse gas(es) addressed). It also includes standardized perfor-mance indicators, as listed in Table 2.
As mentioned in the introduction, Germany is also a participant in the EU ETS. The implement-ing authority in Germany is the German Emissions Trading Authority (DEHSt), a division of the UBA. It administers the national registry and maintains a list of 215 accredited verifiers (5 of which have a foreign accreditation). Operators whose reports do not meet reporting criteria cannot make further transfers of allowances until a report from that operator has been verified as satisfactory. Verified emissions data, as well as surrendered CDM and JI credits, are archived in the national registry and linked to the CITL.
Making of the ex-ante “Policy Scenarios”The Policy Scenarios (Politikszenarien) are used to project Germany’s emissions out to 2030 for inclusion in the report to the EU Monitoring Mechanism. The scenarios contain not only aggregate national emissions for the years 2010, 2015, and 2020 for a with-measures and with-additional-measures scenario, but they also quantify expected mitigation outcomes for individual measures. This helps gauge whether Germany is on track to its medium-term goals (and in turn helps the EU track its overall progress).
The scenarios are recalculated every two years: the BMU asks the UBA to commission the Policy Scenarios from a consortium of research institutes. The winning consortium discusses the scope of the project and design of the scenarios with the BMU and UBA, and other ministries in the Inter-ministerial CO2 Working Group give feedback to the BMU on their recommendations for project design and scenario definition. The consortium then starts to model the projections. The results are discussed again with the UBA, BMU, and other ministries. In recent years, the BMWi, BMVBS, and BMF have contributed greatly to these discussions.
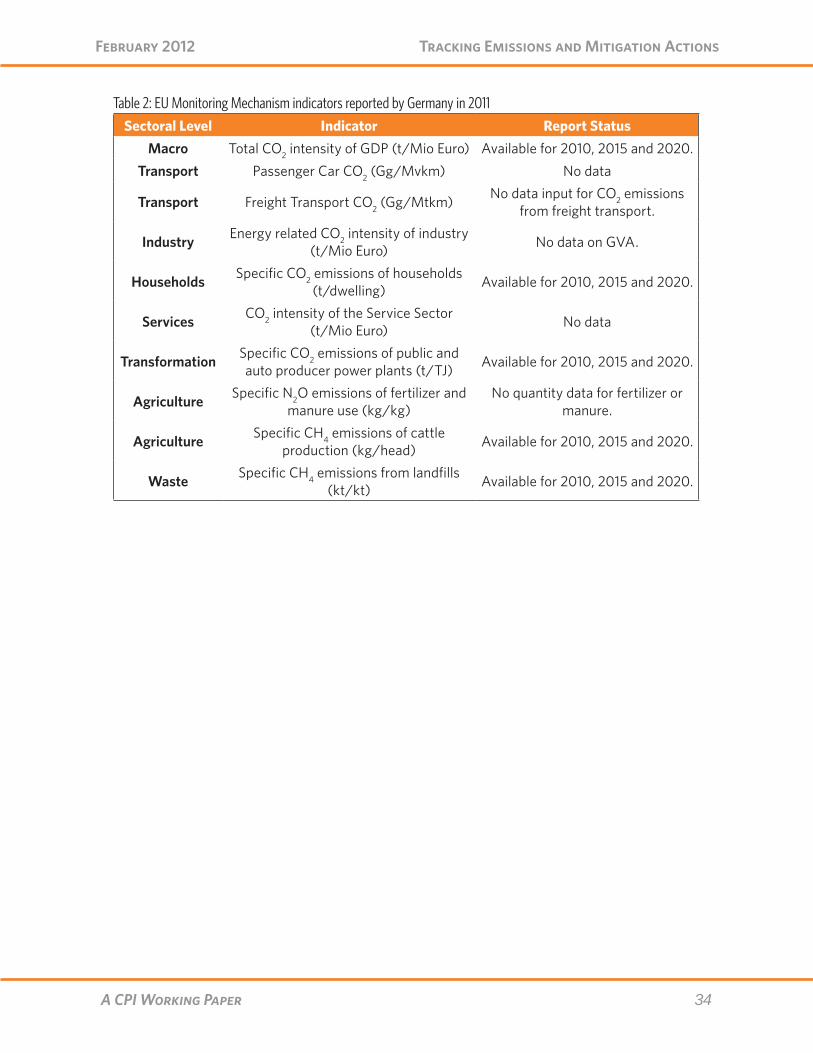
34A CPI Working Paper
Tracking Emissions and Mitigation Actions February 2012
Sectoral Level Indicator Report StatusMacro Total CO2 intensity of GDP (t/Mio Euro) Available for 2010, 2015 and 2020.
Transport Passenger Car CO2 (Gg/Mvkm) No data
Transport Freight Transport CO2 (Gg/Mtkm) No data input for CO2 emissions from freight transport.
Industry Energy related CO2 intensity of industry (t/Mio Euro) No data on GVA.
Households Specific CO2 emissions of households (t/dwelling) Available for 2010, 2015 and 2020.
Services CO2 intensity of the Service Sector (t/Mio Euro) No data
Transformation Specific CO2 emissions of public and auto producer power plants (t/TJ) Available for 2010, 2015 and 2020.
Agriculture Specific N2O emissions of fertilizer and manure use (kg/kg)
No quantity data for fertilizer or manure.
Agriculture Specific CH4 emissions of cattle production (kg/head) Available for 2010, 2015 and 2020.
Waste Specific CH4 emissions from landfills (kt/kt) Available for 2010, 2015 and 2020.
Table 2: EU Monitoring Mechanism indicators reported by Germany in 2011
35A CPI Working Paper
Tracking Emissions and Mitigation Actions February 2012
Italy
Key Points
Emissions:• Italy’s GHG inventory system is well
developed, underpinned by strong insti-tutional capacity and expertise within the Institute of Environmental Protection and Research (ISPRA) and the long- standing National Statistical System (Sistan). Estimates are improved using entity level reporting under the EU Emissions Trading System and strong cooperation between ISPRA and a number of governmental and research institutions, industrial associations, and industries.
• National statistics and country specific emission factors are used in almost all emission estimates. Plant specific emission factors are also used where available. The most advanced IPCC methodological approach (Tier 3) is used for the energy industries sector; Tier 2 in most other sectors; and Tier 1 for particu-larly difficult subsectors, such as agricul-ture and land use, land-use change, and forestry.
• ISPRA is planning a number of improve-ments to the inventory, in particular in the LULUCF, agriculture and waste sectors. A National Land Use Inventory has recently been completed and will improve inventory estimates, and a National Registry for Carbon Sinks is in develop-ment.
• Quality assurance and quality control procedures are well developed but have room for improvement in terms of uncer-tainty analysis and independent review.
Mitigation actions: • A cross-governmental Technical
Committee on GHG emissions annually assesses the implementation status of climate change measures. The Commit-tee’s outputs are not publicly available.
• Beyond the national inventory, there is no comprehensive system in place for tracking the emissions outcomes or cost-effectiveness of the overall portfolio of mitigation actions, nor guidelines for evaluating individual policy outcomes. Instead, MRV procedures are defined within individual policy legislation and rarely provide direct information on GHG savings.
• National communications to the UNFCCC and related reporting to the European Commission serve as the only consistent vehicles for comprehensive reporting of mitigation actions in Italy.
• Limited external verification of mitigation action monitoring and reporting takes place.
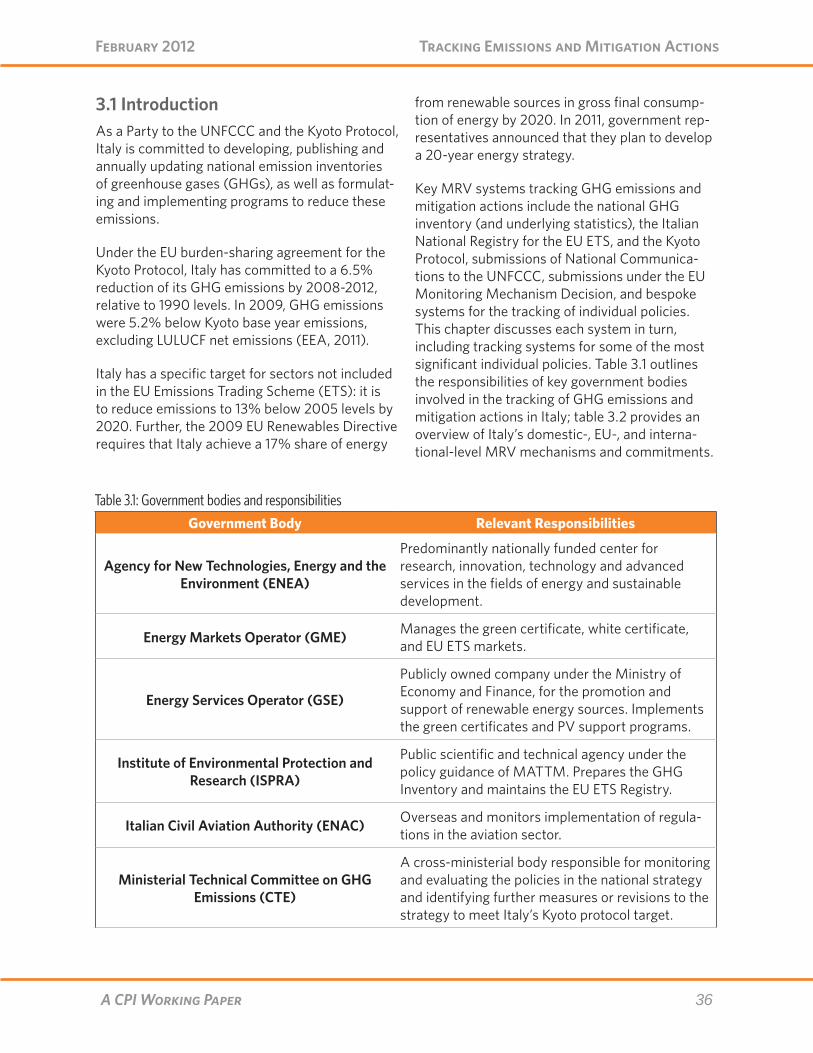
36A CPI Working Paper
Tracking Emissions and Mitigation Actions February 2012
3.1 IntroductionAs a Party to the UNFCCC and the Kyoto Protocol, Italy is committed to developing, publishing and annually updating national emission inventories of greenhouse gases (GHGs), as well as formulat-ing and implementing programs to reduce these emissions.
Under the EU burden-sharing agreement for the Kyoto Protocol, Italy has committed to a 6.5% reduction of its GHG emissions by 2008-2012, relative to 1990 levels. In 2009, GHG emissions were 5.2% below Kyoto base year emissions, excluding LULUCF net emissions (EEA, 2011).
Italy has a specific target for sectors not included in the EU Emissions Trading Scheme (ETS): it is to reduce emissions to 13% below 2005 levels by 2020. Further, the 2009 EU Renewables Directive requires that Italy achieve a 17% share of energy
Table 3.1: Government bodies and responsibilities
Government Body Relevant Responsibilities
Agency for New Technologies, Energy and the Environment (ENEA)
Predominantly nationally funded center for research, innovation, technology and advanced services in the fields of energy and sustainable development.
Energy Markets Operator (GME) Manages the green certificate, white certificate, and EU ETS markets.
Energy Services Operator (GSE)
Publicly owned company under the Ministry of Economy and Finance, for the promotion and support of renewable energy sources. Implements the green certificates and PV support programs.
Institute of Environmental Protection and Research (ISPRA)
Public scientific and technical agency under the policy guidance of MATTM. Prepares the GHG Inventory and maintains the EU ETS Registry.
Italian Civil Aviation Authority (ENAC) Overseas and monitors implementation of regula-tions in the aviation sector.
Ministerial Technical Committee on GHG Emissions (CTE)
A cross-ministerial body responsible for monitoring and evaluating the policies in the national strategy and identifying further measures or revisions to the strategy to meet Italy’s Kyoto protocol target.
from renewable sources in gross final consump-tion of energy by 2020. In 2011, government rep-resentatives announced that they plan to develop a 20-year energy strategy.
Key MRV systems tracking GHG emissions and mitigation actions include the national GHG inventory (and underlying statistics), the Italian National Registry for the EU ETS, and the Kyoto Protocol, submissions of National Communica-tions to the UNFCCC, submissions under the EU Monitoring Mechanism Decision, and bespoke systems for the tracking of individual policies. This chapter discusses each system in turn, including tracking systems for some of the most significant individual policies. Table 3.1 outlines the responsibilities of key government bodies involved in the tracking of GHG emissions and mitigation actions in Italy; table 3.2 provides an overview of Italy’s domestic-, EU-, and interna-tional-level MRV mechanisms and commitments.
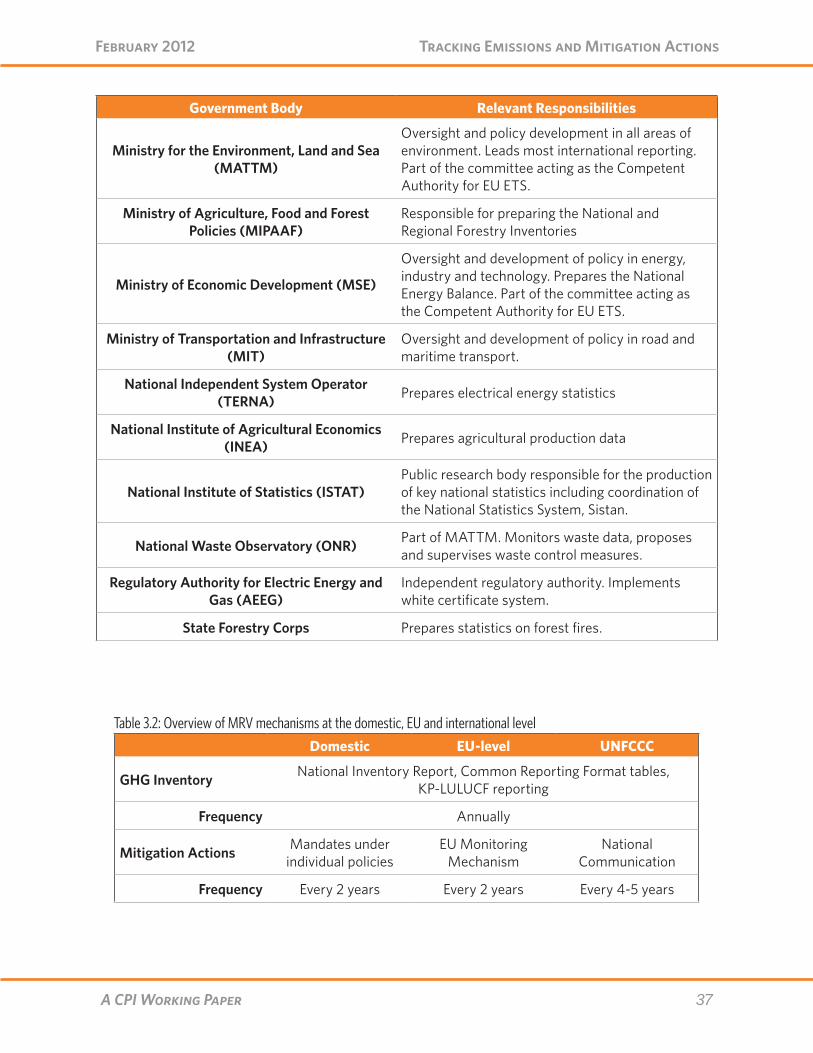
37A CPI Working Paper
Tracking Emissions and Mitigation Actions February 2012
Government Body Relevant Responsibilities
Ministry for the Environment, Land and Sea (MATTM)
Oversight and policy development in all areas of environment. Leads most international reporting. Part of the committee acting as the Competent Authority for EU ETS.
Ministry of Agriculture, Food and Forest Policies (MIPAAF)
Responsible for preparing the National and Regional Forestry Inventories
Ministry of Economic Development (MSE)
Oversight and development of policy in energy, industry and technology. Prepares the National Energy Balance. Part of the committee acting as the Competent Authority for EU ETS.
Ministry of Transportation and Infrastructure (MIT)
Oversight and development of policy in road and maritime transport.
National Independent System Operator (TERNA) Prepares electrical energy statistics
National Institute of Agricultural Economics (INEA) Prepares agricultural production data
National Institute of Statistics (ISTAT)Public research body responsible for the production of key national statistics including coordination of the National Statistics System, Sistan.
National Waste Observatory (ONR) Part of MATTM. Monitors waste data, proposes and supervises waste control measures.
Regulatory Authority for Electric Energy and Gas (AEEG)
Independent regulatory authority. Implements white certificate system.
State Forestry Corps Prepares statistics on forest fires.
Table 3.2: Overview of MRV mechanisms at the domestic, EU and international level
Domestic EU-level UNFCCC
GHG Inventory National Inventory Report, Common Reporting Format tables, KP-LULUCF reporting
Frequency Annually
Mitigation Actions Mandates under individual policies
EU Monitoring Mechanism
National Communication
Frequency Every 2 years Every 2 years Every 4-5 years
38A CPI Working Paper
Tracking Emissions and Mitigation Actions February 2012
3.2 Tracking Emissions: National Inventory
3.2.1 IntroductionSince 1999, the Italian Institute of Environmen-tal Protection and Research (ISPRA), formerly the National Environmental Protection Agency (APAT), has overseen the preparation and com-pilation of Italy’s annual GHG inventory. ISPRA is a public scientific and technical agency oper-ating under the supervision of the Ministry of Environment.
Italy’s first national inventory report, cover-ing the years 1990-2001, was submitted to the UNFCCC in 2003 in accordance with its obliga-tions as a Convention and Kyoto Protocol Party. The latest was submitted in 2011 and covers the years 1990-2009. At present, approximately eight staff members work full time on GHG inventory compilation at ISPRA (Personal Communication, ISPRA, 2011). The annual budget for GHG inven-tory preparation is €475,000 per year.
The Ministry for the Environment, Land and Sea (MATTM) is responsible for approving the inventory and submitting it to both the UNFCCC Secretariat and the European Commission. The MATTM also approves the National System Plan, which includes all updated information on institutional, legal and procedural arrangements for estimating emissions and removals of green-house gases, and for the reporting and archiving inventory information.
In addition to the national GHG Inventory, several regions in Italy have begun to develop their own GHG inventory. However, local GHG inventories are not required to be prepared by law, unlike air pollution emission inventories (where an inter-agency technical board has been established to provide guidance).
3.2.2 MeasurementThe Italian GHG inventory consists of estimates of all six direct GHGs covered under the Kyoto Protocol and four indirect GHGs; all major
sources and sinks; and (at the latest update) the years 1990 to 2009.
Basic statistical data used to estimate emissions come from the various institutions that make up the Italian National Statistical System, Sistan (See ISPRA follows IPCC guidelines in prepar-ing its inventory. Table 3.2 provides an overview of the main methodological features of the GHG Inventory compilation. Country-specific emission factors are used to calculate emissions in most cases. Where emissions from point sources are available (e.g. from power stations, cement kilns, refineries reporting under obligations including the EU ETS, the Large Combustion Plant Direc-tive (LCP) and European Pollutant Release and Transfer Register (E-PRTR and industrial envi-ronmental reports), they are used in preparation of the GHG inventory.). Scientific and technical institutions and consultants contribute additional information on activity data and emission factors of some specific activities. The main data sources used for the inventory compilation and the responsible institutions are shown in Figure 3.1. In its 2011 Inventory Report, ISPRA notes that it has established fruitful collaborations with a number of governmental and research institutions—as well as industrial associations and industries themselves—which helps in improving emission estimates by providing or verifying data.
ISPRA follows IPCC guidelines in preparing its inventory. Table 3.2 provides an overview of the main methodological features of the GHG Inven-tory compilation. Country-specific emission factors are used to calculate emissions in most cases. Where emissions from point sources are available (e.g. from power stations, cement kilns, refineries reporting under obligations including the EU ETS, the Large Combustion Plant Directive (LCP) and European Pollutant Release and Trans-fer Register (E-PRTR and industrial environmental reports), they are used in preparation of the GHG inventory.
ISPRA uses key source category analysis (in line with IPCC guidelines) to prioritize inventory improvements on the sectors that contribute
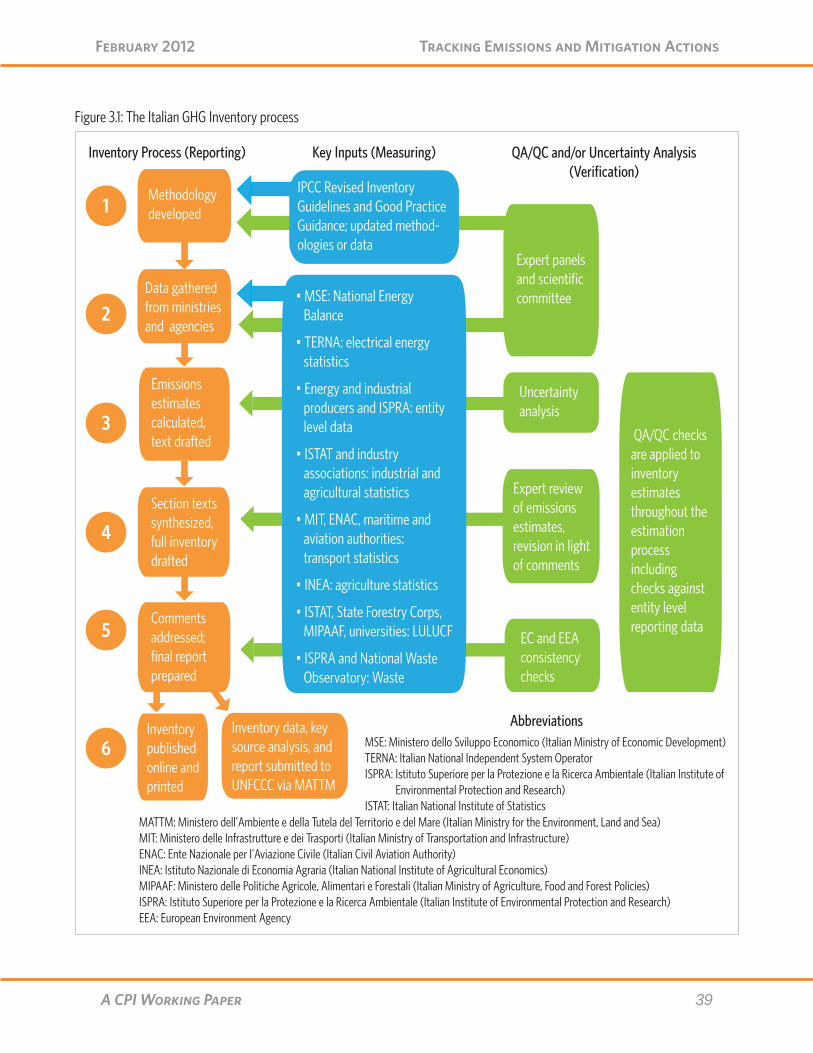
39A CPI Working Paper
Tracking Emissions and Mitigation Actions February 2012
Figure 3.1: The Italian GHG Inventory process
40A CPI Working Paper
Tracking Emissions and Mitigation Actions February 2012
Box 3.1 The National Statistical System (Sistan) and the National Energy Balance (BEN)The National Statistical System (Sistan)66 was established in 1989 based on guiding principles and criteria for reforming national official statistics. Sistan is a network of around 10,000 statistical operators, coordinated by the Italian National Institute of Statistics (ISTAT) which is in turn part of the European Statistical System. Ministries, public agencies, private entities and other bodies, operating across all sectors of the economy, are obliged to provide the data and information as specified for 3 year periods in an organizational and functional co-ordination plan termed the National Statistical Programme (PSN).67 EU Regulation No. 844/2010 sets out details, definitions and methodological details of energy statistics to be reported annually by all EU Member States to Eurostat.
The Committee for Policy and Co-ordination of Statistical Information (Comstat) sets up guidelines and policies for Sistan offices and agrees on the PSN. The president of Comstat is also the president of ISTAT and members are representatives of institutions belonging to Sistan and academic experts. An external and independent body, the Commission for Guaranteeing Statistical Information (CoGIS) supervises the impartiality and completeness of statistical information, the quality of methodologies, and the compliance of surveys with EU and international directives. It also assesses the PSN itself.68
Technical working groups - Circoli di qualità – operate with the aim of improving the quality of basic data. Working group members are producers and users of statistical information.69
The National Energy Balance (BEN) is produced by the statistics office of the Department of Energy of the Ministry of Economic Development. It is aided by ISTAT, ENEL and SNAM, who evaluate methodologies as well as provisional and final results. The BEN is the most significant source of data for the GHG inventory. The BEN includes data on total energy supply (based on production, exports, imports, stock changes and known losses) and total demand. The BEN is published annually, as a summary report, on the Ministry of Economic Development’s website.70 BEN data are collected from industrial entities, on a monthly basis, by the Ministry of Economic Development. Oil products, natural gas and electricity used by industry, civil or transport sectors are all sold with registration papers related to levels of excise duties – providing a reliable source of data for the energy balance.
Coal is not subject to excise duties so consumption information is estimated but reliable since most coal is imported by a limited number of operators which the Ministry of Economic Development (MSE) tracks on a monthly basis. Additional information from TERNA, SNAM and other operators including data reported under the EU ETS is used to prepare and cross check emissions estimates.
most to overall emissions and/or have a high level of uncertainty. Italy plans to improve several areas, including: land use and land-use change; N2O emission factors for agricultural soils; waste composition; and biomass burning and forest fires.
Two additional emissions registries complement Italy’s inventory: the national registry for carbon sinks (described below) and the national registry for the EU ETS and Kyoto (described in Section 3.3.2).
National Registry for Carbon sinks The National Registry for Carbon Sinks was established by a Ministerial Decree on 1 April 2008, and the technical design was completed in
2009 by a technical group of experts from gov-ernment and academic institutions. The Registry is part of the Italian National System for the GHG Inventory, under the joint responsibility of the MATTM and the Ministry of Agriculture, Food and Forest Policies. The Registry will be used to estimate GHG emissions by sources and remov-als by sinks in forestland and related land-use changes. The National Land Use Inventory (IUTI) was recently completed, resulting in national land use classification for the years 1990, 2000 and 2008. It is estimated that the Registry will be completed, including forest inventory data, by 2012. Meanwhile, verified data from the Registry are already used in the preparation of the GHG inventory.
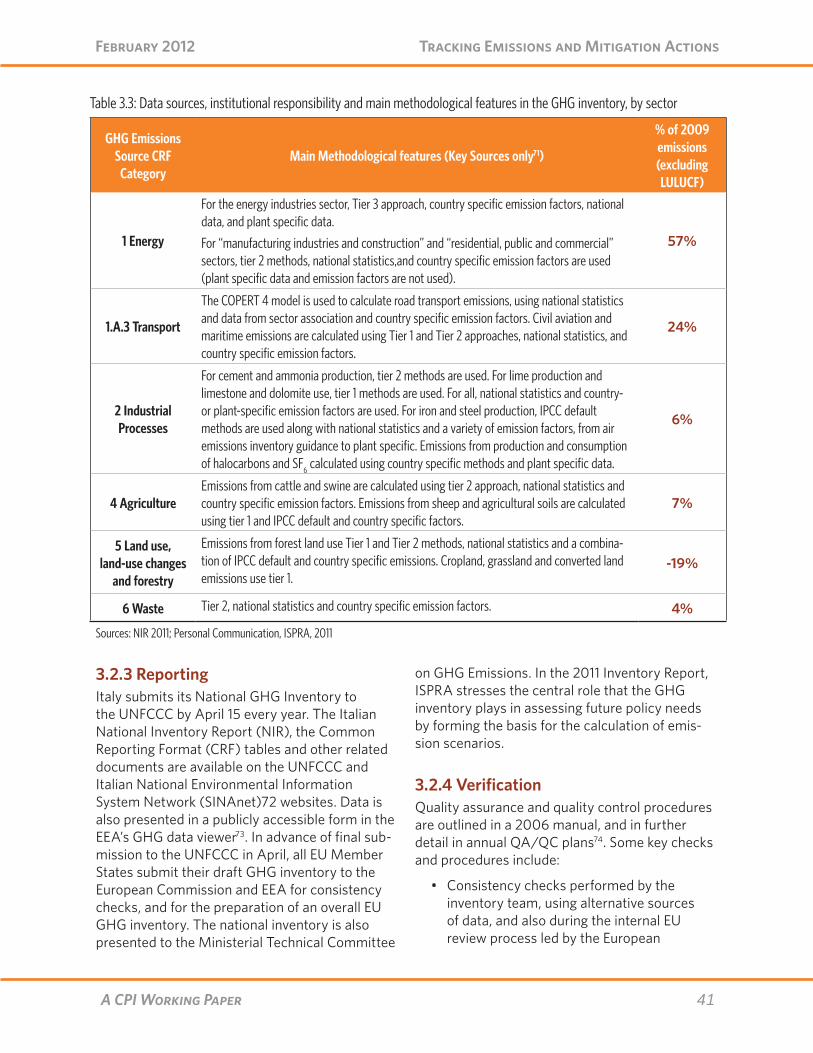
41A CPI Working Paper
Tracking Emissions and Mitigation Actions February 2012
3.2.3 Reporting Italy submits its National GHG Inventory to the UNFCCC by April 15 every year. The Italian National Inventory Report (NIR), the Common Reporting Format (CRF) tables and other related documents are available on the UNFCCC and Italian National Environmental Information System Network (SINAnet)72 websites. Data is also presented in a publicly accessible form in the EEA’s GHG data viewer73. In advance of final sub-mission to the UNFCCC in April, all EU Member States submit their draft GHG inventory to the European Commission and EEA for consistency checks, and for the preparation of an overall EU GHG inventory. The national inventory is also presented to the Ministerial Technical Committee
on GHG Emissions. In the 2011 Inventory Report, ISPRA stresses the central role that the GHG inventory plays in assessing future policy needs by forming the basis for the calculation of emis-sion scenarios.
3.2.4 VerificationQuality assurance and quality control procedures are outlined in a 2006 manual, and in further detail in annual QA/QC plans74. Some key checks and procedures include:
• Consistency checks performed by the inventory team, using alternative sources of data, and also during the internal EU review process led by the European
GHG Emissions Source CRF Category
Main Methodological features (Key Sources only71)
% of 2009 emissions (excluding LULUCF)
1 Energy
For the energy industries sector, Tier 3 approach, country specific emission factors, national data, and plant specific data.
For “manufacturing industries and construction” and “residential, public and commercial” sectors, tier 2 methods, national statistics,and country specific emission factors are used (plant specific data and emission factors are not used).
57%
1.A.3 Transport
The COPERT 4 model is used to calculate road transport emissions, using national statistics and data from sector association and country specific emission factors. Civil aviation and maritime emissions are calculated using Tier 1 and Tier 2 approaches, national statistics, and country specific emission factors.
24%
2 Industrial Processes
For cement and ammonia production, tier 2 methods are used. For lime production and limestone and dolomite use, tier 1 methods are used. For all, national statistics and country- or plant-specific emission factors are used. For iron and steel production, IPCC default methods are used along with national statistics and a variety of emission factors, from air emissions inventory guidance to plant specific. Emissions from production and consumption of halocarbons and SF6 calculated using country specific methods and plant specific data.
6%
4 AgricultureEmissions from cattle and swine are calculated using tier 2 approach, national statistics and country specific emission factors. Emissions from sheep and agricultural soils are calculated using tier 1 and IPCC default and country specific factors.
7%
5 Land use, land-use changes
and forestry
Emissions from forest land use Tier 1 and Tier 2 methods, national statistics and a combina-tion of IPCC default and country specific emissions. Cropland, grassland and converted land emissions use tier 1.
-19%
6 Waste Tier 2, national statistics and country specific emission factors. 4%
Sources: NIR 2011; Personal Communication, ISPRA, 2011
Table 3.3: Data sources, institutional responsibility and main methodological features in the GHG inventory, by sector

42A CPI Working Paper
Tracking Emissions and Mitigation Actions February 2012
Environment Agency. Due to lack of capacity and resources, an independent review of the Italian inventory is not currently undertaken (ISPRA, 2010b). Revisions are, however, made in light of feedback from the UNFCCC review process.
• Direct use of entity level data from the EU ETS, the Italian Pollutant Emission Register, and the National Grid Admin-istrator (TERNA), where possible. Such data are subject to separate verification procedures.
• Methodology development through research projects and national and inter-national expert working groups.
• Tier 1 uncertainty analysis in accordance with IPCC guidance for all sectors and Tier 2 for selected sectors. Higher-level IPCC uncertainty analysis has been applied to some key categories for the year 2009. This analysis will be extended to the entire inventory categories for the next submission.
3.3 Tracking Mitigation Actions: National Reporting, International Reporting and Individual MeasuresFollowing adoption of the Kyoto Protocol in 2002, the Inter-Ministerial Committee for Economic Planning (CIPE)—chaired by the Ministry of Economy—approved the Italian National Climate Change Strategy and established the Technical Committee on GHG emissions (Comitato Tecnico Emissioni Gas-Serra, CTE), a cross-ministerial body responsible for monitoring and evaluating the policies in the national strategy, as well as identifying further potential measures or revisions to meet Italy’s Kyoto protocol target. The CTE, which currently sits at the level of director general with representatives of the prime minister’s office, prepares annual reports on the status of the implementation of climate change measures, based on information provided by administrations and estimated emissions trends. Outputs of the Committee are not publicly available.
To date, other national evaluations of climate policy effectiveness and cost have been done on an ad-hoc basis, e.g. a 2008 intergovernmental evaluation of the economic impact of the EU “20-20-20 package” on the Italian economy;75 and a 2009 review of the potential GHG impact of the 2007-2013 European Regional Development Fund Operational Programmes by MSE’s Public Invest-ment Evaluation Unit (UVAL) and ENEA.76
Beyond this, Italy does not have a comprehensive system in place for tracking the emissions out-comes or cost effectiveness of its overall mitiga-tion action portfolio, nor are there guidelines for evaluating individual policy outcomes. Instead monitoring, reporting and verification procedures are defined within individual policy legislation and executed by designated authorities. The national communications to the UNFCCC and related reporting to the EC serve as the only consistent vehicles for comprehensive reporting of Italy’s mitigation actions. Estimates of emissions out-comes presented in the reports are generated by responsible ministries but methods used to do so are not publically documented.
3.3.1 National Communications and EU Monitoring MechanismNational Communications to the UNFCCC and reports to the EU in the context of the European Decision 280/2004/EC77 on monitoring of GHG emissions (EU Monitoring Mechanism) are coor-dinated by the MATTM with major inputs from ISPRA, MSE, and ENEA.78
Italy includes a wide variety of mitigation actions within the scope of its international climate policy reporting, including: renewable energy; energy efficiency (trading schemes, technology mea-sures, building regulations), measures to reduce emissions in agriculture and industry, as well as Budget Laws and funds which support such measures and rail infrastructure projects. Beyond these coordinated international reporting efforts, MRV of individual mitigation actions is conducted as prescribed in respective legislation.
This section first provides information on the
43A CPI Working Paper
Tracking Emissions and Mitigation Actions February 2012
two major international reporting activities listed above; it then summarizes the MRV provisions present in Italy’s top nine (in terms of projected emissions savings in 2010 and 2015 plus EU ETS) mitigation actions; finally, MRV provisions estab-lished under two of these key mitigation actions are described in more detail.
MeasuringThere appears to be no standardized methods, guidelines, coordination mechanisms, or tools in place at present for the ex-post or ex-ante estima-tion of the impact of mitigation actions in Italy. In addition, methods used to derive the ex-ante estimates of policy impact are not reported. Insti-tutions responsible for the oversight of individual mitigation actions prepare estimates based on their own methods and expert judgment. Ex-post estimates of the impact of mitigation actions are not a mandatory reporting requirement in National Communications or the EU Monitoring Mechanism, and are generally not produced due to significant methodological difficulties (Personal Communication, ISPRA).
The implementation and monitoring of most environmental policies is delegated to the regional and local levels in Italy, particularly in sectors such as energy production, transport and distri-bution. The capacity to evaluate the impact of policies is limited at the regional level. Improve-ments to policy monitoring and evaluation have been stronger in the energy and industry sectors in recent years, due to central government involvement.
Reporting Italy’s 5th National Communication was submit-ted to the UNFCCC in March 2010. Chapter 4 contains an overview of Italy’s climate mitigation actions and Chapter 5 contains GHG emission projection scenarios.
UNFCCC Parties are required to estimate the overall impact of their mitigation actions on GHG emissions, while taking account of the double counting difficulties that could occur from a simple aggregation of the estimates of the impact
of individual mitigation actions. This report does not include a “without policy” projection, nor does it estimate the overall GHG impact of previously implemented and adopted policies. Italy does, however, provide estimates of the overall GHG impact of planned policies and measures in 2010 and 2020.
Other policy information provided includes detailed descriptions of the functioning of existing actions, objectives, types of GHG affected, and the types of policy instruments and implementing entities.
Under the EU Monitoring Mechanism, Italy reported most recently in 2011, providing summary tables on mitigation actions, projec-tions, projection indicators and parameters, as well as a written Italian climate policy progress report.79 This reporting obligation is currently biennial. In the 2011 submission, an ex-ante estimate of the reduction potential of every policy listed is provided. However, no information is provided to explain how the estimates were derived. Other policy information provided in the EUMM submission includes the objectives of the policy, sector targeted, type of instrument, related EU polices, gases affected and implementation status.
Though required by EU rules, Italy does not report the cost of the policy and information on interact-ing policies.80 Italy is therefore unable to assess the cost effectiveness of its various mitigation actions. In addition, no “without policies” projec-tion scenario is provided, and therefore the overall impact of implemented mitigation actions is not reported. An “additional measures” scenario is provided, however, which, when deducted from the “with measures” scenario, provides an ex-ante estimate of the overall impact of planned mitiga-tion measures.
Based on the 2009 Monitoring Mechanism submission, the European Environment Agency has prepared an online database of EU Member States’ (including Italy’s) climate mitigation actions.81
44A CPI Working Paper
Tracking Emissions and Mitigation Actions February 2012
VerificationUnder the UNFCCC, National Communications are subject to a process of “in-depth” review that is conducted by a team of international experts and includes a country visit. However, the review tends to focus on the implementation of report-ing requirements under the Convention, and does not necessarily constitute verification of the accuracy of data reported by the country. Italy’s 4th National Communication was found to meet UNFCCC national communication guideline requirements, but improvements in the reporting of the policy impacts was identified as one area for improvement. Italy’s 5th National Communi-cation has recently undergone UNFCCC in-depth review—however, the review report is not yet published.
Submissions under European Directive 280/2004/EC on Monitoring of GHG emissions are not subject to a formal verification procedure, although data are checked for irregularities by the EEA and its European Topic Centre on Air Pollu-tion and Climate Change Mitigation throughout the preparation process of annual reports on GHG Trends and Projections in Europe.
3.3.3 Tracking of individual mitigation actionsOf the 26 implemented mitigation actions listed in Italy’s March 2011 EC Monitoring Mechanism submission, the following mitigation actions are the top eight in terms of projected emissions savings in 2010 and 2015:
• PV Systems Decree / “Conto Energia”• Green Certificates System• 55% Tax Incentive for energy efficiency
improvements• White Certificates Scheme• Buildings Regulation• Standards for energy using products• Emission standard for new cars• Biofuels target
An addition to this is the EU Emissions Trading System, which is not listed in the submission. As described in the Introduction, as an EU Member
State, Italy participates in the ETS, and member states are responsible for establishing imple-mentation bodies within their own borders. The competent authority in Italy is the National Committee for the Management of Directive 2003/87/EC and Support to the Management of Kyoto Protocol Project Activities (Comitato nazio-nale per la gestione della direttiva 2003/87/CE e per il supporto nella gestione delle attività di pro-getto del protocollo di Kyoto). This is composed of a Governing Council and a Technical Secretariat. The former consists of representatives of the MATTM, the MSE, and the Ministry of European Affairs and Regions (on an advisory basis only),82 while the latter consists of technical experts appointed by MATTM, MSE, ENEA, Ministry of Economy and Finance, Ministry of Infrastructure and Transport and GSE.83
For Italy’s EU ETS National Registry, ISPRA func-tions as Italy’s Registry Administrator.84 It over-sees the registry’s operation and maintenance under the supervision of the National Competent Authority. The Italian National Registry was established in 2006 and is linked to the European Community Independent Transaction Log (CITL). Since January 2011, ISPRA has an agreement with Innofactor Oy to host and maintain the Regis-try and provide support related to the Registry. The Italian Competent Authority has accredited 24 verification organizations to date85 and lays down minimum requirements for verification reports, including reporting of omissions, misrep-resentations, or errors.
Detailed descriptions of the tracking systems for Italy’s White and Green Certificate Schemes are provided in the following section. This, together with our broader review of mitigation policies, reveals that almost all of Italy’s mitigation actions involve some form of entity level reporting of activity and/or emissions data (for example, by grid operators, electricity producers or import-ers, industrial installation operators, distribution system operators, product manufacturers or importers, fuel suppliers, or car manufacturers). However the EU ETS and White Certificates could be said to have the most stringent guidelines for measuring, reporting and verification.
45A CPI Working Paper
Tracking Emissions and Mitigation Actions February 2012
Verification is usually carried out by official gov-ernment agencies such as AEEG, ENEA or GSE using desk-based analysis of data and onsite spot checks. Third party verification or certification takes place in the case of the EU ETS, the EU Per-formance of Buildings Directive, the Energy Per-formance of Products Directive and the Biofuels Directive. The green certificates, white certificates and the EU emission trading systems have clear sanctions for non-compliance.
Most mitigation actions also require competent authorities to prepare annual progress reports detailing the implementation status, and in the case of policies that implement EU legislation, such reports are also required to be submitted to the European Commission. Most policy level reporting does not include a direct estimation of GHG savings induced by the policy.
3.3.4 White Certificates Scheme
Overview Introduced in 2001, the White Certificates or Title of Energy Efficiency (TEE) system is the most important energy efficiency program in Italy and covers the industrial, service and residential sectors.86 Italian gas and electricity Distribution System Operators (DSO) with more than 50,000 customers are required to achieve primary energy saving targets through a variety of energy saving projects in end use sectors. Projects can be imple-mented by distributors directly or by intermedi-ary companies (e.g. energy service companies or ESCOs). Distributors can also buy certificates from other parties. Each certificate corresponds to 1 ton of oil equivalent (toe) of energy saved.87
The Regulatory Authority for Electric Energy and Gas (AEEG) both defines the technical rules and implements, monitors, and enforces the system. AEEG’s guidelines evaluate proposals for energy reducing measures and also certify DSO energy savings. AEEG publishes annual and biannual reports on the progresses and results achieved by the White Certificates Scheme.88
MeasurementAEEG guidelines define three possible methods
for calculating energy savings:
• Default valuation methods: estimate savings on the basis of a project’s technical attributes and pre-defined, technology-specific savings (for instance, default savings associated with CFLs)
• Analytical valuation methods: estimate savings on the basis of pre-defined algorithms
• “On-balance” valuation methods: energy savings are quantified on the basis of an Energy Monitoring Plan defined by the project developer and subject to AEEG/ENEA approval
ReportingDistributors request verification and certification of the energy savings attributable to their proj-ects from AEEG/ENEA. DSOs use a predefined reporting format to provide project documenta-tion. DSOs developing a project reliant on an “on-balance” valuation method submit their requests for verification and certification - and associated reporting documents - on the basis of the time-schedules agreed within the Energy Monitoring Plan.
Verification AEEG—with support from ENEA—validates projects, certifies energy savings, and provides a signal to the Energy Markets Operator (Gestore dei Mercati Energetici - GME) to issue certificates to the distributor. Verification is carried out via random on-site audits and qualitative and quan-titative desk-based checks of project documenta-tion submitted by distributors.89 In the case of non-compliance, AEEG can apply appropriate sanctions according to law 481/95. However, when the DSO achieves savings of at least 60% of its assigned targets, it can compensate by taking additional action in the next year, without incurring sanctions.90
3.3.5 Green Certificates System
Overview The Green Certificates system (or “CV”) obliges

46A CPI Working Paper
Tracking Emissions and Mitigation Actions February 2012
electricity generators and importers to contribute a minimum share of electricity (excluding CHP) from renewable energy sources to the grid. Pro-viders can generate the renewable electric-ity themselves, import it or purchase it on the market. The initial share was set at 2% of the overall electricity produced or imported (exceed-ing 100 GWh). Subsequently, Legislative Decree 387/03 increased the quota by 0.35% per year for the period of 2004–2006, and Budget Law 2008 increased the percentage to 0.75% for the period 2008-2012. However, this obligation will linearly decrease to zero in 2016 (starting from 2013) as the Green Certificate system is phased out in favor of alternative renewable incentive programs.
Green Certificates are issued to qualified renew-able plants only for the first 12 years of renewable generation (15 for renewable plants with a capac-ity above 1 MW, starting operations in 2008). Each certificate corresponds to 1 MWh, but allo-cation is differentiated according to the renewable energy type.
MeasuringResponsibility for the measurement of electricity produced by renewable plants lies with:
• the grid operator, for plants with a capacity up to 20 kW;
• the energy producer—with the support of the grid operator—for plants with a capacity above 20 kW.91
ReportingRenewable energy producers can request the delivery of Green Certificates, either ex-post or ex-ante, by submitting the following documenta-tion to the GSE:
• in the case of an ex-post request,documentation of final net renewable electricity produced in the previous year, or
• in the case of an ex-ante request, the net estimated renewable electricity production of the plant.92
In the second case, at the end of the year of
reference for the issued certificates, renew-able energy producers are required to prepare a declaration - to be sent to the Technical Finan-cial Office (UTF) - including data on the energy actually produced in that year. The GSE will then balance out any differences.93
Every year, before March 31, electricity genera-tors and importers provide the GSE with a self-certification including the information needed to quantify electricity produced or imported from conventional sources subject to obligations.94
VerificationThe GSE verifies data submitted by renewable energy producers, and issues Green Certificates within 30 days from receipt of issuance requests. The GSE also verifies compliance of electricity generators and importers, providing the AEEG with the names of non-compliant entities. AEEG will then apply appropriate sanctions according to legislative decree 387/03 and law 481/95.95
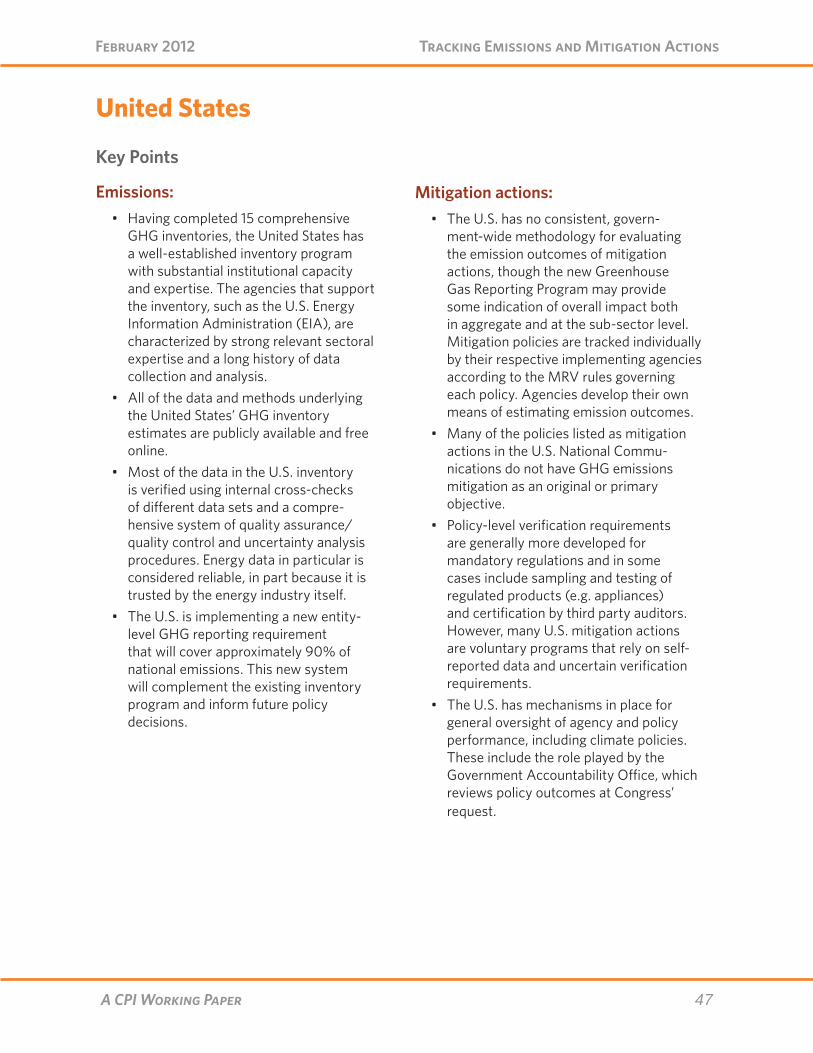
47A CPI Working Paper
Tracking Emissions and Mitigation Actions February 2012
United States
Key Points
Emissions:• Having completed 15 comprehensive
GHG inventories, the United States has a well-established inventory program with substantial institutional capacity and expertise. The agencies that support the inventory, such as the U.S. Energy Information Administration (EIA), are characterized by strong relevant sectoral expertise and a long history of data collection and analysis.
• All of the data and methods underlying the United States’ GHG inventory estimates are publicly available and free online.
• Most of the data in the U.S. inventory is verified using internal cross-checks of different data sets and a compre-hensive system of quality assurance/quality control and uncertainty analysis procedures. Energy data in particular is considered reliable, in part because it is trusted by the energy industry itself.
• The U.S. is implementing a new entity-level GHG reporting requirement that will cover approximately 90% of national emissions. This new system will complement the existing inventory program and inform future policy decisions.
Mitigation actions: • The U.S. has no consistent, govern-
ment-wide methodology for evaluating the emission outcomes of mitigation actions, though the new Greenhouse Gas Reporting Program may provide some indication of overall impact both in aggregate and at the sub-sector level. Mitigation policies are tracked individually by their respective implementing agencies according to the MRV rules governing each policy. Agencies develop their own means of estimating emission outcomes.
• Many of the policies listed as mitigation actions in the U.S. National Commu-nications do not have GHG emissions mitigation as an original or primary objective.
• Policy-level verification requirements are generally more developed for mandatory regulations and in some cases include sampling and testing of regulated products (e.g. appliances) and certification by third party auditors. However, many U.S. mitigation actions are voluntary programs that rely on self-reported data and uncertain verification requirements.
• The U.S. has mechanisms in place for general oversight of agency and policy performance, including climate policies. These include the role played by the Government Accountability Office, which reviews policy outcomes at Congress’ request.
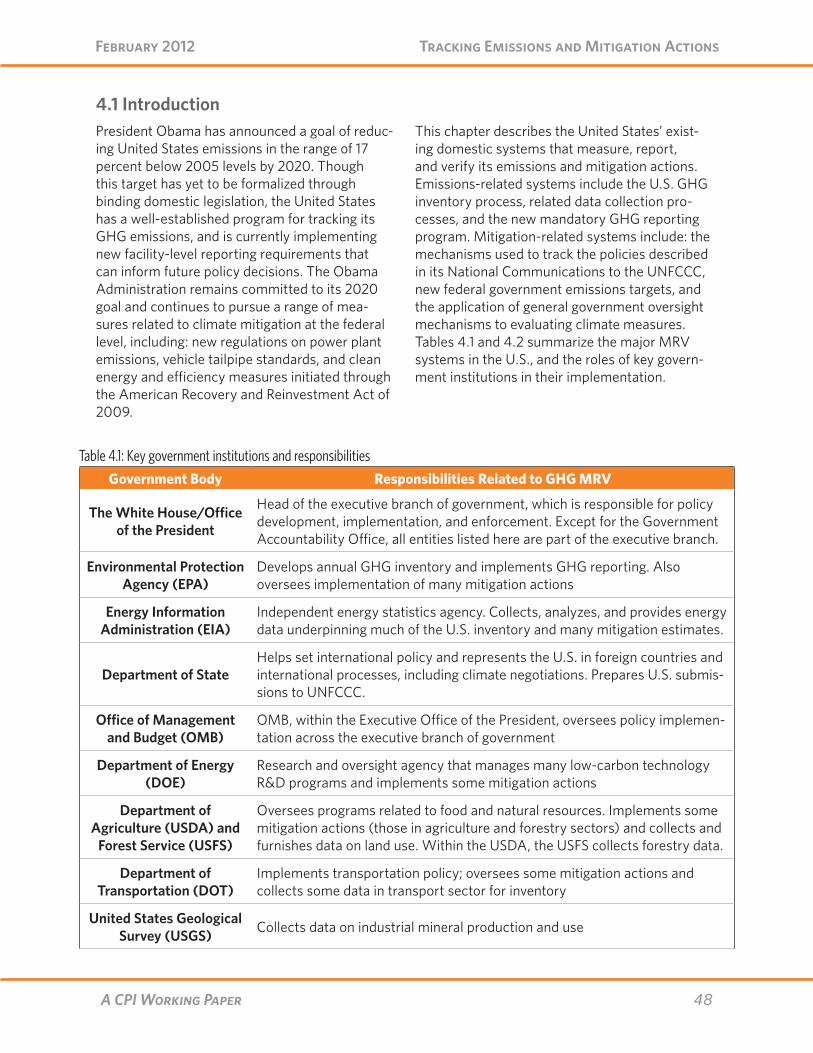
48A CPI Working Paper
Tracking Emissions and Mitigation Actions February 2012
4.1 IntroductionPresident Obama has announced a goal of reduc-ing United States emissions in the range of 17 percent below 2005 levels by 2020. Though this target has yet to be formalized through binding domestic legislation, the United States has a well-established program for tracking its GHG emissions, and is currently implementing new facility-level reporting requirements that can inform future policy decisions. The Obama Administration remains committed to its 2020 goal and continues to pursue a range of mea-sures related to climate mitigation at the federal level, including: new regulations on power plant emissions, vehicle tailpipe standards, and clean energy and efficiency measures initiated through the American Recovery and Reinvestment Act of 2009.
This chapter describes the United States’ exist-ing domestic systems that measure, report, and verify its emissions and mitigation actions. Emissions-related systems include the U.S. GHG inventory process, related data collection pro-cesses, and the new mandatory GHG reporting program. Mitigation-related systems include: the mechanisms used to track the policies described in its National Communications to the UNFCCC, new federal government emissions targets, and the application of general government oversight mechanisms to evaluating climate measures. Tables 4.1 and 4.2 summarize the major MRV systems in the U.S., and the roles of key govern-ment institutions in their implementation.
Table 4.1: Key government institutions and responsibilities
Government Body Responsibilities Related to GHG MRV
The White House/Office of the President
Head of the executive branch of government, which is responsible for policy development, implementation, and enforcement. Except for the Government Accountability Office, all entities listed here are part of the executive branch.
Environmental Protection Agency (EPA)
Develops annual GHG inventory and implements GHG reporting. Also oversees implementation of many mitigation actions
Energy Information Administration (EIA)
Independent energy statistics agency. Collects, analyzes, and provides energy data underpinning much of the U.S. inventory and many mitigation estimates.
Department of StateHelps set international policy and represents the U.S. in foreign countries and international processes, including climate negotiations. Prepares U.S. submis-sions to UNFCCC.
Office of Management and Budget (OMB)
OMB, within the Executive Office of the President, oversees policy implemen-tation across the executive branch of government
Department of Energy (DOE)
Research and oversight agency that manages many low-carbon technology R&D programs and implements some mitigation actions
Department of Agriculture (USDA) and
Forest Service (USFS)
Oversees programs related to food and natural resources. Implements some mitigation actions (those in agriculture and forestry sectors) and collects and furnishes data on land use. Within the USDA, the USFS collects forestry data.
Department of Transportation (DOT)
Implements transportation policy; oversees some mitigation actions and collects some data in transport sector for inventory
United States Geological Survey (USGS) Collects data on industrial mineral production and use
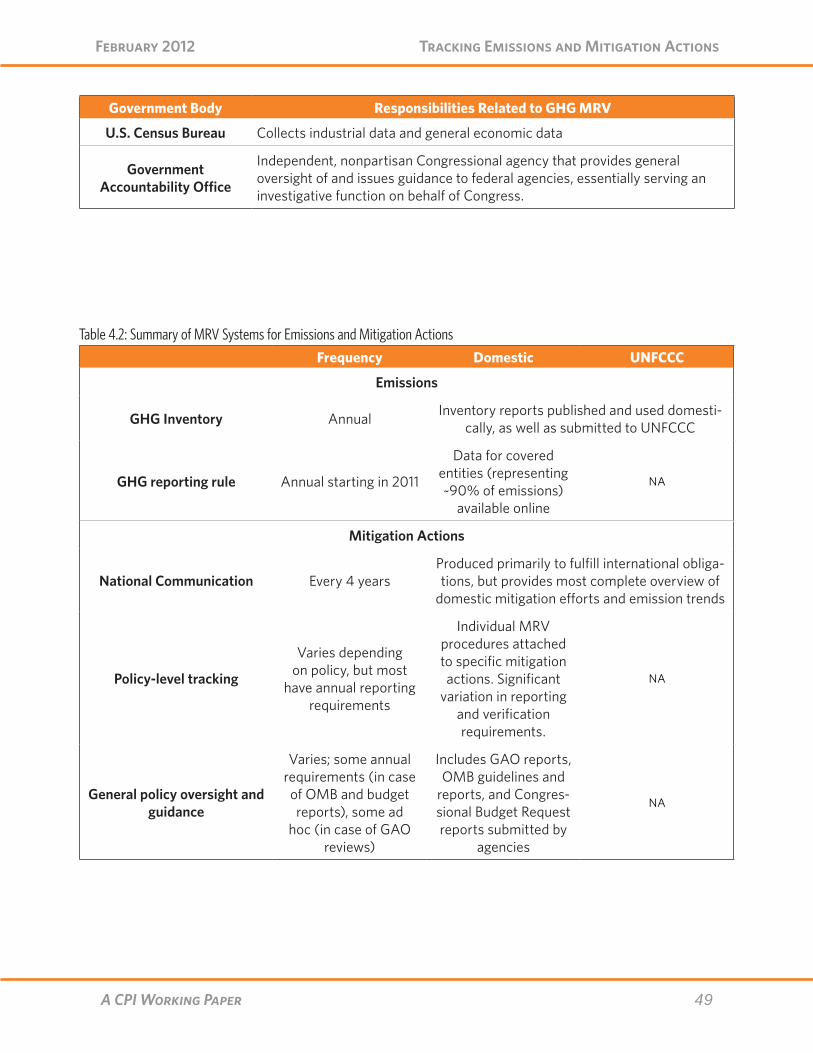
49A CPI Working Paper
Tracking Emissions and Mitigation Actions February 2012
Government Body Responsibilities Related to GHG MRV
U.S. Census Bureau Collects industrial data and general economic data
Government Accountability Office
Independent, nonpartisan Congressional agency that provides general oversight of and issues guidance to federal agencies, essentially serving an investigative function on behalf of Congress.
Table 4.2: Summary of MRV Systems for Emissions and Mitigation ActionsFrequency Domestic UNFCCC
Emissions
GHG Inventory Annual Inventory reports published and used domesti-cally, as well as submitted to UNFCCC
GHG reporting rule Annual starting in 2011
Data for covered entities (representing ~90% of emissions)
available online
NA
Mitigation Actions
National Communication Every 4 yearsProduced primarily to fulfill international obliga-tions, but provides most complete overview of
domestic mitigation efforts and emission trends
Policy-level tracking
Varies depending on policy, but most
have annual reporting requirements
Individual MRV procedures attached to specific mitigation actions. Significant
variation in reporting and verification requirements.
NA
General policy oversight and guidance
Varies; some annual requirements (in case of OMB and budget reports), some ad
hoc (in case of GAO reviews)
Includes GAO reports, OMB guidelines and
reports, and Congres-sional Budget Request reports submitted by
agencies
NA
50A CPI Working Paper
Tracking Emissions and Mitigation Actions February 2012
4.2 Tracking Emissions: National Inventory and EPA Reporting Rule
4.2.3 The United States Greenhouse Gas Inventory
History and ContextThe United States prepares and submits an annual national GHG inventory to the UNFCCC. This is also published in a full report available to the public. In May 2011 the U.S. completed its 15th inventory, which covers annual emissions and sinks for the period 1990-2009. The inventory program was developed primarily to meet inter-national obligations, but also supports several national objectives:
• informing policy-making and evaluation, and tracking progress towards domestic goals;
• improving emission estimation methodologies;
• supporting state and local planning;• estimating future emissions trends, and
the cost of new mitigation options; and• informing international negotiations.
The United States Environmental Protection Agency (EPA) has the overall authority for coor-dinating inventory preparation and submission to the UNFCCC through the Department of State. EPA was established in 1970, and is responsible for protecting the U.S. environment through a variety of research, monitoring, standard-setting, and enforcement programs. The GHG Inventory Program, which operates within EPA’s Office of Atmospheric Programs, oversees inventory devel-opment. The Program itself operates on an annual budget of less than $1 million, though data col-lection activities at other agencies add additional costs (most significantly in energy data collection, as described below).
Measurement in the inventoryThe U.S. inventory describes levels and trends of all anthropogenic emission sources and sinks for the six primary GHGs, starting in 1990 and ending with the latest year for which reliable data
are available. Like all countries, the U.S. calculates emissions based on activity data and GHG emis-sions factors using IPCC methods. EPA relies on other agencies for activity data collection, and any responsibilities for furnishing data are assigned according to agency jurisdiction and expertise, as described below. Within EPA, staff members with relevant expertise are assigned as source cate-gory leads and determine the best methodologies to apply in estimating emissions for their respec-tive sources, oversee the collection of required data, and develop calculation methodologies.
Energy-related activities – primarily fossil fuel combustion for electricity, heating, and transport – accounted for nearly 87 percent of U.S. emis-sions in 2009. The Energy Information Adminis-tration (EIA) collects and processes energy data; this accounts for a significant share of inventory development. Formally established within the Department of Energy (DOE) in 1977, EIA is now an independent, non-partisan agency which collects and analyses energy production and consumption data—which it then provides to the EPA—and develops emissions factors for various fuels. EIA’s information does not require approval for release from any other U.S. government office and is freely available to the public. EIA operated on a budget of $110.5 million in 2010; its energy data collection and processing activities had a budget of $29 million (note: these functions have a wide range of applications beyond emissions tracking).
EIA tracks the production, apparent consumption, import, and export of energy through over 70 different types of surveys that are distributed to entities throughout the energy supply chain.
Survey frequencies range from weekly to qua-drennial. Data is self-reported by survey recipi-ents, and although EIA can penalize entities who fail to report, the need for enforcement is rare as response rates are very high. As the data is not used to assess regulatory compliance, and the energy industry itself is the largest consumer of this data, entities have an incentive to report accurately.
Agricultural activities – such as soil management,
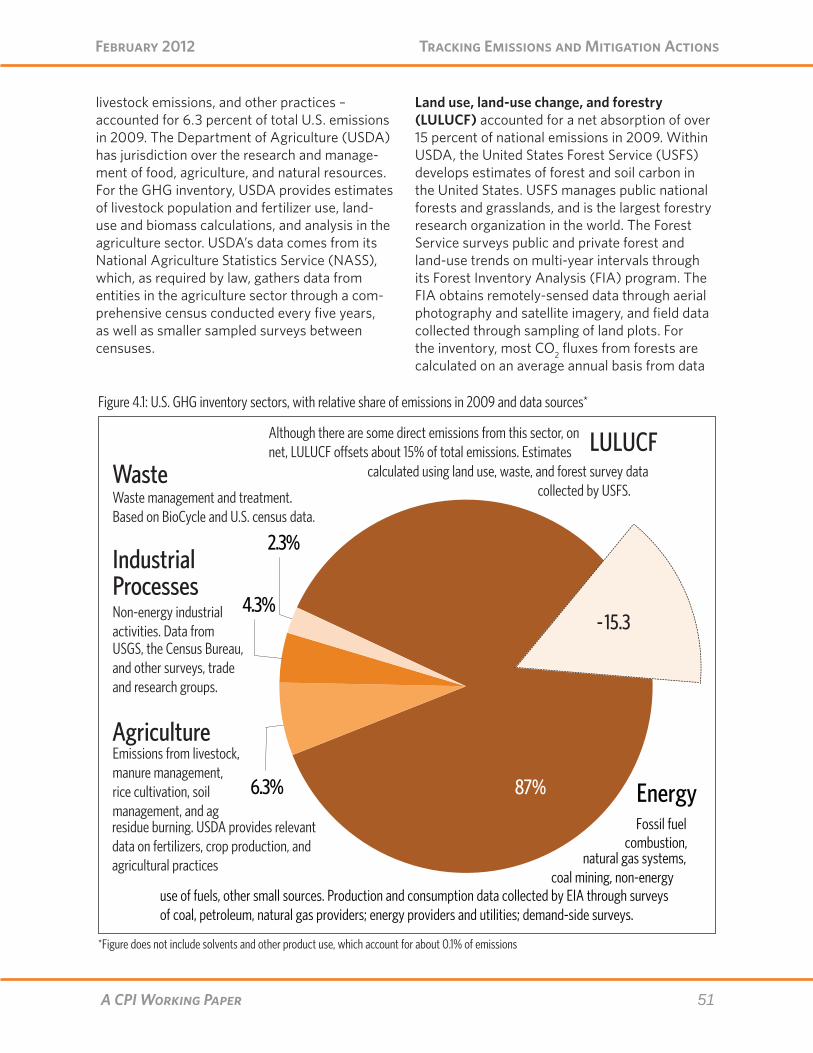
51A CPI Working Paper
Tracking Emissions and Mitigation Actions February 2012
livestock emissions, and other practices – accounted for 6.3 percent of total U.S. emissions in 2009. The Department of Agriculture (USDA) has jurisdiction over the research and manage-ment of food, agriculture, and natural resources. For the GHG inventory, USDA provides estimates of livestock population and fertilizer use, land-use and biomass calculations, and analysis in the agriculture sector. USDA’s data comes from its National Agriculture Statistics Service (NASS), which, as required by law, gathers data from entities in the agriculture sector through a com-prehensive census conducted every five years, as well as smaller sampled surveys between censuses.
Land use, land-use change, and forestry (LULUCF) accounted for a net absorption of over 15 percent of national emissions in 2009. Within USDA, the United States Forest Service (USFS) develops estimates of forest and soil carbon in the United States. USFS manages public national forests and grasslands, and is the largest forestry research organization in the world. The Forest Service surveys public and private forest and land-use trends on multi-year intervals through its Forest Inventory Analysis (FIA) program. The FIA obtains remotely-sensed data through aerial photography and satellite imagery, and field data collected through sampling of land plots. For the inventory, most CO2 fluxes from forests are calculated on an average annual basis from data
Figure 4.1: U.S. GHG inventory sectors, with relative share of emissions in 2009 and data sources*
*Figure does not include solvents and other product use, which account for about 0.1% of emissions
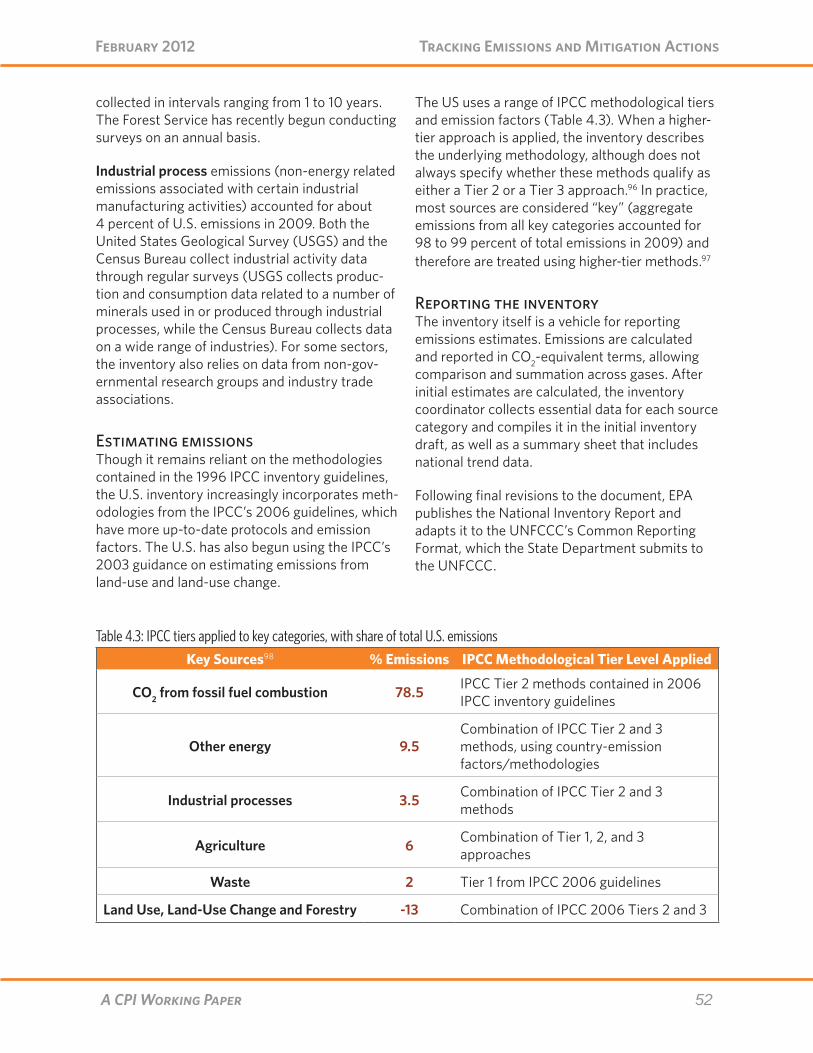
52A CPI Working Paper
Tracking Emissions and Mitigation Actions February 2012
collected in intervals ranging from 1 to 10 years. The Forest Service has recently begun conducting surveys on an annual basis.
Industrial process emissions (non-energy related emissions associated with certain industrial manufacturing activities) accounted for about 4 percent of U.S. emissions in 2009. Both the United States Geological Survey (USGS) and the Census Bureau collect industrial activity data through regular surveys (USGS collects produc-tion and consumption data related to a number of minerals used in or produced through industrial processes, while the Census Bureau collects data on a wide range of industries). For some sectors, the inventory also relies on data from non-gov-ernmental research groups and industry trade associations.
Estimating emissionsThough it remains reliant on the methodologies contained in the 1996 IPCC inventory guidelines, the U.S. inventory increasingly incorporates meth-odologies from the IPCC’s 2006 guidelines, which have more up-to-date protocols and emission factors. The U.S. has also begun using the IPCC’s 2003 guidance on estimating emissions from land-use and land-use change.
The US uses a range of IPCC methodological tiers and emission factors (Table 4.3). When a higher-tier approach is applied, the inventory describes the underlying methodology, although does not always specify whether these methods qualify as either a Tier 2 or a Tier 3 approach.96 In practice, most sources are considered “key” (aggregate emissions from all key categories accounted for 98 to 99 percent of total emissions in 2009) and therefore are treated using higher-tier methods.97
Reporting the inventory The inventory itself is a vehicle for reporting emissions estimates. Emissions are calculated and reported in CO2-equivalent terms, allowing comparison and summation across gases. After initial estimates are calculated, the inventory coordinator collects essential data for each source category and compiles it in the initial inventory draft, as well as a summary sheet that includes national trend data.
Following final revisions to the document, EPA publishes the National Inventory Report and adapts it to the UNFCCC’s Common Reporting Format, which the State Department submits to the UNFCCC.
Table 4.3: IPCC tiers applied to key categories, with share of total U.S. emissions
Key Sources98 % Emissions IPCC Methodological Tier Level Applied
CO2 from fossil fuel combustion 78.5 IPCC Tier 2 methods contained in 2006 IPCC inventory guidelines
Other energy 9.5Combination of IPCC Tier 2 and 3 methods, using country-emission factors/methodologies
Industrial processes 3.5 Combination of IPCC Tier 2 and 3 methods
Agriculture 6 Combination of Tier 1, 2, and 3 approaches
Waste 2 Tier 1 from IPCC 2006 guidelines
Land Use, Land-Use Change and Forestry -13 Combination of IPCC 2006 Tiers 2 and 3
53A CPI Working Paper
Tracking Emissions and Mitigation Actions February 2012
The full inventory, which includes detailed descriptions of estimation methodologies in each sector, is usually published in the spring and made available for free online.. The inventory is updated annually; the most recent data usually lags two years behind the year of publication (so the 2011 report includes data for 1990 through 2009).
The inventory report includes the following features:
• Detailed descriptions of calculation methodologies for all emissions source categories. These descriptions include methods for calculating and/or selecting emissions factors for different fuels and activities, activity data sources, references or any other sources of infor-mation used, and assumptions made for all calculations.
• A “fast facts” page that summarizes key emissions trends from 1990 through the most recent inventory year.
• A chapter describing any methodological improvements and recalculations relative to preceding inventories.
While the data underpinning the inventory is not available directly on EPA’s website, the vast majority is collected through government surveys and can be accessed on the websites of the various agencies responsible for collecting it (the EIA, the USDA, USGS, etc). For example, all of EIA’s activity data, which underpins the vast majority of the U.S. inventory estimates, is publicly available for free online, as are all of its survey forms and accompanying descriptions. Similarly, the USDA’s agriculture statistics are available online for free to the public. The inven-tory notes the use of any non-government data and includes references.
Verification in the inventoryThe U.S. integrates quality assurance and quality control measures throughout its inven-tory process, as recommended within the IPCC’s good practice guidance. Key features of the plan include:
• Standardized procedures for documenting
information and detailed record keeping;• General and source-specific quality
controls, as well as consideration of secondary data quality and source-spe-cific quality checks; and
• Outside expert and public review.
Uncertainty analysis is also integrated into the inventory process. Uncertainties arise for many reasons, including the lack of credible, quantita-tive estimation methodologies for some sources and sinks (particularly some land-use and indus-trial process activities), the need to improve the accuracy of emission factors for gases from some sources, and a lack of activity-level data in some areas. The U.S. inventory program aims to identify these and other sources of uncertainty and reduce them over time. Where possible, the program develops quantitative measures of uncertainty surrounding emissions estimates for all sources as well as the inventory as a whole.
The EIA also incorporates a number of quality assurance measures into its processes for data collection and analysis. Although there is no auditing or third-party verification of survey respondent data, as noted previously, EIA’s data is generally considered accurate by the energy industry itself (and since data is not used for any kind of enforcement, there is little incentive for entities to falsify their reports). Key EIA proce-dures for QA/QC of data include:
• Survey reporting software that incorpo-rates automated error and consistency checks. Where anomalies occur or where data is lacking, EIA directly contacts survey respondents to ask for an explana-tion or additional data.
• Comparing balances in production and consumption data. The collection of data from multiple points in the production chain allows for cross-survey consistency checks.
• Comparison to data sets collected by other agencies and non-government entities
• Peer review of data collection process and analysis.

54A CPI Working Paper
Tracking Emissions and Mitigation Actions February 2012
Figure 4.2: U.S. GHG inventory process (with key inputs, QA/QC and uncertainty applications)

55A CPI Working Paper
Tracking Emissions and Mitigation Actions February 2012
4.2.4 Emerging Program: The U.S. Entity-Level GHG Reporting Rule
Background/context:In September 2009, EPA announced a new man-datory GHG reporting program to collect facility-level emissions data.99 The system is designed to inform future policy decisions, track progress towards national goals, help entities identify opportunities to reduce their own emissions, and complement national inventory emissions estimates. Data from the reporting program will not be used for enforcement of any other federal programs, but it may play that role in the future.
The program applies to fossil fuel and industrial gas suppliers, direct emitters of GHGs (from electricity production, industrial activity/manu-facturing, and landfills), and manufacturers of mobile sources and engines. With some excep-tions, the rule applies only to facilities emitting 25,000 tCO2e or more per year, excluding most small businesses. Overall, the reporting program covers over 10,000 facilities representing 85-90 percent of annual U.S. emissions. EPA expects the private-sector cost of the program at $132 million for the first year and $82 million a year in subse-quent years, while the cost to the public sector is estimated to be $17 million per year.100
MeasuringAs with the national inventory, facility-level emissions will be calculated based on activity data (e.g., the amount of fuel combusted) using category-specific measurement protocols and estimation methods defined by the EPA. Covered entities will be required to measure and report emissions data for all six primary GHGs. Continuous emissions monitoring will be required of facilities already using such systems to meet other requirements (e.g., the Federal Acid Rain Program already requires some facilities to use continuous emissions monitoring for CO2 and other gases).101
ReportingAll data will be self-reported. The first report-ing deadline was September 30, 2011, covering emissions data for 2010; this data was published
in January 2012. Facilities submit data electroni-cally on an annual basis using a standardized reporting tool. All emissions data reported under the program is available online to the public and disaggregated at both the sector and facility level, allowing for public review of the distribution of emissions across industries and the relative con-tributions of individual facilities.102
Verification EPA will verify submitted data itself using auto-mated quality assurance and data consistency checks, site audits, and possible additional proce-dures for new sources. On-site verification audits may be performed by private entities contracted either by EPA or by state or local governments. Since the program collects upstream and down-stream data, EPA will be able to compare both datasets to ensure consistency. EPA expects that the combination of electronic data review and onsite auditing will allow for the most efficient use of limited resources available for verification. The approach is similar to the reporting verification methods applied under EPA’s Acid Rain Program, which has generally succeeded in producing reli-able data.
4.3 Tracking Mitigation Actions: National Communication and Individual MeasuresThis section outlines the US systems designed to track mitigation policies and their outcomes. At the highest level, the national inventory and new GHG reporting system described travel overall progress towards national goals. However, the United States does not have a comprehensive system for tracking the emissions outcomes of its overall portfolio of direct and indirect mitiga-tion actions, or guidelines for evaluating individual policy outcomes. The national communications to the UNFCCC serve as the only consistent vehicle for comprehensive reporting of mitigation actions in the United States. Still, budget reports from the EPA describe the status and achievements of many U.S. mitigation actions. The United States also has general mechanisms for policy oversight that can be applied to its climate measures, and
56A CPI Working Paper
Tracking Emissions and Mitigation Actions February 2012
a number of individual policies with associated MRV systems.
4.3.1 U.S. National CommunicationThe National Communication reports the exis-tence of mitigation policies and, where possible, estimates of their direct impact on emissions. Most policy-level MRV systems in the United States were not created to track emissions impacts (as many policies themselves were not implemented primarily to address emissions) but rather to measure compliance or generally track a policy’s progress relative to its own goals. As such, most MRV systems attached to mitigation actions measure direct policy outcomes (e.g. the number of buildings weatherized, amount of renewable energy deployed, etc). This provides proxy data that in some cases can be converted to emissions impact estimates. A review of the policies reported as mitigation actions within the Communication, and their associated MRV systems in particular, reveals some patterns about how the U.S. tracks its policies.
Measurement: Key themesNo common definition for “mitigation action”Many policies categorized as mitigation actions within the National Communication do not have climate mitigation as their original or primary focus. There are no common guidelines across government agencies for defining a policy as a mitigation action, and mitigation policies are tracked individually by their respective imple-menting agencies according to the monitoring, reporting, and/or verification rules governing each policy.
Of the 79 policies listed as mitigation actions in the National Communication, 46 include current or projected mitigation impact estimates. Of these, 20 list GHG mitigation or addressing climate change as an explicit primary purpose. Most policies include climate benefits as a secondary goal, but primarily address energy or fuel efficiency, technology innovation, renew-able energy deployment, or general resource conservation.
No common guidance on measuring mitigation outcomesEach agency is responsible for quantifying, when possible, the estimated mitigation benefits of the policies it oversees, based on the data it collects for each policy, its own experience, and related assumptions.103 For some policies, implementing agencies already track emission impacts as part of the policies’ requirements, or collect proxy data that can be converted to a GHG reduction estimate in a straightforward manner.
However, there are no mitigation estimate guide-lines or consistent methodologies applied across agencies (or in some cases, within agencies them-selves). Although many of the policies defined by the U.S. as mitigation actions have systems in place to track progress and impacts, the National Communication does not clearly explain the methodologies or key assumptions employed in calculating mitigation estimates. Even for those policies for which GHG mitigation is an explicit goal, it is not always clear how mitigation esti-mates are calculated based on the data that is tracked by their implementing agencies.
No aggregation of mitigation outcomesDue to the differences in calculation methodolo-gies and assumptions across and within agencies, and a lack of coordination between them, GHG reduction estimates associated with individual measures cannot be aggregated to the sectoral or national levels. Estimates do not account for interactions of layered policies, and mitigation may be double-counted. For instance, if an entity is covered by three energy efficiency policies, observed energy savings may be fully attributed to each policy individually.
Therefore, based on its current tracking systems, the U.S. has no consistent way of measuring the aggregate impact of its mitigation actions on overall national emissions, or even the aggregate impact of policies within a particular economic sector.
ReportingThe National Communication is prepared and
57A CPI Working Paper
Tracking Emissions and Mitigation Actions February 2012
submitted by the U.S. Department of State, with input and assistance from a number of other federal agencies including the EPA, DOT, DOE, and USDA. Like other Annex 1 parties to the Convention, the U.S. submits its Communication approximately every five years, and submitted its fifth report in 2010.
The National Communication reports the exis-tence of policies that either directly or indirectly reduce emissions, and—where possible—their effect on emissions. This includes a brief descrip-tion of the program, its implementation status (either “initiated” or “implemented”), the GHGs it affects, and its implementing agency or agencies. The U.S. catalogues policies within the follow-ing sectors: energy (split into the residential and commercial, industrial, and supply subsectors), transportation, industrial (non-CO2), agriculture, and waste management, as well as policies that cut across multiple sectors. The following types of policies are included:
• regulatory/mandatory • voluntary and partnerships • economic • fiscal • research and information.
VerificationThe White House Office of Management and Budget (OMB) reviews mitigation estimates contained in the National Communications, and can remove those it deems highly questionable. Beyond this general check, the U.S. has verifica-tion requirements for activities subject to specific regulation, such as appliance, fuel economy, and vehicle emissions standards. Verification proce-dures include sampling and testing of products and certification by third party auditors in some cases.
Many of the measures reported as mitigation actions are voluntary programs and partnerships, which primarily rely on self-reported data from participants. The extent to which this data is veri-fied varies widely: some programs require agency or third-party verification, while others appear to require little or no verification.
General Reporting by the Environmental Protection AgencyAs part of the government funding process, all federal agencies must submit budget justifica-tions to Congress that report on their historical spending and, based on agency goals and man-dates, estimate funding needs for the upcoming year. These budget justifications usually report on financial resources devoted to particular program areas or policies, and where possible, information demonstrating whether the policies have deliv-ered on their objectives. Where GHG mitigation is listed amongst these objectives, implementing agencies report the estimated emissions-reduc-tion outcomes.
For example, in its Congressional Budget Justifi-cations, the EPA — which oversees many of the United States’ most significant mitigation efforts in the transportation, buildings, and industrial sectors — reports annually on the mitigation outcomes of its policies. Currently, emissions outcomes are not reported for individual mitiga-tion policies, but rather for the aggregated impact of all policies targeting a particular sector (e.g., in terms of GHGs reduced through all policies affecting the transportation sector). EPA mea-sures and reports the sectoral emissions impact of these policies on an annual basis; how out-comes compare to EPA’s own annual emission reduction targets in each sector; and the cost of these programs. Justification reports are publicly available online.104
Many of the regulatory mitigation actions men-tioned in EPA’s budget reports — such as the new GHG vehicle tailpipe standards, performance standards for new sources in the electricity gener-ation and refinery sectors, and the revised Renew-able Fuels Standard — are relatively new. Though their designs have been finalized, they have yet to produce any measurable results. Current practice for other regulatory programs, such as air and water quality regulations, suggest it is reason-able to expect the EPA will include more detailed information on their cost, performance relative to objectives, and emissions reduction estimates in the future.105
58A CPI Working Paper
Tracking Emissions and Mitigation Actions February 2012
EPA also describes its annual financial and program performance in less technical publicly available reports.106 These reports highlight EPA’s key achievements and progress over the previ-ous year. Again, since many of the United States’ regulatory actions on GHG mitigation are still in the early stages of implementation, EPA’s current highlight reports only include projected mitigation and other benefits from these policies. However, based on what is measured and reported for existing clean air and water programs, future reports on these mitigation actions are likely to include basic information on key achievements and expenditures in mitigation program areas.
4.3.2 Policy-Level MRV: Tracking Systems for Individual Measures Many U.S. mitigation policies have relatively limited mitigation potential. Of the 46 policies in the National Communication with quanti-fied emissions estimates, only 19 have an esti-mated 2020 mitigation impact of 25 MtCO2e or greater.107 To provide a comparison, 25 Mt represents about 0.4 percent of total national emissions in 2009.
Those measures notable for their current or pro-jected mitigation impacts include:
• The Energy Star product labeling program (2020 impact: about 2 percent of 2009 emissions)
• The Renewable Fuels Standard (2020 impact: about 2 percent of 2009 emissions)
• New vehicle GHG emissions standards (2020 impact: about 2 percent of 2009 emissions)
• The Significant New Alternatives Program (2020 impact: 3.6 percent of 2009 emissions. Note that GHG mitigation is not the program’s original purpose)
In addition, the Federal Government has adopted new emissions targets for federal agencies. This represents a potentially significant mitigation effort given the government’s status as one of the largest consumers of energy in the U.S. economy.
All of these policies are implemented and admin-istered by the EPA, although implementation is done jointly with the DOE for the Energy Star program, and with the National Highway Traffic Safety Administration for the vehicle emissions program. An overview of the measurement, reporting, and/or verification systems for tracking compliance with the vehicle emissions standards and government emissions target is presented below.
National Policy to Establish Vehicle GHG Emissions and CAFE standards In September 2009, the EPA and DOT reached an agreement on new light duty vehicle fuel economy and tailpipe GHG emissions stan-dards.108 The new standards cover vehicle model years 2012–2016, and require an average fuel economy of 35.5 miles per gallon and an average emission standard of 250 grams of carbon dioxide per mile in 2016. These standards are designed to work in harmony such that manufacturers will be able to build a single light-duty national fleet that satisfies all requirements under both programs.109 The tailpipe standards will closely replicate the certification, testing, reporting, and associated compliance protocols associated with existing vehicle fuel economy standards.
• Measuring: EPA already conducts vehicle testing, collects data, and performs calculations to determine compliance with current standards. For the new program, manufacturers will demonstrate compliance with the emission standards on a fleet average basis at the end of each model year and allow model-level EPA testing of vehicles throughout the year (as part of the compliance demonstration, manufacturers must demonstrate in good faith that vehicles will meet the standards throughout their lifespan). Manufac-turers conduct vehicle testing over an entire model year and submit their test results to EPA, after which EPA conducts its own laboratory test on a subset of these vehicles. EPA will calculate the average fleet emission level using actual
59A CPI Working Paper
Tracking Emissions and Mitigation Actions February 2012
production figures and, for each model type, CO2 emission testing.
• Reporting: Compliance determination will be based on actual production figures for each model and on model-level emissions data measured through testing over the course of the model year. As noted above, manufacturers will submit this informa-tion to EPA in an end-of-year report. Manufacturers must also report vehicle production data to EPA, which, combined with emission data for vehicle models, determines whether standards are being met at the national level. As the program closely follows the reporting requirements under current fuel economy regulations, test data and information on vehicle-level compliance will be publicly available (both through labeling and an online informa-tion portal) as will vehicle production statistics.110
• Verifying: EPA verifies emissions data at the time of production, and also applies monitoring standards throughout the lifetimes of vehicle models to ensure compliance over time. It is unclear if or how EPA intends to verify production volume data.
Federal Government Emissions Targets and Emissions Reporting In October 2009, President Barack Obama issued Executive Order 13514, directing all Federal agencies to set GHG reduction targets for 2020 and to adopt measures to track, manage, and cut their emissions.111 Based on the self-reported targets submitted by agencies, the White House has since announced an aggregate government-wide GHG emissions target of 28 percent below 2008 levels by 2020 for direct emissions, and 13 percent below 2008 levels for indirect emissions.112
MeasuringIn October 2010, the White House Council on Environmental Quality (CEQ) announced new government-wide guidelines for measuring and
reporting GHG emissions. Agencies must follow these guidelines in tracking progress towards their targets,113 including compiling and submit-ting GHG inventories to CEQ. The federal GHG accounting and reporting guidelines provide requirements for calculating and reporting agency emissions from direct and indirect activities, but do not include procedures for quantifying reduc-tions from individual mitigation policies. The requirements include guidance on: defining the operational scope of each agency and setting accounting boundaries; methodologies for spe-cific categories such as sequestration and emis-sions from land-use, agriculture, and biogenic sources; and estimating reductions associated with renewable energy purchases.
ReportingIn general, agencies report data for a certain activity (such as on-site stationary fuel combus-tion, mobile source data, electricity purchases, and others) through an online portal that auto-matically estimates emissions using default emissions factors and methodologies. Advanced accounting methodologies are available for many source categories. CEQ compiles the emissions data for all agencies into a federal government emissions inventory, which is then published online and freely available to the public. The first such inventory was released in April 2011.114 The inventory includes emissions data associated with each agency’s energy use (both for electricity and transport), waste, and process emissions.
VerifyingThe federal GHG guidelines outline procedures for emissions verification to enhance the com-pleteness, accuracy, consistency, and transpar-ency of reported emissions data. At a minimum, agencies must verify their inventories through at least one of three methods: 1) a detailed quality assurance plan that includes verification proce-dures and a process for improving data over time; 2) second-party verification, in which an entity within the agency verifies data (such entities must be clearly identified and independent of those responsible for reporting emissions data),
60A CPI Working Paper
Tracking Emissions and Mitigation Actions February 2012
or 3) third-party verification, in which an external entity outside of the agency verifies data. Second and third-party verification is encouraged but not required.115
4.3.3 Other Federal Policy Oversight and Guidance Beyond the National Communications – which report on the existence of mitigation actions and the subsequent emissions outcomes, as well as policy-specific MRV systems — which essentially track policy compliance and emissions outcomes in some cases — the U.S. has other tools avail-able to oversee policies and verify that they are delivering on their objectives.
White House Office of Management and Budget The Office of Management and Budget (OMB) within the Executive Office of the President over-sees policy implementation across the executive branch of government.116 In its general oversight and implementation roles, OMB performs func-tions related to tracking and evaluating govern-ment policies with GHG mitigation impacts.
• Reports to Congress: The U.S. Congress requires that the Administration provide an annual report on federal spending for existing climate change programs and activities, including both domestic and international policies and scientific research. This data is provided by the White House Office of Management and Budget (OMB) in its annual Federal Climate Change Expenditures Report to Congress.117 These budget reports include summaries of the Climate Change Technology Program (CCTP), and energy tax provisions and grant programs with the potential to impact GHG emissions.118
While the reports include information on each federal agency’s spending on climate technology policies, they focus on R&D policies rather than the full suite of mitigation actions reported in the National Communications. Though the reports break down expenditures by
agency and select program areas, the policy set does not align closely with that contained in the National Communication. This makes it difficult to tell if the budget information contained in the FCCER provides a complete picture of resources devoted to mitigation actions.
• Agency guidance on measurement and verification: OMB also provides agencies with general guidance on program measurement and evaluation, including program impact assessments.119 Although the methodologies and assumptions used to estimate policy emissions impacts vary across federal agencies, agency-specific processes and the estimates themselves must adhere to quality control guidelines established by OMB.120
• In 2001, OMB issued its “Guidelines for Ensuring and Maximizing the Quality, Objectivity, Utility, and Integrity of Information Disseminated by Federal Agencies.” All agencies have developed their own “implementing guidelines” to ensure that the information they each disseminate meets certain basic quality standards. These include guidelines for maintaining objectivity, utility, and integrity throughout information develop-ment and dissemination processes. Most agency implementing guidelines ensure some degree of peer review of informa-tion, where applicable.121
U.S. Government Accountability Office The U.S. Government Accountability Office (GAO) is an independent, nonpartisan Congres-sional agency that issues guidance and provides general oversight for federal agencies, essentially serving an investigative function on behalf of Congress. At the request of Congressional com-mittees and subcommittees, GAO investigates federal government activities, reports on the per-formance of government programs, and analyzes policy, among other activities. Ultimately, GAO advises Congress and agency staff on ways to improve government function.
GAO evaluates a wide range of federal programs,
61A CPI Working Paper
Tracking Emissions and Mitigation Actions February 2012
including those directly or indirectly contributing to GHG mitigation.122 Essentially, it plays a role in assessing policy performance, providing oversight of policies themselves to verify they’re delivering on their objectives. For example, in 2010, GAO evaluated the certification process for Energy Star, a voluntary product-efficiency labeling program administered by the EPA and one of the more significant mitigation actions reported by the U.S. in its national communications.123 GAO reviews climate policies and programs on an ad hoc basis; it responds to Congress’ interest, and the review’s scope is defined by the nature of a Congressional request. GAO focuses its queries on general agency performance and policy design more frequently than it does retrospective evalua-tion of particular measures.
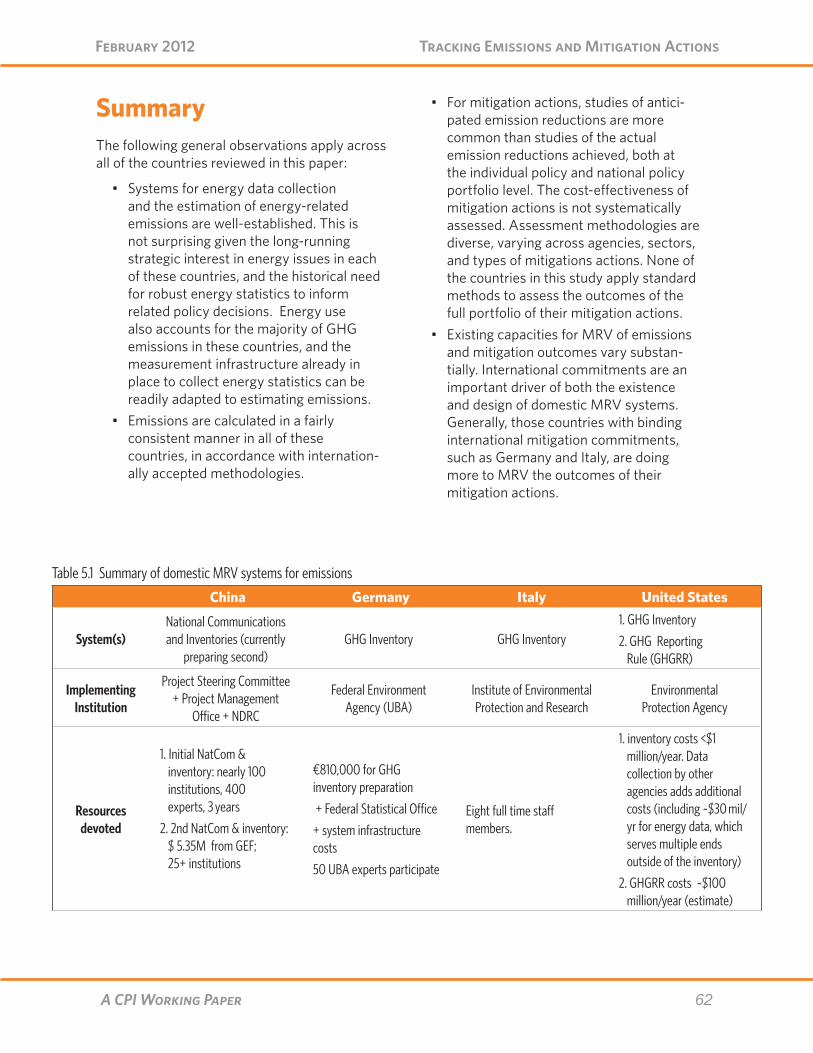
62A CPI Working Paper
Tracking Emissions and Mitigation Actions February 2012
SummaryThe following general observations apply across all of the countries reviewed in this paper:
• Systems for energy data collection and the estimation of energy-related emissions are well-established. This is not surprising given the long-running strategic interest in energy issues in each of these countries, and the historical need for robust energy statistics to inform related policy decisions. Energy use also accounts for the majority of GHG emissions in these countries, and the measurement infrastructure already in place to collect energy statistics can be readily adapted to estimating emissions.
• Emissions are calculated in a fairly consistent manner in all of these countries, in accordance with internation-ally accepted methodologies.
• For mitigation actions, studies of antici-pated emission reductions are more common than studies of the actual emission reductions achieved, both at the individual policy and national policy portfolio level. The cost-effectiveness of mitigation actions is not systematically assessed. Assessment methodologies are diverse, varying across agencies, sectors, and types of mitigations actions. None of the countries in this study apply standard methods to assess the outcomes of the full portfolio of their mitigation actions.
• Existing capacities for MRV of emissions and mitigation outcomes vary substan-tially. International commitments are an important driver of both the existence and design of domestic MRV systems. Generally, those countries with binding international mitigation commitments, such as Germany and Italy, are doing more to MRV the outcomes of their mitigation actions.
China Germany Italy United States
System(s)National Communications and Inventories (currently
preparing second)GHG Inventory GHG Inventory
1. GHG Inventory
2. GHG Reporting Rule (GHGRR)
Implementing Institution
Project Steering Committee + Project Management
Office + NDRC
Federal Environment Agency (UBA)
Institute of Environmental Protection and Research
Environmental Protection Agency
Resources devoted
1. Initial NatCom & inventory: nearly 100 institutions, 400 experts, 3 years
2. 2nd NatCom & inventory: $ 5.35M from GEF; 25+ institutions
€810,000 for GHG inventory preparation
+ Federal Statistical Office
+ system infrastructure costs
50 UBA experts participate
Eight full time staff members.
1. inventory costs <$1 million/year. Data collection by other agencies adds additional costs (including ~$30 mil/yr for energy data, which serves multiple ends outside of the inventory)
2. GHGRR costs ~$100 million/year (estimate)
Table 5.1 Summary of domestic MRV systems for emissions
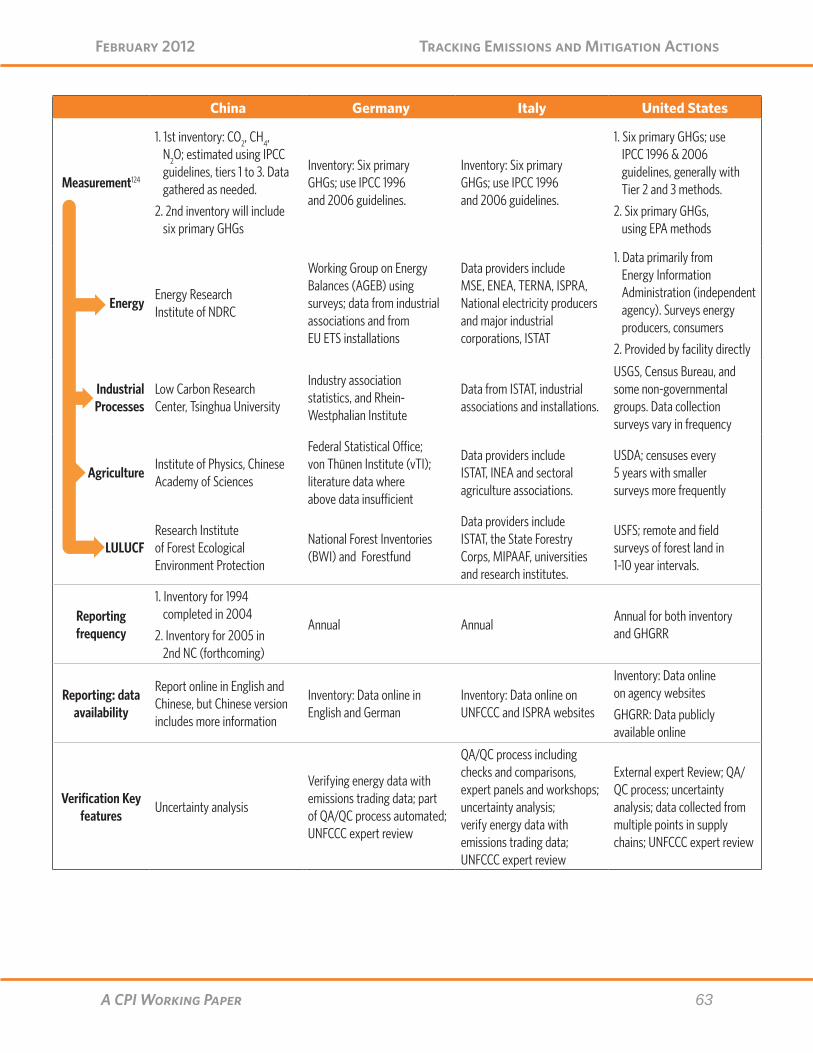
63A CPI Working Paper
Tracking Emissions and Mitigation Actions February 2012
China Germany Italy United States
Measurement124
1. 1st inventory: CO2, CH4, N2O; estimated using IPCC guidelines, tiers 1 to 3. Data gathered as needed.
2. 2nd inventory will include six primary GHGs
Inventory: Six primary GHGs; use IPCC 1996 and 2006 guidelines.
Inventory: Six primary GHGs; use IPCC 1996 and 2006 guidelines.
1. Six primary GHGs; use IPCC 1996 & 2006 guidelines, generally with Tier 2 and 3 methods.
2. Six primary GHGs, using EPA methods
EnergyEnergy Research Institute of NDRC
Working Group on Energy Balances (AGEB) using surveys; data from industrial associations and from EU ETS installations
Data providers include MSE, ENEA, TERNA, ISPRA, National electricity producers and major industrial corporations, ISTAT
1. Data primarily from Energy Information Administration (independent agency). Surveys energy producers, consumers
2. Provided by facility directly
Industrial Processes
Low Carbon Research Center, Tsinghua University
Industry association statistics, and Rhein-Westphalian Institute
Data from ISTAT, industrial associations and installations.
USGS, Census Bureau, and some non-governmental groups. Data collection surveys vary in frequency
AgricultureInstitute of Physics, Chinese Academy of Sciences
Federal Statistical Office; von Thünen Institute (vTI); literature data where above data insufficient
Data providers include ISTAT, INEA and sectoral agriculture associations.
USDA; censuses every 5 years with smaller surveys more frequently
LULUCFResearch Institute of Forest Ecological Environment Protection
National Forest Inventories (BWI) and Forestfund
Data providers include ISTAT, the State Forestry Corps, MIPAAF, universities and research institutes.
USFS; remote and field surveys of forest land in 1-10 year intervals.
Reporting frequency
1. Inventory for 1994 completed in 2004
2. Inventory for 2005 in 2nd NC (forthcoming)
Annual AnnualAnnual for both inventory and GHGRR
Reporting: data availability
Report online in English and Chinese, but Chinese version includes more information
Inventory: Data online in English and German
Inventory: Data online on UNFCCC and ISPRA websites
Inventory: Data online on agency websites
GHGRR: Data publicly available online
Verification Key features
Uncertainty analysis
Verifying energy data with emissions trading data; part of QA/QC process automated; UNFCCC expert review
QA/QC process including checks and comparisons, expert panels and workshops; uncertainty analysis; verify energy data with emissions trading data; UNFCCC expert review
External expert Review; QA/QC process; uncertainty analysis; data collected from multiple points in supply chains; UNFCCC expert review
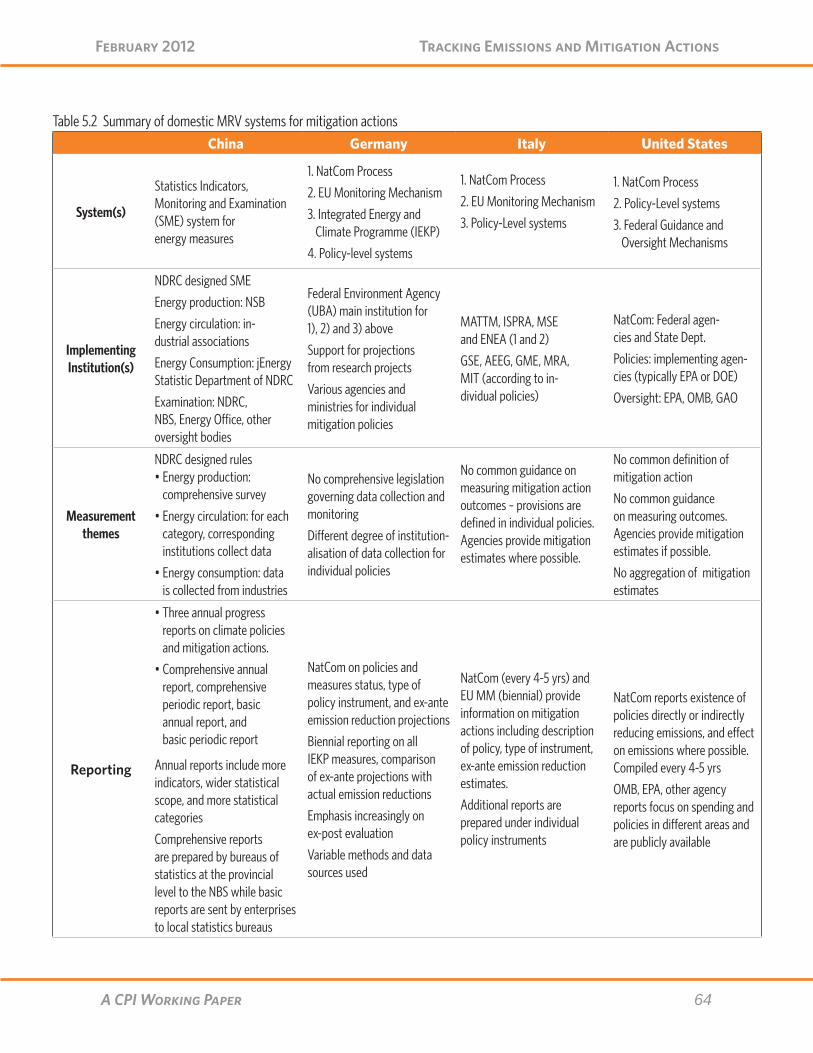
64A CPI Working Paper
Tracking Emissions and Mitigation Actions February 2012
Table 5.2 Summary of domestic MRV systems for mitigation actionsChina Germany Italy United States
System(s)
Statistics Indicators, Monitoring and Examination (SME) system for energy measures
1. NatCom Process
2. EU Monitoring Mechanism
3. Integrated Energy and Climate Programme (IEKP)
4. Policy-level systems
1. NatCom Process
2. EU Monitoring Mechanism
3. Policy-Level systems
1. NatCom Process
2. Policy-Level systems
3. Federal Guidance and Oversight Mechanisms
Implementing Institution(s)
NDRC designed SME
Energy production: NSB
Energy circulation: in-dustrial associations
Energy Consumption: jEnergy Statistic Department of NDRC
Examination: NDRC, NBS, Energy Office, other oversight bodies
Federal Environment Agency (UBA) main institution for 1), 2) and 3) above
Support for projections from research projects
Various agencies and ministries for individual mitigation policies
MATTM, ISPRA, MSE and ENEA (1 and 2)
GSE, AEEG, GME, MRA, MIT (according to in-dividual policies)
NatCom: Federal agen-cies and State Dept.
Policies: implementing agen-cies (typically EPA or DOE)
Oversight: EPA, OMB, GAO
Measurement themes
NDRC designed rules • Energy production:
comprehensive survey
• Energy circulation: for each category, corresponding institutions collect data
• Energy consumption: data is collected from industries
No comprehensive legislation governing data collection and monitoring
Different degree of institution-alisation of data collection for individual policies
No common guidance on measuring mitigation action outcomes – provisions are defined in individual policies. Agencies provide mitigation estimates where possible.
No common definition of mitigation action
No common guidance on measuring outcomes. Agencies provide mitigation estimates if possible.
No aggregation of mitigation estimates
Reporting
• Three annual progress reports on climate policies and mitigation actions.
• Comprehensive annual report, comprehensive periodic report, basic annual report, and basic periodic report
Annual reports include more indicators, wider statistical scope, and more statistical categories
Comprehensive reports are prepared by bureaus of statistics at the provincial level to the NBS while basic reports are sent by enterprises to local statistics bureaus
NatCom on policies and measures status, type of policy instrument, and ex-ante emission reduction projections
Biennial reporting on all IEKP measures, comparison of ex-ante projections with actual emission reductions
Emphasis increasingly on ex-post evaluation
Variable methods and data sources used
NatCom (every 4-5 yrs) and EU MM (biennial) provide information on mitigation actions including description of policy, type of instrument, ex-ante emission reduction estimates.
Additional reports are prepared under individual policy instruments
NatCom reports existence of policies directly or indirectly reducing emissions, and effect on emissions where possible. Compiled every 4-5 yrs
OMB, EPA, other agency reports focus on spending and policies in different areas and are publicly available

65A CPI Working Paper
Tracking Emissions and Mitigation Actions February 2012
Verification
The Plan to implement the Monitoring system of energy consumption per unit of GDP provides guidelines for data verification.
Upper level bureaus of statistics should verify data from lower level bureaus of statistics. NBS and provincial energy management govern-mental authorities oversee data submitted by top 1000 enterprises; local governments monitor data of other key energy-using enterprises.
No 3rd party verification of the first IEKP status report. Individual mitigation actions, especially those where financial outflows pay a role (i.e. the feed-in-tariff), are audited by 3rd parties
Verification is usually carried out by official government agencies such as AEEG, ENEA or GSE.
Third party verification or certification takes place only in the case of the EU ETS, the EU Performance of Buildings Directive, the Energy Perfor-mance of Products Directive and the Biofuels Directive.
Generally, verification procedures such as sampling, testing, and auditing are in place at policy level, though they vary widely.
GAO evaluates policies at Congress’ request
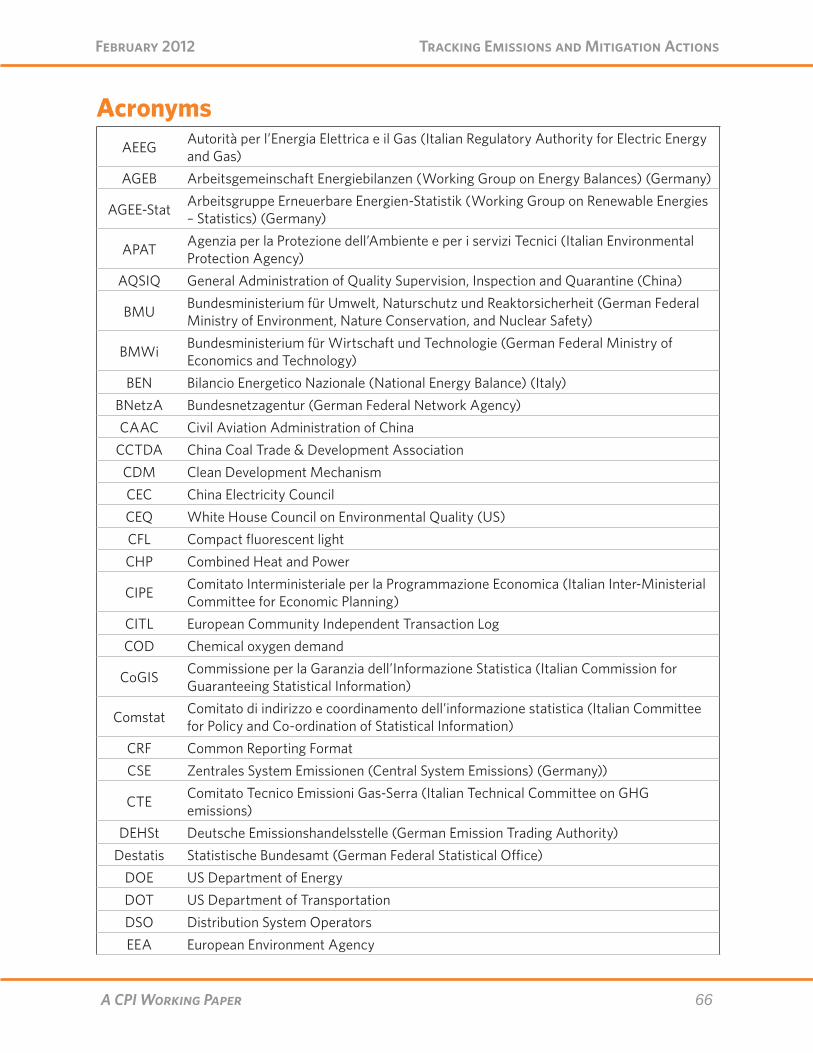
66A CPI Working Paper
Tracking Emissions and Mitigation Actions February 2012
AcronymsAEEG Autorità per l’Energia Elettrica e il Gas (Italian Regulatory Authority for Electric Energy
and Gas)AGEB Arbeitsgemeinschaft Energiebilanzen (Working Group on Energy Balances) (Germany)
AGEE-Stat Arbeitsgruppe Erneuerbare Energien-Statistik (Working Group on Renewable Energies – Statistics) (Germany)
APAT Agenzia per la Protezione dell’Ambiente e per i servizi Tecnici (Italian Environmental Protection Agency)
AQSIQ General Administration of Quality Supervision, Inspection and Quarantine (China)
BMU Bundesministerium für Umwelt, Naturschutz und Reaktorsicherheit (German Federal Ministry of Environment, Nature Conservation, and Nuclear Safety)
BMWi Bundesministerium für Wirtschaft und Technologie (German Federal Ministry of Economics and Technology)
BEN Bilancio Energetico Nazionale (National Energy Balance) (Italy)BNetzA Bundesnetzagentur (German Federal Network Agency)CAAC Civil Aviation Administration of China
CCTDA China Coal Trade & Development AssociationCDM Clean Development MechanismCEC China Electricity CouncilCEQ White House Council on Environmental Quality (US)CFL Compact fluorescent lightCHP Combined Heat and Power
CIPE Comitato Interministeriale per la Programmazione Economica (Italian Inter-Ministerial Committee for Economic Planning)
CITL European Community Independent Transaction LogCOD Chemical oxygen demand
CoGIS Commissione per la Garanzia dell’Informazione Statistica (Italian Commission for Guaranteeing Statistical Information)
Comstat Comitato di indirizzo e coordinamento dell’informazione statistica (Italian Committee for Policy and Co-ordination of Statistical Information)
CRF Common Reporting FormatCSE Zentrales System Emissionen (Central System Emissions) (Germany))
CTE Comitato Tecnico Emissioni Gas-Serra (Italian Technical Committee on GHG emissions)
DEHSt Deutsche Emissionshandelsstelle (German Emission Trading Authority)Destatis Statistische Bundesamt (German Federal Statistical Office)
DOE US Department of EnergyDOT US Department of TransportationDSO Distribution System OperatorsEEA European Environment Agency

67A CPI Working Paper
Tracking Emissions and Mitigation Actions February 2012
EEG Erneuerbare-Energien-Gesetz (German feed-in-tariff)EIA US Energy Information Administration
ENAC Ente Nazionale per l’Aviazione Civile (Italian Civil Aviation Authority)
ENEA Ente per le Nuove Tecnologie, l’Energia e l’Ambiente (Italian Agency for New Technolo-gies, Energy and the Environment).
EPA US Environmental Protection AgencyE-PRTR European Pollutant Release and Transfer Register
ERI Energy Research Institute (China)ESCO Energy service company
EU ETS European Union Emissions Trading SystemEU MM European Union Monitoring Mechanism
FYP Five-Year Plan (China)GAO US Government Accountability OfficeGEF Global Environmental FacilityGHG Greenhouse gasGME Gestore dei Mercati Energetici (Italian Energy Markets Operator)GSE Gestore dei Servizi Energetici (Italian Energy Services Operator)
IEKP Integriertes Energie- und Klimaschutzprogramm Integrated Energy and Climate Program (Germany)
INEA Istituto Nazionale di Economia Agraria (Italian National Institute of Agricultural Economics)
IPCC Intergovernmental Panel on Climate Change
ISPRA Istituto Superiore per la Protezione e la Ricerca Ambientale (Italian Institute of Environ-mental Protection and Research)
ISTAT Italian National Institute of StatisticsITL International Transaction Log
IUTI Inventario dell’Uso delle Terre d’Italia (Italian National Land Use Inventory)LCP Large Combustion Plant Directive
LUCF Land-use change and forestryLULUCF Land use, land-use change and forestry
MATTM Ministero dell’Ambiente e della Tutela del Territorio e del Mare (Italian Ministry for the Environment, Land and Sea)
MHUD China Ministry of Housing and Urban-rural Development
MIPAAF Ministero delle Politiche Agricole, Alimentari e Forestali (Italian Ministry of Agriculture, Food and Forest Policies)
MIT Ministero delle Infrastrutture e dei Trasporti (Italian Ministry of Transportation and Infrastructure)
MOC China Ministry of Commerce MOR China Ministry of Railway MRV Measurement, reporting, and verification
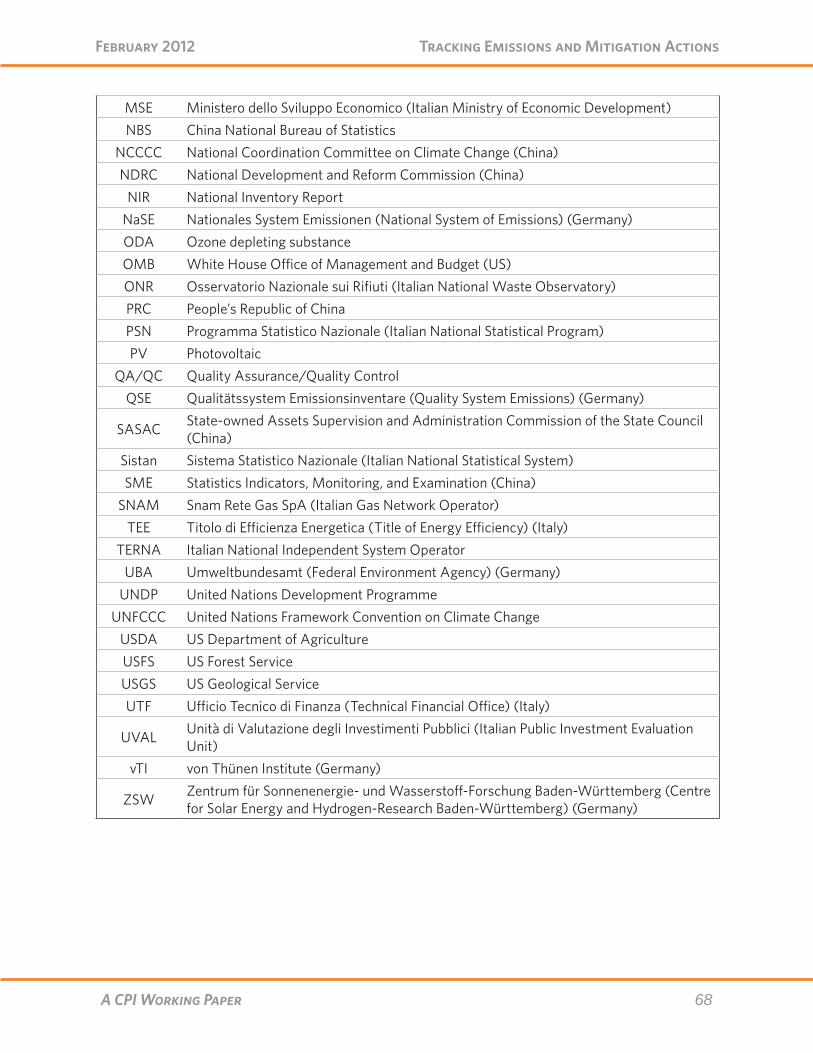
68A CPI Working Paper
Tracking Emissions and Mitigation Actions February 2012
MSE Ministero dello Sviluppo Economico (Italian Ministry of Economic Development)NBS China National Bureau of Statistics
NCCCC National Coordination Committee on Climate Change (China)NDRC National Development and Reform Commission (China)
NIR National Inventory ReportNaSE Nationales System Emissionen (National System of Emissions) (Germany)ODA Ozone depleting substanceOMB White House Office of Management and Budget (US)ONR Osservatorio Nazionale sui Rifiuti (Italian National Waste Observatory)PRC People’s Republic of ChinaPSN Programma Statistico Nazionale (Italian National Statistical Program)PV Photovoltaic
QA/QC Quality Assurance/Quality ControlQSE Qualitätssystem Emissionsinventare (Quality System Emissions) (Germany)
SASAC State-owned Assets Supervision and Administration Commission of the State Council (China)
Sistan Sistema Statistico Nazionale (Italian National Statistical System)SME Statistics Indicators, Monitoring, and Examination (China)
SNAM Snam Rete Gas SpA (Italian Gas Network Operator)TEE Titolo di Efficienza Energetica (Title of Energy Efficiency) (Italy)
TERNA Italian National Independent System OperatorUBA Umweltbundesamt (Federal Environment Agency) (Germany)
UNDP United Nations Development ProgrammeUNFCCC United Nations Framework Convention on Climate Change
USDA US Department of AgricultureUSFS US Forest ServiceUSGS US Geological ServiceUTF Ufficio Tecnico di Finanza (Technical Financial Office) (Italy)
UVAL Unità di Valutazione degli Investimenti Pubblici (Italian Public Investment Evaluation Unit)
vTI von Thünen Institute (Germany)
ZSW Zentrum für Sonnenenergie- und Wasserstoff-Forschung Baden-Württemberg (Centre for Solar Energy and Hydrogen-Research Baden-Württemberg) (Germany)
69A CPI Working Paper
Tracking Emissions and Mitigation Actions February 2012
ReferencesChinaGlobal Environment Facility. 2010. Report of the
GEF to the sixteenth session of the confer-ence of the parties to the United Nations Framework Convention on Climate Change.
Information Office of the State Council, 2008. China’s Policies and Actions for Addressing Climate Change. http://www.ccchina.gov.cn/WebSite/CCChina/UpFile/File419.pdf
Mintzer, I., Leonard, A. & Valencia, I. 2010. “Counting the gigatonnes: Building trust in greenhouse gas inventories from the United States and China.” Washington, DC: World Wildlife Fund.
Ministry of Science and Technology, 2007. Unscrambling of National Assessment Report on Climate Change. http://news.xinhuanet.com/politics/2007-04/19/content_5999349.htm
Ministry of Supervision, National Develop-ment and Reform Commission, National Energy Office, 2007. Plan to implement the statistics indicators system of energy consumption per unit of GDP. http://news.xinhuanet.com/newscenter/2007-11/23/content_7132232_1.htm
Ministry of Supervision, National Development and Reform Commission, National Energy Office, 2007. Plan to implement the monitor-ing system of energy consumption per unit of GDP. http://news.xinhuanet.com/news-center/2007-11/23/content_7132232_1.htm
Ministry of Supervision, National Develop-ment and Reform Commission, National Energy Office, 2007. Plan to implement the examination system of energy con-sumption per unit of GDP. http://news.xinhuanet.com/newscenter/2007-11/23/content_7132232_1.htm
National Assessment Report on Climate Change Compilation Committee, 2007. National
Assessment Report on Climate Change. Science Press.
National Development and Reform Commis-sion, 2006. “Implementation Plan of the Top 1000 Enterprises Program.”. Online at http://hzs.ndrc.gov.cn/newzwxx/W020060414545396387736.doc.
National Development and Reform Commission, 2007. China’s National Climate Change Programme. http://www.ccchina.gov.cn/WebSite/CCChina/UpFile/File188.pdf
National Development and Reform Commis-sion, 2009. China’s Policies and Actions for Addressing Climate Change – The Progress Report 2009. http://www.ccchina.gov.cn/WebSite/CCChina/UpFile/File571.pdf
National Development and Reform Commis-sion, 2010. China’s Policies and Actions for Addressing Climate Change – The Progress Report 2010. http://www.ccchina.gov.cn/WebSite/CCChina/UpFile/File927.pdf
National Development and Reform Commission, 2011. “Energy Conservation and Emission Reduction Achievements.” Online at http://www.sdpc.gov.cn/xwfb/t20110310_399044.htm.
People’s Republic of China. 2004. The People’s Republic of China Initial National Commu-nication on Climate Change. Beijing: China Planning Press. Also at http://unfccc.int/essential_background/library/items/3599.php?such=j&symbol=CHN/COM/1%20B#beg
People’s Republic of China, 2006. 11th Five-year Plan. http://www.gov.cn/ztzl/2006-03/16/content_228841.htm
People’s Republic of China, 2011. 12th Five-year Plan Guideline. http://www.gov.cn/2011lh/content_1825838.htm
70A CPI Working Paper
Tracking Emissions and Mitigation Actions February 2012
Germany Arbeitsgemeinschaft Energiebilanzen. 2010.
“Preface to the Working Group Energy Bal-ances.” http://www.ag-energiebilanzen.de.
Council of the EU & European Parliament. 2009. “Directive 2009/29/EC of the European Parliament and of the Council of 23 April 2009 amending Directive 2003/87/EC so as to improve and extend the greenhouse gas emission allowance trading scheme of the Community.” http://eur-lex.europa.eu/LexUriServ/LexUriServ.do?uri=OJ:L:2009:140:0063:0087:en:PDF.
CRF, 2011. “Common Reporting Format tables Germany submitted in 2011”. http://unfccc.int/files/national_reports/annex_i_ghg_in-ventories/national_inventories_submis-sions/application/zip/deu-2011-crf-15apr.zip
Destatis, 2010. “Federal Statistical Office Germany - Strategy and Programme Plan 2009-2013.” http://epp.eurostat.ec.europa.eu/portal/page/portal/pgp_insite/insite_docs/de/strategy.pdf.
Destatis. 2010. “Quality reports Energy.” http://www.destatis.de/jetspeed/portal/cms/Sites/destatis/Internet/DE/Content/Pub-likationen/Qualitaetsberichte/EnergieWas-serversorgung/Einfuehrung,templateId=renderPrint.psml.
Dreher, Marion. 2002. “Zentrales System Emis-sionen des Umweltbundesamtes.” http://www.umweltdaten.de/luft/dreher.ppt.
Federal Ministry of Finance. 2010a. “Budgetary allowance for experts on GHG inventory and for research projects and expert opinions.” http://www.bundesfinanzministerium.de/bundeshaushalt2010/html/ep16/ep16k-p05nra06.html.
Federal Ministry of Finance. 2010b. “Expenses and Revenue Federal Environment Agency.” http://www.bundesfinanzministerium.de/bundeshaushalt2010/html/ep16/ep16kp05.html.
Günther, Dirk. 2011. “Personal Communication - GHG reporting process. Federal Environment Agency (UBA) - July 2011.”
German Parliament. 2010. “German Parliament 26th Plenary Session Protocol 17/26.” http://dipbt.bundestag.de/dip21/btp/17/17026.pdf.
IPCC. 2000. “Good Practice Guidance and Uncer-tainty Management in National Greenhouse Gas Inventories.” http://www.ipcc-nggip.iges.or.jp/public/gp/english/.
IPCC. 1996. “Revised 1996 IPCC Guidelines for National Greenhouse Gas Inventories.” http://www.ipcc-nggip.iges.or.jp/public/gl/invs1.html.
IPCC, 2003.” Good Practice Guidance for Land-Use, Land-use Change and Forestry” http://www.ipcc-nggip.iges.or.jp/public/gpglulucf/gpglulucf.html
Kuhnhenn. 2011. “Personal Communication - EU Monitoring Mechanism and Policy Sce-narios. Federal Environment Agency (UBA) - July 2011.”
Lämderarbeitskreis Energiebilanzen, 2011. “CO2 Bilanzen” http://www.lak-energiebilanzen.de/sixcms/detail.php?template=liste_cobi-lanzen
Memmler, Michael. 2011. “Personal Communi-2011. “Personal Communi-cation - Feed-in-tariff reporting. Federal Environment Agency (UBA) - August 2011.”
NIR. 2009. “National GHG Inventory Report 1990-2007 for Germany.” http://unfccc.int/national_reports/annex_i_ghg_inven-tories/national_inventories_submissions/items/4771.php
NIR. 2011. “National GHG Inventory Report 1990-2009 for Germany.” http://unfccc.int/national_reports/annex_i_ghg_inven-tories/national_inventories_submissions/items/5888.php
Nissler, Daniela. 2011. “Personal Communication - IEKP reporting. Federal Environment Agency (UBA) - July 2011.”
Open Federal Budget. 2011. “Open Federal Budget Expenditure by Federal Ministry of Environ-
71A CPI Working Paper
Tracking Emissions and Mitigation Actions February 2012
ment.” http://bund.offenerhaushalt.de/16.html
UBA. 2011a. “EU GHG Monitoring Mechanism Submission Projection report 2011. Submis-sion by Germany to the EU Decision No 280/2004/EC concerning a mechanism for monitoring Community greenhouse gas emissions and for implementing the Kyoto Protocol.” http://cdr.eionet.europa.eu/de/eu/ghgpro/envtcqp5g
UBA. 2011b. “Status Report on the IEKP (Sta-tusbericht zur Umsetzung des Integrierten Energie- und Klimaschutzprogramms der Bundesregierung).” http://www.uba.de/uba-info-medien/3971.html
UNFCCC, 2010. “Report of the individual review of the annual submission of Germany submit-ted in 2010”. http://unfccc.int/resource/docs/2011/arr/deu.pd
ItalyAngelucci, M., Vecchiocattivi, M., Bini, G., Col-
laveri, C., Bini, E., 2006, Operational Guide for the Realization of Local Emission Invento-ries, Interagency Technical Board.
Basili, Rossano, 2011, Presentation “Il quadro normativo nazionale per l’Efficienza Ener-getica degli edifici“, Auditorio Regionale ERF – ANCONA, 8 Giugno 2011, http://www.casaportale.com/public/uploads/Rossano%20Basili%20ENEA.pdf
Davide, M., Favero, A., Galluccio, G., Rogate, C., 2010, STRATEGIES AND RESEARCH TOWARDS LCS IN ITALY, Issue RP102, November 2010, http://www.cmcc.it/pub-blicazioni/pubblicazioni/research-papers/rp0102.pdf
EEA, 2010, Tracking progress towards Kyoto and 2020 targets in Europe, EEA, Denmark
EEA, 2011a, EEA GHG data viewer, http://da-taservice.eea.europa.eu/PivotApp/pivot.aspx?pivotid=475, accessed June 2011
EEA, 2011b, Database on Policies and Measures in Europe, http://www.eea.europa.eu/themes/
climate/pam/introduction, accessed May 2011
ENEA, 2011, The 55% Tax Deduction for energy efficiency improvements in buildings in 2009, http://efficienzaenergetica.acs.enea.it/doc/rapporto_2009.pdf
European Commission, 2007, Answers to Fre-quently Asked Questions on Greenhouse Gas Emissions Monitoring and Reporting under the EU Emissions Trading System Pursuant Directive 2003/87/EC, http://ec.europa.eu/clima/documentation/ets/docs/monitoring/mrg2faq_sep_2007.pdf, September 2007
European Union, 2003, DIRECTIVE 2003/87/EC OF THE EUROPEAN PARLIAMENT AND OF THE COUNCIL of 13 October 2003 establishing a scheme for greenhouse gas emission allowance trading, Official Journal of the European Union
European Union, 2007, COMMISSION DECISION 2007/589/EC of 18 July 2007 establishing guidelines for the monitoring and reporting of greenhouse gas emissions pursuant to Directive 2003/87/EC of the European Par-liament and of the Council (notified under document number C(2007) 3416), Official Journal of the European Union
European Union, 2009, DIRECTIVE 2009/29/EC OF THE EUROPEAN PARLIAMENT AND OF THE COUNCIL of 23 April 2009 amending Directive 2003/87/EC so as to improve and extend the greenhouse gas emission allow-ance trading scheme of the Community, Official Journal of the European Union
European Union, 2009, REGULATION (EC) No 443/2009 OF THE EUROPEAN PARLIA-MENT AND OF THE COUNCIL of 23 April 2009 setting emission performance stan-dards for new passenger cars as part of the Community’s integrated approach to reduce CO2 emissions from light-duty vehicles, Official Journal of the European Union
Gaudioso, D., 2006, Work package 3.1: White Certificate Schemes and European Emis-sions Trading System, http://www.ewc.

72A CPI Working Paper
Tracking Emissions and Mitigation Actions February 2012
polimi.it/dl.php?file=13)%20Report%20on%20white%20certificates%20and%20EU-ETS%20-%20Final.pdf
Hoehne, N., Vieweg, M., Blok, K., Becker, D., 2010, Climate Policy Tracker for the EU, http://www.climatepolicytracker.eu/italy
http://www.minambiente.it/export/sites/default/archivio/allegati/emission_trading/Delibera-zione_24_2010.pdf
IEA, 2009, Energy Policies of IEA countries: Italy 2009 Review.
ISPRA, 2010a, National GHG Inventory 1990 – 2008: National Inventory Report 2010, ISPRA.
ISPRA, 2010b, National Greenhouse Gas Invento-ry System in Italy, http://www.isprambiente.gov.it/site/_contentfiles/00004000/4078_rapp_120_2010_web.pdf
ISPRA, 2011a, National Greenhouse Gas Inventory System in Italy, http://www.isprambiente.gov.it/site/_contentfiles/00009400/9473_rap136_2011_NS_ITALY_2011.pdf
ISPRA, 2011b, National GHG Inventory 1990 – 2009: National Inventory Report 2011, ISPRA.
ISPRA, 2011c, Rete del sistema Informativo Nazionale Ambientale (Inventory Web Site), http://www.sinanet.isprambiente.it/it/sinanet/serie_storiche_emissioni
Italian national committee for the management of Directive 2003/87/EC and support to the management of Kyoto Protocol project activities, 2010, Resolution n.24/2010 on the conduct of verification activities related to Directive 2003/87/EC, http://www.minambiente.it/export/sites/default/ar-chivio/allegati/emission_trading/Delibera-zione_24_2010.pdf
Italian national committee for the management of Directive 2003/87/EC and support to the management of Kyoto Protocol project activities, 2011, Resolution n.5/2011 on the accreditation of verification activities related to the reporting of activities and emissions
by plants subject to legislative decree 216/06,
Italy, 2006, Decreto Legislativo 4 aprile 2006, n. 216 “Attuazione delle direttive 2003/87 e 2004/101/CE in materia di scambio di quote di emissioni dei gas a effetto serra nella Comunità, con riferimento ai mecca-nismi di progetto del Protocollo di Kyoto”, http://www.camera.it/parlam/leggi/deleghe/06216dl.htm
Italy, 2009, EU GHG Monitoring Mechanism Submission, http://cdr.eionet.europa.eu/it/eu/ghgpro
Italy, 2011a, EU GHG Monitoring Mechanism Sub-mission, Excel Reporting Template, http://cdr.eionet.europa.eu/it/eu/ghgpro
Italy, 2011b, 2011 Italy Climate Policy Progress Report: Submitted to the European Commis-sion pursuant to Decision No 280/2004/EC, Article 3(2), May 2011, http://nfp-it.eionet.europa.eu:8980/Public/irc/circa-it/reportnet/library?l=/projected_emissions/delivery_2011/progress_reportpdf/_EN_1.0_&a=d
Ministry for the Environment, Land and Sea, 2009, Italy’s Fifth National Communica-tion under the UNFCCC, November 2009. [submitted to the UNFCCC March 2010]
Roglieri, M. and Geurts, F., 2010, Climate Policy Tracker for the EU: Calculations for Italy, September 2010, http://www.climatepolicy-tracker.eu/full_report
UNFCCC, 2006, Report of the individual review of the greenhouse gas inventory of Italy sub-mitted in 2006, http://unfccc.int/resource/docs/2007/arr/ita.pdf [latest year avail-able]
UNFCCC, 2009, Report of the Centralized In-Depth Review of the Fourth National Communication of Italy, http://unfccc.int/resource/docs/2009/idr/ita04.pdf
UNFCCC, 2010, Report of the individual review of the annual submission of Italy submitted in 2010, November 2010, http://unfccc.int/documentation/
73A CPI Working Paper
Tracking Emissions and Mitigation Actions February 2012
documents/advanced_search/items/3594.php?rec=j&priref=600006054#eg
United StatesBreidenich, Clare. “Improving Reporting of
National Communications and GHG Inven-tories by Non-Annex I Parties Under the Climate Convention.” National Resources Defense Council, Washington, DC February 2011. http://www.nrdc.org/globalwarming/files/trackingcarbon-wp.pdf
Breidenich, Clare. “Measurement, reporting, and verification of GHG Emissions in the United States.” Presentation at Pew Center on Global Climate Change workshop, October 11, 2010 in Beijing, China. Avail-able online at http://www.pewclimate.org/events/2010/10/beijing-workshop-reporting-practices-related-climate-change-and-other-international-c.
Department of Energy Fiscal Year 2012 Budget Request to Congress. Department of Energy, February 2011. Online at http://www.cfo.doe.gov/budget/12budget/index12.html#Detailed Budget Justifications.
Environmental Protection Agency. “2011 U.S. Greenhouse Gas Inventory Report: Inven-tory of U.S. Greenhouse Gas Emissions and Sinks: 1990-2009.” United States Environ-mental Protection Agency, April 2011.
Environmental Protection Agency, “Mandatory Reporting of Greenhouse Gases; Final Rule,” Federal Register Vol 74, No. 209, October 2009. Available at http://www.epa.gov/climatechange/emissions/downloads09/GHG-MRR-Full%20Version.pdf
“EPA and NHTSA Finalize Historic National Program to Reduce Greenhouse Gases and Improve Fuel Economy for Cars and Trucks.” Online factsheet. U.S. EPA April 2010. Avail-able online at http://www.epa.gov/oms/climate/regulations/420f10014.htm#3
“Federal Climate Change Expenditures Report to Congress.” White House Office of Manage-ment and Budget, June 2010. http://www.whitehouse.gov/sites/default/files/omb/
assets/legislative_reports/FY2011_Climate_Change.pdf
Forest Inventory and Analysis National Program. United States Forest Service. http://www.fia.fs.fed.us/Forest%20Carbon/default.asp
“Quality Assurance/Quality Control and Uncer-tainty Management Plan for the U.S. Green-house Gas Inventory: Background on the U.S. Greenhouse Gas Inventory Process.” United States Environmental Protection Agency, Washington, D.C. June 2002.
Regulatory Impact Analysis for the Mandatory Re-porting of Greenhouse Gas Emissions Final Rule (GHG Reporting): Final Report. U.S. EPA September 2009. http://www.epa.gov/climatechange/emissions/downloads09/GHG_RIA.pdf
Sutley, Nancy. “Leading by Example – Making the Federal Government More Sustainable.” February 4th, 2010. http://www.whitehouse.gov/blog/2010/02/04/leading-example-making-federal-government-more-sustain-able
United States Department of Agriculture: Census of Agriculture Methodology. USDA 2007. http://www.agcensus.usda.gov/Publications/2007/Full_Report/Volume_1,_Chapter_1_US/usappxa.pdf
United States Department of State. U.S. Climate Action Report 2010. Washington, D.C., Global Publishing Services, June 2010.
The White House, Office of the Press Secretary. “President Obama Signs an Executive Order Focused on Federal Leadership in Environ-mental, Energy, and Economic Performance.” October, 2009. Online at http://www.whitehouse.gov/the_press_office/President-Obama-signs-an-Executive-Order-Focused-on-Federal-Leadership-in-Environmental-Energy-and-Economic-Performance.
74A CPI Working Paper
Tracking Emissions and Mitigation Actions February 2012
Endnotes1 Note that estimation of emissions from waste is not summarized,
given the relatively small share of emissions accounted for by these sources in each of these countries.
2 Relevant work has been led by the National Resources Defense Council, the World Resources Institute, the World Wildlife Fund, and others.
3 The IPCC uses three tiers. Tier 1 methods use default data and emis-sion factors, while higher tiers employ increasingly complex method-ologies. For example, tier 2 methods are generally used by countries to develop more detailed, sector-based emissions estimates that account for differences in the carbon content of fuels and combus-tion technologies within different countries. Tier 3 methods rely on more detailed models for particular gases, or facility-level emissions measurement. Note that these tiers are distinct from those contained in the IPCC good practice and uncertainty guidelines, which include tiers for applying uncertainty analysis.
3 ”Question of implementation” were triggered in the case of Greece, Canada, Croatia, Bulgaria, Romania, and Ukraine on the national system and on several Annex I countries for submission of the demonstrable progress report. http://unfccc.int/kyoto_protocol/com-pliance/questions_of_implementation/items/5451.php
4 Carbon Dioxide (CO2), Methane (CH4), Nitrous Oxide (N20), Sulfur Hexafluoride (SF6), Perfluorocarbons (PFCs), and Hydrofluorocarbons (HFCs).
5 Note though that these three gases do account for the majority of emissions.
6 Directive 2003/87/EC (Article 15 and Annex V)
7 People’s Republic of China, 2006. 11th Five-year Plan. http://www.gov.cn/ztzl/2006-03/16/content_228841.htm
8 The People’s Republic of China, 2011. 12th Five-year Plan Guideline. http://www.gov.cn/2011lh/content_1825838.htm
9 The People’s Republic of China, 2004. China Initial National Commu-nication. http://unfccc.int/essential_background/library/items/3599.php?such=j&symbol=CHN/COM/1%20B#beg
10 Other major sources of uncertainty in the initial inventory include: problems in measurement and statistical errors; the model for paddy rice does not account for relevant land management components; no information to differentiate among different types of trees; parameters of the proportion or degradable organic carbon by IPCC produced uncertainty for landfills; no measured values available on contained degradable organic carbon.
11 Teng Fei, 2010. MRV Practices in China: Domestic System and Inven-tory.
12 Created in 1998, this took over the work of the Coordination Com-mittee under the Environmental Protection Committee of the State Council.
13 People’s Republic of China, 2011. 12th Five-year Plan Guideline. http://www.gov.cn/2011lh/content_1825838.htm
14 National Assessment Report on Climate Change Compilation Committee, 2007. National Assessment Report on Climate Change. Science Press. See also Ministry of Science and Technology, 2007. Unscrambling of National Assessment Report on Climate Change. http://news.xinhuanet.com/politics/2007-04/19/content_5999349.htm
15 NDRC, 2007. China’s National Climate Change Programme. http://www.ccchina.gov.cn/WebSite/CCChina/UpFile/File188.pdf
16 Information Office of the State Council, 2008. China’s Policies and Actions for Addressing Climate Change. http://www.ccchina.gov.cn/WebSite/CCChina/UpFile/File419.pdf
17 NDRC, 2009. China’s Policies and Actions for Addressing Climate Change – The Progress Report 2009. http://www.ccchina.gov.cn/WebSite/CCChina/UpFile/File571.pdf
18 NDRC, 2010. China’s Policies and Actions for Addressing Climate Change – The Progress Report 2010. http://www.ccchina.gov.cn/WebSite/CCChina/UpFile/File927.pdf
19 MOS, NDRC, National Energy Office, 2007.Plan to implement the statistics indicators system of energy consumption per unit of GDP. http://news.xinhuanet.com/newscenter/2007-11/23/con-tent_7132232_1.htm
20 MOS, NDRC, National Energy Office, 2007. Plan to implement the monitoring system of energy consumption per unit of GDP. http://news.xinhuanet.com/newscenter/2007-11/23/content_7132232_1.htm
21 MOS, NDRC, National Energy Office, 2007. Plan to implement the examination system of energy consumption per unit of GDP. http://news.xinhuanet.com/newscenter/2007-11/23/content_7132232_1.htm
22 NDRC, 2011, http://www.sdpc.gov.cn/xwfb/t20110310_399044.htm[2011-3-10].
23 These include iron & steel, non-ferrous metals, coal, power, petro-chemical, chemicals, building materials, textile, and pulp & paper
24http://www.lak-energiebilanzen.de/sixcms/detail.php?template=liste_cobilanzen
75A CPI Working Paper
Tracking Emissions and Mitigation Actions February 2012
25 NIR, 2011
26 NIR, 2011
27 Federal Finance Ministry, 2010a, 2010b. http://bund.offenerhaushalt.de/16.html
28 Land-use, land-use change and forestry
29 CRF, 2011
30 The Federal Statistical office publishes the survey frequency, the number of respondents, the survey itself and a quality report (in German only) about each data series and the data series publicly online (not all) (FSO Strategy Plan 2011-2015 and Quality Reports, 2010). The quality reports include information about the survey method, potential sample and non-sample induced errors, number of respondents, time-series consistency and timeliness.
31 Germany is divided in sixteen Länder (federal states).
32 Paragraph 23 Federal Statistics Law – BstatG.
33 https://www-idev.destatis.de/idev used with a free guest-account
34 The following actors are part of the Working Group on Energy Balance (Arbeitsgemeinschaft Energiebilanzen, 2010). Energy Industry Associations: BDEW - Association of the German Energy and Water Industry; DEBRIV - German Lignite Industry Association; GVSt - General Association of the German Hard Coal Industry; MWV - Association of the German Petroleum Industry. Research Institu-tions: German Institute for Economic Research (DIW Berlin); Energy Environment Forecast Analysis; Institute of Energy Economics at the University of Cologne; Rhine-Westphalian Institute for Economic Research. Furthermore the work is supported VIK – the Association of the Energy and Power Generation Industry and the Association of Coal Importers.
35 The Energy Balance distinguishes the consumption of energy carri-ers among several, GHG inventory-relevant categories: Public thermal power stations; Industrial power stations (only for electricity); Public cogeneration plants; District heating stations; Hydro, wind, photovoltaic and other power stations; Other energy producers; Total energy consumption in the conversion sector; Mining and quarrying, manufacturing industry; Transport; Households, trade, commerce and services.
36 The Energy Balance provides data on the production, import and consumption of six primary energy carriers: Hard coal (4); Lignite (4); Petroleum (11); Gases (4); Renewable energy (3); Further Energy car-riers (1). These six primary energy carriers are further disaggregated into subgroups) (indicated by the number in brackets above). For instance, hard coal has four secondary energy carrier sub-categories: coal, briquettes, coke and other hard coal products. In total there are
twenty-seven secondary energy carriers distinguished in the Energy Balances.
37 The list is available at http://www.dehst.de/SharedDocs/Downloads/Archiv/Zuteilung_2005-2007/Zut2007_Emissionsfaktoren_C-Gehalte.pdf
38 “The guide on describing uncertainties in measurements DIN 1319.”
39 Franco-German Institute for Environmental Research at the Univer-sity of Karlsruhe (DFIU) Report, January 2010 http://www.dfiu.kit.edu/downloads/DFIU-Bericht_2010_Deutsch.pdf, at p 31
40 Taking different system boundaries and including for instance emis-sions from agricultural vehicles almost doubles the share to 13-15%. Question 3 of Waltraud Wolff in the German Parliament (German Parliament, 2010)
41 Forest land accounts is a sink equivalent to -2.7 per cent of emis-sions in 2009 (NIR, 2011).
42 NIR, 2011; UNFCCC, 2010
43 NIR, 2011: p. 443
44 UNFCCC, 2010
45 NIR, 2011: p. 97.
46 NIR, 2011, p. 98; UNFCCC, 2010.
47 Fuel combustion, Transport and fugitive emissions from oil and gas.
48 In the chemical industry.
49 Enteric fermentation and manure management.
50 Forestland and Cropland.
51 Part of the cropland source category
52 Solid waste disposal on land.
53 Personal Communication Daniela Nissler, 2011.
54 http://www.bmu.de/energiewende/doc/47465.php
55 Personal Communication Daniela Nissler, 2011.
56 Source Category 1.A
57 UBA, 2011. Status Report on the IEKP “Statusbericht zur Umsetzung des Integrierten Energie- und Klimaschutzprogramms der Bundesr-egierung”.
76A CPI Working Paper
Tracking Emissions and Mitigation Actions February 2012
58 The first IEKP report illustrates briefly the potential interaction between national mitigation actions, such as the renewable energy support scheme and the EU ETS. The report also sketches the inter-action between non-climate related decisions such as the nuclear pha.se-out and the EU ETS and national mitigation actions.
59 Personal communication Daniela Nissler, 2011
60 BMU- Federal Ministry of Environment, Nature Conservation and Nuclear Safety; BMWi - Federal Ministry of Economics and Technol-ogy; BMLEV - Federal Ministry of Food, Agriculture and Consumer Protection
61 Personal Communication Michael Memmler UBA, 2011 – 5th August, 2011.
62 Personal Communication Frank Musiol, Head of AGEE-Stat ZSW, 2011 – September, 2011.
63 Discussions about a potential voluntary extension of the EU Moni-toring Mechanism to ex-post analysis are currently underway.
64 The categorization of policy types can be found in the Excel sheet template and in “Review of the implementation of commitments and of other provisions of the Convention. UNFCCC guidelines on reporting and review.” UNFCCC, 1999 page 85 (FCCC/CP/1999/7). The “Planning” category was added and comprises: “measures such as waste management plan, transport plan, urban planning.”
65 Sectors are distinguished between: 1) Energy – Supply, 2) Energy -Industry/Construction, 3) Energy - Other (residential, commercial, agricultural), 4) Transport; 5) Industrial Processes, 6) Agriculture, 7) Waste 8) LULUCF and 9) Cross-cutting.
66 Basic information is taken from the Sistan Website: http://www.sistan.it/index.php
67 The latest update of the plan for 2009-2010 was approved by a Prime Ministerial Decree on 3rd August 2009.
68 Latest annual report is from 2009: http://www.palazzochigi.it/Presidenza/statistica/rapporti_annuali.html
69 Personal communication.
70 http://dgerm.sviluppoeconomico.gov.it/dgerm/ben.asp
71 Excludes therefore solvents which account for 0.4% of 2009 emis-sions excluding LULUCF. Fugitive emissions, which account for 1% of emissions are also excluded from the table.
72 http://www.sinanet.apat.it/it/sinanet/serie_storiche_emissioni
73 http://dataservice.eea.europa.eu/PivotApp/pivot.aspx?pivotid=475
74 ISPRA, 2010, Quality Assurance/Quality Control plan for the Italian Emission Inventory: Year 2010.
75 http://affaritaliani.libero.it/static/upl/doc/documento_risevato_gov-erno.pdf
76 The report includes an estimate of the impact of the interventions in the energy, transport and waste sectors in terms of potential gross total reduction in GHG emissions. The estimate results from a complex methodology which required the calculation of the total amount of public resources planned by national and additional policies and the evaluation of the multilevel governance framework involved. Sources: http://www.dps.tesoro.it/materialiuval/documenti.asp, http://www.dps.tesoro.it/uval_presentazione.asp, http://www.dps.tesoro.it/valutazione/snv_soggetti_attivi.asp
77 DECISION No 280/2004/EC concerning a mechanism for monitor-ing Community greenhouse gas emissions and for implementing the Kyoto Protocol
78 As previously mentioned, the Technical Committee on GHG emis-sions (CTE), is responsible for monitoring and evaluating the policies in the national strategy and identifying further potential measures or revisions to the strategy to meet Italy’s Kyoto protocol target. Reporting under the Committee is not however publically available.
79 See http://cdr.eionet.europa.eu/it/eu/ghgpro
80 Infringement procedures can be launched against Member States for failure to comply with legislation, which could result in a fine.
81 See http://www.eea.europa.eu/themes/climate/pam/introduction
82 Legislative Directive n. 216/2006
83 Legislative decree of 30 dicembre 2010 , n. 257
84 Website: http://www.greta.sinanet.apat.it/
85 Regulations n.24/2010 and n.5/2011.
86 Italy (2001b). Note that high efficiency co-generation is also included.
87 Current guidelines refer to AEEG’s Annex A to resolution 103/03 including amendments introduced by resolutions 123/07 and EEN 1/09. http://www.autorita.energia.it/allegati/docs/03/103-3allnew.pdf
88 http://www.autorita.energia.it/it/pubblicazioni_ee.htm
89 Art. 7 of Ministerial Decree 20/07/2004, http://www.autorita.energia.it/it/docs/riferimenti/decreto_040720.htm
77A CPI Working Paper
Tracking Emissions and Mitigation Actions February 2012
90 Art. 5 of Ministerial Decree 21/12/2007 http://www.mercatoelettri-co.org/en/MenuBiblioteca/Documenti/20071221DecretoCertificatiBianchi.pdf
91 http://www.gse.it/media/Pubblicazioni/Documents/GuidaFontiRin-novabili.pdf, http://www.autorita.energia.it/it/docs/08/150-08arg.htm
92 http://www.gse.it/attivita/Incentivazioni%20Fonti%20Rinnovabili/Documents/Decreto%20Ministeriale%2018_12_08.pdf
93 http://www.gse.it/media/Pubblicazioni/Documents/GuidaFontiRin-novabili.pdf
94 http://www.gse.it/attivita/stateautocert/Pagine/QuadroNormativo.aspx http://www.gse.it/attivita/Incentivazioni%20Fonti%20Rinnov-abili/Documents/Decreto%20Ministeriale%2018_12_08.pdf
95 http://www.autorita.energia.it/allegati/docs/09/048-09vis.pdf
96 EPA 2002.
97 EPA 2011. (chapter on Key Category Analysis).
98 Key sources included within CO2 from fossil fuel combustions are emissions from stationary gas, coal, and oil combustion, as well as road, marine, and aviation transportation fuel combustion. Key sources within other energy categories include emissions from non-energy use of fuels, natural gas systems, coal mining, petroleum systems, international bunker fuels, N20 emissions from mobile combustion, and non-CO2 emissions from stationary combustion. Key sources within industrial process emissions include production associated with iron and steel, metallurgical coke, cement, ammonia, aluminum, nitric acid, adipic acid, magnesium, and HFCs, and from substitutes for ozone-depleting substances. Key sources in agricul-ture include enteric fermentation, manure management, rice cultiva-tion, soil management, and applied nitrogen. Key sources in waste include emissions from landfills and wastewater treatment. This table excludes other LULUCF net emissions and sinks, which account for a further absorption of 2% of gross emissions and includes sequestra-tion from urban tree planting, cropland, landfilled yard trimmings and food scraps, and grasslands, and non-CO2 emissions from forest fires.
99 For more information, see Environmental Protection Agency, “Mandatory Reporting of Greenhouse Gases; Final Rule,” Federal Register Vol 74, No. 209, October 2009. Available at http://www.epa.gov/climatechange/emissions/downloads09/GHG-MRR-Full%20Version.pdf
100 Regulatory Impact Analysis for the Mandatory Reporting of Green-house Gas Emissions Final Rule (GHG Reporting): Final Report. U.S. EPA September 2009. http://www.epa.gov/climatechange/emissions/downloads09/GHG_RIA.pdf
101 Breidenich October 2011.
102 EPA factsheet on Confidentiality Determinations for Data Collected Under the GHG Reporting Program. U.S. EPA, May 2011. See http://www.epa.gov/climatechange/emissions/downloads11/documents/CBI-factsheet-final.pdf
103 United States Department of State. U.S. Climate Action Report 2010. Washington, D.C., Global Publishing Services, June 2010.
104 See http://nepis.epa.gov/EPA/html/DLwait.htm?url=/Adobe/PDF/P100A4HZ.PDF
105 For example, in reporting on the status and achievements of its Acid Rain program – a well-established program designed to cap and reduce sulfur dioxide emissions from power plants – EPA includes information on the number of units affected, their total emissions, and how annual emissions from covered sources compare to the program’s mandatory cap.
106 See http://nepis.epa.gov/EPA/html/DLwait.htm?url=/Adobe/PDF/P100A4H3.PDF
107 Unless otherwise specified, all mitigation numbers are in terms of CO2e.
108 For additional information, see “EPA and NHTSA Finalize Historic National Program to Reduce Greenhouse Gases and Improve Fuel Economy for Cars and Trucks.” Online factsheet. U.S. EPA April 2010. Available online at http://www.epa.gov/oms/climate/regulations/420f10014.htm#3.
109 More information and final rule, see EPA’s final rulemaking notice for light-duty vehicles GHG emissions standards and corporate aver-age fuel economy standards, published May 7 2010. Online at http://edocket.access.gpo.gov/2010/pdf/2010-8159.pdf
110 For reference, summaries of the information currently tracked and made available through the CAFÉ program is available here: http://www.epa.gov/fueleconomy/data.htm.
111 The White House, Office of the Press Secretary. “President Obama Signs an Executive Order Focused on Federal Leadership in Environmental, Energy, and Economic Performance.” October, 2009. Online at http://www.whitehouse.gov/the_press_office/President-Obama-signs-an-Executive-Order-Focused-on-Federal-Leadership-in-Environmental-Energy-and-Economic-Performance.
112 Sutley, Nancy. “Leading by Example – Making the Federal Govern-ment More Sustainable.” February 4th, 2010. http://www.whitehouse.gov/blog/2010/02/04/leading-example-making-federal-govern-ment-more-sustainable
113 “Guidance for Federal Greenhouse Gas Accounting and Inventories.”
78A CPI Working Paper
Tracking Emissions and Mitigation Actions February 2012
The White House. http://www.whitehouse.gov/administration/eop/ceq/sustainability/fed-ghg
114 Federal Agency GHG inventory and scorecards. Data online at http://explore.data.gov/Geography-and-Environment/FY2010-Federal-Government-Greenhouse-Gas-Inventory/vzm3-edjq
115 The guidelines recommend verifiers refer to ISO standards 14064 in carrying out their reviews.
116 OMB’s core functions include both budget development and execu-tion, general management including oversight of federal agency performance, coordination and review of federal regulations, review of all agency communication with Congress, and delivery and execu-tion of executive orders. For more information on OMB’s mission and priorities, see OMB’s website at http://www.whitehouse.gov/omb/organization_mission/.
117 “Federal Climate Change Expenditures Report to Congress.” White House Office of Management and Budget, June 2010. http://www.whitehouse.gov/sites/default/files/omb/assets/legislative_reports/FY2011_Climate_Change.pdf
118 CCTP is a collaboration among 12 federal agencies to conduct RD&D of low-carbon technology technologies and implement a variety of voluntary partnerships and grant programs. CCTP activities all reduce, avoid, or sequester GHG emissions.
119 For more information on these guidelines, see http://www.white-house.gov/sites/default/files/omb/memoranda/2010/m10-32.pdf
120 “Guidelines for Ensuring and Maximizing the Quality, Objectivity, Utility, and Integrity of Information Disseminated by Federal Agen-cies.” White House Office of Management and Budget, October 2001. http://www.whitehouse.gov/omb/fedreg_final_information_qual-ity_guidelines
121 The most relevant agency implementing guidelines are available here:
EPA: http://www.cecosweb.com/resources/EPA%20Informa-tion%20Quality%20Guidelines.pdf
DOE: http://cio.energy.gov/documents/finalinfoqualityguidelines.pdf
USDA: http://www.thecre.com/pdf/20021014_usda-final.pdf DOT: http://www.bts.gov/programs/statistical_policy_and_re-
search/data_quality_guidelines/pdf/entire.pdf
122 For more information on the GAO and its activities related to climate change policy, see http://www.gao.gov/docsearch/featured/climate_change.html
123 After successfully receiving certification for 15 of 20 submitted bogus products, GAO concluded Energy Star’s verification measures
were “vulnerable to fraud and abuse.” Since the release of GAO’s report in March 2010, the EPA and DOE have begun revising testing and certification procedures within the program. See “Energy Star Program: Covert Testing Shows the Energy Star Program Certifica-tion Process is Vulnerable to Fraud and Abuse.” U.S. Government Accountability Office March 2010. http://www.whitehouse.gov/omb/fedreg_final_information_quality_guidelines
124 Note that estimation of emissions from waste is not summarized, given the relatively small share of emissions accounted for by these sources in each of these countries.