Theoretical and experimental analysis of photovoltaic water pumping system
Upload
wwwuniv-bejaiaCategory
view
0download
0
Applied Energy 87 (2010) 3451–3459
Contents lists available at ScienceDirect
Applied Energy
journal homepage: www.elsevier .com/locate /apenergy
Modelling photovoltaic water pumping systems and evaluation of their CO2
emissions mitigation potential
S. Ould-Amrouche a,*, D. Rekioua b, A. Hamidat a
a Centre of Development of Renewable Energies, Cedex1, BP120, Bouzareah, Algiers, Algeriab Department of Electrical Engineering, University A. Mira, Bejaia, Algeria
a r t i c l e i n f o
Article history:Received 28 July 2009Received in revised form 17 May 2010Accepted 23 May 2010Available online 16 June 2010
Keywords:PhotovoltaicWaterPumping systemsCO2 emissionsDieselClimate
0306-2619/$ - see front matter � 2010 Elsevier Ltd. Adoi:10.1016/j.apenergy.2010.05.021
* Corresponding author. Tel.: +213 21 90 15 03; faxE-mail address: [email protected] (S. Ould-Am
a b s t r a c t
In photovoltaic (PV) water pumping design, the accurate prediction of the water flow is a key step foroptimized implementation and system robustness. This paper presents a model to characterize themotor-pumps subsystems used in PV pumping installations. The model expresses the water flow output(Q) directly as a function of the electrical power input (P) to the motor-pump, for different total heads.The actual model is developed using the experimental results obtained by the use of several motor-pumpsubsystems of different types and technologies. This work details the investigations concerning centrif-ugal and positive displacement motor-pump subsystems. The experimental tests are used to validatethe developed model. Based on the motor-pump subsystem model, a method is proposed to estimatethe amount of carbon dioxide (CO2) emissions saved by the use of water pumping facilities poweredby a photovoltaic array instead of diesel fuelled generators. This work shows that the dissemination ofPV water systems not only improves the living conditions in remote areas, but is also environmentfriendly.
� 2010 Elsevier Ltd. All rights reserved.
1. Introduction
Algeria is facing water scarcity due to the arid and semi aridnature of its climate. Arid climate prevails in the Algerian Sahara,which represents 87% of the total area of the country, semi aridclimate in the highlands and Mediterranean climate on the north-ern coasts [1]. Because of this, the water resources, consisting ofsurface water and ground water, are limited. The actual renewabletotal volume of water resources is 11.25 km3/year, renewed byprecipitations with an average of 89 mm/year [1]. In the context ofwater stress, the demand is increasing for drinking, agriculture andindustrial uses: in 2000, the total withdrawal was 6.07 km3/yearand is expected to attain 11 km3/year by 2020 [1–3].
Although Algeria receives large quantities of solar radiations allover the year and PV pumping is clearly the solution to the waterproblem in remote sites, the use of photovoltaic technology is stillnot widespread [4]. Actually, in Algeria, the number of photovoltaicenergy-driven water pumps is very low. The main obstacles to thePV pumping development and dissemination are the high initialinvestment, the low awareness about these systems and the lackof tools serving to predict their performances [5].
The first part of this work is a contribution to the developmentof prediction tools for PV water pumping systems. This is carried
ll rights reserved.
: +213 21 90 16 54.rouche).
out by presenting a model which can be used to characterize themotor-pump subsystem. This point has been dealt with in previouswork. However, the different models existing in the literature areeither too complex or related to specific subsystems such as DCor induction motors and use specific variables such as current,voltage or supply frequency [6–11]. This paper proposes a simplermodel to predict the water flow output Q, given the electricalpower input P. So it could be used easily with other electricalpower sources. To derive the proposed model, experiments havebeen conducted for several pumps of different types and technolo-gies at the test bench of the CDER (Bouzareah – Algiers). Severalexperiments have been used to validate the simulations and checkthe effectiveness of the developed model. This paper details moreparticularly the work and the results concerning two centrifugalpumps and one positive displacement pump.
The second contribution of the paper is the evaluation of theeconomical and positive environmental impact induced by theuse of photovoltaic water pumping technology. This method isbased on the motor-pump subsystem model and calculates thereduction of carbon dioxide emissions due to the use of photovol-taic powered pumping systems instead of diesel generator waterpumping setups.
The paper is organized as follows: the Algerian water resourcesand needs are presented in Section 2. Section 3 analyses thepotential of PV pumping in Algeria. Section 4 describes PV waterpumping systems. The Section 5 is devoted to the investigated

3452 S. Ould-Amrouche et al. / Applied Energy 87 (2010) 3451–3459
motor-pump subsystem model. The Section 6 presents an eco-nomic study of the PV pumping system as compared to the dieselpumping system. The Section 7 develops the CO2 estimation sav-ings method and the last section concludes this paper.
2. Water in Algeria
Algeria climate can be considered as arid or at least as semi aridover the major part of the country. Thus, limited renewable surfaceand ground water resources are available. The water requirementsare expected to increase because of the population growth, exten-sion of irrigated area and industrial development. To meet the var-ious demands, dams and traditional electrical or diesel pumps arethe most conventional means actually in use, whereas the renew-able energy systems remain insignificantly and insufficiently used.
2.1. Algerian climate
The climate varies from the Mediterranean type in the north tothe desert type in the south. Algeria with a total area of2,381,741 km2, can be divided into three climatic regions whichrun parallel to each other horizontally through the country [1]:
– The northern part has a Mediterranean climate and forms 4% ofthe country area. Despite its small size, this region is inhabitedby more than ninety percent of Algeria’s population, mainlybecause it is the most fertile region.
– The highlands region has a semi arid climate and constitutes 9%of the total area. Some places in the highlands are so dry thatthey may be considered as part of the Sahara.
– The Sahara is an arid desert which constitutes 87% of the coun-try area.
2.2. Water resources
Conventional water, generated by rainfall, represents the mostimportant potential. The average rainfall is 89 mm (the equivalentwater volume is 212 km3) per year on the whole country [1]. Theamounts of rainfall vary drastically going from the north to thesouth as described below:
– In the north, precipitations, which mainly occur in winter andthe beginning of spring, are very irregular with considerablevariations from year to year. The average precipitations are1600 mm/year.
– In the highland region, rainfall is seasonal and heaviest betweenSeptember and December. The average precipitations arebetween 100 and 400 mm/year on this region.
– The rainfall in the country’s Saharan region is sparse and irreg-ular, averaging less than 100 mm/year. Drought conditions arecommon and some regions may not receive rain for periods ofup to 20 years.
For hydrological, topographical and geological reasons, only aminor part of the precipitations is collected in the form of surfaceand ground resources [2,3]. The renewable surface water capacityis 9.76 km3/year for the whole country land, including the Sahara.The renewable ground water is evaluated to about 1.49 km3/yearin the Algerian northern regions. Actually, the total renewablewater resources in the country are estimated to be 11.25 km3/yearand the exploitable quantity is approximately 7.9 km3/year [1].Non-conventional water resource such as desalination representsonly a minor part of the total production with only 0.017 km3 in2002 [1].
2.3. Water needs
In 2000 the total water withdrawal was 6.07 km3, which isequal to 52% of the total annual renewable water resources [1].Agriculture is by far the greatest consumer of water, accountingfor 65% of all water consumption. The agricultural water with-drawal represented 3.94 km3 in 2000 [1]. In 2002, there were only8.27 � 106 hectares of sown land [1]. This forms a small part of the40 � 106 hectares cultivable area [1]. The estimated irrigated areais 450,000 hectares and is expected to reach an area of 770,000hectares [2]. Thus, the agricultural water needs are expected tocontinuously rise. The drinking water (domestic) needs represent22% of the renewable water resources. The water drinking con-sumption which attained 1.33 km3 in 2000, is growing by 4–5%each year [1,2]. The population is estimated to increase from23 million in 1987 to 46 million in 2020 [2]. The industrial waterwithdrawal ranked third (13%), was 0.8 km3 in 2000 [1]. In 2020,the various demands will exceed the volume of water availablenowadays, estimated at 11 km3 [2].
2.4. Conventional and non-conventional water systems
To mobilize the necessary water resources, conventional wayssuch as dams are used to regulate the surface water. The ground-water is usually provided by using pumps connected to the gridand by diesel pumps in areas located far from the grid. However,the diesel pumps show a low reliability which leads to high main-tenance costs.
Among the non-conventional systems, the use of photovoltaicpowered pumps is a cost effective method for providing water inlocations where power lines are too far from the grid. The publicsubsidy policy may alleviate the high initial investment obstacleto the development and dissemination of PV pumping systems[4]. Moreover, if the decision criteria for a water production systemchoice do not rely only on the direct capital cost but include alsothe environmental cost, then the photovoltaic water pumping isa valuable option. This solution lowers the global warming effect,mitigates the negative impact on the air quality and contributesto a sustainable economic development scheme.
3. Potential application of PV pumping in algeria
In Algeria, the average annual daily solar radiation on a horizon-tal plane is within the range of 5–7 kW h/m2/day and the annualaverage daily sunshine is in the range of 7–9 h [12]. Because ofthe solar radiation availability and the high cost of grid connection,the photovoltaic pumping is an advantageous way to meet thewater needs of the remote communities in Algeria.
Forty-one percent of the Algerian population, i.e. 13.3 millionpeople live in rural areas and only 80% of the population is suppliedwith drinking water. The rural population which is not suppliedwith drinking water attains about 2.66 million inhabitants. By pro-viding 40 l/day per person, the daily capacity of PV pumping sys-tems must be about 106,400 m3 in order to improve the livingconditions of the rural population which is not connected to thewater distribution network. To determine the necessary numberof small PV pumping systems, it is assumed that each pump pro-vides 8 m3/day using 350 Wp photovoltaic generators for a totalhead of 10 m. In these circumstances, the potential number of PVpumping system is estimated at about 13,300. This figure is muchhigher than the number of existing systems today and shows thepotential for the PV pumping in Algeria.
Despite the clear benefits of photovoltaic pumping systems,their wide use faces several constraints such as high investmentcost, subsidy for diesel, taxes on imported equipments. This is also

S. Ould-Amrouche et al. / Applied Energy 87 (2010) 3451–3459 3453
due to the lack of funding schemes, of skilled personnel and ofcodes and standards.
4. Description of photovoltaic water pumping systems
Photovoltaic water pumping systems generally consist of a PVarray, a motor-pump subsystem, a controller and a tank (Fig. 1).The motor-pump subsystem includes a motor, a pump and a powerconverter.
4.1. PV array
The source of electrical energy is the solar cell. Commercial so-lar cells reach maximum conversion efficiencies of 20–21%, whilean efficiency of 25% may be achieved in laboratory [13]. The overallefficiency of a module ranges from 15% to 17% [13]. Under realoperating conditions, a lower efficiency than the nominal efficiencycould be observed [13].
PV arrays must be installed so that they maximize the amountof direct exposure to the sun. That usually means placement in anarea clear of shading, in a southward direction and at an angleequal to the latitude of the location. The power provided by thePV array varies with solar radiation and temperature, since theseparameters influence the I–V characteristics of solar cells. In orderto optimize the energy transfer from the PV array to the load, it isnecessary to force the working point to be at the maximum powerpoint (MPP) [14,15].
4.2. Pump
Depending upon the intended application, the pumping systemcan be selected from surface, submersible or floating pumps types[16]. Submersible pumps remain underwater, surface pumps aremounted at water level at the vicinity of the well or, in the caseof a floating pump, on top of the water. Pumps can be classifiedaccording to their operating mode. Mainly there are centrifugaland positive displacement pumps [16]. In the centrifugal pump,the rotation of an impeller forces water into the pipe. The watervelocity and pressure depend on the available mechanical powerat the rotating impeller and the total head. The displacement pumpuses a piston or a screw to control the water flow. As compared tothe centrifugal pump, the positive displacement pump presents abetter efficiency under low power conditions.
4.3. Motor
The water pumps may be driven by DC or AC motors. The earlierPV pumping systems were principally based on DC motors [17].
Photovoltaic array
Storage tank Controller
Well Submersible Motor - Pump
Water Hose
Power line
Fig. 1. Schematic diagram of a photovoltaic water pumping station.
The DC motors present the drawback of maintenance expensesdue to frequent brushes replacements [5]. Brushless permanentmagnet DC motors have been introduced in some systems [18]. Re-cent developments in induction motor technology, made this op-tion attractive among the AC motors based pumping setups [19].The induction motor is more robust, requires much less mainte-nance and is available at lower costs than DC motors [5,18].
4.4. Controller
The controller is an electronic interface between the photovol-taic array and the motor-pump subsystem. In the case of AC motoruse, an inverter may be included in the controller [10]. In DC motorwater pumping applications, the motor could be connected di-rectly to the PV generator. To allow operation of the pumping sys-tem at maximum power, the controller may perform the trackingof the MPP. The controller offers some protections to the systemagainst malfunctions [16]. It also controls the filling of the tankand offers diagnostic help in some cases.
4.5. Tank
Usually a tank is commonly employed for water storage. Theprinciple is to store water rather than electricity in batteries, there-by reducing the cost and complexity of the system.
5. Motor-pump modelling
There are still many obstacles inhibiting a larger implementa-tion of PV pumping systems [5]. Among these problems, there isa lack of accurate tools for the prediction of the system perfor-mances. To achieve improvements in PV pumping design, it is nec-essary to study and model photovoltaic water pumping systems,particularly motor-pump subsystems.
Many research papers dealt with PV pumping systems model-ling. Daud and Mahmoud [6] have investigated a method to deter-mine a PV pumping system performance by representing the waterflow rate and efficiency of the system as function of supply fre-quency and pumping head. Badescu [7] has used sets of differentialequations to predict the behaviour of a PV water pumping systemdepending on the level of solar global irradiance incident on the PVarray. The characteristics have been represented by current, volt-age, head (I, V, h) and water flow, current, head (Q, I, h) relation-ships [8]. The current, voltage (I, V) and water flow, voltage (Q, V)relations have been presented [9]. Amer and Younes [10] have pre-dicted the relation between water flow and solar radiation. Theelectrical power input has been expressed as a function of waterflow at different heads [11]. The precedent models do not givethe water flow output directly as a function of the electrical powerinput to the motor-pump subsystem. The actual model relates di-rectly the pumped water flow output Q to the motor-pump subsys-tem electric power input P. This work provides a tool for motor-pumps characterization and it may be used for any other energysource of a clean nature such as wind, hydrogen fuel cell, or a hy-brid type. The model is derived from the data analysis obtainedfrom a pumping test facility. The experimentation used differentsets of centrifugal and positive displacement pumps.
5.1. Description of experimental installation
The experiments are carried out by using the pump testing sys-tem at the Centre of Development of Renewable Energies located inAlgiers-Algeria [9,11]. The main components of the test facilityconsist of 30 mono-crystalline PV modules with a total peak powerof 2.2 kWp, several pumps, a water tank, an air/water regulated
3454 S. Ould-Amrouche et al. / Applied Energy 87 (2010) 3451–3459
pressure vessel, an air compressor, a piping system and measuringdevices. A motor operated valve is used to set the water head be-tween 0 and 120 m with flow rates ranging between 0 and30 m3/h.
5.2. Proposed model
The experimental data has been collected for several pumps byusing the test bench. The collected data consists of measuring thewater flow Q for different values of the electrical power input P andtotal head h. On the basis of these experiments, a model is elabo-rated by the use of the least-squares method to the set of measure-ments data. A polynomial fit of the third order expresses therelationship between the flow rate and power input, as describedby the following equation:
Qðh; PÞ ¼ aðhÞP3 þ bðhÞP2 þ cðhÞP þ dðhÞ ð1Þ
Table 1Manufacturer data of the tested motor-pumps.
C1a C2
a D1a
Motor AC (three phase) AC (three phase) DC (brushless)Nominal power (W) 400 1000 400Nominal voltage (V) 90 100 20–160Nominal current (A) 4 10 4.5
a C1 and C2 are centrifugal pumps and D1 a positive displacement pump.
Table 2Model coefficients for the positive displacement pump D1 and the centrifugal pumps C1 a
Pump D1 Pump C1
h (m) a(h) � 10�9 b(h) � 10�6 c(h) � 10�3 d(h) h (m) a(h) � 10�9 b(h) � 10
5 1023.00 �338.30 40.940 �0.594 4 36.34 �29.3810 524.10 �204.30 30.960 �0.559 6 30.06 �24.4415 314.41 �154.60 28.600 �0.707 8 50.06 �39.3920 185.80 �114.60 25.960 �0.842 10 17.19 �18.4525 122.00 �80.45 21.310 �0.812 12 45.52 �37.8830 �25.66 �15.83 12.620 �0.571 14 27.29 �26.2935 �88.16 17.57 7.644 �0.480 16 26.77 �26.3840 �62.83 14.25 6.919 �0.518 18 44.68 �36.8045 �93.53 37.09 2.064 �0.321 20 15.52 �15.1050 �35.94 13.66 4.562 �0.501 22 45.07 �39.4955 �47.49 20.57 3.453 0.581 24 10.23 �13.1960 �19.74 6.75 5.238 �0.742 26 �18.21 �45.7265 7.33 �10.86 8.965 �1.123 28 41.05 �41.4970 �23.36 12.28 3.425 �0.84175 55.15 �61.80 26.730 �3.3980 15.29 �26.82 16.620 �2.57
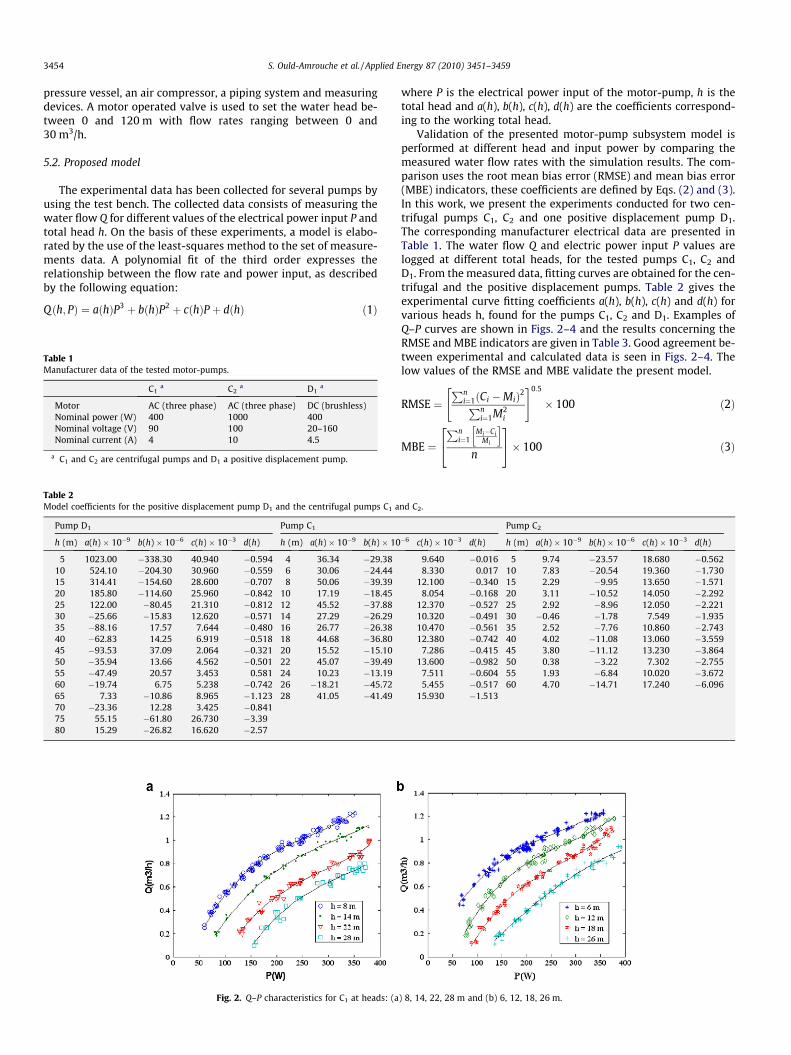
Fig. 2. Q–P characteristics for C1 at heads: (a
where P is the electrical power input of the motor-pump, h is thetotal head and a(h), b(h), c(h), d(h) are the coefficients correspond-ing to the working total head.
Validation of the presented motor-pump subsystem model isperformed at different head and input power by comparing themeasured water flow rates with the simulation results. The com-parison uses the root mean bias error (RMSE) and mean bias error(MBE) indicators, these coefficients are defined by Eqs. (2) and (3).In this work, we present the experiments conducted for two cen-trifugal pumps C1, C2 and one positive displacement pump D1.The corresponding manufacturer electrical data are presented inTable 1. The water flow Q and electric power input P values arelogged at different total heads, for the tested pumps C1, C2 andD1. From the measured data, fitting curves are obtained for the cen-trifugal and the positive displacement pumps. Table 2 gives theexperimental curve fitting coefficients a(h), b(h), c(h) and d(h) forvarious heads h, found for the pumps C1, C2 and D1. Examples ofQ–P curves are shown in Figs. 2–4 and the results concerning theRMSE and MBE indicators are given in Table 3. Good agreement be-tween experimental and calculated data is seen in Figs. 2–4. Thelow values of the RMSE and MBE validate the present model.
RMSE ¼Pn
i¼1ðCi �MiÞ2Pni¼1M2
i
" #0:5
� 100 ð2Þ
MBE ¼Pn
i¼1Mi�Ci
Mi
h in
24
35� 100 ð3Þ
nd C2.
Pump C2
�6 c(h) � 10�3 d(h) h (m) a(h) � 10�9 b(h) � 10�6 c(h) � 10�3 d(h)
9.640 �0.016 5 9.74 �23.57 18.680 �0.5628.330 0.017 10 7.83 �20.54 19.360 �1.730
12.100 �0.340 15 2.29 �9.95 13.650 �1.5718.054 �0.168 20 3.11 �10.52 14.050 �2.292
12.370 �0.527 25 2.92 �8.96 12.050 �2.22110.320 �0.491 30 �0.46 �1.78 7.549 �1.93510.470 �0.561 35 2.52 �7.76 10.860 �2.74312.380 �0.742 40 4.02 �11.08 13.060 �3.559
7.286 �0.415 45 3.80 �11.12 13.230 �3.86413.600 �0.982 50 0.38 �3.22 7.302 �2.755
7.511 �0.604 55 1.93 �6.84 10.020 �3.6725.455 �0.517 60 4.70 �14.71 17.240 �6.096
15.930 �1.513
) 8, 14, 22, 28 m and (b) 6, 12, 18, 26 m.

Fig. 3. Q–P characteristics C2 at heads: (a) 10, 15, 20, 25, 30 m and (b) 35, 40, 45, 50, 55, 60 m.
Fig. 4. Q–P curves for pump D1 at heads (a) 5, 15, 25, 35 m and (b) 45, 55, 65, 75, 80 m.
Table 3RMSE and MBE results for the displacement pump D1 and the centrifugal pumps C1 and C2.
Pump D1 Pump C1 Pump C2
h (m) RMSE (%) MBE (%) h (m) RMSE (%) MBE (%) h (m) RMSE (%) MBE (%)
5 7.22 �0.08 4 3.74 �0.05 5 3.86 �0.1510 7.57 0.06 6 2.97 �0.03 10 7.62 �0.7815 7.55 0.10 8 3.47 0.64 15 6.52 �0.5520 7.96 0.38 10 4.17 0.01 20 2.89 �0.1725 7.96 0.00 12 6.29 �0.17 25 5.41 �0.8130 6.95 0.05 14 4.14 �0.05 30 4.63 �0.2635 6.78 �0.06 16 5.37 0.72 35 5.60 �0.2140 3.16 �0.01 18 6.60 �0.01 40 6.02 �0.0245 5.16 �0.02 20 5.07 0.03 45 4.86 �0.3450 6.14 0.15 22 5.03 0.16 50 2.94 �0.0655 5.32 0.00 24 4.75 �0.14 55 7.17 �0.4960 4.46 0.04 26 6.65 0.12 60 7.12 1.4965 6.03 0.01 28 7.30 �0.1970 6.32 �0.0175 8.18 �0.4580 8.71 0.01
S. Ould-Amrouche et al. / Applied Energy 87 (2010) 3451–3459 3455
where n is the number of measurements, Ci the ith calculated valueand Mi the ith measured value.
6. Economic study
This section presents an analysis of the economic feasibility ofthe PV pumping system in comparison with systems using diesel
generators. The economic study consists of determining first thecapital cost for the PV system and diesel alternative and then cal-culating the life cycle costs. The life cycle cost uses a combinationof costs to measure the cost effectiveness of a specific pumpingsystem. The cost of the water unit pumped by PV and diesel sys-tems is used for comparison in three cases based on pumps C1,C2 and D1.

3456 S. Ould-Amrouche et al. / Applied Energy 87 (2010) 3451–3459
6.1. Estimation of the water pumping energy demand
The case study considers PV and diesel pumping facilities usingpumps C1, C2 and D1, assuming for the three systems that the totalhead is 20 m, an average daily working time ts equal to 7.5 h. Theaverage electrical input power Pa is supposed to be equal to250 W for pumps C1, and D1, and equal to 500 W for pump C2.The required electric energy Ea that is to be delivered by eitherthe PV or the diesel system is determined by:
Ea ¼ Pats ð4Þ
where Pa is the average electrical input power, ts is the averageworking time.
The necessary energy to be delivered by a PV generator takinginto account the mismatch factor is calculated as follows:
Epv ¼ FEa ð5Þ
where F is the mismatch factor.The peak power of the PV generator is given by:
Ppv ¼ EpvGEs
ð6Þ
where G is the peak solar radiation intensity (1 kW/m2), Es is the an-nual average of solar radiation on a horizontal surface (5.5 kW h/m2 day).
Table 4 presents the working parameters and the size of the PVarray for the three pumps C1, C2 and D1. The water flow Q is calcu-lated by Eq. (4) and the corresponding daily pumped water volumeV is given by:
V ¼ Qts ð7Þ
For C1, D1 and C2, the corresponding volumes of daily pumped waterat the specified conditions are respectively equal to about 5 m3,19 m3 and 11 m3. Assuming a daily demand of 40 l per person,the calculated pumped water will respectively satisfy the needs of125 persons, 275 persons and 475 persons.
6.2. Life cycle cost calculations
The LCC analysis uses a combination of the initial capital cost,operation, maintenance costs and replacement costs with the eco-
Table 4Working parameters.
Pump C1 D1 C2
Total head (m) 20 20 20Electric input power Pa (W) 250 250 500Electric daily input energy Ea (kW h) 1.88 1.88 3.75Photovoltaic daily energy Epv (kW h) 2.25 2.25 4.50PV array size (Wp) 409.10 409.10 818.2Water flow (m3/h) 0.71 1.43 2.49Water flow (m3/day) 5.29 10.73 18.69
Table 5Economic assumptions.
Pump C1 D1 C2
Discount rate (%) 10 10 10Interest rate (%) 5 5 5PV unit cost ($/Wp) 4.57 4.57 4.57Life time of PV generator (years) 20 20 20Life time of motor-pump subsystem (years) 8 8 8PV operating and maintenance cost (%) 2 2 2Life time of diesel generator (years) 8 8 8Diesel fuel cost ($/l) 0.19 0.19 0.19Diesel operating and maintenance cost (%) 10 10 10
nomic assumptions given in Table 5. The life cycle cost calculatesthe present worth of all expenses expected to occur over the lifecycle of the system by using the following equation [8]:
LCC ¼ C þM þ R ð8Þ
where C is the capital cost ($), M is the sum of all operation andmaintenance costs ($), R is the sum of all equipment replacementcosts ($).
6.2.1. LCC analysis of PV pumping systemThe initial capital cost of the PV pumping system can be calcu-
lated by adding up the costs of the PV components (modules, themotor-pump subsystem) and auxiliary costs. The auxiliary costsinclude the costs of the system engineering and planning, panelstructure, wiring and miscellaneous items. The engineering andplanning cost is assumed as 9% of the PV components cost. The pa-nel supporting structure cost is taken to be about 5% of the PVequipments cost. The wiring and other items cost is consideredto be 0.2% of the PV subsystems cost. The equipment costs pro-vided by local retailers are listed in Table 6 for the three systemsbased on pumps C1, C2 and D1. The total initial investment of thePV pumping system is calculated as follows:
C ¼ Cpv þ Csub þ Caux ð9Þ
where Cpv is the initial capital cost of the photovoltaic modules, Csub
is the initial capital cost of the motor-pump subsystem, Caux is theinitial auxiliary capital cost.
The maintenance cost is considered to be 2% of the total invest-ment costs. The lifetime of the PV modules is assumed to be20 years, so this period is chosen for the LCC analysis. The lifetimeof the motor-pump subsystems is assumed to be 8 years, due to thehard working conditions in the major parts of the country. Thesesubsystems should be replaced to match the lifetime of the PV gen-erator and their replacement costs must be considered. The totalinitial costs of the PV based pumping systems are presented by Ta-ble 6.
Normally, a life cycle analysis deals with totals of annual costsduring the life cycle period, but it is more convenient to deal withthe life cycle costs on an annual basis. The annualised life cyclecosts are calculated using the following formulas:
CRF ¼ d
1� ð1þ dÞ�T ð10Þ
PWF ¼ 1þ d1þ i
ð11Þ
Cy ¼ CPWF ð12ÞCk ¼ RkPWF ð13ÞRy ¼
Xk
Ck ð14Þ
Ay ¼ Cy þMy þ Ry ð15Þ
Table 6Total initial investment costs of the PV and diesel systems ($).
Pump C1 D1 C2
PVPV array size (Wp) 409.10 409.10 818.20Total cost of the modules 1869.50 1869.50 3739.10Cost of motor-pump subsystem 1400.00 1700.00 2000.00Support structure cost 163.48 178.48 286.95Cables cost 6.54 7.14 11.48Engineering and planning costs 294.26 321.26 516.42Total initial cost of PV system 3733.80 4076.40 6554.00
DieselRated power of diesel unit (kV A) 5.50 5.50 5.50Unit cost 1450.00 1450.00 1450.00Total initial cost of diesel pumping system 2850.00 3150.00 3450.00

Table 7Annuity and water cost calculations for the PV and diesel systems ($).
Pump C1 D1 C2
PVAnnualised capital cost 438.57 478.82 769.84Operation and maintenance cost 65.39 71.39 114.78Replacement cost 191.46 232.49 273.52Annualised life cycle cost for PV system 695.42 782.70 1158.10Water cost for PV system ($/m3) 0.36 0.20 0.17
DieselAnnualised capital cost 334.76 369.99 405.24Operation and maintenance cost 145.00 145.00 145.00Replacement cost 389.76 430.79 471.82Annual fuel cost 387.01 387.01 774.01Annualised life cycle cost for diesel system 1265.50 1332.80 1790.10Water cost for diesel system ($/m3) 0.65 0.34 0.26
Table 8Water produced by 1000 pumps of type C2 with an average working time of 5 h, aninput power of 950 W at different heads.
Head ha (m) Water flow Qa
(m3/h)Water production Qw
(106 m3/year)Water productionQw (%)a
10 4.8396 8.8323 0.664115 4.3859 8.0043 0.601820 4.2285 7.7170 0.580225 3.6435 6.6493 0.499930 3.2391 5.9114 0.444535 2.7305 4.9832 0.374740 2.2984 4.1945 0.315445 1.9310 3.5241 0.265050 1.5981 2.9166 0.219355 1.3234 2.4151 0.181660 1.0342 1.8874 0.1415
a Qw is expressed as a ratio of the PV pumped water to the withdrawals(1.33 � 109 m3) in 2000.
S. Ould-Amrouche et al. / Applied Energy 87 (2010) 3451–3459 3457
where CRF is the capital recovery factor, d is the discount rate = 10%,T is the lifetime period = 20 years, PWF is the present worth factor, iis the interest rate = 5%, Cy is the annualised capital cost, Ck is thepresent worth of replacement at year k, Rk is the cost of replacementof a system component at year k, Ry is the present worth of allreplacements incurred during the lifetime T, My is the yearly oper-ating and maintenance cost = 2% of initial capital cost C, Ay is annu-alised life cycle cost.
The annualised life cycle costs for PV pumping systems are gi-ven by Table 7.
6.2.2. LCC analysis of diesel pumping systemUsually, the diesel generators are oversized as compared to the
power needs of the water pumping systems [8]. In Algeria, theavailable diesel generators are rated at 5 kW or larger. This will re-sult in high investment cost, operating cost, maintenance andreplacement costs. These costs are added up to the diesel fuel costto calculate the total life cycle cost.
To produce the electric energy Ea determined by Eq. (4), it isnecessary to use a fuel volume Vd. This volume as calculated byEq. (16), depends on efficiency gd of the diesel generator and theheating value kd of the fuel. The heating value kd of the diesel is10.08 kW h/l, the average efficiency gd of various generators variesbetween 0.299 and 0.353 as reported by Ghosh, 2003 [20]. Thegenerator efficiency is taken as gd = 0.3.
Vd ¼Ea
gdkdð16Þ
where gd is the diesel generator energy conversion efficiency, kd isthe heating value of diesel.
The annual cost for diesel fuel consumption is found by:
Af ¼ 365FdVd ð17Þ
where Fd is the actual diesel price in Algeria (187 $/m3).For the diesel pumping system, the initial capital cost includes
the diesel generator and the motor-pump subsystem. The O&Msums up the annual fuel cost Af and the maintenance cost whichis assumed to be equal to 10% of the diesel generator cost. Replace-ments of the diesel generator and motor-pump subsystem are as-sumed to occur after equal lifetimes of 8 years. Tables 6 and 7present the total initial capital costs and annualised life cycle costsfor the diesel generator based pumping systems.
6.2.3. Pumped water costThe cost of m3 of the pumped water Cw by PV and diesel system
pumping systems is calculated, using the cost annuity methodbased on the LCC analysis by Eq. (18):
Cw ¼Ay
365Vð18Þ
where Ay is the annualised cost of the considered PV or dieselpumping system, V is the daily pumped water.
The water costs of the PV and diesel pumping system for thethree pumps C1, C2 and D1 are presented by Table 7. As expected,the calculated cost of initial investment for PV systems is higherthan the initial cost of systems based on diesel generators. Buton an annual basis, the PV systems are more economical than die-sel systems. The cost of water pumped by a photovoltaic system islower than that pumped by a facility based on a diesel generator.
7. Water pumping planning and evaluation of carbon dioxidereductions
The present model used in this paper may have various applica-tions. In this study, the model is used for water planning and car-bon dioxide savings prediction. The reduction of CO2 emissions isestimated in the case of photovoltaic pumping facilities are in-stalled instead of diesel pumping systems.
7.1. Water planning
For water planning, the available electrical power input is as-sumed to be known and the working conditions are specified (typeof pumps, pumping heads, average working time). Using Eq. (1)with the average values, the average water quantity is calculatedby
Qa ¼ aðhaÞP3a þ bðhaÞP2
a þ cðhaÞPa þ dðhaÞ ð19Þ
where Qa is the average water flow (m3/h), Pa is the average electri-cal power input to the motor-pump (W) and a(ha), b(ha), c(ha), d(ha)are coefficients corresponding to the working head ha.
The number N of pumps needed to deliver a fixed water volumeQw is simply expressed by:
N ¼ Q w
365Q atað20Þ
where N is the number of pumps, Qw is the average water produc-tion objective (m3/year) and ta is the average working time (h).
As an illustration, Table 8 presents the results of calculationscorresponding to 1000 C2 pumps, working 5 h/day with a powerinput of 950 W for each one. At each total head, the required

3458 S. Ould-Amrouche et al. / Applied Energy 87 (2010) 3451–3459
energy to cover between 0.14% and 0.66% of the Algerian drinkingwater consumption (in 2000), is approximately 4.8 MW h.
7.2. Evaluation of CO2 savings
The greenhouse gas emissions from Arab countries were986 million tons in 1999 [21]. The main component of these gasesis CO2 [21]. Electric energy in remote Algerian locations is usuallyproduced by the mean of diesel generators [22]. The carbon dioxideemissions are expected to increase due to population growth andeconomical development. To limit the CO2 emissions, it is neces-sary to encourage the development of water pumping systemspowered by photovoltaic energy. The method used in this workcompares between the PV water pumping systems with dieselbased generators water installations in Algerian remote locations.The calculation of the savings is carried out as follows.
First, the total electrical energy needed by N pumps in a PV sys-tem, is given by
Ew ¼ NPata ð21Þ
where EW is the total electrical energy (kW h), N is the number ofpumps, Pa is the average power input of a pump (W) and ta is theaverage working time of a pump (h).
The second step is to find the quantity of diesel fuel that is nec-essary to provide the same electric energy Ew by using Eq. (16). Inthe third step, the exhausts volume Vc of carbon dioxide is calcu-lated by the following relation:
Vc ¼ kcVd ð22Þ
where Vd is the consumption of the diesel fuel, kc = 2,63 kg/l is thecarbon dioxide weight equivalent for the diesel fuel [23].
By combining Eqs. (16) and (22), the volume of carbon dioxidereductions Vc is expressed as a function of the average pumppower, average working time and number of pumps, as follows:
Vc ¼kc
gdkdNPata ð23Þ
where Pa is the average power of a pump (W), ta is the averageworking time of a pump (h), gd is the diesel generator energy con-version efficiency and kd is the heating value of diesel.
In Algeria the total peak power of the installed pumping sys-tems is not precisely known. Nevertheless, according to the Minis-try of Energy and Mines, the reported peak power of the installedwater pumping sets is around 54 kW [24]. This correspondsapproximately to only 54 water pumps systems, showing thatmuch further developments may be achieved. Installing muchmore photovoltaic powered water sets is encouraged by the recentgovernmental policy in the domain of renewable energies. TheAlgerian government stated that 10% of the electric energy in2020 is to be provided by renewable energies sources [25]. Increas-ing the number of water pumping systems is an interesting way inorder to reach the above mentioned 20% objective. In this context,raising the peak power of installed PV water systems from 54 kWto 1 MW, corresponding to 1000 pumps of C2 type, is possibleand constitutes a reasonable goal. Not only this choice will satisfythe water demands in remote locations and improves the life ofisolated populations, but also alleviates the negative impact of die-sel sets-ups on the climate. For the case of 1000 pumps of type C2,working at the average conditions of a power input equal to 950 Wand during 5 h a day, as presented by Table 8, the carbon dioxideexhausts reductions are evaluated by Eq. (23) and attain theamount of 4.2 ton/year. This shows that larger amounts of carbongas emissions might be avoided by an extended application of PVsystems in the water pumping field.
8. Conclusion
There is a vast potential for the diffusion of the PV pumpingtechnology in Algeria, not only for drinking water applicationsbut for irrigation as well. The potential number of PV pumpingsystems is estimated at about 13,300 to provide 40 l/day per per-son to satisfy the drinking water demand of the 2.66 millioninhabitants living in the remote regions of Algeria. To help the dif-fusion of the PV pumping technology, a new motor-pump subsys-tem model is developed to allow the prediction of PV pumpinginstallation water output flow. The model expresses the waterflow output (Q) directly as a function of the electrical power input(P) of the motor-pump subsystem. The model is validated by com-paring the simulation results and the measurement data. TheRMSE error indicator for the tested pumps lies between about8.7% and 2.9% and the MBE indicator is between 0.01% and 1.5%,depending on the total head. The financial study conducted in thiswork using the LCC method show that although PV pumping sys-tems do have higher capital, they present the advantage of lowercosts on an annual basis as compared to diesel fuelled installa-tions. Moreover, for the studied small systems, the cost of thewater unit pumped by PV systems is lower than that pumpedusing diesel systems even with the actual subsidised diesel fuel.The water price for PV systems varies between 0.17 $/m3 and0.36 $/m3, it ranges from 0.26 $/m3 to 0.65 $/m3 for diesel sys-tems, depending on the technology and power range of the pump.The developed model can be easily used in various applicationssuch as planning of PV pumping systems and calculation of car-bon dioxide emission savings. The mitigation potential of CO2 in-duced by the use of PV pumping systems is estimated by a simplemethod. The calculations show that the use of 1000 PV systems,based on 1 kW pumps will avoid the emission of 4.2 ton of CO2
per year.
References
[1] L’irrigation en Afrique en chiffres: Enquête AQUASTAT-2005. <http://www.fao.org/nr/water/aquastat/countries/algeria/indexfra.stm> [accessed10.07.08].
[2] Kettab A. Les ressources en eau en Algérie: stratégies, enjeux et vision.Desalination 2001;136(1-3):26–33.
[3] Kadi A. La gestion de l’eau en Algérie. Hydrol Sci J 1997;42(2):191–7.[4] Bouzidi B, Haddadi M, Belmokhtar O. Assessment of a photovoltaic pumping
system in the areas of the Algerian Sahara. Renew Sustain Energy Rev2008;13(4):879–86.
[5] Odeh I, Yohanis YG, Norton B. Influence of pumping head, insolation and PVarray size on PV water pumping system performance. Solar Energy2006;80(1):51–64.
[6] Daud AK, Mahmoud MM. Solar powered induction motor-driven water pumpoperating on a desert well, simulation and field tests. Renew Energy2005;30(5):701–14.
[7] Badescu V. Time dependent model of a complex PV water pumping system.Renew Energy 2003;28(4):543–60.
[8] Ghoneim AA. Design optimization of photovoltaic powered water pumpingsystem. Energy Convers Manage 2006;47(11–12):1449–63.
[9] Hadj Arab A, Benghanem M, Chenlo F. Motor-pump system modelization.Renew Energy 2006;31(7):905–13.
[10] Amer EH, Younes MA. Estimating the monthly discharge of a photovoltaicwater pumping system: model verification. Energy Convers Manage2006;47(15–16):2092–102.
[11] Hamidat A, Benyoucef B. Mathematic models of photovoltaic motor-pumpsystems. Renew Energy 2008;33(5):933–42.
[12] Himri Y, Malik AS, Boudghene Stambouli A, Himri S, Draoui B. Review and useof the Algerian renewable energy for sustainable development. Renew SustainEnergy Rev 2009;13:1584–91.
[13] Kauter S. Solar electric power generation – photovoltaic energysystems. Berlin: Springer; 2006.
[14] Salameh Z, Taylor D. Set-up maximum power point tracker for photovoltaicarrays. Solar Energy 1990;44(1):57–61.
[15] Lalouni S, Rekioua D, Rekioua T, Matagne E. Fuzzy logic control of stand-alone photovoltaic system with battery storage. J Power Sour 2009;193(2):899–907.
[16] Meah K, Fletcher S, Ula S. Solar photovoltaic water pumping for remotelocations. Renew Sustain Energy Rev 2008;12(2):472–87.

S. Ould-Amrouche et al. / Applied Energy 87 (2010) 3451–3459 3459
[17] Vongmanee V. The vector control inverter for a PV motor drive systemimplemented by a single chip DSP controller ADMC331. In: Proceedings of IEEEAsia Pacific conference on circuits and systems; 2002. p. 447–51.
[18] Betka A, Moussi A. Performance optimization of a photovoltaic inductionmotor pumping system. Renew Energy 2004;29(14):2167–81.
[19] Idjdarene K, Rekioua D, Rekioua T, Tounzi A. Vector control of autonomousinduction generator taking saturation effect into account. Energy ConversManage 2008;49(10):2609–17.
[20] Ghosh PC, Emonts B, Stolten D. Comparison of hydrogen storage with diesel-generator system in a PV–WEC hybrid system. Solar Energy2003;75(3):187–98.
[21] Chedid R, Chaaban F. Renewable-energy developments in Arab countries: aregional perspective. Appl Energy 2003;74(1-2):211–20.
[22] Saheb-Koussa D, Haddadi M, Belhamel M. Economic and technical study of ahybrid system (wind-photovoltaic-diesel) for rural electrification in Algeria.Appl Energy 2009;86(7-8):1024–30.
[23] Department for Environment, Food and Rural Affairs. Guidelines for companyreporting on greenhouse gas emissions, annexe 1: fuel conversion factors.<http://www.defra.gov.uk/environment/business/envrp/pdf/envrpgas-annexes.pdf> [accessed 15.07.08].
[24] Ministère de l’Energie et des Mines. Bilan général des réalisations. <http://www.mem-algeria.org/fr/enr/energiesolaire/Bilan_generale.htm> [accessed05.05.09].
[25] Boudghene SA. Overview and perspectives of the Algerian renewable energyprogram. In: Proceedings of Colloque National sur l’Energie Solaire CNESOL 06,Bejaia, Algeria; 2006. p. 93–9.
Copyright © 2022 FDOKUMEN