Valproic acid confers functional pluripotency to human amniotic fluid stem cells in a transgene-free...
15
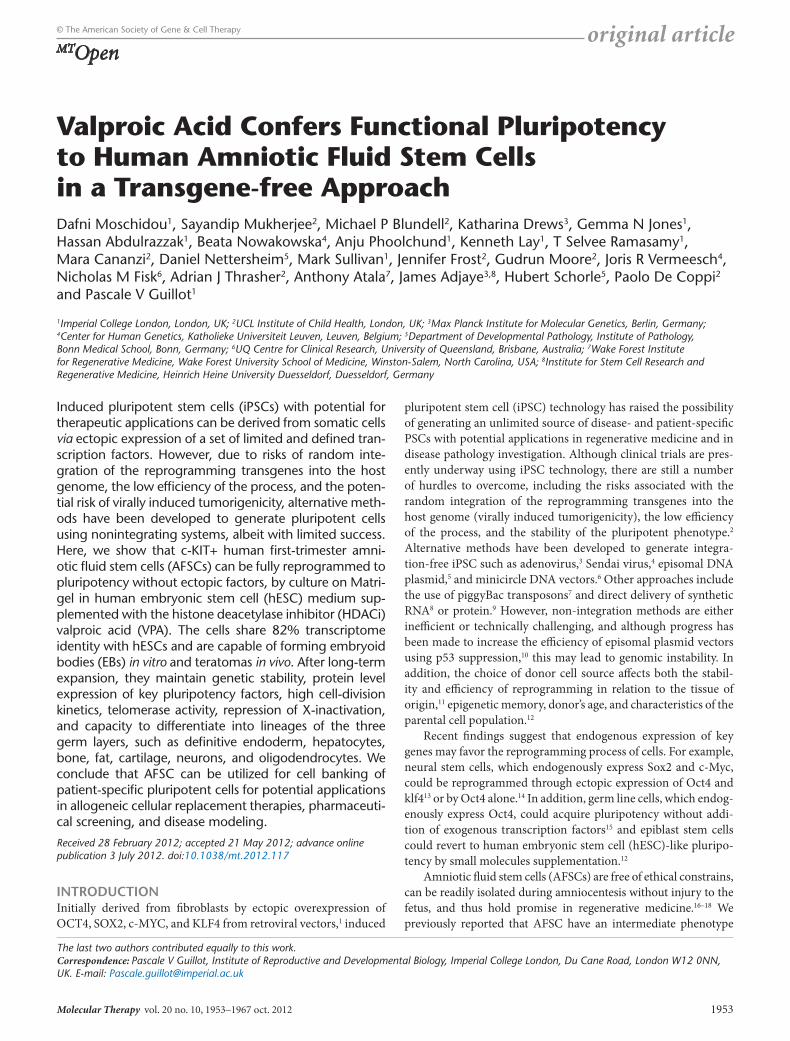
original article © The American Society of Gene & Cell Therapy Molecular Therapy vol. 20 no. 10, 1953–1967 oct. 2012 1953 Induced pluripotent stem cells (iPSCs) with potential for therapeutic applications can be derived from somatic cells via ectopic expression of a set of limited and defined tran- scription factors. However, due to risks of random inte- gration of the reprogramming transgenes into the host genome, the low efficiency of the process, and the poten- tial risk of virally induced tumorigenicity, alternative meth- ods have been developed to generate pluripotent cells using nonintegrating systems, albeit with limited success. Here, we show that c-KIT+ human first-trimester amni- otic fluid stem cells (AFSCs) can be fully reprogrammed to pluripotency without ectopic factors, by culture on Matri- gel in human embryonic stem cell (hESC) medium sup- plemented with the histone deacetylase inhibitor (HDACi) valproic acid (VPA). The cells share 82% transcriptome identity with hESCs and are capable of forming embryoid bodies (EBs) in vitro and teratomas in vivo. After long-term expansion, they maintain genetic stability, protein level expression of key pluripotency factors, high cell-division kinetics, telomerase activity, repression of X-inactivation, and capacity to differentiate into lineages of the three germ layers, such as definitive endoderm, hepatocytes, bone, fat, cartilage, neurons, and oligodendrocytes. We conclude that AFSC can be utilized for cell banking of patient-specific pluripotent cells for potential applications in allogeneic cellular replacement therapies, pharmaceuti- cal screening, and disease modeling. Received 28 February 2012; accepted 21 May 2012; advance online publication 3 July 2012. doi:10.1038/mt.2012.117 INTRODUCTION Initially derived from fibroblasts by ectopic overexpression of OCT4, SOX2, c-MYC, and KLF4 from retroviral vectors, 1 induced pluripotent stem cell (iPSC) technology has raised the possibility of generating an unlimited source of disease- and patient-specific PSCs with potential applications in regenerative medicine and in disease pathology investigation. Although clinical trials are pres- ently underway using iPSC technology, there are still a number of hurdles to overcome, including the risks associated with the random integration of the reprogramming transgenes into the host genome (virally induced tumorigenicity), the low efficiency of the process, and the stability of the pluripotent phenotype. 2 Alternative methods have been developed to generate integra- tion-free iPSC such as adenovirus, 3 Sendai virus, 4 episomal DNA plasmid, 5 and minicircle DNA vectors. 6 Other approaches include the use of piggyBac transposons 7 and direct delivery of synthetic RNA 8 or protein. 9 However, non-integration methods are either inefficient or technically challenging, and although progress has been made to increase the efficiency of episomal plasmid vectors using p53 suppression, 10 this may lead to genomic instability. In addition, the choice of donor cell source affects both the stabil- ity and efficiency of reprogramming in relation to the tissue of origin, 11 epigenetic memory, donor’s age, and characteristics of the parental cell population. 12 Recent findings suggest that endogenous expression of key genes may favor the reprogramming process of cells. For example, neural stem cells, which endogenously express Sox2 and c-Myc, could be reprogrammed through ectopic expression of Oct4 and klf4 13 or by Oct4 alone. 14 In addition, germ line cells, which endog- enously express Oct4, could acquire pluripotency without addi- tion of exogenous transcription factors 15 and epiblast stem cells could revert to human embryonic stem cell (hESC)-like pluripo- tency by small molecules supplementation. 12 Amniotic fluid stem cells (AFSCs) are free of ethical constrains, can be readily isolated during amniocentesis without injury to the fetus, and thus hold promise in regenerative medicine. 16–18 We previously reported that AFSC have an intermediate phenotype The last two authors contributed equally to this work. Correspondence: Pascale V Guillot, Institute of Reproductive and Developmental Biology, Imperial College London, Du Cane Road, London W12 0NN, UK. E-mail: [email protected] Valproic Acid Confers Functional Pluripotency to Human Amniotic Fluid Stem Cells in a Transgene-free Approach Dafni Moschidou 1 , Sayandip Mukherjee 2 , Michael P Blundell 2 , Katharina Drews 3 , Gemma N Jones 1 , Hassan Abdulrazzak 1 , Beata Nowakowska 4 , Anju Phoolchund 1 , Kenneth Lay 1 , T Selvee Ramasamy 1 , Mara Cananzi 2 , Daniel Nettersheim 5 , Mark Sullivan 1 , Jennifer Frost 2 , Gudrun Moore 2 , Joris R Vermeesch 4 , Nicholas M Fisk 6 , Adrian J Thrasher 2 , Anthony Atala 7 , James Adjaye 3,8 , Hubert Schorle 5 , Paolo De Coppi 2 and Pascale V Guillot 1 1 Imperial College London, London, UK; 2 UCL Institute of Child Health, London, UK; 3 Max Planck Institute for Molecular Genetics, Berlin, Germany; 4 Center for Human Genetics, Katholieke Universiteit Leuven, Leuven, Belgium; 5 Department of Developmental Pathology, Institute of Pathology, Bonn Medical School, Bonn, Germany; 6 UQ Centre for Clinical Research, University of Queensland, Brisbane, Australia; 7 Wake Forest Institute for Regenerative Medicine, Wake Forest University School of Medicine, Winston-Salem, North Carolina, USA; 8 Institute for Stem Cell Research and Regenerative Medicine, Heinrich Heine University Duesseldorf, Duesseldorf, Germany MT Open
Transcript of Valproic acid confers functional pluripotency to human amniotic fluid stem cells in a transgene-free...
original article© The American Society of Gene & Cell Therapy
Molecular Therapy vol. 20 no. 10, 1953–1967 oct. 2012 1953
Induced pluripotent stem cells (iPSCs) with potential for therapeutic applications can be derived from somatic cells via ectopic expression of a set of limited and defined tran-scription factors. However, due to risks of random inte-gration of the reprogramming transgenes into the host genome, the low efficiency of the process, and the poten-tial risk of virally induced tumorigenicity, alternative meth-ods have been developed to generate pluripotent cells using nonintegrating systems, albeit with limited success. Here, we show that c-KIT+ human first-trimester amni-otic fluid stem cells (AFSCs) can be fully reprogrammed to pluripotency without ectopic factors, by culture on Matri-gel in human embryonic stem cell (hESC) medium sup-plemented with the histone deacetylase inhibitor (HDACi) valproic acid (VPA). The cells share 82% transcriptome identity with hESCs and are capable of forming embryoid bodies (EBs) in vitro and teratomas in vivo. After long-term expansion, they maintain genetic stability, protein level expression of key pluripotency factors, high cell-division kinetics, telomerase activity, repression of X-inactivation, and capacity to differentiate into lineages of the three germ layers, such as definitive endoderm, hepatocytes, bone, fat, cartilage, neurons, and oligodendrocytes. We conclude that AFSC can be utilized for cell banking of patient-specific pluripotent cells for potential applications in allogeneic cellular replacement therapies, pharmaceuti-cal screening, and disease modeling.
Received 28 February 2012; accepted 21 May 2012; advance online publication 3 July 2012. doi:10.1038/mt.2012.117
IntroductIonInitially derived from fibroblasts by ectopic overexpression of OCT4, SOX2, c-MYC, and KLF4 from retroviral vectors,1 induced
pluripotent stem cell (iPSC) technology has raised the possibility of generating an unlimited source of disease- and patient-specific PSCs with potential applications in regenerative medicine and in disease pathology investigation. Although clinical trials are pres-ently underway using iPSC technology, there are still a number of hurdles to overcome, including the risks associated with the random integration of the reprogramming transgenes into the host genome (virally induced tumorigenicity), the low efficiency of the process, and the stability of the pluripotent phenotype.2 Alternative methods have been developed to generate integra-tion-free iPSC such as adenovirus,3 Sendai virus,4 episomal DNA plasmid,5 and minicircle DNA vectors.6 Other approaches include the use of piggyBac transposons7 and direct delivery of synthetic RNA8 or protein.9 However, non-integration methods are either inefficient or technically challenging, and although progress has been made to increase the efficiency of episomal plasmid vectors using p53 suppression,10 this may lead to genomic instability. In addition, the choice of donor cell source affects both the stabil-ity and efficiency of reprogramming in relation to the tissue of origin,11 epigenetic memory, donor’s age, and characteristics of the parental cell population.12
Recent findings suggest that endogenous expression of key genes may favor the reprogramming process of cells. For example, neural stem cells, which endogenously express Sox2 and c-Myc, could be reprogrammed through ectopic expression of Oct4 and klf413 or by Oct4 alone.14 In addition, germ line cells, which endog-enously express Oct4, could acquire pluripotency without addi-tion of exogenous transcription factors15 and epiblast stem cells could revert to human embryonic stem cell (hESC)-like pluripo-tency by small molecules supplementation.12
Amniotic fluid stem cells (AFSCs) are free of ethical constrains, can be readily isolated during amniocentesis without injury to the fetus, and thus hold promise in regenerative medicine.16–18 We previously reported that AFSC have an intermediate phenotype
The last two authors contributed equally to this work.Correspondence: Pascale V Guillot, Institute of Reproductive and Developmental Biology, Imperial College London, Du Cane Road, London W12 0NN, UK. E-mail: [email protected]
Valproic Acid Confers Functional Pluripotency to Human Amniotic Fluid Stem Cells in a Transgene-free ApproachDafni Moschidou1, Sayandip Mukherjee2, Michael P Blundell2, Katharina Drews3, Gemma N Jones1, Hassan Abdulrazzak1, Beata Nowakowska4, Anju Phoolchund1, Kenneth Lay1, T Selvee Ramasamy1, Mara Cananzi2, Daniel Nettersheim5, Mark Sullivan1, Jennifer Frost2, Gudrun Moore2, Joris R Vermeesch4, Nicholas M Fisk6, Adrian J Thrasher2, Anthony Atala7, James Adjaye3,8, Hubert Schorle5, Paolo De Coppi2 and Pascale V Guillot1
1Imperial College London, London, UK; 2UCL Institute of Child Health, London, UK; 3Max Planck Institute for Molecular Genetics, Berlin, Germany; 4Center for Human Genetics, Katholieke Universiteit Leuven, Leuven, Belgium; 5Department of Developmental Pathology, Institute of Pathology, Bonn Medical School, Bonn, Germany; 6UQ Centre for Clinical Research, University of Queensland, Brisbane, Australia; 7Wake Forest Institute for Regenerative Medicine, Wake Forest University School of Medicine, Winston-Salem, North Carolina, USA; 8Institute for Stem Cell Research and Regenerative Medicine, Heinrich Heine University Duesseldorf, Duesseldorf, Germany
MTOpen
1954 www.moleculartherapy.org vol. 20 no. 10 oct. 2012
© The American Society of Gene & Cell TherapyPluripotency State of Amniotic Fluid Stem Cells
between hESC and adult stem cells but are not pluripotent, although they can differentiate into non-mesodermal lineages.18 Here, we show for the first time that functional pluripotent human first-trimester AFSC which express OCT4, SOX2, KLF4, c-MYC, and hESC-specific surface antigens, can be generated without ectopic reprogramming factors by culture on Matrigel in hESC medium supplemented with the histone deacetylase inhibitor (HDACi) val-proic acid (VPA). Together, our data show that AFSC can be used to generate patient-specific pluripotent cells for use in regenerative medicine, pharmaceutical screening, and in disease modeling.
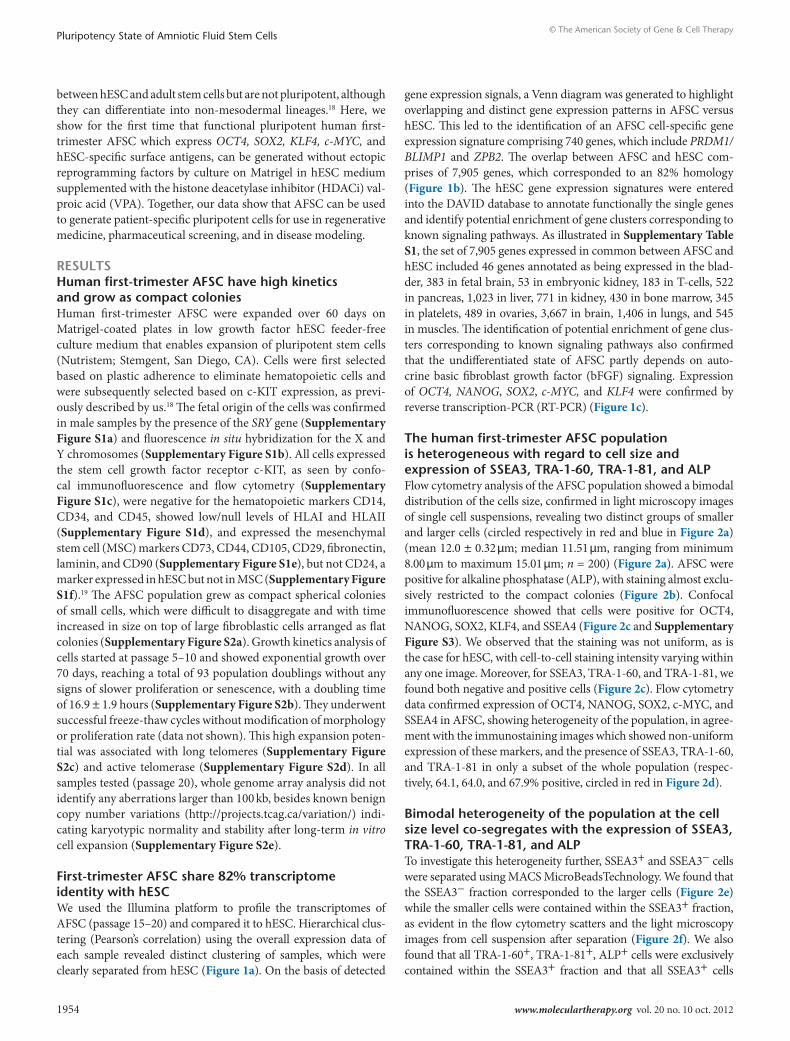
resultsHuman first-trimester AFsc have high kinetics and grow as compact coloniesHuman first-trimester AFSC were expanded over 60 days on Matrigel-coated plates in low growth factor hESC feeder-free culture medium that enables expansion of pluripotent stem cells (Nutristem; Stemgent, San Diego, CA). Cells were first selected based on plastic adherence to eliminate hematopoietic cells and were subsequently selected based on c-KIT expression, as previ-ously described by us.18 The fetal origin of the cells was confirmed in male samples by the presence of the SRY gene (Supplementary Figure S1a) and fluorescence in situ hybridization for the X and Y chromosomes (Supplementary Figure S1b). All cells expressed the stem cell growth factor receptor c-KIT, as seen by confo-cal immunofluorescence and flow cytometry (Supplementary Figure S1c), were negative for the hematopoietic markers CD14, CD34, and CD45, showed low/null levels of HLAI and HLAII (Supplementary Figure S1d), and expressed the mesenchymal stem cell (MSC) markers CD73, CD44, CD105, CD29, fibronectin, laminin, and CD90 (Supplementary Figure S1e), but not CD24, a marker expressed in hESC but not in MSC (Supplementary Figure S1f).19 The AFSC population grew as compact spherical colonies of small cells, which were difficult to disaggregate and with time increased in size on top of large fibroblastic cells arranged as flat colonies (Supplementary Figure S2a). Growth kinetics analysis of cells started at passage 5–10 and showed exponential growth over 70 days, reaching a total of 93 population doublings without any signs of slower proliferation or senescence, with a doubling time of 16.9 ± 1.9 hours (Supplementary Figure S2b). They underwent successful freeze-thaw cycles without modification of morphology or proliferation rate (data not shown). This high expansion poten-tial was associated with long telomeres (Supplementary Figure S2c) and active telomerase (Supplementary Figure S2d). In all samples tested (passage 20), whole genome array analysis did not identify any aberrations larger than 100 kb, besides known benign copy number variations (http://projects.tcag.ca/variation/) indi-cating karyotypic normality and stability after long-term in vitro cell expansion (Supplementary Figure S2e).
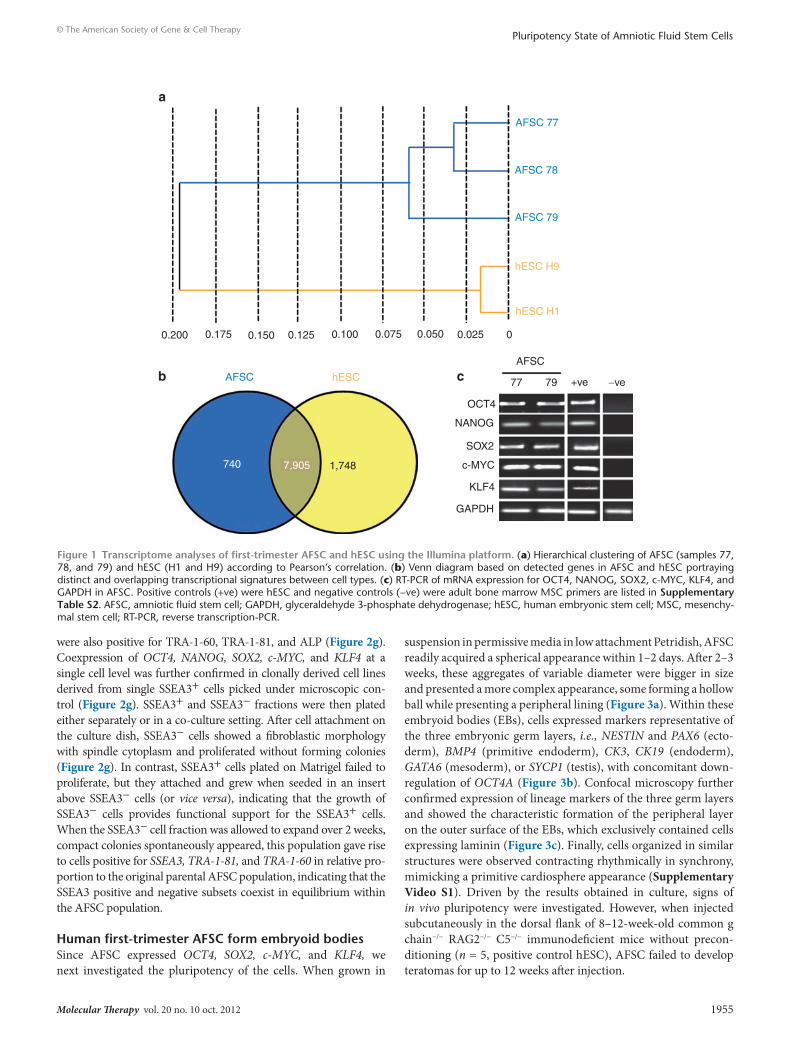
First-trimester AFsc share 82% transcriptome identity with hescWe used the Illumina platform to profile the transcriptomes of AFSC (passage 15–20) and compared it to hESC. Hierarchical clus-tering (Pearson’s correlation) using the overall expression data of each sample revealed distinct clustering of samples, which were clearly separated from hESC (Figure 1a). On the basis of detected
gene expression signals, a Venn diagram was generated to highlight overlapping and distinct gene expression patterns in AFSC versus hESC. This led to the identification of an AFSC cell-specific gene expression signature comprising 740 genes, which include PRDM1/BLIMP1 and ZPB2. The overlap between AFSC and hESC com-prises of 7,905 genes, which corresponded to an 82% homology (Figure 1b). The hESC gene expression signatures were entered into the DAVID database to annotate functionally the single genes and identify potential enrichment of gene clusters corresponding to known signaling pathways. As illustrated in Supplementary Table S1, the set of 7,905 genes expressed in common between AFSC and hESC included 46 genes annotated as being expressed in the blad-der, 383 in fetal brain, 53 in embryonic kidney, 183 in T-cells, 522 in pancreas, 1,023 in liver, 771 in kidney, 430 in bone marrow, 345 in platelets, 489 in ovaries, 3,667 in brain, 1,406 in lungs, and 545 in muscles. The identification of potential enrichment of gene clus-ters corresponding to known signaling pathways also confirmed that the undifferentiated state of AFSC partly depends on auto-crine basic fibroblast growth factor (bFGF) signaling. Expression of OCT4, NANOG, SOX2, c-MYC, and KLF4 were confirmed by reverse transcription-PCR (RT-PCR) (Figure 1c).
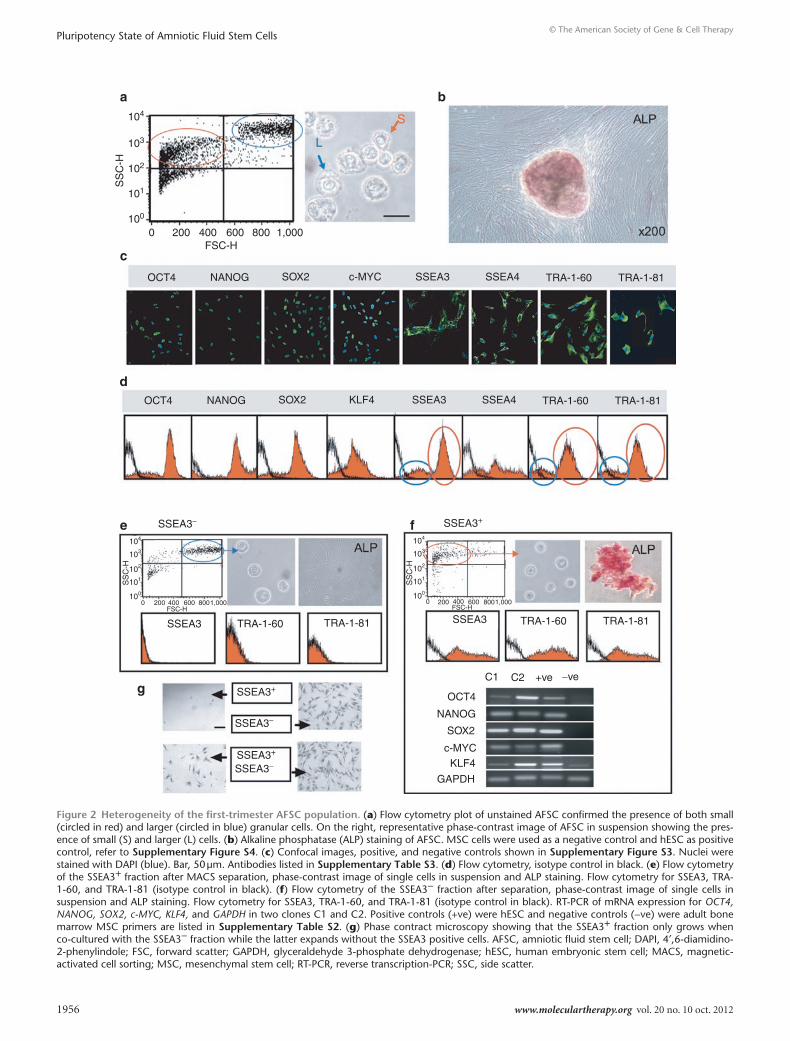
the human first-trimester AFsc population is heterogeneous with regard to cell size and expression of sseA3, trA-1-60, trA-1-81, and AlPFlow cytometry analysis of the AFSC population showed a bimodal distribution of the cells size, confirmed in light microscopy images of single cell suspensions, revealing two distinct groups of smaller and larger cells (circled respectively in red and blue in Figure 2a) (mean 12.0 ± 0.32 μm; median 11.51 μm, ranging from minimum 8.00 μm to maximum 15.01 μm; n = 200) (Figure 2a). AFSC were positive for alkaline phosphatase (ALP), with staining almost exclu-sively restricted to the compact colonies (Figure 2b). Confocal immunofluorescence showed that cells were positive for OCT4, NANOG, SOX2, KLF4, and SSEA4 (Figure 2c and Supplementary Figure S3). We observed that the staining was not uniform, as is the case for hESC, with cell-to-cell staining intensity varying within any one image. Moreover, for SSEA3, TRA-1-60, and TRA-1-81, we found both negative and positive cells (Figure 2c). Flow cytometry data confirmed expression of OCT4, NANOG, SOX2, c-MYC, and SSEA4 in AFSC, showing heterogeneity of the population, in agree-ment with the immunostaining images which showed non-uniform expression of these markers, and the presence of SSEA3, TRA-1-60, and TRA-1-81 in only a subset of the whole population (respec-tively, 64.1, 64.0, and 67.9% positive, circled in red in Figure 2d).
Bimodal heterogeneity of the population at the cell size level co-segregates with the expression of sseA3, trA-1-60, trA-1-81, and AlPTo investigate this heterogeneity further, SSEA3+ and SSEA3− cells were separated using MACS MicroBeadsTechnology. We found that the SSEA3− fraction corresponded to the larger cells (Figure 2e) while the smaller cells were contained within the SSEA3+ fraction, as evident in the flow cytometry scatters and the light microscopy images from cell suspension after separation (Figure 2f). We also found that all TRA-1-60+, TRA-1-81+, ALP+ cells were exclusively contained within the SSEA3+ fraction and that all SSEA3+ cells
Molecular Therapy vol. 20 no. 10 oct. 2012 1955
© The American Society of Gene & Cell TherapyPluripotency State of Amniotic Fluid Stem Cells
were also positive for TRA-1-60, TRA-1-81, and ALP (Figure 2g). Coexpression of OCT4, NANOG, SOX2, c-MYC, and KLF4 at a single cell level was further confirmed in clonally derived cell lines derived from single SSEA3+ cells picked under microscopic con-trol (Figure 2g). SSEA3+ and SSEA3− fractions were then plated either separately or in a co-culture setting. After cell attachment on the culture dish, SSEA3− cells showed a fibroblastic morphology with spindle cytoplasm and proliferated without forming colonies (Figure 2g). In contrast, SSEA3+ cells plated on Matrigel failed to proliferate, but they attached and grew when seeded in an insert above SSEA3− cells (or vice versa), indicating that the growth of SSEA3− cells provides functional support for the SSEA3+ cells. When the SSEA3− cell fraction was allowed to expand over 2 weeks, compact colonies spontaneously appeared, this population gave rise to cells positive for SSEA3, TRA-1-81, and TRA-1-60 in relative pro-portion to the original parental AFSC population, indicating that the SSEA3 positive and negative subsets coexist in equilibrium within the AFSC population.
Human first-trimester AFsc form embryoid bodiesSince AFSC expressed OCT4, SOX2, c-MYC, and KLF4, we next investigated the pluripotency of the cells. When grown in
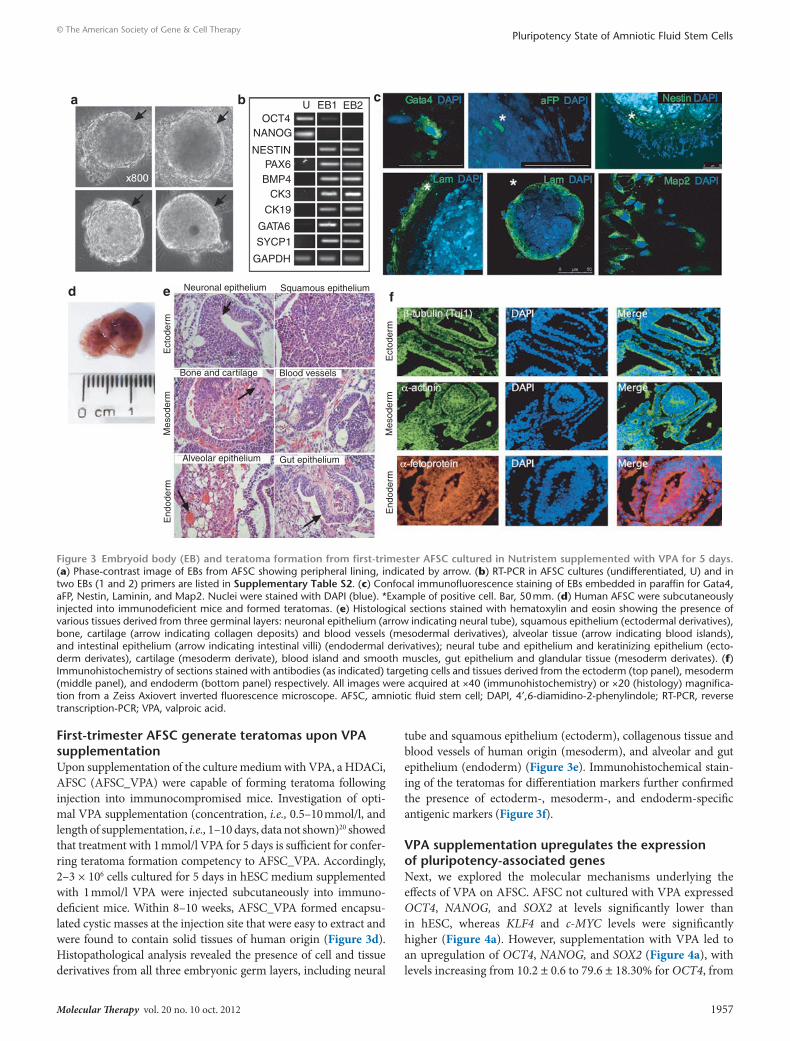
suspension in permissive media in low attachment Petridish, AFSC readily acquired a spherical appearance within 1–2 days. After 2–3 weeks, these aggregates of variable diameter were bigger in size and presented a more complex appearance, some forming a hollow ball while presenting a peripheral lining (Figure 3a). Within these embryoid bodies (EBs), cells expressed markers representative of the three embryonic germ layers, i.e., NESTIN and PAX6 (ecto-derm), BMP4 (primitive endoderm), CK3, CK19 (endoderm), GATA6 (mesoderm), or SYCP1 (testis), with concomitant down-regulation of OCT4A (Figure 3b). Confocal microscopy further confirmed expression of lineage markers of the three germ layers and showed the characteristic formation of the peripheral layer on the outer surface of the EBs, which exclusively contained cells expressing laminin (Figure 3c). Finally, cells organized in similar structures were observed contracting rhythmically in synchrony, mimicking a primitive cardiosphere appearance (Supplementary Video S1). Driven by the results obtained in culture, signs of in vivo pluripotency were investigated. However, when injected subcutaneously in the dorsal flank of 8–12-week-old common g chain−/− RAG2−/− C5−/− immunodeficient mice without precon-ditioning (n = 5, positive control hESC), AFSC failed to develop teratomas for up to 12 weeks after injection.
0.200
a
b c
0.175 0.150 0.125 0.100 0.075 0.050 0.025 0
AFSC
77
OCT4
1,7487,905740
NANOG
SOX2
c-MYC
KLF4
GAPDH
79 +ve −ve
hESC H1
hESC
hESC H9
AFSC 79
AFSC
AFSC 78
AFSC 77
Figure 1 transcriptome analyses of first-trimester AFsc and hesc using the Illumina platform. (a) Hierarchical clustering of AFSC (samples 77, 78, and 79) and hESC (H1 and H9) according to Pearson’s correlation. (b) Venn diagram based on detected genes in AFSC and hESC portraying distinct and overlapping transcriptional signatures between cell types. (c) RT-PCR of mRNA expression for OCT4, NANOG, SOX2, c-MYC, KLF4, and GAPDH in AFSC. Positive controls (+ve) were hESC and negative controls (−ve) were adult bone marrow MSC primers are listed in supplementary table s2. AFSC, amniotic fluid stem cell; GAPDH, glyceraldehyde 3-phosphate dehydrogenase; hESC, human embryonic stem cell; MSC, mesenchy-mal stem cell; RT-PCR, reverse transcription-PCR.
1956 www.moleculartherapy.org vol. 20 no. 10 oct. 2012
© The American Society of Gene & Cell TherapyPluripotency State of Amniotic Fluid Stem Cells
104
103
102
SS
C-H
101
100
0
a
c
d
e
g
f
b
400200 600 800 1,000FSC-H
104
103
102
101
100
SS
C-H
0 200 400 600 8001,000FSC-H
104
103
102
101
100
SS
C-H
0 200 400 600 8001,000FSC-H
OCT4 NANOG SOX2 c-MYC SSEA3 SSEA4 TRA-1-60 TRA-1-81
OCT4
SSEA3−
SSEA3 TRA-1-60 TRA-1-81 SSEA3
C1
OCT4
NANOG
SOX2
c-MYCKLF4
GAPDH
C2 +ve −ve
TRA-1-60 TRA-1-81
SSEA3+
SSEA3+
SSEA3+
SSEA3−
SSEA3−
NANOG SOX2 KLF4 SSEA3 SSEA4 TRA-1-60 TRA-1-81
Figure 2 Heterogeneity of the first-trimester AFsc population. (a) Flow cytometry plot of unstained AFSC confirmed the presence of both small (circled in red) and larger (circled in blue) granular cells. On the right, representative phase-contrast image of AFSC in suspension showing the pres-ence of small (S) and larger (L) cells. (b) Alkaline phosphatase (ALP) staining of AFSC. MSC cells were used as a negative control and hESC as positive control, refer to supplementary Figure s4. (c) Confocal images, positive, and negative controls shown in supplementary Figure s3. Nuclei were stained with DAPI (blue). Bar, 50 μm. Antibodies listed in supplementary table s3. (d) Flow cytometry, isotype control in black. (e) Flow cytometry of the SSEA3+ fraction after MACS separation, phase-contrast image of single cells in suspension and ALP staining. Flow cytometry for SSEA3, TRA-1-60, and TRA-1-81 (isotype control in black). (f) Flow cytometry of the SSEA3− fraction after separation, phase-contrast image of single cells in suspension and ALP staining. Flow cytometry for SSEA3, TRA-1-60, and TRA-1-81 (isotype control in black). RT-PCR of mRNA expression for OCT4, NANOG, SOX2, c-MYC, KLF4, and GAPDH in two clones C1 and C2. Positive controls (+ve) were hESC and negative controls (−ve) were adult bone marrow MSC primers are listed in supplementary table s2. (g) Phase contract microscopy showing that the SSEA3+ fraction only grows when co-cultured with the SSEA3− fraction while the latter expands without the SSEA3 positive cells. AFSC, amniotic fluid stem cell; DAPI, 4′,6-diamidino-2-phenylindole; FSC, forward scatter; GAPDH, glyceraldehyde 3-phosphate dehydrogenase; hESC, human embryonic stem cell; MACS, magnetic-activated cell sorting; MSC, mesenchymal stem cell; RT-PCR, reverse transcription-PCR; SSC, side scatter.
Molecular Therapy vol. 20 no. 10 oct. 2012 1957
© The American Society of Gene & Cell TherapyPluripotency State of Amniotic Fluid Stem Cells
First-trimester AFsc generate teratomas upon VPA supplementationUpon supplementation of the culture medium with VPA, a HDACi, AFSC (AFSC_VPA) were capable of forming teratoma following injection into immunocompromised mice. Investigation of opti-mal VPA supplementation (concentration, i.e., 0.5–10 mmol/l, and length of supplementation, i.e., 1–10 days, data not shown)20 showed that treatment with 1 mmol/l VPA for 5 days is sufficient for confer-ring teratoma formation competency to AFSC_VPA. Accordingly, 2–3 × 10⁶ cells cultured for 5 days in hESC medium supplemented with 1 mmol/l VPA were injected subcutaneously into immuno-deficient mice. Within 8–10 weeks, AFSC_VPA formed encapsu-lated cystic masses at the injection site that were easy to extract and were found to contain solid tissues of human origin (Figure 3d). Histopathological analysis revealed the presence of cell and tissue derivatives from all three embryonic germ layers, including neural
tube and squamous epithelium (ectoderm), collagenous tissue and blood vessels of human origin (mesoderm), and alveolar and gut epithelium (endoderm) (Figure 3e). Immunohistochemical stain-ing of the teratomas for differentiation markers further confirmed the presence of ectoderm-, mesoderm-, and endoderm-specific antigenic markers (Figure 3f).
VPA supplementation upregulates the expression of pluripotency-associated genesNext, we explored the molecular mechanisms underlying the effects of VPA on AFSC. AFSC not cultured with VPA expressed OCT4, NANOG, and SOX2 at levels significantly lower than in hESC, whereas KLF4 and c-MYC levels were significantly higher (Figure 4a). However, supplementation with VPA led to an upregulation of OCT4, NANOG, and SOX2 (Figure 4a), with levels increasing from 10.2 ± 0.6 to 79.6 ± 18.30% for OCT4, from
OCT4U EB1 EB2
NANOG
NESTINPAX6BMP4
CK3
CK19
GATA6
SYCP1
GAPDH
Neuronal epithelium
Ect
oder
mM
esod
erm
End
oder
m
Ect
oder
mM
esod
erm
End
oder
m
Squamous epithelium
Gut epitheliumAlveolar epithelium
Blood vesselsBone and cartilage
a b c
fed
Figure 3 embryoid body (eB) and teratoma formation from first-trimester AFsc cultured in nutristem supplemented with VPA for 5 days. (a) Phase-contrast image of EBs from AFSC showing peripheral lining, indicated by arrow. (b) RT-PCR in AFSC cultures (undifferentiated, U) and in two EBs (1 and 2) primers are listed in supplementary table s2. (c) Confocal immunofluorescence staining of EBs embedded in paraffin for Gata4, aFP, Nestin, Laminin, and Map2. Nuclei were stained with DAPI (blue). *Example of positive cell. Bar, 50 mm. (d) Human AFSC were subcutaneously injected into immunodeficient mice and formed teratomas. (e) Histological sections stained with hematoxylin and eosin showing the presence of various tissues derived from three germinal layers: neuronal epithelium (arrow indicating neural tube), squamous epithelium (ectodermal derivatives), bone, cartilage (arrow indicating collagen deposits) and blood vessels (mesodermal derivatives), alveolar tissue (arrow indicating blood islands), and intestinal epithelium (arrow indicating intestinal villi) (endodermal derivatives); neural tube and epithelium and keratinizing epithelium (ecto-derm derivates), cartilage (mesoderm derivate), blood island and smooth muscles, gut epithelium and glandular tissue (mesoderm derivates). (f) Immunohistochemistry of sections stained with antibodies (as indicated) targeting cells and tissues derived from the ectoderm (top panel), mesoderm (middle panel), and endoderm (bottom panel) respectively. All images were acquired at ×40 (immunohistochemistry) or ×20 (histology) magnifica-tion from a Zeiss Axiovert inverted fluorescence microscope. AFSC, amniotic fluid stem cell; DAPI, 4′,6-diamidino-2-phenylindole; RT-PCR, reverse transcription-PCR; VPA, valproic acid.

1958 www.moleculartherapy.org vol. 20 no. 10 oct. 2012
© The American Society of Gene & Cell TherapyPluripotency State of Amniotic Fluid Stem Cells
12.2 ± 1.2 to 85.3 ± 5.3% for NANOG, and from 55 ± 8.2 to 164 ± 22.3% for SOX2, whereas KLF4 increased from 360 ± 19.5 to 705.4 ± 16.2% and c-MYC from 26,950 ± 750 to 34,200 ± 350% (Figure 4a). As expected, although c-MYC expression level was considerably higher than hESC in undifferentiated AFSC_VPA, c-MYC expression dropped to 0.005 ± 350% upon differentiation (Figure 4a). At the protein level, flow cytometry showed high peaks of expression for OCT4, SOX2, and c-MYC, indicating uni-form expression within the culture, with AFSC_VPA having lost bimodal expression of SSEA3, SSEA4, TRA-1-60, and TRA-1-81 (Figure 4b).
VPA activates 585 specific genes, including 273 hesc-specific genesTranscriptome profiling of AFSC cultured with VPA (AFSC_VPA) showed that VPA-treated samples (AFSC_VPA 1 and AFSC_VPA 2) clustered together and were clearly separated from both of their respective parental lines (AFSC 77, AFSC 78, and AFSC 79), as well as from hESC (Figure 4c). On the basis of detected gene expression signals (detection P value <0.01) a Venn diagram was generated
to highlight overlapping and distinct gene expression patterns in AFSC versus AFSC_VPA and hESC (Figure 4d). This revealed an overlap between AFSC_VPA and hESC of 7,572 genes, among which 273 genes were only expressed in AFSC_VPA and hESC but not in AFSC. In addition, 312 genes were uniquely expressed in VPA_AFSC but not in hESC nor in AFSC (Figure 4d).
The identification of potential enrichment of gene clusters cor-responding to known signaling pathways showed that the enriched 273 genes set common to AFSC_VPA and hESC but not expressed in AFSC was associated with WNT and NOTCH signaling pathways, and included genes expressed during spermatogenesis, including testis-specific kinase 2 (TESK2), gamete generation, sexual repro-duction, as well as genes expressed during embryonic development, patterning, neurogenesis and development of the nervous system, immunoglobulins, negative regulation of cell death and apopto-sis, cell signaling, development of kidney, limb, urogenital system, mesoderm, primary germ layer, gastrulation, tissue morphogenesis, and regulation of transcription and gene expression, as well as genes involved in chromatin binding, histone modification, and chro-mosome organization (Supplementary Table S4). In addition, 13
100
a
b
c d
OCT4
OCT4
0.25 0.20 0.15 0.10 0.05 0
N +VPA N N+VPA +VPA N N+VPA +VPA Differe-ntiated
NANOG SOX2
SOX2
KLF4 c-MYC
c-MYC SSEA3 SSEA4 TRA-1-60
AFSC
AFSC 77
AFSC 78
AFSC 79
hESC H9
hESC H1
AFSC_VPA
AFSC_VPA 1
AFSC_VPA 2
hESC
1,475
273
312
7,299
485255
606
TRA-1-81
10
2−DC
t (%
hE
SC
)
1
0.1
100
10
1
0.1
100
10
1
0.1
100
1,000104
102
100
10−2
10−4
10
1
0.1
Figure 4 transcriptome analysis of first-trimester AFsc culture in nutristem supplemented with VPA for 5 days. (a) Quantitative real-time RT-PCR. The relative expression of OCT4, NANOG, SOX2, c-MYC, and KLF4 was normalized by its expression in hESC (H9 line) after normalization to β-actin and plotted (log10 scale) relative to the expression level in H9, arbitrarily set to 100. Error bars, SEM, n = 4 primers are listed in supplementary table s2. (b) Flow cytometry analyses, isotype control in black. (c) Hierarchical clustering of AFSC (samples 77, 78, and 79), AFSC cultured with VPA (AFSC_VPA1 and AFSC_VPA2), and hESC (H1 and H9) according to Pearson’s correlation. (d) Venn diagram based on detected genes in AFSC, AFSC_VPA, and hESC portraying distinct and overlapping transcriptional signatures between cell types. AFSC, amniotic fluid stem cell; hESC, human embryonic stem cell; RT-PCR, reverse transcription-PCR; VPA, valproic acid.
Molecular Therapy vol. 20 no. 10 oct. 2012 1959
© The American Society of Gene & Cell TherapyPluripotency State of Amniotic Fluid Stem Cells
genes involved in the extracellular matrix production were enriched in AFSC_VPA following VPA treatment.
In the 312 AFSC_VPA-specific genes signature, Jak-STAT sig-naling, cytokine-cytokine receptor, γ-R–mediated phagocytosis, and vascular smooth muscle contraction were over-represented. In addition AFSC_VPA, but not AFSC or hESC, uniquely expressed VCX3A, which is involved in spermatogenesis and is exclusively expressed in male germ cells; C19ORF20, which is required for the development of the spermatid flagellum; as well as MICALCL, which is involved in the morphogenetic development of round spermatids to spermatozoa.
This raised the possibly that AFSC might originate from a founder population of stem cells of epiblast origin such as pri-mordial germ cells, which may have been retained in the amniotic fluid early during their migration to the genital ridges. The epiblast origin of AFSC was further documented during whole genome transcriptome analysis by high expression of FGF5, a marker of pluripotent epiblast cells which is not expressed in the inner cell
mass. In fact, c-KIT is expressed on the surface of primordial germ cells, neural crest stem cells and hematopoietic stem cells. The transcriptome of AFSC_VPA showed absence of expression of markers which constitute the neural crest stem cell molecular signature, such as FOXD3 and RET, indicating that AFSC might be of primordial germ cells/progenitors origin.
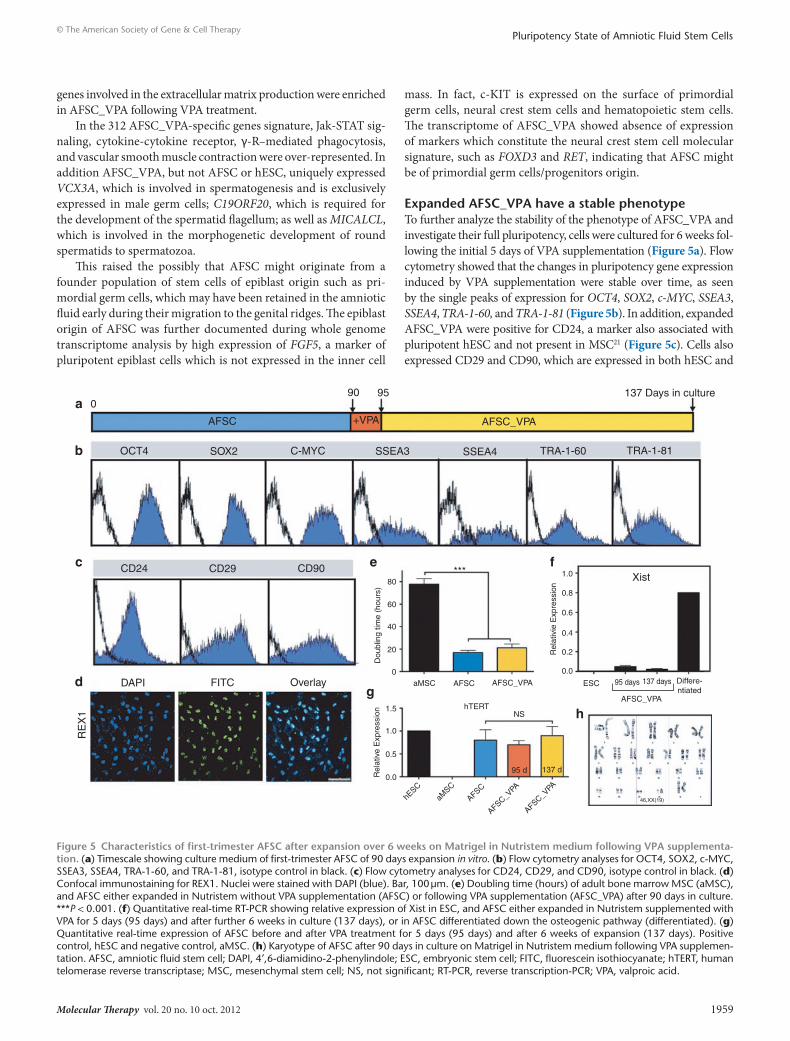
expanded AFsc_VPA have a stable phenotypeTo further analyze the stability of the phenotype of AFSC_VPA and investigate their full pluripotency, cells were cultured for 6 weeks fol-lowing the initial 5 days of VPA supplementation (Figure 5a). Flow cytometry showed that the changes in pluripotency gene expression induced by VPA supplementation were stable over time, as seen by the single peaks of expression for OCT4, SOX2, c-MYC, SSEA3, SSEA4, TRA-1-60, and TRA-1-81 (Figure 5b). In addition, expanded AFSC_VPA were positive for CD24, a marker also associated with pluripotent hESC and not present in MSC21 (Figure 5c). Cells also expressed CD29 and CD90, which are expressed in both hESC and
a
b
c e f
h
gd
OCT4
CD24
DAPI
RE
X1
FITC Overlay
CD29 CD90 *** 1.0 Xist
ESC 95 days
AFSC_VPA
46,XX(19)
137 days Differe-ntiated
0.8
0.6
0.4
0.2
0.0
60
80
40
20
0
1.5
1.0
Rel
ativ
ie E
xpre
ssio
n
Rel
ativ
e E
xpre
ssio
nD
oubl
ing
time
(hou
rs)
0.5
0.0
hESC
aMSC
AFSC
AFSC_VPA
AFSC_VPA
aMSC AFSC AFSC_VPA
hTERTNS
95 d 137 d
0
AFSC +VPA
90 95
AFSC_VPA
137 Days in culture
SOX2 C-MYC SSEA3 SSEA4 TRA-1-60 TRA-1-81
Figure 5 characteristics of first-trimester AFsc after expansion over 6 weeks on Matrigel in nutristem medium following VPA supplementa-tion. (a) Timescale showing culture medium of first-trimester AFSC of 90 days expansion in vitro. (b) Flow cytometry analyses for OCT4, SOX2, c-MYC, SSEA3, SSEA4, TRA-1-60, and TRA-1-81, isotype control in black. (c) Flow cytometry analyses for CD24, CD29, and CD90, isotype control in black. (d) Confocal immunostaining for REX1. Nuclei were stained with DAPI (blue). Bar, 100 μm. (e) Doubling time (hours) of adult bone marrow MSC (aMSC), and AFSC either expanded in Nutristem without VPA supplementation (AFSC) or following VPA supplementation (AFSC_VPA) after 90 days in culture. ***P < 0.001. (f) Quantitative real-time RT-PCR showing relative expression of Xist in ESC, and AFSC either expanded in Nutristem supplemented with VPA for 5 days (95 days) and after further 6 weeks in culture (137 days), or in AFSC differentiated down the osteogenic pathway (differentiated). (g) Quantitative real-time expression of AFSC before and after VPA treatment for 5 days (95 days) and after 6 weeks of expansion (137 days). Positive control, hESC and negative control, aMSC. (h) Karyotype of AFSC after 90 days in culture on Matrigel in Nutristem medium following VPA supplemen-tation. AFSC, amniotic fluid stem cell; DAPI, 4′,6-diamidino-2-phenylindole; ESC, embryonic stem cell; FITC, fluorescein isothiocyanate; hTERT, human telomerase reverse transcriptase; MSC, mesenchymal stem cell; NS, not significant; RT-PCR, reverse transcription-PCR; VPA, valproic acid.
1960 www.moleculartherapy.org vol. 20 no. 10 oct. 2012
© The American Society of Gene & Cell TherapyPluripotency State of Amniotic Fluid Stem Cells
MSC (Figure 5c),19 as well as REX1, a known marker of undifferenti-ated hESC which is a direct target of NANOG augmented by SOX2 and OCT422 (Figure 5d). In addition, AFSC_VPA showed stable growth with an averaged population doubling of 21 ± 3.4 hours after 6 weeks in culture (Figure 5e). Finally, female AFSC_VPA showed X-chromosome inactivation repression, as seen by the repression of the X-linked Xist gene, the expression of which is essential for heterochromatin formation on the X chromosome (Figure 5f).23 Expression of a subset of X-linked genes in our gene arrays showed that CXORF15, PLS3, RBBP7, and UTX were expressed, confirm-ing repression of X-chromosome inactivation in AFSC_VPA. In addition, AFSC_VPA maintained expression of human telomerase reverse transcriptase (hTERT), which encodes the catalytic and a rate-limiting subunit of telomerase (Figure 5g) and were genetically stable (Figure 5h). Finally, transcriptome identity of AFSC_VPA showed that, similarly to hESC but contrary to the parental line, AFSC_VPA expressed tripartite motif protein 28 (TRIM28), also
known as transcription intermediary factor 1β (TIF1β) or KRAB-associated protein 1 (KAP1), which is a specific and indispensable factor for the maintenance of pluripotency in hESC.24
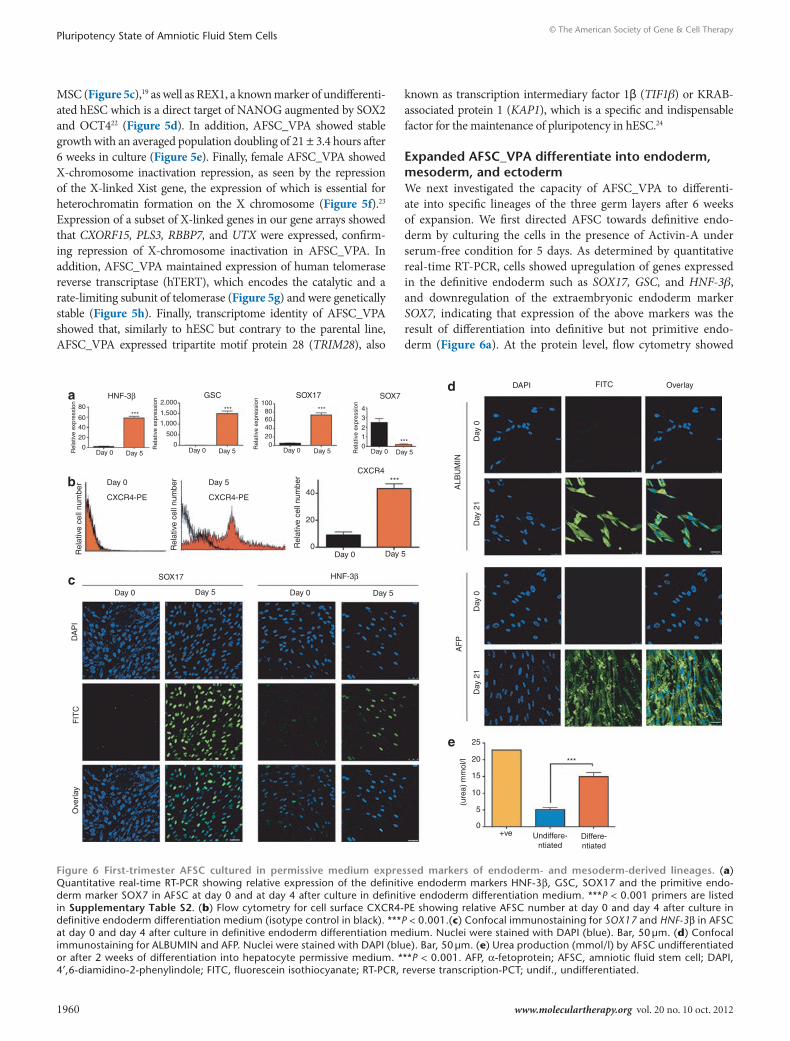
expanded AFsc_VPA differentiate into endoderm, mesoderm, and ectodermWe next investigated the capacity of AFSC_VPA to differenti-ate into specific lineages of the three germ layers after 6 weeks of expansion. We first directed AFSC towards definitive endo-derm by culturing the cells in the presence of Activin-A under serum-free condition for 5 days. As determined by quantitative real-time RT-PCR, cells showed upregulation of genes expressed in the definitive endoderm such as SOX17, GSC, and HNF-3β, and downregulation of the extraembryonic endoderm marker SOX7, indicating that expression of the above markers was the result of differentiation into definitive but not primitive endo-derm (Figure 6a). At the protein level, flow cytometry showed
80
6040
20
Rel
ativ
e ex
pres
sion
Rel
ativ
e ex
pres
sion
Rel
ativ
e ex
pres
sion
Rel
ativ
e ex
pres
sion
0
2,000 10043
210
Day 0 Day 5Day 0Day 0 Day 5
Day 0 Day 5
Day 0
DA
PI
AF
PA
LBU
MIN
Day
0D
ay 0
Day
21
Day
21
FIT
CO
verla
y
Day 0Day 5 Day 5
Day 5Day 0
Day 0
CXCR4-PE
Rel
ativ
e ce
ll nu
mbe
r
Rel
ativ
e ce
ll nu
mbe
r
Rel
ativ
e ce
ll nu
mbe
r
Day 5
CXCR4
CXCR4-PE40
20
0
HNF-3βad
e
b
c
GSC SOX17
SOX17
SOX7DAPI FITC Overlay
HNF-3β
Day 5
***
*********
***
806040200
1,500
1,000
500
0
25
20
15
(ure
a) m
mol
/l
10
5
0+ve Undiffere-
ntiated
***
Differe-ntiated
Figure 6 First-trimester AFsc cultured in permissive medium expressed markers of endoderm- and mesoderm-derived lineages. (a) Quantitative real-time RT-PCR showing relative expression of the definitive endoderm markers HNF-3β, GSC, SOX17 and the primitive endo-derm marker SOX7 in AFSC at day 0 and at day 4 after culture in definitive endoderm differentiation medium. ***P < 0.001 primers are listed in supplementary table s2. (b) Flow cytometry for cell surface CXCR4-PE showing relative AFSC number at day 0 and day 4 after culture in definitive endoderm differentiation medium (isotype control in black). ***P < 0.001.(c) Confocal immunostaining for SOX17 and HNF-3β in AFSC at day 0 and day 4 after culture in definitive endoderm differentiation medium. Nuclei were stained with DAPI (blue). Bar, 50 μm. (d) Confocal immunostaining for ALBUMIN and AFP. Nuclei were stained with DAPI (blue). Bar, 50 μm. (e) Urea production (mmol/l) by AFSC undifferentiated or after 2 weeks of differentiation into hepatocyte permissive medium. ***P < 0.001. AFP, α-fetoprotein; AFSC, amniotic fluid stem cell; DAPI, 4′,6-diamidino-2-phenylindole; FITC, fluorescein isothiocyanate; RT-PCR, reverse transcription-PCT; undif., undifferentiated.
Molecular Therapy vol. 20 no. 10 oct. 2012 1961
© The American Society of Gene & Cell TherapyPluripotency State of Amniotic Fluid Stem Cells
significant increase in the number of cells expressing CXCR4 on the cell surface (Figure 6b), and confocal immunostaining con-firmed expression of SOX17 and HNF-3β in cells cultured in the presence of Activin-A (Figure 6c), indicating that AFSC_VPA differentiated into definitive endoderm.
Culture of AFSC_VPA in hepatic-permissive medium supple-mented with hepatocyte growth factor over 21 days induced expres-sion of the hepatic markers ALBUMIN and AFP (α-fetoprotein) as visualized by confocal immunostaining (Figure 6d). Functionality of the differentiated cells was evidenced by the production of urea in the culture medium (Figure 6e).
Differentiation into the three standard mesodermal lineages, i.e., osteogenic, chondrogenic, and adipogenic, was confirmed by Von Kossa (osteogenic), Alcian blue (chondrogenic), and oil-red-O (adipogenic) stainings, and by expression of the appropriate lineage-specific markers osteopontin (osteogenic), collagen type II (ColII), and PPARγ (adipogenic) (Supplementary Figure S4).
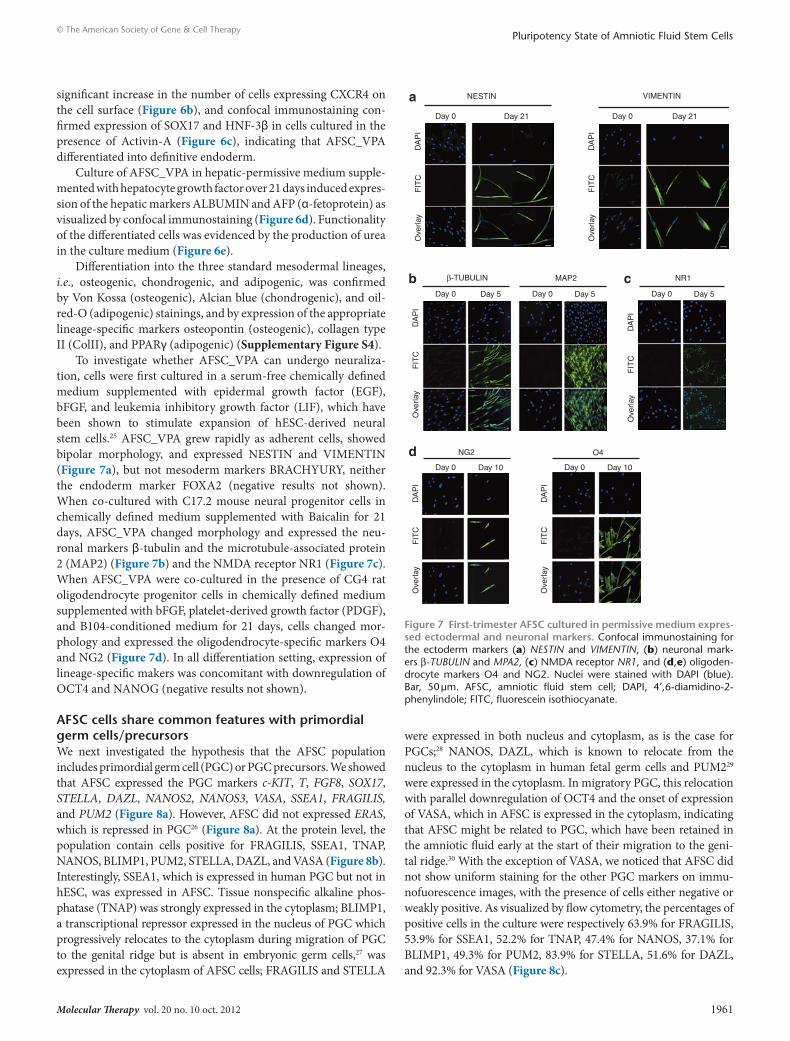
To investigate whether AFSC_VPA can undergo neuraliza-tion, cells were first cultured in a serum-free chemically defined medium supplemented with epidermal growth factor (EGF), bFGF, and leukemia inhibitory growth factor (LIF), which have been shown to stimulate expansion of hESC-derived neural stem cells.25 AFSC_VPA grew rapidly as adherent cells, showed bipolar morphology, and expressed NESTIN and VIMENTIN (Figure 7a), but not mesoderm markers BRACHYURY, neither the endoderm marker FOXA2 (negative results not shown). When co-cultured with C17.2 mouse neural progenitor cells in chemically defined medium supplemented with Baicalin for 21 days, AFSC_VPA changed morphology and expressed the neu-ronal markers β-tubulin and the microtubule-associated protein 2 (MAP2) (Figure 7b) and the NMDA receptor NR1 (Figure 7c). When AFSC_VPA were co-cultured in the presence of CG4 rat oligodendrocyte progenitor cells in chemically defined medium supplemented with bFGF, platelet-derived growth factor (PDGF), and B104-conditioned medium for 21 days, cells changed mor-phology and expressed the oligodendrocyte-specific markers O4 and NG2 (Figure 7d). In all differentiation setting, expression of lineage-specific makers was concomitant with downregulation of OCT4 and NANOG (negative results not shown).
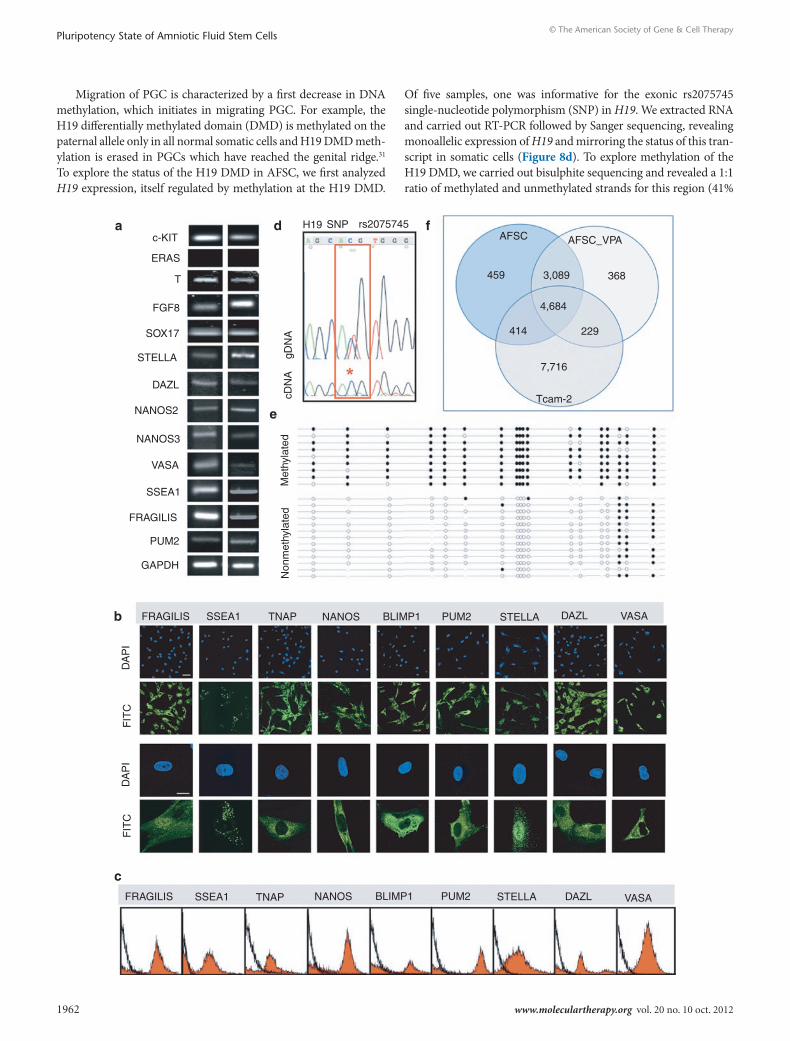
AFsc cells share common features with primordial germ cells/precursorsWe next investigated the hypothesis that the AFSC population includes primordial germ cell (PGC) or PGC precursors. We showed that AFSC expressed the PGC markers c-KIT, T, FGF8, SOX17, STELLA, DAZL, NANOS2, NANOS3, VASA, SSEA1, FRAGILIS, and PUM2 (Figure 8a). However, AFSC did not expressed ERAS, which is repressed in PGC26 (Figure 8a). At the protein level, the population contain cells positive for FRAGILIS, SSEA1, TNAP, NANOS, BLIMP1, PUM2, STELLA, DAZL, and VASA (Figure 8b). Interestingly, SSEA1, which is expressed in human PGC but not in hESC, was expressed in AFSC. Tissue nonspecific alkaline phos-phatase (TNAP) was strongly expressed in the cytoplasm; BLIMP1, a transcriptional repressor expressed in the nucleus of PGC which progressively relocates to the cytoplasm during migration of PGC to the genital ridge but is absent in embryonic germ cells,27 was expressed in the cytoplasm of AFSC cells; FRAGILIS and STELLA
were expressed in both nucleus and cytoplasm, as is the case for PGCs;28 NANOS, DAZL, which is known to relocate from the nucleus to the cytoplasm in human fetal germ cells and PUM229 were expressed in the cytoplasm. In migratory PGC, this relocation with parallel downregulation of OCT4 and the onset of expression of VASA, which in AFSC is expressed in the cytoplasm, indicating that AFSC might be related to PGC, which have been retained in the amniotic fluid early at the start of their migration to the geni-tal ridge.30 With the exception of VASA, we noticed that AFSC did not show uniform staining for the other PGC markers on immu-nofuorescence images, with the presence of cells either negative or weakly positive. As visualized by flow cytometry, the percentages of positive cells in the culture were respectively 63.9% for FRAGILIS, 53.9% for SSEA1, 52.2% for TNAP, 47.4% for NANOS, 37.1% for BLIMP1, 49.3% for PUM2, 83.9% for STELLA, 51.6% for DAZL, and 92.3% for VASA (Figure 8c).
DA
PI
FIT
CO
verla
y
DA
PI
FIT
CO
verla
y
DA
PI
FIT
CO
verla
y
DA
PI
FIT
CO
verla
yD
AP
IF
ITC
Ove
rlay
DA
PI
FIT
CO
verla
y
Day 0
NESTIN
β-TUBULIN MAP2 NR1
VIMENTIN
Day 21
Day 0 Day 5
Day 0 Day 10 Day 0
O4NG2
Day 10
Day 0 Day 5 Day 0 Day 5
Day 0 Day 21
a
b
d
c
Figure 7 First-trimester AFsc cultured in permissive medium expres-sed ectodermal and neuronal markers. Confocal immunostaining for the ectoderm markers (a) NESTIN and VIMENTIN, (b) neuronal mark-ers β-TUBULIN and MPA2, (c) NMDA receptor NR1, and (d,e) oligoden-drocyte markers O4 and NG2. Nuclei were stained with DAPI (blue). Bar, 50 μm. AFSC, amniotic fluid stem cell; DAPI, 4′,6-diamidino-2-phenylindole; FITC, fluorescein isothiocyanate.
1962 www.moleculartherapy.org vol. 20 no. 10 oct. 2012
© The American Society of Gene & Cell TherapyPluripotency State of Amniotic Fluid Stem Cells
Migration of PGC is characterized by a first decrease in DNA methylation, which initiates in migrating PGC. For example, the H19 differentially methylated domain (DMD) is methylated on the paternal allele only in all normal somatic cells and H19 DMD meth-ylation is erased in PGCs which have reached the genital ridge.31 To explore the status of the H19 DMD in AFSC, we first analyzed H19 expression, itself regulated by methylation at the H19 DMD.
Of five samples, one was informative for the exonic rs2075745 single-nucleotide polymorphism (SNP) in H19. We extracted RNA and carried out RT-PCR followed by Sanger sequencing, revealing monoallelic expression of H19 and mirroring the status of this tran-script in somatic cells (Figure 8d). To explore methylation of the H19 DMD, we carried out bisulphite sequencing and revealed a 1:1 ratio of methylated and unmethylated strands for this region (41%
c-KITa d
e
b
c
fH19
gDN
AcD
NA
Met
hyla
ted
Non
met
hyla
ted
SNP rs2075745AFSC AFSC_VPA
459 3,089
4,684
368
229414
7,716
Tcam-2
ERAS
T
FGF8
SOX17
STELLA
DAZL
NANOS2
NANOS3
VASA
SSEA1
FRAGILIS
PUM2
GAPDH
FRAGILIS
DA
PI
DA
PI
FIT
CF
ITC
SSEA1 TNAP NANOS BLIMP1 PUM2 STELLA DAZL VASA
FRAGILIS SSEA1 TNAP NANOS BLIMP1 PUM2 STELLA DAZL VASA
Molecular Therapy vol. 20 no. 10 oct. 2012 1963
© The American Society of Gene & Cell TherapyPluripotency State of Amniotic Fluid Stem Cells
methylated:59 % unmethylated) (Figure 8e). These data are indica-tive of allelic differential methylation at the H19 DMD, as expected from the monoallelic expression of H19 in AFSC. We next compared the whole genome transcriptome identity of AFSC_VPA with the seminoma cell line TCam-2,32 which exhibit characteristics of fetal germ cell (Supplementary Figure S5). Results showed that AFSC and TCam-2 cells share 39% transcriptome identity (Figure 8f).
dIscussIonThe direct reprogramming of somatic stem cells to pluripotency provided a valuable tool for pharmaceutical screening, disease modeling, and in cell-based therapies, although therapeutic appli-cations are presently limited by the pitfalls associated with the use of vectors employed for generating iPSCs from terminally differ-entiated somatic cells. Here, we show that human first-trimester amniotic fluid contains cells of germ origin that can be reverted to pluripotency when expanded on Matrigel in low growth fac-tor medium supplemented with VPA. The AFSC population showed some features with MSC, such as expression of CD73, CD44, CD105, fibronectin, and laminin. However, the phenotype of AFSC is distinct from that of MSC as cells shared 82% tran-scriptome identity with hESC, had high kinetics, expressed telom-erase, and contained a subset of cells expressing the hESC-specific markers OCT4, NANOG, SSEA4, SOX2, KLF4, and c-MYC with 60% of the cells also coexpressing SSEA3, TRA-1-60, TRA-1-81, and ALP at clonal level. AFSC grew as compact colonies of small SSEA3+ cells on top of larger SSEA3− cells growing as flat colo-nies, with SSEA3+ cells proliferation being dependent on soluble factors secreted from SSEA3− cells which function as feeders. The SSEA3− AFSC population was capable of re-entering the stem cell compartment by acquiring SSEA3 expression, reflected in their ability to form mixed colonies of SSEA3−/+ cells. Interestingly, two subclasses of hESC based on SSEA3 expression33 have also been reported, with SSEA3+ hESC not proliferating in the absence of SSEA3− cells, which function as support, whereas the latter can be expanded successfully in the absence of SSEA3+ hESC.34
It has recently been emphasized that assessment of human pluripotent lines should be carried out through the highest-stringency test acceptable, i.e., teratoma formation.35 Here, we show that upon supplementation with VPA, a HDACi which can induce pluripotency genes in hESC36 and has been found to enhance the efficiency of iPSC production,37 AFSC_VPA homo-geneously expressed OCT4, SOX2, KLF4, c-MYC, and the hESC-specific surface antigens TRA-1-60, TRA-1-81, SSE3, and SSEA4, stained positive for ALP, readily formed embryoid bodies in vitro
and generated teratomas in vivo. Interestingly, TRA-1-81 expres-sion has been used for the identification of genuine human iPSC colonies derived from fibroblasts.38 The pluripotent phenotype of AFSC_VPA was stable over time, as seen by the cells retaining a normal phenotype and maintaining expression of pluripotency markers, high kinetics, normal karyotype, telomerase activity, repression of X-inactivation, and ability to differentiate into func-tional lineages of the three germ layers, i.e., bone, fat, cartilage, definitive endoderm, hepatocyte, ectoderm, neurons, and oligo-dendrocytes. Although together these results are in accordance with true pluripotency, additional assays would be beneficial in testing the functional differentiation and tissue repair capac-ity of specific cell types derived from AFSC_VPA in transplant models.35
Despite pluripotent AFSC_VPA sharing common charac-teristics with hESC, including similar levels of expression of OCT4, SOX2, and NANOG, active telomerase, repression of X-inactivation, high cell-division kinetics, and capacity to dif-ferentiate into lineages of the three germ layers, they also present unique features, such as higher levels of c-MYC and KLF4 expres-sion, and 18% of unique transcriptome identity. c-MYC expression has been shown to maintain ES pluripotency and self-renewal, and is required for early embryogenesis, controlling proliferation versus differentiation.39 Our results show that upon differentia-tion, the levels of c-MYC expression are downregulated, indicat-ing that the derivates of AFSC_VPA potentially used in cell-based therapies may not be oncogenic.
The analysis of the molecular mechanisms involved in the effects of VPA revealed that VPA-treated AFSC expressed 273 genes in common with hESC, among which 13 genes are involved in the extracellular matrix production. Interestingly, it was recently shown that increased pluripotency of hESC by HDAC inhibition acts to enhance the activity of target genes involved in extracel-lular matrix production to support pluripotency.36 In addition, VPA-treated AFSC uniquely expressed 312 genes including genes involved in spermatogenesis that are only expressed in germ cells. Complementary analysis revealed that AFSC share com-mon characteristics with PGC or PGC precursors, expressing c-KIT, T, FGF8, SOX17, STELLA, DAZL, NANOS, VASA, SSEA1, FRAGILIS, STELLA, and PUM2. However, AFSC have not lost their imprinting and therefore might originate from PGC or PGC progenitors, which have been retained in the amniotic fluid at the start of their migration to the genital ridge, when imprinting is not yet erased, and remained undifferentiated probably because they miss two key messages for cell differentiation such as cell-matrix
Figure 8 First-trimester AFsc population manifest features of primordial germ cells (PGc)/progenitors. (a) RT-PCR of mRNA expression for c-KIT, ERAS, T, FGF8, SOX17, STELLA, DAZL, NANOS2, NANOS3, VASA, SSEA1, FRAGILIS, PUM2, and GAPDH. (b) Confocal immunofluorescence images showing AFSC expressing FRAGILIS, SSEA1, TNAP, NANOS, BLIMP1, PUM2, STELLA, DAZL, and VASA. Nuclei were stained with DAPI (blue). Bars, 100 μm. (c) Flow cytometry for PGC markers in AFSC cells. Isotype control in black. (d) Analysis of allelic expression of the H19 gene. Genomic and cDNA Sanger sequencing chromatograms are shown in the H19 SNP rs2075745. The SNP is highlighted in red, showing complete monoal-lelic expression from this sample in the cDNA. *Single peak at nucleotide C. (e) Bisulphite sequencing of the H19 differentially methylated domain (DMD). Closed circles indicate methylated CpG dinucleotides and open circles represent unmethylated CpG dinucleotides. The even distribution of methylated and unmethylated strands for this region (41% methylated:59% unmethylated) is indicative of the maintenance of normal differential methylation at the H19 DMD. Quality control of bisulphite sequencing data was performed in a standardized manner using BiQ analyser. Bisulphite conversion was at least 90% in each case and any identical PCR clones were excluded. Bead on a string diagrams were produced using BiQ Analyser. (f) Venn diagram based on detected genes in AFSC, AFSC_VPA, and TCam-2 cells portraying distinct and overlapping transcriptional signatures between cell types. AFSC, amniotic fluid stem cell; DAPI, 4′,6-diamidino-2-phenylindole; FITC, fluorescein isothiocyanate; GAPDH, glyceraldehyde 3-phosphate dehydrogenase; gDNA, genomic DNA; RT-PCR, reverse transcription-PCR; SNP, single-nucleotide polymorphism; VPA, valproic acid.
1964 www.moleculartherapy.org vol. 20 no. 10 oct. 2012
© The American Society of Gene & Cell TherapyPluripotency State of Amniotic Fluid Stem Cells
and cell-cell contacts. PGC originate from the pluripotent epiblast and migrate out of the embryo to reside in extra embryonic tissues where they subsequently migrate to the genital ridge once gastru-lation is completed.40 Zwaka et al.41 have suggested a germ cell ori-gin of hESC, providing evidence that the closest in vivo equivalent to hESC is early germ cells. It has also been hypothesized that dur-ing early development, epiblast/germ line-derived cells including PGC become founder populations of stem cells.42
Reprogramming has been achieved from several easily acces-sible adult somatic cell types using virus-free and/or vector-free methods.10 Here, we have avoided the use of virally/nonvirally introduced exogenous factors and have alternatively employed VPA, which is a US Food and Drug Administration–approved drug for the treatment of epilepsy43 and may therefore facilitate the generation and application of transgene-free reprogrammed cells in a clinical setting. We anticipate that early AFSC could pro-vide alternative source of pluripotent cells. Similarly to other first-trimester fetal stem cells, amniotic fluid can be collected early in pregnancy during termination procedure and pluripotent AFSC derived for allogeneic clinical use in cell-based therapies or in medicine for disease modeling and drug screening. Considering that a bank of 150 donor cell lines would provide a beneficial match for up to 37.9% of the population,44 these results may also have broader effect on society, promoting the development of banks of pluripotent cells of fetal origin. Further studies will also be needed to investigate whether similar cells could be found and expanded either from mid-gestation amniotic fluid, or from other extraembryonic tissues routinely sampled.
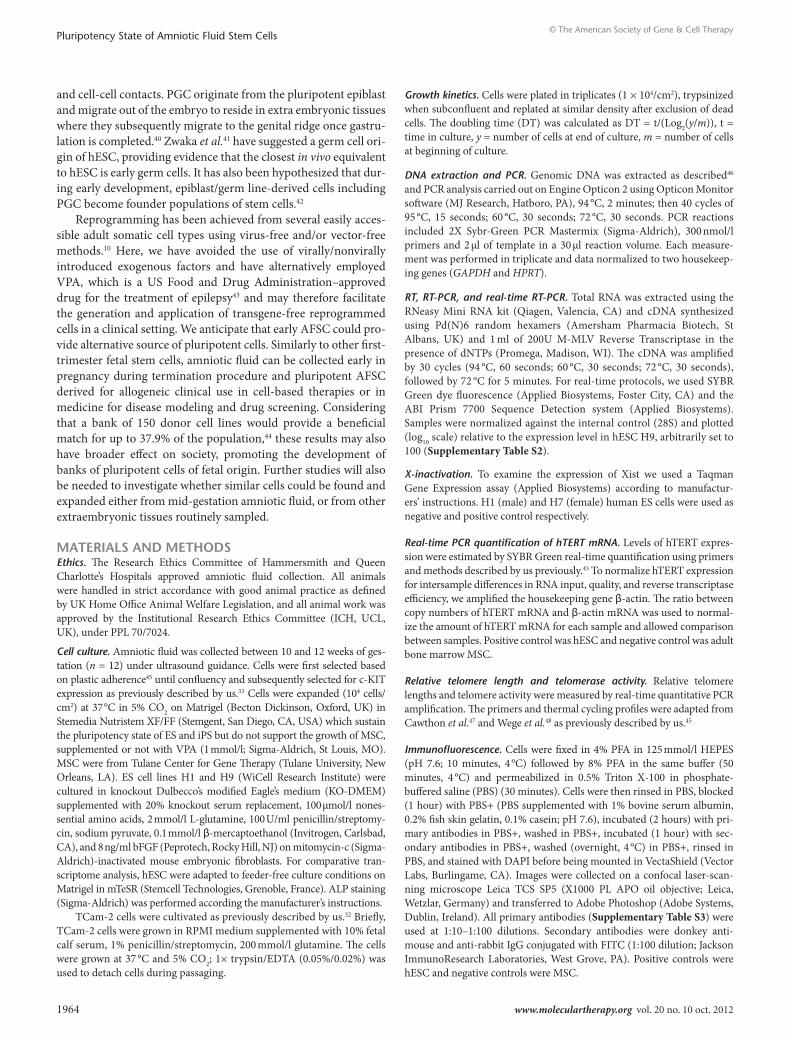
MAterIAls And MetHodsEthics. The Research Ethics Committee of Hammersmith and Queen Charlotte’s Hospitals approved amniotic fluid collection. All animals were handled in strict accordance with good animal practice as defined by UK Home Office Animal Welfare Legislation, and all animal work was approved by the Institutional Research Ethics Committee (ICH, UCL, UK), under PPL 70/7024.
Cell culture. Amniotic fluid was collected between 10 and 12 weeks of ges-tation (n = 12) under ultrasound guidance. Cells were first selected based on plastic adherence45 until confluency and subsequently selected for c-KIT expression as previously described by us.33 Cells were expanded (104 cells/cm2) at 37 °C in 5% CO2 on Matrigel (Becton Dickinson, Oxford, UK) in Stemedia Nutristem XF/FF (Stemgent, San Diego, CA, USA) which sustain the pluripotency state of ES and iPS but do not support the growth of MSC, supplemented or not with VPA (1 mmol/l; Sigma-Aldrich, St Louis, MO). MSC were from Tulane Center for Gene Therapy (Tulane University, New Orleans, LA). ES cell lines H1 and H9 (WiCell Research Institute) were cultured in knockout Dulbecco’s modified Eagle’s medium (KO-DMEM) supplemented with 20% knockout serum replacement, 100 µmol/l nones-sential amino acids, 2 mmol/l L-glutamine, 100 U/ml penicillin/streptomy-cin, sodium pyruvate, 0.1 mmol/l β-mercaptoethanol (Invitrogen, Carlsbad, CA), and 8 ng/ml bFGF (Peprotech, Rocky Hill, NJ) on mitomycin-c (Sigma-Aldrich)-inactivated mouse embryonic fibroblasts. For comparative tran-scriptome analysis, hESC were adapted to feeder-free culture conditions on Matrigel in mTeSR (Stemcell Technologies, Grenoble, France). ALP staining (Sigma-Aldrich) was performed according the manufacturer’s instructions.
TCam-2 cells were cultivated as previously described by us.32 Briefly, TCam-2 cells were grown in RPMI medium supplemented with 10% fetal calf serum, 1% penicillin/streptomycin, 200 mmol/l glutamine. The cells were grown at 37 °C and 5% CO2; 1× trypsin/EDTA (0.05%/0.02%) was used to detach cells during passaging.
Growth kinetics. Cells were plated in triplicates (1 × 10⁴/cm2), trypsinized when subconfluent and replated at similar density after exclusion of dead cells. The doubling time (DT) was calculated as DT = t/(Log2(y/m)), t = time in culture, y = number of cells at end of culture, m = number of cells at beginning of culture.
DNA extraction and PCR. Genomic DNA was extracted as described46 and PCR analysis carried out on Engine Opticon 2 using Opticon Monitor software (MJ Research, Hatboro, PA), 94 °C, 2 minutes; then 40 cycles of 95 °C, 15 seconds; 60 °C, 30 seconds; 72 °C, 30 seconds. PCR reactions included 2X Sybr-Green PCR Mastermix (Sigma-Aldrich), 300 nmol/l primers and 2 µl of template in a 30 µl reaction volume. Each measure-ment was performed in triplicate and data normalized to two housekeep-ing genes (GAPDH and HPRT).
RT, RT-PCR, and real-time RT-PCR. Total RNA was extracted using the RNeasy Mini RNA kit (Qiagen, Valencia, CA) and cDNA synthesized using Pd(N)6 random hexamers (Amersham Pharmacia Biotech, St Albans, UK) and 1 ml of 200U M-MLV Reverse Transcriptase in the presence of dNTPs (Promega, Madison, WI). The cDNA was amplified by 30 cycles (94 °C, 60 seconds; 60 °C, 30 seconds; 72 °C, 30 seconds), followed by 72 °C for 5 minutes. For real-time protocols, we used SYBR Green dye fluorescence (Applied Biosystems, Foster City, CA) and the ABI Prism 7700 Sequence Detection system (Applied Biosystems). Samples were normalized against the internal control (28S) and plotted (log10 scale) relative to the expression level in hESC H9, arbitrarily set to 100 (Supplementary Table S2).
X-inactivation. To examine the expression of Xist we used a Taqman Gene Expression assay (Applied Biosystems) according to manufactur-ers’ instructions. H1 (male) and H7 (female) human ES cells were used as negative and positive control respectively.
Real-time PCR quantification of hTERT mRNA. Levels of hTERT expres-sion were estimated by SYBR Green real-time quantification using primers and methods described by us previously.45 To normalize hTERT expression for intersample differences in RNA input, quality, and reverse transcriptase efficiency, we amplified the housekeeping gene β-actin. The ratio between copy numbers of hTERT mRNA and β-actin mRNA was used to normal-ize the amount of hTERT mRNA for each sample and allowed comparison between samples. Positive control was hESC and negative control was adult bone marrow MSC.
Relative telomere length and telomerase activity. Relative telomere lengths and telomere activity were measured by real-time quantitative PCR amplification. The primers and thermal cycling profiles were adapted from Cawthon et al.47 and Wege et al.48 as previously described by us.45
Immunofluorescence. Cells were fixed in 4% PFA in 125 mmol/l HEPES (pH 7.6; 10 minutes, 4 °C) followed by 8% PFA in the same buffer (50 minutes, 4 °C) and permeabilized in 0.5% Triton X-100 in phosphate-buffered saline (PBS) (30 minutes). Cells were then rinsed in PBS, blocked (1 hour) with PBS+ (PBS supplemented with 1% bovine serum albumin, 0.2% fish skin gelatin, 0.1% casein; pH 7.6), incubated (2 hours) with pri-mary antibodies in PBS+, washed in PBS+, incubated (1 hour) with sec-ondary antibodies in PBS+, washed (overnight, 4 °C) in PBS+, rinsed in PBS, and stained with DAPI before being mounted in VectaShield (Vector Labs, Burlingame, CA). Images were collected on a confocal laser-scan-ning microscope Leica TCS SP5 (X1000 PL APO oil objective; Leica, Wetzlar, Germany) and transferred to Adobe Photoshop (Adobe Systems, Dublin, Ireland). All primary antibodies (Supplementary Table S3) were used at 1:10–1:100 dilutions. Secondary antibodies were donkey anti-mouse and anti-rabbit IgG conjugated with FITC (1:100 dilution; Jackson ImmunoResearch Laboratories, West Grove, PA). Positive controls were hESC and negative controls were MSC.
Molecular Therapy vol. 20 no. 10 oct. 2012 1965
© The American Society of Gene & Cell TherapyPluripotency State of Amniotic Fluid Stem Cells
Flow cytometry. Cells were resuspended in FACS buffer (PBS, 1% bovine serum albumin; 5 × 10⁵ cells/100 ml buffer). For cell surface staining, cells were stained with antibodies for 1 hour at 4 °C. When using unconjugated primary antibodies (mouse anti-human SSEA3, TRA-1-60 and TRA-1-81, and rabbit anti-human NANOG), cells were washed in FACS buffer and sec-ondary goat anti-mouse IgM PE-conjugated or goat anti-rabbit IgG FITC-conjugated antibody was added and incubated for 30 minutes. Cells were then washed and resuspended in FACS buffer. For intracellular FACS stain-ing, cells were washed once in FACS buffer, fixed for 10 minutes in 0.01% PFA, washed twice with PBS, resuspended in permeabilization buffer (PBS, 1% Triton) and stained as above. All samples were analyzed by FACScalibur flow cytometer (Becton Dickinson) and analyzed using CellQuest software. Positive controls were hESC and negative controls were IgG or IgM primary antibody-specific isotype controls (Supplementary Table S3).
EB formation. Cells from 5 to 6 confluent wells of a 6-well plate were incu-bated with differentiation medium containing 80% KO-DMEM supple-mented with 1 mmol/l L-glutamine, 0.1 mmol/l β-mercaptoethanol, 1% nonessential amino acids stock (all Gibco BRL Life Technologies, Grand Island, NY) and 20% fetal bovine serum (FBS) (Biosera, Ringmer, UK). At confluence, cells were incubated with 1 mg/ml type IV collagenase (Sigma-Aldrich) at 37 °C for 10 minutes before being dissociated into small clumps using 100-ml Gilson pipette tips, cultured in suspension in 58-mm low attachment Petri dish in differentiating medium and allowed to develop into 15-day-old EBs. EBs suspensions were then transferred to gelatin-coated plates for another 7–10 days before fixation in 4% PFA.
Teratoma formation assay. Immunodeficient mice were housed in microi-solator laminar flow caging systems and were supplied with sterile water, food, and bedding; 2 × 10⁶ cells resuspended in Matrigel were injected sub-cutaneously into the dorsal flank of 8–12-week-old common γ-chain−/−, RAG2−/−,C5−/− immunodeficient mice without preconditioning. Mice were observed for the growth of solid tumors up to 12 weeks or up to 10 mm3 tumor volume. All experiments were performed according to Home Office animal welfare legislation. Positive control was hESC.
Molecular analysis. Array comparative genomic hybridization was per-formed using a 105K-oligonucleotide microarray (CytoSure Syndrome Plus v2; Oxford Gene Technology, Begbroke, UK). Labeling and hybridiza-tion were performed following the manufacturer’s protocols (Invitrogen). After washing the array was analyzed with the Agilent scanner and Feature Extraction software (Agilent Technologies, Wokingham, UK) and text file outputs from the quantitation analysis were imported to CytoSure Interpret Software (Oxford Gene Technology).
Illumina bead chip hybridization and global gene expression analysis. Total RNA was isolated using the RNeasy Mini Kit (Qiagen). For each sam-ple, 500 ng RNA were used as input for the biotin-labelling reaction (IL1791; Ambion, Grand Island, NY). Bead chip hybridization, washing steps, Cy3-straptavidin staining, and image scanning were performed on Illumina BeadStations 500 (Illumina, San Diego, CA). Basic processing of the resulting raw data was done using BeadStudio Software version 3.0.17. This included background subtraction and normalization of signal intensities according to the rank invariant algorithm. Significant expression values were determined by comparison with negative control beads. Hierarchical clustering based on Pearson’s correlation was performed for overall expression data. For the gen-eration of Venn diagrams, detected gene expression was defined by a detec-tion P Value <0.01. The DAVID platform version 6.7 was used to perform functional annotation and signaling pathway and tissue expression enrich-ment analyses (http://david.abcc.ncifcrf.gov/home.jsp) (Huang et al., 2009). Illumina PROBE_IDs and/or Official Gene Symbols were used as input against the background of the Homo sapiens species. Analyses were per-formed using DAVID default parameter settings (14 December 2010). The microarray data for AFSC discussed in this publication have been deposited
in NCBI’s Gene Expression Omnibus (Ref: GSE 26940) and are accessible through the GEO Series accession number GSE26940 (http://www.ncbi.nlm.nih.gov/geo/query/acc.cgi?token=lpebjummoqmqqte&acc=GSE26940). The microarray data for TCam-2 cells were previously published.49
Genotyping and RT-PCR sequencing. In silico identification of common exonic SNPs in the H19 gene was carried out using the UCSC Genome Browser dbSNP (http://genome.ucsc.edu/cgi-bin/hgGateway). Genomic DNA was amplified over rs2075745 in exon 1 on H19 (accession no. NR_002196) and sequenced to detect heterozygous samples. Total RNA was reverse transcribed in parallel with a control omitting reverse tran-scriptase and cDNA integrity checked using β-ACTIN primers. RT-PCR was carried out, products sequenced, and analyzed using the 4Peaks soft-ware (http://mekentosj.com/).
Analysis of DMD methylation of H19 by bisulphite sequencing. DNA from one sample was treated with sodium bisulphite and purified using the EZ DNA Methylation-Gold kit (Zymo, Irvine, CA). We amplified the bisulphite-treated DNA using primers specific for bisulphite converted DNA at the H19 DMD, using Hotstar Taq Polymerase (Qiagen) for 45 cycles; 3 μl of the amplicon were ligated into TOPO TA vector (Invitrogen) as per the manufacturers’ instructions. JM109 chemically competent cells were then transformed and 20 white colonies selected and amplified using M13 primers for 30 cycles. Amplification of the H19 DMD was verified on agarose gel, and each amplicon of appropriate size was sequenced directly. Quality control of our bisulphite sequencing data was performed in a stan-dardized manner using BiQ analyser. Bead on a string diagrams were pro-duced using BiQ Analyser.
Differentiation into endoderm, ectoderm, and mesoderm lineagesDefinitive endoderm. Differentiation was carried out using the Human Pluripotent Cell-derived Endoderm Differentiation kit (catalog no. SC019; R&D Systems, Minneapolis, MN) over 5 days in Activin A-supplemented medium, according to the manufacturer’s instructions. Cells were subsequently assessed for expression of the definitive endoderm markers SOX17, HNF-3β, CXCR4, and GSC and downregulation of the extraembryonic endoderm marker SOX7.
Hepatic. Cells were seeded at a concentration of 5,000 cells/cm2 on tissue culture plastic plates and coverslips coated with Matrigel (BD Biosciences, Franklin Lakes, NJ) and cultured in high glucose DMEM supplemented with 1% Penicillin/Streptomycin (Invitrogen), 2 mmol/l L-Glutamine (Invitrogen) and 10% FBS for 3 days. The media were then changed to high glucose DMEM supplemented with 15% FBS, 1% Penicillin/Streptomycin, 2 mmol/l L-Glutamine, 300 μmol/l Monothioglycerol (Sigma-Aldrich), 20 ng/ml Hepatocyte Growth Factor (Peprotech), 10 ng/ml Oncostatin M (Peprotech), 10−7 Dexamethasone (Sigma-Aldrich), 100 ng/ml FGF4 (Peprotech), and 1X ITS (Insulin, Transferrin, selenium; Sigma-Aldrich). The cells were allowed to differentiate for 21 days and then fixed and stored in PBS for immunofluorescence. The differentiation media were collected and analyzed for the presence of urea secreted by the differentiated cells. Urea was subsequently measured using the Urea/Ammonia determination kit (R-Biopharm AG, Darmstadt, Germany) according to the manufacturers’ instructions. Cells were subsquently assessed for expression of the hepatocyte markers ALBUMIN and AFP.
Ectoderm. AFSC were seeded at a concentration of 3,000 cells/ cm2 on tissue culture plastic plates and coverslips and cultured in DMEM/F12 (1:1) supplemented with 1% Penicillin/Streptomycin, 2 mmol/l L-Glutamine, 0.6% glucose (Sigma-Aldrich), 3 mmol/l sodium bicarbonate (Sigma-Aldrich), 5 mM HEPES buffer (Sigma-Aldrich), 25 mg/ml insulin (Sigma-Aldrich), 100 mg/ml transferrin (Sigma-Aldrich), 20 nmol/l progesterone (Sigma-Aldrich), 60 mmol/l putrescine (Sigma-Aldrich), 30 nmol/l selenium chloride (Sigma-Aldrich), 20 ng/ml EGF (Peprotech), 10 ng/ml bFGF (Peprotech), and 10 ng/ml LIF (Sigma-Aldrich). Media
1966 www.moleculartherapy.org vol. 20 no. 10 oct. 2012
© The American Society of Gene & Cell TherapyPluripotency State of Amniotic Fluid Stem Cells
were changed every 3 days and the cells were allowed to differentiate for 21 days, before being assessed for expression of NESTIN and VIMENTIN.
Neuronal. AFSC were seeded at a concentration of 5,000 cells/cm2 on tissue culture plastic plates and coverslips and cultured in high glucose DMEM supplemented with 1% Penicillin/Streptomycin (Invitrogen), 2 mmol/l L-Glutamine (Invitrogen), and 10% FBS (Biosera, East Sussex, UK) for 1 day. The media were then changed to high glucose DMEM supplemented with 0.5% FBS, 1% Penicillin/Streptomycin, 2 mmol/l L-Glutamine, and 0.1% Baicalin (Sigma-Aldrich), freshly made. C17.2 mouse neural progenitor cells (gift from Henrik Hagberg and Pierre Gressens) were added in a co-culture setting to promote differentiation, using co-culture membrane inserts (Thermo Scientific Nunc, Loughborough, UK). The cells were allowed to differentiate for 5 days and assessed for expression of the neuronal markers β-TUBULIN and MAP2 and for the NMDA receptor NR1.
Oligodendrocyte. Cells were seeded at a concentration of 5,000 cells/cm2 on tissue culture plastic plates and coverslips and cultured in high glucose DMEM supplemented with 1% Penicillin/Streptomycin (Invitrogen), 2 mmol/l L-Glutamine (Invitrogen), 1X N1 supplement (Sigma-Aldrich), 1 μg/ml biotin (Sigma-Aldrich), 5 ng/ml bFGF (Peprotech), 1 ng/ml PDGF (Peprotech), and 30% B104-conditioned media for 1 day. On the second day, CG4 rat oligodendrocyte progenitor cells were added in a co-culture setting to promote differentiation, using co-culture membrane inserts, and the media were changed every 2 days. The cells were allowed to differentiate for 5 days and were then fixed and stored in PBS for immunofluorescence. Cells were subsequently assessed for expression of the oligodendrocyte markers O2 and NG2.
Mesoderm lineages. Adipogenic, osteogenic, and chondrogenic differentiations were performed as previously described.45
Karyotyping. Cells were cultured at subconfluency and processed while mitotically active by a cytogenetics service (The Doctors Laboratory, London, UK).
Statistical analysis. Statistical analysis was performed using InStat Version 3.0a statistical software (GraphPad Software, La Jolla, CA). P < 0.05 was significant.
suPPleMentArY MAterIAlFigure S1. Isolation of first trimester AFSC.Figure S2. Phenotype of first trimester AFSC cultured in Nutristem medium.Figure S3. Positive and negative controls for immunostaining.Figure S4. Differentiation into mesodermal lineages.Figure S5. Expression of PGC markers and H19 status of TCam-2 cells.Table S1. Results of the tissue expression enrichment analyses per-formed using the DAVID database. Only significant results (p < 0.05) are displayed. “Count” is the number of genes from the input gene list that are expressed in the corresponding tissue.Table S2. List of primers used for RT-PCR and quantitative real-time RT-PCR which do not amplify pseudogenes.Table S3. List of antibodies used for IF and FC.Table S4. Lists of significantly enriched genes and associated pathways from the signature gene sets of 740 AFSC-specific genes and 7905 genes overlapping between AFSC and hESC and 1748 hESC-specific genes as given by the DAVID database.Video S1. Movie showing the beating of AFSC cells upon spontane-ous differentiation.
AcKnoWledGMentsThis research was funded by Genesis Research Trust and Henry Smith Charity. D.M. was supported by Kidney Research United Kingdom; G.N.J. by the Medical Research Council; M.C. by Citta’ della Speranza, Malo (VI) Italy; S.M., M.P.B., and A.J.T. are supported by European Union funded FP7, Wellcome Trust & GOSH Children’s Charity; P.D.C.
by Great Ormond Street Hospital Children’s Charity; K.D. by the Berlin-Brandenburg School for Regenerative Therapies; J.A. by the BMBF-Federal Ministry of Education and Research (ERASysBio:0315717A) and the Max Planck Society. The authors declared no conflict of interest.
reFerences1. Takahashi, K and Yamanaka, S (2006). Induction of pluripotent stem cells from mouse
embryonic and adult fibroblast cultures by defined factors. Cell 126: 663–676.2. Mukherjee, S and Thrasher, AJ (2011). iPSCs: Unstable origins? Mol Ther 19:
1188–1190.3. Li, C, Zhou, J, Shi, G, Ma, Y, Yang, Y, Gu, J et al. (2009). Pluripotency can be rapidly
and efficiently induced in human amniotic fluid-derived cells. Hum Mol Genet 18: 4340–4349.
4. Fusaki, N, Ban, H, Nishiyama, A, Saeki, K and Hasegawa, M (2009). Efficient induction of transgene-free human pluripotent stem cells using a vector based on Sendai virus, an RNA virus that does not integrate into the host genome. Proc Jpn Acad, Ser B, Phys Biol Sci 85: 348–362.
5. Hu, K, Yu, J, Suknuntha, K, Tian, S, Montgomery, K, Choi, KD et al. (2011). Efficient generation of transgene-free induced pluripotent stem cells from normal and neoplastic bone marrow and cord blood mononuclear cells. Blood 117: e109–e119.
6. Narsinh, KH, Jia, F, Robbins, RC, Kay, MA, Longaker, MT and Wu, JC (2011). Generation of adult human induced pluripotent stem cells using nonviral minicircle DNA vectors. Nat Protoc 6: 78–88.
7. Kaji, K, Norrby, K, Paca, A, Mileikovsky, M, Mohseni, P and Woltjen, K (2009). Virus-free induction of pluripotency and subsequent excision of reprogramming factors. Nature 458: 771–775.
8. Warren, L, Manos, PD, Ahfeldt, T, Loh, YH, Li, H, Lau, F et al. (2010). Highly efficient reprogramming to pluripotency and directed differentiation of human cells with synthetic modified mRNA. Cell Stem Cell 7: 618–630.
9. Kim, D, Kim, CH, Moon, JI, Chung, YG, Chang, MY, Han, BS et al. (2009). Generation of human induced pluripotent stem cells by direct delivery of reprogramming proteins. Cell Stem Cell 4: 472–476.
10. Okita, K, Matsumura, Y, Sato, Y, Okada, A, Morizane, A, Okamoto, S et al. (2011). A more efficient method to generate integration-free human iPS cells. Nat Methods 8: 409–412.
11. Galende, E, Karakikes, I, Edelmann, L, Desnick, RJ, Kerenyi, T, Khoueiry, G et al. (2010). Amniotic fluid cells are more efficiently reprogrammed to pluripotency than adult cells. Cell Reprogram 12: 117–125.
12. Zhou, H, Li, W, Zhu, S, Joo, JY, Do, JT, Xiong, W et al. (2010). Conversion of mouse epiblast stem cells to an earlier pluripotency state by small molecules. J Biol Chem 285: 29676–29680.
13. Di Stefano, B, Prigione, A and Broccoli, V (2009). Efficient genetic reprogramming of unmodified somatic neural progenitors uncovers the essential requirement of Oct4 and Klf4. Stem Cells Dev 18: 707–716.
14. Kim, JB, Sebastiano, V, Wu, G, Araúzo-Bravo, MJ, Sasse, P, Gentile, L et al. (2009). Oct4-induced pluripotency in adult neural stem cells. Cell 136: 411–419.
15. Sterneckert, J, Höing, S and Schöler, HR (2012). Concise review: Oct4 and more: the reprogramming expressway. Stem Cells 30: 15–21.
16. Kaviani, A, Guleserian, K, Perry, TE, Jennings, RW, Ziegler, MM and Fauza, DO (2003). Fetal tissue engineering from amniotic fluid. J Am Coll Surg 196: 592–597.
17. Tsai, MS, Lee, JL, Chang, YJ and Hwang, SM (2004). Isolation of human multipotent mesenchymal stem cells from second-trimester amniotic fluid using a novel two-stage culture protocol. Hum Reprod 19: 1450–1456.
18. De Coppi, P, Bartsch, G Jr, Siddiqui, MM, Xu, T, Santos, CC, Perin, L et al. (2007). Isolation of amniotic stem cell lines with potential for therapy. Nat Biotechnol 25: 100–106.
19. Ryan, JM, Pettit, AR, Guillot, PV, Chan, JK and Fisk, NM (2011). Unravelling the Pluripotency Paradox in Fetal and Placental Mesenchymal Stem Cells: Oct-4 Expression and the Case of the Emperor’s New Clothes. Stem Cell Rev (epub ahead of print).
20. Huangfu, D, Osafune, K, Maehr, R, Guo, W, Eijkelenboom, A, Chen, S et al. (2008). Induction of pluripotent stem cells from primary human fibroblasts with only Oct4 and Sox2. Nat Biotechnol 26: 1269–1275.
21. Chen, YS, Pelekanos, RA, Ellis, RL, Horne, R, Wolvetang, EJ and Fisk N M (2012). Small molecule mesengenic induction of human induced pluripotent stem cells to generate mesenchymal stem/stromal cells. Stem Cells Trans Med 1: 83–95.
22. Shi, W, Wang, H, Pan, G, Geng, Y, Guo, Y and Pei, D (2006). Regulation of the pluripotency marker Rex-1 by Nanog and Sox2. J Biol Chem 281: 23319–23325.
23. LYON, MF (1961). Gene action in the X-chromosome of the mouse (Mus musculus L.). Nature 190: 372–373.
24. Seki, Y, Kurisaki, A, Watanabe-Susaki, K, Nakajima, Y, Nakanishi, M, Arai, Y et al. (2010). TIF1beta regulates the pluripotency of embryonic stem cells in a phosphorylation-dependent manner. Proc Natl Acad Sci USA 107: 10926–10931.
25. Daadi, MM, Davis, AS, Arac, A, Li, Z, Maag, AL, Bhatnagar, R et al. (2010). Human neural stem cell grafts modify microglial response and enhance axonal sprouting in neonatal hypoxic-ischemic brain injury. Stroke 41: 516–523.
26. Yabuta, Y, Kurimoto, K, Ohinata, Y, Seki, Y and Saitou, M (2006). Gene expression dynamics during germline specification in mice identified by quantitative single-cell gene expression profiling. Biol Reprod 75: 705–716.
27. Surani, MA, Durcova-Hills, G, Hajkova, P, Hayashi, K and Tee, WW (2008). Germ line, stem cells, and epigenetic reprogramming. Cold Spring Harb Symp Quant Biol 73: 9–15.
28. Hayashi, K, de Sousa Lopes, SM and Surani, MA (2007). Germ cell specification in mice. Science 316: 394–396.
29. Moore, FL, Jaruzelska, J, Fox, MS, Urano, J, Firpo, MT, Turek, PJ et al. (2003). Human Pumilio-2 is expressed in embryonic stem cells and germ cells and interacts with DAZ (Deleted in AZoospermia) and DAZ-like proteins. Proc Natl Acad Sci USA 100: 538–543.
Molecular Therapy vol. 20 no. 10 oct. 2012 1967
© The American Society of Gene & Cell TherapyPluripotency State of Amniotic Fluid Stem Cells
30. Lee, GS, Kim, HS, Lee, SH, Kang, MS, Kim, DY, Lee, CK et al. (2005). Characterization of pig vasa homolog gene and specific expression in germ cell lineage. Mol Reprod Dev 72: 320–328.
31. Hajkova, P, Erhardt, S, Lane, N, Haaf, T, El-Maarri, O, Reik, W et al. (2002). Epigenetic reprogramming in mouse primordial germ cells. Mech Dev 117: 15–23.
32. Nettersheim, D, Gillis, A, Biermann, K, Looijenga, LH and Schorle, H (2011). The seminoma cell line TCam-2 is sensitive to HDAC inhibitor depsipeptide but tolerates various other chemotherapeutic drugs and loss of NANOG expression. Genes Chromosomes Cancer 50: 1033–1042.
33. Graf, T and Enver, T (2009). Forcing cells to change lineages. Nature 462: 587–594.34. Stewart, MH, Bossé, M, Chadwick, K, Menendez, P, Bendall, SC and Bhatia, M (2006).
Clonal isolation of hESCs reveals heterogeneity within the pluripotent stem cell compartment. Nat Methods 3: 807–815.
35. Maherali, N and Hochedlinger, K (2008). Guidelines and techniques for the generation of induced pluripotent stem cells. Cell Stem Cell 3: 595–605.
36. Hezroni, H, Sailaja, BS and Meshorer, E (2011). Pluripotency-related, valproic acid (VPA)-induced genome-wide histone H3 lysine 9 (H3K9) acetylation patterns in embryonic stem cells. J Biol Chem 286: 35977–35988.
37. Huangfu, D, Osafune, K, Maehr, R, Guo, W, Eijkelenboom, A, Chen, S et al. (2008). Induction of pluripotent stem cells from primary human fibroblasts with only Oct4 and Sox2. Nat Biotechnol 26: 1269–1275.
38. Lowry, WE, Richter, L, Yachechko, R, Pyle, AD, Tchieu, J, Sridharan, R et al. (2008). Generation of human induced pluripotent stem cells from dermal fibroblasts. Proc Natl Acad Sci USA 105: 2883–2888.
39. Varlakhanova, NV, Cotterman, RF, deVries, WN, Morgan, J, Donahue, LR, Murray, S et al. (2010). myc maintains embryonic stem cell pluripotency and self-renewal. Differentiation 80: 9–19.
40. Kerr, CL, Hill, CM, Blumenthal, PD and Gearhart, JD (2008). Expression of pluripotent stem cell markers in the human fetal testis. Stem Cells 26: 412–421.
41. Zwaka, TP and Thomson, JA (2005). A germ cell origin of embryonic stem cells? Development 132: 227–233.
42. Kucia, M, Machalinski, B and Ratajczak, MZ (2006). The developmental deposition of epiblast/germ cell-line derived cells in various organs as a hypothetical explanation of stem cell plasticity? Acta Neurobiol Exp (Wars) 66: 331–341.
43. Leeman, BA and Cole, AJ (2008). Advancements in the treatment of epilepsy. Annu Rev Med 59: 503–523.
44. Taylor, CJ, Bolton, EM, Pocock, S, Sharples, LD, Pedersen, RA and Bradley, JA (2005). Banking on human embryonic stem cells: estimating the number of donor cell lines needed for HLA matching. Lancet 366: 2019–2025.
45. Guillot, PV, Gotherstrom, C, Chan, J, Kurata, H and Fisk, NM (2007). Human first trimester fetal mesenchymal stem cells (MSC) express pluripotency markers, grow faster and have longer telomeres compared to adult MSC. Stem cells 25: 646–654.
46. Miller, SA, Dykes, DD and Polesky, HF (1998). A simple salting out procedure for extracting DNA from human nucleated cells. Nucleic Acids Res 3: 1215.
47. Cawthon, RM (2002). Telomere measurement by quantitative PCR. Nucleic Acids Res 30: e47.
48. Wege, H, Chui, MS, Le, HT, Tran, JM and Zern, MA (2003). SYBR Green real-time telomeric repeat amplification protocol for the rapid quantification of telomerase activity. Nucleic Acids Res 31: E3–E3.
49. Eckert, D, Nettersheim, D, Heukamp, LC, Kitazawa, S, Biermann, K and Schorle, H (2008). TCam-2 but not JKT-1 cells resemble seminoma in cell culture. Cell Tissue Res 331: 529–538.