Posttranscriptional silencing of chalcone synthase in Petunia by inverted transgene repeats
20
The Plant Journal (1997) 12(1), 63-82 Post-transcriptional silencing of chalcone synthase in Petunia by inverted transgene repeats Maike Stare, Rob de Bruin, Susan Kenter, Renier A.L. van tier Hoorn, Rik van Bloklend t, Joseph N.M. Mol and Jan M. Kooter* Department of Molecular Genetics, Institute for Molecular Biological Sciences, BioCentrum Amsterdam, Vrije Universiteit, De Boelelaan 1087, 1081 HV Amsterdam, The Netherlands Summary To induce post.transcriptional silencing of flower pig- mentation genes by homologous sense transgenes in transgenic petunias, it is not necessary for the transgenes to be highly transcribed. Even promoterless transgenes can induce silencing. Here it is shown that in these cases silencing is mediated by multimeric transgene/T- DNA loci in which the T-DNAs are arranged as inverted repeats (IRs). With the transgene constructs used, monomeric T-DNA loci are unable to confer silencing even though they modulate IR-induced silencing. IRs with the silencing sequences proximal to the centre (IRc) induce a more severe silencing than IRs with these sequences distal to the centre (IR,). Somatic reversion of silencing, as observed in a side branch of one of the chalcone synthase (Chs) transformants, was associated with a deletion of the IR locus from L1 cells, the meristematic cell layer that expresses the endogenous Chs genes in the flower corolla. Taken together, these data indicate that the post-transcriptional silencing mech- anism can be activated by inverted transgene repeats. It is also shown that a silent IR UidA-ChsA locus silences the expression of a monomeric 35S promoter-driven UidA-ChsA transgene only in corollas where the endo- genous Chs genes are highly transcribed. These results are consistent with a model in which an IR, by virtue of its palindromic sequence organization, is able to promote the production of aberrant RNAs from the endogenous homologs as a result of ectopic pairing. Introduction Gene silencing is a common phenomenon in transgenic plants and affects transgenes and endogenous genes (reviewed by Baulcombe and English, 1996; Matzke and Received 16 October 1996; revised 20 January 1997; accepted 21 February1997. *For correspondence (fax +31 20 4447137; e-mail: [email protected]). tPresent address: Department of Genetics, University of Leeds, Leeds LS29JT, UK. Matzke, 1995; Meyer, 1995, 1996; Stam et al., 1997). If the promoter is inactivated, which is often correlated with DNA methylation, transgenes are transcriptionally silenced (Elmayan and Vaucheret, 1996; Meyer et al., 1993; Neuhuber et al., 1994; Park et al., 1996). If RNA is produced but fails to accumulate, transgenes are post- transcriptionally silenced (De Carvalho et al., 1992; Dehio and Schell, 1994; Depicker et al., 1996; Elmayan and Vaucheret, 1996; English et aL, 1996; Goodwin et al., 1996; Ingelbrecht et aL, 1994; Mueller et al., 1995; Smith et al., 1994). The expression of endogenous genes can also be post-transcriptionally silenced by introduced sense transgenes when these genes are sufficiently homologous to the endogenous counterparts (De Carvalho Niebel et aL, 1995; Kunz et aL, 1996; Van Blokland et al., 1994). How is post-transcriptional gene silencing (PTGS) activated? A few studies indicate that excessive produc- tion of transgene RNA might be the trigger (De Carvalho et al., 1992; Elmayan and Vaucheret, 1996; Goodwin et al., 1996; Smith et aL, 1994). This occurs efficiently when transgenes are transcribed from a strong promoter (Elmayan and Vaucheret, 1996; Jorgensen et aL, 1996) or present in high copy numbers (Dorlhac de Borne et al. 1994; Palauqui and Vaucheret, 1995). To explain PTGS, it is assumed that a particular RNA can be produced only up to a certain level. Exceeding this threshold level initiates the degradation of these RNAs. This RNA threshold model gained support from studies of viral transgene-mediated virus resistance in plants (De Haan et al., 1992; Dougherty et al., 1994; Goodwin et al., 1996; Lindbo et al., 1993; Smith et al., 1994). Mainly the transformants in which the transgenes were highly transcribed were resistant (Goodwin et al., 1996; Lindbo et al., 1993; Smith et at., 1994). Resistance to virus infection is explained by assuming that the mechanism that prevents (viral) transgene RNAs from accumulating also prevents the accumulation of the homologous viral RNA. Even post-transcriptionally silenced non-viral transgenes, such as UidA or Nptll, will prevent infection by a chimaeric virus which carries these non-viral sequences as part of the viral genome (English et al., 1996). As RNA viruses replicate in the cytoplasm, these results suggest that the process of RNA degradation is entirely cytoplasmic (Dougherty and Parks, 1995). It has been proposed that this process involves the action of a plant encoded RNA-dependent RNA polymerase (RdRP, Dougherty and Parks, 1995; Lindbo et aL, 1993) which uses the transgene transcripts as a template to 63
Transcript of Posttranscriptional silencing of chalcone synthase in Petunia by inverted transgene repeats
The Plant Journal (1997) 12(1), 63-82
Post-transcriptional silencing of chalcone synthase in Petunia by inverted transgene repeats
Maike Stare, Rob de Bruin, Susan Kenter, Renier A.L. van tier Hoorn, Rik van Bloklend t, Joseph N.M. Mol and Jan M. Kooter* Department of Molecular Genetics, Institute for Molecular Biological Sciences, BioCentrum Amsterdam, Vrije Universiteit, De Boelelaan 1087, 1081 HV Amsterdam, The Netherlands
Summary
To induce post.transcriptional silencing of flower pig- mentation genes by homologous sense transgenes in transgenic petunias, it is not necessary for the transgenes to be highly transcribed. Even promoterless transgenes can induce silencing. Here it is shown that in these cases silencing is mediated by multimeric transgene/T- DNA loci in which the T-DNAs are arranged as inverted repeats (IRs). With the transgene constructs used, monomeric T-DNA loci are unable to confer silencing even though they modulate IR-induced silencing. IRs with the silencing sequences proximal to the centre (IR c) induce a more severe silencing than IRs with these sequences distal to the centre (IR,). Somatic reversion of silencing, as observed in a side branch of one of the chalcone synthase (Chs) transformants, was associated with a deletion of the IR locus from L1 cells, the meristematic cell layer that expresses the endogenous Chs genes in the flower corolla. Taken together, these data indicate that the post-transcriptional silencing mech- anism can be activated by inverted transgene repeats. It is also shown that a silent IR UidA-ChsA locus silences the expression of a monomeric 35S promoter-driven UidA-ChsA transgene only in corollas where the endo- genous Chs genes are highly transcribed. These results are consistent with a model in which an IR, by virtue of its palindromic sequence organization, is able to promote the production of aberrant RNAs from the endogenous homologs as a result of ectopic pairing.
Introduction
Gene silencing is a common phenomenon in transgenic plants and affects transgenes and endogenous genes (reviewed by Baulcombe and English, 1996; Matzke and
Received 16 October 1996; revised 20 January 1997; accepted 21 February 1997. *For correspondence (fax +31 20 4447137; e-mail: [email protected]). tPresent address: Department of Genetics, University of Leeds, Leeds LS2 9JT, UK.
Matzke, 1995; Meyer, 1995, 1996; Stam et al., 1997). If the promoter is inactivated, which is often correlated with DNA methylation, transgenes are transcriptionally silenced (Elmayan and Vaucheret, 1996; Meyer et al., 1993; Neuhuber et al., 1994; Park et al., 1996). If RNA is produced but fails to accumulate, transgenes are post- transcriptionally silenced (De Carvalho et al., 1992; Dehio and Schell, 1994; Depicker et al., 1996; Elmayan and Vaucheret, 1996; English et aL, 1996; Goodwin et al., 1996; Ingelbrecht et aL, 1994; Mueller et al., 1995; Smith et al., 1994). The expression of endogenous genes can also be post-transcriptionally silenced by introduced sense transgenes when these genes are sufficiently homologous to the endogenous counterparts (De Carvalho Niebel et aL, 1995; Kunz et aL, 1996; Van Blokland et al., 1994).
How is post-transcriptional gene silencing (PTGS) activated? A few studies indicate that excessive produc- tion of transgene RNA might be the trigger (De Carvalho et al., 1992; Elmayan and Vaucheret, 1996; Goodwin et al., 1996; Smith et aL, 1994). This occurs efficiently when transgenes are transcribed from a strong promoter (Elmayan and Vaucheret, 1996; Jorgensen et aL, 1996) or present in high copy numbers (Dorlhac de Borne et al. 1994; Palauqui and Vaucheret, 1995). To explain PTGS, it is assumed that a particular RNA can be produced only up to a certain level. Exceeding this threshold level initiates the degradation of these RNAs. This RNA threshold model gained support from studies of viral transgene-mediated virus resistance in plants (De Haan et al., 1992; Dougherty et al., 1994; Goodwin et al., 1996; Lindbo et al., 1993; Smith et al., 1994). Mainly the transformants in which the transgenes were highly transcribed were resistant (Goodwin et al., 1996; Lindbo et al., 1993; Smith et at., 1994).
Resistance to virus infection is explained by assuming that the mechanism that prevents (viral) transgene RNAs from accumulating also prevents the accumulation of the homologous viral RNA. Even post-transcriptionally silenced non-viral transgenes, such as UidA or Nptll, will prevent infection by a chimaeric virus which carries these non-viral sequences as part of the viral genome (English et al., 1996). As RNA viruses replicate in the cytoplasm, these results suggest that the process of RNA degradation is entirely cytoplasmic (Dougherty and Parks, 1995). It has been proposed that this process involves the action of a plant encoded RNA-dependent RNA polymerase (RdRP, Dougherty and Parks, 1995; Lindbo et aL, 1993) which uses the transgene transcripts as a template to
63
64 Maike Stam et al.
synthesize small complementary RNAs (cRNA). These cRNAs are thought to tag homologous RNAs for degrada- tion by dsRNA-specific ribonucleases (Dougherty and Parks, 1995). The possible involvement of cRNAs (anti- sense RNA) is attractive as it explains the strong sequence specificity of PTGS. In this model, the question as to how RdRP recognizes only the excessively produced RNAs amongst the thousands of others that are produced remains unanswered. Perhaps only particular RNAs or aberrant RNAs are utilized as a template and these may constitute just a small proportion of the total transgene RNA pool (English et al., 1996).
However, PTGS is not always associated with excess- ively active transgenes, as is shown for transgene- mediated virus resistance (English et aL, 1996; Mueller et aL, 1995) and for the silencing of endogenous plant genes (Van Blokland et al., 1994). In the latter case, silencing was induced by a T-DNA carrying a promoterless chalcone synthase (Chs) transgene which was not detect- ably transcribed in the transformants. These results suggest excessive production of transgene RNA is not a prerequisite for activation of the PTGS mechanism.
We are studying the post-transcriptional silencing of the pigmentation gene Chs in Petunia hybrida. This gene is required for the synthesis of anthocyanin pigments in flowers and its silencing results in fully white flowers or flowers with a variegated pigmentation phenotype (Jorgensen et aL, 1996; Napoli et aL, 1990; Van Blokland et al., 1994; Van der Krol et aL, 1990). Expression of the endogenous Chs genes in the corolla of these flowers is down-regulated by a post-transcriptional mechanism, as determined by run-on transcription assays, (Van Blokland et al., 1994). The fact that the transgenes do not have to be highly transcribed indicates that, in this case, PTGS is induced in a way that is different from that of the RNA threshold model. Another observation is that just a minority of the primary transformants show silencing. These transformants not only differ in transgene expression levels but also in transgene copy number, and importantly, the way the transgenes are integrated in the genome: as single copies or as repeats. To determine whether PTGS is associated with the presence of a particular transgene locus, we examined the structure of the transgene loci present in several Chs sense transformants in which the endogenous homologs are silenced to various degrees. By performing crosses and by genetic and molecular analysis of the progeny, we identified the T-DNA loci that segregated with the silencing phenotype. None of the monomeric T-DNA inserts identified induced silencing. Silencing was only observed in the plants carrying a multimeric T-DNA locus in which the T-DNAs were organized as inverted repeats (IR), and seemed to require transcription of the endogen- ous gene(s).
Results
Physical mapping and structure of T-DNA loci in Chs transformants
The T-DNA(s) of Agrobacterium tumefaciens transformed plants may differ in copy number, integrity, and when multiple copies are physically linked, in their relative orientation. They are usually inserted at different chromo- somal sites and are sometimes associated with binary vector sequences (Martineau et al., 1994). As it is not known to what extent these factors affect silencing of endogenous genes, it was important to carefully map the T-DNA loci in the Chs silenced transformants previously described by Van Blokland et aL (1994) and to study their heritability with PTGS. To be able to do this, the ChsA transformants PSE6-2, PSE19-3, PSE19-1-4, PSE21-1 and PSE21-6 (Van Blokland et al., 1994) were first back-crossed to untransformed V26 plants as outlined in Figure l(b). These transformants carry the transgene constructs pSE19, pSE6 or pSE21, of which the physical maps are shown in Figure l(a).
T-DNA locus of transformant PSE6-2
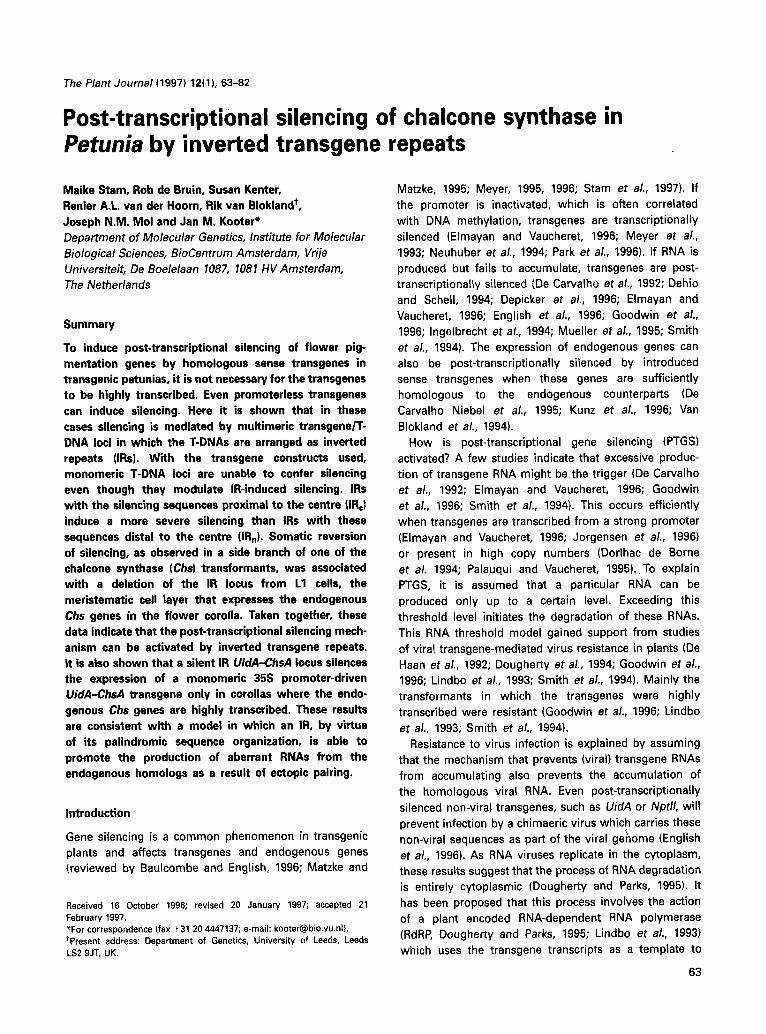
The T-DNA locus of this transformant was analysed in two progeny plants (W7016-10 and W7017-10, Figures lb and 2e). Figure 2 (a)-(c) shows a selection of the Southern blot hydridizations. Figure 2(d) shows the constructed physical map of the T-DNA inserts and the position of the various restriction fragments. Hindlll-digested DNA gives rise to fragments of 5.9 kb (G) and 11.5 kb (F) which hybridize to the UidA probe (Figure 2a, lanes H), suggesting two T-DNAs. The Nptll probe detects a single 5 kb fragment (B, panel (b), lanes H), which is expected if the two T-DNAs are linked and arranged as an inverted repeat (IR) centered around the Right T-DNA border (RB) (IRn). This IR n structure is consistent with the EcoRI digest. The UidA (panel (a), lanes E), Nptll (panel (b), lanes E) and 3'nos probes (panel (c), lanes E) detect the same 15 kb fragment (E), which is actually larger than the expected 12.4 kb in the case of an IRn. One of the T-DNAs appeared truncated at the left border, as the UidA (panel (a), lanes EH) and 3'nos probes (panel (c), lanes EH) detect in an EcoRI/Hindlll double- digest the expected 3.7 kb fragment (C), but also a 5.9 kb fragment (G). The 3'nos-hybridizing 5.9 kb band is about 30% less intense than the 3.7 kb fragment, which suggests that the endpoint of the T-DNA is within the nos polyadenyl- ation region of one of the UidA-ChsA transgenes. This was confirmed by an EcoRI/Hindlll/Dral triple digest which generated a 4.9 kb UidA-hybridizing fragment (D, panel (a), lanes EHD). In addition to the described fragments, some faint bands were visible with Hindlll, EcoRI/Hindlll and EcoRI/Hindlll/Dral digests (all three panels). The sizes

(a)
pSE19
uidA
pSE6
peE21 D S H D E
RB ~ LB
B D B E
4,8
L8
(b) PSE6-2 PSE19-3 PSE19-1
3"7001(#7) S5055(#5) pSElg-I(#4)
T7068(#331 T7066 V7055 W7001 X7030
W7017 W7016
PSE21-1 PSE21-6
W70021#4)
I xV26
W7036
Figure 1 Schematic representation of the Chs transgene constructs and overview of the crosses involving the transformants. (a) Physical maps of the T-DNA constructs used to generate transgenic petunias (Van Blokland et al., 1994). In addition to the selectable marker gene Nptll, pSE19 and pSE6 contain a chimaeric gene consisting of the UidA-coding region fused to the full-length ChsA cDNA or the 5' half, respectively; pSE21 contains just the full-length ChsA cDNA without a promoter in front of it. Arrows mark the transcription start sites of the nopaline synthase promoter (Pnos) or the CaMV 35S promoter. Fragments used as probes for the Southern blot analysis are indicated beneath pSE19 as bars: Nptl/, nos polyadenylation region, PCaMV UidA, ChsA. Abbreviations: B, BamHI; D, Dral; E, EcoRI; H, Hindlll; LB, left T-DNA border; RB, right T-DNA border; S, Sphl; X, Xbal; nos, nos polyadenylation region. (b) Crossing schemes showing the transformants generated by Van Blokland et al. (1994) in bold. The progenies are indicated by non-bold letters. The numbers of the plants used for subsequent crosses are indicated in brackets.
Gene si lencing associated with inverted repeats 65
of these fragments correspond to partially digested fragments.
T-DNA loci of transformant PSE19-3
The T-DNA inserts of this transformant were analysed in three progeny plants ($5055-8, 2, and 14, Figure 3e) of a back-cross of PSE19-3 to V26 (Figure lb). Lanes E of Figure 3 show that the UidA (panel (a)) and Chs probes (panel (b)) detect EcoRI fragments of 13.6 kb (C) and 8.2 kb (F). These fragments segregate in a Mendelian manner indicating that they are derived from separate T-DNA loci located on different chromosomes. Fragment C can be derived from a locus that consists of two T-DNAs arranged as inverted repeats with the Nptll genes near the centre of the IR (IRn). It has the expected size (13.6 kb) for an IRn fragment and the hybridization signal is twice as high as that of the other locus, which consists of a single T-DNA (see below). This IRn structure is consistent with the Hindlll digest, as it generates a single Nptll-hybridizing fragment of the expected 5 kb (A, panel (c)). The UidA (panel (a)) and ChsA (panel (b)) probes both detect two Hindlll border fragments, of 4.6 kb (D) and 5.5 kb (E). The UidA-ChsA transgenes of the two T-DNAs are intact as the EcoRI/ Hindlll digest gives the expected 4.3 kb fragment B with the UidA and ChsA probes (lanes EH of panels (a) and (b), plant no. 2).
The second locus consists of a single truncated T-DNA (St). The UidA and ChsA probes detect one 7.5 kb Hindlll fragment (G, panels (a) and (b) respectively, plant no. 8). Although the EcoRI/Hindlll digest shows that the UidA- ChsA transgene is intact (4.3 kb, fragment B, panels (a) and (b)), no hybridization was found with the Nptll probe (plant no. 8, panel (c)). This result together with the detec- tion of just fragment B with the 3'nos probe (not shown) indicates that the S t locus lacks the entire Nptll gene. Furthermore, St contains pBin19 vector sequences at both sides. The UidA-hybridizing Hindlll fragment G and the EcoRI fragment F are also detected by a 2.7 kb EcoRV pBin19 Left T-DNA Border (LB) probe (not shown). The precise length of these pBin19 sequences has not been determined, but is less than 3.9 kb.
T-DNA loci of transformant PSE19-1
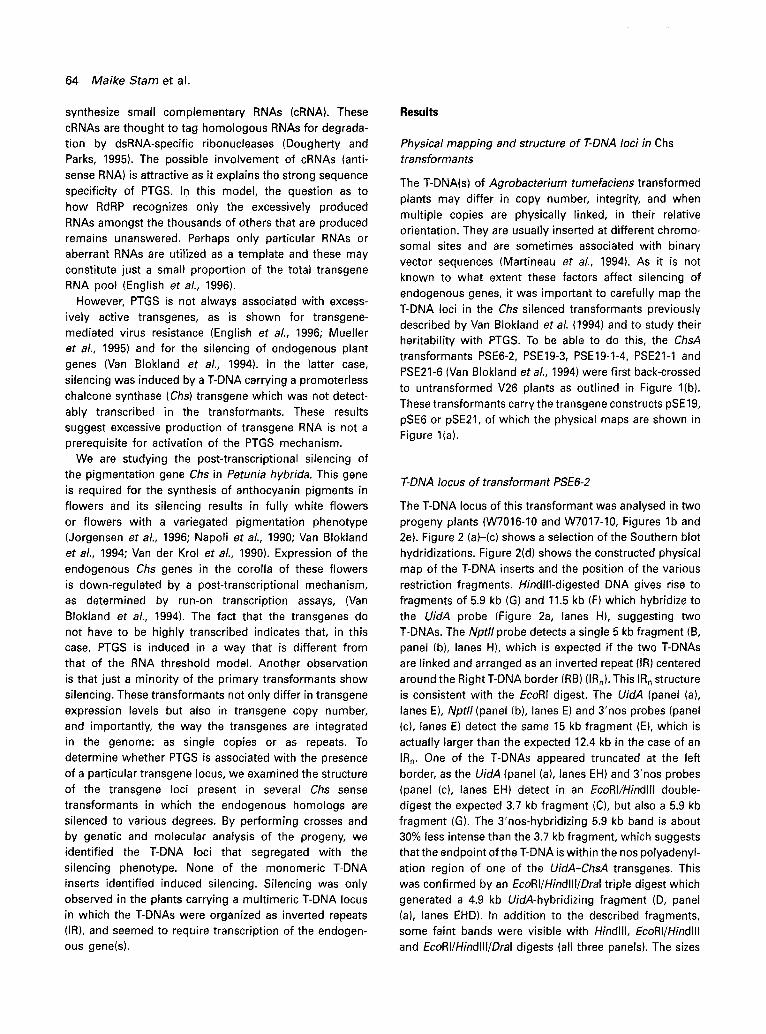
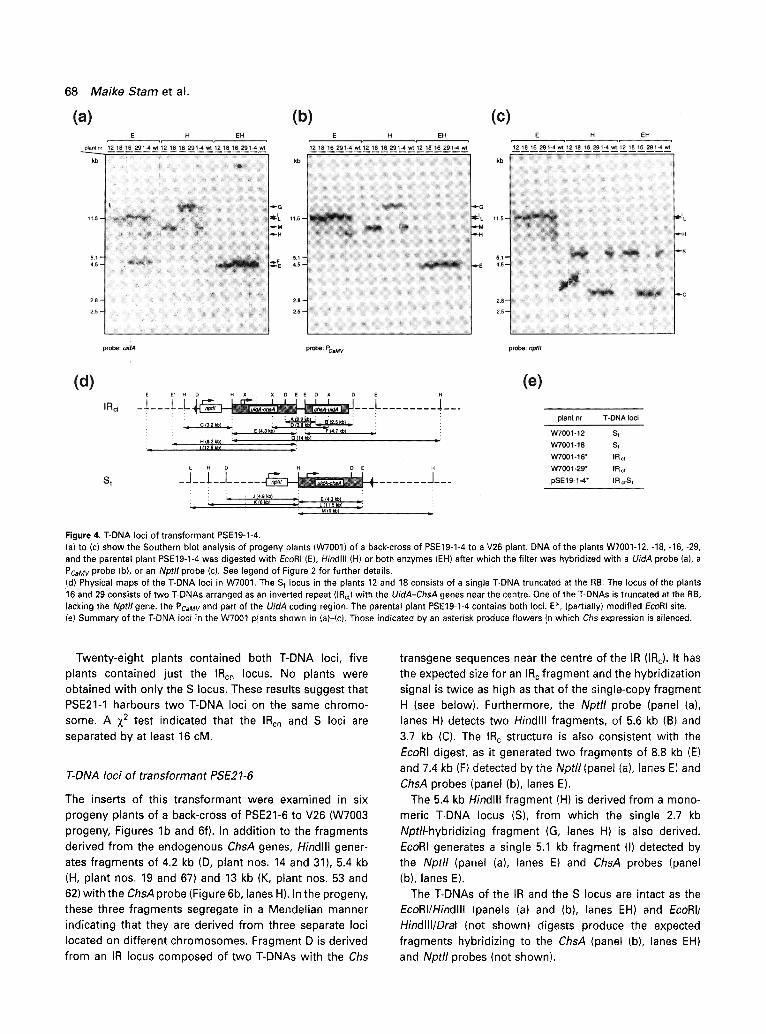
The inserts of this transformant were examined in the progeny of a back-cross of PSE19-1-4 with V26 (Figures lb and 4e, W7001 progeny). Hindlll generates a 9 kb (M) and a 14 kb fragment (G) which hybridize to the UidA (Figure 4a, lanes H), PCaMV (Figure 4b), lanes H) and ChsA probes (not shown). These two fragments are from separate loci located on different chromosomes as they segregate in a Mendelian manner (panels (a)-(c), plant nos. 12 and 18 versus 16 and 19). Fragment G can be derived from an IR
66 Maike Stare et al.
Figure 2. T-DNA locus of transformant PSE6-2. (a) to (c) show the Southern blot analysis of progeny plants (W7016 and W7017) of PSE6-2 (see Figure lb). W7016-10 is homozygous and W7017-10 is hemizygous for the T-DNA. Genomic DNA from W7016-10 and W7017-10 digested with EcoRI (E at the top), Hindlll (H), both enzymes (EH) or both enzymes with Dral (EHD) was hybridized with a UidA probe (a), Nptll probe (b) or 3'nos probe (c). As a control, pSE6 plasmid DNA was digested with EH and EHD. Lanes indicated by wt contain DNA from untransformed V26 plants. Pstl-digested phage lambda DNA was used as a size marker. Capital letters at the right of each panel refer to the fragments in the physical maps in (d). (d) Physical map of the T-DNA locus in W7016~10 and W7017-10 for which the most relevant restriction sites are shown in capitals. The labelling of the fragments refers to the bands on the Southern blots shown in the panels (a), (b) and (c). The interrupted lines indicate flanking plant DNA. The IRnt locus consists of two T-DNAs arranged as an inverted repeat, one of which is truncated at the LB and lacks part of the 3'nos polyadenylation region. H*, a partially- modified Hindlll site. (e) Summary of the T-DNA loci in the plants shown in (a)-(c). Those indicated by an asterisk produce flowers in which Chs expression is silenced.
locus with the Chs transgene sequences near the centre (IRc). While Hindlll gives one fragment G (panel (a), lanes H, plant nos. 16 and 29), EcoRI (lanes E, panel (a)) generates two co-segregating fragments of 4.7 kb (F) and 12.5 kb (I) detected by a UidA probe. The IR c structure is consistent with the results of the Dral and Xbal digests, which give rise to 2.2 kb (A) and 3.9 kb fragments (D, panel (d)) respectively, both detected by a ChsA and 3'nos probe (not shown). However, the A and D fragments are approximately 600 bp smaller than expected for a perfect IR centred around the LB. This suggests that 600 bp between the two adjacent UidA-ChsA transgenes are missing, and the locus is therefore termed IRct. In addition to this truncation, one of the T-DNAs also lacks the Nptll gene, the CaMV 35S promoter and part of the UidA sequence. The 4.7 kb EcoRI fragment (F) was not detected by the PCaMV (lanes E, panel (b)) and Nptll probes (panel (c)), which is consistent with the detection of a single Nptll-hybridizing Hindlll fragment (C) in plants harbouring just the IRct (panel (c), lanes H, plant nos. 16 and 29). Quantification of the band intensities by a Phosphor-lmager indicates that about 30% of the UidA-coding region is missing. This truncation could be confirmed by an EcoRI/Dral double digest which gave rise to a 2.5 kb fragment that hybridized to the UidA and ChsA
probes. For an intact UidA-coding region, this fragment should have been at least 2.7 kb.
The DNAs from W7001-29 and PSE19-1-4, digested with
EcoRI and hybridized with the UidA, P caMv and Nptll probes (Figure 4a-c) contain a faint 8.2 kb fragment (H) which segregates with the IRct locus. As the intensity of band H increases, that of band I decreases. We therefore infer that fragment I contains an EcoRI site that is partially cleavable (indicated in panel (d) by E*), probably as a result of DNA modification. This modification seems to increase in the successive generations, since fragment H is clearly detect- able in PSE19-1-4 (and other plants of that generation) and barely detectable in most W7001 plants.
The second locus appears to consist of a single T-DNA. The Nptll probe detects one Hindlll fragment of 6 kb (K, panel (c), plant nos. 12 and 18). The UidA (panel (a)), PCaMV (panel (b)), Nptll (panel (c)) and ChsA (not shown) probes detect a single 11.5 kb EcoRI fragment (L, lanes E). This single T-DNA (St) is truncated at the RB. This was concluded from EcoRI/Dral and EcoRI/Dral/Hindlll digests (data not shown), which showed that the 5' Dral site at position -290 in the Pnos promoter of the Nptll gene is missing. Instead of the expected 2.5 kb DraI-Hindlll fragment, a 4.9 kb fragment (J) was detected by the Nptll probe. The

Gene si lencing associated with inverted repeats 67
Figure 3. T-DNA loci of transformant PSE19-3. (a) to (c) show the Southern blot analysis of progeny plants ($5055) of a back-cross of PSE19-3 to V26. DNA from transformant $5055-8, S5055-2 and $5055- 14 digested with EcoRI (E at the top), Hindlll (H) or both enzymes (EH) was hybridized with a UidA probe (a), ChsA probe (b), or Nptll probe (c). Bands in panel (b) not indicated by capital letters are derived from the endogenous ChsA genes. See legend of Figure 2 for further details. (d) Physical maps of the T-DNA inserts in $5055. The St locus in plant 8 consists of a truncated T-DNA lacking the Nptll gene and is at both sides flanked by pBin19 vector sequences. The IR n locus of $5055-2 consists of two complete T-DNAs arranged as an inverted repeat with the Nptl/genes in the middle. $5055-14 contains both loci. (e) Summary of the T-DNA inserts in the $5055 plants shown in (a)-(c). Those indicated by an asterisk produce flowers in which the expression of Chs is silenced.
exact breakpoint was not determined but since a normal Nptll mRNA is produced (not shown), the Nptll coding region is intact, as well as part of the nos promoter.
T-DNA loci of transformant PSE21-I
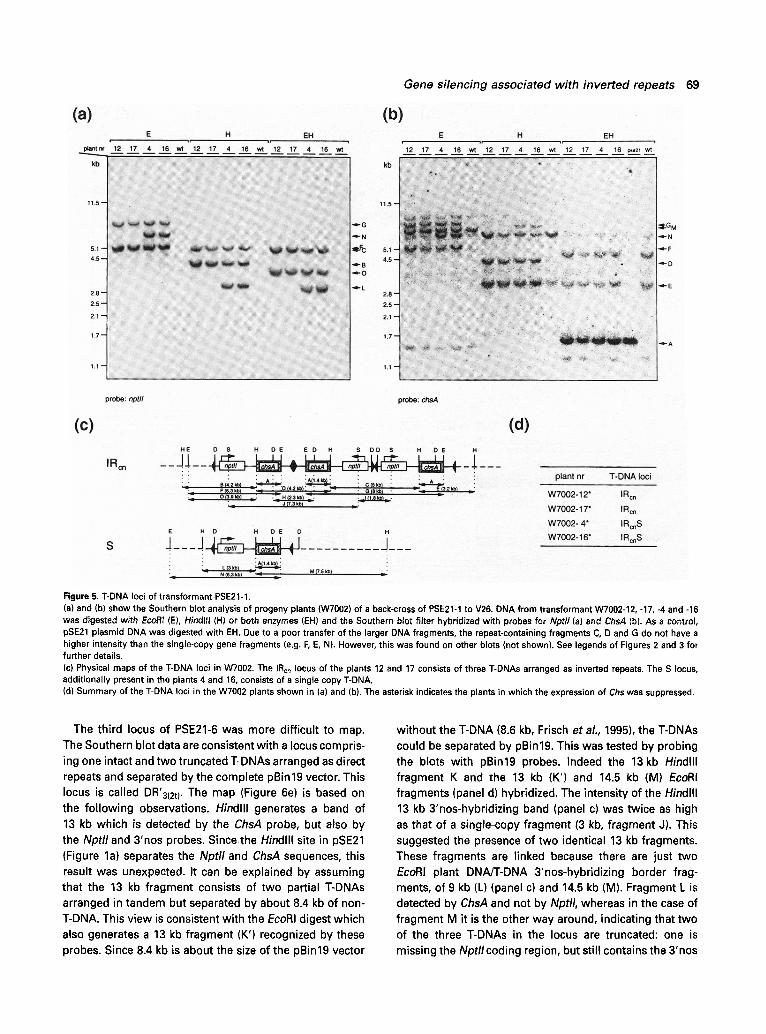
The T-DNA inserts of this transformant were examined in four progeny plants of a back-cross of PSE21-1 to V26 (W7002 progeny, Figures lb and 5d). Hindlll generates fragments of 4.2 kb (B), 5 kb (C) and 3 kb (L) that hybridize to the Nptll probe (Figure 5a, lanes H). The fragments B and C co-segregate and are derived from a T-DNA locus harbouring three T-DNAs which are all inverted relative to one another (IRcn). Fragment C fits with an IR fragment which contains two Nptll genes which are centred around the RB. In addition to the endogenous ChsA gene frag- ments, the ChsA probe (panel (b), lanes H) detected two Hindlll fragments of 4.2 kb (D) and 3.2 kb (E). Fragment D
has the expected size of an IR-fragment centred around the LB and which carries two ChsA transgenes. The pro- posed IRcn structure is consistent with the EcoRI digest as the Nptll (panel (a), lanes E) and ChsA probes (panel (b), lanes E) detect a 5.3 kb fragment (F) and a fragment of the expected 8 kb (G). The double IR configuration was confirmed by Dral and Sphl digests (H and I, panel (c)).
The second locus consists of a monomeric T-DNA (S). Consistent with this organization is that the ChsA probe detects a single 7.5 kb Hindlll fragment (M, panel (b), lanes H) and EcoRI gives rise to a single 6.3 kb fragment (N) detected by the Nptll (panel (a)) and ChsA probes
(panel (b)). The T-DNAs of both loci are intact, as the EcoRI/I-lindlll
(panels (a) and (b), lanes EH), EcoRI/Dral (not shown) and EcoRI/Hindlll/Dral digests (not shown) give rise to the expected fragments with the ChsA (panel (b)) and Nptl/ probes.
68 Maike Stam et al.
Figure 4. T-DNA loci of transformant PSE19-1-4. (a) to (c) show the Southern blot analysis of progeny plants (W7001) of a back-cross of PSE19-1-4 to a V26 plant. DNA of the plants W7001-12, -18, -16, -29, and the parental plant PSE19-1-4 was digested with EcoRI (E), Hindlll (H) or both enzymes (EH) after which the filter was hybridized with a UidA probe (a), a PCaMV probe (b), or an Nptll probe (c). See legend of Figure 2 for further details. (d) Physical maps of the T-DNA loci in W7001. The S t locus in the plants 12 and 18 consists of a single T-DNA truncated at the RB. The locus of the plants '16 and 29 consists of two T-DNAs arranged as ~n inverted repeat (IRct) with the UidA-ChsA genes near the centre. One of the T-DNAs is truncated at the RB, lacking the Nptll gene, the PcaMv and part of the UidA coding region. The parental plant PSE19-1-4 contains both loci. E*, (partially) modified EcoRI site. (e) Summary of the T-DNA loci in the W7001 plants shown in (a)-(c). Those indicated by an asterisk produce flowers in which Chs expression is silenced.
Twenty-eight plants contained both T-DNA loci, five plants contained just the IRcn locus. No plants were obtained with only the S locus. These results suggest that PSE21-1 harbours two T-DNA loci on the same chromo- some. A X 2 test indicated that the IRcn and S loci are
separated by at least 16 cM.
T-DNA loci of transformant PSE21-6
The inserts of this transformant were examined in six progeny plants of a back-cross of PSE21-6 to V26 (W7003
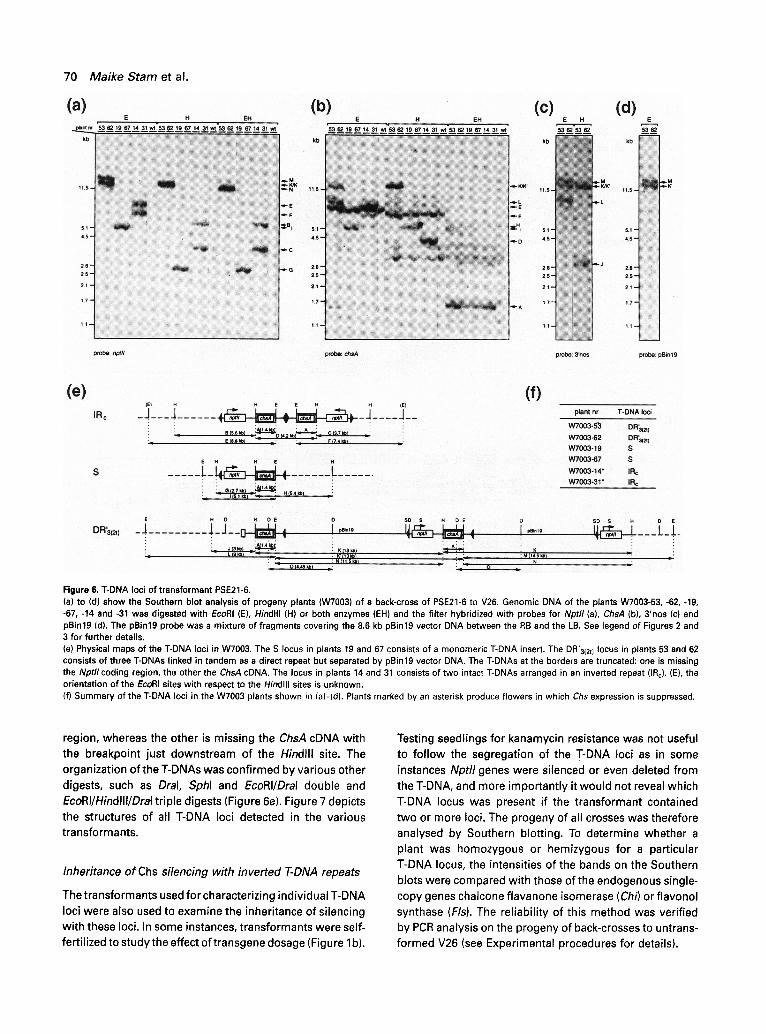
progeny, Figures lb and 6f). In addition to the fragments derived from the endogenous ChsA genes, Hindlll gener- ates fragments of 4,2 kb (D, plant nos. 14 and 31), 5.4 kb (H, plant nos. 19 and 67) and 13 kb (K, plant nos. 53 and 62) with the ChsA probe (Figure 6b, lanes H). In the progeny, these three fragments segregate in a Mendelian manner indicating that they are derived from three separate loci located on different chromosomes. Fragment D is derived
from an IR locus composed of two T-DNAs with the Chs
transgene sequences near the centre of the IR (IRc). It has the expected size for an IRc fragment and the hybridization signal is twice as high as that of the single-copy fragment H (see below). Furthermore, the Nptll probe (panel (a), lanes H) detects two Hindlll fragments, of 5.6 kb (B) and
3.7 kb (C). The IR c structure is also consistent with the
EcoRI digest, as it generated two fragments of 8.8 kb (E) and 7.4 kb (F) detected by the Nptlt (panel (a), lanes E) and ChsA probes (panel (b), lanes E).
The 5.4 kb Hindlll f ragment (H) is derived from a mono- meric T-DNA locus (S), from which the single 2.7 kb
Nptll-hybridizing f ragment (G, lanes H) is also derived. EcoRI generates a single 5.1 kb fragment (I) detected by the Nptll (panel (a), lanes E) and ChsA probes (panel (b), lanes E).
The T-DNAs of the IR and the S locus are intact as the EcoRI/Hindlll (panels (a) and (b), lanes EH) and EcoRI/ Hindlll/Dral (not shown) digests produce the expected fragments hybridizing to the ChsA (panel (b), lanes EH)
and Nptll probes (not shown).
Gene silencing associated with inverted repeats 69
Figure 5. T-DNA loci of transformant PSE21-1. (a) and (b) show the Southern blot analysis of progeny plants (W7002) of a back-cross of PSE21-1 to V26. DNA from transformant W7002-12, -17, -4 and -16 was digested with EcoRI (E), Hindlll (H) or both enzymes (EHI and the Southern blot filter hybridized with probes for Nptll (a) and ChsA (b). As a control, pSE21 plasmid DNA was digested with EH. Due to a poor transfer of the larger DNA fragments, the repeat-containing fragments C, D and G do not have a higher intensity than the single-copy gene fragments (e.g. F, E, N). However, this was found on other blots (not shown). See legends of Figures 2 and 3 for further details. (c) Physical maps of the T-DNA loci in W7002. The IRon locus of the plants 12 and 17 consists of three T-DNAs arranged as inverted repeats. The S locus, additionally present in the plants 4 and 16, consists of a single copy T-DNA. (d) Summary of the T-DNA loci in the W7002 plants shown in (a) and (b). The asterisk indicates the plants in which the expression of Chs was suppressed.
The third locus of PSE21-6 was more difficult to map. The Southern blot data are consistent with a locus compris- ing one intact and two truncated T-DNAs arranged as direct repeats and separated by the complete pBin19 vector. This locus is called DR'312t ). The map (Figure 6e) is based on the fol lowing observations. Hindlll generates a band of 13 kb which is detected by the ChsA probe, but also by the Nptll and 3'nos probes. Since the Hindlll site in pSE21 (Figure la) separates the Nptll and ChsA sequences, this result was unexpected. It can be explained by assuming that the 13 kb fragment consists of two partial T-DNAs arranged in tandem but separated by about 8.4 kb of non- T-DNA. This view is consistent with the EcoRI digest which also generates a 13 kb fragment (K') recognized by these probes. Since 8.4 kb is about the size of the pBin19 vector
without the T-DNA (8.6 kb, Frisch et al., 1995), the T-DNAs could be separated by pBin19. This was tested by probing the blots with pBin19 probes. Indeed the 13 kb Hindlll fragment K and the 13 kb (K') and 14.5 kb (M) EcoRI fragments (panel d) hybridized. The intensity of the Hindlll 13 kb 3'nos-hybridizing band (panel c) was twice as high as that of a single-copy fragment (3 kb, fragment J). This suggested the presence of two identical 13 kb fragments. These fragments are linked because there are just two EcoRI plant DNA/T-DNA 3'nos-hybridizing border frag- ments, of 9 kb (L) (panel c) and 14.5 kb (M). Fragment L is detected by ChsA and not by NptU, whereas in the case of fragment M it is the other way around, indicating that two of the three T-DNAs in the locus are truncated: one is missing the Nptllcoding region, but still contains the 3'nos
70 Maike Stare et al.
Figure 6. T-DNA loci of transformant PSE21-6. (a) to (d) show the Southern blot analysis of progeny plants (W7003) of a back-cross of PSE21-6 to V26. Genomic DNA of the plants W7003-53, -62, -19, -67, -14 and -31 was digested with EcoRI (E), Hindlll (H) or both enzymes (EH) and the filter hybridized with probes for Nptll (a), ChsA (b), 3'nos (c) and pBin19 (d). The pBin19 probe was a mixture of fragments covering the 8.6 kb plBin19 vector DNA between the RB and the LB. See legend of Figures 2 and 3 for further details. (e) Physical maps of the T-DNA loci in W7003. The S locus in plants 19 and 67 consists of a monomeric T-DNA insert. The DR'3(2t) locus in plants 53 and 62 consists of three T-DNAs linked in tandem as a direct repeat but separated by pSin19 vector DNA. The T-DNAs at the borders are truncated: one is missing the Npt//coding region, the other the ChsA cDNA. The locus in plants 14 and 31 consists of two intact T-DNAs arranged in an inverted repeat (IRc). (E), the orientation of the EcoRI sites with respect to the Hindlll sites is unknown. (f) Summary of the T-DNA loci in the W7003 plants shown in (a)-(d). Plants marked by an asterisk produce flowers in which Chs expression is suppressed.
region, whereas the other is missing the ChsA cDNA wi th the breakpoint just downs t ream of the Hindlll site. The
organizat ion of the T-DNAs was conf i rmed by various other
digests, such as Dral, Sphl and EcoRI/Dral double and EcoRI/Hindlll/Dral t r ip le digests (Figure 6e). Figure 7 depicts the structures of all T-DNA loci detected in the var ious t ransformants.
Inheritance of Chs silencing with inverted T-DNA repeats
The t ransformants used for character iz ing indiv idual T-DNA
loci were also used to examine the inheri tance of si lencing wi th these loci. In some instances, t ransformants were self- fert i l ized to study the effect of t ransgene dosage (Figure lb) .
Testing seedl ings for kanamycin resistance was not useful
to fo l l ow the segregat ion of the T-DNA loci as in some
instances Nptll genes were si lenced or even deleted f rom the T-DNA, and more impor tant ly it wou ld not reveal which
T-DNA locus was present if the t ransformant contained two or more loci. The progeny of all crosses was therefore analysed by Southern blott ing. To determine whether a plant was homozygous or hemizygous for a part icular
T-DNA locus, the intensit ies of the bands on the Southern blots were compared wi th those of the endogenous single-
copy genes chalcone f lavanone isomerase (Chi) or f lavonol synthase (FIs). The rel iabi l i ty of this method was veri f ied by PCR analysis on the progeny of back-crosses to untrans- fo rmed V26 (see Exper imental procedures for details).
P S E 6 - 2
IRnt __ 0~..,.,~ ~ "~' ~A~ __
P S E 1 9 - 3
IRn ___ ,~A-,,~ "~ 'P~ ~A-=,,~ _ -
u /~4 -chcA - - - i Al l 'e~11l St ~"" I , • ---
P S E 1 9 - 1
IRct - - ~ - -
St - - - ~ - -
P S E 2 1 - 1 ~ 4 ch~A
IRcn - - -~ 'J ;
S - - ~ - -
P S E 2 1 - 6
IR c ---~l-~.tl ~ ¢ °~ it'~. ip__
S - - ~ - -
DR'3(2t) __ 0~'~ ~,9 ~,, ~,A ~,,~ ~,, ___
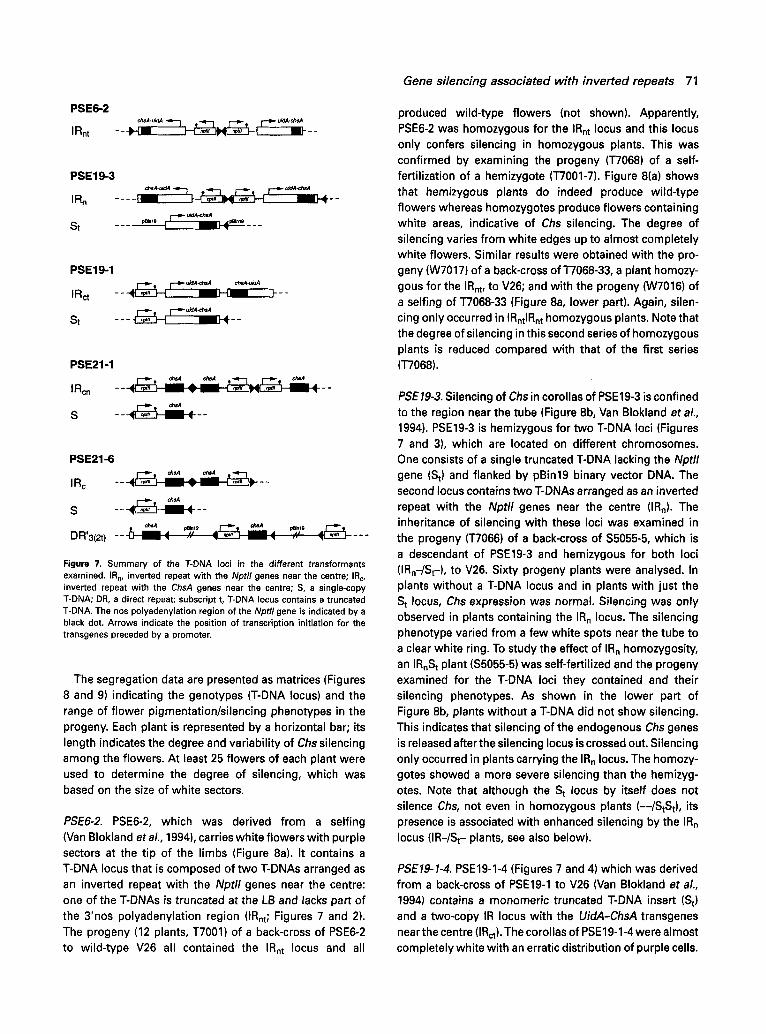
Figure 7. Summary of the T-DNA loci in the different transformants examined. IR n, inverted repeat with the Nptll genes near the centre; IR c, inverted repeat with the ChaA genes near the centre; S, a single-copy T-DNA; DR, a direct repeat; subscript t, T-DNA locus contains a truncated T-DNA. The nos polyadenylation region of the Nptll gene is indicated by a black dot. Arrows indicate the position of transcription initiation for the transgenes preceded by a promoter.
The segregation data are presented as matrices (Figures 8 and 9) indicating the genotypes (T-DNA locus) and the range of flower pigmentation/silencing phenotypes in the progeny. Each plant is represented by a horizontal bar; its length indicates the degree and variability of Chs silencing among the flowers. At least 25 flowers of each plant were used to determine the degree of silencing, which was based on the size of white sectors.
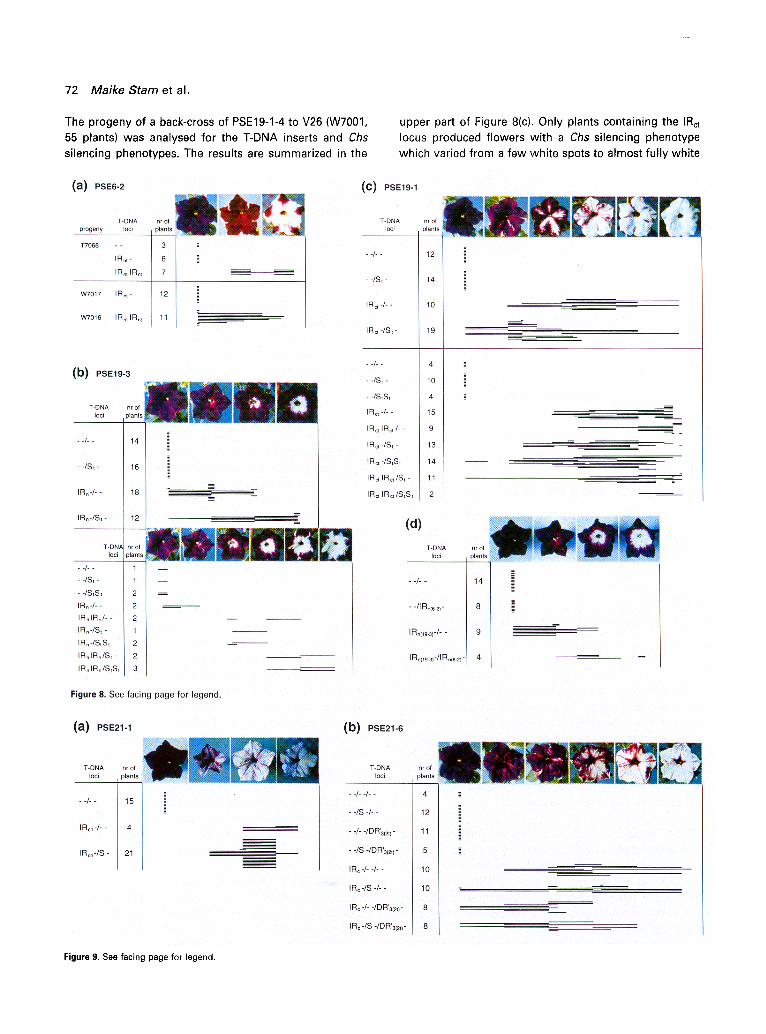
PSE6-2. PSE6-2, which was derived from a selfing (Van Blokland et aL, 1994), carries white flowers with purple sectors at the tip of the limbs (Figure 8a). It contains a T-DNA locus that is composed of two T-DNAs arranged as an inverted repeat with the Nptll genes near the centre: one of the T-DNAs is truncated at the LB and lacks part of the 3'nos polyadenylation region (IRnt; Figures 7 and 2). The progeny (12 plants, T7001) of a back-cross of PSE6-2 to wild-type V26 all contained the IRnt locus and all
Gene silencing associated with inverted repeats 71
produced wild-type flowers (not shown). Apparently, PSE6-2 was homozygous for the IRnt locus and this locus only confers silencing in homozygous plants. This was confirmed by examining the progeny (T7068) of a self- fertilization of a hemizygote (T7001-7). Figure 8(a) shows that hemizygous plants do indeed produce wild-type flowers whereas homozygotes produce flowers containing white areas, indicative of Chs silencing. The degree of silencing varies from white edges up to almost completely white flowers. Similar results were obtained with the pro- geny (W7017) of a back-cross of T7068-33, a plant homozy- gous for the IRnt, to V26; and with the progeny (W7016) of a selfing of T7068-33 (Figure 8a, lower part). Again, silen- cing only occurred in IRntlRnt homozygous plants. Note that the degree of silencing in this second series of homozygous plants is reduced compared with that of the first series (T7068).
PSE19-3. Silencing of Chs in corollas of PSE19-3 is confined to the region near the tube (Figure 8b, Van Blokland et al., 1994). PSE19-3 is hemizygous for two T-DNA loci (Figures 7 and 3), which are located on different chromosomes. One consists of a single truncated T-DNA lacking the Nptll gene (St) and flanked by pBin19 binary vector DNA. The second locus contains two T-DNAs arranged as an inverted repeat with the Nptll genes near the centre (IRn). The inheritance of silencing with these loci was examined in the progeny (T7066) of a back-cross of S5055-5, which is a descendant of PSE19-3 and hemizygous for both loci (IRn-/St-), to V26. Sixty progeny plants were analysed. In plants without a T-DNA locus and in plants with just the St locus, Chs expression was normal. Silencing was only observed in plants containing the IR n locus. The silencing phenotype varied from a few white spots near the tube to a clear white ring. To study the effect of IR n homozygosity, an IRnSt plant (S5055-5) was self-fertilized and the progeny examined for the T-DNA loci they contained and their silencing phenotypes. As shown in the lower part of Figure 8b, plants without a T-DNA did not show silencing. This indicates that silencing of the endogenous Chs genes is released after the silencing locus is crossed out. Silencing only occurred in plants carrying the IRn locus. The homozy- gotes showed a more severe silencing than the hemizyg- otes. Note that although the S t locus by itself does not silence Chs, not even in homozygous plants (--/StSt), its presence is associated with enhanced silencing by the IR n locus (IR-/St- plants, see also below).
PSE19-1-4. PSE19-1-4 (Figures 7 and 4) which was derived from a back-cross of PSE19-1 to V26 (Van Blokland et al., 1994) contains a monomeric truncated T-DNA insert (St) and a two-copy IR locus with the UidA-ChsA transgenes near the centre (IRct). The corollas of PSE19-1-4 were almost completely white with an erratic distribution of purple cells.
72 Maike Stam et al.
The progeny of a back-cross of PSE19-1-4 to V26 (W7001, 55 plants) was analysed for the T-DNA inserts and Chs silencing phenotypes. The results are summarized in the
upper part of Figure 8(c). Only plants containing the IRct locus produced flowers with a Chs silencing phenotype which varied from a few white spots to almost fully white
Figure 9. See facing page for legend.
flowers. The St locus was not able to induce silencing and its presence seems even to diminish silencing by the IRct
locus. The effect of homozygosity of the IRct locus was examined in the progeny of a self-fertilization of PSE19-1-
4. The progeny (X7030, 82 plants) were examined for T- DNA copy number and phenotype, and as shown in the lower part of Figure 8(c), plants wi thout a T-DNA and plants
wi th just the St locus, in a hemizygous or homozygous state, did not show silencing. Again, silencing only occurred
in plants containing the IRct ~ocus and was in homozygotes
stronger than in hemizygotes.
Silencing by promoterless ChsA transgenes is associated with inverted repeats
We have previously shown that T-DNAs containing a
promoterless ChsA cDNA can silence Chs expression post-transcriptionally (Van Blokland et al., 1994). Analysis
of 15 pr imary transformants indicated that eight contained mult iple T-DNAs and that silencing did not occur in any of the plants carrying just monomeric T-DNA insertions (Van Blokland, 1994). The three transformants that pro-
duced white or partially white f lowers contained mult imeric
T-DNA loci. We have analysed two of these transformants, PSE21-1 and PSE21-6, in more detail.
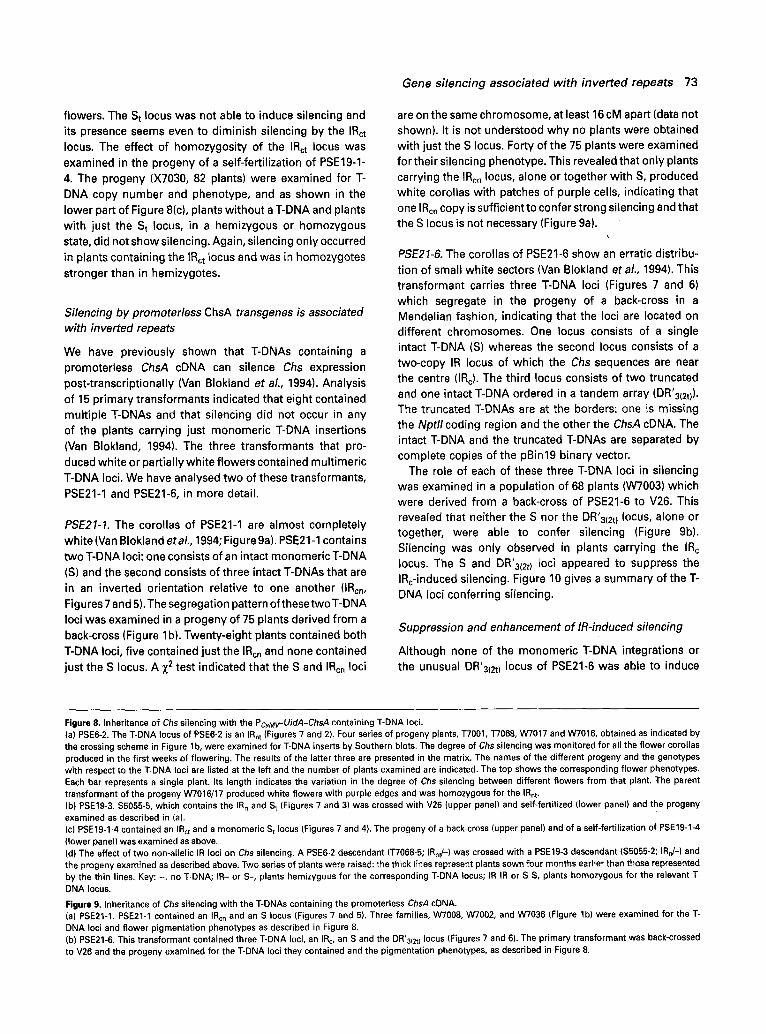
PSE21-1. The corollas of PSE21-1 are almost completely white (Van Blokland etal., 1994; Figure 9a). PSE21-1 contains
two T-DNA loci: one consists of an intact monomeric T-DNA (S) and the second consists of three intact T-DNAs that are
in an inverted orientation relative to one another (IRen, Figures 7 and 5). The segregation pattern of these two T-DNA loci was examined in a progeny of 75 plants derived from a
back-cross (Figure lb). Twenty-eight plants contained both
T-DNA loci, five contained just the IRcn and none contained just the S locus. A ~2 test indicated that the S and IRcn loci
Gene si lencing associated with inverted repeats 73
are on the same chromosome, at least 16 cM apart (data not shown). It is not understood why no plants were obtained with just the S locus. Forty of the 75 plants were examined for their silencing phenotype. This revealed that only plants carrying the IRcn locus, alone or together wi th S, produced white corollas with patches of purple cells, indicating that one I Rcn copy is sufficient to confer strong silencing and that the S locus is not necessary (Figure 9a).
PSE21-6, The corollas of PSE21-6 show an erratic distribu-
tion of small white sectors (Van Blokland et al., 1994). This transformant carries three T-DNA loci (Figures 7 and 6) which segregate in the progeny of a back-cross in a Mendelian fashion, indicating that the loci are located on different chromosomes. One locus consists of a single intact T-DNA (S) whereas the second locus consists of a two-copy IR locus of which the Chs sequences are near the centre (IRc). The third locus consists of two truncated and one intact T-DNA ordered in a tandem array (DR'3(2t)). The truncated T-DNAs are at the borders: one is missing the Nptll coding region and the other the ChsA cDNA. The intact T-DNA and the truncated T-DNAs are separated by complete copies of the pBin19 binary vector.
The role of each of these three T-DNA loci in silencing was examined in a population of 68 plants (W7003) which were derived from a back-cross of PSE21-6 to V26. This revealed that neither the S nor the DR'3(2t ) locus, alone or together, were able to confer silencing (Figure 9b). Silencing was only observed in plants carrying the IRc Locus. The S and DR'3(2t ) Loci appeared to suppress the IRc-induced silencing. Figure 10 gives a summary of the T- DNA loci conferring silencing.
Suppression and enhancement of IR-induced silencing
Although none of the monomeric T-DNA integrations or the unusual OR'3(2t ) locus of PSE21-6 was able to induce
Figure 8. Inheritance of Chs silencing with the PCaMv-UidA-ChsA containing T-DNA loci. (a) PSE6-2. The T-DNA locus of PSE6-2 is an IRnt (Figures 7 and 2). Four series of progeny plants, T7001, T7068, W7017 and W7016, obtained as indicated by the crossing scheme in Figure lb, were examined for T-DNA inserts by Southern blots. The degree of Chs silencing was monitored for all the flower corollas produced in the first weeks of flowering. The results of the latter three are presented in the matrix. The names of the different progeny and the genotypes with respect to the T-DNA loci are listed at the left and the number of plants examined are indicated. The top shows the corresponding flower phenotypes. Each bar represents a single plant. Its length indicates the variation in the degree of Chs silencing between different flowers from that plant. The parent transformant of the progeny W7016/17 produced white flowers with purple edges and was homozygous for the IRnt. (b) PSE19-3. S5055-5, which contains the IR n and S t (Figures 7 and 3) was crossed with V26 (upper panel) and self-fertilized (lower panel) and the progeny examined as described in (a). (c) PSE19-1-4 contained an IRct and a monomeric S t locus (Figures 7 end 4). The progeny of a back-cross (upper panel) and of a self-fertilization of PSE19-1-4 (lower panel) was examined as above, (d) The effect of two non-allelic IR loci on Chs silencing. A PSE6-2 descendant (T7068-5; IRnt/-) was crossed with a PSE19-3 descendant (S5055-2; IRn/-) and the progeny examined as described above. Two series of plants were raised: the thick lines represent plants sown four months earlier than those represented by the thin lines. Key: --, no T-DNA; IR- or S-, plants hemizygous for the corresponding T-DNA locus; IR IR or S S, plants homozygous for the relevant T- DNA locus. Figure 9. Inheritance of Chs silencing with the T-DNAs containing the promoterless ChsA cDNA. (a) PSE21-1. PSE21-1 contained an IRcn and an S locus (Figures 7 and 5). Three families, W7008, W7002, and W7036 (Figure lb) were examined for the T- DNA loci and flower pigmentation phenotypes as described in Figure 8. (b) PSE21-6. This transformant contained three T-DNA loci, an IRc, an S and the OR'3(2t ) lOCUS (Figures 7 and 6). The primary transformant was back-crossed to V26 and the progeny examined for the T-DNA loci they contained and the pigmentation phenotypes, as described in Figure 8.
74 Maike Stam et al.
Transformant Silencing locus Chs silencing hemi- homo- zygous zygous
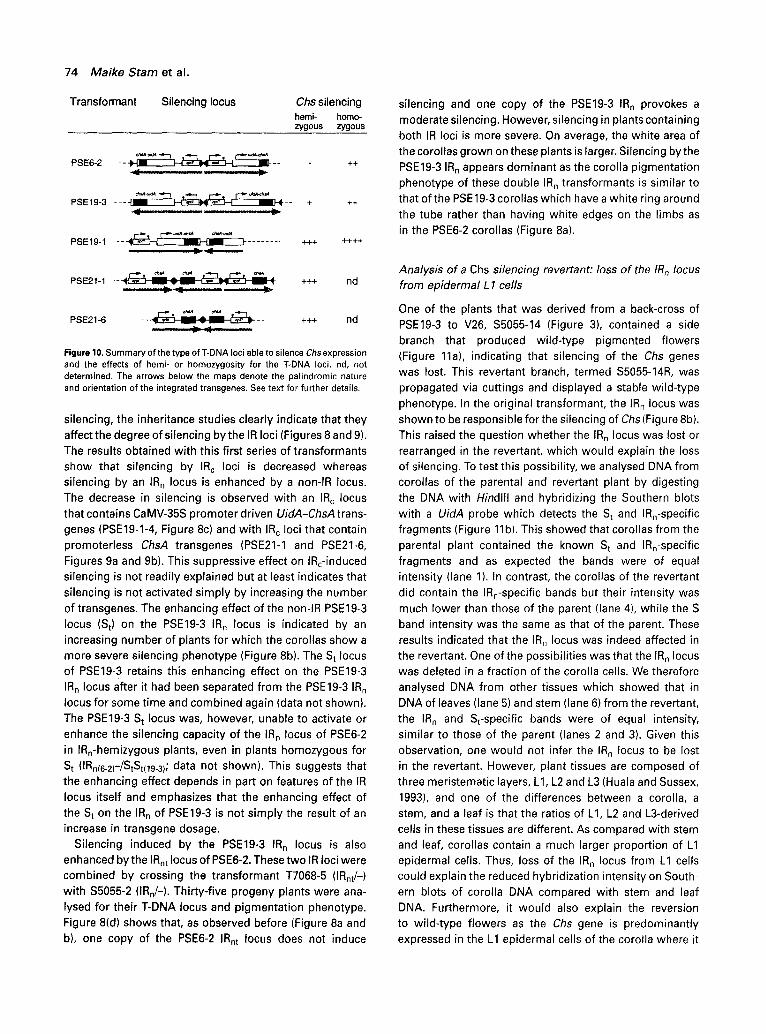
PsE6-2 --+~= ~ , ~ , ~ r " ~ _ _ + +
PSE19-1 " - ~ .... . . . . + ÷ ÷ + + + +
PSE21-6 ---9 ~ ~ ~ p--- +++ nd
Figure 10. Summary of the type of T-DNA loci able to silence Chs expression and the effects of hemi- or homozygosity for the T-DNA loci. nd, not determined. The arrows below the maps denote the palindromic nature and orientation of the integrated transgenes. See text for further details.
silencing, the inheritance studies clearly indicate that they affect the degree of silencing bythe IR loci (Figures 8 and 9). The results obtained with this first series of transformants show that silencing by IRc loci is decreased whereas silencing by an IR n locus is enhanced by a non-IR locus. The decrease in silencing is observed with an IR c locus that contains CaMV-35S promoter driven UidA-ChsA trans- genes (PSE19-1-4, Figure 8c) and with IR c loci that contain promoterless ChsA transgenes (PSE21-1 and PSE21-6, Figures 9a and 9b). This suppressive effect on IRc-induced silencing is not readily explained but at least indicates that silencing is not activated simply by increasing the number of transgenes. The enhancing effect of the non-IR PSE19-3 locus (S t ) on the PSE19-3 IR n locus is indicated by an increasing number of plants for which the corollas show a more severe silencing phenotype (Figure 8b). The St locus of PSE19-3 retains this enhancing effect on the PSE19-3 IR n locus after it had been separated from the PSE19-3 IR n locus for some time and combined again (data not shown). The PSE19-3 S t locus was, however, unable to activate or enhance the silencing capacity of the IRn locus of PSE6-2 in IRn-hemizygous plants, even in plants homozygous for St (Ian(6-2)-/StSt(19-3); data not shown). This suggests that the enhancing effect depends in part on features of the IR locus itself and emphasizes that the enhancing effect of the St on the IRn of PSE19-3 is not simply the result of an increase in transgene dosage.
Silencing induced by the PSE19-3 IRn locus is also enhanced by the IRnt locus of PSE6-2. These two IR loci were combined by crossing the transformant T7068-5 (IRnt/-) with S5055-2 (IRn/-). Thirty-five progeny plants were ana- lysed for their T-DNA locus and pigmentation phenotype. Figure 8(d) shows that, as observed before (Figure 8a and b), one copy of the PSE6-2 IRnt locus does not induce
silencing and one copy of the PSE19-3 IRn provokes a moderate silencing. However, silencing in plants containing both IR loci is more severe. On average, the white area of the corollas grown on these plants is larger. Silencing bythe PSE19-3 IR n appears dominant as the corolla pigmentation phenotype of these double IR n transformants is similar to that of the PSE 19-3 corollas which have a white ring around the tube rather than having white edges on the limbs as in the PSE6-2 corollas (Figure 8a).
Analysis of a Chs silencing revertant: loss of the IRn locus from epidermal L 1 cells
One of the plants that was derived from a back-cross of PSE19-3 to V26, $5055-14 (Figure 3), contained a side branch that produced wild-type pigmented flowers (Figure 11a), indicating that silencing of the Chs genes was lost. This revertant branch, termed $5055-14R, was propagated via cuttings and displayed a stable wild-type phenotype. In the original transformant, the IRn locus was shown to be responsible for the silencing of Chs (Figure 8b). This raised the question whether the IRn locus was lost or rearranged in the revertant, which would explain the loss of silencing. To test this possibility, we analysed DNA from corollas of the parental and revertant plant by digesting the DNA with Hindlll and hybridizing the Southern blots with a UidA probe which detects the S t and IRn-specific fragments (Figure 11b). This showed that corollas from the parental plant contained the known St and IRn-specific fragments and as expected the bands were of equal intensity (lane 1). In contrast, the corollas of the revertant did contain the IRn-specific bands but their intensity was much lower than those of the parent (lane 4), while the S band intensity was the same as that of the parent. These results indicated that the IRn locus was indeed affected in the revertant. One of the possibilities was that the IRn locus was deleted in a fraction of the corolla cells. We therefore analysed DNA from other tissues which showed that in DNA of leaves (lane 5) and stem (lane 6) from the revertant, the IR n and St-specific bands were of equal intensity, similar to those of the parent (lanes 2 and 3). Given this observation, one would not infer the IR n locus to be lost in the revertant. However, plant tissues are composed of three meristematic layers, L1, L2 and L3 (Huala and Sussex, 1993), and one of the differences between a corolla, a stem, and a leaf is that the ratios of L1, L2 and L3-derived cells in these tissues are different. As compared with stem and leaf, corollas contain a much larger proportion of L1 epidermal cells. Thus, loss of the IRn locus from L1 cells could explain the reduced hybridization intensity on South- ern blots of corolla DNA compared with stem and leaf DNA. Furthermore, it would also explain the reversion to wild-type flowers as the Chs gene is predominantly expressed in the L1 epidermal cells of the corolla where it
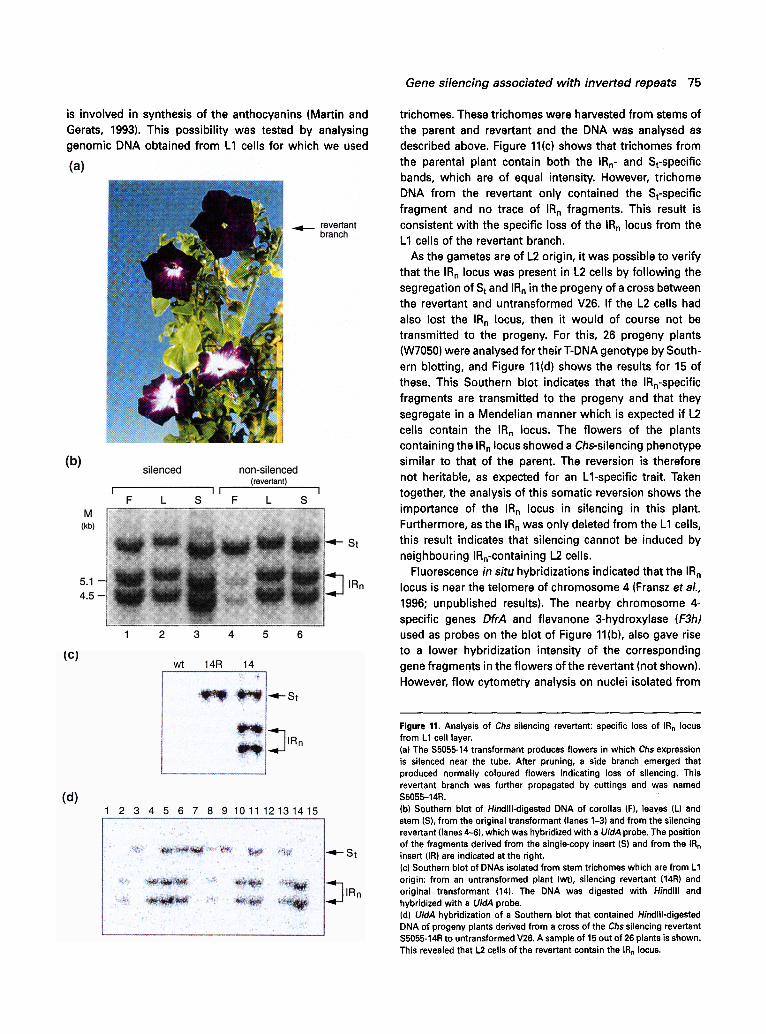
is involved in synthesis of the anthocyanins (Martin and Gerats, 1993). This possibility was tested by analysing genomic DNA obtained from L1 cells for which we used
Gene silencing associated with inverted repeats 75
trichomes. These trichomes were harvested from stems of the parent and revertant and the DNA was analysed as described above. Figure 11(c) shows that trichomes from the parental plant contain both the IR n- and St-specific bands, which are of equal intensity. However, trichome DNA from the revertant only contained the St-specific fragment and no trace of IRn fragments. This result is consistent with the specific loss of the IRn locus from the L1 cells of the revertant branch.
As the gametes are of L2 origin, it was possible to verify that the IRn locus was present in L2 cells by following the segregation of St and IRn in the progeny of a cross between the revertant and untransformed V26. If the L2 cells had also lost the IR n locus, then it would of course not be transmitted to the progeny. For this, 26 progeny plants (W7050) were analysed for their T-DNA genotype by South- ern blotting, and Figure 11(d) shows the results for 15 of these. This Southern blot indicates that the IRn-specific fragments are transmitted to the progeny and that they segregate in a Mendelian manner which is expected if L2 cells contain the IRn locus. The flowers of the plants containing the IRn locus showed a Chs-silencing phenotype similar to that of the parent. The reversion is therefore not heritable, as expected for an Ll-specific trait. Taken together, the analysis of this somatic reversion shows the importance of the IR n locus in silencing in this plant. Furthermore, as the IRn was only deleted from the L1 cells, this result indicates that silencing cannot be induced by neighbouring IRn-containing L2 cells.
Fluorescence in situ hybridizations indicated that the IR n locus is near the telomere of chromosome 4 (Fransz et al., 1996; unpublished results). The nearby chromosome 4- specific genes DfrA and flavanone 3-hydroxylase (F3h) used as probes on the blot of Figure 11(b), also gave rise to a lower hybridization intensity of the corresponding gene fragments in the flowers of the revertant (not shown). However, flow cytometry analysis on nuclei isolated from
Figure 11. Analysis of Chs silencing revertant: specific loss of IR n locus from L1 cell layer, (a) The $5055-14 transformant produces flowers in which Chs expression is silenced near the tube. After pruning, a side branch emerged that produced normally coloured flowers indicating loss of silencing. This revertant branch was further propagated by cuttings and was named $5055-14R. (b) Southern blot of Hindlll-digested DNA of corollas (F), leaves (L) and stem (S), from the original transformant (lanes 1-3) and from the silencing revertant (lanes 4-6), which was hybridized with a UidA probe. The position of the fragments derived from the single-copy insert (S) and from the IR n insert (IR) are indicated at the right. (c) Southern blot of DNAs isolated from stem trichomes which are from L1 origin: from an untransformed plant (wt), silencing revertant (14R) and original transformant (14). The DNA was digested with Hindlll and hybridized with a UidA probe. (d) UidA hybridization of a Southern blot that contained Hindlll-digested DNA of progeny plants derived from a cross of the Chs silencing revertant $5055-14R to untransformed V26. A sample of 15 out of 26 plants is shown. This revealed that L2 cells of the revertant contain the IRn locus.
76 Maike Stam et al.
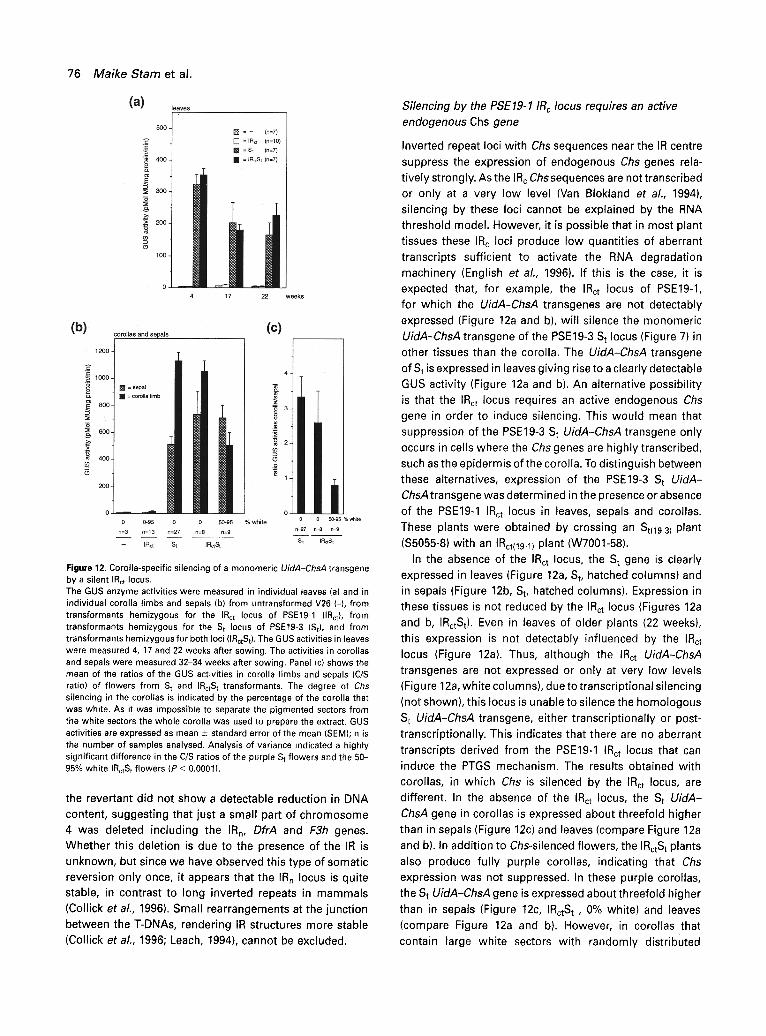
Figure 12. Corolla-specific silencing of a monomeric UidA-ChsA transgene by a silent IRct locus. The GUS enzyme activities were measured in individual leaves (a) and in individual corolla limbs and sepals (b) from untransformed V26 (-), from transformants hemizygous for the IRct locus of PSE19-1 (IRct), from transformants hemizygous for the S t locus of PSE19-3 (St), and from transformants hemizygous for both loci (IRctSt). The GUS activities in leaves were measured 4, 17 and 22 weeks after sowing. The activities in corollas and sepals were measured 32-34 weeks after sowing. Panel (c) shows the mean of the ratios of the GUS activities in corolla limbs and sepals (C/S ratio) of flowers from S t and IRctS t transformants, The degree of Chs silencing in the corollas is indicated by the percentage of the corolla that was white. As it was impossible to separate the pigmented sectors from the white sectors the whole corolla was used to prepare the extract. GUS activities are expressed as mean _+ standard error of the mean (SEM); n is the number of samples analysed. Analysis of variance indicated a highly significant difference in the C/S ratios of the purple St flowers and the 50- 95% white IRctS t flowers (P < 0.0001).
the revertant did not show a detectable reduction in DNA content, suggesting that just a small part of chromosome 4 was deleted including the IRn, DfrA and F3h genes. Whether this deletion is due to the presence of the IR is unknown, but since we have observed this type of somatic reversion only once, it appears that the IRn locus is quite stable, in contrast to long inverted repeats in mammals (Collick et aL, 1996). Small rearrangements at the junction between the T-DNAs, rendering IR structures more stable (Collick et al,, 1996; Leach, 1994), cannot be excluded.
Silencing by the PSE19-1 IR c locus requires an active endogenous Chs gene
Inverted repeat loci with Chs sequences near the IR centre
suppress the expression of endogenous Chs genes rela- tively strongly. As the I R c Chs sequences are not transcribed or only at a very low level (Van Blokland et al., 1994), silencing by these loci cannot be explained by the RNA threshold model. However, it is possible that in most plant tissues these IRc loci produce low quantities of aberrant transcripts sufficient to activate the RNA degradation machinery (English et al., 1996). If this is the case, it is expected that, for example, the IRct locus of PSE19-1, for which the UidA-ChsA transgenes are not detectably expressed (Figure 12a and b), will silence the monomeric UidA-ChsA transgene of the PSE19-3 S t locus (Figure 7)in other tissues than the corolla. The UidA-ChsA transgene
of St is expressed in leaves giving rise to a clearly detectable GUS activity (Figure 12a and b). An alternative possibility is that the IRct locus requires an active endogenous Chs gene in order to induce silencing. This would mean that suppression of the PSE19-3 St UidA-ChsA transgene only occurs in cells where the Chs genes are highly transcribed, such as the epidermis of the corolla. To distinguish between these alternatives, expression of the PSE19-3 St UidA- ChsA transgene was determined in the presence or absence of the PSE19-1 IRct locus in leaves, sepals and corollas.
These plants were obtained by crossing an St(19_3) plant ($5055-8) with an IRct(19.1) plant (W7001-58).
In the absence of the IRct locus, the St gene is clearly expressed in leaves (Figure 12a, St, hatched columns) and in sepals (Figure 12b, St, hatched columns). Expression in these tissues is not reduced by the IRct locus (Figures 12a and b, IRctSt). Even in leaves of older plants (22 weeks), this expression is not detectably influenced by the IRct locus (Figure 12a). Thus, although the IRct UidA-ChsA transgenes are not expressed or only at very low levels (Figure 12a, white columns), due to transcriptional silencing
(not shown), this locus is unable to silence the homologous S t UidA-ChsA transgene, either transcriptionally or post- transcriptionally. This indicates that there are no aberrant
transcripts derived from the PSE19-1 IRct locus that can induce the PTGS mechanism. The results obtained with corollas, in which Chs is silenced by the IRct locus, are different. In the absence of the IRct locus, the St UidA- ChsA gene in corollas is expressed about threefold higher than in sepals (Figure 12c) and leaves (compare Figure 12a
and b). In addition to Chs-silenced flowers, the IRotS t plants also produce fully purple corollas, indicating that Chs expression was not suppressed. In these purple corollas, the St UidA-ChsA gene is expressed about threefold higher
than in sepals (Figure 12c, IRctS t , 0% white) and leaves (compare Figure 12a and b). However, in corollas that contain large white sectors with randomly distributed
purple cells, the expression is fourfold reduced (Figure 12c, IRctSt, 50-95% white) as compared with that in purple corollas with just the S t locus. Taken together, these results show that down-regulation of the St transgene by the IRct locus only occurs in tissues in which the endogenous Chs genes are normally highly active, and moreover, only when they are post-transcriptionally silenced. This co-ordinate silencing of the St locus and the endogenous genes by the IRct locus thus appears to require transcription of the endogenous Chs genes. That the St UidA-ChsA gene is not completely silenced can be attributed to the fact that it might still be expressed in the L2 cell layer which is sandwiched between the upper and lower epidermis and which is not transcribing Chs, and the fact that the flowers tested still contained 5-50% purple cells in which the UidA- ChsA transgene of the St is probably expressed as it is in purple flowers (Figure 12c). It was not possible to verify this because the GUS activity was too low to detect it histochemically. These results are consistent with a model in which aberrant RNAs, thought to be necessary to induce the RNA degradation machinery, are derived from one or more of the endogenous genes, We infer that this happens as a consequence of an ectopic interaction with the IR locus. Why the IRct locus does not inactivate the St locus in this way is not understood.
Discussion
To obtain an insight into the mechanism(s) of post-tran- scriptional silencing of endogenous genes, we have identi- fied and physically characterized the T-DNA loci responsible for the silencing of endogenous Chs genes in a series of previously described transformants (Van Blokland eta/., 1994). Our results show that silencing is associated with the presence of multimeric T-DNA loci in which the T-DNAs, which harbour the transgenes, are arranged as inverted repeats. This was found for the chimaeric UidA-ChsA transgenes driven by the CaMV 35S promoter and for the promoterless ChsA transgene.
Structure of the T-DNA integrations
In the transformants showing gene silencing, various types of T-DNA integrations were found (Figure 7), but all con- tained a T-DNA locus that was composed of two or more T-DNAs arranged as inverted repeats. PSE6-2 and PSE19-3 contained an IR n type locus with the Nptll genes near the centre of the IR and Chs sequences distal to the centre, whereas PSE19-1 and PSE21-6 contained an IRc T-DNA locus with the Chs sequences proximal to the IR centre. PSE21-1 contained a locus composed of three T-DNAs that are arranged as inverted repeats (IRcn, Figure 7). Two T- DNA loci, DR'3(2t ) of PSE21-6 and S t of PSE19-3 (Figure 7), contained DNA from the binary vector pBin19 which was
Gene silencing associated with inverted repeats 77
used for the transfection. Co-transfection of vector DNA appears to occur rather frequently (Martineau eta/., 1994), However, as these vector DNA-containing T-DNA loci did not segregate with the silencing phenotype, these sequences are not involved in silencing. Many of the T-DNAs of both the monomeric and multimeric loci are truncated, either at the left border or at the right border. The breakpoints of these partial T-DNAs have not been precisely mapped by sequencing. However, the Southern blot analyses and the use of the various probes provided sufficient information about the parts that are missing. As silencing was not associated with the presence of a particular type of truncated T-DNA, it is unlikely that partial T-DNAs play a role in establishing silencing.
Silencing of Chs requires the presence of an IR locus
Silencing of Chs expression coincides with the presence of an IR locus (Figures 8 and 9), indicating that such a locus is important for activating the process. This is supported by the results obtained with the somatic revertant which shows that a deletion of the IR locus from L1 cells results in loss of silencing in these cells (Figure 11). Furthermore, a survey of our entire collection of transgenics so far indicates that in addition to the characterized transformants analysed in this study, 26 other transformants that con- tained silenced endogenous genes contain an IR locus or a more complex locus. In contrast, none of the monomeric T-DNA copies or the DR'3(2t ) locus of PSE21-6 conferred silencing (Figure 8 and 9) and 43 other transformants containing one or more monomeric T-DNA integrations also do not show silencing of the endogenous genes (unpublished results). This compilation and the segregation data presented in Figures 8 and 9 indicate that the structural organization of a transgene locus is important for activating the PTGS mechanism. In some other studies, PTGS was also found associated with multimeric transgene loci (De Carvalho Niebel eta/., 1995; Depicker eta/., 1996; English eta/., 1996; Hobbs et a/., 1993; Kunz eta/., 1996). However, the exact structural organization of the locus was not determined in all cases, and also the importance of the repetitive character of the silencing loci was not emphasized. In the case of Nptll (Depicker et al., 1996) and UidA silencing (English et al., 1996; Hobbs et a/., 1993), the T-DNAs were in an IR configuration. Jorgensen eta/. (1996) also observed silencing of Chs in petunia by IR loci.
However, several studies show PTGS associated with a single monomeric T-DNA locus (Dorlhac de Borne et al., 1994; Elmayan and Vaucheret, 1996; Jorgensen et al., 1996, Palauqui and Vaucheret, 1995) which raises the question about the relevance for multimeric T-DNA loci in activating the PTGS mechanism. In two of these cases, the transgenes were expressed from an enhanced CaMV 35S promoter (Elmayan and Vaucheret, 1996; Jorgensen et a/., 1996)

78 Ma ike S t a m et al.
which seems to cause suppression in all or most of the transformants. In the other two cases, a regular 35S pro- moter was used and the frequency with which silencing was observed was much lower than with the enhanced promoter. These results indicate that the higher the amount of transgene RNA accumulation, the higher the silencing frequency, which is consistent with the RNA-threshold model of PTGS. The UidA-ChsA transgenes in our con- structs were also transcribed from the regular 35S promoter but we have not observed silencing by monomeric T-DNAs. One difference is that the transcripts from our chimaeric UidA-ChsA genes hardly accumulate despite the fact that the transgenes are sometimes highly transcribed, as determined by run-on assays (Van Blokland et al., 1994). Apparently these transcripts are intrinsically unstable and therefore may not reach the proposed threshold level.
A particular threshold level can also be reached by a high transgene copy number or by increasing the number of transgenes by crossings, by combining ectopic loci or by making plants homozygous (Angenent et al., 1993; De Carvalho et aL, 1992; De Carvalho Niebel et aL, 1995; Dorlhac de Borne et al., 1994; Hart et al., 1992; Palauqui and Vaucheret, 1995; Vaucheret et al., 1995). We also observed such gene dosage effects. Plants homozygous for silencing loci and plants containing two non-allelic silencing loci show a more severe silencing phenotype than plants carrying a single silencing locus (Figure 8). These findings can be interpreted in two ways. The first is that a higher gene dosage results in a higher production of transgene RNA which is responsible for triggering the PTGS mechanism via the RNA threshold mechanism. Indeed, the silencing sequences of the IRn loci are tran- scribed (Van Blokland et al., 1994). However, monomeric UidA-ChsA transgenes in a homozygous state can be transcribed as high as those of a single IR n locus and yet do not induce silencing. Thus the amount of transcripts per se does not seem important. This is supported by the fact that strong IRc loci are barely transcribed, if at all. Another relevant observation is that the IRct locus of PSE19-1 does not silence by itself but appears to require the endogenous Chs gene (Figure 12). We therefore favour a second possibility, in which the palindromic arrangement of the silencing sequences within the IR loci plays a crucial role (see also below). How the effects of monomeric T- DNA loci on the IR loci fit in is not understood. With one locus, we observed enhancement of IRn-induced silencing (Figure 8), whereas with the others we saw a reduction in silencing by IRc loci. Whatever the underlying mechanisms of these opposite effects, these findings are not easy explained by current RNA threshold or gene dosage models.
To correlate the seemingly contradictory results with the IR loci described here and the monomeric loci described by others (Dorlhac de Borne et al., 1994; Elmayan and
Vaucheret, 1996; Jorgensen et aL, 1996, Palauqui and Vaucheret, 1995), information is required about the fate of the transcripts from the endogenous genes and/or the transgenes. It has been proposed that some kind of aberrant RNA activates or catalyses the degradation of specific transcripts (English et al., 1996; Smith et al., 1994). Follow- ing this line of reasoning, it is conceivable that there are different ways by which such an RNA species might be produced: (i) via the excessive production of stable RNA, by using a strong promoter driving the transgenes (Elmayan and Vaucheret, 1996; Goodwin et aL, 1996; Jorgensen et al., 1996; Metzlaff et aL, 1996; Smith et al., 1994); (ii) by the expression of transgenes that are modified (Ingelbrecht etal., 1994) and/or located in repeats (Depicker et al., 1996); and (iii) by the endogenous gene(s) when their expression is altered by means of a (transient) ectopic interaction with the IR locus (see below). Such an inter- action may only be possible if the transgene locus is repetitive, and perhaps more important, the silencing sequences close to the centre of an IR. If structural proper- ties of a silencing transgene locus are indeed the most important features, it is evident that the transgenes may not have to be highly transcribed, if at all (Van Blokland et al., 1994), which would explain the efficient silencing by IRc loci carrying promoterless Chs sequences.
Differences between IRc or IRn type loci
Although IRc and IRn type loci both induce silencing, they display some differences. Firstly, silencing by an IRc is more severe than by an IR n (Figures 8, 9 and 10). Secondly, the silencing capacity of an IRn locus declines in successive generations (Figures 8a; unpublished results), while that of IRc loci appears more stable. Finally, the distribution of silenced (white) cells in the corolla seems different in IR n- and IRe-containing corollas (Figures 8 and 9). The white sectors of IRn corollas have a fairly regular pattern whereas those of IRc corollas are more erratic. Jorgensen et al. (1996) also reported differences in pigmentation patterns in petunia flowers that were correlated with differences in the repetitiveness and organization of the transgene loci, Hardly anything is known about the formation of these patterns but it seems unlikely that local differences in the transcriptional activity of the endogenous genes are responsible (Jorgensen, 1995). If this is true, every silencing transformant is expected to have the same basic pigmenta- tion phenotype which is clearly not the case. The type of transgene locus seems to determine the type of variegated pigmentation pattern. Taken together, these results suggest that IRn and IRc loci may activate silencing along different pathways, which appears to be related to the different positions of the silencing sequences within the IR.
IR loci and aberrant transcripts
In several cases of post-transcriptional silencing, the level of transgene expression is also not directly correlated with the degree of silencing (English et al., 1996; Kunz et aL, 1996; Mueller et al., 1995). It has therefore been proposed that for activating the RNA degradation activity, a fraction of the transgene transcripts has to be aberrant (Baulcombe and English, 1996; Dougherty and Parks, 1995) in structure, base modification, or the degree of processing (Metzlaff et al., 1996; Van Blokland et aL, 1996). The plant-encoded RNA-dependent RNA polymerase (RdRP; Lindbo et al., 1993) may use these aberrant or excessively produced RNAs as a template and would synthesize complementary RNAs (cRNA, or antisense RNA; Dougherty and Parks, 1995) which in turn would tag other complementary RNAs for degradation by dsRNA-specific ribonucleases. A role for cRNAs, produced by the RdRP, is attractive as it explains the sequence specificity of the PTGS mechanism.
Do the characterized IR silencing loci produce such aberrant transcripts? It is unlikely that the IRc loci carrying the promoterless Chs transgenes produce aberrant tran- scripts as these sequences are not detectably transcribed. Moreover, there is no detectable read-through transcription from one repeat into the other. The T-DNA of the pBin19 vector used to generate transgenic petunia plants contains M13 DNA (Fray et al., 1994). Hybridization of labelled nascent RNA obtained by nuclear run-on transcription to M13 vector DNA did not result in signals above background levels (Van Blokland et al., 1994). It is furthermore unlikely that the detected antisense transcripts from the CaMV 35S promoter-driven UidA-ChsA transgenes (Van Blokland et al., 1994) provoke silencing because the levels are so low, and monomeric T-DNAs can produce as much antisense RNA or even more and yet not induce silencing (data not shown). As a result of specific characteristics of an IR locus, transcription of genes within such a locus could potentially result in aberrant RNAs. However, if a low level of IR-derived aberrant RNAs were responsible for activating the silent state, then silencing of the St(19-3) UidA-ChsA transgene would be expected in leaves, for example. This is not observed (Figure 12a). In partially white corollas, however, where the endogenous genes are transcriptionally highly active but post-transcriptionally silenced (Figures 12b and c), the expression of the St(19_3) UidA-ChsA transgene is fourfold lower, indicating that the gene is down-regulated. This suggests that the endogenous genes play a key role in the post-transcriptional silencing process.
One possibility is that the endogenous genes produce the aberrant RNA species. An elevated level of unspliced Chs transcripts in nuclei containing post-transcriptionally silenced Chs genes suggests that the normal production of Chs mRNA is to some extent impaired (Van Blokland
Gene silencing associated with inverted repeats 79
et al., 1996). It is therefore tempting to speculate that an IR locus, and in particular the IRc locus, is able to interact at some point during corolla development with the endo- genous Chs gene(s) via DNA-DNA pairing (Baulcombe and English, 1996; Jorgensen, 1992; Van Blokland et aL, 1994), thereby interfering with the normal processing and/or transport of transcripts and hence generating possibly aberrant RNAs.
Possible rote of IR loci in PTGS: DNA pairing
Inverted repeats are known to be a source of genomic instability in prokaryotes (Bi and Liu, 1996; Leach, 1994) and in eukaryotes (Collick et al., 1996; Gordenin et aL, 1993; Henderson and Petes, 1993; Ruskin and Fink, 1993). In contrast in plants, IR loci composed of two or three tandemly inverted repeats, each repeat 4.5 kb or more in length, appear stable. Except for one special case in which the IRn locus and part of the chromosome was specifically tost from L1 cells (Figure 11), which seems unrelated to the IR locus itself, we have no indications for gross DNA rearrangements. Small rearrangements at the centre of the IRs, which can lead to a more stable IR (Collick et aL, 1996; Leach, 1994) cannot be excluded.
In Drosophila, closely linked repeats, including inverted repeats, of a P transposon carrying a white transgene tend to become silenced by means of heterochromatin formation and which gives rise to white variegation (Dorer and Henikoff, 1994). It was proposed that pairing of the closely linked repeats may result in the formation of folded structures that are recognized by heterochromatic proteins. By analogy, similar interactions may occur between the sequences within the plant IRs, and although the Chs transgenes at the boundaries of the IR are still active, it is striking that the Chs genes near the centre are mostly inactive (Van Blokland et al., 1994). This inactivation is associated with an increased methylation (unpublished results) but whether these genes have a condensed chro- matin structure is as yet unknown, tR structures might be prone to pair with one or more of the ectopic homologous endogenous genes, which may occur even without strand displacement (Camarini-Otero and Hsieh, 1993). In this context, it is interesting to note that, in yeast, IRs create hot spots for mitotic interchromosomal recombination with single-copy sequences (Gordenin et al., 1993) indicating that palindromic DNA senses homologous sequences more easily than non-palindromic DNA, which might be related to the potential stem structures of IRs (Gordenin et al., 1993). Evidence in plants that homologous sequences sense each other and possibly pair, comes from studies of transgene loci of which the pattern of methylation is transferred to unlinked homologous transgenes (Ingelbrecht et aL, 1994; Matzke et al., 1994; Matzke et aL, 1989; Meyer et aL, 1993; Vaucheret, 1993). How this
80 Maike Starn et al.
happens is as yet unknown but may involve a gene conversion-like mechanism. However, for the silenced
endogenous Chsgenes, we have no evidence for rearrange- ments or changes in methylation.
The presumed pairing between IR sequences and
endogenous gene(s) might be stimulated by a particular chromatin structure of the IRs. It is attractive to propose a role for chromatin because a transient interaction early in
corolla development may mark or imprint the endogenous gene which later during development may alter its expres-
sion and lead to the production of aberrant transcripts• The differential silencing capacities of IR n and IRc loci (Figures 8 and 9) might be explained by assuming that the chromatin structure near the centre of an IR is different from that at the borders. Although the effect of the non-
silencing locus on an IR n locus is not readily explained, it is conceivable that in the case of S loci that reduce silencing
by an IRc locus, an increasing number of homologous sites in the genome may cause some kind of competi t ion with the IR.
Future experiments are required to obtain a better under-
standing of the special features of IR loci and to obtain direct evidence for the proposed DNA-DNA pairing as was elegantly shown for the Brown d°minant allele in Drosophila
(Csink and Henikoff, 1996; Dernburg et eL, 1996).
Experimental procedures
T-DNA constructs and plant material
The ChsA T-DNA constructs pSE19, pSE6 and pSE21 and the corresponding petunia V26 transformants have been described by Van Blokland et al. (1994). The physical maps of the T-DNA constructs are shown in Figure 1.
DNA manipulations
DNA for the Southern blot analyses was extracted from leaves, stem, corollas or trichomes (Dellaporte et al., 1983) and further purified by N-cetyI-N,N,N-trimethyl ammonium bromide (CTAB)
• precipitation. The trichomes were harvested by putting stems into liquid N 2 after which the frozen trichomes could be removed by a razor blade. DNA for the PCR analysis was obtained from seedlings (Klimyuk et aL, 1993). For the Southern blots, 5-10 lig of genomic DNA was digested overnight with the appropriate enzymes, separated on a 0.8% agarose gel at low voltage and transferred onto a Hybond-N + membrane (Amersham) by capillary blotting, followed by alkali fixation. The filters were hybridized at 60°C for about 20 h in 10% dextran sulphate, 1% SDS, 50 mM Tris pH 7.5, 1 M NaCI; 0.1 mg sheared herring sperm DNA/ml, con- taining a double stranded 32p-labelled DNA probe. After the hybridizations, the filters were washed in 0.18 M NaCI, 10 mM NaPi, 1 mM EDTA, pH 7 (SSPE) buffer with a final wash in 0.1 SSPE 0.1% SDS at 65°C for 5 min. The hybridizing fragments were visualized by autoradiography or by using a Phosphor-lmager. Before re-hybridizations, the filters were washed in 0.5% SDS at 100°C for 5 min.
The UidA and ChsA (+79 to 1413) probes were BamHI fragments,
the CaMV 35S promoter probe was a 850 bp HindllI-BamHI fragment and the nos poly adenytation region probe was a 253 bp BamHI-EcoRI fragment, all derived from construct pSE19 (Van Blokland et al., 1994) The pBin19 vector probe was a mixture of two EcoRV fragments (2736 bp and 1801 bp) and three Dral fragments (1177 bp, 548 bp and 2932 bp), which together cover the entire pBin19 vector region (Frisch et aL, 1995). The ploidy level of the T-DNA loci in progeny from self-fertilizations was determined by Southern blot analysis using the Chi or FIs probes as internal controls. The band intensities of the T-DNA fragments were compared with those of the Chi and FIs bands. The reliability of this method was tested by analysing the progeny of a back- cross of a few plants to V26 using PCR of seedling extracts (data not shown). The primers we used were: RB2 (5'-GGAAGCI-FTGCT- GGTGGCACGG-3') and ME1 (5'-GGGATCCGTTGTACGTGCTCTTA- TTGG-3') which are directed against the nucleotides +1831 to +1852 and +2802 to + 2783 relative to the first nucleotide of the ATG of the ChsA gene, and RBO (5'-CGCAAGACCGGCAACAGG- 3'), which is directed against the transgenic nos polyadenylation region. The primer combination RB2/RBO amplified a transgene fragment, while the primer combination RB2/ME1 amplified a 972 bp fragment from the endogenous ChsA gene, which served as an internal control.
Fluorometric GUS assay and statistical analysis
GUS enzyme activities in the extracts of young leaves, young flower limbs and the corresponding sepals were determined by the fluorometric assay as described by Jefferson et aL (1987). The tissues were ground in liquid N 2 in the presence of Dowex-1 (Sigma) to remove flavonoids (Van Tunen et al., 1990). For each flower, the GUS activity of the limb, which was normalized to the protein concentration, was divided by that of the sepal (C/S ratio). There were no differences in protein content between purple and white corollas. To test for significant differences of the C/S ratios between groups, analysis of variance was used on logarithmic values of the C/S ratios, followed by an a posteriori comparison with Bonferoni correction.
Acknowledgements
We thank Ada Viterbo for contributing to some of the experiments, and Pieter Hoogeveen and Martina Meesters for taking care of the transgenic plants and for the numerous crosses. We are grateful to Ronald Koes for suggestions on analysing the Chs silencing revertant and to Jacques Bedaux for the statistical analysis of the GUS activities. This work was supported by the Netherlands' Technology Foundation (STW), by a research grant to M.S. from S&G Seeds BV, Enkhuizen, The Netherlands, and by a research fellowship from the Royal Netherlands Academy of Sciences (KNAW) to J.M.K.
References
Angenent, G.C., Franken, J., Busscher, M., Colombo, L. and Van Tunen, A.J. (1993) Petal and stamen formation in Petunia is regulated by the homeotic gene-fbpl. Plant J. 4, 101-112.
Baulcombe, D.C. and English, J.J. (1996) Ectopic pairing of homologous DNA and post-transcriptional silencing in transgenic plants. Curr. Opin. BiotechnoL 7, 173-180.
Bi, X. and Uu, L.F. (1996) DNA rearrangement mediated by inverted repeats. Proc. Natl Acad. ScL USA, 93, 819-823.
Camarini-Otero, R.D. and Hsieh, P. (1993) Parallel DNA triplexes,
homologous recombination, and other homology-dependent DNA interactions. Cell, 73, 217-223.
Collick, A., Drew, J., Penbarth, J., Bois, P., Luckett, J., Scaerou, F., Jeffreys, A. and Reik, W. (1996) Instability of long inverted repeats within mouse transgenes. EMBO J. 15, 1163-1171.
Csink, A.K. and Henikoff, S. (1996) Genetic modification of heterochromatic association and nuclear organization in Drosophila. Nature, 381,529-531.
De Carvalho, F., Gheysen, G., Kushnir, S., Van Montagu, M., Inz& D. and Castresana, C. (1992) Suppression of ~-l,3-glucanase transgene expression in homozygous plants. EMBO J. 11, 2595-2602.
De Carvalho Niebel, F., Frendo, R, Van Montagu, M. and Cornelissen, M. (1995) Post-transcriptional cosuppression of ~-l,3-glucanase genes does not affect accumulation of transgene nuclear mRNA. Plant Cell, 7, 347-358.
De Haan, P., Gielen, J.J.L., Prins, M., Wijkamp, I.G., Van Schepen, A., Peters, D., Van Grinsven, M.Q.J.M. and Goldbach, R. (1992) Characterization of RNA-mediated resistance to tomato spotted wilt virus in transgenic tobacco plants. Biotechnology, 10, 1133-1137.
Dehio, C. and Schell, J. (1994) Identification of plant genetic loci involved in a posttranscriptional mechanism for meiotically reversible transgene silencing. Proc. Nat/Acad. Sci. USA, 91, 5538-5542.
Dellaporte, S.L., Wood, J. and Hicks, J.B. (1983) A plant DNA minipreparation: version I1. Plant Mo/. Biol. Rep. 1, 19-21.
Depicker, A., Ingelbrecht, I., Van Houdt, H., De Loose, M. and Van Montagu, M. (1996) Post-transcriptional reporter transgene silencing in transgenic tobacco. In Mechanisms andApp/ications of Gene Silencing (Grierson, D., Lycett, G.W. and Tucker, G.A. eds). Nottingham: Nottingham University Press, pp. 71-84.
Dernburg, A.F., Broman, K.W., Fung, J.C., Marshall, W.F., Philips, J., Agard, D.A. and Sedat, J.W. (1996) Perturbation of nuclear architecture by long-distance chromosome interactions. Cell, 86, 745-759.
Dorer, D.R. and Henikoff, S. (1994) Expansions of transgene repeats cause heterochromatin formation and gene silencing in Drosophila. Cell, 77, 993-1002.
Dorlhac de Borne, F.D., Vincentz, M., Chupeau, Y. and Vaucheret, H, (1994) Co-suppression of nitrate reductase host genes and transgenes in transgenic tobacco plants. MoL Gen. Genet, 243, 613-621.
Dougherty, W.G., Lindbo, J.A., Smith, H.A., Parks, T.D., Swaney, S. and Proebsting, W.M. (1994) RNA-mediated virus resistance in transgenic plants: exploitation of a cellular pathway possibly involved in RNA degradation. Mol. Plant-Microbe Interact. 7, 544-552.
Dougherty, W.G. and Parks, T.D. (1995) Transgenes and gene suppression: telling us something new? Curr. Opin. Cell Biol. 7, 399-405.
Elmayan, T. and Vaucheret, H. (1996) A strongly-expressed 35S- driven transgene undergoes post-transcriptional silencing in all tobacco transformants irrespective of the copy number. Plant J. 9, 787-797.
English, J.J., Mueller, E. and Baulcombe, D.C. (1996) Suppression of virus accumulation in transgenic plants exhibiting silencing of nuclear genes. Plant Cell, 8, 179-188.
Fransz, RF., Stare, M., Montijn, B., Ten Hoopen, R., Wiegant, J., Kooter, J.M., Oud, O. and Nanninga, N. (1996) Detection of single-copy genes and chromosome rearrangements in Petunia hybrida by fluorescence in situ hybridization. P/ant J. 9,767-774.
Fray, R.G., Wallace, A.D. and Grierson, D. (1994) Identification of unexplained DNA fragments within the T-DNA borders of the Bin19 plant transformation vector. Plant Mo/. Biol. 25, 339-342.
Gene si lencing associated wi th inver ted repeats 81
Frisch, D.A., Harrishaller, L.W., Yokubaitis, N.T., Thomas, T.L., Hardin, S.H. and Hall, T.C. (1995) Complete sequence of the binary vector Bin19. I~lant Mol. Biol. 27, 405-409.
Goodwin, J., Chapman, K., Swaney, S., Parks, T.D., Warnsman, E.A. and Dougherty, W.G. (1996) Genetic and biochemical dissection of transgenic RNA-mediated virus resistance. Plant Cell, 8, 95-105.
Gordenin, D.A., Lobachev, K.S., Degtyareva, N.P., Malkova, A.L., Perkins, E. and Resnick, M.A. (1993) Inverted DNA repeats: a source of eukaryotic genomic instability. Mol. Cell. Biol. 13, 5315-5322.
Hart, C.M., Fischer, B., Neuhaus, J,M. and Meins, R (1992) Regulated inactivation of homologous gene expression in transgenic Nicotiana sylvestris plants containing a defense- related tobacco chitinasa gene. Mol. Gen. Genet. 235, 179-188.
Henderson, S.T. and Pates, T.D. (1993) Instability of a plasmid- borne inverted repeat in Saccharomyces cerevisiae. Genetics, 134, 57-62.
Hobbs, S.L.A., Warkentin, T.D. and Delong, C.M.O. (1993) Transgene copy number can be positively or negatively associated with transgene expression, PlantMoL Biol. 21, 17-26.
Huala, E. and Sussex, I.M. (1993) Determination and cell interactions in reproductive meristems. Plant Cell, 5, 1157-1165.
Ingelbrecht, I., Van Houdt, H., Van Montagu, M. and Depicker, A. (1994) Posttranscriptional silencing of reporter transgenes in tobacco correlates with DNA methylation. Proc. Natl Acad. ScL USA, 91, 10502-10506.
Jefferson, R.A., Kavanagh, T.A. and Bevan, M.W. (1987) GUS fusions: J~-glucuronidase as a sensitive and versatile gene fusion marker in higher plants. EMBO J. 6, 3901-3907.
Jorgensen, R. (1992) Silencing of plant genes by homologous transgenes, Agbiotech. News Info. 4, 265-273.
Jorgensen, R.A. (1995) Cosuppression, flower color patterns, and metastable gene expression states. Science, 268, 686-691.
Jorgensen, R., Cluster, P., Qua, Q., English, J. and Napoli, C. (1996) Chalcone synthase cosuppression phenotypes in petunia flowers: comparison of sense vs, antisense constructs and single copy vs. complex T-DNA sequences. Plant Mol. Biol. 31, 957-973.
Klimyuk, V.I., Carroll, B.J., Thomas, C.M. and Jones, J.D.G. (1993) Alkali treatment for rapid preparation of plant material for reliable PCR analysis. Plant J. 3, 493-494.
Kunz, C,, Sch6b, H., Stam, M., Kooter, J.M. and Meins, F. (1996) Developmentally regulated silencing and reactivation of tobacco chitinase genes. Plant J. 10, 437-450.
Leach, D.R.F. (1994) Long palindromes, cruciform structures, genetic instability and secondary structure repair. BioEssays, 16, 893-900.
Lindbo, J.A., Silva-Rosales, L., Proebsting, W.M. and Dougherty, W.G. (1993) Induction of a highly specific antiviral state in transgenic plants: implications for regulation of gene expression and virus resistance, Plant Cell, 5, 1749-1759.
Martin, C. and Gerats, T. (1993) Control of pigment biosynthesis genes during petal development. Plant Cell, 5, 1253--1264.
Martineau, B., Voelker, T.A. and Sanders, R.A. (1994) On defining T-DNA, Plant Cell, 11, 1032-1033.
Matzke, A.J.M., Neuhuber, F., Park, Y.D., Ambros, P.F. and Matzke, M.A. (1994) Homology-dependent gene silencing in transgenic plants: epistatic silencing loci contain multiple copies of methylated transgenes. Mol. Gen. Genet. 244, 219-229.
Matzke, M.A. and Matzke, A.J.M. (1995) How and why do plants inactivate homologous (trans)genes? Plant Physiol. 107, 679- 685.
Matzke, M.A., Primig, M., Trnovsky, J. and Matzke, A.J.M. (1989)
82 Maike S t a m et al.
Reversible methylation and inactivation of marker genes in sequentially transformed tobacco plants. EMBO J. 8, 643-649.
Metzlaff, M., O'Dell, M. and Flavell, R.I~. (1996) Suppression of chalcone synthase A activities in Petunia by the addition of a transgene encoding chalcone synthase A. In Mechanisms and Applications of Gene Silencing (Grierson, D., Lycett, G.W. and Tucker, G.A., eds). Nottingham: Nottingham University Press, pp. 21-32.
Meyer, P. (1995) Understanding and controlling transgene expression. Trends BiotechnoL 13, 332-337.
Meyer, P. (1996) Repeat-induced gene silencing: common mechanisms in plants and fungi. Biol. Chem. H-S 377, 87-95.
Meyer, P., Heidmann, I. and Niedenhof, h (1993) Differences in DNA- methylation are associated with a paramutation phenomenon in transgenic petunia. Plant J. 4, 89-100.
Mueller, E., Gilbert, J., Davenport, G., Brigneti, G. and Baulcombe, D.C. (1995) Homology-dependent resistance: transgenic virus resistance in plants related to homology-dependent gene silencing. Plant J. 7, 1001-1013.
Napoli, C., Lemieux, C. and Jorgensen, R. (1990) Introduction of a chimeric chalcone synthase gene into petunia results in reversible co-suppression of homologous genes in trans. Plant Cell, 2, 2"/9-289.
Neuhuber, E, Park, Y.D., Matzke, A.J.M. and Matzke, M.A. (1994) Susceptibility of transgene loci to homology-dependent gene silencing. MoL Gen. Genet. 244, 230-241.
Palauqui, J.-P. and Vaucheret, H. (1995) Field trial analysis of nitrate reductase co-suppression: a comparative study of 38 combinations of transgene loci. Plant Mol. BioL 29, 149-159.
Park, Y.-D., Papp, I., Moscone, E.A., Iglasias, M.A., Vaucheret, H., Matzke, A.J.M. and Matzke, M.A. (1996) Gene silencing mediated by promoter homology occurs at the level of transcription and results in meiotically heritable alterations in methylation and gene activity. Plant J. 9, 183-194.
Ruskin, B. and Fink, G.R. (1993) Mutations in POLl increase the mitotic instability of tandem inverted repeats in Saccharomyces cerevisiae. Genetics, 134, 43-56.
Smith, H.A., Swaney, S.L., Parks, T.D., Wernsman, E.A. and Dougherty, W.G. (1994) Transgenic plant virus resistance mediated by untranslatable sense RNAs: expression, regulation, and fate of nonessential RNAs. P/ant Ceil, 6, 1441-1453.
Stam, M., Mol, J.NM, and Kooter, J.M. (1997) The silence of genes in transgenic plants. Ann. Bot. (in press).
Van Blokland, R. (1994) Trans-inactivation of flower pigmentation genes in Petunia hybrida. PhD. Thesis. Amsterdam, The Netherlands: Vrije Universiteit
Van Blokland, R., Van der Geest, N., Mol, J.NM. and Kooter, J.M. (1994) Transgene-mediated suppression of chalcone synthase expression in Petunia hybrida results from an increase in RNA turnover. Plant J. 6, 861-877,
Van Blokland, R, Van der Geest, N., De Lange, P., Stam, M., Mol, J.N.M. and Kooter, J.M. (1996) Post-transcriptional suppression of chalcone synthase genes in Petunia hybrida and the accumulation of unspliced pre-mRNAs. In Mechanisms and Applications of Gene Silencing (Grierson, D., Lycett, G.W. and Tucker, G.A., eds). Nottingham: Nottingham University Press, pp. 57-69.
Van der Krol, A.R., Mur, L.A., Beld, M., Mol, J.N.M. and Stuitje, A.R. (1990) Flavonoid genes in petunia: addition of a limited number of gene copies may lead to a suppression of gene expression. Plant Cell, 2, 291-299.
Van Tunen, A.J., Mur, L., Brouns, G.S., Rienstra, J.-D., Koes, R.E. and Mol, J.N.M. (1990) Pollen- and anther-specific chi promoters from petunia: tandem promoter regulation of the Chi A gene. Plant Cell, 2, 393-401.
Vaucheret, H. (1993) Identification of a general silencer for 19S and 35S promoters in a transgenic tobacco plant: 90 bp of homology in the promoter sequence are sufficient for trans- inactivation. C, R. Acad. ScL [111], 316, 1471-1483.
Vaucheret, H., Palauqui, J.-C., Elmayan, T. and Moffatt, B. (1995) Molecular and genetic analysis of nitrite reductase co- suppression in transgenic tobacco plants. Mol. Gen. Genet. 248, 311-317.