The value of informing Children prior to examination and ...
Upload
independentCategory
view
5download
0
Development and validation of a sensitive assay for thequantification of imatinib using LC/LC-MS/MS in human wholeblood and cell culture
Jelena Klawittera, Yan Ling Zhanga, Jost Klawittera,b, Nora Andersona,c, Natalie J.Serkovaa,d, and Uwe Christiansa,baClinical Research and Development, Department of Anesthesiology, University of Colorado,Denver, Aurora, CO 80045-7503, USAbEurofins Medinet Denver, Aurora, CO 80045-7503, USAcFraunhofer Institute for Toxicology and Experimental Medicine, Center of Drug Research andMedical Biotechnology, Hannover, GermanydUniversity of Colorado Cancer Center, University of Colorado, Denver, Aurora, CO 80045-7503,USA
AbstractWe developed and validated a semi-automated LC/LC-MS/MS assay for the quantification ofimatinib in human whole blood and leukemia cells. After protein precipitation, samples wereinjected into the HPLC system and trapped onto the enrichment column (flow 5 mL/min); extractswere back-flushed onto the analytical column. Ion transitions [M + H]+ of imatinib (m/z = 494.3→ 394.3) and its internal standard trazodone (372.5 → 176.3) were monitored. The range ofreliable response was 0.03–75 ng/mL. The inter-day precisions were: 8.4% (0.03 ng/mL), 7.2%(0.1 ng/mL), 6.5% (1 ng/mL), 8.2% (10 ng/mL) and 4.3% (75 ng/mL) with no interference fromion suppression. Autosampler stability was 24 hs and samples were stable over three freeze–thawcycles. This semi-automated method is simple with only one manual step, uses a commerciallyavailable internal standard, and has proven to be robust in larger studies.
Keywordsimatinib; gleevec; liquid chromatography; sample enrichment; tandem mass spectrometry; LC/LC-MS/MS
IntroductionImatinib [Gleevec®, Fig. 1(A)] is currently used for the treatment of Philadelphiachromosome positive chronic myelogenous leukemia (CML) as well as for othermalignancies with Bcr–Abl or c-Kit mutation such as lymphoblastic leukemias andgastrointestinal stromal tumors (Buchdunger et al., 1996; Savage and Antman, 2002).However, the complete spectrum of its activities is still incompletely defined. Numerousstudies are currently investigating potential imatinib use in various solid tumors and its
Copyright © 2009 John Wiley & Sons, Ltd.*Correspondence to: J. Klawitter, Clinical Research and Development, Department of Anesthesiology, University of Colorado,Denver, Bioscience East, Suite 100, 1999 N. Fitzsimons Parkway, Aurora, CO 80045-7503, USA. [email protected].
NIH Public AccessAuthor ManuscriptBiomed Chromatogr. Author manuscript; available in PMC 2011 February 24.
Published in final edited form as:Biomed Chromatogr. 2009 December ; 23(12): 1251–1258. doi:10.1002/bmc.1247.
NIH
-PA Author Manuscript
NIH
-PA Author Manuscript
NIH
-PA Author Manuscript

combination with other cytotoxic and antitumor agents. These and future studies will have toevaluate potential pharmacokinetic–pharmacodynamic relationships and drug–druginteractions. In addition, if there is a clinical need for pharmacokinetic monitoring ofimatinib-treated patients, our assay will provide specific and sensitive analysis that allowsfor a fast extraction and measurement of large series of samples.
We here report the development and validation of an HPLC–tandem mass spectrometryassay for the quantification of imatinib in human whole blood and leukemia cells incombination with semi-automated sample enrichment that involves a fast proteinprecipitation as the only manual step.
ExperimentalChemicals and Reagents
Solvents and reagents (HPLC-grade methanol, water and formic acid) used for samplepreparation extraction and mobile phases in this study were purchased from Fisher Scientific(Fair Lawn, NJ, USA) and used without further purification. Imatinib was a kind gift fromDr E. Buchdunger (Novartis Pharmaceuticals, Basel, Switzerland). Trazodone [internalstandard, Fig. 1(B)] and zinc sulfate were from Sigma-Aldrich (St Louis, MO, USA). TheK562 human leukemia cell line was purchased from the German Collection ofMicroorganisms and Cell Cultures (Braunschweig, Germany).
Calibrators and Quality Control SamplesStock solutions of imatinib and trazodone [Fig. 1(B)] were prepared in methanol–0.1%formic acid (8:2 v/v) at a concentration of 1 mg/mL and stored at −80°C. The workingsolutions to construct quality control and calibration curve samples were prepared bydilution of the stock solutions with methanol–0.1% formic acid (8:2 v/v). Working solutionswere always prepared on the day of the analysis. The use of human whole blood samplesfrom healthy (untreated) volunteers for assay development and validation purposes received‘exempt’ status from the Colorado Multi-Institutional Review Board (COMIRB). Forcalibrators and quality controls in isolated, cultured leukemia cells and cell culture media,blank cell samples and media were extracted as described below and spiked with imatinib.Calibration and quality control samples were prepared by enriching blank blood, centrifugedleukemia cells or cell culture media samples with imatinib. Blood was drawn from healthyvolunteers into EDTA-coated tubes. The calibration samples for all matrices contained thefollowing concentrations: 0, 0.01, 0.05, 0.1, 0.5, 2.5, 5, 10, 25, 50 and 100 ng/mL. Qualitycontrol (QC) samples were prepared at the following concentrations: lower limit ofquantitation [0.03 ng/mL (human whole blood and leukemia cells) and 0.01 ng/mL (cellmedia)], 0.1, 1, 10 ng/mL and upper limit of quantitation (50 and 75 ng/mL). For stabilitystudies, quality control samples were prepared in human whole blood at the following fiveconcentration levels: 0.03, 0.1, 1, 10 and 75 ng/mL.
Sample Preparation and Protein PrecipitationWhole blood and cell culture media—The only manual step during the extraction ofwhole blood or cell culture samples was protein precipitation. The protein precipitationsolution (methanol–0.2 M ZnSO4, 7:3, v/v) contained the internal standard trazodone at aconcentration of 2 ng/mL. Eight hundred microliters of protein precipitation solution wasadded to 200 µL of whole blood or cell culture medium. Smaller sample volumes could beanalyzed, but it was necessary to maintain the matrix–protein precipitation solution ratio.After vortex (10 min) and centrifugation steps (4°C, 13,000g, 10 min), the supernatant wastransferred into an HPLC vial.
Klawitter et al. Page 2
Biomed Chromatogr. Author manuscript; available in PMC 2011 February 24.
NIH
-PA Author Manuscript
NIH
-PA Author Manuscript
NIH
-PA Author Manuscript
Cells—Cultured human leukemia cells were counted prior to extraction and washedthoroughly with ice-cold PBS in order to remove any traces of extracellular imatinib. Aftercentrifugation the cell pellets were frozen in liquid nitrogen and reconstituted in 200 µLwater plus 800 µL methanol–0.2 M zinc sulfate (7:3 v/v) solution containing 2 ng/mL of theinternal standard trazodone. After vortexing for 10 min and ultrasonic treatment (10 min),samples were centrifuged (13,000g, 10 min, 4°C) and the supernatants were transferred intoHPLC vials. As an even less time-consuming alternative in the case of larger sample series,the extraction can be carried out in 96-well plates with 1 mL wells (Agilent Technologies,Palo Alto, CA, USA).
Automated Sample Enrichment and HPLC ConditionsThe extracts were analyzed using an LC/LC-MS/MS system. The two HPLC systemsconsisted of the following components (all series 1100, Agilent Technologies, Palo Alto,CA, USA): HPLC I, G1312A binary pump, G1379A degasser; HPLC II, G1312A binarypump, and a G1316A column thermostat. A Sciex API 4000 triple-stage quadrupole massspectrometer was used as detector (Applied Biosystems, Foster City, CA, USA). The HPLCsystems were connected via a six-port column switching valve mounted on a step motor(Rheodyne, Cotati, CA, USA). Connection of the switching valve is shown in Fig. 2. TheHPLCs, switching valve and the mass spectrometer were controlled by the Analyst software(version 1.3.1., Applied Biosystems).
One-hundred microliters of the samples was injected onto a 4.6 × 12.5 mm extractioncolumn filled with Eclipse XDB-C8 material of 5 µm particle size (Agilent Technologies,Palo Alto, CA, USA). Samples were washed with a mobile phase of 10% methanol and 90%0.1% formic acid. The flow was 5 mL/min. After 1 min, the switching valve was activatedand the analytes were back-flushed from the extraction column onto a 4.6 × 50 mm columnfilled with Luna C18 material of 5 µm particle size (analytical column, Phenomenex,Torrance, CA, USA). The mobile phase consisted of methanol and 5 mM ammonium acetatesupplemented with 0.01% trifluoroacetic acid (TFA) with a pH of 3.2. The flow rate was 1mL/min. The following gradient was run: 0–1.0 min 30% methanol, 1.0–4.5 min 30–98%and 4.5–9.0 min 98%. The extraction column was switched back into the extraction positionafter 4.0 min and was washed with 98% methanol (flow 2 mL/min) for 5 min. From 9.0 to10.0 min, both columns were re-equilibrated to the starting conditions. Both columns werekept at 65°C. The time between injections was 10.5 min.
MS/MS Analysis and QuantificationTriple-stage quadrupole mass spectrometer and HPLC system were interfaced by a turboelectrospray-ion source. Nitrogen (purity 99.999%) was used as collision-activateddissociation (CAD) gas. The mass spectrometer was run in the positive MRM (multiple-reaction monitoring) mode. The declustering potential (DP) was set to −70 V. The interfacewas heated to 600°C. The first quadrupole was set to select the [M + H]+ ions the followingmass transitions were monitored: imatinib (m/z 494.3 → 394.3) and trazodone (IS, m/z 372.5→ 176.3). For quantification, the imatinib–trazodone ratios were calculated and compared tothe non-weighted calibration curves.
Validation ProceduresValidation strategy—The assay was fully validated using enriched whole blood samples.Hereafter, the validation was extended to the cultured leukemia cells and cell culture mediausing an abbreviated validation strategy since the only change was the matrix. Parametersdetermined for abbreviated validation included lower limit of quantitation, upper limit ofquantitation, linearity, intra-day accuracy and precision and 24 h in-process stability.
Klawitter et al. Page 3
Biomed Chromatogr. Author manuscript; available in PMC 2011 February 24.
NIH
-PA Author Manuscript
NIH
-PA Author Manuscript
NIH
-PA Author Manuscript
Predefined acceptance criteria—The assay was considered acceptable if precision(coefficient of variance, %CV) at each concentration, except at the lower limit ofquantitation, was ≤15% for intra-day and day-to-day variability. The accuracy comparedwith the nominal value had to be within ±15% for both intra- and day-to-day variability. Thecalibration curve had to have a correlation coefficient of r = 0.99 or better.
Limit of detection and lower limit of quantitation—The limit of detection (LOD)was defined as a signal-to-noise ratio of 3:1. The lower limit of quantitation (LLOQ) wasdetermined as the lowest quantity consistently achieving accuracy ≤±20% of the nominalconcentration and a precision of ≤20%.
Precision and accuracy—The method was validated using human whole blood, isolatedleukemia cells and cell culture media. The intra-day precision and accuracy were determinedby analysis of each of the six quality control samples containing imatinib (n = 6) on thesame day. Determination of inter-day precision and accuracy were also based on qualitycontrol samples. Samples were extracted and analyzed on three different days over a one-week period (n = 6/concentration and day). Intra-day precision is reported as coefficient ofvariance in percentage and accuracies are reported as a percentage of the nominalconcentration. Owing to the repeat measures design on different days, inter-day precisionwas estimated as the residual standard deviation in percentage using a one-way analysis ofvariance (SPSS, version 16.0, SPSS Inc., Chicago, IL, USA).
Recoveries—Absolute method recoveries were determined by comparing the signal ofimatinib obtained after extraction of six quality control samples (n = 6) with the signal afterinjection of the respective nominal amount from standard solutions (in methanol–0.1%formic acid, 8:2 v/v) directly onto the analytical column. This was a valid approach since ionsuppression did not interfere with the analytes. The extraction recovery/yield wasdetermined by a comparison of imatinib signal obtained after extraction of six qualitycontrol samples (n = 6) with the signal obtained from the samples in which imatinib wasadded after the protein precipitation.
Matrix interferences, ion suppression and carry-over effect—To excludeinterferences in the matrices, blank whole blood samples from 10 different subjects or cellextracts from 10 different culture dishes were extracted and analyzed. The lack of ionsuppression at the time of elution of the analyte and its internal standard from the HPLCcolumn was established following a previously described procedure (Muller et al., 2002;Larger et al., 2005). To detect changes in ionization efficiency by co-eluting matrixsubstances, blank human EDTA blood samples from 10 different healthy individuals and 10different cell or cell matrix preparations were tested. After protein precipitation sampleswere extracted online and back-flushed onto the analytical column as described above.Imatinib or its internal standard (10 µg/mL dissolved in 0.1 formic acid–methanol, 1:1, v/v)was infused post-column via a T-piece at 20 µL/min using a syringe pump (KD Scientific,Holliston, MA, USA). The extent of ion suppression was established by monitoring theintensity of the ion currents in MRM mode (imatinib m/z = 494.3 → 394.3 or trazodone m/z= 372.5 → 176.3) at the retention times of analyte and internal standard after injection ofblank extracted blood samples into the LC/LC–MS/MS system.
A potential carry-over effect was assessed by alternately analyzing blank whole bloodsamples (n = 6) and whole blood samples containing concentrations of imatinib higher thanthe upper limit of quantitation (100 ng/mL, n = 6).
Stability studies—Stability during three freeze–thaw cycles was tested (n = 6/concentration level/cycle). Samples were kept frozen at −80°C and thawed at room
Klawitter et al. Page 4
Biomed Chromatogr. Author manuscript; available in PMC 2011 February 24.
NIH
-PA Author Manuscript
NIH
-PA Author Manuscript
NIH
-PA Author Manuscript
temperature. Within-batch stability of imatinib and its internal standard (trazodone) afterprotein precipitation was studied at room temperature and +4°C in the autosampler for 24 h.Samples (n = 6/concentrations) were compared with freshly prepared samples at the sameconcentration levels. Stability was assumed when concentrations of the stability test samplesfell within ±15% of the concentrations measured in the fresh controls.
ResultsAs a first step, MS and MS/MS spectra of the analytes were recorded after direct infusion ofimatinib into the electrospray source via a syringe pump (KD Scientific, Holliston, MA,USA). Imatinib and its internal standard were dissolved at a concentration of 10 µg/mL inmethanol–0.1% formic acid 80/20 v/v and were delivered at a rate of 20 µL/min. Figure 1shows the product ion scan spectra of imatinib [Fig. 1(C)] and its internal standard trazodone[Fig. 1(D)].
The proton adduct of imatinib ([M + H]+, m/z 494.3) was the predominant Q1 ion. Thefragment at m/z = 394.3 gave the fragment signal with the highest intensity and thus thetransition m/z 494.3 → 394.3 was selected for the quantification of imatinib. The mostabundant product ion detected for the internal standard trazodone was the ion at m/z 176.3[Fig. 1(D)]. Based on this result, the transition m/z 372.5 → 176.3 was selected for theinternal standard.
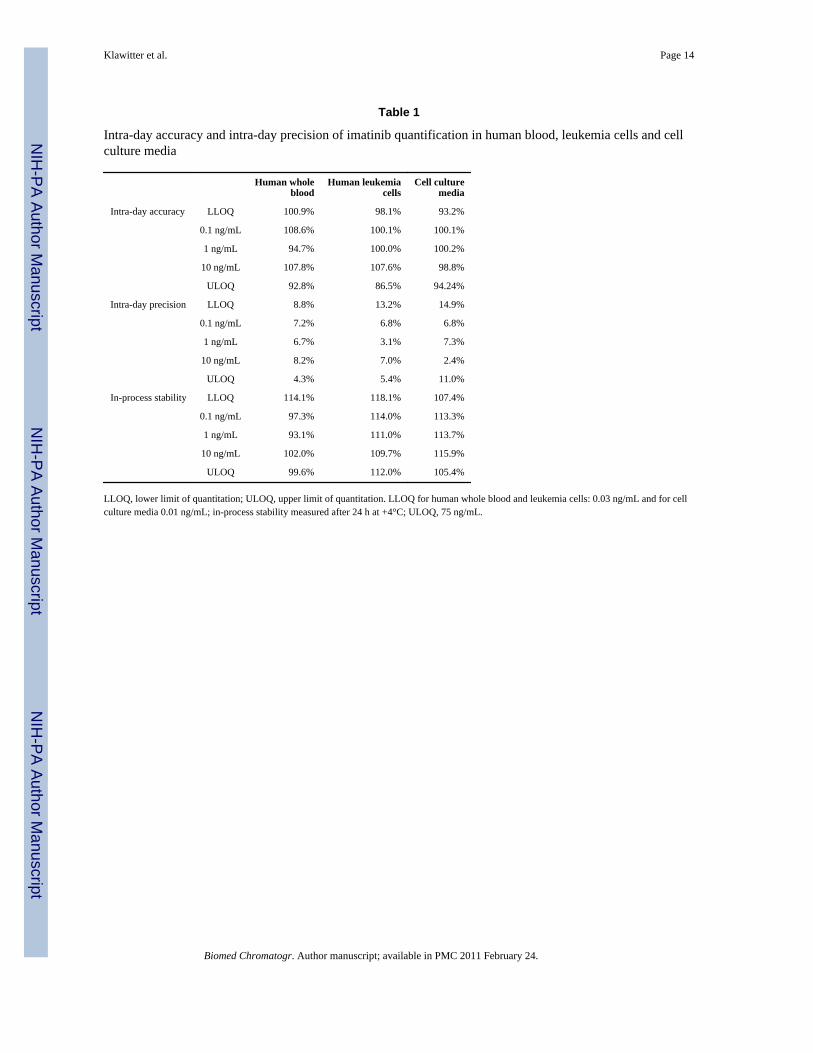
In human whole blood, the lower limit of quantification was 0.03 ng/mL and the assay waslinear from 0.03 to 75 ng/mL (y = 0.0429x − 0.0236, r = 0.9994) (Fig. 4; Table 1). Inleukemia cell extracts the assay was linear from 0.03 to 75 ng/mL, and in the cell culturemedia from 0.01 to 75 ng/mL (for further details see Table 1).
Assay accuracy and precision were determined using the following concentrations: lowerlimit of quantitation (0.01, 0.03 and 0.05 ng/mL), 0.1, 1, 10 ng/mL and upper limit ofquantitation (50 and 75 ng/mL). The results for intra-day precision and accuracy are listed inTable 1.
In human whole blood, inter-day accuracies were: 105.1% (0.03 ng/mL); 114.6% (0.1 ng/mL); 114.5% (1 ng/mL); 111.6% (10 ng/mL); and 99.0% (75 ng/mL). The inter-dayprecisions were: 8.4% (0.03 ng/mL); 7.2% (0.1 ng/mL); 6.5% (1 ng/mL); 8.2% (10 ng/mL);and 4.3% (75 ng/mL).
The absolute method recovery of imatinib after protein precipitation of human whole bloodand column switching was 92.5 ± 8.6% (mean ± standard deviation, n = 6). The recovery ofthe internal standard trazodone was 100.7 ± 2.0%. The extraction recovery/yield was 90.9 ±4.3%, while the matrix effect was calculated at 94.3 ± 8.9% (mean ± standard deviation, n =6). Comparison of peak areas after injection of imatinib solutions (200 µL of 100 ng/mL inmethanol–0.1% formic acid, n = 5) into the LC/LC-MS system including the columnswitching step with Quantitation of imatinib by tandem mass spectrometry those afterinjection of the same solution directly onto the analytical column without the priorenrichment step showed that no drug was lost during the enrichment procedure.
To exclude the possibility that ion suppression compromised quantification of imatinib, theeffect of whole blood samples from 10 different individuals was tested following previouslypublished recommendations (Muller et al., 2002). As mentioned above, post-columninfusion experiments were conducted. A T-junction was placed between the HPLC and theMS source (after the MS flow splitter) and the compound of interest was introduced at 20µL/min into the LC eluent. The influence of different matrices (whole blood, cell media,methanol) was determined by their injection into the column-switching system. Ion
Klawitter et al. Page 5
Biomed Chromatogr. Author manuscript; available in PMC 2011 February 24.
NIH
-PA Author Manuscript
NIH
-PA Author Manuscript
NIH
-PA Author Manuscript
suppression was detected only during the time of the injection peak (Fig. 3) and did notinterfere with the detection of imatinib or the internal standard.
Imatinib eluted with an average retention time of 4.19 ± 0.10 min and the internal standardtrazodone with a retention time of 5.11 ± 0.11 min. The analyses of blank whole blood andcell extracts did not detect any significant interferences with the detection of imatinib or theinternal standard (Fig. 3). Potential carry-over effects were assessed by alternately analyzingblank human whole blood samples and human blood samples containing 500 ng/mLimatinib (n = 6). No carry-over was found.
After extraction, imatinib was stable in the autosampler at 4°C as well as at roomtemperature in all concentrations tested for at least 24 h. After seven days at 4°C, no changesin imatinib concentrations were observed. Furthermore imatinib was stable over at leastthree freeze–thaw cycles.
The assay was successfully used for the quantification of intracellular and extracellularimatinib concentrations in leukemia cells [see Fig. 4(C)] and their growth media. Inparticular, we were able to correlate changes in intracellular imatinib concentrations with thechanges in expression of p-glycoprotein drug exporter upon long-term imatinib treatmentand in different imatinib-resistant cell lines.
DiscussionImatinib is an ABL tyrosine kinase inhibitor of the 2-phenylamino pyrimidine class (Drukeret al., 1996; Buchdunger et al., 2000). As mentioned above, imatinib is used in the treatmentof Bcr–Abl positive chronic myelogenous leukemia and c-Kit positive gastrointestinal solidtumors (Buchdunger et al., 1996).
In order to support pharmacokinetic studies with sufficient speed, suitable analyticalprocedures are required. To date, several methods for quantitation of the parent drug,imatinib, in human plasma by high-performance liquid chromatography have been publishedin the literature. Among these, four have used tandem mass spectrometry (LC-MS/MS)(Bakhtiar et al., 2002; Guetens et al., 2003; Titier et al., 2005; Rochat et al., 2008). One ofthese LC-MS-MS procedures used an atmospheric pressure chemical ionization interface fordetection and a semi-automated high-throughput precipitation bioanalytic procedure forsample preparation requiring some instruments that are available in only a few laboratories(Bakhtiar et al., 2002). The other published LC-MS-MS method used an electrosprayionization detection and non-automated precipitation followed by a filtration (Guetens et al.,2003). While the method by Bakhtiar et al. reached a LLOQ of 4 ng/mL imatinib (40 pgimatinib on the column), Guetens et al.’s method was slightly more sensitive with a LLOQof 1 ng/mL (10 pg imatinib on the column). The method most similar to ours, by Titier et al.(2005), employed a liquid–liquid plasma extraction, while reaching an LLOQ of 10 ng/mL(50 pg imatinib on the column). However, it has been demonstrated during the past decadethat plasma monitoring alone misses important information since blood cells (red bloodcells, erythrocytes) and sometimes other blood cells are not analyzed (Driessen et al., 1994;Highley and De Bruijn, 1996). For example it has been demonstrated that co-administrationof imatinib with other signal transduction inhibitors such as everolimus, alters bloodpartition and distribution in favor of the cellular blood components (Prenen et al., 2006).Therefore, we chose whole blood as matrix for our method.
The method described here was also successfully used for studies of imatinib uptake andrelease in imatinib-resistant leukemia cell lines (publications in preparation). Imatinibresistance is a major therapeutic problem (Druker, 2006), of which the exact origins seem tobe multifactoral. One of the factors described in the literature is the overexpression of
Klawitter et al. Page 6
Biomed Chromatogr. Author manuscript; available in PMC 2011 February 24.
NIH
-PA Author Manuscript
NIH
-PA Author Manuscript
NIH
-PA Author Manuscript
multidrug-resistant proteins such as p-glycoprotein and variability in the amount andfunction of the drug influx protein OCT-1 (Gorre et al., 2001; Hochhaus et al., 2002; Roche-Lestienne et al., 2002; Donato et al., 2003; White et al., 2006; Jiang et al., 2007; Assef etal., 2008). Since the expression of transporter proteins does not always correlate with theirfunctional activity, it is important to measure the imatinib concentration inside its target, theleukemia cells.
Our LC-LC/MS-MS assay fulfill all predefined acceptance criteria. Column-switchingtechniques for automated on-line sample preparation have been used for HPLC analyses fordecades (Huber and Zech, 1988). However, their application was limited to drugs withspecific UV-absorption maxima. During recent years, on-line sample preparation hasexperienced a revival due to the increased use of mass spectrometers as HPLC detectors andtheir superior specificity and selectivity compared with UV detectors. LC-MS/MS includingonline enrichment has successfully been used by our laboratory (Christians et al., 2000;Zhang et al., 2005; Clavijo et al., 2008). In our experience including the present assay,online extract has the following advantages: (A) it eliminates the need for external columnextraction or evaporation steps; (B) it avoids the necessity for multiple manual steps withtheir potential for reducing precision and the occurrence of random errors; (C) it allows forthe combination of large injection volumes without having negative effects on analyticalcolumn performance and life span; (D) it further removes salts and other compoundspotentially causing ion suppression; (E) backflush allows for a ‘volume-less’ injection withsharper peaks improving separation and reproducibility of integration; and (F) the extractionof each individual sample is recorded by the regulatory compliant software, which is anadvantage in a good laboratory practice (GLP) environment.
Extraction of cell culture samples included fast and simple cell membrane disruptionfollowed by protein precipitation as the only other manual steps. We also found it veryconvenient that tissue/cell samples and whole blood samples could be extracted in the samebatch.
Our assay was always designed as an analytical platform that also allows for the analysis ofother tyrosine kinase inhibitors such as ZD1839 and ZD6474. However, the assay was notfully validated for these compounds and thus their analysis is not reported here. Therefore,for quantification of imatinib, it is easily possible to shorten the analysis time since by 6.5min all analytes have eluted from the column (see Fig. 4). This is simple since between 4.5and 9.0 min the solvent composition is isocratic.
In comparison to another described LC-MS/MS assay for the quantification of imatinib inhuman plasma using liquid–liquid extraction (Titier et al., 2005), our assay is more than 10-fold more sensitive (LLOQ 3 vs 50 pg on the column). The assay was successfully used forquantitation of intracellular imatinib concentrations in imatinib-treated and imatinib-resistant cell lines. In addition, the disadvantage of liquid–liquid extraction in comparison toour computer-controlled, semi-automated extraction procedure is not only the time requiredfor extraction, but also the fact that liquid–liquid extractions generally tend to be associatedwith higher variability. In our assay, the supernatants after protein precipitation were loadedonto the extraction column and washed at a high solvent flow of 5 mL/min for 1 min. Thisconstitutes a significant improvement over previously published LC-MS assays for imatinibusing online sample preparation that required several minutes for on-line sample extraction(Bakhtiar et al., 2002; Guetens et al., 2003; Titier et al., 2005). Our assay also has theadvantage that we are using an internal standard that is commercially freely available.
At therapeutic doses, imatinib Cmax is typically 3–6000 ng/mL, with through levels near1000 ng/mL. Therefore, the high sensitivity of our assay allows for use of low blood sample
Klawitter et al. Page 7
Biomed Chromatogr. Author manuscript; available in PMC 2011 February 24.
NIH
-PA Author Manuscript
NIH
-PA Author Manuscript
NIH
-PA Author Manuscript
volumes, such as potential fingertip collection, in both the clinic, especially in pediatricpatients, and in animal experiments, where the collected blood volume should be kept to aminimum.
Abbreviations used
CML chronic myelogenous leukemia
ESI electrospray ionization
LLOQ lower limit of quantitation
MRM multiple-reaction monitoring
m/z mass/charge
QC quality control
TFA trifluoroacetic acid
ULOQ upper limit of quantitation
AcknowledgmentsThis study was supported by the National Institutes of Health grants R21 CA108624 and P30 DK048520 (ClinicalNutrition Research Unit Mass Spectrometry Core).
ReferencesAssef Y, Rubio F, Colo G, Del Monaco S, Costas MA, Kotsias BA. Imatinib resistance in multidrug-
resistant K562 human leukemic cells. Leukemia Research 2009;33:710–716. [PubMed: 18977528]Bakhtiar R, Lohne J, Ramos L, Khemani L, Hayes M, Tse F. High-throughput quantification of the
anti-leukemia drug STI571 (Gleevec) and its main metabolite (CGP 74588) in human plasma usingliquid chromatography–tandem mass spectrometry. Journal of Chromatography B AnalyticalTechnology in Biomedicine and Life Sciences 2002;768:325–340.
Buchdunger E, Zimmermann J, Mett H, Meyer T, Muller M, Druker BJ, Lydon NB. Inhibition of theAbl protein-tyrosine kinase in vitro and in vivo by a 2-phenylaminopyrimidine derivative. CancerResearch 1996;56:100–104. [PubMed: 8548747]
Buchdunger E, Cioffi CL, Law N, Stover D, Ohno-Jones S, Druker BJ, Lydon NB. Abl protein–tyrosine kinase inhibitor STI571 inhibits in vitro signal transduction mediated by c-kit and platelet-derived growth factor receptors. Journal of Pharmacology and Experimental Therapy2000;295:139–145.
Christians U, Jacobsen W, Serkova N, Benet LZ, Vidal C, Sewing KF, Manns MP, Kirchner GI.Automated, fast and sensitive quantification of drugs in blood by liquid chromatography-massspectrometry with on-line extraction: immunosuppressants. Journal of Chromatography BBiomedical Science Applications 2000;748:41–53.
Clavijo C, Bendrick-Peart J, Zhang YL, Johnson G, Gasparic A, Christians U. An automated, highlysensitive LC-MS/MS assay for the quantification of the opiate antagonist naltrexone and its majormetabolite 6beta-naltrexol in dog and human plasma. Journal of Chromatography B AnalyticalTechnology in Biomedicine and Life Science 2008;874:33–41.
Donato NJ, Wu JY, Stapley J, Gallick G, Lin H, Arlinghaus R, Talpaz M. BCR-ABL independenceand LYN kinase overexpression in chronic myelogenous leukemia cells selected for resistance toSTI571. Blood 2003;101:690–698. [PubMed: 12509383]
Driessen O, Highley MS, Harper PG, Maes RA, De Bruijn EA. Description of an instrument forseparation of red cells from plasma and measurement of red cell volume. Clinical Biochemistry1994;27:195–196. [PubMed: 7923761]
Druker BJ. Circumventing resistance to kinase-inhibitor therapy. New England Journal of Medicine2006;354:2594–2596. [PubMed: 16775240]
Klawitter et al. Page 8
Biomed Chromatogr. Author manuscript; available in PMC 2011 February 24.
NIH
-PA Author Manuscript
NIH
-PA Author Manuscript
NIH
-PA Author Manuscript
Druker BJ, Tamura S, Buchdunger E, Ohno S, Segal GM, Fanning S, Zimmermann J, Lydon NB.Effects of a selective inhibitor of the Abl tyrosine kinase on the growth of Bcr–Abl positive cells.Natural Medicine 1996;2:561–566.
Gorre ME, Mohammed M, Ellwood K, Hsu N, Paquette R, Rao PN, Sawyers CL. Clinical resistance toSTI-571 cancer therapy caused by BCR-ABL gene mutation or amplification. Science2001;293:876–880. [PubMed: 11423618]
Guetens G, De Boeck G, Highley M, Dumez H, Van Oosterom AT, de Bruijn EA. Quantification ofthe anticancer agent STI-571 in erythrocytes and plasma by measurement of sediment technologyand liquid chromatography–tandem mass spectrometry. Journal of Chromatography A2003;1020:27–34. [PubMed: 14661754]
Highley MS, De Bruijn EA. Erythrocytes and the transport of drugs and endogenous compounds.Pharmaceutical Research 1996;13:186–195. [PubMed: 8932435]
Hochhaus A, Kreil S, Corbin AS, La Rosee P, Muller MC, Lahaye T, Hanfstein B, Schoch C, CrossNC, Berger U, Gschaidmeier H, Druker BJ, Hehlmann R. Molecular and chromosomalmechanisms of resistance to imatinib (STI571) therapy. Leukemia 2002;16:2190–2196. [PubMed:12399961]
Huber, R.; Zech, K. Selective Sample Handling and Detection in High-performance LiquidChromatography. Amsterdam: Elsevier; 1988.
Jiang X, Saw KM, Eaves A, Eaves C. Instability of BCR-ABL gene in primary and cultured chronicmyeloid leukemia stem cells. Journal of the National Cancer Institute 2007;99:680–693. [PubMed:17470736]
Larger PJ, Breda M, Fraier D, Hughes H, James CA. Ion-suppression effects in liquidchromatography–tandem mass spectrometry due to a formulation agent, a case study in drugdiscovery bioanalysis. Journal of Pharmaceutical and Biomedical Analysis 2005;39:206–216.[PubMed: 15871916]
Muller C, Schafer P, Stortzel M, Vogt S, Weinmann W. Ion suppression effects in liquidchromatography–electrospray–ionisation transport-region collision induced dissociation massspectrometry with different serum extraction methods for systematic toxicological analysis withmass spectra libraries. Journal of Chromatography B Analytical Technology in Biomedicine andLife Sciences 2002;773:47–52.
Prenen H, Guetens G, De Boeck G, Highley M, van Oosterom AT, de Bruijn EA. Everolimus altersimatinib blood partition in favour of the erythrocyte. Journal of Pharmacy and Pharmacology2006;58:1063–1066. [PubMed: 16872552]
Rochat B, Fayet A, Widmer N, Lahrichi SL, Pesse B, Decosterd LA, Biollaz J. Imatinib metaboliteprofiling in parallel to imatinib quantification in plasma of treated patients using liquidchromatography–mass spectrometry. Journal of Mass Spectrometry 2008;43:736–752. [PubMed:18286663]
Roche-Lestienne C, Soenen-Cornu V, Grardel-Duflos N, Lai JL, Philippe N, Facon T, Fenaux P,Preudhomme C. Several types of mutations of the Abl gene can be found in chronic myeloidleukemia patients resistant to STI571, and they can pre-exist to the onset of treatment. Blood2002;100:1014–1018. [PubMed: 12130516]
Savage DG, Antman KH. Imatinib mesylate—a new oral targeted therapy. New England Journal ofMedicine 2002;346:683–693. [PubMed: 11870247]
Titier K, Picard S, Ducint D, Teilhet E, Moore N, Berthaud P, Mahon FX, Molimard M. Quantificationof imatinib in human plasma by high-performance liquid chromatography–tandem massspectrometry. Therapeutic Drug Monitoring 2005;27:634–640. [PubMed: 16175138]
White DL, Saunders VA, Dang P, Engler J, Zannettino AC, Cambareri AC, Quinn SR, Manley PW,Hughes TP. OCT-1-mediated influx is a key determinant of the intracellular uptake of imatinib butnot nilotinib (AMN107): reduced OCT-1 activity is the cause of low in vitro sensitivity toimatinib. Blood 2006;108:697–704. [PubMed: 16597591]
Zhang YL, Bendrick-Peart J, Strom T, Haschke M, Christians U. Development and validation of ahigh-throughput assay for quantification of the proliferation inhibitor ABT-578 using LC/LC-MS/MS in blood and tissue samples. Therapeutic Drug Monitoring 2005;27:770–778. [PubMed:16306853]
Klawitter et al. Page 9
Biomed Chromatogr. Author manuscript; available in PMC 2011 February 24.
NIH
-PA Author Manuscript
NIH
-PA Author Manuscript
NIH
-PA Author Manuscript

Figure 1.Chemicals structure of imatinib mesylate (A) and trazodone (B). Arrows indicate theproduct ions selected for the multiple-reaction monitoring experiments. MS/MS spectra ofimatinib mesylate (C) and the internal standard trazodone (D) as well as structures of thefragments used for MRM. Abbreviation: cps, counts per second.
Klawitter et al. Page 10
Biomed Chromatogr. Author manuscript; available in PMC 2011 February 24.
NIH
-PA Author Manuscript
NIH
-PA Author Manuscript
NIH
-PA Author Manuscript
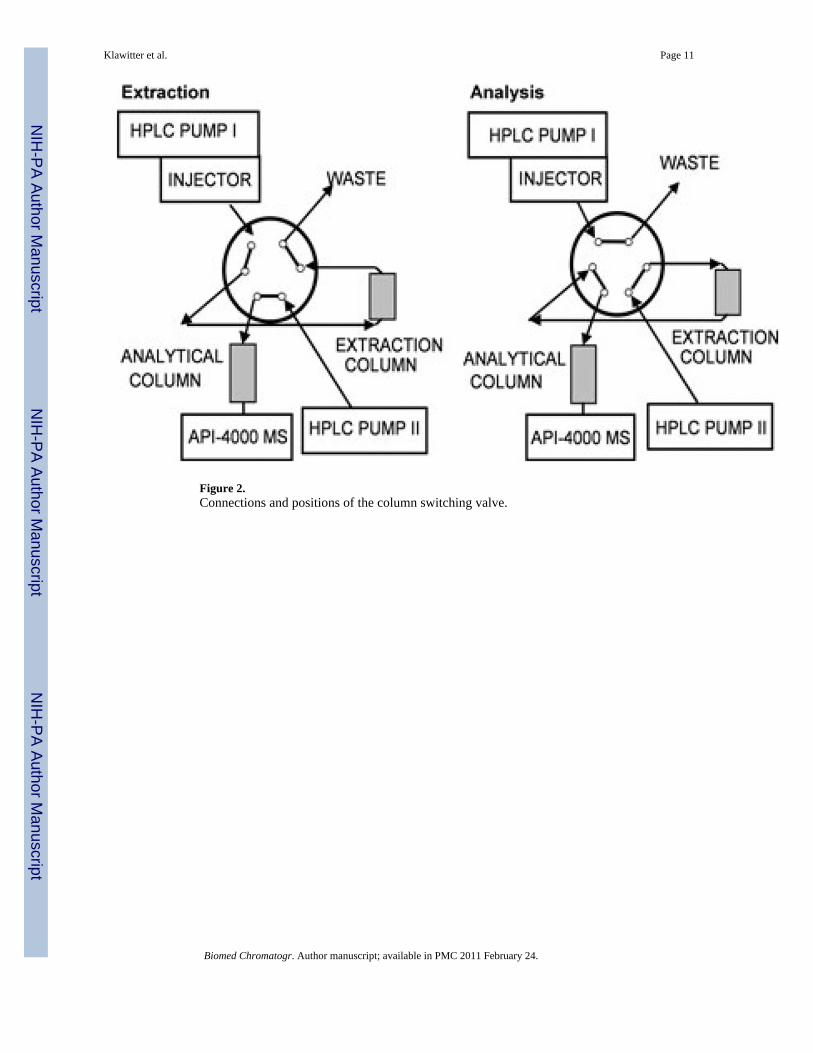
Figure 2.Connections and positions of the column switching valve.
Klawitter et al. Page 11
Biomed Chromatogr. Author manuscript; available in PMC 2011 February 24.
NIH
-PA Author Manuscript
NIH
-PA Author Manuscript
NIH
-PA Author Manuscript

Figure 3.Lack of ion suppression. Ion suppression was tested following the procedure described by[12]. Imatinib was infused post-column using a syringe pump at a delivery rate of 20 µL/min and a concentration of 10 µg/mL. Influence of different matrices on imatinib signal ispresented in whole blood (dark blue), methanol (light blue) and cell media (gray line). Blankmatrix was injected into the column-switching system.
Klawitter et al. Page 12
Biomed Chromatogr. Author manuscript; available in PMC 2011 February 24.
NIH
-PA Author Manuscript
NIH
-PA Author Manuscript
NIH
-PA Author Manuscript

Figure 4.Representative chromatograms after extraction of human blood samples. (A) blank humanblood, (B) blood spiked with imatinib at the lower limit of quantitation (LLOQ, 0.03 ng/mL), (C) representative ion chromatogram after extraction of K562 leukemia cells treatedwith 1µM imatinib for 24 hours (the intracellular concentration was 0.08 µM imatinib per107 cells). Chromatographic separation was performed using a Luna C18 column (4.6 ×50mm; 5 µm particle size). Mobile phase consisted of methanol supplemented with 0.1%TFA and 5mM ammonium acetate. For more details on HPLC conditions please refer to theexperimental section
Klawitter et al. Page 13
Biomed Chromatogr. Author manuscript; available in PMC 2011 February 24.
NIH
-PA Author Manuscript
NIH
-PA Author Manuscript
NIH
-PA Author Manuscript
NIH
-PA Author Manuscript
NIH
-PA Author Manuscript
NIH
-PA Author Manuscript
Klawitter et al. Page 14
Table 1
Intra-day accuracy and intra-day precision of imatinib quantification in human blood, leukemia cells and cellculture media
Human wholeblood
Human leukemiacells
Cell culturemedia
Intra-day accuracy LLOQ 100.9% 98.1% 93.2%
0.1 ng/mL 108.6% 100.1% 100.1%
1 ng/mL 94.7% 100.0% 100.2%
10 ng/mL 107.8% 107.6% 98.8%
ULOQ 92.8% 86.5% 94.24%
Intra-day precision LLOQ 8.8% 13.2% 14.9%
0.1 ng/mL 7.2% 6.8% 6.8%
1 ng/mL 6.7% 3.1% 7.3%
10 ng/mL 8.2% 7.0% 2.4%
ULOQ 4.3% 5.4% 11.0%
In-process stability LLOQ 114.1% 118.1% 107.4%
0.1 ng/mL 97.3% 114.0% 113.3%
1 ng/mL 93.1% 111.0% 113.7%
10 ng/mL 102.0% 109.7% 115.9%
ULOQ 99.6% 112.0% 105.4%
LLOQ, lower limit of quantitation; ULOQ, upper limit of quantitation. LLOQ for human whole blood and leukemia cells: 0.03 ng/mL and for cellculture media 0.01 ng/mL; in-process stability measured after 24 h at +4°C; ULOQ, 75 ng/mL.
Biomed Chromatogr. Author manuscript; available in PMC 2011 February 24.
Copyright © 2022 FDOKUMEN