
Early influence of prior experience on face perception
12
Early influence of prior experience on face perception Lucile Gamond a,b,c, ⁎, Nathalie George a,b,c , Jean-Didier Lemaréchal a,b,c , Laurent Hugueville a,b,c , Claude Adam a,b,c,d,e , Catherine Tallon-Baudry a,b,c a CNRS, UMR 7225, Hôpital de la Salpêtrière, 47, bd. de l'hôpital, 75651 Paris Cedex 13, France b Université Pierre et Marie Curie-Paris 6, Centre de Recherche de l'Institut du Cerveau et de la Moelle épinière, UMR-S975, Paris, France c INSERM, UMRS975, Hôpital de la Salpêtrière, 47, bd. de l'hôpital, 75651 Paris Cedex 13, France d AP-HP, Groupe hospitalier Pitié-Salpétrière, Epilepsy Unit, Paris, France e Unité d'Epileptologie, Hôpital de la Salpêtrière; 47, Bd. de l'Hôpital, 75651, Paris Cedex, France abstract article info Article history: Received 10 May 2010 Revised 20 July 2010 Accepted 31 August 2010 Available online 9 September 2010 Keywords: Associative learning Categorization Face Intracranial EEG MEG Proactive brain Inferring someone's personality from his or her photograph is a pervasive and automatic behavior that takes place even if no reliable information about one's character can be derived solely from facial features. This illustrates nicely the idea that perception is not a passive process, but rather an active combination of current sensory inputs with endogenous knowledge derived from prior experience. To understand how and when neural responses to faces can be modulated by prior experience, we recorded magneto-encephalographic (MEG) responses to new faces, before and after subjects were exposed for a short period of 15–20 min to an experimentally induced association between a facial feature (inter-eye distance) and a response (personality judgment). In spite of the absence of any observable response bias following such a short reinforcement phase, our experimental manipulation influenced neural responses to faces as early as 60–85 ms. Source localization of magneto-encephalographic signals, confirmed by intracranial recordings, suggests that prior experience modulates early neural processing along two initially independent neural routes, one initiated in an anterior system that includes the orbitofrontal cortex and the temporal poles, and the second one involving face-sensitive regions in the ventral visual pathway. The two routes are both active as early as 60 ms but engage in reciprocal interactions only later, between 135 and 160 ms. These experimental findings support recent models assuming the existence of a fast anterior pathway activated in parallel with the ventral visual system which would link prior experience with current sensory inputs. © 2010 Elsevier Inc. All rights reserved. Introduction We constantly, spontaneously and often unconsciously make inferences on encountered objects and persons (Barrett and Bar, 2009; Todorov et al., 2008; Uleman et al., 2008). For example, the man in blue overalls who is ringing at my door is likely to be the plumber I called this morning, although I never saw him before. Because the smile of the boy on the photograph reminds me of my nephew Joe, I assume this unknown boy to be as mischievous as Joe. In other words, even on a first encounter with someone never met before, we tend to spontaneously infer personality traits and social categories (Bar et al., 2006b; Hassin and Trope, 2000; Weisbuch et al., 2009; Willis and Todorov, 2006; Zebrowitz, 1997). On a first encounter with someone's portrait, such inferences are bound to be based solely on a visual analysis of facial features, since no other information is available. Facial features tend to be associated to social categories or personality traits, on the basis of either shared social stereotypes (Zebrowitz and Montepare, 2005) or subject-dependent experience. The association between facial features and some social judgment is flexible and can be manipulated experimentally. For instance, a face that has been presented along with the description of an emotionally positive (resp. negative) behavior is perceived as more positive (resp. negative) on the following encounter (Todorov et al., 2007). Moreover a hidden covariation between a facial feature and a personality trait may influence face evaluative judgment (Barker and Andrade, 2006; Lewicki, 1986). Inferences can also be influenced by the ongoing context: new faces are perceived as more male-looking after an experimentally induced adaptation to female faces (Webster et al., 2004). Thus, overall, behavioral data emphasize the importance of prior experience and knowledge in the formation of impression on faces. Moreover, they suggest a high degree of flexibility of the human brain which continuously adapts its response to incoming stimuli as a function of prior experience. NeuroImage 54 (2011) 1415–1426 ⁎ Corresponding author. CRICM, Equipe Cogimage, UPMC / CNRS UMR7225/INSERM UMRS975, Hôpital de la Salpêtrière 47, bd. de l'hôpital, 75651 Paris Cedex 13, France. Fax: +33 1 45 86 25 37. E-mail addresses: [email protected] (L. Gamond), [email protected] (N. George), [email protected] (J.-D. Lemaréchal), [email protected] (L. Hugueville), [email protected] (C. Adam), [email protected] (C. Tallon-Baudry). 1053-8119/$ – see front matter © 2010 Elsevier Inc. All rights reserved. doi:10.1016/j.neuroimage.2010.08.081 Contents lists available at ScienceDirect NeuroImage journal homepage: www.elsevier.com/locate/ynimg
-
Upload
independent -
Category
Documents
-
view
1 -
download
0
Transcript of Early influence of prior experience on face perception

Early influence of prior experience on face perception
Lucile Gamond a,b,c,⁎, Nathalie George a,b,c, Jean-Didier Lemaréchal a,b,c, Laurent Hugueville a,b,c,Claude Adam a,b,c,d,e, Catherine Tallon-Baudry a,b,c
a CNRS, UMR 7225, Hôpital de la Salpêtrière, 47, bd. de l'hôpital, 75651 Paris Cedex 13, Franceb Université Pierre et Marie Curie-Paris 6, Centre de Recherche de l'Institut du Cerveau et de la Moelle épinière, UMR-S975, Paris, Francec INSERM, UMRS975, Hôpital de la Salpêtrière, 47, bd. de l'hôpital, 75651 Paris Cedex 13, Franced AP-HP, Groupe hospitalier Pitié-Salpétrière, Epilepsy Unit, Paris, Francee Unité d'Epileptologie, Hôpital de la Salpêtrière; 47, Bd. de l'Hôpital, 75651, Paris Cedex, France
a b s t r a c ta r t i c l e i n f o
Article history:
Received 10 May 2010
Revised 20 July 2010
Accepted 31 August 2010
Available online 9 September 2010
Keywords:
Associative learning
Categorization
Face
Intracranial EEG
MEG
Proactive brain
Inferring someone's personality from his or her photograph is a pervasive and automatic behavior that takes
place even if no reliable information about one's character can be derived solely from facial features. This
illustrates nicely the idea that perception is not a passive process, but rather an active combination of current
sensory inputs with endogenous knowledge derived from prior experience. To understand how and when
neural responses to faces can be modulated by prior experience, we recorded magneto-encephalographic
(MEG) responses to new faces, before and after subjects were exposed for a short period of 15–20 min to an
experimentally induced association between a facial feature (inter-eye distance) and a response (personality
judgment). In spite of the absence of any observable response bias following such a short reinforcement
phase, our experimental manipulation influenced neural responses to faces as early as 60–85 ms. Source
localization of magneto-encephalographic signals, confirmed by intracranial recordings, suggests that prior
experience modulates early neural processing along two initially independent neural routes, one initiated in
an anterior system that includes the orbitofrontal cortex and the temporal poles, and the second one involving
face-sensitive regions in the ventral visual pathway. The two routes are both active as early as 60 ms but
engage in reciprocal interactions only later, between 135 and 160 ms. These experimental findings support
recent models assuming the existence of a fast anterior pathway activated in parallel with the ventral visual
system which would link prior experience with current sensory inputs.
© 2010 Elsevier Inc. All rights reserved.
Introduction
We constantly, spontaneously and often unconsciously make
inferences on encountered objects and persons (Barrett and Bar,
2009; Todorov et al., 2008; Uleman et al., 2008). For example, theman
in blue overalls who is ringing at my door is likely to be the plumber I
called this morning, although I never saw him before. Because the
smile of the boy on the photograph reminds me of my nephew Joe, I
assume this unknown boy to be as mischievous as Joe. In other words,
even on a first encounter with someone never met before, we tend to
spontaneously infer personality traits and social categories (Bar et al.,
2006b; Hassin and Trope, 2000; Weisbuch et al., 2009; Willis and
Todorov, 2006; Zebrowitz, 1997). On a first encounter with someone's
portrait, such inferences are bound to be based solely on a visual
analysis of facial features, since no other information is available.
Facial features tend to be associated to social categories or personality
traits, on the basis of either shared social stereotypes (Zebrowitz and
Montepare, 2005) or subject-dependent experience.
The association between facial features and some social judgment
is flexible and can be manipulated experimentally. For instance, a face
that has been presented along with the description of an emotionally
positive (resp. negative) behavior is perceived as more positive (resp.
negative) on the following encounter (Todorov et al., 2007). Moreover
a hidden covariation between a facial feature and a personality trait
may influence face evaluative judgment (Barker and Andrade, 2006;
Lewicki, 1986). Inferences can also be influenced by the ongoing
context: new faces are perceived as more male-looking after an
experimentally induced adaptation to female faces (Webster et al.,
2004). Thus, overall, behavioral data emphasize the importance of
prior experience and knowledge in the formation of impression on
faces. Moreover, they suggest a high degree of flexibility of the human
brain which continuously adapts its response to incoming stimuli as a
function of prior experience.
NeuroImage 54 (2011) 1415–1426
⁎ Corresponding author. CRICM, Equipe Cogimage, UPMC / CNRS UMR7225/INSERM
UMRS975, Hôpital de la Salpêtrière 47, bd. de l'hôpital, 75651 Paris Cedex 13, France.
Fax: +33 1 45 86 25 37.
E-mail addresses: [email protected] (L. Gamond), [email protected]
(N. George), [email protected] (J.-D. Lemaréchal),
[email protected] (L. Hugueville), [email protected] (C. Adam),
[email protected] (C. Tallon-Baudry).
1053-8119/$ – see front matter © 2010 Elsevier Inc. All rights reserved.
doi:10.1016/j.neuroimage.2010.08.081
Contents lists available at ScienceDirect
NeuroImage
j ourna l homepage: www.e lsev ie r.com/ locate /yn img

What are the neural mechanisms involved in such flexibility? The
last years have seen the development of influential theories (Friston
et al., 2009; Kersten et al., 2004; Knill and Pouget, 2004; Kveraga et al.,
2007a), which hold that visual perception is not a passive process
aiming at creating a sensory representation corresponding to a
faithful image of the environment, but rather an active combination
of knowledge derived from prior experience with current sensory
inputs. In the case of impression formation, knowledge about
previously encountered faces and associations between physical
features and personality traits may shape the neural response to
newly encountered faces. The neuroanatomical basis for this
combination of past and present experience is far from being well
documented. It seems highly likely that some interplay between top-
down and bottom-up pathways is involved. Imaging experiments
have indeed suggested that prefrontal regions, particularly in their
ventral part, exert top-down influences on sensory regions in object
and face recognition tasks (Summerfield et al., 2006). Importantly, it
has recently been suggested that high-level influences could occur at
much earlier latencies than previously thought, namely in the 50–
150 ms range (Bar et al., 2006a; Chaumon et al., 2008; Chaumon et al.,
2009). However, to what extent these top-down influences may be
associated with recent prior experience remains to be firmly
established. Moreover, in the particular case of impression formation
on persons, when and how structures of the social brain may be
involved and interact with visual areas is far from clear (Barrett and
Bar, 2009; Todorov et al., 2007; Todorov et al., 2008).
Here, we took advantage of the natural human tendency to
automatically draw inferences from the visual appearance of others'
face. We tested whether recent prior experience relative to an arbi-
trary association between a facial trait and a personality label would
alter brain responses to new faces. Using magneto-encephalography
(MEG), we examined whether the early stages of the neural re-
presentation of faces may be modified as a function of recent
experience, and to what extent top-down influences may be involved.
During the whole MEG recording session, subjects performed a face
categorization task where they had to judge the person presented as
either flexible or determined (Fig. 1). After an initial (pre-feedback)
phase, subjects went on with the task but were now given a feedback
on their performance on a trial-by-trial basis. Unknown to the
subjects, this feedback was actually based on an association between
inter-eye distance and personality trait. Half of the subjects were
given positive feedback if they judged a person with small inter-eye
distance as flexible and a person with large inter-eye distance as
determined, while this association was reversed for the other half of
the subjects. After this feedback phase of about 15 min, the subjects
resumed exactly the same task as in the initial phase. Our hypothesis
was that the reinforcement of the association between the physical
feature (inter-eye distance) and the personality trait (flexible/
determined) introduced during the feedback phase would induce a
differentiation of the early visual responses to large and small inter-
eye distance faces during the post-feedback phase.
Materials and methods
Participants
Eighteen participants took part in this study (11 female, mean age
25.2±0.9 years). All participants were right-handed and had normal
or corrected to normal vision. They provided informed written
consent and were paid for their participation. All procedures were
approved by the local ethics committee (CPP No. 07024). Two subjects
were subsequently excluded from the analyses due to eye movement
artifacts. Therefore, we analyzed the results of sixteen subjects.
Fig. 1. Experimental design. Each trial started with a central fixation point, followed by a face that was presented for 400 ms and then replaced by the fixation point. Subjects were
asked to rate the face as flexible or determined. In the feedback phase, subjects were given a feedback on the accuracy of this personality judgment, which – unknown to the subject –
was based on the inter-eye distance of the face presented. We compared MEG responses to small and large inter-eye distance faces, with the hypothesis that differences should be
observed in the post-feedback phase only. Note that there was no stimulus repetition across the successive phases of the study, so that every face and every face feature (including
the eyes) were new for each phase.
1416 L. Gamond et al. / NeuroImage 54 (2011) 1415–1426

Stimuli
Three hundred and sixty face composites were created with FACES
4.0 software (IQ Biometrix). As described in Fig. 2, we selected 180
exemplars of each of the following face features: eyebrows, eyes, nose,
mouth, and jaws as well as 30 haircuts repeated twice in 3 different
colors. We then created 12 blocks of 30 faces out of the 180 exemplars
of every feature. To build the 30 faces of a block, we first randomly
selected 15 exemplars of each feature. By combining the facial
features differently, two sets of faces were created, with the sole
constraint that no face of the second set shared more than one feature
with any face of the first set. Finally, the eyes of the first set of faces
were moved away from each other resulting in the large inter-eye
distance face pool (mean distance between the eyes=1.41±0.15° of
visual angle). The eyes of the second set of faces were moved closer to
each other to create the small inter-eye distance face pool (mean
distance between the eyes=1.21±0.15° of visual angle). Thus, with
this procedure for each block, we obtained two sets of faces made of
exactly the same facial features, yet consisting in unique combinations
of these features so that every face was different. Importantly, there
was no low-level difference between the large and the small inter-eye
distance face sets except the inter-eye distance per se. The procedure
was repeated 12 times to create the 12 blocks of 30 faces used in the
experiment. It is worth underlining that each face was seen only once
during the experiment. Since influence of prior knowledge and top-
down guidance may occur at an early latency (Bar et al., 2006a;
Chaumon et al., 2008; Dambacher et al., 2009; George et al., 1997;
Morel et al., 2009), we wanted to make sure that repetition effects
could not interfere with the results. The faces were presented on a
grey background (luminance: 44.5 cd/m²). They covered a visual
angle of 5° vertically and 3.6° horizontally.
In addition, for the purpose of control analyses, two additional
measures were taken on the stimulus set. Eye brightness was defined
as the relative difference in mean gray level between the iris and
pupil. Each stimulus could thus be classified as bright or dark-eyed
according to a median split of eye brightness values. Face aspect ratio
was defined according to Freiwald et al. (2009) definition as the
eccentricity of a solid ellipse constituting the face outline (i.e.
ffiffiffiffiffiffiffiffiffiffiffiffiffiffiffiffiffiffiffiffi
1−b
a
� �2s
where b is the half-width of the face and a is its half-height). Each
stimulus could thus be classified as large or elongated according to a
median split of eccentricity values of our face set.
Procedure
Participants were comfortably seated in an electromagnetically
shielded MEG room in front of a translucent screen placed at 85 cm
from their eyes. Stimuli were back projected onto the screen through
a video projector placed outside of the room and two mirrors inside
the MEG room.
Before the recording session began, the participants performed a
pseudo morpho-psychological test that was aimed at increasing their
confidence in their ability to perform personality judgment based
solely on facial traits. During this test, the participants had to choose
among four personality traits which ones corresponded best – to their
opinion – to presented faces. The flexible/determined labels were not
used during this test. The same final score of 85% correct responses
was attributed to every participant.
The recording sessionwas divided into three phases, pre-feedback,
feedback and post-feedback phases. In each phase, participants had to
categorize the presented faces as either flexible or determined. A
definition of these personality traits was provided beforehand,
ensuring that for both traits, the descriptions contained similar
amount of positively and negatively connoted terms, with both the
pros and cons of flexible and determined personality.
In each trial, after a variable central fixation period of 0.7 to 1 s, a
face stimulus was presented for 0.4 s. It was then replaced by the
fixation point. The participant had to indicate whether the face looked
Fig. 2. Stimulus construction. a) Our face set was built out of a pool of 180 exemplars of different facial features. Each experimental block of 30 different faces was built from 15
exemplars of each feature. b) We drew two combinations of these facial features with the sole constraint that across the two subsets of 15 faces no stimulus shared more than one
facial feature with any of the others. In this example, within each column, faces shared the same eyes (and only this feature). Inter-eye distance was decreased in the first subset, and
increased in the second subset. This procedure was repeated 12 times so that all the 180 features were used once. c) Mean faces in the two conditions of inter-eye distance, showing
that only this feature varied across the two conditions.
1417L. Gamond et al. / NeuroImage 54 (2011) 1415–1426

flexible or determined as soon as possible after the face offset. The
maximum response time was 2.5 s. The inter-trial interval (blank
screen) varied randomly between 2 and 3 s, allowing time for the
participant to blink. The task was the same throughout the three
phases. However, in the feedback phase, participants received a 2 s
feedback immediately after each of their responses which indicated
“correct response” (in green) or “incorrect response” (in red). This
feedback corresponded to an arbitrary association between the large
or small inter-eye distance and the flexible or determined personality
trait respectively. This association was constant for a given subject
and counterbalanced across subjects so that for half of the partici-
pants, correct responses associated small inter-eye distance with
“flexible” response and large inter-eye distance with “determined”
response; the association was reversed for the other half. Half of the
subjects responded “flexible” with their index finger and “deter-
mined” with their middle finger; this stimulus-response mapping
pattern was reversed for the other half of the participants, and it was
orthogonal to the association between inter-eye distance and
personality label.
The pre-feedback, feedback and post-feedback phases were each
divided into two runs and each run was composed of 2 (out of 12)
blocks of 30 stimuli (15 large/15 small inter-eye distance faces). The
blocks that composed the pre-feedback, feedback and post-feedback
phases were counterbalanced across subjects. Within each block, the
order of face presentation was randomized, so that a given facial trait
was repeated (in a different face – see preceding discussion) with a
minimum of three intervening stimuli. Therewas neither face nor face
feature repetition across blocks.
At the end of the recording session, the participants went through
a questionnaire. They were asked to rank five main face features
(eyebrows, eyes, nose, mouth, and global face shape) from the least to
the most important for both the flexible and determined judgments.
Subjects were then asked to indicate which particular property (size,
color, shape, thickness…) was relevant for the two topmost important
features that they had chosen.
At the end of the experiment, the participants were informed of
the main goal of the study. They were told that the morphological test
was a false test and that it is not possible to accurately judge whether
someone is flexible or determined based on facial appearance only.
Participants were thus informed of the real aims of the study at the
end of the experiment only. In that sense, the informed consent they
gave at the beginning was only partially valid (Miller and Kaptchuk,
2008). Participants were therefore offered the opportunity to
withdraw their data from the research — an opportunity that was
not seized by any of the participants.
MEG recordings
Magneto-encephalographic signals were collected continuously
on a whole-head MEG system with 151 axial gradiometers (CTF
Systems, Port Coquitlam, British Columbia, Canada) at a sampling rate
of 1250 Hz (band-pass: DC to 300 Hz). Seventeen external reference
gradiometers and magnetometers were included to apply a synthetic
third-gradient to all MEG signals for ambient field correction. Three
small coils were attached to reference landmarks on the participant
(left and right preauricular points, plus nasion) in order to monitor
head position. Vertical and horizontal eye movements were moni-
tored simultaneously to the MEG signal with an eye-tracker system
(ISCAN ETL-400). The recording also included the signal of a
photodiode that detected the actual appearance of the stimuli on
the screenwithin theMEG room. This allowed correcting for the delay
introduced by the video projector (20 ms) and averaging event-
related magnetic fields (ERFs) precisely time-locked on the actual
onset of the face stimulus.
For the purpose of evoked magnetic field analysis, MEG segments
from 400 ms before to 400 ms after stimulus onset were extracted
from the continuous MEG signal. Trials with saccades (rejection
threshold: 1° of visual angle from fixation), eye blinks or muscle
artifact were rejected upon visual inspection of the MEG and eye-
tracking signals. Average MEG waveforms were then computed,
digitally low-pass filtered at 30 Hz and baseline corrected with
respect to the 300 ms preceding face onset. Averages were computed
separately for each condition of inter-eye distance (small/large) for
the pre-feedback and post-feedback phases respectively.
Data analysis
The evoked magnetic fields obtained for the small and large inter-
eye distance faces during the pre- and post-feedback phases
respectively were averaged across successive 25-ms time windows
from 35 ms to 160 ms, to cover the 50–150 ms time range in which
differences could be expected (Bar et al., 2006a; Chaumon et al., 2008,
2009). Any difference between evoked responses to small vs. large
inter-eye distance faces that exceeded 20 fT was inspected. A
difference of 20 fT corresponded to ~10% modulation of the maximal
response, an effect size compatible with what is described in the
literature. Only a single sensor occasionally exceeded this threshold in
the pre-feedback phase. In the post-feedback phase, in addition to
occasional isolated sensors, clusters of 5 or more neighboring sensors
could be observed. Those clusters of at least 5 neighboring sensors
exceeding 20 fT were thus measured and statistically tested.
Source localization and correlation
Cortical current source density mapping was obtained using a
distributed source model consisting in 15,000 current dipoles in each
subject and condition. Dipole locations and orientations were
constrained to the cortical mantle of a generic brain model (Colin
Homes) built from the standard brain of the Montreal Neurological
Institute using the BrainSuite software package (http://neuroimage.
usc.edu). This head model was then warped to the standard geometry
of the MEG sensor cap. The warping procedure, all subsequent source
analyses and visualization were performed with the BrainStorm
software package (http://neuroimage.usc.edu/brainstorm). MEG for-
ward modeling was computed with the overlapping-spheres analyt-
ical model. Cortical current maps were then computed from the MEG
time series using a linear inverse estimator, the weighted minimum-
norm current estimate. We computed the differences of cortical
currents for large versus small inter-eye distance conditions and
averaged these values for the 3 time windows of interest (60–80 ms,
110–135 ms and 135–160 ms). Only mean differential activities
extending over at least 30 contiguous vertices with amplitudes
above 60% of the maximal source amplitude were taken into account.
For each region revealed by source localization, we selected the
vertex showing the greatest differential activity and his 14 neighbors
to define a region of interest (ROI). For each subject and condition, we
computed the mean difference between small and large inter-eye
distance faces in each ROI and time window of interest. We then
computed Pearson correlation coefficients between each region in
each time window across subjects.
Intracranial recordings
Two epileptic patients (one 25 years oldmale and one 43 years old
female) gave their written informed consent to participate in the
experiment. They both had normal or corrected to normal vision. The
project was approved by the local ethics committee. The patients
suffered from severe, pharmacoresistant partial epilepsy and were
chronically implanted with depth electrodes with a view to surgical
treatment (Ad-TechMedical Instruments, Racine, WI, US). Electrodes
were composed of 4–10 contacts 2.3 mm long, 10 mm apart, mounted
on a 1 mm wide flexible plastic probe. The cerebral structures
1418 L. Gamond et al. / NeuroImage 54 (2011) 1415–1426

explored by intracerebral electrodes were defined according to the
localization hypotheses derived from the non-invasive including
electro-clinical and neuro-imaging (MRI, PET, SPECT) evaluations
(Adam et al., 1996). Contacts located into the epiletogenic zone and/or
displaying either spikes or abnormal rhythmic activity were not
included in the data analysis. In Patient #1, the epileptic focus was
located 1 to 2 cm ventrally and posteriorly to the contacts of interest
described in Fig. 5. In Patient #2, the epileptic focus was in the right
temporal lobe while the results were obtained in the left temporal
lobe. Data were acquired with a Micromed System Plus (Micromed
SpA, Mogliano Veneto, Italy) at a sampling rate of 1024 Hz (band-
pass: 0.16 to 330 Hz) for Patient #1 and with a Nicolet 6000 (Nicolet-
Viasys, Madison,WI, US) at a sampling rate of 400 Hz (band-pass: 0.05
to 150 Hz) for Patient #2, both with respect to a vertex scalp
reference. Bipolar recordings between adjacent contacts were
computed offline to minimize the influence of distant sources, and
low-pass filtered at 30 Hz. A Z score of EEG activity was computed
along time for each trial Z(t)=(x(t)−BL)/σBL where Z(t) is the Z-
score value at time t, x(t) is the raw data value at time t, BL is themean
baseline value from−300 to 0 ms and σBL is the standard deviation of
the baseline. Evoked potentials were computed by averaging Z-score
data across trials under small and large inter-eye distance conditions
respectively (time courses on Figs. 5b and e). Z-score transformation
allows normalizing the data according to baseline noise level on a
trial-by-trial basis, thus avoiding a potential weighting bias toward
noisier trials in the intracerebral ERP averages (see Chaumon et al.,
2009 for a similar approach).
Statistical differences in evoked responses to small and large inter-
eye distance faces in the post-feedback phase were estimated by a
randomization procedure. The difference between the evoked
responses in the two conditions was compared to an estimate of the
expected difference distribution under the null hypothesis. The null
distribution of the data was estimated using a randomization
procedure repeated 1000 times: trials were randomly assigned to
one of two groups of the same size as the actual experimental
conditions, and the permuted difference was computed. At each time
point, p values were the number of permuted differences reaching a
higher level than the difference actually observed between conditions
divided by the number of permutations, multiplied by 2 (two-sided
randomization procedure).
Results
Behavior
Subjects responded “flexible” as often as “determined” throughout
the blocks (mean number of trials per block=28.1±0.6 for
the “flexible” response, 31.2±0.6 for the “determined” response; χ2
(15)=14.3, p=0.50) with a mean reaction time of 1095±41 ms. The
personality trait judgment was not affected by the feedback phase:
the number of responses corresponding to the reinforced association
did not increase in the post-feedback phase (mean number of
responses corresponding to reinforced association in pre-feedback
phase: 60.6±1.3 and post-feedback phase: 60.5±1.5, χ2(15)=6.44,
p=0.97). Reaction times were not affected by the feedback phase
either (mean post-feedback reaction time for the reinforced associ-
ation: 1070±39 ms, for the non reinforced association: 1065±
40 ms; paired t-test: t(15)=0.39, p=0.70). Post-experiment ques-
tionnaires confirmed that the subjects did not report consciously
using inter-eye distance for their judgments. Indeed, although 13 out
of 16 subjects indicated the eyes as the most relevant feature for the
task, only one of these 13 subjects chose inter-eye distance as the
relevant property of the eyes, and he reported the wrong association
between inter-eye distance and personality label.
The association between inter-eye distance and response intro-
duced during feedback did not result in any observable behavioral
bias in the personality judgment task. However, if the statistical
regularity of the association between a personality trait and inter-eye
distance induced during the feedback phase has been somehow
registered, then differentiated neural responses to large versus small
inter-eye distance faces might be observed during the post-feedback
phase.
Event-related magnetic fields (ERFs)
Did the feedback phase induce a sensitization to inter-eye distance
at the neural level? To evaluate whether responses to large and small
inter-eye distance faces differed in the post-feedback phase, we
computed the mean amplitude of evoked magnetic fields over five
successive 25-ms time windows covering the main peaks of activity
(Fig. 3a) between 35 and 160 ms. In each timewindow, any difference
between the magnetic responses to large and that to small inter-eye
distance which exceeded 20 fT over 5 contiguous sensors was sys-
tematically tested. We averaged the ERF value over the sensors above
threshold and computed a paired t-test on mean ERF amplitude for
large versus small inter-eye distance conditions. This systematic
measurement approach was first applied independently to both the
pre- and the post-feedback phases to test for any difference in ERFs to
large and small inter-eye distance faces in either phase (Fig. 3b).
This analysis revealed significant differences between small and
large inter-eye distance faces during the post-feedback period only.
During this phase, an early differential activity for small versus large
inter-eye distance faces was observed as soon as between 60 and
85 ms (9 sensors above the 20 fT threshold). This early differential
response was highly significant (t(15)=3.31, pb0.005). Later, ERFs to
small and large inter-eye distance faces differed between 110 and
135 ms over the left temporal region (11 sensors, t(15)=−2.40,
pb0.03). The difference approached significance over the right
temporal regions (5 sensors, t(15)=2.07, p=0.056). Finally, the
difference in mean ERF amplitude was sustained between 135 and
160 ms on left anterior temporo-central sensors (7 sensors, t(15)=
−2.26, pb0.04). We further checked that these results were not
dependent on the length of the timewindowof analysis: using shorter
time windows (15 or 20 ms) did not alter the nature of the results.
Were these differential responses to large and small inter-eye
distance faces due to the feedback phase, or could they be attributed
to some pre-existing differential processing of faces with small versus
large inter-eye distance? No group of 5 sensors exceeded, nor even
approached, the 20 fT threshold during the pre-feedback phase, as can
be seen in Fig. 3b. At most, only a single sensor exceeded the 20 fT
threshold in the pre-feedback phase. In addition, to ensure that the
post-feedback differential responses to large and small inter-eye
distance were not present during the pre-feedback period, we
measured the mean amplitude of pre-feedback ERFs over the same
sensor sets as those selected on the basis of their post-feedback
activity. This confirmed that there was not any trend toward a pre-
existing differential response for large and small inter-eye distance
over these sensors of interest (Fig. 3c), in either time window (all t
(15)b1.10, all pN0.32). To conclude, there was not any significant
difference between evoked responses to large and small inter-eye
distance faces in the pre-feedback phase, whereas in the post-
feedback phase, neural responses significantly differed as a function of
inter-eye distance as early as from 60 to 85 ms.
A differential response to large and small inter-eye distance thus
seemed to be induced by the feedback phase. Did this difference truly
reflect the relevance of inter-eye distance for the task, or did it reflect
a mere sensitization to the overall structure of our stimuli? Indeed,
throughout the experiment, subjects were exposed to new faces that
could be categorized as having small or large inter-eye distance,
which is a salient configural feature of the faces. The difference
observed could reflect an automatic sensitization to the intrinsic
configural distribution of inter-eye distances in the stimulus set,
1419L. Gamond et al. / NeuroImage 54 (2011) 1415–1426

Fig. 3. Early dissociation along inter-eye distance. a) Left, superimposed time courses of the event-related magnetic fields (ERFs) over the 151 sensors, averaged across all faces in
both pre- and post-feedback phases. Right, topography of ERFs at the two main peak latencies (83 ms and 132 ms). b) Mean ERF difference between large and small inter-eye
distance faces in pre-feedback (top) and post-feedback (bottom) phases during five successive 25-ms time windows. The black contours delineate the regions of interest (ROI),
which showed a difference of at least 20 fT over at least five contiguous sensors. c) Mean (and standard error of the mean) activity in identified ROIs for large and small inter-eye
distance faces during pre- and post-feedback phases, for the three time windows of interest. (**pb0.01; *pb0.05; (*)pb0.1; ns, non significant). d) ERFs to large (black) and small
(red) inter-eye distance faces in the post-feedback phase, grand averaged across subjects, at the sensors of interest indicated by white dots on the topographical maps. e) Mean ERF
topographical maps for large and small inter-eye distance conditions in each time windows of interest.
1420 L. Gamond et al. / NeuroImage 54 (2011) 1415–1426

rather than an actual influence of the reinforced feature. Furthermore,
it is also possible that our effect arose from an increased attention to
the eye region favored by the feedback phase, yet non-specific to
inter-eye distance per se. To rule out these hypotheses, we selected
two other properties of the face: one that also concerned the eyes but
was featural, namely eye brightness, and the other that concerned
another important configural property of the faces and to which face
neurons have been found to be highly sensitive (Freiwald et al., 2009;
Tsao et al., 2008), namely face aspect ratio. We thus tested each
previously identified time window of interest for differential post-
feedback responses to eye brightness or face aspect ratio. There was
not any post-feedback difference in the ERFs for dark versus bright
eyes or for large vs. elongated faces which reached the 20 fT threshold
over more than a single sensor in either time window: 60–85 ms,
110–135 ms, and 135–160 ms. In addition, we determined the
threshold at which clusters of at least 5 neighboring sensors emerged
in every time window of interest. We had to lower the threshold from
20 fT down to 12 fT (eye brightness) and 8 fT (face aspect ratio). Thus
our post-feedback effects of inter-eye distance do not seem to be
explained either by sensitization to the stimulus set structure or by
increased unspecific attention to the eye region.
Finally, in order to further examine whether sensitization to inter-
eye distance per se but independent of the feedback phase could
account for our results, we examinedwhether there was some hint for
such sensitization developing over the experiment. In other words, if
sensitization to inter-eye distance occurred, there should be some
hint of this sensitization when comparing the 1st and 2nd blocks of
the pre-feedback period as well as greater effects in the 6th than the
5th blocks during the post-feedback phase.We therefore compared
the amplitude of ERF difference between small and large inter-eye
distance faces in the 1st and 2nd blocks of the pre-feedback period.
There was no trend to an emergence of a difference (sum of ERF
differences, over all sensors and time windows of interest=1.74 fT in
the 1st block, 0.3 fT in the 2nd block; pN0.70 in both blocks). We also
examined the ERF differences between small and large inter-eye
distance in the 5th and 6th blocks (i.e. post-feedback blocks). If
anything, the inter-eye distance effect observed in the 5th block, just
after the feedback period, tended to be more marked, with a sum of
ERF differences over the sensors and time windows of interest of
29.5 fT in the 5th block (pb0.01), and of 14.9 fT in the 6th block
(p=0.11). Note that the statistical power of these analyses per run
was inevitably limited, since signal-to-noise ratio was lower in this
block-by-block analysis, and p values are only reported here
descriptively.
In sum, the difference of magnetic responses to large and small
inter-eye distance faces found in the post-feedback phase did not
seem attributable either to a mere sensitization to the intrinsic
structure of the stimulus set or to a non-specific increase of attention
toward the eye region. Rather it seemed that the regular association
between inter-eye distance and the subject's response introduced
during the feedback phase resulted in sensitized brain responses to
inter-eye distance, with differentiated responses to large and small
inter-eye distance faces as early as between 60 and 85 ms.
Source localization and correlation analysis
To confirm our findings and determine the regions that encoded
differentially inter-eye distance, we estimated the cortical sources
activated by small and large inter-eye distance faces in the post-
feedback phase, and computed the mean source amplitude difference
in the three time windows of interest, 60–85 ms, 110–135 ms and
135–160 ms. This revealed a spatially and temporally structured
network of activated regions (Fig. 4). Differential encoding of inter-
eye distance begun in the orbitofrontal area and temporal pole, as well
as in a lateral inferotemporal region between 60 and 85 ms. Then, the
activity from the lateral inferotemporal region spreads into the
ventral visual pathway, toward both more anterior and more
posterior regions of the ventral inferotemporal cortex, between 110
and 135 ms. Finally, between 135 and 160 ms, the lateral and
posterior parts of the inferotemporal regions remained differentially
activated while a re-activation of orbitofrontal and temporopolar
regions was observed bilaterally. There was not any other differen-
tially activated region.
In order to ensure that the differential activity located in the
orbitofrontal areas could not be related to uncontrolled eye
movement differences, we averaged eye-tracker signals for the two
conditions of inter-eye distance in the post-feedback phase. The
analysis of this signal over the two timewindows (60-85 ms and 135–
160 ms) where orbitofrontal sources were found did not reveal any
significant effect of eye movements either in the vertical or in the
horizontal directions (all t(15)b1.4, all pN0.15).
We then sought to determine whether the clusters of differentially
activated brain sources were independent from each other, or
whether they were functionally coupled. Specifically, we tested if
neural activity in a given region and in a given time window would
influence the activity of another brain region in the same or a later
Fig. 4. Regions differentially activated by small and large inter-eye distance faces in the
post-feedback phase. Results are presented in the three windows of interest (60–85 ms,
110–135 ms and 135–160 ms), on a ventral view of the brain. The dorsal view is also
presented as a small inset. Only regions that show the 60% topmost difference over at
least 30 contiguous vertices are displayed. Black dots indicate the vertices showing the
largest differences in each region. Black contours delineate regions that respond in a
similar manner and that display similar correlations with other areas. Colored arrows
indicate the significant correlations between regions across the time windows and
doted arrows show near significant correlations. The complete list of correlation values
can be found in Table 1. R: right hemisphere; L: left hemisphere.
1421L. Gamond et al. / NeuroImage 54 (2011) 1415–1426
timewindow. To that aim, we selected themaximally activated vertex
and its 14 neighboring vertices for each region identified in every time
window of interest and we computed the Pearson correlation
coefficient between the mean amplitudes of these source clusters
across subjects (Table 1 and Fig. 4). The early (60–85 ms) source
activation in orbitofrontal and temporopolar regions significantly
correlated with the late (135–160 ms) re-activation within these
regions, but also and more interestingly with the 135–160 ms activity
in the inferotemporal regions (significant correlation between the 60–
85 ms activity in the left temporal pole and the 135–160 ms activity in
the ventral inferotemporal cortex). By contrast, correlations between
the early sources in the orbito-temporopolar regions and the 60–
85 ms or 110–135 ms sources in the inferotemporal regions were
weak and did not reach significance. This pattern of results suggest
that the anterior areas and the ventral visual regions were initially
activated in parallel, and interacted at a later stage, between 135 and
160 ms. In line with this idea, source activation in the inferotemporal
regions between 110 and 135 ms correlated with the late (135–
160 ms) source activations in the orbitofrontal region – and to lesser
extent – in the temporopolar regions. There was also a trend to a
correlation between the early (60–85 ms) activity in the lateral
inferotemporal region and the late orbitofrontal activation. Further-
more, the early (60–85 ms) source activation in the lateral infer-
otemporal region correlated with the source activation in
inferotemporal regions between 110 and 135 ms and between 135
and 160 ms.
Overall, these results suggest two distinct routes by which prior
experience influenced early neural responses to the faces in the post-
feedback phase. The first one originates in the lateral inferotemporal
cortex between 60 and 85 ms and spreads its influence along the
ventral inferotemporal regions. The second one stems from the
orbitofrontal cortex and temporal pole as early as 60–85 ms. At 135–
160 ms, there is reciprocal influence between the orbito-temporopolar
route and the inferotemporal regions. This suggests that at 135–
160 ms, information from the two routes is fully integrated in a
distributed and recurrent network comprising the orbitofrontal cortex
and temporal poles on the one hand and the lateral and ventral
inferotemporal regions on the other hand.
Intracranial data
We had the opportunity to confirm the anatomical localization of
the early differential effects in intracranial recordings in 2 patients.
This is all themore important that source localization ofMEG datawas
obtained on an anatomical template, not on individual MRIs. One
patient's implantation schema included an electrode in the orbito-
frontal cortex (Fig. 5a). We systematically tested the difference
between small and large inter-eye distance faces during the post-
feedback phase by computing mean amplitude of EEG signal in sliding
10-ms time window from −300 ms to +400 ms, for every trial. The
only significant differences (pb0.05, two-sided randomization pro-
cedure) were observed from 61 to 82 ms as well as later on, between
288 and 309 ms (Fig. 5b), in the post-feedback phase. No significant
difference was observed in the pre-feedback phase. We then checked
(Fig. 5c) that the mean 61–82 ms EEG amplitude significantly differed
between small and large inter-eye distance faces during the post-
feedback phase (pb0.03) but not during the pre-feedback phase
(p=0.32, two-sided randomization procedure).
In addition, the posterior inferotemporal region was investigated
in another patient (Figs. 5d, e and f). The same procedure revealed a
significant difference in electrical response to small and large inter-
eye distance stimuli during the post-feedback phase from 112 to
125 ms (pb0.05, two-sided randomization procedure).No significant
difference was observed in the pre-feedback phase. We further
checked that the mean 112–125 ms EEG amplitude differed signifi-
cantly for small versus large inter-eye distance during the post-
feedback phase only (pb0.04), whereas it was nonsignificant in the
pre-feedback phase (p=0.15).
Discussion
We show that when attempting to infer one's personality from his/
her photograph, a short exposure to an unconscious association rule
between a facial feature and a personality trait influences the neural
responses to newly encountered faces at surprisingly early latencies.
Differential responses that were specific to the manipulated facial
feature, namely inter-eye distance, emerged as early as around 70 ms.
Source localization, confirmed by intracranial recordings, suggests
that the early differential response, around 70 ms, stems from the
orbitofrontal cortex and temporal poles on the one hand, and from the
lateral convexity of the temporal lobe on the other hand. The latter
activity spreads around 120 ms in the ventral visual pathway. Last,
correlation measures suggest that these two routes are initially
independent but influence each other around 150 ms.
Reinforcing the association between inter-eye distance and the
subject's response induced a differential neural activity to small and
large inter-eye distance faces which was not present in the pre-
feedback phase. Because the onset latency of the effect was very early,
around 70 ms, it is worth examining whether it could be due to
another parameter than the associative reinforcement between inter-
eye distance and personality judgment. Low-level differences be-
tween stimuli other than related to inter-eye distance can in principle
be ruled out, since stimuli were counterbalanced between subjects
and small and large inter-eye distance faces did not differ on average
apart from their inter-eye distance. Mere repetition effects cannot
have influenced the results since each face was presented only once
during the experiment. Moreover, although each facial feature was
seen twice, it was always within the same phase and therefore cannot
account for any difference between pre- and post-feedback phases.
However, subjects could have become sensitized on inter-eye
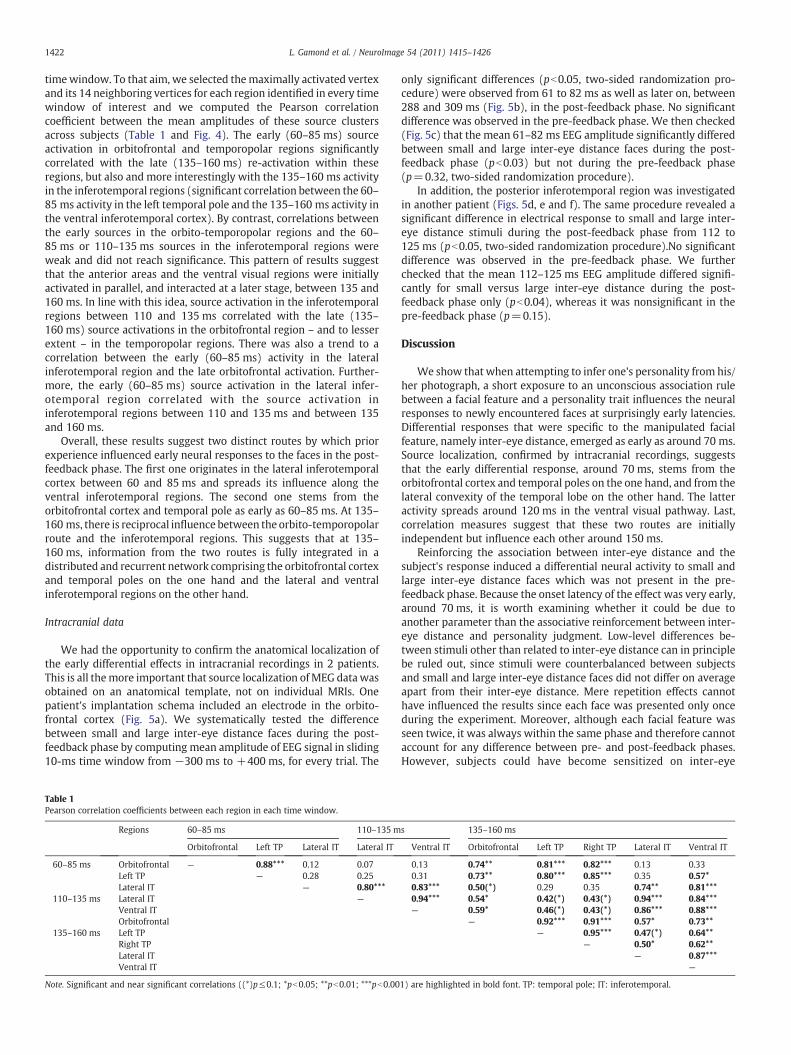
Table 1
Pearson correlation coefficients between each region in each time window.
Regions 60–85 ms 110–135 ms 135–160 ms
Orbitofrontal Left TP Lateral IT Lateral IT Ventral IT Orbitofrontal Left TP Right TP Lateral IT Ventral IT
60–85 ms Orbitofrontal — 0.88*** 0.12 0.07 0.13 0.74** 0.81*** 0.82*** 0.13 0.33
Left TP — 0.28 0.25 0.31 0.73** 0.80*** 0.85*** 0.35 0.57*
Lateral IT — 0.80*** 0.83*** 0.50(*) 0.29 0.35 0.74** 0.81***
110–135 ms Lateral IT — 0.94*** 0.54* 0.42(*) 0.43(*) 0.94*** 0.84***
Ventral IT — 0.59* 0.46(*) 0.43(*) 0.86*** 0.88***
Orbitofrontal — 0.92*** 0.91*** 0.57* 0.73**
135–160 ms Left TP — 0.95*** 0.47(*) 0.64**
Right TP — 0.50* 0.62**
Lateral IT — 0.87***
Ventral IT —
Note. Significant and near significant correlations ((*)p≤0.1; *pb0.05; **pb0.01; ***pb0.001) are highlighted in bold font. TP: temporal pole; IT: inferotemporal.
1422 L. Gamond et al. / NeuroImage 54 (2011) 1415–1426

distance in a task-independent manner. If this were the case, then 1)
subjects should become sensitized on other facial features that are not
relevant for the task and 2) differences between small and large inter-
eye distance faces should develop gradually during the experiment,
not appear abruptly after the feedback phase.We first checked that no
differential response emerged for task-irrelevant features such as eye
brightness (which is another salient feature of the eyes) or face aspect
ratio (which is another configural facial feature to which inferotem-
poral neurons are sensitive (Freiwald et al., 2009). No differentiated
magnetic responses could be observed in the post-feedback phase for
these face features at which the participants were not trained at and
that were not relevant for the task. Second, differences between small
and large inter-eye distance faces were more pronounced immedi-
ately after the feedback phase. The emergence of a difference in the
visual processing of large and small inter-eye distance faces therefore
appears to be due to the reinforcement rule based on inter-eye
distance.
Despite the influence of the reinforcement rule on neural activity,
it did not produce any observable bias in personality judgment. Thus,
the early neural processes described here, in the first 150 ms of
activity, appear to be well upstream from decision making and
personality judgment that occurred on average at 1095 ms. Several
explanations might account for this surprising dissociation between
behavioral performance and neural activity. First, judging someone's
personality from his photograph is bound to be influenced bymultiple
sources of knowledge, some of them highly subject-dependent. For
instance one person may look like your former supervisor who was
highly determined. The large number of variables that can be involved
in social judgments may explain the lack of consistency in behavioral
results of previous studies, which reported biased judgments with
longer (Lewicki, 1986) or faster (Barker and Andrade, 2006) reaction
times as well as weak or negative findings (Bos and Bonke, 1998;
Hendrickx et al., 1997). Thus, our experimental manipulation of a
single variable among the vast amount of information gathered
through life-long experience may not have been sufficient to directly
influence the final decision. Second, the feedback phase was quite
short, about 15 min. It is possible that a longer feedback phase might
have led to a measurable behavioral effect. Third, the behavioral
measure we used may not have been sensitive enough to reveal such
behavioral effect. Confidence ratings or wagering for instance might
be better suited to capture a subtle behavioral difference in the post-
feedback phase (Persaud et al., 2007). Here, the manipulated variable
clearly affected early neural responses, showing that the brain
evaluates the relevant feature at early processing stages although
this piece of information did not influence significantly later
decisional stages. This brain/behavior dissociation is reminiscent of
previous findings in patients with ventral prefrontal lesions whose
behavioral impairment could be assessed experimentally only using
an especially designed gambling task (Bechara et al., 2000; Damasio,
1994).
The first hint of a differential processing of large and small inter-
eye distance faces in the post-feedback phase occurs surprisingly
early, around 70 ms. This result is in line with a growing body of
evidence showing that visual categorization mechanisms could be
much faster than previously thought (Liu et al., 2002; Meeren et al.,
2008; Thorpe et al., 1996). Thus several studies have shown that
visual responses can be modulated even before 100 ms by various
cognitive factors. Such modulations have been reported for attention
(Kelly et al., 2008; Poghosyan and Ioannides, 2008), perceptual
learning (Pourtois et al., 2008), implicit categorization (Meeren et al.,
2008; Mouchetant-Rostaing and Giard, 2003; Pourtois et al., 2005;
Thorpe et al., 1983), as well as prior knowledge onwords (Dambacher
et al., 2009) or abstract visual scenes (Chaumon et al., 2008), and for
the combination of experience- and emotion-related factors (Morel et
al., 2009; Stolarova et al., 2006). Our results extend on previous
findings on fast visual mechanisms in two respects. First, we show
that such mechanisms can operate flexibly, depending on recent
reinforcement history since the implicit categorization rule intro-
duced through simple feedback altered MEG responses to faces after
only 15–20 min of training. Second, we confirm that these mechan-
isms can operate totally unconsciously as subjects had no explicit
knowledge about the underlying task's structure (Chaumon et al.,
2008, 2009). Moreover, our results provide a detailed spatial and
temporal characterization of the very first steps of neural categori-
zation. Two initially independent routes were differentially activated
by different values of the relevant feature around 70 ms. The first
Fig. 5. Intracranial recordings. a) and d) Anatomical MRIs showing the recording sites. R: right hemisphere; L: left hemisphere. b) and e) Time course of the Z-transformed bipolar
intracranial evoked potentials, in response to small (thin line) and large (thick line) inter-eye distance faces, during the post-feedback phase. The time windows revealing significant
differences are highlighted in gray. c) Mean 61–82 ms response (and standard error of the mean) in the orbitofrontal cortex for small (gray bar) and large (black bar) inter-eye
distance faces, in the pre- and post-feedback phases (*pb0.05). f) Mean 112–125 ms response (and standard error of themean) in the posterior inferotemporal region for small (gray
bar) and large (black bar) inter-eye distance faces, in the pre- and post-feedback phases (*pb0.05).
1423L. Gamond et al. / NeuroImage 54 (2011) 1415–1426

route involves the lateral and ventral inferotemporal lobe, and the
other originates in the orbitofrontal and temporopolar regions.
The temporal route showed differential responses as early as
70 ms on the lateral convexity, with this differential activity then
spreading to the ventral inferotemporal cortex both posteriorly and
anteriorly. The location of these source clusters are in line with the
face-responsive regions typically observed in humans, along the
lateral convexity (Allison et al., 1999; Puce et al., 1998), the posterior
fusiform gyrus (Hadjikhani et al., 2009; Kanwisher et al., 1997) and
more anteriorly in the vicinity of the human homologue of the
anterior face patch (Kriegeskorte et al., 2007; Rajimehr et al., 2009).
Face-responsive regions typically contain neurons that are sensitive
to inter-eye distance (Freiwald et al., 2009; Tsao and Livingstone,
2008). Prior experience might affect either the sensitivity of these
neurons or foster their spatial segregation, the two alternatives being
notmutually exclusive. Thus, we show that face (and eye) responsive
regions in the ventral and lateral temporal lobe are altered by
training, in line with previous findings showing that experience
alters the brain regions that were already responsive to the
manipulated stimulus properties before training (Gauthier and
Tarr, 1997; Li et al., 2009; Op de Beeck et al., 2006; Sigala and
Logothetis, 2002). As for the temporal dynamics of these brain
regions, the influence of training in the ventral inferotemporal
cortex, around 120 ms, is consistent with electrophysiological data in
monkeys (Sigala and Logothetis, 2002; Vogels, 1999), although
pioneer work in humans suggested slightly longer latencies, around
170 ms (Bentin et al., 2002).We add to this previous literature an
earlier effect of experience, located on the lateral convexity. This
latter region is known to be sensitive not only to faces (Allison et al.,
1999) but also more specifically to eyes (Puce et al., 1998), and it
seems to be particularly sensitive to new faces as early as 75 ms
(Pourtois et al., 2005; Seeck et al., 1997).
The very first steps of neural categorization also involved an
anterior route with a differential activation of the orbitofrontal cortex
and of the temporal pole around 70 ms. These two structures are
known to be tightly coupled both anatomically (Barbas, 2007;
Carmichael and Price, 1995b; Markowitsch et al., 1985; Pandya and
Seltzer, 1982) and functionally (Olson et al., 2007; Simmons et al.,
2010), and they both belong to the social brain (Olson et al., 2007;
Rolls, 2007). The temporal pole region has been consistently found to
respond at surprisingly early latencies, including responses in the 60–
90 ms range (Chaumon et al., 2009; Eifuku et al., 2004; Kiani et al.,
2005;Wilson et al., 1983; Xiang and Brown, 1998). With regard to the
orbitofrontal region, Bar et al. (2006a) reported an activation in the
100–150 ms time range, whereas Chaumon et al. (2009) and Rudrauf
et al. (2008) reported orbitofrontal and temporopolar activities
around 100 ms and Bayle and Taylor (2010) found medial orbital
frontal sources of MEG signals around 90 ms. The orbitofrontal
involvement in the present study was even earlier, beginning in the
60–85 ms time window. The source of this discrepancy is somewhat
unclear as the material and paradigm were very different across
studies. Chaumon et al. (2009) studied implicit visual memory
associated with visual scenes composed of T and L, Bar et al.
(2006a) focused on visual (non face) object recognition, whereas
Rudrauf et al. (2008) and Bayle and Taylor (2010) studied emotion
perception from scenes and faces respectively (see also Kawasaki et
al., 2001). It is possible that the nature of both tasks and stimuli as well
as the type of top-down influence manipulated may influence the
latency of the effects found. In our case, the conjunction of the use of
highly relevant stimuli (i.e. faces) in a categorical person perception
task (to which humans appear to be naturally inclined (Macrae and
Bodenhausen, 2000)) might have fostered the observation of
particularly early effects involving the temporopolar and orbitofrontal
regions.
There are a number of potential connectivity patterns which may
subtend these fast responses. Inputs going through the geniculo-
striate pathway could reach the temporal pole directly from area V4
through the inferior longitudinal fasciculus (Catani et al., 2003), or the
orbitofrontal cortex through a dorsal relay (Carmichael and Price,
1995a; Cavada and Goldman-Rakic, 1989). Two subcortical pathways
could also be involved. The first one is the hypothetical direct route
toward the amygdala (LeDoux, 1996; Liddell et al., 2005). This region
can be activated as soon as 20–30 ms (Luo et al., 2007) and is closely
connected with orbitofrontal and temporopolar areas (Amaral and
Price, 1984; Cavada et al., 2000; Ghashghaei and Barbas, 2002;
Markowitsch et al., 1985; Rolls, 1999). The other potential subcortical
pathway implies the pulvinar, since this structure is connected to both
the orbitofrontal and temporopolar cortices (Bos and Benevento,
1975; Romanski et al., 1997; Webster et al., 1993) and can be strongly
activated as early as 80 ms (Ouellette and Casanova, 2006).
In our experiment, the orbitofrontal and temporopolar regions
were differentially activated in the same latency range and influenced
the ventral stream in a quite similar manner. The temporal pole is
known to link person-specific memories to perceptual representa-
tions of faces (Olson et al., 2007; Simmons et al., 2010; Tsukiura et al.,
2003). However the information learnt in the present experiment was
not specific to a given face; rather, it reflected a social rule linking a
physical feature to a personality trait. In that sense, our results are in
line with the proposal that the temporal pole could support
conceptual knowledge of social behaviors (Zahn et al., 2007). The
orbitofrontal region is also well known as an emotional and social
region (Barbas, 2007; Rolls, 2007). Furthermore, it is more generally
involved in reinforcement-guided behavior (Rushworth et al., 2007).
Taken together, this suggests a role for the orbito-temporopolar
complex in establishing socially relevant association rules (Rush-
worth et al., 2007).
Our results highlight two parallel processing routes that were
activated rapidly and initially independently. These two routes
influenced each other after about 150 ms of neural processing. This
is in the line with recent models that suggest an activation of anterior
regions in parallel with the well-established visual stream. One of
these models is the two-pathway model of emotional processing
(LeDoux, 1996; Rudrauf et al., 2008; Vlamings et al., 2009;
Vuilleumier, 2005) which assumes that visual ventral stream
activation occurs in parallel with a short-cut pathway through
anterior regions such as the orbitofrontal area and temporal poles.
This anterior route would enhance the saliency of emotional stimuli
by modulating responses in the ventral visual pathway (Morris et al.,
1998). A related view posits that the orbitofrontal region integrates
somatic markers with incoming events to help subjects to navigate
themselves through emotionally laden situations (Dalgleish, 2004).
The other model deals more generally with visual perception (Bar,
2003; Kveraga et al., 2007b) and holds that a coarse representation,
based on magno-cellular inputs (Kveraga et al., 2007a), would be
quickly activated in the orbitofrontal region as an initial guess about
the nature of the object presented (Bar et al., 2006a). This
representation would then be refined by interactions with the ventral
pathway. In the present experiment, we find a modulation of early
brain responses involving both anterior and ventral visual pathways,
which were activated initially independently and influenced each
other reciprocally around 150 ms. This modulation was induced by a
recent exposure to a reinforcement schema and was specific of the
reinforced feature. We propose that the two types of dual route
models dealing with either emotion or visual perception could be
integrated into a more comprehensive view. In this view, the role of
the anterior route would be to link relevant prior experience to
current sensory inputs. The nature of the experience could in principle
vary a lot, including emotional context, motivational factors, guesses
about the most likely object identity, or relevance of specific features
as in the present case, but the anatomical substrate could remain the
same and constitute the basis for a generic proactive neural
mechanism (Bar, 2009; Bechara et al., 2000).
1424 L. Gamond et al. / NeuroImage 54 (2011) 1415–1426

Conclusion
To conclude, our results underline the ability of the visual system
to modulate even its earliest responses to incoming sensory inputs as
a function of recent and unconscious experience. Our results further
confirm the idea of an anterior route involving the temporal poles and
orbitofrontal cortex, activated at very early latencies, and whose role
would be to link prior experience with the current sensory inputs
encoded in parallel in the ventral visual pathway. In the particular
case of person perception, the ability of the anterior and ventral routes
to signal the existence of an association between a facial feature and a
personality label may be one of the basic components of the neural
machinery subtending the automatic and pervasive process of
personality inference from facial appearance.
Acknowledgments
This work was supported by the Agence Nationale de la Recherche
(Project «IMPRESSION»–P005336). We thank Antoine Ducorps and
Denis Schwartz for their assistance with data acquisition and analysis
and Francois Tadel for his help with source localization. We thank
Pascal Huguet, Kia Nobre, Bruno Rossion and Philippe Schyns for
helpful discussion at different stages of the project.
References
Adam, C., Clemenceau, S., Semah, F., Hasboun, D., Samson, S., Aboujaoude, N., Samson,Y., Baulac, M., 1996. Variability of presentation in medial temporal lobe epilepsy: astudy of 30 operated cases. Acta Neurol. Scand. 94, 1–11.
Allison, T., Puce, A., Spencer, D.D., McCarthy, G., 1999. Electrophysiological studies ofhuman face perception. I: Potentials generated in occipitotemporal cortex by faceand non-face stimuli. Cereb. Cortex 9, 415–430.
Amaral, D.G., Price, J.L., 1984. Amygdalo-cortical projections in the monkey (Macaca-Fascicularis). J. Comp. Neurol. 230, 465–496.
Bar, M., 2003. A cortical mechanism for triggering top-down facilitation in visual objectrecognition. J. Cogn. Neurosci. 15, 600–609.
Bar, M., 2009. The proactive brain: memory for predictions. Philos. Trans. R. Soc. B-Biol.Sci. 364, 1235–1243.
Bar, M., Kassam, K.S., Ghuman, A.S., Boshyan, J., Schmidt, A.M., Dale, A.M., Hamalainen,M.S., Marinkovic, K., Schacter, D.L., Rosen, B.R., Halgren, E., 2006a. Top-downfacilitation of visual recognition. Proc. Natl Acad. Sci. USA 103, 449–454.
Bar, M., Neta, M., Linz, H., 2006b. Very first impressions. Emotion 6, 269–278.Barbas, H., 2007. Flow of information for emotions through temporal and orbitofrontal
pathways. J. Anat. 211, 237–249.Barker, L.A., Andrade, J., 2006. Hidden covariation detection produces faster, not slower,
social judgments. J. Exp. Psychol. Learn. Mem. Cogn. 32, 636–641.Barrett, L.F., Bar, M., 2009. See it with feeling: affective predictions during object
perception. Philos. Trans. R. Soc. B-Biol. Sci. 364, 1325–1334.Bayle, D.J., Taylor, M.J., 2010. Attention inhibition of early cortical activation to fearful
faces. Brain Res. 1313, 113–123.Bechara, A., Damasio, H., Damasio, A.R., 2000. Emotion, decision making and the
orbitofrontal cortex. Cereb. Cortex 10, 295–307.Bentin, S., Sagiv, N., Mecklinger, A., Friederici, A., von Cramon, Y.D., 2002. Priming visual
face-processing mechanisms: electrophysiological evidence. Psychol. Sci. 13,190–193.
Bos, J., Benevento, L.A., 1975. Projectio of medial pulvinar to orbitalcortex and frontaleye fields in rhesus-monkey (Macaca-Mulatta). Exp. Neurol. 49, 487–496.
Bos, M., Bonke, B., 1998. When seemingly irrelevant details matter: hidden covariationdetection reexamined. Conscious. Cogn. 7, 596–602.
Carmichael, S.T., Price, J.L., 1995a. Limbic connections of the orbital and medialprefrontal cortex in macaque monkeys. J. Comp. Neurol. 363, 615–641.
Carmichael, S.T., Price, J.L., 1995b. Sensory and premotor connections of the orbital andmedial prefrontal cortex of macaque monkeys. J. Comp. Neurol. 363, 642–664.
Catani, M., Jones, D.K., Donato, R., Ffytche, D.H., 2003. Occipito-temporal connections inthe human brain. Brain 126, 2093–2107.
Cavada, C., Company, T., Tejedor, J., Cruz-Rizzolo, R.J., Reinoso-Suarez, F., 2000. Theanatomical connections of the macaque monkey orbitofrontal cortex. A review.Cereb. Cortex 10, 220–242.
Cavada, C., Goldman-Rakic, P.S., 1989. Posterior parietal cortex in rhesus-monkey.1.Parcellation of areas based ondistinctive limbic and sensory corticocorticalconnections. J. Comp. Neurol. 287, 393–421.
Chaumon, M., Drouet, V., Tallon-Baudry, C., 2008. Unconscious associative memoryaffects visual processing before 100 ms. J. Vis. 8 10.11-10.
Chaumon, M., Hasboun, D., Baulac, M., Adam, C., Tallon-Baudry, C., 2009. Unconsciouscontextual memory affects early responses in the anterior temporal lobe. Brain Res.1285, 77–87.
Dalgleish, T., 2004. The emotional brain. Nat. Rev. Neurosci. 5, 583–589.
Damasio, A., 1994. Descartes Error: Emotion, Reason and the Human Brain. G.P.Putnam's Sons, New York.
Dambacher, M., Rolfs, M., Gollner, K., Kliegl, R., Jacobs, A.M., 2009. Event-relatedpotentials reveal rapid verification of predicted visual input. PLoS ONE 4.
Eifuku, S., De Souza, W.C., Tamura, R., Nishijo, H., Ono, T., 2004. Neuronal correlates offace identification in the monkey anterior temporal cortical areas. J. Neurophysiol.91, 358–371.
Freiwald, W.A., Tsao, D.Y., Livingstone, M.S., 2009. A face feature space in the macaquetemporal lobe. Nat. Neurosci. 12 1187-U1128.
Friston, K.J., Daunizeau, J., Kiebel, S.J., 2009. Reinforcement learning or active inference?PLoS ONE 4.
Gauthier, I., Tarr, M.J., 1997. Becoming a “greeble” expert: exploring mechanisms forface recognition. Vis. Res. 37, 1673–1682.
George, N., Jemel, B., Fiori, N., Renault, B., 1997. Face and shape repetition effects inhumans: a spatio-temporal ERP study. NeuroReport 8, 1417–1423.
Ghashghaei, H.T., Barbas, H., 2002. Pathways for emotion: interactions of prefrontal andanterior temporal pathways in the amygdala of the rhesus monkey. Neuroscience115, 1261–1279.
Hadjikhani, N., Kveraga, K., Naik, P., Ahlfors, S.P., 2009. Early activation of face-specificcortex by face-like objects. NeuroReport 20, 403–407.
Hassin, R., Trope, Y., 2000. Facing faces: studies on the cognitive aspects ofphysiognomy. J. Pers. Soc. Psychol. 78, 837–852.
Hendrickx, H., DeHouwer, J., Baeyens, F., Eelen, P., VanAvermaet, E., 1997. Hiddencovariation detection might be very hidden indeed. J. Exp. Psychol. Learn. Mem.Cogn. 23, 201–220.
Kanwisher, N., McDermott, J., Chun, M.M., 1997. The fusiform face area: a module inhuman extrastriate cortex specialized for face perception. J. Neurosci. 17,4302–4311.
Kawasaki, H., Adolphs, R., Kaufman, O., Damasio, H., Damasio, A.R., Granner, M., Bakken,H., Hori, T., Howard, M.A., 2001. Single-neuron responses to emotional visualstimuli recorded in human ventral prefrontal cortex. Nat. Neurosci. 4, 15–16.
Kelly, S.P., Gomez-Ramirez, M., Foxe, J.J., 2008. Spatial attention modulates initialafferent activity in human primary visual cortex. Cereb. Cortex 18, 2629–2636.
Kersten, D., Mamassian, P., Yuille, A., 2004. Object perception as Bayesian inference.Annu. Rev. Psychol. 55, 271–304.
Kiani, R., Esteky, H., Tanaka, K., 2005. Differences in onset latency of macaqueinferotemporal neural responses to primate and non-primate faces. J. Neurophy-siol. 94, 1587–1596.
Knill, D.C., Pouget, A., 2004. The Bayesian brain: the role of uncertainty in neural codingand computation. Trends Neurosci. 27, 712–719.
Kriegeskorte, N., Formisano, E., Sorger, B., Goebel, R., 2007. Individual faces elicitdistinct response patterns in human anterior temporal cortex. Proc. Natl Acad. Sci.USA 104, 20600–20605.
Kveraga, K., Boshyan, J., Bar, M., 2007a. Magnocellular projections as the trigger of top-down facilitation in recognition. J. Neurosci. 27, 13232–13240.
Kveraga, K., Ghuman, A.S., Bar, M., 2007b. Top-down predictions in the cognitive brain.Brain Cogn. 65, 145–168.
LeDoux, J.E., 1996. The Emotional Brain. Simon & Schuster, New York (NY).Lewicki, P., 1986. Processing information about covariations that cannot be articulated.
J. Exp. Psychol. Learn. Mem. Cogn. 12, 135–146.Li, S., Mayhew, S.D., Kourtzi, Z., 2009. Learning shapes the representation of behavioral
choice in the human brain. Neuron 62, 441–452.Liddell, B.J., Brown, K.J., Kemp, A.H., Barton, M.J., Das, P., Peduto, A., Gordon, E., Williams,
L.M., 2005. A direct brainstem-amygdala-cortical ‘alarm’ system for subliminalsignals of fear. Neuroimage 24, 235–243.
Liu, J., Harris, A., Kanwisher, N., 2002. Stages of processing in face perception: an MEGstudy. Nat. Neurosci. 5, 910–916.
Luo, Q., Holroyd, T., Jones, M., Hendler, T., Blair, J., 2007. Neural dynamics for facialthreat processing as revealed by gamma band synchronization using MEG.Neuroimage 34, 839–847.
Macrae, C.N., Bodenhausen, G.V., 2000. Social cognition: thinking categorically aboutothers. Annu. Rev. Psychol. 51, 93–120.
Markowitsch, H.J., Emmans, D., Irle, E., Streicher, M., Preilowski, B., 1985. Cortical andsubcortical afferent connections of the primates temporal pole— a study of Rhesus-monkeys, squirrel–monkeys and marmosets. J. Comp. Neurol. 242, 425–458.
Meeren, H.K.M., Hadjikhani, N., Ahlfors, S.P., Hamalainen, M.S., de Gelder, B., 2008. Earlycategory-specific cortical activation revealed by visual stimulus inversion. PLoSONE 3.
Miller, F.G., Kaptchuk, T.J., 2008. Deception of subjects in neuroscience: an ethicalanalysis — commentary. J. Neurosci. 28, 4841–4843.
Morel, S., Ponz, A., Mercier, M., Vuilleumier, P., George, N., 2009. EEG–MEG evidence forearly differential repetition effects for fearful, happy and neutral faces. Brain Res.1254, 84–98.
Morris, J.S., Friston, K.J., Buchel, C., Frith, C.D., Young, A.W., Calder, A.J., Dolan, R.J., 1998.A neuromodulatory role for the human amygdala in processing emotional facialexpressions. Brain 121, 47–57.
Mouchetant-Rostaing, Y., Giard, M.H., 2003. Electrophysiological correlates of age andgender perception on human faces. J. Cogn. Neurosci. 15, 900–910.
Olson, I.R., Ploaker, A., Ezzyat, Y., 2007. The enigmatic temporal pole: a review offindings on social and emotional processing. Brain 130, 1718–1731.
Op de Beeck, H.P., Baker, C.I., DiCarlo, J.J., Kanwisher, N.G., 2006. Discrimination trainingalters object representations in human extrastriate cortex. J. Neurosci. 26,13025–13036.
Ouellette, B.G., Casanova, C., 2006. Overlapping visual response latency distributionsin visual cortices and LP-pulvinar complex of the cat. Exp. Brain Res. 175,332–341.
1425L. Gamond et al. / NeuroImage 54 (2011) 1415–1426

Pandya, D.N., Seltzer, B., 1982. Association areas of the cerebral-cortex. Trends Neurosci.5, 386–390.
Persaud, N., McLeod, P., Cowey, A., 2007. Post-decision wagering objectively measuresawareness. Nat. Neurosci. 10, 257–261.
Poghosyan, V., Ioannides, A.A., 2008. Attention modulates earliest responses in theprimary auditory and visual cortices. Neuron 58, 802–813.
Pourtois, G., Rauss, K.S., Vuilleumier, P., Schwartz, S., 2008. Effects of perceptual learningon primary visual cortex activity in humans. Vis. Res. 48, 55–62.
Pourtois, G., Schwartz, S., Seghier, M.L., Lazeyras, F.O., Vuilleumier, P., 2005. View-independent coding of face identity in frontal and temporal cortices is modulatedby familiarity: an event-related fMI study. Neuroimage 24, 1214–1224.
Puce, A., Allison, T., Bentin, S., Gore, J.C., McCarthy, G., 1998. Temporal cortex activationin humans viewing eye and mouth movements. J. Neurosci. 18, 2188–2199.
Rajimehr, R., Young, J.C., Tootell, R.B.H., 2009. An anterior temporal face patch in humancortex, predicted by macaque maps. Proc. Natl Acad. Sci. USA 106, 1995–2000.
Rolls, E.T., 1999. The Brain and Emotion. Oxford Univ. Press, New York (NY).Rolls, E.T., 2007. The representation of information about faces in the temporal and
frontal lobes. Neuropsychologia 45, 124–143.Romanski, L.M., Giguere, M., Bates, J.F., GoldmanRakic, P.S., 1997. Topographic
organization of medial pulvinar connections with the prefrontal cortex in therhesus monkey. J. Comp. Neurol. 379, 313–332.
Rudrauf, D., David, O., Lachaux, J.P., Kovach, C.K., Martinerie, J., Renault, B., Damasio, A.,2008. Rapid interactions between the ventral visual stream and emotion-relatedstructures rely on a two-pathway architecture. J. Neurosci. 28, 2793–2803.
Rushworth, M.F.S., Behrens, T.E.J., Rudebeck, P.H., Walton, M.E., 2007. Contrasting rolesfor cingulate and orbitofrontal cortex in decisions and social behaviour. TrendsCogn. Sci. 11, 168–176.
Seeck, M., Michel, C.M., Mainwaring, N., Cosgrove, R., Blume, H., Ives, J., Landis, T.,Schomer, D.L., 1997. Evidence for rapid face recognition from human scalp andintracranial electrodes. NeuroReport 8, 2749–2754.
Sigala, N., Logothetis, N.K., 2002. Visual categorization shapes feature selectivity in theprimate temporal cortex. Nature 415, 318–320.
Simmons, W.K., Reddish, M., Bellgowan, P.S.F., Martin, A., 2010. The selectivity andfunctional connectivity of the anterior temporal lobes. Cereb. Cortex 20, 813–825.
Stolarova, M., Keil, A., Moratti, S., 2006. Modulation of the C1 visual event-relatedcomponent by conditioned stimuli: evidence for sensory plasticity in early affectiveperception. Cereb. Cortex 16, 876–887.
Summerfield, C., Egner, T., Greene, M., Koechlin, E., Mangels, J., Hirsch, J., 2006.Predictive codes for forthcoming perception in the frontal cortex. Science 314,1311–1314.
Thorpe, S., Fize, D., Marlot, C., 1996. Speed of processing in the human visual system.Nature 381, 520–522.
Thorpe, S.J., Rolls, E.T., Maddison, S., 1983. The orbitofrontal cortex–neuronal activity inthe behaving monkey. Exp. Brain Res. 49, 93–115.
Todorov, A., Gobbini, M.I., Evans, K.K., Haxby, J.V., 2007. Spontaneous retrieval ofaffective person knowledge in face perception. Neuropsychologia 45, 163–173.
Todorov, A., Said, C.P., Engell, A.D., Oosterhof, N.N., 2008. Understanding evaluation offaces on social dimensions. Trends Cogn. Sci. 12, 455–460.
Tsao, D.Y., Livingstone, M.S., 2008. Mechanisms of face perception. Annu. Rev. Neurosci.31, 411–437.
Tsao, D.Y., Schweers, N., Moeller, S., Freiwald, W.A., 2008. Patches of face-selectivecortex in the macaque frontal lobe. Nat. Neurosci. 11, 877–879.
Tsukiura, T., Namiki, M., Fujii, T., Iijima, T., 2003. Time-dependent neural activationsrelated to recognition of people's names in emotional and neutral face-nameassociative learning: an fMRI study. Neuroimage 20, 784–794.
Uleman, J.S., Saribay, S.A., Gonzalez, C.M., 2008. Spontaneous inferences, implicitimpressions, and implicit theories. Annu. Rev. Psychol. 59, 329–360.
Vlamings, P., Goffaux, V., Kemner, C., 2009. Is the early modulation of brain activity byfearful facial expressions primarily mediated by coarse low spatial frequencyinformation? J. Vis. 9 (12), 11–13.
Vogels, R., 1999. Categorization of complex visual images by rhesus monkeys. Part 2:Single-cell study. Eur. J. Neurosci. 11, 1239–1255.
Vuilleumier, P., 2005. How brains beware: neural mechanisms of emotional attention.Trends Cogn. Sci. 9, 585–594.
Webster, M.A., Kaping, D., Mizokami, Y., Duhamel, P., 2004. Adaptation to natural facialcategories. Nature 428, 557–561.
Webster, M.J., Bachevalier, J., Ungerleider, L.G., 1993. Subcortical connections of inferiortemporal areas TE and TEO in Macaque monkeys. J. Comp. Neurol. 335, 73–91.
Weisbuch, M., Pauker, K., Ambady, N., 2009. The subtle transmission of race bias viatelevised nonverbal behavior. Science 326, 1711–1714.
Willis, J., Todorov, A., 2006. First impressions: making up your mind after a 100-msexposure to a face. Psychol. Sci. 17, 592–598.
Wilson, C.L., Babb, T.L., Halgren, E., Crandall, P.H., 1983. Visual receptive-fields andresponse properties of neurons in human temporal-lobe and visual pathways. Brain106, 473–502.
Xiang, J.Z., Brown, M.W., 1998. Differential neuronal encoding of novelty, familiarity andrecency in regions of the anterior temporal lobe. Neuropharmacology 37, 657–676.
Zahn, R., Moll, J., Krueger, F., Huey, E.D., Garrido, G., Grafman, J., 2007. Social conceptsare represented in the superior anterior temporal cortex. Proc. Natl Acad. Sci. USA104, 6430–6435.
Zebrowitz, L.A., 1997. Reading faces: window to the soul? New Directions in SocialPsychology. Westview Press, Boulder (CO).
Zebrowitz, L.A., Montepare, J.M., 2005. Appearance DOES matter. Science 308,1565–1566.
1426 L. Gamond et al. / NeuroImage 54 (2011) 1415–1426