Pitch Perception
68
October 9, 2012 Time: 09:34am chapter23.tex Pitch Perception Exactitude is not Truth. —Henri Matisse 23.1 Overview The sense of pitch is more subtle than most of us think. It masquerades as objective but is, in fact, subjective. Pitch is a psychoacoustic phenomenon, a sensation, akin to hot, cold, or bitter, synthesized for our conscious minds courtesy of the ear-auditory cortex system. The raw data acquired by the outer, middle, and inner ear are passed first to the primary auditory cortex, which in turn produces a kind of executive summary of the sound, suitable for the busy conscious mind. What would music be like without the summary sensations of loudness, pitch and timbre? Imagine instead being aware of all the individual partials and their relative strengths all the time. Hundreds of them could be competing for your attention. Music would be nothing like what we are familiar with. Far too much raw data would flood our consciousness. Hearing a pitch does not mean that a partial or even a tone (a sound with partials related to the perceived pitch frequency) is present at the perceived pitch frequency. Pitch is perceived even for sounds that are aperiodic, such as a chime, whose partials are not evenly spaced; indeed, the perceived pitch does not coincide with any partial present. The reader may object that on the contrary, pitch is quantitative. After all, some people have perfect pitch, meaning that they can name a note or hit the right key on the piano on the first try. Pitch, as we will see, is indeed quantitative in the sense that it is keyed to features in the autocorrelation of sounds. If you have perfect pitch, it is because you can match a signal with a prominent peak in the autocorrelation of the sound at, say, 0.0051 second with a key on the piano with a prominent peak in its autocorrelation at the 437
-
Upload
khangminh22 -
Category
Documents
-
view
4 -
download
0
Transcript of Pitch Perception
October 9, 2012 Time: 09:34am chapter23.tex
Pitch Perception
Exactitude is not Truth.
—Henri Matisse
23.1Overview
The sense of pitch is more subtle than most of us think. It masquerades asobjective but is, in fact, subjective. Pitch is a psychoacoustic phenomenon,a sensation, akin to hot, cold, or bitter, synthesized for our conscious mindscourtesy of the ear-auditory cortex system. The raw data acquired by theouter, middle, and inner ear are passed first to the primary auditory cortex,which in turn produces a kind of executive summary of the sound, suitablefor the busy conscious mind.
What would music be like without the summary sensations of loudness,pitch and timbre? Imagine instead being aware of all the individual partialsand their relative strengths all the time. Hundreds of them could becompeting for your attention. Music would be nothing like what we arefamiliar with. Far too much raw data would flood our consciousness.
Hearing a pitch does not mean that a partial or even a tone (a sound withpartials related to the perceived pitch frequency) is present at the perceivedpitch frequency. Pitch is perceived even for sounds that are aperiodic, suchas a chime, whose partials are not evenly spaced; indeed, the perceived pitchdoes not coincide with any partial present.
The reader may object that on the contrary, pitch is quantitative. Afterall, some people have perfect pitch, meaning that they can name a note orhit the right key on the piano on the first try. Pitch, as we will see, is indeedquantitative in the sense that it is keyed to features in the autocorrelation ofsounds. If you have perfect pitch, it is because you can match a signal witha prominent peak in the autocorrelation of the sound at, say, 0.0051 secondwith a key on the piano with a prominent peak in its autocorrelation at the
437

October 9, 2012 Time: 09:34am chapter23.tex
438 Part V Psychoacoustics andMusic
same time. You will have hit the key G3. (Pitch is specified by non-perfect-pitch listeners by selecting a frequency of a pure partial that is judged tohave the same pitch as the sound in question.)
Many sounds have no identifiable pitch. Other sounds may seem to haveno pitch, but in fact a melody may emerge from a succession of similarsounds. Sets of wooden blocks have been fabricated going back to thenineteenth century to demonstrate this. If a block is dropped on a hardfloor, the sound might be identifiable as containing frequencies in somerange, but not possessing a pitch of any specific frequency. This impressionmight be reinforced by recording and Fourier analyzing the sound—itmight show a range of seemingly unrelated frequencies. Yet if a numberof similar carefully chosen blocks are dropped in succession, a familiarmelody can force itself on the listener. Since melody is based on pitch, theremust be a pitch present—at least when it is called to our attention. Thereis no correct answer to whether a pitch is present in the sound of a woodblock, since the human subject is the ultimate authority, by definition. Ifthe pitch was not heard, it was not present.
It is difficult to reason in a detached way about subjective sensations. Iftwo people are coming from a different place in that debate, then somethingobvious to one person might be vehemently rejected by the other. This isa recipe for debate going around in circles, and indeed today you can findthe same controversies that flared up in the mid-1800s.
23.2Pitch Is Not Partial
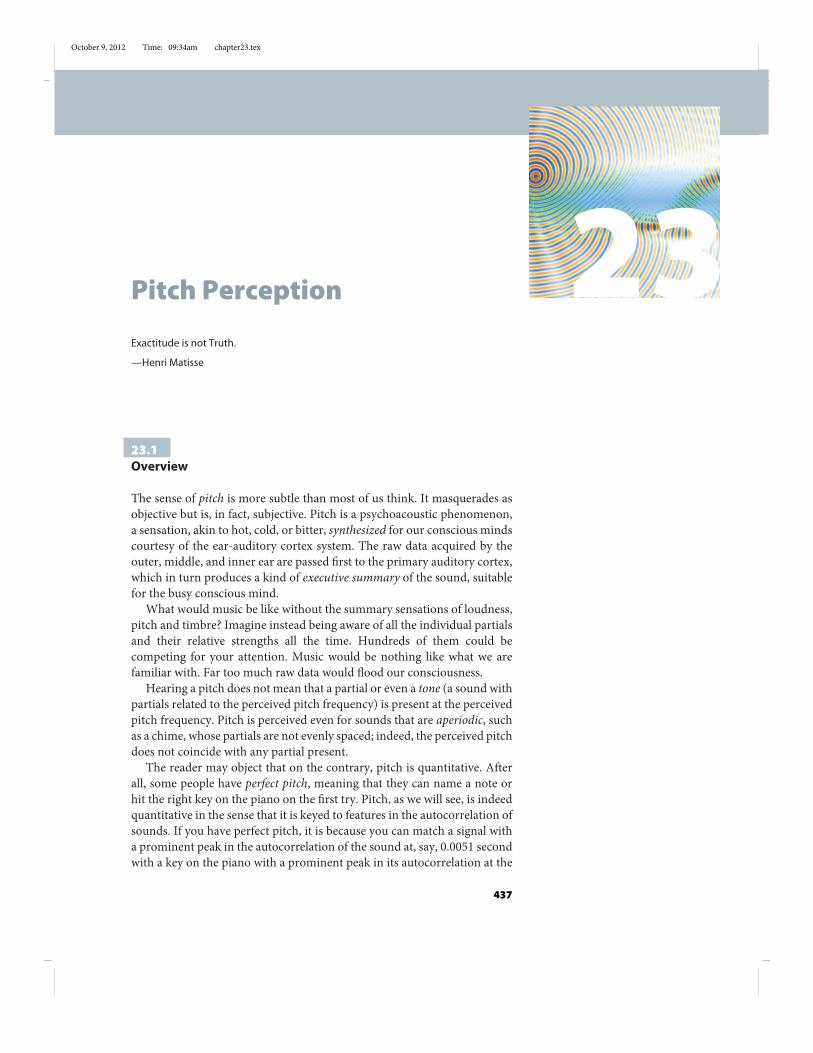
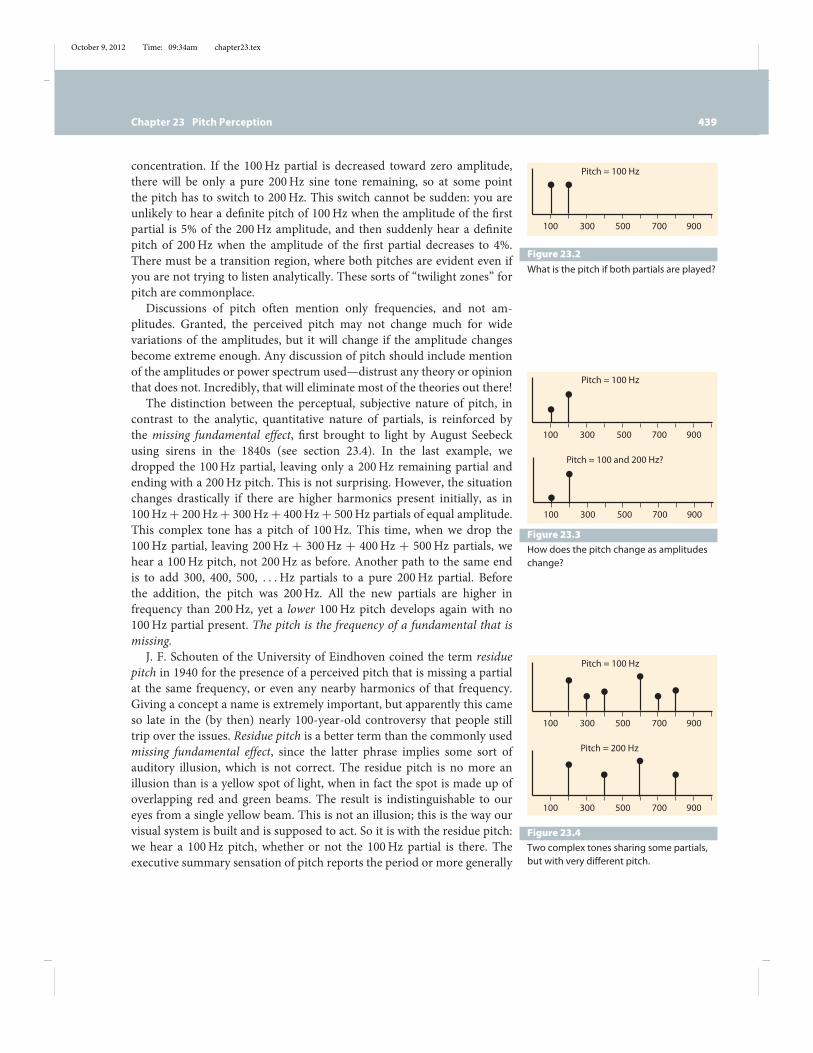
The pitch of a 100Hz pure sine tone is clearly 100Hz; and that of a pure200Hz sine tone is of course 200Hz (figure 23.1). In these cases, pitchand partial coincide in frequency. What is the pitch of both partials playedtogether (figure 23.2)? It is not immediately clear that there will be a singlepitch in the resulting complex tone. After all, there are two quite distinctpartials present, well separated, and of equal power, so perhaps we registerthe presence of both, and report hearing the two partials present, one asimportant as the other. There would be nothing wrong with a hearingsystem that did this. But this is not what usually happens. The sensation of asingle 100Hz pitch usually prevails when both partials are played together.In this case of only two partials, one might become conscious of both at alltimes, especially if the partials had just been presented individually. But noone hears 10 separate “pitches” when 10 partials have significant strength.
Suppose now that we decrease the amplitude of the first 100Hz partial(figure 23.3). Try this experiment in Jean-François Charles’s MAX patchPartials or Paul Falstad’s Fourier, but adjust the partial strengths with thesound off, since otherwise your attention will be drawn to them. At first, thepitch remains 100Hz, and again we can still hear both partials with some
100 300 500 700 900
Pitch = 100 Hz
100 300 500 700 900
Pitch = 200 Hz
Figure 23.1The pitch of these two partials isunambiguous.
October 9, 2012 Time: 09:34am chapter23.tex
Chapter 23 Pitch Perception 439
100 300 500 700 900
Pitch = 100 Hz
Figure 23.2What is the pitch if both partials are played?
100 300 500 700 900
Pitch = 100 Hz
100 300 500 700 900
Pitch = 100 and 200 Hz?
Figure 23.3How does the pitch change as amplitudeschange?
100 300 500 700 900
Pitch = 100 Hz
100 300 500 700 900
Pitch = 200 Hz
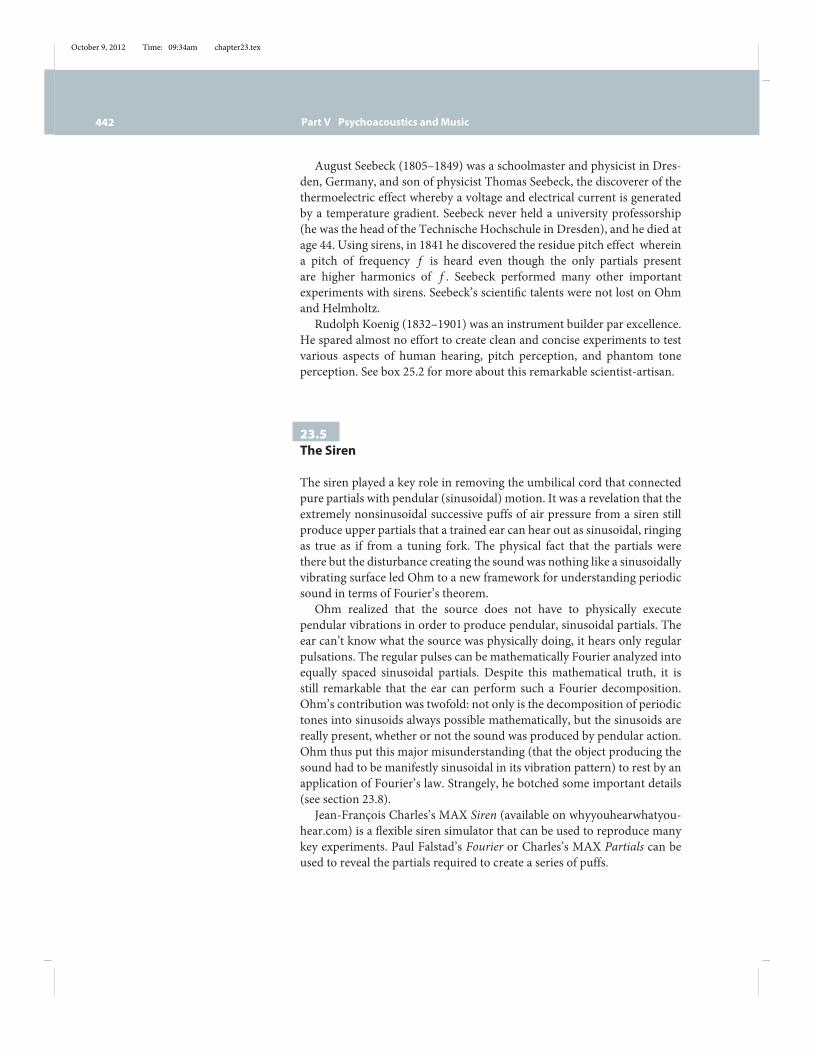
Figure 23.4Two complex tones sharing some partials,but with very different pitch.
concentration. If the 100Hz partial is decreased toward zero amplitude,there will be only a pure 200Hz sine tone remaining, so at some pointthe pitch has to switch to 200Hz. This switch cannot be sudden: you areunlikely to hear a definite pitch of 100Hz when the amplitude of the firstpartial is 5% of the 200Hz amplitude, and then suddenly hear a definitepitch of 200Hz when the amplitude of the first partial decreases to 4%.There must be a transition region, where both pitches are evident even ifyou are not trying to listen analytically. These sorts of “twilight zones” forpitch are commonplace.
Discussions of pitch often mention only frequencies, and not am-plitudes. Granted, the perceived pitch may not change much for widevariations of the amplitudes, but it will change if the amplitude changesbecome extreme enough. Any discussion of pitch should include mentionof the amplitudes or power spectrum used—distrust any theory or opinionthat does not. Incredibly, that will eliminate most of the theories out there!
The distinction between the perceptual, subjective nature of pitch, incontrast to the analytic, quantitative nature of partials, is reinforced bythe missing fundamental effect, first brought to light by August Seebeckusing sirens in the 1840s (see section 23.4). In the last example, wedropped the 100Hz partial, leaving only a 200Hz remaining partial andending with a 200Hz pitch. This is not surprising. However, the situationchanges drastically if there are higher harmonics present initially, as in100Hz+ 200Hz+ 300Hz+ 400Hz+ 500Hz partials of equal amplitude.This complex tone has a pitch of 100Hz. This time, when we drop the100Hz partial, leaving 200Hz + 300Hz + 400Hz + 500Hz partials, wehear a 100Hz pitch, not 200Hz as before. Another path to the same endis to add 300, 400, 500, . . .Hz partials to a pure 200Hz partial. Beforethe addition, the pitch was 200Hz. All the new partials are higher infrequency than 200Hz, yet a lower 100Hz pitch develops again with no100Hz partial present. The pitch is the frequency of a fundamental that ismissing.
J. F. Schouten of the University of Eindhoven coined the term residuepitch in 1940 for the presence of a perceived pitch that is missing a partialat the same frequency, or even any nearby harmonics of that frequency.Giving a concept a name is extremely important, but apparently this cameso late in the (by then) nearly 100-year-old controversy that people stilltrip over the issues. Residue pitch is a better term than the commonly usedmissing fundamental effect, since the latter phrase implies some sort ofauditory illusion, which is not correct. The residue pitch is no more anillusion than is a yellow spot of light, when in fact the spot is made up ofoverlapping red and green beams. The result is indistinguishable to oureyes from a single yellow beam. This is not an illusion; this is the way ourvisual system is built and is supposed to act. So it is with the residue pitch:we hear a 100Hz pitch, whether or not the 100Hz partial is there. Theexecutive summary sensation of pitch reports the period or more generally

October 9, 2012 Time: 09:34am chapter23.tex
440 Part V Psychoacoustics andMusic
the presence of peaks in the autocorrelation of the sound, as we emphasizein the following.
MAX Partials or Falstad’s Fourier can be used to check the residue pitcheffect. Listen carefully for the presence of a 200Hz sinusoidal partial withonly partials 400, 600, 800, 1000, 1200, and 1400 present. You won’t hear a200Hz partial at low sound intensities, yet a 200Hz pitch will prevail. The200Hz partial is not there in the original sound, nor is it created for us byany part of the hearing system from the outer ear to the auditory cortex.What is created by that system is the sensation we call pitch. Pitch is notpartial.
23.3Pitch Is Not Periodicity
If pitch is not partial, the next line of defense might be that pitch isperiodicity: the 100 + 200Hz partials combined have an unambiguous100Hz periodicity—which might be used to “explain” why 100Hz isthe pitch heard. (See section 3.9 for a discussion of the periodicity ofcombinations of partials.) Early in his remarkable On The Sensation ofTone as a Physiological Basis for the Theory of Music (English edition,1875), which is even today a foundation for psychoacoustics, Helmholtzstates that pitch is periodicity. But consider this combination: 120, 220,320, 420, 520, and 620Hz in equal measure. The periodicity is 20Hz,but the pitch is 104.6Hz! Similar examples are examined quantitatively insections 23.10 to 23.17.
If pitch is not determined by periodicity, perhaps then by autocorrela-tion? Now we are getting somewhere. The first major peak in the auto-correlation after the ever-present peak at time 0 in the preceding exampleoccurs at 0.00956 second, which corresponds to 104.6Hz. If sounds resolveinto several distinct pitches, these will have corresponding peaks in theautocorrelation. Pitch is associated with something more important than thepresence or absence of a single partial: its tendency to repeat itself at givenintervals. The generalization of this concept to sounds that are not strictlyperiodic is the autocorrelation function. Periodic signals will always havepeaks at multiples of the period that mirror the peak at time zero. Theanalogs of such periodicity are peaks in the autocorrelation of nonperiodicsignals. We will explore the autocorrelation theme extensively in sections23.10 to 23.17.
23.4Pitched Battles
The subject of pitch perception heated up in the mid-nineteenth centurywith a debate between physicists Hermann vonHelmholtz and Georg Ohm

October 9, 2012 Time: 09:34am chapter23.tex
Chapter 23 Pitch Perception 441
Figure 23.5The four nineteenth-century principals inthe theory of pitch: Helmholtz, Ohm,Seebeck, and Koenig.
on one side and Rudolf Koenig and August Seebeck on the other(figure 23.5). They went to extreme lengths to try to achieve control ofsound sources in order to settle ambiguities of human hearing. At somerisk of oversimplification, we can state in a few words what the controversyis all about: Are human beings essentially walking Fourier analyzers?
The debate continues today, although it is slightly more subdued. In thischapter, we take a partly historical view, not only because of the fascinatingpersonalities involved, but also because the old controversies are still inplay today and still pose the appropriate questions. In so doing, readerswill be empowered to form opinions on the controversies based on theirown hearing, using modern apparatus that it is fair to say the principalsmentioned earlier would have paid dearly for. It is far from the truth tosay that everything is presently understood. Beautiful ideas that “ought" tobe right, but unfortunately aren’t, die hard. Some are still in the process ofexpiration.
Hermann von Helmholtz (1821–1894) was a towering figure innineteenth-century physics. His theory of dissonance and musical har-mony holds sway today; we discuss it at greater length in chapter 26.Helmholtz was perhaps the most renowned physicist of his day, brilliantand dominant in almost everything he did, including physiology, the theoryof color vision, and the invention of the familiar ophthalmoscope usedto examine the retina. Helmholtz was a talented musician and an expertin music theory. Thus he was in his element when dealing with both thephysics and psychophysics of hearing and perception.
Georg Ohm (1789–1854) had a checkered academic career, partlyuniversity trained, partly self-taught, and later sometimes a high schoolteacher, sometimes a professor. Famously, he discovered the basic lawof electrical resistance, which bears his name. Less famously but moreimportant for this book, a second law also bearing his name pertains tothe decomposition of arbitrary periodic sounds into sinusoidal partials.
October 9, 2012 Time: 09:34am chapter23.tex
442 Part V Psychoacoustics andMusic
August Seebeck (1805–1849) was a schoolmaster and physicist in Dres-den, Germany, and son of physicist Thomas Seebeck, the discoverer of thethermoelectric effect whereby a voltage and electrical current is generatedby a temperature gradient. Seebeck never held a university professorship(he was the head of the Technische Hochschule in Dresden), and he died atage 44. Using sirens, in 1841 he discovered the residue pitch effect whereina pitch of frequency f is heard even though the only partials presentare higher harmonics of f . Seebeck performed many other importantexperiments with sirens. Seebeck’s scientific talents were not lost on Ohmand Helmholtz.
Rudolph Koenig (1832–1901) was an instrument builder par excellence.He spared almost no effort to create clean and concise experiments to testvarious aspects of human hearing, pitch perception, and phantom toneperception. See box 25.2 for more about this remarkable scientist-artisan.
23.5The Siren
The siren played a key role in removing the umbilical cord that connectedpure partials with pendular (sinusoidal) motion. It was a revelation that theextremely nonsinusoidal successive puffs of air pressure from a siren stillproduce upper partials that a trained ear can hear out as sinusoidal, ringingas true as if from a tuning fork. The physical fact that the partials werethere but the disturbance creating the sound was nothing like a sinusoidallyvibrating surface led Ohm to a new framework for understanding periodicsound in terms of Fourier’s theorem.
Ohm realized that the source does not have to physically executependular vibrations in order to produce pendular, sinusoidal partials. Theear can’t know what the source was physically doing, it hears only regularpulsations. The regular pulses can be mathematically Fourier analyzed intoequally spaced sinusoidal partials. Despite this mathematical truth, it isstill remarkable that the ear can perform such a Fourier decomposition.Ohm’s contribution was twofold: not only is the decomposition of periodictones into sinusoids always possible mathematically, but the sinusoids arereally present, whether or not the sound was produced by pendular action.Ohm thus put this major misunderstanding (that the object producing thesound had to be manifestly sinusoidal in its vibration pattern) to rest by anapplication of Fourier’s law. Strangely, he botched some important details(see section 23.8).
Jean-François Charles’s MAX Siren (available on whyyouhearwhatyou-hear.com) is a flexible siren simulator that can be used to reproduce manykey experiments. Paul Falstad’s Fourier or Charles’s MAX Partials can beused to reveal the partials required to create a series of puffs.

October 9, 2012 Time: 09:34am chapter23.tex
Chapter 23 Pitch Perception 443
23.6Ohm’s Law
The importance of the connection between sinusoidal waveforms and thepure tones—single partials—cannot be overemphasized; it is the one fixedboulder among many rolling stones in the field of pitch perception. It wasOhm who made this connection explicit. Helmholtz gave it legitimacy bymaking the connection a centerpiece of his work.
Ohm realized that only the sinusoid waveform yields the sensation of acolorless tone, a pure partial. Any embellishments to this sound taking thewaveform away from a pure sinusoid requires higher harmonics (higherpartials) to describe.
Ohm’s advance was slow to diffuse its way into the fledgling world ofpsychoacoustics. According to the prevailing notion, the ear was supposedto be receiving souvenirs of motion in the object generating the sound.Ohm understood that, on the contrary, any periodic undulation couldbe decomposed into pendular (sinusoidal) components, and each partialwould sound just as bright and clear whether some object vibrated exclu-sively at one frequency or at many frequencies at one time. Indeed, this wasa straightforward application of Fourier’s law from early in the century, butlike somany other things in psychophysics, it is not always clear that naturehas decided to follow the path of the mathematicians.
What about nonperiodic sounds, such as a chime? These too fall into thedomain of the Ohm-Helmholtz laws—the partials in a chime tone are alsopure sinusoids, except that they are not harmonically related.
Ohm’s 1843 paper was unfortunately simultaneously pompous andmuddled, as if to mask a measure of self-doubt. Helmholtz saw thesignificance of the paper more clearly than its author. Summing up whatOhm had done, Helmholtz said, “the proposition enunciated and defendedby G. S. Ohmmust be regarded as proven, viz. that the human ear perceivespendular [sinusoidal] vibrations alone as simple tones.” This is true, and ofunsurpassed importance in sound perception. But then Helmholtz revealshis own obsession with the human ear as a Fourier analyzer by continuing“and resolves all other periodic motions of the air into a series of pendularvibrations, hearing the series of simple tones which correspond with thesesimple vibrations” (emphasis is Helmholtz’s).1 It is true that all periodicmotions of the air can be resolvedmathematically into a series of pendularvibrations, but only the best, trained, or prompted ears can parse the soundinto its partials,. and then only some of the partials. Even possessors of suchears normally listen holistically rather than performing the harder work of“hearing out” individual partials.
1From Helmholtz’s On the Sensation of Tone, p. 56.

October 9, 2012 Time: 09:34am chapter23.tex
444 Part V Psychoacoustics andMusic
By 1937, Dayton C. Miller of Case School of Applied Science (now CaseWestern Reserve University), himself a formidable figure in the acousticsof his day, stated Ohm’s law as follows:
that all musical tones are periodic functions; that the ear perceivespendular [sinusoidal] vibrations alone, as simple tones; that all vari-eties of tone quality or tone color are due to particular combinationsof a larger or smaller number of simple tones of commensurablefrequencies; and that a complex musical tone or a composite massof musical tones is capable of being analyzed into a sum of simpletones.2
It could not be stated better.
23.7Seebeck’s Mistake
Before Ohm’s work, the sinusoid–pure partial connection had been blurryin several respects. Some observers thought that waveforms other thansinusoidal could also be perceived as pure partials, as long as they wereperiodic. August Seebeck fell into this trap, when trying to explain how it isthat 100Hz wins so handily in the simple “competition” for perceived pitchbetween 100 and 200Hz (and higher) pure partials when they are bothpresent. Seebeck supposed that somehow the 200Hz component couldadd to the strength of the 100Hz pure tone—that is, that the 100Hz puretone could be made louder by adding in some higher sinusoid of shorterbut commensurate period. Seebeck arrived at this notion by throwing thepresence of the period-reinforcing upper partials onto the lowest partial.He could not have meant this in a mathematical sense, since it violatesFourier’s theorems, but rather in a physiologic sense. However, a strongsense of a 100Hz pitch that accompanies the series 200, 300, 400, . . .Hzis not that of a 100Hz fundamental sinusoidal partial. That sensation isabsent, it cannot be “heard out,” even though a 100Hz pitch is definitelyheard. Once again, pitch is not partial, a fact that both Helmholtz andSeebeck failed to see clearly.
23.8Ohm’s Blunder
The power of the (trained or prompted) ear to parse partials out of a toneinduced both Ohm and Helmholtz to overplay the Fourier role in pitch
2D. Miller The Science of Musical Sounds, Macmillan, New York, 1926.

October 9, 2012 Time: 09:34am chapter23.tex
Chapter 23 Pitch Perception 445
perception. This, in turn, probably caused Ohm to make a mathematicalblunder. Helmholtz also could not resist the Fourier deconstruction oftone, and substituted his own idea of nonlinear effects to account for thepitch in the presence of missing partials.
Fourier’s theorem allowed Ohm to write:
s (t) = a1 sin(2! f t + "1)+ a2 sin(4! f t + "2)+ a3 sin(6! f t + "3)+ · · · .
Ohm knew that each of the terms on the righthand side corresponded to adifferent partial that could possibly be heard out by analytic listening. Thismuch is true, but by itself it suggests a kind of democracy of partials, anddoesn’t explain our sense of pitch or, for example, the case of 100Hz and200Hz, wherein a 100Hz pitch is reported unless it is many times weakerthan 200Hz.
Ohm needed to explain why a siren with all its partials, many muchstronger than the 100Hz fundamental, should have a 100Hz pitch if 100holes were passing by the source of air per second. In fact, the lowestpartial in a siren is usually quite weak. Conveniently for his prejudices, inthe course of his lengthy and rather overly formal analysis Ohm made amathematical blunder, which caused him to tremendously exaggerate thestrength of the fundamental partial a1 when the siren is emitting a soundwith pitch f—that is, when f holes per second are being exposed to the airhose. Seebeck pointed out the mathematical error in a paper about his ownexperiments and theory concerning the operation of the siren. Apparently,Ohm was deeply embarrassed; his overly formal paper seemed hollow inthe face of such a mistake. Ohm got out of the field of acoustics altogether,but it turned out he had underestimated his own contributions.
After putting Fourier’s theorem in proper context and connecting it withour ability to hear partials individually, Ohm and Helmholtz focused toomuch on the ear’s analytic Fourier analysis capabilities, never assigninga role to any holistic synthesis. When it came to explaining pitch, Ohmcouldn’t let go of the idea that what we hear is a collection of partials, so nopitch could be heard unless there was a partial present at that frequency.
23.9Helmholtz Falls Short
Helmholtz didn’t do much better, although this point is still controversial.Helmholtz knew that Ohm was correct about the principle of Fourier de-composition of sound into pure partials, although he too must have wincedat Ohm’s mathematical blunder. He would also have been frustrated bySeebeck’s confusion about the strength of the lowest partial depending onupper partials, exactly the point that Ohm had cleared up. But Helmholtzneeded some other way to explain why a pitch of 100Hz needed little or nopower at 100Hz in the tone. Here, he would soon make his own gaffs.
October 9, 2012 Time: 09:34am chapter23.tex
446 Part V Psychoacoustics andMusic
Helmholtz began by using bottles as resonators to detect partials, butRudolf Koenig optimized them in brass (see figure 13.3), making a cavitywith a large opening with a very short neck on one side and a small nippleon the other for insertion into the ear. These are the famous Helmholtzresonators, and as with other Helmholtz inventions, they were turned intosomething of an art form by Koenig, prized by museums of scientificinstruments today. These resonators are relatively high Q and respond onlyto a very narrow range of frequencies. With them, Helmholtz could easilyverify the presence or absence of an objective partial at a perceived pitch,since it would be so much enhanced if present.
The principle is not near-field capture (NFC), since the source may notbe close by, nor is the source made louder, except inside the resonator. Theidea is to set up a Helmholtz resonance in the usual way and then listen towhat is happening on the inside of the resonator. The sound is much louderthere, but we normally cannot hear it.3 However, if a small nipple protrudesout the back of the resonator, tightly sealed in the ear canal, the nipple andshort air cavity leading to the tympanum become part of the inside cavity.The tympanum is subjected to the full SPL inside the resonator, greatlyenhancing any partial present at the resonator’s frequency. This is whyHelmholtz resonators work so well, a fact seemingly almost forgotten sinceKoenig’s day.
Helmholtz knew that a pitch at frequency f could be heard with veryweak or absent partials at f , since his resonators failed to find them insome circumstances. His theories of combination tones, to be taken up inchapter 25, appeals tomechanical nonlinear interactions in the ear to createthe fundamental partial missing in the arriving signal. This idea, whichonce again confused pitch and partial, does not stand up to scrutiny.
This error by such a great scientist is surprising, and reflects howeven the best scientists struggle with objectivity when the subject of theirexperiments is themselves. In his bookOn the Sensation of Tone, Helmholtzreveals just how comfortable he is with problems of perception, freelyacknowledging of the role of synthetic listening:
We . . . become aware that two different kinds or grades must bedistinguished in our becoming conscious of a sensation. The lowergrade of this consciousness, is that where the influence of the sensa-tion in question makes itself felt only in the conceptions we form ofexternal things and processes, and assists in determining them. Thiscan take place without our needing or indeed being able to ascertainto what particular part of our sensations we owe this or that relationof our perceptions. In this case we will say that the impression ofthe sensation in question is perceived synthetically. The second and
3Except inside a car traveling down the highway with one window open. However, our hearingis not sensitive to sound at the frequency produced, but the SPL is so high that we can feel it!
October 9, 2012 Time: 09:34am chapter23.tex
Chapter 23 Pitch Perception 447
higher grade is when we immediately distinguish the sensation inquestion as an existing of the sum of the sensations excited in us. Wewill say then that the sensation is perceived analytically. The two casesmust be carefully distinguished from each other.
It is all the more surprising after this eloquent summary that Helmholtz didnot assign a synthetic role to the sensation of pitch. Moreover, Helmholtz’stheories of “tokens” or “signs” were part of a sophisticated understandingof epistemology that could have cleared this up, but instead he followedOhm, apparently failing to recognize pitch as one of his tokens! Helmholtzdismissed pitch as periodicity, sidestepping issues of missing fundamentalsand nonperiodic tones. Later, in discussing combination tones, Helmholtzwrongly attributes the perceived pitch to a partial created in the ear bynonlinear interactions as we mentioned earlier. (This may actually happenfor very loud tones, however.) Helmholtz apparently thought that hearing atone or pitch of f meant a partial at f had to be present, but his discussionis ambiguous because he is imprecise about the presence of pure partialsin the perceived tone. This absolutely key point was muddled up in Onthe Sensation of Tone, for, as his translator, John Ellis, said, “Even Prof.Helmholtz himself has not succeeded in using his word Ton consistentlyfor a simple tone only” (that is, a simple partial). This is the one thing heshould have made crystal clear, but he repeatedly fails to do so: Does onealways hear a sinusoidal partial oscillating at any given perceived pitch? Theanswer is, clearly, no, but Helmholtz never quite framed the question thisway.
The key point is not to confuse pitch with presence of a partial at thefrequency of the perceived pitch. Create the tone 200+400+600+800Hz,in Fourier or Partials, and then raise and lower the amplitude of the 200Hzpartial, all the way to zero. Concentrate on what a 200Hz partial soundslike, and try to hear it when it is at zero amplitude. You won’t hear thatpartial, but you will hear the 200Hz pitch.
Three of four excellent scientists made serious but different mistakeswhen trying to explain the dominance of the lowest “root” fundamentalin pitch perception, whether or not a partial is actually present at theroot frequency. Again, the fact that such talented people made mistakestestifies to the pitfalls associated with trying to be objective about one’s ownsubjective sensations.
23.10ADramatic Residue Pitch Effect
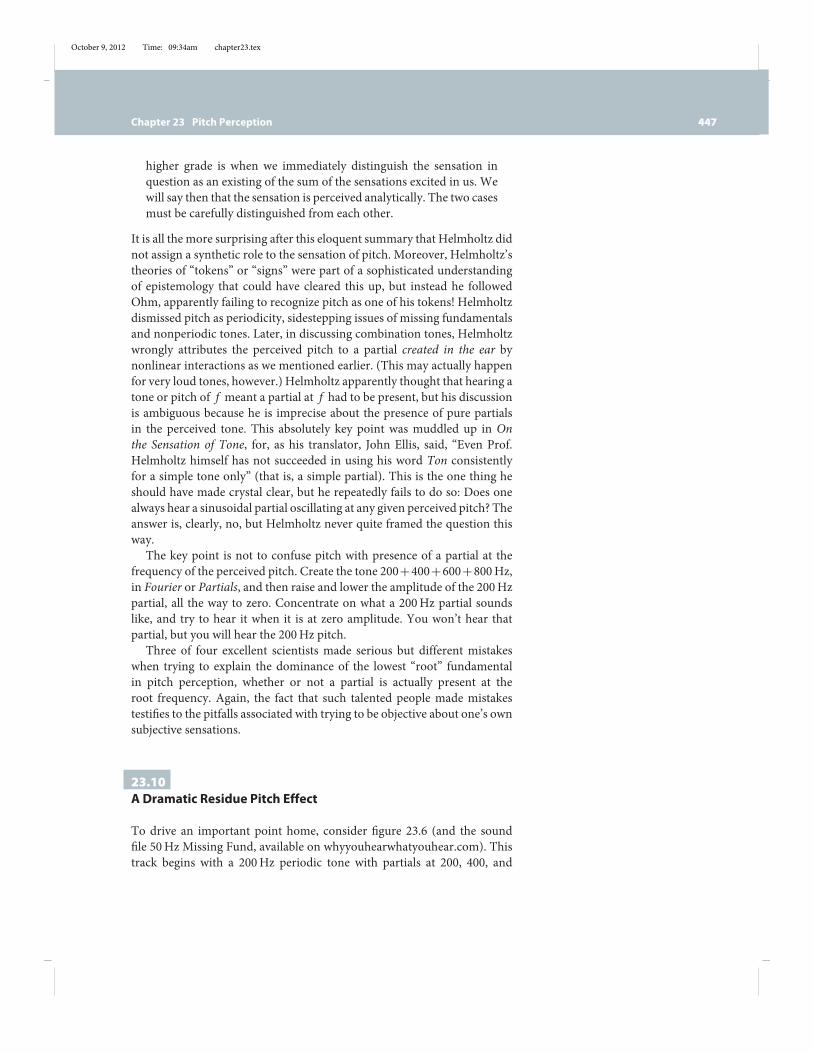
To drive an important point home, consider figure 23.6 (and the soundfile 50Hz Missing Fund, available on whyyouhearwhatyouhear.com). Thistrack begins with a 200Hz periodic tone with partials at 200, 400, and
October 9, 2012 Time: 09:34am chapter23.tex
448 Part V Psychoacoustics andMusic
Time (seconds)
Ampl
itude
0 0200 400 600 200 400 600Frequency (Hz) Frequency (Hz)
Pow
er
Pow
er1.9 2.1 2.22.0
Autocorrelation Autocorrelation
20 msec5 msec
Figure 23.6The sound trace for the transition regionfor the example audio file,50HzMissingFund. Up to about 1.9seconds, the sound is an ordinary complex200 Hz tone with three partials, but after2.1 seconds it has a partial every 50 Hzstarting at 200 Hz and ending at 650 Hz.This latter progression has a 50 Hzfrequency—four times smaller than the200 Hz frequency at the beginning. Thislonger period can be seen in the traceafter 2 seconds. A strong sensation of50 Hz sound emerges as the new partialscome in, but there is no 50, 100, or 150 Hzcomponent at all. The autocorrelationfunctions (bottom) reveal the transitionfrom a 200 Hz pitch to a 50 Hz pitch.
600Hz. The power spectrum is shown at the upper left in figure 23.6;the corresponding sound trace is shown in the first part of the middlepanel. The autocorrelation is shown at the lower left. The pitch heard is200Hz, and the autocorrelation has a prominent peak at 1/200= 0.005 s.Starting just before 2 seconds into the file, partials at 250, 300, 350, 450,500, and 550Hz are added. Despite the fact that all of these partials arehigher in frequency than the original perceived pitch and higher than thelowest partial originally present, the pitch drops by two octaves to 50Hz!There is no 50, 100, or 150Hz component at all. The T = 0.02 secondperiodicity, corresponding to 50Hz, is clearly seen after the 2-second mark
October 9, 2012 Time: 09:34am chapter23.tex
Chapter 23 Pitch Perception 449
in the sound trace. The GCD of 200, 250, 300, . . . is of course 50Hz, whichas we discovered in section 3.9 is the period of the combination of thepreceding partials. The autocorrelation now has its first prominent peakat 1/50= 0.02 s, as seen in the lower right.
Truth or Illusion?
The acoustics group at the University of New SouthWales dubs the residuepitch effect an “auditory illusion,” which is another way of saying that pitchis not really there. This is compatible with the idea that pitch is a sensationlike hot or cold, but perhaps the word illusion is too strong, because it is bydesign that we process pitch the way we do.
When confronted with the strong dominance of the fundamental overhigher partials in musical tones, Ohm also referred to auditory illusionsor tricks that the mind was playing. He viewed this as some kind of ananomaly, rather than a necessity or at least a preference of the humanmind.
We prefer the terms executive summary or token of reality rather thanillusion, since many illusions, especially visual ones, are unexpected andsometimes just plain weird side effects of the way our sensory systemswork. The sensation of pitch is not a weird side effect. It serve a purpose. Ifsomething is vibrating at 100Hz, we are much better off hearing a 100Hzpitch, which is telling us the truth: the object is vibrating at 100Hz. Thefourth overtone partial at 400Hzmight be the loudest frequency arriving atour ears, and 100Hzmay be absent, but whywould wewant to be distractedby that? The pattern of partial strengths is cast into the sensation of timbre.
Small speakers in a laptop are very poor at creating low-frequencysound. If an object producing the sound is much smaller than the typ-ical wavelengths of the sound produced, the pressure (force) and theacceleration at the surface of the object are nearly in phase, as explainedin section 7.11. Once the object is appreciable in size compared to thewavelength, it is possible for the force and velocity to be more nearly inphase, greatly enhancing the work done on the air by the vibrating object,and therefore its loudness. Small laptop speakers can produce only a veryweak tone if driven sinusoidally at 100Hz (wavelength about 3.5 meters,much larger than the speakers). However, because of the residue pitcheffect, the same speaker producing a 100Hz complex tone gives rise to thestrong sensation of a 100Hz pitch, in spite of the near total absence of a100Hz partial, and a very weak 200Hz partial.
23.11Autocorrelation and Pitch
The dramatic change from a 200Hz pitch to a 50Hz pitch after addingpartials no lower than 250Hz was accompanied by a shift in the first large

October 9, 2012 Time: 09:34am chapter23.tex
450 Part V Psychoacoustics andMusic
peak in the autocorrelation from 5ms to 20ms—that is, the inverse of200Hz and 50Hz, respectively. The 50Hz pitch was heard in the absenceof the first three partials—namely, 50, 100, and 150Hz.
The idea that autocorrelation is what determines pitch came rather late,only in 1951, suggested by J.C.R. Licklider. The notion seems to have had arather lukewarm reception in the literature ever since, yet autocorrelationis what pitch estimators use in many sound analysis programs, such asPraat and Audacity. Physiologically, it is not clear whether autocorrelationis literally computed in a neural circuit or merely strongly related towhatever is. The autocorrelation idea is an example of a temporal theoryof pitch perception. We will expand on how autocorrelation may be usedto determine pitch shortly, but it works so well in so many circumstancesthat it seems safe to say this: Beware of any theory of pitch perception thatentirely leaves out autocorrelation.
Autocorrelation was defined in chapter 4. It can be constructed fromthe power spectrum, and is therefore equivalent to it. A peak in theautocorrelation function at a time # means that the function tends to besimilar to itself at times t and t + # , for all t. Unlike periodic sounds, whichare strictly correlated with themselves (doing the same thing at the sametime intervals forever), a less than perfect correlation peak (peak height lessthan one) only implies a tendency to mimic what came a time # before.
The autocorrelation predicts the residue pitch effect. In this case, thepeaks in the autocorrelation function reflect what we already knew fromthe periodicity of the sound. Strict periodicity is reflected in autocorrelationpeaks that are as prominent as the first peak at time zero. The ultimatetest of the autocorrelation idea involves perceived pitches of nonperiodicsounds.
An early, tall, isolated peak in the autocorrelation function will deter-mine a perceived pitch, as the inverse of the time of the peak. Clearly,given some wiggly autocorrelation function, notions of early, tall, andisolated are qualitative at best. However, this is just as it should be.Pitch is itself qualitative—its sensation can be weak or strong, there canbe more than one pitch present, and attention can be focused on eachpitch separately. (Just as we can hear out partials, we can also hear outseparate notes—separate collections of partials—even though this abilitymay require contextual cues.)
23.12A Simple Formula for Pitch
A simple, approximate formula for the pitch seems to work very well ina reasonable range of circumstances. The idea is to find a good approx-imation to the time of early, tall autocorrelation peaks, given the set of
October 9, 2012 Time: 09:34am chapter23.tex
Chapter 23 Pitch Perception 451
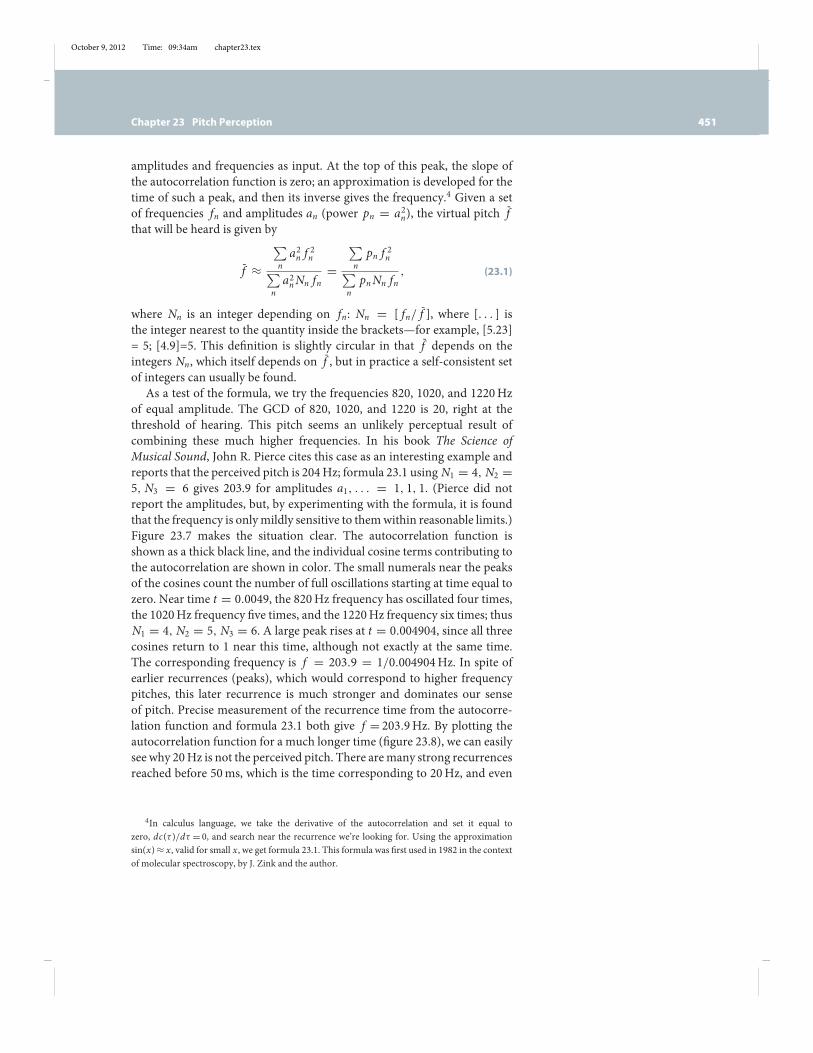
amplitudes and frequencies as input. At the top of this peak, the slope ofthe autocorrelation function is zero; an approximation is developed for thetime of such a peak, and then its inverse gives the frequency.4 Given a setof frequencies fn and amplitudes an (power pn = a2n), the virtual pitch f̄that will be heard is given by
f̄ !
!na2n f 2n
!na2nNn fn
=
!n
pn f 2n!n
pnNn fn, (23.1)
where Nn is an integer depending on fn: Nn = [ fn/ f̄ ], where [. . . ] isthe integer nearest to the quantity inside the brackets—for example, [5.23]= 5; [4.9]=5. This definition is slightly circular in that f̄ depends on theintegers Nn, which itself depends on f̄ , but in practice a self-consistent setof integers can usually be found.
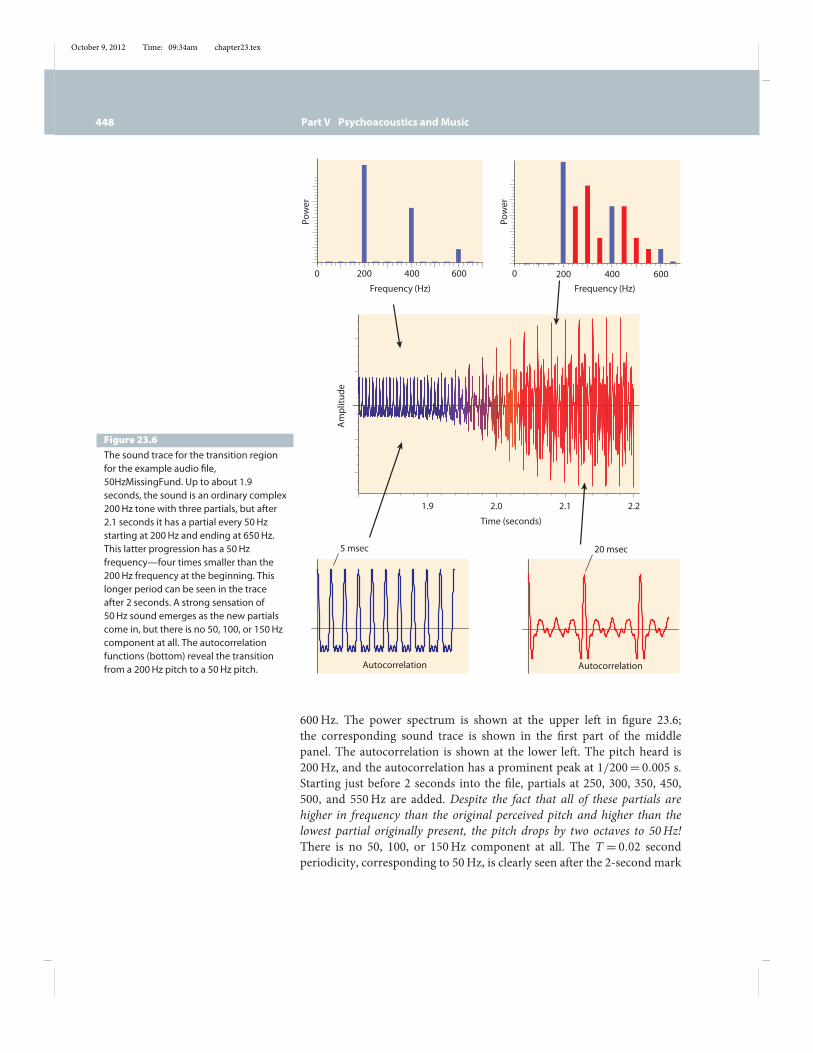
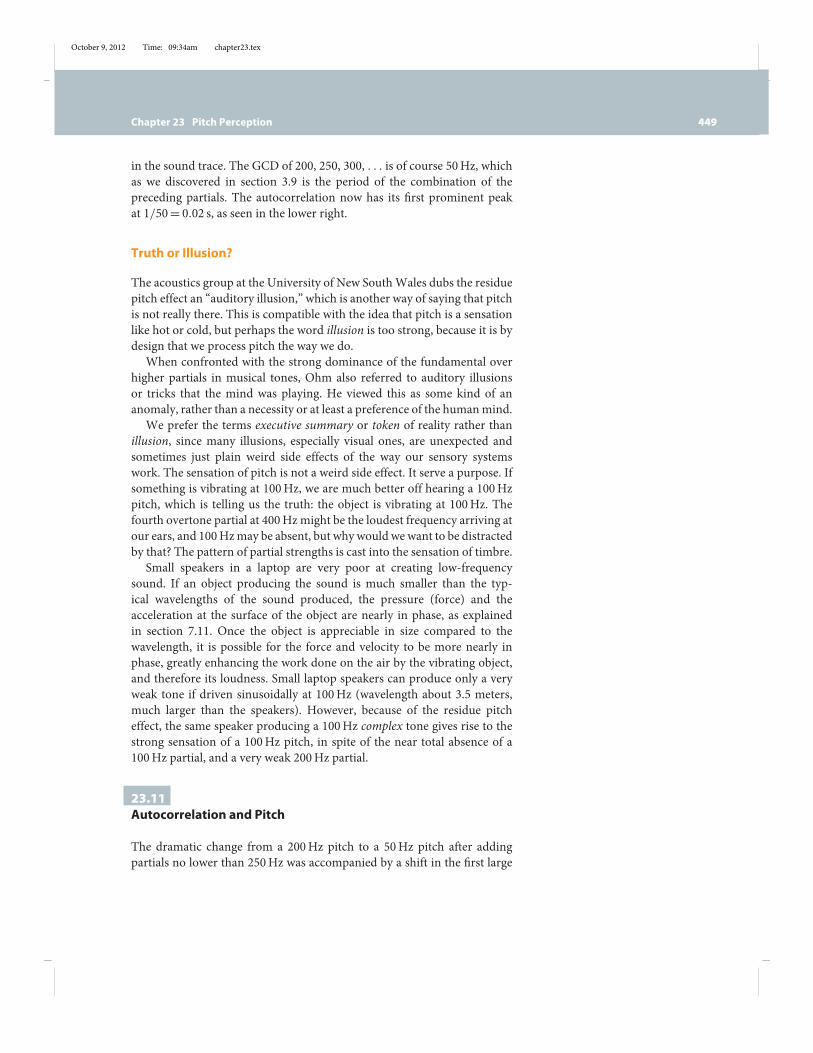
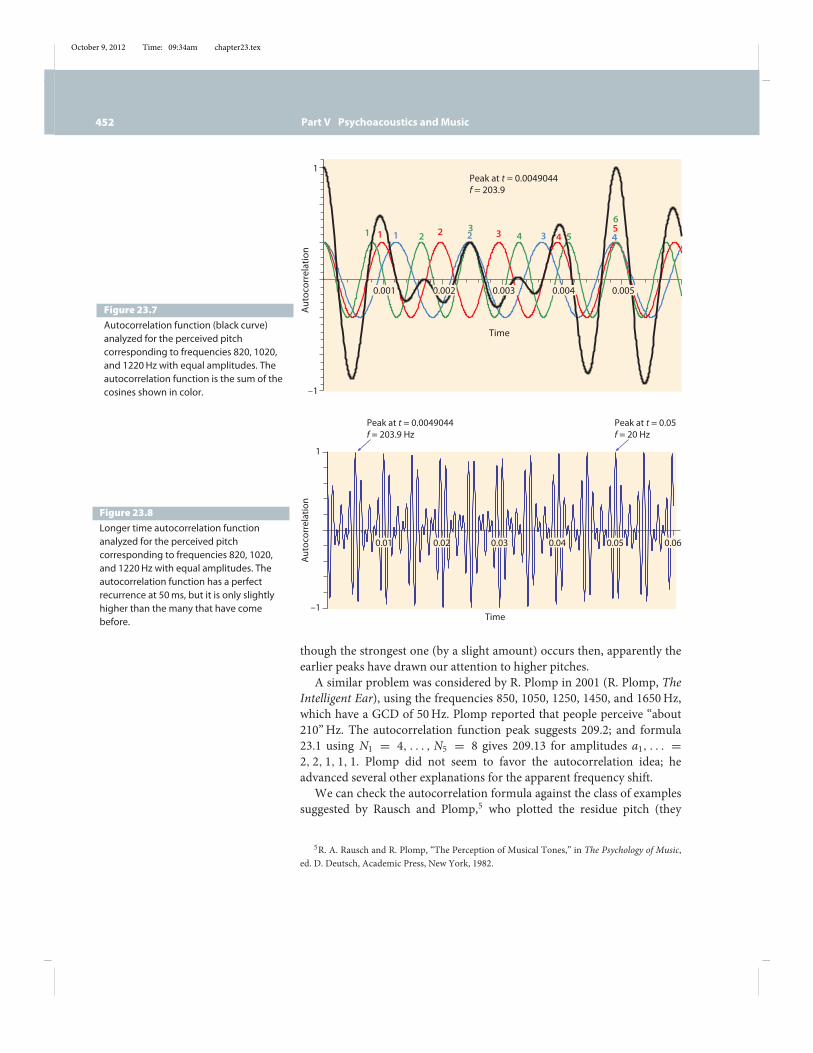
As a test of the formula, we try the frequencies 820, 1020, and 1220Hzof equal amplitude. The GCD of 820, 1020, and 1220 is 20, right at thethreshold of hearing. This pitch seems an unlikely perceptual result ofcombining these much higher frequencies. In his book The Science ofMusical Sound, John R. Pierce cites this case as an interesting example andreports that the perceived pitch is 204Hz; formula 23.1 using N1 = 4, N2 =5, N3 = 6 gives 203.9 for amplitudes a1, . . . = 1, 1, 1. (Pierce did notreport the amplitudes, but, by experimenting with the formula, it is foundthat the frequency is onlymildly sensitive to themwithin reasonable limits.)Figure 23.7 makes the situation clear. The autocorrelation function isshown as a thick black line, and the individual cosine terms contributing tothe autocorrelation are shown in color. The small numerals near the peaksof the cosines count the number of full oscillations starting at time equal tozero. Near time t = 0.0049, the 820Hz frequency has oscillated four times,the 1020Hz frequency five times, and the 1220Hz frequency six times; thusN1 = 4, N2 = 5, N3 = 6. A large peak rises at t = 0.004904, since all threecosines return to 1 near this time, although not exactly at the same time.The corresponding frequency is f = 203.9 = 1/0.004904Hz. In spite ofearlier recurrences (peaks), which would correspond to higher frequencypitches, this later recurrence is much stronger and dominates our senseof pitch. Precise measurement of the recurrence time from the autocorre-lation function and formula 23.1 both give f = 203.9Hz. By plotting theautocorrelation function for a much longer time (figure 23.8), we can easilysee why 20Hz is not the perceived pitch. There aremany strong recurrencesreached before 50ms, which is the time corresponding to 20Hz, and even
4In calculus language, we take the derivative of the autocorrelation and set it equal tozero, dc(# )/d# = 0, and search near the recurrence we’re looking for. Using the approximationsin(x)! x, valid for small x, we get formula 23.1. This formula was first used in 1982 in the contextof molecular spectroscopy, by J. Zink and the author.
October 9, 2012 Time: 09:34am chapter23.tex
452 Part V Psychoacoustics andMusic
1
–1
Peak at t = 0.0049044f = 203.9
Time
Auto
corr
elat
ion
0.001 0.002 0.004 0.005
1 1 2 3 41 23
4 5
62 3 4
5
0.003
Figure 23.7Autocorrelation function (black curve)analyzed for the perceived pitchcorresponding to frequencies 820, 1020,and 1220 Hz with equal amplitudes. Theautocorrelation function is the sum of thecosines shown in color.
0.01 0.02 0.03 0.04
Peak at t = 0.0049044f = 203.9 Hz
Peak at t = 0.05f = 20 Hz
Time
Auto
corr
elat
ion
1
–1
0.060.05
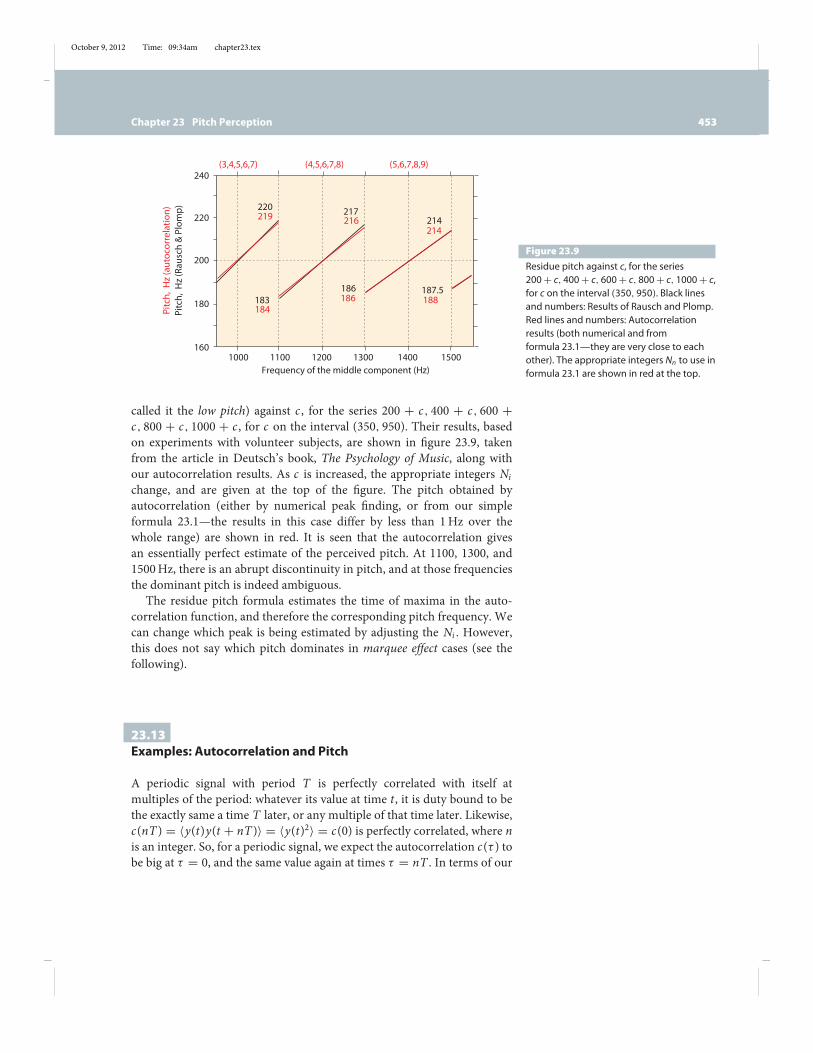
Figure 23.8Longer time autocorrelation functionanalyzed for the perceived pitchcorresponding to frequencies 820, 1020,and 1220 Hz with equal amplitudes. Theautocorrelation function has a perfectrecurrence at 50 ms, but it is only slightlyhigher than the many that have comebefore.
though the strongest one (by a slight amount) occurs then, apparently theearlier peaks have drawn our attention to higher pitches.
A similar problem was considered by R. Plomp in 2001 (R. Plomp, TheIntelligent Ear), using the frequencies 850, 1050, 1250, 1450, and 1650Hz,which have a GCD of 50Hz. Plomp reported that people perceive “about210”Hz. The autocorrelation function peak suggests 209.2; and formula23.1 using N1 = 4, . . . , N5 = 8 gives 209.13 for amplitudes a1, . . . =2, 2, 1, 1, 1. Plomp did not seem to favor the autocorrelation idea; headvanced several other explanations for the apparent frequency shift.
We can check the autocorrelation formula against the class of examplessuggested by Rausch and Plomp,5 who plotted the residue pitch (they
5R. A. Rausch and R. Plomp, “The Perception of Musical Tones,” in The Psychology of Music,ed. D. Deutsch, Academic Press, New York, 1982.
October 9, 2012 Time: 09:34am chapter23.tex
Chapter 23 Pitch Perception 453
Pitc
h, H
z (a
utoc
orre
latio
n)
184
216
186
214
188
219
(3,4,5,6,7) (4,5,6,7,8) (5,6,7,8,9)
1000 1100 1200 1300 1400 1500160
180
200
220
240Pi
tch,
Hz
(Rau
sch
& Pl
omp)
Frequency of the middle component (Hz)
220 217214
183186 187.5
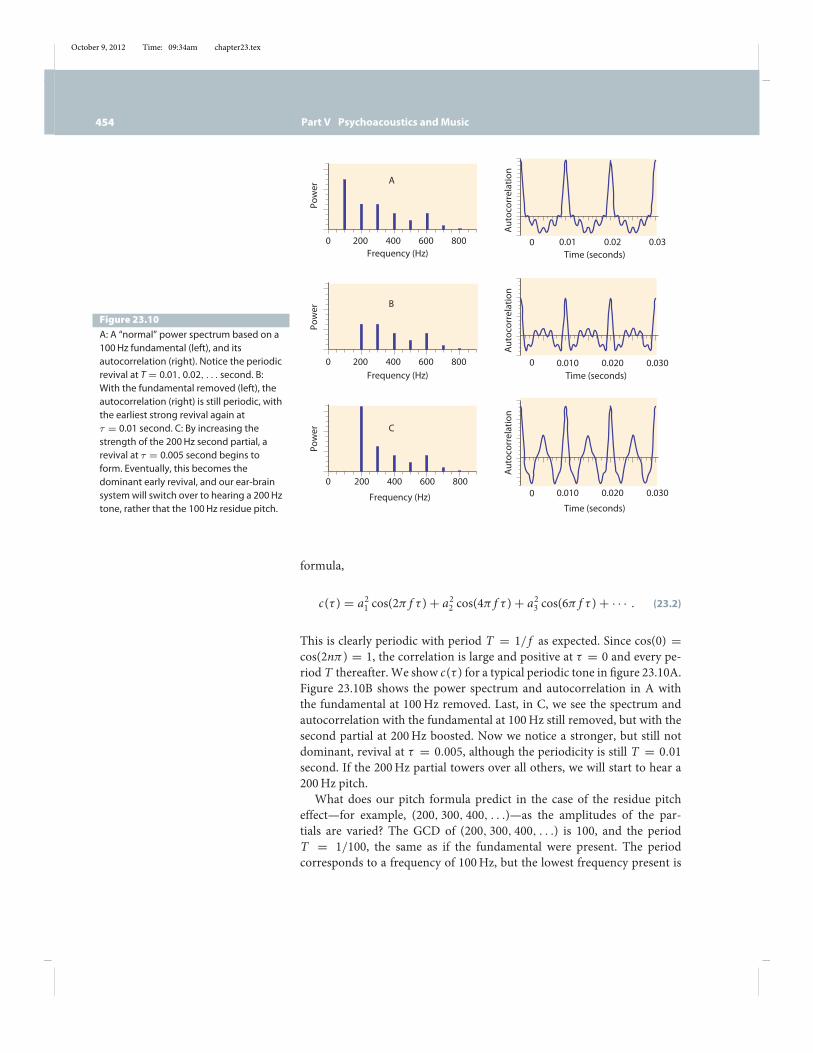
Figure 23.9Residue pitch against c, for the series200 + c, 400 + c, 600 + c, 800 + c, 1000 + c,for c on the interval (350, 950). Black linesand numbers: Results of Rausch and Plomp.Red lines and numbers: Autocorrelationresults (both numerical and fromformula 23.1—they are very close to eachother). The appropriate integers Nn to use informula 23.1 are shown in red at the top.
called it the low pitch) against c , for the series 200 + c, 400 + c, 600 +c, 800 + c, 1000 + c , for c on the interval (350, 950). Their results, basedon experiments with volunteer subjects, are shown in figure 23.9, takenfrom the article in Deutsch’s book, The Psychology of Music, along withour autocorrelation results. As c is increased, the appropriate integers Nichange, and are given at the top of the figure. The pitch obtained byautocorrelation (either by numerical peak finding, or from our simpleformula 23.1—the results in this case differ by less than 1Hz over thewhole range) are shown in red. It is seen that the autocorrelation givesan essentially perfect estimate of the perceived pitch. At 1100, 1300, and1500Hz, there is an abrupt discontinuity in pitch, and at those frequenciesthe dominant pitch is indeed ambiguous.
The residue pitch formula estimates the time of maxima in the auto-correlation function, and therefore the corresponding pitch frequency. Wecan change which peak is being estimated by adjusting the Ni . However,this does not say which pitch dominates in marquee effect cases (see thefollowing).
23.13Examples: Autocorrelation and Pitch
A periodic signal with period T is perfectly correlated with itself atmultiples of the period: whatever its value at time t, it is duty bound to bethe exactly same a time T later, or any multiple of that time later. Likewise,c(nT ) = "y(t)y(t + nT )# = "y(t)2# = c(0) is perfectly correlated, where nis an integer. So, for a periodic signal, we expect the autocorrelation c(# ) tobe big at # = 0, and the same value again at times # = nT . In terms of our
October 9, 2012 Time: 09:34am chapter23.tex
454 Part V Psychoacoustics andMusic
0 200 400 600 800 0.01 0.02 0.03
0 200 400 600 800 0.010 0.020 0.030
0 200 400 600 8000.010 0.020 0.030
Frequency (Hz) Time (seconds)
Time (seconds)
Frequency (Hz)
Frequency (Hz) 0Au
toco
rrel
atio
nAu
toco
rrel
atio
nAu
toco
rrel
atio
n
Pow
erPo
wer
Pow
er
Time (seconds)0
0
A
B
C
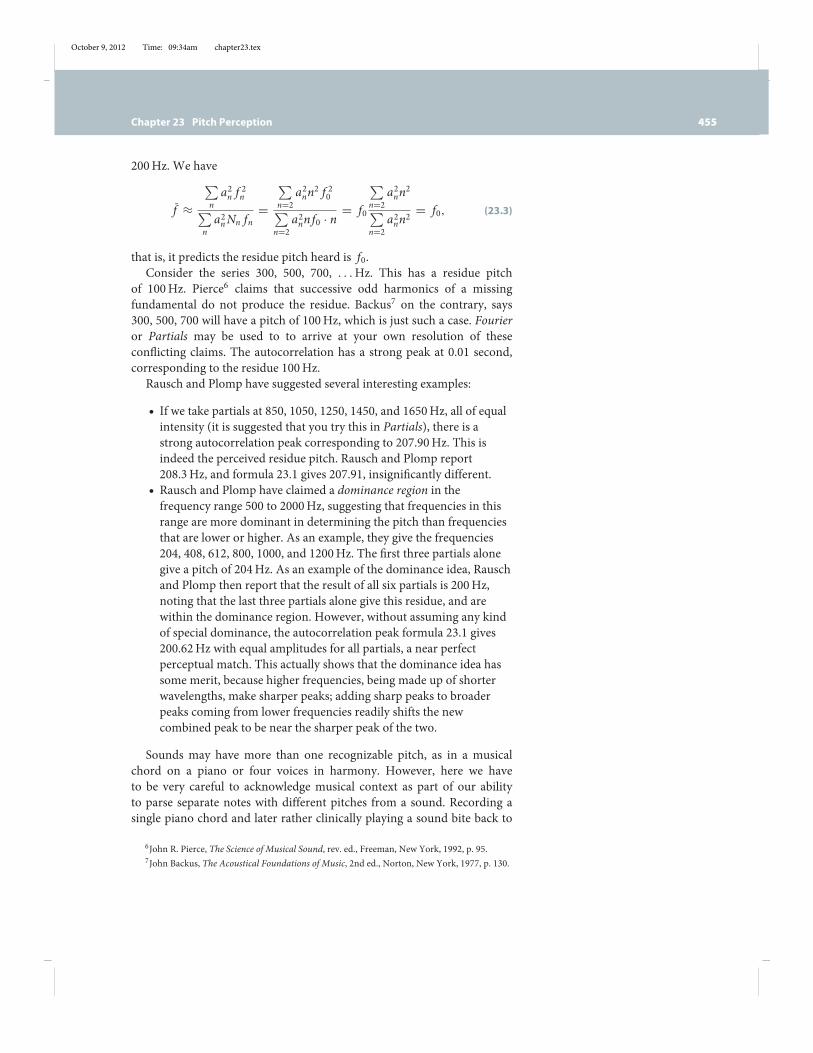
Figure 23.10A: A “normal” power spectrum based on a100 Hz fundamental (left), and itsautocorrelation (right). Notice the periodicrevival at T = 0.01, 0.02, . . . second. B:With the fundamental removed (left), theautocorrelation (right) is still periodic, withthe earliest strong revival again at! = 0.01 second. C: By increasing thestrength of the 200 Hz second partial, arevival at ! = 0.005 second begins toform. Eventually, this becomes thedominant early revival, and our ear-brainsystem will switch over to hearing a 200 Hztone, rather that the 100 Hz residue pitch.
formula,
c(# ) = a21 cos(2! f # ) + a22 cos(4! f # ) + a23 cos(6! f # ) + · · · . (23.2)
This is clearly periodic with period T = 1/ f as expected. Since cos(0) =cos(2n!) = 1, the correlation is large and positive at # = 0 and every pe-riod T thereafter.We show c(# ) for a typical periodic tone in figure 23.10A.Figure 23.10B shows the power spectrum and autocorrelation in A withthe fundamental at 100Hz removed. Last, in C, we see the spectrum andautocorrelation with the fundamental at 100Hz still removed, but with thesecond partial at 200Hz boosted. Now we notice a stronger, but still notdominant, revival at # = 0.005, although the periodicity is still T = 0.01second. If the 200Hz partial towers over all others, we will start to hear a200Hz pitch.
What does our pitch formula predict in the case of the residue pitcheffect—for example, (200, 300, 400, . . .)—as the amplitudes of the par-tials are varied? The GCD of (200, 300, 400, . . .) is 100, and the periodT = 1/100, the same as if the fundamental were present. The periodcorresponds to a frequency of 100Hz, but the lowest frequency present is
October 9, 2012 Time: 09:34am chapter23.tex
Chapter 23 Pitch Perception 455
200Hz. We have
f̄ !
!na2n f 2n
!na2nNn fn
=
!n=2
a2nn2 f 20!n=2
a2nn f0 · n = f0
!n=2
a2nn2!n=2
a2nn2= f0, (23.3)
that is, it predicts the residue pitch heard is f0.Consider the series 300, 500, 700, . . .Hz. This has a residue pitch
of 100Hz. Pierce6 claims that successive odd harmonics of a missingfundamental do not produce the residue. Backus7 on the contrary, says300, 500, 700 will have a pitch of 100Hz, which is just such a case. Fourieror Partials may be used to to arrive at your own resolution of theseconflicting claims. The autocorrelation has a strong peak at 0.01 second,corresponding to the residue 100Hz.
Rausch and Plomp have suggested several interesting examples:
• If we take partials at 850, 1050, 1250, 1450, and 1650Hz, all of equalintensity (it is suggested that you try this in Partials), there is astrong autocorrelation peak corresponding to 207.90Hz. This isindeed the perceived residue pitch. Rausch and Plomp report208.3Hz, and formula 23.1 gives 207.91, insignificantly different.
• Rausch and Plomp have claimed a dominance region in thefrequency range 500 to 2000Hz, suggesting that frequencies in thisrange are more dominant in determining the pitch than frequenciesthat are lower or higher. As an example, they give the frequencies204, 408, 612, 800, 1000, and 1200Hz. The first three partials alonegive a pitch of 204Hz. As an example of the dominance idea, Rauschand Plomp then report that the result of all six partials is 200Hz,noting that the last three partials alone give this residue, and arewithin the dominance region. However, without assuming any kindof special dominance, the autocorrelation peak formula 23.1 gives200.62Hz with equal amplitudes for all partials, a near perfectperceptual match. This actually shows that the dominance idea hassome merit, because higher frequencies, being made up of shorterwavelengths, make sharper peaks; adding sharp peaks to broaderpeaks coming from lower frequencies readily shifts the newcombined peak to be near the sharper peak of the two.
Sounds may have more than one recognizable pitch, as in a musicalchord on a piano or four voices in harmony. However, here we haveto be very careful to acknowledge musical context as part of our abilityto parse separate notes with different pitches from a sound. Recording asingle piano chord and later rather clinically playing a sound bite back to
6John R. Pierce, The Science of Musical Sound, rev. ed., Freeman, New York, 1992, p. 95.7John Backus, The Acoustical Foundations of Music, 2nd ed., Norton, New York, 1977, p. 130.
October 9, 2012 Time: 09:34am chapter23.tex
456 Part V Psychoacoustics andMusic
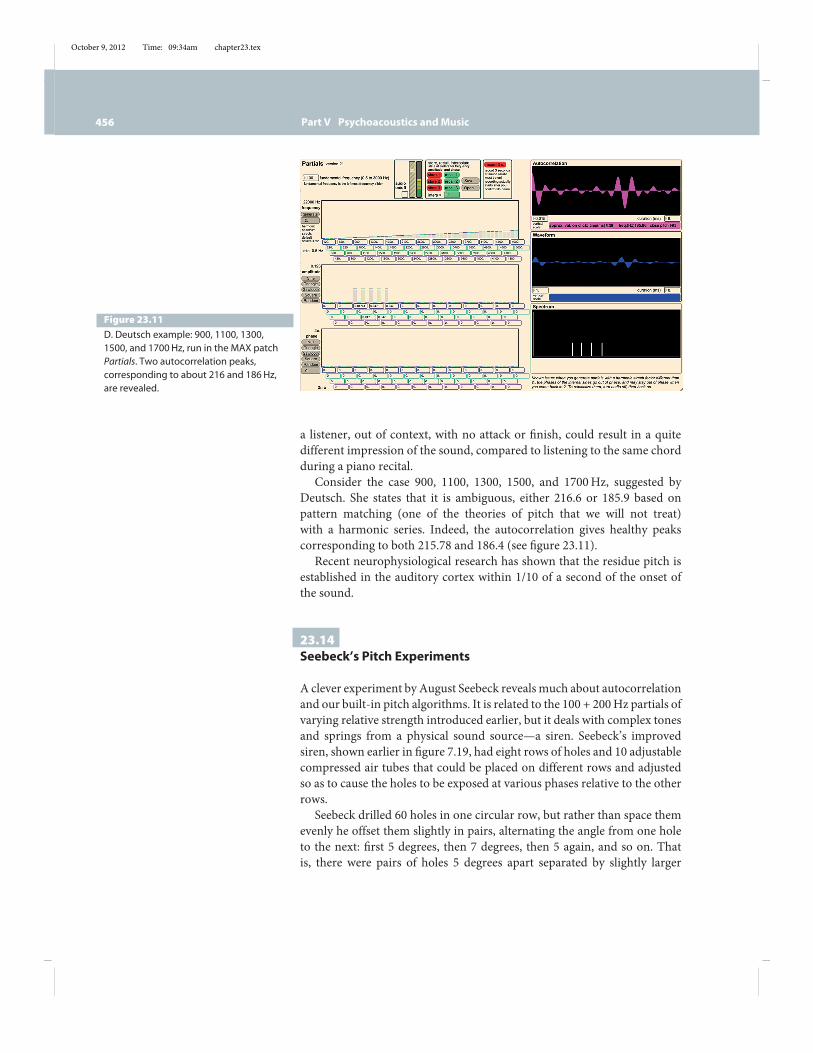
Figure 23.11D. Deutsch example: 900, 1100, 1300,1500, and 1700 Hz, run in the MAX patchPartials. Two autocorrelation peaks,corresponding to about 216 and 186 Hz,are revealed.
a listener, out of context, with no attack or finish, could result in a quitedifferent impression of the sound, compared to listening to the same chordduring a piano recital.
Consider the case 900, 1100, 1300, 1500, and 1700Hz, suggested byDeutsch. She states that it is ambiguous, either 216.6 or 185.9 based onpattern matching (one of the theories of pitch that we will not treat)with a harmonic series. Indeed, the autocorrelation gives healthy peakscorresponding to both 215.78 and 186.4 (see figure 23.11).
Recent neurophysiological research has shown that the residue pitch isestablished in the auditory cortex within 1/10 of a second of the onset ofthe sound.
23.14Seebeck’s Pitch Experiments
A clever experiment by August Seebeck reveals much about autocorrelationand our built-in pitch algorithms. It is related to the 100 + 200Hz partials ofvarying relative strength introduced earlier, but it deals with complex tonesand springs from a physical sound source—a siren. Seebeck’s improvedsiren, shown earlier in figure 7.19, had eight rows of holes and 10 adjustablecompressed air tubes that could be placed on different rows and adjustedso as to cause the holes to be exposed at various phases relative to the otherrows.
Seebeck drilled 60 holes in one circular row, but rather than space themevenly he offset them slightly in pairs, alternating the angle from one holeto the next: first 5 degrees, then 7 degrees, then 5 again, and so on. Thatis, there were pairs of holes 5 degrees apart separated by slightly larger

October 9, 2012 Time: 09:34am chapter23.tex
Chapter 23 Pitch Perception 457
Figure 23.12(Left) Siren holes spaced 6 degrees apart.(Right) Siren holes spaced alternately 5degrees and 7 degrees apart. The periodbecomes twice what it was with all theholes 6 degrees apart.
7-degree gaps between holes on adjacent pairs. If all 60 holes had beeninstead each 6 degrees apart—evenly spaced—the result of rotating the diskfive times per second would clearly be a 300Hz complex tone with a 300Hzpitch. The uneven set of holes corresponds to taking every other hole in theeven set and rotating it by one degree. If the disk is spun again at 5Hz, 300holes pass by the air source per second, the same number as when the holeswere exactly evenly spaced. It seems that the pitch should again be 300Hz.Instead, the pitch drops an octave, to 150Hz (figure 23.12).
MAX Siren (see figure 7.18) can be used to reproduce the experiment.Create two rows of holes, 30 each, with zero phase offset. At five revolutionsper second, a 150Hz pitch is very strong. The holes are sounding in pairsat exactly the same time, so the periodicity is 150Hz. Now, using the phasetool, offset one row of holes by 6 degrees (0.016666 $ 2! radians; type0.016666 in the box). This setting causes the second set of 30 holes to soundexactly halfway between those of the first set, making a 300Hz periodicitywith the disk revolving at 5Hz. The 6-degree offset setting is equivalent to60 evenly spaced holes in the same row. (We can be sure that the secondrow of holes is providing exactly the same pressure profile at each hole asthis first row is, because the sound is being produced electronically. Seebeckneeded to place all the holes in the same row, to ensure that the holes areall given exactly the same air pressure.)
Up to now, we have established that with zero offset, the pitch is 150Hz,and with a 6-degree offset, the pitch is 300Hz. What happens in between?Do we hear both pitches in varying degrees? A 5-degree offset of the secondset of 30 holes (0.013888$2! radians) was Seebeck’s choice. Perfect 300Hzperiodicity happens only at 6 degrees; 5 degrees is not quite periodic at300Hz and strictly periodic at 150Hz. Even though 300 holes are stillpassing by the air source per second, the perceived pitch drops an octave,to a strong 150Hz with a 5-degree offset.
Since we don’t have to laboriously drill holes, it is tempting to see whathappens as we change the offset from 5 degrees back toward 6 degrees.To the author, both pitches are apparent at 5.5 (0.015277 $ 2! radians)degrees offset, and the 300Hz pitch becomes perhaps slightly dominant at5.75 degrees. That is, not until the holes are almost perfectly evenly spaceddoes the pitch finally start to switch to the higher frequency.
The data are summarized in figure 23.13, which shows the autocorrela-tion graphs and the power spectra for 6, 5.75, 5.5. 5.0, and 0 degrees offsetof the second set of 30 holes.

October 9, 2012 Time: 09:34am chapter23.tex
458 Part V Psychoacoustics andMusic
150 300 450 600 750 900
150 300 450 600 750 900
150 300 450 600 750 900
150 300 450 600 750 900
150 300 450 600 750 900
Time (milliseconds)6.663.33
6.663.33
6.663.33
6.663.33
6.663.33
6º (Pitch = 300 Hz)
(Pitch = 150 Hz)
5.75º
5.5º
Hz
5.0º
0º
Spec
trum
Auto
corr
elat
ion
Figure 23.13Autocorrelation and spectrum plots forthe Seebeck siren experiment, whereinexact periodicity of the holes is slightlybroken in favor of pairs. Seebeck used 60holes, with each hole spaced by 5, 7, 5, 7,. . . degrees from its neighbor, where 6, 6,6, 6, . . . would be even spacing of 60 holes.
TheMarquee Effect
These experiments and the data in figure 23.13 give clues as to our built-in neural algorithms for determining pitch. The first and last cases areunambiguous, with the first large autocorrelation peaks at 3.333 and 6.666milliseconds, corresponding to 300 and 150Hz, respectively. The spectrareflect this periodicity. The middle cases are ambiguous and instructive.The game being played is to decide which autocorrelation peak determinespitch. It is possible to have a near tie, in which case we will hear two distinctpitches. The rules seem to be
Key point: Earlier peaks are favored, taller peaks are favored, sharperpeaks are favored.
There are limitations. For example, peaks may arrive too late to controlour sense of pitch, even if they are tall. These rules can lead to a tiebetween an earlier, slightly smaller peak, giving a high-frequency pitch,and a later, taller peak, giving a lower pitch. It is a little like two starswho both want top billing on a movie marquee. Someone gets firstbilling, don’t they? Not necessarily. Who is first in the marquee shown infigure 23.14? You may have a definite answer in this case, but not everyone
Starring . . . Mimi Bueno
Mercedes Ford
Figure 23.14Who’s got first billing? This is analogous toone form of the octave ambiguityproblem.
October 9, 2012 Time: 09:34am chapter23.tex
Chapter 23 Pitch Perception 459
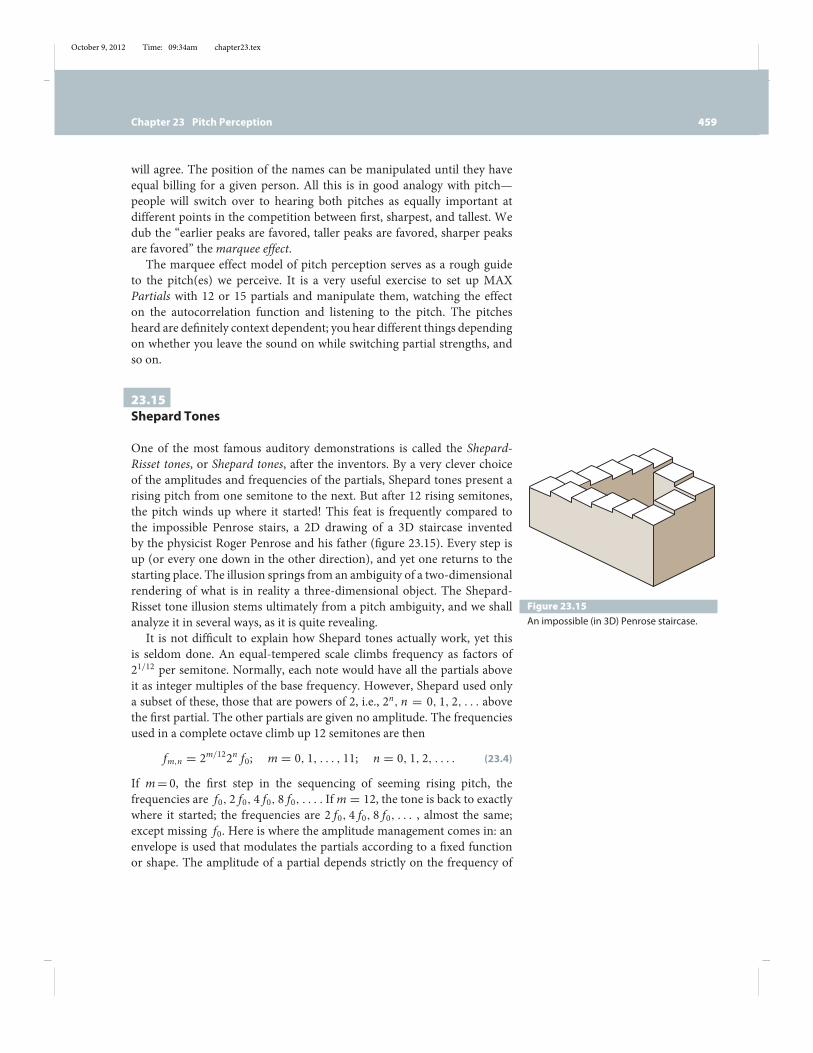
Figure 23.15An impossible (in 3D) Penrose staircase.
will agree. The position of the names can be manipulated until they haveequal billing for a given person. All this is in good analogy with pitch—people will switch over to hearing both pitches as equally important atdifferent points in the competition between first, sharpest, and tallest. Wedub the “earlier peaks are favored, taller peaks are favored, sharper peaksare favored” themarquee effect.
The marquee effect model of pitch perception serves as a rough guideto the pitch(es) we perceive. It is a very useful exercise to set up MAXPartials with 12 or 15 partials and manipulate them, watching the effecton the autocorrelation function and listening to the pitch. The pitchesheard are definitely context dependent; you hear different things dependingon whether you leave the sound on while switching partial strengths, andso on.
23.15Shepard Tones
One of the most famous auditory demonstrations is called the Shepard-Risset tones, or Shepard tones, after the inventors. By a very clever choiceof the amplitudes and frequencies of the partials, Shepard tones present arising pitch from one semitone to the next. But after 12 rising semitones,the pitch winds up where it started! This feat is frequently compared tothe impossible Penrose stairs, a 2D drawing of a 3D staircase inventedby the physicist Roger Penrose and his father (figure 23.15). Every step isup (or every one down in the other direction), and yet one returns to thestarting place. The illusion springs from an ambiguity of a two-dimensionalrendering of what is in reality a three-dimensional object. The Shepard-Risset tone illusion stems ultimately from a pitch ambiguity, and we shallanalyze it in several ways, as it is quite revealing.
It is not difficult to explain how Shepard tones actually work, yet thisis seldom done. An equal-tempered scale climbs frequency as factors of21/12 per semitone. Normally, each note would have all the partials aboveit as integer multiples of the base frequency. However, Shepard used onlya subset of these, those that are powers of 2, i.e., 2n, n = 0, 1, 2, . . . abovethe first partial. The other partials are given no amplitude. The frequenciesused in a complete octave climb up 12 semitones are then
fm,n = 2m/122n f0; m = 0, 1, . . . , 11; n = 0, 1, 2, . . . . (23.4)
If m= 0, the first step in the sequencing of seeming rising pitch, thefrequencies are f0, 2 f0, 4 f0, 8 f0, . . . . Ifm = 12, the tone is back to exactlywhere it started; the frequencies are 2 f0, 4 f0, 8 f0, . . . , almost the same;except missing f0. Here is where the amplitude management comes in: anenvelope is used that modulates the partials according to a fixed functionor shape. The amplitude of a partial depends strictly on the frequency of
October 9, 2012 Time: 09:34am chapter23.tex
460 Part V Psychoacoustics andMusic
f 4f 8f 16f 32f 64f
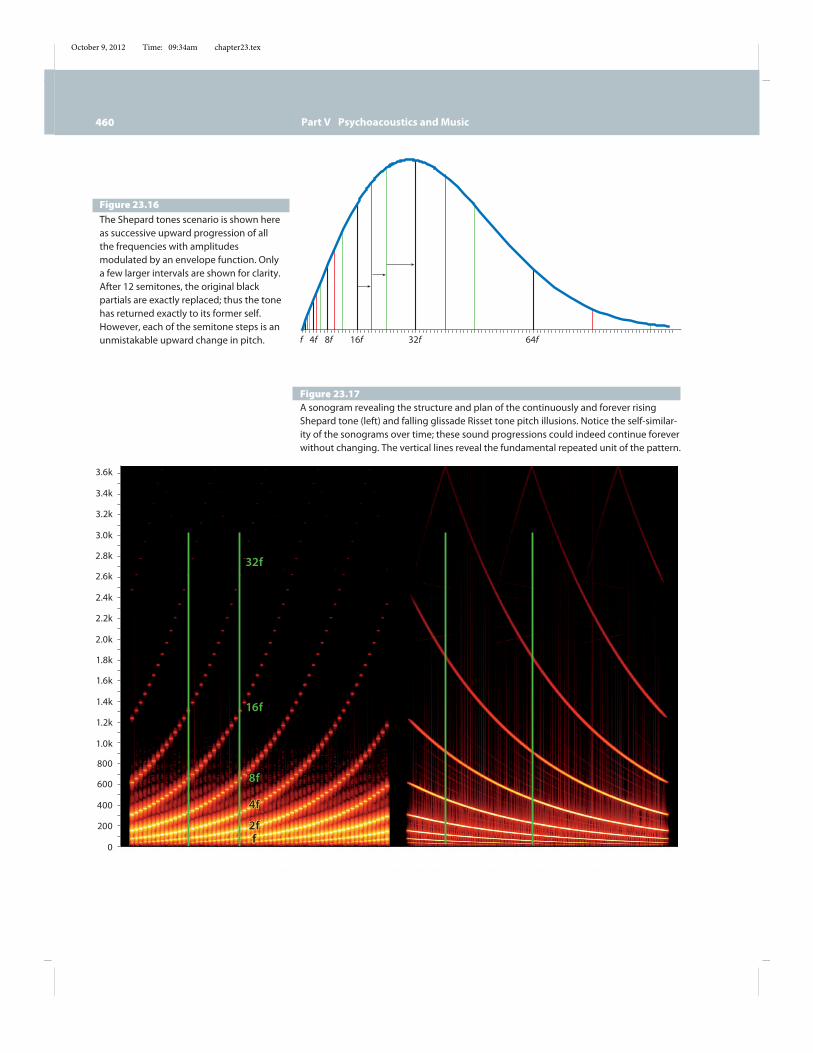
Figure 23.16The Shepard tones scenario is shown hereas successive upward progression of allthe frequencies with amplitudesmodulated by an envelope function. Onlya few larger intervals are shown for clarity.After 12 semitones, the original blackpartials are exactly replaced; thus the tonehas returned exactly to its former self.However, each of the semitone steps is anunmistakable upward change in pitch.
Figure 23.17A sonogram revealing the structure and plan of the continuously and forever risingShepard tone (left) and falling glissade Risset tone pitch illusions. Notice the self-similar-ity of the sonograms over time; these sound progressions could indeed continue foreverwithout changing. The vertical lines reveal the fundamental repeated unit of the pattern.
3.6k
3.4k
3.2k
3.0k
2.6k
2.8k
2.4k
2.2k
2.0k
1.6k
1.8k
1.4k
1.2k
1.0k
600
800
400
200
0ff
2f2f
4f4f
f2f
4f
8f8f
16f16f
32f32f
8f
16f
32f
October 9, 2012 Time: 09:34am chapter23.tex
Chapter 23 Pitch Perception 461
that partial, according to the envelope, which modulates the amplitudes asan = E ( fm,n). Specifically, this envelope has the property E ( f0) = 0—thatis, it is 0 at frequency f0. This makes the m = 0 and m = 12 amplitudesand frequencies the same, so after an octave of semitone steps we havearrived back where we started, yet every semitone step is a rise in pitch.Figure 23.16 shows the spectrum and the envelope. We can also see thescheme in a sonogram (figure 23.17). After one octave rise in pitch, thepattern of amplitudes and frequencies is exactly where it started, which isconfirmed by the sonogram. The vertical lines in figure 23.17 reveal thefundamental repeated unit of the pattern.
Shepard Tones and Autocorrelation
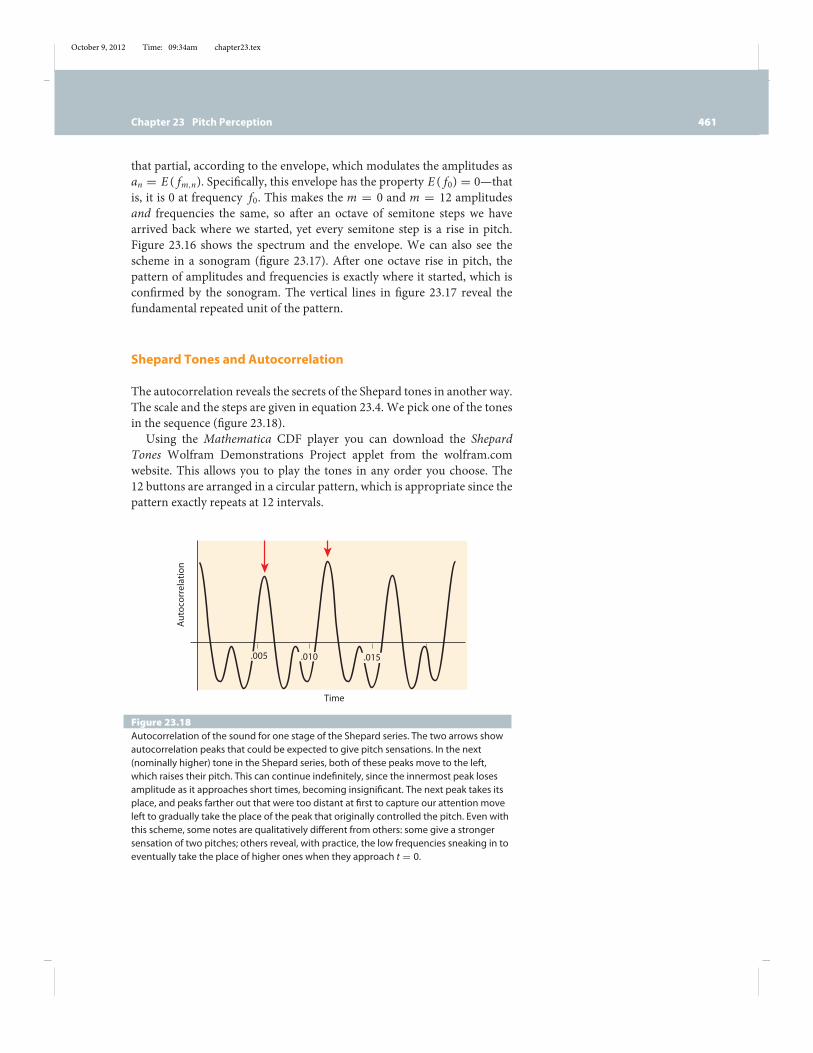
The autocorrelation reveals the secrets of the Shepard tones in another way.The scale and the steps are given in equation 23.4. We pick one of the tonesin the sequence (figure 23.18).
Using the Mathematica CDF player you can download the ShepardTones Wolfram Demonstrations Project applet from the wolfram.comwebsite. This allows you to play the tones in any order you choose. The12 buttons are arranged in a circular pattern, which is appropriate since thepattern exactly repeats at 12 intervals.
Time
Auto
corr
elat
ion
.005 .010 .015
Figure 23.18Autocorrelation of the sound for one stage of the Shepard series. The two arrows showautocorrelation peaks that could be expected to give pitch sensations. In the next(nominally higher) tone in the Shepard series, both of these peaks move to the left,which raises their pitch. This can continue indefinitely, since the innermost peak losesamplitude as it approaches short times, becoming insignificant. The next peak takes itsplace, and peaks farther out that were too distant at first to capture our attention moveleft to gradually take the place of the peak that originally controlled the pitch. Even withthis scheme, some notes are qualitatively different from others: some give a strongersensation of two pitches; others reveal, with practice, the low frequencies sneaking in toeventually take the place of higher ones when they approach t = 0.

October 9, 2012 Time: 09:34am chapter23.tex
462 Part V Psychoacoustics andMusic
Every step clockwise to the next note is an apparent semitone higher inpitch. There is a left shift of the autocorrelation peaks (which means theyappear earlier in time and correspond to higher pitch), and there are smallchanges in their shape and height. The shift is just that required for thepitch to rise a semitone. When the first two tall peaks are about equal inheight, they are an octave apart and both can be heard. Both tones rise in thenext clockwise step up (both peaks shift left), but the peak closer to t = 0(higher pitch) starts to diminish in height, graduallymaking the lower pitchmore dominant even though each clockwise step raises the pitch of bothpeaks by moving them left. Eventually, new peaks moving from the right toleft arrive, after 12 steps, to exactly reproduce the starting autocorrelationfunction.
Can the Shepard effect be achieved without such careful parsing ofpartials? The answer is yes, although perhaps not quite so convincingly.The basic idea is to use many notes across a wide frequency range, withthe highest and lowest notes muted and the loudest notes in the middle ofthe range. Play successive rising (or falling) intervals while fading in or outnotes at the extremes. Shepard-like effects have been used by the rock bandQueen in the song “Tie Your Mother Down,” have been exploited by PinkFloyd, and appear in the works of Bach and Chopin. Risset constructed acontinuous glissade version of Shepard’s discrete tones (figure 23.17, right).
1
2
3
8642
–2–4
0.005 0.010 0.015 0.0208642
–2–4
0.005 0.010 0.015 0.020
8642
–2–4
0.005 0.010 0.015 0.020
8642
–2–4
0.005 0.010 0.015 0.020
8642
–2–4
0.005 0.010 0.015 0.020
8642
–2–4
0.005 0.010 0.015 0.020
8642
–2–4
0.005 0.010 0.015 0.020
8642
–2–4
0.005 0.010 0.015 0.020
8642
–2–4
0.005 0.010 0.015 0.020
8642
–2–4
0.005 0.010 0.015 0.020
8642
–2–4
0.005 0.010 0.015 0.020
8642
–2–4
0.005 0.010 0.015 0.020
Figure 23.19The Shepard tone illusion from the pointof view of the autocorrelation functions,shown here for the notes of the ShepardTones Mathematica applet. The scale isdescribed in equation 23.4. Everyclockwise step to the next note is asemitone higher in pitch. Every clockwisestep (1 % 2, 2 % 3, and so on) gives a leftshift of the autocorrelation peaks (whichmeans that they appear earlier in time andcorrespond to higher pitch) and smallchanges in their shape and height. Theshift is just that required for the pitch torise a semitone. When the first two tallpeaks are about equal in height, they arean octave apart and both can be heard.Both tones rise in pitch at the nextclockwise step (both peaks shift left), butthe peak closer to t = 0 (higher pitch)starts to diminish in height, graduallymaking the lower pitch more dominanteven though each clockwise step raisesthe pitch of both peaks by moving themleft. Eventually, new peaks moving fromthe right to left arrive, after 12 steps, toexactly reproduce the startingautocorrelation function.
October 9, 2012 Time: 09:34am chapter23.tex
Chapter 23 Pitch Perception 463
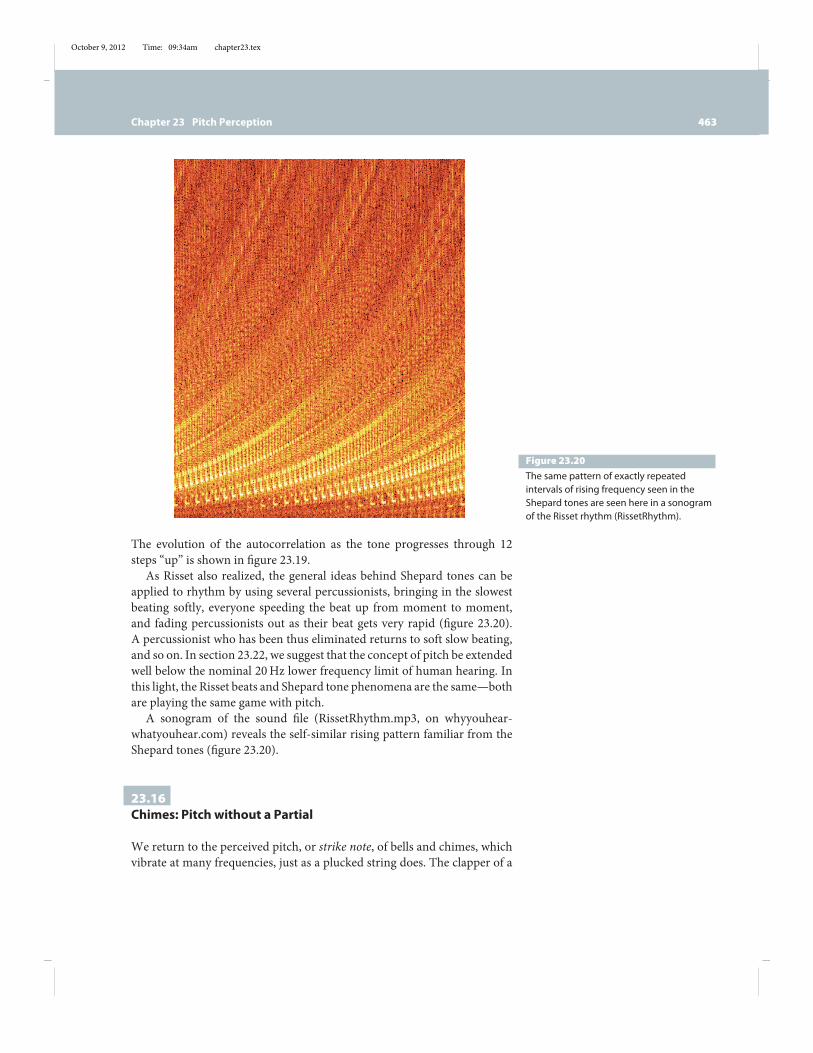
Figure 23.20The same pattern of exactly repeatedintervals of rising frequency seen in theShepard tones are seen here in a sonogramof the Risset rhythm (RissetRhythm).
The evolution of the autocorrelation as the tone progresses through 12steps “up” is shown in figure 23.19.
As Risset also realized, the general ideas behind Shepard tones can beapplied to rhythm by using several percussionists, bringing in the slowestbeating softly, everyone speeding the beat up from moment to moment,and fading percussionists out as their beat gets very rapid (figure 23.20).A percussionist who has been thus eliminated returns to soft slow beating,and so on. In section 23.22, we suggest that the concept of pitch be extendedwell below the nominal 20Hz lower frequency limit of human hearing. Inthis light, the Risset beats and Shepard tone phenomena are the same—bothare playing the same game with pitch.
A sonogram of the sound file (RissetRhythm.mp3, on whyyouhear-whatyouhear.com) reveals the self-similar rising pattern familiar from theShepard tones (figure 23.20).
23.16Chimes: Pitch without a Partial
We return to the perceived pitch, or strike note, of bells and chimes, whichvibrate at many frequencies, just as a plucked string does. The clapper of a
October 9, 2012 Time: 09:34am chapter23.tex
464 Part V Psychoacoustics andMusic
bell excites many modes at once; a complex vibration of the bell ensues thatis a linear superposition of all these modes, each of which corresponds toa pure sinusoidal partial. If a mode has an antinode where the clapper hits,it tends to be strongly excited, and if it has a node there, it will be silent.This is the same principle as a plucked string, the difference being that thepartials of the bell are not evenly spaced. There is no definite period of theresulting tone, and no unambiguous frequency that is the inverse of thisperiod, yet “true” bells have a definite pitch—after all, they have to be ableto ring out a tune.
The perceived pitch of a bell is usually not among the partials present.To achieve a pleasing tone, the partials cannot be placed helter-skelter. Itis still an art to make a great-sounding church bell. The first, or lowest,partial tone is called the hum tone and is the simplest ellipsoidal vibrationof the bell, in which the bell oscillates in the same way as the bowl shownin figure 20.10.
Many people find the unequally spaced partials in a bell or chime easierto hear out than the equally spaced partials in a periodic tone. We takeas an example the sound file Strike Note of a Chime from the AcousticalSociety of America’s audio demonstration disk.8 In this demonstration,the same chime tone is repeated nine times. The first time, we hear thechime; the next seven repeats are preceded by a pure sine tone at successive(inharmonic) partials contained in the chime tone. Although a trained earcan certainly hear the individual partials in the original tone with no help,the tendency on first hearing the chime is to listen holistically, taking inits pleasing timbre and hearing a definite overall pitch. However, after anindividual partial is played, it is impossible for most people not to hearthat particular partial ringing strongly in the subsequent chime tone, eventhough the chime playback is identical to the ones that preceded it. In effect,we are forced by the playing of the pure partial to hear the subsequentchime tone analytically. The last repetition of the chime is followed by thepure sine tone at the pitch of the chime. The pitch does not coincide withone of the chime’s partials.
The Hosanna Bell in Freiburg
The Hosanna Bell in Freiburg, Germany, was commissioned in 1258.It is of a design now considered antiquated; its partials are not wellspaced by modern criteria, owing ultimately to its shape. The bell is“long waisted” and “shaped like a large flowerpot with a heavy rim”according to William A. Hibbert, whose excellent 2008 PhD thesis (TheOpen University, Milton Keynes, United Kingdom) on bells includes a
8Houtsma, Rossing, and Wagenaars.
October 9, 2012 Time: 09:34am chapter23.tex
Chapter 23 Pitch Perception 465
500 1000 1500 2000Frequency (Hz)
Time (msec)
308 Hz
Pow
erAu
toco
rrel
atio
n
t = 1 ∕ 308 s
0.001 0.002 0.003 0.004 0.005 0.006
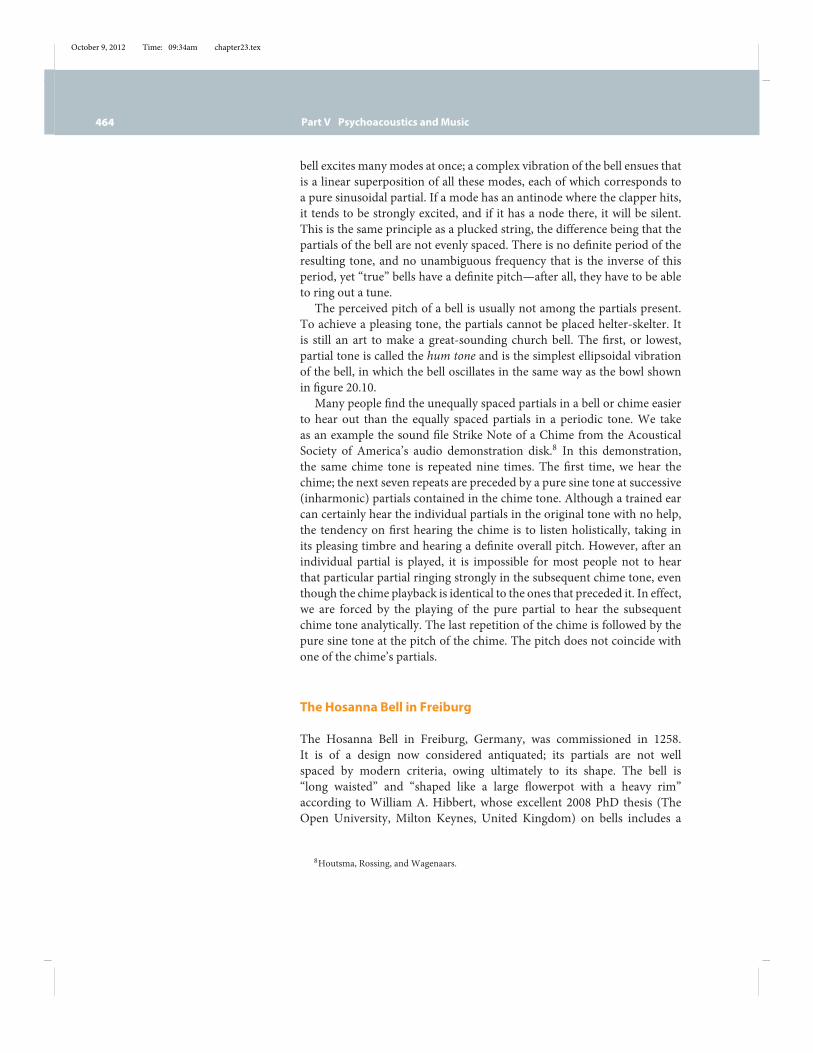
Figure 23.21The power spectrum and autocorrelationfor the Hosanna Bell in Freiburg, Germany,as rung normally by its clapper. There is adistinct peak in the autocorrelation att = 1/308 s, corresponding to a 307.3 Hzaverage pitch reported by observers. Theresidue pitch formula 23.1 yields 308.6 Hz.
study of the Freiburg Hosanna. The Hosanna has a very definite pitch,which most people agree is near 308Hz, rather high for a bell of thissize. The partials are at frequencies 135.4, 267.4, 346.4, 365.8, 615.8, 912,1231.6, 1582, 1962, 2356Hz, with relative amplitudes 0.28, 0.5, 0.82, 0.1,1.1, 0.85, 0.75, 0.2, 0.3, 0.25. Figure 23.21 shows the power spectrum andthe autocorrelation using just this data. The residue pitch (formula 23.1)using Nn = (0, 1, 1, 2, 2, 3, 4, 5, 6, 8)—arrived at by counting the nearestwhole number of periods of each partial present—is 308.6Hz.
Pitch of a Kettle Drum
A well-struck kettle drum might have partials at 128, 192, and 256Hz,which “should” give a residue pitch of 64Hz, since these frequencies areall multiples of 64Hz. However, almost everyone reports a pitch of 128Hzinstead. The 128Hz component may dominate, but if the next two have areasonable amplitude, a constant tone (as opposed to the kettle drumstrike)with these components does have a pitch of 64Hz (although 128 can alsobe heard). The kettle drum, however, stubbornly seems to be 128Hz.
October 9, 2012 Time: 09:34am chapter23.tex
466 Part V Psychoacoustics andMusic
1
0
Auto
corr
elat
ion
Auto
corr
elat
ion
Time Time
0.0156 s, 64 Hz
0.00781 s, 128 Hz
0
1
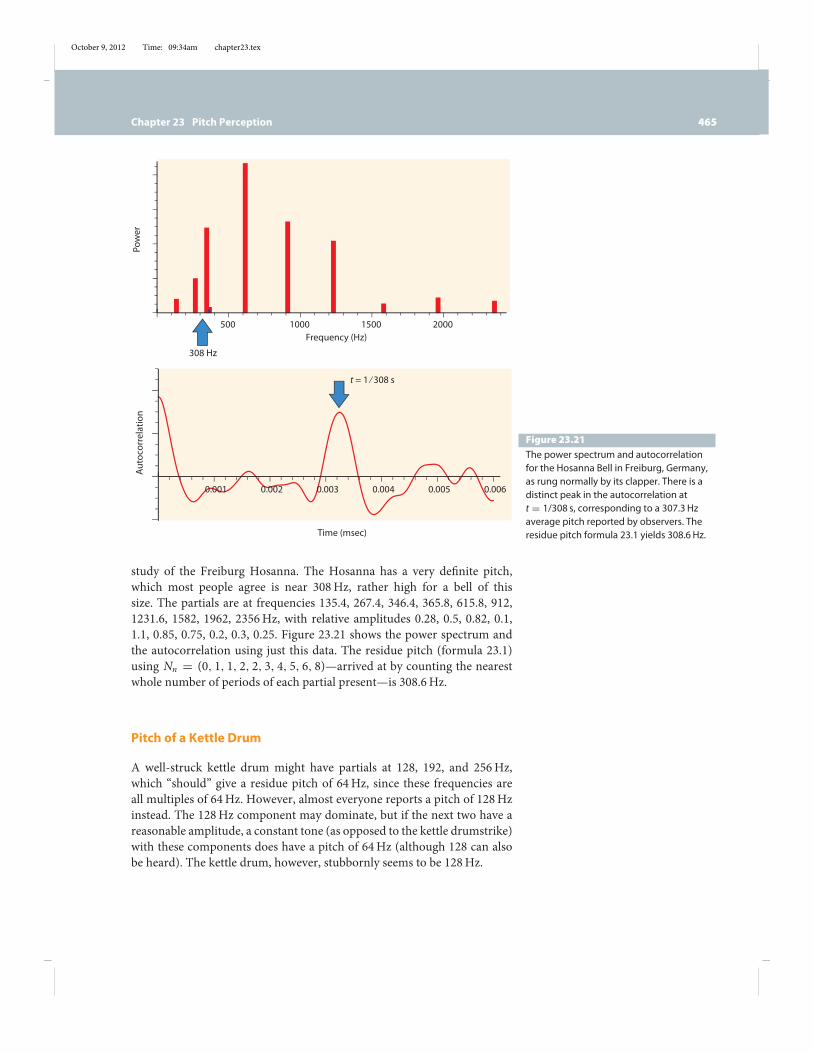
Figure 23.22(Left) The autocorrelation function of the sound of a single strike of a kettle drum. Peakscorresponding to 64 Hz pitch and 128 Hz pitch are competing for dominance accordingto the marquee effect principle (see section 23.14). For most listeners, the pitch reportedis 128 Hz. (Right) We synthesized a summary version of the tone, having only 128, 192,and 256 Hz components. Two sound traces and two corresponding autocorrelations aredisplayed. One tone was cut off rapidly, the other, less so. The pitch of the weaklydamped tone when played over a speaker system is indeed often perceived an octavebelow the strongly damped one, as Rossing predicted, even though they differ only inhow fast they are cut off. The autocorrelation gives some support to this impression: wenote that for the longer lasting tone, the 64 Hz peak is taller and more prominent relativeto the 128 Hz peak.
Figure 23.22 shows the autocorrelation for a recorded strike of the kettledrum. We see that the competition for “first billing” on the marquee is setup (see section 23.14) with an earlier peak at 128Hz and a later but tallerpeak at 64Hz. Apparently, here the earlier one wins.
Rossing speculated that the short duration of the kettle drum strike hadsomething to do with the 128Hz perception. To test this, we create artificialkettle drum strikes, and check whether the autocorrelation measure ofpitch might lend support to this idea. Using amplitudes (1, 0.6, 0.3), inthat order, for the 128, 192, and 256Hz partials, we listen to the resultfor various exponential damping rates. A very interesting trend emerges:a short cutoff of the sound does cause the dominant pitch to rise anoctave. Moreover, the autocorrelation measure confirms or at least makesplausible this trend, showing that the peak corresponding to a 64Hz pitchbecomes more prominent relative to the earlier 128Hz peak as the toneis lengthened. (See figure 23.22, right, and listen to shortkettle.wav andlongkettle.wav, available on whyyouhearwhatyouhear.com.)
23.17Repetition Pitch
Noise is a common companion out-of-doors. The rustle of leaves, thesound of a waterfall, waves on a beach, feet shuffling along the ground
October 9, 2012 Time: 09:34am chapter23.tex
Chapter 23 Pitch Perception 467
are all noise sources. We now have many additional sources of outdoornoise, such as jet aircraft, cars passing by, and the general din of cities.The power spectrum of such noise is often not gathered into manysharp peaks, but rather diffused over very broad frequency ranges. Ifan average is taken over a long time, the power spectrum is a smoothcontinuum.
If a complex periodic tone of frequency f and period T = 1/ f istime delayed by half of its period—a time T/2—and added to its originalself, the pitch of the tone will go up by an octave. The lowest partial,and in fact every odd (the 3rd, the 5th, and so on) partial above it, isnullified if it is added to itself half a period later: these partials are alwaysthe negative of themselves half a period of the fundamental earlier. For a100Hz tone, this is a delay of 0.005 s. If all the odd partials in a 100Hztone with 100, 200, 300, 400, . . .Hz partials are killed, leaving 200, 400,600, . . .Hz, a 200Hz pitch results (an octave higher). This fact figures inour explanation of Lord Rayliegh’s harmonic echo, wherein he heard anecho of a woman’s voice return at an octave higher than it left (see section28.4). The autocorrelation of the signal reveals the repetitions as peaksand valleys shaping the power spectrum at the receiver accordingly (seefigures 21.3 and 21.4). We discuss commonly encountered examples of thisnext.
Huygens at Chantilly
Very likely the first discovery and explanation of repetition pitch wasprovided in 1693 by Christian Huygens at the castle of Chantilly in France.Huygens is renowned for his theories of wave propagation; we encounteredhim in connection with refraction (see figure 2.9 and surrounding discus-sion). He noticed that the sound of a fountain located near a large set ofsteps is colored by a dominant pitch, and he correctly surmised that thereflections of the fountain noise by the nearby steps caused a repetitiousecho consisting of a sequence of small echoes, one from each step. For 1/2meter separating the steps, the echo from a hand clap near the fountainwould send back echo pulses 340 to the second, giving a frequency off = 340. The sound of the fountain is noisy, but the pitch can be heardnonetheless. The fountain noise can be thought of as thousands of littleclaps per second, each of which gets a repetition pitch echo. Huygens’s ownobservations are remarkably modern, and his way of explaining the pitchthat is heard is worth reading:
When one is standing between the staircase and the fountain, onehears from the side of the staircase a resonance that possesses acertain musical pitch that continues, as long as the fountain spouts.One did not know where this tone originated from or improbable
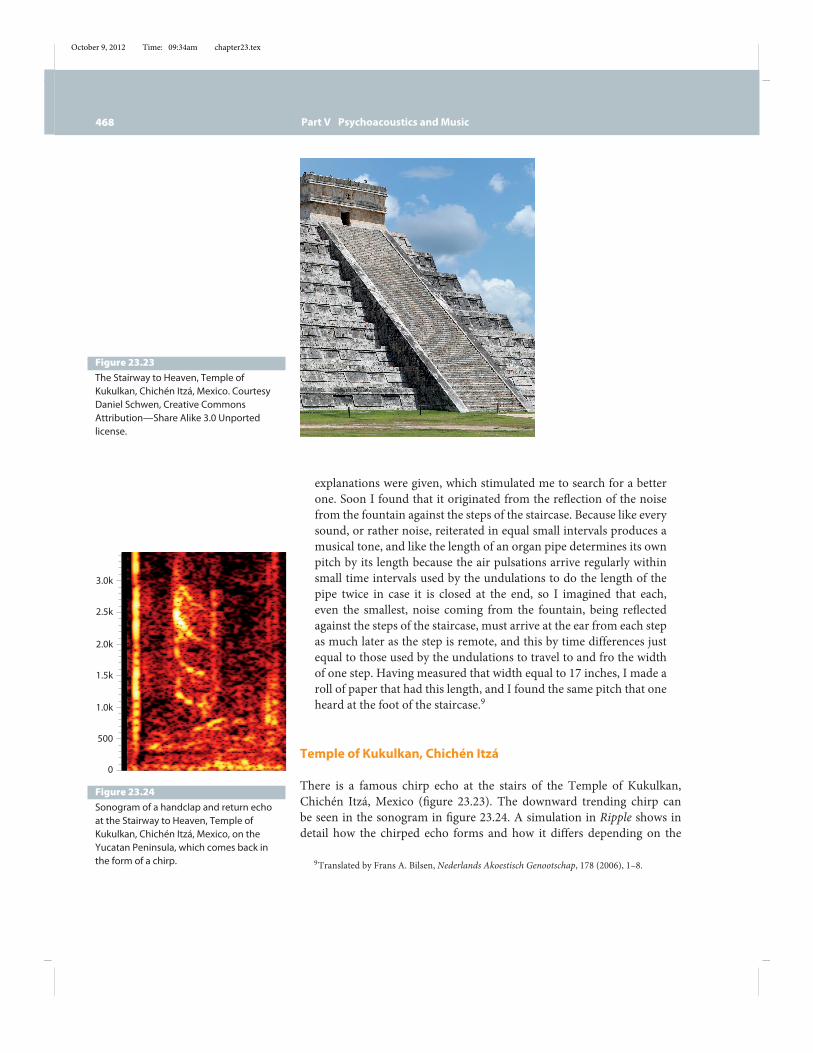
October 9, 2012 Time: 09:34am chapter23.tex
468 Part V Psychoacoustics andMusic
Figure 23.23The Stairway to Heaven, Temple ofKukulkan, Chichén Itzá, Mexico. CourtesyDaniel Schwen, Creative CommonsAttribution—Share Alike 3.0 Unportedlicense.
explanations were given, which stimulated me to search for a betterone. Soon I found that it originated from the reflection of the noisefrom the fountain against the steps of the staircase. Because like everysound, or rather noise, reiterated in equal small intervals produces amusical tone, and like the length of an organ pipe determines its ownpitch by its length because the air pulsations arrive regularly withinsmall time intervals used by the undulations to do the length of thepipe twice in case it is closed at the end, so I imagined that each,even the smallest, noise coming from the fountain, being reflectedagainst the steps of the staircase, must arrive at the ear from each stepas much later as the step is remote, and this by time differences justequal to those used by the undulations to travel to and fro the widthof one step. Having measured that width equal to 17 inches, I made aroll of paper that had this length, and I found the same pitch that oneheard at the foot of the staircase.9
Temple of Kukulkan, Chichén Itzá
There is a famous chirp echo at the stairs of the Temple of Kukulkan,Chichén Itzá, Mexico (figure 23.23). The downward trending chirp canbe seen in the sonogram in figure 23.24. A simulation in Ripple shows indetail how the chirped echo forms and how it differs depending on the
9Translated by Frans A. Bilsen, Nederlands Akoestisch Genootschap, 178 (2006), 1–8.
3.0k
2.5k
2.0k
1.5k
1.0k
500
0
Figure 23.24Sonogram of a handclap and return echoat the Stairway to Heaven, Temple ofKukulkan, Chichén Itzá, Mexico, on theYucatan Peninsula, which comes back inthe form of a chirp.
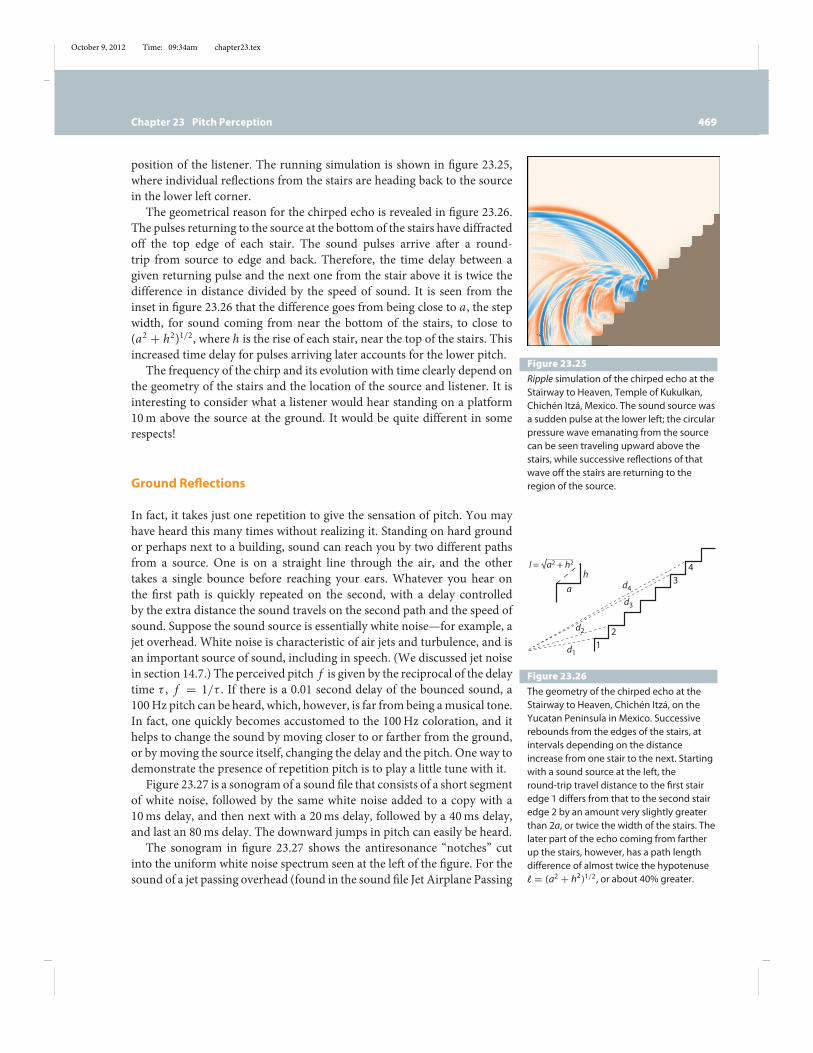
October 9, 2012 Time: 09:34am chapter23.tex
Chapter 23 Pitch Perception 469
Figure 23.25Ripple simulation of the chirped echo at theStairway to Heaven, Temple of Kukulkan,Chichén Itzá, Mexico. The sound source wasa sudden pulse at the lower left; the circularpressure wave emanating from the sourcecan be seen traveling upward above thestairs, while successive reflections of thatwave off the stairs are returning to theregion of the source.
position of the listener. The running simulation is shown in figure 23.25,where individual reflections from the stairs are heading back to the sourcein the lower left corner.
The geometrical reason for the chirped echo is revealed in figure 23.26.The pulses returning to the source at the bottom of the stairs have diffractedoff the top edge of each stair. The sound pulses arrive after a round-trip from source to edge and back. Therefore, the time delay between agiven returning pulse and the next one from the stair above it is twice thedifference in distance divided by the speed of sound. It is seen from theinset in figure 23.26 that the difference goes from being close to a, the stepwidth, for sound coming from near the bottom of the stairs, to close to(a2 + h2)1/2, where h is the rise of each stair, near the top of the stairs. Thisincreased time delay for pulses arriving later accounts for the lower pitch.
The frequency of the chirp and its evolution with time clearly depend onthe geometry of the stairs and the location of the source and listener. It isinteresting to consider what a listener would hear standing on a platform10m above the source at the ground. It would be quite different in somerespects!
Ground Reflections
In fact, it takes just one repetition to give the sensation of pitch. You mayhave heard this many times without realizing it. Standing on hard groundor perhaps next to a building, sound can reach you by two different pathsfrom a source. One is on a straight line through the air, and the othertakes a single bounce before reaching your ears. Whatever you hear onthe first path is quickly repeated on the second, with a delay controlledby the extra distance the sound travels on the second path and the speed ofsound. Suppose the sound source is essentially white noise—for example, ajet overhead. White noise is characteristic of air jets and turbulence, and isan important source of sound, including in speech. (We discussed jet noisein section 14.7.) The perceived pitch f is given by the reciprocal of the delaytime # , f = 1/# . If there is a 0.01 second delay of the bounced sound, a100Hz pitch can be heard, which, however, is far from being amusical tone.In fact, one quickly becomes accustomed to the 100Hz coloration, and ithelps to change the sound by moving closer to or farther from the ground,or bymoving the source itself, changing the delay and the pitch. One way todemonstrate the presence of repetition pitch is to play a little tune with it.
Figure 23.27 is a sonogram of a sound file that consists of a short segmentof white noise, followed by the same white noise added to a copy with a10ms delay, and then next with a 20ms delay, followed by a 40ms delay,and last an 80ms delay. The downward jumps in pitch can easily be heard.
The sonogram in figure 23.27 shows the antiresonance “notches” cutinto the uniform white noise spectrum seen at the left of the figure. For thesound of a jet passing overhead (found in the sound file Jet Airplane Passing
l = √a2 + h2
ah
d1
d2
d3
d4
43
21
Figure 23.26The geometry of the chirped echo at theStairway to Heaven, Chichén Itzá, on theYucatan Peninsula in Mexico. Successiverebounds from the edges of the stairs, atintervals depending on the distanceincrease from one stair to the next. Startingwith a sound source at the left, theround-trip travel distance to the first stairedge 1 differs from that to the second stairedge 2 by an amount very slightly greaterthan 2a, or twice the width of the stairs. Thelater part of the echo coming from fartherup the stairs, however, has a path lengthdifference of almost twice the hypotenuse! = (a2 + h2)1/2, or about 40% greater.

October 9, 2012 Time: 09:34am chapter23.tex
470 Part V Psychoacoustics andMusic
7.0k
8.0k
6.0k
5.0k
4.0k
3.0k
2.0k
1.0k
0
7.5k
6.5k
5.5k
4.5k
3.5k
2.5k
1.5k
500
Figure 23.27Sonogram of a white noise sample (leftstrip), followed by the white noise samplewith a copy added with a 1 ms delay, thenwith a 2 ms delay, a 4 ms delay, and finallyan 8 ms delay. The notches (andenhancements between) in the powerspectrum caused by the repetition areclearly seen. The reader should verify thatthe frequencies of the notches are in theexpected positions.
Overhead available at whyyouhearwhatyouhear.com), the sonogram ofwhich is shown in figure 23.28, the notches are also clearly visible, butare now continuously changing with time. Starting at the left, as the jetapproaches, the interval between the notches is decreasing and reachesa minimum when the jet is directly overhead. After the jet passes, theinterval between the notches increases again. The effect is first a fallingpitch, followed by a rising pitch after the jet passes. This effect is not like theDoppler effect: after the jet passes, the pitch would continue to fall if thiswere a Doppler phenomenon (see figure 7.31 or 7.32). If you look carefully,the whine of the jet engine is a faint trace in the upper part of the sonogramthat does have this Doppler signature. You can hear the whine of the engineand the Doppler effect separately from the repetition pitch.
In order to hear these repetition pitch effects, the listener must bestanding on the ground or at least on some hard surface of considerableextent, like the top of a parking structure. You would not hear the effectfrom an apartment balcony.
We can estimate the repetition pitch as the jet passes overhead bycomputing the path length difference between the direct and bounce paths(see figure 23.29). To get both lengths, we need only apply the Pythagorean
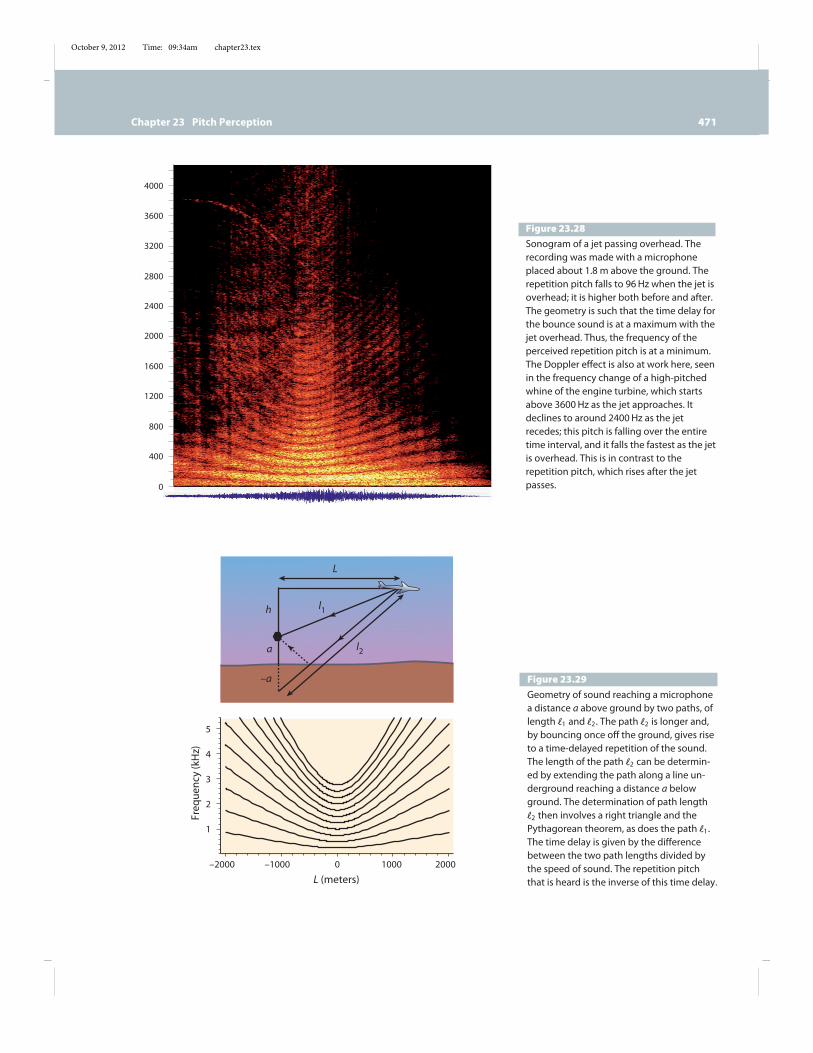
October 9, 2012 Time: 09:34am chapter23.tex
Chapter 23 Pitch Perception 471
3600
3200
2800
2400
2000
1600
1200
800
400
0
4000
Figure 23.28Sonogram of a jet passing overhead. Therecording was made with a microphoneplaced about 1.8 m above the ground. Therepetition pitch falls to 96 Hz when the jet isoverhead; it is higher both before and after.The geometry is such that the time delay forthe bounce sound is at a maximum with thejet overhead. Thus, the frequency of theperceived repetition pitch is at a minimum.The Doppler effect is also at work here, seenin the frequency change of a high-pitchedwhine of the engine turbine, which startsabove 3600 Hz as the jet approaches. Itdeclines to around 2400 Hz as the jetrecedes; this pitch is falling over the entiretime interval, and it falls the fastest as the jetis overhead. This is in contrast to therepetition pitch, which rises after the jetpasses.
L (meters)
Freq
uenc
y (k
Hz)
1
–2000 –1000 0 1000 2000
2
3
4
5
a
–a
h
L
l1
l2
Figure 23.29Geometry of sound reaching a microphonea distance a above ground by two paths, oflength !1 and !2. The path !2 is longer and,by bouncing once off the ground, gives riseto a time-delayed repetition of the sound.The length of the path !2 can be determin-ed by extending the path along a line un-derground reaching a distance a belowground. The determination of path length!2 then involves a right triangle and thePythagorean theorem, as does the path !1.The time delay is given by the differencebetween the two path lengths divided bythe speed of sound. The repetition pitchthat is heard is the inverse of this time delay.

October 9, 2012 Time: 09:34am chapter23.tex
472 Part V Psychoacoustics andMusic
theorem, since both lengths are the hypotenuse of right triangles. We have$1 =
&L 2 + h2, $2 =
"L 2 + (h + 2a)2. The lines plotted in figure 23.29
are then
fn(L) = nc($2 ' $1)
; n = 1, 2, . . . , 11, (23.5)
where c is the speed of sound. (A single repetition with a time delay T putsnotches in the power spectrum at frequencies fn = (n' 1/2)/T , as shownalso in figures 21.3 and 23.27.)
Repetition pitch is far more commonly heard than we are normallyaware of. For example, if you are in a room with a ceiling fan that makesa lot of broadband noise, and there is a hard floor that is very reflective ofsound, try putting your head at different distances above the floor. Youmayhear a changing pitch. The next time a jet flies overhead, try positioningyour head at different heights above the ground. You’ll have control of therepetition pitch, which will go up as your head approaches the pavement.
Visually impaired people often use repetition pitch to judge distance.If you create a sound and there is a wall many meters away, you willhear a distinct echo separated in time, not a pitch. But as you comecloser to the surface, reflected sound arrives very quickly, say, within afew milliseconds. The repetition pitch rises as the wall is approached, sincethere is a smaller time delay, much too quick to detect a separate echo. Ifyou become sensitive to repetition pitch, it can be used to judge distancequite accurately.
23.18Quantifying Frequency
Frequency can be measured inHz, as accurately and with as many decimalplaces as you please, so you might imagine that there’s no need for anyother system. However, the way we actually hear intervenes and makesanother way of measuring frequency much more useful. We are far moresensitive to small changes of a fewHz at lower frequencies than we are athigher frequencies. A 5Hz shift in a 50Hz tone is a 10% effect, but a 5Hzshift in a 5000Hz tone is a 0.1% effect. Most people can tell the differenceeasily between 50 and 55Hz, but cannot tell the difference between 5000and 5005Hz. The best measure of frequency differences would reflect oursensitivity to them.
Cents
Any octave interval is divided into 1200 parts, called cents. An A3 at 220Hzand an A4 an octave higher at 440Hz, an absolute difference of 220Hz,

October 9, 2012 Time: 09:34am chapter23.tex
Chapter 23 Pitch Perception 473
differ by 1200 cents. The division is, however, not into 1200 intervals ofequal frequency difference, but rather equal intervals in the logarithm ofthe frequency. In theWestern, 12-tone, equal-tempered system, this meansthere are 100 cents between adjacent keys on the piano keyboard. (We shalldiscuss various approaches to temperament in chapter 26.) We can expressthe measure of cents as
n(cents) = 1200 log2#
f2f1
$! 3896 log10
#f2f1
$
= 3896 log10( f2) ' 3896 log10( f1), (23.6)
where n is the number of cents up in going from the lower frequency f1 tothe higher frequency f2. Since log2(2) = 1, any two frequencies that differby a factor of two are separated by 1200 cents.
Just Noticeable Difference (JND)
The just noticeable difference, or JND, is defined as the minimum puretone frequency change required for a listener to detect a change in pitch.Humans are most sensitive to pitch changes in the range 50 to 2000Hz; inthis range, most of us can detect a change from 2 to 10Hz.10
The JND is about 1/30th of the critical bandwidth throughout the range20 to 10,000Hz. Thus it is about 3Hz for a 200Hz sine tone, where thecritical bandwidth is about 90Hz, and it is about 70Hz for a 10,000Hzsine tone, where the critical bandwidth is about 2000Hz. This suggests thatthe critical bandwidth is somehow involved in pitch detection. It also issuggestive of a peak locating algorithm. Suppose a 100Hz signal is smearedout symmetrically, 25Hz on either side of 100Hz. Even with the smearing,the maximum is still at exactly 100Hz; if some way exists to find themaximum response in the curve, then the resolution of frequency will bemuch better than ±25Hz. This trick is used to advantage in many fieldswhere the source of data is known to be sharp, but the instruments smearit out. The orbital parameters of planets around distant stars are measuredthis way, for example. An active neural-hair cell feedback loop is known tosharpen pitch detection. See section 21.4.
Time or Place?
The controversies and the issues surrounding pitch perception and relatedphenomena are intimately connected to two seemingly disparate views of
10To determine your own JND, take the test at http://webphysics.davidson.edu/faculty/dmb/soundRM/jnd/jnd.html.
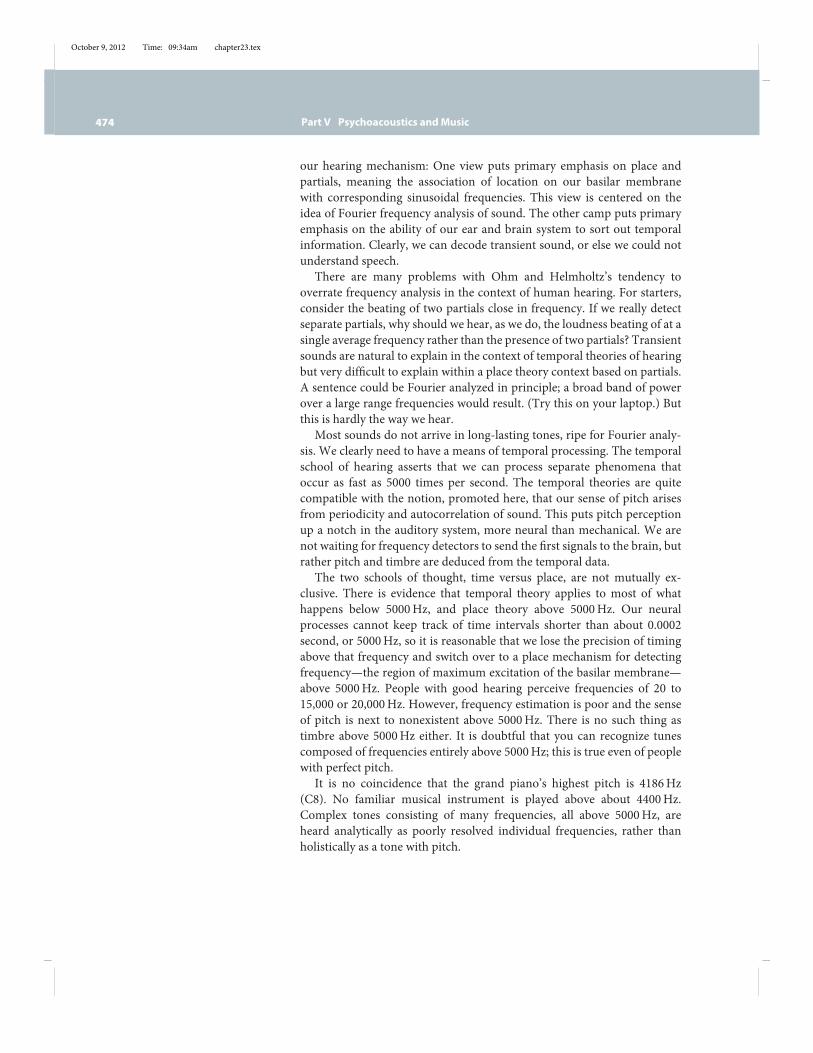
October 9, 2012 Time: 09:34am chapter23.tex
474 Part V Psychoacoustics andMusic
our hearing mechanism: One view puts primary emphasis on place andpartials, meaning the association of location on our basilar membranewith corresponding sinusoidal frequencies. This view is centered on theidea of Fourier frequency analysis of sound. The other camp puts primaryemphasis on the ability of our ear and brain system to sort out temporalinformation. Clearly, we can decode transient sound, or else we could notunderstand speech.
There are many problems with Ohm and Helmholtz’s tendency tooverrate frequency analysis in the context of human hearing. For starters,consider the beating of two partials close in frequency. If we really detectseparate partials, why should we hear, as we do, the loudness beating of at asingle average frequency rather than the presence of two partials? Transientsounds are natural to explain in the context of temporal theories of hearingbut very difficult to explain within a place theory context based on partials.A sentence could be Fourier analyzed in principle; a broad band of powerover a large range frequencies would result. (Try this on your laptop.) Butthis is hardly the way we hear.
Most sounds do not arrive in long-lasting tones, ripe for Fourier analy-sis. We clearly need to have a means of temporal processing. The temporalschool of hearing asserts that we can process separate phenomena thatoccur as fast as 5000 times per second. The temporal theories are quitecompatible with the notion, promoted here, that our sense of pitch arisesfrom periodicity and autocorrelation of sound. This puts pitch perceptionup a notch in the auditory system, more neural than mechanical. We arenot waiting for frequency detectors to send the first signals to the brain, butrather pitch and timbre are deduced from the temporal data.
The two schools of thought, time versus place, are not mutually ex-clusive. There is evidence that temporal theory applies to most of whathappens below 5000Hz, and place theory above 5000Hz. Our neuralprocesses cannot keep track of time intervals shorter than about 0.0002second, or 5000Hz, so it is reasonable that we lose the precision of timingabove that frequency and switch over to a place mechanism for detectingfrequency—the region of maximum excitation of the basilar membrane—above 5000Hz. People with good hearing perceive frequencies of 20 to15,000 or 20,000Hz. However, frequency estimation is poor and the senseof pitch is next to nonexistent above 5000Hz. There is no such thing astimbre above 5000Hz either. It is doubtful that you can recognize tunescomposed of frequencies entirely above 5000Hz; this is true even of peoplewith perfect pitch.
It is no coincidence that the grand piano’s highest pitch is 4186Hz(C8). No familiar musical instrument is played above about 4400Hz.Complex tones consisting of many frequencies, all above 5000Hz, areheard analytically as poorly resolved individual frequencies, rather thanholistically as a tone with pitch.
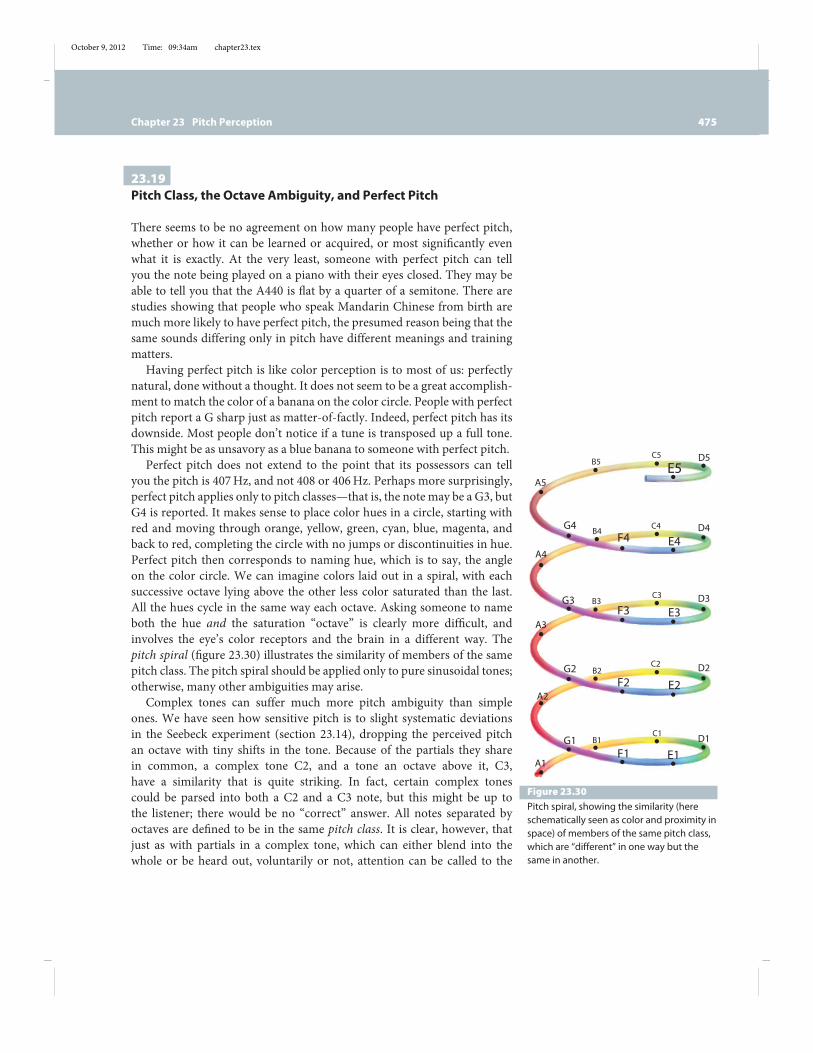
October 9, 2012 Time: 09:34am chapter23.tex
Chapter 23 Pitch Perception 475
23.19Pitch Class, the Octave Ambiguity, and Perfect Pitch
There seems to be no agreement on how many people have perfect pitch,whether or how it can be learned or acquired, or most significantly evenwhat it is exactly. At the very least, someone with perfect pitch can tellyou the note being played on a piano with their eyes closed. They may beable to tell you that the A440 is flat by a quarter of a semitone. There arestudies showing that people who speak Mandarin Chinese from birth aremuch more likely to have perfect pitch, the presumed reason being that thesame sounds differing only in pitch have different meanings and trainingmatters.
Having perfect pitch is like color perception is to most of us: perfectlynatural, done without a thought. It does not seem to be a great accomplish-ment to match the color of a banana on the color circle. People with perfectpitch report a G sharp just as matter-of-factly. Indeed, perfect pitch has itsdownside. Most people don’t notice if a tune is transposed up a full tone.This might be as unsavory as a blue banana to someone with perfect pitch.
Perfect pitch does not extend to the point that its possessors can tellyou the pitch is 407Hz, and not 408 or 406Hz. Perhaps more surprisingly,perfect pitch applies only to pitch classes—that is, the note may be a G3, butG4 is reported. It makes sense to place color hues in a circle, starting withred and moving through orange, yellow, green, cyan, blue, magenta, andback to red, completing the circle with no jumps or discontinuities in hue.Perfect pitch then corresponds to naming hue, which is to say, the angleon the color circle. We can imagine colors laid out in a spiral, with eachsuccessive octave lying above the other less color saturated than the last.All the hues cycle in the same way each octave. Asking someone to nameboth the hue and the saturation “octave” is clearly more difficult, andinvolves the eye’s color receptors and the brain in a different way. Thepitch spiral (figure 23.30) illustrates the similarity of members of the samepitch class. The pitch spiral should be applied only to pure sinusoidal tones;otherwise, many other ambiguities may arise.
Complex tones can suffer much more pitch ambiguity than simpleones. We have seen how sensitive pitch is to slight systematic deviationsin the Seebeck experiment (section 23.14), dropping the perceived pitchan octave with tiny shifts in the tone. Because of the partials they sharein common, a complex tone C2, and a tone an octave above it, C3,have a similarity that is quite striking. In fact, certain complex tonescould be parsed into both a C2 and a C3 note, but this might be up tothe listener; there would be no “correct” answer. All notes separated byoctaves are defined to be in the same pitch class. It is clear, however, thatjust as with partials in a complex tone, which can either blend into thewhole or be heard out, voluntarily or not, attention can be called to the
A4
A5
G4 B4
B5
E4
E5
F4D4
D5
C4
C5
A3
G2
G3
B2
B3E3F3
D2
D3
C2
C3
A1
A2
G1 B1
E1
E2
F1
F2
D1C1
Figure 23.30Pitch spiral, showing the similarity (hereschematically seen as color and proximity inspace) of members of the same pitch class,which are “different” in one way but thesame in another.
October 9, 2012 Time: 09:34am chapter23.tex
476 Part V Psychoacoustics andMusic
0 f 2f 4f
Figure 23.31Is this one tone with a pitch f, or is it two,the black with pitch f and the red withpitch 2f ?
possible existence of two notes by musical context, learning, and othercues.
In figure 23.31, we see the spectrum of an ordinary complex periodictone, with every other partial colored red, beginning with the second par-tial. This tone “ought” to have an unambiguous, strong pitch at frequencyf . Yet who is to say that the tone is not a combination of two tones? Thelower tone consists of the black power spectrum, and the upper tone thered power spectrum. Both tones are complex, one an octave above theother. A tone like this could be produced with a combination of a clarinet(lacking its even partials) playing a G3 (black spectrum) and an oboe anoctave above, playing a G4 (red spectrum), with all its overtone partialspresent. A clever experiment was described in a Stanford PhD thesis byS. McAdams.11 The harmonics of an oboe were separated into even andodd components, and then an independent vibrato was added to just theodd components. This results in the sensation of two independent noteson two different instruments, separated in pitch by an octave.
23.20Parsing and Persistence: Analytic versus Synthetic Hearing
We have mentioned switching between analytic and synthetic listening andhow this can be influenced by context. An example was the chime sound,analyzed into partials, as heard in the file Strike Note of a Chime from theAcoustical Society of America’s audio demonstration disk or as heard whena partial in a complex tone in Fourier or MAX Partials is adjusted, callingattention to it. Two intriguing questions are raised: Does auditory persis-tence apply to two or more partials at once? Does this work in a musicalcontext? These questions were addressed by Helmholtz 150 years ago:
Get a powerful bass voice to sing E flat to the vowel O, in sore (morelike aw in saw than o in so), gently touch B flat on the piano, whichis the 12th or third partial tone of E flat, and let its sound die awaywhile you are listening to it attentively. The note B-flat on the pianowill appear really not to die away, but to keep on sounding, even whenits string is damped by removing the finger from the digital, becausethe ear unconsciously passes from the tone of the piano to the partialtone of the same pitch produced by the singer, and takes the latter forcontinuation of the former. But when the finger is removed from thekey, and the damper has fallen, it is of course impossible that the toneof the string should have continued sounding.12
11Stanford University, Dept. of Music technical report, STAN-M-22 (1984).12On the Sensation of Tone. There is a spectacular modern reversal of this experiment, in which
a computer controlled piano with dampers down is able to reproduce recognizable speech. Lookup “Speaking Piano” on YouTube.
October 9, 2012 Time: 09:34am chapter23.tex
Chapter 23 Pitch Perception 477
Memory of the partials that were very recently present does seem tocolor our perception of a tone. This is why the strike note of a chime orbell is so important. Some partials die off faster than others, and memoryof them may color what we hear two seconds into a chime tone, makingpartials that are very weak have a disproportionate effect.
The boundaries between analytic and synthetic listening are not rigid.Are we listening analytically or synthetically when we parse a compoundsound into several distinct musical instruments and perhaps many distinctsimultaneous notes? Or, when we recognize two singers in unison assuch, rather than a single voice? (Depending on the voices, the context,vibrato, and so on, this may be quite difficult to do.) It is one form ofanalytic listening to hear out individual partials, but perhaps a not sodistantly related form to hear out patterns of several partials that mightindicate the presence of an oboe, for example, among other instrumentsplaying simultaneously. According to this definition, normal listening ispart analytical and part synthetic, even when individual partials are notheard.
23.21Deutsch’s Octave Illusion
An auditory illusion was discovered by Diana Deutsch in the 1970s andis rich with implications. It is perhaps the most remarkable audio illusionyet discovered. (Unless you happen to be one of the few who hears what ishappening correctly.) One of the amazing aspects of this illusion is thatdifferent people hear it in starkly different and easily describable ways.There are no nagging ambiguities, no mincing of interpretations or words,which seems to happen too often in pitch perception. This illusion mightbe the key to one of the difficulties in resolving pitch in phantom tonecontroversies: What if people aren’t hearing even approximately the samething?
We quote from Deutsch’s website:
Two tones that are spaced an octave apart are alternated repeatedlyat a rate of four per second. The identical sequence is played overheadphones to both ears simultaneously, except that when the rightear receives the high tone the left ear receives the low tone, and viceversa. The tones are sine waves of constant amplitude, and followeach other without amplitude drops at the transitions. So in fact thelistener is presented with a single, continuous two-tone chord, withthe ear of input for each component switching repeatedly.
Despite its simplicity, this pattern is almost never heard correctly,and instead produces a number of illusions. Many people hear a sin-gle tone which switches from ear to ear, while its pitch simultaneously
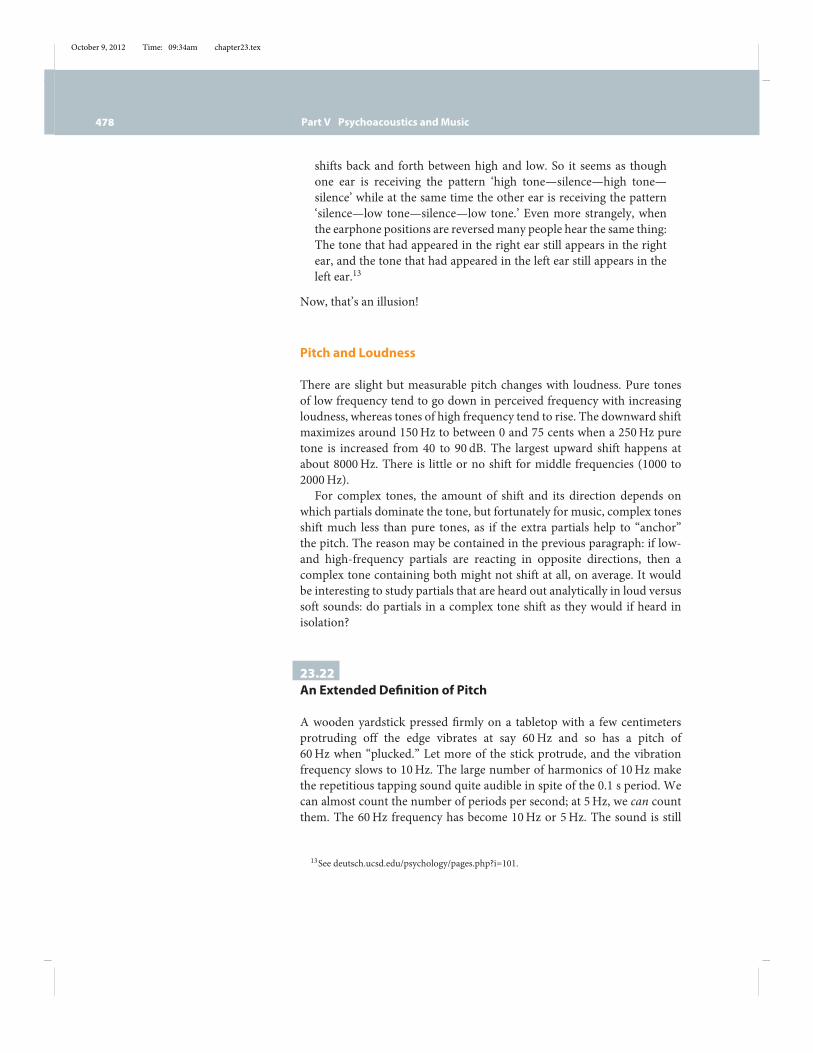
October 9, 2012 Time: 09:34am chapter23.tex
478 Part V Psychoacoustics andMusic
shifts back and forth between high and low. So it seems as thoughone ear is receiving the pattern ‘high tone—silence—high tone—silence’ while at the same time the other ear is receiving the pattern‘silence—low tone—silence—low tone.’ Even more strangely, whenthe earphone positions are reversedmany people hear the same thing:The tone that had appeared in the right ear still appears in the rightear, and the tone that had appeared in the left ear still appears in theleft ear.13
Now, that’s an illusion!
Pitch and Loudness
There are slight but measurable pitch changes with loudness. Pure tonesof low frequency tend to go down in perceived frequency with increasingloudness, whereas tones of high frequency tend to rise. The downward shiftmaximizes around 150Hz to between 0 and 75 cents when a 250Hz puretone is increased from 40 to 90 dB. The largest upward shift happens atabout 8000Hz. There is little or no shift for middle frequencies (1000 to2000Hz).
For complex tones, the amount of shift and its direction depends onwhich partials dominate the tone, but fortunately for music, complex tonesshift much less than pure tones, as if the extra partials help to “anchor”the pitch. The reason may be contained in the previous paragraph: if low-and high-frequency partials are reacting in opposite directions, then acomplex tone containing both might not shift at all, on average. It wouldbe interesting to study partials that are heard out analytically in loud versussoft sounds: do partials in a complex tone shift as they would if heard inisolation?
23.22An Extended Definition of Pitch
A wooden yardstick pressed firmly on a tabletop with a few centimetersprotruding off the edge vibrates at say 60Hz and so has a pitch of60Hz when “plucked.” Let more of the stick protrude, and the vibrationfrequency slows to 10Hz. The large number of harmonics of 10Hz makethe repetitious tapping sound quite audible in spite of the 0.1 s period. Wecan almost count the number of periods per second; at 5Hz, we can countthem. The 60Hz frequency has become 10Hz or 5Hz. The sound is still
13See deutsch.ucsd.edu/psychology/pages.php?i=101.
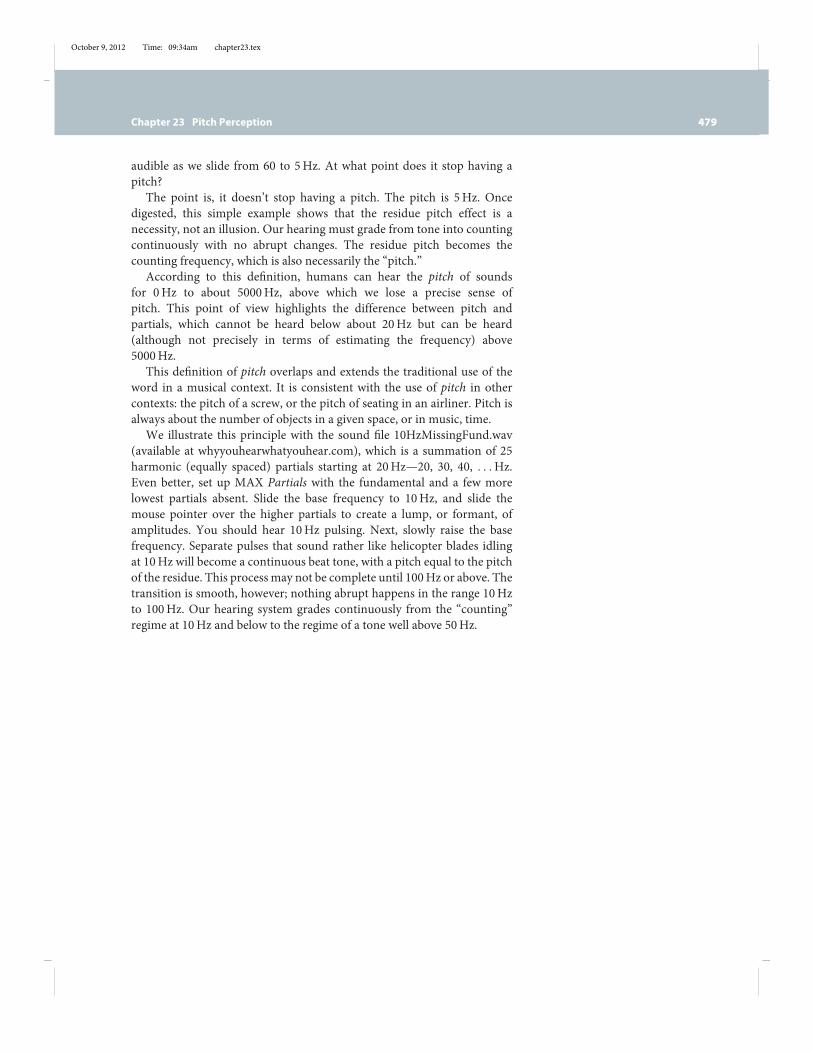
October 9, 2012 Time: 09:34am chapter23.tex
Chapter 23 Pitch Perception 479
audible as we slide from 60 to 5Hz. At what point does it stop having apitch?
The point is, it doesn’t stop having a pitch. The pitch is 5Hz. Oncedigested, this simple example shows that the residue pitch effect is anecessity, not an illusion. Our hearing must grade from tone into countingcontinuously with no abrupt changes. The residue pitch becomes thecounting frequency, which is also necessarily the “pitch.”
According to this definition, humans can hear the pitch of soundsfor 0Hz to about 5000Hz, above which we lose a precise sense ofpitch. This point of view highlights the difference between pitch andpartials, which cannot be heard below about 20Hz but can be heard(although not precisely in terms of estimating the frequency) above5000Hz.
This definition of pitch overlaps and extends the traditional use of theword in a musical context. It is consistent with the use of pitch in othercontexts: the pitch of a screw, or the pitch of seating in an airliner. Pitch isalways about the number of objects in a given space, or in music, time.
We illustrate this principle with the sound file 10HzMissingFund.wav(available at whyyouhearwhatyouhear.com), which is a summation of 25harmonic (equally spaced) partials starting at 20Hz—20, 30, 40, . . .Hz.Even better, set up MAX Partials with the fundamental and a few morelowest partials absent. Slide the base frequency to 10Hz, and slide themouse pointer over the higher partials to create a lump, or formant, ofamplitudes. You should hear 10Hz pulsing. Next, slowly raise the basefrequency. Separate pulses that sound rather like helicopter blades idlingat 10Hz will become a continuous beat tone, with a pitch equal to the pitchof the residue. This process may not be complete until 100Hz or above. Thetransition is smooth, however; nothing abrupt happens in the range 10Hzto 100Hz. Our hearing system grades continuously from the “counting”regime at 10Hz and below to the regime of a tone well above 50Hz.

October 10, 2012 Time: 03:31pm chapter24.tex
Timbre
Timbre is the third of three executive summaries of sound provided to ourconsciousness, after pitch and loudness. Timbre is what is different abouta trumpet and a clarinet when they (separately) play a 220Hz tone at thesame loudness. Like all sensory functions, timbre is a complex, difficult tomeasure, psychophysical phenomenon. As with the sense of taste, there aresubtleties and there are also connoisseurs. Impressions of timbre dependon context and experience. We shall try to sidestep these nuances and takea simplistic view: timbre is a kind of executive summary of the distributionof amplitudes of the various partials in a complex tone. Two sounds havingall the same frequencies present but differing in amplitude have a differenttimbre. It is easy to experiment with timbre differences by changing thepower spectrum amplitudes in Fourier or MAX Partials.
It is not possible to characterize timbre on a single scale from low to high,as we can for pitch and loudness. Timbre depends on the relative amplitudeof the various partials, but it is often hard to describe. Some universals doexist: tones consisting only of the odd harmonics sound “hollow.”1 Toneswith many high upper partials may sound raspy or harsh, as in buzzing intoa trumpet mouthpiece; those with few may sound mellow, as in a flute atlow sound volume. Pure sinusoidal partials are dull and colorless, especiallyat low frequency.
24.1Timbre and Phase
Shape Depends on Phase
When two sinusoids of frequency f1 and f2 are added together, the shapeof the resulting curve depends on the relative phase !:
y(t) = A1 sin(2" f1t) + A2 sin(2" f2t + !). (24.1)
1For good reason: half-open pipes (that is, a hollow space) have only odd harmonics asresonances!
480

October 10, 2012 Time: 03:31pm chapter24.tex
Chapter 24 Timbre 481
Figure 24.1Both of the black traces are the result ofadding the colored sinusoids together.These are the same in the two cases,except for a phase shift. Both black traceswould sound almost exactly the same, andboth have the same power spectrum.
The phase controls the offset of the crests and troughs of differentpartials, and affects the resulting shape when they are added together(figure 24.1).
Ohm-Helmholtz Phase Law
We can phase-shift a sine wave by adding a phase ! inside the argument ofthe sine—that is, y(t) = A sin(2" f t + !). We allegedly cannot hear one! from another. In a complex tone, there may be many partials and manypossible phases !i , which for a harmonic tone reads
y(t)= A1 sin(2" f t+ !1)+A2 sin(4" f t+ !2)+A3 sin(6" f t+ !3)+· · · .
(24.2)
Now the question arises: can we hear differences as the !i are changed?There is a generalization of this question to any steady inharmonic tonelike a chime. Here, we will consider mainly pairs of sinusoids that fall intoboth harmonic and inharmonic classes.
The autocorrelation (and thus the power spectrum) of a steady toneis unchanged by the phase of its partials, so it is no surprise that pitchis not affected by the phases. However, since the phases drastically affectthe shape of the waveform, one might wonder if the timbre is affected.Although Ohm knew that the timbre of a note is a result of the amplitudesAi , he assigned no importance to the phases !i . Later, Helmholtz made thisan explicit principle, asserting that phases did not affect our perceptionof the tone. We shall call this the Ohm-Helmholtz phase law, which is acorollary of Ohm’s law, since phases are not mentioned in the statement ofOhm’s law.
Figure 24.2 shows a case with many partials; when the phases arerandomized the waveform changes drastically. According to the Ohm-Helmholtz phase law, we can’t hear the difference.
Are we in fact totally insensitive to the phases? Elaborate and ingeniousexperiments were devised to check this, in particular by Helmholtz andRudolph Koenig. These experiments were not taken to be conclusive,because it could not be verified that other things besides phase had notchanged. Now, we can check this more easily with computers, althoughsome of the same pitfalls still exist. Primarily, it is important to ensurethat there are no partials shared by tones that are to be phase-shifted.If in fact some are shared, then phase shifting will alter the amplitudeof the shared partial, since the relative phase will induce constructive ordestructive interference.

October 10, 2012 Time: 03:31pm chapter24.tex
482 Part V Psychoacoustics andMusic
Figure 24.2The two 100 Hz traces shown here have thesame power spectrum. They differ in thephase choices, !k, in equation 24.2 in the 15partials that are present. When played, theysound the same or nearly the same, suppor-ting the Ohm-Helmholtz phase law. How-ever, if you play them back at 1/4 speed(25 Hz), they sound significantly different.
0.005 0.010 0.015Time (seconds)
Ampl
itude
Rationale for Insensitivity to Relative Phase of Harmonic Partials
There is more than one rationale for our phase insensitivity to harmonicpartials in a tone. Even in musical sounds, relative phases of the partialscan vary naturally over time. Real strings are an example, where the higherharmonics are not quite exact multiples of the fundamental—for example,the second partial of a string might be 401Hz if the first partial is 200Hz.The fact that the second partial is one Hz away from being perfectlyharmonic means that the relative phase of the second partial is going fullcircle through 2" once per second:
sin(2"200t) + sin(2"401t) = sin(2"200t) + sin(2"400t + !(t)), (24.3)
where the phase !(t) = 2" t. If we were quite sensitive to phase, the pianowould sound very weird indeed. Certainly, however, the timbre of a piano isnot perfectly constant after a note is struck with the pedal down. Some of itsshimmering qualities may be due to slight changes of timbre due to phasedrifts, although interaction of string and soundboard is also important.
The second rationale for our insensitivity to phase is that we need to hearmore or less the same thing when in similar locations, as in two differentseats in a concert hall. Two listeners sitting in different places relative tothe sound sources can experience a marked shift in the relative phase of thepartials they are hearing. However, they also experience different strengthof the partials, due to reflections from walls and the ceiling that enhancecertain frequencies at the expense of others, which we saw in connectionwith the repetition pitch effect (see section 23.17 and figure 27.17).
To simplify things, we go outdoors to eliminate most reflections. Sup-pose one singer is producing a pure partial at 100Hz, and another severalmeters away is generating a pure partial a fifth above, at 150Hz. Twolisteners at different locations receive the partials with altered phases sincethe time delays are different. (The phase shift due to a difference d isdistance is 2"d/#, where # is the wavelength of the partial in question.)Figure 24.3 shows a numerical simulation of this situation, done in Ripple,resulting in a very different-looking sound trace for the two listeners.

October 10, 2012 Time: 03:31pm chapter24.tex
Chapter 24 Timbre 483
Figure 24.3The sound waves emanating from two“singers,” each singing a different purelysinusoidal tone (one at 100 Hz, andanother at 150 Hz), are shown reachingtwo “listeners" some distance away.Because the listeners have differentdistances to the two singers, theyexperience a different relative phase ofthe 100 Hz and 150 Hz sine waves. Thelisteners receive different sound traces,but with very nearly the same powerspectrum. The Ohm-Helmholtz law saysthat the listeners will hear essentially thesame timbre.
Nonetheless, we expect them to hear essentially the same tone and timbre.We come to the conclusion that acute sensitivity to the relative phase ofpartials would not be a good thing. We would not want the two traces infigure 24.2 or 24.3 to sound as different as they look.
24.2Amplitude and Timbre Beats
The simplest form of beats are heard as undulations of amplitude (loud-ness) occurring between two sinusoidal partials if they differ by less thanabout 10Hz. As the difference increases, the sensation of beats eventuallygives way to a “fused” tone, which sounds “rough” when the frequencydifference goes above 15Hz. If we increase the frequency difference further,the fused tone remains rough but becomes discernible as two separatetones. Still further, the rough sensation finally becomes smooth. Thishappens when the two tones “get out of each other’s way” on the basilarmembrane: each pure tone affects a nonoverlapping critical band. (See sec-tion 26.1 for more details about these effects, which figure strongly in oursense of dissonance and therefore our choices of musical temperament.)
Two sinusoids combined, f (t) = sin(2" f1t) + sin(2" f2t), can also bewritten as
y(t)= sin(2" f1t)+ sin(2" f2t)=2 cos[2"( f1! f2)t/2] sin[2"( f1+ f2)t/2]
= 2 cos[2"$ f t/2] sin[2" f̄ t], (24.4)
using the identity sin v + sin u = 2 cos 12 (v ! u) sin 1
2 (v + u). The twosinusoids may be written as a product of two new sinusoids, one with theaverage frequency f̄ = ( f1+ f2)/2 and one with half the difference frequency$ f/2 = ( f1 ! f2)/2.
The reader is encouraged to add two sinusoids differing by a few Hz tohear the beats. They are also quite visible on a plot (see figure 24.4). All thisseems straightforward, but, in fact, subtleties abound when two sinusoidsare added, especially when it comes to what we hear and what we don’thear.
The case of adding 27Hz and 25Hz sinusoids is shown in figure 24.4.The GCD of these two frequencies is 1Hz, and this is indeed the true
Figure 24.4A 27 Hz sinusoid and a 25 Hz sinusoid areadded, and show beating at 2 Hz, butperiodicity at 1 Hz.
1 sec
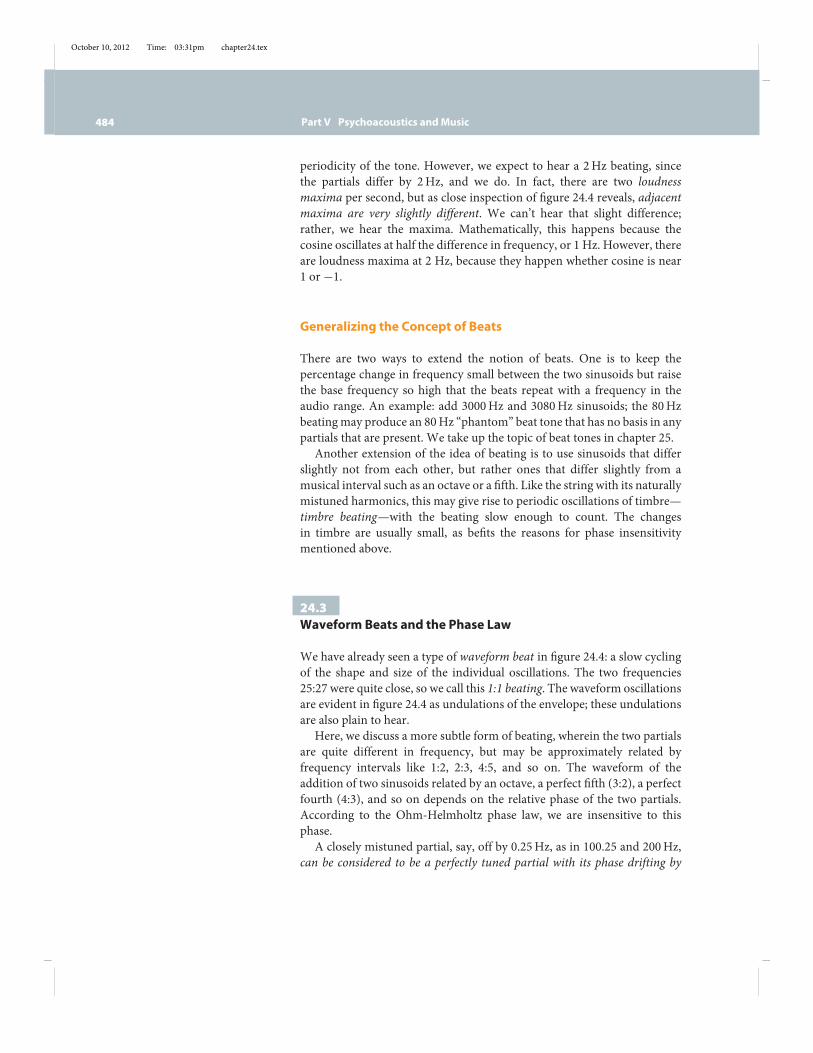
October 10, 2012 Time: 03:31pm chapter24.tex
484 Part V Psychoacoustics andMusic
periodicity of the tone. However, we expect to hear a 2Hz beating, sincethe partials differ by 2Hz, and we do. In fact, there are two loudnessmaxima per second, but as close inspection of figure 24.4 reveals, adjacentmaxima are very slightly different. We can’t hear that slight difference;rather, we hear the maxima. Mathematically, this happens because thecosine oscillates at half the difference in frequency, or 1 Hz. However, thereare loudness maxima at 2 Hz, because they happen whether cosine is near1 or !1.
Generalizing the Concept of Beats
There are two ways to extend the notion of beats. One is to keep thepercentage change in frequency small between the two sinusoids but raisethe base frequency so high that the beats repeat with a frequency in theaudio range. An example: add 3000Hz and 3080Hz sinusoids; the 80Hzbeatingmay produce an 80Hz “phantom” beat tone that has no basis in anypartials that are present. We take up the topic of beat tones in chapter 25.
Another extension of the idea of beating is to use sinusoids that differslightly not from each other, but rather ones that differ slightly from amusical interval such as an octave or a fifth. Like the string with its naturallymistuned harmonics, this may give rise to periodic oscillations of timbre—timbre beating—with the beating slow enough to count. The changesin timbre are usually small, as befits the reasons for phase insensitivitymentioned above.
24.3Waveform Beats and the Phase Law
We have already seen a type of waveform beat in figure 24.4: a slow cyclingof the shape and size of the individual oscillations. The two frequencies25:27 were quite close, so we call this 1:1 beating. The waveform oscillationsare evident in figure 24.4 as undulations of the envelope; these undulationsare also plain to hear.
Here, we discuss a more subtle form of beating, wherein the two partialsare quite different in frequency, but may be approximately related byfrequency intervals like 1:2, 2:3, 4:5, and so on. The waveform of theaddition of two sinusoids related by an octave, a perfect fifth (3:2), a perfectfourth (4:3), and so on depends on the relative phase of the two partials.According to the Ohm-Helmholtz phase law, we are insensitive to thisphase.
A closely mistuned partial, say, off by 0.25Hz, as in 100.25 and 200Hz,can be considered to be a perfectly tuned partial with its phase drifting by

October 10, 2012 Time: 03:31pm chapter24.tex
Chapter 24 Timbre 485
2" once every 4 seconds (see equation 24.3). Such a slow drift would allowthe listener to establish the timbre at all times, and if the timbre dependsslightly on the relative phase, the timbre should cycle through a changeonce per 4 seconds. This would be interpreted as a sensation of slow,weak beating, not so dramatic as loudness beating. In fact, beats are heardgoing through a complete cycle once every 2 seconds—see the following.This phenomenon has generated lengthy discussions as to its cause and aprodigious amount of experimentation. A plot of the waveform over someinterval (say, 10 seconds) reveals that it cycles through “shapes” at the samefrequency as the beats that are heard. This phenomenon has earned thenames waveform beats, beats of mistuned consonances, and quality beats.For example, 201Hz added to a 400Hz partial beats at 2Hz; a 200Hzplus a 401Hz partial beat at 1Hz. The reader should try this, using, forexample, MAX Partials. The beating is subtle but definitely present, even atlow volume. The beating may be more pronounced if the upper partial isless loud than the lower one.
We notice that both 201 + 400Hz and 200 + 401Hz differ fromperfection by 1Hz, but the waveform beating is different. The waveformshape is the way two sinusoids of different period are combining: Arecrests adding with crests, and the like? A key point is that a given crestin a plot of sin(ax + b) shifts at a rate inversely proportional to a as bchanges: $xc/$b = !1/a, where xc is the position of a crest. So, forexample, as the phase b = 2"$ f t advances in the term sin(2" f t+ 2" t)—($ f = 1)—it advances the sinusoidal peaks in proportion to 1/ f . This iswhy 200 + 401Hz has waveform beats half as often as 201 + 400Hz.
Some waveform beats are seen in figure 24.5. Although all four examplesare strictly periodic at exactly 1Hz, they regain shape at different frequen-cies, 1Hz for 100+201, 2Hz for 101+200, 2Hz for 200+301, and last 3Hzfor 201 + 300. The beating we hear makes perfect sense if we are slightlysensitive to the waveform.
We don’t need to use whole numbers. For example, beating at2.5342. . . Hz is heard for the combination 101.2671 . . .+200Hz. The actualwaveform may never exactly repeat, but the waveform shape beats repeatreliably at 2.5342. . . Hz.
Figure 24.6 shows some detail in a 1-second trace of the waveformsin(2" · 200t) + sin(2" · 301t); the shape changes in the waveform areclear. In spite of near-coincidences, the exact function (as opposed to itsoverall shape) does not repeat in less than 1 second. The two red tracesdiffer in time by 1/2 second and have the same shape, although they are notquite identical in detail. The red and black traces at the bottom are the sameshape except they are each other’s negative (one is upside-down comparedto the other). They are only a quarter-second apart. If they sounded thesame, the beating would be 4Hz, but instead it is 2Hz. Thus a waveformand its negative generally do not sound exactly the same, even though theydiffer only by an overall sign. The relative phases of the partials are the
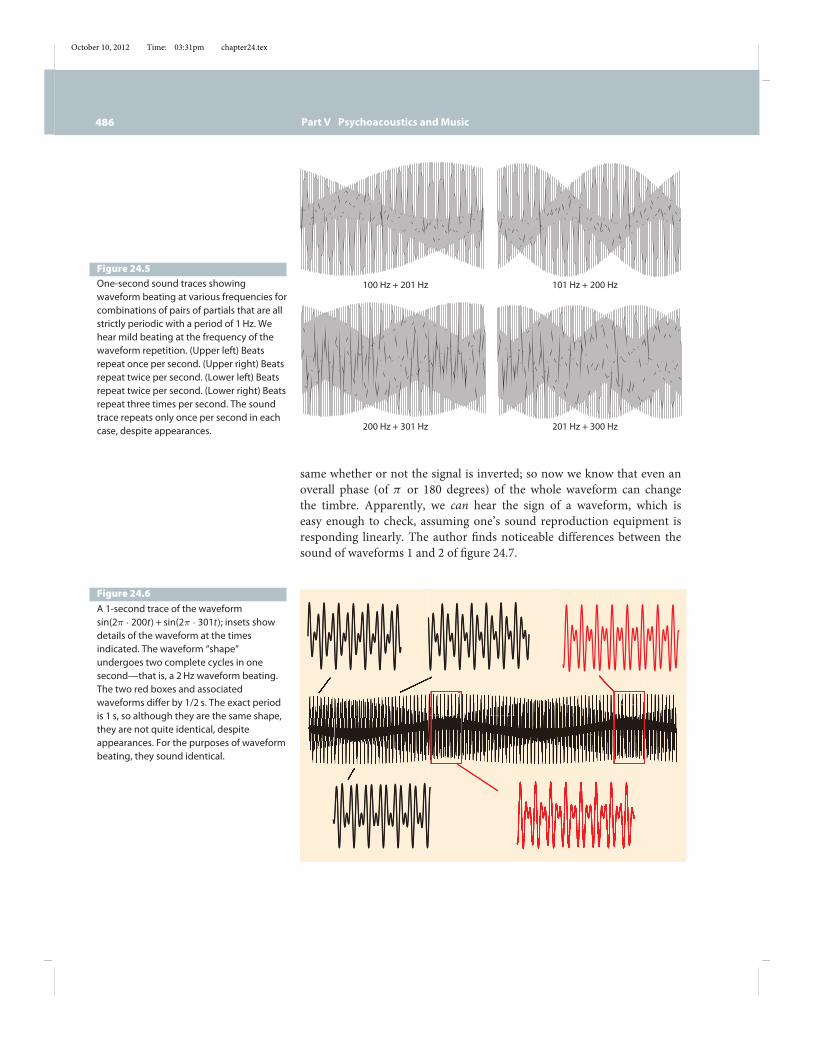
October 10, 2012 Time: 03:31pm chapter24.tex
486 Part V Psychoacoustics andMusic
Figure 24.5One-second sound traces showingwaveform beating at various frequencies forcombinations of pairs of partials that are allstrictly periodic with a period of 1 Hz. Wehear mild beating at the frequency of thewaveform repetition. (Upper left) Beatsrepeat once per second. (Upper right) Beatsrepeat twice per second. (Lower left) Beatsrepeat twice per second. (Lower right) Beatsrepeat three times per second. The soundtrace repeats only once per second in eachcase, despite appearances.
100 Hz + 201 Hz 101 Hz + 200 Hz
200 Hz + 301 Hz 201 Hz + 300 Hz
same whether or not the signal is inverted; so now we know that even anoverall phase (of " or 180 degrees) of the whole waveform can changethe timbre. Apparently, we can hear the sign of a waveform, which iseasy enough to check, assuming one’s sound reproduction equipment isresponding linearly. The author finds noticeable differences between thesound of waveforms 1 and 2 of figure 24.7.
Figure 24.6A 1-second trace of the waveformsin(2! · 200t)+ sin(2! · 301t); insets showdetails of the waveform at the timesindicated. The waveform “shape”undergoes two complete cycles in onesecond—that is, a 2 Hz waveform beating.The two red boxes and associatedwaveforms differ by 1/2 s. The exact periodis 1 s, so although they are the same shape,they are not quite identical, despiteappearances. For the purposes of waveformbeating, they sound identical.

October 10, 2012 Time: 03:31pm chapter24.tex
Chapter 24 Timbre 487
2
1
Figure 24.7The two waveforms 1 and 2 differ only inan overall sign. However, they soundsomewhat different—they have a slightlydifferent timbre.
Suppose a waveform is periodic but not symmetrical in time—that is, itlooks different if reversed (played backward), which corresponds to settingt to !t in the Fourier series. Both original and reversed waveforms havethe same spectral content and differ only in phases:
a1 cos(2" f t + !1) + a2 cos(4" f t + !2) + · · ·
" a1 cos(!2" f t + !1) + a2 cos(!4" f t + !2) + · · · (reversed)
= a1 cos(2" f t ! !1) + a2 cos(4" f t ! !2) + · · · , (24.5)
since cos(x) = cos(!x). Depending on the waveform, the sound and thereversed sound are also slightly different in timbre.
24.4The Perception of Waveform Beats
The waveform beating debate began with Johann Scheibler (1777–1837), asilk merchant in Crefeld, Germany, who did some early experiments withtuning forks in the 1830s. In 1881, one of the eminent acoustical researchersof that time, R.H.M. Bosanquet, in an article in the Journal of the RoyalMusical Association titled “On the Beats of Mistuned Consonances” said ofhis quest to find the source of the beating:
It is hard to believe that a question to which the answer is tolerablysimple could be so difficult. Yet it is very difficult; it is one of the mostdifficult things I ever tried to do.
Arguments and experiments continued with Ohm, Koenig, Helmholtz, andmany others. If humans cannot hear the phases at all (which, we havealready seen, is not the case), then some other explanation of waveformbeating is needed. The 2Hz beating sensation for the combination 101 +200Hz is consistent with a nonlinear aural harmonic of 2 # 101 = 202Hzgenerated by the ear itself, beating in the 1:1 way at 2Hz with the “real”200Hz partial. The plot thickens, however, when we try to explain the3Hz beats heard when 201Hz and 300Hz partials are present. The thirdharmonic of 201 and the second of 300 are 3Hz apart and could cause3Hz beats, but this is starting to feel like a nonlinear conspiracy theory.Remarkably, the beating is heard even if one partial is fed to the right earand the other to the left. This eliminates some types of physical nonlineareffects as responsible for the beating.
The waveform for adding 200 and 301Hz sinusoids is cycling twice persecond (see figure 24.5); 2Hz beating is heard. By very clever masking
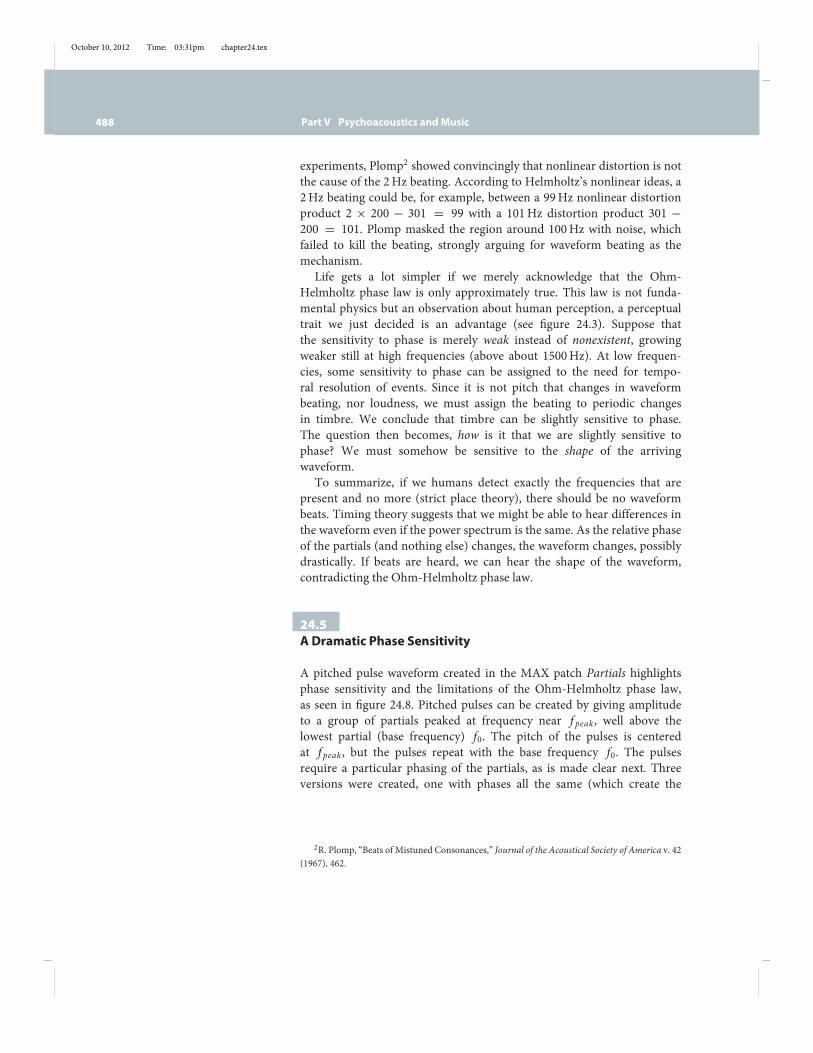
October 10, 2012 Time: 03:31pm chapter24.tex
488 Part V Psychoacoustics andMusic
experiments, Plomp2 showed convincingly that nonlinear distortion is notthe cause of the 2Hz beating. According to Helmholtz’s nonlinear ideas, a2Hz beating could be, for example, between a 99Hz nonlinear distortionproduct 2 # 200 ! 301 = 99 with a 101Hz distortion product 301 !200 = 101. Plomp masked the region around 100Hz with noise, whichfailed to kill the beating, strongly arguing for waveform beating as themechanism.
Life gets a lot simpler if we merely acknowledge that the Ohm-Helmholtz phase law is only approximately true. This law is not funda-mental physics but an observation about human perception, a perceptualtrait we just decided is an advantage (see figure 24.3). Suppose thatthe sensitivity to phase is merely weak instead of nonexistent, growingweaker still at high frequencies (above about 1500Hz). At low frequen-cies, some sensitivity to phase can be assigned to the need for tempo-ral resolution of events. Since it is not pitch that changes in waveformbeating, nor loudness, we must assign the beating to periodic changesin timbre. We conclude that timbre can be slightly sensitive to phase.The question then becomes, how is it that we are slightly sensitive tophase? We must somehow be sensitive to the shape of the arrivingwaveform.
To summarize, if we humans detect exactly the frequencies that arepresent and no more (strict place theory), there should be no waveformbeats. Timing theory suggests that we might be able to hear differences inthe waveform even if the power spectrum is the same. As the relative phaseof the partials (and nothing else) changes, the waveform changes, possiblydrastically. If beats are heard, we can hear the shape of the waveform,contradicting the Ohm-Helmholtz phase law.
24.5ADramatic Phase Sensitivity
A pitched pulse waveform created in the MAX patch Partials highlightsphase sensitivity and the limitations of the Ohm-Helmholtz phase law,as seen in figure 24.8. Pitched pulses can be created by giving amplitudeto a group of partials peaked at frequency near f peak , well above thelowest partial (base frequency) f0. The pitch of the pulses is centeredat f peak , but the pulses repeat with the base frequency f0. The pulsesrequire a particular phasing of the partials, as is made clear next. Threeversions were created, one with phases all the same (which create the
2R. Plomp, “Beats of Mistuned Consonances,” Journal of the Acoustical Society of America v. 42(1967), 462.
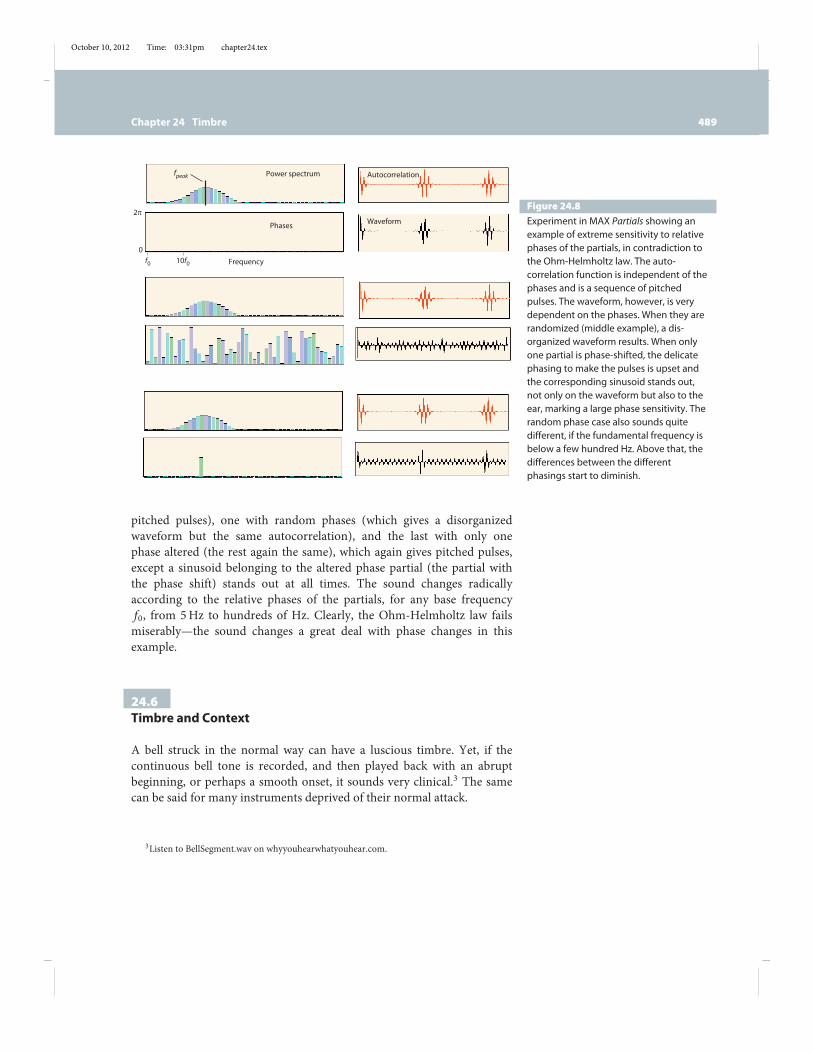
October 10, 2012 Time: 03:31pm chapter24.tex
Chapter 24 Timbre 489
Figure 24.8Experiment in MAX Partials showing anexample of extreme sensitivity to relativephases of the partials, in contradiction tothe Ohm-Helmholtz law. The auto-correlation function is independent of thephases and is a sequence of pitchedpulses. The waveform, however, is verydependent on the phases. When they arerandomized (middle example), a dis-organized waveform results. When onlyone partial is phase-shifted, the delicatephasing to make the pulses is upset andthe corresponding sinusoid stands out,not only on the waveform but also to theear, marking a large phase sensitivity. Therandom phase case also sounds quitedifferent, if the fundamental frequency isbelow a few hundred Hz. Above that, thedifferences between the differentphasings start to diminish.
Power spectrum Autocorrelation
WaveformPhases
0
2p
Frequency10f0
fpeak
f0
pitched pulses), one with random phases (which gives a disorganizedwaveform but the same autocorrelation), and the last with only onephase altered (the rest again the same), which again gives pitched pulses,except a sinusoid belonging to the altered phase partial (the partial withthe phase shift) stands out at all times. The sound changes radicallyaccording to the relative phases of the partials, for any base frequencyf0, from 5Hz to hundreds of Hz. Clearly, the Ohm-Helmholtz law failsmiserably—the sound changes a great deal with phase changes in thisexample.
24.6Timbre and Context
A bell struck in the normal way can have a luscious timbre. Yet, if thecontinuous bell tone is recorded, and then played back with an abruptbeginning, or perhaps a smooth onset, it sounds very clinical.3 The samecan be said for many instruments deprived of their normal attack.
3Listen to BellSegment.wav on whyyouhearwhatyouhear.com.

October 10, 2012 Time: 03:31pm chapter24.tex
490 Part V Psychoacoustics andMusic
Box 24.1Helmholtz’s and Koenig’s Ingenious Tests of the Ohm-Helmholtz Phase Law
Ever the resourceful experimentalist,Rudolf Koenig set out to test sensi-tivity to the phase of the partials inperiodic tones. It might seem suffi-cient just to rotate different sets ofholes in a siren relative to each otherto change the phase, but this alsoaffects the amplitude, not just thephase, of any partials shared by thetwo tones. For example, a circle of 20holes and a circle of 30 holes create a200Hz and a 300Hz tone if the diskrotates at 10 revolutions per second.The two tones, which are a perfectfifth apart, both have amplitude in a600Hz partial. If both partials had thesame amplitude and phase, theamplitude of the sum would be twicethat of each of its components. But a180-degree phase change of one ofthem would change the sign, cancel-ing the amplitude of the 600Hzpartial. Since a change of phase of oneof the notes changes the amplitude ofthe 600Hz partial, the timbre willchange, since it depends on therelative intensity of the partials.Helmholtz’s circumvention of this
problem led him to invent the doublesiren (figure 24.9). This ingeniousdevice consisted of two independentsirens strongly coupled to tunableHelmholtz resonators. The reso-nators were supposed to filter out allthe harmonics of the siren but oneeach, selected by adjusting the air
volume of the brass chamber. Therelative phase was adjustable bychanging the timing of the puffs ofair. The two siren disks rotated on acommon shaft, guaranteeing that thefrequencies produced by the twosirens would be locked into simpleinteger ratios depending only on thenumber of holes being played in agiven disk. The objection to this setupis that the filtering would not havebeen perfect, and weak harmonicscould reinforce and cancel as desc-ribed earlier, causing unintendedsubtle alterations in timbre andloudness.
Realizing this, Koenig invented hiswavetable synthesismethod, or wavesiren. A slit of air emerging from apressure source strikes a proximaterotating metal band of variableheight. The air escapes in proportionto the height of the unobstructedportion of the slit (figure 24.10). Theshape of the bands were painstakinglycomputed and cut, using a photo-graphic process to reduce a largemockup of the curve to the rightsize for the template. However,the vagaries of real airflow aroundsuch obstacles may have caused farmore deviation from a pure phaseeffect than any error in the curves.
He used this apparatus to success-fully investigate phantom beat tones,discussed later, but it was not clear
that the method of blowing air acrosscut metal bands as in figure 24.10produces tones with partials exactlyof the same amplitude from one set ofphases to the next.These difficulties led Koenig to
construct a real masterpiece, in whichhe simplified the waves to a sinus-oidal shape, and returned to rotating
Figure 24.9Helmholtz’s double siren (constructedby Koenig), invented to test senistivity ofour hearing to the relative phase of thepartials. Each siren drives its ownHelmholtz resonator, with a controllablephase.
Perhaps the most dramatic demonstration of context on timbre isto play a note backwards. A piano works especially well. As Mur-ray Campbell and Clive Greated state in their book, The Musician’sGuide to Acoustics, if a piano is played backward the “instrument istransformed into a leaky old harmonium, although only the orderof presentation of the sound has changed.” Indeed, the timbre as
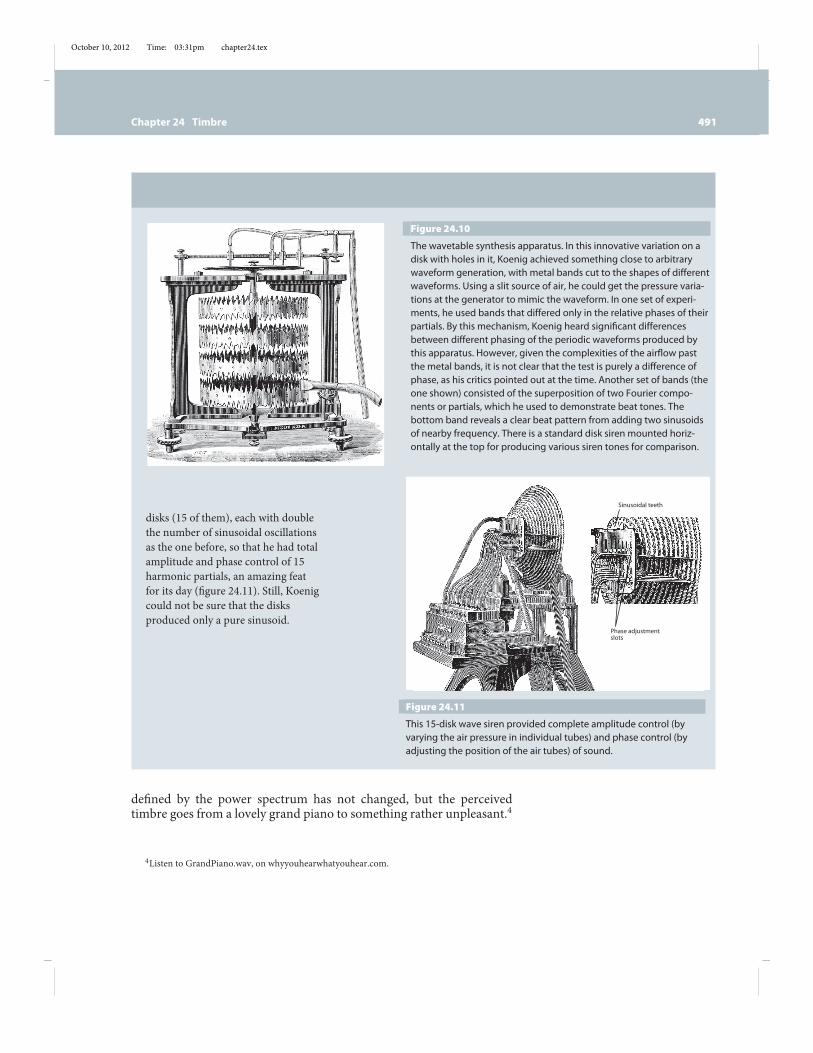
October 10, 2012 Time: 03:31pm chapter24.tex
Chapter 24 Timbre 491
Figure 24.10The wavetable synthesis apparatus. In this innovative variation on adisk with holes in it, Koenig achieved something close to arbitrarywaveform generation, with metal bands cut to the shapes of differentwaveforms. Using a slit source of air, he could get the pressure varia-tions at the generator to mimic the waveform. In one set of experi-ments, he used bands that differed only in the relative phases of theirpartials. By this mechanism, Koenig heard significant differencesbetween different phasing of the periodic waveforms produced bythis apparatus. However, given the complexities of the airflow pastthe metal bands, it is not clear that the test is purely a difference ofphase, as his critics pointed out at the time. Another set of bands (theone shown) consisted of the superposition of two Fourier compo-nents or partials, which he used to demonstrate beat tones. Thebottom band reveals a clear beat pattern from adding two sinusoidsof nearby frequency. There is a standard disk siren mounted horiz-ontally at the top for producing various siren tones for comparison.
disks (15 of them), each with doublethe number of sinusoidal oscillationsas the one before, so that he had totalamplitude and phase control of 15harmonic partials, an amazing featfor its day (figure 24.11). Still, Koenigcould not be sure that the disksproduced only a pure sinusoid.
Sinusoidal teeth
Phase adjustmentslots
Figure 24.11This 15-disk wave siren provided complete amplitude control (byvarying the air pressure in individual tubes) and phase control (byadjusting the position of the air tubes) of sound.
defined by the power spectrum has not changed, but the perceivedtimbre goes from a lovely grand piano to something rather unpleasant.4
4Listen to GrandPiano.wav, on whyyouhearwhatyouhear.com.

October 10, 2012 Time: 03:31pm chapter24.tex
492 Part V Psychoacoustics andMusic
Sound that ramps up and suddenly ends can be turned into pulsesthat start abruptly and decay slowly, just by reversing them. Thisdoes not affect their spectral content, but they leave a very differentimpression. This is an easy experiment to try on your computer.
24.2Timbre, Loudness, and ShockWaves
Universally, when wind instruments (including the voice) are drivenharder, the strength of the higher harmonics grow relative to the lowerharmonics. The sound becomes more brilliant, or perhaps developstoo many high harmonics and begins to sound raspy, according tothe effects of autodissonance and overlap of harmonics on the basilarmembrane. The vocal folds, for example, suffer more violent andabrupt opening and closings when driven at higher pressures, whichnecessarily generates stronger high harmonics.
An interesting phenomenon happens with both the trombone andthe trumpet, and possibly other wind instruments: the oscillating aircolumn vibrations arrange themselves into a shock wave under veryloud driving of the instrument; this has been captured using schlierenphotography. The shock wave certainly requires the presence of highharmonics. Perhaps most surprising, however, is that a sharp shockfront implies a precise phasing of the harmonics of the air column, inanalogy to the Helmholtz wave on a violin string.
How indeed are the relative phases of the harmonics determinedunder any playing conditions? Certainly they are not random, since thevocal folds (or lips, in the case of a trumpet, for example) are openin pulses, and the pressure due to a given partial should be high inthe mouthpiece at the moment of the pulse to resonantly enhance thatpartial. This suggests a more pulsed waveform than a random choiceof phases is likely to produce. It appears that further investigation ofthe relative phases in wind instruments, as a function of the player,instrument, lipping up or down, and so on would be very rewarding.

October 11, 2012 Time: 12:18pm chapter25.tex
Phantom TonesReality is merely an illusion, although a very persistent one.
—Albert Einstein
In this chapter, we discuss perceptions of tones that simply are physicallynot present in the sound arriving at out ears. Certainly, we see things thataren’t there, and many good visual illusions are widely known. Auditoryillusions are much less well known, but we try to partially remedy thathere.
25.1Lies and Illusions
Illusions are of two types: (1) those with a direct purpose, which we liketo call “lying in order to tell the truth,” and (2) just plain weird and“unexpected” side effects of our sensory apparatus and algorithms.
An example of the first type from the visual world is two squares on animage of a chessboard that look like they are very different shades of gray(A and B in figure 25.1), when they are in fact physically the same shadeof gray on the printed page.1 This example falls under “lying to tell thetruth,” since it is very likely that the chessboard would have been uniformunder uniform illumination, and our brains know that the shadow of thecylinder should cause only an apparent, not a real darkening of the shadedregion. This is how the image is presented to our consciousness, which is alie because the areas that appear to be much darker in shade are not.
A very clear audio illusion with a definite purpose involves estimatingthe direction of a sound source. A sudden pulse of sound from the right willarrive at the right ear first. We use such arrival time delays to help decode
1The image is also found on whyyouhearwhayyouhear.com. Copy it to your screen andexperiment with it—for example, cut and paste the two regions in question onto a blank field.
Figure 25.1A visual example of our sensory system andthe brain lying to us in order to tell thetruth. The two squares of the chessboard,labeled A and B, are of exactly equal grayvalue. Courtesy Edward Adelson, MIT.
493

October 11, 2012 Time: 12:18pm chapter25.tex
494 Part V Psychoacoustics andMusic
Figure 25.2The sound field near a model head at three different frequencies, 220 Hz (left), 600 Hz(middle), and 1400 Hz (right). The incident sound is a plane wave coming from above.Note that the sound intensity is about the same on the side of the head facing the sourceas it is on the side facing away at 220 and 600 Hz, but it starts to diminish on the far sideas the wavelength approaches the size of the head. So, for low to midrange frequencies,the sound is nearly equally loud on either side of the head, but there is a crucial timedelay, so that both ears are not receiving the same signal at the same time. Theimpression that the sound is much louder in one ear than the other is a necessaryillusion, designed to quickly reveal the direction of the source of the sound.
where the source is, as mentioned in section 21.2. A click from the right sideof the head is heard only in the right ear, yet the sound is almost exactlyas loud in the left ear after it has diffracted around the head! Our brainsuppresses the sound on the left, which is a lie with a purpose: to convey,without delay, the impression that the source of sound is to the right. Howelse would this information be presented to us so that the conclusion isinstantaneously obvious?
The diffraction of sound around small objects can be simulated inRipple. Draw a mock head receiving sound from one side, as shown infigure 25.2; make sure that the Fixed Edges option is unchecked. With twoprobes and a source, show to your satisfaction that (1) the sound is almostas loud at the “far” ear if the wavelength is long enough, and (2) the phaseof the arriving sound differs compared to the “near” ear.
This illusion is easy to quantify using earbuds and sound generationsoftware. Use your laptop to generate or record a sharp click in monauralsound. Copy it over to a second stereo channel, and then time-delay theplayback in the right ear by various amounts. You can do this by usingthe Generate Silence option in one channel after copying the click over.Using earphones, try time delays of a quarter of a millisecond up to a fewmilliseconds. For delays of about 0.66 millisecond, which is the time delayfor sound to cross the distance spanned by a human head (the so-calledinteraural time difference), you will perceive that the sound is coming fromthe side with the first arrival of the sound. but more than that, even thoughyou know the intensity of the sound is the same in both ears, it will soundmuch louder in the ear with the first arrival. (High frequencies are more
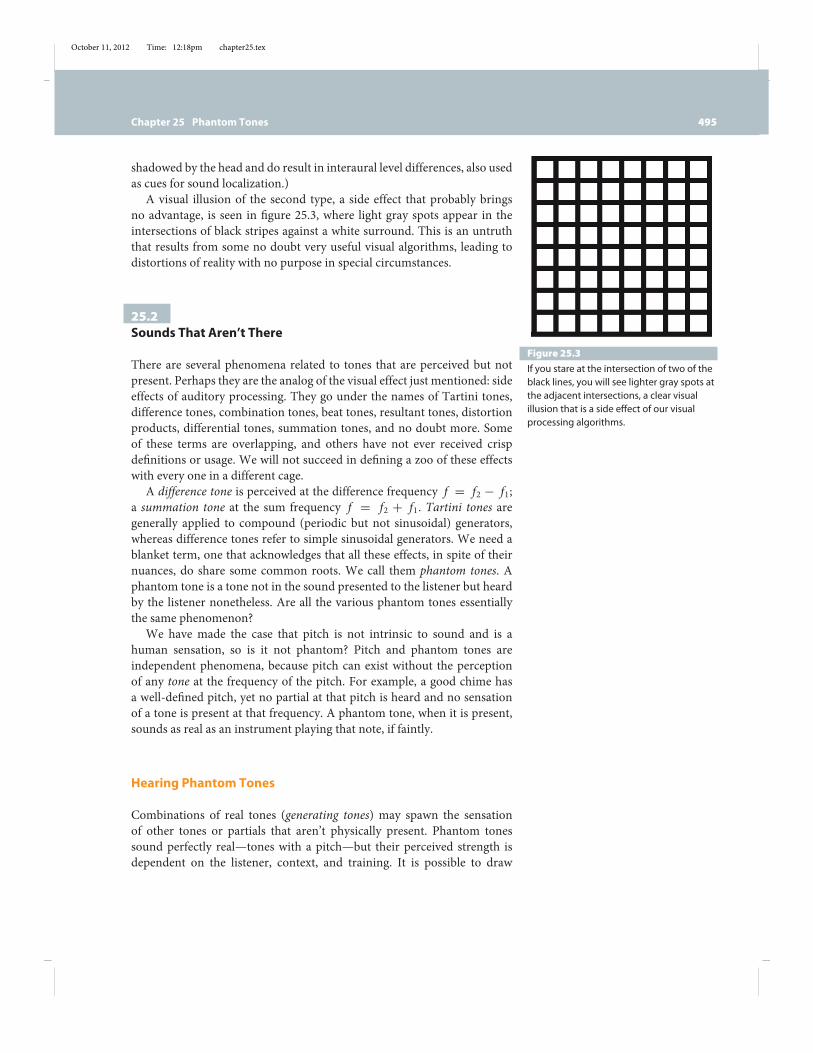
October 11, 2012 Time: 12:18pm chapter25.tex
Chapter 25 Phantom Tones 495
Figure 25.3If you stare at the intersection of two of theblack lines, you will see lighter gray spots atthe adjacent intersections, a clear visualillusion that is a side effect of our visualprocessing algorithms.
shadowed by the head and do result in interaural level differences, also usedas cues for sound localization.)
A visual illusion of the second type, a side effect that probably bringsno advantage, is seen in figure 25.3, where light gray spots appear in theintersections of black stripes against a white surround. This is an untruththat results from some no doubt very useful visual algorithms, leading todistortions of reality with no purpose in special circumstances.
25.2Sounds That Aren’t There
There are several phenomena related to tones that are perceived but notpresent. Perhaps they are the analog of the visual effect just mentioned: sideeffects of auditory processing. They go under the names of Tartini tones,difference tones, combination tones, beat tones, resultant tones, distortionproducts, differential tones, summation tones, and no doubt more. Someof these terms are overlapping, and others have not ever received crispdefinitions or usage. We will not succeed in defining a zoo of these effectswith every one in a different cage.
A difference tone is perceived at the difference frequency f = f2 ! f1;a summation tone at the sum frequency f = f2 + f1. Tartini tones aregenerally applied to compound (periodic but not sinusoidal) generators,whereas difference tones refer to simple sinusoidal generators. We need ablanket term, one that acknowledges that all these effects, in spite of theirnuances, do share some common roots. We call them phantom tones. Aphantom tone is a tone not in the sound presented to the listener but heardby the listener nonetheless. Are all the various phantom tones essentiallythe same phenomenon?
We have made the case that pitch is not intrinsic to sound and is ahuman sensation, so is it not phantom? Pitch and phantom tones areindependent phenomena, because pitch can exist without the perceptionof any tone at the frequency of the pitch. For example, a good chime hasa well-defined pitch, yet no partial at that pitch is heard and no sensationof a tone is present at that frequency. A phantom tone, when it is present,sounds as real as an instrument playing that note, if faintly.
Hearing Phantom Tones
Combinations of real tones (generating tones) may spawn the sensationof other tones or partials that aren’t physically present. Phantom tonessound perfectly real—tones with a pitch—but their perceived strength isdependent on the listener, context, and training. It is possible to draw
October 11, 2012 Time: 12:18pm chapter25.tex
496 Part V Psychoacoustics andMusic
attention to phantom tones by causing them to change pitch, which canbe done by varying the pitch of the generating tones. Sometimes alternatelyremoving and restoring a generating tone brings out a phantom tone. Thesetechniques are analogous to the trick used to make partials stand out—bothcause us to switch from synthetic to analytic listening. Practice makes itpossible to make the switch without such coaxing.
What relation does the frequency of a phantom tone bear to the gen-erating tones? What is the connection between fast beating and phantomtones?
A way to discover new phantom tones is to use two pure sinusoidal par-tials as the generating tones, and then listen for tones at other frequencies.Some sine tone generating software allows slowly ramping up one partial infrequency, while keeping another fixed. This can be done using the cursorcontrol to ramp a partial up or down in frequency in MAX Partials. Somepeople seem to have difficulty recognizing phantom tones, possibly becausethey have more accurate hearing or are less capable of analytic listening—it is difficult to tell which. There is growing evidence for a considerablevariability in sound processing in the brain from person to person. Adramatic example of this is Deutsch’s audio illusion, discussed in section25.21, which different people hear radically differently. For this reason,there may be no fixed set of answers to the question of what phantom tonesare heard under a given set of circumstances.
A key question is whether the phantom tones grow louder in proportionto the generator loudness, or if they respond more dramatically, suggestingnonlinear effects. You can check this on yourself once you find goodexamples; specific cases to try of frequencies f1 and f2 are given in thefollowing.
25.3How andWhere Do Phantom Tones Arise?
The debate on the cause of timbre beating is recapitulated in the debate onthe causes of phantom tones.
Mechanical Causes
Camps divide according to what part of the auditory chain is responsiblefor phantom tones. Place theorymaintains that the required partials, absentin the incident sound, are created by the mechanics of the ear, so thatthe missing vibrations are actually real by the time they are detected bythe neural system. This is quite possible on general nonlinear mechanicalprinciples. The presence of two frequencies may in fact generate a third
October 11, 2012 Time: 12:18pm chapter25.tex
Chapter 25 Phantom Tones 497
frequency or even several new frequencies, which could be a difference ofthe two, sum of the two, twice one minus the other, and so on.
Helmholtz was attracted to the idea of nonlinear sound generation inthe ear. His thinking was that if we are frequency analyzers, we cannothear a particular frequency or a tone unless it is physically present. Facedwith the absence of the first partial in some complex musical tones—theresidue pitch effect—Helmholtz felt compelled to restore the lowest partial,to require its physical presence, by saying that it was produced by nonlineareffects based on the presence of the higher partials. This idea is flawed, sincethe residue pitch is not actually accompanied by the ability to hear out asinusoidal partial at the frequency of the pitch. In other words, Helmholtz’sphantom partial is not even perceptually present. He was quite sloppyabout the distinction between tone, pitch, and partial, using the wordsinterchangeably, when more precision of language was called for. Histranslator complained bitterly about this, as we remarked in section 23.9.
Perhaps his mind was clouded by the beauty of the nonlinear idea—ifonly it were true! It fits a very pretty physical phenomenon that is nearlyuniversal for physical systems that vibrate: nonlinear generation of har-monics and combination tones. Due to this effect, a vibrating system canbe driven at one frequency and generate other frequencies spontaneously.If the vibrational amplitude is large enough, new frequencies are generatedthat are combinations and differences of multiples of the frequencies thatwere originally present. Thus, if we force a nonlinear system with sinu-soidal frequencies f1 and f2, we might see, for example, a new sinusoidalfrequency f = f2 ! f1 generated as a response. In Helmholtz’s day,this notion was new, and it must have been tempting to appeal to thismechanism in the face of the apparent dominance of the fundamental. Itassigns the perception of pitch at a missing fundamental frequency to aphysical property of the ear, amenable to analysis in terms of relativelysimple nonlinear oscillations. Still, it is surprising that Helmholtz took thisphysical, causative path to explaining pitch, since he was comfortable withpsychophysical phenomena. He had already spent much time juggling suchissues in connection with color vision and sight.
Neural Causes and the Auditory Cortex
Timing theory supposes that phantom tone generation lies further up theneural chain: the nervous system can create, either deliberately or as a sideeffect of its algorithms, the sensation of tones that reveal repetitious eventsin the sound, present even if the corresponding partials of the same periodare absent.
The auditory cortex stands between the ear and the seat of conscious-ness. It is divided into three parts with different function. The tertiary
October 11, 2012 Time: 12:18pm chapter25.tex
498 Part V Psychoacoustics andMusic
cortex apparently synthesizes the aural experience before sending it on,and the secondary cortex apparently processes harmonic, melodic, andrhythmic patterns. The primary cortex extracts pitch and loudness data,and is tonotopically organized (different frequency zones in physicallydifferent places). Brain scans show that the primary cortex is not involvedwhen imagining music, but it is active when schizophrenics have auditoryhallucinations.
Hallucinations
Hallucinations, either visual or auditory, can be indistinguishable fromreality. One of the maladies that Oliver Sacks recounts in his fascinatingbook Musicophilia can be distracting to the point of despair: people quitesuddenly hear music that isn’t there, and it doesn’t tend to go away. Thesensation is nothing like the tune you can’t get out of your head. The musicsounds completely real. The genre of the music heard is often not a matchyou would imagine for the patient, who may or may not be musicallyinclined. If, for whatever reason and through whatever mechanism, theauditory cortex decides to create and send phony data, there is apparentlyno way for our conscious minds to tell it is not real.
What has this anomaly got to do with pitch perception or phantomtones? The point is that if the auditory cortex can send symphonies thataren’t there, why couldn’t it more routinely send us the sensation of a “real”tone, which might sound like a single partial or perhaps a complex tone,andwhich isn’t physically present but still represents some aspect of the realsound being processed? Sending such a sensation might serve a purpose orit might be a side effect of complex processing algorithms.
Otoacoustic Emissions
It is known that the ear emits sounds as well as receives them. Signals fromthe nervous system are sent to the cochlea, causing hair cells to contract andrelax at audio frequencies, resulting in sound emission from the ear. (Theseotoacoustic emissions were discussed in section 21.4.) The relevance forthe present discussion is that otoacoustic combination tones (called upperbeat tones by Koenig, Zahm, and others) of the form f = 2 f2 ! f1 arequite discernible by the sensitive microphones used to detect otoacousticemissions. Thus the combination tones are “really there" in a physical sensewithin the ear, but it is still not completely clear how they get produced, orwhether these signals are the ones we hear, and where in the neurologicalchain the signals originate.
Helmholtz was wrong about hair cells being little high-Q resonators ontheir own, but neural feedback effectively makes them capable of sharpfrequency resolution anyway. It seems likely that Helmholtz was also wrongabout the importance of mechanical nonlinear effects, but this too may berescued by nonlinear neural feedback—that is, otoacoustic emissions.
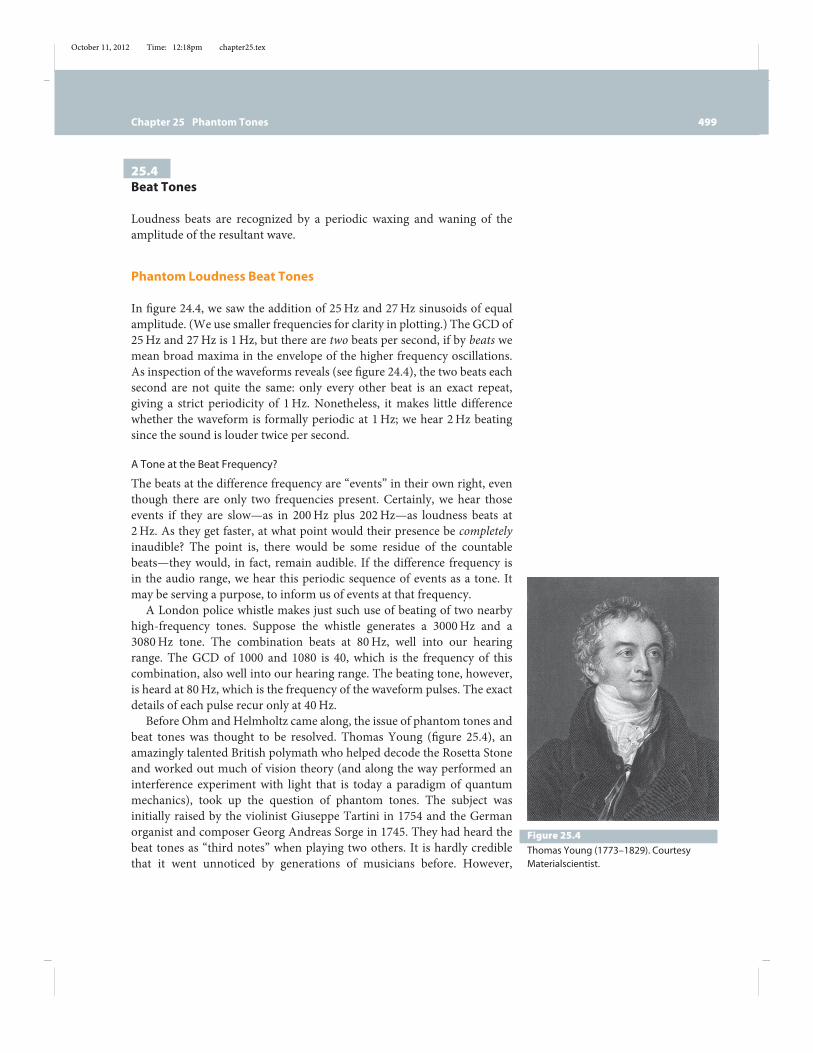
October 11, 2012 Time: 12:18pm chapter25.tex
Chapter 25 Phantom Tones 499
25.4Beat Tones
Loudness beats are recognized by a periodic waxing and waning of theamplitude of the resultant wave.
Phantom Loudness Beat Tones
In figure 24.4, we saw the addition of 25Hz and 27Hz sinusoids of equalamplitude. (We use smaller frequencies for clarity in plotting.) The GCD of25Hz and 27Hz is 1Hz, but there are two beats per second, if by beats wemean broad maxima in the envelope of the higher frequency oscillations.As inspection of the waveforms reveals (see figure 24.4), the two beats eachsecond are not quite the same: only every other beat is an exact repeat,giving a strict periodicity of 1Hz. Nonetheless, it makes little differencewhether the waveform is formally periodic at 1Hz; we hear 2Hz beatingsince the sound is louder twice per second.
A Tone at the Beat Frequency?
The beats at the difference frequency are “events” in their own right, eventhough there are only two frequencies present. Certainly, we hear thoseevents if they are slow—as in 200Hz plus 202Hz—as loudness beats at2Hz. As they get faster, at what point would their presence be completelyinaudible? The point is, there would be some residue of the countablebeats—they would, in fact, remain audible. If the difference frequency isin the audio range, we hear this periodic sequence of events as a tone. Itmay be serving a purpose, to inform us of events at that frequency.
A London police whistle makes just such use of beating of two nearbyhigh-frequency tones. Suppose the whistle generates a 3000Hz and a3080Hz tone. The combination beats at 80Hz, well into our hearingrange. The GCD of 1000 and 1080 is 40, which is the frequency of thiscombination, also well into our hearing range. The beating tone, however,is heard at 80Hz, which is the frequency of the waveform pulses. The exactdetails of each pulse recur only at 40Hz.
Before Ohm and Helmholtz came along, the issue of phantom tones andbeat tones was thought to be resolved. Thomas Young (figure 25.4), anamazingly talented British polymath who helped decode the Rosetta Stoneand worked out much of vision theory (and along the way performed aninterference experiment with light that is today a paradigm of quantummechanics), took up the question of phantom tones. The subject wasinitially raised by the violinist Giuseppe Tartini in 1754 and the Germanorganist and composer Georg Andreas Sorge in 1745. They had heard thebeat tones as “third notes” when playing two others. It is hardly crediblethat it went unnoticed by generations of musicians before. However,
Figure 25.4Thomas Young (1773–1829). CourtesyMaterialscientist.
October 11, 2012 Time: 12:18pm chapter25.tex
500 Part V Psychoacoustics andMusic
phenomena are often not attributed to their first discoverer, but ratherto someone who described their significance most eloquently. Youngpromoted the commonly accepted explanation, until Ohm and Helmholtzquestioned it.
Young and also Joseph Lagrange first argued that beats are events—that is, loudness peaks owing to constructive interference maxima thatoccur repeatedly at the beat frequency. The ear is willing to assign a toneto this periodic succession of loudness undulations, despite the completeabsence of partials at the frequency of the beat tone. Young said: “Thegreater the difference in pitch of two sounds the more rapid the beats, tillat last, like the distinct puffs of air in the experiments already related theycommunicate the idea of a continued sound; and this is the fundamentalharmonic described by Tartini.”
Examples of Beat Tones
Even for just two sinusoids, there are all sorts of cases to consider. It isamazing how many mathematical ramifications there are surrounding thechoice of just two numbers. Is their ratio rational or irrational? Are anyinteger ratios, involving small integers, a good approximation to the ratioof the two? The answers to these questions affect what we hear.
For example, suppose f1 = 1000Hz, f2 = 800Hz. These beat at 200Hz,and perhaps therefore we will hear a 200Hz tone. But not so fast—200Hzis also the residue pitch. We should examine instead, say, 1042 and 842Hz.These are now inharmonic partials, but they differ by 200Hz. Indeed, a200Hz difference tone—a true phantom tone—is clearly heard, weakerthan the two generators but still quite distinct.
This sheds some light on residue pitch. Nothing drastic happens tothe perceived 200Hz tone in going continuously from 1042 and 842 asgenerators to 1000 and 800. This implies that any tone heard along withthe 200Hz pitch is an event tone—that is, a tone generated in our soundprocessing hardware and software to signify the occurrence of repetitiveevents (beats) at a frequency of 200Hz in either case.
A case is provided by intervals near 8:15, using frequencies such asf2 = 2048 and f1 = 3840Hz, giving the beat tone f = 2 f2 ! f1 of 256Hz,which indeed is heard. This is also just the frequency of the waveform beats.If f2 is raised by A Hz, the phantom tone increases by 2A Hz, as doesthe frequency of the waveform beating. If f1 is raised by A Hz, the toneis lowered by AHz, as is the frequency of the waveform beating. The readeris encouraged to try this, using, if possible, high-quality earbuds and goodtone generators. One may vary f1 by 200Hz in either direction and f isclearly heard, obeying f = 2 f2 ! f1.
Another interval, f2 = 2048 and f1 = 3072Hz (and analogousintervals), is remarkable in that, first, the difference tone f = f1 ! f2 =1024 and the combination tone f = 2 f2 ! f1 = 1024 are the same; thus
October 11, 2012 Time: 12:18pm chapter25.tex
Chapter 25 Phantom Tones 501
what Koenig termed the lower beat tone (the difference tone) and the upperbeat tone (the combination tone) coincide. This combination has loudnessbeats at 1024Hz. If the higher frequency f1 is raised by AHz, the differencetone should increase by A Hz, but the combination tone should decreaseby A Hz. Indeed, as f1 = 3072 is lowered by hand, as is possible in theMAX patch Partials, one hears both rising and falling phantom tones (arising combination tone and a falling difference tone) interfering with eachother, causing beats when they are still relatively close in frequency. Whenf1 = 3073Hz, there should be two beats per second, and that is what isheard. This is also the frequency of the waveform beats. If, on the other hand,the lower frequency is raised by AHz, the difference tone should decreaseby A Hz, but the combination tone should increase by 2A Hz, implying abeating of between them of 3AHz. That is heard also. Quite an instructiveexample!We are feeding our ears only two pure tones, both above 2000Hz,yet we are discussing the easily audible beating of two phantom tones, botharound 1000Hz!
25.5Nonlinear Harmonic Generation
The key to hearing interesting phantom tones is to make sure they donot already exist in the sound presented to the listener, owing to somequite common imperfections in the production of sound. In the old days,Helmholtz, Seebeck, Ohm, and especially Koenig went to extraordinarylengths to ensure that there were only pure sinusoids coming from tuningforks, sirens attached to resonators, and the like. Nonetheless, aspersionswere sometimes cast regarding the purity of a competing researcher’ssound sources. Today, professional-level recording and playback equip-ment may be employed to ensure the near absence of contaminatingfrequencies. Laptops and earbuds may not be free of such problems.
When a single vibration mode is present—that is, a single simpleoscillator such as a real (as opposed to an ideal) pendulum—an oscillatorforced sinusoidally at frequency f may generate other frequencies 2 f ,3 f . . . as well. This is called harmonic generation, but it may sound likeold news: don’t simple strings have harmonics? They do, but the situationis quite different. In a string, eachmode f , 2 f , . . . . is an oscillator in its ownright—a string has many different vibration modes. Also, in real strings thehigher modes will not be quite exactly integer multiples of the lowest modefrequency, so that the second partial of a string might be 401.3Hz if thefirst partial is 200Hz. If on the other hand a single mode is oscillating in aperiodic but not sinusoidal way, higher harmonics must be present and areexact multiples of the lowest frequency. An ideal pendulum or mass andspring oscillates sinusoidally, so just one frequency is present. Harmonicgeneration is associated with “nonlinear” vibration. We can get a feel for
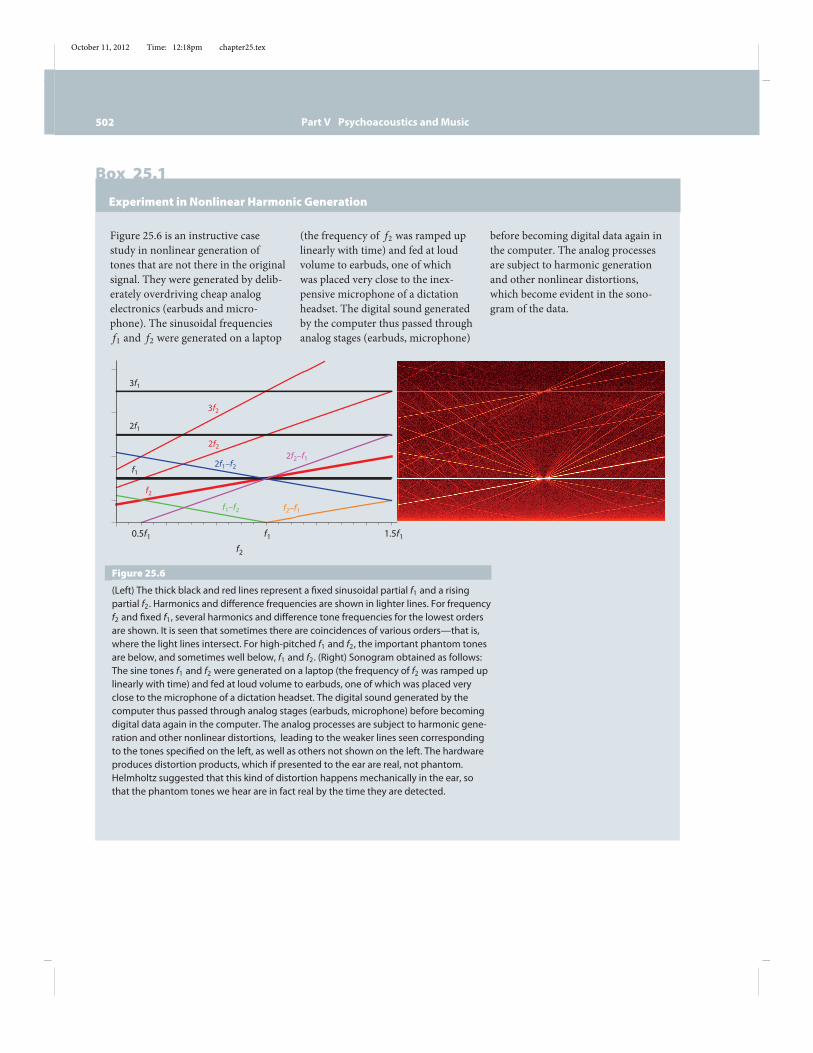
October 11, 2012 Time: 12:18pm chapter25.tex
502 Part V Psychoacoustics andMusic
Box 25.1Experiment in Nonlinear Harmonic Generation
Figure 25.6 is an instructive casestudy in nonlinear generation oftones that are not there in the originalsignal. They were generated by delib-erately overdriving cheap analogelectronics (earbuds and micro-phone). The sinusoidal frequenciesf1 and f2 were generated on a laptop
(the frequency of f2 was ramped uplinearly with time) and fed at loudvolume to earbuds, one of whichwas placed very close to the inex-pensive microphone of a dictationheadset. The digital sound generatedby the computer thus passed throughanalog stages (earbuds, microphone)
before becoming digital data again inthe computer. The analog processesare subject to harmonic generationand other nonlinear distortions,which become evident in the sono-gram of the data.
0.5f1 f1 1.5f1f2
3f1
2f1
f1
f2
2f2
3f2
2f1–f22f2–f1
f2–f1f1–f2
Figure 25.6(Left) The thick black and red lines represent a fixed sinusoidal partial f1 and a risingpartial f2. Harmonics and difference frequencies are shown in lighter lines. For frequencyf2 and fixed f1, several harmonics and difference tone frequencies for the lowest ordersare shown. It is seen that sometimes there are coincidences of various orders—that is,where the light lines intersect. For high-pitched f1 and f2, the important phantom tonesare below, and sometimes well below, f1 and f2. (Right) Sonogram obtained as follows:The sine tones f1 and f2 were generated on a laptop (the frequency of f2 was ramped uplinearly with time) and fed at loud volume to earbuds, one of which was placed veryclose to the microphone of a dictation headset. The digital sound generated by thecomputer thus passed through analog stages (earbuds, microphone) before becomingdigital data again in the computer. The analog processes are subject to harmonic gene-ration and other nonlinear distortions, leading to the weaker lines seen correspondingto the tones specified on the left, as well as others not shown on the left. The hardwareproduces distortion products, which if presented to the ear are real, not phantom.Helmholtz suggested that this kind of distortion happens mechanically in the ear, sothat the phantom tones we hear are in fact real by the time they are detected.
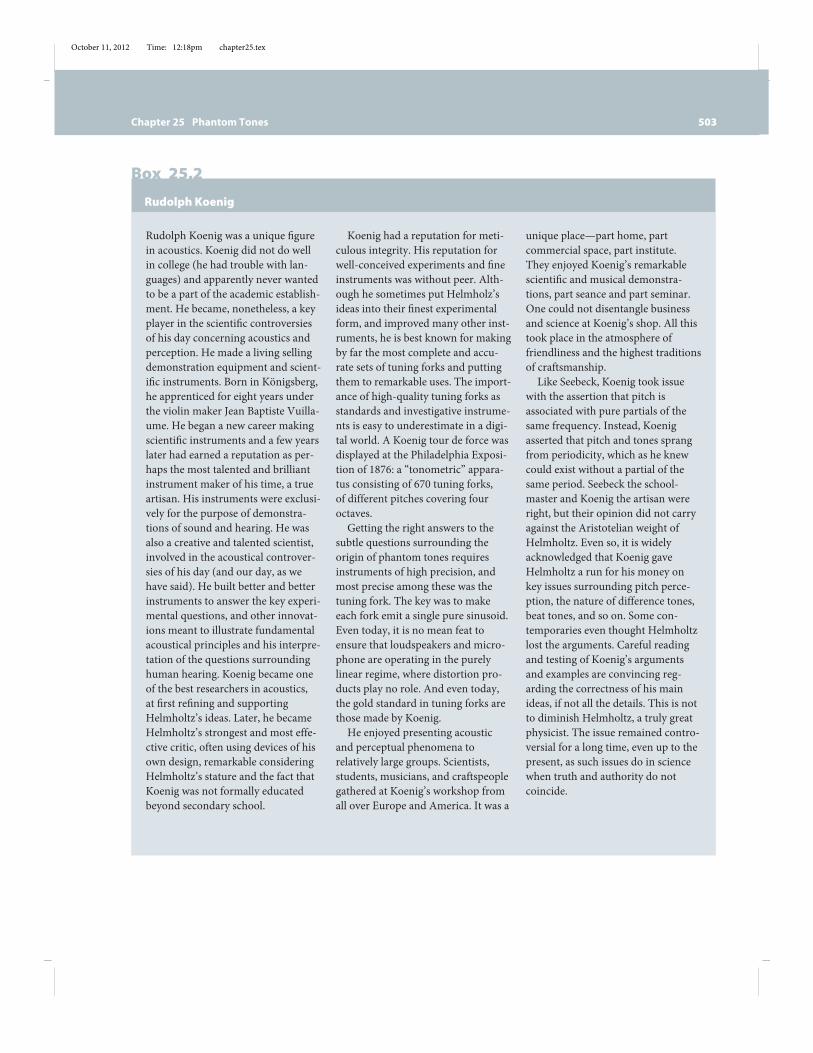
October 11, 2012 Time: 12:18pm chapter25.tex
Chapter 25 Phantom Tones 503
Box 25.2Rudolph Koenig
Rudolph Koenig was a unique figurein acoustics. Koenig did not do wellin college (he had trouble with lan-guages) and apparently never wantedto be a part of the academic establish-ment. He became, nonetheless, a keyplayer in the scientific controversiesof his day concerning acoustics andperception. He made a living sellingdemonstration equipment and scient-ific instruments. Born in Königsberg,he apprenticed for eight years underthe violin maker Jean Baptiste Vuilla-ume. He began a new career makingscientific instruments and a few yearslater had earned a reputation as per-haps the most talented and brilliantinstrument maker of his time, a trueartisan. His instruments were exclusi-vely for the purpose of demonstra-tions of sound and hearing. He wasalso a creative and talented scientist,involved in the acoustical controver-sies of his day (and our day, as wehave said). He built better and betterinstruments to answer the key experi-mental questions, and other innovat-ions meant to illustrate fundamentalacoustical principles and his interpre-tation of the questions surroundinghuman hearing. Koenig became oneof the best researchers in acoustics,at first refining and supportingHelmholtz’s ideas. Later, he becameHelmholtz’s strongest and most effe-ctive critic, often using devices of hisown design, remarkable consideringHelmholtz’s stature and the fact thatKoenig was not formally educatedbeyond secondary school.
Koenig had a reputation for meti-culous integrity. His reputation forwell-conceived experiments and fineinstruments was without peer. Alth-ough he sometimes put Helmholz’sideas into their finest experimentalform, and improved many other inst-ruments, he is best known for makingby far the most complete and accu-rate sets of tuning forks and puttingthem to remarkable uses. The import-ance of high-quality tuning forks asstandards and investigative instrume-nts is easy to underestimate in a digi-tal world. A Koenig tour de force wasdisplayed at the Philadelphia Exposi-tion of 1876: a “tonometric” appara-tus consisting of 670 tuning forks,of different pitches covering fouroctaves.Getting the right answers to the
subtle questions surrounding theorigin of phantom tones requiresinstruments of high precision, andmost precise among these was thetuning fork. The key was to makeeach fork emit a single pure sinusoid.Even today, it is no mean feat toensure that loudspeakers and micro-phone are operating in the purelylinear regime, where distortion pro-ducts play no role. And even today,the gold standard in tuning forks arethose made by Koenig.He enjoyed presenting acoustic
and perceptual phenomena torelatively large groups. Scientists,students, musicians, and craftspeoplegathered at Koenig’s workshop fromall over Europe and America. It was a
unique place—part home, partcommercial space, part institute.They enjoyed Koenig’s remarkablescientific and musical demonstra-tions, part seance and part seminar.One could not disentangle businessand science at Koenig’s shop. All thistook place in the atmosphere offriendliness and the highest traditionsof craftsmanship.
Like Seebeck, Koenig took issuewith the assertion that pitch isassociated with pure partials of thesame frequency. Instead, Koenigasserted that pitch and tones sprangfrom periodicity, which as he knewcould exist without a partial of thesame period. Seebeck the school-master and Koenig the artisan wereright, but their opinion did not carryagainst the Aristotelian weight ofHelmholtz. Even so, it is widelyacknowledged that Koenig gaveHelmholtz a run for his money onkey issues surrounding pitch perce-ption, the nature of difference tones,beat tones, and so on. Some con-temporaries even thought Helmholtzlost the arguments. Careful readingand testing of Koenig’s argumentsand examples are convincing reg-arding the correctness of his mainideas, if not all the details. This is notto diminish Helmholtz, a truly greatphysicist. The issue remained contro-versial for a long time, even up to thepresent, as such issues do in sciencewhen truth and authority do notcoincide.
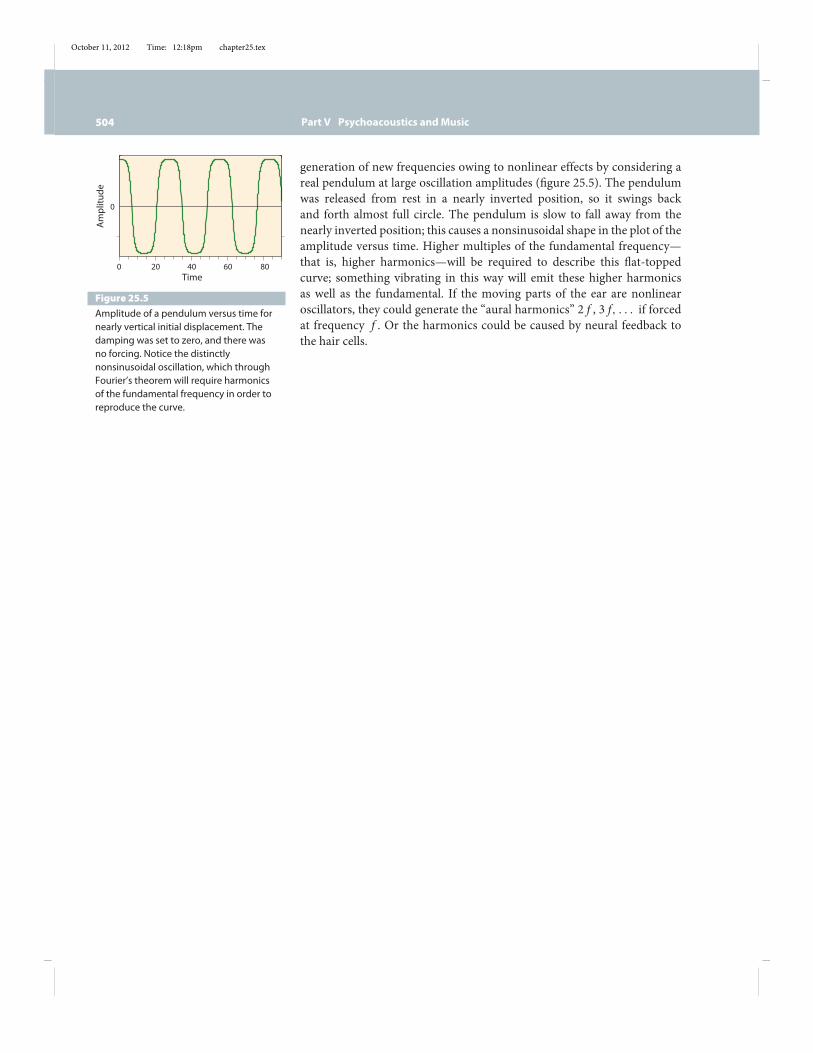
October 11, 2012 Time: 12:18pm chapter25.tex
504 Part V Psychoacoustics andMusic
0 20 40 60 80
0
Time
Ampl
itude
Figure 25.5Amplitude of a pendulum versus time fornearly vertical initial displacement. Thedamping was set to zero, and there wasno forcing. Notice the distinctlynonsinusoidal oscillation, which throughFourier’s theorem will require harmonicsof the fundamental frequency in order toreproduce the curve.
generation of new frequencies owing to nonlinear effects by considering areal pendulum at large oscillation amplitudes (figure 25.5). The pendulumwas released from rest in a nearly inverted position, so it swings backand forth almost full circle. The pendulum is slow to fall away from thenearly inverted position; this causes a nonsinusoidal shape in the plot of theamplitude versus time. Higher multiples of the fundamental frequency—that is, higher harmonics—will be required to describe this flat-toppedcurve; something vibrating in this way will emit these higher harmonicsas well as the fundamental. If the moving parts of the ear are nonlinearoscillators, they could generate the “aural harmonics” 2 f , 3 f, . . . if forcedat frequency f . Or the harmonics could be caused by neural feedback tothe hair cells.