
Transformational Investing - Understanding Sustainable Investing
Upload
khangminh22Category
view
1download
0

UNIT 2 |
Disclaimer1. The information in this free guide is provided for the purpose of education and intended to be of a factual and objective nature only. The University Network for Investing and Trading (“UNIT”) makes no recommendations or opinions about any particular financial product or class thereof.
2. UNIT has monitored the quality of the information provided in this guide. However, UNIT does not make any representations or warranty about the accuracy, reliability, currency or completeness of any material contained in this guide.
3. Whilst UNIT has made the effort to ensure the information in this guide was accurate and up-to-date at the time of the publication of this guide, you should exercise your own independent skill, judgement and research before relying on it. This guide is not a substitute for independent professional advice and you should obtain any appropriate professional advice relevant to your particular circumstances.
4. References to other organisations are provided for your convenience. UNIT makes no endorsements of those organisations or any other associated organisation, product or service.
5. In some cases, the information in this guide may incorporate or summarise views, standards or recommendations of third parties or comprise material contributed by third parties (“third party material”). Such third party material is assembled in good faith, but does not necessarily reflect the views of UNIT, or indicate a commitment to a particular course of action. UNIT makes no representations or warranties about the accuracy, reliability, currency or completeness of any third party material.
6. UNIT takes no responsibility for any loss resulting from any action taken or reliance made by you on any information in this guide (including, without limitation, third party material).
UNIT Chapters:
AcknowledgementsEditors in Chief: Sam Pham, Julie Zhu, Sharon Ho
Software: Adobe Indesign, Adobe Illustrator, Adobe Photoshop
© University Network for Investing & Trading 2018
This guide was printed with funding from the University of Sydney Business School.
Special Thanks: Careers and Employability Office
Designers: Mia Cresswell Leo ShuNicholas LeeWei WangXenia LopesKevin LuWinnie Zhang
Authors:Nicholas LeeJerry Li Roland Huang Wei WangXenia LopesJosh RizkAlick Song
| 3UNIT | 3UNIT
Table of Contents
1. IntroductionAbout Stock PitchingWhy Learn to Pitch a Stock?Investment Philosophy
567
2. Idea GenerationInvestable UniverseScreeningPreliminary ResearchFollowing Market News
9101213
3. Stock Pitch ComponentsPitch Overview Industry OverviewBusiness OverviewInvestment Thesis CatalystsValuation Investment Risks
15161820232528
4. Example Pitch: Ooh! Media (ASX:OML)Executive Summary Industry OverviewBusiness OverviewInvestment Thesis CatalystsValuation Investment Risks
31323436394042
5. Student OpportunitiesUSYD Student Managed Investment Fund
Australian Students Asset Management
44
45

UNIT 4 |
About Stock Pitching
| 5UNIT
Keep in mind what the purpose of a stock pitch is! Stock pitches aim to:
1 Inform the audience of the investment opportunity
2 Convince the audience to invest
Remember that a pitch is not just the presentation, but also includes the responses to the questions from potential investors.
It is essential that you can respond to any issues or problems which investors may take notice of in order to successfully sell your recommendation to them.
Failing to do so will result in an unconvincing pitch.
A stock pitch is essentially a summary of a potential investment idea into a stock. It should recommend a position which an investor should take in the stock and why.
The defining aspect of an effective stock pitch is extensive research into all aspects of the company. This research will be critical in justifying your argument as to which position a potential investor should take in the stock. While a stock pitch cannot practically cover every aspect of your company or its respective industry, it is nevertheless critical that you, the pitcher, know the company and its broader context inside out.
What is it?
Positions you can take to “grow” your portfolio
Top tips
This is the recommendation to neither buy nor sell the stock. Investors with an existing long position in the stock should not sell, while those without a holding
should not purchase the stock either.
Position 2: Hold
Position 1: ShortThis is a recommendation to sell the stock because the price is expected to fall. This can be done by borrowing
the stock from another investor.
Position 3: LongThis is a recommendation to buy the stock as its price is expected to increase in the future, generating
a profit for the investor.
Que
stio
n tim
e
Purp
ose
v
Personal Investing
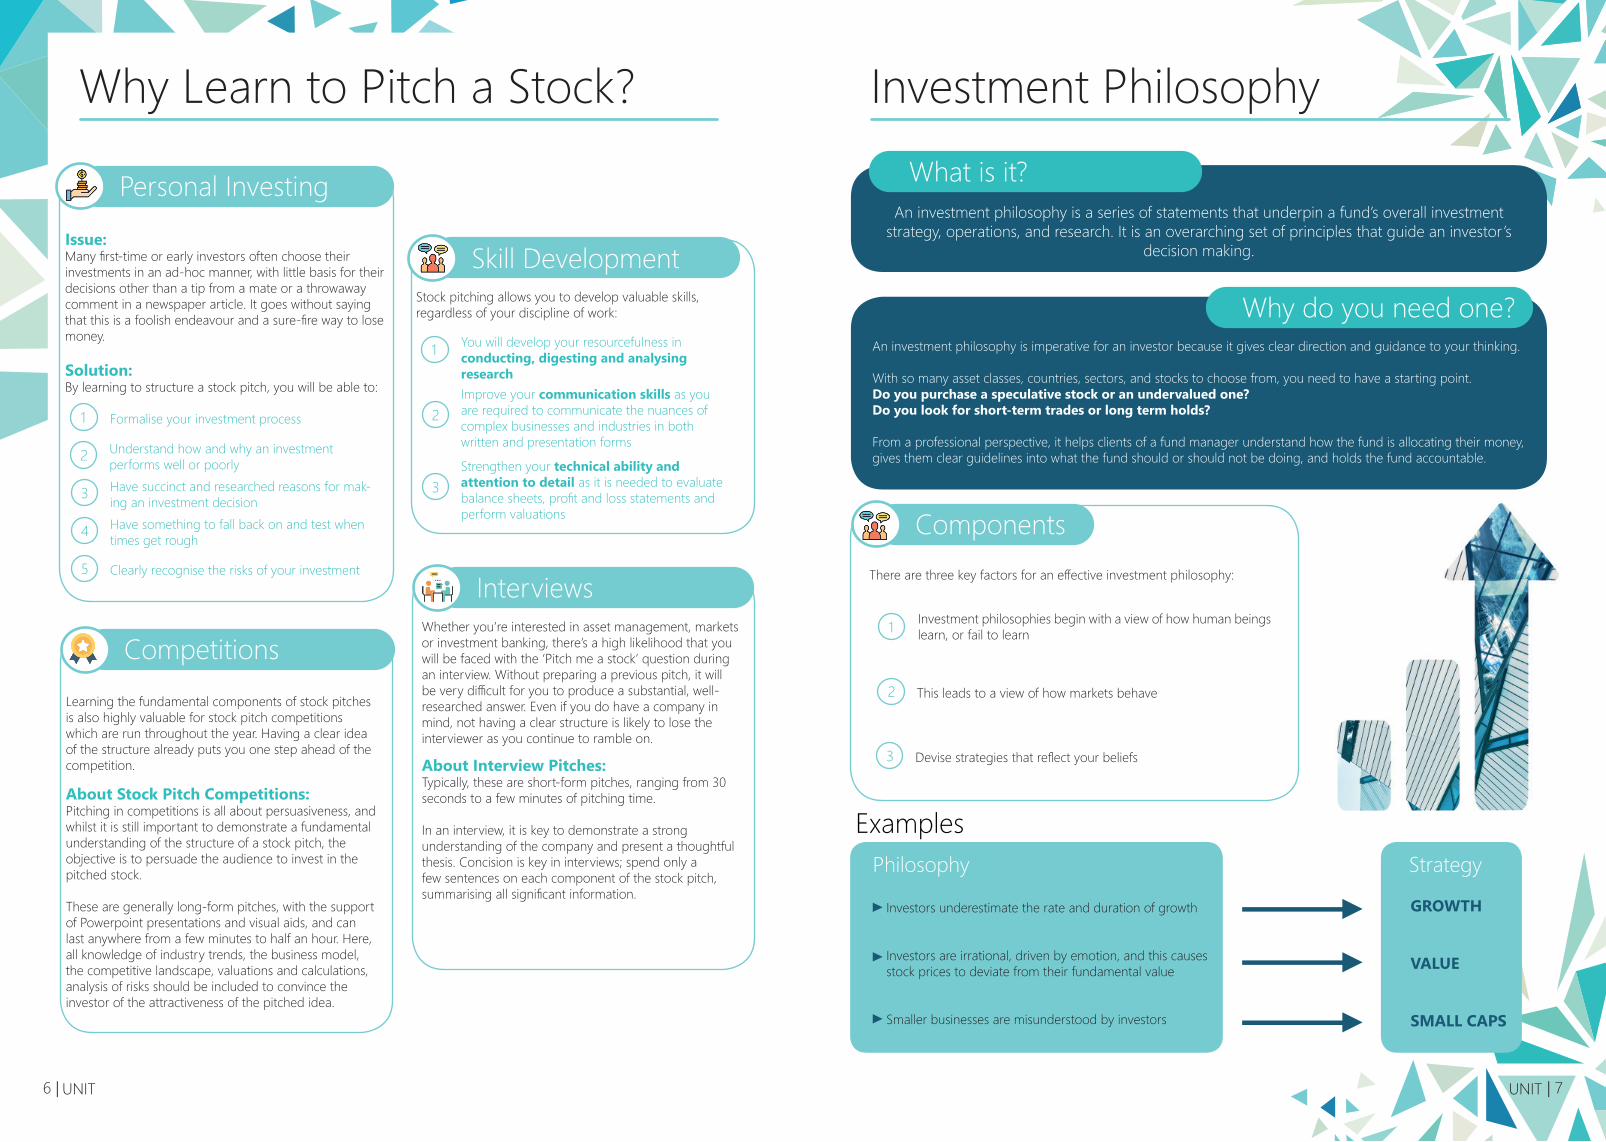
Issue: Many first-time or early investors often choose their investments in an ad-hoc manner, with little basis for their decisions other than a tip from a mate or a throwaway comment in a newspaper article. It goes without saying that this is a foolish endeavour and a sure-fire way to lose money.
Solution: By learning to structure a stock pitch, you will be able to:
Skill DevelopmentStock pitching allows you to develop valuable skills, regardless of your discipline of work:
1 You will develop your resourcefulness in conducting, digesting and analysing research
2Improve your communication skills as you are required to communicate the nuances of complex businesses and industries in both written and presentation forms
3Strengthen your technical ability and attention to detail as it is needed to evaluate balance sheets, profit and loss statements and perform valuations
InterviewsWhether you’re interested in asset management, markets or investment banking, there’s a high likelihood that you will be faced with the ‘Pitch me a stock’ question during an interview. Without preparing a previous pitch, it will be very difficult for you to produce a substantial, well-researched answer. Even if you do have a company in mind, not having a clear structure is likely to lose the interviewer as you continue to ramble on.
About Interview Pitches:Typically, these are short-form pitches, ranging from 30 seconds to a few minutes of pitching time.
In an interview, it is key to demonstrate a strong understanding of the company and present a thoughtful thesis. Concision is key in interviews; spend only a few sentences on each component of the stock pitch, summarising all significant information.
CompetitionsLearning the fundamental components of stock pitches is also highly valuable for stock pitch competitions which are run throughout the year. Having a clear idea of the structure already puts you one step ahead of the competition.
About Stock Pitch Competitions: Pitching in competitions is all about persuasiveness, and whilst it is still important to demonstrate a fundamental understanding of the structure of a stock pitch, the objective is to persuade the audience to invest in the pitched stock.
These are generally long-form pitches, with the support of Powerpoint presentations and visual aids, and can last anywhere from a few minutes to half an hour. Here, all knowledge of industry trends, the business model, the competitive landscape, valuations and calculations, analysis of risks should be included to convince the investor of the attractiveness of the pitched idea.
UNIT 6 |
Why Learn to Pitch a Stock?
1 Formalise your investment process
2 Understand how and why an investment performs well or poorly
3 Have succinct and researched reasons for mak-ing an investment decision
4 Have something to fall back on and test when times get rough
5 Clearly recognise the risks of your investment
ComponentsThere are three key factors for an effective investment philosophy:
1 Investment philosophies begin with a view of how human beings learn, or fail to learn
2 This leads to a view of how markets behave
3 Devise strategies that reflect your beliefs
ExamplesPhilosophy
Investors underestimate the rate and duration of growth
Investors are irrational, driven by emotion, and this causes stock prices to deviate from their fundamental value
Smaller businesses are misunderstood by investors
Strategy
GROWTH
VALUE
SMALL CAPS
| 7UNIT
Investment Philosophy
An investment philosophy is a series of statements that underpin a fund’s overall investment strategy, operations, and research. It is an overarching set of principles that guide an investor’s
decision making.
What is it?
An investment philosophy is imperative for an investor because it gives clear direction and guidance to your thinking.
With so many asset classes, countries, sectors, and stocks to choose from, you need to have a starting point. Do you purchase a speculative stock or an undervalued one? Do you look for short-term trades or long term holds?
From a professional perspective, it helps clients of a fund manager understand how the fund is allocating their money, gives them clear guidelines into what the fund should or should not be doing, and holds the fund accountable.
Why do you need one?

Interviews
UNIT 8 |
Investable UniverseWhat is it?
There are a multitude of markets and investment opportunities that we can choose from.
Your investable universe is defined by a personalised set of criteria.
This criteria is framed within the boundaries that YOU define! These may include: personal preferences, risk aversion, investment philosophy.
Filters
A starting point may be deciding which GICS (Global Industry Classification Standard) sectors suit your preferences for volatility and/or market capitalisation. For example, sectors such as Information Technology are likely to produce relatively high returns at the expense of bearing greater risks.
To refine your selections of the desired GICS sectors, you may also choose to exclude specific companies or groups of companies displaying certain types of characteristics.
Industry
Market CapitalisationMarket capitalisation is described as the market value of a company’s equity based on the number of outstanding shares and its share price. One should be cautious in associating a company’s market capitalisation with its current or future performance. These companies are often well-known and understood by the market and are subsequently highly sensitive to market expectations.
This leads us to consider the volatility of an industry to market movements. High volatility levels tend to generate high returns albeit with a greater likelihood of actual returns differing from expected returns. Your choice of volatility will rest entirely on your risk preferences and investment philosophy.
Volatility
| 9UNIT

ThematicThematic factors, as the name suggests, relate to themes trending or emerging in the domestic or global economy. However, these market/industry trends may also lead to speculative bubbles and herding behaviour.
E.g. Chipmaker companies may benefit from break-throughs in artificial intelligence.
Screening
MacroeconomicThe level of sensitivity of stocks to these macroeconomic factors such as interest rates, inflation, investment, consumption ought to be considered.
E.g. A financial stock which relies on mortgage lending will be highly sensitive to interest rate changes.
GeographicRegional constraints or opportunities for growth may be essential for a company’s success or could be the ingredient of its downfall.
E.g. Australian import-export company will experience growth when there are indicators suggesting increased demand of commodities from Chinese consumers.
What is it?Stock screening is a way for you to start to narrow your ideas from the investable universe down to a series of stocks you can perform deeper analysis on. There are two main forms of screening: Quantitative and Qualitative.
UNIT 10 |
Qualitative ScreeningIdea generation can simply come from noticing a retail store being busier than usual, or noticing more news coverage on a certain company - this is known as qualitative screening.
Quantitative ScreeningQuantitative stock screening involves choosing key metrics, and using them to filter stocks.
Note: This stock screening stage is influenced by your investment philosophy & it may also be useful to develop a screen which tracks these metrics over time.
| 11UNIT
Example of initial screening
Key Screening Metrics
Price to earnings (P/E)
Market capitalisation
Return on investment (ROI)
Earnings per share (EPS)
Dividend yield
Price to book (P/B)
Ticker EV/EBITDA P/E ROE EBITDA Margin Revenue Growth Score Rank
Weighting 25% 15% 30% 20% 10% N/A N/A
Stock 1 8.6x 20.4x 35% 25.1% 8.3% 9.2 2
Stock 2 15.2x 30.3x 30% 35.5% 15.6% 12.3 1
Stock 3 6.7x 12.5x 10% 13.3% 3.2% 8.5 3
What now?
Preliminary Research
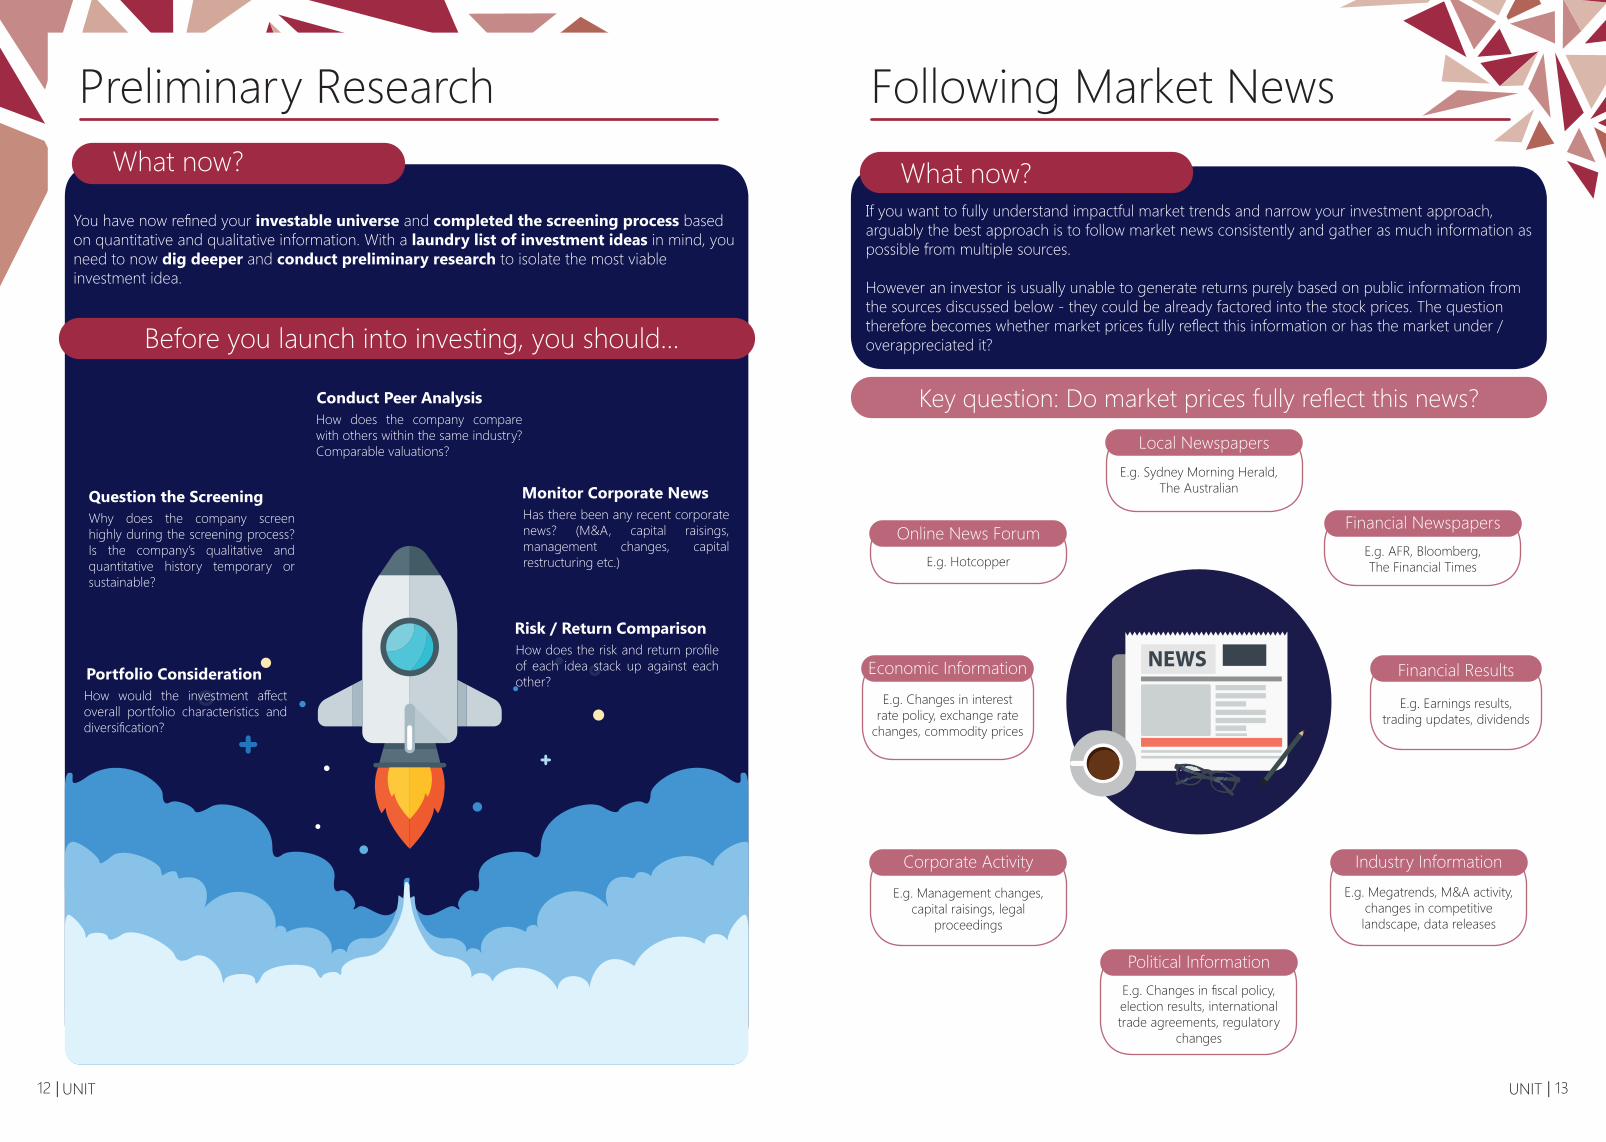
You have now refined your investable universe and completed the screening process based on quantitative and qualitative information. With a laundry list of investment ideas in mind, you need to now dig deeper and conduct preliminary research to isolate the most viable investment idea.
Before you launch into investing, you should...
Why does the company screen highly during the screening process? Is the company’s qualitative and quantitative history temporary or sustainable?
Question the Screening
How does the company compare with others within the same industry? Comparable valuations?
Conduct Peer Analysis
Has there been any recent corporate news? (M&A, capital raisings, management changes, capital restructuring etc.)
Monitor Corporate News
How does the risk and return profile of each idea stack up against each other?
Risk / Return Comparison
How would the investment affect overall portfolio characteristics and diversification?
Portfolio Consideration
UNIT 12 |
Following Market News
| 13UNIT
What now? If you want to fully understand impactful market trends and narrow your investment approach, arguably the best approach is to follow market news consistently and gather as much information as possible from multiple sources.
However an investor is usually unable to generate returns purely based on public information from the sources discussed below - they could be already factored into the stock prices. The question therefore becomes whether market prices fully reflect this information or has the market under / overappreciated it?
Key question: Do market prices fully reflect this news?
Online News ForumE.g. Hotcopper
Local NewspapersE.g. Sydney Morning Herald,
The Australian
Financial NewspapersE.g. AFR, Bloomberg, The Financial Times
Economic InformationE.g. Changes in interest
rate policy, exchange rate changes, commodity prices
Industry InformationE.g. Megatrends, M&A activity,
changes in competitive landscape, data releases
Financial Results
E.g. Earnings results, trading updates, dividends
Corporate ActivityE.g. Management changes,
capital raisings, legal proceedings
Political InformationE.g. Changes in fiscal policy, election results, international trade agreements, regulatory
changes

UNIT 14 | | 15UNIT
Pitch OverviewExecutive Summary
Business Overview
Catalyst
Investment Risks
Industry Overview
Investment Thesis
Valuation
Recommendation
Why are you making the recommendation?
Target Price
Describe the key value propositions, activities, and structure of the business
Describe where the firm is in the market
Give an overview of its capital structure and any other prominent aspects of the firm
Describe any significant recent events or changes in the business model
Describe upcoming informational events that should explain when a share price rerating will likely occur - they justify the ‘why now’
Such events could be macro or micro related.
Describe any risks that could cause your thesis to not come to fruition
Outline any mitigating factors which reduce the likelihood of these risks arising
Describes aspects such as the market structure and who the significant firms in the industry are, the trends of the industry, and competitive landscape
Explain why you are suggesting either a buy, sell, or hold recommendation
Usually three reasons as to why the stock is currently mispriced
Justify how you reached your target price and the underlying assumptions and forecasts
Outline the potential bull and bear scenarios

Industry Overview
UNIT 16 |
What is it?An industry overview defines the type of industry which your selected company belongs to, and the major characteristics of that industry. These characteristics can be broken down into the industry’s products, competitive landscape, service offerings, and drivers and trends.
Industry reporters like IBISWorld specialise in disseminating market research reports. The reports cover recent industry performance, the competitive landscape, the types of products / services produced, the major companies and key metrics.
Source 1: Industry Reports
Source 2: Industry Groups
Source 3: Broker Reports
Numerous industry groups / organisations exist which provide extensive information about their industry. The industry information which these organisations provide can range from facts and figures to media releases of industry players.
These reports are written by broker firms and analysts who interact with management and competitors frequently. Their reports will likely contain very extensive and unique insights into the landscape of the industry.
Product and Source Offering
How do the companies in the industry differentiate themselves? It may be through quality controls and premiumisation, cutting-edge technologies or brand image and reputation.
Product Differentiation
Where are the industry’s main markets? Which are growing and which are stable / stagnating? Location is key for companies in reaching customers as well as offering another avenue for differentiation.
Location
Who does the industry sell to? Where does the industry source its inputs? Answering these questions will allow for a better understanding of the industry’s cost base.
Supply / Customer Base
Macroeconomic - Level
Consider whether or not the industry is cyclical, i.e. if profitability is sensitive to the level of economic activity. You may also look at macroeconomic drivers which influence a wide variety of industries. This can range from trade agreements and geopolitical events to changes in population demographics, such as an ageing population.
Market Position
Examine the role of each player in the industry, and look at their respective strengths and weaknesses. This will help identify any opportunities for consolidation and how the company can improve upon what other competitors offer.
Industry - Level
Assessing the stage at which the industry stands at in its life cycle - introduction, growth, maturity, or decline - is also very significant as sales and profitability vary across the different phases. This may involve looking at the tailwinds or structural challenges accelerating / restricting its growth.
| 17UNIT
Market Power
Look at the strength of their brand name, as well as their market share, location and size. This will assist in determining the type of market structure which the company is operating in and the barriers of entry.
Market Activity
Monitor the activity of major players, and assess whether the company will be able to accordingly guard against, or leverage any opportunities which arise from movements made by other players.
Competitive Landscape
Drivers and trends are used to gauge the general direction in which an industry is headed, and assists in estimating a company’s future profitability.
Drivers and Trends
Regulatory Drivers
The role of the government and regulation is also significant. Whilst rules and legislation are often adverse for companies as they can restrict business activity and impose tax, it should be noted that the regulatory environment can also be
supportive by, for example, providing grants or subsidies.

A prospectus is a document which is disclosed prior to an IPO. It will contain information on the company, its operations, financial position and the risks associated with the offer. This is often the ideal source for company and industry information, provided it is not too outdated.
Source 1: Prospectus
The company’s website will usually provide annual reports which contain financial statements, such as the income statement, balance sheets, and cash flow statement.
Source 2: Company Releases
Source 3: Databases
Databases like Bloomberg, CapIQ and Factset provides concise summaries on what each company does, as well as a stock analysis, which includes the stock price, share price chart, company news, key statistics, fundamentals and company profile.
Recent corporate news include any announcements or changes that can affect the price of the stock. These
can include M&A, profit guidance updates, changes to dividend policy or management changes.
Recent Corporate NewsGeneral Information
General information includes, but is not limited to, qualitative features such as the company’s
headquarters and key management, as well as more quantitative factors, such as historical share price performance and valuation metrics like P/E and
dividend yield.
Business Overview
UNIT 18 |
What to include?
What is it?A business overview should provide a concise summary of the most important aspects of the company. This can be broadly separated into general information about the company and its business model.
Prod
uct M
ix
Where companies are segmented into numerous business divisions, usually through separate product or service lines, historical performance and percentage splits should also be included. These identified streams can then be used to highlight what the primary growth drivers of a company are.
| 19UNIT
The business model should explain to investors how the company will generate revenue and profit and sell to inves-tors where the value of the company is stemming from.
Business Model
Geo
grap
hic
Mar
ket
For a business that operates on a global / national scale, it is also useful to identify the key geographical markets in which it operates. This is often indicated on financial statements, making it easier to trace historical performance that has been impacted by regional trends.
Key
Fina
ncia
ls An overview of the financials of the company would be a summary of the key financial statements of the firm. This could include the historical revenue growth of the stock, key ratios from the balance sheet such as leverage or the debt/equity ratio, or what the key cost drivers are. The financials shown will also depend on the stock being analysed - for example, the net interest margin is an influential ratio for a bank.

Investment Thesis
UNIT 20 |
A company may have a better revenue model or a more appropriate capital structure that allows them to better leverage available investment opportunities.
Competitive AdvantagesA competitive edge can be sourced from many different aspects of the company. Regardless of the nature of the competitive edge, it should allow the company to outperform their competitors in the mid to long-term. Such prospects of long-term growth and sustenance will add value to a company, which should be reflected in the share price.
For example, a firm undertaking extensive research and development may be able to create more innovative products with patents and copyrights in place to help sustain this advantage.
Competitive Advantages
Key Question: Can the competitive advantage be sustained?
What is it?An investment thesis should explain why an investor should invest into the specific stock by defining the value that the stock would add to a portfolio. The thesis should be motivated by the idea that the stock is currently mispriced, generally as a result of the market underappreciating or having yet to factor in certain information into the share’s price.
While many reasons may potentially support and form the basis of an investment thesis, three common factors amongst many investment theses include sustainable competitive advantage, macroeconomic and industry tailwinds and strategy / management.
| 21UNIT
Macroeconomic And Industry Tailwinds
Strategy and Management
Macroeconomic and industry tailwinds refer to the forces and drivers which help stimulate the economy and industry as a whole.
The macroeconomic environment in which the company operates can provide top-down support to your investment thesis by helping drive the growth of your company.
Management styles are often based off past performance, i.e. the success of their previous strategies and how management has handled different situations in the past.
Strategies can include mergers & acquisitions, new product development, and asset sales. Your investment thesis can be supported if you believe that investors are underappreciating the actual value you expect the company’s strategies to create.
For example, expectations of falling interest rates may reduce borrowing costs for the company and allow them to take advantage of a wider range of investment opportunities.
Changes in consumer tastes and demographics may also open up opportunities which your company may intend to exploit.
Specific technologies may be able to increase the production scale within certain industries, whilst subsidies provided by the government may allow certain industries to become more competitive.

Investment Thesis
UNIT 22 |
Mispricings are often caused by Behavioural Biases
• Recent evidence is more compelling• Investors may focus too heavily on recent bad
news and discount historical good news
• Dramatic evidence is more compelling• Investors focus too heavily on news / information
that is highly dramatised / publicised
• Mistaken belief that prior success will lead to future success
• Investors project historical growth too far into the future
• There is lots of information available, which can be a lot to process
• Investors tend to take shortcuts and are attracted to the ‘easy’ stories
• New information is discounted• Investors unwilling to change their views on
companies
• Bellamy’s and Chinese regulations
• Entry of Amazon into Australian market was overhyped
• Domino’s high earnings growth was expected to continue for many years
• Everyone knows lithium demand is expected to skyrocket, but the supply dynamics remain overlooked
• Nine News was disliked by the market for a long time despite trends in TV media turning
Short Termism
Salience
Hot Hand Phenomenon
Information Overload
Anchoring
How do mispricings arise?However, identifying these thesis points is likely insufficient - many other investors are able to do the same. It is your job as the stock-pitcher to identify the mispricing and this often requires an understanding of behavioural biases because such mispricings often arise from irrational market behaviour. Such biases may for example, lead to underestimating of earnings growth or overestimation of the impact of short term shocks.
Broker Reports
Since investors have certain expectations regarding a company’s earnings prior to each release, earnings releases are the key informational event which will either justify or fall short of these expectations. A ‘beat’ will likely lead to an increase in share price whilst a ‘miss’ will do the opposite.
Note: Investors should also pay attention to the outlook statements in the earnings releases - a strong result followed by a poor outlook statement / trading update may not be looked upon favourably.
Some broker reports will provide a revised valuation of a stock’s value, whilst others may provide buy and sell recom-mendations for particular stocks. The release of these broker reports acts as a catalyst which can directly impact stock prices, especially if they involve a change in price target or recommendation.
Catalysts
| 23UNIT | 23UNIT
Earnings Reports
What are they?Catalysts are any upcoming factors or informational events that you believe will propel the share price to rise (or fall for a sell pitch), thus justifying your investment thesis. The catalyst explains the why now and is important to include as stocks can remain undervalued for a long period of time.
Information about the impact of these catalysts are not yet incorporated into the stock price and so they provide an opportunity for investors to make significant gains in wealth. A catalyst can be almost anything, and the four examples provided below include earnings reports, broker reports, macroeconomic factors and, other company announcements.
UNIT 24 |
Catalysts
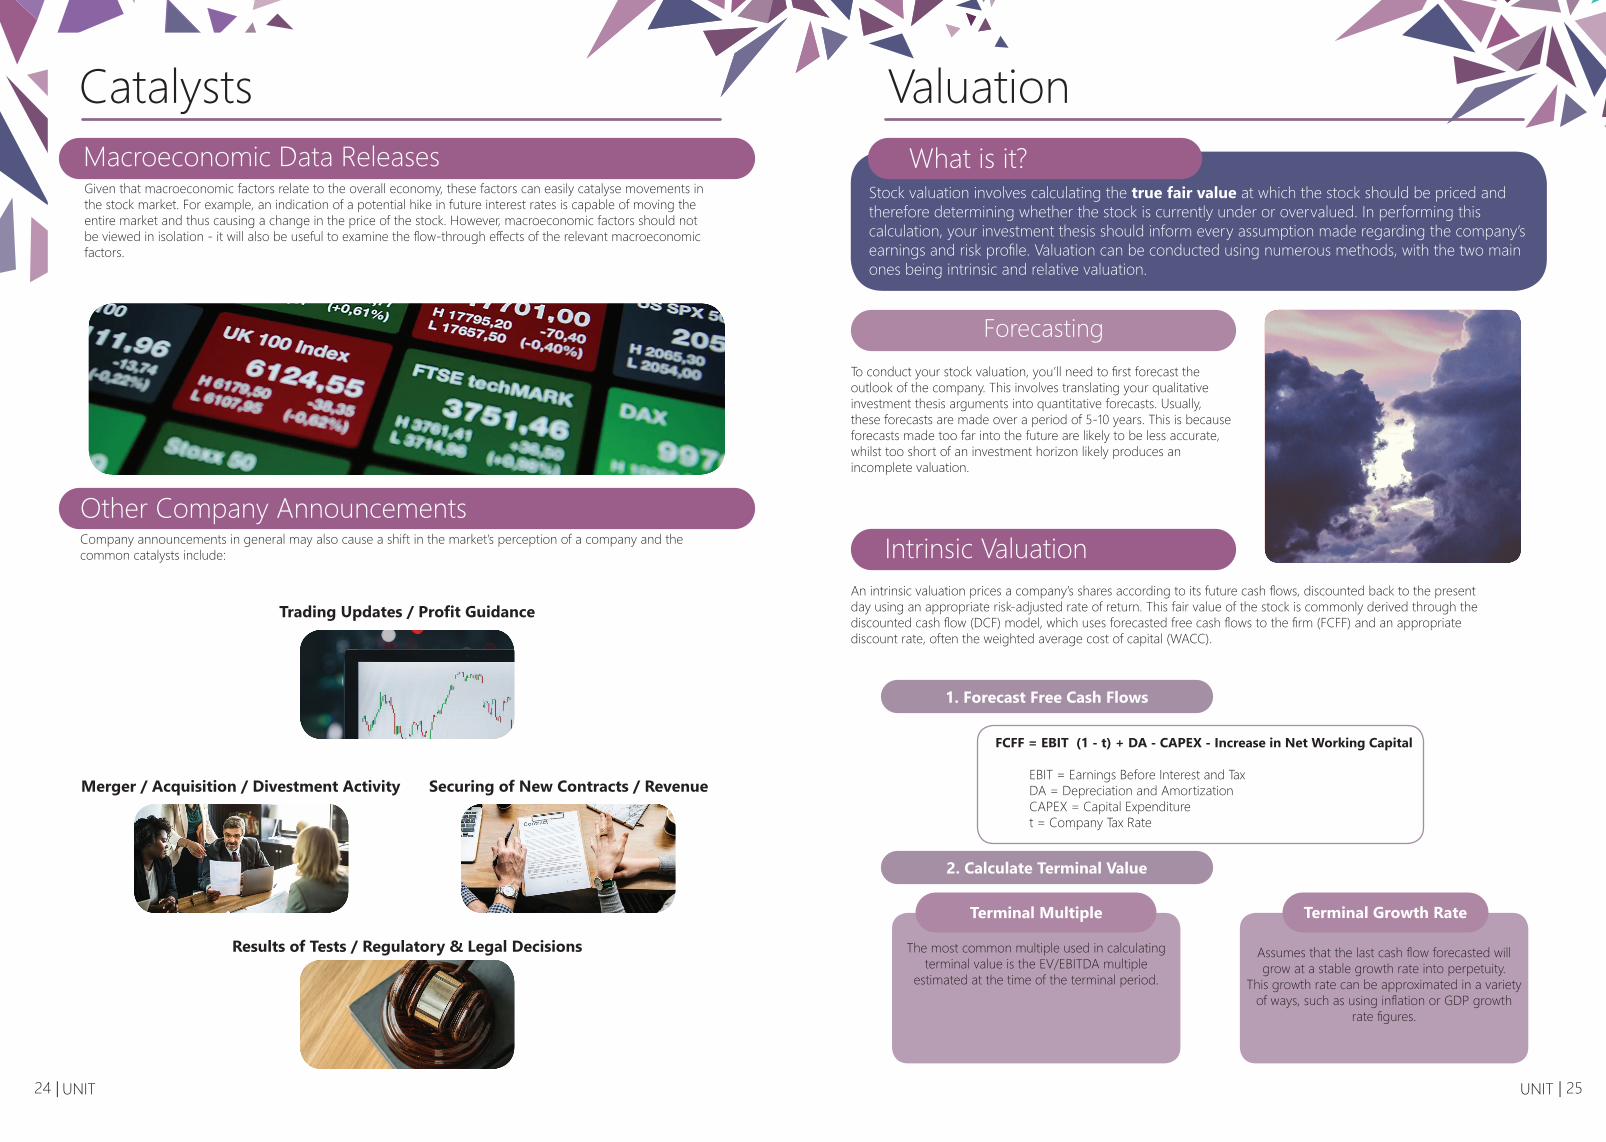
Given that macroeconomic factors relate to the overall economy, these factors can easily catalyse movements in the stock market. For example, an indication of a potential hike in future interest rates is capable of moving the entire market and thus causing a change in the price of the stock. However, macroeconomic factors should not be viewed in isolation - it will also be useful to examine the flow-through effects of the relevant macroeconomic factors.
Macroeconomic Data Releases
Company announcements in general may also cause a shift in the market’s perception of a company and the common catalysts include:
Merger / Acquisition / Divestment Activity
Trading Updates / Profit Guidance
Results of Tests / Regulatory & Legal Decisions
Securing of New Contracts / Revenue
Other Company Announcements
FCFF = EBIT (1 - t) + DA - CAPEX - Increase in Net Working Capital
EBIT = Earnings Before Interest and Tax DA = Depreciation and Amortization CAPEX = Capital Expenditure t = Company Tax Rate
To conduct your stock valuation, you’ll need to first forecast the outlook of the company. This involves translating your qualitative investment thesis arguments into quantitative forecasts. Usually, these forecasts are made over a period of 5-10 years. This is because forecasts made too far into the future are likely to be less accurate, whilst too short of an investment horizon likely produces an incomplete valuation.
An intrinsic valuation prices a company’s shares according to its future cash flows, discounted back to the present day using an appropriate risk-adjusted rate of return. This fair value of the stock is commonly derived through the discounted cash flow (DCF) model, which uses forecasted free cash flows to the firm (FCFF) and an appropriate discount rate, often the weighted average cost of capital (WACC).
The most common multiple used in calculating terminal value is the EV/EBITDA multiple
estimated at the time of the terminal period.
Terminal Multiple
Assumes that the last cash flow forecasted will grow at a stable growth rate into perpetuity.
This growth rate can be approximated in a variety of ways, such as using inflation or GDP growth
rate figures.
Terminal Growth Rate
| 25UNIT
Forecasting
Intrinsic Valuation
Valuation
Forecasting
What is it?Stock valuation involves calculating the true fair value at which the stock should be priced and therefore determining whether the stock is currently under or overvalued. In performing this calculation, your investment thesis should inform every assumption made regarding the company’s earnings and risk profile. Valuation can be conducted using numerous methods, with the two main ones being intrinsic and relative valuation.
1. Forecast Free Cash Flows
2. Calculate Terminal Value

The market capitalisation of your company can then be calculated as the difference between its enterprise value and net debt.
Market Cap = EV - Net Debt
You can then simply divide the market cap of your company by the number of shares outstanding to obtain your final share price.
Share Price = Market Cap / Shares Outstanding
Compare this with the current market price per share to see if your share is overvalued, or undervalued!
You will then need to discount each year’s cash flow and the terminal value by the appropriate discount rate to find their present value.
WACC = RE x (E/V) + RD x (D/V) x (1-t)
RE = Cost of Equity RD = Cost of Debt D = Total Debt E = Market Value of Equity V = D + E t = Company Tax Rate
Discounted Cash Flow = FCFFX / (1+WACC)X
X = Forecast Year
Add all of these together to attain the enterprise value of the company.
UNIT 26 |
3. Apply Discount Rate
4. Calculate Share Price
| 27UNIT
The P/E multiple is defined as a share’s value (P) divided by earnings per share (EPS).
The biggest limitation of using the P/E multiple is that it only reflects a firm’s bottom line and fails to consider tax
and interest rates, as well as methods of depreciation and amortization, which often vary across different
companies and may distort company value.
Price / Earnings
The EV/EBITDA multiple is defined as a company’s total Enterprise Value (EV) divided by Earnings Before Interest, Tax, Depreciation & Amortisation (EBITDA).
EV / EBITDA addresses the aforementioned limitation of the P/E multiple as it is not affected by the differing
methods of depreciation and leverage across companies.
EV / EBITDA
Identify the relevant multiples of each of your comparable firms. The most common multiples typically used in a relative valuation are the Price / Earnings and the EV/EBITDA multiple.
Having chosen your desired multiples and comparable set, the median multiples of your set should then be applied to your target company’s own earnings metrics.
Selection can be based on a variety of factors, such as industry, size, scale, and sector.
Relative valuation involves factoring in multiples, ratios, and benchmarks derived from similar companies in determining the company’s share price. This aligns with the law of ‘one price’ as we are assuming that assets with similar risk and returns characteristics should be priced similarly.
Relative Valuation
Company EV/LTM EBITDA EV/NTM EBITDA Forward P/E Trailing P/E EV/LTM Rev
EV/NTM Rev
Company 1 16.0x 13.0x 22.5x 30.3x 6.0x 5.2x
Company 2 16.2x 14.5x 24.8x 28.1x 2.6x 2.5x
Company 3 9.4x 9.3x 17.6x 16.5x 2.3x 2.1x
Company 4 15.2x 9.8x 19.8x 0.0x 2.3x 2.2x
Company 5 10.0x 9.0x 16.5x 60.3x 3.2x 3.0x
Average 13.3x 11.1x 20.2x 27.1x 3.3x 3.0x
Median 15.2x 9.8x 19.8x 28.1x 2.6x 2.5x
Target Company 8.9x 9.0x 24.8x 4.6x 2.4x 2.4x
Implied Share Price $13.39 $12.42 $18.83 $23.35 $11.83 $11.24
1. Identify Your Comparable Set
2. Identify Your Multiples
3. Apply the Peer Multiples
Investment Risks
UNIT 28 |
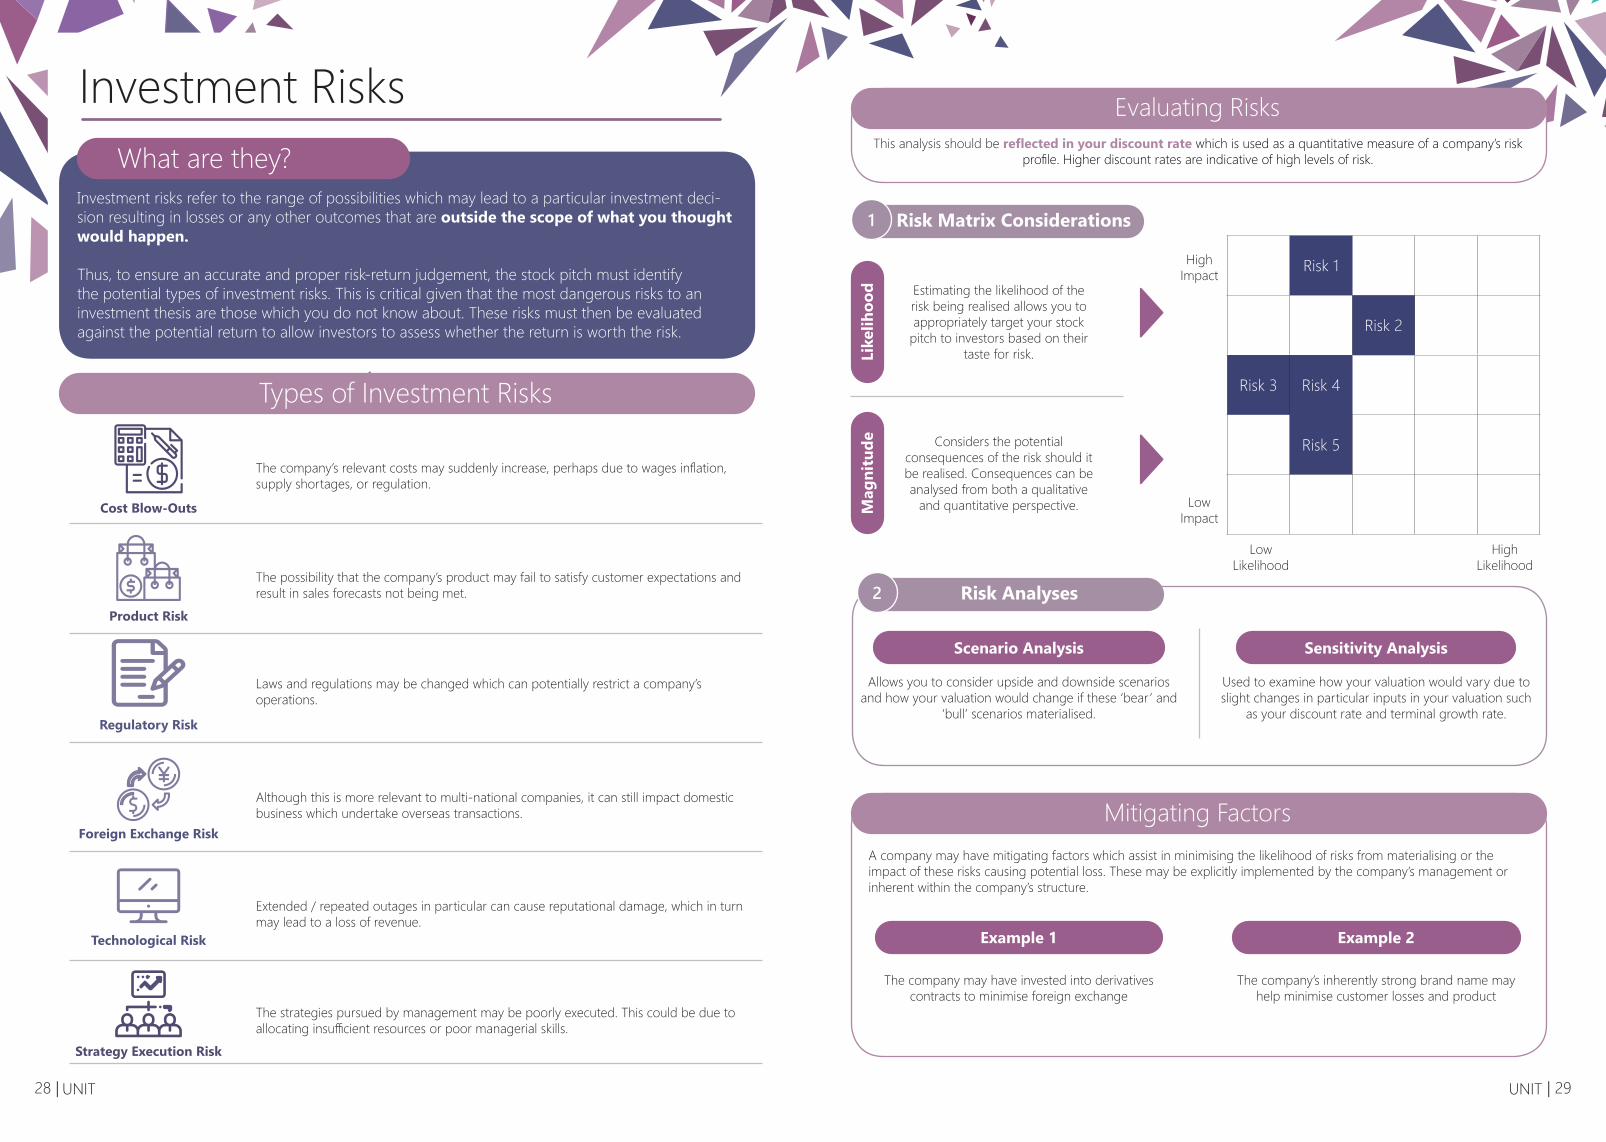
The company’s relevant costs may suddenly increase, perhaps due to wages inflation, supply shortages, or regulation.
The possibility that the company’s product may fail to satisfy customer expectations and result in sales forecasts not being met.
Laws and regulations may be changed which can potentially restrict a company’s operations.
Although this is more relevant to multi-national companies, it can still impact domestic business which undertake overseas transactions.
The strategies pursued by management may be poorly executed. This could be due to allocating insufficient resources or poor managerial skills.
Types of Investment Risks
Cost Blow-Outs
Product Risk
Regulatory Risk
Foreign Exchange Risk
Extended / repeated outages in particular can cause reputational damage, which in turn may lead to a loss of revenue.
Technological Risk
Strategy Execution Risk
What are they?Investment risks refer to the range of possibilities which may lead to a particular investment deci-sion resulting in losses or any other outcomes that are outside the scope of what you thought would happen.
Thus, to ensure an accurate and proper risk-return judgement, the stock pitch must identify the potential types of investment risks. This is critical given that the most dangerous risks to an investment thesis are those which you do not know about. These risks must then be evaluated against the potential return to allow investors to assess whether the return is worth the risk.
| 29UNIT
This analysis should be reflected in your discount rate which is used as a quantitative measure of a company’s risk profile. Higher discount rates are indicative of high levels of risk.
Evaluating Risks
Risk Matrix Considerations1
Risk Analyses2
Estimating the likelihood of the risk being realised allows you to appropriately target your stock
pitch to investors based on their taste for risk.Li
kelih
ood
Considers the potential consequences of the risk should it be realised. Consequences can be analysed from both a qualitative
and quantitative perspective.Mag
nitu
deA company may have mitigating factors which assist in minimising the likelihood of risks from materialising or the impact of these risks causing potential loss. These may be explicitly implemented by the company’s management or inherent within the company’s structure.
Mitigating Factors
The company may have invested into derivatives contracts to minimise foreign exchange
Example 1
The company’s inherently strong brand name may help minimise customer losses and product
Example 2
Allows you to consider upside and downside scenarios and how your valuation would change if these ‘bear’ and
‘bull’ scenarios materialised.
Scenario Analysis
Used to examine how your valuation would vary due to slight changes in particular inputs in your valuation such
as your discount rate and terminal growth rate.
Sensitivity Analysis
Risk 1
Risk 2
Risk 3 Risk 4
Risk 5
High Impact
Low Impact
Low Likelihood
High Likelihood

UNIT 30 | v| 31UNIT
Executive Summary
Recommendation: BUY
12 month target price: $5.37
Upside: 12.60%
Ooh!Media: Ooh! What a buy!
Investment Thesis
Price Range
Industry Outdoor Media
1,150m
$3.92 - $5.41
16.5x
3.10%
$4.77
$5.37
Market cap
52 week range
P/E
Dividend yield
Previous close (20/8/18)
12 month price target
12.60%Upside
Ticker ASX: OML
Date of valuation: 20/8/18
Historical meeting of guidance is expected to continue
Digital partnerships strategy is currently undervalued
Market is too focused on the ACCC risk of Adshel acquisition and is
discounting the earnings upside
3.50
4.00
4.50
5.00
5.50
6.00
6.50
7.00
Aug-17 Sep-17 Oct-17 Nov-17 Dec-17 Jan-18 Feb-18 Mar-18 Apr-18 May-18 Jun-18 Jul-18
$6.15
$4.21
$5.37
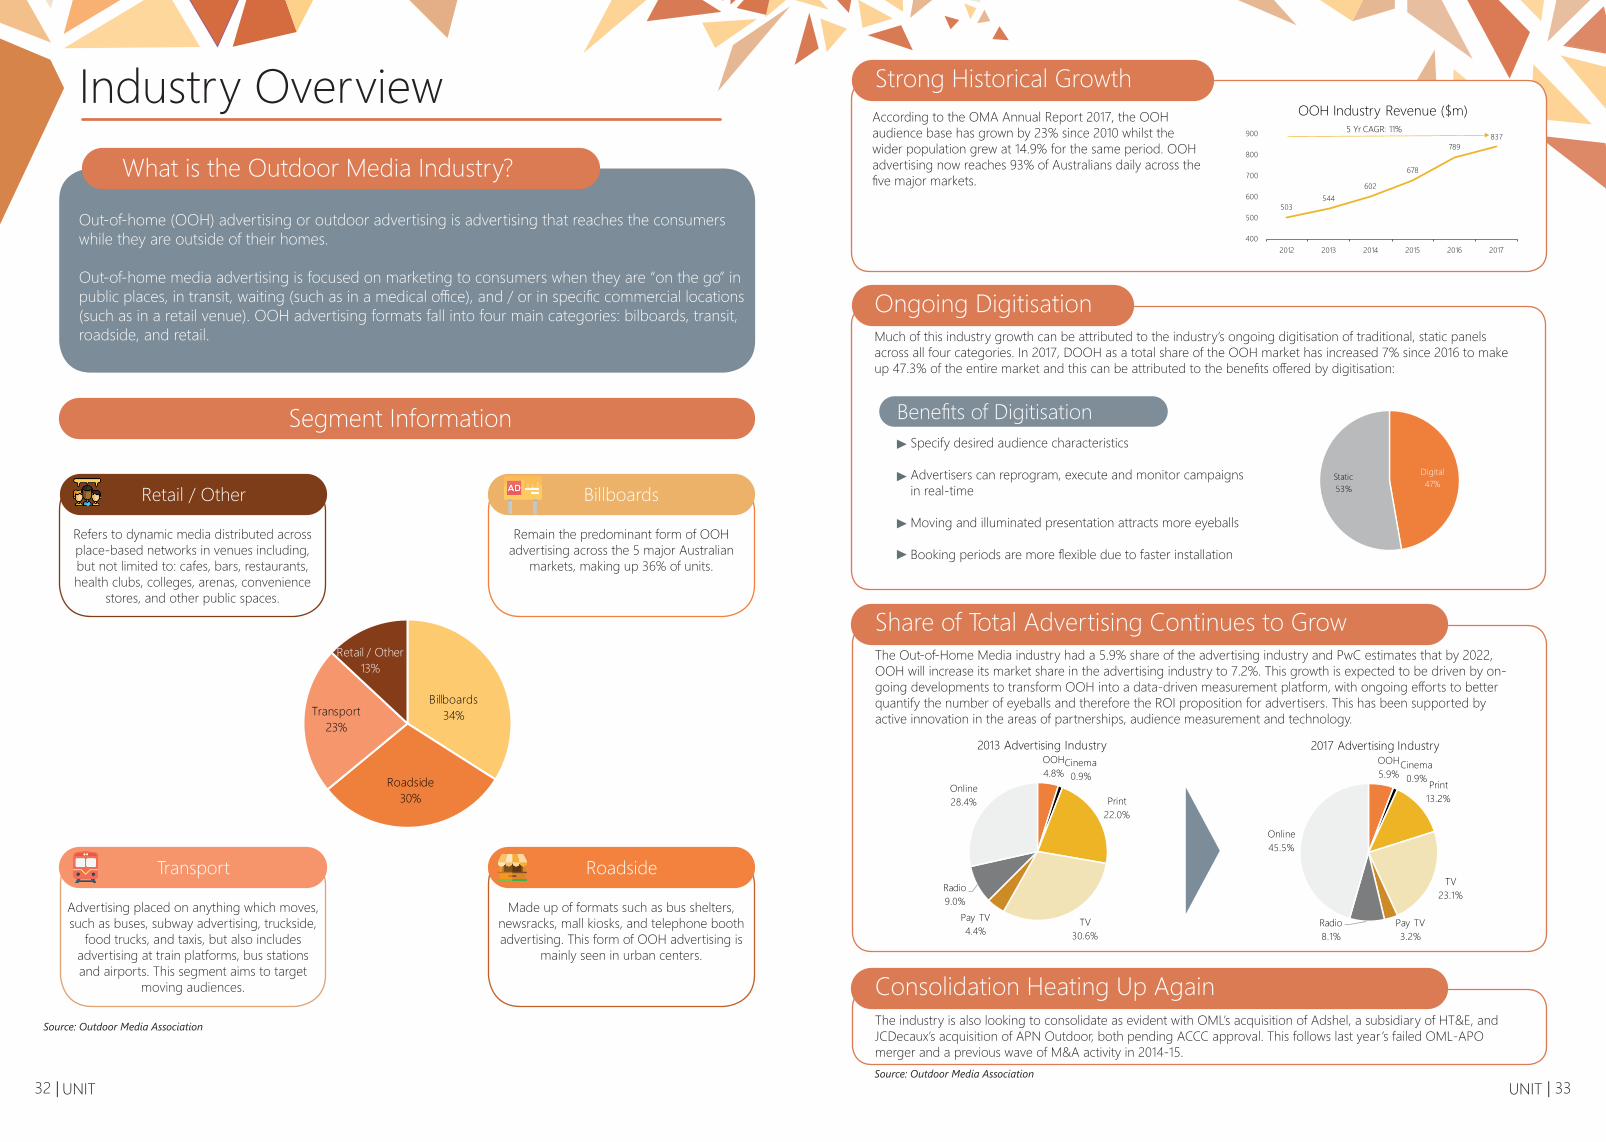
Billboards34%
Roadside30%
Transport23%
Retail / Other13%
UNIT 32 |
Source: Outdoor Media Association
Transport
Advertising placed on anything which moves, such as buses, subway advertising, truckside,
food trucks, and taxis, but also includes advertising at train platforms, bus stations and airports. This segment aims to target
moving audiences.
Roadside
Made up of formats such as bus shelters, newsracks, mall kiosks, and telephone booth advertising. This form of OOH advertising is
mainly seen in urban centers.
Industry Overview
Retail / Other
Refers to dynamic media distributed across place-based networks in venues including, but not limited to: cafes, bars, restaurants, health clubs, colleges, arenas, convenience
stores, and other public spaces.
Billboards
Remain the predominant form of OOH advertising across the 5 major Australian
markets, making up 36% of units.
Segment Information
What is the Outdoor Media Industry?
Out-of-home (OOH) advertising or outdoor advertising is advertising that reaches the consumers while they are outside of their homes.
Out-of-home media advertising is focused on marketing to consumers when they are “on the go” in public places, in transit, waiting (such as in a medical office), and / or in specific commercial locations (such as in a retail venue). OOH advertising formats fall into four main categories: bilboards, transit, roadside, and retail.
| 33UNIT Source: Outdoor Media Association
Consolidation Heating Up AgainThe industry is also looking to consolidate as evident with OML’s acquisition of Adshel, a subsidiary of HT&E, and JCDecaux’s acquisition of APN Outdoor, both pending ACCC approval. This follows last year’s failed OML-APO merger and a previous wave of M&A activity in 2014-15.
Ongoing DigitisationMuch of this industry growth can be attributed to the industry’s ongoing digitisation of traditional, static panels across all four categories. In 2017, DOOH as a total share of the OOH market has increased 7% since 2016 to make up 47.3% of the entire market and this can be attributed to the benefits offered by digitisation:
Specify desired audience characteristics
Advertisers can reprogram, execute and monitor campaigns in real-time
Moving and illuminated presentation attracts more eyeballs
Booking periods are more flexible due to faster installation
Strong Historical GrowthAccording to the OMA Annual Report 2017, the OOH audience base has grown by 23% since 2010 whilst the wider population grew at 14.9% for the same period. OOH advertising now reaches 93% of Australians daily across the five major markets.
Share of Total Advertising Continues to GrowThe Out-of-Home Media industry had a 5.9% share of the advertising industry and PwC estimates that by 2022, OOH will increase its market share in the advertising industry to 7.2%. This growth is expected to be driven by on-going developments to transform OOH into a data-driven measurement platform, with ongoing efforts to better quantify the number of eyeballs and therefore the ROI proposition for advertisers. This has been supported by active innovation in the areas of partnerships, audience measurement and technology.
OOH4.8%
Cinema0.9%
Print22.0%
TV30.6%
Pay TV4.4%
Radio9.0%
Online28.4%
2013 Advertising IndustryOOH5.9%
Cinema0.9% Print
13.2%
TV23.1%
Pay TV3.2%
Radio8.1%
Online45.5%
2017 Advertising Industry
Benefits of Digitisation
Digital 47%
Static53%
503544
602
678
789837
400
500
600
700
800
900
2012 2013 2014 2015 2016 2017
OOH Industry Revenue ($m)5 Yr CAGR: 11%

UNIT 34 | Source: Company Reports
LocateMade up of formats such as bus shelters,
newsracks, mall kiosks, and telephone booth advertising. This form of OOH advertising is
mainly seen in urban centers.
FlyAdvertising placed on anything which moves, such as buses, subway advertising, truckside, food trucks, and taxis, but also includes ad-vertising at train platforms, bus stations and airports. This segment aims to target moving
audiences.
oOh!Media Limited (ASX:OML) was listed on the ASX in December 2014 after spending time under CHAMP private equity ownership, and is an Australian outdoor advertising and media company based in Sydney, Australia.
With over 20,000 locations in Australia and New Zealand, OML clients have access to some of the most sought out advertising spots. Of these screens, 8,000 are digital, giving OML one of the largest digital networks in the country and the company remains focused on converting classic signs to digital, increasing their capacity in key locations.
Business OverviewWho is Ooh!Media?
Operating Segments
RoadOML have over 3,800 roadside billboards in Australia, offering clients access to large format billboards located in major regional
and metropolitan areas.
RetailOML have retail advertising assets in over 540 shopping centres around Australia,
allowing them to reach a large breadth of shoppers.
Road36.1%
Retail33.2%
Fly14.5%
Locate8.9%
New Zealand
2.5%
Other4.8%
FY 17
| 35UNIT
Recent Corporate News
Source: Company Reports, CapIQ, AFR
Financials
Business Model
Advertiser
Develops the intended message, the scope of the advertising campaign and the
budget.
Landlord / Owner
Owns the advertising site and collects rent from the operator. Rent usually consists of
both a fixed rent and revenue share.
Media Agency
Determines the appropriate advertising mediums for the campaign and acts as an intermediary between the advertiser and
Ooh!Media.
Ooh!Media
Operates the site, provides recommendations regarding the location
and format of advertisement and implements the campaign.
CY15 CY16 CY17 1CY18 CY18e
Revenue 279.8 336.1 380.3 192.0 423.0
LTM Growth 7% 20% 13% 11% 11%
EBITDA 58.0 73.5 87.4 37.9 97.0
Margin 21% 22% 23% 20% 23%
LTM Growth 36% 27% 19% 13% 11%
Net Income 18.4 24.5 33.2 9.2 46.6
Margin 7% 7% 9% 5% 11%
Growth NM 33% 36% 21% 40%
Net Debt / EBITDA 1.5x 1.6x 1.4x 1.4x 2.5x
oOh!media and APN Outdoor call off $1.b billion merger
oOh!media wins battle for Adshel with $570 million bid
UNIT 36 |
Source: CapIQ
Investment Thesis
#1 Historical meeting of guidance expected to continue
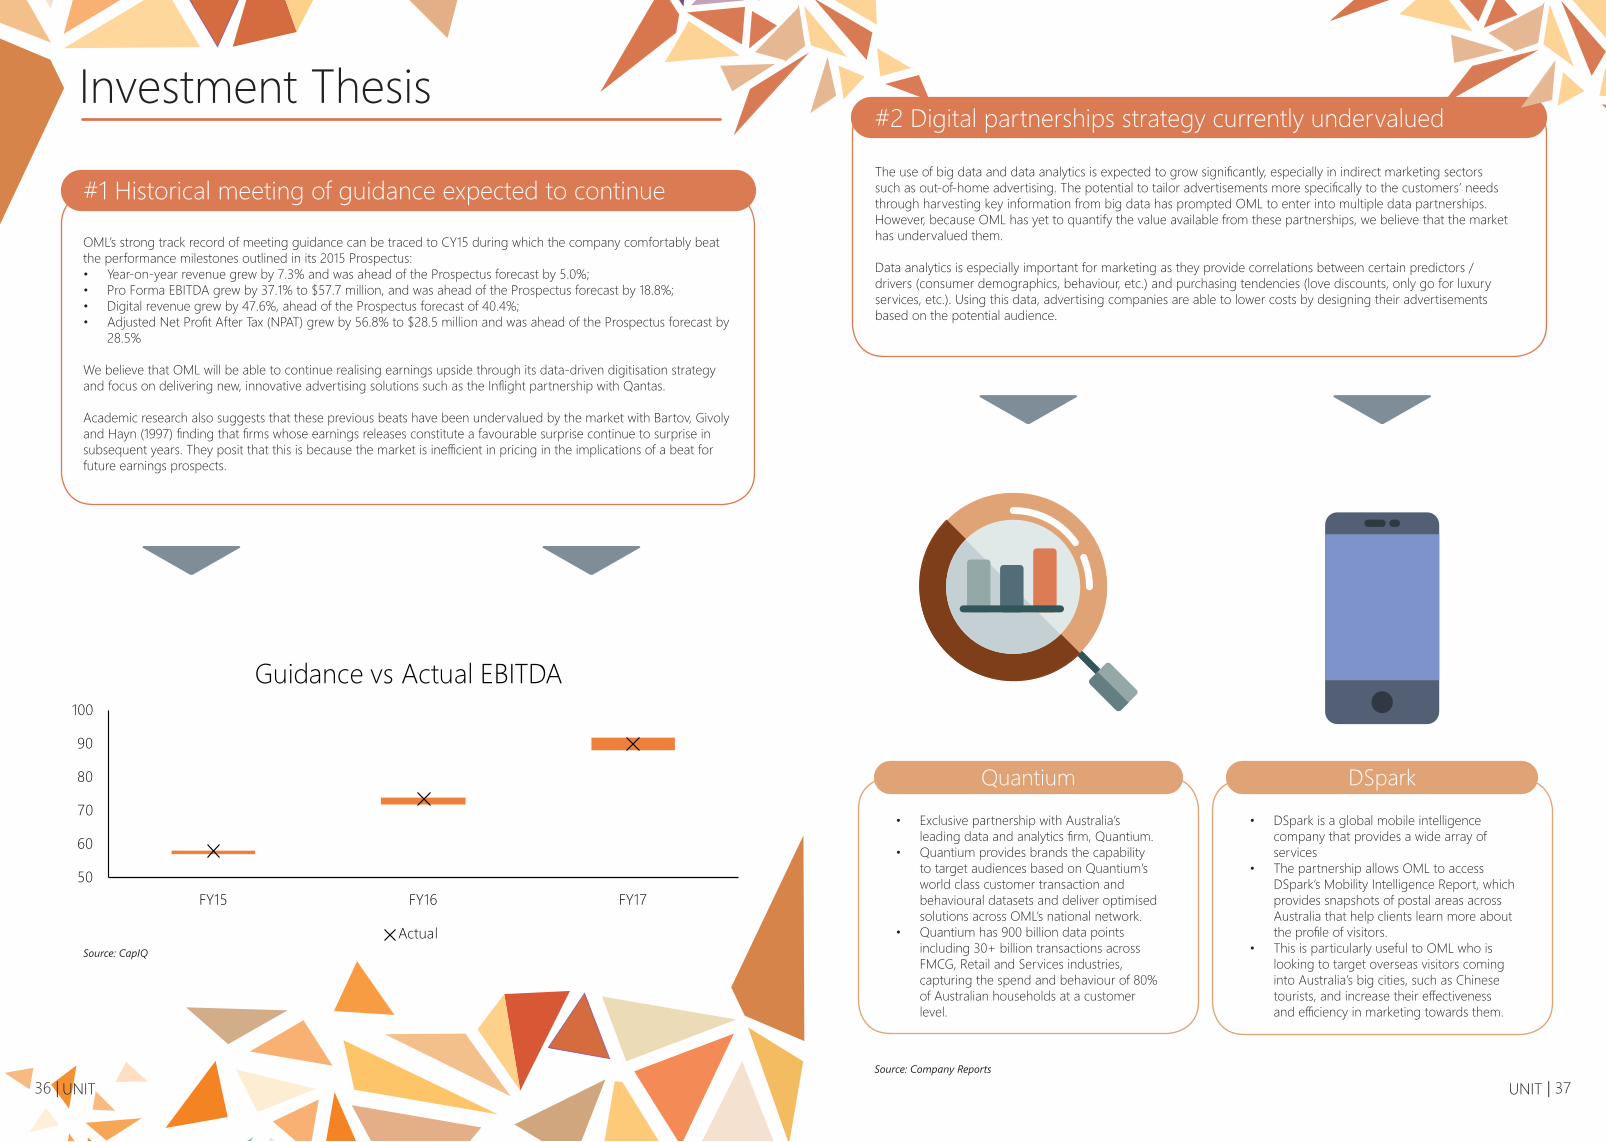
OML’s strong track record of meeting guidance can be traced to CY15 during which the company comfortably beat the performance milestones outlined in its 2015 Prospectus:• Year-on-year revenue grew by 7.3% and was ahead of the Prospectus forecast by 5.0%;• Pro Forma EBITDA grew by 37.1% to $57.7 million, and was ahead of the Prospectus forecast by 18.8%;• Digital revenue grew by 47.6%, ahead of the Prospectus forecast of 40.4%;• Adjusted Net Profit After Tax (NPAT) grew by 56.8% to $28.5 million and was ahead of the Prospectus forecast by
28.5%
We believe that OML will be able to continue realising earnings upside through its data-driven digitisation strategy and focus on delivering new, innovative advertising solutions such as the Inflight partnership with Qantas.
Academic research also suggests that these previous beats have been undervalued by the market with Bartov, Givoly and Hayn (1997) finding that firms whose earnings releases constitute a favourable surprise continue to surprise in subsequent years. They posit that this is because the market is inefficient in pricing in the implications of a beat for future earnings prospects.
50
60
70
80
90
100
FY15 FY16 FY17
Guidance vs Actual EBITDA
Actual
| 37UNIT Source: Company Reports
• Exclusive partnership with Australia’s leading data and analytics firm, Quantium.
• Quantium provides brands the capability to target audiences based on Quantium’s world class customer transaction and behavioural datasets and deliver optimised solutions across OML’s national network.
• Quantium has 900 billion data points including 30+ billion transactions across FMCG, Retail and Services industries, capturing the spend and behaviour of 80% of Australian households at a customer level.
• DSpark is a global mobile intelligence company that provides a wide array of services
• The partnership allows OML to access DSpark’s Mobility Intelligence Report, which provides snapshots of postal areas across Australia that help clients learn more about the profile of visitors.
• This is particularly useful to OML who is looking to target overseas visitors coming into Australia’s big cities, such as Chinese tourists, and increase their effectiveness and efficiency in marketing towards them.
Quantium DSpark
The use of big data and data analytics is expected to grow significantly, especially in indirect marketing sectors such as out-of-home advertising. The potential to tailor advertisements more specifically to the customers’ needs through harvesting key information from big data has prompted OML to enter into multiple data partnerships. However, because OML has yet to quantify the value available from these partnerships, we believe that the market has undervalued them.
Data analytics is especially important for marketing as they provide correlations between certain predictors / drivers (consumer demographics, behaviour, etc.) and purchasing tendencies (love discounts, only go for luxury services, etc.). Using this data, advertising companies are able to lower costs by designing their advertisements based on the potential audience.
#2 Digital partnerships strategy currently undervalued

UNIT 38 |
Source: Investor Presentations
Strategic Rationale
Road36.1%
Retail33.2%
Fly14.5%
Locate8.9%
New Zealand
2.5%
Other4.8%
FY 18
40%
4%
0%5%
10%15%20%25%30%35%40%45%
OML Adshel
% of digital sites
Road33.1%
Retail26.6%
Fly13.6%
Locate8.9%
New Zealand
2.4%
Other4.2%
Adshel11.1%
FY 18 Proforma New Data Insights
The unique placement of street furniture and subsequent expansion of OML’s network and reach
will further OML’s data collection capabilities.
Cost Synergies
Cost synergies of $15 - 18 million p.a. are realisable in the short-medium term.
Revenue Diversification
Highly complementary offering which will improve OML’s value proposition to advertisers seeking out
a full-suite service.
Adshel Digitisation
There is currently low digital penetration in street furniture and there is therefore an opportunity for margin upside by converting Adshel’s static
screens.
Given uncertainties surrounding OML’s acquisition of Adshel which remains pending approval from ACCC, the share price has fallen recently. However, we believe that this movement is a market overreaction and the likelihood that the ACCC will disapprove of the deal is low. This is due to their complementary, rather than overlapping product portfolios, with Adshel being focused on street furniture whereas OML’s portfolio consists mainly of large format billboards. This is in contrast to the scrapped OML/APO merger of 2017, where both companies were large players in the billboard segment. We believe that the market has not priced in the potential revenue synergies from the acquisition which is expected to be EPS accretive in FY18, even with no cost synergies to be realised.
#3 Overcompensation of ACCC risk of Adshel acquisition
| 39UNIT
Source: CapIQ
#1 Historical meeting of guidance expected to continue#2 Further M&A ActivityWith a new wave of consolidation hitting the Outdoor Media industry, OML is in prime position to consider tilts at smaller bolt-on acquisitions. OML’s healthy balance sheet positions it well to pursue such activity, with Net Debt / EBITDA expected to remain below banking covenants at 2.5x post-Adshel. Given OML’s strong cash generation and ability to repay debt, this is forecast to fall to 2.0x within 18 months.
Potential targets could include QMS given its unique sports division, stand-alone billboard assets or players within the data collection space.
#3 Update on Data Analytics DevelopmentOn 7 July 2018, OML announced its intentions of leveraging its partnership with Quantium and launching an automated private marketplace that uses machine learning to help marketers find the best inventory to use and the best timing to reach and engage with a target audience. This is part of a $15m investment to revolutionise out of home advertising to help it gain a larger share of the media investment pie. An update regarding a successful trial or implementation of this digital strategy would likely prove to be a positive catalyst for the share price.
#1 CY18 Earnings ReleaseAs mentioned above, OML’s management has had a good track record of reaching or beating guidance, and this is anticipated to be continued in the future. For CY18 the street consensus of EBITDA is in the lower end of management guidance of $94-99m which we believe is conservative, given our forecasts of $97m.
Catalysts
1.4% 1.4% 0.9%
0.0%
0.5%
1.0%
1.5%
30405060708090
100
FY15 FY16 FY17
Consensus vs Actuals
Consensus Actual Surprise
UNIT 40 |
Term
inal
Grow
th R
ate Forecast WACC
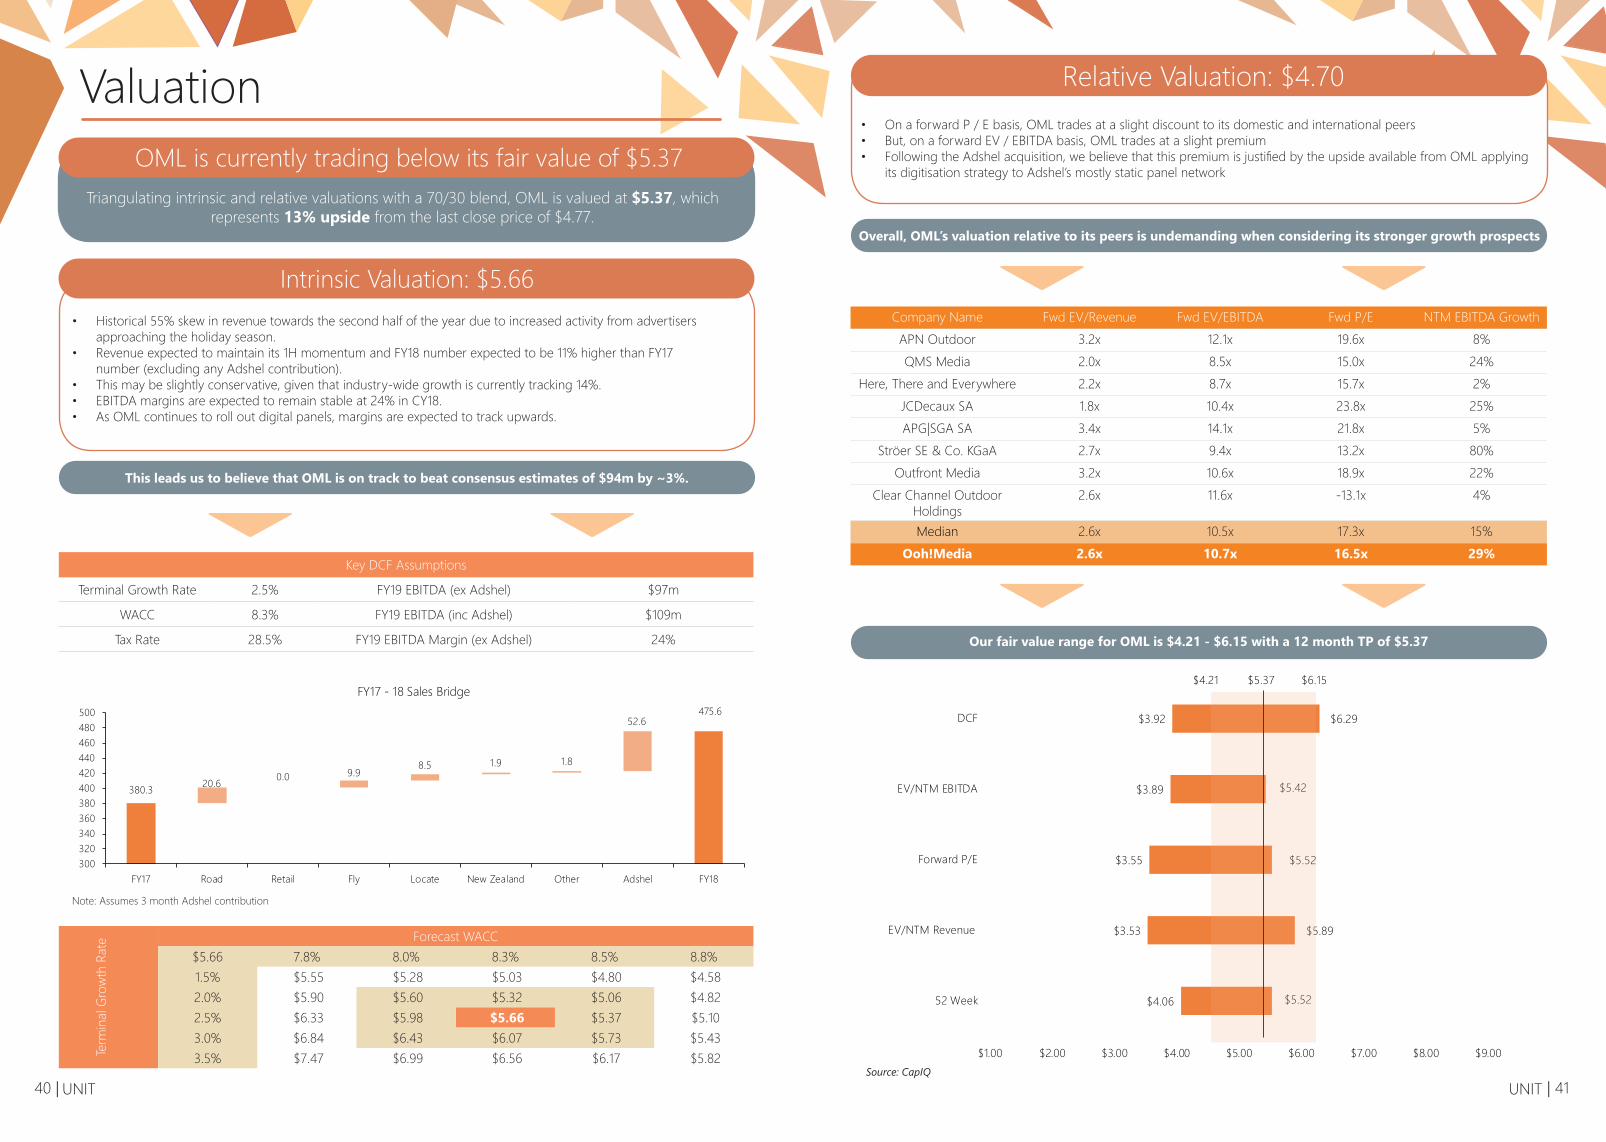
$5.66 7.8% 8.0% 8.3% 8.5% 8.8%1.5% $5.55 $5.28 $5.03 $4.80 $4.58 2.0% $5.90 $5.60 $5.32 $5.06 $4.82 2.5% $6.33 $5.98 $5.66 $5.37 $5.10 3.0% $6.84 $6.43 $6.07 $5.73 $5.43 3.5% $7.47 $6.99 $6.56 $6.17 $5.82
Key DCF Assumptions
Terminal Growth Rate 2.5% FY19 EBITDA (ex Adshel) $97m
WACC 8.3% FY19 EBITDA (inc Adshel) $109m
Tax Rate 28.5% FY19 EBITDA Margin (ex Adshel) 24%
ValuationOML is currently trading below its fair value of $5.37
Triangulating intrinsic and relative valuations with a 70/30 blend, OML is valued at $5.37, which represents 13% upside from the last close price of $4.77.
• Historical 55% skew in revenue towards the second half of the year due to increased activity from advertisers approaching the holiday season.
• Revenue expected to maintain its 1H momentum and FY18 number expected to be 11% higher than FY17 number (excluding any Adshel contribution).
• This may be slightly conservative, given that industry-wide growth is currently tracking 14%.• EBITDA margins are expected to remain stable at 24% in CY18. • As OML continues to roll out digital panels, margins are expected to track upwards.
Intrinsic Valuation: $5.66
This leads us to believe that OML is on track to beat consensus estimates of $94m by ~3%.
475.6
20.6 0.0 9.98.5 1.9 1.8
52.6
380.3
300320340360380400420440460480500
FY17 Road Retail Fly Locate New Zealand Other Adshel FY18
FY17 - 18 Sales Bridge
Note: Assumes 3 month Adshel contribution
| 41UNIT Source: CapIQ
Overall, OML’s valuation relative to its peers is undemanding when considering its stronger growth prospects
Our fair value range for OML is $4.21 - $6.15 with a 12 month TP of $5.37
Company Name Fwd EV/Revenue Fwd EV/EBITDA Fwd P/E NTM EBITDA GrowthAPN Outdoor 3.2x 12.1x 19.6x 8%QMS Media 2.0x 8.5x 15.0x 24%
Here, There and Everywhere 2.2x 8.7x 15.7x 2%JCDecaux SA 1.8x 10.4x 23.8x 25%APG|SGA SA 3.4x 14.1x 21.8x 5%
Ströer SE & Co. KGaA 2.7x 9.4x 13.2x 80%Outfront Media 3.2x 10.6x 18.9x 22%
Clear Channel Outdoor Holdings
2.6x 11.6x -13.1x 4%
Median 2.6x 10.5x 17.3x 15%Ooh!Media 2.6x 10.7x 16.5x 29%
Relative Valuation: $4.70• On a forward P / E basis, OML trades at a slight discount to its domestic and international peers • But, on a forward EV / EBITDA basis, OML trades at a slight premium• Following the Adshel acquisition, we believe that this premium is justified by the upside available from OML applying
its digitisation strategy to Adshel’s mostly static panel network
$4.06
$3.53
$3.55
$3.89
$3.92
$5.52
$5.89
$5.52
$5.42
$6.29
$1.00 $2.00 $3.00 $4.00 $5.00 $6.00 $7.00 $8.00 $9.00
52 Week
EV/NTM Revenue
Forward P/E
EV/NTM EBITDA
DCF
$5.37$4.21 $6.15

UNIT 42 |
v
Investment Risks
Risks are high-impact, but have a low likelihood of arising
• ACCC may disapprove of the Adshel transaction and future M&A
• OML and Adshel are complementary, rather than overlapping businesses
• High visibility of displays means there may be increased scrutiny regarding acceptable content
• Digital billboards in overseas markets found to be more distracting than static ones
• OML is a member of the leading industry group, Outdoor Media Association, which works with government to develop content standards
• Management may find it difficult to integrate Adshel into the existing business given their limited expertise in street furniture
• May lead to failure to realise cost synergies effectively
• OML has a strong track record of integrating accqusitions (including those outside the outdoor media industry)
• E.g. Junkee Media 2016
• Earnings are dependent on OML’s ability to successfully tender and renew contracts
• Loss of a contract can lead to a sharp fall in earnings e.g. APO and Yarra Trams
• OML has a full-suite outdoor media offering
• Large digital network offers high ROI for advertisers
• The capital intensive nature of digitisation roll out and data strategy may force OML to undertake a dilutive equity raising
• OML remains well capitalised post-Adshel
• There is headroom to take on more debt
Risk
Contract Risk
Funding Risk
Regulatory Risk
M&A Execution
Public Scrutiny
Description Mitigant
| 43UNIT
USYD Student Managed Investment Fund
Convert to PNG
UNIT 44 |
About
Benefits
Dual-Purpose
Recruitment
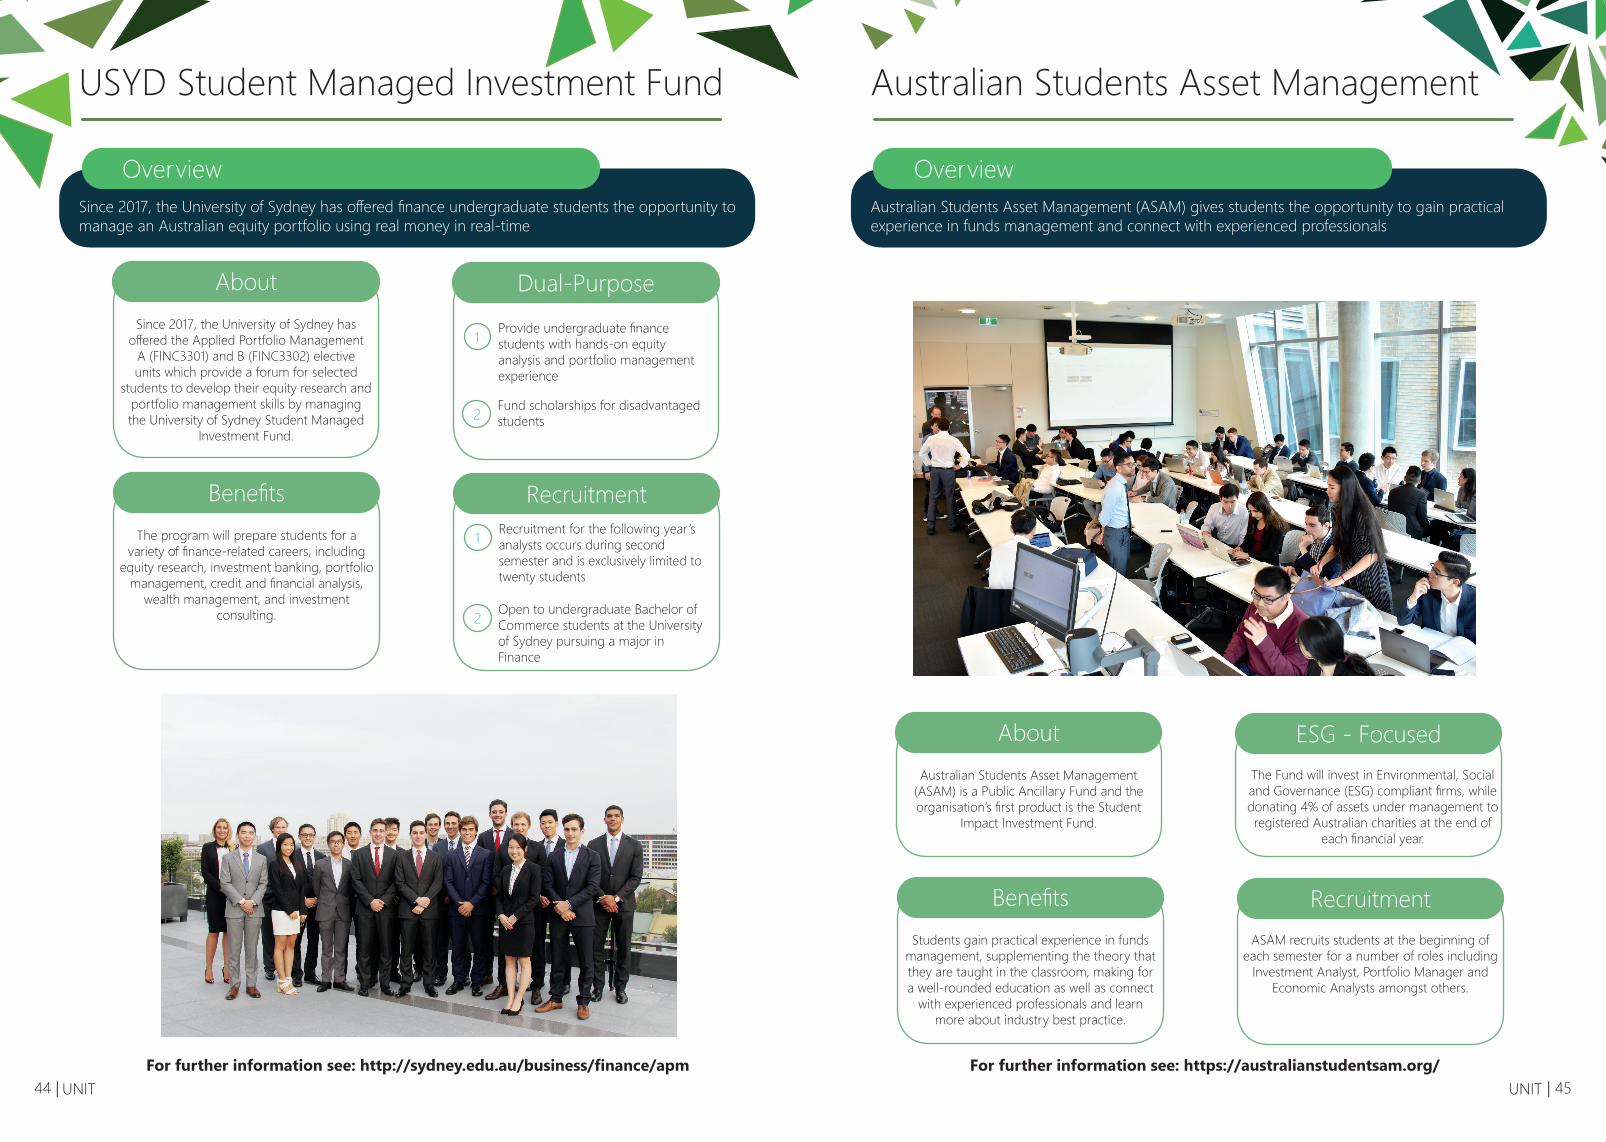
Since 2017, the University of Sydney has offered the Applied Portfolio Management
A (FINC3301) and B (FINC3302) elective units which provide a forum for selected
students to develop their equity research and portfolio management skills by managing the University of Sydney Student Managed
Investment Fund.
The program will prepare students for a variety of finance-related careers, including
equity research, investment banking, portfolio management, credit and financial analysis,
wealth management, and investment consulting.
1 Provide undergraduate finance students with hands-on equity analysis and portfolio management experience
2 Fund scholarships for disadvantaged students
1 Recruitment for the following year’s analysts occurs during second semester and is exclusively limited to twenty students
2 Open to undergraduate Bachelor of Commerce students at the University of Sydney pursuing a major in Finance
For further information see: http://sydney.edu.au/business/finance/apm
OverviewSince 2017, the University of Sydney has offered finance undergraduate students the opportunity to manage an Australian equity portfolio using real money in real-time
| 45UNIT
Australian Students Asset Management
About
Benefits
ESG - Focused
Recruitment
Australian Students Asset Management (ASAM) is a Public Ancillary Fund and the organisation’s first product is the Student
Impact Investment Fund.
The Fund will invest in Environmental, Social and Governance (ESG) compliant firms, while donating 4% of assets under management to registered Australian charities at the end of
each financial year.
ASAM recruits students at the beginning of each semester for a number of roles including
Investment Analyst, Portfolio Manager and Economic Analysts amongst others.
Students gain practical experience in funds management, supplementing the theory that they are taught in the classroom, making for a well-rounded education as well as connect
with experienced professionals and learn more about industry best practice.
For further information see: https://australianstudentsam.org/
Australian Students Asset Management (ASAM) gives students the opportunity to gain practical experience in funds management and connect with experienced professionals
Overview


Copyright © 2022 FDOKUMEN