Spermatogenesis and sperm structure of Acerella muscorum, (Ionescu, 1930) (Hexapoda, Protura
Upload
independentCategory
view
2download
0
Nucleic Acids Research, Vol. 19, No. 7 1557
Determining transcript number using the polymerase chainreaction: Pgk-2, mP2, and PGK-2 transgene mRNA levelsduring spermatogenesis i
Murray O.Robinson* and Melvin I.SimonDivision of Biology, California Institute of Technology, Pasadena, CA 91125, USA
Received December 11, 1990; Revised and Accepted February 27, 1991
ABSTRACTWe describe a technique that uses reverse transcriptionand the polymerase chain reaction (pcr) to rapidlyquantitate numbers of specific mRNA transcripts fromnanogram quantities of total cellular RNA. Linearity ofinput molecules to output signal was maintained bylimiting the cycle number and the amount of input RNAand by minimizing the number of manipulations.Absolute levels of specific transcripts were determinedby the inclusion of a separate standard curvecomposed of serially diluted in vitro transcribed RNArun alongside the experimental samples. This allowedrapid quantitation of many samples simultaneously. Weapplied this technique to measuring the expression ofphosphoglycerate kinase 2 (Pgk-2) transgenes in themouse testis during development. A human PGK-2transgene, a PGK-2/CAT transgene, and theendogenous mPgk-2 gene all displayed similar patternsand levels of expression, consistent with theconclusion that peak RNA accumulation occurs inpachytene spermatocytes. Mouse protamine 2 (mP2)is expressed at a level approximately tenfold higherthan Pgk-2 and displays a different pattern ofexpression consistent with initiation of transcriptionoccuring in haploid round spermatids.
INTRODUCTIONQuantitative analysis of RNA is central to the understanding ofthe mechanisms that regulate gene activity. Northern analysis iscurrently the most widely used method for analyzing RNA levels,however, northern analysis requires microgram amounts ofRNA,is time consuming and is of limited quantitative use. Techniquesbased on solution hybridization of RNA are more sensitive andquantitative, however, the increased time and effort involved limittheir widespread use. The advent of the polymerase chain reaction(pcr) (1) has resulted in the development of a number ofquantitative (2-5) and semi-quantitative (6-8) procedures forthe analysis of steady-state RNA levels. These protocols allinclude the addition of reverse transcriptase to the samples toconvert the RNA into a DNA copy providing a suitable substrate
for taq polymerase. The pcr approach allows increased sensitivity,ease of use, and requires only small amounts of RNA.
Protocols designed to quantitate the products of the pcr mustaccount for the exponential nature of the cycling reaction. Theproduct (N) of pcr amplification can be defined by the functionN=NJ(1 +eff.)n, and is initially linear with respect to inputmolecules (NO). However, as cycle number (n) and total product(N) increase, the efficiency (eff.) of the pcr is reduced as theconcentration of one of the substrates eventually becomeslimiting, resulting in loss of linearity. Furthermore, small changesin the efficiency of the reaction result in large differences in theamount of total product. This leads to non-uniformity in the levelof pcr product from tube to tube or experiment to experiment.Accordingly, efforts to use the pcr to measure,RNA levels haveincluded internal competitive or noncompetitive templates tocontrol for such differences in amplification. Although useful forstandardization, each of these templates requires additionalcloning steps, and the use of an internal standard requires severalreactions to measure each sample.Another approach (9) takes advantage of the theoretical linearity
of input molecules versus pcr product. Using this approach, therelative levels of testis-specific messages were measured bylimiting both the cycle number and the amount of starting materialsuch that the efficiency of the reaction remained constant.Although this approach is useful for determining the relative levelsof a specific mRNA in different samples, it is not useful forcomparing the level of different messages, and it is difficult todetermine whether the message levels detected are ofphysiological importance (5,10). We have extended the utilityof this approach through the use of an externally generatedstandard curve. The standard curve is used both to determinethe range over which the reaction is linear and to determine thelevel of signal that corresponds to a specific number of RNAmolecules. Here we present a novel quantitation protocol(modified from reference 9) that provides rapid and accurateanalysis of absolute RNA levels from many samples and allowsquantitative comparison of different messages.We are interested in gene expression during spermatogenesis,
and have been studying the transcriptional control of the genefor Phosphoglycerate Kinase (Pgk-2), expressed only in meiotic
* To whom correspondence should be addressed
.::/ 1991 Oxford University Press
1558 Nucleic Acids Research, Vol. 19, No. 7
and post meiotic male germ-cells. In the mouse, the initial stagesof spermatogenesis occur synchronously and begin shortly afterbirth. Germ-cells first enter meiosis around day 12, and divideto form haploid round spermatids by about day 21. Thus, theage of the prepuberal mouse can be correlated with thedevelopmental progression of germ-cells in the testis. Previously,we showed that a human PGK-2 transgene is expressed in a tissue-specific and developmentally controlled manner in mice, and thata PGK-2/CAT fusion gene demonstrates tissue-specific CATactivity that is first detected at post natal day 13 (11). Due tothe limits of quantitation and low yields ofRNA from immaturetestes we were unable to accurately measure and compare RNAlevels from these transgenes. Here, we have used this techniqueto show that the human PGK-2 transgene, the PGK-2ICAT fusiongene and the endogenous mouse Pgk-2 gene all share the samepattern of expression, and the mRNA levels vary less thanfourfold among the three genes. Furthermore, the developmentalexpression profiles of the PGK-2 genes are consistent with highlevels of expression in pachytene cells, a cell-type that waspreviously thought to contain only low levels of Pgk-2 message(12).
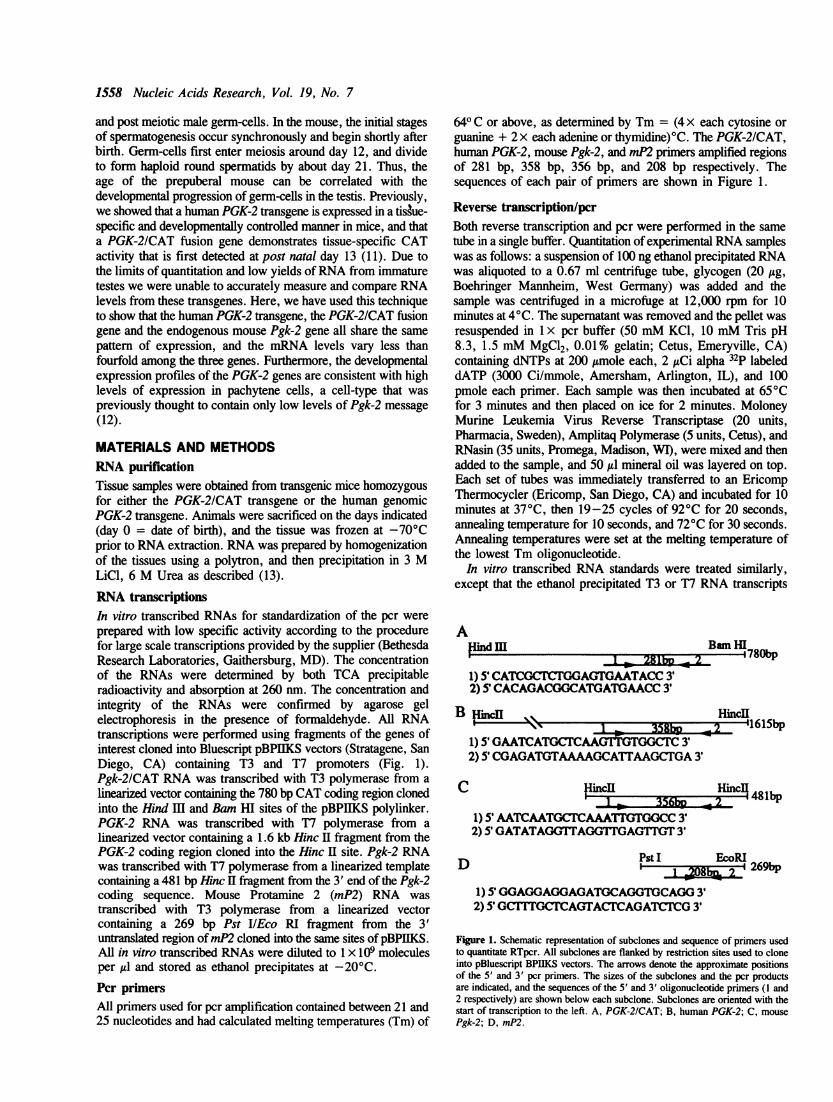
MATERIALS AND METHODSRNA purificationTissue samples were obtained from transgenic mice homozygousfor either the PGK-2ICAT transgene or the human genomicPGK-2 transgene. Animals were sacrificed on the days indicated(day 0 = date of birth), and the tissue was frozen at -70°Cprior to RNA extraction. RNA was prepared by homogenizationof the tissues using a polytron, and then precipitation in 3 MLiCl, 6 M Urea as described (13).RNA transcriptionsIn vitro transcribed RNAs for standardization of the pcr wereprepared with low specific activity according to the procedurefor large scale transcriptions provided by the supplier (BethesdaResearch Laboratories, Gaithersburg, MD). The concentrationof the RNAs were determined by both TCA precipitableradioactivity and absorption at 260 nm. The concentration andintegrity of the RNAs were confirmed by agarose gelelectrophoresis in the presence of formaldehyde. All RNAtranscriptions were performed using fragments of the genes ofinterest cloned into Bluescript pBPIIKS vectors (Stratagene, SanDiego, CA) containing T3 and T7 promoters (Fig. 1).Pgk-2/CAT RNA was transcribed with T3 polymerase from alinearized vector containing the 780 bp CAT coding region clonedinto the Hind HI and Bam HI sites of the pBPIIKS polylinker.PGK-2 RNA was transcribed with T7 polymerase from alinearized vector containing a 1.6 kb Hinc I fragment from thePGK-2 coding region cloned into the Hinc H site. Pgk-2 RNAwas transcribed with T7 polymerase from a linearized templatecontaining a 481 bp Hinc II fragment from the 3' end of the Pgk-2coding sequence. Mouse Protamine 2 (mP2) RNA wastranscribed with T3 polymerase from a linearized vectorcontaining a 269 bp Pst IlEco RI fragment from the 3'untranslated region ofmP2 cloned into the same sites of pBPIIKS.All in vitro transcribed RNAs were diluted to 1 x 10⁹ moleculesper gl and stored as ethanol precipitates at -20°C.Pcr primersAll primers used for pcr amplification contained between 21 and25 nucleotides and had calculated melting temperatures (Tm) of
640 C or above, as determined by Tm = (4 x each cytosine orguanine + 2 x each adenine or thymidine)°C. The PGK-2/CAT,human PGK-2, mouse Pgk-2, and rnP2 primers amplified regionsof 281 bp, 358 bp, 356 bp, and 208 bp respectively. Thesequences of each pair of primers are shown in Figure 1.
Reverse transcription/pcrBoth reverse transcription and pcr were performed in the sametube in a single buffer. Quantitation of experimental RNA sampleswas as follows: a suspension of 100 ng ethanol precipitated RNAwas aliquoted to a 0.67 ml centrifuge tube, glycogen (20 Ag,Boehringer Mannheim, West Germany) was added and thesample was centrifuged in a microfuge at 12,000 rpm for 10minutes at 4°C. The supernatant was removed and the pellet wasresuspended in 1 x pcr buffer (50 mM KCl, 10 mM Tris pH8.3, 1.5 mM MgCl2, 0.01% gelatin; Cetus, Emeryville, CA)containing dNTPs at 200 ltmole each, 2 ,uCi alpha 32p labeleddATP (3000 Ci/mmole, Amersham, Arlington, IL), and 100pmole each primer. Each sample was then incubated at 65°Cfor 3 minutes and then placed on ice for 2 minutes. MoloneyMurine Leukemia Virus Reverse Transcriptase (20 units,Pharmacia, Sweden), Amplitaq Polymerase (5 units, Cetus), andRNasin (35 units, Promega, Madison, WI), were mixed and thenadded to the sample, and 50 ,ul mineral oil was layered on top.Each set of tubes was immediately transferred to an EricompThermocycler (Ericomp, San Diego, CA) and incubated for 10minutes at 37°C, then 19-25 cycles of 92°C for 20 seconds,annealing temperature for 10 seconds, and 72°C for 30 seconds.Annealing temperatures were set at the melting temperature ofthe lowest Tm oligonucleotide.
In vitro transcribed RNA standards were treated similarly,except that the ethanol precipitated T3 or T7 RNA transcripts
AIindm B
I - 2allDD V1) 5' CATCGCTCTGGAGTGAATACC 3'2)5 CACAGACGGCATGATGAACC 3'
I HincIlGAAT C A T G~~~~~~~~~~~~~~~~C A A~~~~~~~~~~
-i78bp
HincIlA I solql1)5'
1) 5' GAATCAGT3CAAAAGCAIGGC1A3'2) S' CGAGATGTAAAAGCATTAAGCTwGA 3'
C HincI HincU
1) 5' AATCAATGCTCAAATTGTGGCC 32) 5' GATATAGGTrAGGTrGAGTTGT 3'
D Pst I EcoRIi I 208b._ i269bp
1)5' GGAGGAGGAGATGCAGGTGCAGG 3'2) 5' GCTITGCCAGTACTCAGATCTCG 3'
Figure 1. Schematic representation of subclones and sequence of primers usedto quantitate RTpcr. All subclones are flanked by restriction sites used to cloneinto pBluescript BPIIKS vectors. The arrows denote the approximate positionsof the 5' and 3' pcr primers. The sizes of the subclones and the pcr productsare indicated, and the sequences of the 5' and 3' oligonucleotide primers (1 and2 respectively) are shown below each subclone. Subclones are oriented with thestart of transcription to the left. A, PGK-2/CAT; B, human PGK-2; C, mousePgk-2; D, mP2.
---IioljE)P

Nucleic Acids Research, Vol. 19, No. 7 1559
were first resuspended in diethyl pyrocarbonate treated H20,serially diluted as required, then reprecipitated in the presenceof 20 ,ug glycogen and 100 ng liver RNA. After the pcr,formamide loading buffer (0.1% w/v xylene cyanol, 0,1 %w.vbromophenol blue, 10 mM Na2EDTA, 95% v/v formamide)was added, the samples were heated to 65°C for 3 minutes, andthen electrophoresed in a 6% acrylamide/6 M urea gel at 200volts for 1.5 hours. The gel was then dried down and exposedto a Molecular Dynamics Phosphorimager plate (MolecularDynamics, Sunnyvale, CA) for one to ten hours and quantitatedusing the phosphorimager. Similar results were obtained byexcising the bands from the dried gel and quantitating by liquidscintillation counting.
RESULTS
The protocol for the combined reverse transcription andpolymerase chain reaction (RTpcr) is predicated on the theoreticallinear relationship of input molecules to total product. By limitingthe amount of starting material and the number of cycles of pcr,we could keep all substrates in excess, insuring uniformamplification. Because the final yield of the pcr is sensitive tosmall differences in efficiency, another consideration was tominimize the number of manipulations involved. By combiningall components of both the reverse transcriptase and the pcr ina single reaction mixture (pcr buffer, dNTPs, primers, reversetranscriptase and taq polymerase) we could achieve amplificationof the RNA. It was then essential to demonstrate that the reactionwas linear, sensitive and reproducible.
Linearity of RTpcrTo examine the linearity of the RTpcr, eleven samples of twofolddilutions of T3 transcribed CAT RNA were mixed with 100 ngC57B6/DBA2 mouse liver RNA. The range of the experimentwas from 4,900 molecules to 5,000,000 molecules ofCAT RNA.Each sample was prepared as described in Materials and Methodsand both the pcr mix and the enzyme mix were aliquoted froma common stock. Samples with fewer input molecules requiredmore cycles to obtain a detectable signal. Accordingly, samplescontaining from 4,900 to 78,000 CAT RNA molecules were runfor 25 cycles, and samples containing 78,000 to 5,000,000molecules were run for 21 cycles. The signals from the 25 cyclereactions were normalized to the 21 cycle values using theoverlapping 78,000 molecule samples. Approximately half of theresulting products were run on a 6% polyacrylamide gel, dried,and quantitated using the Molecular Dynamics phosphorimagersystem. As shown in figure 2A, there is a linear relationshipbetween input RNA molecules and signal when the number inputRNA molecules is between 19,000 and 5,000,000. The signalbegins to level off as the concentration ofCAT RNA moleculesis decreased below this range. A control reaction containing noadded CAT RNA molecules also gives a faint signal (data notshown), suggesting that this constant signal at very low RNAconcentrations is due to contamination of the pcr solutions witha total of approximately 10,000 CAT RNA or DNA sequencesper reaction.
Variability between experimentsTo determine the variability of the RTpcr, CAT RNA dilutioncurves were repeated over a period of one month, using 21 cyclereactions and identical thermocycler times and temperatures, butusing different prepared solutions, different tubes of enzyme
stock, and different lots of 32p labeled dATP. Figure 2B showsthree such CAT dilution series, each normalized at the 78,000molecule point to account for differences in exposure time.Although each experiment shows a linear relationship betweeninput molecules and signal, the slopes of the three lines vary asmuch as twofold; the slope of each line representing the relativeefficiency of amplification. It is important to note that althoughthe efficiency of the reaction may vary from day to day(presumably due to differences in the concentrations or specificactivities of the components), in any given experiment, linearityof input molecules to signal is observed. Because a high degree
A- 108.
o07i6
106.
B
-c._
c 4
coCd2
a
0
0*--**----*--n a-
104 I0 106 1RNA molecules
19 21 23 25cycle number
Figure 2. Quantitation of Reverse Transcription/pcr. A) Linearity of RTpcr. Elevensamples of twofold serial dilutions of T3 transcribed CAT RNA were mixed with100 ug liver RNA and subjected to the RTpcr protocol. Half of the reaction mixturewas run on a 6% polyacrylamide gel, dried, quantitated using a MolecularDynamics phosphorimager and plotted as signal versus RNA molecules. Samplescontaining 4,900 to 78,000 molecules were run for 25 cycles; samples containing78,000 to 5,000,000 molecules were run for 21 cycles. The two sets of pointswere normalized to the 21 cycle curve by the overlapping 78,000 molecule values.B) Experiment variability. Over a period of one month, three sets of serial twofoldor fourfold serial dilutions of T3 transcribed CAT RNA molecules were mixedwith 100 ng liver RNA, subjected to RTpcr for 21 cycles and quantitated as inA. A line drawn through each set of points describes the linear fit of the databy the least squares technique. C) Tube to tube uniformity. Triplicate samplesof 5 million molecules of CAT T3 RNA mixed with 100 ng liver RNA weresubjected to RTpcr for the number of cycles indicated and quantitated as in A.A line drawn through the 19, 21, and 23 cycle points describes the exponentialincrease in product with increasing cycle number.

1560 Nucleic Acids Research, Vol. 19, No. 7
44
4k
Figure 3. Quantitation of Pgk-21CAT transgene RNAs in the testis. A)Autoradiograph of a dried 6% polyacrylamide gel showing the products of RTpcr from a developmental timecourse. Total RNA samples (100 ng) from thetestes of Pgk-21CAT transgenic mice of the ages indicated were amplified for21 cycles using CAT primers. On the right is a standard curve of fourfold serialdilutions of T3 transcribed CAT RNA run concurrently to allow absolutequantitation of the Pgk-21CAT transgene RNAs. The letter B = 5 x 10⁶molecules. B) Plot of signal versus CAT RNA molecules of the standard curvein A. The equation of the line drawn through the points allows the conversionof the developmental timecourse signal into numbers of RNA molecules. C)Appearance of Pgk-21CAT RNA during development. The signal in A wasconverted to numbers of CAT RNA molecules using the standard curve and ispresented as molecules CAT RNA per ng total RNA as a function of development.
of variability was seen, we were unable to use a single standardcurve for multiple experiments, and were required to include anew standard curve to run alongside each set of experiments.
Uniformity among reaction vesselsThe efficiency of the pcr is affected by variables such asincubation time, reaction temperature, and the concentrations ofthe substrates. Variation in the efficiency of pcr among individualtubes in an experiment would lead to unequal amplification fromtube to tube, making quantitation impossible. The linearity ofthe standard curves presented above (each data point representinga separate tube) suggests that each sample is amplifying with thesame efficiency. To test this directly, triplicate samples of5,000,000 molecules of CAT RNA were each amplified for 19,21, 23 or 25 cycles and processed as described above. Figure2C shows a semilog plot of signals corresponding to the 12samples. The variation in signal among triplicate samples is 20%or less. The efficiency of amplification (calculated byN=N0(1+eff.)n) at 19, 21 and 23 cycles is nearly 100%,however, by 25 cycles the efficiency of amplification is clearlydecreasing. Thus, we can conclude that while in the exponentialrange of the reaction, the efficiency of amplification is uniform,both for adjacent tubes at a particular cycle number and forreactions amplified for sequential numbers of cycles.
PGK-2/CAT RNA developmental timecourseHaving demonstrated that we can select conditions under whichthe reaction is linear with in vitro transcribed standards, we nextapplied the technique to experimental samples. We have shownpreviously that CAT activity expressed from a PGK-21CATtransgene is found only in the mouse testis and is first detectedat post natal day 13 (1 1). To analyze the developmental pattern
*a
* _,,*4 ,
Figure 4. Developmental accumulation and quantitation of Pgk-2, mP2, PGK-2transgene and PGK-21CAT transgene RNAs. One hundred ng total testis RNAisolated from mice at various days was subjected to the RTpcr protocol for variouscycles. A) Semilog plot of the message levels of the four genes analyzed. mP2,open squares; PGK-2, open circles; mPgk-2, open triangles; PGK-21CAT, closeddiamonds. B) Autoradiographs of pcr products used to derive points in A. Thetarget gene amplified in each experiment is indicated. Numbers refer to thedevelopmental age in days of each RNA sample. The letters refer to the numberof in vitro transcribed RNA molecules used in each standard curve. A, I x 107in the mPgk-2 experiment, 1 x 10⁸ in the mP2 experiment; B, 5 x 10⁶. Note thatin the mPgk-2 experiment, the IOA sample (1 x 10⁸ molecules) is out of the linearrange and was not used in the standard curve calculation.
of expression, CAT RNA levels were measured in samples oftestis RNA isolated from transgenic PGK-2/CAT mice of variousages. Post natal days 15 to day 25 were monitored closely asthis represents the period of most dynamic change in theexpression of the PGK-2 promoter.
In a single experiment, 100 nanogram aliquots of RNA frommouse testes at post natal days 15, 17, 22, 25, and 60 wereamplified at 21 cycles using primers corresponding to sequencesin the CAT coding region. Included alongside the experimentalpoints in separate tubes was a standard curve consisting offourfold serial dilutions of T3 transcribed CAT RNA startingat 5,000,000 molecules. The standard curve was amplifiedsimultaneously using the same primers under identical conditions.Figure 3A shows an autoradiogram of the resulting pcr products.The points of the standard curve, designed to encompass the rangeof the experimental points, were quantitated, and demonstratedthat the reaction was in the linear range (Figure 3B). The standardcurve was used to convert the signal from the experimental points(d5-d60) to molecules of CAT RNA per nanogram total RNA.
g, k'2./(.`.,LN 'T

Nucleic Acids Research, Vol. 19, No. 7 1561
The resulting plot of the developmental accumulation ofPGK-21CAT RNA (Figure 3C) shows the level of messageincreasing from 250 molecules/ng total RNA at day 15 to 10,000molecules/ng at day 60. The majority of the RNA accumulatesbetween days 17 and 25 and correlates with the appearance andproliferation of pachytene spermatocytes in the developing testis(14). The observation that the level of specific message pernanogram total RNA remains at a high level from day 25 to day60, a period during which the proportion of pachytene cells inthe testis is decreasing, suggests that PGK-2ICAT RNA is alsobeing expressed at significant levels in spermatids, thepredominant cell-type in the adult mouse testis (14).
Mouse Pgk-2, Protamine 2 (mP2), and human PGK-2developmental accumulationTo determine if the Pgk-2/CAT transgene expression reflects thatof the human transgene and endogenous Pgk-2 genes, weanalyzed the expression patterns of both the human genomicPGK-2 transgene and the endogenous Pgk-2 locus and comparedthe expression levels and patterns to that of PGK-21CAT. Ameasure of developmental accumulation of these genes woulddetermine more precisely the regulation of the Pgk-2 genes inthe testis and would uncover any differences in the regulationof the three genes. mP2 was also analyzed, as its expressionpattern begins in the haploid round spermatid stage ofspermatogenesis (15). The expression pattern of mP2 is importantas it will delineate the appearance and proliferation of roundspermatids, and will thus serve as a reference point for the Pgk-2expression patterns.Each of the three genes, mouse Pgk-2, mP2, and the human
PGK-2 transgene were analyzed by RTpcr using a standard curvefor each obtained using known amounts of T3 or T7 transcribedRNAs. The standard curves demonstrated linearity ofamplification and allowed absolute quantitation of the expressionlevels as described above. RNA isolated from mice containingthe human PGK-2 transgene was used for both the endogenousmPgk-2 gene and the PGK-2 transgene. RNA isolated from micecontaining the PGK-2ICAT transgene was used for the mP2experiment. Figure 4 shows developmental RNA accumulationcurves for all four genes analyzed. Among the Pgk-2 genes, thehighest level of expression is found in the human PGK-2transgene, and the lowest in the PGK-2ICAT transgene. Levelsof expression of transgenes are in part a function of their siteof chromosomal integration, and therefore, correlating the levelsof expression with the presence or absence of transcriptionalsignals is difficult. The transgenic lines chosen for this analysiswere the highest expressing lines tested (11), and despite concernsover position of integration effects, the three Pgk-2 promotedRNA levels varied less than fourfold. More importantly,examination of the RNA accumulation of the three genesdemonstrates that all three genes are expressed with very similardevelopmental timecourses. In contrast, the mP2 developmentalanalysis shows a very different pattern of RNA accumulation.Expression of mP2 is first detected at day 22 and accumulationreaches 65% of maximum levels by day 30; this is consistentwith mP2 gene expression inititating in round spermatids.
DISCUSSIONHere we describe a procedure for the quantitative analysis ofRNA message levels using reverse transcription and thepolymerase chain reaction. We have shown that by careful
selection of cycle number and quantity of input RNA we canreadily quantitate RNA levels. Because we have demonstrateduniform amplification from tube to tube, we are able to includea standard curve alongside the experimental points to determineabsolute levels of mRNA. This protocol is rapid and simple: upto twelve samples of RNA have been quantitated in less thanseven hours with sufficient resolution to detect at least twofolddifferences in the amount of RNA. Incorporation of 32p labeleddATP into the pcr product increases sensitivity, allows simplequantitation, and eliminates the need for Southern transfer. Thelinear range of the assay is demonstrated here to be greater thantwo orders of magnitude. By using less input RNA or fewercycles, this linear range can be extended greatly. At very lowlevels of input RNA the signal begins to level off as the numberinput molecules continues to decrease, and we believe this is dueto contaminating RNA or DNA. We have not attempted tostringently eliminate contamination in our system, although, byreducing the level of contamination we would expect to increasethe sensitivity of the assay.The linearity achieved with this method may be attributed to
several factors. First, limiting cycle number and input RNAmolecules keeps all other substrates in excess. Designing theprotocol to use one tube, one buffer for all enzymatic reactionsalso minimizes variability. The use of the 3' pcr primer (asopposed to a poly dT oligomer) to prime the reverse transcriptasereaction eliminates the potential for differential primingefficiencies of certain messages and insures uniform cDNAsynthesis. Additionally, maintaining the annealing temperatureat the Tm of the primers reduces the level of background bands,and may therefore increase linearity by not depleting thesubstrates.Although this protocol uses unaltered in vitro transcribed RNA
molecules as the template, these molecules differ from the targetmessages not only in length but in the absence of modificationsthat natural messages contain ( 5' capping and 3' poly A tail).These differences may affect the efficiency of amplification inearly steps of the pcr and could affect the accuracy of thequantitation. Additionally, care must be taken to assure that allreactions amplify with equal efficiency. Therefore, a standardcurve in the linear range that brackets the experimental pointsis essential for accurate quantitation. Another variable that couldaffect the efficiency of the reaction is the source and preparationof the RNA sample. We have amplified standard amount ofCATRNA in samples of total RNA from various mouse tissues andshown that all samples amplify with similar efficiencies (data notshown). However, RNA preparations of different purity orresidual contaminants might be expected to have differentamplification efficiencies.
Several other pcr protocols have been published for quantitatingRNA levels. These protocols rely on internal standards that mustbe modified to produce an amplified product that may bedistinguished from the target pcr product. Such modificationsinclude addition of a restriction site (2,4), addition of an intron(4) and the construction of an artificial amplification template(3). The use of such internal standards requires not only theadditional steps to prepare these altered template, but alsonecessitates performing several pcr reactions to quantitate eachsample of RNA.
In our analysis of the transcriptional control of the Pgk-2 geneduring spermatogenesis, RTpcr has enabled us to readily measurethe steady-state levels of Pgk-2 RNA throughout the developmentof the germ-cell. By determining the initiation of transcription

1562 Nucleic Acids Research, Vol. 19, No. 7
and quantitating the accumulation of message of the three genes,we show here that the PGK-21CAT transgene, the PGK-2transgene, and the mouse Pgk-2 gene all function in an identicalmanner. We assume therefore that the transcriptional machineryin the developing germ cell recognizes the same cis-actingsequences in the 1.4 kb human 5' sequence as in the endogenouslocus.The developmental curves presented here also serve as markers
for the appearance and proliferation of specific cell-types in thedeveloping testis. As the appearance and accumulation of mP2RNA is a marker for the appearance and proliferation of roundspermatids, we suggest that the peak of Pgk-2 expression occursearlier, during the pachytene stage of germ cell development.Noting that the proportion of pachytene cells peaks atapproximately day 21, then decreases in the adult (14), thecontinued high levels of expression of Pgk-2 RNA duringdevelopment suggest that continued expression occurs in haploidround spermatids. This conclusion is supported by in situ data(16 and our unpublished observations).Singer-Sam et. al. (9), using a related technique with separated
spermatogenic cell populations, showed that round spermatidshad the highest level of Pgk-2 RNA. This apparent discrepancymay be reconciled by the observation that round spermatidscontain roughly one fourth as much RNA as pachytenespermatocytes (17), causing the Pgk-2 specific RNA to appearhigher in round spermatids when calculated as a function of totalRNA. Analysis on a per cell basis (as done in in situ experiments),or as a function of total testis RNA, however, shows the highestlevels of Pgk-2 RNA to be in pachytene cells.
This type of analysis is very useful for determining theaccumulation of specific messages during development andcorrelating those messages with the appearance and proliferationof specific cell-types. These expression curves allow us to plotcoordinate regulation of both messages and protein products asa function of development and therefore to learn more about thecontrol of development in the testis.
12. Gold, B., Fujimoto, H., Kramer, J. M., Erickson, R. P. and Hecht, N.B. (1983) Dev. Biol. 98, 392-399.
13. Auffray, C. and Rougeon, F. (1980) Eur. J. Biochem. 107, 303-324.14. Bellve, A. R., Cavicchia, J. C., Millete, C. F., O'Brien, D. A., Bhatnagar,
Y. M. and Dym, M. (1977) J. Cell Biol. 74, 68-85.15. Kleene, K. C., Distel, R. J. and Hecht, N. B. (1984) Dev. Biol. 105, 71-79.16. Goto, M., Koji, T., Kiyonobu, M., Tamaru, M., Koikeda, S., Nakane, P.
K., Mori, N., Masamune, Y. and Nakanishi, Y. (1990) Exp. Cell Res. 186,273-278.
17. Kleene, K. C., Distel, R. J. and Hecht, N. B. (1983) Dev. Biol. 98, 455-464.
ACKNOWLEDGEMENTSWe would like to thank Andrew Pakula and Tom Wilkie forcritical review of the manuscript. This work was supported byN.I.H. grant AG 07687.
REFERENCES1. Mullis, K. B. and Faloona, F. A. (1987) Methods Enzymol. 155, 335-350.2. Becker-Andre, M. and Hahlbrock, K. (1989) Nucleic Acids Res. 17,
9437-9446.3. Wang, A. M., Doyle, M. V., and Mark, D. F. (1989) Proc. Natl. Acad.
Sci. 86 9717-9721.4. Gilliland, G., Perrin, S., Blanchard, K. and Bunn, H. F. (1990) Proc. Natl.
Acad. Sci. 87, 2725-2729.5. Chelly, J., Kaplan, J., Maire, P., Gantron, S. and Kahn, A. (1988) Nature
333, 858-860.6. Rappolee, D. A., Mark, D., Banda, M. J. and Werb, Z. (1988) Science
241, 708-712.7. Frye, R. A., Benz, C. C. and Liu, E. (1989) Oncogene 4, 1153-1157.8. Brenner, C. A., Tam, A. W., Nelson, P. A., Engleman, E. G., Suzuki,
N., Fry, K. E. and Larrick, J. W. (1989) Biotechniques 7, 1096-1103.9. Singer-Sam, J., Robinson, M. O., Bellve, A. R., Simon, M. I. and Riggs,
A. D. (1990) Nucleic Acids Res. 18, 1255-1259.10. Chelly, J., Concordet, J., Kaplan, J. and Kahn, A. (1989) Proc. Natl. Acad.
Sci. 86, 2617-2621.11. Robinson, M. O., McCarrey, J. R. and Simon, M. I. (1989) Proc. Natl.
Acad. Sci. 86, 8437-8441.
Copyright © 2022 FDOKUMEN