UTCC International Journal of Business - ThaiJO
214
UTTC IJBE | 1 Content Page BRAND EQUITY AND MARKETING EFFECTING SUNSCREEN BUYING DECISION OF WOMEN IN BANGKOK Sivanart Phongvisit, Rawida Wiriyakitjar and Aticha Promrat ……………………………………3 SPA MANAGEMENT AFTER THE COVID-19 PANDEMIC Prattana Punnakitikashem, Nattapan Buavaraporn and Umaporn Wiwatreungdech………...17 EXAMINING CHINESE TOURISTS’ TRAVELING BEHAVIOR ENGAGED WITH CULTURAL TOURISM IN THAILAND Korawan Sangkakorn, Pachernwaat Srichai and Ravee Phoewhawm ...…………………..…41 FACTORS INFLUENCE ONLINE SHOPPING AND OFFLINE SHOPPING: CASE STUDIES OF RETAIL FOOTWEAR INDUSTRY IN BANGKOK SetthaYusuk and Suthawan Chirapanda …....………………………………………………...53 THE DEVELOPMENT OF CUSTOMER JOURNEY ON PATIENT SERVICE DESIGN: A CASE STUDY IN HEALTHCARE BUSINESS IN THAILAND Tarittawan Chareanporn, Chanin Yoopetch, Chatrudee Jongsureyapart, Piyanart Junkrachang and Ekawee Vinitkhatkumnuen………………………...………..…….77 THE IMPORTANCE OF INNOVATION FOR ENTREPRENEURIAL SUSTAINABILITY FOR SOCIAL ENTREPRENEURS IN ASIA-PACIFIC Ulrike Guelich and Hans Michael Guelich ………………………………………………..… 97 THAILAND 4.0: A NEW VALUE-BASED ECONOMY AND ITS IMPLICATION ON WELLNESS BUSINESS Surada Chundasutathanakul and Suthawan Chirapanda ………………………………...… 113 FACTORS AFFECTING THE RESIDENTIAL REAL ESTATE PRICES IN CHINA Jing Zhou ……………………………………………………………………………………. 133 MIDDLE-INCOME TRAP: REFLECTION ON MALAYSIA’S ECONOMIC DEVELOPMENT AND POLICY IMPLICATIONS Hieu C. Nguyen ..……………………………………………………………………………. 155 INVESTIGATING THE FACTORS EFFECTING SERVICE QUALITY UNDER LEAN IMPLEMENTATION WITHIN COMMERCIAL AIRLINES INDUSTRY IN THAILAND Walwisa Pongugsorn and Nattapan Buavaraporn.…………………….. ………………….. 187 Guide for authors …………………..……………………………………………………...... 209
-
Upload
khangminh22 -
Category
Documents
-
view
3 -
download
0
Transcript of UTCC International Journal of Business - ThaiJO
UTCC International Journal of Business and Economics
UTTC IJBE | 1
Content Page
BRAND EQUITY AND MARKETING EFFECTING SUNSCREEN BUYING
DECISION OF WOMEN IN BANGKOK
Sivanart Phongvisit, Rawida Wiriyakitjar and Aticha Promrat ……………………………………3
SPA MANAGEMENT AFTER THE COVID-19 PANDEMIC
Prattana Punnakitikashem, Nattapan Buavaraporn and Umaporn Wiwatreungdech………...17
EXAMINING CHINESE TOURISTS’ TRAVELING BEHAVIOR ENGAGED
WITH CULTURAL TOURISM IN THAILAND
Korawan Sangkakorn, Pachernwaat Srichai and Ravee Phoewhawm ...…………………..…41
FACTORS INFLUENCE ONLINE SHOPPING AND OFFLINE SHOPPING:
CASE STUDIES OF RETAIL FOOTWEAR INDUSTRY IN BANGKOK
SetthaYusuk and Suthawan Chirapanda …....………………………………………………...53
THE DEVELOPMENT OF CUSTOMER JOURNEY ON PATIENT SERVICE DESIGN:
A CASE STUDY IN HEALTHCARE BUSINESS IN THAILAND
Tarittawan Chareanporn, Chanin Yoopetch, Chatrudee Jongsureyapart,
Piyanart Junkrachang and Ekawee Vinitkhatkumnuen………………………...………..…….77
THE IMPORTANCE OF INNOVATION FOR ENTREPRENEURIAL SUSTAINABILITY
FOR SOCIAL ENTREPRENEURS IN ASIA-PACIFIC
Ulrike Guelich and Hans Michael Guelich ………………………………………………..… 97
THAILAND 4.0: A NEW VALUE-BASED ECONOMY AND ITS IMPLICATION ON
WELLNESS BUSINESS
Surada Chundasutathanakul and Suthawan Chirapanda ………………………………...… 113
FACTORS AFFECTING THE RESIDENTIAL REAL ESTATE PRICES IN CHINA
Jing Zhou ……………………………………………………………………………………. 133
MIDDLE-INCOME TRAP: REFLECTION ON MALAYSIA’S ECONOMIC
DEVELOPMENT AND POLICY IMPLICATIONS
Hieu C. Nguyen ..……………………………………………………………………………. 155
INVESTIGATING THE FACTORS EFFECTING SERVICE QUALITY UNDER LEAN
IMPLEMENTATION WITHIN COMMERCIAL AIRLINES INDUSTRY IN THAILAND
Walwisa Pongugsorn and Nattapan Buavaraporn.…………………….. ………………….. 187
Guide for authors …………………..……………………………………………………...... 209

UTCC International Journal of Business and Economics
UTTC IJBE | 2
UTCC International Journal of Business and Economics
UTTC IJBE | 3
UTCC International Journal of Business and Economics (UTCC IJBE)
Volume 13 Number 2, August 2021
BRAND EQUITY AND MARKETING EFFECTING
SUNSCREEN BUYING DECISION OF WOMEN IN
BANGKOK
Sivanart Phongvisit1, Rawida Wiriyakitjar2 and
Aticha Promrat3 1,2,3School of Business, University of the Thai Chamber of Commerce
126/1 Vibhavadi Rangsit Rd., Dindang, Bangkok 10400, Thailand [email protected], [email protected], [email protected]
Abstract
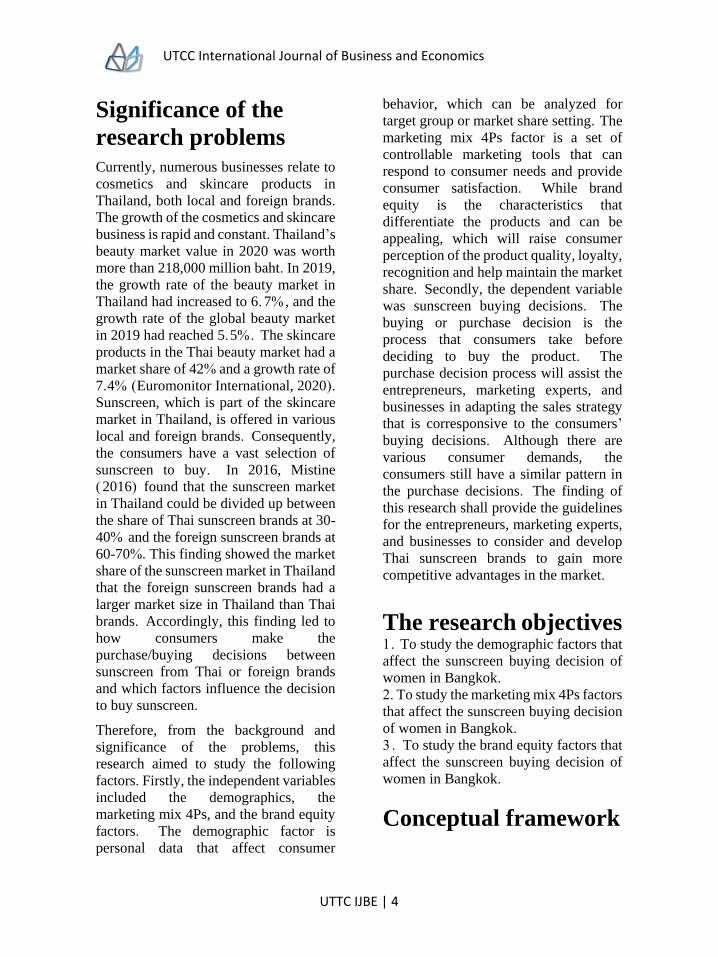
This research aimed to study the demographics, the marketing mix 4Ps, and the brand
equity factors that affect the consumers’ purchase decision on sunscreen of women in
Bangkok. The sample in this research was the 400-female consumer in Bangkok who
purchased decision sunscreen from Thailand (Local Brand) and sunscreen from a foreign
country (Inter Brand) from Din Dang district, Ladprao district, Huaykwang district, and
Wang Thonglang district, and respondents were selected using purposive sampling. In
addition, the reliability test showed the Cronbach’s alpha coefficient of these tools was
0.71-0.88. The data was collected by using questionnaires. The statistics of data analysis
were mean, frequency, standard deviation, t-test, One Way ANOVA, and multiple
regression analysis. The results showed that most of the sample were female, 20-30 years
old, employees, had a bachelor’s degree, whose single status, with an average monthly
income of 10,000 – 20,000 baht. The different demographics in terms of age, profession,
education level, and income significantly affect the sunscreen purchase decisions of
women in Bangkok. The marketing mix 4Ps in terms of product, price, and promotion
significantly affect the sunscreen purchase decision of women in Bangkok. The brand
equity in terms of brand perceived quality, brand association, and brand loyalty
substantially affects women’s sunscreen purchase decisions in Bangkok.
Keyword: Brand Equity, Marketing Mix, Decision, Sunscreen
UTCC International Journal of Business and Economics
UTTC IJBE | 4
Significance of the
research problems Currently, numerous businesses relate to
cosmetics and skincare products in
Thailand, both local and foreign brands.
The growth of the cosmetics and skincare
business is rapid and constant. Thailand’s
beauty market value in 2020 was worth
more than 218,000 million baht. In 2019,
the growth rate of the beauty market in
Thailand had increased to 6. 7% , and the
growth rate of the global beauty market
in 2019 had reached 5.5%. The skincare
products in the Thai beauty market had a
market share of 42% and a growth rate of
7.4% (Euromonitor International, 2020).
Sunscreen, which is part of the skincare
market in Thailand, is offered in various
local and foreign brands. Consequently,
the consumers have a vast selection of
sunscreen to buy. In 2016, Mistine
( 2016) found that the sunscreen market
in Thailand could be divided up between
the share of Thai sunscreen brands at 30-
40% and the foreign sunscreen brands at
60-70%. This finding showed the market
share of the sunscreen market in Thailand
that the foreign sunscreen brands had a
larger market size in Thailand than Thai
brands. Accordingly, this finding led to
how consumers make the
purchase/buying decisions between
sunscreen from Thai or foreign brands
and which factors influence the decision
to buy sunscreen.
Therefore, from the background and
significance of the problems, this
research aimed to study the following
factors. Firstly, the independent variables
included the demographics, the
marketing mix 4Ps, and the brand equity
factors. The demographic factor is
personal data that affect consumer
behavior, which can be analyzed for
target group or market share setting. The
marketing mix 4Ps factor is a set of
controllable marketing tools that can
respond to consumer needs and provide
consumer satisfaction. While brand
equity is the characteristics that
differentiate the products and can be
appealing, which will raise consumer
perception of the product quality, loyalty,
recognition and help maintain the market
share. Secondly, the dependent variable
was sunscreen buying decisions. The
buying or purchase decision is the
process that consumers take before
deciding to buy the product. The
purchase decision process will assist the
entrepreneurs, marketing experts, and
businesses in adapting the sales strategy
that is corresponsive to the consumers’
buying decisions. Although there are
various consumer demands, the
consumers still have a similar pattern in
the purchase decisions. The finding of
this research shall provide the guidelines
for the entrepreneurs, marketing experts,
and businesses to consider and develop
Thai sunscreen brands to gain more
competitive advantages in the market.
The research objectives 1. To study the demographic factors that
affect the sunscreen buying decision of
women in Bangkok.
2. To study the marketing mix 4Ps factors
that affect the sunscreen buying decision
of women in Bangkok.
3 . To study the brand equity factors that
affect the sunscreen buying decision of
women in Bangkok.
Conceptual framework

UTCC International Journal of Business and Economics
UTTC IJBE | 5
This research consisted of the conceptual
frameworks including the demographic
factors (Hanna & Wozniak, 2001,
Schiffman & Kanuk, 1994), marketing
mix 4Ps factors (Kotler & Keller, 2012),
and brand equity factors (Aaker, 1991)
that affected the buying decisions (Kotler
& Keller, 2012), as shown in Picture 1.
Figure 1 Conceptual framework
Research methodology
This research is quantitative research
with the following research
methodology.
Population and sample group
The population and sample group is the
female consumers in Bangkok that
selected and purchased sunscreen. The
sample group was chosen by purposive
sampling. The sample size was
calculated using W.G. Cochran’s
unknown population formula (1941) and
set a reliability value at 95% with the
margin of error at 5%. The sample group
consisted of 385 people, but the actual
data collection had obtained all 400
complete questionnaires.
Validation of the research
instruments
1. The test on content validity from 4
experts.
2. Validation on reliability using
Cronbach’s alpha coefficient found that
the marketing mix variables had
reliability values as followed: a product
Demographics
1.Age
2.Profession
3.Education level
4.Status
5.Average monthly income
Marketing mix 4Ps 1.Product 2.Price or Pricing
3.Place (distribution channels)
4.Promotion
Brand equity 1.Brand awareness 2.Brand perceived quality
3.Brand association
4.Brand loyalty
Sunscreen buying decisions
1.Problem recognition
2.Information search
3.Evaluation of alternatives
4.Purchase
5.Post-purchase behavior
dependent variables independent variables
UTCC International Journal of Business and Economics
UTTC IJBE | 6
variable was 0.818, a pricing variable
was 0.815, a place variable was 0.710,
and a promotion variable was 0.887. The
brand equity variables had reliability
values as followed: a brand awareness
variable was 0.839, a brand perceived
quality was 0.813, a brand association
was 0.816, and brand loyalty was 0.877.
The variable of sunscreen purchase
decision had a reliability value of 0.801.
The protection of the data
subjects and data collection
Before the data collection, the researcher
asked the data subjects for consent to
provide useful data for this research in
advance. The questionnaire did not have
or show any data that can identify the
identity of the data subjects. All data
collected from the data subjects was
stored by the researcher on the computer
with security password protection to
prevent unauthorized access to the
collected data. The Research Ethics
Committee of the Business
Administration Graduate School,
University of the Thai Chamber of
Commerce, had considered and excluded
this research from the ethics in human
research review by the international
standard because this research fell within
the scope of review exemption. For the
data collection, the researcher distributed
the questionnaire among the target group
within Bangkok.
Data analysis
In this research, the researcher had
analyzed the statistical data as followed.
5.1 Descriptive statistics were analyzed,
including mean, frequency, percentage,
and standard deviation.
5.2 Inferential statistics were analyzed by
the Independent Sample t-test, One Way
ANOVA, and multiple regression
analysis.
Research findings
1. The results of personal data analysis by
the calculation of maximum frequency,
percentage and, personal data found an
age of 252 subjects was around 20-30
years old (63.00%), a profession of 158
subjects was company employee
(39.50%), an education level of 295
subjects was Bachelor’s degree/High
Vocational Certificate (73.75%), a status
of 336 subjects was single (84.00%), an
average salary of 150 subjects was about
10,000-20,000 baht (37.50%).
2. The results of the descriptive statistics
analysis using mean, standard deviation,
and satisfaction level were as followed.
2.1 The overall result of data analysis on
the marketing mix 4Ps variables was at
the highest level, with the mean was at
4.34 and the standard deviation was at
0.48. The analysis on each variable found
that a product variable had a mean of 4.61
and a standard deviation of 0.43. A
pricing variable had a mean of 4.23 and a
standard deviation of 0.61. A place
variable had a mean of 4.54 and a
standard deviation of 0.55. A promotion
variable had a mean of 3.97 and a
standard deviation of 0.73. The results
are shown in Table 1.

UTCC International Journal of Business and Economics
UTTC IJBE | 7
Table 1 shows the analysis result on the marketing mix 4Ps variables/factors by calculating
the mean, standard deviation, and satisfaction level.
Marketing Mix 4Ps Variables X S.D. Satisfaction
Product 4.61 0.43 Highest
Pricing 4.23 0.61 Highest
Place 4.54 0.55 Highest
Promotion 3.97 0.73 High
Total 4.34 0.48 Highest
2.2 The overall result of data analysis on
the brand equity variables was at the
highest level, with the mean was at 4.32,
and the standard deviation was at 0.55.
The analysis on each variable found that
a brand awareness variable had a mean of
4.40 and a standard deviation of 0.58. A
brand perceived quality variable had a
mean of 4.42 and a standard deviation of
0.57. A brand association variable had a
mean of 4.23 and a standard deviation of
0.65. A brand loyalty variable had a mean
of 4.21 and a standard deviation of 0.71.
The results are shown in Table 2.
Table 2 shows the analysis result of the brand equity variables/factors by calculating the
mean, standard deviation, and satisfaction level.
Brand Equity Variables X S.D. Satisfaction
Brand awareness 4.40 0.58 Highest
Brand perceived quality 4.42 0.57 Highest
Brand association 4.23 0.65 Highest
Brand loyalty 4.21 0.71 Highest
Total 4.32 0.55 Highest
2.3 The overall result of data analysis on
buying decisions was at the highest level,
with the mean was at 4.18 and standard
deviation was at 0.67, as shown in Table
3.
Table 3 shows the analysis result of the sunscreen buying decision by calculating the mean,
standard deviation, and satisfaction level.
Sunscreen Buying Decisions X S.D. Satisfaction
Plan before buying the sunscreen 3.88 1.07 High
Research the sunscreen information from 4.31 0.77 Highest
reliable sources before purchasing
Read up and make a comparison between sunscreen 4.39 0.68 Highest
products before making a purchase decision
Intend to buy sunscreen at a shopping mall or 4.60 0.67 Highest
through online channel
Intend to buy sunscreen from a nearby place 3.73 1.18 High
Total 4.18 0.67 High
UTCC International Journal of Business and Economics
UTTC IJBE | 8
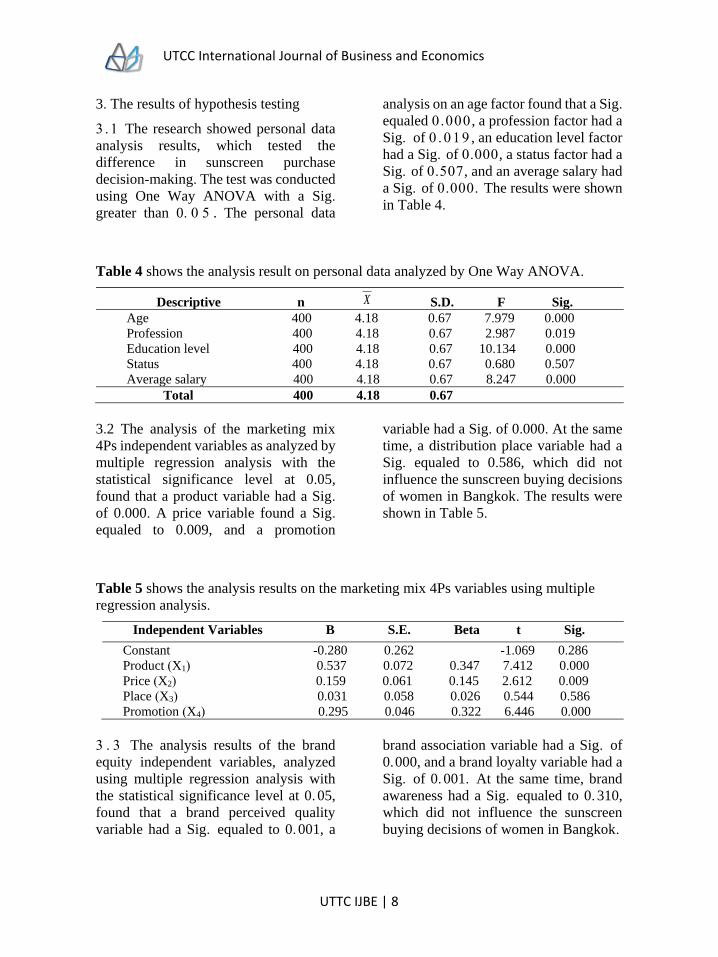
3. The results of hypothesis testing
3 . 1 The research showed personal data
analysis results, which tested the
difference in sunscreen purchase
decision-making. The test was conducted
using One Way ANOVA with a Sig.
greater than 0. 0 5 . The personal data
analysis on an age factor found that a Sig.
equaled 0.000 , a profession factor had a
Sig. of 0 . 0 1 9 , an education level factor
had a Sig. of 0.000, a status factor had a
Sig. of 0.507, and an average salary had
a Sig. of 0.000. The results were shown
in Table 4.
Table 4 shows the analysis result on personal data analyzed by One Way ANOVA.
Descriptive n X S.D. F Sig.
Age 400 4.18 0.67 7.979 0.000
Profession 400 4.18 0.67 2.987 0.019
Education level 400 4.18 0.67 10.134 0.000
Status 400 4.18 0.67 0.680 0.507
Average salary 400 4.18 0.67 8.247 0.000
Total 400 4.18 0.67
3.2 The analysis of the marketing mix
4Ps independent variables as analyzed by
multiple regression analysis with the
statistical significance level at 0.05,
found that a product variable had a Sig.
of 0.000. A price variable found a Sig.
equaled to 0.009, and a promotion
variable had a Sig. of 0.000. At the same
time, a distribution place variable had a
Sig. equaled to 0.586, which did not
influence the sunscreen buying decisions
of women in Bangkok. The results were
shown in Table 5.
Table 5 shows the analysis results on the marketing mix 4Ps variables using multiple
regression analysis.
Independent Variables B S.E. Beta t Sig.
Constant -0.280 0.262 -1.069 0.286
Product (X1) 0.537 0.072 0.347 7.412 0.000
Price (X2) 0.159 0.061 0.145 2.612 0.009
Place (X3) 0.031 0.058 0.026 0.544 0.586
Promotion (X4) 0.295 0.046 0.322 6.446 0.000
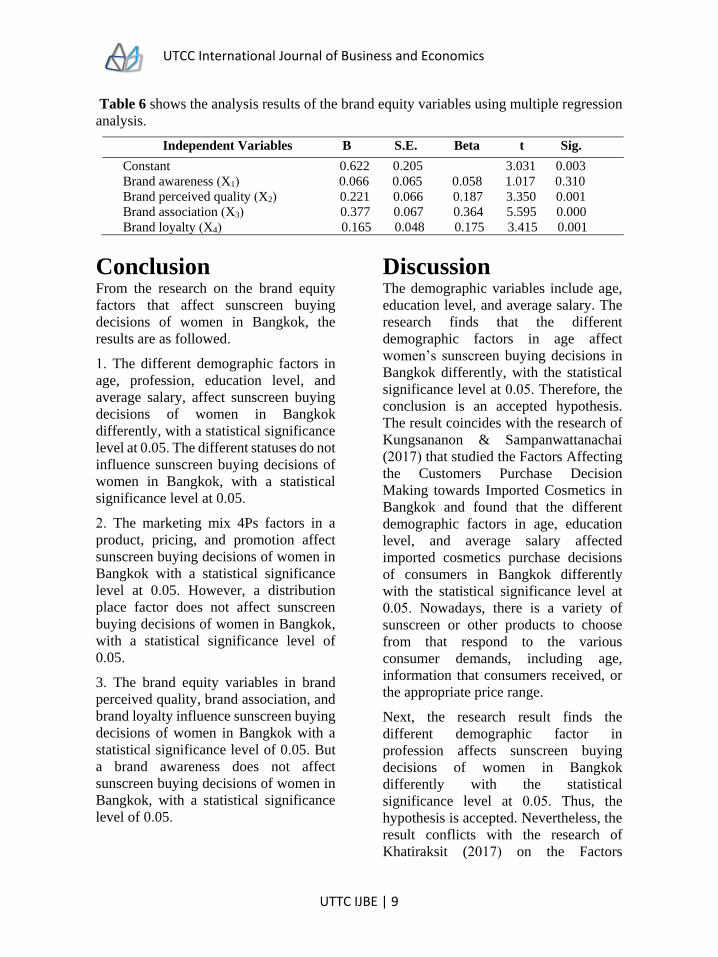
3 . 3 The analysis results of the brand
equity independent variables, analyzed
using multiple regression analysis with
the statistical significance level at 0. 05,
found that a brand perceived quality
variable had a Sig. equaled to 0. 001, a
brand association variable had a Sig. of
0.000, and a brand loyalty variable had a
Sig. of 0. 001. At the same time, brand
awareness had a Sig. equaled to 0. 310,
which did not influence the sunscreen
buying decisions of women in Bangkok.
UTCC International Journal of Business and Economics
UTTC IJBE | 9
Table 6 shows the analysis results of the brand equity variables using multiple regression
analysis.
Independent Variables B S.E. Beta t Sig.
Constant 0.622 0.205 3.031 0.003
Brand awareness (X1) 0.066 0.065 0.058 1.017 0.310
Brand perceived quality (X2) 0.221 0.066 0.187 3.350 0.001
Brand association (X3) 0.377 0.067 0.364 5.595 0.000
Brand loyalty (X4) 0.165 0.048 0.175 3.415 0.001
Conclusion From the research on the brand equity
factors that affect sunscreen buying
decisions of women in Bangkok, the
results are as followed.
1. The different demographic factors in
age, profession, education level, and
average salary, affect sunscreen buying
decisions of women in Bangkok
differently, with a statistical significance
level at 0.05. The different statuses do not
influence sunscreen buying decisions of
women in Bangkok, with a statistical
significance level at 0.05.
2. The marketing mix 4Ps factors in a
product, pricing, and promotion affect
sunscreen buying decisions of women in
Bangkok with a statistical significance
level at 0.05. However, a distribution
place factor does not affect sunscreen
buying decisions of women in Bangkok,
with a statistical significance level of
0.05.
3. The brand equity variables in brand
perceived quality, brand association, and
brand loyalty influence sunscreen buying
decisions of women in Bangkok with a
statistical significance level of 0.05. But
a brand awareness does not affect
sunscreen buying decisions of women in
Bangkok, with a statistical significance
level of 0.05.
Discussion The demographic variables include age,
education level, and average salary. The
research finds that the different
demographic factors in age affect
women’s sunscreen buying decisions in
Bangkok differently, with the statistical
significance level at 0.05. Therefore, the
conclusion is an accepted hypothesis.
The result coincides with the research of
Kungsananon & Sampanwattanachai
(2017) that studied the Factors Affecting
the Customers Purchase Decision
Making towards Imported Cosmetics in
Bangkok and found that the different
demographic factors in age, education
level, and average salary affected
imported cosmetics purchase decisions
of consumers in Bangkok differently
with the statistical significance level at
0.05. Nowadays, there is a variety of
sunscreen or other products to choose
from that respond to the various
consumer demands, including age,
information that consumers received, or
the appropriate price range.
Next, the research result finds the
different demographic factor in
profession affects sunscreen buying
decisions of women in Bangkok
differently with the statistical
significance level at 0.05. Thus, the
hypothesis is accepted. Nevertheless, the
result conflicts with the research of
Khatiraksit (2017) on the Factors
UTCC International Journal of Business and Economics
UTTC IJBE | 10
Influencing Purchase Decisions for
Sunscreen Products in the Bangkok
metropolitan area, Thailand that found
the different professions did not affect
different sunscreen products purchase
decisions of consumers in the Bangkok
metropolitan area with the statistical
significance level at 0.05. The careers are
more diverse, with varying working
hours and periods affecting the various
demands and expectations on sunscreen
or product effectiveness. Consequently,
the consumer needs on purchasing
sunscreen or other products will be
different. Moreover, there are different
sunscreen or other products in the current
market that respond to various needs of
consumers. Therefore, the demographic
factor in the profession that did not affect
different buying decisions in the past
would affect sunscreen or other
consumer products buying decisions
differently now.
In addition, the research finds that the
different demographic factor in status
does not affect sunscreen buying
decisions of women in Bangkok
differently with the statistical
significance level at 0.05. The conclusion
of this result rejects the hypothesis. This
result corresponds with Traikulnipat’s
(2016) research that studied the Factors
Influencing Consumer Choice of Sun
Screen Products in the Bangkok
Metropolitan Area and found the
different statuses did not affect different
sunscreen purchase decisions of
consumers in the Bangkok Metropolitan
area with the statistical significance level
at 0.05. This result shows that no matter
which statuses the consumers are in, they
still have the demands to buy products
and use them for similar purposes such as
self-cares, in which they recognize the
importance of sunscreen as a daily
necessity that will assist effectively with
the beauty, self-care, and health care.
On the marketing mix factors 4Ps in a
product, the sample group mainly
focused on the safety of use with the
mean at 4.84 and the highest level of
satisfaction. For the marketing mix factor
in pricing, the sample group mainly
emphasized the appropriate value for the
price with the mean of 4.70 and the
highest level of satisfaction. The research
result finds that the product and pricing
affect sunscreen buying decisions of
women in Bangkok, with the statistical
significance level at 0.05. Thereby, the
conclusion is an accepted hypothesis.
The result coincides with Kungsananon
& Sampanwattanachai’s (2017) research
that studied the Factors Affecting the
Customers Purchase Decision Making
towards Imported Cosmetics in Bangkok
and found the marketing mix factors in
product and pricing affected imported
cosmetics purchase decisions of
consumers in Bangkok with the statistical
significance level at 0.05. Now, the
consumers emphasize the product and
price, such as the quality, the product’s
effectiveness, the reasonable price for the
products, etc. But the result conflicts with
the research of Poonyarith (2016) that
studied the Marketing Mix and Brand
Equity Affecting the Distributor’s
Buying Decisions of AGELOC Products
at Nu Skin Enterprises (Thailand)
Limited in Bangkok and found the
marketing mix factors in product and
pricing did not affect the distributor’s
buying decisions of AGELOC products
at Nu Skin Enterprises (Thailand)
Limited in Bangkok with the statistical
significance level at 0.05. In the past, the
marketing mix factors like product and
pricing may not influence consumers’
purchase decisions because there was no

UTCC International Journal of Business and Economics
UTTC IJBE | 11
wide selection of the products and prices
or no significant differentiator for the
consumers.
Another variable of the marketing mix
4Ps is promotion. The sample group
emphasized the promotional campaigns
(discounts, exchanges, giveaways,
freebies) with the mean at 4.34 and the
highest level of satisfaction. The result
finds the marketing mix factor in
promotion affects sunscreen buying
decisions of women in Bangkok, with the
statistical significance level at 0.05.
Therefore, the research accepts the
hypothesis. This result also corresponds
with the past study of Sudsawatt (2010)
on the Factors of Marketing Mix and
Brand Equity that have an effect on how
the Bangkok university’s college student
decide to buy the Korean cosmetics that
the marketing mix factor in promotion
affected imported Korean cosmetics
buying decisions of Bangkok
university’s college students with the
statistical significance level at 0.05. The
marketing mix factor in promotion not
only provides consumers with the values
for the money but also provides an
exciting strategy to entice the consumers
and increases the confidence of products,
whether through advertising or
promotional campaigns.
Moreover, on the marketing mix factor in
distribution place, the sample group gave
importance to the availability of the
products at the hypermarkets,
supermarkets, shopping malls, or online
channels with the mean at 4.72 and the
highest level of satisfaction. Yet, the
research finds the marketing mix factor
in distribution places does not affect
sunscreen buying decisions of women in
Bangkok, with the statistical significance
level at 0.05. Thus, the hypothesis is
rejected. This result conflicts with
Sudsawatt’s (2010) research on the
Factors of Marketing Mix and Brand
Equity that have an effect on how the
Bangkok university’s college student
decide to buy the Korean cosmetics that
found the marketing mix factor in
distribution place affected imported
Korean cosmetics buying decisions of
Bangkok university’s college students
with the statistical significance level at
0.05. In the past, the product logistics
services were not as extensive or
effective. In contrast, present-day
logistics services can deliver the products
rapidly and more effectively with product
status tracking ability. Therefore, the
current distribution channels no longer
affect sunscreen or other product buying
decisions. There are many distribution
channels to purchase products, such as
hypermarkets, shopping plazas, or
online. The amount of time the
consumers need to travel to buy the
products and the amount of time the
consumers need to wait for the online
orders are also similar short.
For the brand equity factor in brand
perceived quality, the sample group
primarily emphasized the brands of
sunscreen that influenced the consumers’
perception of the reliable product quality,
with the mean at 4.50 and the highest
level of satisfaction. On the brand equity
factor in brand loyalty, the sample group
mainly emphasized the consumers’ pride
in telling other people that they have used
the sunscreen of the brands they bought
from, with the mean at 4.38 and the
highest level of satisfaction. The research
finds that the brand equity factors in
brand perceived quality and brand loyalty
affect sunscreen buying decisions of
women in Bangkok, with the statistical
significance level at 0.05. Therefore, the

UTCC International Journal of Business and Economics
UTTC IJBE | 12
hypothesis is accepted. This result
coincides with the study of Kungsananon
& Sampanwattanachai (2017) on the
Factors Affecting the Customers
Purchase Decision Making towards
Imported Cosmetics in Bangkok and
found the brand equity factors in brand
perceived quality and brand loyalty
affected imported cosmetics purchase
decisions of consumers in Bangkok with
the statistical significance level at 0.05.
Now, there are many brands of sunscreen
and other products, which may attribute
to the consumers’ perception of the brand
quality that will lead to brand
differentiation. The brand perceived
quality will then lead to the consumers’
confidence and loyalty to the brand.
However, this result conflicts with the
research by Kalyanavichai (2014) on the
Brand Equity and Personal Values
Affecting the Foreign Tourists’ Making
Decision to Purchase Brand Name
Products at the Shopping Malls in
Bangkok and found the brand equity
factors in brand perceived quality and
brand loyalty did not affect brand name
products purchase decisions of foreign
tourists in the shopping malls in Bangkok
with the statistical significance level at
0.05. In the past, the brand equity factor
in brand perceived quality might not
affect consumers’ purchase decisions
because there were not many product
brands as in the present day. There were
no significant development or
improvement in the brand perception or
appearance to differentiate from each
other. In comparison, the brand equity
factor in brand loyalty might not affect
the consumers’ decision to buy products
in the past because there was no emphasis
on securing the customer base, whether it
was the membership program or
promotional campaign to build brand
loyalty.
On the brand equity factor in brand
association, the sample group
emphasized the selected sunscreen
product brands generally accepted
among the consumers, with the mean at
4.46 and the highest level of satisfaction.
The research finds the brand equity factor
in brand association affects sunscreen
buying decisions of women in Bangkok,
with the statistical significance level at
0.05. Thus, the research accepts the
hypothesis. This result corresponds with
Vichit & Thongjeen’s (2018) research on
the Marketing Mixed, Brand Equity, and
Trust Affecting Purchasing Decisions of
Supplementary Vitamins in Bangkok and
found the brand equity factor in brand
association affected supplementary
vitamins purchase decisions in Bangkok
with the statistical significance level at
0.05. Because of the large variety of
products or merchandise that are now
distinguished, the consumers can
associate themselves with certain
elements the brands offer, such as when
the brands hire influential persons as the
brand ambassadors, etc., which can
increase consumers’ brand awareness.
Nonetheless, this finding conflicts with
the study of Kalyanavichai (2014) on the
Brand Equity and Personal Values
Affecting the Foreign Tourists’ Making
Decision to Purchase Brand Name
Products at the Shopping Malls in
Bangkok and found the brand equity
factor in brand association did not affect
brand name products purchase decisions
of foreign tourists in the shopping malls
in Bangkok with the statistical
significance level at 0.05. As in the past,
the products or other merchandise were
not as diverse as today’s market, so the

UTCC International Journal of Business and Economics
UTTC IJBE | 13
brand association might not be necessary
for consumers’ buying decisions.
Moreover, the research found that on the
brand equity factors in brand awareness,
the sample group mainly emphasized
buying the sunscreen based on the liking
of the brands, with the mean at 4.49 and
the highest level of satisfaction. The
result finds the brand equity factor in
brand awareness does not affect
sunscreen buying decisions of women in
Bangkok, with the statistical significance
level at 0.05. Therefore, the hypothesis is
rejected. This result coincides with the
research of Poonyarith (2016) that
studied the Marketing Mix and Brand
Equity Affecting the Distributor’s
Buying Decisions of AGELOC Products
at Nu Skin Enterprises (Thailand)
Limited in Bangkok and found the brand
equity factor in brand awareness did not
affect the distributor’s buying decisions
of AGELOC products at Nu Skin
Enterprises (Thailand) Limited in
Bangkok with the statistical significance
level at 0.05. Brand awareness can be
raised through advertisement, word of
mouth, etc., and generally can be seen.
The consumers may not place importance
on brand awareness but focus more on
the other factors that emphasize the
quality, effectiveness of the products or
merchandise, pricing, appearances, the
relationship between the consumers and
the brands, etc., that related to the
consumers’ benefits more. This result
does not correspond with the research of
Kungsananon & Sampanwattanachai
(2017) that studied the Factors Affecting
the Customers Purchase Decision
Making towards Imported Cosmetics in
Bangkok and found the brand equity
factor in brand awareness affected
imported cosmetics purchase decisions
of consumers in Bangkok with the
statistical significance level at 0.05. In
Kungsananon & Sampanwattanachai’s
(2017) research, they studied the factors
affecting the imported cosmetics from
foreign countries of consumers in
Bangkok, which emphasized the
imported cosmetic products from foreign
countries. There was a possibility that the
import of foreign cosmetic products into
Thailand had increased the consumers’
confidences, so the consumers placed
importance on the brand awareness such
as the advertisement to boost the brand’s
reliability or the words of mouths that
increase the confidence in trying out the
products, which affect the consumers’
buying decisions.
Recommendation on adopting
the research findings and the
future researches
Recommendation on adopting the
research findings
1. On the marketing mix factors, the
entrepreneurs should emphasize the
quality, safety of the product, packaging,
or new technologies that apply to the
products. They should design the product
and set the pricing appropriated with the
quantity, packaging, quality, and
effectiveness of sunscreen products, such
as developing the sunscreen products in
various sizes or forms at different price
points. There should be a promotion on
discounts, exchanges, giveaways, or
freebies, such as giving discount codes or
coupons. On the marketing strategy,
there should be advertisements, creating
pictures or short videos on the brand’s
sunscreen products that display vital
information such as the product textures,
instruction on how to use, ingredients,
technologies, that will provide the
UTCC International Journal of Business and Economics
UTTC IJBE | 14
knowledge for the consumers to be aware
and pay more attention to the brands.
2. On the brand equity factors, there
should be an encouragement for the
consumers to write the product reviews,
which are the reviews from the actual
users, or create the collaboration with the
market’s influencers as the mediums for
spreading the information relating to the
sunscreen, which will increase the
awareness of the brands and give
consumers accurate information about
the products. These recommendations
will increase the consumers’ interests,
reliability, and quality perception that
will be factors for buying products.
Additionally, the brands should
emphasize connecting with the attitude
and lifestyles, such as hiring the market’s
influencers to help advertise the
products. The influencers in marketing
may be the persons with lifestyles that
encounter the sunlight, dust, pollution, or
have personal interests such as outdoor
activities, which will help the consumers
associate themselves unconsciously with
the brand. There should be more
emphasis on relationship building with
the customers, whether using
membership cards or reward cards, to
collect points through the purchases.
Moreover, the entrepreneurs or
marketing experts should focus more on
responding, listening to, and resolving
the problems for consumers through all
available channels, which will help raise
the consumers’ confidence and loyalty
toward the brands.
Recommendation on the future
researches In the subsequent researches, the
researchers can adopt the conceptual
framework of this study to be applied to
the other businesses, which share similar
characteristics. There should be a study
on other areas such as consumer
satisfaction or behaviors that affect the
buying decision. In addition, there should
be an expansion of the sample group for
better data analysis which will cover
more areas and provide more clarity to
the research findings that would be
utilized as a development approach to
increase the competitive advantages
within the market.
References
Aaker, D.A. (1991). Managing Brand Equity: Capitalizing on the Value of a Brand Name.
New York, N.Y: The Free Press.
Barwise, P. (1993). Brand equity: Snark or boojum?. International Journal of Research in
Marketing, 10(1), 93-104.
Clow, K. E. & Baack, D. ( 2005) . Brand and brand equity concise encyclopedia of
Advertising. New York: Routledge.
Eucerin. (2020). Sunlight and the Skin. Retrieved from https://www.eucerin.co.th/about-
skin/basic-skin-knowledge/sun-and-the-skin (In Thai).
Euromonitor International. (2563). Premium Beauty and Personal Care in Thailand.
Retrieved from https://www.euromonitor.com/premium-beauty-and
personal-care-in-thailand/ report

UTCC International Journal of Business and Economics
UTTC IJBE | 15
Hanna, N. & Wozniak, R. (2001). Consumer behavior: An applied approach. Englewood
Cliffs. New Jersey: Prentice Hall.
https://www.researchgate.net/figure/The-process-of-buying-decision-Johnston-
E-2013-a-Need-Recognition-Problem_fig3_268630448
Johnston, E. ( 2013) . The Process of Buying Decision. Retrieved from https://www.
researchgate.net/figure/The-process-of-buying-decision-Johnston-E-2 0 1 3 - a-
Need-Recognition-Problem_fig3_268630448
Jongkraijak, C. & Thongjeen, C. (2018). The impacts of Marketing Mix, Brand Equity, and
Attitude on Consumers Purchase Decision to Organic Vegetables in
Bangkok. ( Master Degree Independent Study) . Bangkok University, Khlong
Luang. (In Thai).
Kalyanavichai, S. ( 2014) . Brand Equity and Personal Values Affecting the Foreign
Tourists’ Making Decision to Purchase Brand Name Products at the
Shopping Malls in Bangkok. ( Master Degree Independent Study) . Bangkok
University, Khlong Luang. (In Thai).
Keller, K.L. (1998) . Branding perspectives on social marketing. Advances in Consumer
Research, 25, 299–302.
Khatiraksit, N. (2017). Factors Influencing Purchase Decisions for Sunscreen Products in
the Bangkok metropolitan area, Thailand. (Master of Business
Administration Independent Study). Thammasat University, Phra Nakhon. (In
Thai).
Kotler, P. & Keller, K. ( 2012) . Marketing Management. ( 12th ed. ) . Edinburgh Gate:
Pearson Education Limited.
Kreausa, N. & Charutawephonnukoon, P. (August, 2020). The Purchasing Behavior and
Marketing Mixed Factors Influencing The Decision To Buy De Leaf Brand Skin
Care Products of Customers in Bangkok. National Graduate Research
Conference. Rangsit University, Muang Pathum Thani. (In Thai).
Kungsananon, S. & Sampanwattanachai, B. ( 2017) . Factors Affecting the Customers
Purchase Decision Making towards Imported Cosmetics in Bangkok. Journal of
Humanities and Social Sciences. Rajapruk University, 2(3), 84-95. (In Thai).
Laohasinnarong, S. (2014). Influence of Brand Equity on AIDA (Attention, Interest, Desire,
and Decision) to Buy Brand Name Products. ( Master Degree Independent
Study). Bangkok University, Khlong Luang. (In Thai).
Mistine. (2016). The Market Share of Sunscreen Products on Thailand in 2559. Retrieved
from https://marketeeronline.co/archives/25194 (In Thai).
Poonyarith, J. (2016). Marketing Mix and Brand Equity Affecting the Distributor’s Buying
Decisions of AGELOC Products at Nu Skin Enterprises ( Thailand) Limited in
Bangkok. (Master Degree Independent Study). Bangkok University, Khlong
Luang. (In Thai).
Schiffman, L.G. & Kanuk, L.L. (1994). Consumer Behavior (5th ed). New Jersey: Prentice
Hall Inc.
Sudsawatt, J. ( 2010) . Factors of Marketing Mix and Brand Equity that have an effect on
how the Bangkok university’ s college student decide to buy the Korea
cosmetics. (Master Degree Individualized Study) . Bangkok University,
Khlong Luang. (In Thai).
UTCC International Journal of Business and Economics
UTTC IJBE | 16
Traikulnipat, N. (2016). Factors Influencing Consumer Choice of Sunscreen Products in
the Bangkok Metropolitan Area. ( Master of Business Administration
Independent Study). Thammasat University, Phra Nakhon. (In Thai).
Vichit, J. & Thongjeen, C. (2018). Marketing Mixed, Brand Equity, and Trust Affecting
Purchasing Decisions of Supplementary Vitamins in Bangkok. University of
the Thai Chamber of Commerce Journal, 8(1), 262-272. (In Thai).
William, G.C. (1941). Sampling Theory When the Sampling-Units are of Unequal Sizes.
Journal of the American Statistical Association, 37, 199-212.
doi:10.2307/2279214

UTCC International Journal of Business and Economics
UTTC IJBE | 17
UTCC International Journal of Business and Economics (UTCC IJBE)
Volume 13 Number 2, August 2021
SPA MANAGEMENT AFTER THE COVID-19 PANDEMIC
Prattana Punnakitikashem1, Nattapan Buavaraporn2 and
Umaporn Wiwatreungdech3 1,3College of Management, Mahidol University
69 Vibhavadi Rangsit Rd., Samsennai, Phayathai, Bangkok 10400, Thailand 2International School of Management,
University of the Thai Chamber of Commerce
126/1 Vibhavadi Rangsit Rd., Dindang, Bangkok 10400, Thailand [email protected], [email protected]
Abstract
The spa industry has been severely affected by the COVID-19 pandemic. Many spa
businesses struggled with long-term impact from COVID-19 crisis. Considering as an
unexpected circumstance, it is imperative that spa businesses implement the right
strategy to survive in this challenging situation. Therefore, this study aims at
investigating problems and challenges of spa businesses during the COVID-19 crisis,
exploring the opportunities to manage problems of spa using McKinsey’s 7-S
framework, recommending the preparedness of spas for the post-COVID-19 phase. The
McKinsey’s 7-S is adopted as the main framework for achieving objectives of this study.
Qualitative research approach is adopted as the main research methodology. In order to
gain deep understanding and insights, in-depth interviews were conducted for gathering
data from two hotel spas in Bangkok and Khon Kaen provinces. Empirical data was
analyzed based on McKinsey’s 7-S Framework. The findings indicated that hotel spas
encountered a dramatic customer loss and the reduced number of staffs. The hotel spas
adjusted their marketing strategy to attract more domestic customers and managed
insufficient staff with a job rotation in which requiring multitasking skills. In terms of
post COVID-19 preparation, the hotel spas need to ensure the staffs’ health for hygiene
and safety reasons. Additionally, spa businesses should consider recruiting more staffs
to meet customer demands in the future. This study provides useful guidance and
recommendations for spas businesses to survive the COVID-19 crisis and to prepare for
future incidents.
Keywords: spa management, covid-19, spa, covid-19, pandemic
UTCC International Journal of Business and Economics
UTTC IJBE | 18
Introduction
The spa business is one of the world’s
largest leisure industries and spas have
become one of the standard facilities in
luxury hotels and resorts (Cohen &
Bodeker, 2008). The spa business
segment is also considered as the main
driver of the wellness tourism growth
around the world. It contributed $3.7
trillion dollars due to the growing
wellness trends (Global Wellness
Summit, 2017) and the number of total
wellness industry revenue in the US was
estimated to increase from $5.6 billion to
$11.32 trillion between 2007 to 2021
(The Statistics Portal, 2015). Among
countries around the world, Thailand has
been recognized as one of primary
countries for spa and wellness tourism in
Asia apart from being a leading holiday
destination in the world. The business has
been greatly supported through the
cooperation of the Ministry of Public
Health and the Ministry of Commerce
which aim to establish Thailand as the
“Health Tourism Hub of Asia” and the
Wellness Capital of Asia” (Johnston et
al., 2011). Despite the great support from
the government sector and the rising
trends of health and wellness tourism, the
spa business is not always run as
smoothly as expected since operators
have to tackle challenges in various
aspects such as the entry of new
competitive spas, the development of spa
service differences, and the creation of
unique experience to attract targeted
customers. More importantly, the spa
business is more vulnerable to threats
caused by reoccurring catastrophe and
unprecedented pandemics like COVID-
19.
COVID-19 (Coronavirus Disease 2019)
was declared by the World Health
Organization as a global pandemic on 11
March, 2020. Originated in Wuhan, the
capital city of Hubei, China, the disease
emergence occurred in late December
2019 and the disease spread rapidly
across 203 countries around the globe as
of 9 April, 2020, less than a month after
the WHO’s pandemic outbreak
declaration (Association of Southeast
Asian Nations, 2020). COVID-19 is
caused by the same family of viruses as
Severe Acute Respiratory Syndrome
(SARS), an epidemic occurring during
2002 and 2003. However, COVID-19 has
spread more easily and widely and
caused more fatalities. Moreover, from
global to local economy and from small-
to large-scale businesses have been
drastically impacted by the outbreak of
COVID-19.
Several businesses have been forced to
shut down as the current disease had led
to dramatic changes in business practices
and consumer behaviors such as social
distancing and more time spending at
home in accordance with mandatory
regulations imposed by worldwide
governments. Apparently, the current
disease has had great impacts on tourism
and hospitality sectors which are key
pillars for economic growth in several
countries due to the imposed disease
outbreak control measures including
travel restrictions and entry bans on
travelers from countries with certain
levels of active COVID-19 cases.
According to the UN World Tourism
Organization, as much as 96% of the
world’s destinations have implemented
such measures to stem the spread of
COVID-19 (World Tourism
Organization, 2020). Besides the strict
travel measures, people’s fears and high

UTCC International Journal of Business and Economics
UTTC IJBE | 19
anxiety of the novel disease have caused
cancellation of planned trips, flights, and
hotel room bookings. 80% of hotel rooms
globally become empty amid the
COVID-19 crisis (Asmelash & Cooper,
2020). Countries dependent on arrivals of
foreign travelers are more vulnerable and
hugely devastated by the impacts of the
COVID-19 crisis (International Labour
Organization, 2020) due to the sharp
decline of tourists from China and other
countries around the world.
The spread of COVID-19 pandemic
seems unlikely to stop in the near future.
All entrepreneurs and operators of
businesses including hotel spas may face
several problems and challenges. They
cannot help adjusting their business
practices and operations to the new
normal of COVID-19 in order to sustain
during the crisis. The businesses have put
a lot of their efforts to survive by
adopting various business management
models to adjust their business operations
in response to the COVID-19 crisis. It is
important that hotel spa operators
understand the underlying problems,
challenges and proper ways to handle
these problems during this pandemic
time. One of the effective business
management tools useful for tackling
challenges and handling all problems
emerging during the crisis is the
McKinsey’s 7-S framework. Therefore,
it is interesting that how do the business
operators handle problems or difficulties
through the McKinsey’s 7-S framework,
especially during the emergence of the
unprecedented COVID-19 outbreak
which has caused much greater impacts
on numerous business sectors when
compared with other pandemics in the
past.
Since there is limited number of research
thoroughly exploring the hotel spa
business after experiencing the COVID-
19 crisis, this research aims to fulfill the
research gaps by investigating what
problems hotel spas encounter by
adopting the McKinsey’s 7-S framework.
This research also studies how hotel spa
operators handle the problems caused by
the outbreak of COVID-19 through the
framework of McKinsey’s 7-S. In
addition, the research explores how hotel
spa operators adapt to survive the
COVID-19 crisis and how they prepare
their business for the post-COVID-19
phase.
The research questions of this study are
the followings:
What problems and challenges do hotel
spas encounter during the outbreak of
COVID-19?
How do the hotel spas handle/manage
these problems during the outbreak of
COVID-19?
How will hotel spas make preparations
for the aftermath of the COVID-19
outbreak?
This research will investigate problems
or difficulties which two hotel spas
experience during the COVID-19 crisis
and study how they deal with the
problems through the McKinsey’s 7-S
framework in order to survive this
unprecedented pandemic crisis. The
research will explore case example of
how the two hotel spas adapt their
business to the crisis and prepare
themselves after the COVID-19
outbreak.
This research will explore two registered
hotel spa operators in two cities in

UTCC International Journal of Business and Economics
UTTC IJBE | 20
Thailand: Bangkok, a capital city, and
Khon Kaen Province, a non-capital city.
In this research, in-depth interviews will
be conducted to collect responses on
various aspects based on the idea of
McKinsey’s 7-S framework from three
groups of respondents including
management, staff, and customers from
the two selected hotel spas.
Literature review
Spa
The meaning of spa
The word “ spa” was derived from the
Walloon word “ espa” which was the
name of the Spa town in Belgium, where
a remedial, thermal spring was found in
the 14th century”. Later, “espa” became
the word “ spaw” in English and
eventually became the update word spa.
(Miller, 1996). The term “spa” originated
from the Latin phrase “ sanitas per aqua”
which means “health through water”. In
fact, the concept of spa came from the
period of the Roman Empire as the
soldiers tried to recover from wounds,
pains and sickness resulted from their
military services.
History of spas in Thailand
Around the year 1994, spas were
established in Thailand in response to the
demand of foreign visitors at that time
( Ninnar, 2006) . At the beginning, the
spas were popular and fashionable
among the foreign tourists and
expatriates. However, spas have recently
become popular among the local Thais as
new alternative therapy.
At the early stage, most spas in Thailand
were located in luxurious or five- star
hotels. However, due to the increase in
the demand of the local people in
different cities. Spas are located
everywhere nationwide, especially
famous tourist attraction. Nowadays,
tourists can visit spas at all the major
tourist cities in Thailand such as,
Bangkok, Pattaya, and Chiang Mai.
Moreover, Thailand has also been
recognized as a spa capital of Asia thanks
to the unique way of delivering a relaxing
atmosphere, warm hospitality, service,
and Thai therapists with welcoming
personalities.
Because of the increasing popularity and
growth of Thai spa industry, the Thai
government established a policy to
promote Thailand as Spa Capital of Asia
in the year 2004 by launching five- year
strategic plan to establish Thailand as
‘ Centre of Excellent Health of Asia’ .
There are three key areas that the strategy
focused, that were, medical services,
healthcare services and Thai herbal
products. Besides the 5 years strategic
plan for spa as initiated by the Ministry
of Public Health, Thailand Board of
Investment ( BOI) has executed several
economic incentives for spa, wellness,
and related investors supported the Thai
government policy to promote Thailand
as a medical tourism hub during 2012 and
2016.
In order to promote and develop the spa
industry in Thailand, the Thai Spa
Association and the Thai Spa Operators
Association were established as the main
private sectors to promote and develop.
The association has established a
voluntary Thai Spa Excellence Quality
Standard in 2011. It is an internationally-
designed audit and certification program

UTCC International Journal of Business and Economics
UTTC IJBE | 21
specifically for spas, which seeks to offer
regular and independent monitoring to
enhance spa safety, reduce accident risks
and set the highest standard of services,
thereby providing an independent quality
endorsement for spa. ( Cohall et al. ,
2013).
Types of spas
According to International Spa
Association, there are 7 different types of
spas: day spa, club spa, medical spa,
mineral spring spa, resort and hotel spa,
cruise ship spa, and destination spa
(Quintela et al., 2016). Brief information
of each spa is given as follows ( Wisnom
& Capozio, 2012):
Day spa is a business that offers a variety
of professionally administered spa
services to day- use clients. Day spa is
open to the public and offer a la carte spa
service to customers who can enjoy one
or two individual treatments or a full day
treatment.
Club spa is a business that offers a
variety of professionally administered
spa and fitness services to its
membership. Club spa is emerged from
fitness club looking to provide more
comprehensive wellness offerings to
their customers. To receive services in a
club spa, you are generally required to be
a member.
Medical spa is a business that offers a
variety of professionally administered
spa services, including medical and
wellness care, to day- use clients,
typically with on- site supervision by a
licensed health care professional. It is
generally located in a hospital. This spa
offers a blend of conventional and
alternative medicine therapies in a
clinical setting. Medical spa can include
skin injections, cosmetic dental services,
and laser skin care.
Mineral spring spa is a business that
offers an on- site source of natural
mineral, thermal or seawater used in
professionally administered
hydrotherapy treatment. Some of these
spas may offer only hydrotherapy
treatment, whereas others may offer a
wide range of spa services, lodgings,
fitness, and other opportunities. It is the
‘ spring’ that makes this spa different
from other types of spas.
Resort and hotel spa is a business that
operates as a division of and within a
resort or hotel. It provides professionally
administered spa, wellness, and
occasionally, medical services primarily
to guests of the establishment. Resort
and hotel spas operate in a similar
manner to a day spa. Famous examples
of hotel spas include Banyan Tree Spa
and Kempinski the Spa ( SCB Economic
Intelligence Center, 2018).
Cruise ship spa is a spa that operates on
board a cruise ship and provides
professionally administered spa and
wellness services to passengers. These
unique spas serve exclusively those on a
cruise vacation.
Destination spa is an extended-stay
resort with the primary purpose of
providing guests with healthy lifestyle
services. These spas have health,
wellness, and ‘spa-ing’ as the focal point
of the visit. Modern destination spas
encourage stays of a week or longer, as
well as provides a blending of health
related activities such as spa treatment,
wellness education, healthy cuisine and
medical services.

UTCC International Journal of Business and Economics
UTTC IJBE | 22
Spa products and services
Spa products and services can be
categorized into various types (Miller,
1999; Wisnom & Capozio, 2012) such
as:
Hair services styling, cutting, coloring,
scalp treatment
Nail services regular manicures, regular
pedicure, oil massage for hands, feet,
food spa
Facial treatments deep cleansing,
exfoliation, masks, facial massage, facial
nutrition, aromatherapy, layer, waxing,
makeup
Body treatments hydrotherapy,
exfoliation, masks, body massage, body
tanning, wraps, foot spa/massage, sauna,
thermal treatment
Mind therapy meditation, yoga, and
relaxation classes
Fitness services personal training,
general fitness and weight exercises
Educational programs nutrition
counseling and stress management
Overview of Thailand’s spa
business
Spa business has become popularity in
the past decade (Han et al., 2017) due to
the increasing demands of consumers to
pursue a better quality of life and well-
being ( Quintela et al. , 2016) . Spa
business is directly associated with
wellness tourism in that tourists spend
some of their or leisure time) to receive
the services enhancing their physical and
mental well-being. The business has also
contributed to Thailand’s tourism sector.
The overall value of Thailand’ s spa
industry has seen a steady increase of 8%
per annum during 2013-2015, increasing
from 30 billion in 2013 to 35 billion baht
in 2015 ( SCB Economic Intelligence
Center, 2018).
Spa market in Thailand has been rapidly
growing for decades due to the increasing
health- conscious consumers among
Thais and internationals ( Han et al. ,
2017) as well as the reputation of high
quality services, welcoming hospitality
and inexpensive cost of living ( Ministry
of Public Health, 2013) . These reasons
consequently make Thailand be one of
the largest spa destinations in the Asia
Pacific region (Han et al., 2017). Today,
wellness tourism is one of the target
tourism products under the government’s
Thailand 4. 0 policy with the aims to
accelerate Thailand’ s future economic
growth and to earn higher incomes
(Klaysung, 2016).
Thailand’ s spa industry has started to
expand clearly since 2002 both in terms
of the number of service users and spa
service places. Most of the spa service
places in Thailand are operated by small
operators (Siam Wellness Group, 2018) .
According to the statistics of Thai Spa
Association, it showed that during the
years 2008 and 2012, Thailand had about
60% of the places of business being set
up in the hotels and resorts and about
40% of the places of business, which
were set up as Stand Alone. Moreover,
Thai Spa Association forecasted that in
the future, the ratio of the place of
business of the two formats would switch
to 50: 50 due to the Stand Alone spa
which started to embark on investment in
the business format and increasingly
expanded to more branches. ( Siam
Wellness Group, 2018) . In 2016, the
Ministry of Public Health counted 2,053
UTCC International Journal of Business and Economics
UTTC IJBE | 23
spa establishments being legally
registered. Out of these establishments,
1,790 are located in Bangkok and 263 in
other regions of the country, with 3 in the
northern region, 23 establishments in the
north- eastern region, 113 located in
central Thailand and 124 establishments
in the south ( Ministry of Public Health,
2016).
The total market value for spa in 2018 is
estimated to be approximately 4 billion
baht, growing from 2017’ s sum market
value of 3.85 billion baht. The growth of
the spa market in Thailand is resulted
from increasing demand from locals and
foreigners. Similar expectation is also
anticipated for the spa products market.
The strategy is to maintain the unique
Thai spa business and products in both
the therapists and Thai herbs ( Thai Spa
Association, 2018). This goes in line with
Tourism Authority of Thailand’ s policy
of Discover Thainess, which targets
quality leisure tourists. The Ministry of
Tourism and Sports anticipated that the
revenue from the tourism business will
be 2. 7 trillion baht ( Ministry of Tourism
and Sports, 2018) . For the local market,
there is also expectation of strong growth
as the economy continues to grow which
results in higher income per capita and
higher proportion of expenses on health
related products. Moreover, people are
taking better care of themselves. More
than 48% of people in Bangkok use
natural remedies for relaxation and
rejuvenation ( Kasikornbank Research,
2016) . Thus, the health sector has
potential positive growth.
Overview of Thailand’s luxury
hotel spa industry
International arrivals historically
accounted for more than 60% of
Bangkok total arrivals ( Tourism
Authority of Thailand Intelligence
Center, 2016) . Hotel spas provide
services for a plenty of foreign guests,
especially from Europe and America.
The European and American guests once
dominated the reservations in hotel spas;
however, hotel spas are currently
recording higher spa usage from Asian
visitors. American and European guests
still dominate bookings at Riverside Saps
and Suburban Spas, located near
Suvarnabhumi International Airport,
accounting for 95% of total internal spa
guests, referred to as those staying at the
hotel. Meanwhile, due to the increase in
the number of arrivals from China, the
Chinese spa guests grew up by more than
26% in 2015 ( Tourism Authority of
Thailand, 2015) . In addition, the
percentage of Chinese spa guests at
Downtown and Suburban Spas ( other
than by the international airport)
accounted for 50% of total internal spa
guests.
On average, between 70% and 90% of
total spa guests stayed at the hotel where
the spa is located. External guests,
defined as nonresidential visitors to spa
facilities, accounted for 10% to 30% of
total spa guests, and these guests were
Thai nationals or foreign expats living in
Bangkok. Due to the large number of
easily accessible day spas in Bangkok,
hotel spas captured lower levels of
external guests than hotel spas in other
capital cities in Asia and The Middle
East. Leisure guests historically
accounted for 70% to 80% of total
internal spa guests. Due to the nature of
the hotel properties, Riverside Spas
capture more leisure spa guests, whereas,
Downtown and Suburban Spas capture a
UTCC International Journal of Business and Economics
UTTC IJBE | 24
higher percentage of business spa guests.
Bangkok’ s MICE market is improving
(4.5% growth in MICE arrivals in 2015)
( Health & Wellness Market Reports
Bangkok, 2016).
Riverside, Downtown, and Suburban
Hotel Spas, on average, realized between
5% and 10% revenue growth per year. On
average, they generated between 3% and
5% of total revenue through the sale of
spa retail products. Spas at the upper-end
of the luxury range generated between
8% and 10% of total spa revenue through
the sale of retail products. Between 20%
and 40% of guests accessing Riverside,
Downtown, and Suburban Hotel Spas
(including guests not staying at the hotel)
visit multiple times. Although Bangkok
has a high number of spas, guests of
Hotel Spas, internal and external, tend to
demonstrate loyalty. (Health & Wellness
Market Reports Bangkok, 2016).
In Thailand, one of the best hotel spas is
The Spa at Lebua at State Tower, the
winner of Thailand’ s Best Hotel Spa in
both 2018 and 2019, rewarded by the
World Spa Awards. Meanwhile, in 2016
and 2017, Anantara Spa at Anantara
Siam Bangkok Hotel was the winner of
Thailand’ s Best Hotel Spa in the World
Spa Awards.
Spa business standards before and
during the COVID-19 outbreak
Standards for the spa business are set up
and identified into five elements as
follows Ministry of Public Health (2014):
1) Service quality: This element will
examine if the spa business provides
customers with good services and quality
as well as enhance customer
satisfactions. 2) Spa staff: This element
will examine if the spa personnel have
appropriate qualification to provide
standard services and customer
satisfactions. 3) Tool and equipment:
This element will examine if the spa
business provides tool & equipment in
good quality and safety for customers. 4)
Organization and management: This
element will examine if the spa business
has effective working procedures and
further service development. 5)
Environment: This element will examine
if the spa business provides customers
with good environment and customer
well-being.
During the outbreak of the COVID- 19
disease, spas are used with restrictions in
accordance with relevant national
guidelines. In particular, the following
measures should be in place ( World
Health Organization, 2020):
A maximum number of persons must be
determined to ensure adequate physical
distancing, and this maximum number
should be displayed prominently for
guests and users of the facility.
Individuals using these facilities should
follow national and/or local requirements
for wearing of fabric masks in public
settings such as these facilities.
Each facility should follow the
ventilation and air conditioning
recommendations as described earlier in
the document. It should be noted that in
steam baths, ventilation is normally
minimal, and therefore extra attention
should be paid to physical distancing by
restricting number of users, hygiene,
surface cleaning and disinfection.
Guest should have easy access to
facilities for hand hygiene ( soap and
water and alcohol hand rub) , especially
in toilet and changing room areas.
UTCC International Journal of Business and Economics
UTTC IJBE | 25
Towels provided must be for single use
only. Provide a bin for guests to place
their towel after use for laundering.
Drinking water should be provided in
containers for individual use.
Changing rooms should be equipped
with disposable tissue dispensers,
disinfectant materials and containers
with lids for waste.
Cleaning staff should clean and disinfect
showers, changing rooms, toilets and
high touch surfaces such as door handles,
toilet handles, and faucet handles several
times per day, depending on the
frequency of use of these areas.
Impacts of the COVID-19
outbreak on Thailand’s
tourism industry
Southeast Asian countries, especially
Thailand are particularly exposed to
events in China and the rest of the world
through trade and tourism. Thailand also
relies heavily on tourism and electronics
and appliances for export earnings and
exports account for more than two-thirds
of GDP (Harvard University, 2018).
Due to the COVID- 19 pandemic, the
number of Chinese tourists that visited
Thailand in March 2020 was only 57
thousand compared to 985 thousand in
March 2019. In that period, the total
number of international tourists in
Thailand decreased by 76. 40 percent
compared to March 2019 ( Statista
Research Department, 2020) . Thailand
has been severely affected as the country
depends heavily on the visits of Chinese
tourists. From January – March, 2020 the
number of foreign tourists was 6. 69
million people, which is 38% less than
2019. The income generated from
tourism, at 330 billion baht, is 40% less
compared to the same period in 2019
( Ministry of Tourism and Sports, 2020) .
Tourism in April was at a complete
stand- still with zero arrivals. The total
income generated from international
tourists was 333 billion baht in the first
three months of 2020, down from 557
billion baht one year earlier, a decrease of
more than 40% . ( International Labour
Organization, 2020).
In 2019, Thailand’ s labor force
participation rate was at 67%, with a very
low unemployment rate of 0. 7% , total
employment was 37. 6 million, of which
45. 6 per cent were women. However,
after the outbreak of the COVID- 19
pandemic, the unemployment increased
to 34,000 persons, a decline of 59,000
persons employed and an increase of
92,000 in the number of persons outside
the labor market from the fourth quarter
2019 to first quarter 2020 ( International
Labour Organization, 2020) . The total
number of work hours of labors in
Thailand dropped by nearly 6% from the
last quarter 2019 through first quarter
2020, equivalent to the loss of 2.2 million
full- time jobs ( assuming a 40 hour
working week) . The hours actually
worked per week in Thailand declined in
2020, from both fourth quarters in 2019
and comparing the same first quarter in
2019 (International Labour Organization,
2020).
The decline in tourism numbers and
revenues was across the board in terms of
origin countries, but the largest decrease
was resulted from the decline in tourists
from China. According to data from the
Ministry of Tourism and Sport of the
Government of Thailand, also the total
income brought by international tourists

UTCC International Journal of Business and Economics
UTTC IJBE | 26
declined, corresponding to 293 million
baht in the first two months of 2020,
down from 381 million baht one year
earlier, a decrease of more than 23%
( International Labour Organization,
2020).
Thailand’ s tourism sector, which
accounts close to 15 percent of GDP, has
been severely impacted with a near
cessation of international tourist arrivals
since March 2020. Finally, the mobility
restrictions imposed in response to the
outbreak, while critical to flattening the
infection curve, has severely dented
private consumption, particularly for
retail and recreational services.
McKinsey’s 7-S framework
Historical development of the
McKinsey’s 7-S Framework
The McKinsey’s 7-S Framework was
created during a meeting of four
McKinsey & Company’s consultants:
Tom Peters, Robert Waterman, Richard
Pascale, and Anthony Athos in 1978. In
1980, the McKinsey’s 7-S concept was
introduced in 1980 in the article entitled
“Structure Is Not Organization”,
published in Business Horizons
(Waterman et al., 1980). Later, the
framework appeared in “The Art of
Japanese Management” published in
1981 and investigated by Pascale and
Athos who studied the huge success of
Japanese businesses (Chimera
Consulting, 1999).
The McKinsey’s 7-S Framework is one
of a managerial tools developed to get a
structural approach to handle
organizational problems, especially
efficiency. The framework is also suited
to analyze an organization’s current
situation, a proposed future scenario, or
identify gaps to reach an organization’s
desired state (Waterman, 1982). The
framework consist of seven essential
elements that make up an organization.
The elements include Structure, Strategy,
Style, Systems, Skills, Staff and Shared
values.
Seven Elements of McKinsey’s 7-S
Framework
The seven elements include strategy,
structure, systems, style, staff, skills, and
shared values (Waterman et al., 1980).
The elements are also classified into
“Hard S” and “Soft S”. The ‘Hard’
elements consisting of strategy, structure,
and systems are easy to identify or
recognize in an organization since they
are often documented in a corporate
plans, organizational charts, and strategy
statements. In addition, management can
influence these factors directly
(mindtools.com, 2011). Meanwhile, the
‘Soft’ elements including skills, style,
staff, and shared values are harder to
identify and more intangible. They
seldom appear in corporate publications
(Pascale & Athos, 1981). The factors are
more influenced by a company’s culture
(mindtools.com, 2011). The following is
a description of the seven elements of the
McKinsey’s 7-S Framework.
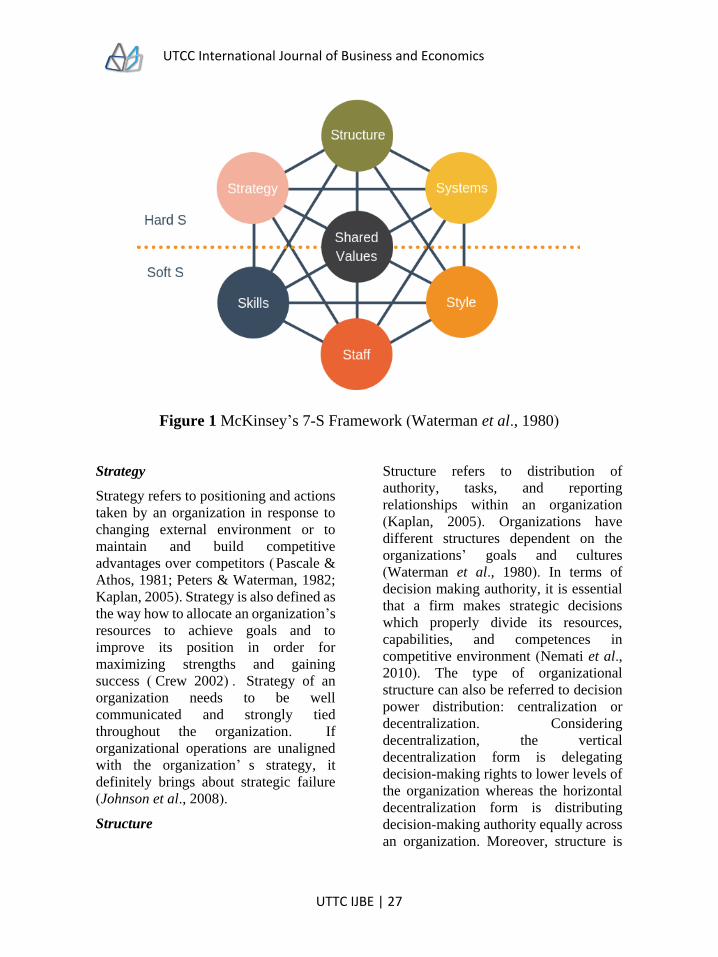
UTCC International Journal of Business and Economics
UTTC IJBE | 27
Figure 1 McKinsey’s 7-S Framework (Waterman et al., 1980)
Strategy
Strategy refers to positioning and actions
taken by an organization in response to
changing external environment or to
maintain and build competitive
advantages over competitors ( Pascale &
Athos, 1981; Peters & Waterman, 1982;
Kaplan, 2005). Strategy is also defined as
the way how to allocate an organization’s
resources to achieve goals and to
improve its position in order for
maximizing strengths and gaining
success ( Crew 2002) . Strategy of an
organization needs to be well
communicated and strongly tied
throughout the organization. If
organizational operations are unaligned
with the organization’ s strategy, it
definitely brings about strategic failure
(Johnson et al., 2008).
Structure
Structure refers to distribution of
authority, tasks, and reporting
relationships within an organization
(Kaplan, 2005). Organizations have
different structures dependent on the
organizations’ goals and cultures
(Waterman et al., 1980). In terms of
decision making authority, it is essential
that a firm makes strategic decisions
which properly divide its resources,
capabilities, and competences in
competitive environment (Nemati et al.,
2010). The type of organizational
structure can also be referred to decision
power distribution: centralization or
decentralization. Considering
decentralization, the vertical
decentralization form is delegating
decision-making rights to lower levels of
the organization whereas the horizontal
decentralization form is distributing
decision-making authority equally across
an organization. Moreover, structure is
UTCC International Journal of Business and Economics
UTTC IJBE | 28
also referred to a hierarchical or flat
organization. The hierarchical structure
is a very centralized and top-to-down
decision making distribution while the
flat organization is more decentralized.
The structure is also how an
organization’s units relate to each other
and how departments or teams,
assignments or tasks, and responsibilities
are coordinated (Waterman et al., 1980).
An efficient organization needs to have a
clear structure which coherently
establishes its sets of boundaries and
internal units within the organization
communicate and collaborate well
(Hansen & Wernerfelt, 1989).
Systems
Systems refer to routine processes and
procedures that an organization’s staff
members follow. Examples of
organizational processes and flows are
information systems, capital budgeting
systems, manufacturing processes,
quality control systems, and performance
measurement systems (Waterman, 1982).
Systems show how a firm works and gets
things done and systems are seen as the
manual of organizational procedures
(Pascale & Athos, 1981). From an
organizational perspective, systems can
be used to establish organizational focus,
cohesion, learning and execution of
selected strategies (Shang & Seddon,
2002). Meanwhile, from a managerial
perspective, systems can be used as an
instrument for making decisions like
resource allocation and monitoring and
assessing a firm’s operations (Shang &
Seddon, 2002). Systems need to be
evaluated, maintained, and developed to
create a firm’s value and efficiency. A
firm with well-established systems that
are evaluated, developed, and maintained
to suit its strategic purpose has
competitive advantage (Irani, 1999).
Moreover, an importance of the
evaluation of a firm’s existing systems is
the systems respond to the firm’s overall
goals, not the individual needs of
employees. (Shang & Seddon, 2002).
Style
Style refers to top or senior
management’s leadership styles. In other
words, the style of leadership means how
top or senior managers spend their time,
what they focus attention on, what
questions they ask of employees, and also
organizational culture (Kaplan, 2005).
What kind of decisions top managers
make and how they allocate, combine,
and develop resources has a great impact
on corporate culture (Waterman et al.,
1980). Leadership styles also have a huge
impact on the coherence of overall
strategy (Waterman, 1982). Leaders or
managers can create a certain
environment based on the decisions they
make and leadership behaviors or
patterns can shape organizational culture.
For example, if a leadership style is
collaborative, which means staff
members are given freedom for decision
making and providing feedbacks, it is
easier for leaders to gain engagement
from staff members who have established
their trust towards the management
through this pattern of leadership. It is
clear that the importance of leadership
styles is how leaders apply strategies to
ensure trust and support among staff
members and how they manage
individuals to be counted for tasks or
projects (Erskine, 2013).
Staff
Staff refers to both the staff itself and
demographic characteristics of people
within an organization (Drucker, 2007;

UTCC International Journal of Business and Economics
UTTC IJBE | 29
Pascale & Athos, 1981). Staff is also
defined as people’s backgrounds and
competencies and an organization’s staff
recruiting, selecting, training, managing,
and promoting processes (Kaplan, 2005).
This staff element can be linked to the
Human Resources function of an
organization. Recruitment processes
should find suitable employees who have
the right commitment and proficiency to
match an organization (Ulrich et al.,
2008). An organization has to hire staff
members, train them well, and assign
them to right jobs. Other key issues in
this element include motivation,
recognition, and reward (Crew, 2002).
Motivation tools can be related to
tangible rewards such as financial means
and intangible incentives such as
professional development and
knowledge enhancement (Gottlschalg &
Zollo, 2017). It is also evidently
important for a firm to find and develop
staff members to match overall strategy
in order to achieve the firm’s goals. Staff
should also have right mindset towards a
firm and feel motivated and committed to
reach the firm’s goal. Motivation tools
and recruitment processes are important
procedures for staff alignment with a
firm.
Skills
Skills refer to distinctive competencies or
capabilities of an organization and key
personnel who carry out the
organization’s strategy and the ways of
how an organization differentiate
themselves from its competitors (Pascale
& Athos, 1981; John, 2005). The skills
element also refers to what an
organization does best along dimensions
such as people, management, processes,
systems, technology, and customer
relationship (Waterman, 1982; Kaplan,
2005). In addition, skills are defined as
capability in organizational management
by entire employees, not individual
capability (Peters and Waterman, 1982).
To create capabilities and competencies,
education and training is fundamental
(Senge, 1990). Training and
development are essential in ensuring
personnel how to do their jobs and keep
up to date with the latest techniques and
technology (Crew, 2002; Fox, 2002).
Shared values
Shared values refer to the core or
fundamental set of values shared within
an organization and serve as guiding
principles of what is important including
vision, mission, and value statements
which provide a broad sense of purpose
for all employees (Pascale & Athos,
1981; Kaplan, 2005). In fact, the core
values of an organization, as shown in its
corporate culture and general work ethic,
were called “superordinate goals” when
the framework was first developed
(Waterman et al., 1980). This Shared
Values element is essential to develop all
other elements in the framework; that is,
if Shared Values change, all other factors
are directly affected (Waterman, 1982).
Shared values are expressed at high
levels of abstraction. Shared values can
mean very little for outsiders who do not
know the organization well; however,
they are significant or mean a lot for
employees of the organization.
Research methodology This research uses a qualitative method
to gain deep understanding and insights
on problems, challenges, management,
and preparation of hotel spa management
and operations during the COVID-19
UTCC International Journal of Business and Economics
UTTC IJBE | 30
crisis. The case study research design is
often adopted in an exploratory or
descriptive research and answers
questions including “How”, “Why”, and
“What” (Ghauri & Gronhaug, 2011). As
a result, the case study is suitable for this
research in order to get both a clear and
accurate focus and in-depth
understandings of hotel spa management
during the COVID-19 crisis. In this
study, a case study of two hotel spa will
be conducted.
One of appropriate sampling techniques
for qualitative research is purposive
sampling (Boenhnke, 2011). The
technique suggests researchers to choose
the samples with actual experiences. The
selected samples in this research possess
appropriate knowledge and real
experiences contributing to the
completion of spa management during
the crisis.
In this study, we use purposive sampling
to sample two hotel spas to gain insight
on one spa in a capital city, i.e., Bangkok
and a non-capital city, Khon Kaen
province. Both Bangkok and Khon Kaen
are similar in terms of a gateway for both
local and foreign tourists. Bangkok and
Khon Kaen have an airport which can
accommodate Thai and international
passengers. Khon Kaen, in additional,
has been developed and promoted to be
one of MICE or Meetings, Incentives
Travel, Conventions, and Exhibitions
city centers besides Bangkok.
Research populations and
samples
The population are the all spa businesses
located in the 4-5 star hotels located in
Bangkok and Khon Kean provinces. The
spas have to be operated before, during,
and after the COVID-19 outbreak.
The samples are the two spa cases. One
is in Bangkok, and another one is in Khon
Kaen. Within the case, the purposive
sampling technique will be used to
recruit potential interviewees. In-depth
interview on a one-on-one basis is used
to collect data from the samples in
response to the research objectives. In
general, interviews consist of data of
meaningful expressed through words,
pattern and impacts (Saunders et al.,
2009).
Total of 14 respondents will be sampled
based on convenient basis. Respondents
will be divided into three groups
including 1 hotel spa manager from each
spa, 3 hotel spa staff from each spa, and
3 customers from each spa. Hotel spa
managers and staff have to be on duty
before, amid, and after the spread of the
COVID-19 pandemic.
Research instrument
The interview contains open-ended
questions based on the McKinsey’s 7-S
Framework. Open-ended questions
enable respondents to include more
information including feelings, attitudes,
and understanding of issues (Kothari,
2004); therefore, they are useful for
researchers to collect qualitative data in
order to gain a better understanding of
certain issues and more insightful
interpretation of research results. Based
on the McKinsey’s 7-S Framework and
the situation of the COVID-19 crisis, the
open-ended questions in the in-depth
interview are developed from Gaspar
(2017), Chartered Institute of Internal
Auditors (2015), mindtools.com (2011),
and The Organizational Strategist (2011).

UTCC International Journal of Business and Economics
UTTC IJBE | 31
The interview questions are divided into
two sections as follows:
Section A
This section contains the open-ended
questions asking the respondents about
their position in the organizational
structure, their roles or responsibilities,
and their total years of work experience
among hotel spa management and staff.
For hotel spa customers, this section
contains the questions asking about
general demographic information
including gender and age.
Section B
This section contains questions based on
the McKinsey’s 7-S Framework in
response to the research objectives: 1)
problems and challenges experienced by
hotel spa managers, hotel spa staff, and
hotel spa customers during the COVID-
19 outbreak, 2) ways to manage/handle
the problems during the COVID-19
outbreak, and 3) preparations of hotel spa
managers, hotel spa staff, and hotel spa
customers for the aftermath of the
COVID-19 outbreak.
Data collection
The primary data was collected from in-
depth personal interviews administered
through open-ended questions based on
the McKinsey’s 7-S Framework. The key
informants included hotel spa managers,
hotel spa staff, and hotel spa customers
from two hotel spas in a capital city,
Bangkok, and a non-capital city, Khon
Kaen Province. To gather the data, the
interview was recorded by note taking,
voice, and visual recording if agreed by
the respondents. Data collection was
conducted during November 2020 –
December 2020 (after the outbreak of
COVID-19 or after the hotel spa
reopening). In addition, the personal
interviews on a one-on-one basis were
conducted in accordance with the World
Health Organization’s preventive
measures including hand and respiratory
hygiene and physical distancing for
preventing transmission of COVID-19
(WHO, 2020). The researcher and the
respondents had to wash hands with soap
or alcohol-based hand-rub before and
after the interview, wear a face mask
throughout the interview, and keep a
distance of at least 1 meter between each
other during the interview.
Data analysis
The primary data collected through the
in-depth personal interviews was
transcribed and analyzed based on
content analysis which is a systematic
replicable technique for compressing
many words of text into fewer content
categories (Krippendorf, 1980). Since the
open-ended question interview approach
was applied in this study, the
interviewees were able to fully express
their answers in as much details as they
want, so a comprehensive data coding
process was necessary. In fact, coding is
a way of developing and refining
interpretations of the data in qualitative
research (Charmaz, 2014). The data
coding purpose is to make categories and
concepts become smaller analyzable
units by compressing extensive data sets
in a systematic way. The content from in-
depth interviews of the respondents was
analyzed through the content analysis.
Research findings
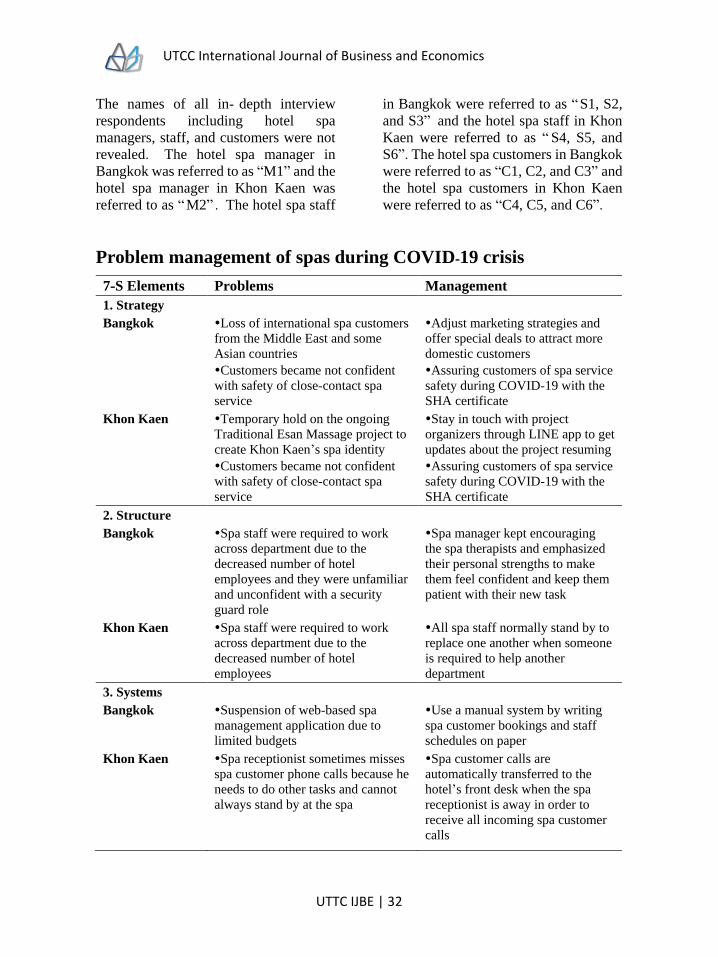
UTCC International Journal of Business and Economics
UTTC IJBE | 32
The names of all in- depth interview
respondents including hotel spa
managers, staff, and customers were not
revealed. The hotel spa manager in
Bangkok was referred to as “M1” and the
hotel spa manager in Khon Kaen was
referred to as “M2” . The hotel spa staff
in Bangkok were referred to as “S1, S2,
and S3” and the hotel spa staff in Khon
Kaen were referred to as “ S4, S5, and
S6”. The hotel spa customers in Bangkok
were referred to as “C1, C2, and C3” and
the hotel spa customers in Khon Kaen
were referred to as “C4, C5, and C6”.
Problem management of spas during COVID-19 crisis
7-S Elements Problems Management
1. Strategy
Bangkok Loss of international spa customers
from the Middle East and some
Asian countries
Customers became not confident
with safety of close-contact spa
service
Adjust marketing strategies and
offer special deals to attract more
domestic customers
Assuring customers of spa service
safety during COVID-19 with the
SHA certificate
Khon Kaen Temporary hold on the ongoing
Traditional Esan Massage project to
create Khon Kaen’s spa identity
Customers became not confident
with safety of close-contact spa
service
Stay in touch with project
organizers through LINE app to get
updates about the project resuming
Assuring customers of spa service
safety during COVID-19 with the
SHA certificate
2. Structure
Bangkok
Spa staff were required to work
across department due to the
decreased number of hotel
employees and they were unfamiliar
and unconfident with a security
guard role
Spa manager kept encouraging
the spa therapists and emphasized
their personal strengths to make
them feel confident and keep them
patient with their new task
Khon Kaen Spa staff were required to work
across department due to the
decreased number of hotel
employees
All spa staff normally stand by to
replace one another when someone
is required to help another
department
3. Systems
Bangkok Suspension of web-based spa
management application due to
limited budgets
Use a manual system by writing
spa customer bookings and staff
schedules on paper
Khon Kaen Spa receptionist sometimes misses
spa customer phone calls because he
needs to do other tasks and cannot
always stand by at the spa
Spa customer calls are
automatically transferred to the
hotel’s front desk when the spa
receptionist is away in order to
receive all incoming spa customer
calls

UTCC International Journal of Business and Economics
UTTC IJBE | 33
4. Shared Values
Bangkok Shared values remain the same as
the pre-COVID-19 phase, except
some unaccustomed behaviors of
Thai customers such as late arrival
Maintain commitment to the
global etiquettes to offer customers
the best service experience, keep
customer satisfaction a top priority,
and enhance service quality by
double to meet domestic
customers’ expectations
Khon Kaen Shared values remain the same as
the pre-COVID-19 phase such as
focusing on customers
Hold the shared values principles
including keeping customers a top
priority and maintaining both the
hotel’s spa standards of excellence
and the spa industry’s required
standards.
5. Style
Bangkok
Lack of face-to-face
communication with staff during
temporary spa closure
Devoted to staying in touch with
staff through the LINE application
to give encouragement to staff
Khon Kaen Lack of face-to-face
communication with staff during
temporary spa closure
Devoted to staying in touch with
staff through the LINE application
to give encouragement to staff
6. Staff
Bangkok Spa therapists have workload due
to the insufficient number of staff
Spa staff became uncertain about
career and financially insecure
Make a phone call to other
available therapists who take leave
of absence without pay to help on a
busy day
Keep communicating with staff to
encourage them during temporary
closure and continue to provide
employee benefits such as free 3
meals and monthly relief grants to
ease staff’s financial burdens
Khon Kaen Spa staff became uncertain about
career and financially insecure
Keep communicating with staff to
encourage them during temporary
closure, provide employee benefits
such as free 2 meals and protective
equipment, and hold special events
to appreciate staff’s hard work and
dedication
7. Skills
Bangkok Lack of actual work practice and
discontinued trainings cause spa
therapists to forget some massage
postures and steps
Allow spa therapists to work part-
time jobs at other spas in order not
to lose skills during temporary
closure and receive skills retraining
from senior therapists after
reopening
Khon Kaen Only spa receptionist is unable to
provide information of spa services
and products
Read through all details in a spa
service brochure and study about
all products and services

UTCC International Journal of Business and Economics
UTTC IJBE | 34
Preparations of spas for the
aftermath of COVID-19
Hotel spa in Bangkok
The hotel spa respondents stated that they
have to rely more heavily on domestic or
Thai customers after the COVID- 19
crisis. They need to put more emphasis
on publicizing their products and services
through channels, particularly social
media such as Facebook and Instagram in
order to raise customers’ awareness of
the hotel spa. They also prepare to run
sales promotions offering special deals
and discounts more frequently to attract
Thai customers to use spa services and
share their hotel- standard spa
experiences to friends or acquaintances.
“ We expect that Thai customers will
know more about our hotel spa through
word of mouth after we promote more on
social media,” expressed by M1.
Moreover, since Thai customers have
become a major customer group, they
prepare to learn more about preferences,
needs, and expectations of spa goers in
Thailand in order to adjust services to
meet the Thai customers’ needs and
expectations. The hotel spa’ s staff also
plan to upskill to provide a wide range of
massage and treatments which are mainly
for relaxation purposes.
“ I’ d like learn about therapeutic or
remedial massage to be different from
other spas because our hotel spa mainly
provides relaxation massage and
treatments,” expressed by S1.
“ Apart from the spa receptionist’ s role,
I’ m now capable of only foot massaging
and facial and body scrub treatments. I
want to learn more about Thai or deep
massage and want to get certified,”
expressed by S3.
Hotel spa in Khon Kaen
The spa manager stated that the most
important thing of the hotel spa to
prepare is the number of spa therapists to
serve the possible increase of spa
customers in the future. In case that the
number of customers increases in the
post- COVID- 19 phase, the hotel spa
considers hiring more staff to work on a
part- time basis. Moreover, part- time
therapists are also required to undergo
intensive trainings to meet the hotel spa
standards of excellence apart from other
common qualifications.
“ Currently, there are totally 142 hotel
employees. Due to the decreased
revenues, the hotel can’ t hire full- time
staff over 142 people. New employees
have to work part- time only,” expressed
by M2.
The two spa therapist respondents stated
that in preparation for the post- COVID-
19 phase, it is necessary to maintain good
health and the best sanitation practices
such as regular handwashing and mask
wearing because safety has become
customers’ top of mind after the
pandemic outbreak.
“I will have to do exercises regularly in
order to keep good health and to make
customers feel confident and safe from
using our spa services,” expressed by
S4.
“Before the COVID-19 outbreak,
customers didn’t mind when we had a
little cough. But during the current
pandemic outbreak, only a little cough
can scare off customers,” expressed by
S5.
UTCC International Journal of Business and Economics
UTTC IJBE | 35
Managerial implication
As for managerial implications, the
findings from this research suggested that
the hotel spas have adapted by means of
rethink, reduce, revive, reskill, and
retain. Rethink means to shift its focus to
Thai customers whom the hotel spas have
to currently rely on or pay more attention
to and to adjust products and services to
meet their needs and expectations.
Reduce means to cut down unnecessary
operating costs and to be able to perform
tasks with the decreased number of staff
during the COVID- 19 crisis. Revive
means to bring back confidence of
customers with hygiene and health safety
of spa services and also confidence of
staff with their career. Reskill means the
hotel spa staff need to learn other new
skills, not only job- specific skills since a
job rotation scheme is necessary to be
implemented during the COVID- 19
crisis. Retain means to keep staff who are
valuable assets to deliver products and
services by providing them with various
forms of support and benefits and to keep
domestic customers’ satisfaction as a top
priority.
References
Asmelash, L. & Cooper, A. (2020). Nearly 80% of hotel rooms in the US are empty,
according to new data. CNN. Retrieved October 12, 2020, from
https://edition.cnn.com/2020/04/08/us/hotel-rooms industrycoronavirus-
trnd/index.htm.
Association of Southeast Asian Nations. (2020). ASEAN Policy Brief. Retrieved October
11, 2020, from https://asean.org/?static_post=asean-policy-brief-2
Boehnke, K., Lietz, P., Schreier, M. & Wilhelm, A. (2011). Sampling: The selection of
cases for culturally comparative psychological research. In D. Matsumoto & F.
J. R. van de Vijver (Eds.), 40 E. ITO ET AL. Cross-cultural research methods in
psychology (pp. 101–129). New York, NY: Cambridge University Press
Charmaz, K. (2014). Constructing grounded theory: A practical guide through qualitative
analysis (2nd ed). Thousand Oaks, CA: Sage.
Chartered Institute of Internal Auditors. (2015). McKinsey 7S questions. Retrieved
October 13, 2020, from https://www.iia.org.uk/media/598963/mckinsey-7s-
questions.pdf
Chimera Consulting. (1999). Famous models.7S Framework. . Retrieved October 10,
2020, from www.chimeraconsulting.com/7s model.htm
Cohall, D., Johnson, S., Storch, K.V. & Mullin, V. (2013). QUALITY ASSURANCE
REPORT. The University of the West Indies Development of Standards for the
Regional Health and Wellness Sector.
Cohen, M. & Bodeker, G. (2008). Understanding the Global Spa Industry.

UTCC International Journal of Business and Economics
UTTC IJBE | 36
Crew, J. (2002). ALIGNMENT: Heading in the Same Direction. Retrieved October 12,
2020, from https://www.ars.usda.gov/afm/tqm/mgt0398.htm
Druker, P.F. (2007). Management challenges for the 21st century. London: Butterworth-
Heinemann Publishers.
Erskine, P. (2013). ITIL® and Organizational Change. IT Governance Ltd.
Gaspar, M.,Popescu, S., Dragomir, M. & Unguras, D. (2018). Defining Strategic Quality
Directions based on Organisational Context Identification; Case Study in a
Software Company. Procedia - Social and Behavioral Sciences. 238. 615-623.
Ghauri, P. N. & Grønhaug, K. (2011). Research methods in business studies: A practical
guide. Harlow, England: Financial Times Prentice Hall.
Global Wellness Summit. (2017). Wellness Trends for 2017 - and Beyond. Global
Wellness Summit. Retrieved October 10, 2020, from https://www.
globalwellnesssummit.com/wp-content/.../8WellnessTrends_2017.pdf
Gottshalg, O. & Zollo, M. (2007). Interest alignment and competitive advantage. Academy
of Management Review. Vol. 32 No. 2, pp.418-437.
Han, H., Kiatkawsin, K. & Kim, W. (2017). Investigating customer loyalty formation for
wellness spa: individualism vs. Collectivism. International Journal of
Hospitality Management 67: 11–23.
Hansen, G.S. & Wernerfelt, B. (1989). Determinants of firm performance: The relative
importance of economic and organizational factors. Strat. Mgmt. J., 10: 399-411.
Harvard University. (2018). The Atlas of Economic Complexity: Mapping Paths to
Prosperity. Retrieved October 11, 2020, from https://growthlab.cid.
harvard.edu/files/growthlab/files/atlas_2013_part1.pdf
Health & Wellness Market Reports Bangkok. (2016). Retrieved October 11, 2020, from
https://silo.tips/download/health-wellness-market-reports-bangkok
International Labour Organization. (2020). COVID-19 and employment in the tourism
sector:Impact and response in Asia and the Pacific. Retrieved October 10, 2020,
from https://www.ilo.org/wcmsp5/groups/public/---asia/---ro-bangkok/
documents/briefingnote/wcms_742664.pdf
Irani. Z., Ezingeard. J-N., Grieve. R.J. & Race. P. (1999). Investment justification of
information technology in manufacturing. International Journal of Computer
Applications in Technology. 12, 2, 90 - 101.
Johnson, G., Scholes, K. & Whittington, R. (2008). Exploring Corporate Strategy. 8th ed.
FT Prentice Hall, p. 11-12
Johnston, K., Puczko, L., Smith, M., & Ellis, S. (2011). Global spa summit. Colorado:
Global Spa Summit.
Kaplan, R. (2005). How the balanced scorecard complements the McKinsey 7‐S model.
Strategy & Leadership, Vol. 33 (3), 41 – 46.

UTCC International Journal of Business and Economics
UTTC IJBE | 37
Kasikornbank Research. (2016). Sustainability Report 2016. Retrieved October 11, 2020,
from https://www.kasikornbank.com/en/sustainable-development/
SDAnnualReports/SD-EN-KBank59.pdf
Klaysung, C. (2016). Behaviors and Factors Affecting the Selection of Spa Services among
Consumers in Amphawa, Samut Songkhram, Thailand. World Academy of
Science, Engineering and Technology, International Journal of Social,
Behavioral, Educational, Economic, Business and Industrial
Engineering, 10(12), 3852-3856
Kothari, C.R. (2004). Research methodology and techniques. New Delhi: New Age
Publications.
Krippendorff, K. (1980). Content Analysis: An Introduction to Its Methodology. Beverly
Hills: Sage.
Miller, E. (1996) Day Spa Operations. United States of America. Business Series.
Mindtools.com. (2011). McKinsey 7-S Framework. Retrieved October 12, 2020, from
https://www.mindtools.com/pages/article/newSTR_91.htm
Ministry of Public Health (Department of Health Service Support). (2016). Spa Business
Manual. Bangkok.
Ministry of Public Health. (2013). Health service standards for overseas establishment.
Nonthaburi: Ministry of Public Health.
Ministry of Public Health. (2013). Manual for Entrepreneurs: Spa for Health.Department
of Supporting Health Service. Retrieved October 12, 2020, from
http://www.thaispa.go.th/spa2013/web/?wpfb_dl=336
Ministry of Tourism & Sports. (2018). Tourism Plan 2018. Retrieved October 11, 2020,
from https://www.austchamthailand.com/wp-content/uploads/2020/03/Tourism-
Plan-2018-Nov.15-2017.pdf
Nemati, A.R., Bhatti, A.M., Maqsal. M., Mansoor, M. and Naveed. F. (2010). Impact of
Resource Based View and Resource Dependence Theory on Strategic Decision
Making. International Journal of Business and Management. 5 (12): 110-115.
Ninnar. (2006). Thailand Paradise for Spa Lovers. Thaiwaysmagazine. Retrieved October
10, 2020, from http://www.thaiwaysmagazine.com/thai_article/2119_spa_
thailand/spa_thailand.html
Pascale, R.T. & Athos, A.G. (1981). The art of Japanese management. Simon & Schuster,
New York, 221.
Quintela, J., Costa, C. & Correia, A. (2016). Health, wellness and medical tourism - a
conceptual approach. Enlightening Tourism: A Pathmaking Journal, 6, 1-18.
Saunders, M. N. K., Lewis, P. & Thornhill, A. (2009). Research Methods for Business
Students (5th Edition). London Pearson Education.

UTCC International Journal of Business and Economics
UTTC IJBE | 38
SCB Economic Intelligence Center. (2018). Hotel Spa: A Win-Win Business
Opportunities. Retrieved October 10, 2020, from
https://www.scbeic.com/en/detail/file/
product/4384/exu3xnx6re/NOTE_EN_Hotel-Spa_20180131.pdf
Senge, P. (1990). The Fifth Discipline. London: Century Business.
Shang, S., & Seddon, P.B. (2002). Assessing and managing the benefits of enterprise
systems: the business manager's perspective. Information Systems Journal.12:
271-299.
Siam Wellness Group. (2018). SPA annual report 2018. Retrieved October 15, 2020, from
https://www.siamwellnessgroup.com/ir/files/annual_report_2018_en.pdf
Statista Research Department. (2020). Impact of COVID-19 on visitors' number Thailand
March 2019 and March 2020, by region. Retrieved October 11, 2020, from
https://www.statista.com/statistics/1140772/thailand-impact-of-covid-19-on-
number-of-foreign-visitors-by-region-of-origin/
Thai Spa Association. (2018). Spa industry study 2018: Opening the spa doors to ASEAN.
Retrieved October 15, 2020, from http://www.thaispaassociation.com/uploads/
userfiles/file/ 2018_Spa_Study_Final.pdf.
The Organizational Strategist. (2011). McKinsey 7S Model: A strategic assessment and
alignment model. Retrieved October 13, 2020, from https://whittblog.wordpress.
com/2011/04/24/mckinsey-7s-model-a-strategic-assessment-and-alignment-
model/
The Statistics Portal. (2015). Wellness and spa industry - Statistics & Facts. Retrieved 10
October 2020, from, Statista.com:https://www.statista.com/topics/1336/
wellness-and-spa/
Tourism Authority of Thailand Intelligence Center. (2016). Health & Wellness Market
Reports. Retrieved October 12, 2020, from https://www.scbeic.com/en/
detail/file/product/2953/ekn1rppsq7/EIC_Insight_ENG_Tourism_2016.pdf
Tourism Authority of Thailand. (2015). TAT Announces Results of Study Chinese High
Value Tourist Market. Retrieved October 10, 2020, from
https://www.tatnews.org/2015/04/tat-announces-results-of-study-chinese-high-
value-tourist-market/
Ulrich, D., Younger, J. & Brockbank, W. (2008). The twenty-first-century HR
organization. Human Resource Management. 47.
Waterman, R. H. Peters, T.J. & Phillips, J. R. (1980). Structure is not organization.
Business Horizons. 23, (3) 14-26.
Wisnom, M. & Capozio, L. (2012). Spa management. New jersey: Pearson Education.
World Health Organization. (2020). The Ministry of Public Health and the World Health
Organization Review Thailand’s COVID-19 Response. Retrieved October 10,

UTCC International Journal of Business and Economics
UTTC IJBE | 39
2020, from https://www.who.int/thailand/news/detail/14-10-2020-Thailand-
IAR-COVID19
World Travel and Tourism Council. (2020). Coronavirus puts up to 50 million Travel and
Tourism jobs at risk says WTTC. Retrieved October 11, 2020, from
https://wttc.org/News-Article/Coronavirus-puts-up-to-50-million-Travel-and-
Tourism-jobs-at-risk-says-WTTC

UTCC International Journal of Business and Economics
UTTC IJBE | 40
UTCC International Journal of Business and Economics
UTTC IJBE | 41
UTCC International Journal of Business and Economics (UTCC IJBE)
Volume 13 Number 2, August 2021
EXAMINING CHINESE TOURISTS’ TRAVELING
BEHAVIOR ENGAGED WITH CULTURAL TOURISM
IN THAILAND
Korawan Sangkakorn¹, Pachernwaat Srichai² and
Ravee Phoewhawm³ 1,2Social Research Institute, Chiang Mai University
239 Huay Kaew Road, Amphur Muang, Chiang Mai, Thailand, 50200 3 International Business School, Chongqing Technology and Business University,
Xuefu Street, No.19, 400067, Chongqing, China [email protected], [email protected], [email protected]
Abstract
Cultural tourism can bring about challenging viewpoints and adapting to accommodate
the requirements of visiting travelers. This work examines the behavior of Chinese
tourists who are engaged with cultural tourism in Thailand This work examines the
traveling behaviors of Chinese tourists engaged with cultural tourism in Thailand and
offers a proposal for cultural tourism management to accommodate with the behaviors.
The examination of the large number of tourists’ behavior arriving from mainland China
with a specific idea provides plenty of information for the cultural tourism management
to develop a strategy and a whole new practical refinement for accommodating tourists.
Keywords: Behavior, Chinese Tourists, Culture, Management, Planning, Traveling
Introduction
Culture is the beliefs and values that
identity the people, their custom, and
traditional practices that reinforces the
ideas for living and lifestyle. In the field
of tourism, the local culture can
sometimes be challenged on certain
viewpoints, tested on the principles
uphold, and may have to adapt at times to
accommodate the trade and commerce
from the demand of visiting travelers
(Ali, Ryu and Hussain, 2016). The
record number of foreign travelers
coming to Thailand has brought about
some contemporary mixed emotions for
the locals to provide the very best in
offering that ideal service that would
leave a lasting impression on them. It’s
vital to promote a message for goodwill
and trust for all sides to make the idea of
cultural tourism viable in the long run as
it’s the source of livelihood for some
stakeholders (Engeset and Elvekrok,
2015). There has been investment made
in the traveling and communication
infrastructure by the government and

UTCC International Journal of Business and Economics
UTTC IJBE | 42
organizations in order to cater to the
needs of the large number of tourists
vacationing in Thailand. Educational
curriculums and training have been
updated to ensure that the vocation is
geared towards making the travelers from
mainland China feel welcomed and
secured. Tour sites have made the
arrangements for Chinese visitors to gain
that extra value in purchasing a standard
item of service or product. With regards
to the infrastructure arranged to support
cultural tourism all things need to be
ensured that the events taking place meet
the well-being and health of the locals as
well as the travelers (Zhao and Lin,
2014). However, the question of the
Chinese tourists’ traveling behavior
going through the route of Thai cultural
tourism has not yet been fully
investigated.
Research aim &
questions The intention of this research is to
examine the traveling behaviors of
Chinese tourists who are engaged with
cultural tourism in Thailand. In addition,
the study offers a proposal for cultural
tourism management to accommodate
with the behaviors displayed. The
following questions have been asserted to
obtain a proper investigation:
1. What are the traveling behaviors of
Chinese tourists taking part in cultural
tourism?
2. What are the practical guidelines in
cultural tourism management to
accommodate with the traveling
behaviors of Chinese tourists?
Literature review
Traveling behavior of cultural
tourists The political, social, economic, and
technological background of foreign
tourists are uniquely diverse in their own
ways which provide them a combination
of making sense of things from different
viewpoints that give them a better
purpose for vacationing which can be a
sharing experience with others as a
source of information to assist in decision
making for traveling (Malik, Madappa
and Chitranshi, 2017). The
environmental living condition that
stems from being heavily influenced by
the government or elemental factors
often shapes how the person thinks and
carries out his/her beliefs in practical
action that influence the number of times
taking a trip, using a specific amount of
days to spend on their vacation, and
selecting a certain period for traveling
(Boland and Shirlow, 2016). Individuals
growing up in a highly developed nation
have access to channels of education and
public media broadcasting which provide
updated information to get some
understanding about other nation’s
culture, what kind of accommodations
are provided, and figuring out the best
transportation that will get them into that
country (Murtagh, Boland, and Shirlow,
2016). The event organizers and
planners will have to keep in mind that
the foreign travelers may know more
than the tour guide and even the locals
themselves especially when it comes to
the traveling preferences that stems from
the number of family members or close
friends that are accompanying them. To
maintain professional credibility and
sincere passion the approach for making
the tour for the foreign visitors in great
hospitality care on behalf of the tour
UTCC International Journal of Business and Economics
UTTC IJBE | 43
operators will have to seek for ways to
add value into the service or in the
marketed product that can give travelers
a proper method in planning and
organizing their own journey (Iverson,
2010). Some level of stewardship needs
to be in placed in order to prevent the
culture’s beliefs and values from being
another exploited commodity that
manipulates people into making an
expensive purchase. In a sense, tourists
from another country should not be
‘taken for a ride’ just to get some money
squeezed out of their pockets otherwise it
creates a bad impression that would lead
to negative blogging for other travelers to
be cautious of; let other choices of
vehicles be available for traveling to
various destinations along the route
(Kalman, 2017). Cultural tourism can act
as a vehicle promoting international
relations and a good understanding on
how to work together for great intentions
toward peace and prosperity (Ruhanen,
2013). The tourist sites promoting
cultural tourism can be a positive catalyst
for alleviating differences between
people, creating a bridge that connects
people together, brings about a sense of
accountability on others to be responsible
for their own actions, and instilling
appreciation to uphold values in
universal camaraderie (Bramwell, 2011).
Models for cultural tourism are always
going to be challenged as the systems in
place can only be efficient and effective
as the people who put in their efforts of
producing the expected values. Things
that are disturbing to the eyes and
shocking to the heart such as depletion of
natural resources, waste and pollution
going out of control, and deviant
behaviors that make others
uncomfortable can happen abruptly
despite strong attempts to prevent them
(Almeida, Costa and da Silva, 2017).
However, the feelings can all be forgiven
and commendable when action is taken
to reinstate a proper balance for putting
things at ease for everyone to have a
strong confidence that the events are
designed to be in concerned for the best
interests for all (Yuan, 2013).
In practice for guideline
management of cultural
tourism
With the idea of cultural tourism in
gathering people from different parts of
the world to enjoy the experience with
one another in unison organizers of the
events must ensure that the spiritual
elements become the main point over the
technical and material elements (Zoltan
et. al., 2015). In the midst of wonder and
delight the events aim for travelers to be
enamored with the heritage and customs
on how the local people go about their
ways blending the practical beliefs in
their social settings and as part of their
work functions (Oikonomopoulou et al.,
2017). Most important is that the foreign
travelers are receiving some valuable
education and learning opportunities that
give a greater meaning of dignity and
respect for others which they can apply
back in their home nation (Ross et al.,
2017). Cultural tourism requires a strong
support for maintaining itself to be
sustainable for all stakeholders involved.
There’s a call for more practical ways
that are innovative and creative for the
sake of restoring the cultural values that
enable the locals to have the time and
space for finding solutions to a particular
problem and to resolve matters for the
benefit of moving forward (Marianne,
Bickel and Harrill, 2017). The dynamics
within cultural tourism include different

UTCC International Journal of Business and Economics
UTTC IJBE | 44
groups and individuals looking to gain
something that can fulfill their spirit, life,
commercial income, belief or
relationship, therefore all group members
have to collaborate in coordination to
ensure that there’s an appreciation for
providing the platform for being
immersed in the positive changes
(Kortegast and Kupo, 2017). Not all
plans for cultural tourism will be
followed accordingly nor will it
guarantee that the mission objectives
have been accomplished. Event
organizers and planners will need to have
a new sense of direction when the
changes in attitudes and behaviors occur
amongst the foreign travelers and the
stakeholders involved so that the concept
and ideas that go into cultural tourism
don’t make things redundant which could
stagnate the market (Tomlinson-Clarke
and Clarke, 2010).
Methodology The study was conducted in the Chiang
Mai cultural tourist spots with
questionnaire that targeted 250 Chinese
travelers who were taking part in the
activities and event. These visitors were
asked about the following with regards to
their actions for traveling:
1. Frequency of traveling
2. Favorite season for traveling
3. Travel preferences
4. Traveling in numbers to the northern
region of Thailand
5. Method in planning and organizing
6. Source of information used for
traveling plans
7. Accommodation chosen
8. Number of days used for traveling
9. Traveling purpose
10. Tourist sites visited
11. Transportation used to enter the
northern region
12. Vehicles Used for Traveling to
Various Destinations
The feedback gathered from their
response was utilized as information for
“the practical guidelines for management
to accommodate with the behaviors”.
Results Traveling behaviors of Chinese tourists The results based on the traveling behavior of Chinese tourists are as followed:
Table 1 Frequency of traveling by Chinese respondents
Frequency of traveling Total Percentage
1. Rarely traveled / visited a few times. 5 5.1
2. About 2-3 times in a year 13 13.3
3. Once a year 20 20.4
4. 2-3 times a year 46 46.9
5. 4-5 times a year 9 9.2
6. More than 5 times a year 5 5.1
Total 98 100.0

UTCC International Journal of Business and Economics
UTTC IJBE | 45
46.9% of Chinese tourists travel 2-3
times a year. 20.4% of the mainland
residents travel once a year. About
13.2% travel 2-3 times in a year, while
only 9.2% travel 4-5 times a year. 5.1%
rarely travel and travel more than 5 times
a year.
Table 2 Favorite season for traveling by Chinese respondents
Favorite season for traveling Total Percentage
1. Not specific to a season / every season. 89 89.0
2. Winter 8 8.0
3. Summer 3 3.0
Total 100 100.0
There is no particular season chosen as
the favorite time of year for traveling
(89.0), most of them will come to travel
in the northern region. There’s a very
small number traveling in the winter
(8%) and summer (3%).
Table 3 The travel preferences of Chinese respondents
Travel preferences Total Percentage
1. Non-festive days 72 72.7
2. Sunday/non-holiday 2 2.0
3. Public Holiday / Long Weekend 18 18.2
4. Period of the festival - traditions. 1 1.0
5. Other 6 6.1
Total 99 100.0
Based on their travel preferences, 72.7%
of Chinese tourists mostly choose to
make trips that fall on the ordinary days.
18.2% choose to travel on the public
holiday/long weekend. A very small
number of Chinese tourists travel on a
Sunday/non-holiday (25) and festival
periods (1%).
Table 4 Traveling in numbers to Northern Thailand of Chinese respondents
Traveling in numbers to Northern Thailand Total Percentage
1. Come alone 11 11.0
2. Come with spouse 22 22.0
3. Come with the family. 34 34.0
4. Come with friends 33 33.0
Total 100 100.0
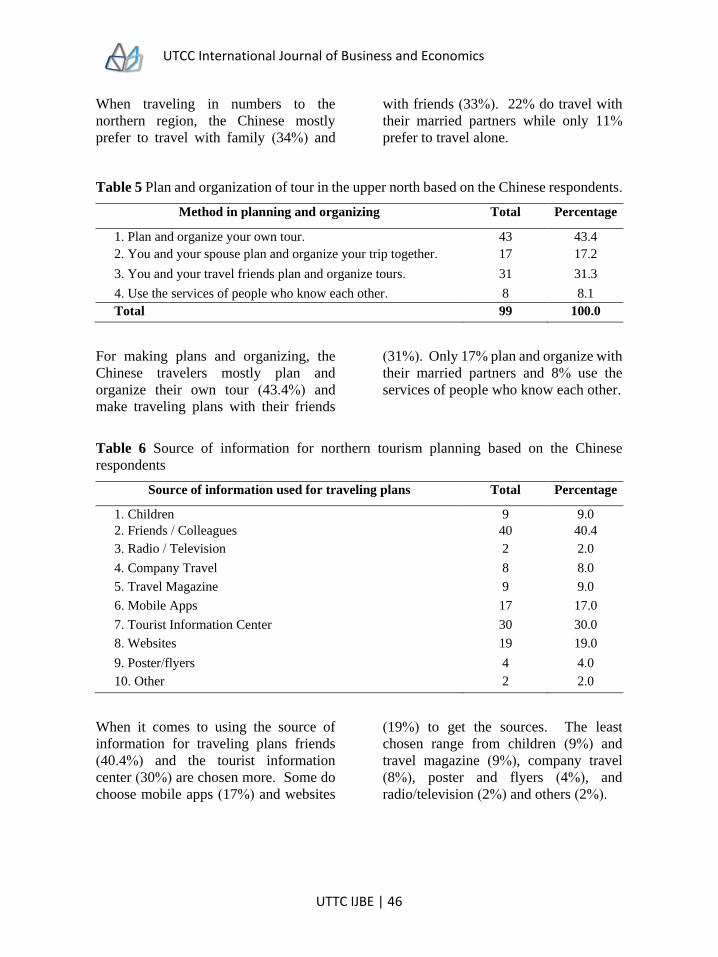
UTCC International Journal of Business and Economics
UTTC IJBE | 46
When traveling in numbers to the
northern region, the Chinese mostly
prefer to travel with family (34%) and
with friends (33%). 22% do travel with
their married partners while only 11%
prefer to travel alone.
Table 5 Plan and organization of tour in the upper north based on the Chinese respondents.
Method in planning and organizing Total Percentage
1. Plan and organize your own tour. 43 43.4
2. You and your spouse plan and organize your trip together. 17 17.2
3. You and your travel friends plan and organize tours. 31 31.3
4. Use the services of people who know each other. 8 8.1
Total 99 100.0
For making plans and organizing, the
Chinese travelers mostly plan and
organize their own tour (43.4%) and
make traveling plans with their friends
(31%). Only 17% plan and organize with
their married partners and 8% use the
services of people who know each other.
Table 6 Source of information for northern tourism planning based on the Chinese
respondents
Source of information used for traveling plans Total Percentage
1. Children 9 9.0
2. Friends / Colleagues 40 40.4
3. Radio / Television 2 2.0
4. Company Travel 8 8.0
5. Travel Magazine 9 9.0
6. Mobile Apps 17 17.0
7. Tourist Information Center 30 30.0
8. Websites 19 19.0
9. Poster/flyers 4 4.0
10. Other 2 2.0
When it comes to using the source of
information for traveling plans friends
(40.4%) and the tourist information
center (30%) are chosen more. Some do
choose mobile apps (17%) and websites
(19%) to get the sources. The least
chosen range from children (9%) and
travel magazine (9%), company travel
(8%), poster and flyers (4%), and
radio/television (2%) and others (2%).

UTCC International Journal of Business and Economics
UTTC IJBE | 47
Table 7 Accommodation used in this trip by Chinese respondents.
Accommodation chosen Total Percentage
1. Hotel 72 72.0
2. Resort 12 12.0
3. Guest house 8 8.0
4. Apartment / Dormitory / Condo 10 10.0
5. Homestay 6 6.0
6. Other 3 3.0
For accommodation, most of the Chinese
travelers are residing in the hotel (72%).
Other choices that are not quite popular
to stay are the resorts (12%),
apartment/dormitory/condo (10%), guest
house (8%), and homestay (6%).
Table 8 Duration of travel by Chinese respondents
Number of days used for traveling Total Percentage
1. ≤2 days 4 4.0
2. 3–4 days 10 10.1
3. 5– 6 days 46 46.5
4. 7–8 days 15 15.2
5. ≥9 days 24 24.2
Total 99 100.0
Minimum 1 day Maximum 17 days Average of 6.97 days Standard Deviation of 3.501 days
46.5% of Chinese travelers are more
likely to stay for about 5-6 days, while
24.2% would stay for more than 9 days.
Some tourists are willing to stay for 7-8
days (15.2%) and 3-4 days (10.1%).
Only 4% would stay at less than 2 days.
Table 9 The purpose of taking the trip by the Chinese respondents
Traveling purpose Total Percentage
1. To relax and refresh the body / mind. 56 56.0
2. To learn and understand the way of life / culture / beliefs of the
community.
27 27.0
3. To admire the beautiful nature and landscape. 48 48.0
4. It is an opportunity to be with your family / friends. 44 44.0
5. To seek new business channels/Looking for new products. 2 2.0
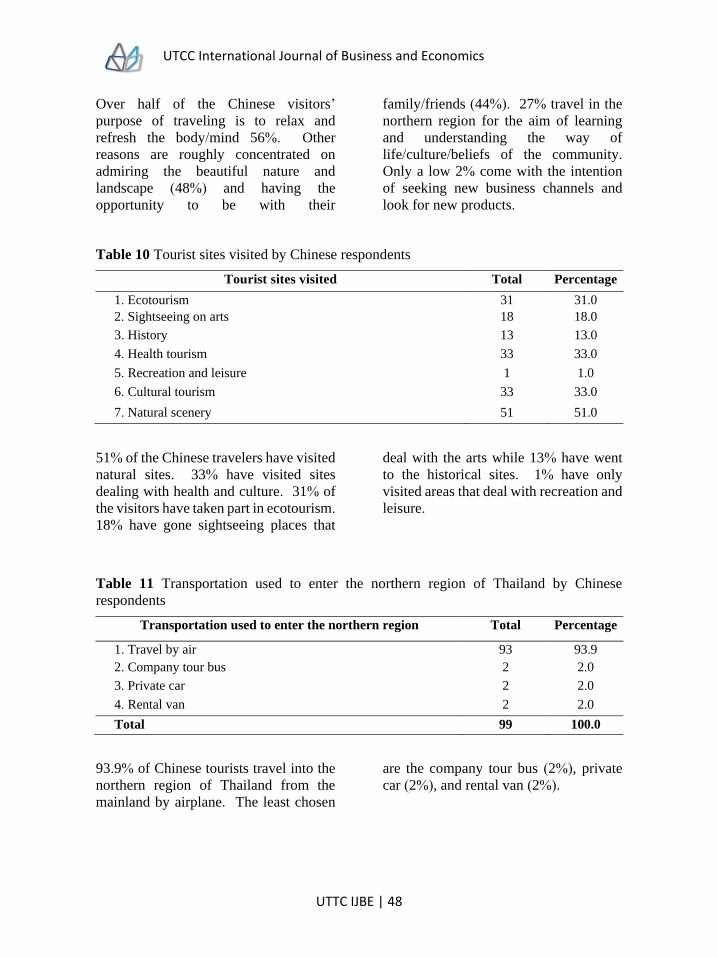
UTCC International Journal of Business and Economics
UTTC IJBE | 48
Over half of the Chinese visitors’
purpose of traveling is to relax and
refresh the body/mind 56%. Other
reasons are roughly concentrated on
admiring the beautiful nature and
landscape (48%) and having the
opportunity to be with their
family/friends (44%). 27% travel in the
northern region for the aim of learning
and understanding the way of
life/culture/beliefs of the community.
Only a low 2% come with the intention
of seeking new business channels and
look for new products.
Table 10 Tourist sites visited by Chinese respondents
Tourist sites visited Total Percentage
1. Ecotourism 31 31.0
2. Sightseeing on arts 18 18.0
3. History 13 13.0
4. Health tourism 33 33.0
5. Recreation and leisure 1 1.0
6. Cultural tourism 33 33.0
7. Natural scenery 51 51.0
51% of the Chinese travelers have visited
natural sites. 33% have visited sites
dealing with health and culture. 31% of
the visitors have taken part in ecotourism.
18% have gone sightseeing places that
deal with the arts while 13% have went
to the historical sites. 1% have only
visited areas that deal with recreation and
leisure.
Table 11 Transportation used to enter the northern region of Thailand by Chinese
respondents
Transportation used to enter the northern region Total Percentage
1. Travel by air 93 93.9
2. Company tour bus 2 2.0
3. Private car 2 2.0
4. Rental van 2 2.0
Total 99 100.0
93.9% of Chinese tourists travel into the
northern region of Thailand from the
mainland by airplane. The least chosen
are the company tour bus (2%), private
car (2%), and rental van (2%).

UTCC International Journal of Business and Economics
UTTC IJBE | 49
Table 12 Vehicles used for traveling to various tourist destinations by Chinese respondents
Vehicles used for traveling to various destinations Total Percentage
1. Car 2 2.0
2. Public bus 11 11.0
3. Tour bus 13 13.0
4. Car rental 31 31.0
5. Tuk Tuk 48 48.0
6. Taxi 19 19.0
7. Other 6 6.0
When traveling to get to various
destinations within the northern region of
Thailand, 48% acquire the traveling
services of the Tuk Tuk which is a
motorized rickshaw. 31% would rent a
car to travel around. 19% choose a taxi
to get their desired points. 13% would
take a tour bus and 11% get on the public
bus for traveling about. While 6% have
identified other forms of transportation
only 2% would take the car in riding to
their destinations.
Practical management
guidelines for accommodating
the behaviors of Chinese
tourists
A delicate balance that pushes visitors to
take part in a cultural learning and
understanding experience while also
pulling them to enhance the charm that
makes the cultural events alluring for
other foreign travelers would be grand in
making the cultural tourism economy and
environment highly sustainable (Pesonen
et al., 2011). For the practical guidelines
in accommodating with the behaviors of
Chinese tourists the cultural tourism
management will have to work with the
facts to conjure up the ways to get the
tourists feel a great deal of satisfaction
along their traveling journey. With 56%
of the Chinese travelers coming to travel
for the purpose of resting the body and
the mind, 48% coming to admire the
beautiful nature and landscape, and 44%
taking the opportunity to be with their
friends and family the cultural tourism
management group will have to design
the facilities within the infrastructures to
have tourists be exposed to the serenity
of the exquisite urban/rural environment
that also welcomes them to partake
events that involves their family and
friends. With regards to the tourists sites
visited mainly involving the natural
scenery (51%), health and culture (33%),
and ecotourism (31%) some financial
arrangements will have to be set aside for
making re-investments to uphold the
systems to keep the services robust
throughout a longer period of time. A
good number confirming that Chinese
travelers are more likely to travel 2-3
times a year (46.9%) during the non-
festive days (72.7%), with no particular
season chosen as the favorite time of year
for traveling (89%), and staying for about
5-6 days (46.5%): this information
provides the initiative for the cultural
tourism management to be in contact
with the hospitality network for having
their hotels room available for booking
because most of the tourists from the
UTCC International Journal of Business and Economics
UTTC IJBE | 50
mainland prefer to stay at a hotel (72%).
Security and safety measures have to be
aligned as a majority of Chinese travelers
are coming by airplane (93.9%) to enter
the northern region of Thailand. Cultural
tourism management will also need to
make use of the social media and other
forms of digital communication to keep
the Chinese tourists updated about
certain events and interesting places to
visit because these travelers who mostly
prefer to travel with family (34%) and
with friends (33%) often get together
with people who they are familiar with
(40.4%) for making traveling plans;
information center (30%) will also need
to be modernized to give the best services
for the visitors. Since the Chinese
travelers mostly plan and organize their
own tour (43.4%) and make traveling
plans with their friends (31%)
management will have to provide the
accessible resources that speak in their
native language to point out the
information about the cultural site and to
be aware of what behavior is acceptable
and what is not. Cultural tourism
management will have to ask for some
collaborative assistance with the law
enforcement agencies to provide the
protection and direction needed for
Chinese tourists who prefer to ride in a
tuk-tuk (48%), rent a car (31%), or get a
taxi (19%) just to get to their various
destinations.
Discussion and
conclusion The examination of the large number of
tourists’ behavior arriving from mainland
China with a specific idea provides
plenty of information for the cultural
tourism management to develop a
strategy for in accommodation in the
northern region of Thailand. Working
with the facts on the traveling purpose,
their length of stay, chosen place to stay,
how traveling plans are made, and means
of transportation all give a better
perspective on defining ways in
arranging the conditions for traveling and
transportation: while the safety and
security issue is always the focus the
others side is on providing the access to
be more positively engaged with the
natural beauty of the environment and
landscape. For cultural tourism to be at
its best the thinking has to be along the
value chain to help management discuss
about the details and sources that are
occurring with fellow members of the
tourism network to agree on the services
or products that need to be improved
upon (Ogaboh Agba, 2010). In
conclusion, cultural tourism is already
complex and dynamic with the ideas and
behaviors meshing, colliding, or
sometimes in conflict with one another.
The addition of the details from the
examination of Chinese tourists’
behavior brings the equation to a whole
new practice for management in cultural
tourism. Unlike working in an office at
an organization, cultural tourism needs to
have all the key players and resources to
be developed in alignment (Muskat,
Muskat and Blackman, 2013). Cultural
events and activities will need to be
organized as a framework for learning
how to empower the staff to anticipate for
problems or get organizations tightly
involved to find the hidden values that
can bolster a terrific cultural experience
for the Chinese tourists to keep on
coming back to visit the northern region
of Thailand.
UTCC International Journal of Business and Economics
UTTC IJBE | 51
References Ali, F. Ryu, K. & Hussain, K. (2016), “Influence of Experiences on Memories, Satisfaction
and Behavioral Intentions: A Study of Creative Tourism,” Journal of Travel &
Tourism Marketing, Vol.33, No. 1, pp. 85–100.
Almeida, J. Costa, C. & da Silva, F.N. (2017), “A Framework for Conflict Analysis in
Spatial Planning for Tourism,” Tourism Management Perspectives, Vol.24,
October, pp. 94-106.
Baum, T. (2012), “Human Resource Management in Tourism: A Small Island
Perspective”, International Journal of Culture, Tourism and Hospitality
Research, Vol.6, No. 2, pp. 124-132.
Bickle, M. C. & Harrill, R. (2010), “Avoiding Cultural Misconceptions During
Globalization of Tourism”, International Journal of Culture, Tourism and
Hospitality Research, Vol.4, No. 4, pp. 283-286.
Bramwell, B. (2011), “Governance, the State and Sustainable Tourism: A Political
Economy Approach”, Journal of Sustainable Tourism, Vol.19, No. 4–5, pp. 459–
477.
Engeset, M. G. & Elvekrok, I. (2015), “Authentic Concepts: Effects on Tourist
Satisfaction”, Journal of Travel Research, Vol.54, No. 4, pp. 456–466.
Iverson, T. J. (2010), “Cultural Conflict: Tourists Versus Tourists in Bali, Indonesia”,
International Journal of Culture, Tourism and Hospitality Research, Vol.4, No.
4, pp. 299-310.
Kalman, H. (2017), “Destruction, Mitigation, and Reconciliation of Cultural Heritage”,
International Journal of Heritage Studies, Vol.23, No. 6, March, pp. 538-555.
Kortegast. C. & Kupo, V. L. (2017), “Deconstructing Underlying Practices of Short-term
Study Abroad: Exploring Issues of Consumerism, Post-colonialism, Cultural
Tourism, and Commodification of Experience”, International Journal of Critical
Pedagogy, Vol.8, No. 1, pp. 150-172.
Malik R., Madappa, T. & Chitranshi, J. (2017), “Diversity Management in Tourism and
Hospitality: An Exploratory Study”, Foresight, Vol.19, No. 3, pp. 323-336.
Murtagh, B. Boland, P. & Shirlow, P. (2016), “Contested Heritages and Cultural Tourism”,
International Journal of Heritage Studies, Vol.23, No. 6, pp. 506-520.
Muskat, B. Muskat, M. & Blackman, D. (2013), “Understanding the Cultural Antecedents
of Quality Management in Tourism”, Managing Service Quality: An
International Journal, Vol.23, No. 2, pp. 131-148.
Ogaboh Agba, A. M. Ikoh, M. U. Bassey, A. O. & Ushie, E. M. (2010), “Tourism Industry
Impact on Efik's Culture, Nigeria”, International Journal of Culture, Tourism
and Hospitality Research, Vol.4, No. 4, pp. 355-365.
Oikonomopoulou, E. Delegou, E. T. Sayas, J. & Moropoulou, A. (2017), “An Innovative
Approach to the Protection of Cultural Heritage: the Case of Cultural Routes in
Chios Island, Greece”, Journal of Archaeological Science: Reports, Vol. 14,
August, pp. 742–757.
Pesonen, J. Komppula, R. Kronenberg, C. & Peters, M. (2011), “Understanding the
Relationship Between Push and Pull Motivations in Rural Tourism”, Tourism
Review, Vol.66, No. 3, pp. 32-49.

UTCC International Journal of Business and Economics
UTTC IJBE | 52
Ross, D. Saxena, G. Correia, F. & Deutz, P. (2017), “Archaeological Tourism: a Creative
Approach”, Annals of Tourism Research, Vol.67, pp. 37–47.
Ruhanen, L. (2013), “Local Government: Facilitator or Inhibitor of Sustainable Tourism
Development?”, Journal of Sustainable Tourism, Vol.21, No. 1, pp. 80–98.
Tomlinson-Clarke, S. M. & Clarke, D. (2010), “Culturally Focused Community Service
Learning: an International Cultural Immersion Experience”, Journal of
Multicultural Counseling & Development, Vol.38, No. 3, pp. 166-175.
Yuan, Y. (2013), “Adding Environmental Sustainability to the Management of Event
Tourism”, International Journal of Culture, Tourism and Hospitality Research,
Vol.7, No. 2, pp. 175-183.
Zhao, D. & Lin, I. Y. (2014), “Understanding Tourists’ Perception and Evaluation of Inter-
cultural Service Encounters: a Holistic Mental Model Process”, International
Journal of Culture, Tourism and Hospitality Research, Vol.8, No. 3, pp. 290-
309.
Zoltan, B. Lorant, D. Anett, T. Gyongyi, K. Veronika, M. K. Gulmira, U. Peter, K. &
Maria, V. (2015), “Basis of Heritagization and Cultural Tourism Development”,
Procedia - Social and Behavioral Sciences, Vol.188, pp. 307 – 315.
UTCC International Journal of Business and Economics
UTTC IJBE | 53
UTCC International Journal of Business and Economics (UTCC IJBE)
Volume 13 Number 2, August 2021
FACTORS INFLUENCE ONLINE SHOPPING AND
OFFLINE SHOPPING: CASE STUDIES OF RETAIL
FOOTWEAR INDUSTRY IN BANGKOK
SetthaYusuk1 and Suthawan Chirapanda2 1International School of Management, University of the Thai Chamber of Commerce 2School of Business, University of the Thai Chamber of Commerce 126/1 Vibhavadi Rangsit Rd., Dindang, Bangkok 10400, Thailand [email protected], [email protected]
Abstract
Recent research has shown explore the factors which influence the online shopping and
offline shopping behavior, Also compare online and offline shopping and understands
what factors influence online and offline shopping decision process. The study expects
to fulfill the blank space and could be employed as the reference for current companies
to associate them and improving and develop customer satisfaction in Footwear retail
business in online and offline channel. The researched survey was conducted with a
sample size of 400 respondents, of different age, gender, education, occupation and
income, also conducted in 5 popular shopping locations in Bangkok, Thailand, and
focused on impact of three major factors (Marketing Mix, Brand and Consumer
Behavior) on Online and Offline shopping, The research found that both online and
offline shopping plays an essential role in the modern Thai society. People whose
income level is high and are very busy with their personal and professional lives prefer
to purchase goods and services online. Other individuals whose income level are lower
and have no relevant knowledge about the Internet prefer to buy goods and services in
traditional ways via physical shops. But nowadays due to fast change of technology as
well as the ongoing risks associated with the COVID-19 pandemic, people try to adapt
themselves according to the changing environment. The young generation wants to
purchase every item online because they can use technology more comfortably than
other age groups. The regression analysis found show that the Brand and Marketing Mix
factors (Product, Place, Price, Promotion, Physical Evidence, People, and Processes)
influences choice decisions towards the online and offline shopping (channel
distribution) of retail footwear in Bangkok in line with Charles McIntyre, T.C. Melewar
and Charles Dennis (2016) research on the matter, while Consumer Behavior variable is
less relevant in the context of Online Shopping and Offline Shopping. The strongest
significance for the model was found between Marketing Mix (7Ps) and Online and
Offline Shopping behavior which can attest the relevance of the 7Ps model as well as
the importance of 7Ps components on the purchase intend for the footwear industry in

UTCC International Journal of Business and Economics
UTTC IJBE | 54
Bangkok, Also a strong model significance was also found between the Brand image
and Online and Offline Shopping behavior as found by Mohan, Brian P. Brown, and
Caley Cantrell (2017). This shows that brand strength plays an important role in
customer trust, regardless of the physical shop or online store when customer decides to
purchase shoes articles.
Keyword: Consumer behavior in online and offline, Marketing mix (7PS) in online and
offline and Band orientation
Introduction and
background
The researched studies the comparative
factors which influence the Online and
Offline shopping focuses on the footwear
retail business in Bangkok. The first
section starts with the background and
significance of this research. This
research investigates the comparative
factors influencing.
The increase technology provides good
opportunity to seller to reach customer in
much faster and easier, Online shopping
is emerging very fast in recent year. Now
a day the internet holds the attention of
the retail market. Many people shop
online on the other hand the purchasing
of product from traditional market is
continuing since years. Many customers
go for purchasing offline so as to
examine the product and hold the
possession of the product just after the
payment for the product. In this
contemporary world customer’s loyalty
depends upon the consistent ability to
deliver quality, value and satisfaction.
Some go for offline shopping, some for
online and many go for both kind of
shopping. The focus of the study is on the
consumer’s choice to shop on internet
and at the traditional stores at the
information gaining period. However
online shopping is easier for the people
and less price than the offline shopping.
While making any purchase decision
consumer should know the medium to
purchase whether online shopping or the
offline shopping. Consumer should
decide the channel for them which can
best suit to their need and wants and
which can satisfy them. In this
competitive world how, consumer can
decide the particular medium for their
purchase of goods is very important to
understand in a managerial point of view.
(Laing and Lai, 2000). The customer of
online shopping should have internet and
valid method of payment in order to
purchase the products from the internet.
Amazon, Myntra, flipkart are some of the
examples of the successful online
shopping sites that use less price of the
items and large stocks to attract the
consumer. In general, the population
from high level of income and high level
of learning are more favorable to do
online shopping. The populations who
are more knowledgeable and more
explored to the internet are more into
online shopping. The increase in
technology increases the online shopping
by the consumer. The increase in
technology creates a favorable attitude
towards the consumer for online
shopping. (Palmer& Kimberly,2007).
UTCC International Journal of Business and Economics
UTTC IJBE | 55
Retailers in footwear industry needed the
strategy to develop online and offline
channel. With the well-created strategy,
they could also attain their goals
regardless of the channel customers used
to access information about product
including product review, visibility and
availability. Therefore, the companies
who aimed to meet the profitability and
success as well as business development
should take strategy development as their
priority. This could change the way the
shopping scene viewed by the customer
experience (Conny T. &Niklas V. 2015).
Online and Offline channel in Footwear
retailer can be found in different ways.
Nevertheless, the core principle was the
development of the retailer potential to
reach and interact with their customers
via established sale channels
successively (Frazer & Stiehler, 2014;
Rigby, 2011). Channels utilized by
retailers could be the mobile app, social
media sites, their websites, physical
store, television, call centers and so on
(Rigby, 2011; Piotrowicz& Cuthbertson,
2014).
The experience occurs when a company
intentionally uses services as stages and
products as props to engage with
customers in a way that creates
memorable experiences. Therefore,
claiming that an experience is fully
staged by the company. (Pine and
Gilmore, 1998) had a more general view
on customer experience. He held that
experiences “occur as a result of
encountering, undergoing or living
through things. Experiences provide
sensory, emotional, cognitive,
behavioral, and relational values that
replace functional values” (Bernd
Schmitt, 1999) Therefore stating that
experience occurs in every encounter and
living moment of a person. define
customer experience as something that is
advocated by the customer instead of the
company. “Customer experience is the
internal and subjective response
customers have to any direct or indirect
contact with a company. Direct contact
generally occurs in the course of
purchase, use, and service and is usually
initiated by the customer.” (Meyer &
Schwager, 2007).
Bangkok, particularly Thailand District
as we all know, is one of the most
educated states in the country. It is
important to look into the situation from
an academic research point of view so as
to question the reasons behind the
condition of the shopping in the state
Bangkok, particularly Thailand District.
The researched may fill the gap between
the choice of online shopping and offline
shopping. This study reflects the
problems and factors of online and
offline shopping. There were certain
problems, why people do not do online
shopping and go for market to shop
things? What are the major reasons
behind the online and offline shopping?
This study helps the consumer to get an
idea about the online shopping. The study
makes the consumer clear about which
option should be taken by the consumer
to get more benefit out of its.
Therefore, this study aims to discuss and
explore the comparative factors which
influencing Online and Offline shopping
of footwear industry in Bangkok. This
study is expected to be used as the
guideline for the companies within the
footwear industry to understand and
interpret the needs of customers through
the online and offline shopping.

UTCC International Journal of Business and Economics
UTTC IJBE | 56
Research objective
In recent years, studies distinguished
another non store retail format Internet.
Recent studies investigated why
consumers shop through stores, catalogs,
or the Internet (Black et al.2002). The
study contributes to the current
marketing literature by comparing the
offline and online channel side-by-side.
This study also contributes
hypothetically and practically to a better
understanding.
-To examine the factors affecting online
shopping
-To find the factors affecting offline
shopping
Research questions
1. What are the factors that influence
online shopping?
2. What are the factors that influence
offline shopping?
The thesis could benefit retailers for the
use of measuring and compare online and
offline shopping. The online and offline
shopping is lack in previous studies
meanwhile factors affecting to online and
offline shopping in is still unidentified
(Piotrowicz and Cuthberson, 2014;
Verhoef et., 2015). Thus, this study
expects to fulfill the blank space and
could be employed as the reference for
current companies to associate them and
improving and develop customer
satisfaction in Footwear retail business in
online and offline, this research can also
be used as the reference for the future
studies.
Literature review
Marketing Mix (7Ps) Strategy
in online shopping
In the area of e-commerce, the
development of the marketing concept
can be considered in two important
aspects. The first aspect – is the
development of the service component.
E-commerce, as it has been mentioned
earlier - is the sphere of commercial
activity to provide online trading
services. It is carried out in the special
environment, which, on one side, has the
features of the service environment, and
on the other side - rejects these signs
because it is virtual. Not material,
technological and programmatic nature
of the sales process, distanced
communication (often more than
hundreds or thousands of kilometers)
between a seller and a buyer, the inability
to get to know the features of the goods
in a real life - these are just some of the
features inherent in the trading service in
the Internet. The second aspect of the
development of the marketing concept in
ecommerce is due to the special role of
the innovation component. (E.V.
POGORELOVA ET AL., 2016)
Band orientation in online
shopping
Torsten Lihra and Raoul Graf (2007)
studied about the Online and Offline
shopping consumer choice in regard with
the buying process and selection of
household furniture. According to their
study, they suggested that the retailers
should continue to develop marketing
strategies as consumers relied on many
channels to meet their needs for products
UTCC International Journal of Business and Economics
UTTC IJBE | 57
and services. Charles McIntyre, T.C.
Melewar and Charles Dennis (2016)
stated in their book that the Online and
Offline channel experience, retail
customer experience including service
process should be incorporated in order
to create engagement and interaction
between customer and brand as well as
customer experience. Mosquera, Pascual
and Ayensa (2017) studied about the
customer experience in Online and
Offline shopping. Their study aimed to
overview and increase more
understanding towards the trend of
Online and Offline shopping. The
method they used was the collection of
over 100 papers and business reports
from Scopus, Google Scholar, and Web
of Science. Mayo or Mohan, Brian P.
Brown, and Caley Cantrell (2017)
studied about the influence of brand
image to the customers’ experience.
Their study pointed out those brands
mattered in consumers’ lives meanwhile
some brands were perceived as more
valuable compared to others brands.
Consumers were more interested in
brands of which enhanced their
autonomy, competence including
potential to relate to others from their
view.
Consumer behavior in online
shopping
In order to analyze with precision, the
availability of customers to behave in
offline shopping the same way they do in
online shopping, it is useful to understand
the processes behind online consumer
behavior. Online consumer behavior is
described as the process of purchasing
products or services through the internet
(Liang and Lai, 2000). The typical
process begins when potential consumers
recognize a need for some product or
service. The next step is searching for
information in the web related with their
specific need. After deciding, the
transaction is performed and post-sales
services are provided (Li & Zhang,
2002).
Online channel
The online channel, the retail can offer
the customer worldwide product section
compare with the physical channel.
Additionally, the online channel can
reduce cost of customer searching by
provide the information of product and
recommendation and reviews also can
compare price as well as quick and easy
to check by online the customer have to
rethink of online channel offer the option
to use online channel such as cash
payment and traditional face to face
interaction are present (Piotrowicz &
Cubertson, 2014; Zhang et al., 2010), but
online channel provide the online
payment that should be to selected.
Marketing Mix (7Ps) Strategy
in offline shopping
Marketing Mix or 7Ps is defined as the
strategy as a direction and scope for an
organization in meeting long term
objectives by configuring its resources in
the present dynamic business
environment (McCarthy, 2011). Nagle
and Holden (2012) stated that marketing
mix was important for the strategic
management and also became a
framework of controllable and tactical
tools which developed the marketing and
was often utilized by the marketers in
order to so as target the needs of their
target customers.
UTCC International Journal of Business and Economics
UTTC IJBE | 58
Thus, the marketing mix strategies
should contain the responses of the
organization to ensure that the target
customers were positively influencing
their product needs. In To meet the
customer needs, the marketers must have
a close focus on the customers’ behavior
so that they could develop the marketing
strategies to improve their performance.
Marketing Mix (7Ps) Strategy, there are
four elements which the marketers are
about to develop following to the
consumer behaviors which are price,
place, product and promotion.
Band orientation in offline
shopping
Band orientation is considered as a
unique cluster of associations within the
minds of the customers towards the
brand. It represents the way they believe
brand stands for. Moreover, the brand
image can be defined as the set of beliefs
about the brand. In other words, brand
image is included in a part of consumers’
perception about the product offered by
the brand in the market under the manner
where a specific brand is positioned itself
(Petty, 2016). Brand image is well said to
lead to the emotional value not only
mental image. This means brand image
can create the perceived value of
customers potentially and refers to
nothing but the company’s or brand’s
character.
Consumer Behavior in offline
shopping
The study of consumer behavior was
crucial for the companies as consumer
behavior influenced the marketing
strategy and helped explore the target
group and increased companies’
potential to meet customer satisfaction,
Also consumer’s behavior as the
activities which people had undertaken
when they recruited the products and
services, including consuming and
obtaining (Zeithamal and Bitner, 2000).
The marketers should examine the
probability of the consumers to purchase
for especial product and at a particular
time so that the marketers could know
that what time and which product
consumers would buy and then these
consumers can be satisfied their needs
and wants precisely. (Kumar, 2006).
Offline channel
The physical stores the retailer allows to
achieve to the customer provide goods
and services effect since the customer
does not have to wait to receive the goods
and services (Agatz et al, 2008; Grewal
et al, 2004). Operation physical stores
allows the customer to convenient as well
and provides them in the decision-
making process with any potential
(Rigby, 2011; Grewal et al; 2004). The
store retailers have opportunity to
enhance the quality of service by
personality. Also, the presence of product
and service that allow customer o try,
touch and feel before making a purchase
(Gorsch, 2000; Herhausen et al, 2015,
p.3; Rigby; Webb, 2002). The physical
store is traditional shopping still plays
key part in the market, but the “brick and
mortar” has changed to the emergence of
the Omni-channel customer experience.
The influence demand today consumer,
brands need to rethink and coordinate in
store and online experience as well.
Research hypothesis
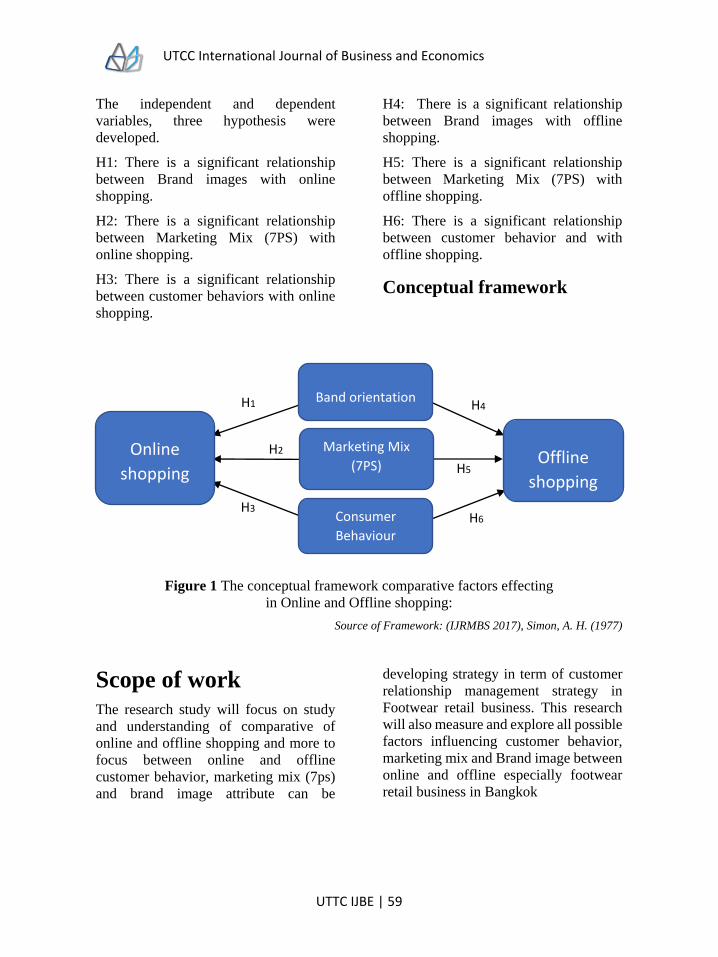
UTCC International Journal of Business and Economics
UTTC IJBE | 59
The independent and dependent
variables, three hypothesis were
developed.
H1: There is a significant relationship
between Brand images with online
shopping.
H2: There is a significant relationship
between Marketing Mix (7PS) with
online shopping.
H3: There is a significant relationship
between customer behaviors with online
shopping.
H4: There is a significant relationship
between Brand images with offline
shopping.
H5: There is a significant relationship
between Marketing Mix (7PS) with
offline shopping.
H6: There is a significant relationship
between customer behavior and with
offline shopping.
Conceptual framework
Figure 1 The conceptual framework comparative factors effecting
in Online and Offline shopping:
Source of Framework: (IJRMBS 2017), Simon, A. H. (1977)
Scope of work
The research study will focus on study
and understanding of comparative of
online and offline shopping and more to
focus between online and offline
customer behavior, marketing mix (7ps)
and brand image attribute can be
developing strategy in term of customer
relationship management strategy in
Footwear retail business. This research
will also measure and explore all possible
factors influencing customer behavior,
marketing mix and Brand image between
online and offline especially footwear
retail business in Bangkok
H2
H3
H4
H5
H6
H1
Online
shopping
Offline
shopping
Band orientation
Marketing Mix
(7PS)
Consumer
Behaviour

UTCC International Journal of Business and Economics
UTTC IJBE | 60
Methodology
This thesis was instrument of
questionnaire for collected the data and
study the comparative factors which
influence customer behavior, marketing
mix and Brand image between online and
offline especially footwear retail
business in Bangkok: case study separate
to 3 part as following; Part 1:
Demographics The questionnaire
collected personality’s data such as
gender, age, education, occupations and
revenue. There were 5 questions for
difference type and also questionnaire
structure would be close-ended question.
Part 2: Likert Scale Research by
Shim et al. (2001) found that consumers
that have a positive attitude towards
online and offline shopping are more
likely to purchase online and offline, and
a higher number of experiences with
buying results in higher purchase
intentions. They are 8 questions for brand
image, 8 questions for experience of in
your opinion which factors do you
consider for online shopping, 21
questions for experience of in your
opinion which factors do you consider
for online shopping.
Part 3: Consumer behavior they are 14
questions of consumer behavior, As
What kind of shopping channel do you
like to buy shoe?, How often do you buy
shoes?, How much time do
Part 4: Online and Offline shopping they
are 9 questions of Online and Offline
shopping
Findings and
discussion
The research found a significant
relationship between Brand images,
Marketing Mix (7Ps) with Online and
Offline Shopping. However, the
Consumer behavior was found to have no
significance on the Online Shopping
though a strong significance was found
between Customer Behavior and Offline
Shopping. Therefore, the H1, H2, H3 H4,
and H6 were found to be significant for
the present research context. In
consequence, the H5 was invalidated as
low significance was found in the
analysis for the data collected in this
study.
Table 1
Demographics Gender Men 39.5% Female 60.5%
Age 21-30
44.3%
31-40
22%
41-50
22.5%
More than 50
11.3%
Education Below or equal
High school
24%
Bachelor
Degree
43%
Master Degree
26%
More than
Master Degree
6.8%
Occupation Student
10.8%
Employees
30%
Own Business
22.5%
Retired
11.2%
Other
22.5%
Income Less than or
equal 15,000
31.8%
15,001-20,000
18.5%
20,001-30,000
34.5%
30,001-40,000
7%
40,001-50,000
8.3%
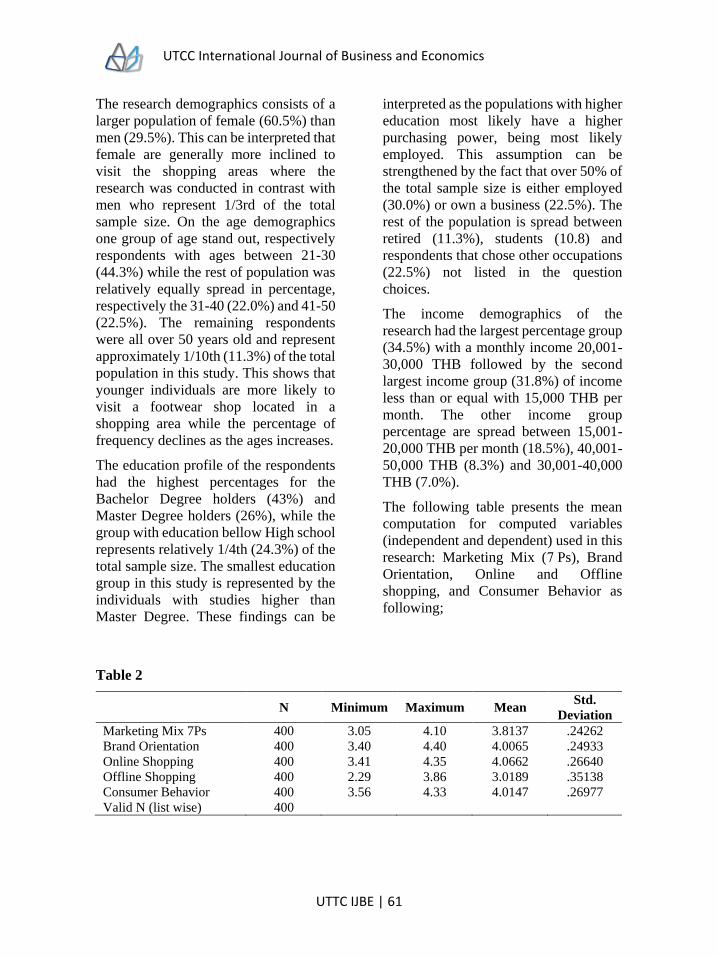
UTCC International Journal of Business and Economics
UTTC IJBE | 61
The research demographics consists of a
larger population of female (60.5%) than
men (29.5%). This can be interpreted that
female are generally more inclined to
visit the shopping areas where the
research was conducted in contrast with
men who represent 1/3rd of the total
sample size. On the age demographics
one group of age stand out, respectively
respondents with ages between 21-30
(44.3%) while the rest of population was
relatively equally spread in percentage,
respectively the 31-40 (22.0%) and 41-50
(22.5%). The remaining respondents
were all over 50 years old and represent
approximately 1/10th (11.3%) of the total
population in this study. This shows that
younger individuals are more likely to
visit a footwear shop located in a
shopping area while the percentage of
frequency declines as the ages increases.
The education profile of the respondents
had the highest percentages for the
Bachelor Degree holders (43%) and
Master Degree holders (26%), while the
group with education bellow High school
represents relatively 1/4th (24.3%) of the
total sample size. The smallest education
group in this study is represented by the
individuals with studies higher than
Master Degree. These findings can be
interpreted as the populations with higher
education most likely have a higher
purchasing power, being most likely
employed. This assumption can be
strengthened by the fact that over 50% of
the total sample size is either employed
(30.0%) or own a business (22.5%). The
rest of the population is spread between
retired (11.3%), students (10.8) and
respondents that chose other occupations
(22.5%) not listed in the question
choices.
The income demographics of the
research had the largest percentage group
(34.5%) with a monthly income 20,001-
30,000 THB followed by the second
largest income group (31.8%) of income
less than or equal with 15,000 THB per
month. The other income group
percentage are spread between 15,001-
20,000 THB per month (18.5%), 40,001-
50,000 THB (8.3%) and 30,001-40,000
THB (7.0%).
The following table presents the mean
computation for computed variables
(independent and dependent) used in this
research: Marketing Mix (7 Ps), Brand
Orientation, Online and Offline
shopping, and Consumer Behavior as
following;
Table 2
N Minimum Maximum Mean
Std.
Deviation
Marketing Mix 7Ps 400 3.05 4.10 3.8137 .24262
Brand Orientation 400 3.40 4.40 4.0065 .24933
Online Shopping 400 3.41 4.35 4.0662 .26640
Offline Shopping 400 2.29 3.86 3.0189 .35138
Consumer Behavior 400 3.56 4.33 4.0147 .26977
Valid N (list wise) 400
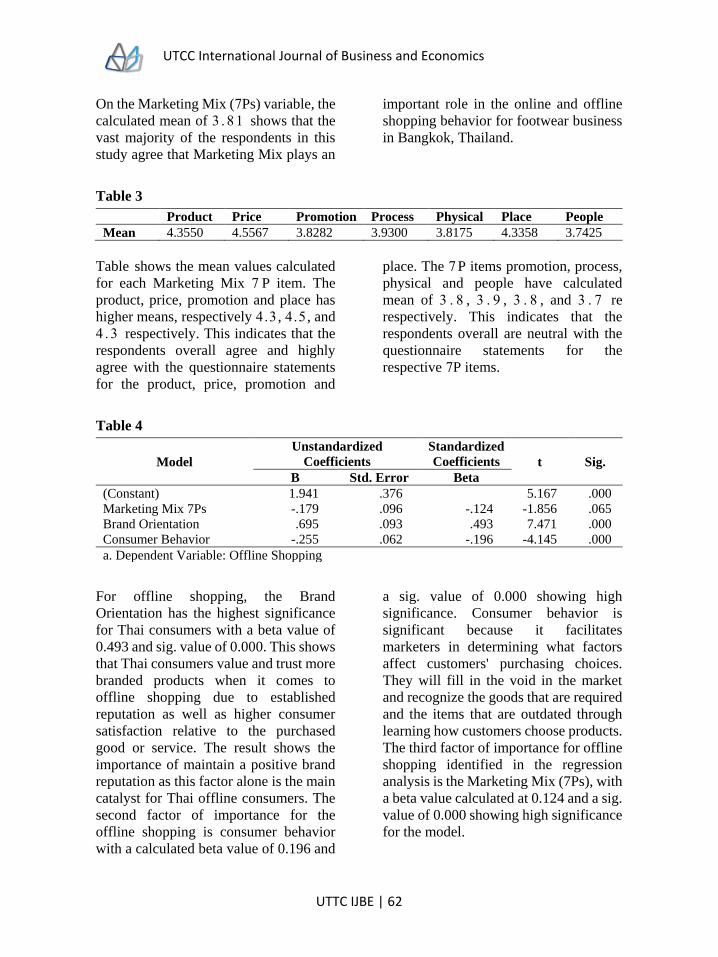
UTCC International Journal of Business and Economics
UTTC IJBE | 62
On the Marketing Mix (7Ps) variable, the
calculated mean of 3 . 8 1 shows that the
vast majority of the respondents in this
study agree that Marketing Mix plays an
important role in the online and offline
shopping behavior for footwear business
in Bangkok, Thailand.
Table 3
Product Price Promotion Process Physical Place People
Mean 4.3550 4.5567 3.8282 3.9300 3.8175 4.3358 3.7425
Table shows the mean values calculated
for each Marketing Mix 7 P item. The
product, price, promotion and place has
higher means, respectively 4.3 , 4.5 , and
4 . 3 respectively. This indicates that the
respondents overall agree and highly
agree with the questionnaire statements
for the product, price, promotion and
place. The 7 P items promotion, process,
physical and people have calculated
mean of 3 . 8 , 3 . 9 , 3 . 8 , and 3 . 7 re
respectively. This indicates that the
respondents overall are neutral with the
questionnaire statements for the
respective 7P items.
Table 4
Model
Unstandardized
Coefficients
Standardized
Coefficients t Sig.
B Std. Error Beta
(Constant) 1.941 .376 5.167 .000
Marketing Mix 7Ps -.179 .096 -.124 -1.856 .065
Brand Orientation .695 .093 .493 7.471 .000
Consumer Behavior -.255 .062 -.196 -4.145 .000
a. Dependent Variable: Offline Shopping
For offline shopping, the Brand
Orientation has the highest significance
for Thai consumers with a beta value of
0.493 and sig. value of 0.000. This shows
that Thai consumers value and trust more
branded products when it comes to
offline shopping due to established
reputation as well as higher consumer
satisfaction relative to the purchased
good or service. The result shows the
importance of maintain a positive brand
reputation as this factor alone is the main
catalyst for Thai offline consumers. The
second factor of importance for the
offline shopping is consumer behavior
with a calculated beta value of 0.196 and
a sig. value of 0.000 showing high
significance. Consumer behavior is
significant because it facilitates
marketers in determining what factors
affect customers' purchasing choices.
They will fill in the void in the market
and recognize the goods that are required
and the items that are outdated through
learning how customers choose products.
The third factor of importance for offline
shopping identified in the regression
analysis is the Marketing Mix (7Ps), with
a beta value calculated at 0.124 and a sig.
value of 0.000 showing high significance
for the model.

UTCC International Journal of Business and Economics
UTTC IJBE | 63
To identify which Marketing Mix
component has the highest impact on
offline shopping, regression analysis was
performed for each Marketing Mix
component (Table 4.22) as following:
Table 5
Model Unstandardized Coefficients Standardized
Coefficients t Sig.
B Std. Error Beta
(Constant) .784 .228 3.437 .000
Product -.268 .028 -.274 -9.527 .000
Price 1.122 .079 1.502 14.221 .000
Promotion -.253 .030 -.274 -8.416 .000
Process .079 .015 .146 5.443 .000
Physical .816 .038 1.789 21.338 .000
Place -1.373 .098 -2.374 -13.990 .000
People .477 .060 .597 7.907 .000
a. Dependent Variable: Offline Shopping
The highest beta calculated value is for
the place, respectively 2.374 and a sig.
value of 0.000 showing high significance
for the model. This shows that the place
plays the most important role for the
offline consumers when deciding to
purchase a product or service. This
finding is important for shop owners in
order to understand the way the shop and
products are presented to the customer
can directly impact their sales. The
second Marketing Mix component of
importance for offline consumers is the
physical evidence with a calculated beta
value of 1.789 and a sig. value of 0.000
showing high significance for the model.
Offline business owners should pay
attention to the visible elements which
provided the atmosphere of friendliness
within the business. Various factors such
as interior features: wallpaper, ceilings,
space are important for offline business.
The air temperature, and personal
artifacts also physically influenced the
customer experience that can enable
potential sales. The third Marketing Mix
component of importance for offline
businesses is the price with a calculated
beta value of 1.502 and a sig. value of
0.000 showing high significance for the
model. It is important for an offline
business to apply different pricing
strategies up on their target groups, goals
and objectives including product stage in
order to maximize their sales. The fourth
Marketing Mix component of importance
for offline businesses is the people with a
calculated beta value of 0.597 and a sig.
value of 0.000 showing significance for
the model. Some actions such as greeting
customer with smiling face, the presence
of friendliness and politeness under
warm environment, and understanding
customers' problems, and giving the
interaction with them were considered
positive by customers can impact
customer intend and eventually can lead
to sales. The fifth important Marketing
Mix components for offline businesses
are the promotion and product, both
factors having a calculated beta value of
0.274 and a sig. value of 0.000 showing
significance for the model. The fact that
promotion and product are not the top
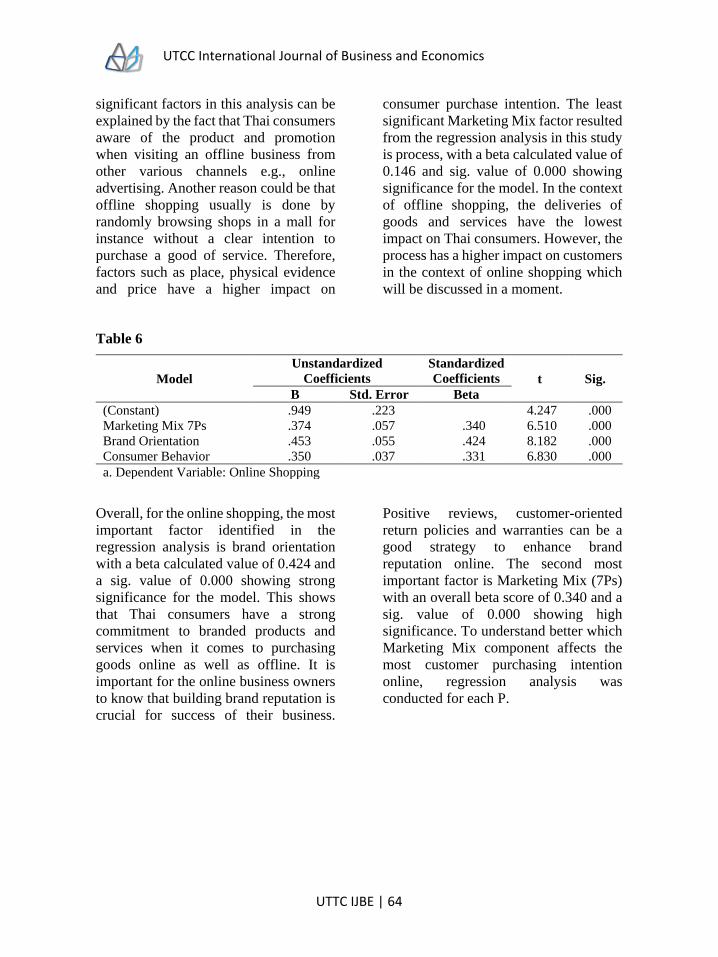
UTCC International Journal of Business and Economics
UTTC IJBE | 64
significant factors in this analysis can be
explained by the fact that Thai consumers
aware of the product and promotion
when visiting an offline business from
other various channels e.g., online
advertising. Another reason could be that
offline shopping usually is done by
randomly browsing shops in a mall for
instance without a clear intention to
purchase a good of service. Therefore,
factors such as place, physical evidence
and price have a higher impact on
consumer purchase intention. The least
significant Marketing Mix factor resulted
from the regression analysis in this study
is process, with a beta calculated value of
0.146 and sig. value of 0.000 showing
significance for the model. In the context
of offline shopping, the deliveries of
goods and services have the lowest
impact on Thai consumers. However, the
process has a higher impact on customers
in the context of online shopping which
will be discussed in a moment.
Table 6
Model
Unstandardized
Coefficients
Standardized
Coefficients t Sig.
B Std. Error Beta
(Constant) .949 .223 4.247 .000
Marketing Mix 7Ps .374 .057 .340 6.510 .000
Brand Orientation .453 .055 .424 8.182 .000
Consumer Behavior .350 .037 .331 6.830 .000
a. Dependent Variable: Online Shopping
Overall, for the online shopping, the most
important factor identified in the
regression analysis is brand orientation
with a beta calculated value of 0.424 and
a sig. value of 0.000 showing strong
significance for the model. This shows
that Thai consumers have a strong
commitment to branded products and
services when it comes to purchasing
goods online as well as offline. It is
important for the online business owners
to know that building brand reputation is
crucial for success of their business.
Positive reviews, customer-oriented
return policies and warranties can be a
good strategy to enhance brand
reputation online. The second most
important factor is Marketing Mix (7Ps)
with an overall beta score of 0.340 and a
sig. value of 0.000 showing high
significance. To understand better which
Marketing Mix component affects the
most customer purchasing intention
online, regression analysis was
conducted for each P.
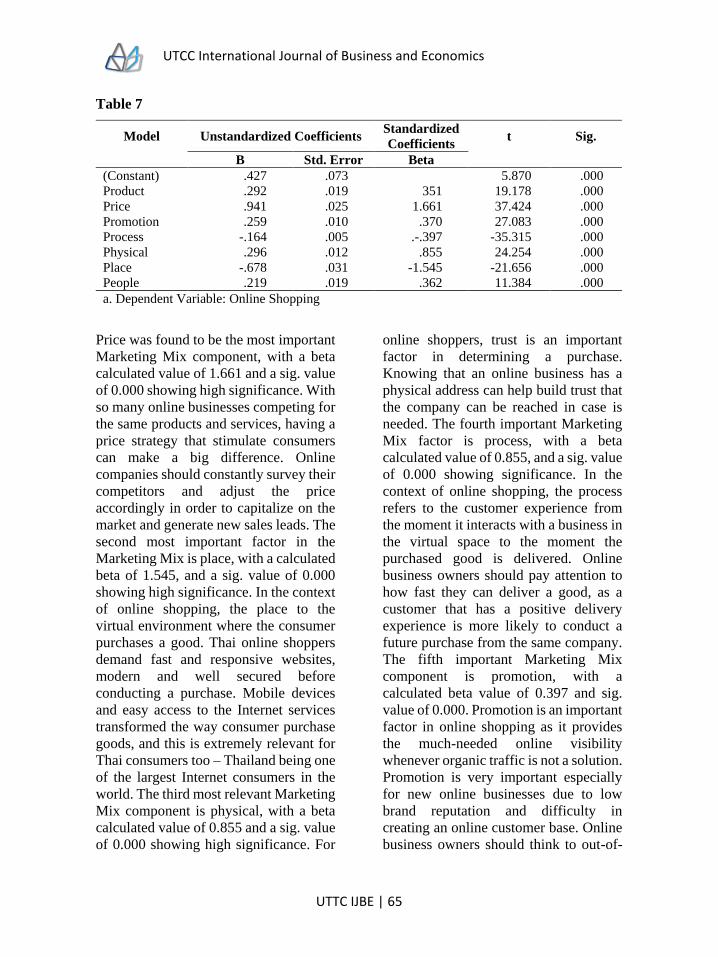
UTCC International Journal of Business and Economics
UTTC IJBE | 65
Table 7
Model Unstandardized Coefficients Standardized
Coefficients t Sig.
B Std. Error Beta
(Constant) .427 .073 5.870 .000
Product .292 .019 351 19.178 .000
Price .941 .025 1.661 37.424 .000
Promotion .259 .010 .370 27.083 .000
Process -.164 .005 .-.397 -35.315 .000
Physical .296 .012 .855 24.254 .000
Place -.678 .031 -1.545 -21.656 .000
People .219 .019 .362 11.384 .000
a. Dependent Variable: Online Shopping
Price was found to be the most important
Marketing Mix component, with a beta
calculated value of 1.661 and a sig. value
of 0.000 showing high significance. With
so many online businesses competing for
the same products and services, having a
price strategy that stimulate consumers
can make a big difference. Online
companies should constantly survey their
competitors and adjust the price
accordingly in order to capitalize on the
market and generate new sales leads. The
second most important factor in the
Marketing Mix is place, with a calculated
beta of 1.545, and a sig. value of 0.000
showing high significance. In the context
of online shopping, the place to the
virtual environment where the consumer
purchases a good. Thai online shoppers
demand fast and responsive websites,
modern and well secured before
conducting a purchase. Mobile devices
and easy access to the Internet services
transformed the way consumer purchase
goods, and this is extremely relevant for
Thai consumers too – Thailand being one
of the largest Internet consumers in the
world. The third most relevant Marketing
Mix component is physical, with a beta
calculated value of 0.855 and a sig. value
of 0.000 showing high significance. For
online shoppers, trust is an important
factor in determining a purchase.
Knowing that an online business has a
physical address can help build trust that
the company can be reached in case is
needed. The fourth important Marketing
Mix factor is process, with a beta
calculated value of 0.855, and a sig. value
of 0.000 showing significance. In the
context of online shopping, the process
refers to the customer experience from
the moment it interacts with a business in
the virtual space to the moment the
purchased good is delivered. Online
business owners should pay attention to
how fast they can deliver a good, as a
customer that has a positive delivery
experience is more likely to conduct a
future purchase from the same company.
The fifth important Marketing Mix
component is promotion, with a
calculated beta value of 0.397 and sig.
value of 0.000. Promotion is an important
factor in online shopping as it provides
the much-needed online visibility
whenever organic traffic is not a solution.
Promotion is very important especially
for new online businesses due to low
brand reputation and difficulty in
creating an online customer base. Online
business owners should think to out-of-
UTCC International Journal of Business and Economics
UTTC IJBE | 66
the-box creative ways of advertising
online in order stand-out among the
massive amount of online advertising
available. The sixth important factor
identified by regression analysis is
people, with a calculated beta value of
0.353 and a sig. value of 0.000. Even if
consumers today interact with virtual
interfaces rather than people, humans are
still an important component in the
Marketing Mix when it comes to online
shopping. Online businesses should
make sure they provide quick online
customer support whenever possible or
try to manage customer complains in the
most effective ways to avoid negative
reviews and improve customer
satisfaction and brand trust. The seventh
Marketing Mix factor is product, with a
calculated beta of 0.351, and sig. value of
0.000. The results shows that Thai
customer already have a purchase intend
in mind when they decide to visit an
online shopping platform to purchase a
good or service and their purchase do not
happen randomly in most cases. This
concludes the regression analysis for
Marketing Mix (7Ps).
The least influential factor in online
shopping is consumer behavior, with a
calculated beta of 0.196 and sig. of 0.000
showing that Thai consumers are aware
of the processes and risks associated with
online shopping. The online consumer
behavior is a highly dynamic process, in
constant change accordingly to the
technology and market trends.
In the following section, the multiple
regression for independent variables
Online Shopping and Offline Shopping,
and dependent variables Brand
Orientation, Marketing Mix (7Ps), and
Consumer Behavior was calculated using
the following multiple regression
equation:
Ŷ=b_0+b_1 X_1+b_2 X_2+...+b_p X_p
Where [equation image indication] is the
dependent variable's projected or
expected value, X1 through Xp are p
unique independent or predictor
variables, b0 is the value of Y when all of
the independent variables (X1 through
Xp) are zero, and b1 through bp are the
estimated regression coefficients.
Y = a + b1X + b2X + b3X
Offline Regression Equation
Y = 0.784 + 0.493X - 0.1962X - 0.124X
Online Regression Equation
Y = 0.427 + 0.424X + 0.331X + 0.34X
The following table presents to
summaries the hypotheses results.
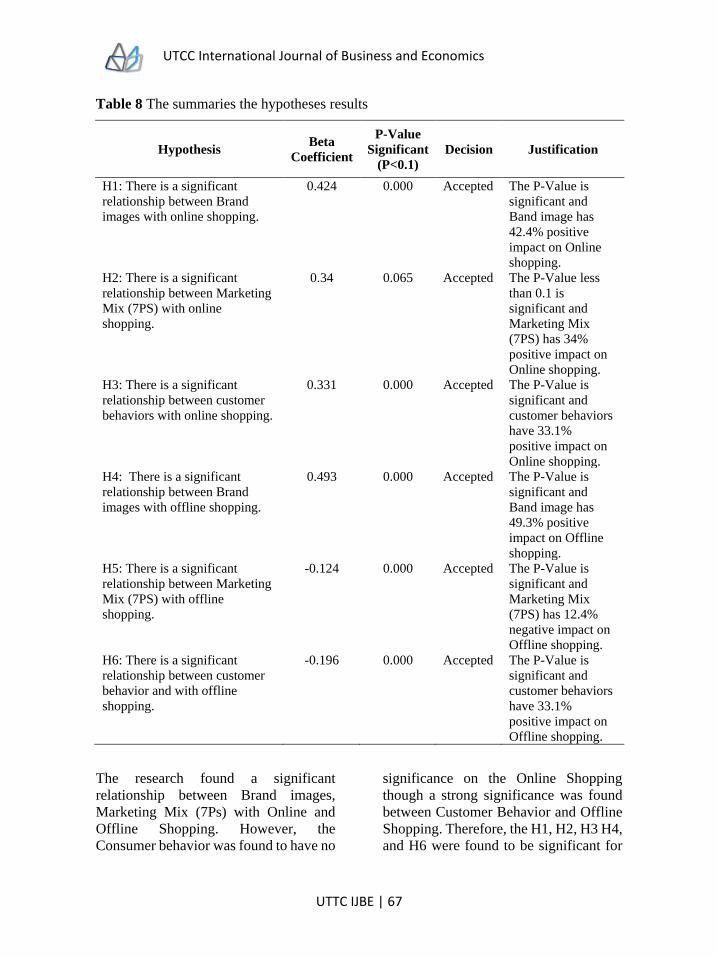
UTCC International Journal of Business and Economics
UTTC IJBE | 67
Table 8 The summaries the hypotheses results
Hypothesis Beta
Coefficient
P-Value
Significant
(P<0.1)
Decision Justification
H1: There is a significant
relationship between Brand
images with online shopping.
0.424 0.000 Accepted The P-Value is
significant and
Band image has
42.4% positive
impact on Online
shopping.
H2: There is a significant
relationship between Marketing
Mix (7PS) with online
shopping.
0.34 0.065 Accepted The P-Value less
than 0.1 is
significant and
Marketing Mix
(7PS) has 34%
positive impact on
Online shopping.
H3: There is a significant
relationship between customer
behaviors with online shopping.
0.331 0.000 Accepted The P-Value is
significant and
customer behaviors
have 33.1%
positive impact on
Online shopping.
H4: There is a significant
relationship between Brand
images with offline shopping.
0.493 0.000 Accepted The P-Value is
significant and
Band image has
49.3% positive
impact on Offline
shopping.
H5: There is a significant
relationship between Marketing
Mix (7PS) with offline
shopping.
-0.124 0.000 Accepted The P-Value is
significant and
Marketing Mix
(7PS) has 12.4%
negative impact on
Offline shopping.
H6: There is a significant
relationship between customer
behavior and with offline
shopping.
-0.196 0.000 Accepted The P-Value is
significant and
customer behaviors
have 33.1%
positive impact on
Offline shopping.
The research found a significant
relationship between Brand images,
Marketing Mix (7Ps) with Online and
Offline Shopping. However, the
Consumer behavior was found to have no
significance on the Online Shopping
though a strong significance was found
between Customer Behavior and Offline
Shopping. Therefore, the H1, H2, H3 H4,
and H6 were found to be significant for

UTCC International Journal of Business and Economics
UTTC IJBE | 68
the present research context. In
consequence, the H5 was invalidated as
low significance was found in the
analysis for the data collected in this
study.
Compare the results between online and
offline channels
The results shows that the online and
offline shopping are still both preferred
ways for purchasing goods in Thailand
though a low significance between
Marketing Mix (7Ps) and offline
shopping was found. As a result the H5
was found to not be significant. In the
context of the offline shopping, the study
found that customers visit a shop because
they are unsure if a product will fulfill
their requirements. When customers try
the goods, the offline retailer's job is to
retain them in the shop by leveraging
their decision-making behaviors,
particularly for individuals who plan to
explore and switch. Otherwise, if
customers already have complete
knowledge about the goods, or if the
probability of their purchasing the
product is exceptionally high from the
start, they may buy straight online. When
competing with online retailers, this
finding may be more critical for
department shops or shopping malls
since this approach is more appropriate
for products with high-value uncertainty
(McIntyre et al. 2016). Through the new
transaction paradigm, the emergence of
online commerce has provided customers
with more diverse options. This has
enabled diverse customers to adopt
various buying tactics, which impacts the
retail industry's competitive climate.
Customer heterogeneity is represented in
this study by the various purchasing
prices and the probability of the product
meeting consumer requirements. In
addition to price, these two variables will
affect customer behavior to varying
degrees, and various consumer behaviors
will alter the competitive situation and
store pricing and profit. The study
suggests that business design and
marketing tactics should vary in the two
buying contexts, depending on whether
the factor variations were the
consequence of most online customers'
and offline consumers' actions.
The most influential factors that impact
online and offline shopping behavior in
Bangkok is Brand Orientation has the
highest significance for consumers the
result shows the importance. It causes the
priorities can be developed with
descriptive related brand orientation.
This can be strategically used to identify
investment preferences, new areas to be
addressed, opportunities, strengths and
weaknesses, and competitive advantage
to focus.
Second influential factors that impact
offline shopping is Consumer behavior,
also Third influential factors that impact
for online shopping. Businesses can
determine the kind of culture and
environment their consumers expose
themselves to, which affects their
purchasing decisions. All these
psychological aspects help marketers
create marketing strategies and
campaigns that can leave a lasting
impression on the minds of consumers.
The third is Marketing strategy has to be
used if businesses want to succeed in
reaching to their customers faster than
their competitors can get. The 7Ps of
marketing mix help them do just that.
The highest significant is Place for
offline shopping and the second for
online shopping.

UTCC International Journal of Business and Economics
UTTC IJBE | 69
It is important that your product is made
available to your customers conveniently
and at all times. Place and the distribution
network are very important to keep
serving your customers.
The second significant is Physical for
offline shopping and the third for online
shopping. Attaching tangible clues to
services in order to communicate and
satisfy customers. Physical evidence is
important because of the intangible
nature of services. The customer has to
get some tangible clues in order for him
to buy your services. Cleanliness, dress
of staff, wall color, website experience,
packaging, brochure designs are some of
the many factors in determining the
customers decision towards buying. The
third significant is Price for offline
shopping and The highest significant for
online shopping. Companies base their
prices keeping in mind customer’s
perception of the brand and also
competitor’s pricing strategy. The fourth
is People for offline shopping, also The
sixth for online shopping. Services are
generally characterized by frequent
interaction of the creator and the
consumer. It’s the front-end employees
like showroom sales men or receptionists
who play the customer facing role even
before the service experience can begin
for your customer. Employee behavior
can actually make or break a brand name.
Therefore employing, training and
retaining the right set of people becomes
imperative for the success of business.
The fifth is Promotion at online and
offline shopping. Promotion very
important that the target customers know
about your product. Promotion either for
new customers or the existing customers
is a very important tool for campaign
managers. The sixth is Product
influential factors that impact offline
shopping, also The seventh online
shopping. Product it helps Business for
product development keeping in mind the
customer’s needs. As product managers
it is important to always keep ears open
to customer needs and eyes open to
innovation. The least significant is
Process for offline shopping, also The
fourth for online shopping. Businesses
have to keep in mind that the process of
service delivery is designed not for
provider’s convenience but keeping the
customer in mind.
Implications
The most influential factors that impact
online and offline shopping behavior in
Bangkok is Brand Orientation has the
highest significance for consumers the
result shows the importance. It causes the
priorities can be developed with
descriptive related brand orientation.
This can be strategically used to identify
investment preferences, new areas to be
addressed, opportunities, strengths and
weaknesses, and competitive advantage
to focus.
Second influential factors that impact
offline shopping is Consumer behavior,
also Third for online shopping.
Businesses can also determine the kind of
culture and environment their consumers
expose themselves to, which affects their
purchasing decisions. All these
psychological aspects help marketers
create marketing strategies and
campaigns that can leave a lasting
impression on the minds of consumers,
Understanding consumer decision-
making., Assessing a product's supply
and demand, Determining the sales
forecast by studying consumer behavior
UTCC International Journal of Business and Economics
UTTC IJBE | 70
and impact of advertisements on
consumer behavior.
The third is Marketing strategy has to be
used if businesses want to succeed in
reaching to their customers faster than
their competitors can get. And the 7Ps of
marketing mix help them do just that.
The highest significant is Place for
offline shopping and the second for
online shopping.
It is important that your product is made
available to your customers conveniently
and at all times. Place and the distribution
network are very important to keep
serving your customers.
The second significant is Physical for
offline shopping and the third for online
shopping.
Attaching tangible clues to services in
order to communicate and satisfy
customers.
Physical evidence is important because
of the intangible nature of services. The
customer has to get some tangible clues
in order for him to buy your services.
Cleanliness, dress of staff, wall color,
website experience, packaging, brochure
designs are some of the many factors in
determining the customers decision
towards buying that service.
The third significant is Price for offline
shopping and The highest significant for
online shopping. Companies base their
prices keeping in mind customer’s
perception of the brand and also
competitor’s pricing strategy.
The fourth is People for offline shopping,
also The sixth for online shopping.
Services are generally characterized by
frequent interaction of the creator and the
consumer. It’s the front-end employees
like showroom sales men or receptionists
who play the customer facing role even
before the service experience can begin
for your customer. Employee behavior
can actually make or break a brand name.
Therefore employing, training and
retaining the right set of people becomes
imperative for the success of a service
business.
The fifth is Promotion at online and
offline shopping. Promotion either for
new customers or the existing customers
is a very important tool for campaign
managers.
The sixth is Product influential factors
that impact offline shopping, also the
seventh online shopping. Product it helps
Business for product development
keeping in mind the customer’s needs. As
product managers it is important to
always keep ears open to customer needs
and eyes open to innovation.
The least significant is Process for offline
shopping, also the fourth for online
shopping.
Businesses have to keep in mind that the
process of service delivery is designed
not for provider’s convenience but
keeping the customer in mind.
Future research
recommendations
Future research might focus specifically
on a footwear brand that sales both online
and offline in order to get deeper insights
into Marketing Mix, Brand image and
Thai Customer Behavior. On the online
shopping behavior, a future research
might choose a specific shopping
platform or compare multiple shopping

UTCC International Journal of Business and Economics
UTTC IJBE | 71
websites to understand the customer
behavior in the context of the footwear
industry in Bangkok. Future research on
how the social media influencer and
Electronic Word of Mouth (eWOM)
impacts the brand perception and
customer behavior when looking to
purchase footwear articles might help
providing deeper insights into the
hypothesis tested in this study.
Nevertheless, targeting specific
demographic age groups such as Gen Y
and Gen Z Thai population might help
understanding the spending power and
trends for footwear industry in Bangkok,
Thailand. Nevertheless, the present
research found low significance between
Thai consumer behavior and offline
shopping therefore further research on
might be useful to identify any potential
shifts in the Thais attitude towards offline
channels in Thailand.
Limitations
The findings and conclusions presented
in the research are only valid within the
population selection and can not to be
generalized elsewhere due to the
differences in environmental factors and
individual opinions of the respondents.
To better understand the impact of
Marketing Mix, Brand image, and
Consumer Behavior on the Online and
Offline shopping in Bangkok would
require a wider research geographically
and quantitatively. Considering the
limited time and scope of this research,
many theories related to the social media
and consumer purchasing behavior were
covered briefly so as to provide a big
picture of the research context for the
readers.
References
Aaker, D. A. (1991). Managing brand equity: Capitalizing on the value of a brand name.
New York: Free Press.
Aghdaie, SFA, Honari, R (2014). Investigating the Role of Brand in Forming the
Consumer Involvement. International Review of Management and Business
Research, 3(1), 254-266.
Akroush, M. 2006. The Services Marketing Mix Paradigm: Is It Still Appropriate for
Today’s Service Businesses? AL-Balqa’ Journal for Research and Studies, 11(2),
June):49-74.
Ambler, T. (2000). Marketing and the bottom line. Harlow: Financial Times Prentice
Hall.
Barsky, J., World-class Customer Satisfaction, 1994.
Bitner, M. J. (2010). Servicescapes: The impact of physical surroundings on customers and
employees. The Journal of Marketing, 57-71.
Bodhani A., (2012). Shop offer the e-tail experience, Online IS Sn, 7(5), 46-49.
Bowie D.; Buttle F. (2004) Hospitality Marketing: An Introduction, 1st edition, Elsevier
Butterworth-Heinemann, UK.

UTCC International Journal of Business and Economics
UTTC IJBE | 72
Brassington, F., &Pettitt, S. (2003). Principles of marketing. Harlow: Financial Times
Prentice Hall.
Brynjolfsson, E., Yu, J. H. and Rahman, M. (2013). Competing in the age of omnichannel
retailing, Sloan Management Review, pp. 21–29.
Davis, F. D. (1989). Perceived usefulness, perceived ease of use, and user acceptance of
information technology. MIS Quarterly, 13, 319–340.
Dholakia, U. M., Kahn, B. E., Reeves, R., Rindfleisch, A., Stewart, D., & Taylor, E. (2010).
Consumer behavior in a multichannel, multimedia retailing environment. Journal
of Interactive Marketing, 24(2), 86-95.
Euromonitor International. (2017). Apparel and Footwear in Thailand. Retrieved from
https://www.euromonitor.com/apparel-and-footwear-specialist-retailers-in-
thailand/report
Euromonitor International. (2018). Apparel and Footwear in Thailand. Retrieved from
https://www.euromonitor.com/apparel-and-footwear-specialist-retailers-in-
thailand/report
Fianto, A. Y., Hadiwidjojo, D., Aisjah, S., & Solimun, S. (2014). The Influence of Brand
Image on Purchase Behaviour Through Brand Trust. Business Management and
Strategy, 5(2), 58. doi:10.5296/bms.v5i2.6003
Fowler, F. J. (2009). Survey Research Methods (4th ed.)..
Garretson, J. (1998). The Impact of Coupons on Service Quality Evaluations, Risk, and
Purchase Intentions. Journal of Restaurant & Foodservice Marketing, 2(4), 3-19.
doi:10.1300/j061v02n04_02
Hanjin-Soo. (2010). The Influence of Customer Value on Customer Satisfaction and Post-
purchase Behavioral Intention in Hotel Service. Journal of Korea Service
Management Society, 11(5), 199-216. doi:10.15706/jksms.2010.11.5.009
Henrieta. C. & Aleksander. K. & Dagmar. B., Impact of Brand Name. Proceedings of
Economics and Finance Business Economics Management (BEM), 34(2015).
Hisolp. M., An Overview of Branding and Brand name Measurement of On Line
Marketers, Dynamic Logic Branding, 101(2001), 1-22.
Holt. B., Brands and Branding Cultural Strategy Group, (2015).
Ivy, J. and Naude, P. (2004) Succeeding in the MBA marketplace: identifying the
underlying factors, Journal of Higher Education Policy & Management, 26(3),
401-417.
Jobber, D. (2004). Principles and practice of marketing. London: McGraw-Hill Education.
Keller, K. L., & Lehmann, D. R. (2006). Brands and Branding: Research Findings and
Future Priorities. Marketing Science, 25(6), 740-759.
doi:10.1287/mksc.1050.0153.

UTCC International Journal of Business and Economics
UTTC IJBE | 73
Kotler, P. (2003). A framework for marketing management. Harlow: Pearson Prentice
Hall.
Kotler, P., & Armstrong, G. (2008). Principles of marketing. Upper Saddle River, NJ:
Pearson/Prentice Hall.
Lehtinen, J. (2011). Quality Oriented Services Marketing 2. Department of Business
Economics and Business Law, Tampere University, Tampere.
Lihra, T. & Graf, R. (2007) "Multi‐channel communication and consumer choice in the
household furniture buying process", Direct Marketing: An International
Journal, Vol. 1 Issue: 3, pp.146-160, https://doi.org/10.1108/
17505930710779324.
Lim, K. a., “Consumer brand classifications; An assessment of culture-of-origin versus
country of origin”, Journal of Product and Brand Management, vol. 10, no.2,
pp. 120-136, 2001.
MaCarthy. F., Quality Effect in Consumer Behavior. The Pakistan Development Review,
Voi. XX, No.2 (1981).
Mahmood R. & Khan S.M. (2014) Impact of Service Marketing Mixes on Customer
perception: A study on Eastern Bank Limited, Bangladesh, European Journal of
Business and Management, 6 (34) pp164-167.
McCarthy, J. (2011). Basic Marketing: A Managerial Approach (2nd ed.). Richard D.
IRWIN, INC.
McGoldrick, P.a., “Consumer Misbehavior”, Journal of Retailing and Consumer
Services, vol. 4, no. 2, pp. 73-81, 1997.
Mcintyre, C., Melewar, T. C., & Dennis, C. (2016). Multi-channel marketing, branding
and retail design: New challenges and opportunities. Bingley, UK: Emerald
Group Publishing Limited.
Melero, I., Sese, F. J. &Verhoef, P. C. (2016). Recasting the Customer Experience in
Today’s Omni-channel Environment. Universia Business Review | Second
Quarter 2016 | ISSN: 1698-5117.
Miyuri Shirai, The Impact of Quality on Consumer Behavioral Intentions, Journal of
Promotion Management, 21(6) (2015).
N. Mogey, (March 25, 1999). "So You Want to Use a Likert Scale?". Learning Technology
Dissemination Initiative. Heriot-Watt University. Retrieved April 30, 2009.
Mohan, M., Brown, P. B. & Cantrell C. (2017). “Brand skill: Linking brand functionality
with consumer-based brand equity”. Journal of Product & Brand Management,
Virginia Commonwealth University School of Business.
Nagle, T., & Holden, R. (2012). The Strategy and Tactics of Pricing. Englewood Cliffs,
NJ: Prentice-Hall.

UTCC International Journal of Business and Economics
UTTC IJBE | 74
Palmer, A. (2011). Principles of Services Marketing (3rd ed.). UK: McGraw-Hill
Publishing Company.
Petty, R. D. (2016). "A History of Brand Identity Protection and Brand Marketing," in The
Routledge Companion to Marketing History,D.G. Brian Jones & Mark
Tadajewski (eds), Oxon, Routledge.
Roselius, T., ‘’Consumer rankings of risk deduction methods’’, Journal of Marketing,
vol. 35, pp. 56-61, Jan, 1971.
Schiffman, LG. &Kanuk, LL. (2004). Consumer behavior, 8th International edition.
Prentice Hall.
Shepherd, R. & Dennison, C. M. (1996). Influences on adolescent food choice. Proc. Nutr.
Soc.
Shermach, K., ‘’What consumers wish brand managers knew’’, Marketing News, vol. 31,
no. 12, 9th June, 1997.
Soriano R. D. (2002). "Customers' expectations factors in restaurants: The situation in
Spain", International Journal of Quality & Reliability Management, Vol. 19
Issue: 8/9, pp.1055-1067.
Winkielman P., Shwarz. N. & Fazenderio.T., Affective and Cognitive Concequences of
Visual Fluency: When Seeing is Easy on the Mind in, Visual Pre. Ed. Ann-
Arobor. Michigan, USA, (2000).
Wollan, R., Jain, N. &Heald, M. (2013). Selling Through Someone Else: How to Use Sales
Networks and Partners to Sell More, John Wiley & Sons, Somerset, NJ, USA.
Yang, Z., & Peterson, R. T. (2004). Customer perceived value, satisfaction, and loyalty:
The role of switching costs. Psychology and Marketing, 21(10), 799-822.
doi:10.1002/mar.20030
Yusuf, A., Nurmalina, R. & Syuaib, M. F. (2015). The Impacts of Marketing Mix on
Customer Satisfaction and Loyalty in Honey Product. International Journal of
Science and Research (IJSR), 6(7), 1778-1783. doi:10.21275/art20175276
Zeithamal, V. & Bitner, M.J. (2000). Services Marketing: Integrating Customer Focus
Across the Firm. ISBN-10: 0078112109
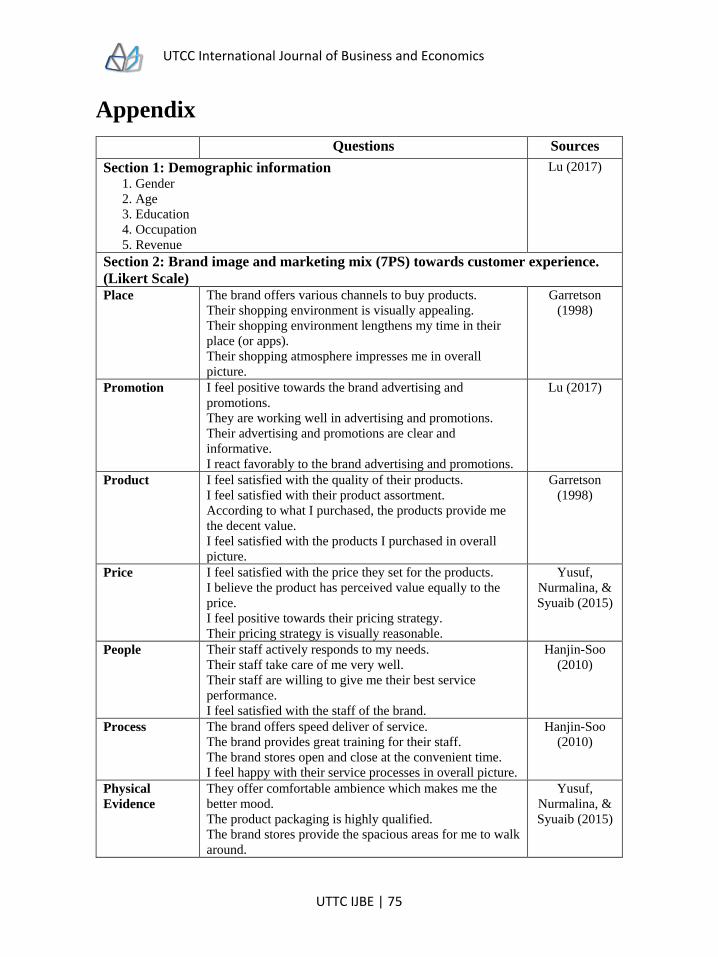
UTCC International Journal of Business and Economics
UTTC IJBE | 75
Appendix
Questions Sources
Section 1: Demographic information 1. Gender
2. Age
3. Education
4. Occupation
5. Revenue
Lu (2017)
Section 2: Brand image and marketing mix (7PS) towards customer experience.
(Likert Scale) Place The brand offers various channels to buy products.
Their shopping environment is visually appealing.
Their shopping environment lengthens my time in their
place (or apps).
Their shopping atmosphere impresses me in overall
picture.
Garretson
(1998)
Promotion I feel positive towards the brand advertising and
promotions.
They are working well in advertising and promotions.
Their advertising and promotions are clear and
informative.
I react favorably to the brand advertising and promotions.
Lu (2017)
Product I feel satisfied with the quality of their products.
I feel satisfied with their product assortment.
According to what I purchased, the products provide me
the decent value.
I feel satisfied with the products I purchased in overall
picture.
Garretson
(1998)
Price I feel satisfied with the price they set for the products.
I believe the product has perceived value equally to the
price.
I feel positive towards their pricing strategy.
Their pricing strategy is visually reasonable.
Yusuf,
Nurmalina, &
Syuaib (2015)
People Their staff actively responds to my needs.
Their staff take care of me very well.
Their staff are willing to give me their best service
performance.
I feel satisfied with the staff of the brand.
Hanjin-Soo
(2010)
Process The brand offers speed deliver of service.
The brand provides great training for their staff.
The brand stores open and close at the convenient time.
I feel happy with their service processes in overall picture.
Hanjin-Soo
(2010)
Physical
Evidence
They offer comfortable ambience which makes me the
better mood.
The product packaging is highly qualified.
The brand stores provide the spacious areas for me to walk
around.
Yusuf,
Nurmalina, &
Syuaib (2015)
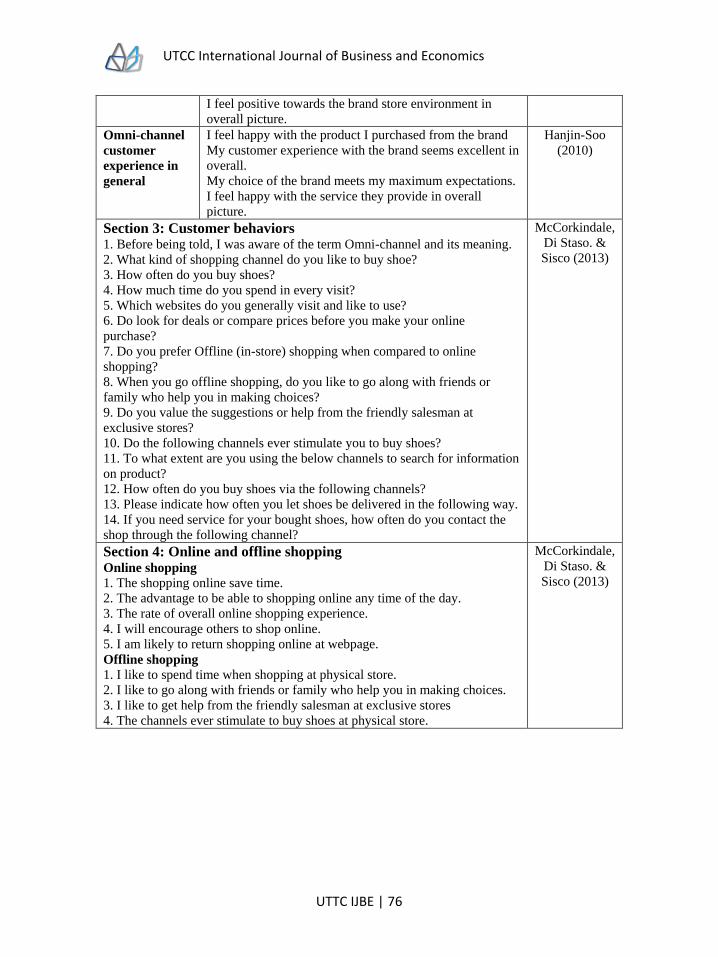
UTCC International Journal of Business and Economics
UTTC IJBE | 76
I feel positive towards the brand store environment in
overall picture.
Omni-channel
customer
experience in
general
I feel happy with the product I purchased from the brand
My customer experience with the brand seems excellent in
overall.
My choice of the brand meets my maximum expectations.
I feel happy with the service they provide in overall
picture.
Hanjin-Soo
(2010)
Section 3: Customer behaviors 1. Before being told, I was aware of the term Omni-channel and its meaning.
2. What kind of shopping channel do you like to buy shoe?
3. How often do you buy shoes?
4. How much time do you spend in every visit?
5. Which websites do you generally visit and like to use?
6. Do look for deals or compare prices before you make your online
purchase?
7. Do you prefer Offline (in-store) shopping when compared to online
shopping?
8. When you go offline shopping, do you like to go along with friends or
family who help you in making choices?
9. Do you value the suggestions or help from the friendly salesman at
exclusive stores?
10. Do the following channels ever stimulate you to buy shoes?
11. To what extent are you using the below channels to search for information
on product?
12. How often do you buy shoes via the following channels?
13. Please indicate how often you let shoes be delivered in the following way.
14. If you need service for your bought shoes, how often do you contact the
shop through the following channel?
McCorkindale,
Di Staso. &
Sisco (2013)
Section 4: Online and offline shopping Online shopping
1. The shopping online save time.
2. The advantage to be able to shopping online any time of the day.
3. The rate of overall online shopping experience.
4. I will encourage others to shop online.
5. I am likely to return shopping online at webpage.
Offline shopping
1. I like to spend time when shopping at physical store.
2. I like to go along with friends or family who help you in making choices.
3. I like to get help from the friendly salesman at exclusive stores
4. The channels ever stimulate to buy shoes at physical store.
McCorkindale,
Di Staso. &
Sisco (2013)
UTCC International Journal of Business and Economics
UTTC IJBE | 77
UTCC International Journal of Business and Economics (UTCC IJBE)
Volume 13 Number 2, August 2021
THE DEVELOPMENT OF CUSTOMER JOURNEY ON
PATIENT SERVICE DESIGN: A CASE STUDY IN
HEALTHCARE BUSINESS IN THAILAND
Tarittawan Chareanporn1, Chanin Yoopetch2,
Chatrudee Jongsureyapart3, Piyanart Junkrachang4
and Ekawee Vinitkhatkumnuen5 1Hospitality Industry Management Program, School of Management 2Corporate Finance Program, College of Management, Mahidol University 3Accounting Program, School of Management 4,5Hospitality Industry Management Program, School of Management 1,3,4,5Mae Fah Luang University, 333 Moo1, Thasud, Muang, Chiang Rai 57100,
Thailand 269 Vibhavadi Rangsit Rd., Samsennai, Phayathai, Bangkok 10400 Thailand [email protected], [email protected], [email protected], [email protected], [email protected]
Abstract
The purpose of this study is to explore the patient service touchpoints in the healthcare
business. This study adopted a qualitative approach for the research process. The patient
service touchpoints are perceived as the influencing stage of patient satisfaction during
the patient journey. The documentation research, semi-structured interview, and
participant observation were conducted to collect data prior to the content analysis. The
study was conducted with thirty informants from healthcare professional groups in
Thailand. They were doctors, nurses, and supported staff sharing their insights for the
current study. This study focuses only on the patient journey of Out-Patient-Department
(OPD). The results of the interviews indicated three main periods of the patient journey.
There were pre-medical service period, in-medical service period, and post-medical
service period. In addition, from the result of the interviews, it also indicated ten critical
patients’ service touchpoints under three main periods of the patient journey; four
touchpoints found in the pre-medical service period, three touchpoints found in the in-
medical service period, and three touchpoints found in post-medical service period. The
discussions, conclusions and implications were also provided.
Keywords: service design, service touchpoints, patient journey, healthcare business
UTCC International Journal of Business and Economics
UTTC IJBE | 78
Research background
Thailand is now in a transition to totally
become an aging society. The
organization is stated that any countries
with more than ten percent of citizens
who are sixty years old and above from
the total number of citizens are
considered to be turning into an aging
society (The Siam Commercial Bank
Public Company Limited, 2021). In
addition, the country ultimately becomes
an aging society when the ratio of
citizens who are sixty years old and
above has risen to twenty percent. In the
near future, the percentage of citizens
who are sixty years old and above will
exceed twenty percent of the overall
citizens. The potential situation results
from the technology and medical
development that allows longer lives to
citizens while the birth rate falls
gradually (Ketsara, 2019). Therefore, the
healthcare and wellness industry should
be prepared for an aging society,
especially in Thailand.
The Thai government would continue to
support the healthcare industry under a
strategic plan to develop Thailand into a
global medical and wellness center hub
by 2 0 2 6 ( Krungsri Research, 2 0 2 1 ) .
Nevertheless, since 2003, successive
Thai governments have pursued the goal
of establishing Thailand as the regional
medical hub. Then, this has been a major
driver of the growth of the private
healthcare sector and the development of
the medical tourism industry. There have
been the increasing development in large
private sector hospitals, specialist
hospitals, and medical centers, specialist
diagnosis and treatment clinics, and care
centers or care homes for the unwell and
the elderly. These businesses continue to
grow at a healthy rate since the service
providers are prepared to deliver high-
quality care to the patients (Krungsri
Research, 2 0 2 1 ) . In addition, to secure
long-term growth and increase the
market share, many hospitals have been
investing more to expand their premises
and commercial network. There were
developing existing premises, building
new hospitals and clinics in regional
centers, tourist destinations, and border
regions to meet demand from
neighboring countries, or even buying
shares in other profitable hospital groups.
Furthermore, several hospitals have
formed partnerships with other
healthcare service providers both
domestically and abroad to expand their
network to receive or refer patients or
develop new specialist market segments.
Besides, many companies are also
generating additional income by
developing new product lines such as
pharmaceuticals and medical supplies,
food supplements, cosmetics, and
establishing beauty clinics and care
homes for the elderly (Krungsri
Research, 2 0 2 1 ) . Therefore, the rising
interest in personal health and wellbeing
is also a key driver of healthcare business
growth.
However, service quality is also
considered one of the most important
factors in patient expectations.
According to Rungroje (2019), service
quality in healthcare is defined by
customer perception. Healthcare
businesses, both public and private
sector, try to develop service quality and
perception of the organization. Most of
them would like to gain more
competitive advantage from competitors
and more patients satisfaction. This study
was adopted the service design concept
UTCC International Journal of Business and Economics
UTTC IJBE | 79
into the patient satisfaction development
in healthcare businesses. Service design
is defined as the design that primarily
considers all stakeholders' experience,
not limited to service receivers and
service providers. Service design is also
taking stakeholders, relating along the
whole service process into account. It is
believed that a collaboration of
stakeholders at every step will generate
an effective service design (Lin, M., Li,
F. Y., & Ji, Z., 2020; Lu, P., Liao, H. T.,
& Lei, J., 2020)
In addition, service design requires
multidisciplinary concepts; hence, the
definition of service design will not be
explained by a single discipline
( Stickdorn, Hormess, Lawrence &
Schneider, 2018; Buchanan, 2001) . The
foundation of service design processes is
developed from human-center design
concept aiming to solve users’ problems
by utilizing research and design
competency. Service design has been
continuously developing, attempting to
serve the best experience to all
individuals within the processes, apart
from consumers (Skooldio, 2021). There
are various tools available for service
design. Service design experts advise that
it is not necessary to strictly follow tools
usage guidelines since it will contrast
with service design principles that
promote variety of problem-solving and
improving methods. Service designers
are flexible in applyi ng any tools to a
project’ s purposes ( Geke Van Dijk, Bas
Raijmakers, & Luke Kelly, 2014; Lin, et
al., 2020) . Service design tools are
customer journey maps, stakeholder
mapping, personas, service blueprint,
service safari, shadowing, contextual
interview, mobile ethnography,
expectation maps, idea generation,
design scenarios, storyboards, Agile
development, service roleplay, customer
lifecycle maps, and business model
canvas ( Geke, et al., 2014) . Customer
journey maps are popular tools for
service design. Furthermore, customer
journey maps demonstrate consumer
decision-making processes, including
prior being the customer and becoming a
customer, which the result will be
brought to create or develop service
design concepts ( Geke, et al., 2014; Lin,
et al., 2020).
Consequently, this paper aimed to
explore the patients' service touchpoints
in the healthcare business. As the
patients' service touchpoints are
perceived as the influencing stage of
patient satisfaction, this study was
adopted customer journey maps as a
service design tool to explore the
patients' service touchpoints in the
healthcare business in Thailand.
Research objectives
This research aims to explore the
patients' service touchpoints in the
healthcare business in Thailand. This
study adopted a qualitative approach for
the research process. The patients’
service touchpoints are perceived as the
influencing stage of patient satisfaction
during the patient journey. The
documentation research, semi-structured
interview, and participant observation
were conducted to collect data prior to
the content analysis. The study was
conducted with 30 key informants from
healthcare professional groups in
Thailand. They were doctors, nurses, and
supported staff. This study focuses only
on the patient journey of Out-Patient-
Department (OPD).

UTCC International Journal of Business and Economics
UTTC IJBE | 80
Research questions
To achieve the objectives of this
research, the following research question
was developed to address this research
study of the healthcare business in
Thailand; “What are the patients’ service
touchpoints that perceive as the
influencing stage of patient satisfaction
on the customer journey map?”
Literature review
Healthcare businesses in
Thailand
According to an announcement of
information on the number of health
agencies from the policy and strategy
division (Office of the permanent
secretary ministry of public health,
2017), Thailand offers more than 38,512
properties in healthcare services,
including thirty-five percent of state-
funded public health centers, district
public health offices, and community or
general hospitals. At the same time, the
remaining 65 percent were private
businesses and ventures such as private
clinics and hospitals. Under the size and
range of medical services offered, 98.3
percent were classified as primary
healthcare providers while others were
secondary and tertiary healthcare
providers. Although state hospitals serve
the patient in Thailand, their capacity and
service delivery to serve patients are
limited in some contexts. This weakness
of government healthcare providers
would lead an opportunity for private
healthcare providers to improve,
typically emphasizing the speed and
convenience of services and supporting
middle-class customers who have
sufficient spending power to turn to
private hospitals despite charging more
than government hospitals for equivalent
services (Krungsri Research, 2 0 2 1 ) . In
addition, tax exemption and other
government-supporting policies are core
motivation factors of private hospital
investment.
Furthermore, business expansion has
been driven by rising demand from
patients in neighboring countries, while
health and wellness tourists have also
been rising steadily. All factors have
stimulated the investment of healthcare
investors in a variety of platforms of
business, such as some large and
dynamic operators have engaged in
mergers and acquisitions. In addition,
some companies opened new hospitals in
critical regional centers of Thailand, and
bought into other private hospitals as
investment and to extend their
commercial networks. Moreover, the
transformed businesses have increased
their competitiveness and help them to
target more niche markets also (Krungsri
Research, 2 0 2 1 ; The Siam Commercial
Bank Public Company Limited, 2 0 2 1) .
In addition, the Thai government also
supports the industry included in
promoting Thailand as an international
healthcare hub; this main strategy is
aligned with rising interest worldwide in
medical tourism and helps to attract more
foreign patients. From now to 2024, the
Tourism Authority of Thailand (TAT)
will promote the country as the medical
and wellness resort of the world. This
campaign will raise the interest in
personal health and wellbeing, also
prompting hospitals to venture into the
wellness industry. Furthermore, the
policy of designating Thailand’s medical
industry and medical hub status is
regarded as a new S-curve industry. The
UTCC International Journal of Business and Economics
UTTC IJBE | 81
government has offered a range of
incentives, such as a tax exemption to
attract overseas investors. It included
setting up facilities for the research and
development of medical innovation and
pharmaceutical products and services.
This supported policy helps private
hospitals cut operation costs while
increasing competitiveness (Krungsri
Research, 2021).
Service design concept
According to Stickdorn, Hormess,
Lawrence, and Schneider (2018) explains
that the term “service design” is defined
as the design that primarily considers all
stakeholders' experience, which is not
limited to service receivers and service
providers. Service design is also taking
stakeholders relating along the whole
service process into account. It is
believed that a collaboration of
stakeholders at every step will generate
an effective service design. Collaboration
can bring pleasure to all, for example,
producers, suppliers, distributors, and
local people. In addition, service design
is interdisciplinary which combining
different methods and tools. This new
method or concept differs from the
former, focusing on only one method or
tool from a particular discipline. Service
design is progressively developed;
therefore, a common definition or clear
explanation has not been available. To
provide a single definition will limit the
evolution and development of service
design concepts and ideas that are
gradually growing throughout time
( Stickdorn, et al., 2018) . Buchanan, R. ,
(2001) agreed that to settle service design
definition into a specific field is obsolete
and unacceptable since it does not
conform to multidisciplinary concepts of
service design. Therefore, service design
requires multidisciplinary concepts;
hence, the definition of service design
will not be explained by a single
discipline and the development of service
design is related to several fields for
different purposes ( Buchanan, R. , 2001:
Lin, et al., 2020; Stickdorn, et al., 2018).
As Thailand Creative and Design Center
explained (TCDC, 2015), service is
appended to a direction of organization
development regarding organizational
context. Development of service design
has begun with the need to respond and
to satisfy customer’s desires. It includes,
first, ‘ Service Marketing’ , which it
focuses on marketing for service
businesses. Then, ‘Service Engineering’
attempts to provide engineering
construction to customers. In addition,
‘ Service Management’ mainly aims at
organization management. Next,
‘ Service Science’ is innovation
development to establish a new service
form, increasing potential competition.
Finally, ‘ Service Design’ is a
combination of service design for an
organization developing direction which
it concerns to all stakeholders, i. e. , staff
or service providers, customers or service
receivers, and other individuals or units
relating to service processes ( TCDC,
2014) . From all definitions mentioned,
whether it is academic approach or
agency approach, it concludes that
service design is an integration of
interdisciplinary aiming to solve the
problems, to develop, to improve, and to
create innovation by adding service value
to the user as well as concerning to all
people throughout the processes. The
users also desire this service while it
contributes efficiency and effectiveness
to either firm or service designer.
UTCC International Journal of Business and Economics
UTTC IJBE | 82
Service design processes
The basis of service design processes
rises from human-centered design
concept aiming to solve users’ problems
by utilizing research and design
competency. The service design
procedures are similar to design thinking
( Skooldio, 2021) . Service design has
been continuously developing,
attempting to serve the best experience to
all individuals within the processes, apart
from consumers. Thinking steps consist
of the followings. Firstly, it is about
understanding users, consumers, and
related stakeholders ( Empathize).
Secondly, problem must be clearly
defined and identify what should be done
to solve the problem ( Define) . Thirdly,
there is brainstorming to discover the
methods to solve an existing problem
( Ideate) . Fourthly, it tests the prototype
of problem- solving methods founded in
the previous stage ( Prototype) , such as
solving plan, simulation situation, model
prototype, service standard blueprint.
Finally, it is accurate situation testing and
evaluating whether the prototype is
effective and can solve an existing
problem in a real situation. It will be
developed to be more potential
( Skooldio, 2021) . Because there is no
general definition of service design,
Stickdorn and Schneider (2014) provided
five essential principles. First, user-
centered service design should transfer
experience regarding consumer
perception. It should not be present only
from the perspective of the service
provider or designer. The second is co-
creation. A co- creation of stakeholders
through the entire process enables
various viewpoints reflection for solving
the problems. Third, sequencing, well
design service will reveal the causes and
effects of the performance to
stakeholders at every step sequentially;
therefore, everyone will realize the
relationship of causes and effects of
service design in the same direction.
Fourth, evidence, the service designer
must present an intangible service
through the tangible physical product to
create a touchable feeling even though it
is untouchable. The last principle is a
holistic viewpoint. Service designer has
been suggested not to consider only one
part of a specific service process but
rather to concern the whole environment
relating to service design aiming to the
highest effectiveness (Stickdorn, M. S. ,
& Schneider, J. 2014).
Even though service design has
employed a design thinking concept for
the designation, service design processes
have been adapted for the
appropriateness of the designing
processes. TCDC ( 2014) explains that
service design processes involve three
steps; they are 1) Exploration, 2)
Creation, and 3) Reflection and
Implementation. TCDC ( 2014) further
explores the step of surveying and
collecting insightful data by applying
ethnography research to identify the
needs of users, consumers, and
stakeholders in each process. Surveying
and collecting data reveal gaps or
opportunities for a suitable service design
to a unique event or context. This agreed
with the definition provided by Dusit
Thani College (2020) that exploration is
collecting data through observation
where the data will be analyzed to
identify the problems affecting
consumer’ s behavior in service
processes. Collecting data brings crucial
information to establish service design.
The next step is the creation of a service
concept which is the result of surveying
UTCC International Journal of Business and Economics
UTTC IJBE | 83
and collecting data. It promotes co-
creation among different service
providers who are called to join in service
design processes to add value to product
and service ( TCDC, 2014) . Similarly,
Dusit Thani College ( 2020) states that
creating a service design concept is the
outcome gained from survey and data
collection. This stage focuses on
designing a unique product or improving
brand personality a n d designing a
consumer experience that connects
touchpoints between service providers
and receivers throughout the journey:
pre- , during, and post- service. The last
process is implementation. The outcomes
of the previous step will be brought to
create a prototype and to study
feasibility. Various kinds of prototypes
can be created, such as diagrams, service
models, simulation situations. The
prototype will be tested for the
effectiveness of each concept. After the
test, the opinions of all stakeholders are
welcomed for improvement. The test will
be done repeatedly so that the most
suitable concept meets the service design
purpose as well as the requirement
identified at the beginning.
Consequently, a selected concept will be
used, serving convenience and
satisfaction to stakeholders entirely
(Dusit Thani College, 2020)
TCDC (2015) describes that firm can be
accomplished service design through
different methods depending on the
project type, purposes, and service
designers of the firm. The designers can
initiate working processes based on
creative thinking principles and thinking
categories. Divergent thinking refers to
thinking about the new matter or
examining The feasibility of existing
approaches that might be used differenty.
Convergent thinking is analyzing
thinking for selection and decision
process where all ideas will be
accumulated to solve the problem
directly or be summarized
unambiguously. Notably, knowledge,
expertise, reason, and logic are drawn to
make the best decision. Service designers
are suggested to add flexibility and
variety to service design processes
depending on context characters,
duration, and existing resources. The
feasibility of creative thinking processes
variety accounts as one of the creative
thinking processes. Thinking processes
employed by TCDC have been
developed from Double Diamond Model,
which The British Design Council first
initiated in 2005 (cited in TCDC, 2015).
The model aims to explain attitudes and
work processes that combine creative
thinking and design process. Double
Diamond Model is a mixture of four
procedures which are 1) discover;
gathering rich and adequate data for
design processes, 2) define; analyzing
and summarizing important issues, 3)
develop; brainstorming all stakeholders
to produce feasible concepts for solving,
developing, and improving the problems
as well as for meeting service design
requirements, and 4) deliver; combining
various ideas to create the best service
design for the market (TCDC, 2015).
Moreover, Double Diamond Model
focuses on three diamond shape
alignment assisting the efficiency and
effectiveness of service design. The first
connector is initiate, referring to an
establishment of the project’ s vision
strategy. Service designers discuss with
all shareholders to analyze trends,
competitors, advantages of the firm, and
other related issues to set goals and roles
of the service design project to the firm
or target group. The second connector is
UTCC International Journal of Business and Economics
UTTC IJBE | 84
brief, describing a summary of all data
gathered from two steps within the first
diamond. It clarifies usage needs of
project and service design developing
direction such as problem, goal, plan, and
duration for designing. The last is launch
referring to the last connector after the
second diamond in the model, including
commercial benefit as well. This process
also means examining and improving
possible defects that might occur during
usage of the service, targeting the highest
efficiency and effectiveness ( TCDC,
2015).
Service design tools
There are various tools available for
service design. Service design experts
advise combining different tools
appropriate to design context and
purposes, and the outcomes will be
different in each project. It is not
necessary to strictly follow tools usage
guidelines since it will contrast with
service design principles that promote a
variety of problem-solving and
improving methods. Service designers
are flexible in applyi n g any tools to a
project’ s purposes ( Geke, et al., 2014) .
Service design tools are stakeholder
mapping, personas, customer journey
maps, service blueprint, service safari,
shadowing, contextual interview, mobile
ethnography, expectation maps, idea
generation, design scenarios,
storyboards, Agile development, service
roleplay, customer lifecycle maps, and
business model canvas ( TCDC, 2015;
Geke, et al., 2014).
Even if there are various tools mentioned
above, this section illustrates preferable
tools. To begin with stakeholder
mapping, this is to demonstrate the whole
picture of stakeholders throughout
service design processes. It will show the
relationship of each unit and direct and
indirect impacts to identify the degree of
involvement of each stakeholder (TCDC,
2015; Geke, et al., 2014) . Another is
personas. This tool assists more
understanding to target users which the
personas will represent actual users
holding unique personalities, i. e. ,
behaviors, habits, interests, expectations,
and problems. Service designers will
gain different characters from the
personas for creating service system
concepts that directly reference the
behavior and needs of different target
users ( TCDC, 2015; Geke, et al., 2014) .
In addition, customer journey maps are
favorable. This offers the better
understanding to consumer’ s behavior,
viewpoints, and feeling that experiencing
through touchpoint among service
providers, service receivers, and an entire
stakeholder. Customer journey maps
demonstrate consumer decision-making
processes, including prior being the
customer and becoming a customer,
which the result will be brought to create
or to develop service design concepts
( TCDC, 2015; Geke, et al., 2014) . The
last is the service blueprint. Service
blueprint gains much preferable by
service designers as it illustrates a
holistic picture of the working system
with specific details of each service unit,
including front of the house, and back of
the house, such as information
technology system and human resource
management system. Customer journey
maps show reflections in a holistic
picture at every service period since the
details of pre-service, during service, and
post-service are required ( TCDC, 2015;
Geke, et al., 2014).

UTCC International Journal of Business and Economics
UTTC IJBE | 85
Research methodology
and data collection
scope
This study was considered qualitative
research that used an in-depth interview
technique. The data collection of
research began with semi-structured
interviews. In this step, a qualitative
approach was used to obtain essential
information and understanding the actual
context of the patient journey in the
healthcare business. Purposive and
snowball sampling was initially used to
identify key informants in the healthcare
business in Thailand. There were many
sampling techniques which are based on
non-probability samplings, such as
purposive, convenience, quota, and
snowball sampling techniques (Neuman,
2006). However, this study employed
purposive sampling and snowball
sampling technique as it was the most
suitable tool matching the research’s aim
and target population. While purposive
sampling implied to the technique that
researcher purposively selects key
informant that fits with the particular
criteria of the study, snowball sampling
is the technique that starts with a small
group of key informants then extends the
sample size through referrals based on
the initial selected key informants
(Neuman, 2006; Yin, 2013).
The interview was conducted with thirty
participants from healthcare
professionals group in Thailand. They
were doctors, nurses, and supported staff
as shown in Table 1. Consequently,
colleagues, acquaintances, and friends
could be referred to in these techniques.
The appropriate sample size for an in-
depth interview was around fifteen to
twenty-five informants or until the data
reached the saturation point
(Chareanporn, T., Mingmalairaks, P., &
Kumsuprom, S., 2020; Riley, 1995).
Furthermore, Patton (2002) affirmed that
there were no specific rules for deciding
the sample size if the size could provide
significant insights into research issues.
In general, the sample size was often
decided by resource constraints which
depend on the cooperation of research
informants or even their effort and
contribution to the researcher. Also, a
number of the chosen participants were
manageable in terms of time frame and
resources available. The target
respondents were selected on the
assumption that they willingly accepted
to be interviewed. Each interview was
conducted around one hour on average.
There was an examining case by
comparing the case classified by themes
with multiple cases within cross-case
analysis (Creswell & Clark, 2011;
Edmonds & Kennedy, 2017). Then, the
data analysis was done by analyzing each
interview from observation notes and
grouping the issues found by classifying
them into different themes. Furthermore,
the data analysis took the form of
thematic analysis by using the constant
comparative method to identify and
refine new categories. The validity of the
data was assured by comparing
statements from the interviewees in
healthcare businesses with multiple data
sources—nevertheless, this study scope
only on the patient journey of Out-
Patient-Department (OPD).

UTCC International Journal of Business and Economics
UTTC IJBE | 86
Tabe1 Participants list from healthcare professionals group
Code Position/ Title Age Healthcare Org
HP1 Senior nurse 52 Public hospital
HP2 Doctor 60 Public hospital
HP3 Doctor 35 Public hospital
HP4 Nurse 27 Public hospital
HP5 Senior nurse / Assistant director 46 Public hospital
HP6 Pharmacist 34 Public hospital
HP7 Senior nurse / Claim center manager 40 Public hospital
HP8 Doctor / Assistant director 54 Public hospital
HP9 Telephone operator 28 Private hospital
HP10 Senior nurse 40 Private hospital
HP11 Cashier 25 Private hospital
HP12 Customer Service 30 Private healthcare business
HP13 Doctor / Management team 57 Private healthcare business
HP14 Senior nurse 48 Private healthcare business
HP15 Laboratory investigation (Lab test) officer 29 Private healthcare business
HP16 Doctor / Assistant director 57 Private hospital
HP17 Senior nurse / OPD manager 43 Private hospital
HP18 Cashier 33 Private hospital
HP19 Telephone operator 35 Private hospital
HP20 Senior nurse 50 Private hospital
HP21 Pharmacist 37 Private hospital
HP22 Doctor / Assistant director 61 Private hospital
HP23 Customer assistant 30 Private hospital
HP24 Customer service manager 46 Private healthcare business
HP25 Hospital porter assistance 25 Private healthcare business
HP26 Senior doctor 60 Private healthcare business
HP27 Doctor 38 Public hospital
HP28 Customer service manager 40 Public hospital
HP29 Pharmacist and Dispensing station
manager
39 Public hospital
HP30 Laboratory investigation (Lab test) officer 33 Public hospital
Research findings
The results provide a rich summary of the
variety of the patient journey in the
healthcare business in Thailand. Thirty
informants described three main periods
of the patient journey. The findings could
be categorized into three periods: 1) Pre-
medical service period; 2) In-medical
service period; and 3) Post-medical
service period, which was repeated by
more than one healthcare professionals
from the case analysis. The healthcare
professionals saw them as key patients
service touchpoints that were found to
help develop patient satisfaction. Each
patient journey period contained specific
influencing service touchpoints that
directly relate to patient satisfaction
development; four service touchpoints
found in the pre-medical service period,
three service touchpoints found in the in-
medical service period, and three service
touchpoints found in the post-medical
service period.
UTCC International Journal of Business and Economics
UTTC IJBE | 87
1) Pre-medical service period
The result found that information
transaction and doctor appointment or
reservation, front counter and parking
and patient pickup point, medical record
and registration, vital signs
measurement, and medical history taking
are service touchpoints in the pre-
medical service period. Information
transactions and doctor appointments or
reservations are related to the
information provided on healthcare
business websites or social media
platforms such as Facebook, Instagram,
Twitter, YouTube. Most of the patients
prefer to know the basic information of
business or company before making their
decision. Accurate information and
reliability are essential for healthcare
businesses. For doctor appointments or
reservations, some organizations allow
the patient to appoint the doctor or
reserve the seat for the medical service
queue via an online channel.
Furthermore, pre-consultation or
information supplication has been
provided via telephone and social media
applications such as Line, WhatsApp,
Facebook, Instagram, Twitter,
Messenger, and WeChat. The
information transaction and doctor
appointments or reservations with
healthcare professionals are essential
touchpoints in healthcare businesses to
make patients trustworthy. The front
counter, parking, and patient pickup
point are concerned with greeting and
hospitality service procedures, car
parking and support facilities, and
hospital porter assistance. The front area
was the first impression creation point of
the healthcare business. Hospitality
procedures by healthcare professional
staff included greeting, smile, eye
contact, warm welcome speech, qualified
assistance with attention. Medical record
and registration touchpoints had to be
established to generate patient profiles
and hospital numbers (HN) and included
initial history taking for new patients
who never visited or used the healthcare
business service before. In addition, the
next touchpoint under the pre-medical
service period is vital signs measurement
and medical history taking. This
touchpoint was including of blood
pressure, temperature, pulse, and
respiration. Furthermore, medical history
taking was also included in this period
because the healthcare professional has
to identify a particular clinic or expert
doctor for the patient's illness. Thus,
these service touchpoints were important
to consider as healthcare professionals
mentioned: information transaction and
doctor appointment or reservation, front
counter and parking and patient pickup
point, medical record and registration,
and vital signs measurement and medical
history taking. Three respondents
highlighted pre-medical service period
that:
“We provided all basis and essential
information such as products and service
list, package, and estimated service fees
on our websites. In addition, our
customer can call to use our pre
consultation service before they come to
see the doctor as appointment.” (HP12)
“It so easy to make an appointment with
the specialist. The patient just accesses to
our websites or Facebook page then chat
with our customer service officer to
reserve the seat.” (HP24)
“Before patient go to see the doctor, our
medical record and registration staff will
check patient’s health insurance and
welfare benefit and create patient profile
and hospital number (HN) …” (HP20)
UTCC International Journal of Business and Economics
UTTC IJBE | 88
One informant further asserted that:
“Vital signs measurement and medical
history taking are important procedure
that we have to service the patient in
pre-medical service period. There were
blood pressure, temperature, pulse,
respiration, and medical history taking
with new comer patients.” (HP4)
2. In-medical service period
With extensive experience working in the
healthcare business, most healthcare
professional informants pointed out that
the medical service and diagnostic
service, medical procedure or nursing
procedures, and medical miscellaneous
treatment service were the critical service
touchpoints in the healthcare business in
Thailand. The informants mentioned that
the great and warm ambient of doctor
consultation and diagnostic service helps
to increase patient satisfaction and
patient loyalty. The medical or nursing
procedures from doctors and nurses are
also identified as important service
touchpoints. There were the therapeutic,
i.e., intended to treat, cure, or restore
function or structure such as surgical and
physical rehabilitation procedures. In
addition, medical miscellaneous
treatment service was included in the in-
medical service period also. The
miscellaneous treatment service was the
medical service such as x-ray,
ultrasound, MRI scan (Magnetic
Resonance Imaging), or CT scan
(Computerized Tomography). For the In-
medical service period, the interviews
showed three influencing service
touchpoints that could affect or use to
improve patient satisfaction: medical
service and diagnostic service, medical
procedure or nursing procedures, and
medical miscellaneous treatment service.
For example, informants gave a general
procedures in-medical service journey:
“Most of our customer prefer to consult
with the same doctor for the second time
because they appreciated with medical
service and diagnostic service” (HP8)
Similarly, one informant explained that
in-medical service is a part of patient
journey and it has impact to patient
satisfaction also. For instance,
“The cherish medical and nursing
procedures from healthcare
professionals is key factor to attract the
patient come to use our healthcare
service. There were therapeutic (i.e.,
intended to treat, cure, or restore
function) and surgical and physical
rehabilitation procedures etc.” (HP17)
One respondent further asserted that:
“…Most of our medical miscellaneous
treatment service can generated more
revenue to our business such as x-ray,
ultrasound, and lab test (Laboratory
Investigation). In addition, MRI scan
(Magnetic Resonance Imaging) and CT
scan (Computerized Tomography) are
also popular service that can generate
more revenue…” (HP1)
3. Post-medical service period
There was evidence showing that the
post-medical service period also directly
concerns patient journey in the healthcare
business. Most informants mentioned
that claim center, cashier, and dispensing
or pharmacy were crucial service
touchpoints of the patient experience.
Most of the patients they concerned
about health insurance and welfare
benefit right identification accurately, the
number of expenses in the billing system,
and medicine or drug receiving. The
speed time of the service process in this

UTCC International Journal of Business and Economics
UTTC IJBE | 89
period is essential. Most patients do not
want to spend more time after using all
medical services in the healthcare
business. Thus, the post-medical service
period was another key service
touchpoint that healthcare businesses
could not de-prioritize inpatient service
journeys, as vital informants mentioned
in the interview session. Two
respondents illustrate post-medical
service issue as follows:
“After medical service such as diagnostic
service or medical procedures, health
insurance and welfare benefits
reconfirmed of the patient will process by
claim center department” (HP7)
“In general, before pick up or going to
dispensing station, the customers have to
experience with queue and billing
system. Previously, they complain a lot
with the service speed and waiting time.
Then our healthcare business also
facilitates them by reduce waiting time
and adding more staff to increase service
delivery speed. We try to cover all
problems and facilitate our customer in
post-medical service to make them satisfy
with our value services.” (HP13)
A similar view from one informant
indicated that post-medical service is a
part of patient journey:
“Medicine or drug receiving is the last
service encounter of patient experience.
Many expectations also expected by the
customer such as medicine advisement
with warm and friendly sense.
Furthermore, the speed time of the
service process of this period is essential.
Most of patients do not want to spend
more time after using medical services,
especially in post-medical service as
pharmacy station” (HP29)
Conclusion and
discussion The objectives of this research were to
explore the patient service touchpoints in
the healthcare business in Thailand. The
study adopted a service design concept
approach to identified patients service
touchpoints that are perceived as the
influencing service encounter of patient
satisfaction. This study focuses only on
the patient journey of Out-Patient-
Department (OPD). The thirty cases had
strong service provider in the
professional healthcare business in
Thailand, including doctors, nurses, and
supporting staff.
As the service design concept was
adopted in this research, this study was
selected customer journey maps as a
service design tool to explore the patient
service touchpoints in the healthcare
business in Thailand. As Thailand
Creative and Design Center (TCDC,
2015) mentioned, service designers have
been suggested to add flexibility and
variety to service design processes
depending on context characters,
duration, and existing resources. Thus,
this research was adopted the thinking
processes employed by TCDC. It has
been developed from the Double
Diamond Model, which The British
Design Council first initiated in 2005.
The model aims to explain attitudes and
work processes that combine creative
thinking and design process. The Double
Diamond Model is a mixture of four
steps: discovered, defined, developed,
and delivered (TCDC, 2016). This
research follows the model which is 1)
discover; the researcher gathering
information from healthcare
professionals, patients who experienced

UTCC International Journal of Business and Economics
UTTC IJBE | 90
in OPD, and related documents then
adequate data about for design processes,
2) define; after gaining more information
from informants and documents enough,
the researchers analyzing and
summarizing essential issues such as
service design process, service
touchpoints, patient journey, and current
healthcare business situation in Thailand,
3) develop; brainstorming to produce
feasible concepts for developing the
patient service touchpoints in the
healthcare business to satisfy the patient
experience which customer journey
approach as well as for meeting service
design requirements, and 4) deliver;
combining various ideas to create the
suitable procedures guideline of service
design for the healthcare professional
entrepreneur, investor, or developers.
From the results, the findings indicated
that all healthcare businesses require
patient service touchpoints development.
Most of them try to identify service
encounters and create products and
services to serve or satisfy patient
expectations and satisfaction. The
findings could be categorized the patient
service journey into three periods; 1) Pre-
medical service period; 2) In- medical
service period; and 3) Post- medical
service period, which was repeated by
more than one healthcare professionals
from the case analysis. The healthcare
professionals saw them as key patient
service touchpoints that were found to
help develop patient satisfaction. Each of
these patient journey periods contained
specific influencing service touchpoints
that directly relate to patient satisfaction
development: four service touchpoints
found in the pre- medical service period,
three service touchpoints found in the in-
medical service period, and three service
touchpoints found in the post- medical
service period. In addition, Stettler et al.,
(2018) highlighted the importance of
services experiences in the service
process as one of the most important
components in service design.
Based on all the touchpoints in the
customer (patient) journey map of the
healthcare business (Out-Patient-
Department) and the direction of the key
service design innovation derived from
patient demand and expectation which
fulfill the touchpoints, it is possible to
form an innovation design of opportunity
points that the patient needs to carry out
of healthcare business. The innovative
design of opportunity patient touchpoints
from the service design approach is
mainly based on the result of the service
design process. By analyzing the three
main periods of medical service, patient
service touchpoint innovation procedures
were clearly investigated and developed,
as shown in Table 2. This is an innovative
design of opportunity points based on
patient demand and expectation from a
healthcare professional perspective. The
details were as follows;
1) Innovative design of opportunity
points in pre-medical service period; in
terms of information transection and
doctor appointment or reservation,
innovative design of opportunity points
in this touchpoint could be developed
user-friendly website and use popular
social media to the potential facilitated
customer. Yoopetch (2018), stated that
social media had crucial influence on the
service design in various services
industry. In addition, the healthcare
business should provide educated
customer service staff to deliver essential
information about healthcare products
and services and pre-consultant the
customers. However, all information
UTCC International Journal of Business and Economics
UTTC IJBE | 91
must be accurate and reliable
information. In addition, both online
platforms and telephone should be one of
the channels that customer can use to
appoint the doctor or reserve a seat for the
medical service queue. For front counter
and parking and patient pickup point,
hospitality service and professional
greeting procedures of front area staff are
the innovative design of opportunity
points to create the first impression such
as hospital porter assistant, hostess, valet
service staff. The first impression that
healthcare professionals can set as
service standard such as greeting
conversation, warm welcome speech,
assistance with attention procedures. For
medical records and registration, it is an
important touchpoint for the patient
journey also. The communication and
hospitality service procedures are the
innovative design of opportunity of this
touchpoint. Because the staff has to
generate a patient profile, hospital
number (HN), initial history taking for a
new patient who never visits or use the
healthcare business service before, and
health insurance and welfare benefit right
check. In terms of vital signs
measurement and medical history taking,
the innovative design of opportunity
point are skillful, educated, and great
communication healthcare professionals.
This touchpoint was step of blood
pressure, temperature, pulse, respiration
etc. In addition, it also including of
medical history taking that healthcare
professional has to identify a special
clinic or expert doctor for the patient
illness.
2) Innovative design of opportunity
points in in-medical service period; from
the result, it was found that in in-medical
service period during the patient journey,
the medical service and diagnostic
service, medical procedure or nursing
procedures, and medical miscellaneous
treatment service were the innovative
design of opportunity points. The great
and warm ambient of doctor consultation
and diagnostic service is necessary for
healthcare professionals. It can lead to
patient satisfaction and loyalty. For
medical or nursing procedures from
doctor and nurse also identified as
innovative design of opportunity points.
The competence healthcare professionals
have been required for this touchpoint.
The activities were the therapeutic, i.e.,
intended to treat, cure, or restore function
or structure such as surgical and physical
rehabilitation procedures. In terms of
medical miscellaneous treatment service,
it is the innovative design of opportunity
points also. The knowledgeable and
competent healthcare professionals have
to concentrate with patient. For the
miscellaneous treatment service was the
medical service such as x-ray,
ultrasound, MRI scan (Magnetic
Resonance Imaging), or CT scan
(Computerized Tomography), Lab test
(Laboratory Investigation) etc.
3) Innovative design of opportunity
points in post-medical service period;
from the finding, it was found that claim
center, cashier, and dispensing or
pharmacy were the innovative design of
opportunity points in post-medical
service period. All crucial service
touchpoints of patient experience require
competence, great communication, and
hospitality and service mind staff. Most
of the patients are concerned about health
insurance and welfare benefit right
identification accurately and reconfirmed
in the claim process. The accuracy of
medical and service fees in the billing
system and dispensing have been
required. In addition, the queuing system

UTCC International Journal of Business and Economics
UTTC IJBE | 92
was an innovative design of opportunity
point that healthcare business should be a
concern. The speed of service time in the
service process is also the focal point of
the post-medical service period.
Additionally, Yoopetch (2010) suggested
that to enhance innovation in services
environment, the organization should
increase the awareness of knowledge
management, especially knowledge
acquisition process to continuously
improve the service development.
Furthermore, Lu, et al. (2020) mentioned,
service design thinking has been
increasing the attention and attraction for
customer in healthcare business and also
creating a great potential in creating
better. Agreeing with Patricio, L.,
Sangiorgi, D., Mahr, D., Čaić, M.,
Kalantari, S., & Sundar, S. (2020)
explained, service design can contribute
to the evolution of healthcare service
system and also focus on patient centered
for service satisfaction purpose. In
addition, Ponsignon, F., Smart, A., and
Phillips, L. (2018) suggested the
theoretical insight into service delivery
system (SDS) design, the customer
journey can use as a frame to explore
dimensions of experience quality that
inform design requirements. It can help
healthcare professional service provider
deliver experience quality to patients.
Further research should investigate more
types of healthcare businesses and apply
a quantitative approach to increase the
generalizability to reaffirm the results of
the study. Nevertheless, this research was
exploratory research that investigates the
patient service touchpoints. It adopted a
service design concept approach to
identified patients service touchpoints
that are perceived as the influencing
service encounter of patient satisfaction.
In addition, this study focuses only on the
patient journey of Out-Patient-
Department (OPD). They are limitations
of the study. It was expected that this
paper had the value that could provide an
analysis of the crucial patient service
touchpoints that adopted a service design
approach to develop customer journey on
patient service design in healthcare
businesses in Thailand.
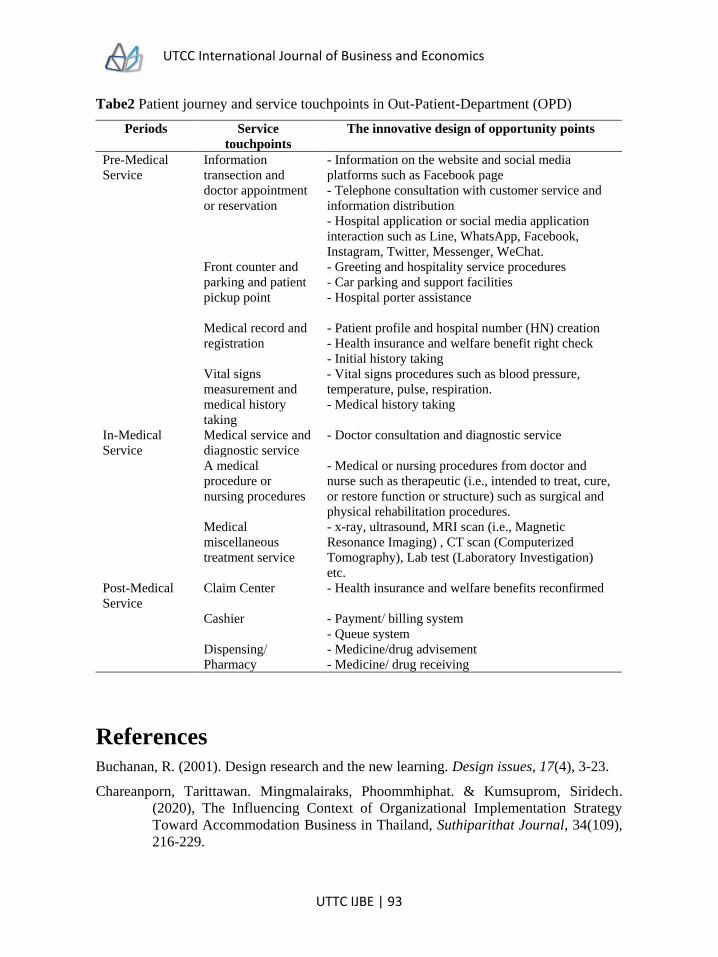
UTCC International Journal of Business and Economics
UTTC IJBE | 93
Tabe2 Patient journey and service touchpoints in Out-Patient-Department (OPD)
Periods Service
touchpoints
The innovative design of opportunity points
Pre-Medical
Service
Information
transection and
doctor appointment
or reservation
- Information on the website and social media
platforms such as Facebook page
- Telephone consultation with customer service and
information distribution
- Hospital application or social media application
interaction such as Line, WhatsApp, Facebook,
Instagram, Twitter, Messenger, WeChat.
Front counter and
parking and patient
pickup point
- Greeting and hospitality service procedures
- Car parking and support facilities
- Hospital porter assistance
Medical record and
registration
- Patient profile and hospital number (HN) creation
- Health insurance and welfare benefit right check
- Initial history taking
Vital signs
measurement and
medical history
taking
- Vital signs procedures such as blood pressure,
temperature, pulse, respiration.
- Medical history taking
In-Medical
Service
Medical service and
diagnostic service
- Doctor consultation and diagnostic service
A medical
procedure or
nursing procedures
- Medical or nursing procedures from doctor and
nurse such as therapeutic (i.e., intended to treat, cure,
or restore function or structure) such as surgical and
physical rehabilitation procedures.
Medical
miscellaneous
treatment service
- x-ray, ultrasound, MRI scan (i.e., Magnetic
Resonance Imaging) , CT scan (Computerized
Tomography), Lab test (Laboratory Investigation)
etc.
Post-Medical
Service
Claim Center - Health insurance and welfare benefits reconfirmed
Cashier - Payment/ billing system
- Queue system
Dispensing/
Pharmacy
- Medicine/drug advisement
- Medicine/ drug receiving
References
Buchanan, R. (2001). Design research and the new learning. Design issues, 17(4), 3-23.
Chareanporn, Tarittawan. Mingmalairaks, Phoommhiphat. & Kumsuprom, Siridech.
(2020), The Influencing Context of Organizational Implementation Strategy
Toward Accommodation Business in Thailand, Suthiparithat Journal, 34(109),
216-229.

UTCC International Journal of Business and Economics
UTTC IJBE | 94
Dusit Thani College. (2020). What is service design? and for whom: hotel management.
Retrieved 19 May 2021, from https://blog.dtc.ac.th/service-design
Geke, V. D., Bas R., & Luke K. (2014). This is Service Design Thinking: Basics, Tools,
Cases. page 148-212. BIS publisher. Netherland
Krungsri Research. (2021). Industry Outlook 2020-2022: Private Hospital Retrieved 26
July 2 0 2 1 , from https://www.krungsri.com/en/research/industry/industry-
outlook/Services/Private-Hospitals/IO/io-Private-Hospitals
Lin, M., Li, F. Y., & Ji, Z. (2020). How to Innovate the Service Design of Leisure Farms:
The Innovation of Sustainable Business Models. Journal of Open Innovation:
Technology, Market, and Complexity, 6(3), 45.
Livework. (2014). Service design is not about ‘pampering’: a brief overview on prejudice.
Retrieved 19 May 2021, from https://www.liveworkstudio.com/blog/service-
design-is-not-about-pampering-a-brief-overview-on-prejudice/
Lu, P., Liao, H. T., & Lei, J. (2020). Applying Service Design in Public Services: A
Scientometric Review for Innovations in Public Health and Administration.
In 2020 Management Science Informatization and Economic Innovation
Development Conference (MSIEID) (pp. 381-384). IEEE.
Moritz, S. (2005). Service design practical access to an evolving field. Retrieved 19 May
2021, from https://www.servicedesignmaster.com/wordpress/wp-content/
uploads/2019/06/PracticalAccesstoServiceDesignsinglepages.pdf
Neuman, W.L. (2 0 0 6 ) . Social Research Methods: Qualitative and Quantitative
Approaches. (6th ed.), Boston, USA: Pearson Education.
Office of the permanent secretary ministry of public health. (2017). Announcement of
information on the number of health agencies Retrieved 1 August 2 0 2 1 , from
http://thcc.or.th/download/letter%20hcode%204%20April%2017.pdf
Patton, M.Q. (2002). Qualitative Research & Evaluation Methods. (3rd ed.). London: Sage
Publications.
Patricio, L., Sangiorgi, D., Mahr, D., Čaić, M., Kalantari, S., & Sundar, S. (2020).
Leveraging service design for healthcare transformation: toward people-
centered, integrated, and technology-enabled healthcare systems. Journal of
Service Management, 31(5), 889-903
Ponsignon, F., Smart, A., & Phillips, L. (2018). A customer journey perspective on service
delivery system design: insights from healthcare. International Journal of
Quality & Reliability Management, 35(10), 2328-2342.
Riley, R.W. (1995). Prestige-worthy tourism behavior. Annals of Tourism Research, 22(3),
630-649.
Rungroje Songsraboon. (2019). Model of Health Care Services Affecting the Satisfaction
of PatientIn Internal Medicine Department Selected Private Hospitals. Journal of
Political Science Suan Sunandha Rajabhat University, 2(2), 82-95.
UTCC International Journal of Business and Economics
UTTC IJBE | 95
Skooldio. (2021). What is service design. Retrieved 19 May 2021, from
https://blog.skooldio.com/service-design/
Stickdorn, M. S., & Schneider, J. (2014). This is Service Design Thinking: Basics, Tools,
Cases. page 28-35. BIS publisher. Netherland
Stickdorn, M., Hormess, M. E., Lawrence, A., & Schneider, J. (2018). This is service
design doing: applying service design thinking in the real world. " O'Reilly
Media, Inc.".
Stettler, J., Rosenberg-Taufer, B., Huck, L., Hoppler, A. A., Schwarz, J., Yoopetch, C., &
Huilla, J. (2018). A Conceptual Framework of Commercial Hospitality:
Perception of Tourists in Thailand and Switzerland. In Contemporary Challenges
of Climate Change, Sustainable Tourism Consumption, and Destination
Competitiveness. Emerald Publishing Limited. 123-138.
TCDC. (2014). Service design work book. Retrieved 19 May 2021, from https://web.
tcdc.or.th/th/Projects/Detail/Service-Design-Thailand
TCDC. (2015). Service design process and methods Retrieved 19 May 2021, from
http://resource.tcdc.or.th/ebook/Service-Design-Book-Final.pdf
The Siam Commercial Bank Public Company Limited. (2021). How Will Thai Stock
Market be When Thailand Has Turned into Aging Society Retrieved 26 July
2021, from https://www.scb.co.th/en/personal-banking/stories/retirement-plan/
ageing-society.html
UK design council, 2015. What is service design? Retrieved 19 May 2021, from
https://www.designcouncil.org.uk/news-opinion/video-what-service-design
Yin, R.K. (2013). Case Study Research: Design and Methods. (5th ed). Thousand Oaks,
California: SAGE Publication
Yoopetch, C. (2010), The model of knowledge acquisition: the study of SMEs in the Thai
Hospitality Industry, World Academy of Science, Engineering and Technology,
42, 351–354.
Yoopetch, C (2018). The impact of social media on hospitality brand and image, UTCC
International Journal of Business and Economics 10 (1), 139-150

UTCC International Journal of Business and Economics
UTTC IJBE | 96

UTCC International Journal of Business and Economics
UTTC IJBE | 97
UTCC International Journal of Business and Economics (UTCC IJBE)
Volume 13 Number 2, August 2021
THE IMPORTANCE OF INNOVATION FOR
ENTREPRENEURIAL SUSTAINABILITY FOR SOCIAL
ENTREPRENEURS IN ASIA-PACIFIC
Ulrike Guelich1 and Hans Michael Guelich2 1Bangkok University, School of Entrepreneurship and Management,
119 Rama 4 Rd., Klongtoei, Bangkok 10110, Thailand 2Stamford International University Thailand, 6 Motorway Road - Km2, Prawet,
Bangkok 10250, Thailand [email protected], [email protected]
Abstract Social entrepreneurs and the likelihood of re-investing their profits to serve the social or
environmental purpose of their enterprises, is triggered by a variety of individual factors.
This study explores the relationship between market-oriented product, service or
process-related innovation and the likelihood that social entrepreneurs reinvest their
profits towards their purpose of their enterprises .Utilizing Global Entrepreneurship
Monitor data of ten Asia-Pacific countries, this empirical study investigates if product-,
service - or process-related innovation is positively related to an increase in those social
enterprises, who reinvest profits towards social goals .Our regression analysis findings
show the importance of bringing innovative products and services to the market,
combined with the educational level of the social entrepreneur in order to reach
entrepreneurial sustainability .With research gaps on social entrepreneurship activities
in the Asia-Pacific region and innovation as a driver for the sustainability of social
enterprises in reinvesting profits towards their purpose, we point out that social
entrepreneurship ventures need long-term nurturing, sustainable business models and
innovative products and services to sustain their businesses.
Keywords :Asia-Pacific; innovation; social entrepreneurship; sustainability; youth
Introduction
To foster entrepreneurship, policy
makers need to understand what
influences individuals to attain sustained
entrepreneurial success, especially in
social enterprises. The aim of our paper
is to explore the influence of market-
oriented innovation in products and
services or of production process-related
innovation on the likelihood of social
entrepreneurs to be involved in a more
narrow definition of social
entrepreneurship (Bosma et al, 2016).
UTCC International Journal of Business and Economics
UTTC IJBE | 98
This definition of a sustainable social
enterprise entails the re-investment of
their profits to serve the social or
environmental purpose of their enterprise
which applies only to 50 % of the social
entrepreneurs globally (Bosma et al,
2016), thus contributing more to their
business purpose by creating sustainable
social enterprises.
Social entrepreneurship can be divided
into two sub concepts: (1) approach- or
impact-related, such as market
orientation, social value creation, social
entrepreneur, and social enterprise (Choi
& Majumdar 2014); and (2)
entrepreneur-related such as
entrepreneurial innovation,
entrepreneurial intent, entrepreneurial
compassion, and entrepreneurial
abilities. All social enterprises are
affected by diverse contextual
complexities to sustainably pursue both
social and economic missions (Alvord et
al, 2004; Miller et al, 2012; Mort et al,
2003; Tan et al, 2005). In a global
comparison, Southeast Asia is the region
with the least number of social
entrepreneurs at just 3.8 % of the
working-age population (Bosma et al.,
2016). Social entrepreneurship in
general, and entrepreneurship related to
the United Nations’ Sustainable SDGs in
specific, is in the focus of many
organizations in the Asia-Pacific region.
There is a research gap on social
entrepreneurship activities in the Asia-
Pacific region in general (Sengupta &
Sahay, 2017), and innovation as a driver
for the sustainability of social enterprises
in re-investing profits towards their
social or environmental goal in specific.
This empirical study explores if
innovation of entrepreneurs in products,
services and processes leads to those
desirable social enterprises that re-invest
their profits to achieve their social or
environmental goals, in series making
both enterprises and goals more
sustainable. To do so, we employ the
Global Entrepreneurship Monitor 2015
individual-level data in a pooled sample
of the ten countries Australia, China,
India, Indonesia, Iran, Malaysia,
Philippines, South Korea, Thailand and
Vietnam. We perform regression analysis
in search for drivers significantly
affecting the individual entrepreneur to
be socially responsible and sustainable
through innovation activities.
Social entrepreneurship
The 2030 United Nations Agenda for
Sustainable Development recognizes the
important role in achieving the SDGs or
‘Global Goals’. Amongst others, it calls
for action against the challenges faced by
youth and other vulnerable groups that
limit their economic, social and political
inclusion. In today’s highly connected
world, people are more creative and more
informed than any previous generation
and are responding to the daily
challenges with innovative approaches,
contributing fresh ideas, creating the
world they want, and driving human
development for themselves, their
communities and their societies (Guelich
& Bosma, 2019).
Social entrepreneurs start and lead
ventures seeking innovate solutions to
address society’s most pressing problems
(Ashoka 2016; Bloom 2012). According
to the Global Entrepreneurship Monitor
(GEM) Special Topic Report on Social
Entrepreneurship (Bosma et al, 2016),
early-stage social entrepreneurial activity

UTCC International Journal of Business and Economics
UTTC IJBE | 99
varies globally and lags behind
commercial entrepreneurial activities
(Terjesen et al, 2016). Measured by the
percentage of adults between ages 18 to
64, who are currently trying to start a
social purpose business, the global
average of social entrepreneurship is 3.2
%. By comparison, the rate of start-up
commercial entrepreneurship in the same
regions is on average more than twice as
high with 7.6 % globally. Of the world’s
social entrepreneurs, an estimated 55 %
are male and 45 % are female – a gender
gap that is less pronounced than in
commercial entrepreneurship. The
gender gap in commercial
entrepreneurship is globally 2:1, which
implies that women are half as likely to
start a business as men (Terjesen et al,
2016). World regions with the highest
social entrepreneurial activity, both in the
start-up phase and the operational phase,
are the United States and Australia (11
%), followed by Sub-Saharan Africa (9
%). Southeast Asia is the region with the
least number of social entrepreneurs at
just 3.8 % of the adult population (Bosma
et al., 2016).
There is no one-size-fits-all blueprint for
institutions to enhance social
entrepreneurship. Some studies favour
the institutional void perspective (e.g.
Mair & Marti, 2006), referring to the idea
that -with an absence of institutional
support in an environment where
problems are abundant- motivation for
social entrepreneurship increases. A
countervailing perspective to this is
institutional support, which explains that
more active governments are able to
reinforce social entrepreneurship
(Stephan et al, 2015). Although most
studies agree on the importance of
governance activism, these two
perspectives are important to keep in
mind for policy implications.
Youth social
entrepreneurship and
entrepreneurial sustainability
Despite research gaps on youth social
entrepreneurship, the practice of youth
social entrepreneurship is currently
increasing (Hodne, Liu, Lloyd, Lyon,
Owen, Perales, Laouri Faulb, Hay, and
Raman, 2019; Kruse 2019). Academic
research mostly focuses on youth social
entrepreneurship “in its infancy ...
[however] the practice [of youth social
entrepreneurship] has been well under
way” (Kruse 2019, p.14). Youth today
are launching social entrepreneurial
initiatives with “ideas and passion to
make incredible change in their local
communities, in the country, and in the
world” (Future Coalition, 2021, “What
We Do”). In general, youth differ from
adults with regard to their societal roles,
power dynamics, propensity to engage in
prosocial behaviours, outlook on life, and
patterns of thinking (Blanchet-Cohen &
Brunson 2014; Blankenstein et al. 2020).
Youth tend to have powerful ideas and
are able to act upon them with the aim to
create positive change. Even though
some behavioural tendencies of youth
have been perceived more negatively,
such as risk taking, challenging authority
and status quo, youth may find and
pursue innovative approaches to societal
and environmental challenges and
engage in social entrepreneurship
(Lewis, 2016).
There is a research gap on social
entrepreneurship activities in the Asia-
Pacific region in general (Sengupta &
Sahay, 2017), and innovation as a driver
UTCC International Journal of Business and Economics
UTTC IJBE | 100
for the sustainability of social enterprises
in reinvesting profits towards their social
or environmental goal in specific. This
reinvestment of profits is considered one
of the most important features of a social
enterprise. Europe DTI (2002, p.13)
defines a social enterprise as a business
“with primarily social objectives whose
surpluses are principally reinvested for
that purpose in the business or in the
community, rather than being driven by
the need to maximize profit for
shareholders and owners”. Bosma et al.
(2016) point out, that only half of the
social enterprises reinvest all of their
profits towards their purpose. In addition,
Guelich & Bosma (2019) found, that a
concerning factor with social enterprises
in Asia-Pacific is, that many of them tend
to experience problems turning their
nascent enterprises into operational
businesses and making them sustainable.
We therefore conclude that –if they are
making profits and are able to reinvest
towards their purpose- these social
entrepreneurs are among those who can
create entrepreneurial sustainability.
Innovation and new products
and markets
An often overseen feature in
entrepreneurship is the innovation-
orientation of entrepreneurs, which is a
necessary underlying feature for long-
term success. Entrepreneurship and
innovation are closely linked and
positively related (Miller & Friesen,
1982) and the innovation process is an
important factor for firm performance
and economic growth (Yu & Si, 2012).
Entrepreneurial innovation has
transitioned from being considered a
technology-driven process of the mid-
twentieth century to an integrated process
of the twenty-first century (Sengupta &
Sahay, 2017). The capability to innovate
relates to several research fields, strategy
and organization, which link to classic
managerial theories of the firm and its
growth (Schumpeter, 1934). Drucker
(1985) pointed out that an entrepreneur is
always in search for any opportunity
caused by change, to which he/she
responds with innovation, thereby
driving economic progress at macro and
micro economic levels. All these theories
introduce the importance of seeking
innovative use for existing corporate
resources to enable new ideas, processes
and products.
Enterprises need to apply innovation to
generate new business models through
new or improved products, services, or
processes which is crucial for their social
advancement (Guelich & Bosma, 2019).
From a different point of view,
entrepreneurship is regarded from a
value-creation perspective. Any
entrepreneur can create value with more
or less innovation - as an innovator or as
a reproducer (Aldrich & Kenworthy,
1999), where innovators enter the market
with significantly different approaches,
practices and competencies than
reproducers, who add little or no
innovativeness to their existing markets.
Bhide (2000) reports that 88 % of the
world’s entrepreneurs succeed because
they excel at the exceptional execution of
an ordinary idea, meaning that they will
transfer something existing or
reproductive and execute it exceptionally
well. However, the remaining 12 %
succeed by executing on an unusual or
extraordinary idea, an innovation, which
usually is generated by themselves. In
this case, entirely new industries could
evolve and these often disruptive new

UTCC International Journal of Business and Economics
UTTC IJBE | 101
ideas create change and fuel economic
growth (Yu & Si, 2012).
Entrepreneurs in developing countries
who tend to be further away from the
international technological frontier will
therefore often be actively pursuing
innovations that are new to their market
or new to their firm. In this case, the
innovation already exists in another
market, but is now adopted by a given
firm. Authors have mentioned
innovations as technology-push and
market-pull innovations (Geum et al,
2016; Horbach et al, 2012). Technology-
push innovations originate from
scientists or knowledgeable persons in
the field of technical and business
implications (Dosi, 1988; Workman,
1993), while market-pull innovations are
either extensions or modifications of
existing products, processes or ideas that
have implications from the market and
the industry (Dosi, 1988; Tushman &
Anderson, 1986). This could encompass
innovations that are led by industry-
specific knowledge.
The innovation concept according to the
Oxford Handbook of Innovation refers to
putting inventions into practice
(Fagerberg et al, 2005). A more narrow
approach focuses specifically on
innovation in products, services and / or
processes or technological innovations as
the result of knowledge-intensive
technological entrepreneurship (Mas-Tur
& Soriano, 2014). The broader approach
refers to innovation as the development
of new products and services or new
processes, unique to a market or the
world, as a key driver of business growth
and job creation. The exploitation of new
markets and the development of new
ways to do business with a distinction
ranges from incremental to disruptive
innovations (Szirmai et al, 2011). Levie
defines innovation confidence as “the
degree to which individuals are willing to
engage with and perceive benefit from
new products or services, or products or
services that embody new technology”
(Levie, 2008, p.4).
Some entrepreneurs risk to be innovative
in order to generate business profits to
create social value (Tan et al., 2005).
These entrepreneurs, symbolizing a more
altruistic version of entrepreneurship,
have come to be known as social
entrepreneurs. They are often community
based, with a dual mission of meeting
social or environmental as well as
economic goals. Business decisions of a
social entrepreneur depend on what
drives him/her in the balance between
market-orientation and societal needs
(Massetti, 2008). In addition, social
innovation targets problems in a
different, more pointed way. By taking
advantage of current needs, exploiting
diverse available resources and building
capacities, these social entrepreneurs
address both the empowerment of
underprivileged groups as a systemic
change of the social, economic and
institutional structures, which create
these problems (Portales, 2019).
Economists, change and thought leaders,
forward-looking governments, industries
and societies have increasingly
articulated the need for entrepreneurial
innovation to achieve high impact to
progress economies. This entrepreneur
would be driven by compassion (Miller
et al., 2012) and would be risk tolerant,
disciplined, innovative and skilled at
recognizing opportunities and
assembling resources to challenge
existing social and economic structures
for creating social value (Hill et al, 2010).
Therefore, we hypothesize:

UTCC International Journal of Business and Economics
UTTC IJBE | 102
H1: Innovation in products and services
positively increases the likelihood of
social enterprises that re-invest in their
social and environmental causes.
H2: Innovation in processes positively
increases the likelihood of social
enterprises that re-invest in their social
and environmental causes.
The Asia-Pacific region
The Asia and the Pacific region consists
of extremely diverse economies,
including countries with the largest and
smallest populations in the world, some
of the wealthiest as well as some of the
least developed countries (Litsareva,
2017). The region also remains home to
two-thirds of the world’s extreme poor
living on less than US$1.90 a day, with
widening income inequality in many
countries in recent years (Litsareva,
2017). These growing disparities will
have implications for achieving the
United Nations 2030 Agenda for
Sustainable Development, including
efforts to promote social cohesion and
the overarching pledge to “leave no one
behind” (UNCDP, 2018, p.1). Under
these circumstances, increasing social
entrepreneurship rates in general, and
entrepreneurship related to the
Sustainable Development Goals in
specific, is in the focus of many
organizations.
With respect to innovation levels and in a
global comparison, the Asia-Pacific
region ranks behind North America and
Europe and before Africa and Latin
America & Caribbean (Bosma et al.,
2016). 25.4 % of start-ups and young
businesses in Asia-Pacific regard their
products or services as new to all or some
customers and perceive few or no
competitors with the same product on
offer (Guelich & Bosma, 2019). Many
entrepreneurs in Asia and the Pacific
pursue to reproduce products and
services, also known as a “me too”
approach in their entrepreneurial
activities. However, the CPA Australia
Asia-Pacific Small Business Survey
(2016) shows that, regardless of market,
small businesses with younger owners
below 40 years of age are significantly
more likely to be growing their
enterprises, creating jobs if they focus on
innovation, export, social media or
training.
Educational level in Asia-
Pacific
In the GEM study, the educational
stages are subdivisions of formal
learning, typically covering early
childhood education, primary
education, secondary
education and tertiary (or higher)
education. In order to be able to conduct
cross-country comparisons, GEM
utilizes the UNESCO (United Nations
Educational, Scientific and Cultural
Organization) classification, which
recognizes seven levels of education in
its International Standard Classification
of Education system (ISCED). In Asia-
Pacific, findings reveal, that the higher
the educational level is, the higher
entrepreneurial attitudes and activities
are, regardless of age. Large country
differences with respect to the
educational levels prevail between
attitudes, intentions and entrepreneurial
activities (Guelich & Bosma, 2019).
The level of education may be a factor in
explaining the number of social
enterprises (Estrin, Mickiewitz &

UTCC International Journal of Business and Economics
UTTC IJBE | 103
Stephan, 2016), but differs substantially
for social entrepreneurs across the globe
(Bosma et al, 2016). The US and
Australia report notably higher
proportions of social entrepreneurs with
a high level of education (62 %), while in
MENA (Middle East and North Africa),
Eastern and Western Europe around half
of the social entrepreneurs are highly
educated. Since Asia-Pacific comprises
many under-developed regions and some
of the lowest social entrepreneurship
rates of the world, we hypothesize that
H3: The educational level positively
increases the likelihood of social
enterprises that re-invest in their social
and environmental causes.
Research design and
methodology Data used in this study are from the GEM
project, an ongoing large-scale research
project, designed to collect data on
entrepreneurial activities, aspirations and
behaviour across countries. Each year, a
random representative sample of the
adult population (age 18 to 64) is
surveyed in each country to identify
individuals who, at the time of the
survey, owned and managed a business
or were in the process of starting one.
(Bosma, 2013).
This empirical study utilizes GEM data
from 2015, collected in the 10 countries
Australia, China, India, Indonesia, Iran,
Malaysia, Philippines, South Korea,
Thailand and Vietnam. The total sample
size of the adult populations in the 10
countries was 29,089 respondents, of
which 1,712 were social entrepreneurs
age 18 to 64, who -alone or with others-
were currently trying to start or currently
leading any kind of activity that has a
social, environmental or community
objective. Educational stages in GEM
utilize the UNESCO classification from
Level 0 (pre-primary education) through
Level 6 (second stage of tertiary
education). They are defined as follows:
(1) Level 1 or lowest level of education:
UNESCO stages 0, 1 or 2: pre-primary
education, primary education or first
stage of basic education, lower secondary
or second stage of basic education; (2)
Level 2 or medium level of education:
UNESCO stages 3 or 4: (upper)
secondary education, post-secondary
non-tertiary education; and (3) Level 3 or
high level of education: UNESCO stages
5 or 6: first stage of tertiary education,
secondary stage of tertiary education.
Linear regression analysis is used to
answer the questions: (1) if innovation in
products and services and/or (2)
innovation in processes are positive
predictors for social enterprises that re-
invest in their social and environmental
causes, and (3) if the educational level
positively increases the likelihood of
social enterprises that re-invest in their
social and environmental causes. Dependent variable DV is “reinvesting
profits for social and environmental
goals” (SEPROFIT: “Profits will be
reinvested to serve the social or
environmental purpose of my
organization”). We control for SEMARKET (operating
in the market by producing goods and
services), AGE (age), gender,
KNOWENT (do you know someone who
started a business in the last 2 years?),
OPPORT (do you see opportunities to
start a business?), SUSKILL (do you
perceive to have the right skills to start a
business?), and GENDER (gender).
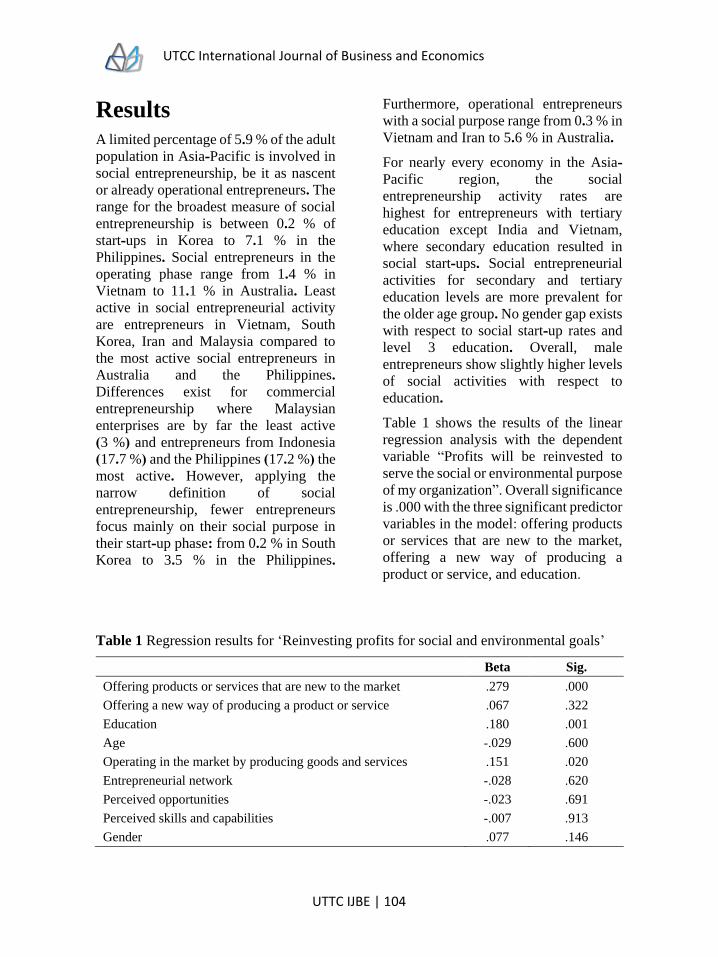
UTCC International Journal of Business and Economics
UTTC IJBE | 104
Results A limited percentage of 5.9 % of the adult
population in Asia-Pacific is involved in
social entrepreneurship, be it as nascent
or already operational entrepreneurs. The
range for the broadest measure of social
entrepreneurship is between 0.2 % of
start-ups in Korea to 7.1 % in the
Philippines. Social entrepreneurs in the
operating phase range from 1.4 % in
Vietnam to 11.1 % in Australia. Least
active in social entrepreneurial activity
are entrepreneurs in Vietnam, South
Korea, Iran and Malaysia compared to
the most active social entrepreneurs in
Australia and the Philippines.
Differences exist for commercial
entrepreneurship where Malaysian
enterprises are by far the least active
(3 %) and entrepreneurs from Indonesia
(17.7 %) and the Philippines (17.2 %) the
most active. However, applying the
narrow definition of social
entrepreneurship, fewer entrepreneurs
focus mainly on their social purpose in
their start-up phase: from 0.2 % in South
Korea to 3.5 % in the Philippines.
Furthermore, operational entrepreneurs
with a social purpose range from 0.3 % in
Vietnam and Iran to 5.6 % in Australia.
For nearly every economy in the Asia-
Pacific region, the social
entrepreneurship activity rates are
highest for entrepreneurs with tertiary
education except India and Vietnam,
where secondary education resulted in
social start-ups. Social entrepreneurial
activities for secondary and tertiary
education levels are more prevalent for
the older age group. No gender gap exists
with respect to social start-up rates and
level 3 education. Overall, male
entrepreneurs show slightly higher levels
of social activities with respect to
education.
Table 1 shows the results of the linear
regression analysis with the dependent
variable “Profits will be reinvested to
serve the social or environmental purpose
of my organization”. Overall significance
is .000 with the three significant predictor
variables in the model: offering products
or services that are new to the market,
offering a new way of producing a
product or service, and education.
Table 1 Regression results for ‘Reinvesting profits for social and environmental goals’
Beta Sig.
Offering products or services that are new to the market .279 .000
Offering a new way of producing a product or service .067 .322
Education .180 .001
Age -.029 .600
Operating in the market by producing goods and services .151 .020
Entrepreneurial network -.028 .620
Perceived opportunities -.023 .691
Perceived skills and capabilities -.007 .913
Gender .077 .146
UTCC International Journal of Business and Economics
UTTC IJBE | 105
Offering products and services that are
new to the market proves to be positively
significant at .279/.000 and thus confirms
hypothesis H1: Innovation in products
and services positively increases the
likelihood of social enterprises that re-
invest in their social and environmental
causes. However, innovation in
processes is not significant and therefore
H2: Innovation in processes positively
increases the likelihood of social
enterprises that re-invest in their social
and environmental causes is not
confirmed. Also confirmed is that the
educational level (.180/.001) is important
for a sustainable social enterprise to be
able to reinvest profits towards their
purpose, thus H3: The educational level
positively increases the likelihood of
social enterprises that re-invest in their
social and environmental causes is
confirmed.
Interestingly, it is also positively
significant (.151/.020) that operating in
the market by producing goods and
services is another predictor for
reinvestment of profits towards the
entrepreneurial purpose. We conclude,
that our construct in general positively
points into a right direction, also because
the amount of variance that is explained
by the independent variables in R Square
shows a strength of association with a
level of 24.7 %.
Discussion
United Nation’s strategy to support youth
to turn their “ideas into action”
acknowledges that youth are “a vast
source of innovation, ideas, and
solutions” who are providing vital
change and leadership on the global
climate crisis, social justice, and
technology (United Nations 2018). This
UN initiative acknowledges that young
social entrepreneurs have great potential
to lead positive change in the world
today. As the objective of any social
innovation is to address a problem more
efficiently and effectively than done
previously, our findings support Portales
(2019), that it is important to promote
social change integrally and holistically.
However, we go beyond the
environmental and societal change alone.
The sustainability of the social enterprise
itself can only contribute to generate new
social, economic, institutional, and even
cultural structures which then transform
conditions or causes, if the entrepreneur
is able to lead the businesses into an
operational and finally established
business phase. As the majority of youth-
led social enterprises does not make it
beyond the start-up phase (Guelich &
Bosma, 2019), our research contributes
to understanding how to realize the
potential success of youth social
entrepreneurs by identifying where
support is needed to make them
successful in the long term.
In Asia-Pacific specifically, clear
relationships exist between introducing
innovative products, services or
processes and expected business growth,
between innovation and future job
creation, and between innovation and
business growth (Guelich & Bosma,
2019). Entrepreneurs in general have
higher innovation confidence than non-
entrepreneurs (Levie, 2008).
Entrepreneurial innovation is therefore a
core driver of economic growth, business
growth and job creation. Similarly, this is
true for social enterprises who are active
in the market with goods and services,
which enables them to make money.
Combining this with innovation in

UTCC International Journal of Business and Economics
UTTC IJBE | 106
products and services and a certain
educational level, will increase the
likelihood that their social enterprises
might be among those who can sustain to
an operational phase. As a result, they
will be among the 50 % of social
enterprises (Guelich & Bosma, 2019),
who reinvest their profits and achieve
their social and environmental goals.
Reinvestment of their profits implies that
their businesses previously earned a
profit, which directly relates to more
sustainable business models. A wider
knowledge about the drivers of
sustainability could have tremendous
impact on social enterprises’ success,
because the majority of social enterprises
-youth and older entrepreneurs- struggle
to sustain their businesses beyond the
start-up phase. To increase impact on
these social enterprises, organizations,
governments, and educational
institutions should work together to
increase innovativeness in products and
services and implement the right support
programs for youth social entrepreneurs.
Conclusions As the Asia-Pacific region includes some
of the wealthiest as well as some of the
least developed countries in the world,
disparities are growing with implications
for achieving the United Nations 2030
Agenda for Sustainable Development
and the overarching pledge to “leave no
one behind” (UNCDP, 2018, p.1). The
region also hosts the largest generation of
youth in history. Organizations, such as
United Nations Development
Programme (UNDP), target youth to
enter entrepreneurship around the SDGs.
Our findings support this concept of
UNDP; however, we point out that youth
social entrepreneurship needs to be
nurtured in the long term, with
sustainable business models and
innovative products, services and
processes. Governments not only need to
rethink their existing education systems
from primary to tertiary educational
levels, but also how and with which
programs they can enhance innovation in
in youth entrepreneurs, enabling them to
reinvest their profits towards their SDG
purpose, thus becoming sustainable.
Social entrepreneurship-targeted
government funding is needed, that takes
into account which challenges and
limitations are prevalent in currently
existing funding programs for social
entrepreneurs with respect to
innovativeness.
The results of the study are valuable for
both academia and practitioners. The
finding, that operating in the market by
producing goods and services as a
predictor for social entrepreneurs to
reinvest their profits for their purpose,
needs further exploration. Clearly, it is
necessary to be in a market with products
or services to make a profit and in series
to be able to reinvest. However, a deeper
investigation is needed to specify what
exactly needs to be done in the market to
strengthen this finding. Following the
findings of Stephan et al (2015), that
governments that are more active are able
to reinforce social entrepreneurship, this
calls for action for governments,
governmental institutions as well as for
private organizations. This could take
place in areas such as access to funding,
supportive funding options by
government and the private sector, and
raising awareness of the importance of
the SDGs. As our results show that –in
the Asia-Pacific region- tertiary level of
education supports social

UTCC International Journal of Business and Economics
UTTC IJBE | 107
entrepreneurship, these stakeholders
specifically need to target the primary
and secondary education level to increase
the probability of social
entrepreneurship. Topics should include
not only innovation and creativity, but
also entrepreneurship general education
to result in a higher level of sustainable
social enterprises. In practice of higher
education, the findings suggest to
incorporate training on innovation mind-
set building, creation of alternative
funding concepts and other supportive
framework conditions and the use of the
UN SDGs as an opportunity concept into
the higher educational organization itself.
This will challenge universities to change
from their tradition of being a managerial
hierarchical institution to becoming a
more entrepreneurial educational
institution.
Limitations of this study is the time of
data collection in 2015, as the awareness
for the importance for social enterprises
increased in the last few years,
accelerated in the Covid-19 pandemic,
resulting in a higher number of social
enterprises now compared to 2015. Data
that are more recent might reveal
different or more nuanced information on
the interaction between innovativeness,
education and social enterprises. In
addition, the recent rapid technological
changes during the Covid-19 pandemic
could accelerate innovativeness in social
enterprises, which might lead to new
findings. This study comprises 10
countries in Asia-Pacific, and a
generalization to overall Asia-Pacific
might not be possible. Therefore,
utilizing the findings of this study for
comparisons of Asia-Pacific to other
larger regions, such as e.g. Europe, might
result in inaccurate results.
As the influence of education on
innovative behaviour is documented,
further studies could investigate the
interplay between the level of education
and innovation in products and services
to find the reasons, what specifically
triggers the purpose to reinvest profits.
Overcoming the innovation obstacle for
social enterprises can lead to a
sustainable economic business
development with higher profitability
and more value-added goods and
services. Gaining more insights in the
different prevalent types of government
support for social enterprises in the Asia-
Pacific region and –if they support
innovation or only the social and
environmental impact- might lead to
innovation-specific approaches towards
their social or environmental goal. The
interplay between youth social
enterprises, universities, governments
and organizations targeting youth
initiatives could help to empower youth
to a new level in the Asia-Pacific region.
Acknowledgements
The authors would like to express their
gratitude to the ten GEM national teams
for their role in conducting the GEM
survey in their respective economies in
2015 and collecting the data used for this
study.

UTCC International Journal of Business and Economics
UTTC IJBE | 108
References
Aldrich, Howard and Kenworthy, Amy ) 1999 .(The accidental entrepreneur :Campbellian
antinomies and organizational foundings .Variations in organization science :In
honor of Donald T .Campbell, 19-33 .
Alvord, Sarah, Brown, David and Letts, Christine (2004). Social entrepreneurship and
societal transformation an exploratory study. The Journal of Applied Behavioral
Science, 40(3), 260–282. https://doi.org/10.1177 /0021886304266847.
Ashoka (2016). More Than Simply ‘Doing Good’: A Definition of Social Entrepreneur.
Ashoka Changemakers [Retrieved June 21, 2019]. Retrieved September 13, 2020
from https://www.evansville.edu/changemaker/downloads/more-than-simply-
doing-gooddefining-changemaker.pdf.
Bhide, Amar (2000). The origin and evolution of new businesses. Oxford: Oxford
University Press.
Blanchet-Cohen, Natasha and Brunson, Liesette (2014). Creating Settings for Youth
Empowerment and Leadership: An Ecological Perspective. Child & Youth
Services 35(3)216–36.
Blankenstein, Neeltje, Telzer, Eva, Do, Kathy, van Duijvenvoorde, Anna and Crone,
Eveline (2020). Behavioral and Neural Pathways Supporting the Development of
Prosocial and Risk-Taking Behavior Across Adolescence. Child Development,
91 (3), e665–81.
Bloom, Paul N. (2012). Introduction to the Special Section on Social Entrepreneurship.
Journal of Public Policy & Marketing, 31(1), 7374.
Bosma, Niels (2013). ‘The Global Entrepreneurship Monitor (GEM) and its impact on
entrepreneurship research.’ Foundations and Trends in Entrepreneurship 9(2).
Bosma, Niels, Schøtt, Thomas, Terjesen, Siri, & Kew, Penny (2016) .Special Topic Report
Social Entrepreneurship .Global Entrepreneurship Research Association
Retrieved February 27, 2021 from https//:gemconsortium.org/report/49542
Choi, Nia, & Majumdar, Satyajit (2014). Social entrepreneurship as an essentially
contested concept: Opening a new avenue for systematic future research. Journal
of Business Venturing, 29(3), 363–376. https://doi.org/10.1016/j.jbusvent.
2013.05.001.
CPA Australia )2016 .(The CPA Australia Asia-Pacific Business Survey 2016 – General
Report for Australia, China, Hong Kong, SAR China, Indonesia, Malaysia, New
Zealand, Singapore and Viet Nam . Southbank :CPA.
Dosi, Giovanni (1988). Sources, procedures, and microeconomic effects of innovation.
Journal of economic literature, 1120-1171.
Drucker, Peter F. (1985). Innovation and Entrepreneurship. Routeledge, London.
https://www.evansville.edu/changemaker/downloads/more-than-simply-doing-gooddefining-changemaker.pdf

UTCC International Journal of Business and Economics
UTTC IJBE | 109
Estrin, Saul, Mickiewicz, Tomasz, and Stephan, Ute (2016) .Human capital in social and
commercial entrepreneurship .Journal of Business Venturing, 31)4(, 449-467.
Europe DTI (2002). Social Enterprise: a strategy for success. Department of Trade and
Industry (DTI), Secretary of State for Trade and Industry, HM Government.
Retrieved September 13, 2020 from: http://www.dti.gov.uk/socialenterprise
Fagerberg, Jan, Mowery, David, & Nelson, Richard (2005). The Oxford handbook of
innovation. Oxford: Oxford University Press.
Future Coalition (2021). About: what we do. Retrieved May 27, 2021 from:
https://futurecoalition.org/what-we-do/
Geum, Youngjung, Jeon, H. and Lee, Hakyeon (2016). Developing new smart services
using integrated morphological analysis: integration of the market-pull and
technology-push approach. Service Business, 10(3), 531-555.
Guelich, Ulrike and Bosma, Niels ) 2019 .(Youth Entrepreneurship in Asia and the Pacific
2018/2019. Retrieved February 27, 2021 from: https//:gemconsortium.org/
report/50262
Hill, T.L., Kothari, Tanvi and Shea, Matthew (2010). Patterns of meaning in the social
entrepreneurship literature: a research platform. Journal of social
entrepreneurship, 1 (1), 5-31.
Horbach, Jens, Rammer, Christian and Rennings, Klaus (2012). Determinants of eco-
innovations by type of environmental impact - The role of regulatory push/pull,
technology push and market pull. Ecological economics, 78, 112-122.
Hodne, Peter, Liu, Todd, Lloyd, Amy, Lyon, Sammy, Owen, Renee, Perales, Luis, Laouri
Faulb, Romina, Hay, Laura, and Raman, Valentina (2019) Changemakers:
Educating with a Purpose. By Educators For Educators. Rosslyn, VA: Ashoka.
Kruse, Tina (2019). Making Change: Youth Social Entrepreneurship as an Approach to
Positive Youth and Community Development. Oxford, UK: Oxford University
Press.
Levie, Jonathan (2008). The IIIP Innovation Confidence Index 2007 Report. Hunter Centre
for Entrepreneurship University of Strathclyde, Glasgow, United Kingdom, 29.
Lewis, K. V. (2016). Identity capital: an exploration in the context of youth social
entrepreneurship. Entrepreneurship & Regional Development, 28(3-4), 191-205.
Litsareva, Eva (2017). Success factors of Asia-Pacific fast-developing regions’
technological innovation development and economic growth. International
Journal of Innovation Studies, 1(1), 72-88.
Mair, Johanna, and Marti, Ignasi (2006). Social entrepreneurship research: A source of
explanation, prediction, and delight. Journal of World Business, 41(1): 36-44.
Massetti, Brenda (2008). The social entrepreneurship matrix as a ‘tipping point’ for
economic change. Emergence: Complexity and Organization, 10 (3), 1-8.

UTCC International Journal of Business and Economics
UTTC IJBE | 110
Mas-Tur, Alicia and Ribeiro-Soriano, Domingo (2014). The level of innovation among
young innovative companies: the impacts of knowledge-intensive services use,
firm characteristics and the entrepreneur attributes. Service Business, 8(1), 51-
63.
Miller, Danny and Friesen, PH. (1982). Innovation in conservative and entrepreneurial
firms: two models of strategic momentum. Strategic Management Journal, 3(1),
1-25.
Miller, Toyah, Grimes, Matthew, McMullen, Jeffery and Vogus, TJ. (2012). Venturing for
others with heart and head: how compassion encourages social entrepreneurship.
Academy of Management Review, 37 (4), 616-640.
Mort, Gillian, Weerawardena, Jay and Carnegie, Kashonia (2003). Social
entrepreneurship: Towards conceptualization. International Journal of Nonprofit
and Voluntary Sector Marketing, 8(1), 76–88. https://doi. org/10.1002/nvsm.202.
Normann, Richard (1971). Organizational innovativeness: Product variation and
reorientation. Administrative Science Quarterly, 203-215.
Portales, Luis (2019). Social Innovation and Social Entrepreneurship: Fundamentals,
Concepts and Tools. Palgrave McMillan. https://doi.org/10.1007/978-3-030-
13456-3
Schumpeter, Josef (1934). The theory of economic development: An inquiry into profits,
capital, credit, interest, and the business cycle (Vol. 55). New Brunswick:
Transaction publishers.
Sengupta, Subhanyan and Sahay, Arunaditya (2017). Social entrepreneurship research in
Asia-Pacific: Perspectives and opportunities. Social Enterprise Journal.
Stephan, Ute, Uhlaner, Lorraine and Stride, Christopher (2015). Institutions and social
entrepreneurship: The role of institutional voids, institutional support, and
institutional configurations. Journal of International Business Studies, 46(3),
308-331.
Szirmai, Adam, Naudé, Wim and Goedhuys, Micheline (2011). Entrepreneurship,
innovation, and economic development. Oxford: Oxford University Press.
Tan, Wee Liang, Williams, John and Tan, Teck Meng (2005). Defining the ‘social’ in
‘social entrepreneurship’: altruism and entrepreneurship. The International
Entrepreneurship and Management Journal, 1 (3), 353-365.
Terjesen, Siri, Bosma, Niels and Stam, Erik (2016). Advancing public policy for high‐
growth, female, and social entrepreneurs. Public Administration Review, 76(2),
230-239.
Tushman, Michael and Anderson, Philip (1986). Technological discontinuities and
organizational environments. Administrative Science Quarterly, 439-465.
UNCDP )2018 .(Leaving no one behind .Retrieved April 10, 2021 from:
https//:sustainabledevelopment.un.org/content/documents/2754713_July_PM_2
UTCC International Journal of Business and Economics
UTTC IJBE | 111
._Leaving_no_one_behind_Summary_from_UN_Committee_for_Development
_Policy.pdf .Bangkok :United Nations CDP Committee for Development Policy
United Nations News (2018). Youth 2030: UN Chief Launches Bold New Strategy for
Young People ‘To Lead’ (September 24). Retrieved April 11, 2021from:
https://news.un.org/en/story/2018/09/1020302.
Workman, John (1993). Marketing's limited role in new product development in one
computer systems firm. Journal of Marketing Research, 30, 405-421.
Yu, Xiaoyu, & Si, Steven (2012). Innovation, internationalization and entrepreneurship: A
new venture research perspective. Innovation Management, Policy & Practice,
14(4), 524-539.

UTCC International Journal of Business and Economics
UTTC IJBE | 112

UTCC International Journal of Business and Economics
UTTC IJBE | 113
UTCC International Journal of Business and Economics (UTCC IJBE)
Volume 13 Number 2, August 2021
THAILAND 4.0: A NEW VALUE-BASED ECONOMY AND
ITS IMPLICATION ON WELLNESS BUSINESS
Surada Chundasutathanakul1 and Suthawan Chirapanda2 1School of Law and Politics, Suan Dusit University
145/9 Sukhothai Rd., Dusit, Bangkok 10300 Thailand 1,2School of Business, University of the Thai Chamber of Commerce 126/1 Vibhavadi Rangsit Rd., Dindang, Bangkok 10400, Thailand [email protected], [email protected]
Abstract The research aims to explain how COVID-19 has affected wellness business SMEs in
Bangkok. It also uses political and management theories namely, developmental state
theory, social capital theory, diffusion of innovation theory, resource-based theory, and
image theory.
The research is qualitative research by nature as it uses snowball sampling and non-
random sampling methods to gather the information through semi-structure in-depth
interviews and focus groups. The main finding of this research is that, though the Thai
government has set “Medical and Wellness Tourism” as the country’s development
strategy to make Thailand a hub for medical and wellness tourism since 2002, the
country has failed to manage COVID-19 crisis, and to provide appropriate risk
management and suitable compensation to wellness business SMEs, both entrepreneurs
and employees. As well, the government has high hope for the future of the wellness
business as it believes that the sector, combined with medical and leisure tourism, will
still be the engine of economic growth for Thailand while the business sector has not yet
seen the bright future for wellness business in the post pandemic world.
The conclusion of the research is that the state ineffectively implements risk
management measures makes the wellness SMEs in Bangkok suffer the effects of the
COVID-19 pandemic. The research suggests that crisis communication and crisis
management plan of the country shall be improved in order to better relieve like
situations if ever occurs again. As well, the limitation of this research, apart from the
pandemic itself, is that it is mainly conducted in Bangkok, especially in the city center.
Therefore, the research suggests that other researchers who are interested in this topic
conduct research in more thorough areas of the city and even nationwide to fill the
knowledge gap.
Keywords: Crisis management; Public policy; Wellness business; SMEs

UTCC International Journal of Business and Economics
UTTC IJBE | 114
Introduction
COVID-19 and its effects on
wellness business SMEs in
Bangkok
Historically, Thailand developed the
country’s economy through its
competitive advantage in rich natural
resources and bio-diversity and devoted
most its investment and attentiveness in
the agriculture sector, which is the 1.0
economic development phase. Then the
country entered the 2.0 and 3.0 phases,
where the country received most revenue
from light industries and heavy industries
respectively. Yet, Thailand still faced 3
traps that hindered it from succeeding
expected economic growth, namely
middle-income trap; inequality trap and;
imbalance trap. These traps merged with
structural problems led to the country
low effectiveness in economic
development. Therefore, to frame
economic improvement for 20 years
(2017 – 2036 B.E.) onward, the
government has come up with the idea of
Thailand 4.0 economic development
strategies that moves the focus into
innovation-based development and to
connect the country’s economy to the
universal level. (Ministry of Industry,
2016)
According to Health Systems Research
Institute (HSRI), Thailand has faced
challenges in numerous scopes that affect
health systems. It proposes 11
dimensions of changes, namely
consuming and living behaviors;
urbanization; aging society; reasonable
drug use; environmental change; market
competition and investment;
technological development; preventable
diseases; higher spending on health-
related activities; healthcare human
resource management and; inequality in
health system (Thailand Board of
Investment, 2018).
As well, the Thai government has set
“Medical and Wellness Tourism” as the
country’s development strategy to make
Thailand a “hub” for medical and
wellness tourism activities since 2002.
(Thailand Board of Investment, 2018).
With medical and wellness tourism as a
“new s-curve” innovation is to ensure
that Thailand’s economy will
continuously develops. That is, the
country will profit from the new wave of
innovation, while the first s-curve, or the
heavy-industry based economy in the
past, will eventually fade out. (Ministry
of Industry, 2016)
The first s-curve is the industry that
Thailand has capabilities to produce and
it is a potential industry that had created
tremendous economic value, but it lacked
technological improvement and generate
low growth rate. On the other hand, the
new s-curve industry is a new industry
that has intense use of technology and
innovation. This is the industry that has
great potential growth in the future.
However, as it is a new industry that
acquires low number of players, it
requires that the relevant actors must
support the industry in order to make it
strong and highly competitive in the near
future (Ministry of Industry, 2016).
One of the strategies is to reform the Thai
industry sector into an innovation
industry. To elaborate, the strategy is to
transform from production-based
activities to innovation and technological
based activities by empowering the
industry’s competitiveness to level up
production standard and to create new
innovations with digital technology as a

UTCC International Journal of Business and Economics
UTTC IJBE | 115
key tool. This is to build a network of
“Innovation Driven Entrepreneurship”
(IDE) who uses innovation and
technology in their activities and to
support the aggregation of industry
cluster. This SPRING strategy is to level
up standard, productivity, and
innovation. Apart from that, to craft
sustainable development, the country
needs to support green growth industry
and cultural and creative entrepreneurs to
assure that they achieve 5 elements of
development: productivity; standardize;
innovation; green growth enterprise and;
cultural and creative enterprise (Ministry
of Industry, 2016).
Wellness business is seen as a new s-
curve actor. To elaborate that, the
Thailand 4.0 model puts the wellness
business, as a new s-curve economic
actor, development into following 4
phases.
1. For 1-2-year timeframe: the strategy is
to strengthen new s-curve business/start-
ups and to craft them into “New
Economic Warrior”; to promote smart
SMEs and; to develop SMEs Rescue
Center and Cultural Industrial Village
2. For 2-5-year timeframe: the strategy is
to accelerate start-ups; to increase the
number of smart SMEs; to connect SMEs
with Les and; to support industry
networking
3. For 2-10-year timeframe: the strategy
is to support the Thai entrepreneurs to be
known internationally and; to connect the
Thai entrepreneurs to the high-valued
chains in the international market.
4. For 10-20-year timeframe: the strategy
is to push the Thai entrepreneurs to
transform themselves to be global
leading enterprises (Ministry of Industry,
2016).
The COVID-19 Pandemic has caused
great damages in many sectors,
especially the business sector. The
pandemic’s impact on tourism and hotel
industry is massive. The helms of global
economy is affectedly paused by
applying the brakes of the pandemic, and
it has not stopped at any limit to any
limits which hinders all the domains of
the economic activities as well as
commercial and managerial activities.
The stances towards in preventing the
pandemic, especially in hospitality
industry is the essence of this study in
which greater parts of the sector got a
stark blow in functioning the suave way
of perspective viewpoint of this sector.
The outbreak of the first and second
waves of COVID-19 have affected
tourism industry in a higher and
progressive manner (Kannan, 2020).
The COVID-19 symbolizes the definitive
test for several leaders, entrepreneurs,
and employees operating in most, if not,
all industries. Among other waves, the
contagion has brutally affected the world
economy including the travel, tourism
and hospitality industries. Besides, the
first-time nature of the pandemic has had
destroyed effects, with various
restrictions on businesses. That leads to
enormous stress on hotels, restaurants,
bars, and other hospitality businesses,
with overall serious and seemingly
unbeatable challenges for the whole
hospitality industry (Alonso, Kok, &
Bressan, 2020).
The research aims to explain COVID-19
crisis management and resilience in
wellness business sector in Thailand. The
country has been dealing with the
pandemic since late 2019 and the virus
has spread in various time span, or waves
through 2019 – 2021 where the
UTCC International Journal of Business and Economics
UTTC IJBE | 116
government has Implemented many
policies and measures to relieve the
pandemic situation. The main problem,
apart from the pandemic itself, is lack of
cooperation in information sharing
between responsible organizations as
they sometimes compete against each
other to get public recognition. That
worsens both the pandemic control and
people’s trust in government. (Bangkok
Post, 2021) Another problem is that the
policies, such as closing various places
and financial aid measures, that have
been issued for relieving the situations
are ineffective. That shows that policy
makers and those affected from the
pandemic and the policies are not in the
same page and the business sector that is
most affected is wellness business,
namely massage parlors, spas, hair salon
and gyms because they are the first to be
closed and the last to be reopened.
(Khaosod English, 2021)
The novel corona pandemic began in late
December 2019 in Wuhan, Hubei
province in China where clusters of
pneumonia cases were reported to
Wuhan Municipal Health Commission.
(World Health Organization, 2020)
Then, the virus has spread around the
globe, including Thailand. The medical
and wellness business is certainly
affected from the pandemic.
Nevertheless, with all the strategies laid
out, they have not incorporated pandemic
into the 20-year strategic plan. With
COVID-19 breaking out in the country,
Thailand has now faced huge challenges
that it needs to overthrow. The
government as well as relevant actors
must redesign the strategies to cope with
reality. Therefore, it is crucial to portray
the support and policy implementation
that the government and relevant actors
provide for medical and wellness
business, both during and after the
COVID-19 pandemic phase. In other
words, it is important to match the policy
makers/practitioners and those who
affected by such policies and measures to
see the similarities and differences in
their perspectives.
In the wellness market, the lines of goods
offered are comprehensive ranging from
preventive measures of health to the
treatment of illness, for example. The
preventive measure introduces a concept
of healthy living while the treatment of
illness merely produces the idea from
health-related tourism. The common
wellness ideas are spa, massage, body
pampering, healthy gourmet meals,
fitness classes, and alternative clinical
treatment (such as aquatic therapy and
acupuncture). Spa treatments, as the
focus point of wellness amenity, can be
delivered in different manners in terms of
sources of water and its setting. As for the
water sources, thermal mineral water
from the ground have been used to treat
diverse kinds of diseases since the
invention of spa therapy over 1,000 years
ago. Nonetheless, thanks to the cutting-
edge technology, the dwellings without a
natural thermal water source can also
offer a healthy spa treatment. For
instance, some herbal ingredients and
mineral extracts can be mixed into hot
water to help fully relax the body (Chen,
2007).
As well, customers can soak into the
mineral water at a nature, rustic setting
directly such as lake and river for spa
settings. However, spa clients receive the
treatment at modern amenities such as
pools and bathtubs in which the
sanitation issue can be prudently
scrutinized (Chen, 2007).

UTCC International Journal of Business and Economics
UTTC IJBE | 117
It is reported that 35% of UK residents
visit a spa in a year while 21% of
Americans do so. The most popular type
of spa in the UK is resort/hotel spa
though, in the USA, day spas are more
preponderant. With an exceptional
growth, the wellness market has recently
increased the attention by tourism
stakeholders including government,
business and hosting community. To
elaborate, the Finnish Government has
invigorated their war veterans to join a
welfare program in which the veterans
can get a subsidy from the government
for healing their illnesses in some
wellness amenities, such as a spa resort.
Even for the veterans who live overseas,
they could travel back to those amenities
in Finland for 10 days in a year with a full
subsidy of all the cost of travels and
treatments. Moreover, Finland’s
Sickness Insurance Act has an emphasis
on preventive treatment at local facilities,
such as a spa center that helps encourage
the wellness business. On the top that, in
Switzerland, many spas incorporate a
rehabilitation department in which the
visitors can get treatments from certified
nurses and doctors and, in some cases,
the visitors can also enjoy five-star meals
(Chen, 2007).
In the United States, the wellness
destinations can accommodate the
pregnants. It is reported diverse locations
accumulation maternity services; in this
case, even pregnant persons are able to
safely enjoy spa treatment. The potential
solutions are using hydraulic treatment
tables and providing door-to-door
services because the pregnants are least
likely to travel during a certain stage of
pregnancy. Some retreats have coped
with the need of single-parents and take
care of child care service while the clients
are getting the treatments (Chen, 2007).
Looking at an even higher standard,
Switzerland has founded even greater
standards of wellness delivery for the
rich and famous for decades. According
to the new standards, wellness service’s
contribution to the quality of life is not
only narrowed to the tourists, but also
extends to the host community. A recent
example of the integrated design of a
treatment center in Lake Geneva has
displayed the sensitivity of wellness
provider to nature environment and local
heritage. The treatment facility prudently
matches with a quaint scene of a 19th
century design attached to a modern
medical center. It implies that the
wellness sector may follow the essence
of sustainable living. As the trend
predominates, it can be intriguing to
expect if the future development of
wellness business will uphold better
quality of life from the angles of the
tourists as well as the host communities
(Chen, 2007).
Wellness business is estimated around
more than 10 billion Baht worth and
Thailand is ranked the 16th best
spa/massage in the world and the 5th in
Asia. That makes Thailand both medical
tourism for foreigners and health and
beauty market for Thais. At Present,
domestic spa and massage market is
estimated at 35 billion Baht with 8%
growth rate with continuing leap growth
in the tourism segment as there is still
high demand for therapy and relaxation
in the market. Spa/massage market takes
23% of overall beauty market while
medical service market is estimate as
high as 100 thousand million Baht, which
is 75% of the market (Marketeer, 2021).
The medical and wellness business surely
benefits from these public policies.
Nevertheless, with all the strategies laid

UTCC International Journal of Business and Economics
UTTC IJBE | 118
out, they have not incorporated pandemic
into the 20-year strategic plan. With
COVID-19 breaking out in the country,
Thailand has now faced huge challenges
that it needs to overthrow. The
government as well as relevant actors
must redesign the strategies to cope with
reality. Therefore, this research suggests
that the study of the medical and wellness
business support from the government
and relevant actors, both during and after
the COVID-19 pandemic phase, should
be further scrutinized to make the story
of Thailand 4.0, value-based economy,
model entirely complete.
As the title of this paper is “COVID-19
and Its Effects on Wellness Business
SMEs in Bangkok”, I have used
following theories to frame the research:
Social network theory
Social network theory assumes that
people tend to think and behave similarly
because they are connected. That is, the
theory scrutinizes collections of ties and
linkages among a defined group of actors
(individuals, groups, or organizations).
Moreover, the connection as a whole can
be used to interpret the social behavior of
the actors involved. The actors can also
be connected, or divided through the use
of the network. The theory also makes
analysis of a range of organizational
phenomena at both the micro level
(leadership, teams, power, trust,
turnover, etc.) and the macro level
(interfirm relations, alliances, network
governance, etc.) (Miles, 2012).
The theory should be applied into the
research proposal in order to explain how
wellness businesses as a group utilize
their connections to manipulate (if there
is any proof) the policy related to
wellness business issues in Thailand. As
well, the theory helps describe how
organizational phenomena at both macro
and micro levels should be put into
analysis.
Social capital theory
Social capital theory’s main point is that
people receive both tangible and
intangible resources at the individual,
group, and organizational levels through
social interactions and connections. A
key focus in the theory is that social
capital resources are embedded within,
available through, and derived from
social networks of interconnected people,
groups, or nations. That is why,
according to this theory, to build strong
families and local communities is crucial.
The term “social capital” is described as
“goodwill, fellowship, mutual sympathy
and social intercourse among a group of
individuals and families who make up a
social unit, the rural community” (Miles,
2012).
Also, the social capital is different from
other kinds of capitals because it is based
on position or location of the member
within the member’s network of social l
relations. Adler and Kwon have
described 3 dimensions of social
structure which are 1) marker relations
which refer to the monetary or bartering
exchange of goods and services; 2)
hierarchical relations which refers to the
exchange of material and security for
obedience to authority; and 3) social
relations which refer to tacit,
symmetrical, ongoing mutual exchanges
of gifts and favors (Miles, 2012).
The theory should be applied to the
research in a way to explain how people,
both in wellness business and policy
makers, use their social capital or, in
other words, “trust” to facilitate the

UTCC International Journal of Business and Economics
UTTC IJBE | 119
crafting of policies and measures related
to wellness business.
Diffusion of innovations theory
Diffusion of innovation theory examines
the process through which information is
communicated to people or organizations
over time that can lead to the use of an
innovation. An innovation can be a good,
service, practice, or idea that people
perceived to be new. The newness does
not depend so much on the creation date
of the item, but refers more to the
newness of the application for helping
address a need or for solving some sort of
problem. Newness also refers to people
having a positive reaction to using the
item themselves; they may have known
about the item before, but may have
never thought about using it themselves
(Miles, 2012).
The arc of innovations can be explained
by its adoption rate. Innovations tend to
be adopted more quickly when they 1)
have a relative advantage over existing
methods; 2) are compatible with existing
value, past experience, and current needs;
3) are simple to understand; 4) can be
tried out or played with by potential
adopters; and 5) are observable, in the
manner that the adopters can see the
results for themselves (Miles, 2012).
Apart from that, the word “diffusion”
means that it is a process though which
an innovation is communicated, or
shared, through communication channels
over time to people in a social system.
According to this theory, innovations are
diffused through organizations in 5
stages: 1) agenda setting; 2) matching; 3)
redefining or restructuring; 4) clarifying;
and 5) routinizing. At each stage, there
are specific events, actions, and decisions
that occur, and later stage cannot take
place until the previous stages have been
completed (Miles, 2012).
The research uses this theory to
rationalize how wellness businesses and
policy makers follow these 5 stages of
innovation diffusion. The stage that the
researcher is most intrigued by is the first
step “agenda setting” as the researcher
believes that to tune the military-run
government to look into wellness-
business related policies is not easy.
Therefore, the researcher would like to
acquire more knowledge on how these
agenda are put into the agenda and
crafted into policies and measures.
Resource-based theory
Resource-based theory observes
performance differences of organizations
based on their resources. It makes 2 main
assumptions: 1) Organizations within an
industry may differ in their resources,
and 2) these resources may not be
perfectly mobile across organizations, so
organizational differences in resources
can be permanent. The theory also
explains how organizations maintain
unique and sustainable positions in
competitive environments because it
highlights efficiency-based differences.
Therefore, the organizations’ market
power, collusion, strategic behaviors can
be various (Miles, 2012).
The main idea of this theory is that the
organizations in the same industry
compete against each other on the basis
of their resources and capabilities. The
theory also concludes that organizational
decisions to select and accumulate
resources are economically rational and
subject to limited information, biases and
prejudices, and causal opacity/ambiguity.
The causal ambiguity means it is not
known exactly how a resource leads to

UTCC International Journal of Business and Economics
UTTC IJBE | 120
outstanding performance for a certain
organization (Miles, 2012).
The theory will be used in the thesis as
one of the theories clarifying the
wellness/health-related organizations’
use of their resources. That is,
organizations in the same industry may
not have same resources and are subject
to limited information regarding
wellness-related policies they have
acquired. Therefore, the researcher
assumes that the organizations, though in
the same industry, have (somewhat)
different access to the resources and
different and limited information
regarding the policies. As a result, the
wellness-related policies may differently
affect/benefit the organizations.
Image theory
Image theory believes that an individual
who decides in the context of a
relationship or organization with a
presumption that the decision may
remain or may later be changed. The
theory is an alternative to traditional
decision-making theory because it is a
psychological theory of decision making
(Miles, 2012).
Apart from that, image theory sees
decisions as being made intuitively and
automatically while traditional decision-
making theory believes that the decisions
are being made deliberately and
systematically. Hence, to image theory,
decision makers often make decisions
using simple, easy, nonanalytic, and
rapid processes for each decision, even
when the decision has considerable
significance to the decision makers
(Miles, 2012).
Moreover, the image theory has 3 types
of image: value image; trajectory image;
and strategic image. The value image is
the decision makers’ principles (morals,
ethics, values, ideals, standards of
equality, justice, loyalty, goodness, etc.),
combined with their moral, civic, and
religious beliefs. The value image
portrays the “self-evident truths” for
which the decision makers believe.
Therefore, it helps the decision makers
foresee which goals are worthy for them
to pursuit and which is not (Miles, 2012).
The trajectory image projects the future
state that the decision makers desire to
achieve; or the agenda that the decision
makers follow. The last image is the
strategic image that includes plans,
strategies, and tactics that have been
adopted in order to achieve the trajectory
image (Miles, 2012).
This research will clarify all the three
types of image, namely the value image;
the trajectory image; and the strategic
image, that the decision makers, both in
the side of policy-making processes and
wellness-related organizations, acquire.
As well, the research assumes that the
decision makers make decision regarding
wellness policies using simple, easy,
nonanalytic, and rapid processes, rather
than making decisions deliberately and
systematically.
COVID-19 and its effects on
wellness SMEs in Bangkok
Looking to the case of COVID-19
pandemic and how it quickly and fatally
widespread throughout the country,
business sector, especially tourism and
wellness industry are heavily affected.
The scope of this research focuses on
wellness SMEs in Bangkok, to be
precise, wellness and spa business in
Bangkok. To elaborate that, Bangkok
Metropolitan Administration has issued
UTCC International Journal of Business and Economics
UTTC IJBE | 121
several announcements that require
wellness and spa salons to close during
certain period of time where each time
the businesses are closed for weeks and
months (Bangkok Metropolitan
Administration, 2020). The researchers
have interviews 25 key informants:
wellness and spa entrepreneurs; wellness
and spa employees; BMA officials; and
Ministry of Health officials. The main
finding is that the state ineffectively
implements risk management measures
makes the wellness SMEs in Bangkok
suffer the effects of the COVID-19.
Therefore, this thesis will be conducted
by using both documentary and field
research. It examines written documents
and carries out participatory field
research. Regarding documentary
research, the thesis thoroughly examines
both published and unpublished
documents in relation to the wellness-
related policies during 2014 - 2021. As
no research has systematically studied
the wellness-related policies in the new
political environment produced by the
reform agenda and the military
administration under General Prayut
Chan-o-cha, the study aims to fill the gap
by concentrating on the policies after the
2014 coup d’état and consequent
introduction of the political reform
agenda.
The empirical content is mainly based on
field research in Bangkok, Thailand. The
research will be conducted using
qualitative methods with a variety of
qualitative techniques. The mechanisms
of inquiry include semi-structured in-
depth interview, participant and non-
participant observation, and the
recording of oral histories. The research
uses a triangulation approach which
utilizes more than one research technique
to study the same incidents in order to
validate information as well as to cross-
check different sources and clarify
conflicting information.
To obtain in-depth information and
record the undocumented stories of the
wellness-related policies and actors, an
ethnographic approach will be used. This
method is used because it allows the
actors (both in policy making side and
wellness-related organization side) to
fully express themselves, reveal the
experiences of their struggles and
describe their everyday practices and the
way they see the world. Semi-structured
in-depth interviews and focus group
discussions will also be used to acquire
information and opinions of members of
wellness-related organizations, such as
spas, wellness centres, hospitals, etc., as
well as that of policy makers.
Data analysis of existing information,
such as news clippings, and unpublished
documents of the government and
official organisations will also be used to
provide supplementary information to
substantiate and fill any gaps in the
findings. The supplementary information
includes internal documents and minutes
of meetings of the government and
ministry of health, unpublished
documents and first-hand information
gathered from the special committees
dealing with the wellness-related
organizations. During the fieldwork, the
researcher expects that the idea of
deliberative participation in that it
intends to involve those who are the
subject of the research in the process of
researching and finding answers.
The table below describes the
characteristics of the selected samples
that are interviewed and studies in this
research.
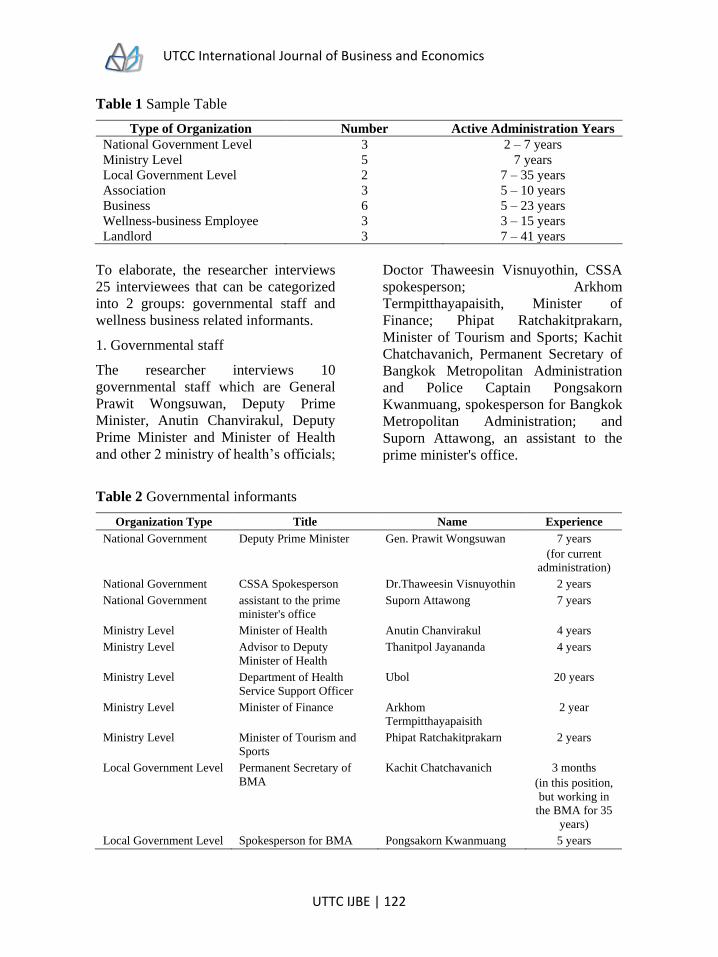
UTCC International Journal of Business and Economics
UTTC IJBE | 122
Table 1 Sample Table
Type of Organization Number Active Administration Years
National Government Level 3 2 – 7 years
Ministry Level 5 7 years
Local Government Level 2 7 – 35 years
Association 3 5 – 10 years
Business 6 5 – 23 years
Wellness-business Employee 3 3 – 15 years
Landlord 3 7 – 41 years
To elaborate, the researcher interviews
25 interviewees that can be categorized
into 2 groups: governmental staff and
wellness business related informants.
1. Governmental staff
The researcher interviews 10
governmental staff which are General
Prawit Wongsuwan, Deputy Prime
Minister, Anutin Chanvirakul, Deputy
Prime Minister and Minister of Health
and other 2 ministry of health’s officials;
Doctor Thaweesin Visnuyothin, CSSA
spokesperson; Arkhom
Termpitthayapaisith, Minister of
Finance; Phipat Ratchakitprakarn,
Minister of Tourism and Sports; Kachit
Chatchavanich, Permanent Secretary of
Bangkok Metropolitan Administration
and Police Captain Pongsakorn
Kwanmuang, spokesperson for Bangkok
Metropolitan Administration; and
Suporn Attawong, an assistant to the
prime minister's office.
Table 2 Governmental informants
Organization Type Title Name Experience
National Government Deputy Prime Minister Gen. Prawit Wongsuwan 7 years
(for current
administration)
National Government CSSA Spokesperson Dr.Thaweesin Visnuyothin 2 years
National Government assistant to the prime
minister's office
Suporn Attawong 7 years
Ministry Level Minister of Health Anutin Chanvirakul 4 years
Ministry Level Advisor to Deputy
Minister of Health
Thanitpol Jayananda 4 years
Ministry Level Department of Health
Service Support Officer
Ubol 20 years
Ministry Level Minister of Finance Arkhom
Termpitthayapaisith
2 year
Ministry Level Minister of Tourism and
Sports
Phipat Ratchakitprakarn 2 years
Local Government Level Permanent Secretary of
BMA
Kachit Chatchavanich 3 months
(in this position,
but working in
the BMA for 35
years)
Local Government Level Spokesperson for BMA Pongsakorn Kwanmuang 5 years

UTCC International Journal of Business and Economics
UTTC IJBE | 123
2. Wellness business related informants:
The researcher interviews 15 wellness
business related informants which are 4
wellness and spa entrepreneurs; 3
wellness business association
representatives; 3 beauty assistants; 1
medical wellness doctor; 3 landlords; and
a Chief Executive Officer of an insurance
company.
Table 3 Wellness-related informants
Business Type Title Name Experience
Spa Manager of Gaya Health and
Beauty Spa
Vilai 23 years
Spa Owner of Health Land Spa Pitak Lapprathana 22 years
Spa Owner of Blink Spa Poom 20 years
Spa Manager of Away spa Bee 3 years
Wellness Clinic Director of Smith Prive
Aesthetic Clinic
Smith Arayaskul 18 years
Association Director of federation of Thai
spa and wellness association
Chavanat Sinthukiow 18 years
Association Director of Charawi Association
for the Conservation of Thai
Massage
Pitak Yotha 3 years
Association Member of Charawi Association
for the Conservation of Thai
Massage
Monlapas Thaichareon 13 years
Counter Brand Sisley Brand’s Beauty Assistant Wan 23 years
Counter Brand Sisley Brand’s Therapist Noon 19 years
Counter Brand Christian Dior Brand’s Beauty
Assistant
Will 8 years
Landlord President of The 1 Central
Limited
Ton Chirathiwat 18 years
Landlord Managing director of the
marketing department of CPN
Natthakit
Tangpoolsinthana
35 years
Landlord A landlord of a spa located on
Sathorn Road
Tee 7 years
Insurance
Company
CEO of AIA Thailand Krit Chantanotoke 4 years
The researcher practices “snowball
sampling” and a “non-random sampling”
methods in this study as the nature of the
data sources and frequent difficulty in
getting subjects to volunteer information.
Graduate students attempting to contact
with high-rank officials and
governmental agencies are often refused.
Therefore, the high-rank officials and
governmental officers who are willing to
volunteer information are used as
samples. The criteria include: working in
the relevant governmental agencies;
having at least 2-year experience in the
office (given that the COVID-19 has hit
the country 2 years ago). For the wellness
business related informants, the criteria
include: owning a business for at least 10
years; or working in the field of wellness
business for at least 3 years: the business’
UTCC International Journal of Business and Economics
UTTC IJBE | 124
products or services are available in
domestic and/or in global markets; and
the brand is well-recognized
domestically and/or internationally.
For the governmental informants, the
researcher uses person-to-person in-
depth interviews with each informant to
gain knowledge on how the
governmental organizations at various
levels plan and tackle the COVID-19
pandemic
For the wellness-business related
informants, the research uses the
qualitative method which the researcher
has conducted semi-structure in-depth
interviews and focus groups with the
mentioned informants to acquire deep
knowledge and understanding of
wellness business and how the COVID-
19 has affected the business. As well, the
researcher aims to see if the relevant
governmental organizations have issues
suitable policies and measures to relieve
the hardship caused by the pandemic.
There are 3 main topics that have
surfaced during the interviews, namely
crisis management; compensation; and
the future of the wellness business. The
arguments are as followings:
3. Crisis management
It is crystal clear from the interviews that
both wellness-related informants and
governmental informants are on the same
page that there are still room for
improvement for COVID-19 crisis
management. For example,
miscommunications of the CSSA and
BMA can be managed by better
cooperation between the 2 parties. That
will prevent misunderstandings for the
public. However, the governmental
informants express that this is the best
they can do for the given circumstances
and they hope that the situations will get
better once the pandemic is over because
they impose new-and-stricter health
standard for the wellness business to act
upon.
Therefore, the wellness-business related
informants feel that while the
government has not managed the crisis
well, it also pushes all the burden for the
public to absorb. For example, the
wellness business needs to practice new
health standard and cover all the expense
by itself because the government does
not give hand in providing needed
resources, such as ATK test kits, masks,
etc.
4. Compensation
The compensation topic is also crystal
clear for both groups of informants that
there is insufficient compensation for
wellness business affected by the
COVID-19 pandemic. That is, the 5,000
Baht compensation for the registered
therapists/masseurs is much lower than
the high living expense they have
nationwide. As well, there are plenty of
unregistered therapists/masseurs who
have received no compensation at all.
Not to mention that the wellness business
owners also have not received
whatsoever compensation for the loss
due to the pandemic though they are
those who fall the hardest in this crisis.
Nonetheless, the governmental
informants believe that the situations will
get better as all relevant organizations are
working together to come up with better
compensation schemes for the wellness
business as well as other affected
businesses.
5. The future of wellness business
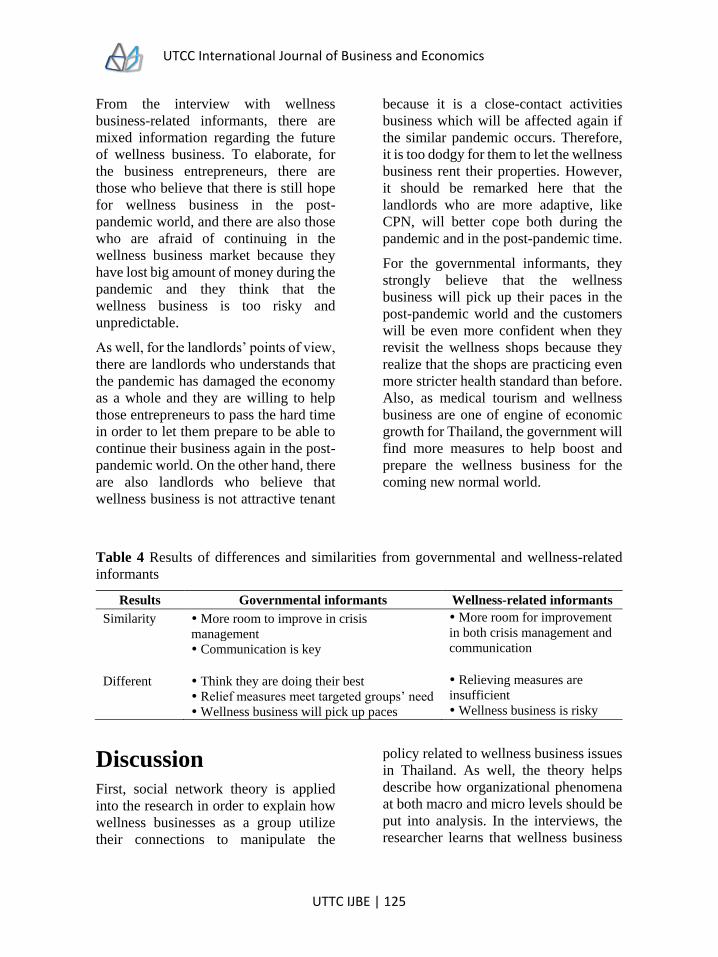
UTCC International Journal of Business and Economics
UTTC IJBE | 125
From the interview with wellness
business-related informants, there are
mixed information regarding the future
of wellness business. To elaborate, for
the business entrepreneurs, there are
those who believe that there is still hope
for wellness business in the post-
pandemic world, and there are also those
who are afraid of continuing in the
wellness business market because they
have lost big amount of money during the
pandemic and they think that the
wellness business is too risky and
unpredictable.
As well, for the landlords’ points of view,
there are landlords who understands that
the pandemic has damaged the economy
as a whole and they are willing to help
those entrepreneurs to pass the hard time
in order to let them prepare to be able to
continue their business again in the post-
pandemic world. On the other hand, there
are also landlords who believe that
wellness business is not attractive tenant
because it is a close-contact activities
business which will be affected again if
the similar pandemic occurs. Therefore,
it is too dodgy for them to let the wellness
business rent their properties. However,
it should be remarked here that the
landlords who are more adaptive, like
CPN, will better cope both during the
pandemic and in the post-pandemic time.
For the governmental informants, they
strongly believe that the wellness
business will pick up their paces in the
post-pandemic world and the customers
will be even more confident when they
revisit the wellness shops because they
realize that the shops are practicing even
more stricter health standard than before.
Also, as medical tourism and wellness
business are one of engine of economic
growth for Thailand, the government will
find more measures to help boost and
prepare the wellness business for the
coming new normal world.
Table 4 Results of differences and similarities from governmental and wellness-related
informants
Results Governmental informants Wellness-related informants
Similarity More room to improve in crisis
management
Communication is key
More room for improvement
in both crisis management and
communication
Different Think they are doing their best
Relief measures meet targeted groups’ need
Wellness business will pick up paces
Relieving measures are
insufficient
Wellness business is risky
Discussion First, social network theory is applied
into the research in order to explain how
wellness businesses as a group utilize
their connections to manipulate the
policy related to wellness business issues
in Thailand. As well, the theory helps
describe how organizational phenomena
at both macro and micro levels should be
put into analysis. In the interviews, the
researcher learns that wellness business
UTCC International Journal of Business and Economics
UTTC IJBE | 126
entrepreneurs and registered therapists
have gathered as an association to
negotiate policies and measures that
affect them. As well, they have pushed
the authority to get the policies
accordingly to their preference and have
received many successful milestones,
such as vaccine quotas and SHA+
certification.
Second, social capital theory is applied to
the research in a way to explain how
people, both in wellness business and
policy makers, use their social capital or,
in other words, “trust” to facilitate the
crafting of policies and measures related
to wellness business. To elaborate, all of
the authority, in this term, is defined as
the Thai government (mainly Ministry of
Health and Ministry of Tourism and
Sports), the Tourism Authority of
Thailand, the Bangkok Metropolitan
Administration, need to closely work
hand in hand in order to make the new
normal lifestyle work. As well, the
wellness business entrepreneurs and
therapists need to trust both each other
and the authority to cope with the
COVID-19 pandemic situations as well
as to assure that the business will be able
to get through this harsh time and be able
to get through the state of resilience and
thrive again after the crisis have passed.
Third, resource-based theory assumes
that organizations in the same industry
may not have same resources and are
subject to limited information regarding
wellness-related policies they have
acquired. After conducting the research,
the researcher believes that the
organizations have different accesses to
the resources and different and limited
information regarding the policies. As a
result, the wellness-related policies
differently affect the organizations. To
clarify, the federation of Thai spa and
wellness association is able to negotiate
policies that affect their members’
conditions because they are united for
communicating with authority to achieve
what they think best for their members
while other wellness businesses that are
not the part of the association are left
alone trying hard to survive during the
crisis.
Last, neo-authoritarian developmental
State theory play vital roles in this
research as the state is micro-managing
the COVID-19 crisis at every level and
that leads to miscommunication and
misunderstanding both among the
authorities and for the public. That is
because the state still fails in tackling the
problems and recovering the affected
parties, especially wellness business
SMEs who are first to crash and last to
bounce.
From the interviews, it occurs that the
policymakers still do not fully understand
the nature of wellness business which is
close-contact activity. That leads to
mismatch policy making that fails to
solve the actual problems and propose
suitable recovery scheme for such
business. Also, the researcher believe
that it is important for those who would
like to study this topic that main source
of income of wellness business SMEs in
Bangkok is from foreign tourists,
especially Chinese. Therefore, the
business has certainly crashed once the
government decided to prohibit inbound
tourism.
In this research, it is proven that, in order
to sustainably survive, the wellness
business SMEs must be more versatile,
both in term of providing service and
building products under their own
brands, whether they are skin cares,
UTCC International Journal of Business and Economics
UTTC IJBE | 127
herbal balm, or food. All in all, wellness
business is still the answer in the long run
because there are still customers’ need to
take care of themselves. However, the
business needs to adapt to be more
universal and to position themselves
beyond providing service and other
close-contact activities.
As well, to compare this research with
relevant studies, the researcher finds that
there are gaps that this research has come
to fulfill. That is, in this research, various
management theories have been put into
test if they are applicable and, more
importantly, still relevant to the real
world. The researcher finds that the
relevant studies that have been done
before this research have not well
proposed the crisis management and
crisis relieve plans for wellness business,
especially in the Thailand’s context. To
elaborate, the crisis management plans in
the past have been crafted for any
businesses, not particularly wellness-
related business. Though the researcher
is able to find one crisis management
scheme that is purposely for the
wellness-related businesses, there are
still many intervening factors that have
surfaced in the research. Therefore, there
is no “one-size-fits-all” crisis
management plan for every wellness-
related business. Everyone must learn
from their experience and work from
that.
Apart from that, since the researcher has
interviewed several key informants who
are either engineers in policy making
process, or wellness-related practitioners,
it is certain that this research has
proposed a holistic point of view of the
COVID-19 crisis management of
wellness business in term of how the
policy makers have responded to the
crisis and how the entrepreneurs and
relevant parts have adapted during the
crisis.
Finally, it is essentially intriguing to
explore how those key informants reflect
on the crisis management plan of the
governments as well as their own crisis
management plans, and to look forward
for their expected post-pandemic world’s
projection.
Limitation and further
study
The main limitation of this research is the
COVID-19 pandemic itself because it has
prevented the researcher to have face-to-
face conversations with many key
informants and the researcher believes
that to have face-to-face and in-depth
interviews in flesh is much juicier and
exciting than to hold those via internet
applications and phone calls. Also, there
might still be some information that the
informants have to omit because they
might fear that it could leak to unwanted
groups.
Apart from that, as the research is mainly
conducted in Bangkok and the city center
part of the province, the information and
the results explained in this research may
not comprehensively display that of other
provinces and the whole country.
For the further study, the researcher
highly recommends those who are
interested in doing research on this topic
to dive deeper in many aspects of
wellness business as many kinds of them
are different and, therefore, there are still
more interesting knowledge lie beneath
what is presented in this research. Also,
to expand the information horizon from

UTCC International Journal of Business and Economics
UTTC IJBE | 128
merely Bangkok and city center to other
provinces in the country as well as the
country as a whole will definitely give
the more complete picture to the research
on wellness business and crisis
management policy in Thailand. As well,
it will be interesting to evaluate how the
crisis has affected the wellness business
in the long run, and to learn from the
wellness-related businesses who have
survived this pandemic to see what they
have done to make it.
References
A. (2021, May 3). Miss. (S. Chundasutathanakul, Interviewer)
Alonso, A., Kok, S. K., & Bressan, A. (2020, October). COVID-19, aftermath, impacts,
and hospitality firms: An international perspective. Retrieved from International
Journal of Hospitality Management.
Bangkok Biz News. (2021). “Massage establishment entrepreneurs” filed a lawsuit
against the government to the state civil court for 200 million baht - pointed out
that the lockdown has no remedy. Retrieved from Bangkok Biz News:
https://www.bangkokbiznews.com/ news/955119
Bangkok Metropolitan Administration. (2020, April 17). Announcement of the Bangkok
Metropolitan Administration (BMA) Subject: Order of Temporary Closure of
Premises (No. 25). Retrieved from Bangkok Metropolitan Administration:
www.prbangkok
Bangkok Post. (2021, June 14). Communication Breakdown. Retrieved from Bangkok
Post: https://www.bangkokpost.com/tech/2131975/ communication-breakdown
Bangkok Post Newspaper. (2015). Decentralise, or Pracharath Bound to Fail. Retrieved
March 10, 2021, from http://www.bangkokpost.com/opinion/ opinion/703540/
decentralise-or-pracharath-bound-to-fail
Bardes, B. A., Shelley, M. C., & Schmidt, S. W. (2010). The Constitution. In B. S. Bardes,
M. C. Shelley, & S. W. Schmidt, American Government and Politics Today: The
Essentials 2009 - 2010 Edition (pp. 28 - 77). Boston: Wadsworth.
BBC Thai. (2021). Corona virus: The government will announce the Emergency Decree
to block Covid-19 this Thursday . Retrieved from BBC Thai: https://www.bbc.
com/thai/thailand-52014435
BBC Thai. (2021). Covid-19: Chronology, Maps, Infographics, Number of infections and
deaths in Thailand and around the world. Retrieved from BBC Thai:
https://www.bbc.com/thai/thailand-52090088
BBC Thai. (2021). Covid-19: The Cabinet knocks on measures to remedy employers and
employees, restaurant-construction and other businesses in 6 provinces.
Retrieved from BBC Thai: https://www. bbc.com/thai/thailand-57648246

UTCC International Journal of Business and Economics
UTTC IJBE | 129
BBC Thai. (2021). Covid-19: The CCSA of Thailand loosen lockdown measures for movie
theaters-fitness-spa started from 1 October together with extending time for mall
opening - reducing the curfew time . Retrieved from BBC Thai:
https://www.bbc.com/thai/thailand-58703184
Chen, J. S. (2007, July 5). WELLNESS TOURISM: MEASURING CONSUMERS’ QUALITY OF
LIFE . Retrieved from Proceedings of the First Hospitality and Leisure: Business
Advances and Applied Research Conference: https://d1wqtxts1xzle7.
cloudfront.net/30787241/Proceedings-with-cover-page-v2.pdf?Expires=164076
5132&Signature=fQEIFZadEcNzaiAn04QjOW2DofbLNtGRw8Okpr2JFMtOd
SoBmta40bNCdWKqnbpsx83KD2V9CCpaIEOdWINleyRlgWJkWkiQt6x2Kd
vHZ~t7Ohr7OZ2UanbmQBZuoM9X~4zULWmpo7Qlfpfm
D. (2021, May 10). Mister. (S. Chundasutathanakul, Interviewer)
Dagnino, G. B. (2012). handbook of Research on Competitive Strategy. Northampton:
Edward Elgar Publishing, Inc.
Department of Health Service Support, Ministry of Public Health. (2020). The preparation
guidelines for opening spa, health massage and beauty massage business to
promote health tourism during the coronavirus disease 2019 (COVID-19)
epidemic. Nonthaburi: Department of Health Service Support, Ministry of Public
Health.
Edwards, J. (2014). Mastering Strategic Management. Victoria: BC Campus. Retrieved
from Mastering Strategic Management - 1st Canadian Edition:
https://opentextbc.ca/strategicmanagement/chapter/resource-based-theory/
Elbe, S. (2010). Pandemic Security. In J. P. Burgess, The Routledge Handbook of New
Security Studies (pp. 163 - 172). New York: Routledge.
Gilpin, D. R., & Murphy, P. J. (2008). Crisis Management in a Complex World. London:
Oxford University Press.
Glaesser, D. (2003). Crisis Management in the Tourism Industry. Oxford: Butterworth-
Heinemann.
Global Wellness Institute. (2020, March 27). 12 Crisis Managemen t Steps - Coronavirus.
Retrieved from Global Wellness Institute: https://globalwellnessinstitute.org/wp-
content/uploads/2020/05/European-Spa_Spa-Crisis-Management-Plan.pdf
Hill, M. (2005). The Public Policy Process (Fourth Edition). Essex: Pearson Education
Limited.
Kannan, R. (2020, October). GLOBAL COVID-19 PANDEMIC AND ITS IMPACT ON HOTEL
INDUSTRY IN GATHERING MOMENTUM OF TOURISTS IN INDIA - A
PERSPECTIVE OUTLOOK. Retrieved from Mukt Shabd Journal:
http://shabdbooks.com/gallery/63-oct2020.pdf
Khaosod English. (2021, April 24). SPAS, GYMS, CINEMAS AMONG VENUES TO BE SHUT
IN BANGKOK. Retrieved from Khaosod English: https://www.khaosodenglish.
UTCC International Journal of Business and Economics
UTTC IJBE | 130
com/news/crimecourtscalamity/2021/04/24/spas-gyms-cinemas-among-venues-
to-be-shut-in-bangkok/
Kuadee, W., & Sookkhong, P. (2021). What is SHA? Knowing your safety badge before
heading our for a sip this weekend. Retrieved from The Standard:
https://thestandard.co/about-sha-symbol/
Lai, E. K., & Wong, J. W. (2020, August 10). Comparing crisis management practices in
the hotel industry between initial and pandemic stages of COVID-19. Retrieved
from Emerald: https://www.emerald.com/insight/ content/doi/10.1108/IJCHM-
04-2020-0325/full/pdf?title=comparing-crisis-management-practices-in-the-
hotel-industry-between-initial-and-pandemic-stages-of-covid-19
Liu, w., Sidhu, A., Beacom, A. M., & Valente, T. W. (2017, March). Social Network
Theory. Retrieved from Research Gate: https://www. researchgate.net/
publication/316250457
Market Business News. (2021). Customer - Definition and Meaning. Retrieved from
Market Business News: https://marketbusinessnews.com/ financial-glossary/
customer-definition-meaning/
Marketeer. (2021). Spa-Massage: 35-Billion-Baht Market Not Without Rivals. Retrieved
from Marketeer Online: https://marketeeronline.co/archives/ 138860
Micklethwait, J., & Wooldridge, A. (2014). The Fourth Revolution: The Global Race to
Reinvent the State. London: Allen Lane.
Milana, E., & Maldaon, I. (2015, February 5). Social Capital: A Comprehensive Overview
at Organizational Context. Retrieved from Periodica Polytechnica Social and
Management Sciences: https://core.ac.uk/ download/pdf/236628291.pdf
Miles, J. A. (2012). Management and Organizatin Theory: A Jossey-Bass Reader (First
Edition ed.). San Francisco: Jossey-Bass A Wiley Imprint.
Ministry of Industry. (2016, October 1). Thailand Indsutry Development Strategy 4.0.
Retrieved May 10, 2021, from http://www.oie.go.th/assets/portals/1/
fileups/2/files/Industrial%20Master%20Plan/thailandindustrialdevelopmentstrat
egy4.0.pdf
N. (2021, April 27). Miss. (S. Chundasutathanakul, Interviewer)
O. (2021, May 17). Miss. (S. Chundasutathanakul, Interviewer)
Office of the Permanent Secretary, Ministry of Finance. (2020). The measures to support
and remedy the impact of the coronavirus (COVID-19) on Thai economy, both
directly and indirectly (Phase2). Pp 1 - 5. Bangkok: Ministry of Finance.
Owen, N. G. (2014). Routledge Handbook of Southeast Asian History. New York:
Routledge.
UTCC International Journal of Business and Economics
UTTC IJBE | 131
Public Administration. (2021, May 27). The Five Stages of the Policy Making Cycle.
Retrieved from Point Park University Online: https://online. pointpark.edu/
public-administration/policy-making-cycle/
Puey Ungphakorn Institute for Economic Research. (2021). Spa and Thai Massage
Industry. Retrieved from Puey Ungphakorn Institute for Economic Research:
https://www.pier.or.th/en/forums/2020/12/spa-and-thai-massage/
Speing News. (2021). Compare Lockdown 2020 VS Lock Down 2021 Without Annoucing
the Word "Lockdown". Retrieved from Spring News: https://www.springnews.
co.th/news/815048
Thailand Board of Investment. (2018, April 1). Thailand Investment Review. Retrieved
May 20, 2021, from http://www.boi.go.th/upload/content/ TIR_Newsletter_
AW_FINAL_24052018_5b0fc23b953f7.pdf
Thansetakij. (2021). The remedy of massage-spa business, exemption of annual fees for 1-
2 years. Retrieved from Thansetakij: https://www.thansettakij.com/economy/
502727
The Royal Thai Government. (2014, July 11). The NCPO Chief Revealed NCPO Vision on
9 Strategies. Twelve National Core Values Are Set for Thai People to Instill and
Create Awareness on True Democracy. Retrieved January 19, 2021, from Royal
Thai Government: http://www. thaigov.go.th/en/news-2/item/84749-id84749.
html
Tourism Authority of Thailand. (2021). SHA Knowledge. Retrieved from Tourism
Authority of Thailand: https://www.thailandsha.com/info
Vilai. (2021, April 25). (S. Chundasutathanakul, Interviewer)
Woo-Cumings, A. (1999). The Developmental State. Ithaca: Cornell University Press.
World Health Organization. (2020, April 27). Archive WHO timeline COVID-19. Retrieved
from World Health Organization: https://www.who.int/news/ item/27-04-2020-
who-timeline---covid-19
Wu, X., Ramesh, M., Howlett, M., & Fritzen, S. (2010). Policy Evaluation. In X. Wu, M.
Ramesh, M. Howlett, & S. Fritzen, The Public Policy Primer: Managing the
Policy Process (pp. 82 - 99). New York: Routledge.
Wu, X., Ramesh, M., Howlett, M., & Fritzen, S. (2010). Public Managers and the Policy
Process. In X. Wu, M. Ramesh, M. Howlett, & S. Fritzen, The public Policy
Primer: Managing the Policy Process (pp. 1 - 11). New York: Routledge.

UTCC International Journal of Business and Economics
UTTC IJBE | 132
UTCC International Journal of Business and Economics
UTTC IJBE | 133
UTCC International Journal of Business and Economics (UTCC IJBE)
Volume 13 Number 2, August 2021
FACTORS AFFECTING THE RESIDENTIAL REAL
ESTATE PRICES IN CHINA
Jing Zhou International school of management, University of the Thai Chamber of
Commerce
126/1 Vibhavadi Rangsit Rd., Dindang, Bangkok 10400, Thailand
Abstract
From the end of the last century to now, China’s real estate developed rapidly and
became a pillar industry of the national economy. However, at the same time the
booming of real estate development has caused the housing prices in China to
continuously rise. High prices bring a series of social problems. Therefore, it is very
necessary to analyze the real estate prices in china and explore the influencing factors of
prices from the root. This study will provide the evidence for real estate companies and
control policies from theoretical and practical standpoints.
According to these standpoints, this paper chooses seven factors, namely: gross domestic
product; customer price index; monetary supply; exchange rate; interest rate; urban per
capita disposable income and land price to study the relationship between residential
real estate price and the above based on quarterly data from 2005 to 2016. This paper
uses multiple linear regression to analyze influencing factors on property prices.
According to the results; gross domestic product negatively affects the housing in some
regions, interest rates and exchange rates show the positive and negative effects in
different areas, monetary supply positively affects prices in each region. Consumer price
index, urban per capita disposable income and land price negatively influence prices in
some areas. Lastly, base on the results of this research this paper gives some suggestions
to companies and organizations.
Keywords: Residential Real Estate Prices, Eight Economic Regions, Factors
UTCC International Journal of Business and Economics
UTTC IJBE | 134
Introduction
From the beginning to now, China’s real
estate development experienced four
stages: theory breakthrough and
experimentation (1978-1991), irrational
speculation and readjustment (1992-
1995), relative stability and development
(1995-2002), housing prices increased
sharply and Macro-control (2002-now).
In 1998, the State Council issued the
abolishment of the welfare housing
system and realization of monetization. It
marked that Chinese real estate had
entered a new stage of development. In
recent years the housing prices and
residential real estate investments have
soared. Along with rapid economic
growth and a great deal of investment, the
domestic estate is going higher.
Worldwide, the property prices of most
cities are overvalued and some are on the
verge of a real estate bubble. According
to the statistics of the International
Monetary Foundation (IMF), Chinese
real estate investment accounts for Gross
Domestic Product (GDP) from 7.39% to
14.18% from 2003 to 2015. In the last
century, this proportion was only 8.7% at
the height of the Japanese real estate
bubble. The highest number was 6.5%
during the American secondary mortgage
crisis. High prices are daunting, and that
has become a hot issue for society and the
government in recent years. The State
and local government have put forward a
series of policies regarding real estate
control, including home purchase
restrictions, the launch of property tax
and increased mortgage rates, but the
effect was not obvious. However, the
housing prices directly affect the revenue
of real estate companies. Therefore, it is
necessary and important to analysis the
factors of the real estate price and explore
the root causes of housing price
increases. Based on the 11th Five-Year
Plan, China is divided into eight
economic regions: North-East China:
Heilongjiang, Jilin, Liaoning; Northern
Coast Area: Beijing, Tianjin, Hebei,
Shandong; Middle Reaches of the
Yellow River Area: Henan, Shanxi,
Shanxi, Inner Mongolia; South-West
China: Sichuan, Chongqing, Guizhou,
Guangxi, Yunnan; Middle Reaches of the
Yangtze River Area : Hunan, Hubei,
Jiangxi, Anhui; Southern Coastal Area:
Guangdong, Hainan, Fujian; Eastern
Coastal Area: Shanghai, Zhejiang,
Jiangsu; North-West China: Ningxia,
Gansu, Qinghai, Xinjiang, Xizang. This
paper studies and comparatively analyzes
the factors affecting residential real estate
prices in above eight areas.
Research of objectives
This paper researches the relationship
between the influencing factors on
residential real estate prices in each of the
eight regions. Influencing factors
include: GDP, interest rate (Five-year
benchmark lending rate), monetary
supply(M2), consumer price index (CPI),
the exchange rate(¥/$), urban per capita
disposable income and land price.
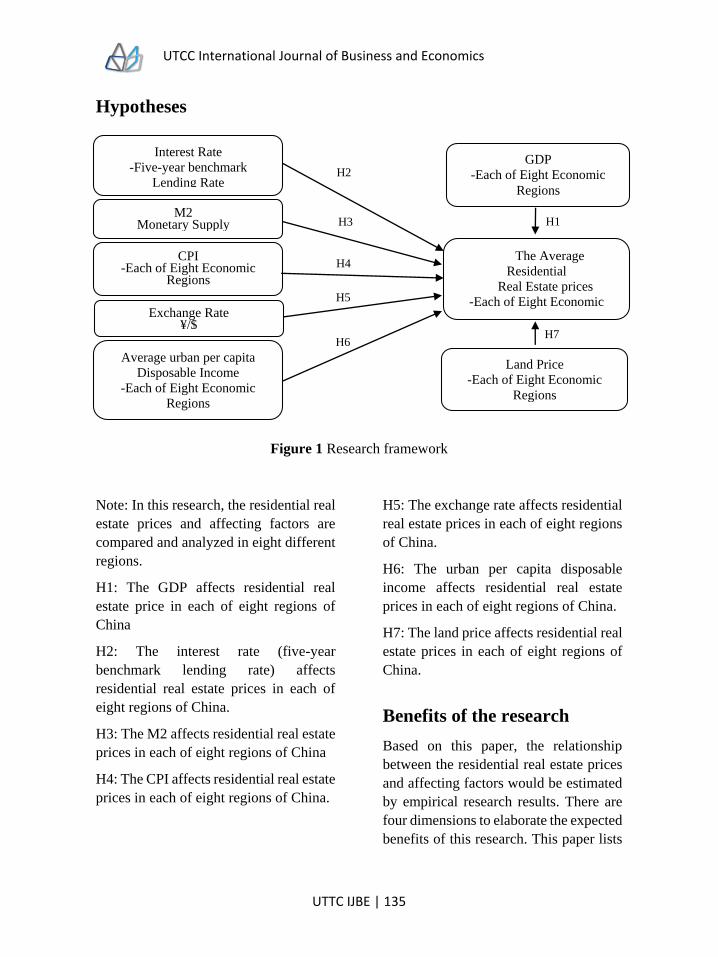
UTCC International Journal of Business and Economics
UTTC IJBE | 135
Hypotheses
Figure 1 Research framework
Note: In this research, the residential real
estate prices and affecting factors are
compared and analyzed in eight different
regions.
H1: The GDP affects residential real
estate price in each of eight regions of
China
H2: The interest rate (five-year
benchmark lending rate) affects
residential real estate prices in each of
eight regions of China.
H3: The M2 affects residential real estate
prices in each of eight regions of China
H4: The CPI affects residential real estate
prices in each of eight regions of China.
H5: The exchange rate affects residential
real estate prices in each of eight regions
of China.
H6: The urban per capita disposable
income affects residential real estate
prices in each of eight regions of China.
H7: The land price affects residential real
estate prices in each of eight regions of
China.
Benefits of the research
Based on this paper, the relationship
between the residential real estate prices
and affecting factors would be estimated
by empirical research results. There are
four dimensions to elaborate the expected
benefits of this research. This paper lists
H1
H7
H2
H6
H5
H4
H3
CPI -Each of Eight Economic
Regions
Interest Rate
-Five-year benchmark
Lending Rate
The Average
Residential
Real Estate prices
-Each of Eight Economic
Regions
Land Price
-Each of Eight Economic
Regions
Average urban per capita
Disposable Income
-Each of Eight Economic
Regions
Exchange Rate ¥/$
M2 Monetary Supply
GDP
-Each of Eight Economic
Regions
UTCC International Journal of Business and Economics
UTTC IJBE | 136
and detailed analyzes some impact
factors of the real. So the real estate
companies understand the price
formation mechanisms and make an
appropriate decision can base on the
results of this paper. They can adjust the
strategy of companies and investment
direction according to this study timely
when the conditions change. Thus the
companies can control the business risk,
protect the loss of the assets and expend
the profits. The results of this study can
provide the evidences and policy
reference of real estate regulation for
government. Finding the trend of the real
estate price is helpful for the consumers
in regards to making appropriate
decisions on purchasing houses. The
results of this paper also are expected to
make a contribution to the future
academic research related to the real
estate market.
Literature review
Li&Wang (2011) used Kalman filtering
to study the factors affecting changes in
real estate prices. They found there was a
positive relationship between GDP and
price. Li and Hu (2011) studied the
fluctuation between China's real estate
prices and macroeconomic based on
PVAR model. The finding of this
research is that GDP and housing prices
are interrelated through cause and effect.
M Belej and R Cellmer (2014) studied
the macro-economic factors: GDP,
inflation rate, unemployment rate and
interest rate, all of which influence the
real estate prices in Europe. There is a
very strong positive correlation between
prices and GDP.
Harris (1989) Proposed that nominal
interest rates are a major variable that
negatively affect housing prices, this was
deduced through the use of the
econometric analysis method. Zheng and
Guo (2011) studied the reason behind
high housing prices based on credit
channel. The results show that the
interest rate increase lead to the real
estate price rise. Englund and Ioannides
(1997) researched the property prices of
fifteen members of Organization for
Economic Cooperation and
Development. They found the interest
rates and prices have a negative
relationship. Liang, Gao and He (2006)
empirically analyzed the real estate
industry and the national economy in
China using quarterly data between
1995-2005. The results were that interest
rates and housing price were negatively
correlated.
William (2002) found that money supply
positively impacted on the housing
market through establishing vector auto
regression (VAR) models based on
monthly data. Gao (2008) studied the
transmission mechanism of Chinese
monetary policy on real estate prices
based on VAR model. The result of this
paper is that money supply increase
caused the real estate investment and
sales increase, which finally resulted in
the rise of real estate prices. Elbourne
(2008) empirically analyzed the impact
of money supply on housing prices. He
found that money supply changes have a
positive impact on housing prices. Huang
UTCC International Journal of Business and Economics
UTTC IJBE | 137
and Wang (2010) adopted empirical
analysis and used the SVAR model to
study the effect of monetary supply on
housing prices based on data in 2005-
2009. They found that monetary supply
increased which causes real estate prices
to increase sharply. Xu (2011) adopted
econometric analysis which includes Co-
integration, the error correction model
and the Grainger causality test for
impulse response to research the
transmission effect of money supply M2
and loan interest rate impact on real
estate prices. The results show that there
is a long-term stable relationship among
these three, and that money supply (M2)
influences housing prices positively.
Yu (2012) made the Grainger causality
test of CPI and housing sales price index
based on the data from January 2006 to
December 2010. He found that the
housing sales price index change would
cause CPI changes, and that the changes
of CPI did not cause price index changes,
there is a one-way causal relationship
between them. Pang and Mao (2013)
conducted research about correlation
between Chinese housing prices and CPI
by utilizing the error correction model.
They think there is a long-term
equilibrium relationship between these
two variables, and they are
interdependent. Yuan (2012) analyzed
the impact of CPI on real estate prices.
The result is that CPI’s influence on
housing price is significant. Xu and
Zhang (2012) pointed out that China's
housing prices and Inflation is different
from other countries and high CPI caused
a negative interest rate which drives the
residents to buy assets in order to reduce
losses. This reason causes demand that
prompts high real estate prices. The
research result from Zhang (2013) stated
that inflation did not have significant
influence on Chinese housing price in
recent years.
Earl Benson, Julia Hansen, Arthur
Schwartz, and Greg Smersh (1999)
studied the factors affecting housing
price in Bellingham, Washington. The
conclusion is that a rise of Canadian/U.S.
exchange rate results in an increase of
real estate prices. Han and Wang (2011)
researched the fluctuations on real estate
prices, money supply, fluctuations of
exchange rate and interest rate using the
VAR model. The result is exchange rates
negatively impact on housing prices.
Wang (2009) analyzed the relationship
between RMB exchange rate and real
estate price after the reform of exchange
rates based on the co-integration test,
Granger causality test and impulse
response. The empirical results show that
there is a negative relationship between
the nominal exchange rate and real estate
price. Chen and Liu (2009) analyzed the
mechanism of exchange rate impact on
housing prices, based on data during
July, 2005 to December, 2007 through
establishing VAR model. The result
showed that the real effective exchange
rate of RMB positively impacts on real
estate prices.
Abraham and Hendershott (1996) built
the price model to empirically research
the influencing factors on housing prices
and found that the rise of housing prices
is largely due to the residents' increasing
UTCC International Journal of Business and Economics
UTTC IJBE | 138
income. Tu and Zhang (2005) empirical
analyzed the Shanghai property prices
based on data from July 2000 to March
2004. The finding of this article shows
that per-capita disposable is an important
factor which drives the real estate prices
to rise. David (2005) constructed the
VEC model to research the relationship
between commodity house price,
household disposable income, and
mortgage rates. He found income
increases lead to price increases, and
mortgage rate increases lead to price
decreases. Égert,and Mihaljek (2007)
found that there is a positive relationship
between per capita income and real estate
prices in central Europe and Eastern
Europe.
Edward, Joseph and Hilber (2002)
selected: land price, housing price,
regional economic development and
human capital as variables to do
regression analysis. The results show that
there is no direct relationship between
land price and housing price. Cao (2000)
studied the commercial housing prices in
Guangzhou, and then he found land
prices positively impact on prices. Kuang
(2005) explored the relationship between
land price and housing price. The finding
is that they are negatively correlated
when supply exceeds demand, and they
are positively correlated if supply is
smaller than demand.
Methodology
Data collection
Due to the fact that the value of sales
revenue and sales areas are cumulated
monthly this study uses the sales
revenues of the next three months minus
the sales of the last three months to get
the sales for the quarter. Then the gross
sales of residential real estate and total
sales area in the same region are
calculated, at last, using the gross sales
divide by total areas to obtain the average
selling price of one region. In the same
way, this paper gets the average land
price per square meter. CPI and urban per
capita disposable are also based on a
monthly cumulated value and therefore a
similar method is used to process the
data. These four variables above are all
regional averages of each quarter. GDP is
the sum of each quarter of a region’s
domestic product of all provinces and
cities in that region. Interest rate is
weighted average of each quarter, M2 is
also an average of each quarter.
Model
This paper uses the ordinary least square
(OLS) to estimate the regression
coefficient in a regression equation using
the ample data, and then analyzes the
degree of influence that the independent
variables has on the dependent variables.
It finds the best-fitting function to a set of
data by minimizing the error squares.
There are many of factors affecting the
residential real estate prices, but the
researcher cannot study all of them due to
the method and data limitation in this
paper. As mentioned above, there are

UTCC International Journal of Business and Economics
UTTC IJBE | 139
seven explanatory variables to analysis in
each of eight regions.
Based on the descriptive statistic of
variables, differences among them are
very large, in order to minimize these
effects of difference and reduce the
heteroscedasticity, therefore some
variable are processed with logarithm.
According the factors affecting the real
estate prices, the multiple linear
regression model can be described as
follow:
Note: This model runs 8 times in North-East China, Northern Coast Area, Middle Reaches of the
Yellow River Area, South-West China, Middle Reaches of the Yangtze River Area, Southern
Coastal Area, Eastern Coastal Area and North-West China.
Dependent variable:
- LnAREP: Natural logarithm of average
residential real estate prices in each
region.
Independent variables
- LnGDP: logarithm of gross domestic
product in each region.
- IR: Nominal interest rate (Five-year
benchmark lending rate)
- ER: Nominal exchange rate of RMB
against US dollar
- LnCPI: Natural logarithm of consumer
price index in each region
- LnUDI: Natural logarithm of urban per
captia disposable income in each region
- LnM2: Natural logarithm of monetary
supply
- LnLP: Natural logarithm of average
land prices in each region
β0: Intercept
βi : Regression coefficient
μ: Random error
Results
This research analyzes the GDP, CPI,
M2, exchange rate, lending interest rate,
urban per capita disposable income, and
how it affects the real estate price in eight
economic zones based on the data during
the period of first quarter of 2005 to the
last quarter of 2016. Descriptive
statistics, a multicollinearity tests,
heteroscedasticity tests, autocorrelation
tests, Regression result and
interpretations will be performed,
meanwhile, the relationships of variables
will be confirmed.
tttttttt
LnLPLnMLnUDILnCPIERIRLnGDPLnAREP76543210
2

UTCC International Journal of Business and Economics
UTTC IJBE | 140
Descriptive statistics
Table 1 Descriptive statistics results of original data in North-East China
Variable Maximum Minimum Std. Dev. Observations
AREP 5803.538 2193.683 1028.379 48
CPI 107.9556 98.9778 2.0398 48
ER 8.2765 6.1176 0.687 48
GDP 20008.77 3154.23 4401.514 48
IR 7.83 5.3022 0.6843 48
LP 5042.593 444.7167 1058.174 48
M2 1550067 264588.9 401491.3 48
UDI 7312.39 2064.6 1644.05 48
Table 2 Descriptive statistics results of original data in Northern Coast Area
Variable Maximum Minimum Std. Dev. Observations
AREP 8182.744 3213.942 1277.323 48
CPI 114.8333 98.4417 2.5289 48
ER 8.2765 6.1176 0.687 48
GDP 39713.55 7278.8 9037.138 48
IR 7.83 5.3022 0.6843 48
LP 15798.45 600.0473 3873.925 48
M2 1550067 264588.9 401491.3 48
UDI 10389.2 2960.675 2137.691 48
Table 3 Descriptive statistics results of original data in Middle Reaches of the Yellow
River Area
Variable Maximum Minimum Std. Dev. Observations
AREP 5076.488 1612.212 1049.423 48
CPI 109.0333 99.3167 2.2024 48
ER 8.2765 6.1176 0.687 48
GDP 27530.08 3992.37 6385.245 48
IR 7.83 5.3022 0.6843 48
LP 6513.165 311.098 1551.646 48
M2 1550067 264588.9 401491.3 48
UDI 7494.413 2079.275 1688.391 48

UTCC International Journal of Business and Economics
UTTC IJBE | 141
Table 4 Descriptive statistics results of original data in South-West China
Variable Maximum Minimum Std. Dev. Observations
AREP 5203.358 1594.156 1124.111 48
CPI 109.6867 98.3133 2.3473 48
ER 8.2765 6.1177 0.687 48
GDP 29772.21 3840.93 6848.705 48
IR 7.83 5.3022 0.6844 48
LP 7211.685 434.2846 1789.241 48
M2 1550067 264588.9 401491.3 48
UDI 7738.126 2116.72 1620.012 48
Table 5 Descriptive statistics results of testing data in Middle Reaches of the Yangtze
River Area
Variable Maximum Minimum Std. Dev. Observations
AREP 5739.857 1646.608 1212.595 48
CPI 108.25 98.4583 2.1022 48
ER 8.2765 6.1176 0.687 48
GDP 32336.14 4726.28 7600.514 48
IR 7.83 5.3022 0.6843 48
LP 5363.432 417.2442 1356.333 48
M2 1550067 264588.9 401491.3 48
UDI 8116.665 2027.75 1732.71 48
Table 6 Descriptive statistics results of original data in Southern Coastal Area
Variable Maximum Minimum Std. Dev. Observations
AREP 11062.42 3142.917 2051.855 48
CPI 107.7556 97.6222 2.1708 48
ER 8.2765 6.1176 0.687 48
GDP 33846.65 5511.06 7306.529 48
IR 7.83 5.3022 0.6843 48
LP 17292.58 566.0038 4110.782 48
M2 1550067 264588.9 401491.3 48
UDI 9575.583 2670.567 1921.97 48

UTCC International Journal of Business and Economics
UTTC IJBE | 142
Table 7 Descriptive statistics results of original data in Eastern Coastal Area
Variable Maximum Minimum Std. Dev. Observations
AREP 11713.57 3586.57 2165.757 48
CPI 107.2444 98.2333 1.9205 48
ER 8.2765 6.1176 0.687 48
GDP 42991.84 8104.25 9417.684 48
IR 7.83 5.3022 0.6843 48
LP 24803.76 1582.406 5668.001 48
M2 1550067 264588.9 401491.3 48
UDI 14089.47 3573.2 2774.567 48
Table 8 Descriptive statistics results of original data in North-West China
Variable Maximum Minimum Std. Dev. Observations
AREP 4537.106 1529.207 993.7658 48
CPI 110.1733 100.78 2.3371 48
ER 8.2765 6.1176 0.687 48
GDP 7674.94 916.72 1902.382 48
IR 7.83 5.3022 0.6843 48
LP 3795.033 249.2187 802.0951 48
M2 1550067 264588.9 401491.3 48
UDI 7176.296 1964 1541.121 48
Table 1 to 8 elaborates the descriptive
statistics of all independent variables
and dependent variables in each of eight
regions. These descriptive statistics
include: maximum, minimum, standard
deviation and observing samples size.
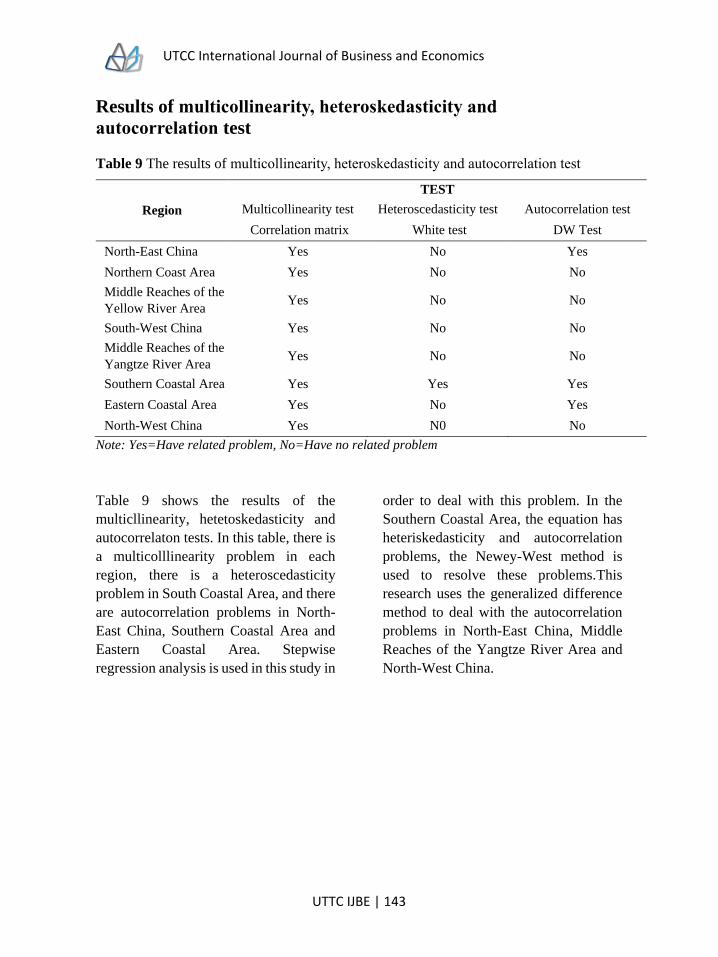
UTCC International Journal of Business and Economics
UTTC IJBE | 143
Results of multicollinearity, heteroskedasticity and
autocorrelation test
Table 9 The results of multicollinearity, heteroskedasticity and autocorrelation test
Region
TEST
Multicollinearity test Heteroscedasticity test Autocorrelation test
Correlation matrix White test DW Test
North-East China Yes No Yes
Northern Coast Area Yes No No
Middle Reaches of the
Yellow River Area Yes No No
South-West China Yes No No
Middle Reaches of the
Yangtze River Area Yes No No
Southern Coastal Area Yes Yes Yes
Eastern Coastal Area Yes No Yes
North-West China Yes N0 No
Note: Yes=Have related problem, No=Have no related problem
Table 9 shows the results of the
multicllinearity, hetetoskedasticity and
autocorrelaton tests. In this table, there is
a multicolllinearity problem in each
region, there is a heteroscedasticity
problem in South Coastal Area, and there
are autocorrelation problems in North-
East China, Southern Coastal Area and
Eastern Coastal Area. Stepwise
regression analysis is used in this study in
order to deal with this problem. In the
Southern Coastal Area, the equation has
heteriskedasticity and autocorrelation
problems, the Newey-West method is
used to resolve these problems.This
research uses the generalized difference
method to deal with the autocorrelation
problems in North-East China, Middle
Reaches of the Yangtze River Area and
North-West China.
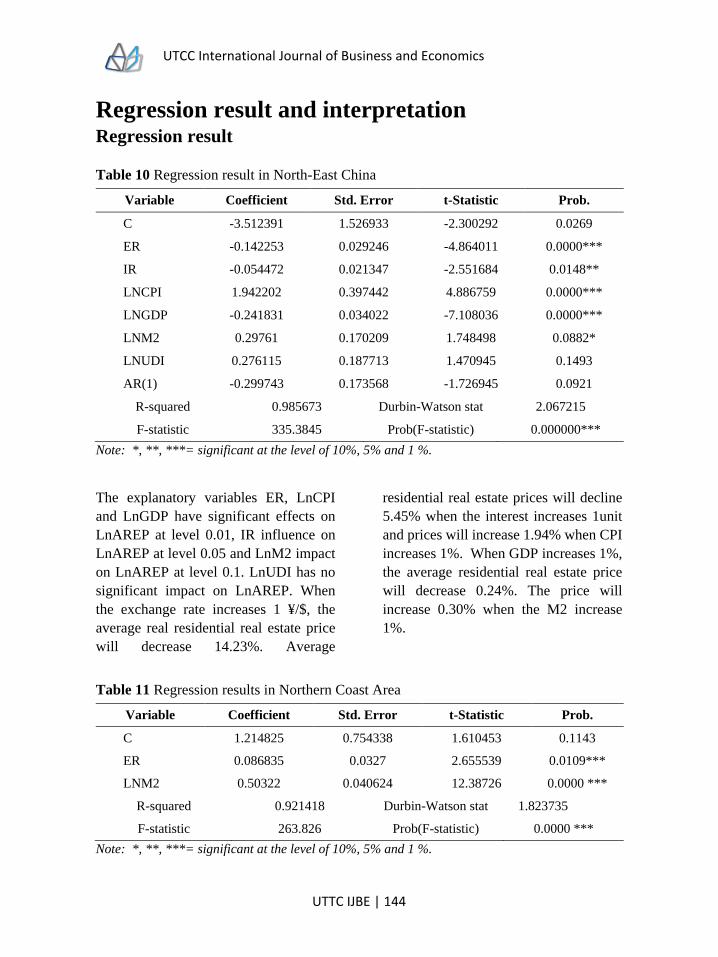
UTCC International Journal of Business and Economics
UTTC IJBE | 144
Regression result and interpretation Regression result
Table 10 Regression result in North-East China
Variable Coefficient Std. Error t-Statistic Prob.
C -3.512391 1.526933 -2.300292 0.0269
ER -0.142253 0.029246 -4.864011 0.0000***
IR -0.054472 0.021347 -2.551684 0.0148**
LNCPI 1.942202 0.397442 4.886759 0.0000***
LNGDP -0.241831 0.034022 -7.108036 0.0000***
LNM2 0.29761 0.170209 1.748498 0.0882*
LNUDI 0.276115 0.187713 1.470945 0.1493
AR(1) -0.299743 0.173568 -1.726945 0.0921
R-squared 0.985673 Durbin-Watson stat 2.067215
F-statistic 335.3845 Prob(F-statistic) 0.000000***
Note: *, **, ***= significant at the level of 10%, 5% and 1 %.
The explanatory variables ER, LnCPI
and LnGDP have significant effects on
LnAREP at level 0.01, IR influence on
LnAREP at level 0.05 and LnM2 impact
on LnAREP at level 0.1. LnUDI has no
significant impact on LnAREP. When
the exchange rate increases 1 ¥/$, the
average real residential real estate price
will decrease 14.23%. Average
residential real estate prices will decline
5.45% when the interest increases 1unit
and prices will increase 1.94% when CPI
increases 1%. When GDP increases 1%,
the average residential real estate price
will decrease 0.24%. The price will
increase 0.30% when the M2 increase
1%.
Table 11 Regression results in Northern Coast Area
Variable Coefficient Std. Error t-Statistic Prob.
C 1.214825 0.754338 1.610453 0.1143
ER 0.086835 0.0327 2.655539 0.0109***
LNM2 0.50322 0.040624 12.38726 0.0000 ***
R-squared 0.921418 Durbin-Watson stat 1.823735
F-statistic 263.826 Prob(F-statistic) 0.0000 ***
Note: *, **, ***= significant at the level of 10%, 5% and 1 %.
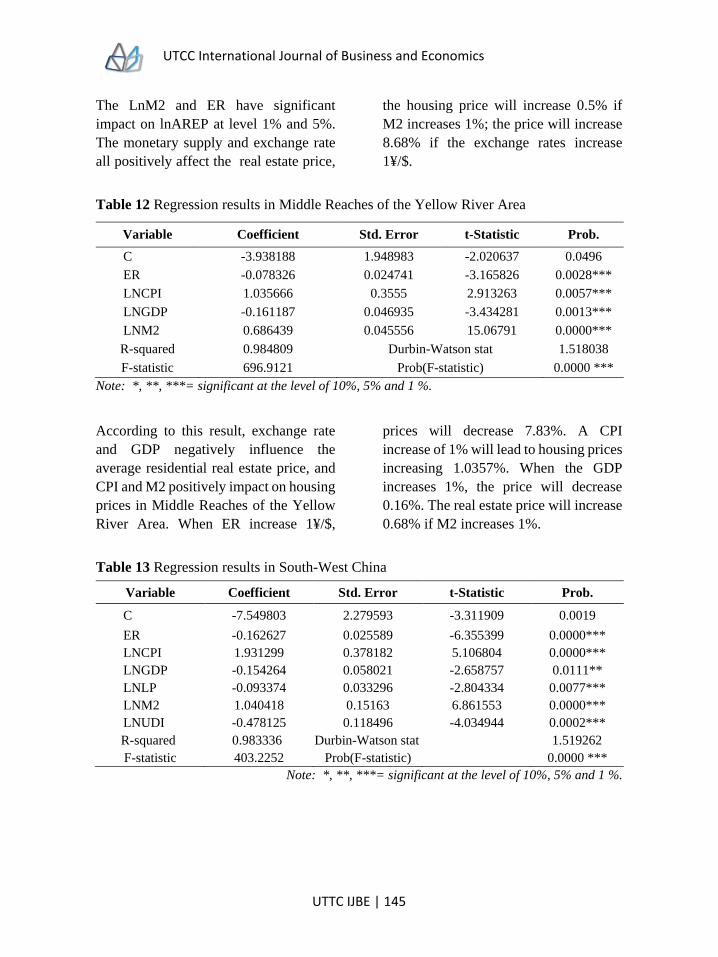
UTCC International Journal of Business and Economics
UTTC IJBE | 145
The LnM2 and ER have significant
impact on lnAREP at level 1% and 5%.
The monetary supply and exchange rate
all positively affect the real estate price,
the housing price will increase 0.5% if
M2 increases 1%; the price will increase
8.68% if the exchange rates increase
1¥/$.
Table 12 Regression results in Middle Reaches of the Yellow River Area
Variable Coefficient Std. Error t-Statistic Prob.
C -3.938188 1.948983 -2.020637 0.0496
ER -0.078326 0.024741 -3.165826 0.0028***
LNCPI 1.035666 0.3555 2.913263 0.0057***
LNGDP -0.161187 0.046935 -3.434281 0.0013***
LNM2 0.686439 0.045556 15.06791 0.0000***
R-squared 0.984809 Durbin-Watson stat 1.518038
F-statistic 696.9121 Prob(F-statistic) 0.0000 ***
Note: *, **, ***= significant at the level of 10%, 5% and 1 %.
According to this result, exchange rate
and GDP negatively influence the
average residential real estate price, and
CPI and M2 positively impact on housing
prices in Middle Reaches of the Yellow
River Area. When ER increase 1¥/$,
prices will decrease 7.83%. A CPI
increase of 1% will lead to housing prices
increasing 1.0357%. When the GDP
increases 1%, the price will decrease
0.16%. The real estate price will increase
0.68% if M2 increases 1%.
Table 13 Regression results in South-West China
Variable Coefficient Std. Error t-Statistic Prob.
C -7.549803 2.279593 -3.311909 0.0019
ER -0.162627 0.025589 -6.355399 0.0000***
LNCPI 1.931299 0.378182 5.106804 0.0000***
LNGDP -0.154264 0.058021 -2.658757 0.0111**
LNLP -0.093374 0.033296 -2.804334 0.0077***
LNM2 1.040418 0.15163 6.861553 0.0000***
LNUDI -0.478125 0.118496 -4.034944 0.0002***
R-squared 0.983336 Durbin-Watson stat 1.519262
F-statistic 403.2252 Prob(F-statistic) 0.0000 ***
Note: *, **, ***= significant at the level of 10%, 5% and 1 %.

UTCC International Journal of Business and Economics
UTTC IJBE | 146
The probability value is 0.0000 that
means all independent variables can be
used to determine their impact on
dependent variable at significant statistic
5%. In this region, the independent
variables ER, GDP, LP and UDI
negatively impact on average residential
estate prices; CPI and M2 positively
influence prices. When the GDP, LP and
UDI increase 1%, respectively, this will
lead to the housing prices decreasing
0.15%, 0.09% and 0.48%. When ER
increases 1¥/$, the prices will decrease
16.26%. If CPI and M2 increase 1% the
average prices will increase 1.93% and
1.04% respectively.
Table 14 Regression results in Middle Reaches of the Yangtze River Area
Variable Coefficient Std. Error t-Statistic Prob.
C -7.373315 2.10271 -3.506576 0.0011
IR 0.046163 0.014366 3.213356 0.0025***
LNCPI 1.030272 0.453352 2.272564 0.0282**
LNGDP -0.250392 0.057747 -4.335983 0.0001***
LNM2 1.10907 0.105276 10.53491 0.0000***
LNUDI -0.253208 0.085135 -2.974188 0.0049***
R-squared 0.988253 Durbin-Watson stat 2.036069
F-statistic 706.6789 Prob(F-statistic) 0.0000***
Note: *, **, ***= significant at the level of 10%, 5% and 1 %.
According to these results, the
probability value is 0.000 that means all
independent variables can be used to
determine their impact on dependent
variable at significant statistic 1%. When
IR increases 1 unit, the housing price will
increase 1%, A CPI increase of 1% will
lead to price increases of 1.03%. When
monetary supply increases 1% the prices
will go up 1.11%. When GDP and urban
per capita disposable income increase
1%, respectively, the average residential
real estate price will decline 0.2503% and
0.2532%.
Table 15 Regression results in Southern Coastal Area
Variable Coefficient Std. Error t-Statistic Prob.
C -5.138753 2.762289 -1.860324 0.0694
LNCPI 1.358926 0.570573 2.381687 0.0215**
LNM2 0.569164 0.031506 18.06502 0.0000***
R-squared 0.958401 Durbin-Watson stat 0.955717
F-statistic 518.3781 Wald F-statistic 163.7483
Prob(F-statistic) 0.0000*** Prob(Wald F-statistic) 0.0000
Note: *, **, ***= significant at the level of 10%, 5% and 1 %.

UTCC International Journal of Business and Economics
UTTC IJBE | 147
According to regression result, the
probability value is 0.000 that means all
independent variables can be used to
determine their impact on dependent
variable LnAREP at significant statistic
1%. In Southern Coastal Area, the
independent variables LnCPI and LnM2
significantly impact on LnAREP. When
CPI increases 1%, the prices will increase
1.36%. When M2 increases 1%, the
housing prices will increase 0.57%.
Table 16 Regression results in Eastern Coastal Area
Variable Coefficient Std. Error t-Statistic Prob.
C -5.87342 3.877938 -1.514573 0.1376
LNCPI 1.578507 0.85778 1.840224 0.073*
LNGDP -0.468293 0.130752 -3.581549 0.0009***
LNM2 1.184964 0.172123 6.884392 0.0000***
LNUDI -0.432102 0.119991 -3.601129 0.0008***
AR(1) 0.395449 0.157856 2.505123 0.0163
SIGMASQ 0.003784 0.000858 4.41207 0.0001
R-squared 0.96031 Durbin-Watson stat 2.039547
F-statistic 165.3348 Prob(F-statistic) 0.0000***
Note: *, **, ***= significant at the level of 10%, 5% and 1 %.
According this result, the value of
probability is 0.00 which is less than
0.01. That means all independent
variables can use to determine their
impact on the dependent variable
LnAREP at significant statistic 0.01.
When CPI increases 1%, the prices will
increase 1.58%. When GDP increase 1%,
the prices will decrease 0.47%. When the
M2 increases 1%, the housing prices will
increase 1.18%. The prices will decline
0.43% when UDI increases 1%.
Table 17 Regression results in North-West China
Variable Coefficient Std. Error t-Statistic Prob.
C -4.352127 1.295593 -3.359179 0.0016
LNCPI 0.751929 0.274373 2.740537 0.0088***
LNLP -0.041265 0.013719 -3.007961 0.0043***
LNM2 0.67629 0.017497 38.6513 0.0000***
R-squared 0.987171 Durbin-Watson stat 1.750582
F-statistic 1128.582 Prob(F-statistic) 0.0000***
Note: *, **, ***= significant at the level of 10%, 5% and 1 %.

UTCC International Journal of Business and Economics
UTTC IJBE | 148
According this result, the value of
probability is 0.0000 which is less than
0.01 that means all independent variables
can determine their impact on the
dependent variable LnAREP at
significant statistic 0.01. They have a
negative relationship between LP and
LnAREP. The prices will increase 0.75%
when CPI increases 1%. When M2
increases 1%, the residential real estate
price will increase 0.68%. When LP
increases 1%, the housing prices will
decline 0.04%.
Conclusion and
discussion
Gross domestic product (GDP)
The results above show that GDP
negatively affects residential real estate
price in North-East China, Middle
Reaches of the Yellow River Area,
South-West China, Middle Reaches of
the Yangtze River Area and Eastern
Coastal Area. These results are not in
concert with the previous studies.
Belejand and Cellmer (2014), Li and Hu
(2011) all pointed out that the GDP
affects real estate price positively.
In this paper, the researcher investigates
the eight economic regions; however,
economic developments are unbalanced
in different provinces and cities. When
they are integrated into a large area this
causes the result to be bias. In recently
years, the government strengthened
macro-control on real estate price and
China’s economic transition led to the
growth of GDP slowdown. There are
only seven independent variables, but
factors affecting housing price are
complicated. These variables which are
selected cannot present the truth in some
regions. That’s why GDP negatively
affects real estate prices in some areas.
Interest rate (IR)
The results of this research as follows,
interest rate have a significantly negative
effect on the residential real estate prices
in Eastern Coastal Area and positive
affects in Middle Reaches of the Yangtze
River Area. That is in compliance with
literature review, such as Harris (1989),
Englund and Ioannides (1997), Gao and
He (2006), all of which pointed out that
there is a negative relationship between
interest rate and housing prices. Zheng
and Guo (2011), found the interest rate
positively affects the housing priced.
This study chooses the Five-year
benchmark lending rate. The rate
increase leads to cost increase which
causes prices to rise. On the other hand,
high interest rates will increase the
pressure of purchasing property. Some
people will change their decision to
purchase property which will lead to a
change in supply and demand. Therefore,
they have a negative relationship. At the
same time, the data of some areas is
missed. Therefore, the interest rate
doesn’t impact on housing prices in other
areas.
Monetary supply (M2)
Based on the above results, monetary
supply has a significant positive
influence on residential real estate prices
in each region; this is consistent with
UTCC International Journal of Business and Economics
UTTC IJBE | 149
previous research, such as William
(2002), Gao (2008), Elbourne (2008),
Huang and Wang (2010) and Xu(2011)
In past years, the growth rate of M2 has
been higher than the GDP growth rate
which results in money over issue. This
meaning is the growth rate of money
supply exceeds the growth rate of money
demand, that is, the amount of money
issued exceeds the amount of money
needed to maintain the normal operation
of the economy. Superfluous money
leads to the purchasing power
enhancement that promotes the housing
prices to rise.
Consumer price index (CPI)
According to the result of this study, CPI
positively affects the residential real
estate prices in the North-East China,
South-West China, Middle Reaches of
the Yangtze River Area, Southern
Coastal Area, Eastern Coastal Area and
North-West China. Those are in
compliance with previous studies. Yuan
(2012), Zhang (2013), and Xu and Zhang
(2012) believed that high CPI promotes
high real estate prices. Pang and Mao
(2013) believed they have a long-term
equilibrium relationship between these
two variables.
In China, even though the housing price
doesn’t factor into the calculation of the
consumer price index, the rising housing
prices still lead to CPI being driven up.
At the same time, when prices rise
rapidly it can be expressed as high
inflation, demand exceeds supply and
prices skyrocket. All of these factors will
cause the housing prices to increase. The
complexity of region and imbalance of
development, selection of methodology
and independent variables and sample
size can be the reason why CPI affects the
housing prices at different level in
different regions.
Exchange rate (ER)
From the results of the analysis, the
exchange rate affects residential real
estate prices negatively in the North-east
of China, Middle Reaches of the Yellow
River Area and South-west China.
However, Affects on housing prices are
positive in Northern Coast Area. These
results are in alignment with the
forerunner's studies. Wang (2009) and
Han and Wang (2011) pointed out that
the exchange rate is negatively related to
housing prices. Greg Smersh (1999),
Chen and Liu (2009) believed that
exchange rate increases lead to a rise in
house prices
RMB exchange rate depends on supply
and demand. When the RMB is
depreciated, some investors will
purchase the property to respond to loss
that causes the price to increase.
Therefore, exchange rate can negatively
impact on housing prices. On the other
hand, high RMB exchange
rate leads international hot money in-
flow to China. Finally, some hot money
in-flow into real estate industry results in
high housing prices. In the past, China
adopted the strict currency control and
intervention. At the same time the
Research method, variable selection and
sample size may be the reason why the

UTCC International Journal of Business and Economics
UTTC IJBE | 150
exchange rate doesn’t influence prices in
some areas.
Urban per capita disposable income
(UDI)
Following the result, urban per capita
disposable income positively impacts on
residential real estate prices in Northern
Coast Area China. That is in accordance
with previous studies, Such as Miller and
Liang (2006), who believed that per
capita income is a major reason for price
volatility. Abraham and Hendershott
(1996), Tu and Zhang (2005), David H
(2005), Égert,and Mihaljek (2007).
Disposable income negatively impacts
on housing prices in South-west China,
Middle Reaches of the Yangtze River
and Eastern Coastal Area. Those results
are different from the research mentioned
above.
The purchasing power of people will
increase along with rising disposable
income. At the same time, more and more
people hope to improve housing
conditions as the residential income
continues to grow. In recently years, the
government strengthened macro-control
on real estate prices. Most of the
provinces and cities implemented the
stringent restriction of purchase policy in
particular. So they have a negative
relationship between them. The average
value in one region is analyzed; however,
the income gap is very large in different
provinces and cities. Sample size,
research method and variables selection
also leads to the research result being
different.
Land price (LP)
The result of this paper presents that land
prices have a negative effect on housing
prices in South-West China and North-
West China. That is different from the
preceding researches, Cao (2000) pointed
out that land prices positively affects the
housing prices. Joseph and Hilber (2002)
believed that there is no direct
relationship between land prices and
housing prices. Kuang (2005) confirmed
that they are negatively correlated when
supply exceeds demand, and they are
positively correlated when supply is
smaller than demand.
Pricing mechanisms are complicated,
although land cost is an important part of
housing price, it is not a determinant.
Housing price is determined by supply
and demand. In recently years, in South-
West China and North-West China, The
economy of these two regions developed
rapidly which caused the high demand
for real estate. This is not interrelated
with other regions due to limitations in
research methodology, analysis tools,
data processing or variable selection.
Implication for the study
The results of this paper provide a
reference for academicians and later
researchers who want to study this field.
The findings of this study provide some
information for real estate enterprises,
other companies and relevant industries
when they make strategies. With the
deepening of economic reform in China,
real estate companies face more and
more challenges and potential
opportunities. They will be able to
UTCC International Journal of Business and Economics
UTTC IJBE | 151
respond quickly according to the results
of this study, which determines the factor
effecting real estate prices. When the
factors trend becomes positive the
company can increase their investment.
Companies can assess the economic
environment and formulate feasible and
effective mechanism of cost and pricing.
Companies can gather more information
from the different channels, strengthen
market research, enhance the
performance of the company, and
optimize the structure of the company.
Different regions have different
influencing factors. The company should
distinguish these factors then make a
reasonable decision.
Research recommendation
High monetary supply promotes the
residential real estate prices to increase
continually. Exchange rate affects
housing price by capital flow. The
government can control the property
prices by changing interest rates. In
general, they are all issued by the
government. In other words, real estate
enterprises and related industries should
be wary of changes to monetary policy
which tighten or loosen and adjust
quickly according these changes. At the
same time; they should pay more
attention to capital flows and change of
interest rate, then rationally adjust the
capital structure to meet changes. After
all, high interest rates lead to cost
increases and cause the housing prices to
go up. They also increase the cost to the
company and decrease the purchasing
demand. As mentioned above, the
companies should make decisions
considering the above factors as a whole.
Land is an important influencing factor
on real estate prices. When the land
prices change, the housing price will be
affected. The real estate enterprises
cannot blindly make decisions on
purchasing at land auctions. Sales will
reduce if people can’t bear the higher
prices. Moreover, the capital return of the
company will be slowed down because of
the increase in the cost of land and could
create a series of problems. Therefore,
the company should make reasonable
land price policy.
The regions GDP reflects its’ economic
development. Urban per capita
disposable income is used to measure the
variation in living standard. Therefore,
the real estate companies should modify
the corporate strategy when economic
growth is up or down. When disposable
income increases this means that
consumer power strengthen. The
company can adjust the prices according
to the economic growth and income
status. CPI also has an affects on housing
prices, high CPI promotes the price
rising. However, the companies need to
be concerned about high inflation that
will endanger the real estate industry and
even the whole national economy.
All of the factors affecting real estate
prices present different effects in
different areas. That is to say, one factor
influencing house prices in one region
may not have the same influence in
another area. Therefore, the enterprise
can modify the investment to other fields
UTCC International Journal of Business and Economics
UTTC IJBE | 152
and regions when some factors begin to
deteriorate.
Limitations and further
research
This paper only chooses seven factors
affecting residential real estate price:
gross domestic product, exchange rate,
interest rate, monetary supply, consumer
price index, land price and urban per
capita disposable income. However,
some others elements impacting on
housing prices are omitted. This will
cause the results to be contained within
inevitable limitations.
This study researches eight regions in
China, however, different provinces and
cities within intra-regional areas adopt
different policies. As a result the
difference of economic development is
large. That might lead to the results not
reflecting the state of some parts of the
country.
Some statistic data is missing which lead
to the data generation process which has
limitation. The data of average
residential real estate prices and land
prices are averages of all the provinces
and cities in one economic area. Because
the data types of some variables are
monthly, they need to be adjusted into
quarterly data that could cause error. In
this article, there are 48 observations
based on quarterly data between 2005
and 2016, therefore, the range is not big
enough. In future, researchers should
expand observation size to obtain more
accurate research results.
This paper builds the multiple linear
regression model to examine the factors
influencing residential real estate prices.
However, there are many research
methods that can be used which may
provide useful results. In the future
researchers can adopt different models
and methods to study residential real
estate from different perspectives.
References
Belej, M., & Cellmer, R. (2014). The effect of macroeconomic factors on changes in real
estate prices-response and interaction. Acta Scientiarum Polonorum.
Oeconomia, 13(2).
Benson, E., Hansen, J., Schwartz, A., & Smersh, G. (1999). Canadian/US Exchange rates
and nonresident investors: Their influence on residential property values. Journal
of Real Estate Research, 18(3), 433-461.
Cao, X. (2000). Analysis on prices of commercial houses in Gaungzhou. A thesis for the
degree of Master of Human geography. Sun Yat-sen University.
Central Bank's Monetary Policy: Empirical Research Based on Money Supply, Exchange
Rates and Interest Rates [J]. South China Finance, 11, 002.

UTCC International Journal of Business and Economics
UTTC IJBE | 153
CHEN, J., LU, J., GAO, P., & DONG, J. C. (2009). An Empirical Analysis on Correlation
Between RMB Exchange Rate Fluctuation and Housing Price [J]. Mathematics
in Practice and Theory, 13, 013.
David, H. (2005). Kingdom of the Netherlands-Netherlands: Selected Issues. IMF Country
Report, (05), p122-134.
Edward, G., Joseph, G., & Hilber, C. (2002). Housing Affordability and Land p Rice: is
There a Risis in American cities. NBER Work Paper, 8, 835.
Égert, B., & Mihaljek, D. (2007). Determinants of house prices in central and eastern
Europe. Comparative economic studies, 49(3), 367-388.
Elbourne, A. (2008). The UK housing market and the monetary policy transmission
mechanism: An SVAR approach. Journal of Housing Economics, 17(1), 65-87.
Englund, P., & Ioannides, Y. M. (1997). House price dynamics: an international empirical
perspective. Journal of Housing Economics, 6(2), 119-136.
HUANG, F. X., & WANG, Y. (2010). Transmission mechanism of monetary policy on
real estate prices in China based on SVAR [J]. Modern Economic Science, 3, 003.
Kauko, T. (2003). The importance of the context and the level of analysis: Author's
response. Housing, Theory and Society, 20(3), 134-136.
Li, Y., & Wang, Y. G. (2011). A Study on Influence Factors of House Prices Change in
China based on the State Space Model.South China Journal of Economics, 29
(2), 38-45
Pang, J. L., & Mao, S. M. (2013). Empirical Research of Relevance between Housing Price
and Inflation of China. [J]. On Economic Problems, 1, 53-56
Song, B., & Gao, B. (2007). Theoretical and Empirical Analysis of Interest Rate Shocks
and Real Estate Price Fluctuation1998-2006. Economic Revie, (04), 46-56
Tu, J. H., & Zhang, J. (2005). What Drives Up Housing Prices: Evidence from the Real
Estate Market in Shanghai [J]. Journal of World Economy, (5), 28-38
Weida, K. U. A. N. G. (2005). A Study on the Relationship Between Housing Pricing and
Land Pricing: Basic Model and Evidence from China [J]. Finance & Trade
Economics, 11, 016.
Wheaton, W., & Nechayev, G. (2008). The 1998-2005 Housing “Bubble” and the current
“Correction”: What’s Different This Time?. Journal of real Estate
research, 30(1), 1-26.
Xintao, H., & Qing, W. (2011). The Real Estate Prices' Volatility and the Functioning of
UTCC International Journal of Business and Economics
UTTC IJBE | 154
Xintao, H., & Qing, W. (2011). The Real Estate Prices' Volatility and the Functioning of
Central Bank's Monetary Policy: Empirical Research Based on Money Supply,
Exchange Rates and Interest Rates [J]. South China Finance, 11, 002.
Xu, H. F. (2011). Empirical Analysis of the Impact of Monetary Policy on Real Estate
Prices in China [J]. Financial Theory & Practice, 10, 112-115
Xu, Z., Zhang, X., & Zou, C. (2012). Housing Prices, Inflation, and Monetary Policies: A
Study Based on China’s Data. Journal of Financial Research, (6), 1-12.
Yu, S. H. (2012). Empirical Analysis of the Relationship between CPI and Real Estate
Prices based on VAR Model. [J]. Inner Mongolia finance and economics college,
4, 6-12
Yuan, X. P. (2012). Analysis of CPI Influence on House Prices Industrial & Science
Tribune. 11(16), 21-22
Zheng, Z. H., & Guo, N. (2011). A study on the Reasons of Rising Price of Real Estate in
China -- An Interpretation of Credit Channels. China Economic Studies, 6, 44-51

UTCC International Journal of Business and Economics
UTTC IJBE | 155
UTCC International Journal of Business and Economics (UTCC IJBE)
Volume 13 Number 2, August 2021
MIDDLE-INCOME TRAP: REFLECTION ON
MALAYSIA’S ECONOMIC DEVELOPMENT AND
POLICY IMPLICATIONS
Hieu C. Nguyen Faculty of Business Administration, Van Lang University
69/68 Dang Thuy Tram Street, Ward 13, Binh Thanh District, Ho Chi Minh City,
Vietnam
Abstract This paper comprehensively reviews the literature on “middle-income trap” and reflects
upon the case of Malaysia’s middle-income transition with attention to drawing relevant
policy implications. The review looks into the discussions on middle-income trap and
its causes from both economic and institutional perspectives. The investigation on
Malaysia is conducted through the analysis of structural change and sources of growth
in comparison with the performance of the two Asian Tigers, South Korea and Taiwan.
Malaysia achieved remarkable growth during its lower-middle-income stage, but was
“trapped” in the upper-middle-income years as its growth declined substantially. The
slowdown was driven by the significant decline in private investment, resulted mainly
from the outflow of capital together with decreasing inward FDI. This was somehow
triggered by macro uncertainties from the Asian Financial Crisis leading to pervasive
pessimism among investors about the economic prospects, coupled with the long-lasting
unfavorable business environment due to discriminatory policies favoring the Malays
and the crowding-out of government-linked corporations. Malaysia consistently faced
multiple structural issues throughout its middle-income stage, including sluggish total
factor productivity growth, relatively modest structural change, slow industrial
upgrading and premature deindustrialization, which had root in the slow upgrade of
human capital, technological capabilities, indigenous capacity, and the integration with
the FDI sector. Low and lower-middle-income nations like those of ASEAN region
should pay strategic attention to all these issues from the early years of their economic
catch-up endeavors in order to overcome unforeseen shocks and maintain sufficient
growth momentum for middle-income transition.
Keywords: middle-income trap; private investment; human capital; technological
capabilities; Malaysia
UTCC International Journal of Business and Economics
UTTC IJBE | 156
Introduction
Economic development is a
transformational process that requires
continuously upgrading and shifting the
production of goods and services toward
higher value-added activities. But many
countries have been unable to sustain this
process because they failed to cope with
the emerging requirements of the higher
stages of development. This implies the
success of a nation in moving from low
to middle income does not guarantee a
smooth transition from middle to high
income. In fact, most countries in Latin
America and the Middle East reached
middle-income level during the 1960s
and 1970s and have stuck there ever
since. According to a study of the World
Bank, of 101 economies classified as
middle income in 1960, only 13 managed
to achieve high income by 2008 (Agénor
& Canuto, 2015). Similarly, Spence
(2011) observed that since 1975 only a
few countries were able to exceed the
threshold of $10,000 (2005 PPP$) in per
capita income, while many remained in
the range of $5,000-$10,000.
The concern about particular challenges
at the middle-income stage was noticed
by Garrett (2004), but it was not until the
World Bank’s 2007 report that the
concept of “middle-income trap” was
first coined (Gill & Kharas, 2007). MIT
countries are those that fail to adapt their
growth strategies to the prevailing
structural characteristics of their
economies as they progress to higher
income levels. Two types of common
“traps” are usually facing the middle-
income nations. On the one hand, many
middle-income countries still maintain
1 These economies include Japan, the “Four Tigers” (Hong Kong, Singapore, South Korea, and Taiwan), and three newly
industrialized countries (Indonesia, Malaysia, and Thailand).
their old growth strategy based on labor-
intensive, export-led manufacturing
despite the comparative disadvantage of
rising wages. On the other hand,
prematurely leapfrogging into
knowledge economies when lacking
necessary conditions such as high-quality
universities, human resource, venture
capital, and robust regulatory
environment, would not enable middle-
income countries to transition to
innovation-driven economies (Gill &
Kharas, 2007, 2015).
Malaysia has been frequently regarded as
a typical case of MIT. The country was
among the economies that made up the
so-called “East Asian miracle” in
economic development history, implying
the superior performance of the eight
high-performing Asian economies
between 1965 and 1990 (World Bank,
1993).1 Malaysia was expected to be in
the next wave of economies joining the
league of emerging high-income nations
following the four Asian Tigers. The
prediction, however, turned out to be
over-optimistic as the following two
decades witnessed its significant growth
slowdown, hindering the country from
becoming an advanced economy.
This paper offers a comprehensive
review of literature on middle-income
trap and examines the case of Malaysia.
The study focuses on investigating
Malaysia’s economic performance over
its middle-income years and the factors
that have “trapped” the country in this
particular income stage. Insights from the
economic growth journey of Malaysia, a
relatively successful mid-size economy
in Southeast Asia, provide useful policy

UTCC International Journal of Business and Economics
UTTC IJBE | 157
implications for developing countries in
their efforts to achieve sustained robust
economic performance and successfully
manage their middle-income transition.
The paper proceeds as follows. Section 2
examines empirical evidence and the
causes of MIT. Section 3 investigates the
performance of Malaysia’s economy
with the analysis on the economic factors
underlying its middle-income slowdown,
followed by in-depth discussion about
the causes in Section 4. Section 5
concludes and draws policy implications.
Empirical evidence
and causes of middle-
income trap
The emergence of the MIT concept has
motivated intensive debate without
coming to a clear consensus among
scholars. The following provides detailed
discussion about empirical evidence and
the causes of MIT.
Empirical evidence
Studies aiming to identify countries
falling into MIT are generally based on
two approaches. The absolute approach
aims to quantify the income range,
growth rate or time span that MIT
countries have experienced. In the study
of 124 countries over 1950-2010, Felipe
(2012) posited that a country needs 28
years with per capita income growth of
4.7% annually to move from lower-
middle to upper-middle income and
another 14 years with a growth rate of
3.5% to graduate from upper-middle to
high income. The study suggested a
country as being stuck in MIT when it
could not reach the middle-income level
within the respective time span. In an
updated study, however, Felipe et al.
(2017) rejected the existence of MIT as a
generalized phenomenon. Instead, they
simply distinguished the economies
according to their speed of transition
from middle to high income. The study
revealed the median time of 45 countries
successfully transforming from lower-
middle to upper-middle income was 55
years, and the median time of 30
economies transitioning from upper-
middle to high income was 15 years.
These two thresholds served as the
criteria to classify a middle-income
economy as slow or fast transition. By
defining MIT as growth slowdown,
Eichengreen et al. (2012, 2014)
investigated the income levels at which
the slowdown is more likely to occur for
middle-income economies. The 2012
study showed that the slowdown mostly
occurred around the income range of
$15,000-$16,000 in 2005 PPP$, while
the 2014 study revealed another
possibility of $10,000-$11,000. Aiyar et
al. (2018) also examined growth
slowdown and found 123 slowdown
episodes of 138 countries in 1955-2009
and the higher frequency of slowdown
experienced by middle-income nations
compared to low- or high-income groups.
Another stream of MIT studies was based
on the relative approach by investigating
the dynamics of catching up of middle-
income countries with advanced
economies. With the same approach,
Agénor et al. (2012) and World Bank
(2013) identified countries stuck in MIT
as those that were unable to exceed the
range between 5% and 45% of the US per
capita income in about 50 years (1960-
2008), while Woo (2012) proposed the
range of 20%-55%. Similarly, Bulman et
UTCC International Journal of Business and Economics
UTTC IJBE | 158
al. (2017) set the middle-income range
between 10% and 50% of the US per
capita GDP, and posited that a country
was stuck in middle-income if it
remained in this range during 1960-2009.
They found no evidence for unusual
stagnation at any particular middle-
income level, and argued that the
determinants of growth at middle-income
level differ from those at low income, and
countries stuck in MIT are those that fail
to make adjustments to adapt to growth
requirements of higher income stage.
Similarly, from the group of 127
countries during 1950-2008, Im and
Rosenblatt (2015) examined the
probability of a country moving into the
next income category and revealed that
the likelihood of the transition from
lower-middle to upper-middle income is
similar to that of the transition from
upper-middle to high income, and thus
failed to support the existence of a
particular trap at middle-income stage.
Causes of middle-income trap
Economic perspective
Most of the explanations on the causes of
MIT mainly derive from traditional
economic models, identifying the factors
driving growth such as structural change,
investment, human capital, and
innovation. The first is the slowdown of
structural change, which is associated
with the dual-sector model dated back to
Lewis (1954). Low-income economies
tend to gain substantial growth from
structural transformation through
reallocating capital and labor from
agriculture to more productive activities.
This effect, however, weakens
considerably when these economies
reach middle-income level (Eichengreen,
2011; Agénor & Canuto, 2015).
The second, which is partly a
consequence of the first, is the decline of
investment due to deteriorated
competitiveness of the economy when it
encounters the “Lewis turning point”
(LTP) but lacks capabilities to develop
higher value-added activities. LTP is an
economic situation when unskilled labor
released from the agricultural sector is
exhausted and wages start to rise rapidly
(Gill & Kharas, 2015; Cai, 2012). The
labor-intensive industries, therefore,
would become less competitive and
finally decline. In such a case, the FDI in
labor-intensive industries would shift to
other countries with lower wage level,
and domestic investment in such
industries would also shrink. If the
economy lacks the conditions such as
quality labor or technological capabilities
necessary for fostering higher value-
added activities, the decline in
investment from FDI and domestic
investors would eventually lead to
growth stagnation.
The third is the failure to resume
momentum by shifting to endogenous
growth driven mainly by upgraded
human capital, technological capabilities,
and management capacity. As discussed
above, facing the LTP requires
restructuring the economy through
boosting intra-industry productivity and
shifting to higher value-added activities,
which in turn requires new skill sets and
technological capabilities. Ohno (2009)
posited that the MIT countries were
usually the ones that failed to upgrade
human capital and technological
capabilities, and their indigenous sectors
were unsuccessful in mastering
technology and management capabilities

UTCC International Journal of Business and Economics
UTTC IJBE | 159
allowing them to replace foreigners in
major activities of production and
become exporters of high quality
products. In contrast, Eichengreen et al.
(2014) found lower frequency of growth
slowdown in countries that have
relatively large share of population with
higher secondary and tertiary education.
Bulman et al. (2017) also evidenced that
economies escaping the middle income
experienced higher total factor
productivity (TFP) growth.
Institutional perspective
While economic development literature
provides understanding about the proper
policies and conditions necessary for
overcoming slowdown in middle-income
countries, the obvious question would be
why many of these economies have been
unable to offer such policies and
conditions. Wang (2016) argued that the
existing stakeholders may not be
receptive to policy changes necessary for
the new stage of development if their
interests are endangered. That is, one
needs to look into the political economy
of the transition process in the context of
middle-income economies, which sheds
light on the underlying institutional
constraints that may hinder growth.
In general, there has been a consensus
that democracy is a necessary condition
for transition from middle to high
income. As Gill and Kharas (2015)
argued, at low income level,
authoritarianism can be better for growth
as it can provide decisive leadership to
speed up the transformational process.
However, at middle-income level when
the economy becomes more complex,
greater institutional stability is necessary,
which is better provided by a democracy.
A democratic regime ensures not only
conducive conditions for growth such as
control of corruption, transparency, and
the rules of law but also responsive
bureaucracies and good governance
necessary for effective implementation
of growth strategies (Rudengren et al.,
2014).
Some discussions on institutional issues,
drawing from the successful experiences
of late comers such as South Korea,
Singapore, Taiwan, and Ireland, stressed
the importance of some minimal political
requisites such as political will, long time
horizons of political leaders, broad
societal consensus, business-government
collaboration, and some degree of
inclusive politics for enacting necessary
policies (Flechtner & Panther, 2015).
Unfortunately, many middle-income
countries seemed to lack such requisites
and were stuck in MIT.
It is observed, however, that the nature of
the required upgrading policies during
middle income seems to be the key
challenge that hinders necessary reforms.
Doner and Schneider (2017) argued that,
in essence, upgrading policies such as
promoting quality education and R&D at
the middle-income stage are much more
challenging than the earlier factor-driven
growth policies focusing largely on the
mobilization and accumulation of capital
and labor. Such upgrading policies to get
closer to the technological frontiers take
more time to implement, require the
participation of numerous stakeholders,
and demand more technical and site-
specific information than reforms that
can be accomplished by the one-off
decisions. These characteristics of
upgrading policies demand more
sophisticated institutional arrangements
for successful implementation (Hanson,
2008; Doner & Schneider, 2017). Doner
and Schneider posited that building such

UTCC International Journal of Business and Economics
UTTC IJBE | 160
institutional arrangements requires the
presence of “pro-upgrading coalitions”,
in which key stake-holders act toward the
shared purposes. Such coalitions,
however, are unlikely to exist in many
middle-countries due to misalignment of
interests.
Malaysia’s economic
performance and
middle-income trap
This section examines the long-term
economic performance of Malaysia over
the past five decades. We first provide an
overview of Malaysia’s growth and
discuss the transition of the country
through the middle-income stage. Then
we investigate the economic factors
underlying the significant growth
slowdown, which may hint some
structural issues of the economy. The
performance of Malaysia is contrasting to
that of the two Asian Tigers, South Korea
and Taiwan, wherever possible. The two
Tigers and Malaysia are comparable in
terms of size and development level in
1960s. In later decades, among the mid-
size economies making up the East Asian
miracle, South Korea and Taiwan were
the most successful, followed by
Malaysia, which makes the comparison
reasonable.
Malaysia: in the middle-
income trap?
Malaysia achieved remarkable economic
growth during its early decades of
development after regaining
2 These calculations are based on data of The Conference Board (2017).
independence in 1957. The economy
picked up speed from sluggish growth of
below 3% on average in the 1950s to
about 6% in the 1960s to above 8% in the
1970s before slowing down to below 5%
in 1981-1986. Growth, however,
recovered its momentum and surged to
above 9% in 1987-1997, enabling
Malaysia to transition into the upper-
middle-income stage. The eruption of the
Asian Financial Crisis (AFC) marked the
start of a new course of development for
Malaysia – a prolonged period of
slowdown. The economy sufferred
severely from the AFC, with GDP
dropped by -7.4% in 1998, followed by a
significant slowdown in subsequent
years. Malaysia was hit hard again by the
Global Financial Crisis (GFC) with GDP
contracted by -1.5% in 2009, making a
decade of stagnation of below 4% growth
during 1998-2009 before bouncing back
slightly to above 5% in the recent period
2010-2016.2
The growth pattern of Malaysia generally
resembled those of the two sizeable
Asian Tigers, South Korea and Taiwan
(Figure 1). These economies performed
well for almost four decades since 1960,
except for the stagnation in 1980s, and all
experienced significant slowdown with
similar growth rates after the AFC. The
key difference, however, was that the two
Asian Tigers commanded a higher
growth rate of 2% points or more, which
enabled them to achieve high-income
status before the AFC. With lower
growth rate, in contrast, Malaysia could
only attained upper-middle income by
this critical juncture. The following
discuss the transition of Malaysia’s
economy and the fall into MIT.
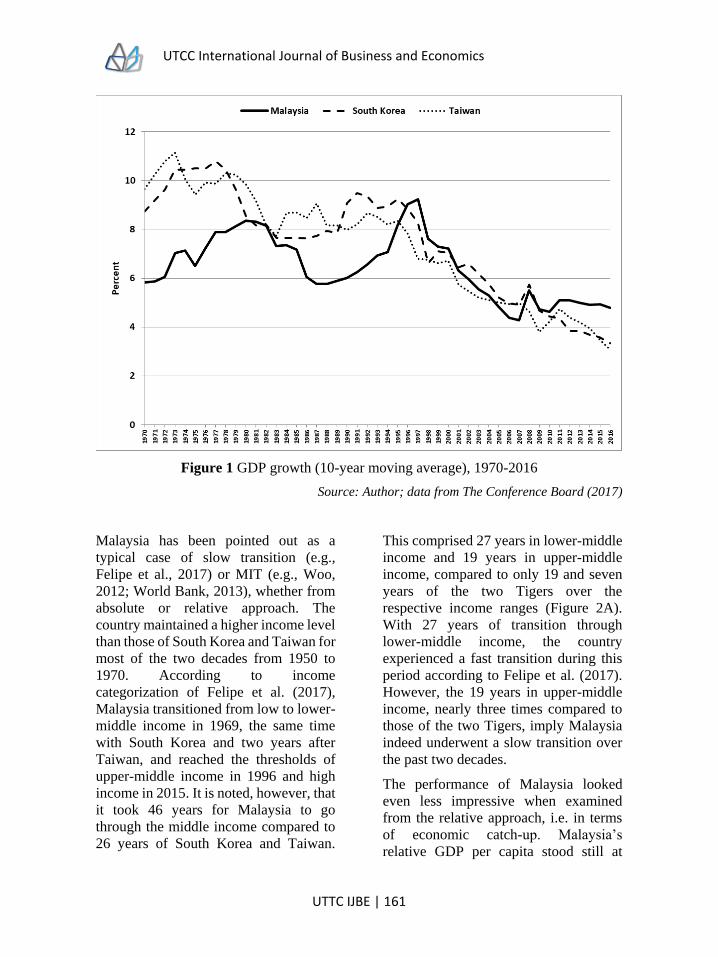
UTCC International Journal of Business and Economics
UTTC IJBE | 161
Figure 1 GDP growth (10-year moving average), 1970-2016
Source: Author; data from The Conference Board (2017)
Malaysia has been pointed out as a
typical case of slow transition (e.g.,
Felipe et al., 2017) or MIT (e.g., Woo,
2012; World Bank, 2013), whether from
absolute or relative approach. The
country maintained a higher income level
than those of South Korea and Taiwan for
most of the two decades from 1950 to
1970. According to income
categorization of Felipe et al. (2017),
Malaysia transitioned from low to lower-
middle income in 1969, the same time
with South Korea and two years after
Taiwan, and reached the thresholds of
upper-middle income in 1996 and high
income in 2015. It is noted, however, that
it took 46 years for Malaysia to go
through the middle income compared to
26 years of South Korea and Taiwan.
This comprised 27 years in lower-middle
income and 19 years in upper-middle
income, compared to only 19 and seven
years of the two Tigers over the
respective income ranges (Figure 2A).
With 27 years of transition through
lower-middle income, the country
experienced a fast transition during this
period according to Felipe et al. (2017).
However, the 19 years in upper-middle
income, nearly three times compared to
those of the two Tigers, imply Malaysia
indeed underwent a slow transition over
the past two decades.
The performance of Malaysia looked
even less impressive when examined
from the relative approach, i.e. in terms
of economic catch-up. Malaysia’s
relative GDP per capita stood still at

UTCC International Journal of Business and Economics
UTTC IJBE | 162
about 14% of the US level throughout the
1950s and the 1960s before catching up
moderately in the 1970s to reach 20% in
1980, followed by a stagnation during
1980-1987. The relative income level
increased dramatically in the following
decade to 30% in 1997 before being hit
hard by the AFC, and stagnated again
throughout the first decade of the 21st
century. The relative income only
recovered to the level before the AFC
(30%) in 2010, and then rose to 35% in
2016 (Figure 2B). It is noted that the
current income level of Malaysia is less
than a half of those of South Korea and
Taiwan. With the relative income level of
35% in 2016 far below the threshold of
around 50% of the US level and the long
lasting middle-income transition of over
50 years, it can be concluded that
Malaysia has been caught in the MIT,
according to Woo (2012) or World Bank
(2013).3
Figure 2A GDP per capita, 1950-2016
Source: Author; data from The Conference Board (2017)
3 As of 2017, the World Bank still categorized Malaysia as a middle-income economy, the status the country has achieved
since 1992. This categorization is based on both income and non-income measures. See Felipe et al. (2017) for more
details.
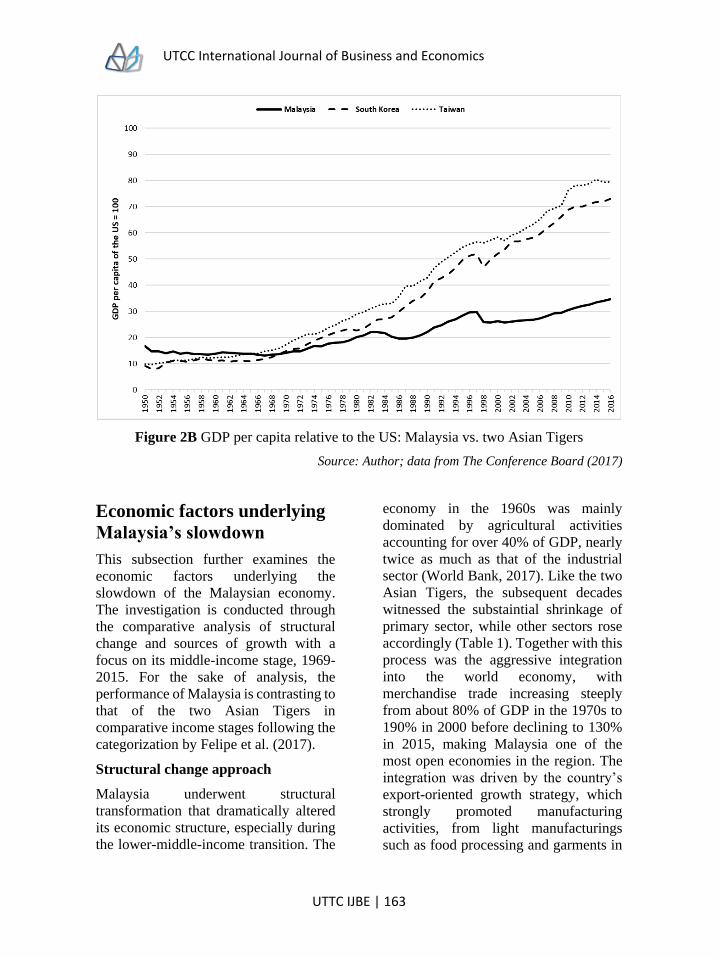
UTCC International Journal of Business and Economics
UTTC IJBE | 163
Figure 2B GDP per capita relative to the US: Malaysia vs. two Asian Tigers
Source: Author; data from The Conference Board (2017)
Economic factors underlying
Malaysia’s slowdown
This subsection further examines the
economic factors underlying the
slowdown of the Malaysian economy.
The investigation is conducted through
the comparative analysis of structural
change and sources of growth with a
focus on its middle-income stage, 1969-
2015. For the sake of analysis, the
performance of Malaysia is contrasting to
that of the two Asian Tigers in
comparative income stages following the
categorization by Felipe et al. (2017).
Structural change approach
Malaysia underwent structural
transformation that dramatically altered
its economic structure, especially during
the lower-middle-income transition. The
economy in the 1960s was mainly
dominated by agricultural activities
accounting for over 40% of GDP, nearly
twice as much as that of the industrial
sector (World Bank, 2017). Like the two
Asian Tigers, the subsequent decades
witnessed the substaintial shrinkage of
primary sector, while other sectors rose
accordingly (Table 1). Together with this
process was the aggressive integration
into the world economy, with
merchandise trade increasing steeply
from about 80% of GDP in the 1970s to
190% in 2000 before declining to 130%
in 2015, making Malaysia one of the
most open economies in the region. The
integration was driven by the country’s
export-oriented growth strategy, which
strongly promoted manufacturing
activities, from light manufacturings
such as food processing and garments in
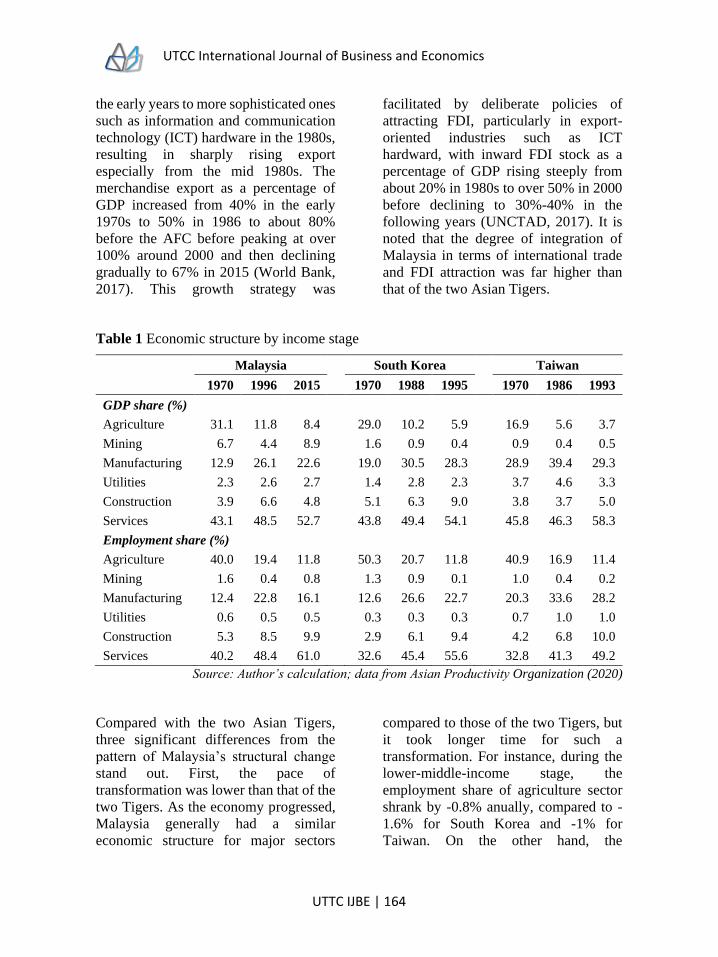
UTCC International Journal of Business and Economics
UTTC IJBE | 164
the early years to more sophisticated ones
such as information and communication
technology (ICT) hardware in the 1980s,
resulting in sharply rising export
especially from the mid 1980s. The
merchandise export as a percentage of
GDP increased from 40% in the early
1970s to 50% in 1986 to about 80%
before the AFC before peaking at over
100% around 2000 and then declining
gradually to 67% in 2015 (World Bank,
2017). This growth strategy was
facilitated by deliberate policies of
attracting FDI, particularly in export-
oriented industries such as ICT
hardward, with inward FDI stock as a
percentage of GDP rising steeply from
about 20% in 1980s to over 50% in 2000
before declining to 30%-40% in the
following years (UNCTAD, 2017). It is
noted that the degree of integration of
Malaysia in terms of international trade
and FDI attraction was far higher than
that of the two Asian Tigers.
Table 1 Economic structure by income stage
Malaysia South Korea Taiwan
1970 1996 2015 1970 1988 1995 1970 1986 1993
GDP share (%)
Agriculture 31.1 11.8 8.4 29.0 10.2 5.9 16.9 5.6 3.7
Mining 6.7 4.4 8.9 1.6 0.9 0.4 0.9 0.4 0.5
Manufacturing 12.9 26.1 22.6 19.0 30.5 28.3 28.9 39.4 29.3
Utilities 2.3 2.6 2.7 1.4 2.8 2.3 3.7 4.6 3.3
Construction 3.9 6.6 4.8 5.1 6.3 9.0 3.8 3.7 5.0
Services 43.1 48.5 52.7 43.8 49.4 54.1 45.8 46.3 58.3
Employment share (%)
Agriculture 40.0 19.4 11.8 50.3 20.7 11.8 40.9 16.9 11.4
Mining 1.6 0.4 0.8 1.3 0.9 0.1 1.0 0.4 0.2
Manufacturing 12.4 22.8 16.1 12.6 26.6 22.7 20.3 33.6 28.2
Utilities 0.6 0.5 0.5 0.3 0.3 0.3 0.7 1.0 1.0
Construction 5.3 8.5 9.9 2.9 6.1 9.4 4.2 6.8 10.0
Services 40.2 48.4 61.0 32.6 45.4 55.6 32.8 41.3 49.2
Source: Author’s calculation; data from Asian Productivity Organization (2020)
Compared with the two Asian Tigers,
three significant differences from the
pattern of Malaysia’s structural change
stand out. First, the pace of
transformation was lower than that of the
two Tigers. As the economy progressed,
Malaysia generally had a similar
economic structure for major sectors
compared to those of the two Tigers, but
it took longer time for such a
transformation. For instance, during the
lower-middle-income stage, the
employment share of agriculture sector
shrank by -0.8% anually, compared to -
1.6% for South Korea and -1% for
Taiwan. On the other hand, the
UTCC International Journal of Business and Economics
UTTC IJBE | 165
employment share of manufacturing and
services sectors expanded by 0.5% and
0.3% per annum, respectively, compared
to 0.8% and 0.7% of South Korea.
Second, Malaysia maintained a sizeable
mining sector in terms of GDP share
throughout its development (in the range
of 3%-16%), suggesting that the country
has been lastingly dependent on its rich
natural resources despite great effort of
diversification.
Third, the industrialization of the
Malaysian economy, measured by
manufacturing share in terms of output
and employment,4 was weaker than those
of the two Tigers. Malaysia achieved
industrialized status around 1990 in
terms of both output and employment,
more than a decade after South Korea. Its
industrialization peaked around 2000
with manufacturing share of 29% for
output and 24% for employment, before
deindustrializing in the 2000s.5 In terms
of output, the peak share was much lower
than that of Taiwan and comparable with
that of South Korea. The two Tigers,
however, still maintained a high level of
output share of nearly 30% until recent
years, while Malaysia has
deindustrialized considerably (Figure
3A).6 Therefore, Malaysia’s
industrialization stage in terms of output,
lasting for about 15 years, was
significantly shorter than those of the two
Tigers. Similar trend was also observed
for Malaysia’s manufacturing
employment share with considerably
lower peak (Figure 3B). In addition, the
industrialization period in terms of
employment only lasted for about 10
years compared to 15 years of South
Korea, while Taiwan still maintained a
large manufacturing sector in its labor
force until rencent years. It is worth
noting that South Korea and Taiwan
started to deindustrialize in the first half
of the 1990s when they almost attained
high income status, while Malaysia’s
deindustrialization occurred around 2000
when the country was in early years of
upper-middle-income stage.
4 An economy is industrialized if any 7-year moving average of manufacturing shares in output and employment are at
least 18% each (Asian Development Bank, 2013). 5 A country is deindustrialized if the difference between the maximum manufacturing shares of the series and the average
during the last decade is at least 5% points (Asian Development Bank, 2013). 6 It is noted that, according to the definition of Asian Development Bank (2013), in terms of output, South Korea has not
deindustrialized, while Taiwan has deindustrialized but its output share has been on increasing trend in recent years. To
some extent, this implies these two economies experienced industrial upgrading towards higher value-added activities.
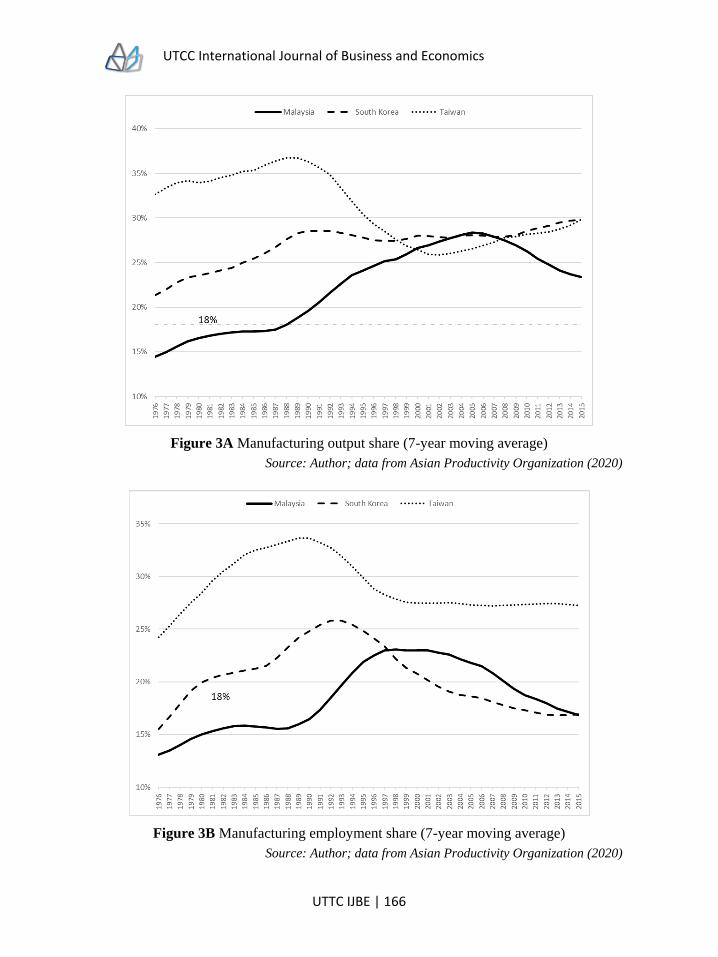
UTCC International Journal of Business and Economics
UTTC IJBE | 166
Figure 3A Manufacturing output share (7-year moving average)
Source: Author; data from Asian Productivity Organization (2020)
Figure 3B Manufacturing employment share (7-year moving average)
Source: Author; data from Asian Productivity Organization (2020)
UTCC International Journal of Business and Economics
UTTC IJBE | 167
To better quantify the contribution of
structural change to Malaysia’s growth,
the shift-share analysis, which
decomposes labor productivity growth
into two sources, within effect and
between effect (or structural change
effect), is conducted.7 The within effect
captures within-sector productivity
improvement, which is driven by capital
deepening, technological progress, or
reduction of misallocation across plants,
while the between effect captures the
reallocation of employment among
sectors (McMillan & Rodrik, 2011). The
shift-share analysis for the two sub-
periods of Malaysia’s middle income in
comparison with South Korea and
Taiwan is presented in Table 2. The
following findings stand out. First,
compared to South Korea and Taiwan,
Malaysia experienced a significant gap in
labor productivity growth of 2%-2.5%
points in lower-middle income and of
3.4%-4.5% points in upper-middle
income, indicating a clear trend of
relatively low labor productivity
improvement in the latter period. Second,
structural change played a marginal role
in driving labor productivity growth of
Malaysia throughout the middle-income
transition, especially in lower-middle
income when it is expected to play a more
significant role. Third, the manufacturing
sector of Malaysia, a key player of
industrialization along the middle-
income stage, contributed less than 1%
point of within-sector effect to the overall
labor productivity enhancement, which
was significantly lower than the
respective contributions of South Korea
and Taiwan.
7 See, for example, Timmer and de Vries (2009) and Vu (2017) for the methodology.
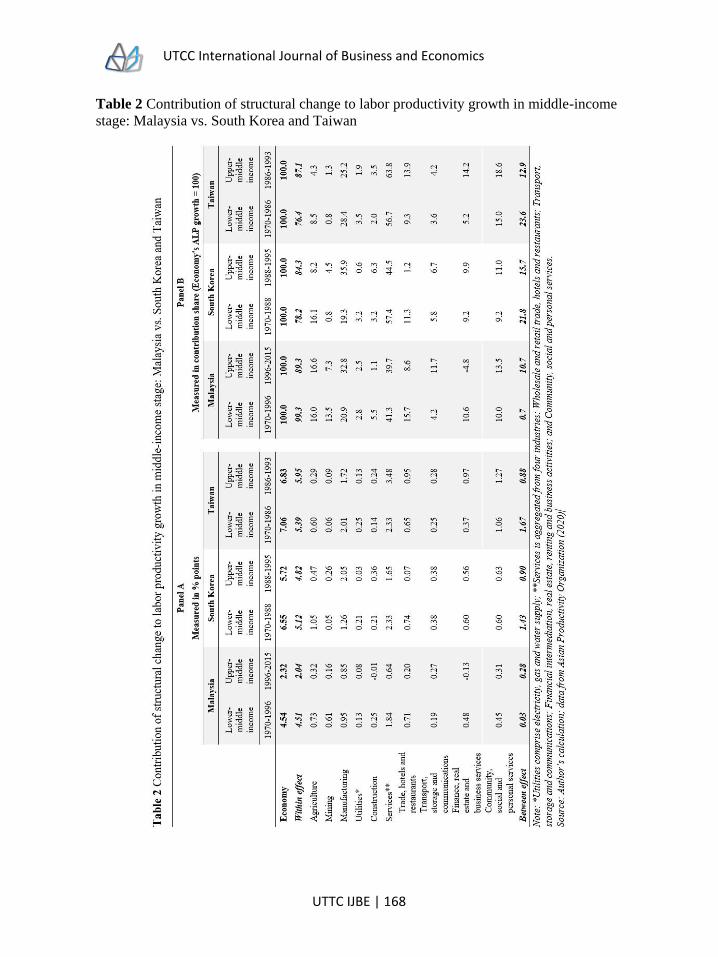
UTCC International Journal of Business and Economics
UTTC IJBE | 168
Table 2 Contribution of structural change to labor productivity growth in middle-income
stage: Malaysia vs. South Korea and Taiwan
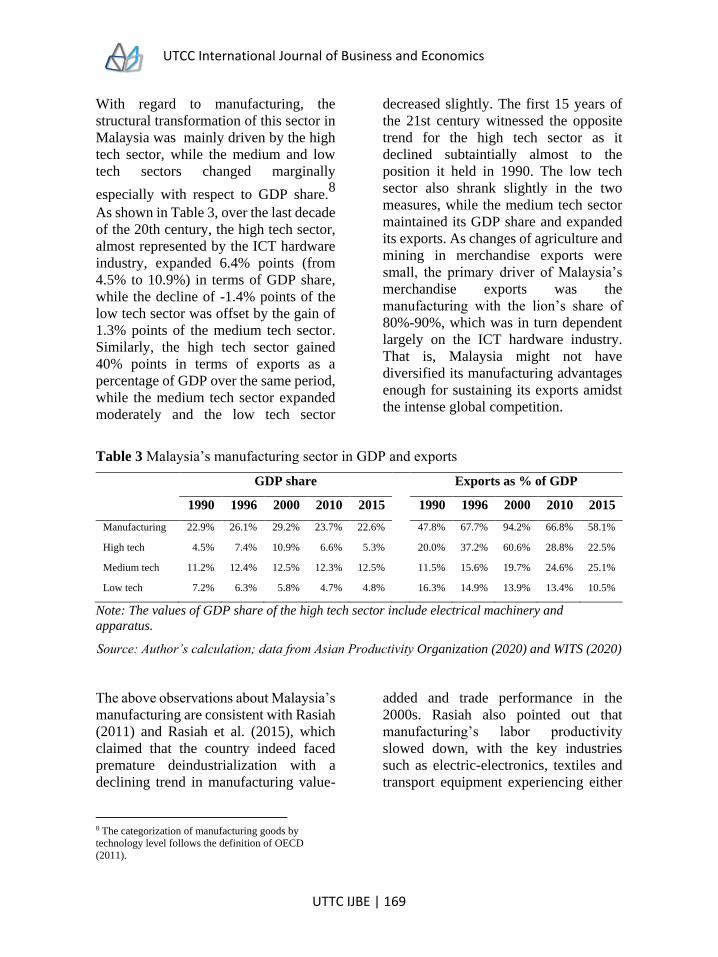
UTCC International Journal of Business and Economics
UTTC IJBE | 169
With regard to manufacturing, the
structural transformation of this sector in
Malaysia was mainly driven by the high
tech sector, while the medium and low
tech sectors changed marginally
especially with respect to GDP share.8
As shown in Table 3, over the last decade
of the 20th century, the high tech sector,
almost represented by the ICT hardware
industry, expanded 6.4% points (from
4.5% to 10.9%) in terms of GDP share,
while the decline of -1.4% points of the
low tech sector was offset by the gain of
1.3% points of the medium tech sector.
Similarly, the high tech sector gained
40% points in terms of exports as a
percentage of GDP over the same period,
while the medium tech sector expanded
moderately and the low tech sector
decreased slightly. The first 15 years of
the 21st century witnessed the opposite
trend for the high tech sector as it
declined subtaintially almost to the
position it held in 1990. The low tech
sector also shrank slightly in the two
measures, while the medium tech sector
maintained its GDP share and expanded
its exports. As changes of agriculture and
mining in merchandise exports were
small, the primary driver of Malaysia’s
merchandise exports was the
manufacturing with the lion’s share of
80%-90%, which was in turn dependent
largely on the ICT hardware industry.
That is, Malaysia might not have
diversified its manufacturing advantages
enough for sustaining its exports amidst
the intense global competition.
Table 3 Malaysia’s manufacturing sector in GDP and exports
GDP share Exports as % of GDP
1990 1996 2000 2010 2015 1990 1996 2000 2010 2015
Manufacturing 22.9% 26.1% 29.2% 23.7% 22.6% 47.8% 67.7% 94.2% 66.8% 58.1%
High tech 4.5% 7.4% 10.9% 6.6% 5.3% 20.0% 37.2% 60.6% 28.8% 22.5%
Medium tech 11.2% 12.4% 12.5% 12.3% 12.5% 11.5% 15.6% 19.7% 24.6% 25.1%
Low tech 7.2% 6.3% 5.8% 4.7% 4.8% 16.3% 14.9% 13.9% 13.4% 10.5%
Note: The values of GDP share of the high tech sector include electrical machinery and
apparatus.
Source: Author’s calculation; data from Asian Productivity Organization (2020) and WITS (2020)
The above observations about Malaysia’s
manufacturing are consistent with Rasiah
(2011) and Rasiah et al. (2015), which
claimed that the country indeed faced
premature deindustrialization with a
declining trend in manufacturing value-
8 The categorization of manufacturing goods by
technology level follows the definition of OECD
(2011).
added and trade performance in the
2000s. Rasiah also pointed out that
manufacturing’s labor productivity
slowed down, with the key industries
such as electric-electronics, textiles and
transport equipment experiencing either
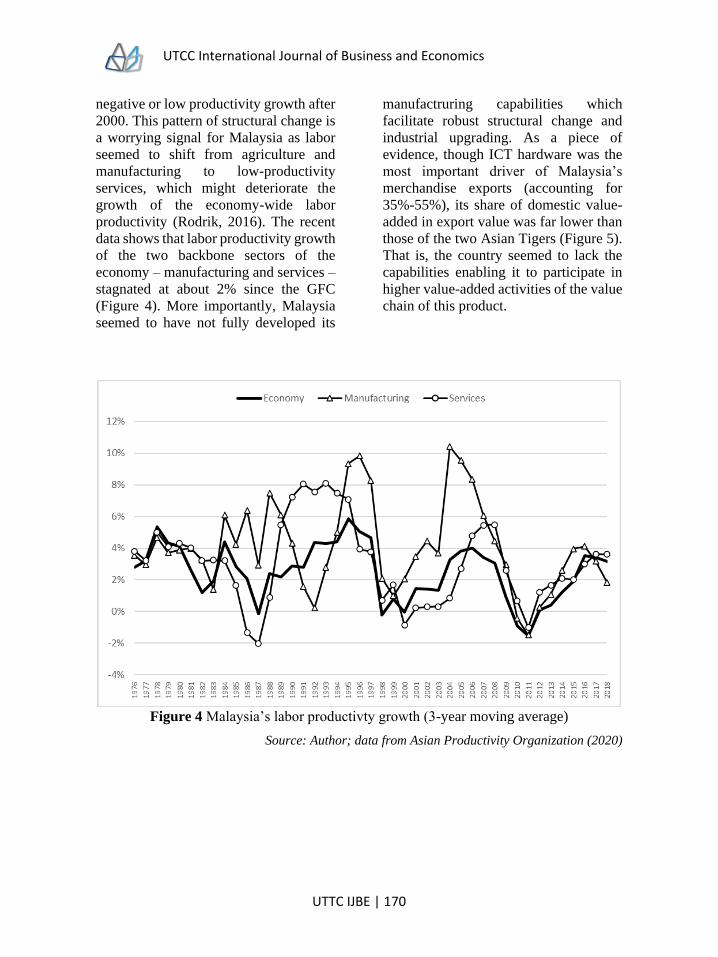
UTCC International Journal of Business and Economics
UTTC IJBE | 170
negative or low productivity growth after
2000. This pattern of structural change is
a worrying signal for Malaysia as labor
seemed to shift from agriculture and
manufacturing to low-productivity
services, which might deteriorate the
growth of the economy-wide labor
productivity (Rodrik, 2016). The recent
data shows that labor productivity growth
of the two backbone sectors of the
economy – manufacturing and services –
stagnated at about 2% since the GFC
(Figure 4). More importantly, Malaysia
seemed to have not fully developed its
manufactruring capabilities which
facilitate robust structural change and
industrial upgrading. As a piece of
evidence, though ICT hardware was the
most important driver of Malaysia’s
merchandise exports (accounting for
35%-55%), its share of domestic value-
added in export value was far lower than
those of the two Asian Tigers (Figure 5).
That is, the country seemed to lack the
capabilities enabling it to participate in
higher value-added activities of the value
chain of this product.
Figure 4 Malaysia’s labor productivty growth (3-year moving average)
Source: Author; data from Asian Productivity Organization (2020)
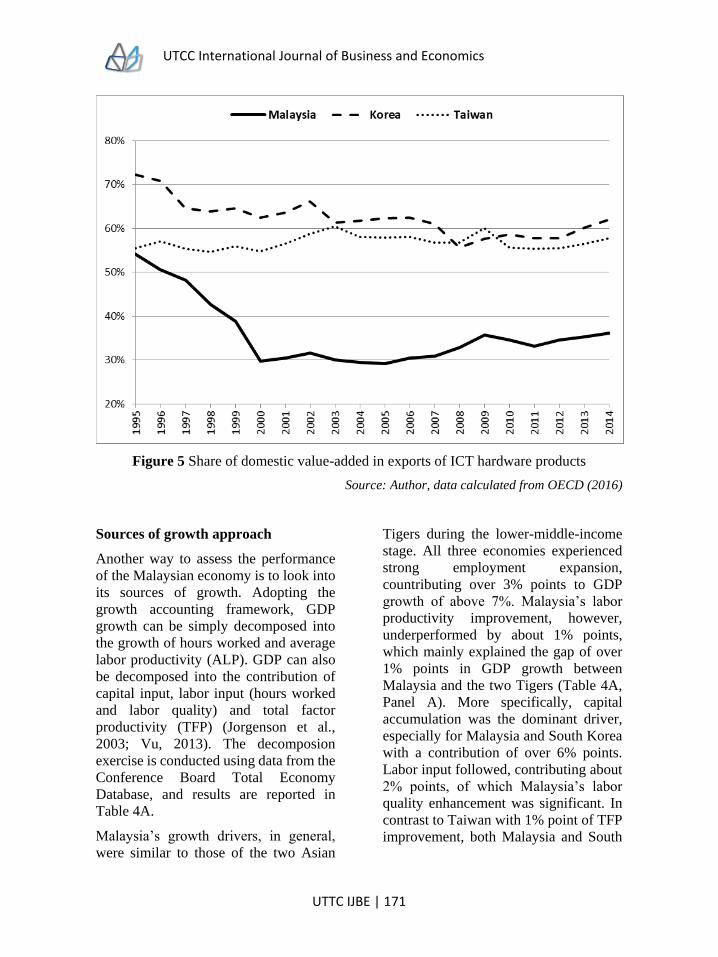
UTCC International Journal of Business and Economics
UTTC IJBE | 171
Figure 5 Share of domestic value-added in exports of ICT hardware products
Source: Author, data calculated from OECD (2016)
Sources of growth approach
Another way to assess the performance
of the Malaysian economy is to look into
its sources of growth. Adopting the
growth accounting framework, GDP
growth can be simply decomposed into
the growth of hours worked and average
labor productivity (ALP). GDP can also
be decomposed into the contribution of
capital input, labor input (hours worked
and labor quality) and total factor
productivity (TFP) (Jorgenson et al.,
2003; Vu, 2013). The decomposion
exercise is conducted using data from the
Conference Board Total Economy
Database, and results are reported in
Table 4A.
Malaysia’s growth drivers, in general,
were similar to those of the two Asian
Tigers during the lower-middle-income
stage. All three economies experienced
strong employment expansion,
countributing over 3% points to GDP
growth of above 7%. Malaysia’s labor
productivity improvement, however,
underperformed by about 1% points,
which mainly explained the gap of over
1% points in GDP growth between
Malaysia and the two Tigers (Table 4A,
Panel A). More specifically, capital
accumulation was the dominant driver,
especially for Malaysia and South Korea
with a contribution of over 6% points.
Labor input followed, contributing about
2% points, of which Malaysia’s labor
quality enhancement was significant. In
contrast to Taiwan with 1% point of TFP
improvement, both Malaysia and South

UTCC International Journal of Business and Economics
UTTC IJBE | 172
Korea experienced TFP deterioration of
over 0.6% points over this stage (Table
4A, Panel B). It can be said that Malaysia
and South Korea had similar growth
drivers during the lower-middle-income
stage, with South Korea having stronger
capital accumulation.
The upper-middle-income stage
witnessed the decline in growth of all
three economies, but Malaysia
experienced a steep drop of nearly 3%
points compared to less than 1% point of
the two Tigers (Table 4A, Panel A).
During this stage, while Malaysia still
maintained employment growth of 2.5%
higher than those of the two Tigers, its
ALP growth decreased by a half to 2%,
making a gap of about 4% points in ALP
growth with the two Tigers.
The revealed sources of growth indicate
that, while the decreased contribution of
labor input was offset by less negative
TFP growth, Malaysia’s drop in GDP
growth was almost due to the reduced
contribution of capital input, resulting in
a gap of 2% points with South Korea and
nearly 1% point with Taiwan in this
measure. This was caused by the steep
decline in investment in Malaysia after
the AFC, which will be discussed more
in Section 4. It is also noted that, while
TFP growth made remarkable
contribution to the two Tigers’ growth
(1.3% points for South Korea and 2.1%
points for Taiwan), Malaysia continued
its negative TFP growth, though less
severe, in this latter stage (Table 4A,
Panel B).
Regarding the TFP deterioration of
Malaysia in both lower- and upper-
middle-income stages, one may argue
that the negative TFP growth might be
attributed to the major shocks the
economy experienced in 1985-1986,
1997-1998 or 2007-2008, and may not
fully reflect the efficiency improvement
and technological progress of the
economy in normal condition. However,
Table 4B, presenting the sources of
growth during high performance periods
without shocks, indicates that the
contribution of TFP to Malaysia’s growth
was modest and far below those of the
two Tigers. This implies TFP
enhancement played an insignificant role
during Malaysia’s middle-income
transition.
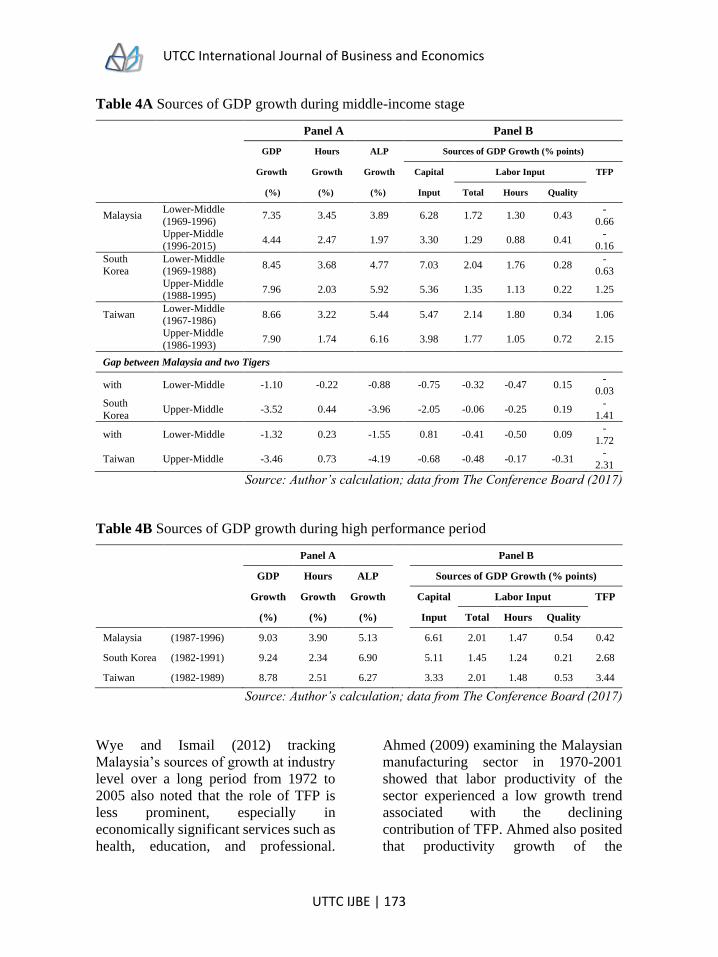
UTCC International Journal of Business and Economics
UTTC IJBE | 173
Table 4A Sources of GDP growth during middle-income stage
Panel A Panel B
GDP Hours ALP Sources of GDP Growth (% points)
Growth Growth Growth Capital Labor Input TFP
(%) (%) (%) Input Total Hours Quality
Malaysia Lower-Middle
(1969-1996) 7.35 3.45 3.89 6.28 1.72 1.30 0.43
-
0.66
Upper-Middle
(1996-2015) 4.44 2.47 1.97 3.30 1.29 0.88 0.41
-
0.16
South
Korea
Lower-Middle
(1969-1988) 8.45 3.68 4.77 7.03 2.04 1.76 0.28
-
0.63
Upper-Middle
(1988-1995) 7.96 2.03 5.92 5.36 1.35 1.13 0.22 1.25
Taiwan Lower-Middle
(1967-1986) 8.66 3.22 5.44 5.47 2.14 1.80 0.34 1.06
Upper-Middle
(1986-1993) 7.90 1.74 6.16 3.98 1.77 1.05 0.72 2.15
Gap between Malaysia and two Tigers
with Lower-Middle -1.10 -0.22 -0.88 -0.75 -0.32 -0.47 0.15 -
0.03
South
Korea Upper-Middle -3.52 0.44 -3.96 -2.05 -0.06 -0.25 0.19
-
1.41
with Lower-Middle -1.32 0.23 -1.55 0.81 -0.41 -0.50 0.09 -
1.72
Taiwan Upper-Middle -3.46 0.73 -4.19 -0.68 -0.48 -0.17 -0.31 -
2.31
Source: Author’s calculation; data from The Conference Board (2017)
Table 4B Sources of GDP growth during high performance period
Panel A Panel B
GDP Hours ALP Sources of GDP Growth (% points)
Growth Growth Growth Capital Labor Input TFP
(%) (%) (%) Input Total Hours Quality
Malaysia (1987-1996) 9.03 3.90 5.13 6.61 2.01 1.47 0.54 0.42
South Korea (1982-1991) 9.24 2.34 6.90 5.11 1.45 1.24 0.21 2.68
Taiwan (1982-1989) 8.78 2.51 6.27 3.33 2.01 1.48 0.53 3.44
Source: Author’s calculation; data from The Conference Board (2017)
Wye and Ismail (2012) tracking
Malaysia’s sources of growth at industry
level over a long period from 1972 to
2005 also noted that the role of TFP is
less prominent, especially in
economically significant services such as
health, education, and professional.
Ahmed (2009) examining the Malaysian
manufacturing sector in 1970-2001
showed that labor productivity of the
sector experienced a low growth trend
associated with the declining
contribution of TFP. Ahmed also posited
that productivity growth of the

UTCC International Journal of Business and Economics
UTTC IJBE | 174
manufacturing sector was input-driven
rather than TFP-driven. This trend was
unhealthy for Malaysia because the
advancement of labor quality, reflecting
the capabilities of the labor force, and of
TFP, to large extent capturing the
technological capabilities and efficiency
of the economy, plays decisive roles in
boosting productivity growth particularly
when the economy progresses to higher
income with already high level of capital
accumulation.
Discussion on the
causes of Malaysia’s
middle-income trap
This section provides an in-depth
discussion on the causes of Malaysia’s
sluggish growth, continuing the analysis
in Section 3. Before that, it is necessary
to understand the overarching
institutional setting – the New Economic
Policy (NEP) – that shaped the long-term
development journey of Malaysia.
The Malaysian government introduced
the NEP in 1971 in response to the 1969
ethnic riots, with affirmative action
policies in favor of the majority
Bumiputera (Malays and indigenous
ethnics) who were at economically
disadvantageous position compared to
the Chinese and Indian. While targeting
poverty reduction for the general
population, the NEP aimed at eliminating
economic disparity between the
Bumiputera and other ethnics by
addressing the concerns of the former
about employment, income distribution,
and ownership of wealth, and promoting
the formation of a Bumiputera
commercial and industrial community.
The NEP set the target of raising
Bumiputera corporate ownership to 30%,
reducing corporate ownership by other
ethnics to 40%, and capping foreign
ownership at 30% by 1990 (Webster,
2014).
Under the NEP, the Bumiputera were
entitled to many privileges in a wide
range of areas. They were reserved for
large shares of quotas for public sector
jobs and university admission, while the
Bumiputera businesses were given
priorities including access to government
contracts. The NEP required private
companies to reserve at least 30% of their
shares and employment, including
manager positions, for the Bumiputera.
For manufacturing activities, private
firms in this sector were subjected to
getting government licenses in line with
the NEP, which required the companies
at certain size to comply with the
minimum 30% rule of Bumiputera
reservation in terms of equity,
employment, board of directors, and
distributor appointment. Conforming
with the rule ensured not only the legal
operation but also the access to formal
government incentives, government
contracts and participation in exports.
Most of the policies under the NEP,
which officially ended in 1990,
continued in subsequent national policy
programs and had significant effect on
Malaysia’s long-term performance.
Though these policies have promoted
equity and political stability conducive to
development, to a certain extent they
might have hindered growth (Tan, 2014).
The distortions resulted from the
discriminatory policies are believed to
have stunted investment, and thus
growth, of Malaysia (Menon, 2014). The
Bumiputera quota on ownership structure
disincentivized successful Chinese

UTCC International Journal of Business and Economics
UTTC IJBE | 175
Malaysian firms to expand their
production to avoid the NEP’s
restrictions or drove them to move their
headquarters to foreign lands (Woo,
2009). According to Henderson and
Phillips (2007), successive Malaysian
governments used this measure to limit
capital accumulation among wealthy
Chinese Malaysian and contain their
influence on the economy. Consequently,
unlike the Taiwan case, very few
Malaysian firms were able to transform
from import substituting goods producers
to major exporters of these goods (Woo,
2009).
The second factor that hindered
investment of both domestic and foreign
investors was the crowding out from the
heavy presence of government-linked
corporations (GLCs) characterized with
close ties to government agencies,
opaque operation and lack of pressures
for upgrading (Menon, 2014; Hill et al.,
2012; Gomez, 2012; Woo, 2009). These
GLCs held dominant role in many key
industries, including utilities (93% in
terms of market share), transportation
and warehouse (80%), agriculture,
banking, communication, and retail trade
(over 50%). Menon (2014) argued that,
as most of these industries are neither
strategic nor natural monopolies, the
heavy presence of GLCs could not be
economically justified. Menon and Ng
(2013) also evidenced that the GLC’s
share of 60% or higher in an industry
would discourage private investment in
that industry.
Though the two discouragements had
existed for long, the outbreak of AFC
was indeed a critical juncture, which
exacerbated the situation and
fundamentally changed the course of
investment and growth of Malaysia. In
fact, the private investment flow – both
foreign and domestic – into the economy
declined sharply after AFC and the trend
persisted until recent years. As shown in
Figure 6, while public investment
remained stable at around 10% of GDP,
private investment dropped 15%-20%
points, from about 25%-30% before the
crisis to around 10% after that, which cut
total investment flow by nearly a half
from about 40%-45% to 20%-25% of
GDP. This explains the fall in the
contribution of capital input to GDP
growth during Malaysia’s upper-middle-
income stage as pointed out in Table 4A.

UTCC International Journal of Business and Economics
UTTC IJBE | 176
Figure 6 Malaysia’s gross fixed capital formation as a percentage of GDP, 1990-2015
Source: Author; data from World Bank (2020)
The dynamics of financial flows may
provide some hints of the causes of
declining private investment in Malaysia
in the recent period. The FDI inflow of
Malaysia decreased significantly after
the AFC, and only resumed the 1997
level in 2006 in absolute terms and
continued to increase in subsequent
years, with a fall in 2009 due to the GFC.
As a percentage of GDP, however, the
inflow after 2000 was only 3%-4%, well
below the level of 6%-8% during 1990-
1997. The FDI outflow also plunged
during 1998-2003 but rebounded
strongly with a record high of 6.5% in
2008 and maintained at 4%-5% in
subsequent years, compared to about 2%-
3% before AFC (Figure 7). The
combination of the decline in FDI inflow
and the rise in FDI outflow obviously led
to investment contraction, but it might
only account for a small part of the fall of
private investment (10%-15% of GDP)
after AFC. A more persuasive
explanation in this vein could be the
massive outflow of illicit capital from
both foreign and domestic investors,
making Malaysia the third among the top
ten in the world (after China and Mexico)
and the second among the top five in Asia
(China, Malaysia, the Philippines, India,
and Indonesia), despite its modest
population (Menon, 2014). The flow was
estimated to range from US$12.5 billion
to US$64.4 billion per annum,
accumulating to US$285 billion for
2001-2010 (Kar & Freitas, 2012). The
figure was as significant as 80% of gross
fixed capital formation and 18% of GDP
of Malaysia, on average, during this
period. According to the Global
Financial Integrity, the underlying
drivers included generic structural and
governance issues such as political
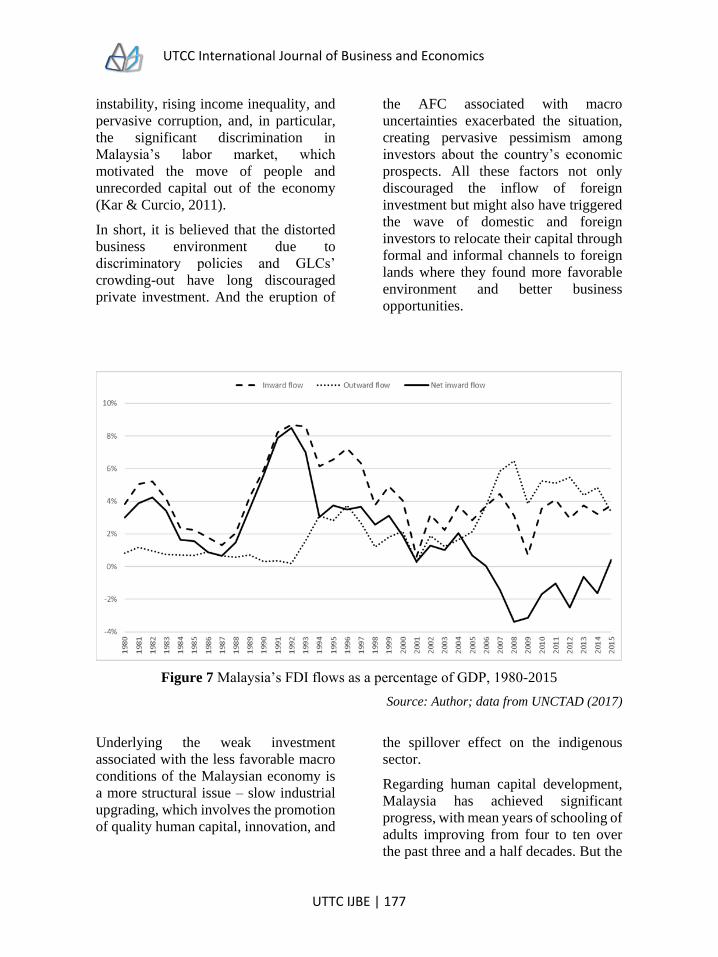
UTCC International Journal of Business and Economics
UTTC IJBE | 177
instability, rising income inequality, and
pervasive corruption, and, in particular,
the significant discrimination in
Malaysia’s labor market, which
motivated the move of people and
unrecorded capital out of the economy
(Kar & Curcio, 2011).
In short, it is believed that the distorted
business environment due to
discriminatory policies and GLCs’
crowding-out have long discouraged
private investment. And the eruption of
the AFC associated with macro
uncertainties exacerbated the situation,
creating pervasive pessimism among
investors about the country’s economic
prospects. All these factors not only
discouraged the inflow of foreign
investment but might also have triggered
the wave of domestic and foreign
investors to relocate their capital through
formal and informal channels to foreign
lands where they found more favorable
environment and better business
opportunities.
Figure 7 Malaysia’s FDI flows as a percentage of GDP, 1980-2015
Source: Author; data from UNCTAD (2017)
Underlying the weak investment
associated with the less favorable macro
conditions of the Malaysian economy is
a more structural issue – slow industrial
upgrading, which involves the promotion
of quality human capital, innovation, and
the spillover effect on the indigenous
sector.
Regarding human capital development,
Malaysia has achieved significant
progress, with mean years of schooling of
adults improving from four to ten over
the past three and a half decades. But the

UTCC International Journal of Business and Economics
UTTC IJBE | 178
problem of Malaysia might lie on skill
acquisition, not general education.
Empirically, Asian Development Bank
(2008) revealed from a survey in 2003
that manufacturers in Malaysia pointed to
inadequate skilled workers as the top
obstacle for doing business. The root
cause of the problem might not be the
lack of education expenditure or
universities and colleges, but quality,
access and recruitment constraint.
Besides the race for quantity of training
institutions at the expense of quality,
there was also a mismatch between the
skills generated in local vocational and
higher education institutions and the
demand of the labor market (Fleming &
Søborg, 2014; Menon, 2014; Hill et al.,
2012). The race-based quota system
granted entry to post-secondary
education in favor of the Bumiputera
might have excluded many more
qualified candidates or included
unqualified ones, resulting in suboptimal
allocation (Lee & Nagaraj, 2012). This
discriminatory policy was also applied
for recruitment, which motivated not
only oversea students of Chinese and
Indian ethnics to stay abroad but also
local professionals of these communities
to look for better opportunities in foreign
countries. This made Malaysia a net
exporter of skills, though hosting a huge
amount of unskilled migrant labor
accounting up to a quarter of its
workforce (Rasiah et al., 2015). Malaysia
has been in urgent need of education
reforms, but the division among the
ruling coalition and the strong party-state
merger remained a formidable political
challenge for such reforms (Fleming &
Søborg, 2014).
With respect to innovation, the
government has put effort to upgrade the
country’s innovation capabilities, but the
results seemed to be far below
expectation. In terms of R&D
investment, it seems that Malaysia did
not spend sufficiently especially in its
early years of middle income. While the
lack of data on R&D expenditure before
1996 does not facilitate a comparison
with advanced economies at comparable
stages of development, it is observed
that, when turning into high income, this
spending as a percentage of GDP of
South Korea (2.24% in 1996) was
significantly higher than that of Malaysia
(1.3% in 2015), which suggests South
Korea’s R&D investment was much
stronger than Malaysia’s during their
middle-income transitions (Table 5).
The available data also indicates that
Malaysia considerably trailed China (and
even India in early years) on R&D
investment despite its higher income
level. When Malaysia attained upper-
middle-income status in 1996, its R&D
expenditure was only 0.22%, which
suggests the spending was even smaller
in its lower-middle-income years. In
contrast, the figure of China was 0.56%
in 1996 and rose rapidly to 1.37% in 2006
to 2.07% in 2015. Malaysia only speeded
up its R&D spending in the recent
decade, from 0.61% in 2006 to 1.3% in
2015 (Table 5). The gap in R&D
expenditure between the two economies
may explain to some extent the gap in
R&D outcomes as evidenced by the
number of patent and industrial design
applications in Figure 8.
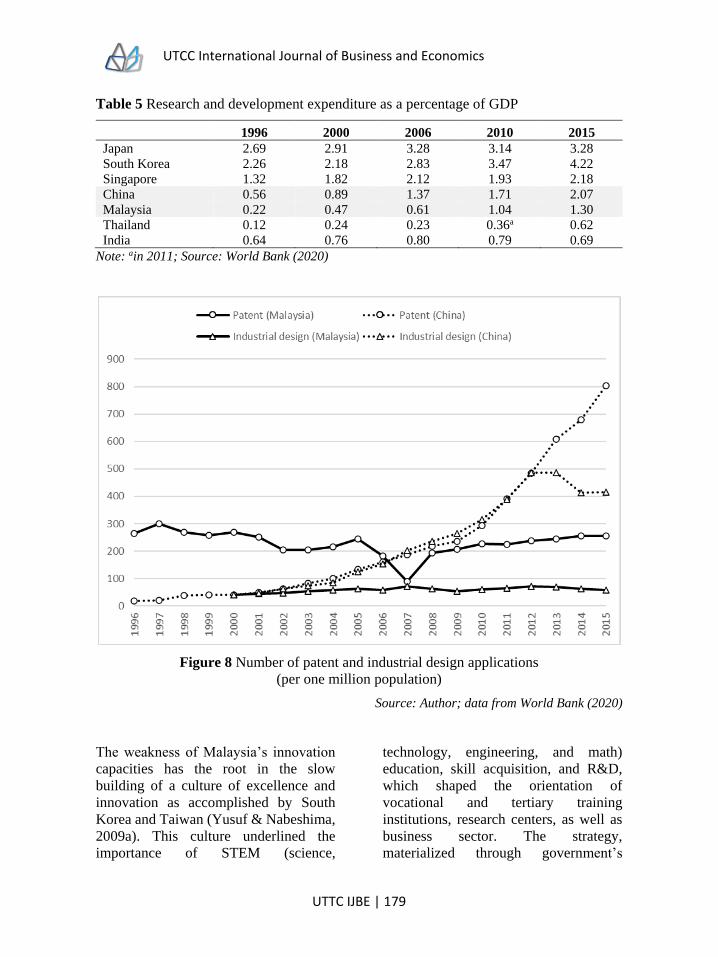
UTCC International Journal of Business and Economics
UTTC IJBE | 179
Table 5 Research and development expenditure as a percentage of GDP
1996 2000 2006 2010 2015
Japan 2.69 2.91 3.28 3.14 3.28
South Korea 2.26 2.18 2.83 3.47 4.22
Singapore 1.32 1.82 2.12 1.93 2.18
China 0.56 0.89 1.37 1.71 2.07
Malaysia 0.22 0.47 0.61 1.04 1.30
Thailand 0.12 0.24 0.23 0.36a 0.62
India 0.64 0.76 0.80 0.79 0.69
Note: ain 2011; Source: World Bank (2020)
Figure 8 Number of patent and industrial design applications
(per one million population)
Source: Author; data from World Bank (2020)
The weakness of Malaysia’s innovation
capacities has the root in the slow
building of a culture of excellence and
innovation as accomplished by South
Korea and Taiwan (Yusuf & Nabeshima,
2009a). This culture underlined the
importance of STEM (science,
technology, engineering, and math)
education, skill acquisition, and R&D,
which shaped the orientation of
vocational and tertiary training
institutions, research centers, as well as
business sector. The strategy,
materialized through government’s

UTCC International Journal of Business and Economics
UTTC IJBE | 180
tangible incentives, not only enhanced
the quality of the labor force but also
promoted innovation in line with the
market demand, which was crucial for
retaining competitive edge and fostering
structural transformation. In Malaysia,
the regulatory environment influenced by
the NEP has hindered the competition
among universities, which undermined
the efforts to enhance the quality of
teaching and research (Lee & Nagaraj,
2012). In the business sector, while the
GLCs had little incentive to engage in
innovation, it is unexpected that most
local private firms and multinational
corporations (MNCs) only conducted
R&D marginally. For instance, only 1%
of the total electronics MNCs conducted
design and R&D activities in 2007
(Rasiah et al., 2015).
One reason was the market structure with
major conglomerates dominating the
industrial landscape, which dampened
competition, raised entry barriers for new
firms with creativity, and discouraged the
innovation initiatives of existing ones.
For the MNCs, the influx of cheap
migrant workers guaranteed the
profitability of their labor-intensive
assembly activities, which relaxed the
pressure of upgrading, particularly risky
R&D activities amidst the lack of
necessary conditions such as quality
human resources (Yusuf & Nabeshima,
2009a; Rasiah et al., 2015). In addition,
ineffective vertical industrial policies
that supported selective industries might
discourage innovation activities. As
noted by Otsuka and Natsuda (2016), in
the automotive industry, the government
provided strong backing for the national
producers Proton and Perodua but not the
local parts and components
manufacturers. With orientation to the
domestic market, these producers had
less incentive to innovate and mainly
focused on assembly of imported
materials, failing to become even
regional brands. At the same time, local
parts and components manufacturers
missed the opportunity to upgrade their
capabilities to participate in the
automotive value chain.
The upgrade of the domestic firms’
capabilities and strengthening their
linkages with the FDI sector remained a
key challenge of Malaysia. While the
goal of FDI policy was to seek spillovers
for skill development and technology
transfer, the interaction between the FDI
sector and the rest of the economy has
been modest at best. FDI firms in the
electronics industry in Penang, for
instance, engaged primarily in low value-
added activities facilitated by abundant
low-skilled migrant workers largely from
Indonesia with limited demand for local
technicians and engineers (Henderson &
Phillips, 2007). Yusuf and Nabeshima
(2009b) posited that though there existed
some diffusion of knowledge and skills
from labor turnover at the MNCs to the
local economy and linkages with local
suppliers mostly for low-tech products,
the expected outcomes on increased local
value-added, technological upgrade, and
new start-ups were not achieved. They
also argued that both sides faced
obstacles that hindered the promotion of
the linkages. On the one hand, partnering
with local suppliers requires the MNCs to
bear high transaction costs for cultivating
them, which might not be preferable to
the option of maintaining a small number
of competent suppliers. On the other
hand, new suppliers usually lack
necessary capabilities and are subjected
to high costs for developing products,
marketing to MNCs and getting
certifications. Therefore, only few
UTCC International Journal of Business and Economics
UTTC IJBE | 181
domestic firms were able to meet the
requirements to enter the MNCs’ value
chains. At best the Malaysian domestic
firms could only become second- or
third-tier suppliers of less sophisticated
parts and components.
The Malaysian government have been
ineffective in urging the MNCs to adjust
their business model to the one that
engages in more R&D activities and
partners more with local suppliers as long
as the existing one remained
satisfactorily profitable. The main reason
was that the government worried, amidst
the intense competition on FDI
attraction, MNCs would move away if
the rules requiring local sourcing were
strongly enforced (Yusuf & Nabeshima,
2009a).
Conclusion and policy
implications
This paper comprehensively reviews the
literature on middle-income trap, a
phenomenon observed for many middle-
income countries that failed to transition
from middle to high income, and reflects
upon the case of Malaysia’s middle-
income transition with the aim of
drawing relevant policy implications.
The literature reveals that the investment
slowdown often occurring at middle-
income due to several factors, including
deteriorated competitiveness of labor-
intensive industries associated with
rapidly rising wages, may significantly
hinder growth. This is usually coupled
with the lack of necessary conditions of
quality human capital and technological
capabilities, which hampers the structural
transformation toward higher value-
added activities. These factors, however,
are usually affected by the underlying
context-specific institutional constraints.
Unfortunately, radical reforms for
upgrading the necessary conditions for
boosting growth require the pro-
upgrading political coalitions that may be
often unavailable in middle-income
nations.
Malaysia achieved remarkable growth
during its lower-middle-income
transition, compared to the two sizeable
Asian Tigers – South Korea and Taiwan.
The country was “trapped” in its upper-
middle-income years, which was marked
by the eruption of the AFC as the turning
point altering the course of Malaysia’s
development. The slowdown was driven
by the consistent decline in private
investment, resulted primarily from the
outflow of capital besides the decrease in
inward FDI. The outbreak of the AFC
associated with macro uncertainties
somehow led to pervasive pessimism
among investors about the economic
prospects, which triggered the relocation
of capital to foreign lands. This was
coupled with the long-lasting
unfavorable business environment due to
discriminatory policies in favor of the
Bumiputera and the crowding-out of
GLCs. Throughout its middle-income
years, the economy consistently faced
many structural problems, including
sluggish TFP growth, relatively modest
structural change, slow industrial
upgrading as well as premature
deindustrialization. These had root in the
slow upgrade of human capital,
innovation and indigenous capacity, and
the ineffective exploitation of spillovers
from the FDI sector.
Malaysia may not expect its private
investment to recover to the level as high
as in the pre-AFC period. Therefore,

UTCC International Journal of Business and Economics
UTTC IJBE | 182
while it is always necessary to improve
the business environment for attracting
investment, particularly eliminating the
market distortions as mentioned above,
the growth drivers should shift to
enhancing the quality of labor force and
TFP. The country needs more radical
reforms especially in building quality
human capital, technological capabilities
and indigenous capacity. These reforms
are expected to be tough given
Malaysia’s political conditions, requiring
the mobilization of pro-upgrading
coalitions as Doner and Schneider (2017)
suggested.
The reflection upon the case of
Malaysia’s middle-income transition
suggests the following policy
implications for low and lower-middle-
income nations, especially those of the
ASEAN region engaging with the East
Asian FDI- and export-led model.
First, the top priority requiring persistent
efforts is to continuously upgrade the
fundamentals for economic
development, including human capital,
innovation capabilities and indigenous
capacity, which enables to sustain
healthy structural transformation to
higher value-added activities and
effectively exploit the spillovers from
and integrate with the FDI sector.
Second, regarding the institutional and
political settings, besides the stability in
general, it is always necessary to build
pro-upgrading coalitions for formulating
and implementing policies to support the
upgrade of the fundamental factors.
While often remaining a challenge for
traditional democracies to come to
consensus for upgrading efforts, it is
indeed an advantage for authoritarian
states like Vietnam if they are able to
proactively democratize and build
consensus for upgrading policies that
would enable the country to speed up its
structural reforms and economic catch-
up.
Third, it is essentially important to build
a conducive business environment that
guarantees a fair playing field for all
stakeholders – be it state-owned, private,
or foreign sector. While ensuring
sufficient support for the FDI sector, it is
crucial to effectively nurture the
indigenous sector, which requires
deliberate strategies to promote its
technological capabilities and integration
with the FDI sector and the world
economy.
Finally, the governments have to be
prepared for managing unforeseen
shocks and resilience, which is decisive
to maintain the optimism of the public
and the domestic and foreign investors
about the economic prospects of the
nations. The recent military coup in
Myanmar, the increasing risk of military
conflict in the East Sea (South China Sea)
facing Vietnam, or the recent global
Covid-19 pandemic may disrupt the
countries’ growth momentum and
change the course of their economic
development if their leaderships do not
take enough sound actions.
Policy makers in low and lower-middle-
income nations like those of ASEAN
region should pay strategic attention to
all these issues from the early years of
their economic catch-up endeavors in
order to overcome unforeseen shocks and
maintain sufficient growth momentum
for successfully managing the middle-
income transition.

UTCC International Journal of Business and Economics
UTTC IJBE | 183
References
Agénor, P. R., & Canuto, O. (2015). Middle-income growth traps. Research in Economics,
69(4), 641-660.
Agénor, P. R., Canuto, O., & Jelenic, M. (2012). Avoiding middle-income growth traps.
World Bank - Economic Premise, 98, 1-7.
Ahmed, E. M. (2009). Factors shaping Malaysia’s manufacturing productivity growth.
Singapore Economic Review, 54(2), 249-262.
Aiyar, S., Duval, R. A., Puy, D., Wu, Y., & Zhang, L. (2018). Growth slowdowns and the
middle income trap. Japan and the World Economy, 48, 22-37.
Asian Development Bank (2008). Asian development outlook 2008: Workers in Asia.
Manila, Philippines.
Asian Development Bank (2013). Key indicators for Asia and the Pacific 2013. Manila,
Philippines.
Asian Productivity Organization (2020). APO Productivity Database 2020 Version 1.
Tokyo, Japan. http://www.apo-tokyo.org/wedo/measurement.
Bulman, D., Eden, M., & Nguyen, H. (2017). Transitioning from low-income growth to
high-income growth: Is there a middle income trap? Journal of the Asia Pacific
Economy, 22(1), 5-28.
Cai, F. (2012). The coming demographic impact on China’s growth: The age factor in the
middle-income trap. Asian Economic Papers, 11(1), 95-123.
Doner, R. F., & Schneider, B. R. (2017). The middle-income trap: More politics than
economics. World Politics, 68(4), 608-644.
Eichengreen, B. (2011). Escaping the Middle-Income Trap. In Achieving maximum long-
run growth – Proceedings of 2011 Jackson Hole Economic Policy Symposium
(pp. 409-419). Federal Reserve Bank of Kansas City.
Eichengreen, B., Park, D., & Shin, K. (2012). When fast-growing economies slow down:
International evidence and implications for China. Asian Economic Papers,
11(1), 42-87.
Eichengreen, B., Park, D., & Shin, K. (2014). Growth slowdowns redux: New evidence on
the middle income trap. Japan and the World Economy, 32, 65-84.
Felipe, J. (2012). Tracking the middle-income trap: What is it, who is in it, and why? Part
1. ADB Economics Working Paper Series No. 306, Asian Development Bank,
Manila, Philippines.
Felipe, J., Kumar, U., & Galope, R. (2017). Middle-income transitions: Trap or myth?
Journal of the Asia Pacific Economy, 22(3), 429-453.
UTCC International Journal of Business and Economics
UTTC IJBE | 184
Flechtner, S., & Panther, S. (2015). Economic inequality, political power and political
decision-making: The case of the “middle-income trap.” In S. Fadda & P. Tridico
(Eds), Varieties of economic inequality (pp. 73-95). London: Routledge.
Fleming, D., & Søborg, H. (2014). Are emerging South-east Asian economies caught in a
middle-income trap? Case: Malaysia – paradoxes in provision of higher skilled
labor. Forum for Development Studies, 41(1), 115-133.
Garrett, G. (2004). Globalization’s missing middle. Foreign Affairs, 83, 84-96.
Gill, I., & Kharas, H. (2007). An East Asian renaissance: Ideas for economic growth.
Washington, DC: World Bank.
Gill, I., & Kharas, H. (2015). The middle-income trap turns ten. World Bank Policy
Research Working Paper 7403, Washington, DC, USA.
Gomez, E. T. (2012). The politics and policies of corporate development: Race, rents and
redistribution in Malaysia. In H. Hill, T. S. Yean & R. M. Zin (Eds), Malaysia’s
development challenges: Graduating from the middle. London: Routledge.
Hanson, M. (2008). Economic development, education and transnational corporations.
London: Routledge.
Henderson, J., & Phillips, R. (2007). Unintended consequences: Social policy, state
institutions and the ‘stalling’ of the Malaysian industrialization project. Economy
and Society, 36(1),78-102.
Hill, H., Yean, T. S., & Zin, R. H. M. (2012). Malaysia: A success story stuck in the
middle? The World Economy, 35(12), 1687-1711.
Im, F. G., & Rosenblatt, D. (2015). Middle-income traps: A conceptual and empirical
survey. Journal of International Commerce, Economics and Policy, 6(3), 1-39.
Jorgenson, D. W., Ho, M. S., & Stiroh, K. J. (2003). Lessons from the U.S. growth
resurgence. Journal of Policy Modeling, 25(5), 453-470.
Kar, D., & Curcio, K. (2011). Illicit financial flows from developing countries 2000-2009
– Update with a focus on Asia. Global Financial Integrity, Washington, DC,
USA.
Kar, D., & Freitas, S. (2012). Illicit financial flows from developing countries: 2001-2010.
Global Financial Integrity, Washington, DC, USA.
Lee, K. H., & Nagaraj, S. (2012). The crisis in education. In H. Hill, T. S. Yean & R. M.
Zin (Eds), Malaysia’s development challenges: Graduating from the middle.
London: Routledge.
McMillan, M., & Rodrik, D. (2011). Globalization, structural change and productivity
growth. NBER Working Paper No. 17143, National Bureau of Economic
Research, Cambridge, MA, USA.
Menon, J. (2014). Growth without private investment: What happened in Malaysia and can
it be fixed? Journal of the Asia Pacific Economy, 19(2), 247-271.
UTCC International Journal of Business and Economics
UTTC IJBE | 185
Menon, J., & Ng, T. H. (2013). Are government-linked corporations crowding out private
investment in Malaysia? Working Papers in Trade and Development No.
2013/03, Arndt-Corden Department of Economics, Australian National
University, Canberra, Australia.
OECD (2016). The Trade in Value Added (TiVA) Database. https://stats.oecd.org/index.
aspx?queryid=75537#.
OECD (2011). ISIC Rev. 3 Technology Intensity Definition. https://www.oecd.org/sti/ind/
48350231.pdf.
Ohno, K. (2009). Avoiding the middle income trap: Renovating industrial policy
formulation in Vietnam. ASEAN Economic Bulletin, 26(1), 25-43.
Otsuka, K., & Natsuda, K. (2016). The determinants of total factor productivity in the
Malaysian automotive industry: Are government policies upgrading
technological capacity? Singapore Economic Review, 61(4), 1-18.
Rasiah, R. (2011). Is Malaysia facing negative deindustrialization? Pacific Affairs, 84(4),
715-736
Rasiah, R., Crinis, V., & Lee, H. A. (2015). Industrialization and labor in Malaysia. Journal
of the Asia Pacific Economy, 20(1), 77-99.
Rodrik, D. (2016). Premature deindustrialization. Journal of Economic Growth, 21(1), 1-
33.
Rudengren, T., Rylander, L., & Casanova, C. R. (2014). It’s democracy, stupid:
Reappraising the middle-income trap. Stockholm Paper May 2014, Institute for
Security and Development Policy, Stockholm, Sweden.
Spence, M. (2011). The next convergence – the future of economic growth in a multispeed
world. New York: Farrar, Straus and Giroux.
Tan, E. C. (2014). Malaysia’s economic growth and development: Challenges and the way
forward. Singapore Economic Review, 59(3), 1-17.
The Conference Board (2017). Total Economy Database. https://www.conference-
board.org/data/economydatabase/index.cfm?id=27762.
Timmer, M. P., & de Vries, G. J. (2009). Structural change and growth accelerations in
Asia and Latin America: A new sectoral data set. Cliometrica, 3(2), 165-190.
UNCTAD (2017). UNCTAD statistics. Available at http://unctad.org/en/Pages/
statistics.aspx.
Vu, K. (2013). The dynamics of economic growth: Policy insights from comparative
analyses in Asia. Cheltenham: Edward Elgar.
Vu, K. (2017). Structural change and economic growth: Empirical evidence and policy
insights from Asian economies. Structural Change and Economic Dynamics, 41,
64-77.

UTCC International Journal of Business and Economics
UTTC IJBE | 186
Wang, Y. (2016). The political economy of the middle-income trap: Implications for
potential growth. Asian Development Review, 33(2), 167-181.
Webster, T. J. (2014). Malaysian economic development, leading industries and
industrial clusters. Singapore Economic Review, 59(5), 1-15.
WITS (2020). World Integrated Trade Solution database. https://wits.worldbank.org/.
Woo, W. T. (2009). Getting Malaysia out of the middle-income trap. Available at SSRN:
http://ssrn.com/abstract=1534454.
Woo, W. T. (2012). China meets the middle-income trap: The large potholes in the road to
catching-up. Journal of Chinese Economic and Business Studies, 10(4), 313-336.
World Bank (1993). The East Asian miracle: Economic growth and public policy. New
York: Oxford University Press.
World Bank (2013). China 2030: Building a modern, harmonious, and creative high-
income society. Washington, DC: World Bank.
World Bank (2020). World Development Indicators database. https://databank.worldbank.
org/source/world-development-indicators
Wye, C. K., & Ismail, R. (2012). Sources of labor productivity growth by economic sectors:
A study of Malaysia 1972-2005. International Journal of Management, 29(2),
760-777.
Yusuf, S., & Nabeshima, K. (2009a). Tiger economies under threat: A comparative
analysis of Malaysia’s industrial prospects and policy options. Washington, DC:
World Bank.
Yusuf, S., & Nabeshima, K. (2009b). Can Malaysia escape the middle-income trap? A
strategy for Penang. World Bank Policy Research Working Paper No. 4971,
World Bank, Washington, DC, USA.
UTCC International Journal of Business and Economics
UTTC IJBE | 187
UTCC International Journal of Business and Economics (UTCC IJBE)
Volume 13 Number 2, August 2021
INVESTIGATING THE FACTORS EFFECTING SERVICE
QUALITY UNDER LEAN IMPLEMENTATION WITHIN
COMMERCIAL AIRLINES INDUSTRY IN THAILAND
Walwisa Pongugsorn1 and Nattapan Buavaraporn2 1,2 International school of management, University of the Thai Chamber of
Commerce 126/1 Vibhavadi Rangsit Rd., Dindang, Bangkok 10400, Thailand [email protected], [email protected]
Abstract Lean has been widely adopted in organizations as the strategy for attaining the
equilibrium between quality, productivity, cost, profitability and customer’s contentment
with proven result from a number of business improvement engagement. This research
aims primarily to investigate the factors effecting service quality under Lean
Implementation within the major commercial airlines industry in Thailand. Based on
extant literature, six main factors are of processes, planning and control, HR, top
management and leadership, customer relations and supplier relations. Through the
interviews conducted with airlines practitioners, the employee engagement is considered
another additional factor affecting the effectiveness of Lean implementation. In total,
400 questionnaire survey were gathered from four commercial airlines implemented lean
as part of strategic improvement initiatives. The findings indicated that there are
significant positive relationships of HR, top management & leadership, process,
planning & control, customer relations, supplier relations, and employee engagement
toward the overall service quality of Airlines.
Introduction
Following the report of UNWTO (2011),
more than half of all international tourists
arrived at the destination through air
transport, in which the growth of air
transport which is the major element of
civil aviation is naturally connected to
the enlargement of tourism industry. The
majority of international air passengers
are travelling for the purpose of leisure or
professional tourism mainly, and thus the
aviation is key success for domestic
tourism development in many countries
(UNWTO, 2011). Further, air
transportation has become the key
UTCC International Journal of Business and Economics
UTTC IJBE | 188
component for global economic
development. Together with tourism
industry when taking all direct, indirect
and convinced effect into account, it is
representing the single importance
economic sector (Oxford Economics,
2012). Thailand’s airport capability is
the third biggest in the ASEAN region
after only Singapore and Malaysia
(ICAO, 2013). Airport of Thailand
(AOT) forecast that in the year 2015,
AOT will serve more than 56 million
passengers in response to growing
demand from tourism sector.
AOT (2014) reported that revenues of
Thailand’s aviation business in 2013 was
THB260 billion, which contributed
mainly by low cost airline and full
service airline for approximately THB35
billion and THB224 billion, respectively.
Since 2009-2013, the average overall
revenues from over Thai airlines had
grown by 9.1% with the majority of
growth from low cost airlines, whose
average revenues growth was 31.5
percent; while the full service airline
revenue growth was only 6.9 percent.
From this percentage of total revenue,
showing that low cost airlines has been
increasing in market shares. Though full
service airline presently govern the
market share but market share of low cost
airlines are now growing quickly and
cultivating the market share from the
main players in other segment.
This research aims to provide a guideline
for the overall commercial airline
industry in Thailand focusing on the
service quality improvement under Lean
implementation, and to overcome the
barriers that act as obstruct in the Lean
implementation within major
commercial airline industry in Thailand.
Additional, the overall service quality
under Lean framework can be used for
any airline industry, irrespectively of
location, as it consolidates all Lean
requirements. Moreover, the findings of
this research can further offer
comprehension into ASEAN Airlines
Industry in general and particular, as
most of ASEAN countries share similar
features, exceptionally with consider to
external factors. Finally, the Lean
operation framework can be used as a
checklist for managers who want to
consider in implementing service quality
assurance under Lean in the future or to
prepare for Lean readiness, as it will
empower them to learn whether the
organisation meets the essential for
implementing Lean, as suggested by Al-
Najem (2014).
Literature review
Lean operation
Lean is described as a rule of
optimization methodology that focuses
on improving the efficiency and
effectiveness of a process by eradicating
activities that do not add value to the
customers (Jones and Mitchell, 2006).
Lewis (2000) argued that Lean can help
organization within any divisions to
complete important performance
improvement. The improvement can be
in many measurements, including those
of productivity, quality, cost capabilities
with profitability and result of customer
satisfaction (Ohno, 1998). Womack et al
(1990) preserved the claim that Lean is a
business methodology and not naturally a
compilation of tools and techniques.
Liker (2004) agreed with this concept by
claiming that Lean is management
interference and greatest test is either can
lead to the better performance.
UTCC International Journal of Business and Economics
UTTC IJBE | 189
Lean has its roots in the manufacturing
especially in the car industry which
having been developed from the Toyota
Production System (Ohno, 1998). Later it
has been adapted and enlarging quickly
into the new sectors such as many private
manufacturing, construction, logistics &
transportation and service organizations
such as health, insurance, education,
bank and aviation, as suggested by
Wallace (2006). According to
Bergmiller and McCright (2009), Lean
can help to increase efficiency, reduce
customer response time, reducing costs,
improve profitability and enhance the
organisation’s attraction. In additional,
Lean can lead to sustainable development
by increasing customer satisfaction and
communication, and reducing cost and
delivery time as it is a systematic
approach that helps managers to identify
wastes and exclude them from the
organisation at every stage in the
operation, which will lead to better
organisational performance and make the
company waste-free (Upadhye et al.,
2010a).
Lean represents a useful philosophy that
can be employed in any organizations
regardless of their activities, sizes, or
sectors. However, these benefits cannot
be achieved unless the organisation
addresses the important issues involved
in Lean. According to Holweg (2007),
the biggest challenge facing
organizations is the understanding of
Lean’s core value as a philosophy and the
appreciating how the organization can
deal with national and organizational
culture differences. Indeed,
organizational culture is the main driver
for creating strategies to achieve the
goals of the organization (Wong, 2007).
Boyer and Sovilla (2003) said that the
main obstacles for Lean include
misunderstanding and undervaluing the
managerial and cultural impacts of it and
the fact that many organizations do not
know the requirements for creating a
Lean culture, conflicting measures and
illusions regarding the progress, a failure
to maintain Lean principles and using
Lean as a set of tools rather than a
philosophy for doing business.
Service quality under lean
implementation
The literature revealed several factors
and issues that can obstruct Lean
implementation, and several essential
aspects that need to be taken into account
to implementing Lean. These factors are
the bases of Lean Systematic that
organizations need to consider these
factors; and without them Lean cannot be
established or sustained. Based on the
previous research of Al-Najem (2014),
the required factors for implementing
Lean shown in the figure 1 below.
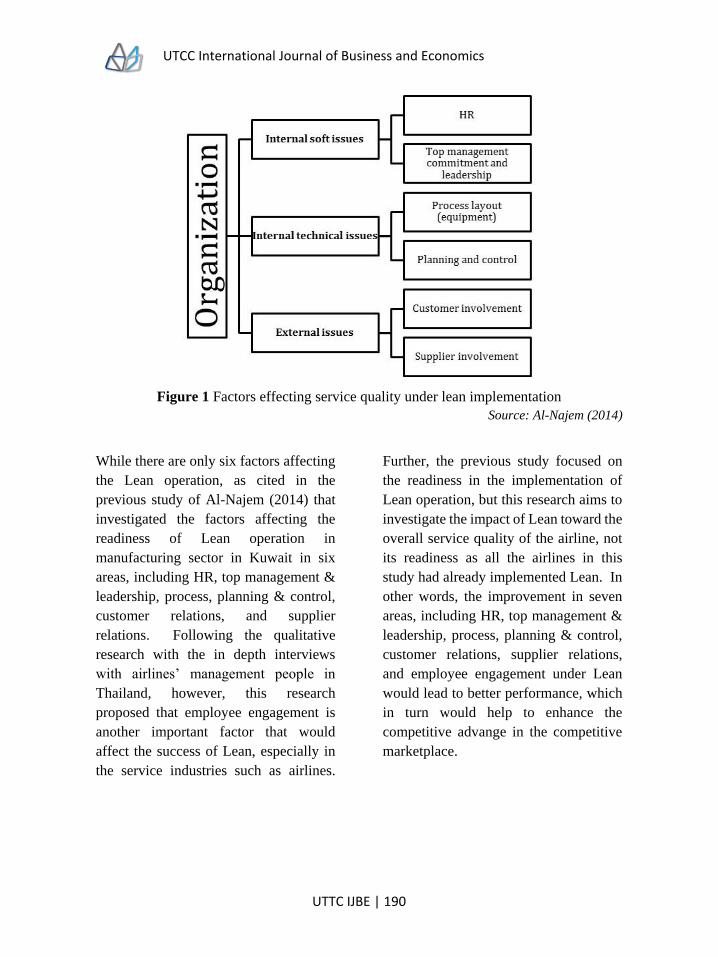
UTCC International Journal of Business and Economics
UTTC IJBE | 190
Figure 1 Factors effecting service quality under lean implementation
Source: Al-Najem (2014)
While there are only six factors affecting
the Lean operation, as cited in the
previous study of Al-Najem (2014) that
investigated the factors affecting the
readiness of Lean operation in
manufacturing sector in Kuwait in six
areas, including HR, top management &
leadership, process, planning & control,
customer relations, and supplier
relations. Following the qualitative
research with the in depth interviews
with airlines’ management people in
Thailand, however, this research
proposed that employee engagement is
another important factor that would
affect the success of Lean, especially in
the service industries such as airlines.
Further, the previous study focused on
the readiness in the implementation of
Lean operation, but this research aims to
investigate the impact of Lean toward the
overall service quality of the airline, not
its readiness as all the airlines in this
study had already implemented Lean. In
other words, the improvement in seven
areas, including HR, top management &
leadership, process, planning & control,
customer relations, supplier relations,
and employee engagement under Lean
would lead to better performance, which
in turn would help to enhance the
competitive advange in the competitive
marketplace.

UTCC International Journal of Business and Economics
UTTC IJBE | 191
Figure 2 Conceptual framework
Human resource (HR)
Training, empowerment, involvement
and recognition are important factors in
terms of Lean success (Kumar et al.,
2009; Zu et al., 2010; Mefford, 2009;
Zhang et al., 2012; Goodson, 2002), and
are required in order to produce high-
quality products. Employees are the core
of the company, and therefore need to be
encouraged and involved in company
strategy and direction, especially when
implementing Lean. Without skilled
workers, Lean will not last (Tsang and
Antony, 2001). This category represents
the core of Lean, as many authors and
researchers have stressed the role of HR.
Top management and leadership
The level of top management
commitment and leadership is crucial for
Lean. This commitment is manifest in
many forms, such as providing clear
vision, allocating resources and funding,
and providing strategic leadership (Tsang
and Antony, 2001). To ensure the success
of Lean implementation, it is essential for
top management to create a quality
culture by empowering other employees
(Zhang et al., 2012). This factor has been
emphasized in various articles (Zu et al.,
2010; Mefford, 2009; Kumar et al., 2009;
Achanga et al., 2006; Panizzolo, 1998).
Without top management and leadership
commitment, Lean implementation will
not succeed.
Processes
Process management is one of the most
important factors in terms of identifying
non-value-adding activities and
increasing quality. Ineffective processes
lead to more waste and lower
UTCC International Journal of Business and Economics
UTTC IJBE | 192
productivity per employee (Zhang et al.,
2012; Goodson, 2002; Lewis, 2000).
Service processes are defined by
Lovelock (2010) as “an activity or a
series of activities of more or less
intangible that normally (but not
necessarily) take place in interactions
between customers and service
employees and/or physical resources or
goods and/or systems of the service
provider, which are provided as solutions
to customer problems”.
Planning and control
Lewis (2000) and Goodson (2002) had
highlighted the importance of planning
and control, in which the use of quality
control systems and scientific methods is
employed to solve problems, as well as to
ensure the quality standard as it is key for
enhancing the firm’s performance and
eventually leads to higher levels of
customer satisfaction. Lovelock (2010)
pointed that service firms normally
encounter more problem in quality
management than those of manufacturing
firms as service cannot be inventoried
while consumers may have different
experience and perception when the
service was delivered.
Customer relations
As highlighted by Zu et al. (2010) and
Panizzolo (1998), maintaining good
customers is the aim of any company,
since all departments are ultimately
working to satisfy the customers’ wants
and needs. To this end, the company must
understand its customers’ requirements
(Zhang et al., 2012). Moreover, the
organization needs to respond quickly to
customer complaints. Meanwhile, Lean
is unlikely to be applicable if the
customer demands are unstable or
unpredictable, so they organisation must
have close relationships with its
customers.
Supplier relations
Similarly, this factor had been mentioned
in Zu et al. (2010), Zhang et al (2012),
and Panizzolo (1998) which suggested
that quality suppliers enable companies
to produce quality products. It is
important in Lean, as the long-term
relationships with suppliers will enable
the company to perform JIT, which is
essential for Lean. They further
explained that having fewer suppliers and
long-term relationships with them, and
making suppliers’ part of the firm’s team,
is healthy and essential for Lean.
Employee engagement
As suggested by Kahn (1990), employee
engagement is an approach in workplace
resulting in the right conditions for all
organizational members for giving their
best each day, committing to the
organizational goals and values instead
of one’s goals or values, inspiring to
contribute to the organizational
achievement, as well as enhancing their
well-being. Kahn (1990) also pointed out
that employee engagement relies on the
establishment of integrity, trust, two-
ways commitment and communication
among the organization itself and
members, which can lead to more
chances of business success, better
UTCC International Journal of Business and Economics
UTTC IJBE | 193
organizational and individual
performance, productivity and well-
being. Further, employee engagement
can be changed over time even better or
worse, fast or slow.
Research methodology
Research approaches & data
collection
Following the suggestion of Creswell
(2003) mixed methodological approach
was adopted, in which qualitative
research intended to investigate in depth
understanding toward the issues and to
further explore the another factor
affecting the Lean implementation and its
effectiveness; and quantitative research
was applied to test the hypothesis and
verified the theoretical framework
mentioned in previous studied in the case
of Thailand’s aviation industry. A mixed
method was designed to avoid the
weakness of a single method and to
enhance credibility and validity by
collecting data from multiple sources.
The qualitative research was conducted
with one manger from four commercial
airlines each through face-to-face
interviews. Meanwhile, the quantitative
research was conducted with
questionnaire survey for 400 respondents
with 100 respondents from four
commercial airlines each with the
adoption of convenience sampling
method, as suggested by Zikmund et al
(2012)
Data analysis
The reliability test was performed to
make sure that there was internal
consistency to carry on doing further
analysis. Descriptive analysis was used
to summarize the data that had been
gathered in term of frequency,
percentage, mean, and standard
deviation. For the hypothesis testing, the
independent sample t-test was used to
compare the mean scores for two
different groups to see if there was a
significant difference between two
groups of full service airlines and low
cost airlines. Further, Pearson
correlation and multiple linear regression
was carried out with different variables to
understand the relationship between two
or more variables.
Research results
Results of qualitative research
The finding from the qualitative research
revealed that the key strengths of their
airlines were ranging from the route
network, quality of service, hospitality of
service staffs, and reasonable service
fees, as well as international reputation of
the airline. The frequency of flying with
large number of passengers provided the
low cost airline with relatively lower
fixed costs for a unit, which in turn
allows the airlines to offer a service to
diverse group of customers to gain large
customer base at relatively low costs. To
further enhance the service, low cost
airline may need to have a wide network

UTCC International Journal of Business and Economics
UTTC IJBE | 194
with other airlines worldwide.
Meanwhile, the capital investment for
upgrading the aircrafts involves with
very high investment. For full service
airlines, it is very difficult to take the
advantage from economy of scale and
higher prices of service. Admittedly,
management people from full service
airlines pointed out that the operation
costs of airlines were very high.
From the observation, most of service
staffs from both full service airlines and
low cost airlines were very friendly and
polite, while aircrafts were also modern,
clean, and tidy. The management people
viewed that service price, flying
schedule, the quality of service, and
reputation and image were the most
important factors affecting the
customers’ decision in selecting the
airline for their air travel. Despite tough
competition in the industry, the airline
industry in Thailand as well as in the
region would remain positive, thanks to
lower service charge, and growing
tourism across the globe. Further,
political conflict, global recession, as
well as crimes and security concerns
were the major factors that might
adversely affect the operations. In
focusing on lead operations, the
management people viewed that people
plays the vital role in driving the Lean
operations. In other word, the key
success in quality management is to
focus on the ways to achieve it. For the
airline industry, the major goal of quality
management is to build customer
satisfaction, in which management
practices are considered as an upstream
of quality management. Aside from the
managers at all level, the airline’s key
staffs include pilot, co-pilot, flight
engineer, flight attendance, and ground
service staffs. There is no worry about
the increased competition after the
implementation of AEC as the airline
industry in Thailand stands better
position in the international market as
compared to those in ASEAN region.
Results of quantitative
research
From 400 respondents who were the
existing employees of airlines, namely
Thai International Airways, Bangkok
Airways, Air Asia, and Nok Air. About
57% were males, and 43% were females.
Respondents’ ages were in a range of 21
years old to over 50 years old. Most of
them were between 21 -35 years old and
were single. Bachelor’s degree was the
biggest group of respondents’ education
level, followed by lower than Bachelor’s
degree, and Master’s degree,
respectively. None of them had
education of higher than Master’s degree.
Respondents’ monthly incomes were
ranging between lower than 20,000 baht
to more than 80,000 baht a month. They
earned about 20,001 – 40,000 baht per
month mostly. Based on respondent’s
working experience with the airline, most
of them had worked for the airline for
about 4 – 10 years.

UTCC International Journal of Business and Economics
UTTC IJBE | 195
Table 1 Profiles of respondents (N=400)
Items Frequency Percent (%)
Airline:
Thai International Airways
Bangkok Airways
Air Asia
Nok Air
100
100
100
100
25.0
25.0
25.0
25.0
Gender:
Male
Female
228
172
57.0
43.0
Age:
21 - 35 years old
36 - 50 years old
more than 50 years old
187
150
63
46.8
37.5
15.8
Marital status:
single
married
others
198
184
18
49.5
46.0
4.5
Level of education:
lower than Bachelor's degree
Bachelor's degree
Master's degree
79
263
58
19.8
65.8
14.5
Monthly income (Baht):
less than 20,000 baht
20,001 - 40,000 baht
40,001 - 80,000 baht
more than 80,000 baht
32
228
98
42
8.0
57.0
24.5
10.5
Length of staying:
less than 6 months
6 - 12 months
1 - 3 years
4 - 10 years
more than 10 years
24
65
118
136
57
6.0
16.3
29.5
34.0
14.2
From the hypothesis testing, Pearson
correlation coefficient was used to
investigate the relationships between HR,
top management & leadership, process,
planning & control, customer relations,
supplier relations, and employee
engagement toward the overall service
quality of Airlines.

UTCC International Journal of Business and Economics
UTTC IJBE | 196
Table 2 Pearson correlation analysis
HR Top
management
&Leadership
Process Planning
&
Control
Customer
Relation
Supplier
Relation
Employee
Engagement
Overall
service
quality
HR Pearson Correlation 1 .663** .346** .685** .573** .025 .152** .362**
Sig. (2-tailed) .000 .000 .000 .000 .621 .002 .000
Top
management
&Leadership
Pearson Correlation .663** 1 .393** .487** .290** -.158** .148** .303**
Sig. (2-tailed) .000 .000 .000 .000 .002 .003 .000
Process Pearson Correlation .346** .393** 1 .144** .111* .008 0.0890448 .183**
Sig. (2-tailed) .000 .000 .004 .026 .867 .075 .000
Planning &
Control
Pearson Correlation .685** .487** .144** 1 .716** .246** .508** .617**
Sig. (2-tailed) .000 .000 .004 .000 .000 .000 .000
Customer
Relation
Pearson Correlation .573** .290** .111* .716** 1 .445** .495** .568**
Sig. (2-tailed) .000 .000 .026 .000 .000 .000 .000
Supplier
Relation
Pearson Correlation .025 -.158** .008 .246** .445** 1 .512** .562**
Sig. (2-tailed) .621 .002 .867 .000 .000 .000 .000
Employee
Engagement
Pearson Correlation .152** .148** 0.0890448 .508** .495** .512** 1 .643**
Sig. (2-tailed) .002 .003 .075 .000 .000 .000 .000
Overall
service
quality
Pearson Correlation .362** .303** .183** .617** .568** .562** .643** 1
Sig. (2-tailed) .000 .000 .000 .000 .000 .000 .000
From the table 2, the finding indicated
there is a significant relationship of HR,
top management & leadership, process,
planning & control, customer relations,
supplier relations, and employee
engagement toward the overall service
quality of Airlines, with the level of
confidence of 99%. The relationship of
these factors toward the overall service
quality of airlines are positive. Among
them employee engagement had the
strongest impact toward the overall
service quality (r =0.643), followed by
planning & control ( r = 0.617), customer
relations ( r = 0.568), supplier relations (
r = 0.562), HR ( r = 0.362), top
management & leadership ( r = 0.303),
and process ( r= 0.183), respectively.
Further, the finding from multiple linear
regression analysis suggested that the
elements of Lean operation can be used
to explain the overall service quality of
airlines. Following the results of t-test,
the finding indicated that there are only
four elements of Lean operation that can
be used to explain the overall service
quality of airlines under this model,
which are top management, planning and
control, supplier relations, and employee
engagement.
Also, the independent sample t-test was
used to explore the difference of service
quality and management practices under
Lean operation. There are four airlines in
this study, in which Thai International
Airways and Bangkok Airway are
classified as full service airline; while Air
Asia and Nok Air are classified as low
cost airline.
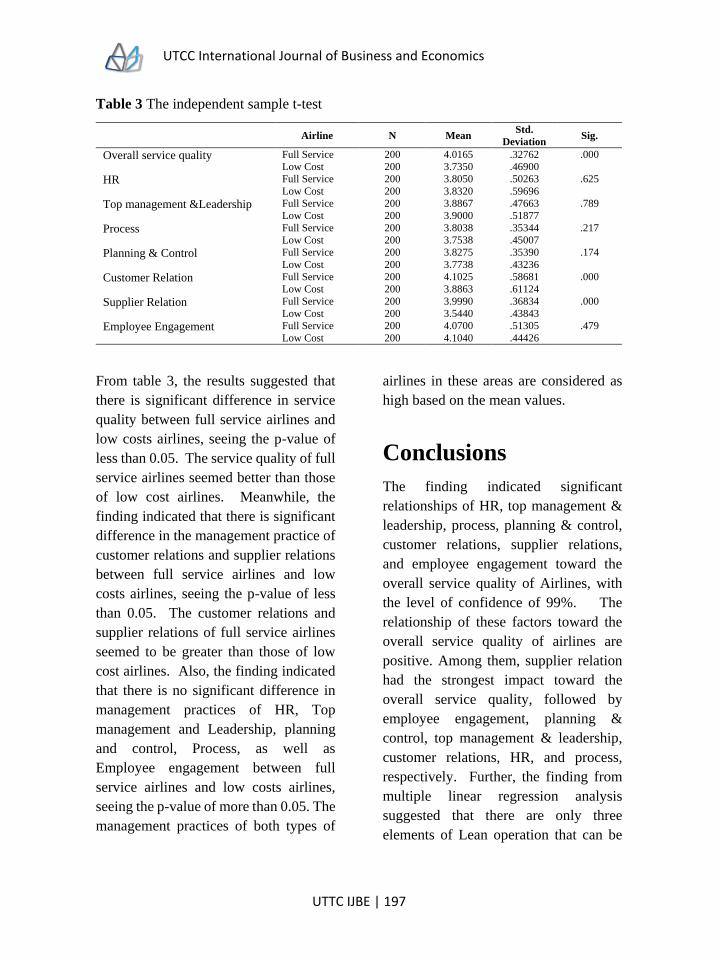
UTCC International Journal of Business and Economics
UTTC IJBE | 197
Table 3 The independent sample t-test
Airline N Mean
Std.
Deviation Sig.
Overall service quality Full Service 200 4.0165 .32762 .000
Low Cost 200 3.7350 .46900
HR Full Service 200 3.8050 .50263 .625
Low Cost 200 3.8320 .59696
Top management &Leadership Full Service 200 3.8867 .47663 .789
Low Cost 200 3.9000 .51877
Process Full Service 200 3.8038 .35344 .217
Low Cost 200 3.7538 .45007
Planning & Control Full Service 200 3.8275 .35390 .174
Low Cost 200 3.7738 .43236
Customer Relation Full Service 200 4.1025 .58681 .000
Low Cost 200 3.8863 .61124
Supplier Relation Full Service 200 3.9990 .36834 .000
Low Cost 200 3.5440 .43843
Employee Engagement Full Service 200 4.0700 .51305 .479
Low Cost 200 4.1040 .44426
From table 3, the results suggested that
there is significant difference in service
quality between full service airlines and
low costs airlines, seeing the p-value of
less than 0.05. The service quality of full
service airlines seemed better than those
of low cost airlines. Meanwhile, the
finding indicated that there is significant
difference in the management practice of
customer relations and supplier relations
between full service airlines and low
costs airlines, seeing the p-value of less
than 0.05. The customer relations and
supplier relations of full service airlines
seemed to be greater than those of low
cost airlines. Also, the finding indicated
that there is no significant difference in
management practices of HR, Top
management and Leadership, planning
and control, Process, as well as
Employee engagement between full
service airlines and low costs airlines,
seeing the p-value of more than 0.05. The
management practices of both types of
airlines in these areas are considered as
high based on the mean values.
Conclusions
The finding indicated significant
relationships of HR, top management &
leadership, process, planning & control,
customer relations, supplier relations,
and employee engagement toward the
overall service quality of Airlines, with
the level of confidence of 99%. The
relationship of these factors toward the
overall service quality of airlines are
positive. Among them, supplier relation
had the strongest impact toward the
overall service quality, followed by
employee engagement, planning &
control, top management & leadership,
customer relations, HR, and process,
respectively. Further, the finding from
multiple linear regression analysis
suggested that there are only three
elements of Lean operation that can be

UTCC International Journal of Business and Economics
UTTC IJBE | 198
used to explain the overall service quality
of airlines under this model, which are
top management & leadership, supplier
relations, and employee engagement.
Also, the results suggested that there is
significant difference in service quality
between full service airlines and low
costs airlines. The service quality of full
service airlines seemed better than those
of low cost airlines. Meanwhile, the
finding indicated that there is significant
difference in the management practice of
planning and control between full service
airlines and low costs airlines. The
planning and control of full service
airlines seemed to be greater than those
of low cost airlines. Further, the results
showed that there is significant
difference in the management practice of
supplier relations between full service
airlines and low costs airlines. The
supplier relations of full service airlines
seemed to be better than those of low cost
airlines. Meanwhile, the finding
indicated that there is no difference in
management practices of HR, top
management and leadership, process,
customer relation, as well as employee
engagement between full service airlines
and low costs airlines.
The recommendation of this research is
to focus on these three elements of Lean
operations, which are top management &
leadership, supplier relations, and
employee engagement for the further
improvement of service quality on
continuous basis. First, the airline should
try to further enhance the leadership
through empowerment in the
organization. The appropriate training
and development program should also
provide to management people to ensure
that they can encourage and coach their
subordinates. The management should
put more effort in arranging people in the
position where they can utilize their
skills, qualifications, and experience.
Also, leader may need to motive them
through providing job security and career
advancement. The finding revealed that
there is a strong positive relationship
between top management and leadership
toward HR functions in the organization.
It can be concluded that the effectiveness
of top management and leadership will
help to enhance the effectiveness and
efficiency of HR functions; while the
improvement of effectiveness and
efficiency of HR functions will lead to
enhance the effectiveness of top
management and leadership within the
organization. Second, it is suggested that
the airline should employ more local
suppliers to avoid shipment delays to
enhance the supplier relations. The
development of effective communication
between and airlines and suppliers would
help suppliers to have better cooperation
and commitment to maintain a long-term
relationship. Only the good suppliers
should be maintain as to reduce the
number of suppliers in each category.
Third, for the enhancement of employee
engagement, employees should be
treated honestly and fairly in every
transaction. The airline should provide
them with attractive incentive and growth
opportunities. Finally, for full service
UTCC International Journal of Business and Economics
UTTC IJBE | 199
airline, the overall service quality
remained better than those of low cost
airlines but the gap is relatively small.
The full service airline should try to
further enhance its service quality,
especially in the enhancement of top
management and leadership, planning
and control, and employee engagement
to be better than those of low cost airlines
in order to survive in the market.
For the future research, the outcomes of
this research may be limited to only them
that have already implemented its
strategies under the Lean and may not be
applicable for other airlines even they are
in the same industry or even same
geographical locations based on cultural
factor. Therefore, further study would be
suggested to take place in other airlines
in other geographical location for the
generalization of the study. To learn
more about organizational factors that
might affect the service quality,
extensive study should include facts like
organizational cultures, structures, sizes,
income level, and others to know
opinions of respective operators. For
example, there might be some difference
in Lean among small and large airlines.
And thus, the outcomes of future research
will reach to a wider range of airline
industry. In addition to these, further
study should analyze the difference
between customers and employees’
perspective toward the issue in this study.
References
Achanga, P., Shehab, E., Roy, R., and Nelder, G. (2006). “Critical success factors for lean
implementation within SMEs”. Journal of Manufacturing Technology
Management, 17(4), 460-471.
Al-Najem, M., Dhakal, H., and Bennett, N. (2012). “The role of culture and leadership in
lean transformation: a review and assessment model”. International Journal of
Lean Thinking, 3(1), 119-138.
AOT (2014), “Annual Report 2014”. Viewed 15 November 2015, from http://www.
airportthai.co.th/uploads/files/Annual_Report_of_2014_2.pdf
Bergmiller, G. G., and McCright, P. R. (2009). “Parallel Models for Lean and Green
Operations”. Industrial Engineering Research Conference. Miami, Florida.
Boyer, M., and Sovilla, L. (2003). “How to identify and remove the barriers for a successful
lean implementation”. Journal of ship production, 19(2), 116-120.
Creswell, J.W. (2003). Research Design: Qualitative and Quantitative Approaches. Sage
Publications: Thousand Oaks, CA.
UTCC International Journal of Business and Economics
UTTC IJBE | 200
Frank, F.D., Finnegan, R.P. and Taylor, C.R. (2004) ‘The race for talent: retaining and
engaging workers in the 21st century’, Human Resource Planning, 27(3), pp12-25
Goodson, E. (2002). “Read a plant fast”. Harvard Business Review, 105-113.
Holweg, M. (2007). “The genealogy of lean production”. Journal of Operations
Management, 25(2), 420-437.
ICAO (2013), Global Air Transport Outlook to 2030 and trends to 2040. ICAO: Montréal,
Canada.
Jones, D. and Mitchell, A. (2006). Lean Thinking for the NHS. NHS Confederation,
London.
Kahn, W. A. (1990). “Psychological conditions of personal engagement and
disengagement at work”. Academy of Management Journal, 33, 692–724.
Kotler, P. (2012). Marketing Management. Prentice Hall. N.Y.
Kumar, M., Antony, J., and Douglas, A. (2009). “Does size matter for Six Sigma
implementation?: Findings from the survey in UK SMEs”. The TQM Journal,
21(6), 623-635.
Lewis, M.A. (2000). "Lean production and sustainable competitive advantage".
International Journal of Operations & Production Management, 20(8), pp.959-
78.
Liker, J. K. (2004). The Toyota Way: 14 Management Principles from the World's Greatest
Manufacturer. New York, NY: McGraw-Hill.
Lovelock, C. H. (1991). Services marketing. Englewood Cliffs, NJ: Prentice-Hall Inc.
Maxwell, J. (2000). Developing the Leader Within You and The 21 Irrefutable Laws of
Leadership and Failing Forward. The INJOY Group.
Mefford, R. N. (2009). “Increasing productivity in global firms: The CEO challenge’.
Journal of International Management, 15(3), 262-272.
Ohno, T. (1998). The Toyota Production System: Beyond Large-Scale Production.
Portland, OR: Productivity Press.
Oxford Economics (2012), “Aviation: Benefits Beyond Borders”, viewed 12 October
2015, from http://www.aviationbenefitsbeyondborders.org/sites/default/files/
pdfs/AB BB _Medium%20Res.pdf
Panizzolo, R. (1998). “Applying the lessons learned from 27 lean manufacturers: The
relevance of relationships management”. International Journal of Production
Economics, 55(3), 223-240.
UTCC International Journal of Business and Economics
UTTC IJBE | 201
Tsang, J., and Antony, J. (2001). “Total Quality Management in UK service organizations:
some key findings from a survey”. Managing Service Quality, 11(2), 132-141.
UNWTO (2011), “Global Air Transport Outlook to 2030 and trends to 2040”, ICAO:
Montréal, viewed 10 October 2015, from http://dtxtq4w60xqpw.cloudfront.net/
sites/ all/files/pdf/unwto_2030_ga_2011_korea_1.pdf
Upadhye, N., Deshmukh, S. G., and Garg, S. (2010a). “Lean manufacturing system for
medium size manufacturing enterprises an Indian case”. International Journal of
Management Science and Engineering Management, 5(5), 362-375.
Wallace, J. (2006). Aerospace notebook: putting 'lean' processes into all of Boeing. Seattle
Post-intelligencer.
Womack, J. P., Jones, D. T., & Roos, D. (1990). The Machine That Changed the World.
New York, NY: Simon & Schuster.
Wong, M. (2007). The role of culture in implementing lean production. International
Federation for Information Processing (IFIP). 246, pp. 413- 422.
Zikmund, W. G., Babin, B. J., Carr , J., and Griffin , M. (2012). Business Research Methods
(9th ed.). Mason, USA: South-Western College
Zhang, Q., Abbas , J., Zhu, X., and Shah , M. (2012). “Critical success factors for successful
lean six sigma implementation in Pakistan”. Interdisciplinary journal of
contemporary research in business, 4(1), 117-124.
Zu, X., Robbins, T. L., and Fredendall, L. D. (2010). “Mapping the critical links between
organizational culture and TQM/Six Sigma practices”. International Journal of
Production Economics, 123(1), 86-106.

UTCC International Journal of Business and Economics
UTTC IJBE | 202
Appendix A
Questionnaire
Kindly complete all questions by marking “” in the space given below. There is no
right or wrong answer,
Airline
Thai Airways Bangkok Airways
Nok Air AirAsia
Part 1: Respondent general information
1. Gender
Male Female
2. Age
Less than 20 years old 20 – 35 years old
36 – 50 years old More than 50 years old
3. Marital Status
Single Married Others
4. Educational Background
Lower than Bachelor’s Degree
Bachelor’s Degree
Master’s Degree
Higher than Master’s Degree
5. Monthly Income
Less than THB 20,000
THB 20,000 – THB 40,000
THB 40,001 – THB 80,000
Over than THB 80,000
6. How long you been an employee of the airline?
Less than 6 months
6 -12 months
1-3 years
4 - 10 years
More than 10 years

UTCC International Journal of Business and Economics
UTTC IJBE | 203
Part 2: Attitude toward factors
Please use the following scales
1= Strongly Disagree, 2= Disagree, 3= Neutral, 4= Agree and 5= Strongly Agree
Item No. HR 1 2 3 4 5
A1 Employees are qualified enough to
contribute to solving problems and are able
to work as a team.
A2 Employees are able to perform different
tasks.
A3 Incentive and bonuses are available for
employees who help to improve processes
and eliminate unnecessary moves.
A4 Each employee has a clear understanding of
his job description.
A5 Departmental and employee relation are
good, and conflict barely occurs.
A6 Employees are empowered that their
suggestions and ideas are actively used and
implemented.
A7 Employees act according to the group’s
interest in which the evaluation is based on
group performance.
Item No. Top management and leadership 1 2 3 4 5
B1 Manager encourages and coaches employees
by visiting the workplace on a regular basis
B2 People are located in the organization where
they can utilize their skills, qualifications,
and experience.
B3 People have a job security and they are
regularly promoted to managerial positions.
B4 The organization invests in training program
and encourages cross job training
B5 The organization uses external experts and
consultants for evaluating the overall
organizational performance as well as for
improving quality level.

UTCC International Journal of Business and Economics
UTTC IJBE | 204
Item No. Process 1 2 3 4 5
C1 The processes used within similar operations
are placed close to each other for eliminating
unnecessary moves.
C2 Each working zone is controlled and
operated by qualified and well-trained
employees.
C3 The process flow of service is smooth and
continuous as the staffs and equipment are
grouped.
C4 Services are not produced unless orders for
them are received from customers.
C5 Service staffs are trained on a regular basis
so that they can provide the highest level of
service quality.
Item No. Planning & control 1 2 3 4 5
D1 A focus group of service employees is
conducted on a regular basis to identify
wastes and quality gap as well as to solve the
problem through generating new ideas and
solutions, which are then submitted to
managers and related parties.
D2 There is an awareness of the wider industry
performance, and a clear strategy is followed
to benchmark performance with the top-class
airline.
D3 There are standard procedures for producing
and delivering services.
D4 Problem solving techniques such as TQM
are used to identify the causes of quality
problem.
D5 Up-to-date information showing key
performance indicators, progress and job
activity are available and displayed.
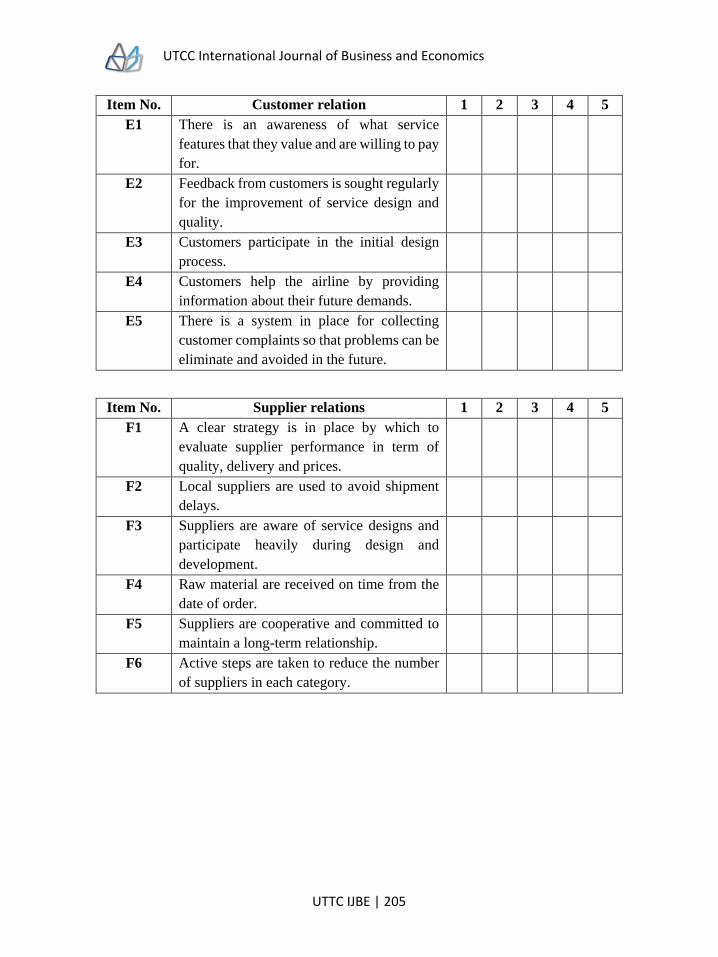
UTCC International Journal of Business and Economics
UTTC IJBE | 205
Item No. Customer relation 1 2 3 4 5
E1 There is an awareness of what service
features that they value and are willing to pay
for.
E2 Feedback from customers is sought regularly
for the improvement of service design and
quality.
E3 Customers participate in the initial design
process.
E4 Customers help the airline by providing
information about their future demands.
E5 There is a system in place for collecting
customer complaints so that problems can be
eliminate and avoided in the future.
Item No. Supplier relations 1 2 3 4 5
F1 A clear strategy is in place by which to
evaluate supplier performance in term of
quality, delivery and prices.
F2 Local suppliers are used to avoid shipment
delays.
F3 Suppliers are aware of service designs and
participate heavily during design and
development.
F4 Raw material are received on time from the
date of order.
F5 Suppliers are cooperative and committed to
maintain a long-term relationship.
F6 Active steps are taken to reduce the number
of suppliers in each category.

UTCC International Journal of Business and Economics
UTTC IJBE | 206
Item No. Employee engagement 1 2 3 4 5
G1 I enjoy working with the airline.
G2 The best way for me to advance my achievement
is to stay with the airline.
G3 The airline probably has a reputation as being an
excellent employer.
G4 The airline treats me honestly in every
transaction.
G5 I am loyal to the airline.
Part 3: Attitude toward factors (Overall service quality)
Please use the following scales
1= Strongly Disagree, 2= Disagree, 3= Neutral, 4= Agree and 5= Strongly Agree
Item No. Overall service quality 1 2 3 4 5
H1 The airline performs the service right the first
time.
H2 The airline does something what they promised
by a certain time.
H3 The airline services are highest safe.
H4 The behavior of employees in the airline makes
customer feel confidence.
H5 Employees of the airline are able to answer
customers’ questions.
H6 The airline inform customers exactly when
services will be performed.
H7 The employees of the airline are always ready to
service the customers.
H8 The employees of the airline are always willing
to help customers.
H9 Services of the airline are fast
H10 The airline is willing to give customer’s best
interests.
H11 The airline shows a sincere interest to help
customers resolve.
H12 The employees of the airline understand the
needs of customers.
H13 The airline has modern looking equipment and
appealing physical facilities.
H14 The airline’s employees are neat appearing.

UTCC International Journal of Business and Economics
UTTC IJBE | 207
Interview questions
Section 1
Self-introduction by Interviewer.
Explain the objective of this research, and procedure of interview
Section 2
How many year have you worked with the airline?
Have you known about lean operation? Please explain
Have your airline engaged in lean operation? Why or why not?
Who are the target customer of your airline?
What are the major strengths and weakness of your airline?
What are the advantages and disadvantage among large and small airline?
What are the factors affecting the success of lean operation?
Explain the prospects of the airline industry in Thailand?
In your opinion, what are going to affect your airline the most after the implementation
of AEC in 2015?

UTCC International Journal of Business and Economics
UTTC IJBE | 208
UTCC International Journal of Business and Economics
UTTC IJBE | 209
Guide for authors
University of the Thai Chamber of Commerce International Journal of Business and
Economics (UTCC IJBE) is published by University of the Thai Chamber of Commerce,
and Thailand Management Association. It is published twice yearly in a spring and fall
edition and is directed toward the needs of academia, practitioners, executives, researchers,
students, and the general public interested in business management (i.e., Marketing,
Service Management, Innovation and Design in Business, Finance, Banking, Accounting,
Economics, Insurance and Risk Management, Production, Industrial and Operation
Management, Strategic Management and Management, International and Global Business
Management, Entrepreneurships, Organization Behavior, Business Ethics, Business Law,
Business System, Hospitality and Tourism Management, Human Resource Management,
and Office and Facility Management).
UTCC International Journal of Business and Economics
UTTC IJBE | 210
Editorial policy
The UTCC IJBE is designed as a forum
for current research, opinions, and
identification of trends in business
management. The opinions expressed are
those of the authors and do not
necessarily reflect the opinions of the
Editors, the Editorial Review Board, or
University of the Thai Chamber of
Commerce, and Thailand Management
Association.
The copyright of all published material
belongs to University of the Thai
Chamber of Commerce, with future use
rights reserved. This, however, does not
limit the author’s right to use his or her
own material.
Objectives
The editorial objectives of UTCC IJBE
are to advance knowledge and science
and to stimulate greater thought and
effort in the fields of business
management, and by providing readers
with:
Novel and useful information;
New business management theory or
techniques;
Research explaining about business
management thought and practice;
Articles in subject areas which have
significant current impact on thought and
practice in business management.
Content
The UTCC IJBE will mainly consider for
publication three types of articles:
1. Articles that report empirical research
on business management issues.
2. Articles that report on the development
of methodologies and techniques that can
enhance business management decision
making.
3. Articles that report the application of
decision tools to generic or specific
business management problems.
Manuscripts should be between 4,000
and 6,000 words, typically 15-20 single-
spaced, typewritten pages. Articles of
shorter length are also acceptable. Only
rarely will it be possible to publish a
manuscript of more than 6,000 words.
Review
Articles are considered for publication if
they have not been published or accepted
for publication elsewhere and are not
being concurrently considered
elsewhere. Authors will usually be
notified of acceptance, rejection, or need
for revision within 16 weeks of
submission.
No manuscript is accepted for UTCC
IJBE until it has been reviewed by the
Editor or one of the Associate Editors and
at least two outside reviewers who are
experts in their respective fields.
All manuscripts are judged on their
contribution to the advancement of the
science and/or practice of business
management. The editors expect all
manuscripts to follow accepted standards
for scholarly work. Manuscripts are
judged not only on depth and scope of
ideas presented and their contribution to
the field, but also on their clarity,
organization, readability, and
comprehensibility.
UTCC International Journal of Business and Economics
UTTC IJBE | 211
Manuscripts should be written in a
manner that is interesting and readable to
both practitioners and academics. It is
beneficial to include a section regarding
managerial implications and discussion
of the consequences of applying the
proposed ideas. Technical terms should
be defined.
Manuscript
preparation
Manuscripts should be typed single-
spaced in 12-point type using Times
Roman or similar type. Use single
spacing in endnote references. Please
allow the text to wrap, rather than
entering a RETURN or LINEFEED after
every line.
The sections of the manuscript should be
placed in the following order: Cover
page, Title page, Authors, Abstract (on a
page by itself) and Body, Illustrations,
Citation, References, and Appendices.
Cover page
The cover page should include the title of
the manuscript and the authors’ name(s)
in the order in which they will be printed.
The following information should be
provided for each co-author: name, title,
university/company name, mailing
address, telephone number, facsimile
number, and e-mail address. Please
indicate which co-author will serve as the
primary contact for the Journal.
In addition to any acknowledgment of
financial or technical assistance, this
page should include each author’s title,
present position, and complete address
and telephone number. Please keep
professional titles succinct.
Title page
Type the title in bold type, all caps,
single-spaced, and centered across the
top of the first page, in 14 point Times
New Roman, as illustrated above.
Authors
The author(s), affiliation(s), mailing
address(es), and e-mail address(es)
should be single-spaced and centered on
the line below the title, in 12 point bold
Times New Roman for the author(s), and
in normal Times New Roman for the
remainders. One line space should be
used to separate author(s) from the paper
title. Please do not use titles such as Dr.,
Professor, etc.
Abstract (on a page by itself),
and body
Introduce the paper with an abstract of
approximately 100-200 words, in 12
point Times New Roman. Begin with the
centered heading “Abstract”. All body
paragraphs should begin flush left (no
paragraph indent) and right justified.
Single-space the body of the paper. Use
12 point Times New Roman throughout.
Figures and tables should be placed as
close as possible to where they are cited.
First-level headings state the table or
figure number. All tables and images
should be embedded into the file and
sized appropriately. All photographs
should be sampled at 300 dpi (dots per
inch). Keep in mind that web graphics are
typically sampled at 72 dpi. Photographs
must be properly sized and positioned in
the body of the paper.

UTCC International Journal of Business and Economics
UTTC IJBE | 212
Illustrations
(Tables and figures)
Each illustration should be numbered
consecutively within its series type
(Table 1, Table 2, Figure 1, Figure 2). If
illustrations appear in appendices, they
should be numbered consecutively, but
separately from body illustrations (e.g.,
Table A-1, Figure A-1). In the text, refer
to tables and figures by their numbers.
Avoid using “above,” “below,”
“preceding,” and similar terms. All
Tables and Figures must have titles.
Titles for each Table and Figure should
be descriptive but not lengthy. The title
should be in bold letters at the top of the
Table or Figure.
Tables and Figures should be called
“Table” or “Figure” and should be
followed by a blank line and then the title
for the table or figure also in bold letters
at the top of the table or figure.
For Journal purposes, tables and figures
are defined as follows: a table is
comprised of rows and columns of
numbers and/or text; a figure is a chart,
graph, diagram, map, drawing, or any
other nontext item that is not a table.
Tables should be typed in the following
style:
General design
For more effective communication and
better quality reproduction when printed,
tables and figures should be kept as
simple and uncluttered as possible, while
conveying all necessary information.
Details
Footnotes should appear directly below
illustrations, flush with the left edge, and
they should be designated by small
letters, rather than asterisks or numerals.
Column or row heads should be
footnoted only if the footnote applies to
all items in the column or row. Complete
source information must be provided for
illustrations copied or derived from other
sources. This complete information
should be provided and an author-date
citation should be given in a source note
on the illustration. (Source notes are
sized and placed like footnotes, below
any footnotes for the illustration.)
If elements on an illustration are not
labelled, but represent certain categories,
items, or amounts, a complete key
(legend) should be included. Make sure
that necessary measures of statistical
significance are reported with each
illustration. Designate units (percent,
dollars, hours, etc.) in column and row
headings (tables) or in element labels or
keys (figures). Separate from each figure,
give numerical values for all points, bars,
pie slices, etc., so that they can be readily
reproduced by the typesetter, if
necessary. Double-check formulae and
mathematical terms and equations for
consistency, readability, and accuracy.
Add extra space between characters to
clarify and separate the terms, and be sure
that sub and superscript relationships are
clear. Check for opening and closing
parenthesis and brackets. Write the
names of Greek and special characters in
the margin. Use tab indents or column
alignment, rather than spaces, to align
columns and indent headings.
English (USA) spelling should be used;
foreign terms not commonly used in
English (USA) should be italicized.

UTCC International Journal of Business and Economics
UTTC IJBE | 213
Regarding mathematical
notation
The percent sign (%) should be used in
text and in tables. Mathematical notation
must be clear within the text and
illustrations. All equations must be very
clearly typed. Display (separate line)
equations should be aligned to the left
margin. Italic type is used for letters in
equations, except for trigonometric
functions and logarithm abbreviations,
which are plain (normal) type. Matrices
and vectors are in boldface type. (If these
cannot be typed in italic and boldface,
italic type can be indicated by a hand-
drawn straight underline and boldface by
a wavy underline). Unusual and Greek
symbols should be typed in the text using
the Symbol capability. If no Symbol
capability is possible, such special
characters should be identified by name
in a marginal note. (This is important; the
editor may be not familiar with these
symbols and may have difficulty
producing the correct one without a
marginal note.) For equations that might
be too long to type in a 6” column,
indicate appropriate breaks.
Citation
The UTCC IJBE follows the reference
format of Academy of Management
Journal. This format is available at the
AMJ'swebsitehttp://aom.pace.edu/amjne
w/style_guide.html. The use of footnotes
is discouraged.
References
References are to be listed alphabetically,
last name first, followed by publication
date in parentheses. Use full first name,
not just initials. The reference list should
be typed single-spaced in 12-point type.
Please let the Endnotes wrap rather than
using tabs or returns at the end of internal
lines. Do not use indents, tabs, or
symbols to delineate your paragraphs.
Instead, use two hard returns between
each reference.
Proceedings/ Journal articles:
Supaporn Kiattisin (2007), “Detection of
an Acute Leukemia Using an Active
Contour Model,” Proceedings of the 4th
International Joint Conference on
Computer Science and Software
Engineering, May 3-4, 2007, Hotel
Sofitel Raja Orchid, Khon Kaen,
Thailand.
Chirapandu, S. & Yoopetch, C. (2009),
“Bank Credit Card Adoption Criteria and
Marketing Implications,” International
Journal of Business in Asia, Vol.1, No. 1,
pp. 1- 20.
Books:
Akachai Apisakkul & Thasana
Boonkwan (2004), Strategic
Management, 4th Ed. New York:
McGraw-Hill Irwin.
Authors are responsible for the accuracy
of their references. Check them carefully.
Readers’ questions and comments about
incomplete and inaccurate References
will be referred to the article authors with
a follow-up by the Editor. All authors of
a referenced work should be listed; et al.
should not be used in the Reference list.
Undefined acronyms should not be used.
Appendices
If any mathematical proof or development is
used but not critical to the exposition of the
main argument of the manuscript, authors
should include it in an appendix. An

UTCC International Journal of Business and Economics
UTTC IJBE | 214
appendix may also be used for the
mathematical material that may be beyond
the level of the average reader.
Permissions
Submitting a manuscript to UTCC IJBE
constitutes an assignment of copyright to
the Journal and a guarantee that the work
is original. It also indicates that the
author(s) owns it, and that no part of it
has been previously published in
substantially the same form, that it is not
being published or considered for
publication elsewhere, and that any use
of others’ materials is by permission or
falls within fair use standards of
copyright law. The author(s) is
responsible for obtaining any necessary
permission from copyright holders and
for paying any necessary fees. Extensive
paraphrasing is considered disguised
copying; permission is required.
Portions of an item, such as some of the
data from a table, or part of a graphic
representation of a model, can be used
without permission if they are properly
credited with full and exact source
information and do not comprise a
significant portion of the submitted
article. Copies of written permissions
should be submitted with the final
manuscript.
Online submission
Manuscripts should be submitted
electronically at http://ijbejournal.com/,
in Microsoft Word.
The sections of the manuscript should be
placed in the following order: Cover
page, Title page, Authors, Abstract (on a
page by itself) and Body, Illustrations,
Citation, References, and Appendices.