Federal Disposal System (FEDS) / Energy Asset ... - GSAXcess
Upload
independentCategory
view
0download
0
J. Egypt. Acad. Soc. Environ. Develop., 15 (2): 67-81 (2014) (D-Environmental Studies) E.mail: [email protected] ISSN 1110-8770 www.eased.byethost13.com eISSN 2314-5471 (online)
Using ZLD technique for safe and economic disposal of desalination plant brines in Egypt
Reda M. A. Hassan
Environment and climate change Research Institute, National Water Research Center
E-mail: Doctor_ [email protected]
ABSTRACT
Water shortage is one of the greatest problems of modern societies, because of the
increase in world population and the fast economic development. In Egypt water requirements is
expected to increase from 63 milliard cubic meters in 1997 to 83 milliard cubic meters in 2025.
In addition to the fresh water from the Nile River and groundwater, desalination of brackish and
sea water is inevitable. The contribution of desalination to drinking water supply is expected to
be more than 0.5 million cubic meters per day in the year 2025. However, the widespread of
brine discharges to the sea and inland as wastewater from desalination plants may affect
environment. This paper assesses the possibility of using the zero liquid discharge (ZLD)
technique as a possible solution for the brine disposal problems. Thinking about a Zero Liquid
Discharge processes is one of the most attractive solutions to the brine environmental dilemma.
ZLD refers to process that fully remove water from the reject brine stream, so the end product is
a solid deposit of precipitate salts. In Zero Liquid Discharge Desalination, not only brines will
stop to be an environmental menace, but also the recovery of the desalination process will reach
values near the 100%. ZLD has been regarded for many years as an uneconomic solution and,
therefore was engaged in limited cases. However, the increasing rate of population growth,
shortage of water in many places around the world and the growing understanding about the
need for environment protection has brought this issue back to focus. This paper presents
feasibility for salt production from brine using ZLD technique. It concentrates on reverse
osmosis type of desalination plants in Egypt. The aim of this paper is to demonstrate the amounts
of brine salts nowadays and the expected amounts in 2025 in Egypt. It presents also economical
feasibility of a new brine treatment system in order to decrease the total volume of brines
generated and even achieve the zero liquid discharge in desalination processes. On the top of
mitigating the negative environmental impacts, additional distilled water and salts were
estimated to assess the possible economic return of ZLD introduction to the desalination process
in Egypt. It could be concluded from the study that, the introduction of ZLD technique to reverse
osmosis desalination plants in Egypt, would viable and has economic and environmental return.
It could be recommended that, more attention should be paid for ZLD case studies in Egypt,
using real economic models.
Key words: Brine Salts-Desalination Plants in Egypt-Economic Return –ZLD Technique
INTRODUCTION
The water demands increased significantly due to the rapid increase in population and the
different purposes of sustainable developments. So it was necessary to search for non-traditional
ways to bridge the gap between the currently available water and the deficit of water. The Zero
Liquid Discharge desalination project website (2013-2017); which is known as ZELDA project
stated in its website that; desalination is used in 150 countries around the world, and currently
there are near 16000 desalination plants worldwide producing fresh water from both seawater
68
Reda M. A. Hassan
and brackish water. ZELDA also stated that; the global capacity of all desalination plants
worldwide is up to 66 million m3·day
-1, which involves a brine production of at least 30 million
m3·day
-1. In the case of the Mediterranean region growth predictions expect an increase of 180%
in the desalination capacity the total global capacity is expected to reach 94 million m3·day
-1 by
2015. Thus, the environmental impact generated by this technology will also increase.
Desalination is widely used in some areas in Egypt as a main source for fresh water
supply for domestic sector due to the scarcity of renewable natural fresh water resources. Some
other areas have already started building desalination plants. The largest number of desalination
plants can be found in the Sinai and Red sea area. The ministry of investment 2008 in Egypt
reported in its study about desalination Plants and drinking water that; the number of desalination
plants in Egypt has been reached about 110 in year 2000; from them 99 plants are reverse
osmosis types. In year 2013 the number of desalination plants became about 194 desalination
plants; from them 175 plants are reverse osmosis types. The total capacities of desalination
plants to produce freshwater were about 185000 m3/ day in year 2000. The expected amount of
produced fresh water is going to be more than 350000 m3/ day in year 2015; if the rate of growth
stills the same as 4.4% as the period from 2000 to 2007. (Dawoud, 2006) stated that; wastewater
from desalination plants are known by brine, concentrate or reject water. By definition, brine is
any water stream in a desalination process that has higher salinity than the feed. Reject brine
is the highly concentrated water in the last stage of the desalination process that is usually
discharged as wastewater.
Ahmed et al. (2000) studied the disposal of brine in evaporation bonds and concluded
that due to the presence of different chemicals at variable concentrations, reject brine
discharged to the sea has the ability to change the salinity, alkalinity and the temperature
averages of the seawater and can cause change to marine environment. The characteristics of
reject brine depend on the type of feed water and type of desalination process. They also depend
on the percent recovery as well as the chemical additives used. They also studied disposal and
management of desalination brine and they found that the potential for desalination brine
mining may lie in the future with advancements in technology. The cost of desalination and
mineral extraction would have to decrease and the efficiency of extraction would need to
increase. However, brine mining for raw materials may be carried out for reasons of resource
security, though this will have to be balanced against higher production costs. Although
technological advances have resulted in the development of new and highly efficient
desalination processes; little improvements have been reported in the management and handling
of the major by-product waste of most desalination plants, which namely reject brine. The
disposal or management of desalination brine (concentrate) represents major environmental
challenges to most plants, and it is becoming more costly. In spite of the scale of this economic
and environmental problem, the options for brine management for inland plants have been rather
limited.
Caterina et al. (2011) studied the brine mining; the study showed that; the challenge is to
consider the brine, instead of a harmful by-product, as a valuable source for several compounds
to be involved in diverse industrial processes. For example, the brines could provide significant
amounts of magnesium, resulting in a very promising source of this element as an alternative to
traditional mining. As traditional approaches in mining are costly in time or inapplicable in
abandoned and remote regions, research needs to be focused on nontraditional sources such as
brines coming from desalination plants. These brines certainly have several advantages, and in
time can replace, at least in part, the conventional sources with an alternative, economically
69
Using ZLD technique for safe and economic disposal of desalination plant brines in Egypt
attractive process. Dual benefits can be achieved in recovering and recycling Mg from reject
brines reduction of large volumes of brines to be discharged, as well as decrease of
environmental concerns due to industrial extraction from silicate minerals.
Bardi (2010) studied the energy analysis of minerals extraction from seawater and
concluded that the concept of recovering minerals from seawater has been proposed as a way
of counteracting the gradual depletion of conventional mineral ores. Seawater contains large
amounts of dissolved ions and the four most concentrated metal ones (Na, Mg, Ca, K) are
being commercially extracted today. It was concluded from the study that the oceans contain
vast quantities of dissolved metal ions which in principal could be extracted. Seawater brine
mining has long been carried out for obtaining common salt, and currently four metal ions are
extracted from brine: sodium, magnesium, calcium and potassium. Bardi (2010) also stated that;
recently the rise in commodity prices has spurred interest in brine mining as a possible source of
other raw materials and as a means of solving resource security issues. Desalination residues are
currently regarded as a waste that must be disposed of. They are highly saline and so can have a
negative environmental impact if returned to the sea. The residues could be mined for sodium,
magnesium, calcium and potassium but interest has also been expressed in using these brines to
obtain the next four elements with the largest oceanic concentrations: lithium, barium,
molybdenum and nickel. Energy requirements are determined by concentration. The extraction
from low concentration resources, no matter in seawater or in the earth’s crust, is expensive in
terms of the energy needed. Most elements extraction from seawater is so energy expensive that
it must be considered beyond our possibilities in the short and medium term. The exceptions
are the four high concentration elements already being commercially extracted (Na, Mg,
Ca, K). It has to evaluate the prospects for obtaining minerals from desalination brines and to
assess the quantities of minerals that could be obtained.
Saudi press agency (2013) announced that, Saudi Arabia is planning to build the largest
desalination plant in the world. This will have a capacity of 600,000 m3 of drinking water per day.
Assuming that three tones of seawater are required for every tone of drinking water produced, this
amounts to around 657 million m3 per year of water passing through the desalination plant.
Mickley (2004) compared the operating costs of three ZLD system designs, including a thermal
evaporator plus evaporation ponds (1), a high recovery RO plus thermal evaporation plus
evaporation ponds (2) and a high recovery RO plus evaporation ponds (3). Option 3 turned out to
be most cost-efficient. Cost savings of about 40 % compared to the alternatives were calculated
due to the absence of energy-intensive evaporators. Options 2 and 3 require the use of chemicals
in the RO process, so that costly sludge disposal must be included in the calculations. In order to
become more cost-efficient, ZLD must make use of salt recovery and commercial exploitation.
Technologies already exist to selectively remove salts. Other trends might help to make ZLD
more competitive in the future.
Objectives
Cost benefit analysis of brine disposal from desalination plants
The objective of this study is to discuss the introduction of zero liquid discharge (ZLD)
technique to existing reverse osmosis desalination plants in Egypt which contribute to 90% of
desalinated water in the country. An economic and financial evaluation for the ZLD produced
salts was carried out to ensure the feasibility of the proposed technique.
Then the variables which are affecting the brine investment are the cost of extracted salts
(ES), the cost of new desalinated water from brine (AW), the cost of brine disposal by traditional
70
Reda M. A. Hassan
methods (CBD), the cost of zero liquid discharge units (CZLD), and the cost of environmental
preservation (CEC). The equation which represents the cost benefit analysis factor of brine
(BCB) can be written as follows
(BCB) = (ES) + (AW) + (CBD) - (CZLD) + (CEC) ……… (1)
Where:-
BCB is the brine cost benefit analysis factor;
ES is the cost of extracted salts;
AW is the cost of new desalinated water from brine;
CBD is the cost of brine disposal by traditional methods;
CZLD is the cost of zero liquid discharge units;
CEC is the cost of environmental preservation.
The term (BCB) is directly proportional to (ES), (AW), and (CBD). But inversely
proportional to the term (CZLD), the term (CEC) can be neglected in present financial analysis
and calculations, but it is very important for environment; and governments should take it into
their considerations.
METHODOLOGY
Achieving the goals of this paper needs a lot of calculations and economic and financial
evaluation for the above mentioned factors to ensure the feasibility of the proposed technique.
The calculations included:
- Calculations of new desalinated water quantity and cost from brine (AW)
- Cost of brine disposal by traditional methods (CBD)
- Cost of zero liquid discharge units (CZLD)
- Expected increase in numbers of desalination plants
- Expected brine water of desalination plants using sea water as a source of feeding water and
product water rate.
- Expected salts from brine water of desalination plants (RO) system using sea water as a source
of feeding water
- Expected values of brine salts from desalination plants (RO) system using sea water as a source
of feeding water
- Cost of extracted salts (ES)
RESULTS AND ANALYSES
More than forty four (44) excel spread sheets had been carried out to achieve the goal of
this research, where the study aims to, solving the problem of brine disposal from desalination
plants, in particular the reverse osmosis type which comprises 90% of desalination plants in
Egypt, the solution starts from knowing the currently and expected amounts of brine water and
ended by suggesting adding evaporators, pumps, packaging units, auxiliary equipment, and
crystallizers to RO plants as hybrid unit, the added equipment will constitute zero liquid
discharge (ZLD) technique, consequently the prices of all parts were gathered from specified
internet sites, according to the international prices in 2014 ,where the transportation and
marketing were not included in the prices. The analysis depended on the previous studies, which
are concerned in economic return of brine calculations (Bardi, 2010; CAIIR, 2012; I.E.S. 2007;
71
Using ZLD technique for safe and economic disposal of desalination plant brines in Egypt
Mickley, 2004; Mohamed et al., 2005); Robin ,(2003); Saudi Press Agency, 2012; SAWPA’s Brine
Line, 2014).
Calculations of new desalinated water quantity and cost from brine (AW)
The cost of desalinated water from the RO plants is dependence on many factors like
water salinity, source of water brackish or sea water, technology of desalination, the energy used,
the capacity of plant if it is more or less than one million gallon per day or ten million gallon per
day (1MGD or 10 MGD), the method of disposing brine and other factors, but references
mentioned that the cost of desalinated cubic meter ranges from 0.75 to 1.25 $ (El Banna H.,
2001), the term (AW) will be 0.75 to 1.25 $ per m3.
Cost of brine disposal by traditional methods (CBD)
The cost of the brine disposal plays an important role in the selection of the method as it
could range from 5 to 33% of the total cost of desalination (Mohamed et al., 2005). The cost of
brine disposal from desalination plants is about $250,000 for 1MGD and the cost of 1galoon/day
is equal to $0.25 x10⁻³
(after,SAWPA’s Brine Line), then the cost of 1 m3 of brine will be
$0.066. Robin A. Foldager (2003) studied the economic return of different traditional methods of
brine disposal from desalination plants; the methods which had been studied were the inland
brine disposals include deep-well injection and the storage in evaporation ponds. Another
concentrate disposal method centers on the use of salinity gradient solar ponds (SGSPs). Solar
pond technology provides an avenue for utilizing reject concentrate to power the desalination
unit. These costs are calculated by updating an economic model developed in 1992. The results
of calculations showed that costs associated with each disposal option have gone down over time
and that evaporation ponds usually present the lowest cost alternative.
The costs of different methods of brine disposal for 1000 gallon /day are:
No. Type of brine disposal 1MGD M3/d 10MGD M
3/d
1- evaporation ponds $ 0.38/1000g/d $0.10 $ 0.38/1000g/d $0.10
2- deep-well injection $ 2.79/1000g/d $0.74 $ 2.09/1000g/d $0.55
3- salinity gradient solar
ponds
$ 2.78/1000g/d $0.73 $ 1.95/1000g/d $0.52
Then the cost of brine disposal (CBD) can be taken as $0.066 to $0.74 for m3/day
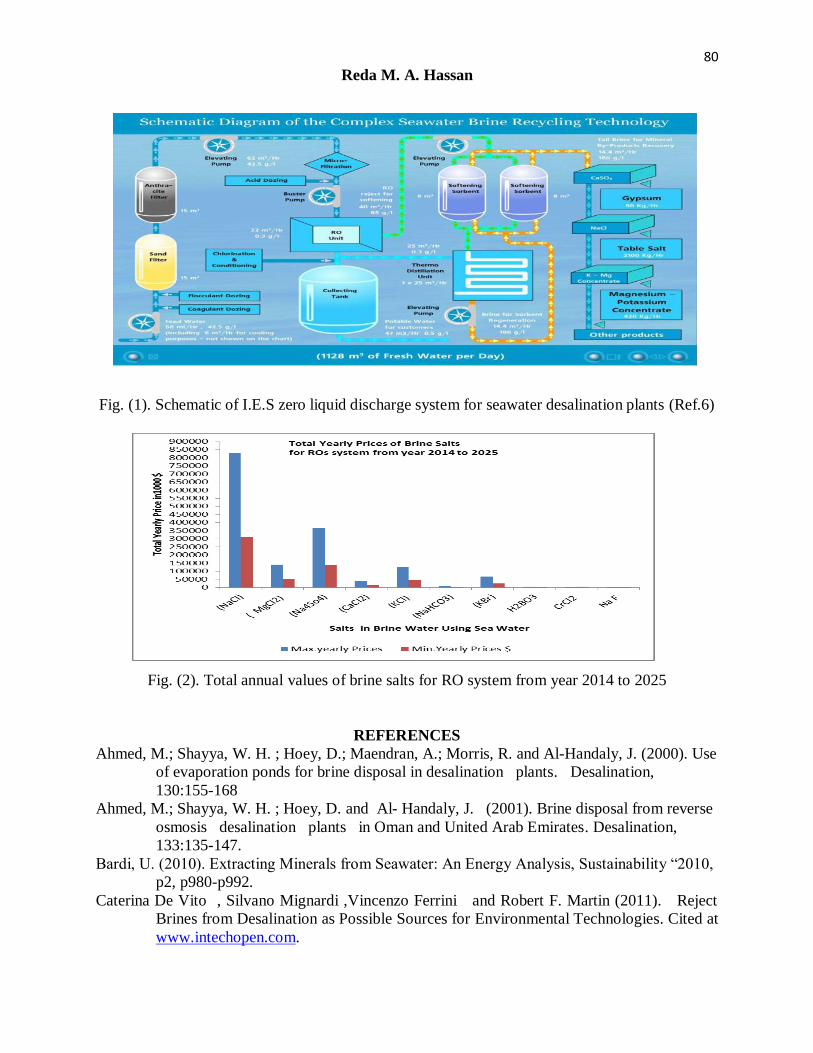
Cost of zero liquid discharge units (CZLD) The ZLD System removes dissolved solids from the wastewater and returns distilled
water to the process. Reverse osmosis (membrane filtration) may be used to concentrate a
portion of the waste stream and return the clean permeate to the process. In this case, a much
smaller volume (the reject) will require evaporation, thus enhancing performance and reducing
power consumption. In many cases, falling film evaporation is used to further concentrate the
brine prior to crystallization. These crystals are removed and dewatered. The water vapor from
evaporation is condensed and returned to the process. Solids from pretreatment are generally
mechanically dewatered in a plate-and-frame filter press. The filtrate is simply recycled back to
the beginning of the pretreatment system. The crystals from the crystallization process can also
be mechanically dewatered, but corrosion resistant materials are usually necessary due to the
high salt concentrations present. The crystals can be dewatered in a filter press or centrifuge
allowing much higher solids concentrations as a result. The filtrate (or concentrate) is then
72
Reda M. A. Hassan
returned to the crystallizer as shown in Figure (2) (I.E.S. 2007). The process can be repeated and
the produced salts can be packaged to be ready for marketing, the new produced distilled water
can be directed to the product water of the plant as a new added value for the ZLD process. From
the aforesaid steps of ZLD system, it could be concluded that the main important parts in the
system are the evaporator, and the crystallizer. The pumps and dryers are auxiliary parts, but for
brine investment a packaging unit should be added to the system to bind the extracted salts in
sacks or plastic covers for commercial use. Then the cost of (CZLD) will include the capital cost
(constructions- main and auxiliary equipment-testing and commissioning) ,the operation and
maintenance cost which include (salaries-chemicals-fuel-spare parts-other consuming materials)
and training, management and research activities, the percentages of different costs can be
quoted from the cost of desalination plants as shown in Table (1) (El Banna , 2001).
Then the cost of (CZLD) according to the capacity of the desalinated plants, for plants
equal or less than ≤ 150 m3/day, will be as follow, according to the international prices of
equipment in 2014 (Http://offer.alibaba.com).
Evaporator cost = 4(evaporators) x$50000 (evaporator price) = $200000, it needs four
evaporators where the evaporation rate equal 48m3/day,
Crystallizer cost = 4x$40000 =$ 160000
Auxiliary unit cost = 4x$20000 = $80000
Packaging unit cost = $80000, Total capital cost =$520000
Operation and maintenance cost = 43% x $520000 = $223600
Total cost = =$520000+$223600 = $743600
Getting the cost of ZLD technique unit needs to calculate the amortization factor of
equipment loan with yearly interest rate (6%) and equipment life (30 years) using this equation.
The amortization capital cost (ACC) = (TCC)/M = $743600/ M = $743600/ 13.69 =$ 54,317.
Where M (amortization factor of equipment loan) = ((1+i) n -1)/ i x (1+i)
n
= (1+0.06)30
-1/ 0.06 x = (1+0.06)30 = 13.69
Where I is the yearly interest rate (6%) and n is the equipment life (30 years) CZLD = ((ACC) + (OM))/ Pa = ($ 54,317 + $223600)/ pa = $277917/54750 m
3/year = 5.076 $/ m
3
Pa is the annually product water = daily unit capacity x 365 days
= 365 days x150 m3/d = 54750 m
3/year
The cost of brine disposal using ZLD technique for 1m3 = 5.076 $/ m
3
Expected increase in numbers of desalination plants
Solving the problem of reject water (brine) in Egypt starts from the determination of
quantity and quality of brine from desalination plants. Data were collected for years 2000 to
2007 as shown in Table (2), to get the rate of change in numbers of desalination plants in Egypt
during this period, so the following equation can be used to get the rate of change in the number
of desalination plants Rd.
Rd = ∑ (Xn-Xn-1) / N × 100 ……………………………………… (2)
Where:-
Rd = the rate of change in the number of desalination plants
Xn = the number of desalination plants at assigned year (n)
Xn-1= the number of desalination plants at pre-assigned year
n = the number of assigned year (according to available collected data)
73
Using ZLD technique for safe and economic disposal of desalination plant brines in Egypt
N = the number of total assigned years
Rd = ∑ (Xn-Xn-1) / N ×100 = (115-110) + (120-115) + (125-120) +
(131-125) + (137-131) + (143-137) + (149-143) / 8 = 0.048
The expected increase in numbers of desalination plants Ix+1 for the subsequently year can be
obtained from the following equation:
I(x+1) = (1+Rd) × Xn ……………………………… (3)
Where:-
Rd = the rate of change in the number of desalination plants
Xn = the number of desalination plants at assigned year (n)
I(x+1) = the expected increase in numbers of desalination plants for the subsequently year
n = the number of assigned year
I(x+1) = (1+Rd) × Xn = 1.048 × Xn
The expected increase in numbers of desalination plants for years 2008, 2009, 2014 and
2025 will be as follows:
I 2008 = 1.048 × X2007 = 1.048 ×149 = 156
I 2009 = 1.048 × X2008 = 1.048 ×156 = 163
I 2014 = 1.048 × X2013 = 1.048 ×194 = 203
I 2025 = 1.048 × X2024 = 1.048 ×314 = 329
The number of reverse osmosis plants (RO) is about 90% of the total amount of
desalination plants, in Egypt. The number of all types of other plants is about 10%, then for this
reason it will be focused on the reverse osmosis plants, in this research. Then the expected
increase in numbers of (RO) desalination plants for year 2008, 2009 and 2014 will be as
follows:-
I 2008 = 1.048 × X2007 ×0.9 = 1.048 ×149 ×0.9 = 140
I 2009 = 1.048 × X2008 ×0.9 = 1.048 ×156 ×0.9 = 147
I 2014 = 1.048 × X2013 ×0.9 = 1.048 ×194 ×0.9 = 183
I 2025 = 1.048 × X2024 ×0.9 = 1.048 ×314 ×0.9 = 296
The expected increase in total number of desalination plants and the expected increase in
total number of (RO) desalination plants from year 2000 to 2025 were calculated and tabulated
as shown in Tables (3).
Expected brine water from desalination plants
Sea water as a source of feeding water
* Product water rate (Sea Water)
In this research the available data is the product water rate (PWR), then getting the reject water
rate (RWR) needs to substituting in the following equation:-
Recovery Rate % = Product water Rate ÷ Feed Water Rate = 20%-40% ……… (4)
Then, Feed Water Rate = Product water Rate ÷ (20%-40%)
Then, Maximum Feed Water Rate = Product water Rate ÷ (20%)
And, Minimum Feed Water Rate = Product water Rate ÷ (40%)
74
Reda M. A. Hassan
Reject water rate (Sea Water)
The brine water rate (BWR) can be obtained from the percentage of rejected water rate,
where the percentage of brine water rate of sea water equal 60 % to 80% of feed water
rate(FWR), as shown in Table (3) ,then the minimum and maximum Amount of brine water can
be obtained from these equations:-
In Egypt, the total amount of product water rate was 185724 m3/ day for year 2000, then
the maximum Amount of brine water, when sea water is the feeding source is
Brine Water Rate (maximum) = 4 (PWR) = 4×185724 m3/ day = 742896 m
3/ day
Brine Water Rate (minimum) = 1.5 (PWR) = 1.5×185724 m3/ day = 278586 m
3/ day
The number of reverse osmosis plants (RO) is about 90% of the total amount of desalination
plants, in Egypt.
Then, Brine Water Rate (maximum) for (RO) plants = 4 (PWR) ×0.90 = 4×0.90× 185724 m
3/ day = 668606 m
3/ day
Brine Water Rate (minimum) for (RO) plants = 1.5 (PWR) ×0.90 = 250727 m3/ day
The number of all types of other plants is about 10%, then for this reason it will be focused on
The reverse osmosis plants, in this research. Then the minimum and maximum brine water rate
for (RO) desalination plants, also the expected increase in brine water rate for years 2000 to
2025, were calculated and tabulated as shown in Table (4).
Expected salts from brine water of desalination plants (RO) system
Sea water as a source of feeding water
The total amounts of dissolved salts can be achieved from sea water as a source of
feeding water for year 2000, the minimum and maximum Dissolved salts for RO type plants
from these equations:
Minimum dissolved salts for (RO) plants (ton /day) = total amount of desalinated water × 0.90 ×
1.5 × 0.003 = 185724 m3/day ×0.90×1.5×0.003 ton/m
3 = 8525 ton /day
Maximum salts for (RO) plants (ton /day) = total amount of desalinated water × 0.90×4×0.003 = 185724 m
3/day ×0.90×4×0.003 ton/m
3 = 22733 ton /day
The minimum and maximum of salts for (RO) desalination plants, also the expected salts for
years 2000 to 2025, were calculated and tabulated as shown in Table (5).
Expected values of brine salts from desalination plants (RO) system
The prices of different components of brine water can be calculated according to the
international prices of each component, as shown in Table (6).
Sea water as a source of feeding water
The cost of the brine disposal plays an important role in the selection of the method as it
could range from 5 to 33% of the total cost of desalination (Mohamed et al., 2005). The total
daily and yearly amounts of salts can be achieved, from sea water as a source of feeding water,
for years 2014 to 2025, also the minimum and maximum expected prices for these amounts of
salts will be achieved for reverse osmosis type plants from these equations:-
75
Using ZLD technique for safe and economic disposal of desalination plant brines in Egypt
Total yearly income of salt ($/ year) = total daily amount of salt (t/m3) × concentration of
assigned salt (t/m3) × international price of assigned salt ($) ×365 days
Minimum total yearly income of salt ($/ year) = minimum total daily amount of salt (t/m3) ×
concentration of assigned salt (t/m3) × international price of assigned salt ($) ×365 days
Maximum total yearly income of salt ($/ year) = minimum total daily amount of salt (t/m3) ×
concentration of assigned salt (t/m3) × international price of assigned salt ($) ×365 days
The amount of each component and its percentage in brine solution and the international
prices can be achieved from as said before.
The minimum total yearly price for sodium chloride salt NaCl, for years 2014 and 2025
will be as follows:
Minimum total yearly income of salt NaCl ($/ year) = minimum total daily amount of salt
15673.5 (t/d) × Concentration of assigned salt 0.000023476 (t/m3) × international price of
assigned salt 150 ($/t) ×365 days = 20145.3×1000 = 20145300 ($/ year)
Maximum total yearly income of salt NaCl ($/ year) = maximum total daily amount of salt
41796.0 (t/d) × Concentration of assigned salt 0.000023476 (t/m3) × international price of
assigned salt 150 ($/t) ×365 days = 53720.9×1000 = 53720900 ($/ year)
The maximum and minimum total yearly prices for all salts were tabulated in table (7) for
the period from 2014 to 2025, will be as follows:
Minimum total income of salts for the period from 2014 to 2025 ($) = $599240100
Maximum total income of salts for the period from 2014 to 2025 ($) = $1584973000
Cost of extracted salts (ES)
The salts which constitute more than 97% of brine solution are NaCl, MgCl2, CaCl2, and
Na2SO4. The international prices of these salts are not including transportation and marketing;
the prices are according to the international prices in 2014 (Http://offer.alibaba.com).
The average prices = (150+400+120+150) /4= 205$/ton
For one cubic meter of brine the amount of salts will be 34.4 kg/m3.
For ZLD the evaporated sea water should be 100% and contains 5% of dissolved salts, and then
the salts would be 0.95%x34.4 kg/m3.
The salts in 1m3= .97x0.95x0.0344=0.0317 ton/m
3, for RO plants the recovery ratio is
35% to 45%, then the concentration of salts in brine will be 1.535x0.0317ton/m3=0.048 ton/m3.
The value of extracted salts from 1m3 of brine = 0.048 ton/m
3x205$/ton = 9.97$/m
3.
Applying equation (1) of economic return for brine disposal, then (BCB) = 9.97$/m3 +
0.75 $/m3 + $0.066 - 5.076 $/ m
3+ 0.0= 5.71 $/m
3
Brine cost benefit analysis factor (BCB) will be 5.71 $/m3
The survey of the data and calculation showed that the present desalination plants in 2014
were 203 different plants, the reverse osmosis plants were 182 plants, and these numbers are
76
Reda M. A. Hassan
matching with the same numbers in (El Banna H., 2001). plainly from the analysis, it is obvious
that the percentage of the reverse osmosis plants is about 90% of these plants, this percent is very
important for the decision maker to decide which type is the most valuable for investment.
The calculation of gathered data showed that the expected number of different types of
desalination plants in 2025 will be 327 plants, using rate of change 4.8% per year increasing in
desalination plants, from these plants 295 plants of (RO) type.
According to the calculations of the currently total amount of brine water from
desalination plants in Egypt, and the expected brine water in 2025, also the expected total
amount of dissolved salts in 2025 which were presented in the methodology, and from the
tabulated data in Tables (6 & 8 ).
The calculations revealed that, for present year 2014 the total minimum and maximum
amounts of brine water from RO type of desalination plants were 460,985 m3/day and 1,229,294
m3/day, when using sea water as a source of feeding water.
Also the expected total minimum and maximum amounts of brine water from RO type of
desalination plants, for year 2025 will be 743,870 m3/day and 1,983,654 m
3/day.
After obtaining the total amounts of brine, several excel spread sheets were carried out to
calculate the total amount of each salt in the brine, and its income according to the international
prices in year 2014, for the enhancement of these salts, which can be collected to use it in
different agricultural and industrial purposes by analyzing and assessing the amounts and prices
of these salts.
The calculations showed that, for all RO plants in Egypt the salt (NaCl) has the biggest
total yearly amounts and income during 12 years from (2014 to 2025), where the minimum
income will be 310,560,000 $/(12years) and maximum income will be 828,160,700 $/(12years).
To study the economic aspects of salts, as an opportunity for investment and as a new
source of foreign currency, the yearly income for each salt in the brine for reverse osmosis (RO)
type of desalination plants, had been calculated for the period from 2014 to 2025, the calculated
data was shown in table (8).
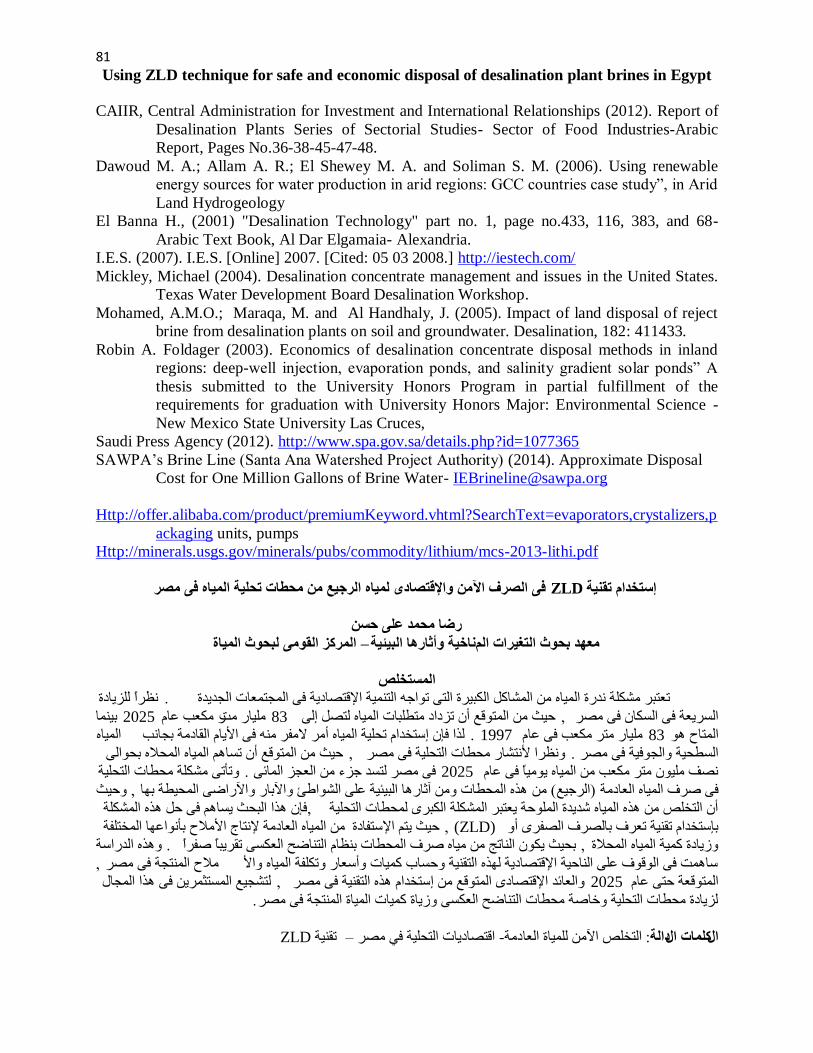
It was obvious that from table (8), the total maximum income for all RO plants in Egypt,
for all salts in brine will be 1,584,973,000$/12years. Also the return income of salts NaCl,
MgCl2, Na2So4, CaCl2 and KCl are more valuable than NaHCO3, KBr, H2BO3, SrCl2, and NaF as
shown in Figure (2). after determining currently and expected amounts of brine water and their
economic return, without taking into considerations the different costs, of the variables which are
affecting the brine investment, for this reason calculations for the cost of one cubic meter of
brine had been carried out to compare among these variables, after making the calculation using
equation 1, the calculation showed that the economic return from brine will be more than 5 $/m3
of brine.
Conclusion and Recommendations
It could be concluded from the study that, the usage of ZLD technique for reverse osmosis
(RO) type of desalination plants in Egypt, will add more than 5 $/m3 of brine, then it will be
a material of significant usage, and has some opportunities for economic return, finally it will
protect environment.
The brine economic return can be expressed by simple relation, which includes the quantity
of extracted salts (ES), the quantity of new desalinated water (added water) from brine (AW),
the cost of brine disposal by traditional methods (CBD), the cost of zero liquid discharge
units (CZLD), and the cost of environmental conservation (CEC).
77
Using ZLD technique for safe and economic disposal of desalination plant brines in Egypt
It is concluded also that the percentage of the RO plants in Egypt are about 90% of all
different plants, this information is very important for the decision maker, to decide which
type is the most valuable for investment.
The yearly rate of change in the number of reverse osmosis desalination plants in Egypt is
about (4.8%). In the future the expected number of different types of desalination plants in
2025 will be 327 plants from which 295 plants of (RO) type.
The salt (NaCl) has the biggest total daily and yearly amounts and income.
The return income of salts NaCl, MgCl2, Na2So4, CaCl2 and KCl are more valuable than
NaHCO3, KBr, H2BO3, SrCl2, and NaF.
It is recommended for the future work that, the research of brine mining and safe disposal of
brine, with a minimum impact on the environment should be studied.
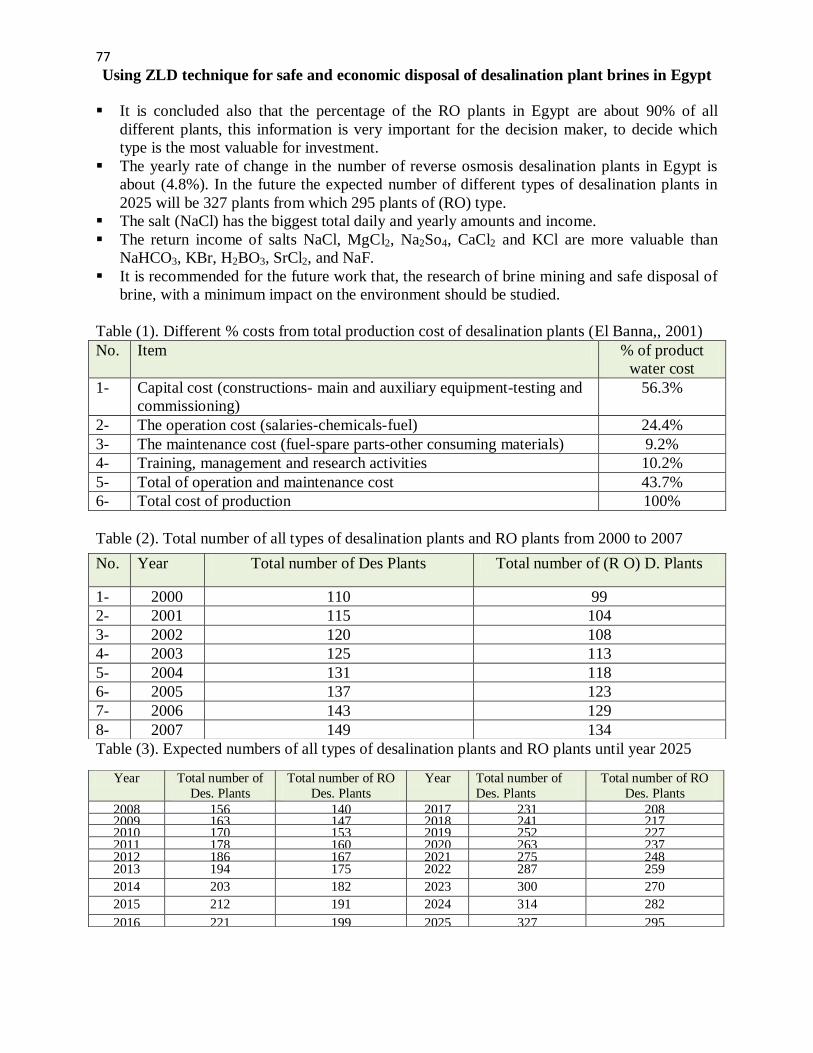
Table (1). Different % costs from total production cost of desalination plants (El Banna,, 2001)
No. Item % of product
water cost
1- Capital cost (constructions- main and auxiliary equipment-testing and
commissioning)
56.3%
2- The operation cost (salaries-chemicals-fuel) 24.4%
3- The maintenance cost (fuel-spare parts-other consuming materials) 9.2%
4- Training, management and research activities 10.2%
5- Total of operation and maintenance cost 43.7%
6- Total cost of production 100%
Table (2). Total number of all types of desalination plants and RO plants from 2000 to 2007
Table (3). Expected numbers of all types of desalination plants and RO plants until year 2025
No. Year Total number of Des Plants Total number of (R O) D. Plants
1- 2000 110 99
2- 2001 115 104
3- 2002 120 108
4- 2003 125 113
5- 2004 131 118
6- 2005 137 123
7- 2006 143 129
8- 2007 149 134
Year Total number of
Des. Plants
Total number of RO
Des. Plants
Year Total number of
Des. Plants
Total number of RO
Des. Plants
2008 156 140 2017 231 208 2009 163 147 2018 241 217 2010 170 153 2019 252 227 2011 178 160 2020 263 237 2012 186 167 2021 275 248 2013 194 175 2022 287 259
2014 203 182 2023 300 270
2015 212 191 2024 314 282
2016 221 199 2025 327 295
78
Reda M. A. Hassan
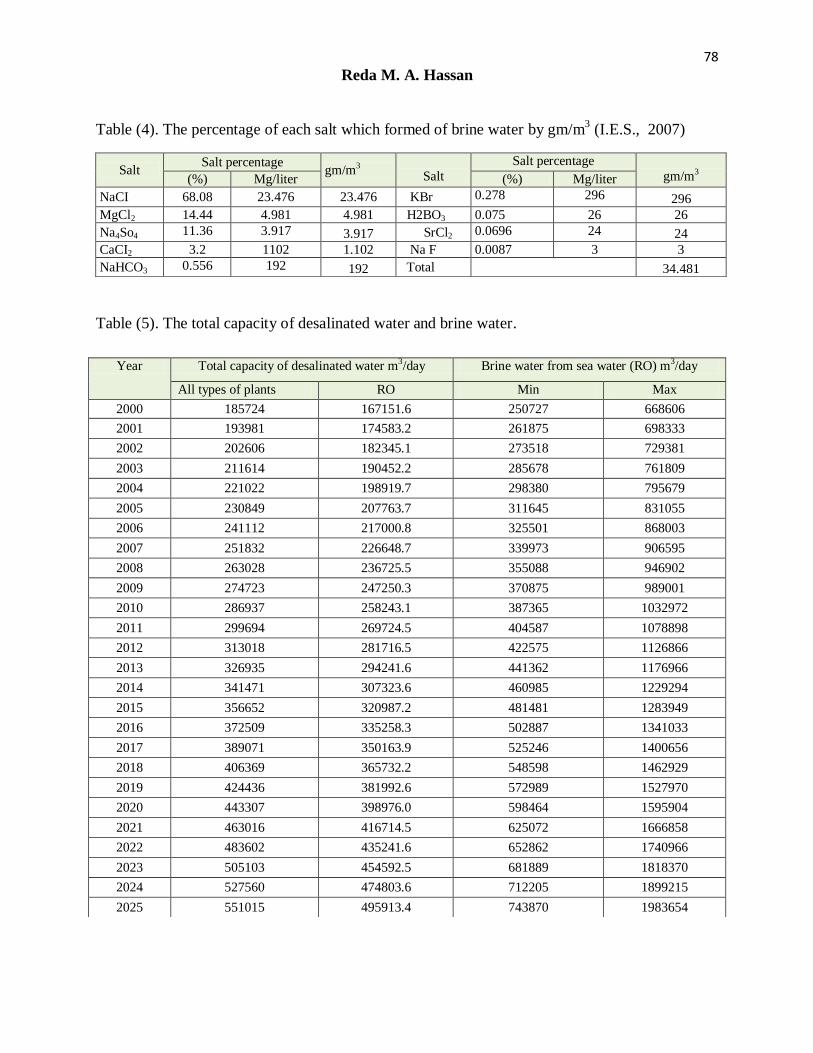
Table (4). The percentage of each salt which formed of brine water by gm/m3 (I.E.S., 2007)
Table (5). The total capacity of desalinated water and brine water.
gm/m3
Salt percentage
Salt gm/m3 Salt percentage
Salt Mg/liter (%) Mg/liter (%)
296 296 0.278 KBr 23.476 23.476 68.08 NaCI
26 26 0.075 H2BO3 4.981 4.981 14.44 MgCl2
24 24 0.0696 SrCl2 3.917 3.917 11.36 Na4So4
3 3 0.0087 Na F 1.102 1102 3.2 CaCI2
34.481 Total 192 192 0.556 NaHCO3
Year Total capacity of desalinated water m3/day Brine water from sea water (RO) m3/day
All types of plants RO Min Max
2000 185724 167151.6 250727 668606
2001 193981 174583.2 261875 698333
2002 202606 182345.1 273518 729381
2003 211614 190452.2 285678 761809
2004 221022 198919.7 298380 795679
2005 230849 207763.7 311645 831055
2006 241112 217000.8 325501 868003
2007 251832 226648.7 339973 906595
2008 263028 236725.5 355088 946902
2009 274723 247250.3 370875 989001
2010 286937 258243.1 387365 1032972
2011 299694 269724.5 404587 1078898
2012 313018 281716.5 422575 1126866
2013 326935 294241.6 441362 1176966
2014 341471 307323.6 460985 1229294
2015 356652 320987.2 481481 1283949
2016 372509 335258.3 502887 1341033
2017 389071 350163.9 525246 1400656
2018 406369 365732.2 548598 1462929
2019 424436 381992.6 572989 1527970
2020 443307 398976.0 598464 1595904
2021 463016 416714.5 625072 1666858
2022 483602 435241.6 652862 1740966
2023 505103 454592.5 681889 1818370
2024 527560 474803.6 712205 1899215
2025 551015 495913.4 743870 1983654
79
Using ZLD technique for safe and economic disposal of desalination plant brines in Egypt
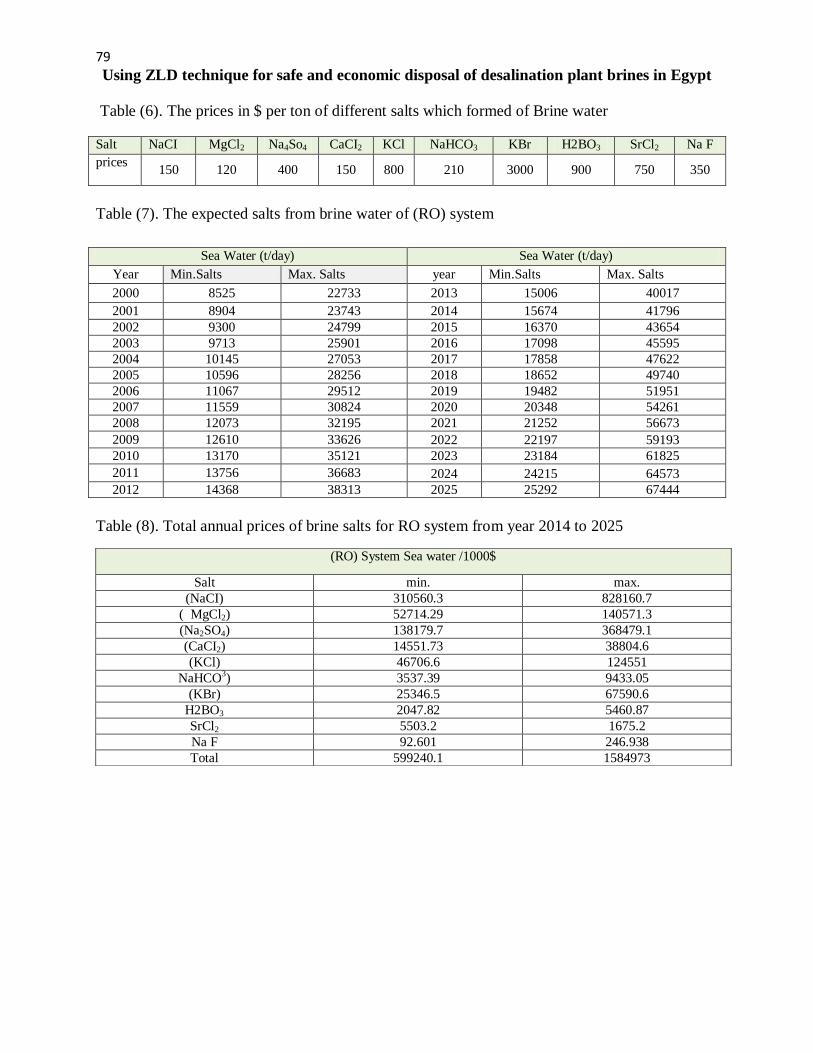
Table (6). The prices in $ per ton of different salts which formed of Brine water
Table (7). The expected salts from brine water of (RO) system
Table (8). Total annual prices of brine salts for RO system from year 2014 to 2025
Salt NaCI MgCl2 Na4So4 CaCI2 KCl NaHCO3 KBr H2BO3 SrCl2 Na F
prices
150 120 400 150 800 210 3000 900 750 350
Sea Water (t/day) Sea Water (t/day)
Year Min.Salts Max. Salts year Min.Salts Max. Salts
2000 8525 22733 2013 15006 40017
2001 8904 23743 2014 15674 41796
2002 9300 24799 2015 16370 43654
2003 9713 25901 2016 17098 45595
2004 10145 27053 2017 17858 47622
2005 10596 28256 2018 18652 49740
2006 11067 29512 2019 19482 51951
2007 11559 30824 2020 20348 54261
2008 12073 32195 2021 21252 56673
2009 12610 33626 2022 22197 59193
2010 13170 35121 2023 23184 61825
2011 13756 36683 2024 24215 64573
2012 14368 38313 2025 25292 67444
(RO) System Sea water /1000$
max. min. Salt
828160.7 310560.3 (NaCI)
140571.3 52714.29 ( MgCl2)
368479.1 138179.7 (Na2SO4)
38804.6 14551.73 (CaCI2)
124551 46706.6 (KCl)
9433.05 3537.39 NaHCO3)
67590.6 25346.5 (KBr)
5460.87 2047.82 H2BO3
1675.2 5503.2 SrCl2
246.938 92.601 Na F
1584973 599240.1 Total
80
Reda M. A. Hassan
Fig. (1). Schematic of I.E.S zero liquid discharge system for seawater desalination plants (Ref.6)
Fig. (2). Total annual values of brine salts for RO system from year 2014 to 2025
REFERENCES
Ahmed, M.; Shayya, W. H. ; Hoey, D.; Maendran, A.; Morris, R. and Al-Handaly, J. (2000). Use
of evaporation ponds for brine disposal in desalination plants. Desalination,
130:155-168
Ahmed, M.; Shayya, W. H. ; Hoey, D. and Al- Handaly, J. (2001). Brine disposal from reverse
osmosis desalination plants in Oman and United Arab Emirates. Desalination,
133:135-147.
Bardi, U. (2010). Extracting Minerals from Seawater: An Energy Analysis, Sustainability “2010,
p2, p980-p992. Caterina De Vito , Silvano Mignardi ,Vincenzo Ferrini and Robert F. Martin (2011). Reject
Brines from Desalination as Possible Sources for Environmental Technologies. Cited at
www.intechopen.com.
81
Using ZLD technique for safe and economic disposal of desalination plant brines in Egypt
CAIIR, Central Administration for Investment and International Relationships (2012). Report of
Desalination Plants Series of Sectorial Studies- Sector of Food Industries-Arabic
Report, Pages No.36-38-45-47-48.
Dawoud M. A.; Allam A. R.; El Shewey M. A. and Soliman S. M. (2006). Using renewable
energy sources for water production in arid regions: GCC countries case study”, in Arid
Land Hydrogeology
El Banna H., (2001) "Desalination Technology" part no. 1, page no.433, 116, 383, and 68-
Arabic Text Book, Al Dar Elgamaia- Alexandria.
I.E.S. (2007). I.E.S. [Online] 2007. [Cited: 05 03 2008.] http://iestech.com/ Mickley, Michael (2004). Desalination concentrate management and issues in the United States.
Texas Water Development Board Desalination Workshop.
Mohamed, A.M.O.; Maraqa, M. and Al Handhaly, J. (2005). Impact of land disposal of reject
brine from desalination plants on soil and groundwater. Desalination, 182: 411433.
Robin A. Foldager (2003). Economics of desalination concentrate disposal methods in inland
regions: deep-well injection, evaporation ponds, and salinity gradient solar ponds” A
thesis submitted to the University Honors Program in partial fulfillment of the
requirements for graduation with University Honors Major: Environmental Science -
New Mexico State University Las Cruces,
Saudi Press Agency (2012). http://www.spa.gov.sa/details.php?id=1077365
SAWPA’s Brine Line (Santa Ana Watershed Project Authority) (2014). Approximate Disposal
Cost for One Million Gallons of Brine Water- [email protected]
Http://offer.alibaba.com/product/premiumKeyword.vhtml?SearchText=evaporators,crystalizers,p
ackaging units, pumps
Http://minerals.usgs.gov/minerals/pubs/commodity/lithium/mcs-2013-lithi.pdf
ف الصرف اآلهن واإلقتصبدي لويبه الرجيع هن هحطبث تحليت الويبه ف هصر ZLDإستخذام تقنيت
رضب هحوذ عل حسن
الوركز القىه لبحىث الويبة –نبخيت وأثبرهب البيئيت هعهذ بحىث التغيراث الن
الوستخلص
ظزا نهشيبدح . رعزجز يشكهخ ذرح انيب ي انشبكم انكجيزح انز راخ انزيخ اإلقزصبديخ ف اندزعبد اندذيذح
ثيب 2025ر يكعت عبو يهيبر يذ 83زيث ي انزقع أ رشداد يزطهجبد انيب نزصم إن , انسزيعخ ف انسكب ف يصز
انيب نذا فإ إسزخذاو رسهيخ انيب أيز اليفز ي ف األيبو انقبديخ ثدبت. 1997يهيبر يزز يكعت ف عبو 83انزبذ
زيث ي انزقع أ رسبى انيب انسال ثسان , ظزا ألزشبر يسطبد انزسهيخ ف يصز . انسطسيخ اندفيخ ف يصز
رأر يشكهخ يسطبد انزسهيخ . ف يصز نزسذ خشء ي انعدش انبئ 2025صف يهي يزز يكعت ي انيب يييب ف عبو
زيث , ذ انسطبد ي آثبرب انجيئيخ عه انشاطئ اآلثبر اآلراض انسيطخ ثب ي( انزخيع)ف صزف انيب انعبديخ
فإ ذا انجسث يسبى ف زم ذ انشكهخ ,أ انزخهص ي ذ انيب شذيذح انهزخ يعزجز انشكهخ انكجز نسطبد انزسهيخ
ي انيب انعبديخ إلزبج األيالذ ثأاعب انخزهفخ زيث يزى اإلسزفبدح , (ZLD)ثإسزخذاو رقيخ رعزف ثبنصزف انصفز أ
ذ انذراسخ . ثسيث يك انبرح ي ييب صزف انسطبد ثظبو انزبضر انعكس رقزيجب صفزا , سيبدح كيخ انيب انسالح
, يالذ انزدخ ف يصزسبذ ف انقف عه انبزيخ اإلقزصبديخ نذ انزقيخ زسبة كيبد أسعبر ركهفخ انيب األ
نزشديع انسزثزي ف ذا اندبل , انعبئذ اإلقزصبد انزقع ي إسزخذاو ذ انزقيخ ف يصز 2025انزقعخ زز عبو
. نشيبدح يسطبد انزسهيخ خبصخ يسطبد انزبضر انعكس سيبح كيبد انيبح انزدخ ف يصز
ZLD رقيخ –اقزصبديبد انزسهيخ في يصز -ديخانزخهص اآلي نهيبح انعب: دالتكلوبث الال
Copyright © 2022 FDOKUMEN