Venture Boldly. Expand Boundaries. - The Forum on Workplace ...
Upload
presidioeduCategory
view
5download
0
UsinganEvent-TriggeredVideo InterventionSystemto Expand the Supervised Learning of NewlyLicensed Adolescent DriversCher Carney, MS, Daniel V. McGehee, PhD, John D. Lee, PhD, Michelle L. Reyes, BSE, and Mireille Raby, MS
In 2005, motor-vehicle crashes accounted formore adolescent deaths in the United States(5253) than did homicide (2219), suicide(1809), and all forms of cancer (981) com-bined.1 Fatal crashes occur more frequently foradolescents—especially for newly licensed ado-lescents—than they do for any other segment ofthe population. In fact, the crash rate per miledriven for 16-year-old drivers is roughly 4 timesthe crash rate for all drivers (61.4 per 1000drivers vs. 16.8 per 1000 drivers).1 Inexperi-ence, immaturity, and risky driving all contributeto the disproportionate number of adolescentsinvolved in motor-vehicle crashes.2
Parents generally play an important role intheir adolescents’ driving development bymentoring and monitoring them during thesupervised-learning phase of driver licensing.However, once adolescents receive their in-dependent driver’s license, parental involve-ment wanes.3,4 This occurs at the worst possibletime, because research shows that the first 6months of independent driving are the mostdangerous. In fact, the crash rate per mile drivenfor newly licensed drivers aged 16 years is twicethat of drivers aged 18 to 19 years.1
Experts on the issue of adolescent drivingadvocate a dual approach for helping adoles-cents become independent drivers: the adop-tion of a graduated driver licensing policy andan increase in parental supervision.5 Mostgraduated driver licensing policies restrict expo-sure of newly licensed adolescents to the riskiestconditions, extend training periods, and requiredrivers to pass tests in order to progress to thenext levels. Doing so increases new drivers’experience and allows additional time for themto develop maturity and driving skills. Recentresearch has shown graduated driver licensing tobe successful in reducing crashes among begin-ning drivers by 7% to 37%.6–8 In addition,parental monitoring can reduce intentionallyrisky driving behaviors, and parental mentoring
can fill the gaps left by standard driver educationby helping adolescents become more aware ofroadway hazards.
The crash risk for adolescent drivers is thelowest during the supervised-learner periodbecause of parental involvement.9 Severalnew technologies are designed to extend this‘‘low-risk’’ period by allowing parents to con-tinue in their supervisory role even afterindependent driving has begun. Data re-corders and global positioning systems canprovide data to parents on general drivingbehavior (e.g., speed, acceleration, location).Although there is a lack of research on thesemore traditional monitoring technologies, ourrecent study of adolescents aged 16 to 17years in rural Iowa found that event-triggeredvideo-based interventions may have the po-tential to improve driving safety among ado-lescents.10,11 Parents can use such systems tomonitor adolescents and enforce restrictions ondriving behavior. Alternatively, the systems can
be used to mentor adolescents and train them todetect hazards.
This follow-up study builds on our previousresearch with rural Iowa drivers by examining16-year-old adolescents with less than 6months of driving experience who drive inan urban environment. Urban adolescentsexperience very different driving conditionsfrom their rural counterparts and are atgreater risk for being involved in a crash.12
We assessed whether event-trigged videotechnology that provides feedback to newlylicensed adolescents and their parents re-garding potentially unsafe driving behaviorsreduced the number of safety-relevant drivingerrors committed by the adolescents. Weaddressed the following questions: (1) Doesthe intervention reduce the frequency ofsafety-relevant driving errors? (2) What typesof unsafe behaviors are most influenced bythis type of intervention? (3) Does the in-tervention have a lasting effect? and (4) Does
Objectives. We examined whether feedback from an event-triggered video
intervention system reduced the number of safety-relevant driving errors made
by newly licensed adolescents.
Methods. We used a 1-group pretest–posttest quasi-experimental design to
compare the rate of coachable error events per 1000 miles for 18 drivers who
were aged 16 years. The intervention consisted of immediate visual feedback
provided to the drivers and weekly event reports and videos provided to the
drivers and their parents.
Results. The number of coachable events was reduced by 61% overall during
the intervention (c2=11.42; P=.001) and did not significantly increase during the
second baseline, which was assessed after the intervention ended (c2=1.49;
P=.223). The greatest reduction was seen in the category of improper turns or
curves and for drivers identified at the first baseline as ‘‘high-event’’ drivers.
Conclusions. Our results show that immediate visual feedback for adoles-
cents and cumulative video feedback for parents and adolescents during the
early period of independent driving can have a dramatic influence on the rate
of safety-relevant driving events. To the extent that such events are a proxy
for crash risk, we suggest that feedback can enhance adolescent driving
safety. (Am J Public Health. 2010;100:1101–1106. doi:10.2105/AJPH.2009.
165829)
RESEARCH AND PRACTICE
June 2010, Vol 100, No. 6 | American Journal of Public Health Carney et al. | Peer Reviewed | Research and Practice | 1101
the intervention benefit drivers by enablingparental monitoring or mentoring?
To the extent that such technology enablesparental monitoring, we hypothesized thatthe benefit would be immediate but that itwould not last once the intervention wascomplete. Such a benefit would also begreater for intentional behaviors that areunsafe. On the other hand, if the technologyenables parental mentoring, we hypothesizedthat the benefit would emerge over time,would not be greater for intentional behav-iors that are unsafe, and would persist beyondthe intervention.
METHODS
Thirty-six 16-year-old drivers (19 males and17 females) were recruited from Eagan HighSchool in Eagan, Minnesota, a suburb of Min-neapolis. All of the participants were newlylicensed adolescents and had less than 5months of unsupervised driving experiencebefore taking part in the study (52% hadless than 2 months of experience). The
adolescents were required to be the primarydriver of their vehicle, in order to ensure thatall of the miles driven were their own. Partic-ipants were paid $25 per month to participate,and they received a $75 bonus for completingall 12 months.
Each participant’s vehicle was equipped withan event-triggered video recording systemmanufactured by DriveCam, Inc. (San Diego,CA). The system is a palm-sized device thatintegrates 2 video cameras (forward and in-terior view), a microphone, a 2-axis acceler-ometer, a 20-second data buffer, an infraredilluminator for lighting the vehicle’s interior atnight, and a wireless transmitter. The device ismounted on the windshield behind the rear-view mirror and is wired into the vehicle’selectrical system. Data are continuously buff-ered 24 hours a day but are written to internalmemory only when an acceleration threshold isexceeded or if the camera is manually acti-vated. Each video clip written to internalmemory captures the 10 seconds precedingand the10 seconds following an accelerometer-based trigger.
There were 3 types of accelerometer-basedtriggers: shock, longitudinal, and lateral. Indi-vidual threshold levels were determined foreach trigger, measured in g-force accelerations.The shock trigger threshold was1.5 g. This typeof trigger is most often caused by severeimpacts. The longitudinal trigger threshold,most often exceeded because of hard braking,was set at 0.50 g. Lateral triggers are most oftencaused by hard cornering or swerving. Thethreshold setting used for this trigger was 0.55 g.
All data were automatically downloadedfrom the device via a secure wireless networkwhenever participants parked in their highschool parking lot. Once downloaded, theencrypted data were classified according toevent type, as shown in the box on this page.
Additional coding was conducted for eachof the safety-relevant events. Information re-garding the nature of the event, its cause, thenumber of vehicles involved, and the actionof the driver that caused the event wererecorded. Safety-relevant data were alsorecorded, including information about safety-belt use, the presence of loud music, andaggressive or reckless driving. Informationabout the number, location, and age of pas-sengers and whether they were wearing a seatbelt was also entered into the database. Alsorecorded were environmental factors (such asweather, light, road conditions, road geome-try, and road type) and driver-related factors(such as distraction, fatigue, and social influ-ence of passengers).
Participants were asked to self-report theirmileage each week by manually triggering thesystem and reading their odometer. In addition,project staff took odometer readings at thebeginning and end of each of the 3 projectphases (first baseline, intervention, and secondbaseline). Mileage traveled during each 8-weekintervention phase was estimated by interpo-lating between odometer readings. Teensreported days when their car was not in use(e.g., gone on vacation, in for repairs, etc.); thesedays were not counted when interpolating orcalculating miles per day.
A 1-group pretest–posttest quasi-experi-mental design was used for this study.13 Table1describes the 3 phases of the design, includingthe duration of each and the type of feedbackprovided. The 6-week first baseline phasecame first, followed by a 40-week intervention
Classification of Event Types Among Drivers Aged 16 Years Recorded by an Event-
Triggered Video Intervention System: Eagan, Minnesota, 2007–2008
Safety-relevant eventsd Incident: A threshold exceedance in which the driver’s action, either intentional or
unintentional, was responsible for a safety-relevant event.d Invalid trigger with feedback: Activation of the system because of something other than
unsafe driving behavior (e.g., the vehicle hitting a bump or pothole in the roadway ormanual activation by someone in the vehicle). However, as the video was reviewed, a safety-relevant concern was revealed (e.g., unbelted driver or passenger, cell phone use, or trafficviolations such as failing to stop for traffic signs or signals).
d Near crash: A threshold exceedance in which an evasive maneuver was performed to avoida collision.
d Crash: A collision with an object or vehicle.d Good response: A threshold exceedance in which the driver’s action occurred in response
to an external event.
Coachable eventsd All safety-relevant events described above, excluding the ‘‘good responses.’’
Invalid eventsd Invalid trigger: Activation of the system because of something other than unsafe driving
behavior (e.g., the vehicle hitting a bump or pothole in the roadway).d Manual: A trigger caused by the driver or passenger pressing a button on the device. This
happened for a variety of reasons (e.g., weekly odometer readings, capturing the actions ofother vehicles, recording passengers).
d Nonparticipant: A threshold exceedance or manual activation that occurred while someoneother than the participant was driving the vehicle. These video events were not reviewed.
RESEARCH AND PRACTICE
1102 | Research and Practice | Peer Reviewed | Carney et al. American Journal of Public Health | June 2010, Vol 100, No. 6
divided into 5 equal segments of 8 weeks each.The intervention was divided into segments toenable us to examine how long it took for theintervention to cause change and whether thechanges would persist throughout the entire40 weeks. The 6-week second baseline phasecame last.
During the intervention phase, feedbacktook 2 forms: immediate and delayed. Imme-diate feedback was provided to the adolescentvia a blinking LED on the in-vehicle system.Delayed feedback consisted of a weekly mail-ing to the adolescent driver’s parents contain-ing both a written report of safety-relevantevents, including seatbelt compliance and cellphone use, and a DVD containing the videoclips of those safety-relevant events. Parentswere asked to review this information withtheir adolescent each week.
Upon completion of the study, adolescentsand parents were asked to complete a briefonline survey regarding their experiencesduring the study. The survey asked questionsabout the amount of time spent reviewingthe weekly feedback, the way in which theparent used the feedback, the adolescent’simpression of the effectiveness of the system,and the adolescent’s acceptance of thetechnology.
The primary dependent measure was thenumber of coachable events per 1000 milesdriven. Negative binomial regression of thenumber of coachable events on study phasewas conducted, with log of phase mileage as theoffset variable and participant as the repeatedmeasure. Two contrasts were calculated tocompare the 5 segments of the interventionphase to both the first and second baselinephases. The analyses were completed using
the PROC GENMOD command in SAS version9.1 (SAS Institute, Inc, Chicago, IL).
RESULTS
Of the 36 adolescent participants, 2 wereunable to participate because of licensing is-sues; 1 other adolescent began the study buthad difficulties with her vehicle and was thusunable to continue. Of the remaining 33participants, 10 had at least 20% of their totalevents triggered while someone else was driv-ing their vehicle. For these 10 adolescents, itis possible that the other driver(s) drove thestudy vehicle infrequently, despite causinga sizable proportion of the triggers; but it couldalso be that the other driver(s) simply drove thestudy vehicle more frequently than did theadolescent participant. Because we were exam-ining the number of events triggered per 1000miles driven, and we were unable to determinewith any reasonable certainty the number ofmiles driven by those 10 participants, their datawere not included in the analysis.
Five of the 23 remaining participants did notagree to continue their participation in theproject for the full year of data collection. Theirintervention lasted only for 16 weeks. A com-parison of the 5 participants who discontinuedthe study with the 18 who continued showedno significant differences in the number ofcoachable events triggered per 1000 milesfor the first baseline phase and for the first 28-week segments of the intervention phase.Therefore, only the data from the 18 partici-pants who were considered the primary driversof their vehicles and who completed the entireyear of data collection were used for thesubsequent analyses.
The 18 adolescent drivers (7 males, 11females) averaged 6904 miles annually. Theirmileage remained relatively constant through-out the year, ranging on average from 17 to 26miles daily, with the lowest mileage occurringduring the months of January and February.Overall, 3792 events were triggered for these18 drivers, and 1416 of these events werecoded as coachable events.
Effectiveness of the Intervention
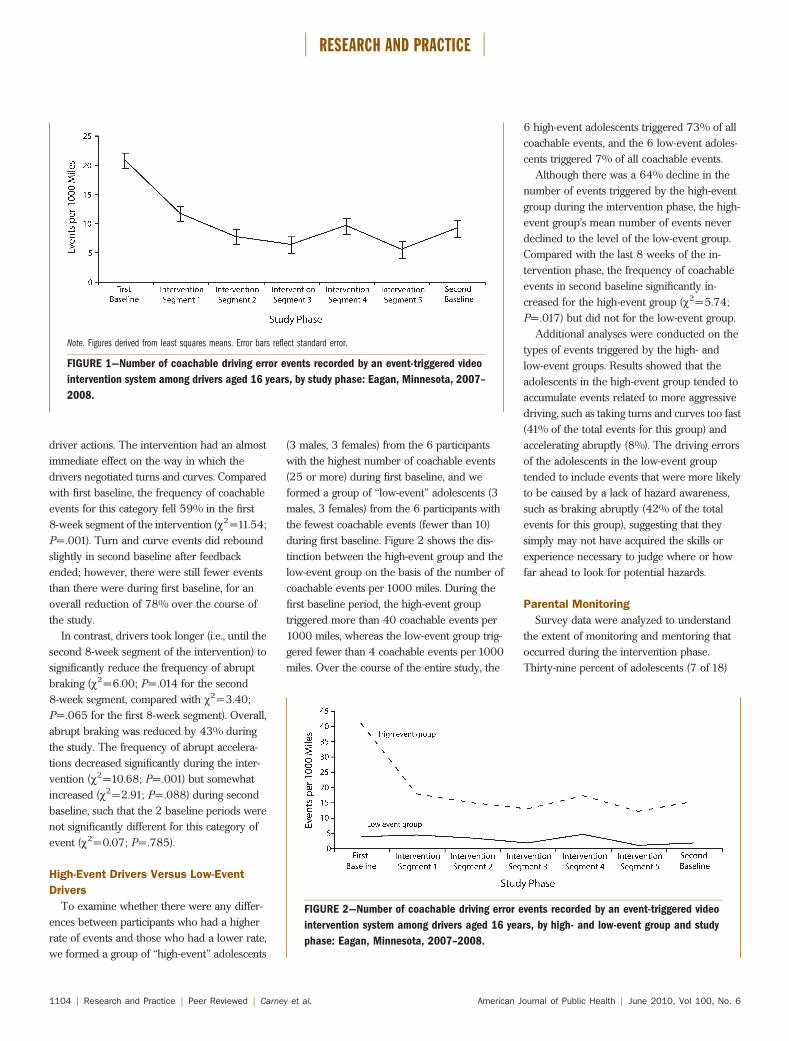
The number of coachable events per 1000miles driven was calculated for each participantfor each segment of the study. Results of theinitial data analysis showed a 61% reduction inthe number of coachable events during theintervention, from an average of 21 per 1000miles at first baseline to 8 per 1000 miles atsecond baseline (Figure 1). The number ofcoachable events decreased significantly withintervention relative to the first baseline(c2=11.42; P=.001) and did not significantlyincrease during the second baseline after theintervention ended (c2=1.49; P=.223).
During weeks 25 through 32 of the inter-vention (January 10 through March 5), therewas a small but significant increase in thenumber of coachable events triggered com-pared with the 8-week segments before theintervention (c2=7.11; P=.008) and after theintervention (c2=9.23; P=.002). The rise inthe number of events corresponds to an in-crease in inclement weather (e.g., snow and ice).
Further analysis of the events coded asincidents, near crashes, or crashes found thatmost were caused by the driver making im-proper turns or curves (41%), braking abruptly(30%), or accelerating abruptly (7%). Theintervention had different effects on different
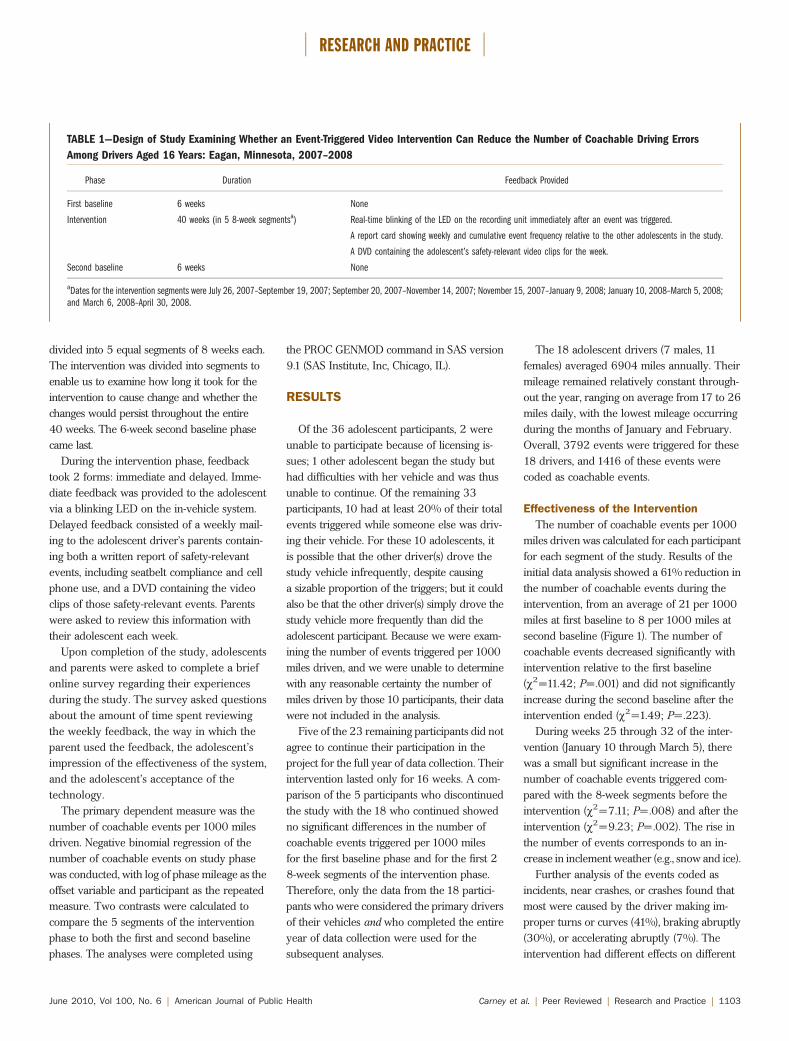
TABLE 1—Design of Study Examining Whether an Event-Triggered Video Intervention Can Reduce the Number of Coachable Driving Errors
Among Drivers Aged 16 Years: Eagan, Minnesota, 2007–2008
Phase Duration Feedback Provided
First baseline 6 weeks None
Intervention 40 weeks (in 5 8-week segmentsa) Real-time blinking of the LED on the recording unit immediately after an event was triggered.
A report card showing weekly and cumulative event frequency relative to the other adolescents in the study.
A DVD containing the adolescent’s safety-relevant video clips for the week.
Second baseline 6 weeks None
aDates for the intervention segments were July 26, 2007–September 19, 2007; September 20, 2007–November 14, 2007; November 15, 2007–January 9, 2008; January 10, 2008–March 5, 2008;and March 6, 2008–April 30, 2008.
RESEARCH AND PRACTICE
June 2010, Vol 100, No. 6 | American Journal of Public Health Carney et al. | Peer Reviewed | Research and Practice | 1103
driver actions. The intervention had an almostimmediate effect on the way in which thedrivers negotiated turns and curves. Comparedwith first baseline, the frequency of coachableevents for this category fell 59% in the first8-week segment of the intervention (c2=11.54;P=.001). Turn and curve events did reboundslightly in second baseline after feedbackended; however, there were still fewer eventsthan there were during first baseline, for anoverall reduction of 78% over the course ofthe study.
In contrast, drivers took longer (i.e., until thesecond 8-week segment of the intervention) tosignificantly reduce the frequency of abruptbraking (c2=6.00; P=.014 for the second8-week segment, compared with c2=3.40;P=.065 for the first 8-week segment). Overall,abrupt braking was reduced by 43% duringthe study. The frequency of abrupt accelera-tions decreased significantly during the inter-vention (c2=10.68; P=.001) but somewhatincreased (c2=2.91; P=.088) during secondbaseline, such that the 2 baseline periods werenot significantly different for this category ofevent (c2=0.07; P=.785).
High-Event Drivers Versus Low-Event
Drivers
To examine whether there were any differ-ences between participants who had a higherrate of events and those who had a lower rate,we formed a group of ‘‘high-event’’ adolescents
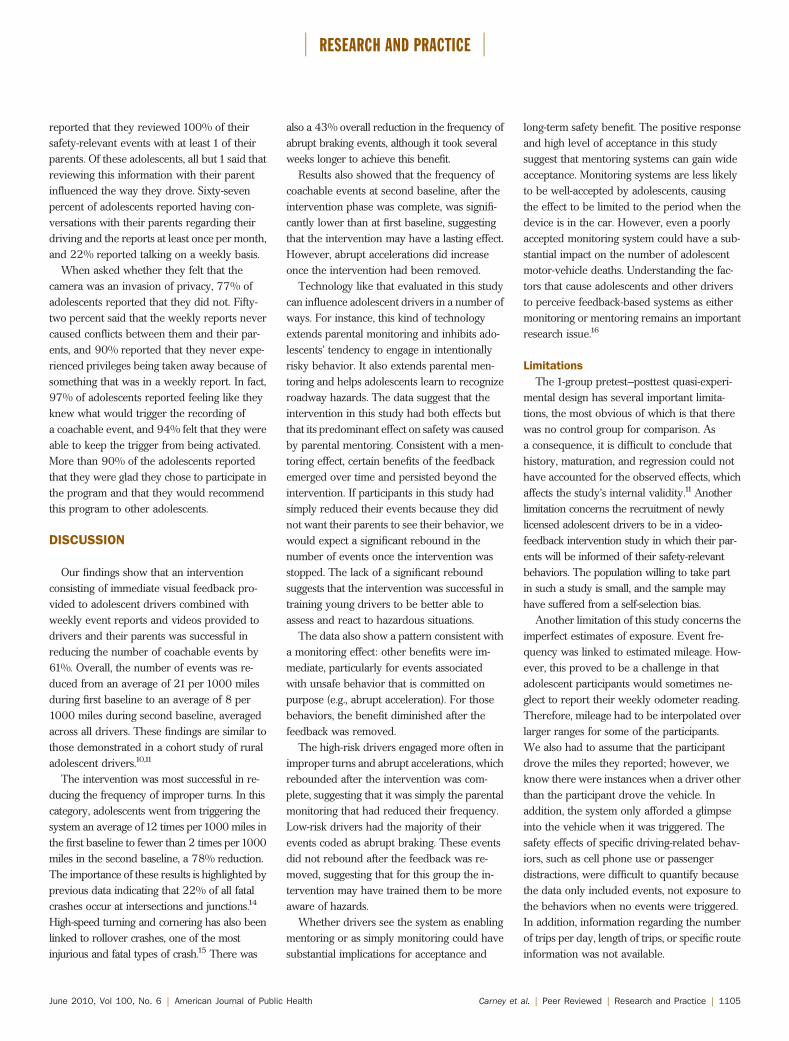
(3 males, 3 females) from the 6 participantswith the highest number of coachable events(25 or more) during first baseline, and weformed a group of ‘‘low-event’’ adolescents (3males, 3 females) from the 6 participants withthe fewest coachable events (fewer than 10)during first baseline. Figure 2 shows the dis-tinction between the high-event group and thelow-event group on the basis of the number ofcoachable events per 1000 miles. During thefirst baseline period, the high-event grouptriggered more than 40 coachable events per1000 miles, whereas the low-event group trig-gered fewer than 4 coachable events per 1000miles. Over the course of the entire study, the
6 high-event adolescents triggered 73% of allcoachable events, and the 6 low-event adoles-cents triggered 7% of all coachable events.
Although there was a 64% decline in thenumber of events triggered by the high-eventgroup during the intervention phase, the high-event group’s mean number of events neverdeclined to the level of the low-event group.Compared with the last 8 weeks of the in-tervention phase, the frequency of coachableevents in second baseline significantly in-creased for the high-event group (c2=5.74;P=.017) but did not for the low-event group.
Additional analyses were conducted on thetypes of events triggered by the high- andlow-event groups. Results showed that theadolescents in the high-event group tended toaccumulate events related to more aggressivedriving, such as taking turns and curves too fast(41% of the total events for this group) andaccelerating abruptly (8%). The driving errorsof the adolescents in the low-event grouptended to include events that were more likelyto be caused by a lack of hazard awareness,such as braking abruptly (42% of the totalevents for this group), suggesting that theysimply may not have acquired the skills orexperience necessary to judge where or howfar ahead to look for potential hazards.
Parental Monitoring
Survey data were analyzed to understandthe extent of monitoring and mentoring thatoccurred during the intervention phase.Thirty-nine percent of adolescents (7 of 18)
Note. Figures derived from least squares means. Error bars reflect standard error.
FIGURE 1—Number of coachable driving error events recorded by an event-triggered video
intervention system among drivers aged 16 years, by study phase: Eagan, Minnesota, 2007–
2008.
FIGURE 2—Number of coachable driving error events recorded by an event-triggered video
intervention system among drivers aged 16 years, by high- and low-event group and study
phase: Eagan, Minnesota, 2007–2008.
RESEARCH AND PRACTICE
1104 | Research and Practice | Peer Reviewed | Carney et al. American Journal of Public Health | June 2010, Vol 100, No. 6
reported that they reviewed 100% of theirsafety-relevant events with at least 1 of theirparents. Of these adolescents, all but 1 said thatreviewing this information with their parentinfluenced the way they drove. Sixty-sevenpercent of adolescents reported having con-versations with their parents regarding theirdriving and the reports at least once per month,and 22% reported talking on a weekly basis.
When asked whether they felt that thecamera was an invasion of privacy, 77% ofadolescents reported that they did not. Fifty-two percent said that the weekly reports nevercaused conflicts between them and their par-ents, and 90% reported that they never expe-rienced privileges being taken away because ofsomething that was in a weekly report. In fact,97% of adolescents reported feeling like theyknew what would trigger the recording ofa coachable event, and 94% felt that they wereable to keep the trigger from being activated.More than 90% of the adolescents reportedthat they were glad they chose to participate inthe program and that they would recommendthis program to other adolescents.
DISCUSSION
Our findings show that an interventionconsisting of immediate visual feedback pro-vided to adolescent drivers combined withweekly event reports and videos provided todrivers and their parents was successful inreducing the number of coachable events by61%. Overall, the number of events was re-duced from an average of 21 per 1000 milesduring first baseline to an average of 8 per1000 miles during second baseline, averagedacross all drivers. These findings are similar tothose demonstrated in a cohort study of ruraladolescent drivers.10,11
The intervention was most successful in re-ducing the frequency of improper turns. In thiscategory, adolescents went from triggering thesystem an average of12 times per1000 miles inthe first baseline to fewer than 2 times per1000miles in the second baseline, a 78% reduction.The importance of these results is highlighted byprevious data indicating that 22% of all fatalcrashes occur at intersections and junctions.14
High-speed turning and cornering has also beenlinked to rollover crashes, one of the mostinjurious and fatal types of crash.15 There was
also a 43% overall reduction in the frequency ofabrupt braking events, although it took severalweeks longer to achieve this benefit.
Results also showed that the frequency ofcoachable events at second baseline, after theintervention phase was complete, was signifi-cantly lower than at first baseline, suggestingthat the intervention may have a lasting effect.However, abrupt accelerations did increaseonce the intervention had been removed.
Technology like that evaluated in this studycan influence adolescent drivers in a number ofways. For instance, this kind of technologyextends parental monitoring and inhibits ado-lescents’ tendency to engage in intentionallyrisky behavior. It also extends parental men-toring and helps adolescents learn to recognizeroadway hazards. The data suggest that theintervention in this study had both effects butthat its predominant effect on safety was causedby parental mentoring. Consistent with a men-toring effect, certain benefits of the feedbackemerged over time and persisted beyond theintervention. If participants in this study hadsimply reduced their events because they didnot want their parents to see their behavior, wewould expect a significant rebound in thenumber of events once the intervention wasstopped. The lack of a significant reboundsuggests that the intervention was successful intraining young drivers to be better able toassess and react to hazardous situations.
The data also show a pattern consistent witha monitoring effect: other benefits were im-mediate, particularly for events associatedwith unsafe behavior that is committed onpurpose (e.g., abrupt acceleration). For thosebehaviors, the benefit diminished after thefeedback was removed.
The high-risk drivers engaged more often inimproper turns and abrupt accelerations, whichrebounded after the intervention was com-plete, suggesting that it was simply the parentalmonitoring that had reduced their frequency.Low-risk drivers had the majority of theirevents coded as abrupt braking. These eventsdid not rebound after the feedback was re-moved, suggesting that for this group the in-tervention may have trained them to be moreaware of hazards.
Whether drivers see the system as enablingmentoring or as simply monitoring could havesubstantial implications for acceptance and
long-term safety benefit. The positive responseand high level of acceptance in this studysuggest that mentoring systems can gain wideacceptance. Monitoring systems are less likelyto be well-accepted by adolescents, causingthe effect to be limited to the period when thedevice is in the car. However, even a poorlyaccepted monitoring system could have a sub-stantial impact on the number of adolescentmotor-vehicle deaths. Understanding the fac-tors that cause adolescents and other driversto perceive feedback-based systems as eithermonitoring or mentoring remains an importantresearch issue.16
Limitations
The 1-group pretest–posttest quasi-experi-mental design has several important limita-tions, the most obvious of which is that therewas no control group for comparison. Asa consequence, it is difficult to conclude thathistory, maturation, and regression could nothave accounted for the observed effects, whichaffects the study’s internal validity.11 Anotherlimitation concerns the recruitment of newlylicensed adolescent drivers to be in a video-feedback intervention study in which their par-ents will be informed of their safety-relevantbehaviors. The population willing to take partin such a study is small, and the sample mayhave suffered from a self-selection bias.
Another limitation of this study concerns theimperfect estimates of exposure. Event fre-quency was linked to estimated mileage. How-ever, this proved to be a challenge in thatadolescent participants would sometimes ne-glect to report their weekly odometer reading.Therefore, mileage had to be interpolated overlarger ranges for some of the participants.We also had to assume that the participantdrove the miles they reported; however, weknow there were instances when a driver otherthan the participant drove the vehicle. Inaddition, the system only afforded a glimpseinto the vehicle when it was triggered. Thesafety effects of specific driving-related behav-iors, such as cell phone use or passengerdistractions, were difficult to quantify becausethe data only included events, not exposure tothe behaviors when no events were triggered.In addition, information regarding the numberof trips per day, length of trips, or specific routeinformation was not available.
RESEARCH AND PRACTICE
June 2010, Vol 100, No. 6 | American Journal of Public Health Carney et al. | Peer Reviewed | Research and Practice | 1105
One of the biggest limitations is that we wereunable to control the amount or type of in-teraction adolescents had with their parentsduring the intervention period. Especially forthe riskiest drivers, it seems that parentalengagement is necessary for the success of theintervention.17 Without a parent to monitor ormentor, we may not have seen a significantreduction in any of the safety-relevant events.
Conclusions
Motor-vehicle crashes are the most commoncause of injury and mortality in adolescents,and the first 6 to 12 months of independentdriving is the most crash-prone period for alldrivers.9 This study showed that immediatevisual feedback for adolescent drivers and cu-mulative video feedback shared with parentsduring the early months of independent drivingcan have a dramatic influence on the rate ofsafety-relevant driving events. To the extentthat such events are a proxy for crash risk, thisstudy suggests that feedback might enhanceadolescent driving safety.
Whether this benefit will generalize toa broader population of adolescents and whatmechanisms underlie the benefits are still un-known. Data from this study suggest that a de-vice that enables parental monitoring can re-duce adolescents’ exposure to risky behaviorduring the critical first months of driving. Thiscould have substantial safety benefits becauseof the high crash rate during this period.Data also suggest that a device that enablesparental mentoring can make adolescents moreaware of hazards, which could help adolescentsforge good driving habits that will remainwith them for the long term. By informingboth adolescent drivers and their parents whendriving errors are made, such an interventionallows for review and discussion. Even if a driverhas no events in a given week, the simpleacknowledgment of a good ‘‘report card’’ wouldmake driving issues a regular part of the familydiscussion. Such communication is critical inhelping parents to regulate the most dangerousactivity they allow their children to do. j
About the AuthorsCher Carney, Daniel V. McGehee, Michelle L. Reyes, andMireille Raby are with the Human Factors and VehicleSafety Research Division of the Public Policy Center,University of Iowa, Iowa City. At the time of the study, John
D. Lee was with the Department of Mechanical andIndustrial Engineering, University of Iowa, Iowa City.
Correspondence should be sent to Daniel V. McGehee,Human Factors and Vehicle Safety Research Division,Public Policy Center, University of Iowa, 227 South Quad,Iowa City, IA 52242-1192 (e-mail: [email protected]). Reprints can be ordered at http://www.ajph.orgby clicking the ‘‘Reprints/Eprints’’ button.
This article was accepted May 23, 2009.
ContributorsC. Carney participated in study conceptualization anddesign, acquisition of data, data interpretation, and wrotethe article. D. V. McGehee supervised the study andparticipated in the study conceptualization, design, datainterpretation, and revision of the article. J. D. Leeassisted with study design, data analysis, data interpre-tation, and article revision. M.L. Reyes led data analysisand interpretation, and assisted with revising the article.M. Raby assisted with the study conceptualization andacquisition and analysis of data.
AcknowledgmentsThis study was supported by the Iowa Department ofTransportation, the Minnesota Department of Transpor-tation, General Motors, and the Centers for DiseaseControl and Prevention National Center for Injury Pre-vention and Control (grant 1R49CE001167-02).
We thank Nicholas Ward, PhD (Montana State Uni-versity), and Michael Manser, PhD (University of Minne-sota), for their help during data collection, and TeresaLopes (University of Iowa Public Policy Center) for herassistance with editing the final draft of the paper. We areenormously grateful to the dedicated faculty, staff, stu-dents, and parents of Eagan High School, Minnesota, whomade this study such a success, particularly principalPolly Reikowski, PhD, for her support and enthusiasm.
Human Participant ProtectionThis study was approved by the University of Iowa’sinstitutional review board.
References1. Insurance Institute for Highway Safety. Fatality facts2007: teenagers. Available at: http://www.iihs.org/research/fatality_facts_2007/teenagers.html. AccessedApril 23, 2008.
2. Williams AF. Teenage drivers: patterns of risk. JSafety Res. 2003;34(1):5–15.
3. Beck KH, Shattuck T, Haynie D, Crump AD, Simons-Morton B. Associations between parent awareness,monitoring, enforcement, and adolescent involvementwith alcohol. Health Educ Res. 1999;14(6):765–775.
4. Beck KH, Shattuck T, Raleigh R. Parental predictors ofteen driving risk. Am J Health Behav. 2001;25(1):10–20.
5. Simons-Morton BG, Winston FK. Translational re-search in child and adolescent transportation safety. EvalHealth Prof. 2006;29(1):33–64.
6. Foss RD, Feaganes JR, Rodgman EA. Initial effects ofgraduated licensing on 16-year-old driver crashes inNorth Carolina. JAMA. 2001;286(13):1588–1592.
7. Shope JT, Molnar LJ, Elliott MR, Waller PF. Gradu-ated driver licensing in Michigan: early impact on motor
vehicle crashes among 16-year-old drivers. JAMA. 2001;286(13):1593–1598.
8. Shope JT. Graduated driver licensing: review ofevaluation results since 2002. J Safety Res. 2007;38(2):165–175.
9. Mayhew DR, Simpson HM, Pak A. Changes incollision rates among novice drivers during the firstmonths of driving. Accid Anal Prev. 2003;35(5):683–691.
10. McGehee DV, Raby M, Carney C, Lee JD, Reyes ML.Extending parental mentoring using an event-triggeredvideo intervention in rural teen drivers. J Safety Res.2007;38(2):215–227.
11. McGehee DV, Carney C, Raby M, Lee JD, Reyes ML.The impact of an event-triggered video intervention onrural teenage driving. In: Proceedings of the Fourth In-ternational Driving Symposium on Human Factors inDriver Assessment, Training and Vehicle Design. IowaCity, IA: Public Policy Center, University of Iowa;2007:565–571.
12. Zwerling C, Peek-Asa C, Whitten PS, Choi S-W,Sprince NL, Jones MP. Fatal motor vehicle crashes in ruraland urban areas: decomposing rates into contributingfactors. Inj Prev. 2005;11(1):24–28.
13. Cook TD, Campbell DT, Perrachio L. Quasi-exper-imentation. In: Dunnette MD, Hough LM, eds. Handbookof Industrial and Organizational Psychology. 2nd ed. PaloAlto, CA: Consulting Psychologists Press; 1990:491–576.
14. National Highway Traffic Safety Administration.Fatality analysis reporting system. Reports; crashes;location; fatal crashes by relation to junction and trafficcontrol device, USA, 2007. Available at: http://www-fars.nhtsa.dot.gov/Crashes/CrashesLocation.aspx.Accessed January 28, 2009.
15. National Highway Traffic Safety Administration.Traffic Safety Facts 2001: Rural/Urban Comparison.Washington, DC: US Dept of Transportation; 2001:1–4.Publication DOT-HS-809-524.
16. Lee JD. Technology and teen drivers. J Safety Res.2007;38(2):203–213.
17. Simons-Morton BG, Hartos JL, Leaf WA. Promotingparental management of teen driving. Inj Prev. 2002;8(suppl 2):ii24–ii31.
RESEARCH AND PRACTICE
1106 | Research and Practice | Peer Reviewed | Carney et al. American Journal of Public Health | June 2010, Vol 100, No. 6
Copyright © 2022 FDOKUMEN