
Ultrahigh sensitivity assays for human cardiac troponin I using TiO 2 nanotube arrays
8
Ultrahigh sensitivity assays for human cardiac troponin I using TiO 2 nanotube arrays† Piyush Kar, b Archana Pandey, ab John J. Greer a and Karthik Shankar * b Received 15th September 2011, Accepted 8th December 2011 DOI: 10.1039/c2lc20892j Rapid, highly sensitive troponin assays for the analysis of serum at the point-of-care are particularly desirable for the effective treatment of myocardial infarction (MYI). TiO 2 nanotube arrays constitute a low cost, high surface area, semiconducting architecture with great promise for biosensing applications due to their compatibility with multiple detection techniques. Using TiO 2 nanotube arrays functionalized with highly robust and ordered carboxyalkylphosphonic acid self-assembled monolayers, we have developed a simple and highly sensitive fluorescence immunoassay which can detect concentrations of human cardiac troponin I as low as 0.1 pg ml 1 without the use of enzymatic amplification. Varying the morphological parameters of the nanotube arrays allows tuning the detection range over 6 orders of magnitude of the troponin concentration from 0.1 pg ml 1 –100 ng ml 1 . 1. Introduction The accurate quantification of the structural heart proteins cardiac troponin I and T has become integral to the diagnosis of acute myocardial infarction (AMI) due to AMI’s direct role in the death of heart muscle tissue. Rapid identification of AMI or the absence thereof, in patients presenting with acute chest pain, is a key enabler of effective evidence-based medical treatment and management. 1 In this regard, a major deficiency of tradi- tional assays for cardiac troponins (cTns) is inadequate sensi- tivity in the first few hours of AMI due to the significant delay occurring between the onset of ischemia and the increase in serum concentration of cTns. 1,2 The promise of point-of-care (POC) biodiagnostic tests is to deliver the benefits of simple, fast and consistent testing and to allow prompt and effective decisions to be made on the course of treatment. The use of semiconductor nanowires and nanotubes in POC biomarker assays is motivated by their rapid response time, the large number and density of sensor elements and the high sensitivity achievable by exploitation of their morphological, optical and electronic properties. 3,4 Field-effect transistor sensors based on silicon nanowires and carbon nanotubes have been used to perform the label-free detection of cancer markers and DNA at picomolar concentrations. 5,6 In the case of highly ordered TiO 2 nanotube arrays (TNAs), the availability of electron percolation pathways, a high surface area, a large capacitance in solution, 7 tunable pore diameters 8 and well-defined controllable reflectance spectra ensure the compatibility of this assay platform with multiple detection techniques including but not limited to inter- ferometric biosensing, 7 electrochemical impedance and ampero- metric sensing, immunoassays, 9 FRET-based biosensing and photoconductive and photoelectrochemical biosensing. 10 TNAs are also being researched for use in bone implants, 11,12 in drug- eluting stents, 13 in stem cell differentiation, 14,15 as biofiltration membranes 16 and as clotting enhancers in gauze pads for the control of hemorrhage. 17 TNAs constitute an air-stable and potentially self-cleaning and re-usable assay platform. 9 Perhaps more importantly, TNAs are fabricated at room-temperature by an inexpensive and scalable anodization process. A subsequent high temperature annealing step induces crystallinity and improves electronic properties but is not necessary for several types of assays based on this platform. Assays based on nanostructures, for example, are now begin- ning to make the transition from the laboratory scale devices to clinical trials. 18 The diagnosis of the disease on the basis of concentration of certain biomolecules requires assays that can detect molecules of interest (in our case it is Troponin I) sensi- tively. In most of the cases the targets are either proteins or nucleic acids. There are basically two approaches by which high sensitivity can be achieved: 1) target-based amplification where the catalytic process is triggered by the recognition event and generates surrogates for that target with polymerase chain reaction being the best example, 19 and the second approach is 2) signal based amplification where a catalytic entity is used to amplify the signal that results from the binding site. 20 A typical example of signal based amplification is enzyme-linked immu- nosorbent assay (ELISA), where a target protein can be captured by the antibody and then sandwiched with a second antibody which is associated with a catalytic, signal generating entity. 21 Although there are advances in protein disease marker detection, a Department of Physiology, University of Alberta, Edmonton, AB, Canada b Department of Electrical and Computer Engineering, University of Alberta, Edmonton, AB, Canada. E-mail: [email protected] † Electronic supplementary information (ESI) available. See DOI: 10.1039/c2lc20892j This journal is ª The Royal Society of Chemistry 2012 Lab Chip, 2012, 12, 821–828 | 821 Dynamic Article Links C < Lab on a Chip Cite this: Lab Chip, 2012, 12, 821 www.rsc.org/loc PAPER Downloaded on 22 February 2012 Published on 10 January 2012 on http://pubs.rsc.org | doi:10.1039/C2LC20892J View Online / Journal Homepage / Table of Contents for this issue
Transcript of Ultrahigh sensitivity assays for human cardiac troponin I using TiO 2 nanotube arrays

Dynamic Article LinksC<Lab on a Chip
Cite this: Lab Chip, 2012, 12, 821
www.rsc.org/loc PAPER
Dow
nloa
ded
on 2
2 Fe
brua
ry 2
012
Publ
ishe
d on
10
Janu
ary
2012
on
http
://pu
bs.r
sc.o
rg |
doi:1
0.10
39/C
2LC
2089
2JView Online / Journal Homepage / Table of Contents for this issue
Ultrahigh sensitivity assays for human cardiac troponin I using TiO2 nanotubearrays†
Piyush Kar,b Archana Pandey,ab John J. Greera and Karthik Shankar*b
Received 15th September 2011, Accepted 8th December 2011
DOI: 10.1039/c2lc20892j
Rapid, highly sensitive troponin assays for the analysis of serum at the point-of-care are particularly
desirable for the effective treatment of myocardial infarction (MYI). TiO2 nanotube arrays constitute
a low cost, high surface area, semiconducting architecture with great promise for biosensing
applications due to their compatibility with multiple detection techniques. Using TiO2 nanotube arrays
functionalized with highly robust and ordered carboxyalkylphosphonic acid self-assembled
monolayers, we have developed a simple and highly sensitive fluorescence immunoassay which can
detect concentrations of human cardiac troponin I as low as 0.1 pg ml�1 without the use of enzymatic
amplification. Varying the morphological parameters of the nanotube arrays allows tuning the
detection range over 6 orders of magnitude of the troponin concentration from 0.1 pg ml�1–100 ng ml�1.
1. Introduction
The accurate quantification of the structural heart proteins
cardiac troponin I and T has become integral to the diagnosis of
acute myocardial infarction (AMI) due to AMI’s direct role in
the death of heart muscle tissue. Rapid identification of AMI or
the absence thereof, in patients presenting with acute chest pain,
is a key enabler of effective evidence-based medical treatment
and management.1 In this regard, a major deficiency of tradi-
tional assays for cardiac troponins (cTns) is inadequate sensi-
tivity in the first few hours of AMI due to the significant delay
occurring between the onset of ischemia and the increase in
serum concentration of cTns.1,2
The promise of point-of-care (POC) biodiagnostic tests is to
deliver the benefits of simple, fast and consistent testing and to
allow prompt and effective decisions to be made on the course of
treatment. The use of semiconductor nanowires and nanotubes in
POC biomarker assays is motivated by their rapid response time,
the large number and density of sensor elements and the high
sensitivity achievable by exploitation of their morphological,
optical and electronic properties.3,4 Field-effect transistor sensors
based on silicon nanowires and carbon nanotubes have been used
to perform the label-free detection of cancermarkers andDNAat
picomolar concentrations.5,6 In the case of highly ordered TiO2
nanotube arrays (TNAs), the availability of electron percolation
pathways, a high surface area, a large capacitance in solution,7
tunable pore diameters8 and well-defined controllable reflectance
aDepartment of Physiology, University of Alberta, Edmonton, AB, CanadabDepartment of Electrical and Computer Engineering, University ofAlberta, Edmonton, AB, Canada. E-mail: [email protected]
† Electronic supplementary information (ESI) available. See DOI:10.1039/c2lc20892j
This journal is ª The Royal Society of Chemistry 2012
spectra ensure the compatibility of this assay platform with
multiple detection techniques including but not limited to inter-
ferometric biosensing,7 electrochemical impedance and ampero-
metric sensing, immunoassays,9 FRET-based biosensing and
photoconductive and photoelectrochemical biosensing.10 TNAs
are also being researched for use in bone implants,11,12 in drug-
eluting stents,13 in stem cell differentiation,14,15 as biofiltration
membranes16 and as clotting enhancers in gauze pads for the
control of hemorrhage.17 TNAs constitute an air-stable and
potentially self-cleaning and re-usable assay platform.9 Perhaps
more importantly, TNAs are fabricated at room-temperature by
an inexpensive and scalable anodization process. A subsequent
high temperature annealing step induces crystallinity and
improves electronic properties but is not necessary for several
types of assays based on this platform.
Assays based on nanostructures, for example, are now begin-
ning to make the transition from the laboratory scale devices to
clinical trials.18 The diagnosis of the disease on the basis of
concentration of certain biomolecules requires assays that can
detect molecules of interest (in our case it is Troponin I) sensi-
tively. In most of the cases the targets are either proteins or
nucleic acids. There are basically two approaches by which high
sensitivity can be achieved: 1) target-based amplification where
the catalytic process is triggered by the recognition event and
generates surrogates for that target with polymerase chain
reaction being the best example,19 and the second approach is 2)
signal based amplification where a catalytic entity is used to
amplify the signal that results from the binding site.20 A typical
example of signal based amplification is enzyme-linked immu-
nosorbent assay (ELISA), where a target protein can be captured
by the antibody and then sandwiched with a second antibody
which is associated with a catalytic, signal generating entity.21
Although there are advances in protein disease marker detection,
Lab Chip, 2012, 12, 821–828 | 821

Dow
nloa
ded
on 2
2 Fe
brua
ry 2
012
Publ
ishe
d on
10
Janu
ary
2012
on
http
://pu
bs.r
sc.o
rg |
doi:1
0.10
39/C
2LC
2089
2J
View Online
the current ELISA based detection methods have several draw-
backs. First, a tiny ratio of protein to antibodies might reduce the
sensitivity of the device. Secondly, the antibodies are floating on
different surfaces randomly which may make proteins inacces-
sible to antibodies. Thirdly, because of their two-dimensional
structures, all the antibodies might not capture the proteins thus
contributing to lower sensitivity. A significant increase in detec-
tion sensitivity and signal to noise (S/N) ratio could be achieved if
the following crucial improvements are made: (i) Increase in the
density and the ratio of antibodies to protein, (ii) Efficient
control of antibody orientation upon the surface immobilization
of antibodies and (iii) A higher surface-to-volume ratio by using
three-dimensional surfaces so that the antibodies can capture
more proteins which leads to recurrent antibody-protein binding.
In this regard, TiO2 nanotube arrays constitute a highly prom-
ising architecture to overcome the drawbacks of ELISA-based
methods and increase detection sensitivity.
Direct physisorption and chemisorption of proteins through
the interaction of their charges and/or amine groups with the
TiO2 surface has been employed to immobilize biomolecules on
TNAs.9 However, the amine-TiO2 linkage is relatively weak and
electrostatic adsorption is a function of the TiO2 surface prepa-
ration. In pursuit of a more robust binding of proteins and other
biomolecules to the substrate while simultaneously exploiting the
many desirable properties of the TNA architecture, several
reports have used TNAs decorated with gold nanoparticles as
assay platforms which provide access to thiolate SAM-based
immobilization protocols.10,22,23 Furthermore, assays based on
planar gold films and gold nanoparticles and nanorods24 are
widely used for molecular recognition in biomarker assays. For
optimal sensitivity and selectivity using gold platforms, a nearly
atomically smooth (111) oriented Au surface is highly desirable
and requires additional surface preparation by techniques such
as template stripping or flame annealing. Thiolate SAMs are
unstable in aqueous solutions, endure a very limited pH range
and suffer from reductive desorption.25 We use TiO2 nanotube
arrays without gold nanoparticles as assay platforms to perform
the sensitive detection of troponin I by using bifunctional self-
assembled monolayers of 16-phosphonohexadecanoic acid con-
sisting of terminal -carboxylic acid and -phosphonic acid groups
to immobilize biomolecules. Alkylphosphonic acid SAMs on
TiO2 are highly robust, durable and stable in aqueous solutions
over a wide pH range from 2–10.26 Similar to thiolate SAMs,
long chain alkylphosphonic acids yield close-packed monolayers
with a high grafting density of alkyl groups of 4.3–4.8 alkyl
groups/nm2 and a high degree of ordering of alkyl chains.27
Carboxyalkyl phosphonic acid SAMs on TiO2 have a more
restricted chain mobility than related alkylphosphonic acid
SAMs due to hydrogen bonding among the pendant –COOH
groups.28 Phosphonic acid ligands have a much higher affinity for
TiO2 surfaces than carboxylic groups29 and selectively bind to
TiO2 surfaces. Due to strong interactions with the substrate,
phosphonic acid SAMs are known to possess a higher hydrolytic
stability than silane SAMs and require no surface conditioning to
obtain high coverage. At room temperature, SAMs of octade-
cane phosphonic acid (ODPA) on TiO2 showed only a 2–5% loss
in grafting density after spending one week at pH 1–10.26
In this study we have developed a sensitive extended sandwich-
type immunoassay consisting of three-dimensional nanotube
822 | Lab Chip, 2012, 12, 821–828
arrays for the detection of human cardiac troponin (cTnI) since
cTnI is considered the ‘gold standard’ in terms of diagnosing MI,
owing to its presence only resulting from direct damage of
myocardium.30 Troponin I was captured on a self assembled
monolayer of 16-phosphonohexadecanoic acid on TiO2 surface
using a polyclonal anti-goat troponin antibody. Antigen–
primary antibody interaction was followed by conjugation with
a secondary antibody (anti-mouse troponin). Subsequently, the
secondary antibody was conjugated with a fluorophore labeled
tertiary antibody, whose intensity of fluorescence was measured
to determine the concentration of the cardiac troponin I. A
detection limit of 0.1 pg ml�1 was achieved using the present
immunoassay. In comparison, commercially available popular
cTnI assays such as Abbott Labs’ iStat and Beckman Coulter’s
Access assays for cTnI both have detection limits in approxi-
mately the 0.01 ng ml�1 range.31 Roche Diagnostics’ Elecsys
assays human cardiac troponin T (cTnT) with a detection limit of
�0.01 ng ml�1.31
2. Materials and methods
2.1 Anodic growth
Titanium dioxide (TiO2) nanotube arrays were obtained by
anodization of a 0.89 mm thick titanium foil (99.7%, Alfa Aesar)
in a two-electrode anodization setup in which titanium foils were
used as both the anode and cathode and only two-thirds of the
length of titanium foil was immersed into the solution. The inter-
electrode spacing was approximately 5 cm. Anodization was
carried out at room temperature in an electrolyte consisting of
a mixture of 3 wt% acetic acid (37% solution, Sigma Aldrich) and
0.25 wt % HF (48% solution, Sigma Aldrich), in deionized water
under the applied voltage of 20V. The electrochemical cell had
a closed lid to reduce variation in electrolyte concentration with
time, and the anodization was performed inside a fume hood
with the sash half-closed. After anodization, the titanium foils
containing the nanotubes were rinsed with water, then isopropyl
alcohol and dried in air. Further detailed procedures can be
found elsewhere.6 Longer nanotubes were obtained by anodizing
Ti foils at room temperature in an electrolyte consisting of
a mixture of ethylene glycol (Reagent plus 99%, Sigma Aldrich),
NH4F (98%A.C.S. reagent, Sigma Aldrich), and deionized water
under the applied voltage of 40V. The electrolyte consisted of
a solution of 0.5 wt% NH4F and 2% (volume) deionized water in
ethylene glycol. After anodization, the titanium foils containing
the nanotubes were rinsed with water, then isopropyl alcohol and
dried in air. The as-grown nanotubes had debris on the surface.
They were cleaned by overnight immersion in 0.1M HCl fol-
lowed by rinsing with water and subsequent sonication in water
and isopropyl alcohol. Cleaner high surface area nanotubes were
also grown by anodizing Ti foils at 7.5–60 V for 48 h in dimethyl
sulfoxide (DMSO) electrolytes containing 2–3% water and 1–2%
HF. These nanotubes were used as formed.
2.2 Characterization and detection
Imaging of the nanoscale morphology of the samples was per-
formed using a JEOL 6301F cold cathode field emission scanning
electron microscopy (FESEM) and a Zeiss Leo 1430 hot cathode
SEM. The Fourier Transform Infrared (FTIR) spectra were
This journal is ª The Royal Society of Chemistry 2012
Dow
nloa
ded
on 2
2 Fe
brua
ry 2
012
Publ
ishe
d on
10
Janu
ary
2012
on
http
://pu
bs.r
sc.o
rg |
doi:1
0.10
39/C
2LC
2089
2J
View Online
obtained using a Bruker Vertex 70 FTIR equipped with a liquid
nitrogen cooled mercury cadmium telluride (MCT) detector and
a Harrick AutoSeagull IRRAS attachment placed in the sample
compartment. The samples were horizontally mounted in
a nitrogen-purged sample chamber with the infrared beam
impinging upon the sample surface at 85 degrees to the surface
normal. All FTIR spectra were obtained with 500 scans in 800–
4000cm�1 spectral region at 4 cm�1 resolution. Background
spectra were obtained by using bare Ti foil in the same geometry.
X-ray photoelectron spectroscopy (XPS) was performed using
a Kratos XPS spectrometer with a Mono Al Ka X-ray source
with Hv ¼ 14 kV and Current ¼ 15 mA. Survey sepectra were
scanned with pass energy of 0.35 eV. High resolution spectra
were scanned with pass energy of 0.1 eV. Fluorescence imaging
was performed using a Li-Cor Odyssey Imaging System and
a Zeiss LSM 710 laser scanning confocal fluorescence
microscope.
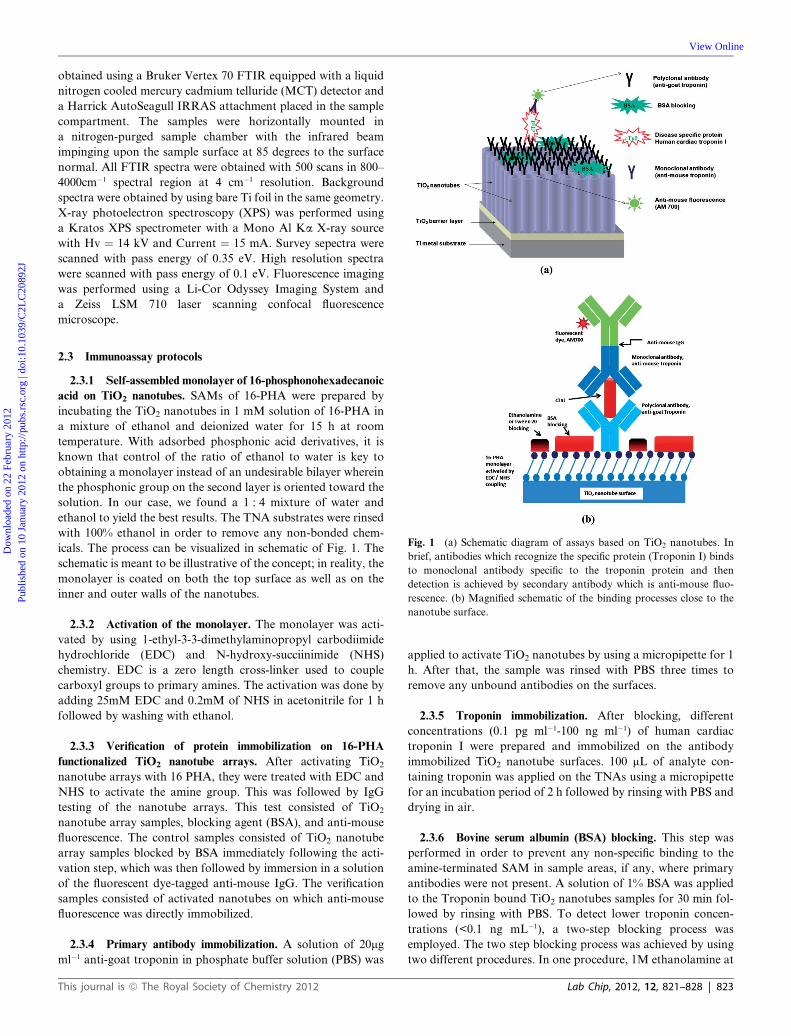
Fig. 1 (a) Schematic diagram of assays based on TiO2 nanotubes. In
brief, antibodies which recognize the specific protein (Troponin I) binds
to monoclonal antibody specific to the troponin protein and then
detection is achieved by secondary antibody which is anti-mouse fluo-
rescence. (b) Magnified schematic of the binding processes close to the
nanotube surface.
2.3 Immunoassay protocols
2.3.1 Self-assembled monolayer of 16-phosphonohexadecanoic
acid on TiO2 nanotubes. SAMs of 16-PHA were prepared by
incubating the TiO2 nanotubes in 1 mM solution of 16-PHA in
a mixture of ethanol and deionized water for 15 h at room
temperature. With adsorbed phosphonic acid derivatives, it is
known that control of the ratio of ethanol to water is key to
obtaining a monolayer instead of an undesirable bilayer wherein
the phosphonic group on the second layer is oriented toward the
solution. In our case, we found a 1 : 4 mixture of water and
ethanol to yield the best results. The TNA substrates were rinsed
with 100% ethanol in order to remove any non-bonded chem-
icals. The process can be visualized in schematic of Fig. 1. The
schematic is meant to be illustrative of the concept; in reality, the
monolayer is coated on both the top surface as well as on the
inner and outer walls of the nanotubes.
2.3.2 Activation of the monolayer. The monolayer was acti-
vated by using 1-ethyl-3-3-dimethylaminopropyl carbodiimide
hydrochloride (EDC) and N-hydroxy-succiinimide (NHS)
chemistry. EDC is a zero length cross-linker used to couple
carboxyl groups to primary amines. The activation was done by
adding 25mM EDC and 0.2mM of NHS in acetonitrile for 1 h
followed by washing with ethanol.
2.3.3 Verification of protein immobilization on 16-PHA
functionalized TiO2 nanotube arrays. After activating TiO2
nanotube arrays with 16 PHA, they were treated with EDC and
NHS to activate the amine group. This was followed by IgG
testing of the nanotube arrays. This test consisted of TiO2
nanotube array samples, blocking agent (BSA), and anti-mouse
fluorescence. The control samples consisted of TiO2 nanotube
array samples blocked by BSA immediately following the acti-
vation step, which was then followed by immersion in a solution
of the fluorescent dye-tagged anti-mouse IgG. The verification
samples consisted of activated nanotubes on which anti-mouse
fluorescence was directly immobilized.
2.3.4 Primary antibody immobilization. A solution of 20mg
ml�1 anti-goat troponin in phosphate buffer solution (PBS) was
This journal is ª The Royal Society of Chemistry 2012
applied to activate TiO2 nanotubes by using a micropipette for 1
h. After that, the sample was rinsed with PBS three times to
remove any unbound antibodies on the surfaces.
2.3.5 Troponin immobilization. After blocking, different
concentrations (0.1 pg ml�1-100 ng ml�1) of human cardiac
troponin I were prepared and immobilized on the antibody
immobilized TiO2 nanotube surfaces. 100 mL of analyte con-
taining troponin was applied on the TNAs using a micropipette
for an incubation period of 2 h followed by rinsing with PBS and
drying in air.
2.3.6 Bovine serum albumin (BSA) blocking. This step was
performed in order to prevent any non-specific binding to the
amine-terminated SAM in sample areas, if any, where primary
antibodies were not present. A solution of 1% BSA was applied
to the Troponin bound TiO2 nanotubes samples for 30 min fol-
lowed by rinsing with PBS. To detect lower troponin concen-
trations (<0.1 ng mL�1), a two-step blocking process was
employed. The two step blocking process was achieved by using
two different procedures. In one procedure, 1M ethanolamine at
Lab Chip, 2012, 12, 821–828 | 823

Dow
nloa
ded
on 2
2 Fe
brua
ry 2
012
Publ
ishe
d on
10
Janu
ary
2012
on
http
://pu
bs.r
sc.o
rg |
doi:1
0.10
39/C
2LC
2089
2J
View Online
pH 9 was applied, and in the other, 0.5 vol. % Tween 20 in PBS at
pH 7.4 was applied, for 1 h followed by application of 1% BSA
for 1 h. Ethanolamine (or Tween 20) being the primary blocker
to passivate unreacted carboxyl groups and 1%BSA for one hour
was used as the secondary blocker to block non-specific binding
sites.
2.3.7 Secondary antibody immobilization. In this step
different anti-mouse antibody was functionalized on the
troponin attached to the TiO2 nanotubes via the linkage to the
immobilized primary antibody. A solution of 20 mg ml�1 anti-
mouse was applied to the above sample by a micropipette for
30 min followed by rinsing with PBS and drying in air.
2.3.8 Binding of fluorescence tagged tertiary antibody. In this
final step the anti-mouse fluorescence (AM700) was added for 30
min followed by rinsing with PBS to rinse out any unbound
AM700. In the control experiment, all steps were identical except
that the troponin step and secondary antibody immobilization
were omitted, and PBS was added instead. This step was to
confirm the binding of antibody on the activated TiO2
monolayer.
3. Results and discussions
3.1 Morphology of TiO2 nanotubes
Fig. 2a shows the field emission scanning electron microscopy
(FESEM) image of as grown TiO2 nanotubes arrays at anod-
ization voltage of 20V for 45 min. Fig. 2a shows that the nano-
tubes are aligned and close-packed. The average diameter of
these nanotubes is 76 nm and a length of �400nm was observed.
Nanotubes can be grown very quickly (30–45 min) using
unbuffered HF-based recipes in aqueous electrolytes. A detection
limit of 0.1 ng ml�1 was achieved using these nanotubes, with
higher sensitivities limited by the relatively low aspect ratio (�4)
and correspondingly low surface area (�25 times a flat planar
surface). To extend the sensitivity of our assay beyond 0.1 ng
ml�1, we used longer nanotubes (shown in Fig. 2b) grown in
ethylene glycol (EG)-based electrolytes and dimethyl sulfoxide
(DMSO)-based electrolytes as platforms for molecular recogni-
tion to enable a larger effective surface area for protein immo-
bilization. However, nanotubes longer than 5 mm grown in EG-
based electrolytes suffer from anodization debris covering the
surface and clogging the pores. Such debris can be removed by
extended ultrasonication of the nanotube samples. However the
ultrasonic cleaning process also results in breakage of nanotubes,
Fig. 2 SEM images of the top-view of (a) TiO2 nanotubes formed by
anodization at 20 V in aqueous electrolyte and (b) TiO2 nanotubes
formed by anodization at 40 V in EG-based electrolyte.
824 | Lab Chip, 2012, 12, 821–828
due to which the average nanotube lengths change significantly
and identical samples become difficult to reproduce. On the other
hand, nanotubes grown in HF-containing (DMSO) electrolytes
are characterized by slow growth rates but a very clean
morphology requiring little additional cleaning. DMSO-grown
nanotubes, which are shown in Fig. 3 are also reproducible in
quality.
3.2 Monolayer characterization
Characterization of the monolayer was done using XPS and
FTIR at each step. Fig. 4 (a) and (b) show the FTIR data after
SAM formation and after monolayer activation respectively. In
each case, the two features around 2850 and 2940 cm�1 are
assigned to the CH2 symmetric and CH2 asymmetric modes from
the carbon backbone respectively. In the case of FTIR data after
EDC/NHS activation, the three characteristic bands at �1815,
1790 and 1750 cm�1 correspond to the carbonyl stretch modes in
the COO-NHS ester moiety.14,18
The monolayer in our case is a bifunctional molecule, namely
16-phosphonohexadecanoic acid which is terminated with
a carboxylic group at one end and a phosphonic group at the
other. In Fig. 4(a), peak at 1694 cm�1 indicates the carboxylic
group present at the monolayer. Spectral interference due to the
broad peak at �1000 cm�1 obscures phosphonic group identifi-
cation in this region. In Fig. 4(b) the appearance of the carbonyl
peak at 1698cm�1 is indicative of the presence of amide I
carbonyl stretching mode resulting from 1,2-diamineoethane
attachment. Peaks at 1280 cm�1 and 1242 cm�1 correspond to C–
OH stretch mode and C–N–C succycle anti-symmetric CNC
stretching mode. The peak at 1560 cm�1 belongs to peptide N–H
bending of amide II.19,20
XPS spectra acquired for monolayer coated on TiO2 surface is
shown in Fig. 5. Fig. 5(a) shows the survey spectrum for
monolayer coated TiO2 nanotube surface. This clearly shows the
P2s peak at 191eV and P 2p peak at 134 eV core lines which are
consistent with PO3 compounds21 in addition to C 1s at 285eV
Fig. 3 SEM images of (a) top-view (b) cross-section of TiO2 nanotubes
formed by anodization at 60 V in DMSO-based electrolyte and (c) top-
view (b) top-view of TiO2 nanotubes formed by anodization at 7.5 V in
DMSO-based electrolyte.
This journal is ª The Royal Society of Chemistry 2012

Fig. 4 FTIR spectra of TiO2 nanotubes (a) after monolayer formation
and (b) after EDC/NHS activation.
Fig. 5 XPS scans of monolayer (16-phosphonohexadecanoic acid) on
TiO2 nanotubes surface (a) survey scans and inset shows P 2s and P 2p
and (b) high resolution scan of P 2p region.
Dow
nloa
ded
on 2
2 Fe
brua
ry 2
012
Publ
ishe
d on
10
Janu
ary
2012
on
http
://pu
bs.r
sc.o
rg |
doi:1
0.10
39/C
2LC
2089
2J
View Online
and several other peaks. Both P 2s and P 2p peaks are observed in
the survey scan and a clear peak is found in the high resolution
scan of P 2p region for monolayer coated TiO2 nanotubes surface
(Fig. 5b). These results positively demonstrate the presence of
phosphonic acid head group on top surface of TiO2 nanotubes.
Fig. 6 (a) and (b) Fluorescence images of a troponin immunoassay using
TiO2 NT array samples grown in DMSO electrolyte by anodization at 7.5
V. (a) shows Troponin concentrations of (1) 0 pg ml�1, (2) 0.5 pg ml�1 (3)
1 pg ml�1 (4) 0 pg ml�1 (5) 0.5 pg ml�1 and (6) 1 pg ml�1. In each case,
a two-step blocking process was used with 1% BSA as the secondary
block. For the primary block, ethanolamine was used for samples (1), (2)
and (3) while Tween 20 was used for samples (4), (5) and (6). (b) shows
Troponin concentration of 0 pg ml�1 (left) and 0.1 pg ml�1 (right), where
blocking process was implemented using Tween 20 followed by 1% BSA.
3.3 Fluorescence detection
Every single sample that was assayed was associated with a cor-
responding control sample prepared in the same run under
identical conditions. As mentioned previously, we performed
two-step IgG testing to verify protein immobilization. For
extended sandwich-type troponin assays, solutions containing
various concentrations of human cardiac troponin I (from 100 ng
ml�1 to 0.01 pg ml�1) were used. We used fluorescence scanning
microscopy to check the intensity of fluorescence from the
functionalized nanotube array samples at different concentra-
tions of troponin. A ratio of at least 4 of the fluorescence
intensity of the assayed sample to that of the control samples (S/
N threshold ¼ 4) was used to detect cTnI. The use of polyclonal
antibodies (see Fig. 1) as probes to capture troponin results in
high sensitivity due to binding to multiple epitopes.
Using short nanotubes grown in aqueous electrolytes with
pore-sizes of �76 nm and lengths of 400 nm, 0.1 ng ml�1 was the
lowest concentration which could be detected using our S/N
threshold of 4. The intensity value-labeled fluorescent images for
100 ng ml�1, 10 ng ml�1 and 1 ng ml�1 are shown in Fig. S1 in
Supporting Information. The fluorescence intensities obtained
for different troponin concentrations in the range of 0.1–100 ng
ml�1 using identical scan settings were normalized to the same
sample area and are presented in tabular format in Table S2 in
Supporting information. Nanotubes grown in EG-based elec-
trolyte had a pore size of �70 nm and a tube-length of 10 mm. As
mentioned previously, the sensitivity of EG-grown nanotubes
This journal is ª The Royal Society of Chemistry 2012
was limited by the pore-clogging debris on the surface and such
samples were therefore useful for sensing cTnI concentrations
only up to 0.05 ng ml�1. Fig. S3 shows that the S/N ratio obtained
with EG-grown nanotubes is higher than the detection threshold
for 0.05 ng ml�1 but lower than 4 for a troponin concentration of
0.01 ng ml�1. On the other hand DMSO-grown nanotubes of
length �4 mm were relatively clean and their diameter was tuned
by adjusting the anodization voltage over the range 7.5 V–60 V.
An anodization voltage of 60 V resulted in a diameter of 270 nm
while a voltage of 7.5 V resulted in a diameter of 30 nm. Fig. 6
shows the lowest concentrations of troponin detected by our
TiO2 nanotube array fluorescent immunoassay.
In making these measurements, we also tested our samples for
troponin zero in each case. For troponin zero, we used phosphate
buffer solution containing no troponin. For troponin zero, there
was a very low signal observed as compared to different
concentrations of troponin. Most other fluorimetric assays have
high noise due to significant background fluorescence. The low
background fluorescence in our nanotube array platform is one
of the factors contributing to the achievement of high sensitiv-
ities. Non-specific binding due to biofouling is a major obstacle
limiting sensitivities in assays based on planar gold platforms, in
reaction to which mixed monolayers of polyethylene glycol
(PEG)-terminated and carboxylic acid-terminated self-assem-
bled monolayers are often used.32 We were able to obtain high
sensitivities without enzymatic amplification using a single
component fully hydrophilic long-chain carboxylic acid-termi-
nated monolayer. In order to detect troponin concentrations
lower than 0.1 ng ml�1, a single step blocking process using
bovine serum albumin was found to be insufficient. We devel-
oped a highly effective two-step blocking process using etha-
nolamine or Tween 20 surfactant as the primary blocker and 1%
BSA as the secondary blocker. At 0.5 pg ml�1, blocking with
Tween 20 enabled higher S/N ratios than with ethanolamine as
shown in Fig. 6 (a). Additional fluorescence images examining
the efficacy of the blocking process are shown in Figs. S4–S6. The
trend observed was that a two-step process consisting of blocking
by Tween 20 and subsequently by BSA, provided the best S/N
ratio. Also, the two-step process consisting of blocking by
ethanolamine and subsequently by BSA outperformed the single
step BSA blocking process. Our results indicate that the best
Lab Chip, 2012, 12, 821–828 | 825
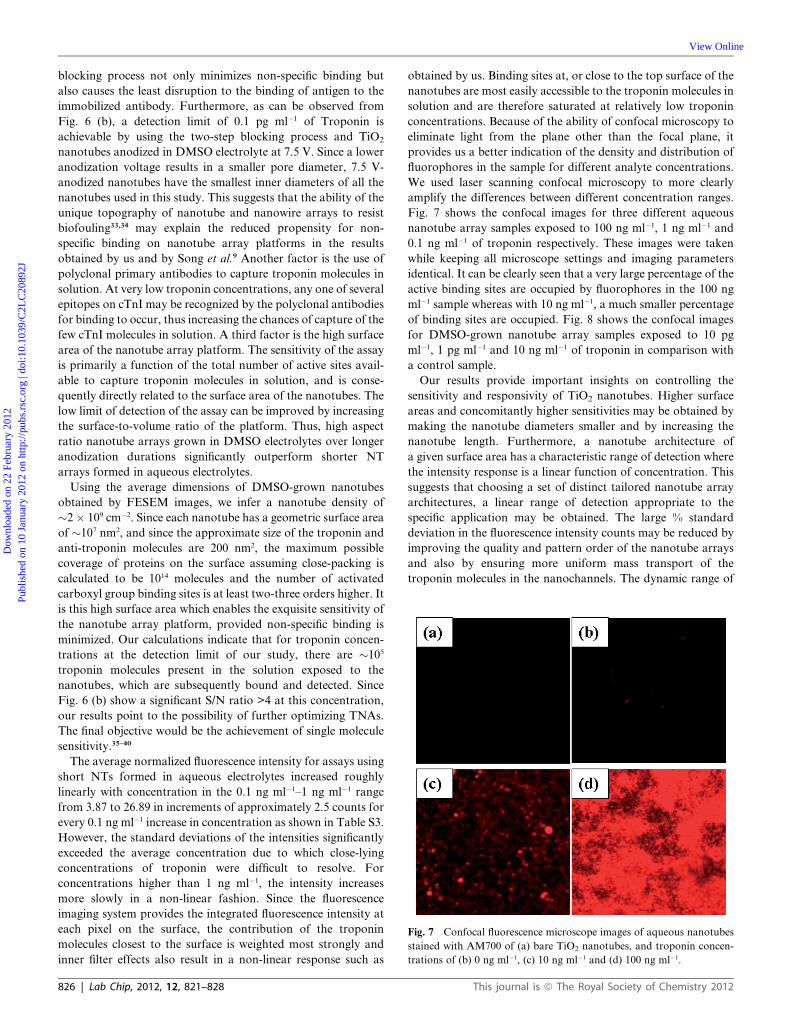
Fig. 7 Confocal fluorescence microscope images of aqueous nanotubes
stained with AM700 of (a) bare TiO2 nanotubes, and troponin concen-
trations of (b) 0 ng ml�1, (c) 10 ng ml�1 and (d) 100 ng ml�1.
Dow
nloa
ded
on 2
2 Fe
brua
ry 2
012
Publ
ishe
d on
10
Janu
ary
2012
on
http
://pu
bs.r
sc.o
rg |
doi:1
0.10
39/C
2LC
2089
2J
View Online
blocking process not only minimizes non-specific binding but
also causes the least disruption to the binding of antigen to the
immobilized antibody. Furthermore, as can be observed from
Fig. 6 (b), a detection limit of 0.1 pg ml�1 of Troponin is
achievable by using the two-step blocking process and TiO2
nanotubes anodized in DMSO electrolyte at 7.5 V. Since a lower
anodization voltage results in a smaller pore diameter, 7.5 V-
anodized nanotubes have the smallest inner diameters of all the
nanotubes used in this study. This suggests that the ability of the
unique topography of nanotube and nanowire arrays to resist
biofouling33,34 may explain the reduced propensity for non-
specific binding on nanotube array platforms in the results
obtained by us and by Song et al.9 Another factor is the use of
polyclonal primary antibodies to capture troponin molecules in
solution. At very low troponin concentrations, any one of several
epitopes on cTnI may be recognized by the polyclonal antibodies
for binding to occur, thus increasing the chances of capture of the
few cTnI molecules in solution. A third factor is the high surface
area of the nanotube array platform. The sensitivity of the assay
is primarily a function of the total number of active sites avail-
able to capture troponin molecules in solution, and is conse-
quently directly related to the surface area of the nanotubes. The
low limit of detection of the assay can be improved by increasing
the surface-to-volume ratio of the platform. Thus, high aspect
ratio nanotube arrays grown in DMSO electrolytes over longer
anodization durations significantly outperform shorter NT
arrays formed in aqueous electrolytes.
Using the average dimensions of DMSO-grown nanotubes
obtained by FESEM images, we infer a nanotube density of
�2� 109 cm�2. Since each nanotube has a geometric surface area
of �107 nm2, and since the approximate size of the troponin and
anti-troponin molecules are 200 nm2, the maximum possible
coverage of proteins on the surface assuming close-packing is
calculated to be 1014 molecules and the number of activated
carboxyl group binding sites is at least two-three orders higher. It
is this high surface area which enables the exquisite sensitivity of
the nanotube array platform, provided non-specific binding is
minimized. Our calculations indicate that for troponin concen-
trations at the detection limit of our study, there are �105
troponin molecules present in the solution exposed to the
nanotubes, which are subsequently bound and detected. Since
Fig. 6 (b) show a significant S/N ratio >4 at this concentration,
our results point to the possibility of further optimizing TNAs.
The final objective would be the achievement of single molecule
sensitivity.35–40
The average normalized fluorescence intensity for assays using
short NTs formed in aqueous electrolytes increased roughly
linearly with concentration in the 0.1 ng ml�1–1 ng ml�1 range
from 3.87 to 26.89 in increments of approximately 2.5 counts for
every 0.1 ng ml�1 increase in concentration as shown in Table S3.
However, the standard deviations of the intensities significantly
exceeded the average concentration due to which close-lying
concentrations of troponin were difficult to resolve. For
concentrations higher than 1 ng ml�1, the intensity increases
more slowly in a non-linear fashion. Since the fluorescence
imaging system provides the integrated fluorescence intensity at
each pixel on the surface, the contribution of the troponin
molecules closest to the surface is weighted most strongly and
inner filter effects also result in a non-linear response such as
826 | Lab Chip, 2012, 12, 821–828
obtained by us. Binding sites at, or close to the top surface of the
nanotubes are most easily accessible to the troponin molecules in
solution and are therefore saturated at relatively low troponin
concentrations. Because of the ability of confocal microscopy to
eliminate light from the plane other than the focal plane, it
provides us a better indication of the density and distribution of
fluorophores in the sample for different analyte concentrations.
We used laser scanning confocal microscopy to more clearly
amplify the differences between different concentration ranges.
Fig. 7 shows the confocal images for three different aqueous
nanotube array samples exposed to 100 ng ml�1, 1 ng ml�1 and
0.1 ng ml�1 of troponin respectively. These images were taken
while keeping all microscope settings and imaging parameters
identical. It can be clearly seen that a very large percentage of the
active binding sites are occupied by fluorophores in the 100 ng
ml�1 sample whereas with 10 ng ml�1, a much smaller percentage
of binding sites are occupied. Fig. 8 shows the confocal images
for DMSO-grown nanotube array samples exposed to 10 pg
ml�1, 1 pg ml�1 and 10 ng ml�1 of troponin in comparison with
a control sample.
Our results provide important insights on controlling the
sensitivity and responsivity of TiO2 nanotubes. Higher surface
areas and concomitantly higher sensitivities may be obtained by
making the nanotube diameters smaller and by increasing the
nanotube length. Furthermore, a nanotube architecture of
a given surface area has a characteristic range of detection where
the intensity response is a linear function of concentration. This
suggests that choosing a set of distinct tailored nanotube array
architectures, a linear range of detection appropriate to the
specific application may be obtained. The large % standard
deviation in the fluorescence intensity counts may be reduced by
improving the quality and pattern order of the nanotube arrays
and also by ensuring more uniform mass transport of the
troponin molecules in the nanochannels. The dynamic range of
This journal is ª The Royal Society of Chemistry 2012

Fig. 8 Confocal fluorescence microscope images of nanotubes formed
by anodization in the DMSO electrolyte at 15 V for troponin concen-
trations of (a) 0 pg ml�1, (b) 1 pg ml�1, (c) 10 pg ml�1 and (d) 10 ng ml�1. In
each case, two-step blocking using 1M ethanolamine followed by 1%
BSA was used.
Dow
nloa
ded
on 2
2 Fe
brua
ry 2
012
Publ
ishe
d on
10
Janu
ary
2012
on
http
://pu
bs.r
sc.o
rg |
doi:1
0.10
39/C
2LC
2089
2J
View Online
the assay is limited by saturation of the intensities, which can be
reduced by decreasing the sample volume used, by using mono-
clonal capture antibodies and by reducing the amount of time
nanotubes are exposed to troponin solutions.
Conclusion
In summary, we have demonstrated an ultrasensitive immuno-
assay capable of detecting troponin concentrations as low as 0.1
pg ml�1 using a TiO2 nanotube array platform without the use of
enzymatic amplification. A carboxyalkylphosphonic acid
monolayer on the TiO2 surface coupled with a two-step blocking
sequence to minimize non-specific binding were found to be
critical for achieving high sensitivities. The highest S/N ratio was
obtained for a two-step blocking process consisting of Tween 20
and BSA. The very low detection limit is promising for the
achievement of high resolution measurements in the physiolog-
ically important concentration range of 0.01 ng ml�1 to 10 ng
ml�1. The use of tailored and optimized TiO2 nanotubes in
microwells could extend the detection range of commercially
available point of care troponin assays, most of which use
ELISA-based principles and/or luminescence detection.30,41,42
Acknowledgements
We thank NSERC and CIHR for funding support. Our sincere
thanks to Wayne Moffat and Craig Turk at the Analytical and
Instrumentation Laboratory for assistance with FTIR data
collection and analysis, and to Jun Ren and Xiuqing Ding for
This journal is ª The Royal Society of Chemistry 2012
assistance with assay design. We would like to acknowledge the
assistance provided by Dimitre Karpuzov at the Alberta Centre
for Surface Engineering and Science (ACSES) in the collection of
XPS data. We thank Scott at the Alberta Nanofab and De-Ann
Rollings in the Department of Earth and Atmospheric Sciences
for help with SEM. We also thank Dr Xuejun Sun at the Cross
Cancer Institute for helpful discussions with regard to optical
imaging.
References
1 R. Twerenbold, T. Reichlina, M. Reiter and C. Mueller, Swiss Med.Wkly., 2011, 141.
2 M. Gustapane, G. Biasillo, R. Della Bona and L. M. Biasucci,Minerva Med., 2011, 102, 161–168.
3 L. Aihua, Biosens. Bioelectron., 2008, 24, 167–177.4 J. Wang, ChemPhysChem, 2009, 10, 1748–1755.5 A. Star, E. Tu, J. Niemann, J. C. P. Gabriel, C. S. Joiner andC. Valcke, Proc. Natl. Acad. Sci. U. S. A., 2006, 103, 921–926.
6 G. F. Zheng, F. Patolsky, Y. Cui, W. U.Wang and C.M. Lieber,Nat.Biotechnol., 2005, 23, 1294–1301.
7 K. S. Mun, S. D. Alvarez, W. Y. Choi and M. J. Sailor, ACS Nano,2010, 4, 2070–2076.
8 A. Mohammadpour and K. Shankar, J. Mater. Chem., 20, pp. 8474–8477.
9 Y. Y. Song, F. Schmidt-Stein, S. Berger and P. Schmuki, Small, 2010,6, 1180–1184.
10 Y. R. An, L. L. Tang, X. L. Jiang, H. Chen, M. C. Yang, L. T. Jin,S. P. Zhang, C. G. Wang and W. Zhang, Chem.–Eur. J., 2010, 16,14439–14446.
11 K. C. Popat, M. Eltgroth, T. J. LaTempa, C. A. Grimes andT. A. Desai, Biomaterials, 2007, 28, 4880–4888.
12 K. C. Popat, L. Leoni, C. A. Grimes and T. A. Desai, Biomaterials,2007, 28, 3188–3197.
13 K. C. Popat, M. Eltgroth, T. J. La Tempa, C. A. Grimes andT. A. Desai, Small, 2007, 3, 1878–1881.
14 S. Oh, K. S. Brammer, Y. S. J. Li, D. Teng, A. J. Engler, S. Chien andS. Jin, Proc. Natl. Acad. Sci. U. S. A., 2009, 106, 2130–2135.
15 J. Park, S. Bauer, K. von der Mark and P. Schmuki,Nano Lett., 2007,7, 1686–1691.
16 M. Paulose, L. Peng, K. C. Popat, O. K. Varghese, T. J. LaTempa,N. Z. Bao, T. A. Desai and C. A. Grimes, J. Membr. Sci., 2008,319, 199–205.
17 S. C. Roy, M. Paulose and C. A. Grimes, Biomaterials, 2007, 28,4667–4672.
18 in ScienceDaily, 2011.19 T. A. Leski, A. P. Malanoski, D. A. Stenger and B. C. Lin, Future
Microbiol., 2006, 5, 191–203.20 S. Dhawan, Expert Rev. Mol. Diagn., 2006, 6, 749–760.21 P. Scrimin and L. J. Prins, Chemical Society Reviews.22 Z. J. Zhang, Y. B. Xie, Z. Liu, F. Rong, Y. Wang and D. G. Fu, J.
Electroanal. Chem., 2011, 650, 241–247.23 A. W. Zhu, Y. P. Luo and Y. Tian, Anal. Chem., 2009, 81, 7243–7247.24 P. L. Truong, C. Cao, S. Park, M. Kim and S. J. Sim, Lab Chip, 2011,
11, 2591–2597.25 N. T. Flynn, T. N. T. Tran, M. J. Cima and R. Langer, Langmuir,
2003, 19, 10909–10915.26 S. Marcinko and A. Y. Fadeev, Langmuir, 2004, 20, 2270–2273.27 R. Helmy and A. Y. Fadeev, Langmuir, 2002, 18, 8924–8928.28 S. Pawsey, K. Yach and L. Reven, Langmuir, 2002, 18, 5205–5212.29 J. P. Folkers, C. B. Gorman, P. E. Laibinis, S. Buchholz,
G. M. Whitesides and R. G. Nuzzo, Langmuir, 1995, 11, 813–824.30 M. I. Mohammed and M. P. Y. Desmulliez, Lab Chip, 2011, 11, 569–
595.31 J. R. Tate and M. Panteghini, Biochimica Clinica, 2008, 32, 535–546.32 M. J. Shuster, A. Vaish, M. E. Szapacs, M. E. Anderson, P. S. Weiss
and A. M. Andrews, Adv. Mater., 2008, 20, 164.33 K. M. Ainslie, G. Sharma, M. A. Dyer, C. A. Grimes and
M. V. Pishko, Nano Lett., 2005, 5, 1852–1856.34 J. Genzer and K. Efimenko, Biofouling, 2006, 22, 339–360.
Lab Chip, 2012, 12, 821–828 | 827

Dow
nloa
ded
on 2
2 Fe
brua
ry 2
012
Publ
ishe
d on
10
Janu
ary
2012
on
http
://pu
bs.r
sc.o
rg |
doi:1
0.10
39/C
2LC
2089
2J
View Online
35 H. Harma, T. Soukka, S. Lonnberg, J. Paukkunen, P. Tarkkinen andT. Lovgren, Luminescence, 2000, 15, 351–355.
36 J. W. Li, W. J. Xie, N. Fang and E. S. Yeung, Anal. Bioanal. Chem.,2009, 394, 489–497.
37 D. M. Rissin, D. R. Fournier, T. Piech, C. W. Kan, T. G. Campbell,L. A. Song, L. Chang, A. J. Rivnak, P. P. Patel, G. K. Provuncher,E. P. Ferrell, S. C. Howes, B. A. Pink, K. A. Minnehan,D. H. Wilson and D. C. Duffy, Anal. Chem., 2011, 83, 2279–2285.
38 R. Schmidt, J. Jacak, C. Schirwitz, V. Stadler, G. Michel, N. Marme,G. J. Schutz, J. D. Hoheisel and J. P. Knemeyert, J. Proteome Res.,2011, 10, 1316–1322.
828 | Lab Chip, 2012, 12, 821–828
39 L. A. Tessler, C. D. Donahoe, D. J. Garcia, Y. S. Jun, D. L. Elbertand R. D. Mitra, J. R. Soc. Interface, 2011, 8, 1400–1408.
40 S. Y. Tetin, K. M. Swift and E. D. Matayoshi, Anal. Biochem., 2002,307, 84–91.
41 D. Bottenus, T. Z. Jubery, Y. X. Ouyang, W. J. Dong, P. Dutta andC. F. Ivory, Lab Chip, 2011, 11, 890–898.
42 D. M. Bruls, T. H. Evers, J. A. H. Kahlman, P. J. W. van Lankvelt,M. Ovsyanko, E. G. M. Pelssers, J. Schleipen, F. K. de Theije,C. A. Verschuren, T. van der Wijk, J. B. A. van Zon,W. U. Dittmer, A. H. J. Immink, J. H. Nieuwenhuis andM. W. J. Prins, Lab Chip, 2009, 9, 3504–3510.
This journal is ª The Royal Society of Chemistry 2012