Crystal-field Paschen-Back effect on ruby in ultrahigh magnetic fields
8
PHYSICAL REVIEW RESEARCH 2, 033257 (2020) Crystal-field Paschen-Back effect on ruby in ultrahigh magnetic fields Masaki Gen, * Tomoki Kanda, Takashi Shitaokoshi, YoshimitsuKohama, and Toshihiro Nomura † Institute for Solid State Physics, University of Tokyo, Kashiwa, Chiba 277-8581, Japan (Received 14 June 2020; revised 26 July 2020; accepted 29 July 2020; published 17 August 2020) Zeeman spectra of the R lines of ruby (Cr 3+ : α-Al 2 O 3 ) were studied in ultrahigh magnetic fields up to 230 T by magnetophotoluminescence measurements. The observed Zeeman patterns exhibit nonlinear behaviors above 100 T, evidencing the breakdown of the previously reported Paschen-Back effect for B ⊥ c geometry. We adopted the crystal-field multiplet theory including the cubic crystal field (H cubic ), the trigonal crystal field (H trig ), the spin-orbit interaction (H SO ), and the Zeeman interaction (H Z ). It is found that the nonlinear splitting of the R lines is owing to the hybridization between the 2 E and 2 T 1 states, which leads to the quantization of these Zeeman levels with the orbital angular momentum. Our results suggest that the exquisite energy balance among H cubic , H trig , H SO , and H Z realized in ruby offers a unique opportunity to observe the onset of the crystal-field Paschen-Back effect toward the high-field extreme. DOI: 10.1103/PhysRevResearch.2.033257 I. INTRODUCTION Zeeman effect is categorized into anomalous Zeeman (AZ) effect at the weak-field limit and normal Zeeman (NZ) effect at the high-field limit. When atoms are located in weak magnetic fields, the energy levels split nonlinearly due to the competition between the external magnetic field and the hyperfine or the spin-orbit interactions. Under high magnetic fields where the Zeeman energy far exceeds those interactions, on the other hand, the energy splitting is asymptotically quantized by μ B B, where μ B is the Bohr magneton and B is the magnetic field. Historically, the crossover from the AZ effect to the NZ effect, the so-called Paschen-Back (PB) effect [1], has been observed in various atoms [2–8] and molecules [9,10]. For example, the D lines of the sodium atom exhibit the hyperfine PB effect around 30 mT [4,5] and the spin- orbit PB effect around 50 T [6]. Through this process, the good quantum number changes from M F for the total angular momentum of an atom to M I and M J for that of a nucleus and electrons, respectively, and then M J are further decoupled to M L and M S for the orbital and spin angular momenta, respectively. The PB effect can also be observed in solid states [11–16]. The most well-known example is the R lines of ruby [13–16]. Many spectroscopic works on ruby have been done for more than half century, motivated by the scientific interests [13–27] as well as its applications to a solid-state laser and pressure gauge [28–33]. The optical transitions of ruby stem from the * [email protected] † [email protected] Published by the American Physical Society under the terms of the Creative Commons Attribution 4.0 International license. Further distribution of this work must maintain attribution to the author(s) and the published article’s title, journal citation, and DOI. Cr 3+ impurities in α-Al 2 O 3 , where Cr 3+ ions are subjected to the cubic crystal field of the octahedrally coordinated O 2− ions. Furthermore, the repulsion between neighboring cations causes the slight lattice distortion, lowering the symmetry to trigonal C 3 . As shown in Fig. 1(a), the absorption spectrum of ruby in visible region consists of two broad bands and three groups of sharp lines. In the notation of the cubic symmetry, the R lines correspond to an electric dipole transition from the ground state 4 A2 to the first excited state 2 E , appearing around 1.79 eV (694 nm). Due to the interplay of the trigonal crystal field and the spin-orbit interaction, the 2 E state further splits into two Kramers doublets E and 2 A (R 1 and R 2 lines) with the energy gap of δ = 3.6 meV. The observed Zeeman patterns of the R lines up to 60 T agree well with the theory based on the effective Hamiltonian for the 2 E state, which are shown in Figs. 1(b) and 1(c) [14–18]. Here, eight optically allowed transitions for E ⊥ c are noted for each B c and B ⊥ c geometry, where c axis is taken as the trigonal axis. For B ⊥ c, the tendency of the PB effect is observed toward 60 T, where the Zeeman energy is large enough compared to the initial splitting (gμ B B ≈ 2δ, where g = 2) [15,16]. This PB effect in ruby can be understood as such, that the Cr 3+ spins initially oriented along the c axis are gradually quantized along the applied magnetic field B ⊥ c. Unlike the case of isolated atoms, the Zeeman levels of the R lines become quantized only with M S in this PB region, while the orbital angular momentum of the 2 E state is still quenched in crystal. Hence, one can naively expect further quantization of these levels with M L toward the high-field limit. In this work, we observe the Zeeman spectra of the R lines of ruby in ultrahigh magnetic fields up to 230 T. For both B c and B ⊥ c geometries, the Zeeman patterns exhibit nonlinear splitting above 100 T, already beyond the previous theory [17,18]. The observed Zeeman patterns are analyzed by the standard crystal-field multiplet theory including the cubic crystal field, the trigonal crystal field, the spin-orbit interaction, and the Zeeman interaction [17–19,34–37]. The 2643-1564/2020/2(3)/033257(8) 033257-1 Published by the American Physical Society
-
Upload
khangminh22 -
Category
Documents
-
view
0 -
download
0
Transcript of Crystal-field Paschen-Back effect on ruby in ultrahigh magnetic fields

PHYSICAL REVIEW RESEARCH 2, 033257 (2020)
Crystal-field Paschen-Back effect on ruby in ultrahigh magnetic fields
Masaki Gen,* Tomoki Kanda, Takashi Shitaokoshi, Yoshimitsu Kohama, and Toshihiro Nomura †
Institute for Solid State Physics, University of Tokyo, Kashiwa, Chiba 277-8581, Japan
(Received 14 June 2020; revised 26 July 2020; accepted 29 July 2020; published 17 August 2020)
Zeeman spectra of the R lines of ruby (Cr3+: α-Al2O3) were studied in ultrahigh magnetic fields up to230 T by magnetophotoluminescence measurements. The observed Zeeman patterns exhibit nonlinear behaviorsabove 100 T, evidencing the breakdown of the previously reported Paschen-Back effect for B ⊥ c geometry.We adopted the crystal-field multiplet theory including the cubic crystal field (Hcubic), the trigonal crystal field(Htrig), the spin-orbit interaction (HSO), and the Zeeman interaction (HZ). It is found that the nonlinear splittingof the R lines is owing to the hybridization between the 2E and 2T1 states, which leads to the quantization of theseZeeman levels with the orbital angular momentum. Our results suggest that the exquisite energy balance amongHcubic, Htrig, HSO, and HZ realized in ruby offers a unique opportunity to observe the onset of the crystal-fieldPaschen-Back effect toward the high-field extreme.
DOI: 10.1103/PhysRevResearch.2.033257
I. INTRODUCTION
Zeeman effect is categorized into anomalous Zeeman (AZ)effect at the weak-field limit and normal Zeeman (NZ) effectat the high-field limit. When atoms are located in weakmagnetic fields, the energy levels split nonlinearly due tothe competition between the external magnetic field and thehyperfine or the spin-orbit interactions. Under high magneticfields where the Zeeman energy far exceeds those interactions,on the other hand, the energy splitting is asymptoticallyquantized by μBB, where μB is the Bohr magneton and Bis the magnetic field. Historically, the crossover from the AZeffect to the NZ effect, the so-called Paschen-Back (PB) effect[1], has been observed in various atoms [2–8] and molecules[9,10]. For example, the D lines of the sodium atom exhibitthe hyperfine PB effect around 30 mT [4,5] and the spin-orbit PB effect around 50 T [6]. Through this process, thegood quantum number changes from MF for the total angularmomentum of an atom to MI and MJ for that of a nucleusand electrons, respectively, and then MJ are further decoupledto ML and MS for the orbital and spin angular momenta,respectively.
The PB effect can also be observed in solid states [11–16].The most well-known example is the R lines of ruby [13–16].Many spectroscopic works on ruby have been done for morethan half century, motivated by the scientific interests [13–27]as well as its applications to a solid-state laser and pressuregauge [28–33]. The optical transitions of ruby stem from the
*[email protected]†[email protected]
Published by the American Physical Society under the terms of theCreative Commons Attribution 4.0 International license. Furtherdistribution of this work must maintain attribution to the author(s)and the published article’s title, journal citation, and DOI.
Cr3+ impurities in α-Al2O3, where Cr3+ ions are subjectedto the cubic crystal field of the octahedrally coordinated O2−ions. Furthermore, the repulsion between neighboring cationscauses the slight lattice distortion, lowering the symmetry totrigonal C3. As shown in Fig. 1(a), the absorption spectrum ofruby in visible region consists of two broad bands and threegroups of sharp lines. In the notation of the cubic symmetry,the R lines correspond to an electric dipole transition fromthe ground state 4A2 to the first excited state 2E , appearingaround 1.79 eV (694 nm). Due to the interplay of the trigonalcrystal field and the spin-orbit interaction, the 2E state furthersplits into two Kramers doublets E and 2A (R1 and R2 lines)with the energy gap of δ = 3.6 meV. The observed Zeemanpatterns of the R lines up to 60 T agree well with the theorybased on the effective Hamiltonian for the 2E state, which areshown in Figs. 1(b) and 1(c) [14–18]. Here, eight opticallyallowed transitions for E ⊥ c are noted for each B ‖ c andB ⊥ c geometry, where c axis is taken as the trigonal axis.For B ⊥ c, the tendency of the PB effect is observed toward60 T, where the Zeeman energy is large enough compared tothe initial splitting (gμBB ≈ 2δ, where g = 2) [15,16].
This PB effect in ruby can be understood as such, that theCr3+ spins initially oriented along the c axis are graduallyquantized along the applied magnetic field B ⊥ c. Unlikethe case of isolated atoms, the Zeeman levels of the R linesbecome quantized only with MS in this PB region, while theorbital angular momentum of the 2E state is still quenched incrystal. Hence, one can naively expect further quantization ofthese levels with ML toward the high-field limit.
In this work, we observe the Zeeman spectra of the Rlines of ruby in ultrahigh magnetic fields up to 230 T. Forboth B ‖ c and B ⊥ c geometries, the Zeeman patterns exhibitnonlinear splitting above 100 T, already beyond the previoustheory [17,18]. The observed Zeeman patterns are analyzedby the standard crystal-field multiplet theory including thecubic crystal field, the trigonal crystal field, the spin-orbitinteraction, and the Zeeman interaction [17–19,34–37]. The
2643-1564/2020/2(3)/033257(8) 033257-1 Published by the American Physical Society

MASAKI GEN et al. PHYSICAL REVIEW RESEARCH 2, 033257 (2020)
FIG. 1. (a) Absorption spectrum of ruby in visible region and thelocal structure of CrO9−
6 with the C3 symmetry. The correspondingexcited state from the ground state 4A2 is denoted for each absorptionpeak. (b), (c) Energy diagrams of the Zeeman splitting of the R linesfor (b) B ‖ c and (c) B ⊥ c geometries. A small initial splitting of0.05 meV in the 4A2 state is neglected. Optically allowed transitionsfor E ⊥ c are denoted by A, B,..., P. In the PB region for B ⊥ c, theexcited levels asymptotically approach the dashed straight lines.
hybridizations between the first and the second excited states,2E and 2T1, are found to be responsible for the AZ effect above100 T. Our observation would be regarded as the onset ofthe crystal-field PB effect, originating from the competitionbetween the Zeeman energy and the crystal-field splitting.
This paper is organized as follows. In Sec. II, we presentthe experimental and theoretical methods. In Sec. III, we showthe observed and calculated results on the Zeeman patterns ofthe R lines. In Sec. IV, we discuss the wave functions of the 2Estates in magnetic fields. We also refer to the Zeeman patternsat the high-field extreme. In Sec. V, we end the paper with theconclusive remarks.
II. METHODS
A. Experimental setup
Figure 2(a) shows the block diagram of the experimentalsetup for the magnetophotoluminescence (PL) measurements.The ultrahigh magnetic fields were generated by a horizon-tal single-turn-coil (HSTC) megagauss generator, equippedwith 200 kJ fast capacitor banks. The magnetic fields weremeasured by a calibrated pickup-coil with the error of ±2%.Disk-shaped ruby single crystals with 2.5 mm diameter and1.0 mm thickness (SHINKOSHA Co., Ltd.) were used. Theconcentration of the Cr3+ ion was 0.70 wt%, which is lowenough to neglect the effect of the exchange interaction. ThePL spectra were measured using a high-speed streak camera.The 532 nm laser was used for the excitation 4A2 →4T2. The
FIG. 2. (a) Block diagram of the experimental setup for themagneto-PL measurements using the STC system. The dashed linesshow the trigger signals. (b) Schematic view of the 4He-flow-typecryostat and the photo of the ruby single crystal used in this work.
incident light was guided by the 2.0-mm-diameter optical fiberand radiated the sample located at the center of the STC. Theemission light was collected by the 0.8-mm-diameter opticalfiber and guided to the polychromator equipped with the greenfilter, then resolved by the streak camera. In our setup, theincident light is polarized as E ⊥ c for B ‖ c, while bothE ⊥ c and E ‖ c components are mixed for B ⊥ c.
The sample was cooled down by using 4He-flow-typecryostats, as shown in Fig. 2(b). The sample and the opticalfibers were inserted inside the cryostat. A chromel/constantanthermocouple was tightly inserted to the half-moon-shapedgap between the sample and the cryostat. The measurementswere performed around 200 K. In this temperature range, elec-trons are thermally distributed within the 2E levels and mostof the optically allowed transitions are observed as relativelysharp peaks. Exceptionally, the measurements above 190 Twere performed without using the cryostat due to the limitedspace inside the STC. For the best signal-to-noise ratio, weperformed several cycles of measurements with the differentmaximum fields Bmax and integrated the spectra recorded nearBmax within 1% for each pulse.
B. Theoretical approach
So far, a simple effective Hamiltonian for the 2E statehas been considered to explain the Zeeman patterns of theR lines [14–18]. For B ‖ c, the Zeeman patterns of the R1
and R2 lines in the low-field region can be respectively dis-cribed by E1±(B) = − δ
2 ± 12 (g0 + 2g1‖)μBB and E2±(B) =
δ2 ± 1
2 (g0 − 2g2‖)μBB [see Fig. 1(b)]. Here, g0 = 1.98 [21]is the g factor of the ground state, and g1‖ = 0.23 and g2‖ =0.26 [16] are the g shifts which are mainly caused by thethird-order interactions between the 2E and the upper excitedstates, 2T1 and 2T2, through the trigonal crystal field and the
033257-2

CRYSTAL-FIELD PASCHEN-BACK EFFECT ON RUBY … PHYSICAL REVIEW RESEARCH 2, 033257 (2020)
FIG. 3. (a) PL spectra of the R lines up to 230 T for B ‖ c (B ⊥ c) in the upper (lower) panel. The spectra were recorded around 200 Kexcept for the 230 T data. (b), (c) Zeeman patterns of the R lines for (b) B ‖ c and (c) B ⊥ c geometries. Filled circles show the experimentalpeak positions. Red and blue lines show the theoretical curves obtained from the crystal-field multiplet theory (see text for details). Inset in(b) presents the average of the peak shifts with the magnetic field, reflecting the change in the mean energy of the four Zeeman levels splittingfrom the 2E states. Error bars in (c) are taken from the full width at half maximum (FWHM) of the fitted Lorentzian functions.
orbital angular momentum along the c axis (Lz) [18]. ForB ⊥ c, in contrast, the Zeeman patterns are described by thequadratic relations without lifting the degeneracies of theKramers doublets as E1±(B) = −(1/2)
√δ2 + (g0μBB)2 and
E2±(B) = (1/2)√
δ2 + (g0μBB)2 [see Fig. 1(c)]. As is evidentfrom these formula, this model assumes that the center of thefour energy levels remains constant in magnetic fields.
In this work, we adopted a Hamiltonian comprised of allthe 120 bases in the 3d3 multiplet, which is more general treat-ment than the above perturbative one. In this Hamiltonian, thetrigonal crystal field (Htrig), the spin-orbit interaction (HSO),and the Zeeman interaction (HZ) were involved in togetherwith the cubic crystal field (Hcubic). The bases are expressedas |(αS�)MSγ 〉, where α is the electronic configuration, MS
the spin quantum number in the spin-S state, and γ the orbitalfunction in the cubic irreducible representation �. We take MS
and γ quantized along the trigonal c axis (u± for E , a± anda0 for T1, and x± and x0 for T2) [17,18]. In the following, thenotation (αS�) is omitted if it is evident from the context.
Several empirical parameters were introduced in themultiplet Hamiltonian for numerical diagonalization: thecubic crystal-field strength 10Dq, Racah parameters B andC [34], the trigonal crystal fields K and K ′ defined asK ≡ 〈(t2)+ 1
2 x+|Htrig |(t2)+ 12 x+〉 and K ′ ≡ −(1/
√2)
〈(t2) + 12 x+|Htrig |(e)+ 1
2 u+〉, the spin-orbit interactions ζ andζ ′ defined as ζ ≡ −2〈(t2) + 1
2 x+|HSO |(t2)+ 12 x+〉 and ζ ′ ≡
−√2 〈(t2)+ 1
2 x+|HSO |(e)+ 12 u+〉, and the orbital reduction
factors k and k′ defined as k ≡ −〈(t2)+ 12 x+| Lz |(t2)+ 1
2 x+〉and k′ ≡ −(1/
√2) 〈(t2)+ 1
2 x+| Lz |(e)+ 12 u+〉, which reflect
the Cr-O bond covalency. Note that K , K ′, ζ , ζ ′, k, and k′are the matrix elements between one-electron states, andK = K ′, ζ = ζ ′, and k = k′ = 1 hold for the free ion. Similartheoretical approach focusing on the low-field limit wasattempted previously [19,20], but the discrepancies between
experimental and theoretical values of δ and g-factor wererelatively large. Hence, although no perfect quantitativematch seems to be achieved with any set of parameters,reexamination of the appropriate values was required in thiswork. We chose the parameters inHcubic as 10Dq = 2.320 eV,B = 0.071 eV, and C = 0.429 eV following the latest analysisin Ref. [27], which succeeded in reproducing the spectrum ofruby at zero field in a wide energy range including the UVregion. Then, we searched for the combination of the valuesof K , K ′, ζ , ζ ′, k, and k′ which simultaneously satisfy (i) theinitial splitting δ = 3.6 meV, (ii) the g values of the R1 andR2 lines for B ‖ c in the low-field limit, g0 + 2g1‖ = 2.44and g0 − 2g2‖ = 1.46 [16], and (iii) our new experimentalresults in the high-field region. Here, we imposed additionalconstraints of K < 0, ζ > 0, 0 < K ′/K < 1, 0.8 < ζ ′/ζ < 1,and k′/k = ζ ′/ζ .
III. RESULTS
A. Experimental Zeeman patterns
The evolutions of the Zeeman spectra of the R lines areshown in Fig. 3(a) (For all the data sets, see Ref. [38]). Thepeak positions as a function of magnetic field for B ‖ c andB ⊥ c are plotted in Figs. 3(b) and 3(c), respectively, whichare extracted by multi-Lorentzian fits [38]. The energy shift�E is measured from the center of the R1 and R2 linesat zero field. For B ‖ c, all of the eight optically allowedlines, corresponding to A–H in Fig. 1(b), are clearly observed.Remarkably, the Zeeman patterns deviate from the linear fielddependence to the lower energy side as the magnetic fieldincreases, resulting in the shift of the average peak positionas shown in the inset of Fig. 3(b). For B ⊥ c, three distinctpeaks are observed at 91 T, which can be understood thatsix lines, corresponding to J–O in Fig. 1(c), merge into threelines in the previously reported PB region. Note that the
033257-3

MASAKI GEN et al. PHYSICAL REVIEW RESEARCH 2, 033257 (2020)
FIG. 4. [(a) and (b)] Calculated energy diagrams of the fourZeeman levels splitting from the 2E states with the magnetic fieldup to 250 T for (a) B ‖ c and (b) B ⊥ c geometries. [(c) and (d)]The corresponding field-derivatives of the energy for (c) B ‖ c and(d) B ⊥ c geometries.
rest two lines, I and P, are hardly observable due to thelittle transition probability under high magnetic fields [14].Surprisingly, those three peaks split again into (at least) sixpeaks above 100 T, contradicting the concept of the previouslyreported PB effect. The tendency of the peak shifts to thelower energy side is also seen in the case of B ⊥ c.
B. Theoretical energy diagrams
The calculated energy diagrams of the four Zeeman levelssplitting from the 2E states are shown up to 250 T in Figs. 4(a)and 4(b). In the crystal-field multiplet Hamiltonian, the pa-rameters are chosen as K = −0.037 eV, K ′ = −0.013 eV,ζ = 0.025 eV, k = 0.72, and k′/k = ζ ′/ζ = 0.86. Here, Kand K ′ are a bit smaller compared to those in the previousworks, whereas ζ and ζ ′ the opposite [19,20,27]. It can beseen that all of the four curves for each geometry showupwardly convex magnetic-field dependence above 100 T.These trends can be clearly captured as the decrease in thefield-derivatives of the energy g′
r ≡ 2μB
dErdB (r = 1±, 2±) as
shown in Figs. 4(c) and 4(d). Furthermore, for B ⊥ c, thesplitting of each Kramers doublet starts to be seen around100 T and becomes larger toward higher fields as shownin Fig. 4(b). The ground state 4A2 is found to show thenearly linear Zeeman splitting up to 250 T (not shown). Fromthe above, the theoretical Zeeman patterns of the R linesare obtained as shown in Figs. 3(b) and 3(c), which agreewell with the experimental peak plots for both geometries.This indicates that the semiempirical crystal-field multipletHamiltonian taking all the bases in the 3d3 state can accountfor the Zeeman spectra of the R lines of ruby even in themegagauss region.
As shown in Fig. 3(c), our calculation predicts that eachof the three merged peaks around 100 T splits into fourindividual peaks beyond the previously reported PB region forB ⊥ c. All of them are optically allowed, suggesting that the
FIG. 5. Square of the coefficient |ck |2 for each of the|(t3
22E )± 1
2 u±〉 and |(t32
2T1)± 12 a±,0〉 components in the wave func-
tion of four Zeeman levels related to the R lines with the magneticfield up to 250 T. Data for B ‖ c and B ⊥ c are shown in (a)–(d) and(e)–(l), respectively. The figures are arranged in the same raw foreach of the four levels in order of |ϕ2+〉, |ϕ2−〉, |ϕ1+〉, and |ϕ1−〉 fromthe top. Arrows ↑ (↓) represent the spin MS = + 1
2 (− 12 ) of the bases.
For clarity, some plots show the summation of two components thatmainly contribute to the same Kramers doublet [40].
observed PL spectra above 100 T are composed of 12 peaks,while not all lines are well resolved due to their overlapping.Those spectra are tentatively fitted by six peaks with relativelylarge errors because the peak assignments with the 12-peakfit are challenging within our experimental accuracy. Thedetailed peak assignments based on the discussion on the peakintensities are found in Appendix A.
IV. DISCUSSIONS
A. Wave functions in magnetic fields
To clarify the origin of the AZ effect above 100 T, wediscuss the wave functions of the four Zeeman levels splittingfrom the 2E states. The wave functions are expressed by alinear combination of the 120 bases in the 3d3 state, |ϕr〉 =∑
k ck |(αS�)MSγ 〉, where ck is a complex number coeffi-cient. Our calculation reveals that |ϕ1±〉 (|ϕ2±〉) at zero fieldmainly consists of one base |(t3
22E )± 1
2 u∓〉(|(t32
2E )± 12 u±〉)
with |ck|2 = 0.947 (0.941) [39]. When a magnetic field isapplied, the second excited states 2T1 start to hybridize withthe 2E states in the first order via the orbital term ofHZ. Notethat the 2T1 states are composed of three Kramers doublets,all of which are � = 60 ∼ 90 meV away from the 2E states[40]. The field dependences of |ck|2 for the 2E and 2T1 statesup to 250 T are summarized in Fig. 5, where only the crucialcomponents are shown. For B ‖ c, as shown in Figs. 5(a)–5(d),the main component of the 2E states decreases in each ofthe four wave functions, associated with the increase in thecontribution of the 2T1 states with the same ML and MS .
033257-4
CRYSTAL-FIELD PASCHEN-BACK EFFECT ON RUBY … PHYSICAL REVIEW RESEARCH 2, 033257 (2020)
Meanwhile, their field-dependences in |ϕ2−〉 and |ϕ1+〉 aredifferent from those in |ϕ2+〉 and |ϕ1−〉. This is responsiblefor the difference in the field dependence of g′, exhibitingconvex upward and downward behaviors, respectively [seeFig. 4(c)]. In contrast, for B ⊥ c, both the summation ofthe |+ 1
2 u+〉 and |− 12 u−〉 components and that of the |+ 1
2 u−〉and |− 1
2 u+〉 components approach 0.5 toward high magneticfields as shown in Figs. 5(e)–5(h). These features signal thetendency of the quantization of the spin along the field direc-tion, i.e., the previously reported PB effect [14]. Besides, asshown in Figs. 5(i)–5(l), we see that the |± 1
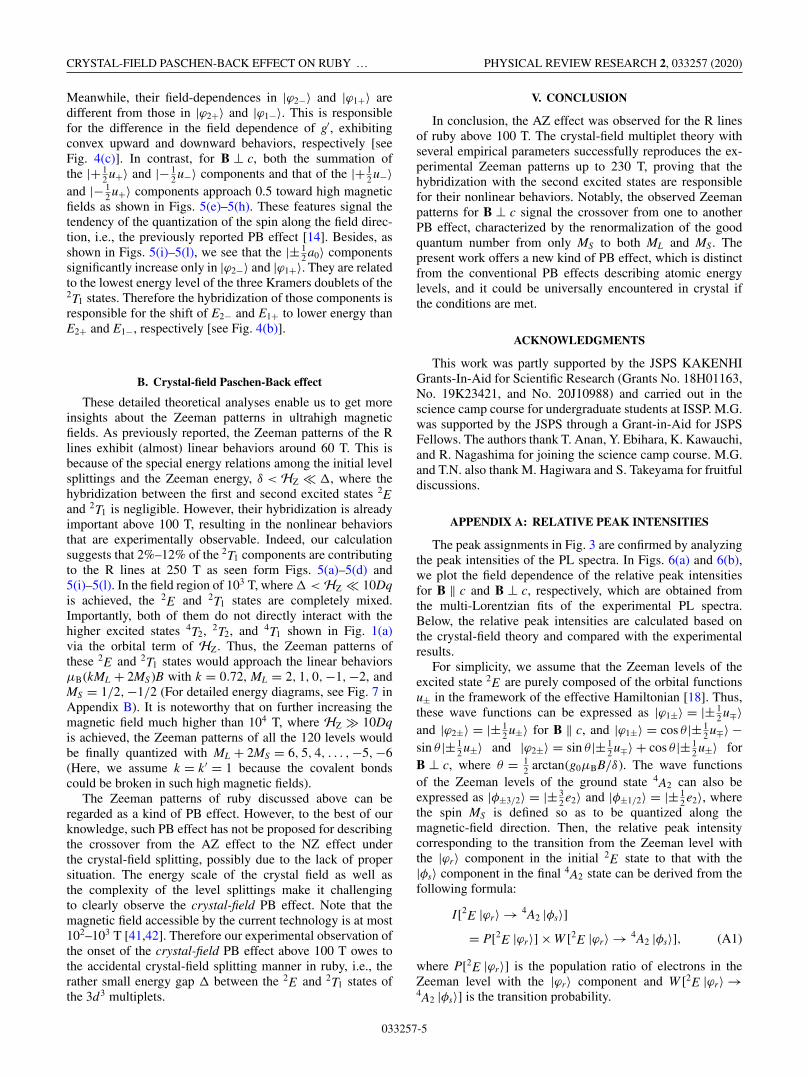
2 a0〉 componentssignificantly increase only in |ϕ2−〉 and |ϕ1+〉. They are relatedto the lowest energy level of the three Kramers doublets of the2T1 states. Therefore the hybridization of those components isresponsible for the shift of E2− and E1+ to lower energy thanE2+ and E1−, respectively [see Fig. 4(b)].
B. Crystal-field Paschen-Back effect
These detailed theoretical analyses enable us to get moreinsights about the Zeeman patterns in ultrahigh magneticfields. As previously reported, the Zeeman patterns of the Rlines exhibit (almost) linear behaviors around 60 T. This isbecause of the special energy relations among the initial levelsplittings and the Zeeman energy, δ < HZ � �, where thehybridization between the first and second excited states 2Eand 2T1 is negligible. However, their hybridization is alreadyimportant above 100 T, resulting in the nonlinear behaviorsthat are experimentally observable. Indeed, our calculationsuggests that 2%–12% of the 2T1 components are contributingto the R lines at 250 T as seen form Figs. 5(a)–5(d) and5(i)–5(l). In the field region of 103 T, where � < HZ � 10Dqis achieved, the 2E and 2T1 states are completely mixed.Importantly, both of them do not directly interact with thehigher excited states 4T2, 2T2, and 4T1 shown in Fig. 1(a)via the orbital term of HZ. Thus, the Zeeman patterns ofthese 2E and 2T1 states would approach the linear behaviorsμB(kML + 2MS )B with k = 0.72, ML = 2, 1, 0,−1,−2, andMS = 1/2,−1/2 (For detailed energy diagrams, see Fig. 7 inAppendix B). It is noteworthy that on further increasing themagnetic field much higher than 104 T, where HZ � 10Dqis achieved, the Zeeman patterns of all the 120 levels wouldbe finally quantized with ML + 2MS = 6, 5, 4, . . . ,−5,−6(Here, we assume k = k′ = 1 because the covalent bondscould be broken in such high magnetic fields).
The Zeeman patterns of ruby discussed above can beregarded as a kind of PB effect. However, to the best of ourknowledge, such PB effect has not be proposed for describingthe crossover from the AZ effect to the NZ effect underthe crystal-field splitting, possibly due to the lack of propersituation. The energy scale of the crystal field as well asthe complexity of the level splittings make it challengingto clearly observe the crystal-field PB effect. Note that themagnetic field accessible by the current technology is at most102–103 T [41,42]. Therefore our experimental observation ofthe onset of the crystal-field PB effect above 100 T owes tothe accidental crystal-field splitting manner in ruby, i.e., therather small energy gap � between the 2E and 2T1 states ofthe 3d3 multiplets.
V. CONCLUSION
In conclusion, the AZ effect was observed for the R linesof ruby above 100 T. The crystal-field multiplet theory withseveral empirical parameters successfully reproduces the ex-perimental Zeeman patterns up to 230 T, proving that thehybridization with the second excited states are responsiblefor their nonlinear behaviors. Notably, the observed Zeemanpatterns for B ⊥ c signal the crossover from one to anotherPB effect, characterized by the renormalization of the goodquantum number from only MS to both ML and MS . Thepresent work offers a new kind of PB effect, which is distinctfrom the conventional PB effects describing atomic energylevels, and it could be universally encountered in crystal ifthe conditions are met.
ACKNOWLEDGMENTS
This work was partly supported by the JSPS KAKENHIGrants-In-Aid for Scientific Research (Grants No. 18H01163,No. 19K23421, and No. 20J10988) and carried out in thescience camp course for undergraduate students at ISSP. M.G.was supported by the JSPS through a Grant-in-Aid for JSPSFellows. The authors thank T. Anan, Y. Ebihara, K. Kawauchi,and R. Nagashima for joining the science camp course. M.G.and T.N. also thank M. Hagiwara and S. Takeyama for fruitfuldiscussions.
APPENDIX A: RELATIVE PEAK INTENSITIES
The peak assignments in Fig. 3 are confirmed by analyzingthe peak intensities of the PL spectra. In Figs. 6(a) and 6(b),we plot the field dependence of the relative peak intensitiesfor B ‖ c and B ⊥ c, respectively, which are obtained fromthe multi-Lorentzian fits of the experimental PL spectra.Below, the relative peak intensities are calculated based onthe crystal-field theory and compared with the experimentalresults.
For simplicity, we assume that the Zeeman levels of theexcited state 2E are purely composed of the orbital functionsu± in the framework of the effective Hamiltonian [18]. Thus,these wave functions can be expressed as |ϕ1±〉 = |± 1
2 u∓〉and |ϕ2±〉 = |± 1
2 u±〉 for B ‖ c, and |ϕ1±〉 = cos θ |± 12 u∓〉 −
sin θ |± 12 u±〉 and |ϕ2±〉 = sin θ |± 1
2 u∓〉 + cos θ |± 12 u±〉 for
B ⊥ c, where θ = 12 arctan(g0μBB/δ). The wave functions
of the Zeeman levels of the ground state 4A2 can also beexpressed as |φ±3/2〉 = |± 3
2 e2〉 and |φ±1/2〉 = |± 12 e2〉, where
the spin MS is defined so as to be quantized along themagnetic-field direction. Then, the relative peak intensitycorresponding to the transition from the Zeeman level withthe |ϕr〉 component in the initial 2E state to that with the|φs〉 component in the final 4A2 state can be derived from thefollowing formula:
I[2E |ϕr〉 → 4A2 |φs〉]= P[2E |ϕr〉] × W [2E |ϕr〉 → 4A2 |φs〉], (A1)
where P[2E |ϕr〉] is the population ratio of electrons in theZeeman level with the |ϕr〉 component and W [2E |ϕr〉 →4A2 |φs〉] is the transition probability.
033257-5

MASAKI GEN et al. PHYSICAL REVIEW RESEARCH 2, 033257 (2020)
FIG. 6. [(a)–(d)] Magnetic-field dependences of the relative peakintensities obtained from the multi-Lorentzian fits for the experimen-tal results [(a) and (b)] and the calculation based on Eq. (A1) [(c) and(d)]. In the calculation, the temperature is fixed to T = 200 K toderive the Boltzmann distribution within the 2E state. (e) Plots of thecalculated intensity ratios for all of the individual peaks for B ⊥ cgeometry, which are decomposed from the plots in (d).
The population ratio P is estimated by assuming the Boltz-mann distribution of electrons among the Zeeman levels of the2E state. Note that the measurement temperature in this workis high enough to achieve the fast spin relaxation, yieldingthe nearly thermal equilibrium condition during the pulse.Accordingly, P is expressed as
P[2E |ϕr〉] = e−βEr
∑r′=1±,2± e−βEr′
, (A2)
where Er is the energy of the Zeeman level with the |ϕr〉 com-ponent and β = 1/kBT , where kB is the Boltzmann constant.Here, we adopt the value of Er obtained from the crystal-fieldmultiplet theory as shown in Figs. 4(a) and 4(b) (not from theeffective Hamiltonian) with the fixed temperature T = 200 K.
As for the transition probability W , the transition fromthe 2E to the 4A2 state is spin-prohibited. Thus we have toconsider the second-order perturbation via the intermediate4T2 state through the spin-orbit interaction [18]. Accordingly,the dipole strength for the transition from the |ϕr〉 component
TABLE I. The values of |〈(4A2)φs|P|(2E )ϕr〉|2 for B ‖ c geome-try [18].
Polarization E ⊥ c E ‖ c
4A2 \2E ϕ1+ ϕ1− ϕ2+ ϕ2− ϕ1+ ϕ1− ϕ2+ ϕ2−
φ+3/2 σ/2 π/2φ+1/2 σ/3 σ/3 σ/6 π/6φ−1/2 σ/3 σ/6 σ/3 π/6φ−3/2 σ/2 π/2
in the 2E state to the |φs〉 component in the 4A2 state is givenby the following formula:
W [2E |ϕr〉 → 4A2 |φs〉] ∝ | 〈(4A2)φs| P |(2E )ϕr〉 |2
=∣∣∣∣∣∑
m
〈(4A2)φs| P |(4T2)ψm〉 〈(4T2)ψm|HSO |(2E )ϕr〉E (2E ) − E (4T2)
∣∣∣∣∣
2
,
(A3)
where |ψm〉 is the component of the intermediate 4T2 state andE (2E ) − E (4T2) is the energy gap between the 2E and 4T2
states. If we neglect the effect of the phonon assisted tran-
sitions, the values of |〈(4A2)φs|P|(2E )ϕr〉|2 can be obtainedas Tables I and II for B ‖ c and B ⊥ c, respectively [14,18].Here, σ and π are defined as follows (spin terms are omitted):
σ = 4
3ζ ′2
∣∣∣∣∣〈(4A2)e2| P |(4T2)x±〉
E (2E ) − E (4T2)
∣∣∣∣∣
2
, (A4)
π = 4
3ζ ′2
∣∣∣∣∣〈(4A2)e2| P |(4T2)x0〉
E (2E ) − E (4T2)
∣∣∣∣∣
2
. (A5)
In our experimental setup, only the σ component (E ⊥ c)should be detected in the PL spectra for B ‖ c geometry,whereas both the σ and π components are expected to coexistfor B ⊥ c geometry. Such an effect might be reflected onthe difference in the intensity distribution of the R lines atzero field between the B ‖ c and B ⊥ c data; the relativeintensity of the R1 line is a bit weaker in the B ⊥ c data [see
Fig. 3(a)]. Note that the values of |〈(4A2)φs|P|(2E )ϕr〉|2 forthe R1 and R2 lines at zero field are respectively (5/3)σ andσ for E ⊥ c, whereas (1/3)π and π for E ‖ c. By consideringthe Boltzmann distribution within the 2E states as well as theabove information, we estimate the experimental ratio of thevalues of σ and π as σ ∼ 7π .
From these preparations, the magnetic-field dependence ofthe peak intensity ratios for B ‖ c and B ⊥ c are calculated asFigs. 6(c) and 6(d), respectively, where several peak intensi-ties are combined in order to compare with the experimentalplots shown in Figs. 6(a) and 6(b). Here, the summation of allthe peak intensities are normalized to 1 at each magnetic field.
For B ‖ c, the changes in the relative peak intensities upto 250 T mainly originate from the increased population ofthe lowest Zeeman level of the 2E state because the transitionprobabilities W remain constant in this field range. Thereforethe relative peak intensities corresponding to the transitionsfrom the Zeeman level with the |ϕ1−〉 or |ϕ2−〉 component,i.e., the peaks B, D, E, and G, are expected to get stronger as
033257-6
CRYSTAL-FIELD PASCHEN-BACK EFFECT ON RUBY … PHYSICAL REVIEW RESEARCH 2, 033257 (2020)
TABLE II. The values of |〈(4A2)φs|P|(2E )ϕr〉|2 for B ⊥ c geometry [14].
Polarization E ⊥ c E ‖ c
4A2 \2E ϕ1+ + ϕ1− ϕ2+ + ϕ2− ϕ1+ + ϕ1− ϕ2+ + ϕ2−
φ+3/2 3(cos θ − sin θ )2σ 3(cos θ + sin θ )2σ (cos θ − sin θ )2π (cos θ + sin θ )2π
φ+1/2 [2(cos θ + sin θ )2 [2(cos θ − sin θ )2 (cos θ − 3 sin θ )2π/3 (3 cos θ + sin θ )2π/3+(3 cos θ − sin θ )2]σ/3 +(cos θ + 3 sin θ )2]σ/3
φ−1/2 [2(cos θ − sin θ )2 [2(cos θ + sin θ )2 (cos θ + 3 sin θ )2π/3 (3 cos θ − sin θ )2π/3+(3 cos θ + sin θ )2]σ/3 +(cos θ − 3 sin θ )2]σ/3
φ−3/2 3(cos θ + sin θ )2σ 3(cos θ − sin θ )2σ (cos θ + sin θ )2π (cos θ − sin θ )2π
the magnetic field increases, which is roughly consistent withthe experimental results as shown in Fig. 6(a).
For B ⊥ c, in contrast, the field dependences of the relativepeak intensities are more complicated because the hybridiza-tions of two components in the Zeeman levels of the 2Estate bring about the changes in the transition probabilitiesW as shown in Table II. Since it is challenging to make theperfect peak assignments on the experimental PL spectra,we plot the relative intensities for three groups of the peaks(J+M, K+N, and L+O) in Fig. 6(b) to avoid the ambiguousplots. Indeed, our crystal-field multiplet theory predicts thateach of these three groups above 100 T are composed offour peaks. However, it is noteworthy that two peaks in theL+O group become strong toward high magnetic fields, asis clearly seen in Fig. 3(a). This tendency can be under-stood from the present calculation of the peak intensities.Figure 6(e) shows the calculated intensities for all of the indi-vidual peaks with the magnetic field B ⊥ c, indicating that thepeaks L± get much stronger than the peaks O±. Hence, weconclude that the optical transitions 2E |ϕ1±〉 → 4A2|φ−3/2〉are responsible for two intense peaks observed in the highenergy side (∼20 meV) at 230 T. In addition, the broad PLspectra observed in the low energy side (∼−30 meV) athigh magnetic fields could be attributed to the almost equalintensities among the four peaks J± and M± as shown inFig. 6(e).
APPENDIX B: THEORETICAL ENERGY DIAGRAMSTOWARD THE HIGH-FIELD LIMIT
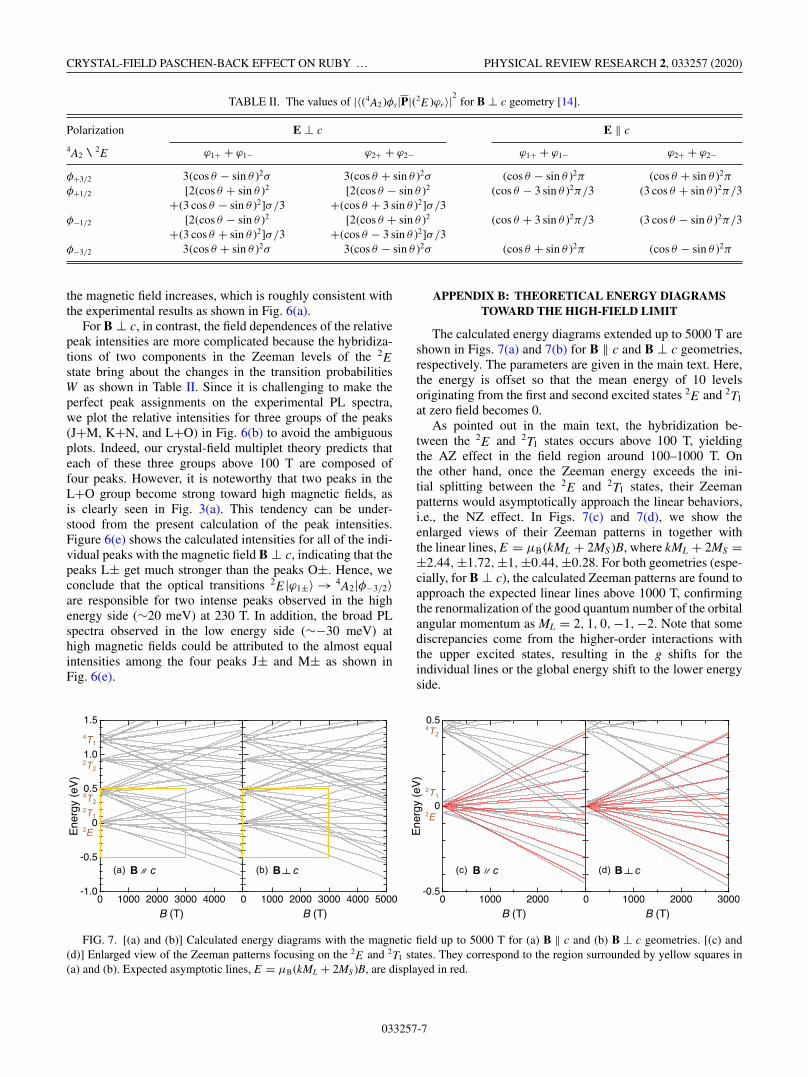
The calculated energy diagrams extended up to 5000 T areshown in Figs. 7(a) and 7(b) for B ‖ c and B ⊥ c geometries,respectively. The parameters are given in the main text. Here,the energy is offset so that the mean energy of 10 levelsoriginating from the first and second excited states 2E and 2T1
at zero field becomes 0.As pointed out in the main text, the hybridization be-
tween the 2E and 2T1 states occurs above 100 T, yieldingthe AZ effect in the field region around 100–1000 T. Onthe other hand, once the Zeeman energy exceeds the ini-tial splitting between the 2E and 2T1 states, their Zeemanpatterns would asymptotically approach the linear behaviors,i.e., the NZ effect. In Figs. 7(c) and 7(d), we show theenlarged views of their Zeeman patterns in together withthe linear lines, E = μB(kML + 2MS )B, where kML + 2MS =±2.44,±1.72,±1,±0.44,±0.28. For both geometries (espe-cially, for B ⊥ c), the calculated Zeeman patterns are found toapproach the expected linear lines above 1000 T, confirmingthe renormalization of the good quantum number of the orbitalangular momentum as ML = 2, 1, 0,−1,−2. Note that somediscrepancies come from the higher-order interactions withthe upper excited states, resulting in the g shifts for theindividual lines or the global energy shift to the lower energyside.
FIG. 7. [(a) and (b)] Calculated energy diagrams with the magnetic field up to 5000 T for (a) B ‖ c and (b) B ⊥ c geometries. [(c) and(d)] Enlarged view of the Zeeman patterns focusing on the 2E and 2T1 states. They correspond to the region surrounded by yellow squares in(a) and (b). Expected asymptotic lines, E = μB(kML + 2MS )B, are displayed in red.
033257-7

MASAKI GEN et al. PHYSICAL REVIEW RESEARCH 2, 033257 (2020)
[1] F. Paschen and E. Back, Physica 1, 261 (1921).[2] N. A. Kent, Astrophys. J. 40, 337 (1914).[3] P. Kapitza, P. G. Stelkov, and E. Laurman, Proc. R. Soc. London
A 167, 1 (1938).[4] L. Windholz, Z. Phys. A 322, 203 (1985).[5] L. Windholz and M. Musso, Z. Phys. D 8, 239 (1988).[6] H. Hori, M. Miki, and M. Date, J. Phys. Soc. Jpn. 51, 1566
(1982).[7] A. Sargsyan, G. Hakhumyan, C. Leroy, Y. Pashayan-Leroy, A.
Papoyan, D. Sarkisyan, and M. Auzinsh, J. Opt. Soc. Am. B 31,1046 (2014).
[8] A. Sargsyan, E. Klinger, G. Hakhumyan, A. Tonoyan, A.Papoyan, C. Leroy, and D. Sarkisyan, J. Opt. Soc. Am. B 34,776 (2017).
[9] C. K. Jen, Phys. Rev. 76, 1494 (1949).[10] S. V. Berdyugina, D. M. Fluri, R. Ramelli, M. Bianda, D. Gisler,
and J. O. Stenflo, Astrophys. J. Lett. 649, L49 (2006).[11] D. L. Wood, J. Chem. Phys. 42, 3404 (1965).[12] N. Koshizuka, T. Ban, and I. Tsujikawa, J. Phys. Soc. Jpn. 30,
470 (1971).[13] S. Sugano and I. Tsujikawa, J. Phys. Soc. Jpn. 13, 899 (1958).[14] K. Aoyagi, A. Misu, and S. Sugano, J. Phys. Soc. Jpn. 18, 1448
(1963).[15] H. Hori, H. Mollymoto, and M. Date, J. Phys. Soc. Jpn. 46, 908
(1979).[16] M. Millot, J.-M. Broto, and J. Gonzalez, Phys. Rev. B 78,
155125 (2008).[17] Y. Tanabe and H. Kamimura, J. Phys. Soc. Jpn. 13, 394 (1958).[18] S. Sugano and Y. Tanabe, J. Phys. Soc. Jpn. 13, 880 (1958).[19] S. Sugano and M. Peter, Phys. Rev. 122, 381 (1961).[20] R. M. Macfarlane, Phys. Rev. B 1, 989 (1970).[21] A. A. Manenkov and A. M. Prokhorov, J. Exptl. Theoret. Phys.
(USSR) 28, 762 (1955).[22] G. Kido and N. Miura, Appl. Phys. Lett. 41, 569 (1982).[23] S. Watanabe, T. Sasaki, R. Taniguchi, T. Ishii, and K.
Ogasawara, Phys. Rev. B 79, 075109 (2009).[24] M. Millot, J.-M. Broto, J. Gonzalez, and F. Rodríguez, Phys.
Rev. B 81, 075120 (2010).[25] S. Watanabe, T. Nagasaki, and K. Ogasawara, J. Appl. Phys.
110, 123524 (2011).
[26] J. A. Aramburu, P. Garcia-Fernandez, J. M. García-Lastra,M. T. Barriuso, and M. Moreno, Phys. Rev. B 85, 245118(2012).
[27] M. O. J. Y. Hunault, Y. Harada, J. Miyawaki, J. Wang, A.Meijerink, F. M. F. de Groot, and M. M. van Schooneveld,J. Phys. Chem. A 122, 4399 (2018).
[28] T. H. Maiman, Nature (London) 187, 493 (1960).[29] T. H. Maiman, Phys. Rev. Lett. 4, 564 (1960).[30] R. A. Forman, G. J. Piermarini, J. D. Barnett, and S. Block,
Science 176, 284 (1972).[31] H. K. Mao, J. Xu, and P. M. Bell, J. Geophys. Res. 91, 4673
(1986).[32] Y. M. Gupta and X. A. Shen, Appl. Phys. Lett. 58, 583
(1991).[33] D. D. Ragan, R. Gustavsen, and D. Schiferl, J. Appl. Phys. 72,
5539 (1992).[34] G. Racah, Phys. Rev. 63, 367 (1943).[35] Y. Tanabe and S. Sugano, J. Phys. Soc. Jpn. 9, 753 (1954).[36] Y. Tanabe and S. Sugano, J. Phys. Soc. Jpn. 9, 766 (1954).[37] Y. Tanabe, Supplement Prog. Theoret. Phys. (Kyoto) 14, 17
(1960).[38] See Supplemental Material at http://link.aps.org/supplemental/
10.1103/PhysRevResearch.2.033257 for all the experimentaldata sets.
[39] These values are different from those of the intercepts shownin Figs. 5(a)–5(h). This is because |ck |2 of each componentchanges discontinuously due to the lifting of degeneracy whena magnetic field is applied.
[40] The energy gap between the first and second excited states, 2Eand 2T1, is attributed to the single-ion Coulomb interactionsin the framework of the crystal-field theory. Three Kramersdoublets originating from the 2T1 states are represented as 2A,Ea, and Eb. In ruby, the main components contributing to eachof the doublet are as follows: |+ 1
2 a+〉 and |− 12 a−〉 for 2A,
|+ 12 a−〉 and |− 1
2 a+〉 for Ea, and |+ 12 a0〉 and |− 1
2 a0〉 for Eb.[41] N. Miura, T. Osada, and S. Takeyama, J. Low Temp. Phys. 133,
139 (2003).[42] D. Nakamura, A. Ikeda, H. Sawabe, Y. H. Matsuda,
and S. Takeyama, Rev. Sci. Instrum. 89, 095106(2018).
033257-8