An UltraHigh Throughput Cell-Based Screen for Wee1 Degradation Inhibitors
18
An Ultra-High Throughput Cell-Based Screen for Wee1 Degradation Inhibitors FRANCK MADOUX 1 , SCOTT SIMANSKI 2 , PETER CHASE 1 , JITENDRA K. MISHRA 3 , WILLIAM R. ROUSH 3 , NAGI G. AYAD 2 , and PETER HODDER 1,4 1 Scripps Research Institute Molecular Screening Center, Lead Identification Division, Translational Research Institute, Scripps Florida, Jupiter, Florida 2 Department of Cancer Biology, Scripps Florida, Jupiter, Florida 3 Department of Chemistry, Scripps Florida, Jupiter, Florida 4 Department of Molecular Therapeutics, Scripps Florida, Jupiter, Florida Abstract The tyrosine kinase Wee1 is part of a key cellular sensing mechanism that signals completion of DNA replication, ensuring proper timing of entry into mitosis. Wee1 acts as an inhibitor of mitotic entry by phosphorylating cyclin-dependent kinase CDK1. Wee1 activity is mainly regulated at the protein level through its phosphorylation and subsequent degradation by the ubiquitin proteasome pathway. To facilitate identification of small molecules preventing Wee1 degradation, a homogeneous cell-based assay was developed using HeLa cells transiently transfected with a Wee1-Luciferase fusion protein. To insure uHTS compatibility, the assay was scaled to 1,536-well plate format and cells were transfected in bulk and cryopreserved. This miniaturized homogenous assay demonstrated robust performance, with a calculated Z′ factor of 0.65±0.05. The assay was screened against a publicly available library of ~218,000 compounds in order to identify Wee1 stabilizers. Nonselective, cytotoxic and promiscuous compounds were rapidly triaged through the use of a similarly formatted counterscreen that measured stabilization of a N-cyclin B-Luciferase fusion protein, as well as execution of viability assessment in the parental HeLa cell line. This screening campaign led to the discovery of four unrelated cell-permeable small molecules that showed selective Wee1-Luciferase stabilization with micromolar potency. One of these compounds, SID4243143, was shown to inhibit cell cycle progression, underscoring the importance of Wee1 degradation to the cell cycle. Our results suggest that this uHTS approach is suitable for identifying selective chemical probes that prevent Wee1 degradation, and generally applicable to discovering inhibitors of the ubiquitin proteasome pathway. Keywords Wee1; degradation; stabilizer; reporter assay; transient transfection; cryopreserved cells; ubiquitin; proteasome INTRODUCTION Wee1 is a highly conserved tyrosine kinase that inhibits mitotic entry by inactivating the mitosis-specific kinase Cdk1/Cyclin B complex during the S and G2 phases though Cdk1 Address correspondence to: Peter Hodder, Lead Identification Division, Translational Research Institute, Scripps Florida, 130 Scripps Way #1A1, Jupiter, FL 33458, U.S.A. [email protected]. NIH Public Access Author Manuscript J Biomol Screen. Author manuscript; available in PMC 2011 September 1. Published in final edited form as: J Biomol Screen. 2010 September ; 15(8): 907–917. doi:10.1177/1087057110375848. NIH-PA Author Manuscript NIH-PA Author Manuscript NIH-PA Author Manuscript
-
Upload
independent -
Category
Documents
-
view
1 -
download
0
Transcript of An UltraHigh Throughput Cell-Based Screen for Wee1 Degradation Inhibitors

An Ultra-High Throughput Cell-Based Screen for Wee1Degradation Inhibitors
FRANCK MADOUX1, SCOTT SIMANSKI2, PETER CHASE1, JITENDRA K. MISHRA3,WILLIAM R. ROUSH3, NAGI G. AYAD2, and PETER HODDER1,4
1 Scripps Research Institute Molecular Screening Center, Lead Identification Division,Translational Research Institute, Scripps Florida, Jupiter, Florida2 Department of Cancer Biology, Scripps Florida, Jupiter, Florida3 Department of Chemistry, Scripps Florida, Jupiter, Florida4 Department of Molecular Therapeutics, Scripps Florida, Jupiter, Florida
AbstractThe tyrosine kinase Wee1 is part of a key cellular sensing mechanism that signals completion ofDNA replication, ensuring proper timing of entry into mitosis. Wee1 acts as an inhibitor of mitoticentry by phosphorylating cyclin-dependent kinase CDK1. Wee1 activity is mainly regulated at theprotein level through its phosphorylation and subsequent degradation by the ubiquitin proteasomepathway. To facilitate identification of small molecules preventing Wee1 degradation, ahomogeneous cell-based assay was developed using HeLa cells transiently transfected with aWee1-Luciferase fusion protein. To insure uHTS compatibility, the assay was scaled to 1,536-wellplate format and cells were transfected in bulk and cryopreserved. This miniaturized homogenousassay demonstrated robust performance, with a calculated Z′ factor of 0.65±0.05. The assay wasscreened against a publicly available library of ~218,000 compounds in order to identify Wee1stabilizers. Nonselective, cytotoxic and promiscuous compounds were rapidly triaged through theuse of a similarly formatted counterscreen that measured stabilization of a N-cyclin B-Luciferasefusion protein, as well as execution of viability assessment in the parental HeLa cell line. Thisscreening campaign led to the discovery of four unrelated cell-permeable small molecules thatshowed selective Wee1-Luciferase stabilization with micromolar potency. One of thesecompounds, SID4243143, was shown to inhibit cell cycle progression, underscoring theimportance of Wee1 degradation to the cell cycle. Our results suggest that this uHTS approach issuitable for identifying selective chemical probes that prevent Wee1 degradation, and generallyapplicable to discovering inhibitors of the ubiquitin proteasome pathway.
KeywordsWee1; degradation; stabilizer; reporter assay; transient transfection; cryopreserved cells; ubiquitin;proteasome
INTRODUCTIONWee1 is a highly conserved tyrosine kinase that inhibits mitotic entry by inactivating themitosis-specific kinase Cdk1/Cyclin B complex during the S and G2 phases though Cdk1
Address correspondence to: Peter Hodder, Lead Identification Division, Translational Research Institute, Scripps Florida, 130 ScrippsWay #1A1, Jupiter, FL 33458, U.S.A. [email protected].
NIH Public AccessAuthor ManuscriptJ Biomol Screen. Author manuscript; available in PMC 2011 September 1.
Published in final edited form as:J Biomol Screen. 2010 September ; 15(8): 907–917. doi:10.1177/1087057110375848.
NIH
-PA Author Manuscript
NIH
-PA Author Manuscript
NIH
-PA Author Manuscript
phosphorylation at tyrosine 15.1 By contrast, the phosphatase Cdc25 abrogates Wee1-mediated effect by removing Cdk1 phosphorylation.2, 3 Therefore, there is a competitionbetween Wee1 and Cdc25 in controlling Cdk1/Cyclin B complex activity, which ultimatelydetermines mitotic entry or division arrest.4 Upon the onset of mitosis, Wee1 is inactivatedboth by protein phosphorylation on specific residues and subsequent degradation via theubiquitin proteasome pathway.5–7 This mechanism tips the balance in favor of Cdc25,triggering a positive feedback loop driven by activated Cdc25 and Cdk1/Cyclin B, thusconferring unidirectionality to mitosis.8 Maintaining the right amount of Wee1 is essentialfor cell growth and proliferation and hence Wee1 is likely to participate in tumorprogression. Lung cancer biopsies have low levels of Wee1 protein.9 By contrast, increasingWee1 levels by reducing its degradation in a prostate cancer model was beneficial as itlimited cell growth.10 Moreover, an anti-cancer compound that increases the steady-statelevels of Wee1 by inhibiting Plk-1 dependent Wee1 turnover is now in Phase I clinicaltrials.11 In addition, many cancer cells are lacking Wee1 dependent checkpoint pathwaysneeded to ensure proper correction of DNA defects prior to mitosis, causing the cells todivide with incompletely replicated DNA.12 Tight regulation of Wee1 activity in these cellsmay prevent the genomic instability caused by premature mitosis entry. Taken together,these studies suggest Wee1 is a promising target in cancer, and the regulation of itsdegradation a point of choice for chemotherapeutic intervention. In addition to providingpotential novel drug leads, small-molecule inhibitors of Wee1 degradation could yieldvaluable probes to decipher pathways controlling Wee1 turnover and cell cycle transit.However, no effort to identify these small molecules has been reported thus far.
In this report, we describe a novel homogeneous 1536-well plate assay to monitor Wee1degradation using cryopreserved transiently transected cells. We also demonstrate theexcellent performance of this assay in the context of an uHTS campaign that led to theidentification of potential selective cell-permeable Wee1-Luc stabilizers.
MATERIALS AND METHODSVector construction
The construct allowing expression of the K328M (kinase inactive) mutant of the Wee1-Luciferase fusion protein (K328M-Wee1-Luc) was created by standard cloning methods aspreviously described.7 The N-cyclin B-Luc expressing construct has also been previouslyreported.13, 14
Cell cultureHeLa cells (American Type Culture Collection, Manassas, VA) were routinely cultured inT-175 flasks (Corning Life Sciences, Acton, MA) in Dulbecco’s Modified Eagle’s Media(DMEM, Gibco, Carlsbad, CA) supplemented with 10% (v/v) fetal bovine serum (FBS,Hyclone, Logan, UT) and 1% penicillin/streptomycin/neomycin mix (PSN, Gibco) at 37°C,5% CO2, 95% relative humidity (RH). For small scale experiments, HeLa cells weretransiently transfected with the k328M-Wee1-Luc expression vector by batches of 6×10⁶
cells prepared in T75 flasks (Corning) containing 24 mL of a 1:1 ratio of OptiMEM andDMEM supplemented with 10% FBS, 1% PSN, 29 μg of K328M-Wee1-Luc plasmid and 87μL of TransIT-LT1 reagent, according to the manufacturer’s protocol (Mirus Bioproducts,Madison, WI). Cells were then incubated for two days at 37°C, 5% CO2, 95% RH. Forlarge-scale experiments, cells were prepared in larger quantities (≈0.5–2×10⁹) andtransfected using the same transfection reagents and media quantities relative to the cellnumber. Two days post-transfection, cells were cryopreserved.15 Briefly, cells weretrypsinized, counted and resuspended in freezing medium (DMEM supplemented with10%DMSO, 10% FBS, and 1% PSN) at a concentration ranging from 1.5 to 2×10⁷ cells per
MADOUX et al. Page 2
J Biomol Screen. Author manuscript; available in PMC 2011 September 1.
NIH
-PA Author Manuscript
NIH
-PA Author Manuscript
NIH
-PA Author Manuscript

mL. Cells were then dispensed into 1.8 mL cryovials (Nalgene) and transferred into a −80°Cfreezing unit using a device allowing a cooling rate of roughly 1°C per minute (Mr. Frosty,Nalgene, Rochester, NY).
Wee1 degradation uHTS assayWhen using cryopreserved cells, frozen stocks of transiently transfected cells were rapidlythawed prior to the assay by transferring them in a centrifuge tube containing pre-heatedmedia composed of phenol-red free DMEM supplemented with 10% FBS and 1% PSN.Transiently transfected cells -either from frozen or regular stocks- were then centrifuged,counted and resuspended at a concentration of 800,000 cells per mL. A stepwise assayprotocol is presented in Table 1. Briefly, the Wee1 degradation assay was performed bydispensing 5 μL of cell-suspension into each well of 1536-well plates (i.e. 4,000 cells perwell). After a 4 hour incubation period at 37°C, 5% CO2 and 95% RH, plates received 25 nLper well of either test compounds from the MLSMR library (final nominal concentration of5μM), positive control MG132 at a final concentration of 30μM (serves as a 100%activation control), or DMSO alone (0.5% final DMSO concentration, 0% activationcontrol) using a Pin Tool transfer unit (GNF/Kalypsys). Plates were then incubated at 37°C,5% CO2 and 95% RH for twenty hours. At the end of the incubation time, plates wereequilibrated at room temperature for 15 minutes before receiving 5 μL/well of SteadyLiteHTS reagent (PerkinElmer Life and Analytical Sciences, Waltham, MA) into each well.Fifteen minutes later, light emitted by the conversion of luciferase’s substrate D-luciferinwas measured on the ViewLux reader for 60 seconds (PerkinElmer Life and AnalyticalSciences).
uHTS screen using the Wee1 assayDetails relative to each step of the uHTS campaign are shown Table 2. During the primaryscreen, test compounds from the library were screened as singlicate in the miniaturizedK328M-Wee1-Luc assay at a final nominal test concentration of 5μM (final DMSOconcentration of 0.5%) using the automated GNF/Kalypsys robotic platform at the ScrippsResearch Institute Molecular Screening Center (The Scripps Research Institute, Jupiter, FL).The percent activation of each test compound was calculated on a per-plate basis as furtherdescribed in the Data Normalization section. The hit-cutoff used to qualify activecompounds was calculated as the average percentage activation of all compounds tested plusthree times their standard deviation16. The confirmation screen was run in the exact sameconditions as the primary uHTS, except that plates were assessed in triplicate and that resultsfor each compound were reported as the average percentage activation of the threemeasurements, plus or minus the associated standard deviation. For titration experiments,assay protocols were identical to those described above, with the following exception thatcompounds were prepared in 10 point, 1:3 serial dilutions starting at a nominal testconcentration of 50 μM, and assessed in triplicate.17
N-cyclin B counterscreen assayThe N-cyclin B assay has previously been reported elsewhere.13, 14 To be used as acounterscreen for potential Wee1 degradation inhibitors, the original protocol was modifiedto match the one followed for the Wee1 assay as described above.
Cell viability assayFive microliters of non-transfected HeLa cell suspension (100,000 cells per mL) in DMEMsupplemented with 10% FBS and 1% PSN was dispensed into each well of a 1,536-wellplate. Four hours after dispensing, 25 nL of test compounds prepared as 10-point, 1:3 serialdilutions were added to the cells using the Pin Tool. Plates were incubated for 20 hours at
MADOUX et al. Page 3
J Biomol Screen. Author manuscript; available in PMC 2011 September 1.
NIH
-PA Author Manuscript
NIH
-PA Author Manuscript
NIH
-PA Author Manuscript
37°C, 5% CO2, 95% RH and 5 μL of CellTiter-Glo (Promega, Madison, WI) was then addedto each well. After 15-minute incubation at room temperature, luminescence was measuredfor 30 s using the ViewLux reader (PerkinElmer Life and Analytical Sciences). Cell survivalwas expressed as a percentage relative to wells containing media only (no cells, 0%survival) and wells containing cells treated with DMSO at 0.5% final only (100% survival).
Screening data acquisition, normalization, representation and analysisRaw fluorescent data from the ViewLux plate reader were uploaded into our institutionalHTS database (MDL Information Systems, San Ramon, CA). Activity of each well wasnormalized on a per-plate basis using the following equation:
where High Control represents wells from the same plate containing 30 μM MG132 (100%activation control, n = 24) and Low Control represents wells from the same plate treatedwith DMSO only (0% activation, n = 24).
A Z′ value greater than 0.5 was required for plate validation during the quality controlprocess.18 For dose-response experiments, triplicate percentage activations were plottedagainst compound concentration. A four-parameter equation describing a sigmoidal dose-response curve was then fitted with adjustable baseline using Assay Explorer software(MDL Information Systems). All data showed here was represented using Prism version4.03 (GraphPad Software, San Diego, CA). Fitting of dose-response curves and EC50determination were performed using the variable slope sigmoidal curve analysis tool ofPrism. Results of screening assays presented in this text can be found the NIH’s PubChemwebsite (http://pubchem.ncbi.nlm.nih.gov/).
ChemicalsThe Molecular Libraries Small Molecule Repository (MLSMR) library was provided byBioFocus DPI (South San Francisco, CA) through the NIH’s Roadmap: Molecular LibrariesInitiative. Details regarding compound selection for this library can be found online athttp://mli.nih.gov/mli/compound-repository/mlsmr-compounds/. Briefly, the MLSMRlibrary is a highly diversified collection of small molecules (more that 50% of compoundsexhibit molecular weights between 350 and 410 g/mol) comprising both synthetic andnatural products, from either commercial or academic sources, that can be grouped into thethree following categories: (1) specialty sets of know bioactive compounds such as drugsand toxins, (2) focused libraries aimed at specific target classes and (3) diversity setscovering a large area of the chemical space. Reference control MG132 (Z-Leu-Leu-Leu-CHO) was purchased from the American Peptide Company (Sunnyvale, CA). Synthesis ofSID4243143, SID3713089, SID4256064 are detailed in the supplemental section of thismanuscript.
FACS analysisCompound treated Hela cells were harvested by collecting culture media, washing once inPBS, and trypsinizing. Cells were centrifuged at 400 g for five minutes at 4°C. Cells werethen washed with cold PBS, centrifuged at 400 g for 5 minutes at 4°C, and rapidlyresuspended with 7.5 mL 70% Ethanol and incubated at −20°C overnight. Cells were thencentrifuged at 400 g for 10 minutes at 4°C and washed with 10 mL cold PBS. Thesupernatant was removed and the cell pellet was resuspended in 38 mM sodium citratecontaining 69 mM of propidium iodide (Invitrogen) and 19mg/mL of Rnase A. FACS
MADOUX et al. Page 4
J Biomol Screen. Author manuscript; available in PMC 2011 September 1.
NIH
-PA Author Manuscript
NIH
-PA Author Manuscript
NIH
-PA Author Manuscript
analysis was performed on a BD Bioscience LSR II system and analyzed using Flowjo 8.7.3software.
Kinase profilingThe kinase profiling assay was performed by Reaction Biology Corporation (Malvern, PA)using a radiometric-based filtration binding assay as previously described.19 Briefly,compound SID4243143 was tested in duplicate at 10 μM on a panel of purified kinases inpresence of 32P-γ-ATP. Incorporation of 32P-γ-ATP into peptide substrates was measuredand compared to DMSO controls. The kinase pan-inhibitor staurosporine was used as apositive control for these experiments.
RESULTSDevelopment, validation and miniaturization of a cell-based HTS assay to monitor Wee1stabilization
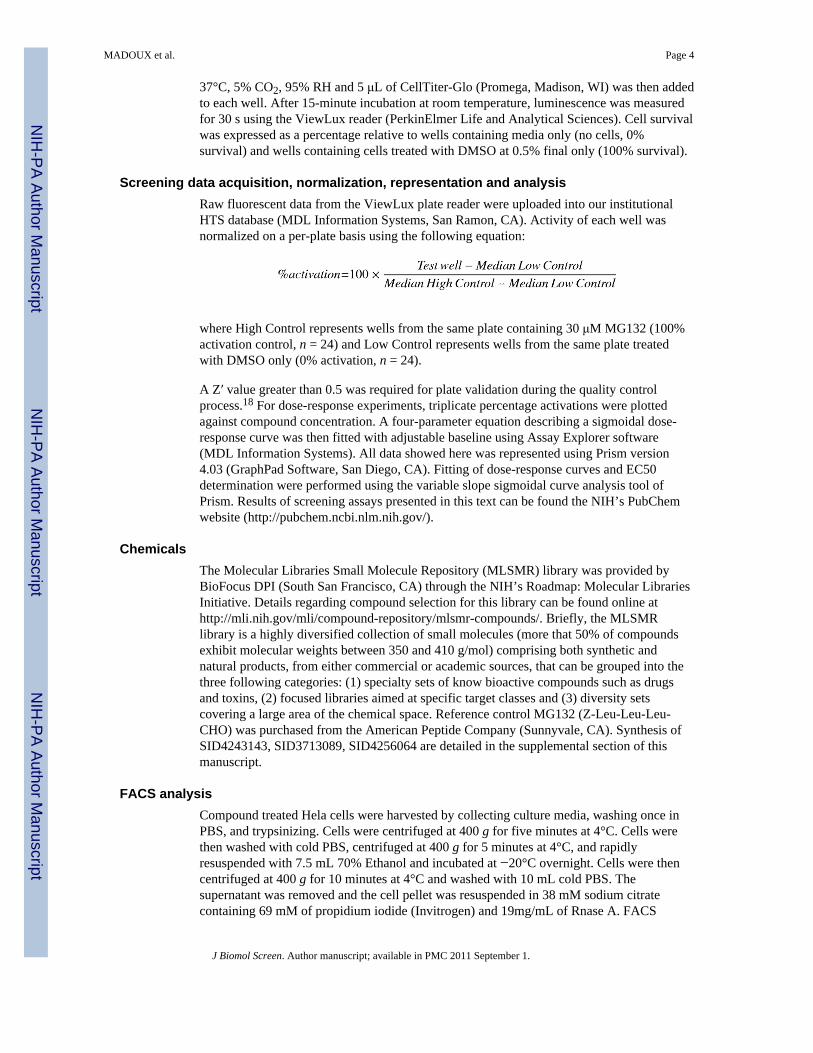
The primary screening assay was designed to measure the effect of test compounds on thestabilization of intracellular Wee1. To facilitate Wee1 protein level monitoring in cells, thefirefly luciferase protein was fused in frame with the C-terminal end of Wee1. We used akinase inactive mutant of Wee1, Wee1K328M, to prevent known toxicity issues associatedwith Wee1 overexpression.6 Prior studies demonstrated that this fusion protein, K328M-Wee1-Luc, had similar degradation characteristics as wild-type endogenous Wee1.7 HeLacells transiently transfected with the K328M-Wee1-Luc encoding plasmid were incubatedwith test compounds for 20 hours and lysed to measure their luciferase content via the use ofa light-emitting D-luciferin substrate (Fig. 1A). K328M-Wee1-Luc expressing cells treatedwith 30 μM MG132 (Fig. 1B), a widely used proteasome inhibitor20, showed a significantincrease (>9-fold) in luminescent levels consistent with a blockade of K328M-Wee1-Lucdegradation through the ubiquitin-proteasome pathway (Fig. 1C). In absence of a previouslydescribed reference compound targeting Wee1 degradation, we used MG132 as a positivecontrol for all the experiments described in this study.
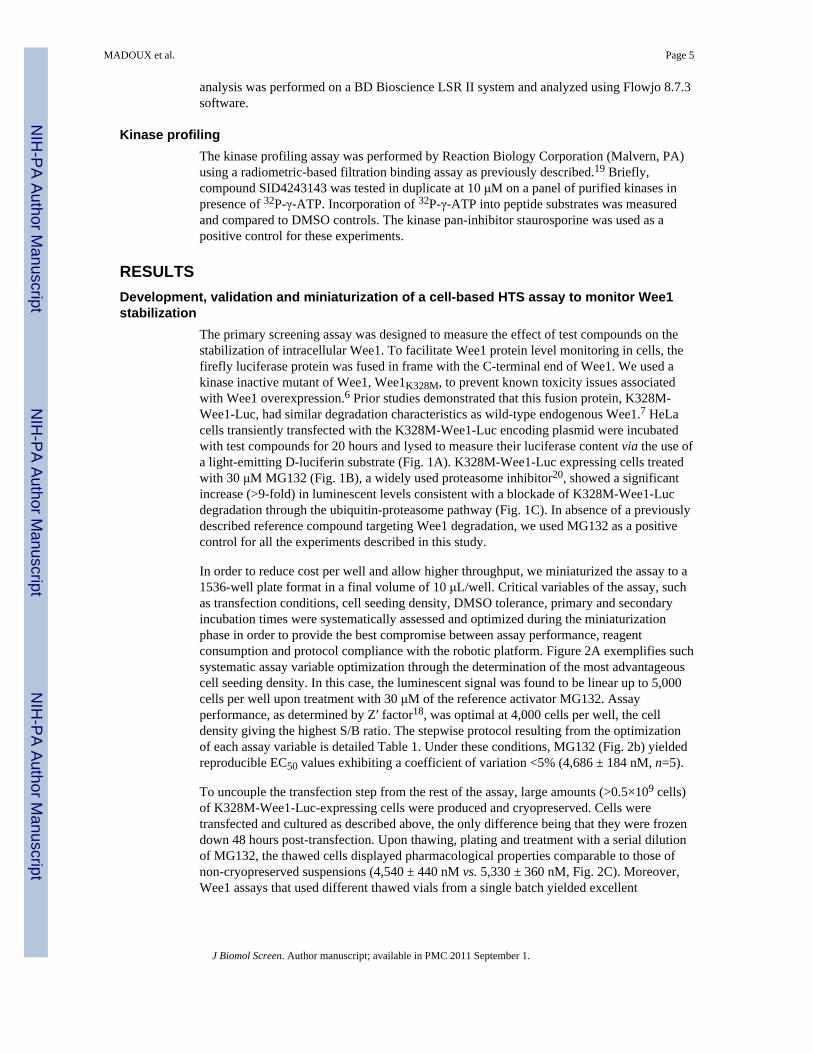
In order to reduce cost per well and allow higher throughput, we miniaturized the assay to a1536-well plate format in a final volume of 10 μL/well. Critical variables of the assay, suchas transfection conditions, cell seeding density, DMSO tolerance, primary and secondaryincubation times were systematically assessed and optimized during the miniaturizationphase in order to provide the best compromise between assay performance, reagentconsumption and protocol compliance with the robotic platform. Figure 2A exemplifies suchsystematic assay variable optimization through the determination of the most advantageouscell seeding density. In this case, the luminescent signal was found to be linear up to 5,000cells per well upon treatment with 30 μM of the reference activator MG132. Assayperformance, as determined by Z′ factor18, was optimal at 4,000 cells per well, the celldensity giving the highest S/B ratio. The stepwise protocol resulting from the optimizationof each assay variable is detailed Table 1. Under these conditions, MG132 (Fig. 2b) yieldedreproducible EC50 values exhibiting a coefficient of variation <5% (4,686 ± 184 nM, n=5).
To uncouple the transfection step from the rest of the assay, large amounts (>0.5×10⁹ cells)of K328M-Wee1-Luc-expressing cells were produced and cryopreserved. Cells weretransfected and cultured as described above, the only difference being that they were frozendown 48 hours post-transfection. Upon thawing, plating and treatment with a serial dilutionof MG132, the thawed cells displayed pharmacological properties comparable to those ofnon-cryopreserved suspensions (4,540 ± 440 nM vs. 5,330 ± 360 nM, Fig. 2C). Moreover,Wee1 assays that used different thawed vials from a single batch yielded excellent
MADOUX et al. Page 5
J Biomol Screen. Author manuscript; available in PMC 2011 September 1.
NIH
-PA Author Manuscript
NIH
-PA Author Manuscript
NIH
-PA Author Manuscript
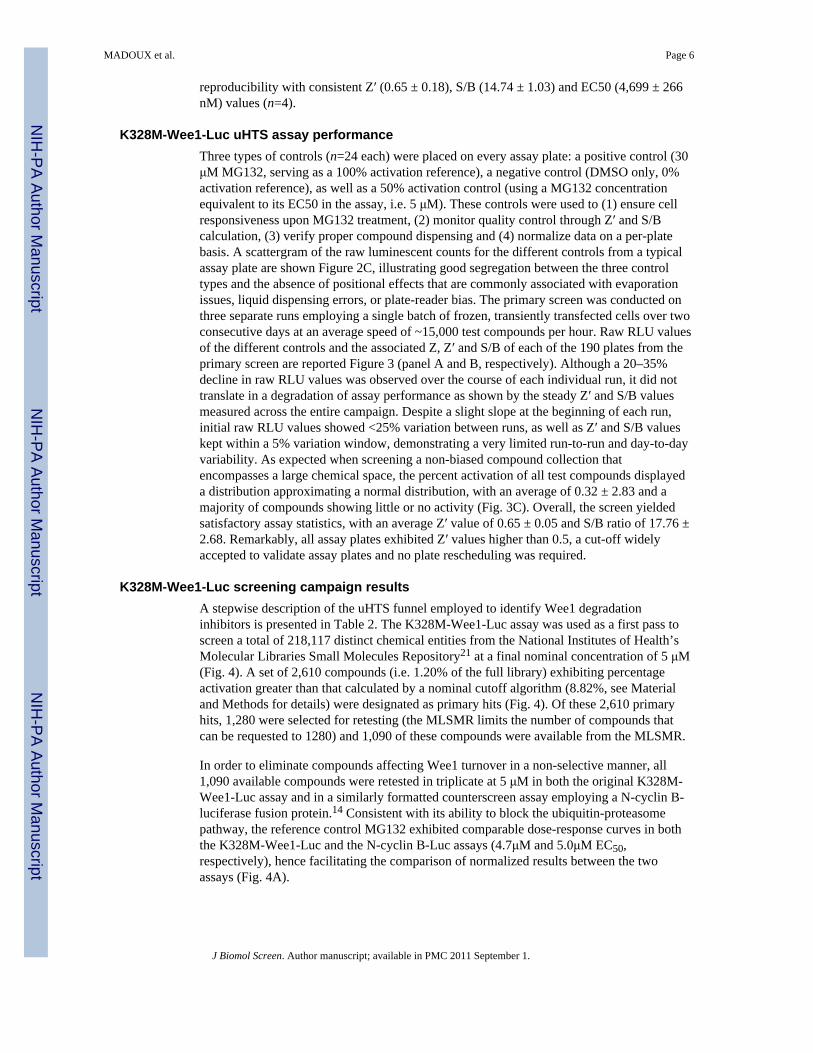
reproducibility with consistent Z′ (0.65 ± 0.18), S/B (14.74 ± 1.03) and EC50 (4,699 ± 266nM) values (n=4).
K328M-Wee1-Luc uHTS assay performanceThree types of controls (n=24 each) were placed on every assay plate: a positive control (30μM MG132, serving as a 100% activation reference), a negative control (DMSO only, 0%activation reference), as well as a 50% activation control (using a MG132 concentrationequivalent to its EC50 in the assay, i.e. 5 μM). These controls were used to (1) ensure cellresponsiveness upon MG132 treatment, (2) monitor quality control through Z′ and S/Bcalculation, (3) verify proper compound dispensing and (4) normalize data on a per-platebasis. A scattergram of the raw luminescent counts for the different controls from a typicalassay plate are shown Figure 2C, illustrating good segregation between the three controltypes and the absence of positional effects that are commonly associated with evaporationissues, liquid dispensing errors, or plate-reader bias. The primary screen was conducted onthree separate runs employing a single batch of frozen, transiently transfected cells over twoconsecutive days at an average speed of ~15,000 test compounds per hour. Raw RLU valuesof the different controls and the associated Z, Z′ and S/B of each of the 190 plates from theprimary screen are reported Figure 3 (panel A and B, respectively). Although a 20–35%decline in raw RLU values was observed over the course of each individual run, it did nottranslate in a degradation of assay performance as shown by the steady Z′ and S/B valuesmeasured across the entire campaign. Despite a slight slope at the beginning of each run,initial raw RLU values showed <25% variation between runs, as well as Z′ and S/B valueskept within a 5% variation window, demonstrating a very limited run-to-run and day-to-dayvariability. As expected when screening a non-biased compound collection thatencompasses a large chemical space, the percent activation of all test compounds displayeda distribution approximating a normal distribution, with an average of 0.32 ± 2.83 and amajority of compounds showing little or no activity (Fig. 3C). Overall, the screen yieldedsatisfactory assay statistics, with an average Z′ value of 0.65 ± 0.05 and S/B ratio of 17.76 ±2.68. Remarkably, all assay plates exhibited Z′ values higher than 0.5, a cut-off widelyaccepted to validate assay plates and no plate rescheduling was required.
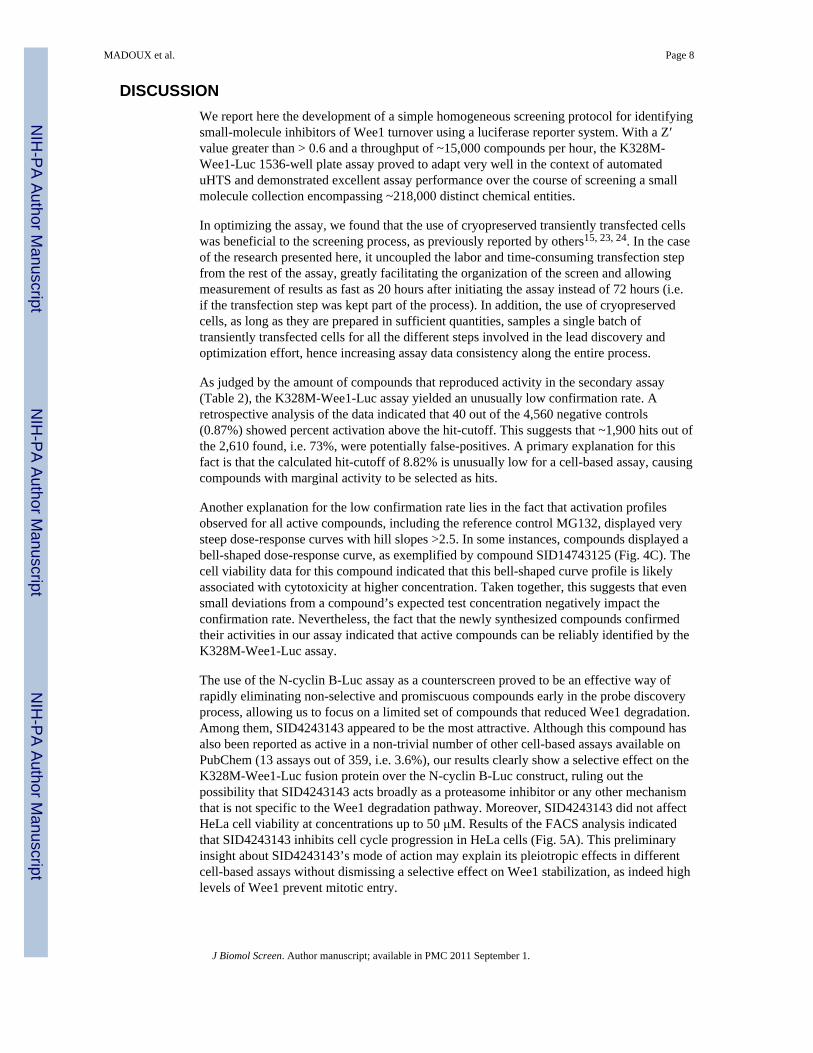
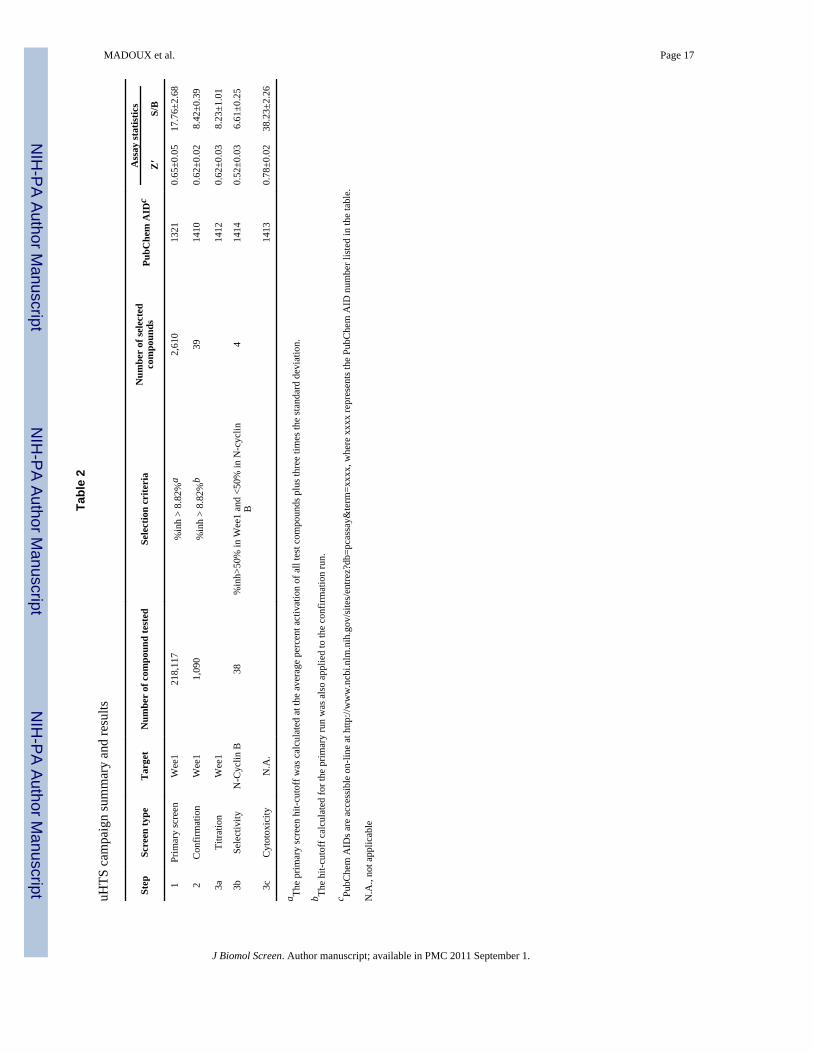
K328M-Wee1-Luc screening campaign resultsA stepwise description of the uHTS funnel employed to identify Wee1 degradationinhibitors is presented in Table 2. The K328M-Wee1-Luc assay was used as a first pass toscreen a total of 218,117 distinct chemical entities from the National Institutes of Health’sMolecular Libraries Small Molecules Repository21 at a final nominal concentration of 5 μM(Fig. 4). A set of 2,610 compounds (i.e. 1.20% of the full library) exhibiting percentageactivation greater than that calculated by a nominal cutoff algorithm (8.82%, see Materialand Methods for details) were designated as primary hits (Fig. 4). Of these 2,610 primaryhits, 1,280 were selected for retesting (the MLSMR limits the number of compounds thatcan be requested to 1280) and 1,090 of these compounds were available from the MLSMR.
In order to eliminate compounds affecting Wee1 turnover in a non-selective manner, all1,090 available compounds were retested in triplicate at 5 μM in both the original K328M-Wee1-Luc assay and in a similarly formatted counterscreen assay employing a N-cyclin B-luciferase fusion protein.14 Consistent with its ability to block the ubiquitin-proteasomepathway, the reference control MG132 exhibited comparable dose-response curves in boththe K328M-Wee1-Luc and the N-cyclin B-Luc assays (4.7μM and 5.0μM EC50,respectively), hence facilitating the comparison of normalized results between the twoassays (Fig. 4A).
MADOUX et al. Page 6
J Biomol Screen. Author manuscript; available in PMC 2011 September 1.
NIH
-PA Author Manuscript
NIH
-PA Author Manuscript
NIH
-PA Author Manuscript
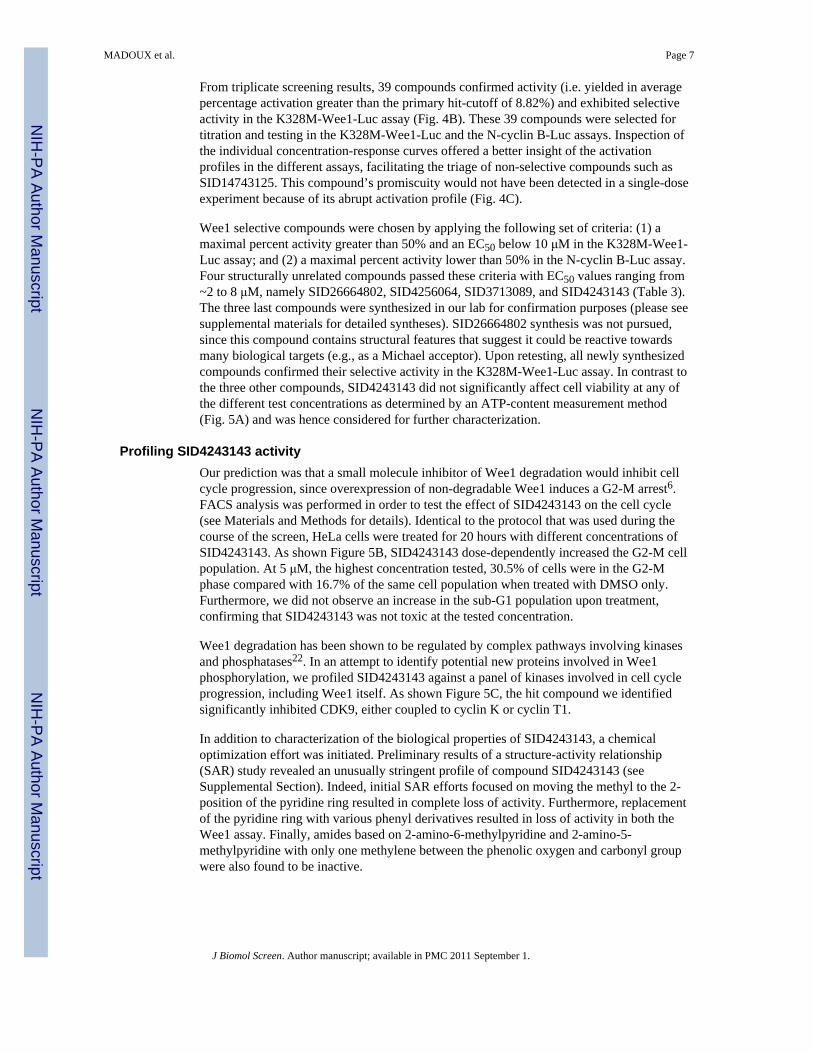
From triplicate screening results, 39 compounds confirmed activity (i.e. yielded in averagepercentage activation greater than the primary hit-cutoff of 8.82%) and exhibited selectiveactivity in the K328M-Wee1-Luc assay (Fig. 4B). These 39 compounds were selected fortitration and testing in the K328M-Wee1-Luc and the N-cyclin B-Luc assays. Inspection ofthe individual concentration-response curves offered a better insight of the activationprofiles in the different assays, facilitating the triage of non-selective compounds such asSID14743125. This compound’s promiscuity would not have been detected in a single-doseexperiment because of its abrupt activation profile (Fig. 4C).
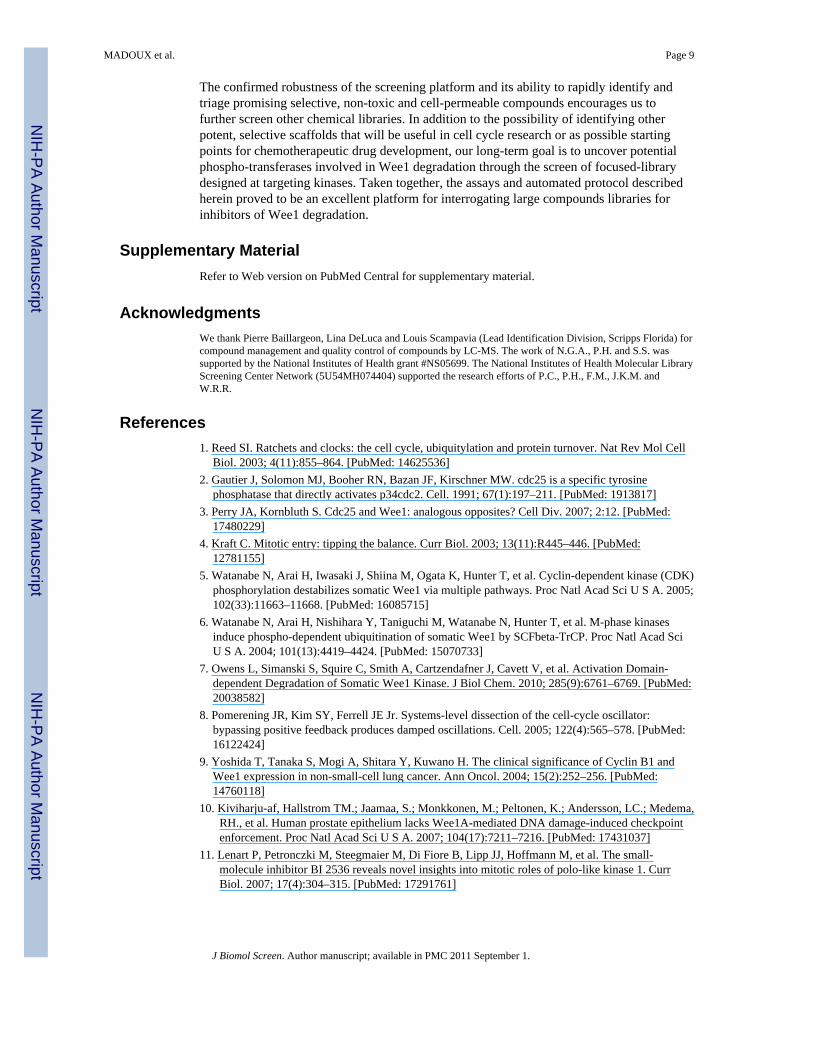
Wee1 selective compounds were chosen by applying the following set of criteria: (1) amaximal percent activity greater than 50% and an EC50 below 10 μM in the K328M-Wee1-Luc assay; and (2) a maximal percent activity lower than 50% in the N-cyclin B-Luc assay.Four structurally unrelated compounds passed these criteria with EC50 values ranging from~2 to 8 μM, namely SID26664802, SID4256064, SID3713089, and SID4243143 (Table 3).The three last compounds were synthesized in our lab for confirmation purposes (please seesupplemental materials for detailed syntheses). SID26664802 synthesis was not pursued,since this compound contains structural features that suggest it could be reactive towardsmany biological targets (e.g., as a Michael acceptor). Upon retesting, all newly synthesizedcompounds confirmed their selective activity in the K328M-Wee1-Luc assay. In contrast tothe three other compounds, SID4243143 did not significantly affect cell viability at any ofthe different test concentrations as determined by an ATP-content measurement method(Fig. 5A) and was hence considered for further characterization.
Profiling SID4243143 activityOur prediction was that a small molecule inhibitor of Wee1 degradation would inhibit cellcycle progression, since overexpression of non-degradable Wee1 induces a G2-M arrest6.FACS analysis was performed in order to test the effect of SID4243143 on the cell cycle(see Materials and Methods for details). Identical to the protocol that was used during thecourse of the screen, HeLa cells were treated for 20 hours with different concentrations ofSID4243143. As shown Figure 5B, SID4243143 dose-dependently increased the G2-M cellpopulation. At 5 μM, the highest concentration tested, 30.5% of cells were in the G2-Mphase compared with 16.7% of the same cell population when treated with DMSO only.Furthermore, we did not observe an increase in the sub-G1 population upon treatment,confirming that SID4243143 was not toxic at the tested concentration.
Wee1 degradation has been shown to be regulated by complex pathways involving kinasesand phosphatases22. In an attempt to identify potential new proteins involved in Wee1phosphorylation, we profiled SID4243143 against a panel of kinases involved in cell cycleprogression, including Wee1 itself. As shown Figure 5C, the hit compound we identifiedsignificantly inhibited CDK9, either coupled to cyclin K or cyclin T1.
In addition to characterization of the biological properties of SID4243143, a chemicaloptimization effort was initiated. Preliminary results of a structure-activity relationship(SAR) study revealed an unusually stringent profile of compound SID4243143 (seeSupplemental Section). Indeed, initial SAR efforts focused on moving the methyl to the 2-position of the pyridine ring resulted in complete loss of activity. Furthermore, replacementof the pyridine ring with various phenyl derivatives resulted in loss of activity in both theWee1 assay. Finally, amides based on 2-amino-6-methylpyridine and 2-amino-5-methylpyridine with only one methylene between the phenolic oxygen and carbonyl groupwere also found to be inactive.
MADOUX et al. Page 7
J Biomol Screen. Author manuscript; available in PMC 2011 September 1.
NIH
-PA Author Manuscript
NIH
-PA Author Manuscript
NIH
-PA Author Manuscript
DISCUSSIONWe report here the development of a simple homogeneous screening protocol for identifyingsmall-molecule inhibitors of Wee1 turnover using a luciferase reporter system. With a Z′value greater than > 0.6 and a throughput of ~15,000 compounds per hour, the K328M-Wee1-Luc 1536-well plate assay proved to adapt very well in the context of automateduHTS and demonstrated excellent assay performance over the course of screening a smallmolecule collection encompassing ~218,000 distinct chemical entities.
In optimizing the assay, we found that the use of cryopreserved transiently transfected cellswas beneficial to the screening process, as previously reported by others15, 23, 24. In the caseof the research presented here, it uncoupled the labor and time-consuming transfection stepfrom the rest of the assay, greatly facilitating the organization of the screen and allowingmeasurement of results as fast as 20 hours after initiating the assay instead of 72 hours (i.e.if the transfection step was kept part of the process). In addition, the use of cryopreservedcells, as long as they are prepared in sufficient quantities, samples a single batch oftransiently transfected cells for all the different steps involved in the lead discovery andoptimization effort, hence increasing assay data consistency along the entire process.
As judged by the amount of compounds that reproduced activity in the secondary assay(Table 2), the K328M-Wee1-Luc assay yielded an unusually low confirmation rate. Aretrospective analysis of the data indicated that 40 out of the 4,560 negative controls(0.87%) showed percent activation above the hit-cutoff. This suggests that ~1,900 hits out ofthe 2,610 found, i.e. 73%, were potentially false-positives. A primary explanation for thisfact is that the calculated hit-cutoff of 8.82% is unusually low for a cell-based assay, causingcompounds with marginal activity to be selected as hits.
Another explanation for the low confirmation rate lies in the fact that activation profilesobserved for all active compounds, including the reference control MG132, displayed verysteep dose-response curves with hill slopes >2.5. In some instances, compounds displayed abell-shaped dose-response curve, as exemplified by compound SID14743125 (Fig. 4C). Thecell viability data for this compound indicated that this bell-shaped curve profile is likelyassociated with cytotoxicity at higher concentration. Taken together, this suggests that evensmall deviations from a compound’s expected test concentration negatively impact theconfirmation rate. Nevertheless, the fact that the newly synthesized compounds confirmedtheir activities in our assay indicated that active compounds can be reliably identified by theK328M-Wee1-Luc assay.
The use of the N-cyclin B-Luc assay as a counterscreen proved to be an effective way ofrapidly eliminating non-selective and promiscuous compounds early in the probe discoveryprocess, allowing us to focus on a limited set of compounds that reduced Wee1 degradation.Among them, SID4243143 appeared to be the most attractive. Although this compound hasalso been reported as active in a non-trivial number of other cell-based assays available onPubChem (13 assays out of 359, i.e. 3.6%), our results clearly show a selective effect on theK328M-Wee1-Luc fusion protein over the N-cyclin B-Luc construct, ruling out thepossibility that SID4243143 acts broadly as a proteasome inhibitor or any other mechanismthat is not specific to the Wee1 degradation pathway. Moreover, SID4243143 did not affectHeLa cell viability at concentrations up to 50 μM. Results of the FACS analysis indicatedthat SID4243143 inhibits cell cycle progression in HeLa cells (Fig. 5A). This preliminaryinsight about SID4243143’s mode of action may explain its pleiotropic effects in differentcell-based assays without dismissing a selective effect on Wee1 stabilization, as indeed highlevels of Wee1 prevent mitotic entry.
MADOUX et al. Page 8
J Biomol Screen. Author manuscript; available in PMC 2011 September 1.
NIH
-PA Author Manuscript
NIH
-PA Author Manuscript
NIH
-PA Author Manuscript
The confirmed robustness of the screening platform and its ability to rapidly identify andtriage promising selective, non-toxic and cell-permeable compounds encourages us tofurther screen other chemical libraries. In addition to the possibility of identifying otherpotent, selective scaffolds that will be useful in cell cycle research or as possible startingpoints for chemotherapeutic drug development, our long-term goal is to uncover potentialphospho-transferases involved in Wee1 degradation through the screen of focused-librarydesigned at targeting kinases. Taken together, the assays and automated protocol describedherein proved to be an excellent platform for interrogating large compounds libraries forinhibitors of Wee1 degradation.
Supplementary MaterialRefer to Web version on PubMed Central for supplementary material.
AcknowledgmentsWe thank Pierre Baillargeon, Lina DeLuca and Louis Scampavia (Lead Identification Division, Scripps Florida) forcompound management and quality control of compounds by LC-MS. The work of N.G.A., P.H. and S.S. wassupported by the National Institutes of Health grant #NS05699. The National Institutes of Health Molecular LibraryScreening Center Network (5U54MH074404) supported the research efforts of P.C., P.H., F.M., J.K.M. andW.R.R.
References1. Reed SI. Ratchets and clocks: the cell cycle, ubiquitylation and protein turnover. Nat Rev Mol Cell
Biol. 2003; 4(11):855–864. [PubMed: 14625536]2. Gautier J, Solomon MJ, Booher RN, Bazan JF, Kirschner MW. cdc25 is a specific tyrosine
phosphatase that directly activates p34cdc2. Cell. 1991; 67(1):197–211. [PubMed: 1913817]3. Perry JA, Kornbluth S. Cdc25 and Wee1: analogous opposites? Cell Div. 2007; 2:12. [PubMed:
17480229]4. Kraft C. Mitotic entry: tipping the balance. Curr Biol. 2003; 13(11):R445–446. [PubMed:
12781155]5. Watanabe N, Arai H, Iwasaki J, Shiina M, Ogata K, Hunter T, et al. Cyclin-dependent kinase (CDK)
phosphorylation destabilizes somatic Wee1 via multiple pathways. Proc Natl Acad Sci U S A. 2005;102(33):11663–11668. [PubMed: 16085715]
6. Watanabe N, Arai H, Nishihara Y, Taniguchi M, Watanabe N, Hunter T, et al. M-phase kinasesinduce phospho-dependent ubiquitination of somatic Wee1 by SCFbeta-TrCP. Proc Natl Acad SciU S A. 2004; 101(13):4419–4424. [PubMed: 15070733]
7. Owens L, Simanski S, Squire C, Smith A, Cartzendafner J, Cavett V, et al. Activation Domain-dependent Degradation of Somatic Wee1 Kinase. J Biol Chem. 2010; 285(9):6761–6769. [PubMed:20038582]
8. Pomerening JR, Kim SY, Ferrell JE Jr. Systems-level dissection of the cell-cycle oscillator:bypassing positive feedback produces damped oscillations. Cell. 2005; 122(4):565–578. [PubMed:16122424]
9. Yoshida T, Tanaka S, Mogi A, Shitara Y, Kuwano H. The clinical significance of Cyclin B1 andWee1 expression in non-small-cell lung cancer. Ann Oncol. 2004; 15(2):252–256. [PubMed:14760118]
10. Kiviharju-af, Hallstrom TM.; Jaamaa, S.; Monkkonen, M.; Peltonen, K.; Andersson, LC.; Medema,RH., et al. Human prostate epithelium lacks Wee1A-mediated DNA damage-induced checkpointenforcement. Proc Natl Acad Sci U S A. 2007; 104(17):7211–7216. [PubMed: 17431037]
11. Lenart P, Petronczki M, Steegmaier M, Di Fiore B, Lipp JJ, Hoffmann M, et al. The small-molecule inhibitor BI 2536 reveals novel insights into mitotic roles of polo-like kinase 1. CurrBiol. 2007; 17(4):304–315. [PubMed: 17291761]
MADOUX et al. Page 9
J Biomol Screen. Author manuscript; available in PMC 2011 September 1.
NIH
-PA Author Manuscript
NIH
-PA Author Manuscript
NIH
-PA Author Manuscript
12. Gorgoulis VG, Vassiliou LV, Karakaidos P, Zacharatos P, Kotsinas A, Liloglou T, et al. Activationof the DNA damage checkpoint and genomic instability in human precancerous lesions. Nature.2005; 434(7035):907–913. [PubMed: 15829965]
13. Verma R, Peters NR, D’Onofrio M, Tochtrop GP, Sakamoto KM, Varadan R, et al. Ubistatinsinhibit proteasome-dependent degradation by binding the ubiquitin chain. Science. 2004;306(5693):117–120. [PubMed: 15459393]
14. Harmey D, Smith A, Simanski S, Moussa CZ, Ayad NG. The anaphase promoting complexinduces substrate degradation during neuronal differentiation. J Biol Chem. 2009; 284(7):4317–4323. [PubMed: 19047054]
15. Chen J, Lake MR, Sabet RS, Niforatos W, Pratt SD, Cassar SC, et al. Utility of large-scaletransiently transfected cells for cell-based high-throughput screens to identify transient receptorpotential channel A1 (TRPA1) antagonists. J Biomol Screen. 2007; 12(1):61–69. [PubMed:17099245]
16. Hodder P, Cassaday J, Peltier R, Berry K, Inglese J, Feuston B, et al. Identification of metabotropicglutamate receptor antagonists using an automated high-throughput screening system. AnalBiochem. 2003; 313(2):246–254. [PubMed: 12605861]
17. Madoux F, Li X, Chase P, Zastrow G, Cameron MD, Conkright JJ, et al. Potent, selective and cellpenetrant inhibitors of SF-1 by functional ultra-high-throughput screening. Mol Pharmacol. 2008;73(6):1776–1784. [PubMed: 18334597]
18. Zhang JH, Chung TD, Oldenburg KR. A Simple Statistical Parameter for Use in Evaluation andValidation of High Throughput Screening Assays. J Biomol Screen. 1999; 4(2):67–73. [PubMed:10838414]
19. Ma H, Horiuchi KY, Wang Y, Kucharewicz SA, Diamond SL. Nanoliter homogenous ultra-highthroughput screening microarray for lead discoveries and IC50 profiling. Assay Drug DevTechnol. 2005; 3(2):177–187. [PubMed: 15871692]
20. Lee DH, Goldberg AL. Proteasome inhibitors: valuable new tools for cell biologists. Trends CellBiol. 1998; 8(10):397–403. [PubMed: 9789328]
21. Inglese J, Johnson RL, Simeonov A, Xia M, Zheng W, Austin CP, et al. High-throughput screeningassays for the identification of chemical probes. Nat Chem Biol. 2007; 3(8):466–479. [PubMed:17637779]
22. Watanabe N, Broome M, Hunter T. Regulation of the human WEE1Hu CDK tyrosine 15-kinaseduring the cell cycle. EMBO J. 1995; 14(9):1878–1891. [PubMed: 7743995]
23. Liu J, Chen T, Norris T, Knappenberger K, Huston J, Wood M, et al. A high-throughput functionalassay for characterization of gamma-aminobutyric acid(A) channel modulators usingcryopreserved transiently transfected cells. Assay Drug Dev Technol. 2008; 6(6):781–786.[PubMed: 19090692]
24. Kunapuli P, Zheng W, Weber M, Solly K, Mull R, Platchek M, et al. Application of division arresttechnology to cell-based HTS: comparison with frozen and fresh cells. Assay Drug Dev Technol.2005; 3(1):17–26. [PubMed: 15798392]
MADOUX et al. Page 10
J Biomol Screen. Author manuscript; available in PMC 2011 September 1.
NIH
-PA Author Manuscript
NIH
-PA Author Manuscript
NIH
-PA Author Manuscript
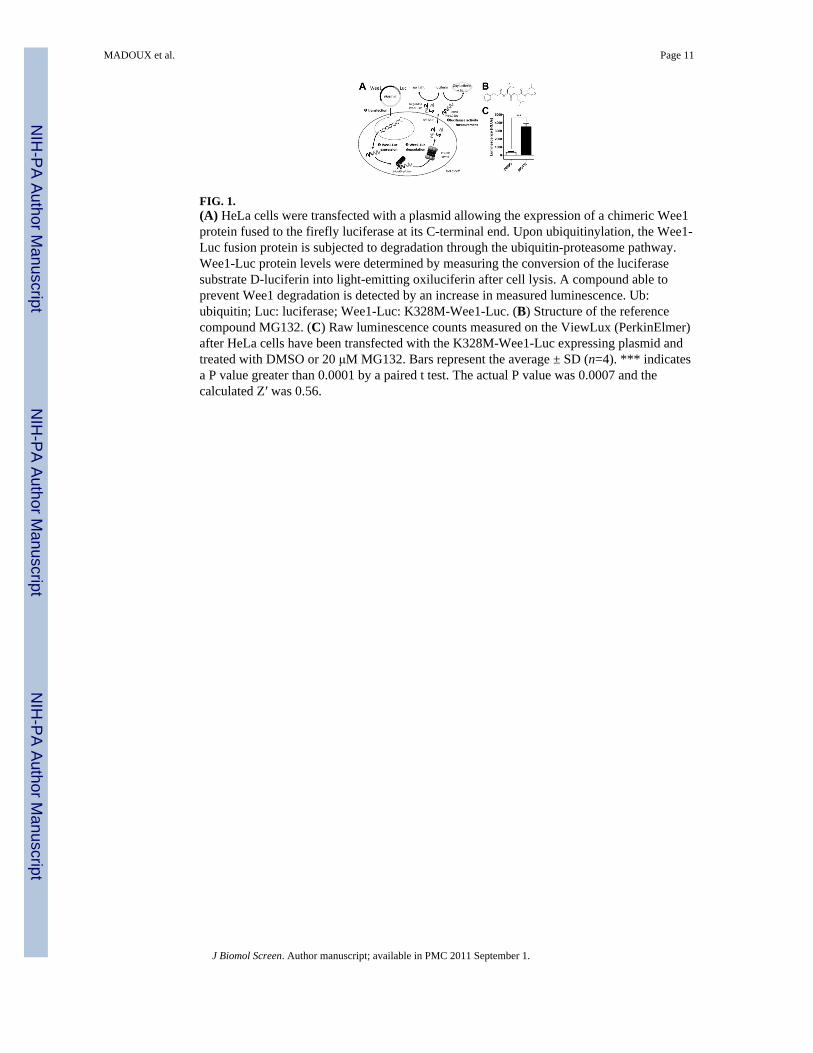
FIG. 1.(A) HeLa cells were transfected with a plasmid allowing the expression of a chimeric Wee1protein fused to the firefly luciferase at its C-terminal end. Upon ubiquitinylation, the Wee1-Luc fusion protein is subjected to degradation through the ubiquitin-proteasome pathway.Wee1-Luc protein levels were determined by measuring the conversion of the luciferasesubstrate D-luciferin into light-emitting oxiluciferin after cell lysis. A compound able toprevent Wee1 degradation is detected by an increase in measured luminescence. Ub:ubiquitin; Luc: luciferase; Wee1-Luc: K328M-Wee1-Luc. (B) Structure of the referencecompound MG132. (C) Raw luminescence counts measured on the ViewLux (PerkinElmer)after HeLa cells have been transfected with the K328M-Wee1-Luc expressing plasmid andtreated with DMSO or 20 μM MG132. Bars represent the average ± SD (n=4). *** indicatesa P value greater than 0.0001 by a paired t test. The actual P value was 0.0007 and thecalculated Z′ was 0.56.
MADOUX et al. Page 11
J Biomol Screen. Author manuscript; available in PMC 2011 September 1.
NIH
-PA Author Manuscript
NIH
-PA Author Manuscript
NIH
-PA Author Manuscript

FIG. 2.Wee1 degradation assay optimization and validation. (A) Cell seeding density optimization.After transfection with the K328M-Wee1-Luc contruct, HeLa cells were seeded at differentdensities ranging from 1,000 to 5,000 cells per well. Cells were either treated with DMSOalone (black bars) or with 30 μM of reference compounds MG132 (grey bars) for 20 hours.Z′ (○) and signal-to-background ratio (□) calculated based on relative luminescence unit(RLU) values between DMSO and MG132-treated cells are shown for each tested celldensity. The star indicates the selected optimal cell density. Error bars represent the S.D. ofeach test condition (n=4). (B) Concentration-dependent activation of the K328M-Wee1-Lucreporter upon MG132 treatment in HeLa cells. Results in 1536-well plate format protocolusing non-frozen cells (○) or frozen cells (●). Twenty-five nanoliters of a 10-point, 3:2 serialdilution starting at 30 μM were dispensed into an assay plate using a PinTool. Each datapoint is mean ± S.D. (n=16). The calculated EC50 was 4.54 ± 0.44 μM. (C) Scatter diagramof the controls of a representative 1536-well screening plate. Each plate contains threedifferent controls: wells treated with DMSO only, noted as Low Controls (▼), wellsreceiving 30 μM of the reference compound MG132 (▲) and wells receiving aconcentration of MG132 equivalent to its EC50, i.e. 5 μM (●). The calculated signal-to-background ratio was 15.53 and the Z′ factor 0.71. Solid lines represent the averageluminescence value for each control type and the dashed lines the associated 95% predictioninterval. Note the absence of overlap between the prediction intervals for all three controltypes.
MADOUX et al. Page 12
J Biomol Screen. Author manuscript; available in PMC 2011 September 1.
NIH
-PA Author Manuscript
NIH
-PA Author Manuscript
NIH
-PA Author Manuscript

FIG. 3.Wee1-Luc primary uHTS campaign performance.(A) Scatter plot of the raw RLU values of intra-plate controls during the K328M-Wee1-Lucprimary screen. One hundred and ninety 1536-well plates were run on the automated roboticplatform of the Scripps Research Institute Molecular Screening Center. Plates were run inthree separate batches noted Run #1, 2 and 3. Designated control wells on each platereceived either 30 μM MG132 (High Control, △), 3 μM MG132 (Medium Control, □) orDMSO only (Low Control, ▽). (B) Scatter plot of the calculated Z, Z′ and S/B values of theK328M-Wee1-Luc primary screen. Low and High Control wells raw values were used tocalculate the signal-to-background ratio (◆, right Y-axis) and the Z′ value (○, left Y-axis).Z values (●, left Y-axis) were calculated in reference to High Control wells and wells withinthe sample field of the assay plate. The low Z values observed at the beginning and at theend of each run are typical of the use of a concentration-response control plate. Indeed, eachrun was starting and finishing with a series of three control plates, respectively a first platecontaining DMSO only in the sample field, a second one containing a 10-point, 3:2 serialdilution of MG132 starting at 30 μM a third plate identical to the first one to check for carry-over. (C) Scatter plot of the normalized percent activation of test compounds (n=218,180, 5μM test concentration). The dashed grey line represents the hit-cutoff, which was calculatedat 8.82% activation. Selected hits correspond to test compounds located above the dashedline.
MADOUX et al. Page 13
J Biomol Screen. Author manuscript; available in PMC 2011 September 1.
NIH
-PA Author Manuscript
NIH
-PA Author Manuscript
NIH
-PA Author Manuscript
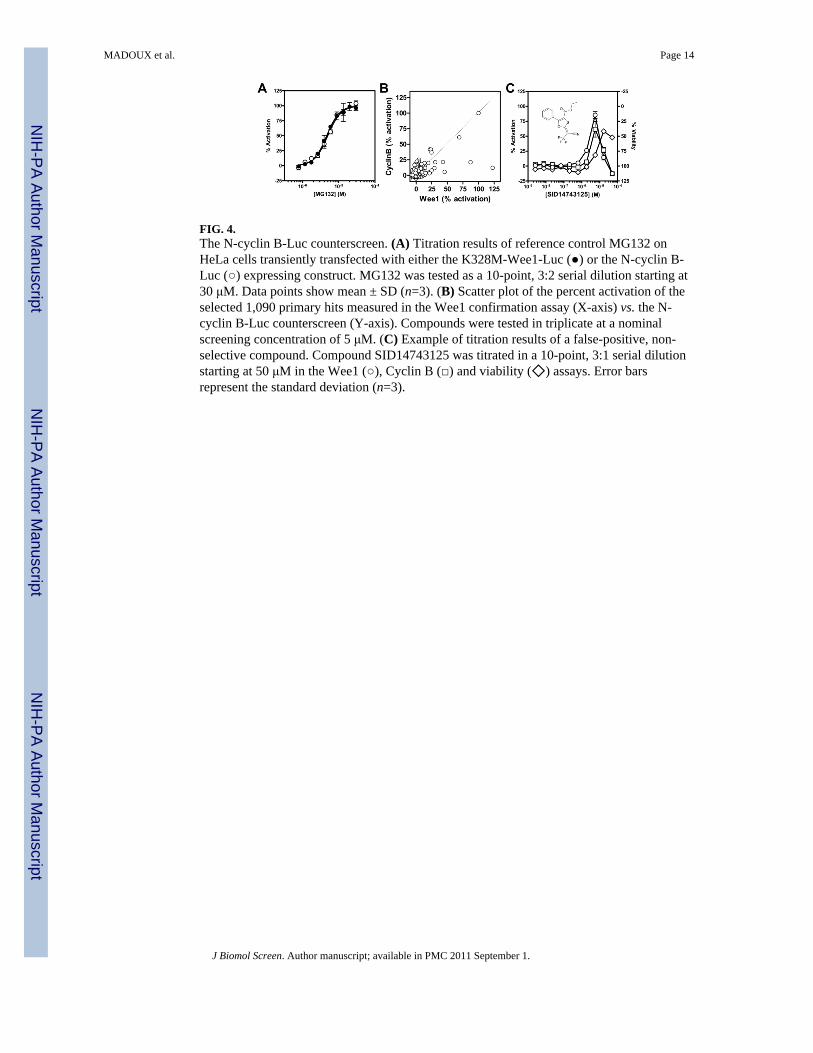
FIG. 4.The N-cyclin B-Luc counterscreen. (A) Titration results of reference control MG132 onHeLa cells transiently transfected with either the K328M-Wee1-Luc (●) or the N-cyclin B-Luc (○) expressing construct. MG132 was tested as a 10-point, 3:2 serial dilution starting at30 μM. Data points show mean ± SD (n=3). (B) Scatter plot of the percent activation of theselected 1,090 primary hits measured in the Wee1 confirmation assay (X-axis) vs. the N-cyclin B-Luc counterscreen (Y-axis). Compounds were tested in triplicate at a nominalscreening concentration of 5 μM. (C) Example of titration results of a false-positive, non-selective compound. Compound SID14743125 was titrated in a 10-point, 3:1 serial dilutionstarting at 50 μM in the Wee1 (○), Cyclin B (□) and viability (◇) assays. Error barsrepresent the standard deviation (n=3).
MADOUX et al. Page 14
J Biomol Screen. Author manuscript; available in PMC 2011 September 1.
NIH
-PA Author Manuscript
NIH
-PA Author Manuscript
NIH
-PA Author Manuscript

FIG. 5. Characterization of SID4243143(A) Titration results of SID4243143 in the Wee1 (○), N-cyclin B (□) and viability (◇)assays. Note the limited cytotoxicity and activity in the N-cyclin-B assay at higher testconcentrations. Data points represent mean ± SD (n=3). (B) FACS analysis on HeLa cellstreated for 20 hours with various concentrations of SID4243143 or DMSO alone. Note thedose-dependent increase in the G2/M population. (C) Profiling of SID4243143 against apanel of mitotic kinases. Black bars indicate activities lower than the average of activitiesmeasured for all kinases minus three times their standard deviation. Error bars represent thestandard deviation (n=2).
MADOUX et al. Page 15
J Biomol Screen. Author manuscript; available in PMC 2011 September 1.
NIH
-PA Author Manuscript
NIH
-PA Author Manuscript
NIH
-PA Author Manuscript

NIH
-PA Author Manuscript
NIH
-PA Author Manuscript
NIH
-PA Author Manuscript
MADOUX et al. Page 16
Table 1
Wee1 degradation assay protocol in 1,536 well plate format
Order Step Condition Comments
1 Cell dispensing 5 μL/well 4,000 cells/well
2 Primary incubation time 4 hours 37°C, 95% R.H., 5% CO2
3 Compound addition 25 nL/well Test concentration: 5 μMFinal DMSO concentration: 0.5%
4 Secondary incubation time 20 hours 37°C, 95% R.H., 5% CO2
5 Luciferase detection reagent addition 5 μL/well
6 Tertiary incubation 15 min Room temperature
7 Luminescence acquisition 60 s/plate
J Biomol Screen. Author manuscript; available in PMC 2011 September 1.
NIH
-PA Author Manuscript
NIH
-PA Author Manuscript
NIH
-PA Author Manuscript
MADOUX et al. Page 17
Tabl
e 2
uHTS
cam
paig
n su
mm
ary
and
resu
lts
Step
Scre
en ty
peT
arge
tN
umbe
r of
com
poun
d te
sted
Sele
ctio
n cr
iteri
aN
umbe
r of
sele
cted
com
poun
dsPu
bChe
m A
IDc
Ass
ay st
atis
tics
Z′
S/B
1Pr
imar
y sc
reen
Wee
121
8,11
7%
inh
> 8.
82%
a2,
610
1321
0.65
±0.0
517
.76±
2.68
2C
onfir
mat
ion
Wee
11,
090
%in
h >
8.82
%b
3914
100.
62±0
.02
8.42
±0.3
9
3aTi
tratio
nW
ee1
1412
0.62
±0.0
38.
23±1
.01
3bSe
lect
ivity
N-C
yclin
B38
%in
h>50
% in
Wee
1 an
d <5
0% in
N-c
yclin
B4
1414
0.52
±0.0
36.
61±0
.25
3cC
ytot
oxic
ityN
.A.
1413
0.78
±0.0
238
.23±
2.26
a The
prim
ary
scre
en h
it-cu
toff
was
cal
cula
ted
at th
e av
erag
e pe
rcen
t act
ivat
ion
of a
ll te
st c
ompo
unds
plu
s thr
ee ti
mes
the
stan
dard
dev
iatio
n.
b The
hit-c
utof
f cal
cula
ted
for t
he p
rimar
y ru
n w
as a
lso
appl
ied
to th
e co
nfirm
atio
n ru
n.
c PubC
hem
AID
s are
acc
essi
ble
on-li
ne a
t http
://w
ww
.ncb
i.nlm
.nih
.gov
/site
s/en
trez?
db=p
cass
ay&
term
=xxx
x, w
here
xxx
x re
pres
ents
the
PubC
hem
AID
num
ber l
iste
d in
the
tabl
e.
N.A
., no
t app
licab
le
J Biomol Screen. Author manuscript; available in PMC 2011 September 1.

NIH
-PA Author Manuscript
NIH
-PA Author Manuscript
NIH
-PA Author Manuscript
MADOUX et al. Page 18
Tabl
e 3
Act
ivity
pro
file
of se
lect
ive
K32
8M-W
ee1-
Luc
degr
adat
ion
inhi
bito
rs
Com
poun
dSt
ruct
ure
K32
8M-W
ee1-
Luc
ass
ayN
-cyc
lin B
-Luc
ass
ayC
ytot
ox
EC
50M
ax a
ct.
EC
50M
ax a
ct.
EC
50M
ax c
ytot
ox.
μM%
μM%
μM%
SID
4243
143
7.9
113
± 3
>50
5 ±
2>5
012
± 4
SID
3713
089
2.3
166
± 19
>50
34 ±
7>5
035
± 2
SID
4256
064
5.9
157
± 17
>50
39 ±
8>5
010
± 2
SID
2666
4802
>1,8
0083
± 1
8>5
036
± 1
4>5
025
± 4
J Biomol Screen. Author manuscript; available in PMC 2011 September 1.