Petrochemical fields and trends
36
Cfeochimica et Cosmochimica Acta, 1958.Vol. 13, pp. 87 to 122. Pergamon Press Ltd., London Petrochemical fields and trends JACK GREEN* and ARIE POLDERVAART~ Abstract-Average compositions of igneous, sedimentary, and metamorphic rocks, and of stony meteorites have been recalculated to ionic weight per cent and plotted on diagrams with variables Al, total Fe, Mg, Ca and combined alkalis. Igneous rocks show a definite trend, indicating that in their formation fractionation predominates over processes which are only locally operative. Na/K ratios show wide scatter, indicating predominance of locally operative processes in sodic versus potassic variations. Normal and preponderant sediments fall in a well-defined field. NalK ratios scatter about a mode of 0.54. Na/K &ids in igneous rocks, sediments, and sea-water are used in argument against the deri- vation of sediments from predominantly mafic source rocks. Storage of Ca near the earth’s surface is indicated by the sedimentary averages. Metamorphic variations from argillite to granitic gneiss indicate addition of alkalis and calcium, with subtraction of iron and magnesium. Low-temperature changes are distinguished from high- temperature metasomatism which grades into formation of granite magma. Data on stony meteorites are also briefly presented. Variations in composition of different types of stony meteorites can be attributed to oxidation-reduction and fractionation by partial melting, both generally operative processes. FIVE years ago the writers started a programme to review the chemistry of major elements in the earth’s crust, especially to determine what evidence can be used in the elusive puzzles of crustal evolution and development of oceans and continents. Four papers have so far appeared (GREEN, 1953, 1955; GREEN and POLDERVAART, 1955; POLDERVAART, 1955) concerned chiefly with estimates of average compositions of rocks and abundance data of major elements. Publi- cation of NOCKOLDS’ reviews of the chemistry of igneous rocks (NOCKOLDS, 1954; NOCKOLDS and ALLEN, 1953; 1954) has greatly helped and accelerated this programme. In this paper an attempt is made to define a common chemical trend for the progression from mafic to silicic igneous rocks, a field of normal and preponderant sediments, and a trend for the common metamorphic series from argillite to granitic gneiss by progressive feldspathization. Certain assumptions are implicit in these attempts. The treatment is in keeping with an overall dynamic concept of evolution, but it does not necessarily follow that members of a series for which a generalized trend is constructed have evolved from one another. The quality of the data used varies considerably. For igneous rocks a large number of averages is available, mostly computed by DALY (1933) and NOCKOLDS (1954). NOCKOLDS’ averages represent more closely defined rock types and are probably superior to those calculated by DALY. The averages include common rock types as well as igneous rocks sparsely distributed in the earth’s crust. Data for sedimentary and metamorphic rocks do not compare with those for igneous rocks; they are few in number and generally less closely defined. For stony meteorites the writers have used the compilations of UREY and CRAIG (1953) and * California Research Corporation, La Habra, California. t Department of Geology, Columbia University, New York, N.Y. 87
-
Upload
independent -
Category
Documents
-
view
0 -
download
0
Transcript of Petrochemical fields and trends

Cfeochimica et Cosmochimica Acta, 1958. Vol. 13, pp. 87 to 122. Pergamon Press Ltd., London
Petrochemical fields and trends
JACK GREEN* and ARIE POLDERVAART~
Abstract-Average compositions of igneous, sedimentary, and metamorphic rocks, and of stony meteorites have been recalculated to ionic weight per cent and plotted on diagrams with variables Al, total Fe, Mg, Ca and combined alkalis.
Igneous rocks show a definite trend, indicating that in their formation fractionation predominates over processes which are only locally operative. Na/K ratios show wide scatter, indicating predominance of locally operative processes in sodic versus potassic variations.
Normal and preponderant sediments fall in a well-defined field. NalK ratios scatter about a mode of 0.54. Na/K &ids in igneous rocks, sediments, and sea-water are used in argument against the deri- vation of sediments from predominantly mafic source rocks. Storage of Ca near the earth’s surface is indicated by the sedimentary averages.
Metamorphic variations from argillite to granitic gneiss indicate addition of alkalis and calcium, with subtraction of iron and magnesium. Low-temperature changes are distinguished from high- temperature metasomatism which grades into formation of granite magma.
Data on stony meteorites are also briefly presented. Variations in composition of different types of stony meteorites can be attributed to oxidation-reduction and fractionation by partial melting, both generally operative processes.
FIVE years ago the writers started a programme to review the chemistry of major elements in the earth’s crust, especially to determine what evidence can be used in the elusive puzzles of crustal evolution and development of oceans and continents. Four papers have so far appeared (GREEN, 1953, 1955; GREEN and POLDERVAART, 1955; POLDERVAART, 1955) concerned chiefly with estimates of average compositions of rocks and abundance data of major elements. Publi- cation of NOCKOLDS’ reviews of the chemistry of igneous rocks (NOCKOLDS, 1954;
NOCKOLDS and ALLEN, 1953; 1954) has greatly helped and accelerated this programme.
In this paper an attempt is made to define a common chemical trend for the progression from mafic to silicic igneous rocks, a field of normal and preponderant sediments, and a trend for the common metamorphic series from argillite to granitic gneiss by progressive feldspathization. Certain assumptions are implicit in these attempts. The treatment is in keeping with an overall dynamic concept of evolution, but it does not necessarily follow that members of a series for which a generalized trend is constructed have evolved from one another.
The quality of the data used varies considerably. For igneous rocks a large number of averages is available, mostly computed by DALY (1933) and NOCKOLDS
(1954). NOCKOLDS’ averages represent more closely defined rock types and are probably superior to those calculated by DALY. The averages include common rock types as well as igneous rocks sparsely distributed in the earth’s crust. Data for sedimentary and metamorphic rocks do not compare with those for igneous rocks; they are few in number and generally less closely defined. For stony meteorites the writers have used the compilations of UREY and CRAIG (1953) and
* California Research Corporation, La Habra, California. t Department of Geology, Columbia University, New York, N.Y.
87

JACK GREEN and ARIE POLDERVAART
WIIK (1956). No attempt is made to qualify the data’ in the figures, but inter- pretations based in the diagrams are warranted in terms of both distribution of all data used and distribution of data for common rock types.
IGNEOUS ROCKS
All igneous rocks have crystallized from magma. There is close agreement between the effects of fractionation of artificial melts and observed differentiation in igneous bodies (BOWEN, 1954). Hence it seems likely that fractionation is the most important single process in producing the diversity of igneous rocks. Fractionation is a generally operative process which affects all magmas in the same manner (though not to the same extent), irrespective of geologic time, geographic location or position in the earth’s crust.* Superimposed on this common pattern of igneous differentiation are the effects of locally operative processes which vary with depth, amounts of water and other fluxes in different magmas, shape and size of igneous bodies, and nature of country rocks surrounding these bodies.
The existence of a compositional trend common to igneous rocks indicates that the combined effects of locally operative processes are small relative to those of fractionation. Conversely, the scatter of points in chemical diagrams furnishes indications of the respective roles played by fractionation and locally operative processes in the formation of igneous rocks. Some constituents may be more sensitive to the latter processes, while others may show the effects of the former process more clearly. A series of diagrams showing variations of different con- stituents of igneous rocks may therefore exhibit different degrees of scatter of points which in themselves are significant.
A common igneous trend of evolution has meaning only for the progression from mafic to felsic rocks. Ultramafic averages are also shown on the diagrams but the trend is not extended to the ultramafic rocks. In the mantle, magma is formed by partial melting. Migration of this magma into the crust results in the residual material of the mantle becoming yet more ultramafic. A regressive series for the mantle that may be suggested is stony meteorite-peridotite-dunite. These averages are indicated in Fig. 4. The trend direction in the mantle is necessarily different from that of the crustal series from mafic to felsic rocks. Ultramafic crystal accumulates are formed in the crust by gravity differentiation. The effects show a strong dependence on size, shape, and depth of the intrusives.
Fractional crystallization of ferromagnesian minerals results in iron enrichment of residual magmas, while fractionation of feldspars results in alkali enrichment. The effects of these two competing trends are most clearly shown on a type of diagram suggested by SIMPSON (1954), modified by the writers to ionic weight per cent.
Fig. 1 shows the result of plotting 201 averages of igneous rocks on this diagram. (See Table 1 and its index.) Between mafic and felsic rocks the averages fall along a reasonably well-defined zone which spreads in the ultramafic rocks. At the felsic end the zone appears to curve toward the right to include averages of
*At depths exceeding 100 km the effects of fractional crystallization or partial melting may be entirely different (cf. VERHOOOEN, 1954), but this affects the mantle rather than the crust.
88

Petrochemical fields and trends
Index NQ.
1 2 3 4 5 6
7 8
9 10 11 12
13
14 15 16
17 18 19
20 21
22
23 24 25
26
27 28
29 30
31 32 33 34 35 36
37 38
39 40
41 42 43 44 45 46 47 48
49 50
si Ti Al
12.3 16-3 16.6
17-7 17.8 18.2 18.3 IL&X-6
18‘6 18-7 18.8
18.9 18-9
19.0 19.2 19.4
19-5 19-5 19.6
19-9 19-9 20-l
20-I 20.2 20-2 20-2
20.3
20.3 20.5 20.6
20.6 20.6 20.6 20-6 20-7
20.7 20.9 21.0
21.1 21-t 21.3 21.4
21.5 21-6
21.6 21.6 21-6 21.9 21.9 22.0
3.6 l-8 O-0 2-O 2-f 0.8
l-1
2.4 1.2
i-9 1-7
o-1 1.9 l-8
2.4 l-5
1.2 74 0.8 44
6-O 2.3 3.3 6.9
3.0 7.3 4*4
0.5 7.1
6-l 7.3
ll”0
0*5 3.9 4.0
6.1 6-6 8.9
9-9 5.2 3-o
8.0 2-2
14.8
2-l
4.8 7.2 3.3 5.5 4.0 7.9 8.0 1.5
9.4 2.3 6-O 8.3 4.5
12-3 7-a 9-Q 7-4 8.9 7.9 9.3 8*0
Table I. Averts of igneous rocks -
-
Feat Fee+
-
i
9.2 4.3
O-0 3.7 3=7 4-o 4.9 6.2
5.7
5.6 4.7 1-3
3-8 3-4 4.7
2.7 2-o 4-8 3-l
3-7 4.6
3-4 2*8
3.9 l-9 2.9 l-5
1.8 l-8 2.4
l-6 3-2 3.6 3.9 3-l 2.6
O-6 2.6
3-2
3-4 3-o
3.6 4.6 2.2
2.8 3.9 2-l 3-l 3.9 2=6
22.4 3.5
29-7 5.7 5.3 3.6
3.7 5-O
2-9 2.8
3.5 9.3 5.8 6-O
5.6 4.0
4-P 6.1 7.4 8-l
3.4 4.6
3-3 7-2
7.8 4.1
74 l-5
7.7 7-4
7-z 6.8 4.6 4*5 6-l
6-2 5.8
5-s 6.3 3.4
5-2 6.1
1.6 6-8 3.4 4.1 6.5 6.0 3.1 6-3
Mg
13.3
4.0 13.4
10.0 8=3
21.0 5-o
3.8 17=6
5.1 9-L
26-Z 5.5 8-1 5-l 2.2
28-8
7‘9 15-3
7.6
3.3 2-7
2-o 12-6
18-9
Q-2 22&l
0.4 20.7 12.0
12-o 13.7
8.4
8.7 5.7 4.1
25-O
2-3 11.5
5.2
4.5 10.3
0.3 5.7 3.1 5-O 3-5 4.7 3.9 4*8
Ca
04 15.4
1.0
11*9 10-7
54
2l*l 10-3
5-3 11.5 11-2
0.5 9.5 9‘4 9.5
7.3 O-5
12-2
5.3 8.2
12-l 7-7
8.2 6.0
3.5 10.0
2.1
3.2 2.5 6.6
5.9 7.3 7-7
11.2 8.9
8-7
1‘8 6-l
12-l 14.4
7-5 8.7
o-7 7.7
7*8 7.2 7.5 7.6 7.1 7.8
K
O-1 2.4 tr 1.2 1.1
1-o 0.2 l-7 2-2
2-l 3-5
O-1
2.7 1.2 l-4 2-5
O-6 o-5 0.7
2.3 4-3 2-l
o-3 o-4
o-3 O-1
3-2 o-2 0.6
o-5 O-6 3-P
2.3 O-8 I.3
P
tr 0.8 0.0 o-4
o-5 0.4 0.2
0.3
o-3 0.2 0.3
0.0
0.3 0.3 o-4
o-2 o-0 o-3 O-2
0.1 0.6 o-3 0.7 0.1
0.0 0.0
0‘0 0=2 0.0 0.1
o-1 0-L o-3
0.3 o-2
O-2
0.4
O*O O-2
0.1 0.0 0.2 O-2
O-4 o-1 o-2 o-3 O-1
-
1
0
36.9 40-G
37-7 41.2
41-5 42.9 40.3 41,s
42.8 41.8 41.6
42.7
41”8 42.1
42.1 42.6 44-o 41*5
42.8 42.3 41*7 42-l
42.6 42.9
43.1
43.7 43.6
43.6 43.4 43.0 43-4 42-7 42.7 42.4 43.1
42.8 44”l
42-6
42*3 42.5
43.2 42.9 43.5
43.4 42.6 43.6 43.2 43.7 44.0 43.7

JACK GREEN and ARIE POLDERVAART
Table l-contimed
Index No.
51 52 53 54 55 56 57 58 59 60 61 62 63 64 65 66 67 68 69 70 71 72 73 74 75 76 77 78 79 80 81 82 83 84 85 86 87 88 89 90 91 92 93 94 95 96 97 98 99
100
-
-
22.0 1.8 22.0 1.0 22.0 0.6 22.0 0.7 22.1 1.3 22.1 1.6 22.1 1.7 22.1 0.9 22.3 1.3 22.3 0.8 22.3 1.5 22.4 1.7 22.5 1.5 22.5 1.0 22.5 1.0 22.6 1.7 22.7 0.9 22.7 1.2 22.8 0.8 22.8 1.1 22.8 1-o 23.0 1.2 23.0 0.5 23.1 0.7 23.2 1.3 23.3 0.4 23.3 0.8 23.4 0.6 23.5 o-1 23.5 0.8 23.6 1.4 23.6 0.5 23.6 0.5 23.6 0.7 23.7 0.3 23.8 0.5 23.8 0.8 23.9 0.7 23.9 1.5 23.9 0.7 24.0 1.2 24.1 0.7 24.1 1.4 24.3 1.6 24.3 0.7 24.4 0.2 24.4 0.9 24.5 1.0 24.7 0.4 24.7 0.8
-r Si Ti Al Fesf I - Fez+
7.8 2.6 6.2 7.5 2.4 2.7 9.3 1.3 6.4 5.5 1.8 3.0 7.9 3.7 3.6 8.4 3.2 5.6 9.1 2.6 4.7 8.6 2.5 4.5
8.9 2.8 5.9 8.4 3.2 3.6 8.9 3.2 4.5 7.8 2.8 6.1 8.6 3.1 5.1 8.6 4.0 4.1 6.3 1.6 7.7 8.5 2,4 5.8 9.2 2.1 6.0 8.3 2.1 6.1 9.0 1.8 6.2 8.3 2.0 6.3 8.3 1.2 3.9 8.8 2.2 6.3 2.4 1.4 3.8 8.0 1.5 3.4 7.5 2.6 7.8 3.7 1.9 7.2 8.5 3.8 5.1 8.9 2.6 5.3
15.4 0.6 1.1 9.8 1.5 3.9 8.7 2.8 4.9 5.9 2.4 4.5 9.4 0.9 5.8 7.0 3.0 4.1 2.2 1.7 5.8
10.2 2.5 2.7 8.3 0.8 7.6 8.3 1.6 5.8
10.7 2.0 3.1 7.2 2.3 3.7 7.5 2.0 7.1 9.6 2.4 4.5 8.9 2.3 5.1 7.0 2.4 7.6 7.9 1.3 5.4 2.4 1.6 5.7 8,8 1.9 5.5 6.8 1.9 5.4
11.9 0.9 0.4 8.3 1.6 5.4
:
Mn
0.1 0.1 0.1 0.0 0.2 0.2 0.1 0.1 0.2 0.2 0.2 0.1 0.2 0.2 0.1 0.1 0.1 0.1 o-1 0.1 0.1 0.2 0.1 0.1 0.2 0.1 0.2 0.2 0.1 0.1 0.2 0.1 0.1 0.3 0.1 0.2 0.2 0.1 0.1 0.1 0.1 o-1 0.1 0.2 0.2 0.1 0.1 0.2 0.0 0.1
90
Wz
4.1 5.0 6.1 8.1 3.0 3.4 3.0 3.8 3.8 3.2 3.1 4.4 3.4 2.1 8.5 3.7 4.5 5.0 4.9 5.2 4.1 4.1 9.3 4.0 4.1
13.8 3.8 2.5 0.5 2.7. 2.7 6.0 5.6 4.3
13.2 1.7 4.2 5.1 1.3 4.9 3.9 3.6 2.6 3.2 4.5
13.0 3.7 4.4 0.1 4.2
-
Ca Na K P 0
8.9 1.9 0.9 0.2 43.5 8.0 l-3 6.8 0.3 42.9 8.2 1.5 0.3 0.1 44.1
10.6 0.7 4.5 0.1 43.0 6.3 4.6 3.6 0.6 43.1 7.1 2.9 1.8 0.3 43.4
6.9 3.8 2.2 0.2 43.6 7.8 1.8 4.5 0.3 43.1 6.5 3.1 1.2 0.2 43.8 8.0 1.5 5.6 0.2 43.0 6.2 4.0 2.2 0.3 43.6 6.8 2.8 1.0 0.2 43.9 6.0 3.4 2.1 0.3 43.8 5.1 5.8 3.0 0.3 43.4 6.7 1.2 0.5 0.1 43.8 6.3 3.0 1.6 0.3 44.0 7.8 1.7 0.5 0.1 44.4 7.6 1.9 0.8 0.1 44.1 8.0 1.7 0.5 0.1 44.1 7.7 1.7 0.6 0.1 44.1 8.8 1.4 4.6 0.2 43.6 6.9 2.3 0.8 0.1 44.1
15.7 0.4 0.3 0.0 43.1 8.5 1.1 5.8 0.2 43.6 6.9 1.9 0.6 0.1 43.8 4.7 0.5 0.1 0.1 44.2 6.5 2.4 1.3 0.2 44.1 7.2 1.9 2.9 0.4 44.0
10.1 2.0 0.4 0.0 46.2 6.0 1.8 5.6 0.2 44-1 6.0 3.2 2.0 0.3 44.2 7.0 1.6 4,4 0.4 43.6 7.0 1.5 0.5 0.1 45.0 6.2 2.2 4.5 0.3 43.8 8.6 0.3 0.2 0.0 43.9 5.7 2.5 5.9 0.2 44.1 7.5 1.6 0.8 0.1 44.3 7.8 l-6 0.5 0.1 44.5 4.4 4.8 3.4 0.2 44.7 6.8 1.7 4.5 0.3 43.9 7.5 1.7 0.7 0.1 44.2 7.2 2.1 0.7 0.1 44.9 5.2 3.6 2.0 0.3 44.4 6.3 2.4 0.9 0.2 43.9 6.1 2.0 3.3 0.2 44.1 7.9 0.4 0.1 0.0 44.2 6.1 2.5 1.1 0.2 44.8 5.9 1.9 3.7 0.3 44.0 1-3 1.1 15.6 0.0 43.6 6.2 2.4 1.2 o-2 44.9

101 102 103 104 105 106 107 108 109 110 111 112 113 114 115 116 117
118 119 120 121
122 123 124 125 126 127 128 129 130 131 132 133 134 135 136 137 138 139
140 141 142
143 144 145 146 147 148 149 150
25-O 25.1 25.1 25‘3 26*3 25-4 25*4 25-5 25.5 25-6 25.6 25.6 25.7 25.7 25.7 25.7 25-7
25.7 25.9 25.9 2&9 26.0 26.0 26.1 26.2 26.3 26.3 26-4 26.4 26.5 26.6 26.7 26.8 26.9 26.9 27.1 27.2 27.4
27.4 274 27.4 2&O 28-X 28.2 28.7 28.9 29.0 29.0 29.0 29-f
1-o 0.7 0.9 O-5 O-6 O-7 o-3 o-7 O-8 1-l O-8 o-1 0.5 o-3 0.9 0.9 O-7
o-5 O-8 o-5 o-9
o-7 0.7 005 o-4 0.5 o-7 o-2 O-8 o-7 o-7 o-9 1.0 0.5 o-4 o-3 O-6 0.7
O-4 o-3 0*8 o-5 O-7 o-5 o-2 o-4 o-3 0.3 o-1 0.4
9.7 8.6
10.3 9-6
10-2 8-3
11-6 9.2 9.6 8-B 9-2 1.2
11.5 13.7 9.2 8-7 9-O
9-O 8.9
10.7 9.5
10.8 S-8
11.3 Il.4 8-8 9.2
11-5 9-O 9.1
11.0 9.4 9.5 8.9
IO*8 12.2 s-9
9*3 9.6
If-1 8.3 9-l 8.3 9-3 . 9.5 9*3 7.8 9.2 9-I 9.0
Fe*
-
1.4 44
1.9 3.6 2-3 2.3 1*8 4.5 f*8 2-3 6.4 1-4: 1-8 3.1 2.7 3.1 2.2 3.6 2.1 5#3 2.5 4.3 O-6 6.7 2.2 1.3
O-6 1.1
2.3 3-6 2.3 4.1 2-3 4.2
2.1 3.7 2-4 4.3 2-4 l-7 2-2 3.9 l-5 1*9
l-8 3.6
l-6 1.8
l-7 1.6
2.2 4.6 2-l 3*9 1.9 1-O 2.6 3.4 2.1 3.2 1.8 l-6
2-o 3.5
1.6 3-3 2.2 3.6
1.6 1.5 O-5 1.9
1.6 3.2
2.8 2.5
X.8 1.6
1.7 CM3 2.4 3.f
l-5 2.2
2.2 3-O 2.4 2-4 1.9 2”l 1*3 2*4 3.2 2*9 2-2 x.4 I-7 3.4 l-6 2.1
2.9 5.5 2-6 2.9 5.5 2.6 l-2 3-9 4*9 3.3 6.0 2-5 1.2 2-5 6-O 0.4 2.9 8.1 O-4 1.9 6.5 2.4 4.9 2.5 2-l 5.1 2.9 1.5 3.6 4.2 2.7 5.7 2*7
18.8 1.2 0.1 o-3 1.7 6-O o-5 6.9 3-5 2-o 4.2 3.6 2-3 4.7 3.1 2-4 5-O 2.8 2-3 4.8 2.6 2-4 4.9 2.6 0.5 l-8 6.2 1.3 3.9 4-3 O-6 2.7 5.7 2-2 4.9 2~6 0.3 1*8 6.3 o-4 L-4 6.6 2-o 4.6 3-l 2.1 4.9 2.7 o-2 I.0 7.5 2-1 5-o 2.7 2-o 4.7 2-s O-4 1.1 6.6 l-2 3.8 3-9 o-9 3.2 4.3 2.5 4.9 2-G O-4 1.4 6-B o-2 0.7 6.5 2.0 4.1 2.7 0.8 3.0 4-3 1-3 3-l 2.9 O-2 1-l 6-7 l-5 4.0 2-6 l-2 2.9 2.9 2-l 3.7 2.9 1.7 4.2 2.7 o-7 2.2 3.3 O-5 1.7 4.2 o-4 1.3 5-O o-3 1.1 5.2 l-7 4.0 2”O O-6 1.8 4-l
1.4 4.0 3.7 0.8 4-8 2-6 3.3 3.7 2.7 2.3 0.9 0.1 5.3 0.9 3.0 2-7 2*3 4-O 2-3 4.6 2.3 4.6 3.9 4-8 4-5 2.5 2.4 4*1 2-2 3.2 4-l 2.6 3.4 l-8 4.6 4.4 3.7 3.1 6-2 4.4 3-s 5.5 2-7 l-7 4.8 5.0 3.9 4.8 l-9 4.9
o-2 45*3 0.2 44.8 0.2 45”l 0-f 45.5 o-3 44*8
I)@ 44*3 O-1 45-6 O-2 45*0 O-2 45.2
0.3 45.1 0.1 45.4
0.0 45.5 O-1 45.3 O-1 46.7 o-2 45.0 o-2 46.2 0.2 46-3 o-2 45.0 0.2 45.2 o-1 45.3 o-3 45*4 0.1 45.3 o-2 45.2 o-1 46.3 o-1 45.6 O-1 45.2 0.2 45*4 O*O 46-O 0‘2 45.5 O-2 45.6 o-0 45-9 0.2 45.6 o-3 45*6 0.1 46-l o-1 45.8
0.0 46-O 0.2 45.8 o-3 4640 O-1 45-5 0-I 46*2 O-2 45.8 0.2 45.9
o-1 46.1 0.1 46*6 o-1 46.4 0-l 46.1 o-1 4549 0.1 46a2 o-1 46-9 O-l 46.2

JACK GREEN and ARIE POLDERVAART
Table I-conhued
Index No.
-
-
Si
-_
151 29.1 152 29.2 153 29.2 154 29.4 155 29.4 156 29.8 157 29.9 158 30.0 159 30.0 160 30.4 161 30.7 162 30.8 163 31.0 164 31.1
165 31.2
166 31.2 167 31.5
168 31.5
169 31.6 170 32.3 171 32.4
172 32.5
173 32.5 174 32.6 175 33.0
176 33.1 177 33.1 178 33.1 179 33.1 180 33.2 181 33.2 182 33.4 183 33.4 184 33.5 185 33.5
186 33.6
187 33.7 188 33.7
189 33.8
190 33.9 191 34.0 192 34.3 193 34.4 194 34.6 195 34.7 196 34.7 197 34.7 198 35.1 199 35.1 200 35.2 201 35.3
-
-
-
Ti
0.4 0.4 0.4 0.8 0.5 0.5 0.4 0.4 0.6 0.3 0.4 0.4 0.5 0.4 0.4 0.4 0.3 0.3 0.4 0.5 0.3 0.3 0.3 0.3 0.3 0.2 0.2 0.2 0.3 0.2 0.2 0.2 0.2 0.6 0.2 0.2
0.2 0.2 0.2 0.3 0.1 0.2 0.2 0.1 0.1 0.1 0.1 0.1 0.1 0.2
Al
-
-
FeS+ Fez+ Mn
9.6 1.6 8.7 1.8 8.4 2.1 8.4 1.1 8.1 1.4 8.7 2.9 8.9 1.6 8.2 2.9 8.3 1.2 8.3 1.5
8.5 1.2 8.3 1.2 8.0 1.2
8.3 1.0
8.7 1.7 8.2 1.5 8.3 0.9 8.3 1.4 6.5 3.0 7.4 1.0 7.7 1.2 8.3 0.8 7.8 0.9 8.0 0.8 7.7 1.2 7.6 0.8 7.7 1.1 8.3 0.4 5.8 4.3 7.5 0.6 8.4 0.6 6.0 3.0 7.6 0.7 6.7 0.6 7.4 1.3 5.2 3.8 7.6 0.8 7.8 0.4 7.9 0.5 7.4 0.6 5.8 2.1 5.6 2.1 7.1 0.6 7.1 1.0 7.3 0.6 7.2 0.9 7.6 0.2 6.7 0.9 7.4 0.4 7.0 0.7 7.0 0.4
-
-
-
-
-
1.2 3.0 2.6 3.4 3.4 1.0 2.4 1.2 3.6 1.9 2.1 2.2 2.1 2.7 1.5 1.8 2.0 1.5 2.4 2.5 1.7 1.6 1.8 2.4 1.2 1.9 1.4 1.7 0.7 1.9 1.1 1.7 1.5 2.8 1.0 2.2 1.6 1.2 1.3 1.3 1.9 2.3 1.1 0.8 0.9 0.6 0.6 0.8 0.7 0.7 0.3
0.1 0.1 0.2 0.1 0.1 0.1 0.1 0.1 0.1
0.1 0.1 0.1 0.1 0.1 0.1 0.1 0.1 0.1 0.0 0.1 0.1 0.1 0.1 0.1 0.0 0.1 0.0 0.1 0.1 0.0 0.1 0.1 0.0 0.1 0.1
0.1 0.0 0.1 0.1 0.2 0.0 0.1 0.0 0.0 0.0 0.0 0.0 0.1 0.1
92
-
Mg
0.4 1.7 1.8 1.7 1.9 1.1 1.3 0.2 1.5 1.5 1.2 1.1 0.8 1.2 0.9 1.0 1.0 0.9 0.2 0.6 0.7 0.7 0.6 0.6 0.4 0.1 0.5 0.4 0.1 0.3 0.5 0.2 0.5 0.2 0.2 0.2 0.5 0.3 0.4 0.3 0.1 0.1 0.3 0.2 0.2 0.2 0.1 0.1 0.2 0.1 0.2
-
-
-
- -
C!a Na K
1.4 4.9 4.6 3.9 2.5 1.8
3.6 2.5 2.2 3.4 2.5 2.2 3.9 2.4 2.2 3.1 2.5 3.2 4.0 3.0 1.2 1.1 5.4 3.9 3.8 2.6 1.0 3.1 2.6 3.1 3.2 2.7 2.3 3.0 2.9 2.5 2.4 2.6 3.9 3.3 2.9 1.2 2.5 3.0 2.3 2.7 3.1 2.5 2.6 2.9 2.6 2.5 2.6 3.1 1.2 4.0 3.7 2.2 2.2 3.4 1.9 2.9 3.2 2.2 2.8 2.6 1.8 2.5 3.8 2.2 3.5 1.2 1.6 2.7 3.8 0.9 3.1 4.3 1.4 2.6 3.4 1.4 3.1 3.0 0.7 4.0 3.4 1.2 2.7 4.5 2.0 3.7 1.4 0.6 3.7 3.5 1.4 2.5 3.9 1.3 2.3 4.2 0.5 4.2 3.3 0.5 3.3 3.4 1.3 2.6 3.6 0.9 2.2 4.6 1.1 2.4 3.9 1.0 2.3 4.6 0.5 3.9 3.7 0.4 3.2 3.7 0.8 2.2 4.6 0.9 2.5 3.9 0.5 2.6 4.3 0.8 2.2 4.5 0.5 2.7 4.4 0.4 3.1 4.0 0.4 2.3 4.3 0.4 2.6 4.2 0.8 2.7 4.0
_- .- -
-
-
P
0.1 0.1 0.1 0.1 0.1 0.1 0.1 0.1 0.1 0.1 0.1 091 0.1 OS1 0.1 0.1 0.1 0.1 0.0 0.1 0.1 0.1 0.1 0.1 0.1 0.0 0.1 0.1 0.0 0.0 0.1 0.0 0.1 0.0 0.0 0.0
0.1 0.1 0.1 0.0 0.0 0.1 0.0 0.1 0.0 0.1 0.0 0.1 0.1 0.0
0
46.6 46.9 46.9 46.9 46.6 47.1 47.1 46.5 47.2 47.2 47.5 47.4 47.3 47.7 47.8 47.4 47.7 47.8 46.9 47.8 47.8 48.0 47.8 48.2 47.9 48.0 48.4 48.3 47.5 47.8 48.8 47.6 48.1 47.8 48.3 47.5 48.3 48.5 48.4 48.2 47.6 48.0 48.6 48.7 48.7 48.8 49.0 48.8 49.0 48.8 48.3

~etrochomio~l fields and trends
INDEX TO TABLE 1
1. 2. 3. 4. 5. 6. 7. 8. 9.
10. 11. 12. 13. 14. 15. 16. 17, 18.
19. 20. 21. 22. 23. 24. 25.
26. 27. 28. 29.
::: 32. 33. 34.
I:: 37‘
38.
39. 40. 41. 42. 43. 44.
45. 46. 47. 48.
49.
50.
51.
52. 53. 54. 55. 56.
Ore dunite (7), NOCKOLDS (1954, p. 1023). Turjaite (5), ibid (p. 1029). Hortonolite dunite (2), ibid (p. 1023). Olivine melilitite (lo), ibid (p. 1029). ~~i~~%-mel~lite nephelinite ( 81, ibid (p. 1029). Basaltic kimberl~te (lo), ibid (F. 1033). ~~~~rn~&h~i~ (21, ibid (p. 1029). N~pbe~~~te [Sf, ibid fp. lO28). Micaceous kimberlite (41, ibid (p. 1023). Melilite nephelinite (3), {bid (p. 1029). Olivine-melilite Ieucitite (5), ibid (p, 1031). Dunite (9), ibid (p. 1023). Oli~ine etindite (7), ibid (p. 1031). 8:: Olivina nephelinite (21), ibid (p, 1028). TitansLugite melteigite (3), ibid (p+ 102s). 69. Tit~~~~gite ijolite (3), ibid (p. 1028). 70. ~~~~~ flO}$ DALY (1933, p. 20). Alka.Ii pyroxenite f21), ~o~Ko~~s (1954, 7X. p. 1022). 72. Alkali peridot&e (22}, ibid (p. 1023). Hornblendite (151, ibid (p, 102%). 73. Melteigite (9), ibid (p. 1028). 74. Etiadite (6), ibid (p. 1031). Tjolite (ll), ibid (p. 1028). ;:: Picritu (14), DALY (1933, p. 19). Hornblende peridotite (5), NocKo~ns (1954, p. 1023). Z* Aribgite (91, ibid (p. 1022). 79: Pyroxene ~eridot~te (II), ~~~ (p_ lO23). Urtite (6), ibid (p. 1028). SO. ~$r~~~~~e (23), ibid fp. 1023). Otivine-rich alkali basalt (31), ibid {p. 1021). :X: Trootolite (9), ibid (p. 1020). Ul~rnnzafic igneous PO&S (182), ibid (p. 1032). 83. Olivine leucitite (ll), ibid (p_ 1031). 84. Biotite pyroxenite (17), ibid (p_ 1022). 85. Alkali gabbro (42), ibid (p. 1020). 86. Bekinkinite (4), ibid (p. 102&). ~~~~~t~t~ ~~~b$ in basalt (2), HESS in 87. ~~~~E~v~~T ~1965,p.l34~. Soda ~mpbibole-p~~oxe~e rn&~i~~~te (61, 88. NOCKoLI)s 11954, p. 1025). Olivine pyroxenite (81, ibid (p. 1022). 89. Puglifinite (2), ibid (p. 1030). 90. Nepheline taphrite (8), ibid (p. 1027). Olivino hornblendite (5), ibid (p. 1022). 91. Tasvite (3), ibid (p. 1029). N~wME aEkali basalt and dolthte (96), ibid (p. 1021). x3: Melilite leucitite (21, ibid fp. 1031). Olivine ~u~~~~tit~ f8), ibid (p. 1028). xi: ~~er~~~~ (61, ibid (p. 1027). Atfantie olivine basalt (251, GREEN and 96. PCXJIERVAART (1955, p. 382). Analcite tephrite (7), NOCK~LDS (1954, p. :;: 1027). PaciJic oliwine basalt {116), GREEN and POLDERVAART (1955, p. ,179). 1::: Alkali basalt without olivine (22), NOCKOLDS 101. (1954, p. 1021). Mesotype missourite (6). i&d (p. 1030). 102. Olivine gabbro f53), ibgd (p. 1020). 103. ~e~~nocr&ti~ missourite (51, ibid (p. 1031). 104. P~~xe~e-biotite rn~~~ite (91, ibid (p_ 1025). Alkali mrangerite of Hurum type (36), &Cd 105. (p. 1018).
93
Esaexite (15), ibid (p. 1027). Leucite tephrite (31), ibid (p. 1030). Tesohenite (S), ibid (p. 102’7). Leucitite (71, Zd (p. 1031). Ordanchite (27), ibid (p. 1027). Alkali andesite f37), itid (p. 1019). Gieurn~~ite (13), IBM (pa 1027). Militia {25), i&d (p_ 1024). Tholeiitic olivine baa& (281, ibid (p. 1021). Volcanic equivalent of Hurum-type alkali mangerite (40), ibid {p. 1018). Hornblende gabbro (lS), ibid (p. 1020). Ma& ign.t~~s rocks &cl&&g nepheEine types (721), ibid (p. 1032). Gabbro (160), ibid fp. 1020). Ma& ignwue roc7cs exc~~d~~ ~e~~~~~~ types (6371, ibid (ps 1032). Leucite rn~~~rite (3), ibid fp. 1030). Ho~~b~en~e-, and h~rnb~o~de-~~~~ diorite (IO), ibid (pa 1019). Augite pyroxenite (7), ibid (p. 1022). Rommaite (4), ibid (p. 1030). Plateau basalt (43), DALY (1933, p. 17). Hornblende hyperstbenite (4), NOCKOLDS (1954, p. 1022). Basalt (198), DALY (1933, p. 17). Tephrite (24}, ibid (p. 23). Anorthosite, 1oca;lized (81, NOCKOLDS (1954, p” 1020). Leucite o~d&n~bite (121, ibid f~. 1030~. Alkali manger&e (53), &id {p: fOl8). ~i~~~~~gite-biotite shonkmlte (9), ibid
korite ($9), ibid (p. 1020). Au&e-biotite shonkinite (81, ibid (p. 1016). Pyrozenite (46), ibid (p. 1022). Leucite latite, including vicoite and cam- panite (IS,) ibid (p. 1030). ~~0~~~~~~ 11021. GREEN and POLRERVAART
QToxene gabbro (3#), NoCKoLDS (1954, p. 1020). Nepheline monzonite (7), ibid (p. 1024). Alkali trachyte equivalent to shonkinite (6), ibid (p. 1016). Nomnal thEei& basalt and dolerite (137), ibid (p. 1021). Central brtsalt (56), ibid (p. 1021). ALkaEaEi cZoreite (76), ibid (B* 1018). ~~~~~~~t~c am&&te (26), ibid (p. 1019). Augit~-biotite-Olivia mon~o~te (61, &id
~wo~p~oxena ~~xe~~~ (2O), ibid (p_ 1022). IXorite (50), ibid (p, 1019). MesotvDe and melenocratic c&-alkali syenite
Y I
(61, ibid (p. 1016). Italite (2), ibid (p. 1030). Pyroxene-mice diorite (Il.), ibid (p. 1019). Hornblende-mica diarits (161, NOCKOLDS . I_ (1964, p. 1019). Au~~te-biotite monzonite (Ii), &Id (p_ 1017). Napheline Iatite (16), ~~~~‘~~*‘i624~. ~~~~~ ~~~-~~~~ ~~~~ (oalc.), NooKo~~s &Iid ALLEN (1953, p. 139). ~ugite-biotic nepheline syenite (W, NocrroLDs (1954, p. 1025).

JACK GREEN and ARIE POLDERVAART
INDEX TO TABLE l-continued
106. Aegirine malignite (4), ibid (p. 1025). 154. Hypersthene granodiorite (lo), NOCKOLDS 107. Soda amphibole-biotite nepheline syenite (6), (1954, p. 1014).
ibid (p. 1025). 108. Latite (42), ibid (p. 1017). 109. Augite-biotite mangerite (7), ibid (p. 1018). 110. Mugaarite (lo), ibid (p. 1018). 111. Andwite (49), ibid (p. 1019). 112. Bronzite pyroxenite (9), ibid (p. 1022). 113. Aegirine augite-biotite nepheline syenite (14),
155. Igneous rock (talc.) WICKMAN (1954, p. 105). 156. Quartz latite (12), DALY (1933, p. 13). 157. Dacite and &cite obsidian. (50), NOCKOLDS
(1954, p. 1015). 158. Aegirine syenite (13), ibid (p. 1016). 159. Hornblende-biotite tonalite (22), ibid
(p. 1015). ibid (p. 1025).
114. Anorthosite, in massifs (9), ibid (p. 1020). 115. Ilztermediate ialteous rocke including nevheline
116.
117. 118.
119.
120. 121.
122.
123. 124.
125. 126.
127.
128.
129. 130. 131.
132.
133. 134. 135. 136. 137. 138. 139.
140. 141.
142. 143. 144. 145. 146.
147. 148. 149. 150. 151. 152. 153.
types (810), ib”io! (p. 1032). ” _ Inter-mediate igneous rocks excluding nepheline types (635), ibid (p. 1032). Mangerite (56), ibid (p. 1018). Pvroxene-hornblende-biotite monzonite (9). ib:d(p. 1017).
~ I.
Pyroxene-biotite mangerite (ll), ibid (p. 1018). Nepheline syenite (43), DALY (1933, p. 14). Volcanic equivalent of Aker-type alkali mangerite (26), NOCKOLDS (1954, p. 1018). Titanaugite-soda amphibole nepheline syenite (3), ibid (p. 1025). Monzonite (46), ibid (p. 1017). Soda amphibole nepheline syenite (ll), ibid (p. 1025); Nephelme syenite (80), ibid (p. 1024). Pyroxene-hornblende-biotite mangerite (lo), ibid (p. 1018). Hornblende-biotite mangerite (9), ibid (p. 1018). Soda pyroxene nepheline syenite (24), ibid (p. 1025). Doreite (38), ibid (p. 1018). Monzonite (27), DALY (1933, p. 13). Aeeirine-soda amuhibole nenheline svenite (9),NocItOLDS (1954, p. 10251. ” Alkali mangerite of Aker type (17), ibid (p. 1018). - Larvikite (15). ibid (p. 1017). Diorite (7d), tiALY (i933, p.’ 16). Phonolite (47), NOCKOLDS (1954, p. 1024). Biotite nephelme syenite (6), ibid (p. 1025). Latite (lo), DALY (1933, p. 13). Trachyandeeite (12), ibid (p. 13). Calc-a&&i truchyte (24), NOCKOLDS (1954, p. 1016). Phone& (25), DALY (1933, p. 14). Hornblende-biotite monzonite (5), NOCKOLDS (1954, p. 1017). Calc-alkali syenite (18), ibid (p. 1016). Igneous rock (talc.), CLARKE (1924, p. 29). Andeeite (87), DALY (1933, p. 16). Tmchyte (48), ibid (p. 11). Ferrohastingite syenite ( 1 l), NOCKOLDS (1954, p. 1016). Peralkaline syenite (47), ibid (p. 1016). Peralkaline trachyte (12), ibid (p. 1016). Tonalite (lo), DALY (1933, p. 15). Alkali syenite (25), NOCKOLDS (1954, p. 1016). Alkali trachyte (15), ibid (p. 1016). Quartz diorite (55), DALY (1933, p. 15). Cordilleran-Appalachian igneous rock (talc.), KNOPF (1916, p. 622).
160. Plutonic igneous rock (talc.), VOGT (1931, p. 47).
161. Chanodiorite (40), DALY (1933, p. 15). 162. Hornblende-biotite granodiorite (65),
NOCKOLDS (1954, p. 1014). 163. Hornblende-biotite adamellite (al), ibid
(p. 1014). 164. Tonalite (58). ibid ID. 10151. 165. 166.
167. 168. 169.
170. 171. 172. 173. 174. 175.
176. 177. 178.
179. 180. 181. 182. 183. 184. 185.
186. 187. 188.
189.
Dacite (96), ‘DALY (i933, p: 15). Rhyodacite and rhyodacite obsidian (115), N0C~0Lns (1954, p. 1014). Granodiorite (137), ibid (p. 1014). Quartz ntonwnite (20), DALY (1933, p. 15). Laneite-aegirine granite (8), NOCKOLDS (1954, p. 1013). Hypersthene adamellite (ll), ibid (p. 1014). Fe&c ignwus rock (794), ibid (p. 1032). Biotite granodiorite (36), ibid (p. 1014). Adamellite (121), ibid (p. 1014). Biotite tonalite (ll), ibid (p. 1015). DeZZenite and dellenite obsidian (58), ibid (p. 1014). Ferrohsstingite granite (7), ibid (p. 1012). Granite (546), DALY (1933, p. 9). Muscovite-biotitegranodiorite (BO),NOCKOLDS (1954, p. 1014). Aegirine granite (ll), ibid (p. 1013). Biotite-hornblende eranite (6). ibid ID. 1012). Muscovite-biotite t&elite (9); ibid (p. 1015). Peralkaline granite (53), ibid (p. 1013). Biotite adamellite (45), ibid (p. 1014). Hypersthene granite (4), ibid (p. 1012). Arfvedsonite-aegirine granite (9), ibid (p. 1013). Riebeckite-aegirine granite (14), ibid (p. 1013). Granite (74), LAPADU-NARGUES (1945, p. 276). Muscovite-biotite granite (21), NOCKOLDS (1954, .p. 1012). Muscovite-biotite adamellite (22), ibid _^_ (p. 1014).
190. C&-alkali granite (72). ibid (1~. 1012). 191.
192.
193. 194. 195. 196.
197. 198.
199.
200. 201.
Peralkalinerhyolite and rhyoiiteobsidian (39), ibid (p. 1013). Riebeckite (or osannite) granite (lo), ibid (p. 1013). Biotite granite (37), ibid (p. 1012). Rhyolite (102), DALY (1933, p. 9). Alkaligranite (48), NOCKOLDS (1954, p. 1012). (Talc-alkali rhyoZite and rhyolite obsidian (22). ibid (p. 1012). Muscovite granite (6), ibid (p. 1012). Alkali rhyolite and rhyolite obsidian (21). ibid (p. 1012). Muscovite-biotite alkali granite (17), ibid (p. 1012). Biotite alkali granite (12), ibid (p. 1012). Granite aplite (15), DALY (1933, p. 27).
94

Petrochemical fields and trends
strongly sodic granites and sodic syenites. This probably results from increased
solubility of Fe3+ in highly sodic melts (BOWEN, SCHAIRER, and WILLEMS, 1930,
p.p. 424-425). At the mafic end the zone terminates in average basalts. Average chondrite (point SM) is included in Fig. 1. The series chondriteperidotite (point P)-dunite (point D) is in opposite direction and displaced with respect to the series basalt-granite.
By contouring Fig. 1 a line can be constructed to pass through the high con- centration areas, as shown in Fig. 2. Averages of common igneous rocks fall on or near this trend. It is a straight line with a steep slope, indicating that frac- tionation of feldspars is usually more than twice as effective as fractionation of ferromagnesians. Also indicated in Fig. 2 are several specific examples of magmatic differentiation. The Skaergaard trend (WAGER and DEER, 1939) is an extreme example of strong fractionation of ferromagnesians with little fractionation of feldspars. That of the southern California batholith (LARSEN, 1948) is a typical example of the talc-alkaline series (NOCKOLDS and ALLEN, 1953). The trend of the Hawaiian series alkali basalbtrachyte (MACDONALD, 1949) is an example of the alkaline series (NOCKOLDS and ALLEN, 1954). The three series fall to the right of the igneous trend but this is accidental and only shows that the examples chosen have slightly higher mafic/felsic ratios than most igneous rocks.
Fig. 3 is a CaNa-K diagram and shows a wide scatter of points distributed about equally on either side of the line joining the Ca corner with a point midway along the Na-K side of the diagram. Most widely distributed intermediate and mafic rocks fall on the sodic side of the line and only in felsic rocks are there common rock types represented by points on the potassic side of the line. It appears from this figure that in the production of sodic versus potassic rocks, the effects of locally operative processes predominate over those of fractionation. As a generally operative process, fractionation alone apparently tends to produce rocks with a Na/K ratio of 1. This is also approximately the Na/K ratio for the minimum of the Na-K feldspar solid solution series. Added interest is given these observations by recognition of a series basalt--latite-trachyte-phonolite (trend A), typical of the oceanic domain, while the series basalt-andesite-dacite- rhyolite (trend B) may be regarded as characteristic of continents. The two series are indicated in Fig. 3. Since this work is aimed at finding a general trend of evolution of igneous rocks, combined alkalis have been used as a variable which is less sensitive to the effects of locally operative processes than Na and K as separate variables.
Fig. 4 shows igneous averages plotted on a series of eleven triangular diagrams, expressed as ionic weight per cent.
The first figure of the series is an Si-Al-Mg diagram and is an example of diagrams including Si. Both early and late products of magmatic consolidation are emphasized in such diagrams, at the expense of intermediate stages of crys- tallization. The figure shows therefore little of interest. The crystal chemistry of silicates indicates that they consist of (SiO,) tetrahedra arranged in a limited number of fundamental patterns, which form a structural skeleton for different minerals. The (SiO,) tetrahedra have therefore been called the “building bricks” of silicates (BUEROER, 1948). The interstitial cations determine the pattern of
95

JAOK GREEK and AFCIE POLDEEWAART
c
I I 9, 0

Petrochemical fields and trends
(SiO,) tetrahedra and give identity to a mineral. In an analogous manner, Si can be regarded as playing a more or less passive role in magmatic differentiation, while the interstitial cations are of greater significance in tracing the evolution of igneous rocks.
This leaves five variables which are major constituents of igneous rocks; Al, total Fe, Mg, Ca and (Na + K). Possible combinations of these five variables are represented in the next ten diagrams. Three groups can be distinguished:
Group 1. Three diagrams with corner Fe, Mg, or Ca, and with a side Al- (Na + K), in which igneous rocks fall in a zone extending toward a point midway
Fig. 3. Ca-NE+-K diagram for igneous rocks.
along the Al-(Na + K) side. The points show generally more scatter than in diagrams of groups 2 and 3. The igneous trend is shown on all the diagrams, arrows marking the progression from mafic to felsic rocks. Variations in ultra- mafic rocks are indicated by averages of stony meteorites, peridotites, and dunites. In the Al-(Na + K)-Ca diagram quite a number of points show low Ca content but fall on the (Na + K) side of the igneous trend. These points represent per- alkaline granites and syenites. The diagram also shows a series of rocks (including pyroxenites) enriched in Ca which departs from the main igneous trend and is directed toward the Ca corner.
Group 2. Three diagrams with corner Al, Ca, or (Na + K), and with a side Fe-Mg. The igneous rocks again fall in a well-defined zone which starts from a point along the Fe-Mg side, approximately at Mg : Fe = 3 : 1. In the Fe-Mg-Al diagram the zone curves toward the Al corner, is convex toward the Fe corner, and ends at a point along the Al-Fe side, approximately at Al : Fe = 9 : 1. In the Fe-Mg-Ca diagram the zone curves toward the Fe corner where it ends, and is convex toward the Ca corner. In the familiar Fe-Mg-(Na + K) diagram the zone curves toward the (Na + K) corner, is convex toward the Fe corner, and

H+O
N
k n
‘IV
+DN
IV

Petrochemical fields and trends
ends at a point along the Fe-(Na + K) side, approximately at (Na + K) : Fe = 8.5 : l-5. The igneous trend is again shown for the progression from mafic to
felsic rocks only. In both the Fe-Mg-Al and Fe-Mg-(Na + K) diagrams there is a group of points with low proportions of Mg but with distinctly higher Fe than corresponds with other igneous rocks of comparable Mg content. The points again represent strongly sodic granites and sodic syenites and their anomalous position reflects the increased solubility of Fe3+ in highly sodic melts.
Group 3. Four diagrams with Ca in one corner, and without either of the pairs Al-(Na + K) or Fe-Mg. Here the igneous rocks fall in a zone which is convex toward the Ca corner and curves between the other two corners. In the Al-Mg-Ca and Mg-Ca-(Na + K) diagrams the zone passes through the Mg corner and respectively the Al and (Na + K) corners. The Mg-Ca-(Na + K) diagram shows the least scatter of points of these ten diagrams. In the Al-Fe-Ca and Fe-Ca-(Na + K) diagrams the zone passes through the Fe corner and respectively a point along the Al-Fe side at about Al : Fe = 9 : 1, and a point along the Fe- (Na + K) side at about (Na + K) : Fe = 8.5 : 1.5. Both diagrams show some scatter toward the Fe corner at the felsic end of the igneous trend, produced by averages of strongly sodic granites and sodic syenites. The progression from mafic to felsic rocks is again indicated as a trend which is not extended to the ultramafic rocks.
If desired, the ten diagrams can be combined in five tetrahedra to show the igneous trend for any four of the five variables. This is not done in the present paper.
The existence of a general trend of evolution of igneous rocks demonstrates that for the variables considered, the effects of fractionation predominate over those produced by locally operative processes. Studies of fractional crystallization of artificial melts are progressing from simple to more complicated systems. Eventually the results of these investigations should be capable of calculation in terms of the same five variables and should then coincide with the igneous trend shown here.
In diagrams with the pair Fe-Mg, the ultramafic rocks start at a ratio Mg : Fe = 3 : 1, which seems to be the mean Mg/Fe ratio of early crystallizing ferromagnesians (although earliest crystals of olivine and bronzite may have a ratio Mg : Fe = 5 : 1). Similarly, in diagrams with the pair Al-(Na + K), the igneous trend ends at or near a ratio Al : (Na + K) = 1 : 1, which is the Al/(Na + K) ratio of alkali feldspars. Corresponding diagrams with Fe or with Mg (e.g. Fe-Ca-AlandMg-C&-Al) are not quite identical, as they would be if Mg and Fe were mutually dependent vari- ables. Ca and (Na + K) are also independent variables. Remarkable is the strong curvature of the zone occupied by igneous rocks convex toward Ca in diagrams which include this element with either Mg or Fe. Ca is gained in the mantle progression from ultramafic to mafic rocks, but in the crustal progression from mafic to felsic rocks Ca is lost.
Detailed interpretation of the igneous trend cannot be attempted here. A full evaluation will require many comparisons with detailed studies of magmatic differentiation in single intrusions, variations in igneous rocks in magmatic pro- vinces, and experimental results obtained for synthetic melts. Statistical analysis
99

JACKGREEN ~~~A~EPOLDERVAART
of the results, with due consideration of relative abundances of the various rock types in the earth’s crust, is also desirable. A general synthesis of this type stands in danger of masking trends of importance which do not result from generally operative processes. The writers believe that the igneous trend portrayed here adequately reflects the progression from mafic to felsic igneous rocks in terms of the variables used. However, by omitting Si the alkalic series of igneous rocks has been made to coincide in large part with the talc-alkalic series. This raises the interesting question whether the alkalic series is really so different from the talc-alkalic series. Further, by combining alkalis instead of representing Na and K. separately, important aspects of igneous evolution toward sodic or potassic differentiates have been neglected. These obvious defects in the present analysis require careful attention, especially in considerations of crustal evolution.
The series of diagrams is also useful as a guide to future investigations of chemical variation in igneous rocks. Evidently the Mg-Ca-(Na + K), Fe-Ca- (Na + K), and Fe-Mg-(Na + K) diagrams are the most suitable to show chemical variation in igneous rock series, since they show the widest spread and least scatter.
SEDIMENTARY ROCKS
Chemical differentiation effected in sedimentary processes is remarkably efficient and can be compared with the methodology of quantitative silicate analysis (GOLDSCHMIDT, 1922). Main stages in the differentiation are the formation of resistates, hydrolysates, oxidates, carbonates, evaporates, and redusates (cf. MASON, 1952). Many writers have emphasized the greater range in content of various major elements in sediments as compared with igneous rocks. This applies especially to Si (as dioxide), Al and Fe (as hydrated oxides), and Ca and Mg (as carbonates).
As in the case of igneous rocks, one may regard sediments as having formed in response to generally operative processes, as well as to processes of local appli- cation only. It is immediately evident that local factors play a much greater role in weathering, transport, and deposition of sediments than they do in the production of igneous rocks. The distribution of the various types of sediments depends on a myriad of different physical and chemical factors. These are winds, waves, currents, climatic conditions, partial CO, pressures, salinity, redox potential, hydrogen ion concentration, shoreline geometry, topography of source highlands and sea floor, nature of source rocks, type and role of organisms, presence of barriers, regressive or transgressive seas, etc. All play vital roles in various com- binations at different places and at diverse times. Attempts to derive a general sedimentary trend are therefore foredoomed to failure.
Chemical adjustments in rock-weathering tend to produce new mineral phases in equilibrium with surface temperatures and pressures, and in accord with the chemical composition of the system. This is a generally operative process which sets sediments apart from high-temperature igneous and metamorphic rocks. A link may be provided by low-temperature phases of igneous and metamorphic
100

Petrochemical fields and trends
Table 2. Averages of Bedimentary rocks
Index si No.
1* I 2 1
. I 4i4
3 I 4 (
4:4 4.3
2.4 5 ~ 5.9
: 4.6 6 ~ 12.5
8.8 7 I 15.8
8 / ‘fjf3
9 / 21.0 18.3
10 : 23.1 ( 20.2
11 1 24.0 20.8
12
13
14 15
16
17 18
19 20
21
22 23
24
25
26
27
28
25.8 25.0
25.8 23.6
25.9 25.9
24.7 27.4 24.3
27.5 27.8
25.9 27.9 28.3 24.9
29.0 27.9
29.0 29.2 27.7
29.4 28.8
29.9 29.1
30.1 28.2
30.2 29.7
30.2 29.6
0.1 0.7 0.6 0.1 0.4 0.4
0.1 0.7 0.6 0.1 0.4 0.4
0.1 0.7 0.6 0.1 0.4 0.4
0.2 3.4 4.4 0.1 2.7 3.4
0.2 3.8 3.8 0.2 2.7 2.7
0.3 4.7 5.6 0.3 5.2 4.4 0.2 4.3 3.5
0.5 7.1 4.4 0.5 6,2 3.9
0.5 7.0 3.7 0.4 6.1 3.2
0.4 6.7 3.2 0.4 5.8 2.8
0.5 9.2 9.4 0.5 8.9 9.1
0.7 8.9 3.5 0.7 8.1 3.2
0.7 8.9 5.3 0.5 9.1 6.6 0.5 8.7 6.3
0.3 6.8 2.1 0.3 6.0 1.8
0.6 8.5 6.0 0.3 8.6 4.3 0.3 8.0 4.1
0.5 7,7 4.5 0.4 5.9 2.3 0.3 5.2 2.0
0.3 8.8 5.0 0.3 8.4 4.8
0.5 8.8 5.1 0.3 8.2 3.2 0.3 7,8 3.0
0.9 10.1 3.9 0.8 9.8 3.9
0.4 9.0 3.1 0.4 8.7 3.0
0.4 7.9 2.7 0.4 7.4 2.5
I.5 9.4 1.9 0.5 9.3 1.9
0.5 8.7 5.9 o-5 8.6 5.8
0.5
0.5 0.8 0.7
1.7 1.6
1.8 1.6
0.8 1.4 1.2
0.7 0.6
1.6 1.5
2.0 1.9
2.1 2.0
1.8 l-7
3.2 3.1
0.1 0.1
0.1 0.1
0.1 0.1
0.6 0.5
0.4 0.3
0.6 0.5 0.5
0.5 0.4
0.3 0.2
0.3 0.2
1.0 1.0
0.1 0.1
0.6 0.9
0.8
0.5 0.6 0.5
0.6 0.1 0.1
0.1 0.1
0.1 0.1
0.2 0.2
Mg Ca Na K
-
3.7 3.8 2.2 8.3 4.8
13.9 8.0
0.8 0.6
1.2 0.8
1.0 1.3 1.1
1.2 1.0
1.7 1.5
1.8 1.6
1.2 1.2
1.3 1.2
1.5 1.8
1.8 2.6 2.3
2.2 1.5 1.4
1.1 1.1 1.0
2.1 2.0
2.1 1.8 1.8
1.4 1.4
1.6 1.6
1.8 1.7
1.6 1.6
l-4 1.3
101
1.2 30.8 1.1 58.3 0.1 0.4 34.3 0.1 0.3
52.9 0.1 0.4 30.7 0.1 0.3
$6.1 0.1 0.4 26.4 0.1 0.3
$9.1 1.5 1.0 38.2 1.2 0.8
39.7 0.6 0.9 27.9 0.4 0.6
30.9 1.2 1.1 30.4 0.7 1.2 21.8 0.6 1.0
20.6 0.8 1.4 17.9 0.7 1.2
17.2 0.9 1.7 15.1 0.8 1.5
16.3 0.9 1.8 14.1 0.8 1.6 4.4 1.1 1.7
4.3 1.0 1.7 10.0 0.8 1.8
9.2 0.7 1.7 8.8 1.0 1.7 5.8 1.3 2.3
5.5 1.3 2.2 10.2 1.1 2.3
9.0 1.0 2.0 4.5 1.4 2.4 7.5 0.8 2.0 6.9 0.7 1.8
7.2 1.3 2.3 11.4 1.3 2.4 10.1 1.2 2.2 4.0 1-o 2.0
3.9 1.0 1.9 2.3 1.6 3.4 4.8 1.5 2.5 4.6 1.4 2.4
1.6 1.8 0.9 1.6 1.8 0.9
2.4 1.1 3.0 2.4 1.0 2.9
4.7 0.9 2.6 4.4 0.9 2.5
1.3 1.4 3.0 1.3 1.4 3.0
1.9 1.8 1.4 1.9 1.8 1.4
P c
0.2 0.1
0.1 0.1
0.1 0.1 0.1
0.0 0.0
0.1 0.0
o-1 0.0
0.1 0.1
0.1 0.1
0.1 0.1
0.1
0.1 0.0
0.1 0.1 0.1 0.1 0.1 0.1
3.0 0.0
0.1 0.1 0.1
0.1 0.1
0.1 0.1
0.1 0.1
0.1 0.1
11.2
11.4
11.7
6.1
8.1
6.2
3.5
3.4
3.7
0.8
2.4
1.3
3.1
1.9
3.7
1.1
1.3
0.6
0.7
2.2
0.5
0.6
-
0
-_
5.4 31.8 48.5
32.6 49.3
33.7 50.1
32.9 41.8
36.8 47.4
38.7 39.5 47.4
42.5 46.4
43.3 47.1
43.7 47.5
45.6 46.4
45.3 47.4
45.5 45.7
46.8 45.3 48.6
46.3 46.5
48.4 46.0 45.3 48.0
47.0 48.0
47.1 46.8 48.1
47.8 48.3
47.3 48.1
47.0 48.0
47.5 48.7
47.9 48.2

JACK GREEN and A_R~ POLDERVAART
Table 2--corttimed
K
30
31
32
‘33
34 35 36
37
38
39
40 41
42
43
si Ti Al Mn C& P 0
.- - 30.2 0.5 9.4 3”L 2-4 1.1 0.8 O-1 47*7 29.8 0.5 9.3 3.0 2.4 1.1 0.8 0.1 47.9
30.4 04 7-4 6.8 o-9 2.3 0.8 o-1 47.5 29.8 o-4 7.2 6.6 o-9 2.2 0.7 0.1 48-2
30.6 0.4 7.7 2.6 1.7 4.4 o-9 0.1 47-3 28.8 0.4 7-3 2*5 l-6 4-l 0.9 0.1 48-l
31.3 0.3 7.7 0.7 3-4 o-1 2.6 2.7 o-o 47.7 30.8 0.3 7.6 0.7 3.4 O-1 2-6 2.6 0.0 48.0
31.5 0.3 5.2 1.9 l*O 8-P 0.7 0.1 47.1 28.3 0.2 4.7 1.7 0.9 7.6 0.6 0.0 49.8
31.6 0.4 7.6 4.7 0.8 1.6 1.6 0.1 47.9 32.5 0.4 8.3 0.7 2*7 0.2 1.7 2.0 0.1 48.5 35.5 0.4 6.1 2.6 O-1 l-7 1-2 o-1 49.3 34-9 0.4 6.0 2.6 O-I 1.6 1.2 0.1 49.7
35.7 6.1 1.7 0.2 1.2 1.5 48.7 35.6 6.1 1.7 0.2 1.1 1.5 48.9
37.1 04 5.1 0.6 2ul 0.2 0.9 1.6 0.1 49.6 36.9 04 5.1 0.6 2.1 0.2 0.9 1.6 0.1 49.7
38.2 0.2 2.9 1.7 0.1 5.4 0.X 0.0 50.1 36.3 0.2 2.7 1.6 0-f 5.2 0.1. 0.0 51-2
38.6 0.2 2.6 1.6 0.1 5.6 0.0 50.2 39.3 0.2 2.7 0.8 0.3 4.2 04 0.0 50.2 37.3 0.2 2.5 O-8 o-2 4-o 0.4 0.0 51.4
39.5 3.4 1.6 0.9 1*2 0.6 0.3 50.6 39.1 3.4 1‘6 0.9 1.2 0‘6 0.3 50.7
44-2 O-7 0.1 0.2 2.2 0.1 52.3 43.2 0.7 0.1 0.2 2-l 0.2 52.8
- * Cl 55.4, s 2.3
3.2 3.2
1.4 1.4
2.6 2.5
1.7 1.7
1.9 1.7
2.0 I-8 2.1 2.1
4.8 4.7
X.3 l-3
0.1 o-1
c
o-4
0.5
231
0.4
2.7
O”4
0.1
0-L
I.4
14
0.3
O”6
processes which result in hydrothermal alteration minerals (cf. FREDERICKSON and Cox, 1964).
Even on this basis of surface-eq~~~ib~urn phases it is d~~cu~t to define a cbaracte~st~c field for segmentary rocks. ~~~c~t~es are threefold:
(1) It is not easy to decide which sediments are thoroughly representative and which are not. Metastable sediments may be formed in near-equilibrium with peculiar local conditions. Conglomerates, grits, and arkoses are probably not sedimentary equilibrium phases, but the position of ~ater~tes and ba~xites is more problematical. evaporates are probably metastab~e in the sense of generally operative processes. However, it is questionable whether dolomite-formation is a sedimentary process or the result of metasomatism.
(2) Complete equilibrium can only be the exception on the surface of the restless earth. Successive sedimentary cycles undoubtedly add continually to ~q~~lib~urn phases in sedirn~~t~~ But acting against this are the incidence and erects of compaction, litb~~cat~o~~ met~somatism, ig~~~Ms action, and meta- morphism which again disturb the sedimentary equilibria,
(3) The composition of the atmosphere has probably changed markedly in

Petrochemical fields and trends
geologic time (RUBEY, 1951, 1955; UREY, 1952). Undoubtedly this has affected chemical differentiation in sedimentary processes (cf. NANZ, 1953). Chemical adjustments in rock-weathering probably have not acted in the same directions
throughout geologic time. While recognizing these problems, the writers have attempted to use the
geologic record since the Cambrian and the distribution of average compositions as guides to delineate a sedimentary field. This field includes normal and pre-
ponderant sediments such as muds, shales, limestones, graywackes, subgraywackes, and sandstones, but excludes conglomerates, grits, arkoses, laterites, bauxites, evaporates, and dolomite or dolomitized limestones. Thus defined the sedimentary field reflects compositions and stabilities of sediments normally attained on the earth’s surface in contact with an oxidizing atmosphere.
Fig. 5 shows sedimentary averages plotted according to a system suggested by MASON (1952, pp. 130-131) and adopted by RUBEY (in preparation) in his compilation of sediments in the United States. (Al + Fe) does not exceed 40 per cent of (Si + Al + Fe + Mg + Ca) in normal sediments, and only reaches more than 30 per cent in sediments with more than 50 per cent Si.
INDEX TO TABLE 2*
1.
2.
3.
4.
5.
6.
7.
8.
9.
10.
11.
12. 13.
14.
15.
16.
:::
19. 20.
2”;: 23.
24.
25.
26.
27. 28.
29.
30.
Dissolved solids in sea-water (talc.), RUBEY (1951, p. 1126). Devonian-Pleistocene limestone (calc.). RIJBEY (personal communication).t ’ ” Limestone (345, camp. anal.), CLARXE (1924, p. 30). - Precambrian-Silurian limestone (talc.). RUBEY (personal communioation).t ~ ” Globigerina ooze (66 Eta.), SUJKOWSKI (1952, p. 37%). Globigerina-pteropod ooze (4975), RUBEY fnersonal communioation). i\;Iodern oceanic sediment (talc.), SUJKOWSKI (1952, p. 373). Pelagic sediment (oalc.), POLDERVAART (1955, D. 125). Bemipelagic sediment (talc.), POLDERVAART (1955, p. 131). Suboceanic sediment (talc.), POLDERVAART (1955, p. 131). All sediment (talc.), POLDERVAART (1955, p. 132). Red clay (45 &a.), SUJKOWSIU (1952, p. 373). Terrigenous clay (52), SVERDRW et al. (1946, p. 1006). Terrigenous mud (53~88), RUBEY in POLDEW VAART (1955, p. 131). Red clay (61-85). RUBEY in POLDERVAART (1955, p. 125). Sediment of young folded belts (talc.) POLDERVAART (1955, p. 130). All sediment (calo.), KUENEN (1950, p. 125). Siliceous ooze (6-17), RUBEY in POLDERVAART (1955, p. 125). All sediment (talc.) SUJKOWSKI (1952, p. 361). Continental sediment (talc.) SUJKOWSKI (1952, p. 361).
31. 32. 33.
34.
:::
37.
ii:
40.
41.
2::
Clay and soil (12), CLARKE (1924, p. 631). Norwegian glacial and post-glacial clays (78). GOLDSCHMIDT (1933, p. 124). Mesozoic-Cenozoic ehale (27, camp. anal.), CLARK (1924, p. 552). Terrigenous mud (52, camp. anal.), CLARKE: (1924, p. 518). Shale (78, camp. anal.), CLARKE (1924, p. 30). All sediment (talc.), LEITFI and MEAD (1915, p. 82). Pelitic rock (155), SHAW (1966, p. 928). Blue mud (13 &a.), SUJKOWSKI (1952, p. 373). Paleozoic shale (51, camp. anal.), CLARKE (1924, p. 552). Radiolarian ooze (7 sta.), SUJKOWSKI (1952, p. 373). All sediment (talc.), CLARKE (1924, p. 33). Graywacke (ll), PETTIJOHN (1949, p. 250). Continental Shield sediment (calo.), POLDER- VAART (1955, p. 129). Pacific diatom ooze (2 sta.), SUJKOWSKI (1952, p. 373). Graywacke (30), TYRRELL (1933, p. 26). Mississippi silt (235, camp. anal.), CLARKE (1924, p. 509). Arkose (3), PETTIJOEN (1949, p. 259). Subgraywaoke (3), PETTIJOHN (1949, p. 256). All diatom ooze (talc.), POLDERVAART, from SUJKOWSKI (1952, p. 373). Antarctic diatom ooze (4 &a.), SUJKOWSKI (1952, p. 373). Sandstone (253, camp. anal.), CLARKE (1924, p. 30). Quartzite (?), SEDEREOLM (1925, p. 4). Orthoquartzite (7), PETTIJOEN (1949, p. 241).
* Although original sources are quoted, many of these averages have been modified in recalculations by the writers.
t After CLARKE (1924, p. 30), modified for Ca/Mg ratios after DALY (1909, p. 20).
103

Index letter *
P.S
<
8
D
C
P
TR
J
K
T
Q
Ave.:
JACK GREEN and ARIE POLDERVAART
Table 2(a). Clays of the Russian Platform (recomputed from VINOGRADOV
and RONOV, 1956, pp. 6-7.)
W
1.5 1.4
1.4
1.4 2.9
2.6 2.5
2.3 2.0
1.9 4.1
3.6 2.5
2.3 1,3
1.3 1.2
1.2
1.5 1.4
2.0 1.9
2.1
1.9
Si
-
-
Ti
29.2 0.6 28.8 0.6
30.0 0.5 29.8 0.5
25.6 0.4 23.0 0.4
25.6 0.6
23.7 0.6 27.6 0.6
26.4 0.5 24.1 0.4
21.2 0.4 26.5 0.5
24.5 0.4
28.8 0.5 27.5 0.5
29.2 0.5
27.8 0.5 30.2 0.4
28.4 0.4
30.4 0.4
29.1 0.4 27.9 0.5
26.4 0.5
-
Al Fe+3
10.4 6.3 10.3 6.2
10.0 5.0 10.0 5.0 7.6 4.4
6.8 4.0 9.2 5.4
8.5 5.0 10.3 5.1
9.8 4.9 7.3 4.9
6.4 4.3 8.7 4.8
8.1 4.4 9.7 4-9
9.4 4.7 9.4 4.6
9.0 4.4
6.9 4.9 6.5 4.6
7.8 4.6 7.5 4.4
8.8 5.0 8.4 4.7
Ca Na
-
-
K
0.4 0.6 3.5 0.4 0.6 3.5
0.6 0.4 4.3 0.6 0.4 4.2
9.5 0.7 4.1 8.5 0.6 3.7
7.2 0.5 3.5 6.6 0.5 3.2
3.5 0.5 3.6 3.3 0.5 3.5
11.1 1.2 2.7
9.8 1.0 2.4 8.1 0.9 2.1
7.5 0.8 2.0 3.8 1.2 2.9
3.6 1.1 2.8 4.5 1.1 2.2
4.2 1.0 2.1
5.9 1.0 2.2 5.5 0.9 2.1
3.9 0.6 2.9 3.7 0.6 2.7
5.3 0.8 3.1 4.9 0.7 2.9
- * Shown on Figs. 5 and 6. t From the original (VINOOFLADOV and RONOV, 1956, p. 11). $ Average plotted on Fig. 7.
PE c
:
: TR
ii T Q Ave.
C
0.3
0.2
2.8
2.1
1.2
3.3
2.1
1.1
1.3
1.7
1.2
1.6
-
-
-
0 WMgt
47.6 47.9
47.8 48.0
44.8 47.7
45.5 47.6
46.8
48.0 44.3
47.7 45.9
48.0 47.0
48.1
47.3 48.5
47.1
48.6 47.5
48.6 46.5
48.0
0.28
0.44
3.17
2.81
1.71
2.63
3.17
2.80
3.59
3.89
1.85
2.51
INDEX TO TABLE 2(a)
Late Precambrian. Average of 17 composites based on 765 individual specimens. Cambrian. Average of 14 composites based on 436 individual specimens. Silurian. Average of 14 composites based on 729 individual specimens. Devonian. Average of 94 composites based on 2543 individual epecimens. Carboniferous. Average of 36 composites based on 508 individual specimens. Permian. Average of 28 composites based on 730 individual specimens. Triassic. Average of 4 composites based on 121 individual specimens. Jurassic. Average of 16 composites baaed on 328 individual specimens. Cretaceous. Average of 12 composites based on 255 individual specimens. Tertiary. Average of 12 composites based on 352 individual specimens. Quaternary. Average of 5 composites based on 28 individual specimens. Average of the above 11 averages giving equal weight to each geologic period. This average differs from the anhydrous equivalent of the original which is a weighted average based on number of composites. The difference is within 0.5 per cent for each constituent. Mn and P are not listed separately in the original. The averages are, therefore, computed Mn and P free. However, the sum of Mn and P in non-pelagic clays normally does not exceed 1 per cent.
104

Petrochemical fields and trends
The Ca-Na-K diagram shown in Fig. 6 shows a strong scatter of points widen- ing toward the Na-K side, with a median line which intersects the N*K side at approximately Na : K = 7 : 13, as compared with Na : K = 1 : 1 for igneous rocks and Na : K = 28 : 1 for sea-water. If it be assumed that Na and K in sea- water result solely from rock weathering, it can be calculated from these three ratios that sedimentary processes affecting igneous source rocks in which Na equals K, result in storage of roughly 47 per cent Na and 1.7 per cent K in sea- water, while 53 per cent Na and 98.3 per cent K are retained in the sediments formed. If the igneous source rocks are basalt with Na = 25 K, sedimentary pro- cesses similarly would result in storage of 79.6 per cent Na and 7-l per cent K in sea-water, while 20.4 per cent Na and 92.9 per cent K would be retained in the derived sediments.
With the assumption that chemical differentiation in sedimentary processes has remained the same throughout geologic time, these percentages may be compared with total amounts of Na and K in all sea-water (respectively 17,232 x 1Ol2 tons and 619 x 1012 tons). This assumption is probably not warranted
but results are nonetheless instructive. Thus for igneous source rocks with Na = K the amounts of Na and K in all sea-water are equivalent to 19,432 x 1012 tons Na and 35,793 x 1012 tons K retained in all sediments. For basaltic source rocks with Na = 2.5 K, the equivalents are 4416 x 1012 tons Na and 8099 x 1012 tons K. Taking POLDERVAART’S (1955, p. 132) average composition of unmetamorphosed sediments as a basis, the amounts of Na and K for igneous source rocks with Na = K represent 1800 x 1015 tons of sediment, while for basaltic source rocks with Na = 2.5 K the amounts of Na and K represent 400 x 1Ol5 tons of sediment. In contrast, POLDERVAART has calculated that there exist at present 1700 x 1015 tons of sediment in an unmetamorphosed or slightly metamorphosed condition.
These calculations completely fail to explain the enormous amounts of sediments found as metamorphic rocks in Archean shields. To the writers it seems likely that the total amount of sediments produced in geologic time is three to ten times the amount calculated. Possible solution of the problem involves one or more of the following assumptions. (1) Estimates on which the calculations are based are completely wrong and should be rejected. (2) Chemical differentiation by sedimentary processes has changed markedly in geologic time and in particular differentiation of Na and K was decidedly less efficient in the Archean than in geologically more recent times. (3) Throughout geologic time considerable pro- portions of sediments have consisted of intermediate to felsic tuffs with Na < K. (4) Throughout geologic time source materials for sediments have consisted pre- dominantly of rocks with Na < K. (5) The Na and K in sea-water have not resulted solely from rock weathering; appreciable proportions may have been added to the oceans by degassing of the mantle.
The writers consider a combination of the last four assumptions most likely. The geochemistry of Na and K is incompatible with a theory of evolution of continents by weathering and sedimentation of basaltic source rocks. On the one hand there is too much sediment, on the other there is not enough Na and K in sea-water.
Fig. 7 shows the same series of 11 triangular diagrams as Fig. 4 for igneous
105

JACK GREEN and ARIE POLDERVAART
Al + Fe (as hydrated oxides)
. Ca+Mg
(as carbanates)
Fig. 5. Si-(Al + Fe)-(Mg f Ca) diagram for sedimentary rocks. Open circles represent clays of the Russian Platform: PC-Late Precambrian, E-Cambrian, S-Silurian, D-Devonian, C-Carboniferous, P-Permian, TR-Triassic, J--Jurassic, K-Cretamous, T-Tertiary, Q-Quaternary. See note added in proof. Open square represents an anhydrous average of 21 Pacific pelagic clays exclusive of calcareous or diatomaceous cores Cap. 32-33HG, Ck-8-9, and NH9 (recalculated from GOLDBERQ and ARRHENIUS, 1957). Weight percentages and s.d. in parentheses are as follows: Si 24.4 (2.4); Ti 0.65 (0.32); Al 9-6 (1.3); Fe 5.4 (0.9); Mn 1.0 (0.7); Mg 1.9 (0.3); Ca 2.8 (1.6); Na 3.6 (0.9);
K 2-6 (0.5). Data for 17 additional elements in original reference.
fl”
Co Fig. 6. Ca-Na-K diagram for sedimentary rocks. Open circles represent, clays of the Russian Platform. Symbqls as in Fig. 5. See note added in proof. Open square represents average of 21 Pa&c pelagic clays exclusive of calcareous or diatomaceous types (GOLDBERG and ARRHENIUS, 1957). The position of the open square relative to the open circles reflects in part the degree of tiuence of basaltic source for these pelagic clays versus a
predominantly non-basaltic source for the Russian terrestrial clays.
106

rocks. The Si-Al-Mg diagram shows few instructive features. Most points are near the Si corner and their grouping suggests that for the same Si-Al values, sediments have slightly higher Mg than igneous rocks.
The next ten d~a~ams show the vacation of Al, total Fe, Mg, Ga, and (Na + K). For comparison the igneous trend from mafic to felsic rocks has been added to the diagrams. In diagrams whieh include Ca, the sedimentary averages fall in a zone fanning out from the Ca corner and widening toward the opposite side. Median lines for these zones intersect the side as follows:
Int~rs~Gtio~ on side opposite Diagram Ca corner
Ca-Al-Fe Al : Fe = 60 : 40
Ca-Al-Mg Al : Mg = 85 : 15
Ca-Al-(Na + K) Al : (Xa + K) = 70 : 30
Fe : Mg = 75 : 25
Ca-Fe-(Na -+ K) Fe : (Na + K) = 60 : 40
Ca-Mg-(Na + K) Mg : (Na + K) =tl: 30 : 70
zone is relatively narrbw in the Ca-Al-(Na + K) and Ca-Al-Mg diagrams, widest in the ~~~~(~~ + K) dia~am. The width of the zone in each
gram reflects the degree of coherence of the two contrasted constituents in normal sediments. Points outside the generalized zones represent arkose, solids in sea-water, diatom ooze, and dolomitized limestone.
In diagrams which exclude Ca, the sedimentary averages fall within a well- defined field, This field is most G~rc~~ar in the Al-Fe-(Na + K) diagram but more elliptical in the othe diagrams, with greatest length of longer axis in the Fe-Mg-(Na + K) diagram. Arkose, solids in sea-water, diatom ooze, and dolomitized limestones again fall outside this field.
Although not done in this paper, the triangular diagrams can be combined in five tetrahedra to show the variation for any combination of four of the five variables. In the four tet~ahedra which include Ga, the sedimentary field is a cone which issues from the Ca corner and widens toward the opposite side of the tetrahedron. In the Al-Fe-Mg-(Na + K) tetrahedron the sedimentary field is an ellipsoid of revolution.
METAMORPEDC ROCKS
As the term is used here, metamorphism encompasses all processes, exclusive of weather~~~~ whereby pro-existing rocks are changes mine~alog~~a~~y, tex- turally, and/or chemically after their first formation or deposition. Thus it includes low-temperature processes such as diagenesis in sediments and hydro- thermal alteration of rocks, as well as high-temperature changes effected by plutonic processes.
Many metamorphic rocks have only rec~stal~zed without sig~fi~a~t variation in propo~~o~s of major and minor ~~erne~ts. In other rocks metamorp~sm has ohanged the water content without significant differences in other major con- stituents, although the content of particular trace elements may be materially
107

JACX GREEN and ARIE Po~~~vA~T
Y
Y +
%
Y *
x
108

Petrochemical fields and trends
Table 3. Averages of metamorphic rocks.
Index s. No. ’ Ti Al FeSf FeBf Mn
-
1 22.9 2 23.5 3 23.5 4 28.1 5 28.2 6 28.2 7 28.9 8 28.9 9 29.9
10 29.9 11 30.1 12 30.2 13 30.3 14 30.3 15 31.0 16 31.0 17 31.6 18 31.7 19 31.8 20 32.0 21 32.1 22 32.9 23 33.0 24 33.1 25 34.5 26 37.5
1. 2.
3.
4. 5.
6. 7. 8.
9. 10.
11.
12.
13. 14.
1.0
0.7
0.5 0.4
0.5
0.6
0.5 0.4 0.4 0.4
0.2 0.2
0.2 0.3 0.1
7.7 8.3 8.8
11.0 12.8 9.8
10.1 10.9 9.0
10.7 9.3
10.2 10.2 9.2 8.2 8.4 9.5 8.8 8.1 7.8 8.7 7.8 8.5 7.7 7.0 5.1
2.7 2.5 2.6 2.1 2.0 2.9 2.3 2.8 1.7
1.5 1.9 2.7 2.0 1.3 1.6 1.4 1.3
0.9
1.4 0.6 1.1 1.0 1.6
7.1 6.1 6.9 3.7 2.8 5.2 4.2 3.4 2.3 5.4 3.6 2.6 1.9 3.0 2.2 3.6 2.6 2.6 5.3 2.5 2.8 1.6 1.4 1.6 1.2 1.0
0.2
0.1
0.1 0.2
0.1
0.1 0.1
0.1 0.1
Mg
5.4 4.2 4.2 1.8 1.2 1.6 1.8 1.8 1.1 1.3 1.6 1.6 1.0 1.9 1.2 1.8 1.2 1.1 2.1 1.0 1.1 0.7 0.4 0.7 0.6 0.6
INDEX TO TABLE 3*
Eclogite (34), LAPADU-HAROUES (1953, p. 166). ~~+$olite (200), POLDERVAART (1955,
Amphibolite (89), LAPADU-HARGUES (1953, p. 161).
15. Continental crystallines (calo.), POLDERVAART (1955, p. 127).
Phyllite (50), POLDERVAART (1955, p. 136). Sericite (muscovite) schist (25), LAPADU- HARGUES (1945, p. 267). Precambrian slate (33), NANZ (1953, p. 57). Slate (61), POLDERVAART (1955, p. 136). Slate and phyllite (27), LAPADU-HARGUES (1945, pp. 261-2).
16. Kinzigite (15), POLDERVAART (1955, p. 136). 17. Mica, schist (5), CLARKE (1924, p. 631). 18. Biotite-muscovite gneiss (51), LAPADU-
HARGUES (1945, pp. 267-71). 19. Norwegian mica, schist (53), GOLDSCHMIDT
(1933, p. 130). 20. Finnish Shield (c&x), SEDERHOLM (1925,
p. 10). 21. Finnish mica, schist (?), SEDERHOLM (1925,
P. 4). Canedian Shield (talc.), GROUT (1938, p. 502). Norwegian phyllite (29), GOLDSCHMIDT (1933, p. 130).
22. Plutonic nneiss (64). LAPADU-HARG~ES (1945.
Mice schist (103), POLDERVAART (1955, p. 136).
pp. 271-6). ’ ” I ,
23. Greenland gneiss (12), RAMBERG (1951, p. 31). 24. Quartzofeldspathic gneiss (250), POLDERVAART
(1955, p. 135). Biotite-musoovite schist (37), LAPADU- HARGUES (1945, pp. 265-7). U.S. roofing slate (36), ECKEL (1904, p. 26). Slate (22), CLARK (1924, p. 631).
25. Leptite and hiilleflinta (112), POLDERVAART (1955, p. 135).
26. Metaquwtzite (18), LAPADU-HARGUES (1945, pp. 296-7).
-
CEh Na
-
-
K
8.2 1.9 0.6 6.8 2.2 0.9 7.2 2.2 0.6 0.9 1.5 3.3 0.6 1.3 3.7 0.8 1.0 3.4 0.7 1.3 3.2 1.0 1.0 3.0 2.9 2.7 2.6 0.3 1.1 3.9 1.4 1.4 3.1 1.1 1.2 3.5 2.0 1.0 3.2 0.8 2.0 2.7 2.7 2.6 2.7 1.0 1.9 2.7 0.9 1.3 2.8 1.4 2.3 2.9 0.9 1.0 3.2 2.4 2.3 3.0 1.8 2.0 3.2 1.4 2.6 3.6 2.1 3.2 2.0 1.6 2.4 3.2 1.1 2.4 3.1 0.8 1.4 2.2
P
0.1
0.1
0.1 0.0
O,l
0.1
0.1 0.0 0.0
0.0 0.0
0.0 0.1 o,o
-r
-
0
43.5 44.2 44.0 46.7 47.4 46.4 46.9 47.2 47.2 47.4 47.2 47.7 47.7 47.6 47.5 47.5 48.3 47.9 47.6 47.9 48.1 48.0 48.6 48.1 48.9 46.2
* Although original sources are quoted, many of these averages have been modified in recalculations by the writers.
109

JACK GREEN and ARIE POLDERVAART
altered (cf. ECKELMANN and POLDERVAART, 1957). Of greatest chemical interest are metamorphic changes that are accompanied by significant variation in bulk chemical composition. These are usually called metasomatic to distinguish them from metamorphic effects in which there is no appreciable change in major chemical constituents other than water.
Probably the most important low-temperature metasomatic change in sedi- ments is dolomitization of limestone. DALY (1909) has estimated the Ca/Mg ratio in all pre-Devonian limestone at 3.35 and in all Devonian to Recent limestone at 20.01. This may be compared with a Ca/Mg ratio of 0.50 in Precambrian slate (NANZ, 1953), 0.73 in Paleozoic shale, and 2.67 in Mesozoic and Cenozoic shale (CLARKE, 1924). Undoubtedly the biosphere has played a major role in this distribution of Ca and Mg in geologic time (cf. KUENEN, 1950, pp. 392-394). How- ever, dolomitization of limestone and the Mg content of argillites may also be influenced by the salinity and pH of water (BiVIRRE, 1939, 1940; MILLOT, 1949; SANDER, 1951).
Several authors have remarked on the enormous amounts of Ca now stored as carbonates in sediments. Usually this is attributed to derivation of sediments from predominantly mafic igneous rocks, but this supposition appears less likely if amounts of Mg and Fe are also considered. There is “not enough” Mg and Fe in sediments and sea-water combined. Consideration of Na/K ratios in igneous rocks, sediments, and sea-water renders derivation of sediments from basaltic source rocks even more unlikely. The alternative is that Ca is continually stored as carbonates at or near the earth’s surface, similar to the continual storage of Na in sea-water. If CO, is combined with Ca for CaCO, in POLDERVAART’S (1955, p. 132) average sediment, the remainder when recalculated to 100 per cent and adjusted for Na/K ratio, comes remarkably close to average granodiorite, not average basalt.
Dolomitization is not the only indication of displacement of Ca in rocks. Ground-water dissolves and redistributes Ca in buried rocks, while it often deposits CaCO, nearer the surface. Studies of hydrothermal alteration frequently indicate solution of Ca at depth and deposition of CaCO, at higher levels. Plutonic pro- cesses may also redistribute Ca and perhaps this accounts for the relative scarcity of marbles in plutonic terranes and the decrease in Ca implicit in the formation of para-amphibolites from limestones or dolomitic shales (cf. ADAMS, 1909; BACKLUND, 1953).
Excellent studies are available of hydrothermal alteration of rocks, but the changes are not easily analysed quantitatively. Changes induced by low- temperature metasomatism often run contrary to trends of magmatic differentia- tion. Late residual magmas are usually poor in Ca, Mg, and Fe, yet accompanying hydrothermal solutions frequently dissolve these elements from igneous rocks and deposit them elsewhere as calcite, dolomite, illite, sericite, chlorite, nontronite, or iron oxides (cf. LOVERMO, 1949; SCHWARTZ, 1950; STRINGHAM, 1953; JAFFE, 1955; KERR et al., 1955). In these respects low-temperature metasomatism resembles chemical differentiation produced by sedimentary processes.
Somewhat more is known of high-temperature chemical changes effected by plutonic processes. The overall change from shale, slate, or phyllite to schist,
110

Petrochamicel fields and trends
gneiss, and granitic gnaiss by progressive feldspathization is well-known and has been a cause cdlkbre in the granite controversy. Marked chemical changes in the plutonic series from ar~illite to ~r&~iti~ para-gn~~ss can ha,rdly be denied and have been demonstrated repeatedly in di rent localities. LAPADU-HAWXJES (1945) has discussed these changes on the basis of averages computed by him. Averages of rn~t~rnorphi~ rocks calculated by POLDERVAART (1955) are based on larger numbers of analyzes, yet are not sig~i~~antly deferent from LA~~~u-~AR~~E~’ (1945, 1953) results. However, averages are still too few in number and thorough chemical studies of particular regions affected by platonic processes are also
Fig 8. Cz+NwK diagram for metamorphic rocks.
scarce. It is therefore only possible to analyse the main chemical changes which attend feldspathization. At present details cannot be discussed quantitatively,
A change from argillite to granitic gneiss involves a compositional trend towaxd granite on the ~gneons trend. Fig. 8 shows averages of meta-
morphic rocks plotted on a Ca-Na-K diagram. The igneous and sedimentary medians are altJo indioated. The trend shown is that for a series from normal potassi~ shale to granjt~~ para-g~eiss, and indicates progressive relative enrichment in both Na and Ca. The three points near the Ca corner represent averages for amphibolites and eclogites. The points nearly coincide with the poaition of average basal&. If such rocks are feldsp~t~zed and converted into gra~~tic gneiss, the compositional trend would be entirely different and involve progressive enrichment in Na and K, with decrease in Na/K ratio. Thus a number of different trends could be drawn, of which the trend of the series shale-g~~nitie gneiss is only one example. This pa~~~u~ar series has been selected because it is believed to be most common in plutonic regions.
Fig. 9 shows the same eleven diagrams used for igneous and sedimentary rocks, The Si-Al-Big di~~arn is again not i~st~~Gt~ve and metamorphic averages
111

JACKGREENMI~ARIE POLDERVAART

Petmchemical fields and trends
are nearly in the same positions as igneous rocks and sediments. The other ten
diagrams are more satisfactory. In these diagrams the igneous trend is shown
as well as the field of normal sediments. The beginning of the igneous trend is
the position of average basalts and in all diagrams the three averages for amphi- bolites and eclogites fall near this point. The additional trend shown is that from
average shale to granitic gneiss. Combined alkalis consistently increase in all the diagrams. Likewise, iron
consistently decreases, except in the Fe-Mg-Ca diagram. Ca increases gradually relative to iron and magnesium (CaFe-Mg diagram), but in the other five diagrams which include calcium, there is a small initial increase, after which there is no significant change in proportions of calcium. Aluminium increases relative to iron, but decreases relative to combined alkalis. Relative to calcium, aluminium shows at first a small decrease, probably due to initial increase in calcium content, after which both aluminium and calcium retain about the same proportions. Mag- nesium increases relative to iron but decreases relative to aluminium. Relative to calcium and combined alkalis, the proportion of magnesium varies little initially but decreases in the change from biotite schist to granitic gneiss. These variations indicate that in the metasomatic transformation of argillites into granitic gneiss: (1) combined alkalis are added, (2) initially a little calcium is also added, and (3) iron and magnesium are diminished, with first decreases of iron preceding first decreases of magnesium.
Addition of combined alkalis probably means that the fluid medium for metasomatism contains Na, K, Al, and Si, roughly in the proportions of alkali feldspar, but with a small excess of alkalis (cf. MOREY and CHEN, 1955). Although in the transformation of argillites there is apparently preferred fixation of Na rather than K, it does not follow that the metasomatizing fluid contains more Na than K. In the same terrain one often finds feldspathized argillites (preferred fixation of Na) associated with feldspathized amphibolites (preferred fixation of K). The initial small increase in Ca is probably not very significant. Thick sedimentary wedges usually contain calcarenites, and in the initial stage of metamorphism Ca may well be redistributed throughout the sedimentary sequence, as well as sub- tracted from the sequence as a whole. These adjustments can easily account for small gains in Ca in argillitic members while at the same time Ca is lost in more calcareous members of the same succession. The decrease in Fe. and Mg has greater import. In part this decrease is probably a dilution effect and reflects continued addition of feldspar-making material. However, there is evidently also removal of Mg and Fe in the feldspathization of argillites.
LAPADU-HARGUES (1945), REYNOLDS (1946), and others have emphasized the development of mafic fronts in regional feldspathization. The writers believe that the problem of basification is essentially one of time and place and not necessarily in contradiction to regional homogenization. Chemical changes proceed during initial heating of sediments when dehydration occurs (cf. YODER, 1955). These injtial metasomatic phases of plutonism have relatively low temperatures and may in part be compared with hydrothermal alteration. Originally existing chemical contrasts between rocks may be accentuated during these phases and this may result in geochemical culminations and depressions. Ultimately these
3 113

JACK GREEN and ARIE POLDERVAART
initial effects are smoothed out by continued high-temperature metasomatism, but in any particular terrain this may not have advanced far enough to result
Probably ma& fronts are developed in early phases
of plutonism in any particular place, but gradually there is a shift toward the development of mafic rears as feldspathization continues and magmatic conditions are approached, In intermediate phases mafic fronts are represented by scattered relicts (skial~t~~) in thoro~gbly fe~dspathized and borno~~n~~ed terrains.
Table 4.. Averages of silicate phase of stony rmteorites
Index si
No. Ti Cr
0.3
o-3 0.3
0.2 o-4
0.5 0.3
O-4
Fe
-.
13-5 10.5 12.3
1.0
19.6
7.8 12.6 13.2
Mn
0.2 0*2 0.2
0.2 O-2 0.3
OS4
0.3
Mg
f7.3 18.5 17.8 19.4 15.6
19.7 5.9
16.5
Ca Na K
I ~ P
O-1 o-1 0.1 0-I O-2
0.0
0.0 0.2
-
-
A..
C 0
--
i 42.6 - 43.4 - 43.0 - 47.2 3.2 38.8 - 44.8 ___ 43.0 - 42.9
i
INDEX TO TABLE 4
l.* Low total iron chondrites (56) 2.* High total iron ahondrites (40) A* Averlage ehondritc (96) 3. Enststitc chon~~~s (6) 4. C~~b~~~~us cbo~~it8s (15)
5. Chon~itic-type achondrite (12) 6. Basaltic-type schondrite (22) B ‘Stony mcteoritc (107), BROWN and PATTERSOW
(1947, p. 407).
* Exclusive of enstatite--snd carbonaceous ohondrites, inclusive of two amphoteric chondrites; Manbhoom (modified analysis by UREY and CRAIG, 1954, p. 63) and Vavilovka (UREY and CRAIG, 1953, p. 55).
The peak of plutonism is represented by partial melting (pa&genesis) of the
rocks. The less refractory (salic) constituents then form new magmas which migrate and intrude rocks elsewhere in the crust, while the more refractory (fern&) constituents remain be ind as mafic rears. During the intermediate phases of regional feldspathization, mafic constituents (Ca, Fe, Mg), removed from the feldspathized’ rocks, may migrate with the metasomatizing fluid toward lower temperature regions in the crust where the effects of their passage are showy as hydrothermal alteration.
Although present data only allow analysis of the transformation of argillites into granitic gneiss, it is apparent from the literature that all types of Poe-existing rocks affected by plutonic processes tend to change toward the composition of granite. The plutonio series is extended from these autochthonous granites into parauto~hthonous granites, and finally into mi~mati~ and ma~matic intrusive granites (cf. READ, 1955).
SToNY METE:ORLTES
Table 4 lists averages of six types of stony meteorites‘ Na and K for averages A, 5 and 6 have been corrected in accordance with EDWARDS and U~EY (1955)
114

Petroohemical fields and trends
and EDWARDS ( 1956). Together with 151 individual analyses of stony meteorites, these data form the basis for the fol~ow~~~ ~scuss~o~,
PRIOR (1916, p. 26) has noted that a low metallic iron phase in chondrites is associated with a high percentage of iron in the silicate phase. UREY and CRAIG
100
80
10
8
6 5 4
1234 1234 1234 1234 _ 14 1234 1234 1 Si Al Fe Mg Ca Na K
Fig. 10. Concentration ratios of average chondrite and averages of Paoific basalt, intermediate and silicic igneous rocks, and sediment.
(I) Average Pacific olivine basalt. (2) Average intermediate igneous rook. (3) Average silicic igneous rock. { 4) Av6r&ge u~etamor~hosed sediment.
(1953, p, 58) and WIIK (1956, p. 282) have recorded a bimodal distribution of total ison (silicate, sulphide, and metal phases) in superior chondrite analyses. Thus chondrites are divided into a high total iron group and a low total iron group. The dist~bution of ircrn in the silicate phase of these superior analysts also shows a bimodal distribution, but this has a reciprocal relationship to the distribution of iron, Hence the, high total iron group, of chondrites has less iron in the silicate phase than the low total iron group. Enstatite ehondrites haye a
115

JACK GREEN and ARIE POLDERVAART
high total iron content, a high pereentage of metallic iron, but a low percentage of iron in the silicate phase. Carbonaceous chondrites have a high total iron content, a low percentage of metallic iron, and a high percentage of iron in the silicate phase. Chondritic-type achondrites are low in calcium, contain oligoclase, and have an Fe/Mg ratio of about 0.4. Basaltic-type achondrites are high in calcium, contain calcic plagioclase, and have an Fe/Mg ratio of about 2.1.
Fig. 10 illustrates differences in main elements between average chondrite (A of Table 4) and Pacific olivine basalt (GREEN and POLDERVAART, 1955, p. 179),
intermediate and silicic igneous rocks (NOCKOLDS, 1954, p. 1032), and average sediment (POLDERVAART, 1955, p. 132). Differences are expressed as concentration ratios relative to average chondrite, and are plotted on a logarithmic scale. Al shows a fourfold enrichment in terrestial rocks; Fe and Mg are impoverished in these rocks. Ca has a range from about 1 in silicic igneous rocks to about 8 in average sediment. K has a range from about 7 in Pacific olivine basalt to about 30 in silicic igneous rocks.
K Ca Fig. 11. Ca-Na-K diagram for silicate phase of stony meteorites.
In Figs. 11 and 12 the six types of stony meteorites have been plotted on the same diagrams used in earlier sections. The igneous trend is shown on the diagrams for comparison.
Fig. 11 is a Ca-Na-K diagram on which the eight averages of Table 4 have been plotted in addition to Pacific olivine basalt (C), the median line for igneous rocks, and the igneous trends basalt-latite+trachyte-phonolite and basalt-andesite- daciterhyolite (Fig. 3). The diagram illustrates the lack of Na-K fractionation in stony meteorites. The position of point C relative to point 6 (basaltic-type
116
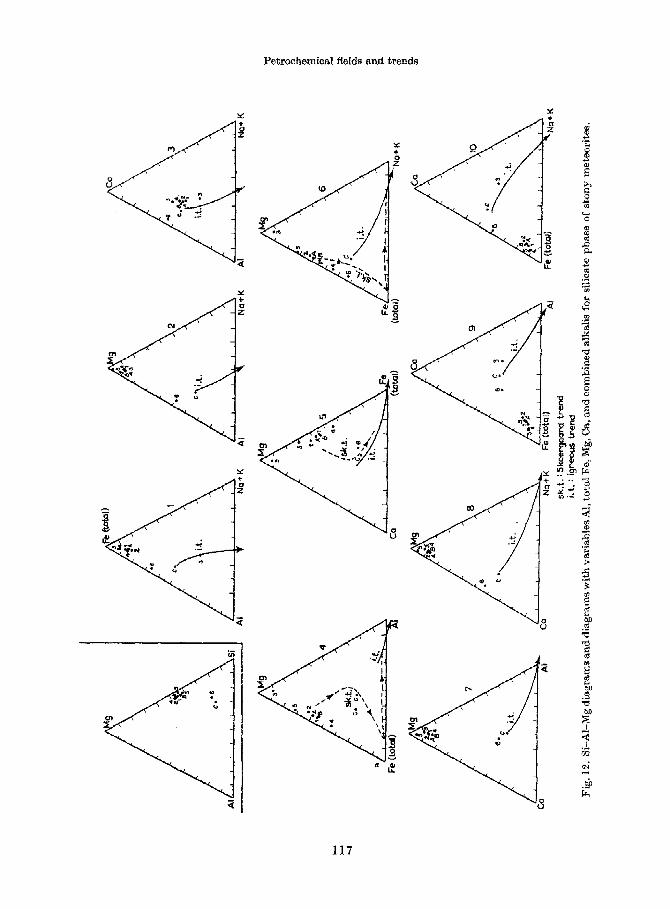
Y + 0
Y
c *i”, B
117

achondrite) is noteworthy. The writers consider the term “basaltic-type achon- drite” as misleading; compositions of these meteorites do not resemble those of
basalts. Fig. 12 shows eleven diagrams arranged in the same order used for igneous
rocks (Fig. a), The Si-Mg--AI‘ diagram shows all points, including the point for basaltic-type achond~te (6). Point C again represents Pacific olivine basalt. The following 10 diagrams show the 8 rnet~~~i~~ averages, as well as the igneous trend (Fig. 4) and Pacific olivine basalt (point C).
Crauy, 1, Three diagrams with side Al-(Na f, K). The meteorite averages in these diagrams group together, but the point for basaltic-type stchondrite (6) is outside the group in all three diagrams while the point for enstatite chondrite (3) falls outside the group in two of the diagrams, The tendency to cluster reflects the lack of alkali enri~bme~t in stony meteorites.
~r~~~ 2. Three diagrams with side Fe-Mg. These diagrams reflect the major role of F&iNg differentiat~u~ in stony rn~teo~it~~ in the wide spread of the points along the side Fe-Mg of the diagrams. For oomparison the Skaergaard trend (WAGER and DEER, 1939) has been added to the diagrams as a broken line. The point for basaltic-type achondrite (6) deviates from the alignment of the meteorite points in the first two diagrams of this group, but conforms with the other points in the Mg-Fe-(Na + K) diagram.
~~0~~ 3. Four ~agra~s with corner Ga and without the pairs Al-(Na + Kf g; The points are again gru~ped together, with the points for basaltic-
type achondrite (6) outside the group in all four diagrams and the point for enstatite chondrite (3) outside the group in the two diagrams which include Fe.
PRIOR (1916, pp, 39-40) has expressed the opinion that progressive oxidation has been of major importance in the formation of stony meteorites, and is reflected in varirttions in the metallic iron phase. UREY and CRAIG (1953, p_ 56) have postulated an initially oxidized state with subsequent reduction by hydrogen and oxidation by water, to produce observed variations in the rn~ta~~~~ iron phase. IIowever, the last two authors point out that the b~modal distribution of total iron in chondrites cannot be explained by differences in oxidation or reduction. They suggest a theory involving selective collision of asteroids to account for the two groups of chondrites.
The diagrams of Fig. 12 indicate to the writers that compositional differences between the various types of stony meteorites have resulted from generally operative processes and not from chance collisions between asteroids. This impressiun is Ferber strengthened if all 151 individual analyses are plotted on the diagrams, In the ~kaergaard intrusive of eastern Greenland ~~A~~R and DEER, 1939), high concentrations of iron in silicates have resulted from fractional crystallization. In many respects the Skat?rgaard trend resembles differences shown by stony meteorites, except that in fhe latter alkali enrichment is negligible, Thus the writers favour a theory of fractional melting to account for observed differences in iron content of stony meteorites.
In the formation of stony me~orit~s, three phases can bs di~ti~g~~isbed~ (If accretion, (2) condensation and compaGt~o~, and (3) fragmentation. During accretion an oxidizing environment may have prevailed. Condensation and
118

Pctxoc~cmical fXds and tzends
compaction with attendant increase in pressure and temperature, may ha~er~s~lted in partial expulsion of water and a change from an oxidizing to a reducing environment. Radioaotive heating (UREY, IQ!.%)* and compaction finally resulted in fractionation by partial melting. Several arguments (KUIPER, 1955, 1956; WREY, 1955) indicate that at least the larger asteroids had differentiated shortly (less than lo9 year) after their formation and before fragmentation Fragments which reach the earth are probably differentiates and mixtures of differentiates (cf. NESS and HENDERSQN, 1949; WAHL, 1952). Thus the iron enrichment shown by stony meteorites is th#~gbt by the writers to reflect fra~t~o~ati~~l by partial me~tiug. In contrast, the igneous trend from mafic to silicic igneous rocks shows the effects of fractionation by partial ~rystalli~ati~u. Here iron enrichment at first competes with and ultimately yields to alkali enrichment.
Stony meteorites are believed to reflect also the early steps in the differentiation of the primitive earth during the first billion years after its formation. One of the
writers (POLDERVAART, 1955, p* 140) has pointed out that this is probably also the time of formation of most of the sificic to intermediate crustal material now concentrated in the continental plates. Thus the problem of stony meteorite di~erentiation is comple entary to that of the ~~e~i~al evolution of the earth’s crust *
A~~~~~~?~~dg~~~~~~ The writers gratefully acknowledge receipt of a grant from the Kemp Fund of Columbia University to aid in the preparation of diagrams and manuscript. The writers also wish to express their appreciation of the splendid co-operation of W. W. RTJBEY in making his unpublished average compositions of oceanic sediments available. They are further indebted to H. H. HESS and I). M. SHAW for unpublished data used in averages given here. Finally they acknowledge critical r~&ding of the manuscript by A. F. BUDDINGTQ~~ and H. H. HESS, who made many valuable suggestions j~corpo~ated in the paper.
bite added ilz ~r~~~: Some recent Russian ~~bl~~ations relating to the distribution of the major elements in the common rock types have appeared in the literature (VINOORADOV, Rowov and RATYNSKII, 1952; VXNOCRADOV, 1956; V~N~GRADOV and RONOV, 1956). Analytical data from the latter reference are in appended Table 2(a) and are included in Figs. 5, 6 and 7.
Na/K ratios obtained from this table show an increase with time and relate to argument on the improbability of basaltic source rocks for sediments during the bulk of geologic time. Grouped data by ~I~~~~A~~v and Rmov (1956, p. 11) show a NafK ratio of O*f’? for Paleozoic clays and shales (203 composites based on 5720 individual specimens) and a NafK ratio of @42 for Mesozoic clays a (32 composites based on 704 individual spe~im~us)~ VI~Q~RA~UY and Ros~ov (1956) believe that low Na/K ratios in the early Paleozoic are possibly due to more inten- sive formation of weathering products enriched in potassium.
Relative to discussion on low temperature metasomatic changes in sediments, attention is called to the increase in Ca/Mg ratio with time in both clays and carbonates (VI~O~RABOV, Ro~ov and RATYNSEII, 1952) of the Russian Platform.
* Recent analytical data have presuaded UREY (1956, p. $91) to b&eve that radioactive heating is a minor factor in the melting af mint-sal~~ in chondrites.
119

JACK GREEN and ARIE POLDERVAAFLT
The graphed data appear on pages 173 and 274 of volume 12 of Geochimicn et Cosmochimica Acta in reviews prepared by CHILINGAR. The ratios show considerable fluctuation. The major “break” in Ca/Mg ratio for clays occurs in the early Paleozoic and does not coincide with the major “break” for carbonates which is in the latter half of the Mesozoic. Discussion of the tectonic, paleotemperature, and biochemical factors producing these fluctuations cannot be attempted here. Extrapolation of these data to other areas should be done with caution and only after statistical analysis of comparable numbers and distribution of samples.
REFERENCES
ADAMS F. D. (1909) On the origin of the amphibolites of the Laurentian area of Canada. J. Geol.
17, 1-18. BACKLUND H. G. (1953) The granitization problem. Estud. Geol. Inst. Mallada 9, 71-106. BOWEN N. L. (1954) Experiment as an aid in the understanding of the natural world. Proc.
Acad. Nat. Sci. Philad. 199, 1-12. BO~VEN N. L., SCHAIRER J. F. and WILLEMS H. W. V. (1930) The ternary system Na,SiO,-
Fe,O,SiOa. Amer. J. Sci. 5th Ser. 20, 405-455. BROW H. S. and PATTERSON C. (1947) The composition of meteoritic matter: I, The composition
of the silicate phase of stony meteorites. J. Geol. 55, 405-411. BUERGER M. J. (1948) The role of temperature in mineralogy. Amer. Mineral. 33, 101-121. CLARKE F. W. (1924) The data of geochemistry. U.S. Geol. Surv., 5th ed., Bull. 770, 841 pp. DALY R. A. (1909) First calcareous fossils and the evolution of the limestones. Bull. Geol. Sot.
Amer. 20, 153-170; (1933) Igneous Rocks and the Depths of the Earth. 598 pp. McGraw-Hill,
New York. ECKEL E. C. (1904) On the chemical composition of American shales and roofing slates. J. Geol.
12, 25-29. ECKELMANN F. D. and POLDERVAART A. (1957) Research on Archean rocks of Beartooth
Mountains (Montana-Wyoming). I. Origin and structure of granitic gneiss and migmatite in Quad Creek area. Bull. Geol. Sot. Amer. 68.
EDWARDS G. (1956) Sodium and potassium in meteorites. Geochim. et Cosmochim. Acta 3, 285-294.
EDWARDS G. and UREY H. C. (1955) Determination of alkali metals in meteorites by a distil- lation process. Geochim. et Cosmochim. Acta 9, 154-168.
FREDERICKSON A. F. and Cox J. E. (1954) “Solubility” of albite in hydrothermal solutions.
Amer. Min. 39, 738-749. GOLDBERG E. D. and ARRHENIUS G. 0. S. (1957) Chemistry of Pacific pelagic sediments. Geochim.
et Cosmochim. Acta 13, 153-211 GOLDSCHMIDT V. M. Der Stoffwechsel der Erde. Norsk Videnskapsselskapets Skrifter. I. Mat.-
naturv. Klasse, 11, l-25; (1933) Grundlagen der quantitativen Geochemie. Forts&r. Min.
17, 112-156. GREEN J. (1953) Geochemical table of the elements for 1953. Bull. Geol. Sot. Amer. 64, IOOl-
1012; (1955) Conversion factors for silicate analyses. N.Y. Acad. Sci. Ann. 62, 295-326. GREEN J. and POLDERVAART A. (1955) Some basaltic provinces. Geochim. et Cosnzochim. Acta
7, 177-188. GROUT F. F. (1938) Petrographic and chemical data on the Canadian Shield. J. Geol. d&486-504. HESS H. H. and HENDERSON E. P. (1949) The Moore County meteorite; a further study with
comment on its primordial environment. Amer. Min. 34, 494-507. JAFFE F. C. (1955) Les ophiolites et les roches connexes de la region du Co1 des Gets. Suisse
Min. Pet. Bull. 35, fast. 1, 150 pp. KERR P. F., KELLEY D. R., KEYS W. S. and BODINE M. W. JR., (1955) Annual Report for
June 30, 1954 to April 1, 1955. Part 3. Collapse features, Temple Mountain uranium area, Utah. U.S. Atomic Energy Comm. R.M.E.-3110 (pt. 3), 138 pp.
KNOPF A. (1916) The composition of the average igneous rock. J. Geol. 24, 62&622.
120

Petrochemical fields and trends
KUENEN P. H. (1950) Marine GeoZogy. 568 pp. John Wiley, New York. KUIPER G. P. (1955) On the origin of the lunar surface features. Proc. Nat. Acad. Sci. Wash.
40, 10961112; (1956) The formation of the planets. Pts. I-III, Roy. A&on. Sot. Canada J.
50, 57-68, 105-121, 158-176. LAPADU-HARCUES (1945) Sur l’existence et la nature de l’apport chimique dans certaines series
crystallophylli&mes. Sot. Gkol. Frunce Bull., 5th ser., 15,255-310; (1953) Sur la composition chimique des amphibolites. Sot. GgoZ. Prance Bull. (6th ser.), 3, 153-173.
LARSEN E. S. (1948) Batholith and associated rocks of Corona, Elsinore, and San Luis Rey quadrangles, Southern California. Bull. GeoZ. Sot. Amer. Mem. 29, 182 pp.
LEITH C. K. and MEAD W. J. (1915) Metamorphic Geology. 337 pp. Holt, New York. LOVERING T. S. (1949) Rock alteration as a guide to ore-East Tintic District, Utah. Icon.
GeoZ. Monograph 1, 65 pp. MACDONALD G. A. (1949) Hawaiian petrographic province. Bull. GeoZ.Soc. Amer. 60, 1541-1595. MASON B. (1952) Principles of Geochemistry 276 pp. John Wiley, New York. MILLOT G. (1949) Relations entre la constitution et la genese des roches sedimentaires argileuses.
G6oZ. It2ppZ. 2, no. 2-4, 352 pp. MOREY G. W. and &EN W. T. (1955) The action of hot water on some feldspars. Amer. Min.
40, 996-1000. NANZ R. H., JR. (1953) Chemical composition of pre-Cambrian slates with notes on the evolution
of lutites. J. GeoZ. 61, 51-64. NOCKOLDS S. R. (1954) Average chemical composition of some igneous rocks. Bull. GeoZ. Sot.
Amer. 65, 1007-1032. NOCKOLDS S. R. and ALLEN R. (1953) The geochemistry of some igneous series. Geochim. et
Cosmochim. Acta 4, 105-142; (1954) The geochemistry of some igneous rock series, part II. Geochim. et Cosmochim. Actu 5, 245-285.
PETTIJOHN F. J. (1949) Sedimentary rocks 526 pp. Harper & Brothers, New York. POLDERVAART A. (1955) Chemistry of the earth’s crust. GeoZ. Sot. Amer. Special Paper 62,
119-144. PRIOR G. T. (1916) On the genetic relationship and classification of meteorites. Miner. Mug. 16, 26-44.
RAMBERG H. (1951) Remarks on the average chemical composition of granulite facies and amphibolite-to epidote amphibolite facies gneisses in West Greenland. Dan&. Geologtik Forening. Middelelser. 12, 27-34.
READ H. H. (1955) Granite series in mobile belts. GeoZ. Sot. Amer. Special Paper 62, 409-429. REYNOLDS .D. L. (1946) The sequence of geochemical changes leading to granitization. Quart. J.
GeoZ. Sot. Lond. 102, 389-446. RIVII%RE A. (1939) Sur la dolomitisation des sediments calcaires. G. R. Acud. Sci., Paris. 209,
597-599; (1940) L’eau de mer et les sediments calcaires. C. R. Sot. GkoZ. France. 5, 40-42. RUBEY W. W. (1951) Geologic history of sea-water. Bull. GeoZ. Sot. Amer. 62, 1111-1148;
(1955) Development of the hydrosphere and atmosphere, with special reference to probable composition of the early atmosphere. GeoZ. Sot. Amer. Special Paper 62, 631-650; (in pre- paration) Compilation of published chemical analyses of sedimentary rocks of the United States. U. S. GeoZ. Surv., Wash. D.C.
SANDER B. (1951) Contributions to the study of depositional fabrics. (Translated by KNOPF E. B.) Amer. Assoc. Petrol. GeoZ. 160 pp.
SCHWARTZ G. M. (1950) Problems in relation of ore deposits to hydrothermal alteration. CoZo. Sch. Min. Quart. 45, 197-208.
SEDERHOLM J. J. (1925) The average composition of the earth’s crust in Finland. Bull. Comm. gdol. F&Z. 12, No. 70, 20 pp.
SHAW D. M. (1956) Geochemistry of pelitic rocks. Part III: Major elements and general geo- chemistry. 67, 919-934.
SIMPSON E. S. W. (1954) On the graphical representation of differentiation trends in igneous rocks. GeoZ. Mag. 91, 238-244,
STRINQHAM B. (1953) Granitization and hydrothermal alteration at Bingham, Utah. Bull. GeoZ.
Sot. Amer. 64, 945-992.
121

JACK GREEN and ARIE POLDERVAART
SUJKOWSKI ZB. L. (1952) Average chemical composition of the sedimentary rocks. Amer. J. Sci.
250, 360-374. SVERDRUP H. U., JOHNSON M. W. and FLEMING R. H. (1946) The Oceans 1060 pp. Prentice
Hall, New York. TYRRELL G. W. (1933) Greenstone and greywackes. R&union Intern. pour I’Etude prdcamb.
1931, C.R. 24-26. UREY H. C. (1951) The Planets. Their Origin and Development 245 pp. Yale Univ. Press, New
Haven, Corm. ; (1955) The cosmic abundance of potassium, uranium, and thorium and the heat balances of the earth, the moon, and Mars. Nat. Acad. Sci. Proc. 41, 127-144.
UREY H. C. (1956) The cosmic abundance of potassium, uranium and thorium and the heat balances of the earth, the moon and Mars. Proc. Nat. Acad. Sci. 42, 889-891.
UREY H. C. and CRAIG H. (1953) The composition of the stone meteorites and the origin of the meteorites. Geochim. et Cosmochim. Actu 4, 3G-82.
VERHOOGEN J. (1954) Petrological evidence on temperature distribution in the mantle of the earth. Trans. Amer. Geophys. Un. 35, 85-92.
VINOGRADOV A. P. (1956) Distribution regularity of chemical elements in the earth’s crust.
Geokhim. No. 1, pp. 6-52. VINOGRADOV A. P. and RONOV A. B. (1956) Evolution of chemical composition of clays of the
Russian Platform. Geokhim. No. 2, pp. 3-18. VINOGRADOV A. P., RONOV A. B. and RATYNSKII V. M. (1952) Variation in the chemical com-
position of carbonate rocks of the Russian Platform. Izv. Akad. Nauk. SSSR Geol. Ser. No. 1, pp. 33-50. Cited from review prepared by G. CHILINGAR in Geochim. et Cosmochim. Acta 12, 273-276.
VOGT J. H. L. (1931) On the average composition of the earth’s crust, with particular reference to t,he contents of phosphoric and titanic acid. Skr. Norske Vidensk. Akad. I, Mat.-naturv. KI.,
7, 48 PP. WAGER L. R. and DEER W. A. (1939) Geological investigations in East Greenland. Part 3.
The petrology of the Sksergaard intrusion, Kangerdlugssaug, East Greenland. Medd. Gr6nland, Bd. 105, Nr. 4, 335 pp.
WAHL W. (1952) The brecciated stony meteorites and meteorites containing foreign fragments. Geochim. et Cosmochim. Acta 2, 91-117.
WICKMAN F. E. (1954) The “total” amount of sediments and the composition of the “average igneous rock”. Geochim. et Coemochim. Acta 5, 97-110.
WIIK H. B. (1956) The chemical composition of some stony meteorites. Geochim. et Goemochim. Acta 29, 279-289.
YODER H. S., JR. (1955) Role of water in metamorphism. Geol. Sot. Amer. Special Paper 62, 505-524.
122