Audience Trends. Insight Trends. Solution Trends. - Become a ...
162
Audience Trends. Insight Trends. Solution Trends.
-
Upload
khangminh22 -
Category
Documents
-
view
0 -
download
0
Transcript of Audience Trends. Insight Trends. Solution Trends. - Become a ...

Audience Trends.Insight Trends.Solution Trends.


Country-by-country DatabaseThe TV Key Facts 2017 database is available on www.rtl-adconnect.com/tvkeyfacts
Once connected with your personal code, you will be able to browse our exclusive country-by-country da-tabase which provides a detailed outline of the tele-vision landscapes, market-by-market.
In particular, it details the TV landscapes with do-mestic and foreign channels, pay TV and digital TV as well as viewing patterns, differentiated audience figures and advertising expenditures, covering:
39 countries
35 European countries
Austria, Belarus, Belgium, Bulgaria, Croatia, Cyprus, Czech Republic, Denmark, Estonia,
Finland, France, Germany, Greece, Hungary, Ireland, Italy, Latvia, Lithuania, Luxembourg,
Macedonia, Netherlands, Norway, Poland, Portugal, Romania, Russia, Serbia, Slovakia, Slovenia, Spain, Sweden, Switzerland, Turkey,
Ukraine, United Kingdom.
4overseas countries
India, China, Japan, United States.
Personal access activation
1. Enter the 6-letter activation code printed on the card you received.
2.Enter your own e-mail address.
3.Create a personal password which you can easily remember.
You will immediately receive a confirmation by e-mail. For future connections to the database, you will only need your e-mail address
and your personal password, the activation code won't be needed again.

Insight Trends. 58. Audience Measurement Is Catching
Up On TV Consumption Habits Florent Carême, Eurodata TV Worldwide
64. The World of Television Alain Beerens, egta
68. Focus. Facts & Figures About TV Effectiveness
74. Video Is Becoming Increasingly More Important To Children Brigitte Bayer, Mediengruppe RTL
76. Virtual Nannies, Apps & Augmented Reality Rupert Schäfer, Nunatak Group
82. Everyday Heroes for Kids How brands become – and stay – relevant
Cornelia Krebs, Mediengruppe RTL Deutschland
88. The Kids Are Alright: Millennial TV Viewing Trends Might Be Getting Better
Duncan Stewart, Deloitte
1. Country-by-country Database
4. The pioneering spirit Guillaume de Posch & Bert Habets, Co-CEOs of RTL Group
8. Reach More with Total Video! Stéphane Coruble, Managing Director of RTL AdConnect
10. Dataviz. 2016Facts&Figures 2016WorldViewingTime European TV Viewing Time & Technological Developments Total Video Investments
Audience Trends. 22. InternationalTrends2016-17
Candice Alessandra, Eurodata TV Worldwide
30. Interview. Success Story: UFA Nico Hofmann, UFA Group
38. Focus. It’s True Even If It Never Happened Carsten Göttel, SUPER RTL
42. Entertainment evolution: Online screens, OTT and new technologies Abed Laraqui, Eurodata TV Worldwide
48. MCN & Original Content Siglinde Martínez, Eurodata TV Worldwide
Table ofContents

Solution Trends. 98. Marketing of Tomorrow The Four Factors for Success Jens Pöppelmann, IP Deutschland
102. Interview. StyleHaul’s data ecosystem Stephanie Horbaczewski, StyleHaul
106. Focus. Facing GAFA Players, European Media Groups Form Data Alliances RTLDeutschland,Prosiebensat.1andUnitedInternet’slog-inalliance Gravity, the French data alliance General Data Protection Regulation (GDPR)
112. Interview. Addressable TV in Europe Thorsten Schütte-Gravelaar, smartClip
120. The Future of Connected Experiences Bianca Stockreiter, TRENDONE
122.The4KeyLeversofAdQuality Martin Bromfield, comScore
126. Focus. More Targeting Solutions The “Cat” in the Cross-Media Jungle Elena Nigra, Rai Pubblicità BehaviouralTargetingatM6 Spott by Appiness & IP Belgium Ludovic de Barrau, RTL Belgium
Advertisers. 134. Focus. Advertisers’ insights
136. Case studies. When Lastminute.com Meets Talent Shows Paypal Attracts Attention of Consumers with Telepromotion! Exclusive Concept to Boost Marc Cain Image Haier & Das Perfekte Dinner: a Powerful Sponsorship
Key Tables. 140. Viewing Time 141. Digital TV 142. BestSingleProgramme2016 143. BestRecurrentSeries2016 144. TV Equipment 145. Multi-Screen Technology 146. Electronic Audience Measurement 148. Top Advertisers & Advertising Sectors
150. Special Thanks 141. Imprint 152. About RTL AdConnect 156. About RTL Group
TV K
EY F
ACTS
201
7
2 3

number of digital studios and multi-platform networks, we also produce and aggregate more and more short-form content for platforms such as YouTube and Facebook. To summarise all this: maximising the consumers’ attention to our broad variety of video offers, across all devices – this is what we mean by Total Video.For example: With more than 238 million views, 2.7 million shares and 230,000 interactions, the audition of 12 year-old Darci Lynne for America’s Got Talent became the most-watched video on Facebook, reaching over 393 million people.Within 24 hours, the clip had already got more than 100 million views. This demonstrates the opportunity for content producers and owners to monetise their content on platforms such as Facebook. In WPP’s most recent ranking, 'Top 100 Most Valua-ble Global Brands', four of those in the top five
The pioneering spiritThe TV industry is becoming more complex and increasingly fragmented. With digitisation, consumer behaviour keeps on changing at a staggering rate. That’s why maintaining RTL Group’s pioneering spirit is more important now than ever before.
For most people, TV today still means the screen in their living room. But the business model of TV, and the wider industry behind it has moved on, and that definition of TV is no longer valid. Thinkbox, the UK’s television marketing body, defines TV nowadays as “the high quality, professionally-made, predo minantly long-form, audio-visual shows we watch on any screen.”But there is a wider and even easier definition. Here at RTL Group, TV stands for ‘Total Video’. We offer free-TV and pay-TV channels; mainstream channels and niche channels; online video in short and long form; traditional ad sales and tech-driven programmatic online advertising. Yet at the same time we have one clear focus: video content.And with FremantleMedia, we produce high-end dramas and big shows for all major free-TV channels, pay-TV channels and streaming services such as Netflix, Amazon Prime and Hulu. With our growing

Guillaume de Posch and Bert Habets,
Co-CEOs of RTL Group, have a clear
strategy for the age of ‘Total Video’
RTL AdConnect acts
as a kind of ‘connecter’
within RTL Group,
bringing together all of
our assets along the
‘Total Video’ value chain.
positions are placing big bets on video: Amazon, Google, Apple and Facebook. To work with, and yet compete with, the internet and tech giants of this world, we need well-coordinated responses across RTL Group. And this also means closer co-operation between our business units. You could even go one step further and say: we have to re-invent ourselves. And this is true for all ‘traditional’ TV players.
“Follow consumers wherever they are”Creativity in programming is the essence of success in our business. It is the starting point for everything we do and it's what makes us stand out. Producing, aggregating, distributing and monetising the best content, across all formats and genres – that is our successful business model. As the importance of exclu-sive local content is growing, so do our opportunities. >
TV K
EY F
ACTS
201
7
4 5

Having said that, leadership in creativity means allowing freedom to experiment, and not being afraid of failure. That is the culture we should foster. This also means we have to pull out all the stops to follow consumers wherever they are. The consumer perspective should guide what we do, as has been the case in other industries for decades. Consumers no longer mind where or how they watch our content, so why should we still draw strict lines between linear and non-linear, offline and online? Undoubtedly, consumers are now more willing to pay for their favourite video content in all markets. In recent weeks, both CBS and Disney announced to enhance their direct-to-consumer businesses, because “the media landscape is increasingly defined by direct relationships between content creators and consumers” as Disney CEO Bob Iger described. This is only the beginning of more direct-to-consumer offers and we will be part of this development. Nevertheless, advertising will remain our biggest reve-nue stream for many years to come. And we can only carry on successfully selling advertising if we
continue to innovate, to reach as many viewers, users and listeners as possible. Figures suggest that growth in the total video industry is mainly coming from non-linear and streaming. This means a more complex value chain, with tech and big data playing a bigger role for all successful business models in the digital media world. Therefore, investments in technology are no longer a nice-to-have in our industry, but a must-have. There is a lot of potential in further expanding and strengthening our data and technology-based competencies. Together with the very experienced management teams of SpotX and Smartclip, we are working on an ambitious growth plan for our ad-tech businesses. This plan includes close collaboration between SpotX and Smartclip, rolling out their solutions across our operations and scaling up the business with further acquisitions and partnerships.
The international ‘total video’ sales houseAt RTL Group, the pioneering spirit has been part of the Group’s DNA ever since its creation: from our first steps into radio back in the 1920s, to bringing moving

pictures to the screen in the living room and now – finally – to catering for consumers on all platforms, in all genres. Most of our programme spend is invested in local productions, news, magazines and sports. In total, RTL Group invests €2 billion in Europe’s creative industries, every year. Our advertising sales houses, and also RTL AdConnect, are at the forefront of this development. Following a comprehensive strategic review, IP Network rebranded to RTL AdConnect this summer. It is a gateway for advertisers wishing to communicate outside their home territory and keen to benefit from local exper-tise. The company’s USP encompasses incomparable reach, international insights and advanced strategic advertising solutions. At the same time, RTL AdConnect acts as a kind of ‘connecter’ within RTL Group, bringing together all of our assets along the ‘Total Video’ value chain with one dedicated purpose: to serve the needs of our advertising clients. x
At RTL Group,
the pioneering
spirit has been
part of the
Group’s DNA
ever since its
creation.
TV K
EY F
ACTS
201
7
6 7

Reach More with Total Video!The Total Video Key Facts brings guidance and expertise into the international advertising world. More than ever, in a complex media ecosystem,dataandinsights,latesttrendsandefficientandcreativesolutions are crucial.
When travelling in Europe and around the world what astonishes the most is that the world is becoming a global village. Just look at the very similar selection of retailers and shops on high streets all around the world. As a result of globalisation, you can find your favourite stores everywhere you go, from Paris to New York, Singapore to Berlin, London to Sydney.As an international advertising sales house, we need to take this trend into account and respond to global mar-keting objectives and KPIs more than ever. On the other hand, the world is not yet one giant common market-place where all consumers live and act the same way.For example, you might find it easier to roll out a marketing plan in the US, but when it comes to Eu-rope, you’ll need to be more granular, to take into account local customs and behaviour, local compe-tition, local legislation, local media habits, and so on.Moreover, it’s been proven that localised media plans will guarantee success and efficiency in Europe.
Stéphane Coruble,
Managing Director
When traveling in Europe and
beyond, what amazes me the
most is that the world is
becoming a global village.

The combination of global objectives with local insights and expertise is at the core of our DNA at RTL AdConnect. We combine our expertise across the different mar-kets in which we operate, while providing scale, pre-mium content, technology, innovation, access to in-fluencers and efficient advertising solutions to make sure advertisers succeed in reaching their global or multi-local objectives. Our mission is to provide sim-plified access to a Total Video marketplace across 12 territories and more. Thanks to our strong portfolio of media partners and state-of-the-art ad technolo-gy, we can offer advertisers self-served or program-matic buying for our digital ecosystem.
The whole is greater than the sum of its partsThe media industry has changed dramatically in the past decade. The ways to watch content using dif-ferent screens and players on the market has prolif-erated in recent years, leading to a very complex and fragmented media world. To stand out from their competitors, advertisers need a clear and simplified solution: more transpar-ency, efficiency, brand safety and trust.A local advertiser looking to branch out in the global market needs simplicity. Our role at RTL AdConnect is to give a clear breakdown of how our group’s local knowledge and expertise can make an impact in this complex media market, as we strongly believe that “the whole is greater than the sum of its parts”.Our pledge at RTL AdConnect for added value is based on three pillars: Audiences, to represent the power of our unique scale in Europe. Insights, to illus-trate our recognized expertise, studies and data col-lected in each country, and Solutions, to show how we engage our audiences with premium content in a secured environment.RTL AdConnect represents all of RTL Group’s media part-ners and beyond (ITV, Rai, Medialaan…). In an environ-ment where efficiency is a key factor, the decision-mak-ing process is shifting: sales are going from local to global or vice versa, resulting in a “glocal” approach. Thanks to our portfolio of more than 100 TV channels,
30 radio stations and 300 digital platforms, we reach 160 million consumers every day and accumulate more than 26 billion video views each month.Our Adtech partners help us to give advertisers sim-plified access to premium content and facilitate the development of pan-European campaigns. This is also the mission for this edition of Total Video Key Facts.
Audience TrendsThe Audience Trends section highlights the challeng-es faced by today’s media players who are adapt-ing to the viewer’s interests and demands. Con-tent is essential on linear TV, where producers and broadcasters invest in more qualitative and creative programmes. The same goes for multi-platform networks where influencers rule advertising. New consumption habits make it more and more chal-lenging to reach Millenials, which is why content cre-ators are becoming an asset in developing innovative solutions.
Insight TrendsThe Insight Trends section covers new behaviours in viewing habits, audience measurement, ad invest-ments, screen technology (HD, VOD, and smart TV) and ad technology. The database linked to the mag-azine gathers information on 39 European countries as well as USA, China, Japan and India.
Solution TrendsIn the Solution Trends section, you’ll get an inside look at the most recent strategies and products de-veloped by our industry to respond to advertiser’s needs. It explores the latest visions in targeting with data collection, return on investments, effective-ness, simplification using programmatic buying and brand safety. In collaboration with RTL Group and all our partners, the Total Video Key Facts serves as a tool, a guiding light in this multifaceted advertising world. x
The Total Video Key Facts serves
as a tool, a guiding light in this
complex and sophisticated
advertising world.
TV K
EY F
ACTS
201
7
8 9

*RTL AdConnects's own calculations.Source: IHS Markit, EURODATA TV, local institutes – reproduction forbidden, all rights reserved by MEDIAMETRIE
2016 Facts & Figures.
Biggest audiences 2016 around the world
Biggest share of time-shifted TV viewingUK 13.8% Switzerland G 13.4% Switzerland F 13.3%
viewers for the Spring Festival on CCTV 1+3
in China
viewers for the Super Bowl
on NBC in the USA
viewers for the Euro 2016 semifinal Germany/France
on ZDF in Germany
158 M 113 M 30M
2016 average viewing time in Europe, -1 minute vs 2015
Highest viewing time: Romania 5h29 Serbia 5h17 Hungary 4h42
Biggest increases vs 2015: Slovenia +9 minutes (3h35) Austria +7 minutes (2h48) Belarus +7 minutes (3h53)
watch TV during prime time in Europe
Latest prime time in Greece and Spain (22:30),earliest in Austria, Czech Republic, Denmark,
Hungary, Russia and Slovakia (20:45).
260 MVIEWERS3h54*

Most popular entertainment showsNumber of times in the Top 20 Programmes
Home Alone Qu’est-ce qu’on a fait au Bon Dieu ?
Source: IHS Markit, EURODATA TV, local institutes – reproduction forbidden, all rights reserved by MEDIAMETRIE
9x
7x
7x7x
4x 4x
Most popular series
Camping Paradis, Castle, Coronation Street, Criminal Minds, Der Bergdoktor, Clem
80% of the top series in 24 markets were local productions
TatortTV programme genres split
in Europe
Sports
58.8%Entertainment
18.1%
Fiction
13.3%Factual
9.8%
Most watched moviesNumber of times in the Top 20 Programmes
Frozen
4x
3x
TV K
EY F
ACTS
201
7
10 11

2016 Facts & Figures.
Top 3 European audiences 2016
Football European Championship
Germany/France Semifinal ZDF (Germany)Rating 39.8%Share 80.3%
Football European Championship
France/Portugal Final
M6 (France)Rating 36.0%Share 71.8%
Football European Championship Germany/Italy
Rai 1 (Italy)Rating 28.3%Share 66.%
Source: IHS Markit, EURODATA TV, local institutes – reproduction forbidden, all rights reserved by MEDIAMETRIE
of European TV households receive a
digital TV signal (even more than 90% in
the EU)
Most of the digitalTV households in Europe
receive their signal by satellite
87.7% 35.1%of European
TV households own a HDTV
81.4%

93.0% 89.8% 83.5%
Biggest panels
Highest TV share in the media mix
Biggest TV ad spenders
in 32 markets
TV share of media
expenditure increased in
17of the European
TV markets
Most advertised
sectors on TV in 32 markets
Italy 5 666
UK 5 100
France 5006
TV spots were broadcast in Europe in 2016 vs 99M in 2010
2016 average spot length in Europe
169M+ 22.2 sec
(in households)
Food
Retail
Pharmaceuticals
Source: IHS Markit, EURODATA TV, local institutes – reproduction forbidden, all rights reserved by MEDIAMETRIE
Bulgaria Croatia Hungary
TV K
EY F
ACTS
201
7
12 13

North America
4h14Universe 389M
3 countries1
South America
3h44Universe 150M14 countries2
Africa8
3h10Universe 85M6 countries3
Europe*
3h54
1Canada, USA, Mexico; 2Argentinia, Brazil, Chile, Colombia, Costa Rica, Dominican Republic, Ecuador, Guatemala, Panama, Paraguay, Peru, Puerto Rico, Uruguay, Venezuela; 3Cameroon, Ivory Coast, Senegal, Madagascar, Morocco, South Africa; 4Australia (Regional), New Zealand; 5Armenia, Bahrain, Egypt, Iraq, Israel, Jordan, Kazakhstan, Kuwait, Lebanon, Oman, Qatar, Saudi Arabia, Syria, Turkey, United Arab Emirates; 6Bangladesh, China, India, Indonesia, Japan (Kansai, Kanto, Nagoya), Malaysia, Mongolia, Pakistan, Philippines, Singapore, South Korea, Sri Lanka, Taiwan, Thailand, Vietnam; 7Including Hong Kong and Myanmar; 8Only South Africa and Morocco are measured on a people-meter basis; 9Only Armenia, Azerbaijan, Israel, Lebanon and Turkey are measured on a people-meter basis. *RTL AdConnects's own calculations.Source: EURODATA TV – One Television in the World 2017 issue – reproduction forbidden, all rights reserved by MEDIAMETRIE
2016 World Viewing Time.

Middle East9
3h50Universe 160M14 countries5
World
3h00Universe 3.9Bn
92 countries
Asia7
2h29Universe 2.5Bn15 countries6
Oceania
2h58Universe 12M2 countries4
more than 4 hours
3 to 4 hours
2 to 3 hours
less than 2 hours
n.a.
Daily viewing time
TV K
EY F
ACTS
201
7
14 15

3h28
Flat ScreensDVR
Blu-Ray Discs
Facebook YouTube
XBox 360HD TV Sets iPhoneApple TV
Netflix Roku
Smart TVs
1996 1997 1998 1999 2000 2001 2002 2003 2004 2005 2006 2007 2008 2009 2010
55.0%
2.8%
European TV Viewing Time & Technological Developments.
Source: IHS Markit, local institues, viewing time for adults

iPad
Hulu PlusInstagram
Snapchat Amazon
Instant Video
Periscope
Ultra HD TV SetsXBox One
PS4Chromecast
2011 2012 2013 2014 2015 2016
4h07
+39 minvs1996
DVD Player
Smartphone
Flat Screen TV
TV HD
Digital TV
Daily ViewingTime
Connected TV
Blu-Ray Player
Tablet
74.0%66.5%
53.9%
62.3%70.8%
73.7%75.5%
81.4%
72.5%
76.2%
81.1%
87.9% 87.7%
7.1%11.9%
22.0%
22.1%
72.0%
60.0%
72.7%
59.0%
62.6%
55.9%
66.5%
53.4%
43.5%
29.3%
61.3%60.2%
68.6% 70.5%
74.4% 81.0%
83.8%
9.2%12.1%
18.0%
22.0%
27.4% 31.1%
17.2%
24.5%
2.7%
6.5%
14.2%16.8%
38.5%
24.2%
TV K
EY F
ACTS
201
7
16 17
AudienceTrends.
The worldwide viewing time for linear TV is far ahead of other screens, and is still ranked the second best leisure activity after sleeping. With a daily worldwide viewing time of 3 hours, TV stands its ground as the most consumed media.As Duncan Stewart from Deloitte ex-plains, social media is dramatically in-creasing among the young target groups: “As of December 2016, over 60 % of US 18- to 34-year olds were on Snapchat, over 75% were on Instagram, and 95 % were on Facebook.” Yet, their social me-dia consumption is far behind linear TV consumption: ”Daily use of each plat-form averaged 14 minutes, 13 minutes and over 30 minutes, respectively…meaning between the three, total daily social media approaches one hour."Often said to be a dying medium, TV continues to thrive as a media leader, despite an important part of TV con-sumption measurement still being lost in the mix: content viewed on online screens. The ongoing success behind linear and nonlinear formats, and influencers on
YouTube, lies in their talent for storytell-ing, evoking emotions, entertaining, and informing the audience. No media other than total video is as effective in bring-ing out powerful emotions.The sports, fiction, and factual genres are the most watched in the world, and live programmes are still on top of the programme rankings.Local fictions are also tremendously suc-cessful. Nico Hofman, head of the pro-duction company UFA, explained that the key to fiction success is “to be au-thentic, unique and new”.Even if TV narratives are historical, in-volving the audience in the casting, sto-rytelling and directing is a key strategy to reach younger target groups.The search for more authenticity is rein-forced by Médiamétrie’s programme trends survey. The key take away words are: “understanding another's reality, the importance of family bonds, and playing with space and time”. Of course, some kinks still need to be sorted out con-cerning the measurement and mone-tisation of TV. But one thing is cer-tain: Total Video is king! x
Today, content is watched in multiple forms: linear, nonlinear, big screens, small screens – the list goes on. The fact is, regardless of the size or format, screens are still inspiring worldwide audiences. And it’s all about the content!
Carine Jean-JeanCommunications Director

TV K
EY F
ACTS
201
7
18 19

13 Reasons Why
Netflix

Most of these new launches are original creations, but there are features in each genre which are worth mentioning. Indeed, scripted content is mostly im-ported, whereas unscripted programmes are main-ly original creations. The amount of adaptation in entertainment is quite significant between fictional and factual narratives.Last season, people and characters questioned themselves in several ways, and the trend followed through this season too. However, this season delves into the multiple sides of reality. Both in TV pro-grammes and online creations, broadcasters and producers seek to evoke the world we live in. Some decide to portray our present real-ity in a frank and open way so that view-ers are confronted with it, while others pre-fer to escape reality to better relate to it. As authenticity was one of the key words at the last MIPTV, playing with space and time was also high-lighted, especially with virtual reality. In the end, the aim is the same: people and characters try to build bonds to face their lives and the tough world we ex-perience. It brings families from all walks of life to-gether. >
During the 2016-2017 season, more than 7,500 new programmes were launchedinthe50countriescoveredbyNoTa.Factualandfictionalgenres remain the key groups when it comes to new launches.
International Trends 2016-17
Both in TV
programmes and
online creations,
broadcasters and
producers seek to
evoke the world
we live in.
Candice AlessandraMedia Consultant
TV K
EY F
ACTS
201
7
20 21

7,500 new programmes launched in 2016-17 Adaptation Finished programme Original Format
Source: Eurodata TV Worldwide / NoTa / – All rights reserved.
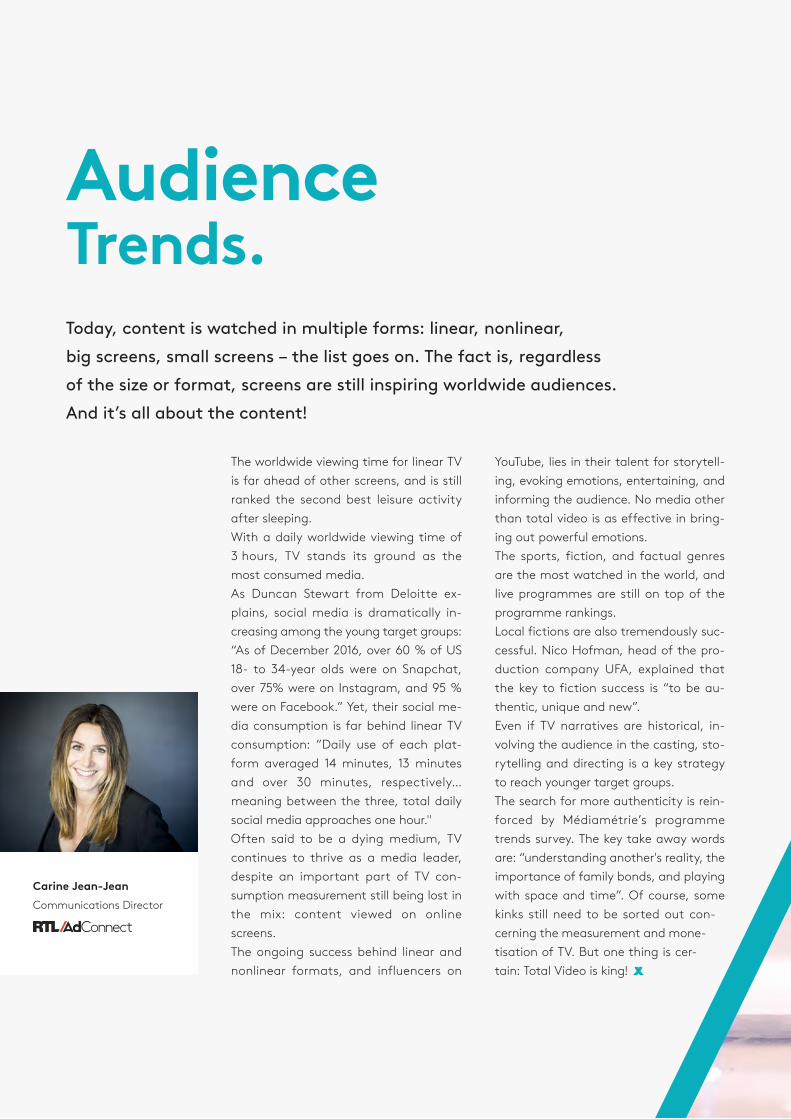
Facing authenticityTeaming reality with authenticity often promotes sensitive topics. This season saw an increasing num-ber of factual docu-series as well as fictional trends involving military and terrorism. Viewers want to make sense of the current conflicts and the “who’s who”; on all sides. In the Flemish documentary, Is In Het Vizier launched on Canvas, journalist Rudi Vranckx braves the ISIS frontlines and questions soldiers as well as ex-jihadists, cyber an-alysts and civilians. War Watchers, the American documentary project, is digging even deeper by confronting war tourism. On the fictional side, Tur-key develops numerous series about terrorism such as The Oath, where a special unit is created to stop
Authenticity
in new programmes
is not only about fear
and news headlines.
It’s also at the core
of shows in which
people are trying to
understand each other.
Factual 40.8%
Fiction 40.6%
Entertainment18.6%
3%
37%
60%
2%
51%
47%
16%
24%
60%
terror attacks in the country. Distributed by Global Agency, the 13-episode series performed very well with young adults. Other territories delve into this trend even if they are far from the front such as the Danish series Below the Surface, which tells the story of 15 hostages in captivity underground. Authenticity in new programmes is not only about fear and news headlines. It’s also at the core of shows in which people are trying to understand each other. The Netflix hit fiction series, 13 Reasons Why, about an American high school girl who commits su-icide, has created a buzz in the media and on social networks. On the unscripted side, and with a light-er tone, the British reality show Rich House, Poor House, follows families from different social classes
after they swap lives. The 4-part series was especially a hit with young adults, multiplying the channel slot average by 2.5. Understanding and group trust is the idea behind the Spanish reality show, The Bridge. Distributed by Endemol Shine Group, the reality show sees participants working together to achieve one common goal, building a bridge to find a treas-ure. But there’s a twist: there’s no elimination, no real competition. Participants decide who wins the treasure, and the winner decides if he/she wants to share it or not, with some people or everyone.
Playing with space and time Portraying the present reality is a complex feat. Seve-ral producers and broadcasters prefer to do it from >
The OathStar, Turkey
Distributor: Global Agency
April 2017
5+, 6 episodes
Rich House, Poor HouseChannel 5, UK
Distributor: Hat Trick Productions
March 2017
16-34, 4 episodes
The BridgeMovistar, Spain
Distributor: Endemol Shine Group
May 2017
Facing authenticity
*Rating evolution vs regular time slot Source: Eurodata TV Worldwide / NoTa / Relevant partners – All rights reserved.
+60%* x2.5* -
TV K
EY F
ACTS
201
7
22 23

The Orville
Fox, USA
another angle, basing their programmes on the past or in a not too distant future. Particularly this sea-son, plots and concepts played with space and time. Several elements are muddled to confuse people and characters, in genres across the board! In the Norwegian game show, Lost in Time, broadcast on TV Norge, contestants are transported into different eras, thanks to interactive mixed reality (IMR) technol-ogy, to face challenges and win a cash prize. Despite some technical issues during the first two episodes, the results among young adults were in line with the channel’s slot average. In September 2016, Talpa launched the pilot The Sto-ry of My Life. Broadcast on the Dutch channel RTL4, the talk show sees a couple of celebrities purposely made to look aged with makeup. After a convincing
broadcast, the format has been bought to be adapted in countries such as Germany, Finland, Brazil and Rus-sia. Following the trend, the British dating show Game of Clones involved a bachelor having the choice be-tween several admirers who are dressed and made up to look the same. The format has been adapted for the French young adults channel NRJ12. Fiction-wise, several series are also playing with time and space concepts. The French mini-series, Beyond the Walls, from Arte, immerses viewers in the journey of a young woman in a labyrinthine, parallel world hidden in an abandoned house she inherits from a complete stranger. Another season hit from the American Cable channel HBO, Westworld has to be mentioned in this category. Set in a high-tech Wild West park populated by android hosts, every day

restarts all over again, at least at the beginning. In the same vein, the upcoming French mini-series, Transfer, imagines the future of science, in which it’s possible to transfer minds from one body to anoth-er. In a more light-hearted mood, The Orville, which is set to launch in fall 2017 on the US channel FOX, centres on a not so top-of-the-line exploratory ship in Earth’s interstellar fleet, 300 years in the future. Gathering with a familyWhether these characters want to confront reality by looking for authenticity, or by trying to under-stand each other, or even by escaping to another space and time, this season proves that getting to-gether with family and loved ones builds bonds to help face reality and life together. >
Game of ClonesE4, UK
Distributor: The Story Lab
February 2017
WestworldHBO, USA
Distributor: HBO
October 2016
18-34, 10 episodes
TransferArte, France
Distributor: Lagardère Studios Distribution
Coming up
*Rating evolution vs regular time slot Source: Eurodata TV Worldwide / NoTa / Relevant partners – All rights reserved.
Playing with space and time
- -x5.4%*
Sometimes, people decide to
confront the reality with a
new family, a family they’ve
chosen themselves.
TV K
EY F
ACTS
201
7
24 25

Access to a unique volume of TV and Online data
WORLDWIDE CONTENTAND AUDIENCE INSIGHTS
Contact: Sales Team Tel: +33 (0)1 47 58 97 57Email: [email protected]
www. e u r o d a t a t v . c om
Eurodata TV Worldwide is the specialist of international TV markets and the unique provider of o� cial TV ratings of 7,000+ channels in more than 110 territories. Eurodata TV Worldwide tracks and monitors the latest TV and online contents and gives insight analyses based on global expertise.
110+Territories covered
7000+ Channels in our database
>3.7 BILLION Potential viewers

This is UsNBC, USA
Distributor: 20th Century Fox Television Distribution
September 2016
18-49, 18 episodes
Planet Earth IIBBC One, UK/USA/France/China/Germany
Distributor: BBC Worldwide
November 2016
4+, 6 episodes
Tytgat ChocolatEén, Belgium
Distributor: Flanders Image
Coming Up
Gathering with a family
One of the best examples of this trend this season is the American hit series, This Is Us. Launched on NBC in September 2016, the series follows three siblings throughout three different times in their lives: birth, childhood and present day. For 18 epi-sodes, viewers follow the evolution and unforeseen developments the families go through, and how events from the past affect their beliefs and ac-tions in the present. On the factual side, and also a worldwide hit this season, is the documentary Planet Earth II. In the BBC hit series narrated by Sir David Attenbor-ough, viewers watch a string of episodes, featuring different kinds of animals and habitats around the
globe with one main thread: building a family and protecting it in a dangerous environment. Some-times, people decide to confront the reality with a new family, a family they’ve chosen themselves. In Flemish Belgium, VTM launched Amigo’s in January 2017, a humorous series about five ex-prisoners who try to start a better life by setting up a restaurant. Jumping on the bandwagon, competitor public channel, Eén, will launch the series Tytgat Choco-lat, a combination of a road trip and a love story about a group of mentally challenged workers at a Flemish chocolate company. x
Source: Médiamétrie / Eurodata TV Worldwide / NoTa International TV Trends 2016-2017 / Relevant Partners
*Rating evolution vs regular time slot Source: Eurodata TV Worldwide / NoTa / Relevant partners – All rights reserved.
+130%* +87%* -
TV K
EY F
ACTS
201
7
26 27

Interview with Nico Hofmann, CEO of UFA: how to learn how a very strong local production company like UFA managed to become a successful international company.
What has been your biggest international success so far?
I would definitely say the two TV series that both received the international Emmy award. The first really big success was Generation War, a WWII sto-ry basically about my own father and what hap-pened during the war to that generation. It was a very controversial film, not only in Germany but worldwide. A lot of topics, feelings and emotions came to the surface from a generation which is now 90-95 years old. Another big success was sure-ly Deutschland 83; other than winning the inter-national Emmy, it was also seen in more than 110 countries around the world, and a huge hit in the UK on Channel 4.
Where do you get your inspiration from?
I’ve been first a director and now for almost 20 years a producer, and most of my films in these years are based on factual German History; about WWII, but also about the reunification of the Eastern part of Germany. It was really a decade of big interest for the audience that has to do with a long search of German identity. >
Success Story:UFAInterview.
Nico HofmannCEO

We called it
cinema for big
screen on
television: so the
production value
was very high
because they
were TV events
as cinema
pieces.
Deutschland 83
28 29
TV K
EY F
ACTS
201
7

So there was a huge appetite on the viewers’ side to watch these films, but at the end of the day, it was really a personal approach, taken from my own fam-ily history. I was always having big debates with my parents about their lives in the Third Reich but also the aftermath of the Third Reich; how they came back to somewhat of a normal life in a democratic country. It really opened up a market. We called it cinema for big screen on television. The production value was very high because they were TV events as cinema pieces. In the last three years, we really opened it up even more internationally, which we saw with the success of Deutschland 83.The show was written by an American writer, Anna Winger, and it’s a different style, very international, not typically German. The historical topics were the same but the angle was much more ironic, fresher and edgier. That’s why we continue working in cooperation with Fremantle, Amazon and RTL, sharing a big plat-form market with RTL is a unique opportunity for us.
Is there a German touch in storytelling?
There are really no boundaries now. People are coming from German film schools and working
for German TV, then working all around the world, nearly everywhere. Florian Cossen, who’s one of the directors of Deutschland86, for example, has done a huge and successful co-production about the NSU last year. The younger generation is building up their own style and bringing fresh ideas. My hope is that we get an individual style with different directors and show runners, but not by individual country.
How do you explain the success in the US?
I’m sure it has to do with the way it’s written. You can feel the difference in the style: it’s totally focusing on the creativity of Anna Winger, the creator and head writer of the series. She brought her own touch to the production, her way of telling German history. Some-times the German way can be didactic; everything is based on true stories and facts. Here it’s very ironic and humorous, which is not typically German.
Do you feel that you have a mission to younger generations?
Yes, I’m absolutely sure we’re doing that and I’m very proud of it. Our films are used in more or less 80% of
Generation War

the programmes in high schools. Of course it’s very controversial as many historical topics are, you never have one agreed opinion amongst historians. What we have learned is, that you have always a very per-sonal viewpoint to talk about History. Yet or proba-bly because of the controvery, our programmes were very successful, like the bombardment of Dresden or the event movie about the refugees coming from the Eastern part of Germany in the end of WWII. Both programmes had about 40-50 million viewers, more or less everybody in Germany saw it. So I think we speeded up the progress about German identity in the past few years speaking about it frankly. For me it’s a very positive outcome with an enormous impact.
Is fiction the main vector to talk about history?
Firstly, I think you have much more freedom in sto-rytelling. Nevertheless, the historical research is a big part of the writing and very detailed and precise. It is coming directly from authentic historical data, and is quite close to what really happened. We also have historians, who are working together with us. >
The most important rule is
that it has to be authentic,
unique and new.
TV K
EY F
ACTS
201
7
30 31

Charité
My hope is that we get
an individual style with
different directors and
show runners, but not by
individual country.

But you have a much more complex structure; if you have, for example, an 8 or 10 part mini-series, which is what we do now with Deutschland86 and Deutschland89, at the end of the day we’ll have 20 more episodes to tell the story. It’s fascinating how deep you can delve into the characters and German History, but also world History. We’re telling the story throughout the Cold War, the fall of the Berlin wall. There are so many elements to talk about from 1983-1989, it’s fascinating. You can build up much more complex characters, and people love to watch it. It’s a huge difference between a big fiction show and a documentary on German TV.The big fiction shows are drawing three times more viewers than the documentaries, based on so much more material and, of course, you need much more money to produce it.
Do you write with a specific target group in mind?
Yes, we really talk about who we want to reach each and every time before we start the production: do we do it for a certain platform, for a very young au-dience, are we trying to get the biggest audience in the evening programme? It’s a crucial discussion to have; we want to be very clear and focused about our target group. We had a very huge success a few weeks ago with our mini-series Charité, about a big hospital in Berlin that drew in more than 7 million viewers. It was produced for that exact purpose, to get a mass audience in the evening.
How do you adapt to the new way of consuming video content?
In Germany, people can have the choice between 120 programmes every night, so they have a distinct de-cision to make about what they want to watch. But there’s a very clear rule recently; they are only inter-ested if it’s authentic, unique and new. If they have the feeling that they’ve seen it before, they’ll switch it off. So you have to bring really fresh new ideas. The other thing we noticed is that it’s helpful to get the
younger generation actively involved; young cast, young storytelling, young directors on the show, e.g. from the film schools. We recently had a lot of success for the second public channel ZDF about a dancing school in Berlin called Ku'damm 56, playing in the 1950’s. It was a huge hit as well on the media page and platform. We really got the target group, even the 15 and 20 years old, because it had a very young cast and was done in a very modern way.
Do you develop new concepts for the international market?
That’s the most exciting prospect at the moment. I just saw the pipeline of what’s coming up in the next 5 years and I strongly support how Cecile Frot-Cout-az is pushing the fiction market, which is growing stronger and stronger. It’s something that Freman-tle is really powerful at right now. They had such a big success with Young Pope or American Gods and also with our production Deutschland83. I’m pretty sure that the American platforms will turn out more heavily in the next five years than they do at the mo-ment. So, the whole fiction strategy is a huge per-spective for me. I feel much supported in the group, with my own material, and that gives me a lot of hope.
What's the biggest challenge in the future?
The biggest challenge is really to have the best crea-tive people on board. It’s all about content and cre-ativity. I see a lot of younger start-ups coming with fresh money, and the Americans doing the same thing in Germany with younger start-ups. It’s our major goal for UFA, but especially at Bertelsmann and RTL Group we have to get the most creative people and exciting talents to come to us in order to survive the next 10 years. The other thing is to have a clear distinction about what we can produce for platforms, for bigger channels, and where audience trends are going. So the debate is much deeper and more complex than ever before. x
TV K
EY F
ACTS
201
7
32 33


Ku'damm 56
34 35
TV K
EY F
ACTS
201
7

Titanic
20th Century Fox

It’s True Even If It Never HappenedOn cult classics, myths and true success
Star Wars, Harry Potter, The Lord of the Rings, Titanic, Pretty Woman, The Matrix – theseareallcultfilmsandboxofficehits,whicharesuretooutlive contemporary fads. They belong to the collective consciousness of entire generations. They frequently involve totally complex stories whose meaningssimplyescapeusatfirstglance.Still,theyfascinateus.Isthere something that they all have in common? Yes!
The monomythIn all of these films, the story involves the big picture, or the profound; fundamental, universal ideas that stay with us our entire lives. When these recurrent patterns of our experience are processed into narra-tives, they become mythical tales. They tend to fol-low a certain scheme, according to the mythologist Joseph Campbell. It is the so-called hero’s journey or “monomyth”, a basic pattern which he deciphered after analyzing thousands of historical myths. Campbell‘s classic model has since become a blue-print used by scriptwriters and fiction authors alike; a manual for good storytelling. It’s composed of three acts, which comprise twelve chapters. In a strict systematic scheme, revolving around the central figure. Let’s now apply this method to cult classics to find out whether they too follow Campbell’s hero’s jour-ney. But let’s not be too pedantic. We’ll focus only on the three central acts and emphasize the parts that are representative of the whole. >
”Though this
be madness,
yet there is
method in’t“
Hamlet,
Shakespeare
Carsten Göttel Programme Director
Focus.
TV K
EY F
ACTS
201
7
36 37

Mythological tales always begin in the hero’s home-land, often a place that evokes longing. We might think of the Shire, the idyllic home of the Hobbits. But in The Lord of the Rings, and many other classics, the characters abandon their comfort zone. Why is it that all of the protagonists in the cult classics do this? It’s the call to adventure, with all its seduction and fantasy. It can be symbolized by an invitation, as received by Harry Potter from the Hogwarts School of Witchcraft and Wizardry, or a call for help as received by Luke Skywalker in Star Wars. Some-times the hero’s destiny leaves no choice. Consider Peter Parker, who, as Spiderman, is forced into an adventure by a spider’s bite. In Pretty Woman, the filthy rich Edward meets the hooker Viv-ian, who shows him the way to his hotel. In this case, they both end up gaining insight into a totally new world. These encounters evoke the call to adventure.
The mentorIn the departure phase, the hero may initially refuse to yield to his or her fate-ful calling. It’s then that a mentor ap-pears to give the decisive nudge needed to undertake such a daring adventure. These are mentors like Dumbledore in Harry Potter or Gandalf in The Lord of the Rings. Luke Skywalker in Star Wars is shown how to exploit the powers of the force by Yoda. The hotel direc-tor in Pretty Woman helps Vivian out with the right outfits and also instructs her in proper table eti-quette.
1. The departure
Lord of the Rings
Thanks to the mentor’s impetus, our hero ultimately and irrevocably embarks into the world, and an un-certain future.
“I'm trying to free your
mind, Neo. But I can only
show you the door.
You're the one that has to
walk through it.”
Morpheus, The Matrix

2. The journey: no pain, no gain On the journey to a new world, there are unanticipat-ed visitors. New enemies appear, but also new friends. In Harry Potter, Hermione and Ron are at Harry’s side. In The Lord of the Rings, Frodo can count on his fellow hobbits Sam, Pippin and Merry. In Star Wars, Luke Skywalker meets Han Solo and Chewbacca. A host of characters teach our cinema heroes the rules of the world. It’s at the very pinnacle of their journeys that they then plunge into some dark abyss, where a decisive battle awaits them. Armed with newfound experience and resourcefulness, they may prevail. The protagonist is face-to-face with a seemingly in-vincible foe. But somehow, by reaching deep inside, some unexpected source of strength is found to combat his or her fear. Frequently, this is symbolized as the greatest inner fear that has been harbored for a lifetime. For Luke Skywalker’s legendary bat-tle with his father, Darth Vader, Luke is also battling with himself. It’s an interior battle as well as at ex-terior battle. Or, simply consider the rebellious ges-tures of Rose in Titanic. She hides from her fiancé and instead accepts Jack’s gift, which symbolizes her new independence.
3. The homecomingIn Pretty Woman, Vivian, fully transformed, continues her bourgeois existence; she ends up going back to university and starts a new life. Luke Skywalker is vic-torious in the decisive battle in Stars Wars, when he destroys the death star. Afterwards, he returns home to join up with Jedi Knights.In the course of their travels filled with trials and tribu-lations, our heroes grow up. They are transformed from creatures of dependency to self-reliant forgers of their own destinies. Their final task is to pass on their new wisdom; they must now take on a new role of responsi-bility, and with that the hero’s journey is over.
"The cave which
you fear to enter
holds the
treasure you
seek."
Joseph Campbell
“Where are we
really going?
Always home.”
Novalis
UpshotCult cinema and box office hits all operate according to the same meth-odology. As different as these stories appear on the surface, they are based on the scheme of the hero’s journey, or monomyth, as coined by Joseph Campbell. Existing beyond space and time, these mythical stories are fic-titious yet true - the “forever-always there”, as Thomas Mann so aptly called it. Ultimately, the hero’s three-act epic of departure, journey and homecom-ing is a reflection of life itself. x
TV K
EY F
ACTS
201
7
38 39

Entertainment Evolution:Online screens, OTTand New Technologies4-screen measurement started in September 2016 in France on the main channels,andit'salreadyhadastrongimpactontheviewingfigures,especially for the channels watched by younger viewers.
Among the channels whose online screen ratings were measured, W9 has boosted its entertainment show audiences – the most thanks to tablets, com-puters and smartphones. This viewing behaviour is completely in line with the channel’s audience pro-file, which is younger than the other channels stud-ied in the report.Additionally, when looking at the programmes that have the biggest online screen audience, it’s interesting to note that they also have a large proportion of young viewers. This suggests a strong correlation between the results of online screens and the number of young adult viewers. Les Princes de l’Amour, the second best programme in terms of additional viewers on the 3 online screens, also has the biggest proportion of 15- to 24-year olds in its TV audience. Overall, W9 is leading the way with Les Marseillais et les Chtis vs. le Reste du Monde in the top two slots. The show gains 257,000 viewers on aver-age on other screens. Coming in third is the local ad-aptation of Married at First Sight on M6. Overall, regarding the split by screen, the online screen that’s most often used for TV viewing is the computer. Among the studied channels, it represents almost half of the total online viewing. >
Abed LaraquiInternational Research Manager
The online
screen that’s
most often
used for TV
viewing is
the computer.

Entertainment additional viewing on other screens vs TV
Prime time only
Top programmes on the 3 online screens
Sources: Médiamétrie / Médiamat – September 2016 – February 2017.
+180,000 viewers
+28%+142,000 viewers
+4%+257,000 viewers
+27%
3 screens average contribution
Sources: ???
+22% +5% +2% +2% +1% +1% +0%
TV K
EY F
ACTS
201
7
40 41

in the show’s original structure. Then, new technolo-gies came in handy by immersing the viewer in the main programme thanks to live streaming and VR experience. The next step is to use all of these tech-nologies and platforms to create global concepts across the board. The number of programmes fol-lowing this strategy is on the rise. In fact, new shows like All Against 1 (DR1, Denmark) have already kicked off the trend of using online screens. The show’s multi-screen mechanism is quite basic and was a huge success with the audience. The potential for TV multi-screen and cutting-edge tech-nologies is limitless, and the latest programmes are jumping on board with these possibilities. Another notable platform is The Stream, which was a huge success in 2016 in Norway on TV2.
However, on channels that attract young viewers, the smartphone takes the lead. For instance, on W9, smartphones have the upper hand, representing al-most half of the total online screen viewing.
The increasing importance of online screens in unscripted contentAt the beginning, online screens were used to em-phasise the reach of traditional, linear entertainment programmes. Channels and producers created addi-tional content on other platforms based on the main programme: mobile games, online or social media companion shows. The idea behind this supple-mentary content was to boost the programme and strengthen the original broadcast; it wasn’t included
The Stream gives musicians a
chance to be discovered through
the internet and social media by
getting participants to upload
their videos to an online platform.
Viewers then share and stream the
performer's music, with the top 100
most streamed musicians then being
invited to perform in front of a panel
of music industry experts. When
the artists have been signed, they
compete in a weekly live show, with
the most streamed artists staying
in the competition and the least
streamed risking eviction.

The rising stars of entertainment While TV teams up with tech firms, OTT platforms are the new trend and have recently started to broadcast entertainment shows. Chinese platforms are way ahead of the game on that matter, but US platforms only recently tapped into it. After produc-ing scripted series and then documentaries, they enlarged the spectrum of streamed genres to offer entertainment programming. According to 7PARK DATA’s newest study of OTT viewership, reality TV viewing is up 10.3% from last year on Hulu and up 28.3% on Netflix – making reality one of the fastest rising genres for the two services. It’s also interest-ing to note that while Netflix and Amazon orig-inated from scripted content, Apple Music – which announced two entertainment shows, Carpool Kara-oke and Planet of the Apps – directly broke into the entertainment market. This is a logical strategy, as the music world and the entertainment world have strong ties. x
Médiamétrie / Médiamat – September 2016 – February 2017 – All rights reserved.
While TV teams up with
tech firms, OTT
platforms are the new
trend and have recently
started to broadcast
entertainment shows.
3 screens' distribution in prime time's entertainment viewing
Studied channels
Smartphone
Tablet
Computer
28.9%
28.6%
21.3% 22.5%
49.7%
48.8%
TV K
EY F
ACTS
201
7
42 43


Secret Story
Plug RTL, Belgium
44 45
TV K
EY F
ACTS
201
7

???

MCN & Original Content The growth in audiovisual crowdsourcing content – calling for ideas from a crowd of people (YouTubers) – has never been as evident as it is today. With millions of subscribers and viewers per month, YouTube channels have started to play a key role in the audiovisual market.
The growth in audiovisual crowdsourcing content – calling for ideas from a crowd of people (YouTubers) – has never been as evident as it is today. With mil-lions of subscribers and viewers per month, YouTube channels have started to play a key role in the audio-visual market. YouTube videos are versatile, flexible and have a big advantage: they can be produced at a low cost and create a big impact. Moreover, they can be launched to test the audience’s response and re-launched if they’re successful. As this content can be customizable, marketers have seen a tremendous opportunity for their brands and are considering innovative ways to work with You-Tube celebrities. In general, Multi-Channel Networks (MCNs) are the main intermediary between influenc-ers and brands. These MCNs have a pool of YouTube channels from which marketers can select the best influencer that matches their brands’ DNA to pro-duce branded content. Among the most important MCNs are Awesomeness TV (acquired by Dream-Works Animation), Fullscreen (owned by Otter Me-dia - a joint venture between AT&T and The Chernin Group), Maker Studio (acquired by The Walt Disney Company), among others. >
Some MCNs
have moved
towards being
[...]
digital-first
production
companies.
Siglinde MartínezMedia Consultant
TV K
EY F
ACTS
201
7
46 47

To compete with these big MCNs, other companies have started to specialize in niche markets to offer expertise and to help brands fine-tune their research. This is the case for MCN Machinima (owned by Warner Brother) which is specialized in video games, or StyleHaul (owned by RTL Group) whose YouTube channel catalog is specialized in fashion, beauty and lifestyle. However, branded content has started to be avail-able beyond YouTube and has also moved to Face-book, Instagram, Snapchat, Twitter, among other “off YouTube” social media sites. Some MCNs have moved towards being not only an intermediary be-tween YouTube influencers and brands, but also dig-ital-first production companies. Awesomeness TV’s business model, which – besides being an intermedi-ary – set up an entire team to produce original con-tent to match brands’ DNA, and other niche MCNs such as MiTú Network have followed suit.
Brands & MCN: joining forcesMiTú Network is a MCN especially focused on tar-geting millennial Latinos living in the US – who are now becoming billennials (bilingual-millennials) – with more than 6,000 video creators and 2 billion accumulated video views each month on YouTube. It offers brand-funded content exploiting its already well-established digital media brand. Knowing that Hispanic billennials have a strong desire to keep in touch with their cultural background, MiTú Network
MiTú Network’s reach
has become such a success
that the platform even
became a political tool by
launching the multi-
platform campaign TACO
(Take Action, Commit
Others) in May 2016.
Multi-Channel Networks (MCNs)Generalist MCNs Specialized MCNs
Latino
Food
Animation
Sports
Video Games
Mode

has taken advantage of this by producing original content which Latinos can identify with. Brands such as MLB (Major League Baseball), whose aim is to at-tract young multicultural Latinos for its February 2017 season, spotted this opportunity and sealed a crea-tive partnership to produce “Always On”, a campaign built to generate original content around the base-ball season. Producing around 300 pieces of content every week, MiTú Network’s impact on the Latino community is important: not only do these pieces of content evoke childhood memories and grandma’s sayings, they also make viewers discover other Lati-no expressions and share them with non-Latinos by translating them into English. MiTú Network’s reach has become such that the platform even became a political tool by launching the multi-platform campaign TACO (Take Action,
Commit Others) in May 2016. This political cam-paign, whose content gained around 75 million me-dia impressions, involved original content, apps and challenges to mobilize the Latino millennial vote. More recently, in November 2016 the ex-President of the United States, Barack Obama, and the actress, Gina Rodriguez, partnered with MiTú Network to em-power the Latino vote for the 2017 elections. Another important MCN targeting Latinos in the United States is Univision Creator Network (UCN). Since the beginning, Univision production facilities and media resources in Los Angeles and New York have helped UCN to advance. This has not only at-tracted influencers, who eagerly wanted to join UCN to increase their value and visibility, but also brands such as Kia, AT&T, P&G, Target and Honda, who wanted to produce branded content. >
A standard business model
Multi-Channel Networks (MCNs)
Intermediaries + Talent networks + Content producers + Marketing advisers
MCNs are
more than
intermediaries,
and have expanded
to become also
talent networks,
content producers
and marketing
advisers. In this
model, YouTubers
and brands are in
contact through a
MCN.
Influencers Advertisers
TV K
EY F
ACTS
201
7
48 49

It seems that MCNs
are no longer merely
intermediaries, but
rather talent networks,
content producers
and marketing
advisers.
Fleur de Force

Honda produced with Flama (a Communication Divi-sion of Univision) The Tamal Taste Race, a video lasting 6 minutes with the influencer Josh Leyva in pursuit of finding the best Tamal in L.A.
Social influencer networkAs marketers get used to this new ecosystem, they need more direct contact with YouTubers, with-out limiting themselves to the affiliates of only one MCN. Brands that look for simple agreements with influencers can contact them via web-based mar-ketplaces like Reelio, Content BLVD, Revfluence or Famebitt – acquired by Google – which are also
known as Social Influencer Networks. These new web-based marketplaces have a fresh advantage which is that they consider “long- and mid-tail creators”, allowing marketers to look for new emerging talent that matches their brands’ DNA, and not only going after the well-established influencers. This again shows that the desire for You-Tube content is real; it’s transforming the strategy of media companies who are now taking this disrup-tive pattern and transforming it into a new business model. x
A new business modelUnlimited Talent Networks
Branded Content Producer
Advertisers
Social Influencer Network
Web-based
marketplaces
known as Social
Influencer
Networks. These
platforms allow a
simpler and more
direct agreement
between the
YouTuber and the
brand, without
limiting themselves
to only one MCN
affiliation. (A kind
of talent pool of
Youtubers that
can be contacted
directly. No need
to discuss with the
intermediary, the
MCN).
TV K
EY F
ACTS
201
7
50 51

Infographics on viewing behaviours

TV K
EY F
ACTS
201
7
52 53

Insight Trends.
Looking at the great insight contribu-tions in this TV Key Facts issue, adver-tisers will find answers, orientation and advice on how to tackle the total video world successfully. Starting with two great articles looking at the Kids' target group from different perspectives, one can already grasp some new – or maybe old? – insights.As Cornelia Krebs from IP Deutschland argues, kids need continuity in brand messages and it has to attend to their needs of safety, but also curiosity. Rupert Schäfer from Nunatak Group takes a dif-ferent angle on the topic of kids and me-dia, describing a connected kid’s world. Both acknowledge that the communica-tion and media needs of kids evolve with their age and brands need to accompa-ny them along this journey, i.e., brands become anchors of continuity in an age of instability.
Television remains the gravitational cen-tre of the total video world. Both Duncan Stewart as well as Alain Beerens take a look at the power of television in their articles, again from two different angles. Stewart deep dives into the viewing time of millenials and comes back with a con-tra-intuitive thought for today’s media discussion – the decline in TV viewing of millennials appears to level off, at least when looking at US data. The disruptive effects of VOD, SVOD, mobile devic-es and the likes on the media usage of millennials seem to flatten out and tel-evision remains the video base with over 2 hours per day for 18- to 24-year olds. Beerens argues that Television remains “(…) resilient in an era of immense dis-ruption” and that all other media de-velop better ROIs when combined with television, especially digital video. x
In a Total Video world advertisers have to take investment decisions based on ever changing advertising possibilities, as well as “alternative & competing”truthsinmediaresearchandmeasurement.Whichfiguresare “the truth”, which are just “fake truths” and how can advertisers navigate their messages to their prospective customers? In the end, they askthemselves:wherecanstabilitybefoundonwhichtobaseeffectiveandefficientmediaplans?
Daniel BischoffMarketing Director

54 55
TV K
EY F
ACTS
201
7
Audience Measurement Is Catching Up On TV Consumption Habits
Eurodata TV Worldwide's One TV Year in the world report gives an annual overview of TV consumption and audiovisual landscapes in more than 100 territories around the world. In 2016, the daily TV viewing time is still solid with 3 hours per individual. To give even more accurate ratings in the next years, TV audience measurement institutes are looking on ways to deliverafullyunified4-screenTVaudiencemeasurement.
TV consumption worldwide
Worldwide daily TV viewing time: waning but still solidTV viewing time calculated over the total population of 92 countries worldwide reaches the very round number of 3 hours per day per individual, a figure averaged over nearly 3.9 billion people. This is a 3-minute decrease compared to 2015, a very similar dip to the one observed last year. This decrease is a tendency shared by most regions in the world, and is stronger in North America and Oceania. However, a noticeable exception is South America, where the average daily TV viewing time has significantly increased between 2015 and 2016. Although on a decline, 2016’s average daily TV viewing time is still very high and remains mainly steady from an evolu-tionary perspective of nearly 25 years. On a regional level, this long-term outlook shows that Europe is at a consistently high level and that South America is on the rise, while North America, the Middle East and Asia show more significant decreasing tendencies. >
Florent CarêmeHead of Research

10%Average audience boost
among Young Adults
The good news
is that 4-screen
TV audience
measurement
became
accessible to the
market in 2016.
56 57
TV K
EY F
ACTS
201
7

Time-shifted viewing on TV sets makes headwayIn 2016, 39 countries measured time-shifted viewing in their TV audience measurement. In the 30 countries where the split between live and time-shifted viewing is available, we note that time-shifted viewing brought in audience hike of 7% on average in 2016, over the entire population and the entire day. This percentage has slightly increased over the last few years. However, it should be noted that, overall, most of TV viewing remains live. Of course, the weight of time-shifted viewing strongly depends on the studied market; countries like the United Kingdom, Switzerland, the United States, Belgium, Ireland and Canada show a far better performance in that respect. A similar analysis of young adults shows paral-lel trends. Although we note a stronger slump in
Online figures are
sometimes impressive,
but are in no way
comparable to the TV
audience figures the market
is actually dealing with.
A shrinking worldwide daily TV viewing time…
Based on total individuals, total day. Computed on 92 countries. Guests and time-shifted viewing included when included in national audience currency. Averages are weighted with the country’s TV universe for total individuals and young adults. Source: Eurodata TV Worldwide / One Television Year in the World 2017 issue / Relevant Partners – All rights reserved
2015
3h03
2h08
2016
3h00
2h04Young Adults
Agregated on
92countries

the total daily TV viewing time amongst young adults compared to the whole population, this de-crease mainly impacts live viewing and not so much time-shifted viewing, which remains steady.The relative audience increase among young adults is therefore stronger than for the whole population; we’ve recorded an average audience boost of nearly 10%, which has been slightly rising for the past two years.This analysis shows that an important part of the TV consumption measurements are lost in the mix: TV content viewed on online screens. Fully unified 4-screen ratings is a must
A new step in TV audience measurement is in the worksFor nearly a decade now, TV audience measurement has been put to the test by new habits in TV viewing. The development of TV catch-up services and hard drives that can easily connect to TV set-top boxes has led to the measurement of time-shifted viewing. This is effective in an increasing number of countries: 39 countries measured time-shifted viewing in 2016, which is 8 more countries than in 2015, and sever-al more has taken the leap in 2017 (Croatia, Serbia, Chile, and more).However, while more and more online services allow viewers to watch television programmes on their de-vices (computers, laptops, mobiles or tablets), au-dience measurements have mainly been limited to those in front of their TV sets—until now. In response to their local TV market needs, many TV audience measurement institutes have worked on ways to pick up these additional figures, to be up to date in re-flecting today’s new modes of TV consumption. This is what we call a fully unified 4-screen TV audience measurement.Without access to this key data, channels and platforms communicate about online viewing us-ing the number of launched streams or the num-ber of unique visitors, often adding data over dif-ferent episodes of the same show. >
With 3 hours daily viewing time worldwide in 2016, TV remains the cornerstone of the Total Video world and a unique opportunity for advertisers to develop their communication strategy.
France and the Netherlands
are among the most advanced
countries for online screen
measurement of TV
programmes.
TV K
EY F
ACTS
201
7
58 59

As a result, the online figures are sometimes im-pressive, but are in no way comparable to the TV audience figures the market is actually dealing with. Let’s keep in mind that the most commonly used “number of viewers” figure in TV is weight-ed in proportion with its viewing duration, which is quite different from the number of launched streams.So, the first aim of 4-screen TV audience measure-ment is to provide comparable figures between au-diences on different screens. Then, of course, the goal is to provide the market with the same level of precision that is available today for TV-set audi-ence measurement: a variety of indicators (ratings,
market shares, reach, coverage, etc.) and targets (by age, sex, socio-economic status, etc.).Tapping into comparable TV audience figures on all screens will allow the market to:• properly take into account the additional audi-
ence on these screens, especially among millennials and young adults that are heavy consumers of vid-eos on mobile devices
• better understand how a programme is watched in order to adapt its content or its broad-casting format to improve the viewer experience
• increase the monetisation of TV viewing on other screens.
Bearing this in mind, the good news is that 4-screen
The challenge: to get comparable audience figures between the screens
Source: Eurodata TV Worldwide / Relevant Partners - All rights reserved
TV Set TV Panel
Online Screens
4 Screens
Screen Average number of viewers Source
Live Recording+ TV catch-up
Live Streaming
Catch-up Streaming
Live Time-Shifted
Online Panel Platform Data
Panel Platform Data

France: 1/5 people watch
TV on an online screen
vs 1/2 in the Netherlands
TV audience measurement became accessible to the market in 2016 in some countries (such as the Netherlands and France) and several more have it in the cards for 2017 or 2018, starting with Denmark (launched on 1 January, 2017), the US, Sweden, Sin-gapore and many more!
How does it work?Let’s start with a recap of how TV audience on TV sets is measured. In most developed TV markets, an establishment survey (often updated on a yearly ba-sis) provides us with detailed information on a specif-ic population regarding their TV equipment, TV sub-scriptions and platform availability depending on their gender, age and revenues. From this data, a TV panel is drawn up to represent the global TV population. Then each household in the panel is equipped with an audience meter that records TV viewing by each panellist. This data is then automatically transmit-ted to the TV audience measurement institute that projects the TV consumption over the entire studied population. This process allows TV audience figures to include live viewing as well as time-shifted view-ing (with some technical adaptations) given a great variety of indicators, such as ratings, viewing times, and coverage, as well as a breakdown according to demographic group. TV consumption across online screens is far more spread out than viewing on TV sets alone, which makes it difficult to get consistent and accu-rate 4-screen ratings using only the panel process. That’s why the first step in the release of consist-ent 4-screen TV audience measurement is for on-line platforms to collect “site centric” data, or “census data”. Unlike panel data, site centric data gives extensive information about the number of launched streams or the viewing duration, but it comes up short when track-ing the exact viewer profile (age, gender, revenue, and so on). With site centric data we can divide the accumu-lated viewing duration of a video by its length to get an average number of complete viewings. This ratio is very similar to usual TV ratings. Site centric data thus provides us with ratings (in number of viewers) for programmes viewed on a live stream or on a replay
platform, with a breakdown by screen, but not by target group.This is why the second step of the 4-screen rating development is to mix site centric data with online panel data, which is thought to be representative of the online video consumer population. This merging between panel data and exhaustive data is called hy-bridisation, allowing the 4-screen ratings to be broken down by target group, as well as target group per-centage, just as usual TV ratings.
First results of 4-screen TV audience measurementFrance and the Netherlands are among the most advanced countries for online screen measurement of TV programmes. Major TV channels are already measured on all 4 screens in these countries and the first feedback on online screens (computers, tab-lets and mobiles) is out. In France, 1 out of 5 people watched TV on an online screen in December 2016, while in the Netherlands, this proportion reached 50% of the population over the course of the same year.Here’s another interesting insight from these online screen results: the audience profile on online screens is very different from the one on TV sets. Although young adults represent only 17% of the TV-set profile, this number rises to 50% for the online screen audi-ence, in place of seniors. This result was to be expect-ed, but it’s now confirmed using comparable data! x
TV K
EY F
ACTS
201
7
60 61

The World of TelevisionWe live in fascinating times. Cars drive themselves, men are preparing to gotoMarsandArtificialIntelligencehasbecomeanintegralpartofourlives. The advertising industry, in turn, has undergone tremendous changes over the past decade.
In this evolving media landscape where brand safety and the looming influence of tech giants on advertis-ing is centre stage, there is one value that has stood the test of time: television.The power of TV – often more aptly described as to-tal vision or total video – has endured more than 10 years of digital disruption and boundless innovation. This is not a random observation or a one-off phe-nomenon, but a measurable reality across countries, continents and generations, according to research done by The Global TV Group. With The Global TV Group as a unified voice, major players in the television industry have rallied around their common cause to get behind TV's new nar-rative. Determined to walk the talk, the industry is exchanging data and technical expertise to shape a positive message for television.As industry-audited figures are pouring in from around the world, The Global TV Group is, for the first time, able to provide an in-depth, interna-tional case for television advertising. This collec-tive voice brings home the unrivalled effective-ness of TV to advertisers and agencies and lets young digital natives in on the myriad possibilities of TV advertising. >
Alain Beerens Marketing &Communication Manager

$1.74payback sales revenue for $1 invested on TV in Australia.
The power of TV
has endured more
than 10 years of
digital disruption
and boundless
innovation.
62 63
TV K
EY F
ACTS
201
7

Online advertisers have faith in TVDespite the myth that Pure Players and online advertisers spend the majority of their advertising budget on online platforms, figures for some of the major advertisers show that they invest massively on TV.
Advertising investment, Spain. TV Online
Source: Arce media. Net investment 2015. theglobaltvgroup.com
TV 98%Online 0%
TV 93%Online 7%
TV 85%Online 0%
TV 95%Online 4%
TV 87%Online 0%
TV 96%Online 4%
TV 90%Online 9%
TV 80%Online 1%
digital has proven to be another enticing argument. The effectiveness of cross-media campaigns is clear: the combination of TV and digital drives the highest return on investment. TV advertising also remains most likely to make consumers laugh, move them to tears or trigger emotions, compared to other media. This is an essential asset, given that the majority of purchasing decisions are emotion-based.We do live in fascinating times, but as artist Andy War-hol once said: “They always say time changes things, but you actually have to change them yourself.” So enough smugness – with these key arguments and many more, The Global TV Group is ready to tell TV’s new story and meet the needs of advertis-ers who are eager for transparent, reliable data and fresh insights. x
These collected insights put forward a number of undeniable arguments.
Consumption & viewingOver the past decade, TV has proven remarkably re-silient in an era of immense disruption. Despite the emergence of new services such as Netflix and the further establishment of YouTube or on-demand ser-vices, TV consumption has remained steadfast all around the globe. TV viewing across all platforms even steadily increases with age across markets. Fur-thermore, the unique combination of volume and reach makes television a powerful brand-builder. On average, TV reaches about 70% of a population within a day, 90% within a week and nearly every-one in a month. Likewise, combining television with

Source: Ebiquity & Thinktv “Payback” Study Wave 1 (FMCG, OTC and Beverages) November 2016. theglobaltvgroup.com
TV indubitably generates more money for advertisers
TV is 2x more effective than online video, print and radio
3x more effective than OOH
4x more effective than online display
Investment
$1
Payback sales revenue for $1 invested, Australia.
$0.41 Online display
OOH$0.62
Radio$0.71
Video$0.72
Print$0.79
TV$1.74
The Global TV Group, formerly known as PEPPTV, is an informal grouping of broadcasters’ and sales houses’ trade bodies in Europe, the USA, Australia and Latin America, whose joint objective is to promote television.
The effectiveness of cross-media campaigns is clear: the combination of TV and digital drives the highest return on investment.
TV K
EY F
ACTS
201
7
64 65

Focus.
Emotion58% of British
claim that TV ads are most likely to make them feel
emotional.
TV ads have a stronger emotional impact than any other medium
Information40% of Italians believe that TV
advertising is the most useful form
of advertising.
Attention61% of Canadians
consumers say that ads screened on TV are the ones they pay the most
attention to.
Action6 in 10 Australians take action as a result of an ad
seen on TV.
Facts & FiguresAbout TV Effectiveness
InternetAccessEvolution
DigitalTVevolution
Hours of TV viewed on a TV set per day, UK.
Despite a decade of disruption,standard viewing is resilient
Source: Thinkbox - BARB, 2006-2016, individuals. TV set viewing within 7 days of broadcast. *Ipsos Tech tracker Q1-4 2016. theglobaltvgroup.com
Sources: Information: GFK TSSP (data for 2016). Sample: 12.000 adult 14+ “Do you think that these kinds of adv ...are useful for you? Do they give you useful information? Emotion: TV/Ad Nation, 2016, Ipsos Connect/Thinkbox, adults 15+. Question: ‘In which, if any, of the following places are you most likely to find advertising that…’ Attention: nlogic thinktv OmniVu Survey March 2016. Action: Nielsen Global Trust in Advertising Survey Q1 2015.
3h36
2006
3h44
2008
3h52
2013
4h02
2010
3h36
2015
3h38
2007
4h01
2012
3h45
2009
3h41
2014
4h02
2011
3h32
2016
89%
47%

Source: Marketing Effectiveness in the Digital Era, 2016, Binet & Field / IPA Base: all IPA cases
Increase in average no. VL business effects
% increase in avg. no. VL business effects from adding TV
Adding TV increases
effectiveness by
40%, making TV
the most effective
medium
Effect of adding medium
TV
1980-1996 1998-2006 2008-2016
Outdoor Radio Press DM Online PR Promos Sponsorship Cinema
29%
20%
Outdoor
12%
17%
Radio
27%
15%
Press
40%
10%7% 6% 6%
3%2%
TV is the most effective medium…
… and has become more effective over time
TV K
EY F
ACTS
201
7
66 67

Focus.
Facts & FiguresAbout European Online Ad Spend
Source : IAB, IHS Markit, Adex Benchmark 2016. Estimated Net on 27 Markets
Source : IAB Europe and IHS Markit
Total Video
Digital Display
(without video)
OOH
Radio
Cinema
• 24 markets
reported data
• Value: €3 Bn
• Year-on-year
growth of 24.4%
• Top 5 markets by
value: UK, Italy,
Germany, France
and Spain
• Top 5 markets by
growth: Slovenia,
Serbia, Belarus,
Ireland, Croatia
UK
Ital
y
Ger
man
y
Fran
ce
Spai
n
Belg
ium
The
Net
herl
ands
Swed
en
Russ
ia
Cze
ch R
epub
lic
Turk
ey
Pola
nd
Irel
and
Aust
ria
Swit
zerl
and
Den
mar
k
Nor
way
Finl
and
Bulg
aria
Hun
gary
Cro
atia
Gre
ece
Slov
enia
Serb
ia
Rom
ania
Bela
rus
TotalVideo
TV DigitalVideo
Display Press OOH Radio Cine
Net European AdSpend 2016 (in €Bn)
Mature markets were the major contributors to the European video ad spend, but highest growth came
from the emerging markets
TV 34
23.3
37
4% 2%
21%
9%
-1%
2%
0%
-9%
13.2
7.4
5.2
0.7
Online Video
3
YoY Growth in %
Video advertising in 2016 (in €M)831
176112
47 35 9
338
12770
397 3
404
13881
4330 6
280
11851 38
5 2 2 1

Europe
• Display was the only format
in 2016 to gain share, with a
small increase from 36.9% to
38.0%. In order for display to
see a substantial increase, the
European market needs to see
online video play a bigger role.
• The contradiction of search
share has stabilised over the last
3 years, floating around 46.0%
• While display and search have
eaten into the classifieds and
directories share, it has hled
its share base above 15.0% over
the last 5 years.
Western Europe
• Within Western Europe, the composition of format share resembles the total European market, which was a
reflection of the market values of the mature markets within the region.
• Display decreased slightly frim 38.0% to 37.8%
• Paid-for-search remained the same year over year.
• Classifieds and directories were strong and gained a small share from display.
Display Classifieds & Directories Paid-for-search
2006
2007
2008
2009
2010
2011
2012
2013
2014
2015
2016
47.6% 18.3% 34.1%
48.5% 14.9% 36.6%
44.5% 18.9% 36.6%
33.8% 18.9% 47.3%
31.3% 20.7% 48.0%
33.3% 19.6% 47.1%
32.7% 18.5% 48.8%
34.0% 16.8% 49.2%
37.7% 15.6% 46.7%
36.9% 16.4% 46.7%
38.0% 15.7% 46.3%
Format shares of online ad spend (%)
Source : IAB Europe and IHS Markit
Display advertising year-on-year growth (%)Display experiences the fastest
growth amongst al the formats,
up to 14.1% from 2015.
• Value: €16.2 Bn
• Accounts for 38.6% of all online
advertising spend
• Year-on-year growth of 14.1%
• Top 5 markets by value: UK,
Germany, France, Italy and Spain
• Top 5 markets by growth:
Ireland, Slovenia, Romania,
Slovakia and Bulgaria. 2007 2008 2009 2010 2011 2012 2013 2014 2015 2016
39.0%
15.1%
0.3%
21.3%
8.9%
14.9%
15.2%
17.2%
14.1%15.4%
TV K
EY F
ACTS
201
7
68 69


Les Experts
Club RTL, Belgium
70 71
TV K
EY F
ACTS
201
7

Video Is Becoming Increasingly More Important
To ChildrenChildrenhaveaccesstoawiderangeofdifferentmediaoptions.Thischoice includes professionally produced and user-generated content, games and social media. The institute iconkids & youth regularly conducts media research into families on behalf of SUPER RTL and surveys what types of devices they have, how they're being used and what other activities children engage in during their spare time.
Around 30% of 6- to 12-year-olds
are brought to school by car.
Same for travelling by bus or train:
ample time to use a smartphone
on the way.
As a whole, use of mobile devices
plays a minor role in children's spare
time activities. Children’s spare time
dominated by traditional forms
of play: alone or with friends,
at home or outdoors.
How children spend their free time?
Brigitte BayerSenior Project ManagerAdvertising Research

TV is more important in the day-to-day lives of
children than Internet use:
Consumption of video content has
risen year after year on nearly all
platforms without substitution taking
place. Linear TV is primarily used for
relaxation, whereas the mood state
associated with YouTube, for example,
is characterised primarily by activity.
93%of 6 to 9-year-olds
and 95% of 10 to
13-year-olds watch
traditional, linear
television several
times a week
26%
of 6 to 9-year-olds
and
61%of 10 to 13-year-olds
watch videos on the
Internet.
87%of children use traditional
TV on any given day...
17%...vs 17% for YouTube and
other Internet video sources
Even considering consumption across all screens,
traditional TV content convinces the most:
89% of 6 to 9-year-olds and
94%
of 10 to 13-year-olds watch
TV programmes at the
time they are broadcast
only 2% of the 6 to 9-year-olds and
6%
of 10 to 13-year-olds watch
shows via fee-based
streaming services.
Consumption
of video content
has risen year
after year on
nearly all
platforms
without
substitution
taking place.
Devices used by children to go online
Linear television dominates video consumption
Variety of choice leads to additional use
Desktop computers & notebooks
Smartphones
Tablets
60%
45%
23%
75% of 6 to 13-year-olds are on
the internet at least once
a week
47% use it on a daily basis
TV K
EY F
ACTS
201
7
72 73

Dragons
Super RTL, Germany

With new apps like PopJam, musical.ly, Toca Boca, a generation of parents that grew up with Panini-scrapbooks, Pac-Man and “Wetten, dass…?” currently looks on with astonishment at how their kids are spending their free time. And because the pace of innovation is exponentially increasing, it’s becoming more important for parents to keep up. Mobile apps are just the tip of the iceberg. If artificial intelligence makes its way into children’s playrooms, it might seem unnatural at first, but it could also open up new possibilities. Parents will have to mull over how digital nannies can support them and re-lieve some of the burden of parenting, especially on the topic of education. Though virtual nannies may not have the same emotional closeness to children as parents do, they could help foster the children’s knowledge and teach media skills in a playful way. With the help of digital nannies, kids can make their first steps in the future’s vast digital media land-scape. And let’s face it, the next generation is tak-ing the internet, smartphones and virtual reality for granted – like eating bread with Nutella in the morn-ing. >
In the last 25 years, the internet has profoundly changed our lives. But that’s just the beginning. New technology already comes naturally to the next generation of digital and social media natives, and what’s coming next will drastically change their behavior.
Virtual Nannies,Apps & Augmented Reality
Rupert Schäfer Managing Partner
If artificial
intelligence
makes its way
into children’s
playrooms, it
might seem
unnatural at
first, but it
could also
open up new
pos sibilities.
TV K
EY F
ACTS
201
7
74 75

The children's market is all about mobileA survey of 2,700 parents in the United States, Can-ada and Great Britain – conducted by Ipsos and DHX Media – shows that the majority of children (61%) prefer mobile devices for watching different forms of content, and 40% of them watch content on their smartphone. That comes as no surprise: they’ve been tinkering with those devices since their early days of childhood. As of now, Germany is trailing behind on that front. According to a representative survey by Iconkids & youth, 87% of mothers said that their children had been watching linear TV the previous day – YouTube and other web services were only named by 17%. And yet, smartphones and tablets are on the rise: 51% of 10- to 12-year olds already own a smartphone. This is an interesting development, considering Ap-ple launched its first iPhone only ten years ago. The tablet is taking off with the younger audiences as well: 54% of kids own one, a 13% boost compared to last year. Many companies have already adapted to the new user behavior and are offering an exclusive-ly mobile ecosystem. For example, the tremendously successful karaoke-app from China, musical.ly, with around 200 million registered users worldwide, is
only accessible on the smartphone and tablet. The Mini Playback-Show 4.0 is also outrageously popu-lar in Germany, especially with a very young audi-ence. Around 19 million fans follow the videos of the 14-year-old twins, Lisa and Lena. Last year, the duo was awarded the Otto by Bravo magazine, proving that these devices have reached the mainstream. It also serves as an important cue for the advertising industry and its customers who naturally see a lot of potential in the market.Another example of a mobile-only approach is the British mobile app, PopJam – a kind of safe Insta-gram for teens, already used by 30% of all 8- to 12-year olds. Similar to its big role models like Instagram and Facebook, PopJam lets children share pictures and stickers, follow channels and generate follow-ers in a safe space. Its success in the UK sparked a launch in the U.S. this year.These apps and networks are increasingly becoming a challenge for traditional broadcasters, particular-ly because more and more video content is being shared on those platforms, and kids today are more accustomed to a digital, on-demand service than linear television. For instance, the app Toca Boca connects thousands of original videos with online games and information for parents.
Children usage of mobile devices and TV
61%of children prefer mobile
devices for watching
different forms of content
40%of children watch content
on their smartphone
87%of mothers said that
their children had been
watching linear TV the
previous day – YouTube
and other web services
were only named by 17%. 54%of kids own a tablet, a 13%
boost compared to last
year.

The internet of things is changing the way we play, consume and learn The digital revolution sweeping through our children’s rooms will gain much more ground in the future. Vir-tual reality, augmented reality and the Internet of Things are all speeding up the process. Forecasts ex-pect 50 million connected devices in the mix by 2020, and I’m not only talking about thermostats and cars. Even toys and games will become digitally connect-ed, interacting with their users through an app which will gather and analyze lots of data. What’s the re-sult? The way children play will drastically change. Pokemon Go – a kind of scavenger hunt 2.0 – was only the beginning. The emerging technologies will also alter the way we learn; new devices can quickly and easily customize content to be precisely in tune with the user’s needs. Microsoft already lets us posi-tion information in rooms via VR glasses, no matter where we are. Another example is Cognitoy, which is no more than a simple toy dinosaur at first glance. But if you connect it to the internet, it can answer almost any question, like a children’s version of Wiki-pedia. Considering the sorts of questions children ask, it might be even better than their parents.
Artificial intelligence is moving into children's roomsVoice control might be breaking one of the last barri-ers into the virtual world. It allows us to consume and interact with media without having to read, write or type. The smart speaker, Amazon Echo, connects to Amazon via voice control. On the 8 August, Google has introduced its rival product – Google Home – in Germany. Mattel recently launched, among other products, Aristotle, Baby’s First Voice Assistant. Said to be an “Amazon Echo that understands your kids too,” the baby phone films your child and sends up-dates to your phone. It recognizes the child’s speech patterns, puts on his or her favorite tunes and ad-justs the light in their room. Another perk for parents is that Aristotle notices when the child needs a nappy change. These are only some of the ways that par-ents can benefit directly from the digital revolution. x
Check out the infographics by Brigitte Bayer from IP Deutschland on page 74-75 for more information on children screen usage.
CogniToys,
The Educational
Toy Dinosaur
TV K
EY F
ACTS
201
7
76 77


78 79
TV K
EY F
ACTS
201
7

Everyday Heroes For KidsHow brands become – and stay – relevant
Development is far quicker during childhood than at any other stage of life. Children are constantly acquiring new skills, and the way they perceive their physical and social environment is always changing. Whatever a four-year-old’s world revolves around today may well be completely forgotten in a few days’ time.
Childhood means change. This presents particular challenges to brands targeting kids in their market-ing and communication. Children’s needs and their developmental level have to be taken into account, and the brand should ideally retain long-term rele-vance. The key to achieving this was demonstrated in a number of presentations at this year’s Kinder-welten conference in Cologne, Germany. The concept m and iconkids & youth institutions presented the results of various studies which ex-amined the subject from different perspectives. The findings of iconkids & youth are based on regular quantitative investigations in the target group of children. Children and their parents are interviewed on subjects including leisure activities, media usage and consumption. concept m was commissioned by IP Deutschland with the task of finding out how brands establish themselves in the awareness of children and what the role of TV ads may be in the process. Children between 5 and 11 years of age were encour-aged to play in a natural setting in association with a brand. >
Cornelia KrebsHead of Advertising Research

Brands have
an ideal
audience in
children, who
are naturally
interested in
novelty.
Inspector Gadget
SUPER RTL, GermanY
80 81
TV K
EY F
ACTS
201
7

Depending on their character, they painted and did crafts with the experiment leader, while other kids reenacted brand experiences themselves or with toy figures. This atmosphere allowed the kids to express themselves in a way they might not have been able to articulate verbally. This combination of quantita-tive and qualitative results gave rise to specific ad-vice for brand communication. Brands have an ideal audience in children, who are naturally interested in novelty.What’s more, they get to know a lot of products through brand names in their daily lives. The brand (for instance, Nutella) is then synonymous with the product category (hazelnut chocolate spread), and it’s often only many years later that children become aware of the actual category behind the product. But even leading brands that make it to pole posi-tion because of their prevalence in very early child-hood development are not guaranteed long-lasting relevance.
An advertiser who
only communicates
their product’s benefits
without offering creative
stimuli won’t be up to par
in the imaginative world
of the child.
Woozle Goozle
SUPER RTL,
Germany

“This is for you”The art of effective children's advertising is to main-tain the balance between creative impulses and qual-ity communication of the product. Even in advertising directed at preschool children, the perks of the prod-uct should be clear. It goes without saying that kids need to understand that they are the target group. Certain key signals – such as colours, typography or the features of the characters in the ad – can be used to define the user category. Preschool kids don’t make strategic use of brands. The connection with a brand arises primarily out of what it offers the child on an emotional level; whether the product is attractive to the child or if he or she has any interest in using it.
Even primary school children think strategically At primary (elementary) school age, brand func-tions change. The egocentric perspective of a pre-school child, “me and the brand”, gives way >
Triggering the imaginationChildren’s ideas about brands and what they offer change according to their stage of development. The preschool period, for example, is distinguished by the very gradual cut off of the child’s symbiotic relationship with its mother. The child very carefully begins to assert its independence, which can quick-ly lead to overwhelming feelings. Brands can adapt to this tension by gearing their communication to-wards freedom and safe spaces for retreat. A child’s imagination is boundless; it only needs the smallest amount of stimulus to register brand communica-tion and it only takes short stories that convey to children the qualities of the brand characters to turn brands into heroes. But the reverse is true as well: an advertiser who only communicates their prod-uct’s benefits without offering creative stimuli won’t be up to par in the imaginative world of the child. They’ll then also be faced with an uphill struggle in the real world.
Brands have to adapt their storytelling to fulfil kids' imagination and safety needs.
TV K
EY F
ACTS
201
7
82 83

To be sure
your brand will
still be used by
the next generation,
your ads need to be
continuously present
with attractive brand
stories that are
relevant to the
times.
The Adventures of Pussy Boots
SUPER RTL, Germany

to a sociocentric one “what can the brand offer me in my social environment?”. After all, when you meet with friends in the playground, it starts to matter what you own and consume. Brands become acces-sories. In this age group, the primary function of brands is an integrative one. Kids want what their friends have. It’s important for children to join forces with friends to occupy shared terrain. This is another step towards breaking away from mum and dad – espe-cially if mum and dad don’t share the same fasci-nation with the current trends. At secondary (high) school, the focus increasingly shifts to the differenti-ation function of brands.Secondary-age kids are now well on their way to ex-pressing themselves. While they still basically want the same things as everyone else, they want them with a personal touch. In every generation, brands offer typical products with an integrative function but also a design that provides scope for distinction.
The comfort of the cocoonWhether preschoolers or teens, children always have periods of yearning for refuge and support. In this safe cocoon, they recharge their batteries in order to experience new discoveries. Products that are adver-tised as family friendly, or used in a family setting, give rise to a feeling of dependable security, emo-tional closeness and care.
Experts for targetSub-groups and lifelong favourite brandsDepending on the sector and product segment, it can be useful either to address a target sub-group defined by age, or to position the brand as suitable for children of all ages. Favourite brands that focus on target sub-groups stay relevant as long as they continuously re-evaluate the sub-group’s specific needs. This tactic helps them win over future gen-erations.
Favourite brands with a broad target group, on the other hand, should focus on the product ben-
efits, and avoid design codes which suggest
over-identification with too narrow an age category. This reduces the risk that the product will lose its cool factor as the children age.One thing is true for both types of brands: continu-ity is important. If brands stop advertising for long periods of time because they assume they’ve made their mark forever, they’ll be booted out by the com-petition. If you want to be sure that your brand will still be used by the next generation, your ads need to be continuously present with attractive brand stories that are relevant to the times.
TV ads build bridges between brands and the imaginationTV ads have a central role in the communication of successful brands: they are the link between the product, the personal environment and the child's imagination. In an ideal world, TV ads would use compelling storytelling to communicate not just the relevance of the product in kids’ daily lives, but also a sense of what the brand stands for. Brands should technically have an easy ride in this case, as they can build on the imaginative way children think. A brand story suitable for children needs time in TV ads to develop its message. Although overly quick cuts may have a dynamic effect, children are over-loaded by them, and the character of the brand falls by the wayside. It’s a better idea to rely on short, concise stories about the qualities of the brand he-roes. With sharp storytelling, brands have the best chance of staying present, even in the absence of di-rect advertising contact. x
TV K
EY F
ACTS
201
7
84 85

The Kids Are Alright: Millennial TV Viewing Trends Might Be Getting BetterDeloitte predicts that traditional TV viewing1 by 18- to 24-year olds (the youngest sub-group of the millennial generation, also known as Gen Y) will decline by 5-10% in the US, Canada and the UK in 2018 compared to a year earlier. In each country that would be a rate of decline lower than a few years ago.
The
erosion of
TV minutes
won’t stop,
but will
likely slow
down.
Deloitte further predicts that it is probable that the trend for the next few years will be ever more modest annual drops. Why? Over the last few years, young people were pulled away from traditional TV by the astonishing growth in digital competition In the last five years young people have been lured by the siren songs of alternatives such as smartphones, comput-ers, social media, streaming platforms like YouTube, SVOD systems like Netflix, and video piracy, from either downloading or more increasingly, streaming. All of those distractions are piling up and showing stagnating annual usage, meaning that the erosion of TV minutes won’t stop, but will likely slow down.Overall, TV viewing for the total population has been resilient. For example, in 2017 TV daily minutes in the US are down less than 2%. But it was a common as-sumption that these average viewing numbers were mainly supported by a rising audience in elderly peo-ple, while younger viewers were abandoning TV at an ever increasing rate.Figure 1 is a chart showing the annual changes in traditional TV viewing for similar young age groups in
Duncan StewartDirector of Research

the US, UK and Canada from 2011 to the present. As far as I know, there has never been a comprehensive graph of the three largest (mainly) English speaking markets before, focused on young viewers, and over such a long period. The first conclusion I would draw looking at Figure 1 is that traditional TV viewing by 18- to 24-year olds ap-pears to be in structural decline. This is hardly news, of course, but seeing the trends over six plus years and across three countries reinforces that message. Second, the annual declines tend to range from about -5% to about -10%. Of the seventy or so indi-vidual data points, over 80% fall into that range. As anyone in the print newspaper business can tell you, single digit declines are MUCH preferable to double digit declines! Finally, the trend does not seem to be accelerating: there were some declines of over 15% in the UK and nearly 20% in the US, but they are outliers. UK declines look stable, and in both Canada and the US there seems to be a moderating trend in annual drops in TV viewing by this youngest age group. That could change, but the worst seems to be behind us. >
86 87
TV K
EY F
ACTS
201
7

It seems likely that, for the rest of 2017, we’ll see viewing declines of closer to -10% than -5% in the US and the UK. Both the US Presidential election and Brexit/UK election had a positive effect on TV news viewing by young people, and therefore the year-by-year comparisons will likely suffer for the rest of 2017 now that these major TV news events are over. But it’s possible that we’ll see smaller declines in 2018.
Why?I think that recent declines in traditional TV viewing by 18- to 24-year olds were in large part caused by tech and media trends that acted as competitors or substitutes for traditional TV: smartphones, stream-ing video on demand services, social media, piracy and ad supported online video. (Some might wonder why I don’t mention video games, but those have ap-pealed to young people and competed with television for decades. They did not spike in the 2014/2015 time
period.) Those all existed before 2013, but entered the steep part of adoption and usage curves, and acted as a “perfect storm” that took 18-24 year olds eyeballs away from TV sets. None of them are expected to be-come less important going forward, but neither are they capable of becoming materially more significant threats than they are already. At some level, the worst may be past!
1. Young people are more likely to have a smartphone. Smartphone ownership by 18- to 24-year olds in the US was only 55% in 2012 and was 94% in 2016, the same number in 2015. Not only are smartphones nearly ubiquitous, the penetration is not growing3.
2. Smartphones have much bigger screens, which are much better for using as a TV alternative. In September 2014, Americans owned
Yearly change in traditional TV viewing by young peopleUS, canada and UK - 2011 to present
Q2/11 Q3/11 Q4/11 Q1/12 Q2/12 Q3/12 Q4/12 Q1/13 Q2/13 Q3/13 Q4/13 Q1/14 Q2/14 Q3/14 Q4/14 Q1/15 Q2/15 Q3/15 Q4/15 Q1/16 Q2/16 Q3/16 Q4/16 Q1/17 Q2/17Q1/11
USA 18-24
Canada 18-24
UK 16-24
5%
0%
-5%
-10%
-15%
-20%
Figure 1

only 60 million phones with screens over 4.5” and 120 million phones smaller than that. By December 2016 the smaller phone category had gone down to about 40 million, while there were now about 160 million larger phones4. Given new product launches, we may see over half of all new phones have screens over 5.5”.
3. More young people have SVOD services such as Netflix, and use them more each day. Only 28% of US millennials had Netflix in 2012, a rate that nearly doubled to 50% by 2015. Tacking on the growth in Amazon Prime, Hulu and HBO Go, SVOD penetration in this demographic is now likely over 75%. Daily usage for Netflix was about 1.2 hours per subscriber per day in 2012, and 1.8 hours in 20175.
4. Young people are consuming more streaming video from services such as YouTube. Streaming video hours weekly for US millennials rose from 1.6 hours in Q4 of 2013 to 5.7 hours in the same quarter of 2015, more than tripling in two years6.
5. Social media apps are ubiquitous and time consuming. As of December 2016, over 60% of US 18- to 34-year olds were on Snapchat, over 75% were on Instagram, and 95% were on Facebook. Daily use of each platform averaged 14 minutes, 13 minutes and over 30 minutes, respectively… meaning between the three, total daily social media approaches an hour7. Snapchat was used by 38% of 18- to 24-year olds in the US in December of 2013, and 78% by December of 20168.
6. Peak piracy? Although millennials are now less likely to download, they are still pirating video content. 42% of 18-24 year olds in 2016 said they illegally streamed video on their desktop or laptop, and 41% said they were streaming illegally on their mobile devices9.Details on interpreting the chart:1. I have chosen to use line thickness as a rough in-
dicator of population size, with the US the thick-est and Canada the thinnest: the line width is not
exactly proportional to population size, but close. In the period measured there were about 25-27 million 18-24 year olds in the US, about 7 million 16-24 year olds in the UK, and over 3 million 18-24 year olds in Canada.
2. Data in each country is sourced from the tradi-tional leader in TV viewing measurement: Nielsen in the US, BARB in the UK, and Numeris in Canada.
3. There are multiple important differences in meas-urement methodologies used by the three data providers. Far too many to enumerate, but they almost certainly matter.
4. The age break used in the US and Canada is 18-24 year olds while the UK age break is 16-24.
5. The Canadian data is annual instead of quarter-ly, and is not as current, ending in the 2015/2016 broadcast year. Equally, we have Q2 2017 data for the UK, while the matching US data will be pub-lished in October. >
Cf. the article by Florent Carême from Eurodata TV Worldwide that gives an interesting insight on the share of non-measured viewing by younger target groups and its effect on the global viewing figures.
TV K
EY F
ACTS
201
7
88 89

Finally, the
trend does not
seem to be
accelerating: there
were some declines
of over 15% in the
UK and nearly 20%
in the US, but they
are outliers. [...]
The worst seems to
be behind us.

6. There are important country differences. Just a few examples:
a. BBC iPlayer is a significant factor in the UK which appeals to younger viewers. There’s no real equivalent in the North American markets.
b. In Canada, TV habits for English-speaking and French-speaking viewers (about 22% of the pop-ulation) are sharply different, with French-speak-ers watching more traditional TV each day, and annual declines being lower. The Netflix take rate in French Canada is less than half of that in Eng-lish Canada.
c. And in the US market, there are even larger dif-ferences within the population. The average 18 to 24 year old watches about 151 minutes of live and time-shifted TV per day in Q4 2016, while the average African American of the same age watches 246 minutes (63% more than the com-posite average) and the average Asian American watches only 83 daily minutes (45% less than the composite).
7. Although younger viewers are moving some of their daily video minutes away from tradition-al TV comedy and drama, other categories, such as sports viewing, has remained relatively strong. Therefore, sports viewing now makes up an increasing percentage of total traditional TV viewing for young people. That’s great news for sports and traditional TV, as it’s watched live and with strong ad loads and subscription fees. But, it also means that analyzing annual trends is more complicated, volatile and country specific.
a. Whether the Football World Cup or Champions League, strong or weak performance by any of the UK teams would have a large positive or negative effect on viewing in the UK market. But although some in North America watch that kind of football the effect is much smaller.
b. Meanwhile, NFL football is the dominant TV sport in the US. A period of weak ratings (as was seen in the first half of the 2016/2017 season) would have a material impact on TV viewing by young people. Assuming they watch an average of 120 minutes of TV per day in that fall football
quarter, even a 6 minute decline in NFL viewing would mean a 5% drop!
c. In Canada, neither kind of football is as impor-tant for traditional TV: instead it is NHL ice hock-ey. A playoff year which saw no Canadian-based teams perform well would literally see a 50% drop in audiences compared to a year where sev-eral Canadian teams (especially in larger mar-kets) made it through several rounds. 5-10 min-utes per day impact for 18- to 24-year olds would be a conservative estimate.
8. Equally, although Figure 1 shows stable single digit annual declines, data from other countries is not so positive. Recent data from Denmark, Norway, and Sweden for Q3 of 2016 show that TV viewing by 15- to 24-year olds is not declining at modest single digit rates, but 29, 21 and 23% respective-ly. The data is over a measurement period of one year, so it will be necessary to watch this trend over a longer time period to see if this decline is steady. Though this seems improbable, time will tell. x
1 This refers to live and time shifted viewing of TV content on TV sets, connected TV devices, computers and smartphones. It does not include tablet viewing, and does not include SVOD services such as Netflix or online video content such as YouTube.
2 http://www.smartbrief.com/s/2017/03/nielsen-millennial-viewer-ship-rise-across-cable-news-networks
3 comScore US Cross Platform Future in Focus 2017, page 244 comScore US Cross Platform Future in Focus 2017, page 285 Netflix quarterly reports.6 http://www.jayshemenski.com/blog/will-social-media-become-the-new-tv-for-brands
7 comScore US Cross Platform Future in Focus 2017, page 328 comScore US Cross Platform Future in Focus 2017, page 359 http://www.broadcastingcable.com/news/news-articles/study-millennial-pira-cy-trends-shifting/159771
10 http://www.newgeography.com/content/00269-number-18-24-year-olds-united-states-2000-2050
11 http://www.statcan.gc.ca/tables-tableaux/sum-som/l01/cst01/demo10a-eng.htm
12 Special thanks to Toby Syfret at Enders Research for the UK data, and to Lisa Eaton and Numeris for Canadian data. All US data is pulled from the various Nielsen Cross Platform and Total Audience reports over the years by me. I of course take all responsibility for the presentation and interpretation of Toby’s and Lisa’s data!
TV K
EY F
ACTS
201
7
90 91


92 93
TV K
EY F
ACTS
201
7

SolutionTrends.
Combining the power of linear reach with digital interactivity in customer re-lationships has a positive short-term ef-fect on sales and long-term effect of TV on the customer's brand experience.• Bianca Stockreiter from TrendOne tack-
les how younger generations today are ‘always on’ in terms of their digital con-nectivity. Knowing how to credibly place a brand in the digital environments so that it gets people talking is vital.
• Marc Cain’s experience testifies of how you can rapidly “popularise” your brand and engage the young generation; in this case, by having them identify with a very young fashion TV show that matches the brand’s DNA.
• The Haier experience on the German channel Vox is a fascinating case that shows how a TV brand partnership and licensing for a TV show can have a strong impact on sales and in-store activities.
• The new PayPal TV experience on Antena 3 in Spain breaks down how brands can deliver a clear message in a creative way, while delivering a strong national reach and boosting digital conversations.
• The Lastminute customer experience on ITV in the UK and M6 in France is an insightful case, showing how memora-ble TV content is the key for compelling “storytelling”. It covers the wide range of Total Video advertising solutions that broadcasters can tap into to bring their message home.
TV remains the ultimate platform for making brands famous. This is not at the expense of innovation, with a plethora of “beyond the spot” solutions available to brands and marketers. In an inter-view with smartclip, we get an in-depth scope on the technical developments in addressable TV. Data is undoubtedly es-sential for tweaking content to achieve results with the biggest impact. Howev-er, data and digital channels should nev-er be a substitute for bold and brilliant ideas, which TV itself is famous for. Thor-sten Schutte-Gravelaar explains how ATV harnesses these new data sets and real-time opportunities, to broaden the timeless value of the traditional TV experience. x
With the new Total Video world we live in, the broadcasting industry has harmonised mass media and customised solutions for advertisers. TV’suniquereachworksmoreeffectivelywithdigitaladpossibilitiesthatmostbroadcastersnowoffer:newvideomarketplaceopportunitiesandinnovative solutions (behavioural targeting, re-targeting, addressable TV, influencemarketing,qualifiedandsafedata).
Krane JefferyHead of Digital Solutions
Christophe LoiselDeputy General Manager

94 95
TV K
EY F
ACTS
201
7
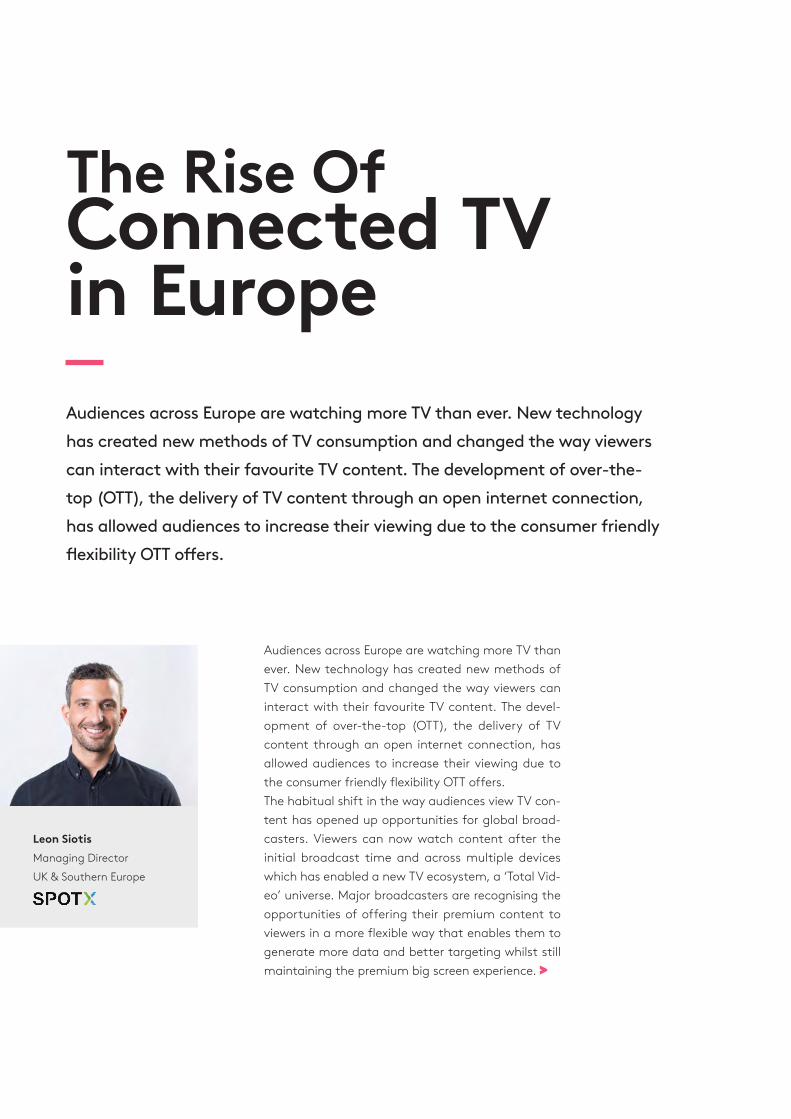
The Rise Of Connected TV in EuropeAudiences across Europe are watching more TV than ever. New technology has created new methods of TV consumption and changed the way viewers can interact with their favourite TV content. The development of over-the-top (OTT), the delivery of TV content through an open internet connection, has allowed audiences to increase their viewing due to the consumer friendly flexibilityOTToffers.
Audiences across Europe are watching more TV than ever. New technology has created new methods of TV consumption and changed the way viewers can interact with their favourite TV content. The devel-opment of over-the-top (OTT), the delivery of TV content through an open internet connection, has allowed audiences to increase their viewing due to the consumer friendly flexibility OTT offers. The habitual shift in the way audiences view TV con-tent has opened up opportunities for global broad-casters. Viewers can now watch content after the initial broadcast time and across multiple devices which has enabled a new TV ecosystem, a ‘Total Vid-eo’ universe. Major broadcasters are recognising the opportunities of offering their premium content to viewers in a more flexible way that enables them to generate more data and better targeting whilst still maintaining the premium big screen experience. >
Leon Siotis Managing Director UK & Southern Europe

Viewers can now watch
content after the initial
broadcast time and
across multiple devices
which has enabled a
new TV ecosystem, a
‘Total Video’ universe.
96 97
TV K
EY F
ACTS
201
7

STV, the leading broadcaster in Scotland, is embrac-ing the new ecosystem. The STV Player allows view-ers to watch their favourite TV programmes such as World Cup Football or The X Factor live and on catch-up, free of charge within STV’s licence areas. The broadcaster was the first in the UK to introduce dynamic ad insertion (DAI) to live channels in 2014, with Yospace. Since then STV has developed a cut-ting-edge data strategy, allowing their inventory to be monetised programmatically and is a perfect ex-ample of a broadcaster embracing the new TV eco-system opportunities.Interest in the development of connected TV is be-ing driven by European advertisers who see enor-mous value in reaching consumers on the big screen in a brand safe environment. Adoption of OTT var-ies market by market in Europe and is dependent on several key variables such as connected TV penetra-tion in the market, consumer awareness, broadband speed and the availability of free-to-air TV. In some countries, the use of connected devices is more of an urban phenomenon with the opportunity for devel-opment in rural areas. In Germany, where TV remains hugely popular, there is a wealth of options for subscription-based VOD services with good competition amongst pro-viders driving the uptake of OTT. There is room for further growth in the market, and as audiences are becoming more aware of how they can watch con-tent through a streaming service, gaming console or
smart TV, broadcasters’ investments into the con-nected TV ecosystem will increase at a steady pace.Like Germany, Spain has excellent broadband pene-tration giving an optimistic outlook for the future of OTT in the region and audiences are well informed about the connected TV options available to them. The strong demand from advertisers and their agen-cies for more connected TV inventory outpaces the supply available at the moment. As the amount of local content in Spain that is available on OTT plat-forms grows, the Spanish market will see the new ecosystem flourish.Like Spain, the success of OTT in France is depend-ent on more local content being produced. Howev-er, according to eMarketer, half of France’s internet users will access streaming video services at least once a month this year. Advertisers and their agen-cies would like to see more of this inventory become integrated with programmatic infrastructure. France also benefits from advanced video measurement which was introduced into the market by Médi-amétrie in 2016 but there is still room for more inte-grated ‘total video measurement across digital and TV. The predominance of IPTV does remain a barrier to full penetration of OTT but awareness amongst consumers is high which will put pressure on broad-casters to meet viewer expectations. Italians love free-to-air live TV and smart TV, while broadband penetration is low, resulting in dimin-ished motivation for broadcasters to invest in a new

connected TV ecosystem. Despite this, advertisers are showing a strong demand for connected TV ad-vertising options in the region. If broadcasters and manufacturers can co-operate to protect and devel-op the TV environment in Italy, the level of OTT adop-tion will increase. According to SNL Kagan, the UK has one of the high-est levels of broadband penetration in Europe. 91% of UK households have fixed broadband connections, of which 91% are over 4Mbps (Akamai, State Of The In-ternet Q4 2016) and, like the US and Germany, smart TVs are extremely popular. There is also widespread audience awareness of OTT options with a rising culture for watching TV across multiple devices and through catch up or streaming services. Broadcast-ers in the UK believe that investing in OTT should be a top priority for them over the next three years. Fast-paced adoption will be facilitated by the already well established programmatic video industry.There is a clear opportunity for European broad-casters looking for incremental revenue from OTT. As audiences continue to enjoy television, albeit on demand and through a variety of connected devices, advertisers demand will continue to increase. Aware-ness amongst consumers for these options across Europe is generally high and it is now in the hands of the broadcasters to capitalise on the opportunities of the new ‘total video’ ecosystem. x
91% of UK households
have fixed broadband
connections, of which
91% are over 4Mbps.
TV K
EY F
ACTS
201
7
98 99

Reliable
standards
that would
offer genuine
comparability
and
meaningfulness
have not yet
become
established
in this
dynamic
market.
Marketing of Tomorrow The Four Factors For Success???
DataQuantity with qualityTechnology and data go hand in hand. If technology is the engine, data is the fuel that drives the mod-ern consumer, the media and the advertising world. There can no longer be any doubt that today – and to an even greater extent in the future – data is a key factor for success across all industries. The keyword here is "big data". To see where the true potential lies for marketing and advertising, however, we need to take a closer look.
Using data intelligentlyWhat data is relevant for brand communication? Who has control over it? How does big data be-come smart data? That is, how can data be pro-cessed to be useful in practice? The challenges are by no means trivial. The fact that even more types and greater volumes of data can be captured is both a blessing and a curse at the same time. While in-creasingly varied and useful insights can be gleaned from the flood of information, the data situation is in many cases still very heterogeneous in terms of origin and methodology. Reliable standards that would of-fer genuine comparability and meaningfulness have not yet become established in this dynamic market.
Jens Pöppelmann Media Operation Director

Data as a contact filterIn the media sector, the primary use of targeted data is in qualifying contacts. The potential benefits range from optimised targeting of the audience via improved targeting mechanisms and optimised con-trol of the screen-independent contact rate, to so-called data creativity. In other words, the user-spe-cific dynamic adaptation of advertising material and play-out using a variety of different sources of data, such as genre, current location, associated weather reports, information on search and purchasing be-haviour etc.All of these benefits contribute to increasing budget efficiency in the long-term, be it by reducing media waste, fine-tuning the campaign control, obtaining more meaningful KPIs for ex-post campaign anal-ysis, or through achieving a better understanding of both the individual customer and the cus-tomer journey in general.
The rarer, the more valuableHoning in on the target group is probably the most relevant area for data-driven optimisation, and it can be grouped into four categories, each of which relies on different information: technical and predictive behav-ioural targeting, re-targeting and the use of so-called us-er-declared data. >
100 101
TV K
EY F
ACTS
201
7

These four categories differ in the type, quantity and availability of the data gathered, and – regardless of the volume – in how the quality of the data in ques-tion can influence the effect of a campaign. Basical-ly, the rarer, more specific and exclusive the data, the more valuable it is.
Acquire, bundle and process data sourcesVarious suppliers have, as a consequence of their history, access to a variety of different data points that they can exploit. Some are striving to strategi-cally extend their data expertise and sovereignty in order to increase their own relevance in the market, because linking different types of data creates add-ed value.
Valuable panel data both in terms of quality and quantity
Number of panellists• Quality assured• Incentivised and valid• Panel data superior to profile data
In order to differentiate a
brand from the competition, to
bring it to life and plant it firmly
in people's memories, you need
inte grated solutions that span
across all chan nels.

OrchestrationCreativity on all platformsIn order to differentiate a brand from the competition, to bring it to life and plant it firmly in people's mem-ories, you need integrated solutions that span across all channels. Mutually complementary measures cov-ering TV and the digital domain are now standard. It's important to adapt the storytelling mechanisms to the scenario of the channel in question. This makes creativity, storytelling and orchestration more impor-tant than ever. Forms of advertising, such as product placement, branded entertainment and content mar-keting have become firmly established in television. It’s becoming apparent that brands and products are not only becoming more tightly associated with TV shows, but are even becoming protagonists in their own right, generating enormous advertising impact in the pro-cess.
Integrated solutions across all channelsIf a brand is seen as credible, sympathetic and rele-vant – whether as part of a large-scale, high-reach comprehensive campaign or a custom split-screen
during a show – content integration will continue to grow in importance and rapidly become the norm. Particularly in the digital domain, such as addressa-ble TV for example, the number of options are grow-ing daily. It’s an important step for IP Deutschland to be involved in driving such future trends.
Greater impact – from tailor-made to off-the-pegThe demands being made of media providers are changing rapidly: attractive environments and com-petitive sales models are an essential basic require-ment, of course. But there is an increasing tenden-cy for expertise in areas outside the traditional core activities to clarify to advertisers the performance, cost-effectiveness, management and transparen-cy when assessing how attractive a product is. Only those who identify trends early enough, take a holis-tic view of the associated thematic fields and flexibly adapt to new developments will enjoy success in the long-term. For IP Deutschland, this means not just relying on its own solid market position, but having a vision focused on key areas, and a corporate culture that embraces constant change. x
TV K
EY F
ACTS
201
7
102 103

Stephanie HorbaczewskiFounder & CEO
StyleHaul’s Data Ecosystem
Could you tell us more about StyleHaul’s creation and purpose?
I’d read in FastCompany, predicting that brands were going to need to build social networks to com-pete in the future. I decided that I wanted to be in the digital space. I met Allen and Aaron DeBevoise through the team that founded Machinima and they agreed to co-found StyleHaul with me. Our vision was to translate the fashion and beau-ty editorial space into digital and social content. It’s now evolved into a vast network of more than 20,000 content creators across 86 countries.
You’re calling yourself a “marketing influencer agency” and not an MCN anymore. Are you changing your strategy?
To me, the MCN movement as you and I know it has gone in different directions. The whole space evolved to an MPN – a multi-platform network – so it’s more of an industry movement. What links these business-es is that we’ve moved across the multi-platform. >
StyleHaul,acontemporarymarketinginfluenceragencyandhometothelargest global style community of content creators, develops multi-platform content strategies for brands, such as CoverGirl, Walgreens, Procter & Gamble, Johnson & Johnson and Sephora, through highly targeted campaigns designed for the 18 to 34-year-old female demographic.
Interview.

YouTube is still
the most popular
platform
for creating
and consuming
content.
104 105
TV K
EY F
ACTS
201
7

We focus on the conversation, and what we can learn across platforms. For example, right now we’re look-ing at the fact that YouTube has become more of a consumption platform than a creator platform. We’re seeing trends completely changing. Facebook is more for consuming, Instagram is more for creating, and YouTube is still for creating and consuming.
Can you describe your global market?
We’ve found that being global and doing multi-re-gion and multi-language campaigns has been very successful. For one P&G brand, we were able to run a campaign simultaneously for 5 different markets across South East Asia using the same products and the same line, which was a new advantage for them.
Where does your data come from? How do you organise it?
We have our own proprietary product, Society, which collects data from many sources, such as YouTube
CMS, authenticated video and social channels, pub-lic APIs, indexing and much more, to provide unique cross-platform insights and strategies. Essentially, the data comes from first-party authentication from all of our 20,000 creators across major four social plat-forms: YouTube, Instagram, Facebook, and Twitter. More specific data, such as sentiment analysis, comes from a variety of third parties that we work with.
Tell us about your technology called the “Eye”.
Until now, we’ve only been able to analyse an Insta-gram campaign by who liked it, who shared it, who commented on it; the typical engagement behav-iour. The Eye allows you to see anyone who saw the content and created their own content as a result, as well as micro-groups within that. For example, we did a programme for a cosmetics products retailer, and by using the Eye, we found that there were hyper-passionate subgroups such as hair, which is only one small section of the products

they sell. We could tell who the leading voices were and what type of content they were passionate about in the hair group. When they were going to launch new hair products in their store, the compa-ny could be practical about their ad investment, and consequently more effective as they’re targeting a very specific group of customers.
How do you select the creators?
We have a certain set of criteria and engagement metrics that our talents have to meet to be part of our network, so we can say to a brand that they’re all relevant, vertical and within a certain engage-ment threshold (e.g. how many followers on Insta-gram, how many monthly viewers on YouTube).
Do advertisers always follow your recommendations on the YouTubers choice?
It’s really brand dependent; some brands still come in with a set idea of who their creator should be, oth-ers are open to learning from the data. A couple of years ago, we created the Vlogorithm to help adver-tisers understand our data-driven recommendations for creators. It allowed them to gauge what was most important to them, such as the demograph-ic reached by the creator, the creator’s age, if they were a mom, etc. It scans all the data points that we store on creators—hundreds of millions of likes a day—and give advertisers a list ranking the positive communication about their brand. What’s the big difference between the Vlogorithm and the Eye?
The connection between the two of them is that they’re both part of Society, which is the StyleHaul product that captures all of our campaigns and our data, but they’re not the same. The Vlogorithm is a tool to help advertisers choose the best creators for them. For example, one brand was really fond of a particular creator, and although
StyleHaul, a market leader• 12.7 billion views on
YouTube in the first half of 2017
• 3.2 billion likes & almost 50 million comments on Instagram
• A community of over 18,000 highly curated influencers across all social platforms
I agreed with her, the products were only carried in one or two retailers at the time, and she indexes re-ally highly with the competitive retailer. She wasn’t the best choice because her audience would end up buying similar products from the competitive retail-er. The Eye shows us everyone who saw the brand’s content on Instagram, and who created content as result of that. Those are their most highly engaged users. From there, we can show advertisers how to use the data to re-target users and continue the re-lationship with them, such as encouraging them to purchase or sign-up. What makes you unique on the market?
We’re fashion, video and style, now we’re female and male with the launch of Hauk, and we’re a focused group of individuals who are passionate about those topics. More than 80% of our community makes household decisions. In the land of MPNs, we’re leading the way with data strategy and internal products, with tools like Society and the Eye, and our work with targeting, re-target-ing and localized modeling. x
TV K
EY F
ACTS
201
7
106 107

In Germany, RTL Deutschland, ProSiebenSat.1 and United Internet have recently formed a log-in alliance to provide a simple, secure solution that manages opt-ins for the use of internet services, while remaining transparent and compliant with data protection laws. Meanwhile, in France, M6, Lagardère Active, Les Echos-Le Parisien, SFR and many other French media groups have rallied together to form “Gravity”. This data alliance bundles and markets all of their data through an innovative platform, consequently bolstering their positions in the advertising market. For now, the companies are readjusting their platforms to meet the new European data protection standards before they come into force.
RTL Deutschland, Prosiebensat.1 and United Internet’s log-in alliance• Creation of a cross-sector, open standard in line
with the new European data protection law • After its launch, 45 million users will be able to log
in to partner websites easily and securely • Transparency and control over personal user data –
open to additional partner companies.Three of Germany's media and Internet compa-nies – Mediengruppe RTL Deutschland GmbH, ProSiebenSat.1 Media SE and United Internet AG – have launched a log-in alliance. This consists of a cross-sector registration and log-in procedure for ac-cessing internet services with single sign-on. The partners are developing an open standard that lets customers use the same log-in credentials to ac-cess all the cross-sector internet services part of the initiative, instead of repeatedly entering different log-in details for each service. In addition, users are able to exercise data sovereignty. Each user has access to a standardised privacy centre from their account provider, which facilitates trans-parency and control over their personal data. Users can manage their data, change their password and grant or revoke permissions, all from a single location. Zalando SE will be the first partner to use the log-in solution. As of its launch in 2018, users will be able
Facing GAFA Players, European Media Groups Form Data Alliances
Focus.

With over 45 million unique
users each month, the
project’s scope is essential
for its future success.
to log in to their single sign-on, not just to watch TV NOW from Mediengruppe RTL and the ProSieben live stream, but also to check emails on WEB.DE and GMX and to shop online at Zalando. With over 45 million unique users each month*, the project’s scope is essential for its future success.Thomas Ebeling, CEO of ProSiebenSat.1 Media SE, weighs in: “With our alliance, we’re adding substan-tial value for the customer. At the same time, we’re strengthening the German digital market by coun-terbalancing the US monopolies and unclear algo-rithms.” x
*Source: Working Group for Online Media Research [Arbeitsgemeinschaft Online-Forschung])
108 109
TV K
EY F
ACTS
201
7

Gravity, the French data alliance
What is Gravity?
Gravity is based on the conviction that putting to-gether their assets, a group of French companies can create a common dynamic and push the digital ad-vertising market one step further. Our commitment to strengthen our positions in the market relies on :• A rich, diverse data offer in socio-demographic, so-
cio-professional, interests, intentions, purchasing patterns, etc.
• And a powerful media offer that brings together a set of formats for the alliance groups’ websites and apps.
What was the motivation behind creating this alliance and what’s at stake regarding data today?
Gravity is an offensive initiative, not a defensive one. The alliance was created in a context in which companies, notably GAFAM, brought innovative ad-vertising solutions to the market. These solutions rely mainly on daily reach, constant communica-tion with the user, and the sheer power of the data collected about the users to maximise ad targeting. Gravity gets inspiration from it and positions itself accordingly. However, we’re convinced that by pool-ing our media, data, and know-how—particularly
Centre France La Montagne, Condé Nast, FNAC DARTY, L’EQUIPE, La Dépêche, La Nouvelle République, Lagardère Active, Le Télégramme, Les Echos-Le Parisien, Marie-Claire, M6, NextRadio TV, Perdriel, Prisma, Media, SFR, SoLocal and Sud-Ouest: a dozen French mediacompanies have combined forces to form a data alliance called Gravity. Bundling and marketing their data through an innovative platform, these media groups hope to become the third major player on the digital advertising market, competing with Google and Facebook.
Amaury Lelong Managing Directorin charge of data, programmatic, search & social advertising
Focus.
The world
of digital
advertising
should
question
itself and
evolve, to
find a
practical
and
effective
place within
the user
experience.

our technological expertise—this alliance can reach a turning point for digital advertising in France and steer the market to a new direction.
What guarantees can you give to advertisers?
The key values we propose to bring to the market are: • Media power – 44% daily reach among the French
population, equivalent to 16 million French people. This gives us a very competitive position in the mar-ket, pitted against Google and Facebook, who have 70% of the daily reach.
• Media granularity – we have the ability to restrict very precisely the broadcasting environments.
• Power and diversity of the data – we deliver an ex-tremely diverse targeting quality. Our data targets are based on socio-demographic characteristics, geolocation, interests, intentions, brand affinity and even purchasing behaviour. More than 10 billion characteristics of internet users or mobile users are updated every month within the alliance companies.
• Brand safety, the core of our offer – we provide qualitative advertising environments along with qualitative and mastered audiences.
Gravity is made up of different groups. How can the standardisation of data achieve consistent targeting?
Well, that's the big challenge! That's why this alli-ance wasn’t so straight forward, and why the market waited a long time to go for it. First, we chose to use a trusted third party, Mediarithmics, to simplify our internal communication. They collect, process and standardise the data, according to certain criteria that all of our partners follow. Moreover, the alliance will be equipped with a data science team, whose work will be to validate and op-timize the data cross-over between companies.
How would you define your current development status in terms of partners?
With close to 50% daily reach, we believe the launch has been a success. We’ll be revealing new alliance members in the coming weeks and I think that with-in a year, we’ll have reached our ambitious target: to be at least on par with Google and Facebook.
Since the alliance is composed of both large groups and smaller partners, how is the distribution and compensation organised?
Dividing up the profits is very simple: each member brings in their own media, reach and data. We work with a dual automatic remuneration model that pays each member when his or her media or data is used, through a platform created by Mediarithmics.It’s a win-win situation: the alliance will let compa-nies break into markets that are out of reach today. So, Gravity is a way to build up a collective experi-ence that we wouldn’t be able to have individually.
What do you think about the new European Personal Data Regulation (GDPR)?
We are fully concerned by the coming evolutions in European regulation. More broadly, the effectiveness and relevance of advertising is paramount to us. The world of digital advertising should question itself and evolve, to find a practical and effective place within the user experience. Gravity is a way to make adver-tising more relevant and therefore more in tune with the user, by sharing data and having an efficient ad-vertising capacity.
Is a log-in agency something you might consider in the future?We know that the world of cookies is likely to more restrained in the future, so there’s already some brainstorming about media logs. It’s not our priority now, but it’s one of the projects that in the works. x
TV K
EY F
ACTS
201
7
110 111


possibility to log-in with your Facebook details. As a result, Facebook can access personal data to track their users even outside their own platform.This is something that Gravity (and similar struc-tures) can provide to advertisers. Using the personal log-in, they could easily access viewing habits and shopping routines, as long as they ensure there won’t be a joint data pool. Those are currently the biggest advantages. Furthermore, forgotten log-ins won’t be a big issue anymore as click-and-buy will be the easy norm. x
On one hand, the GDPR guarantees new rights for data subjects.A data subject is any personal data or information relating to an individual. With the new regulation, data subjects have to actively spell out consent; im-plicit consent will be banned and consent can be re-tracted. It’ll also be possible to deny profiling. Moreo-ver, the data subject can request their personal data and is allowed to transmit it.
On the other hand, the GDPR sets new obligations for the data controller and data processor.
The data collector decides how to process per-sonal data. Processing personal data will still
be possible, but the data collector/processor has to make sure that none of the subject’s
rights are infringed and has to prove that the GDPR rules are followed. Further-
more, international transfer of personal data is restricted and authorities have
to be notified immediately in cases of breach.
14 million websites around the world currently offer the
General Data Protection Regulation (GDPR)
Personal data protection is nothing new, and the implementation of the GDPR will be the next step. New regulations and data protection laws are catching up with the consistent technology evolution. The original GDPR proposal started in 2012. The formal adoption of the laws have been ongoing since April 2017, and come into force on 25 May 2018.
Focus.
TV K
EY F
ACTS
201
7
112 113

There is now a global picture of addressable TV in Europe and around the world: smartclip in Germany, SkyAdsmart in the UK, tests with Orange and SFR in France. Here is an insight into the recipe for success of smartclip, a leading programmatic video platform and technological innovator.
What is smartclip? How did the idea come about?
Today, smartclip curates the online video advertising inventory – more than 700 publishers and broad-casters worldwide – and manages the integration and delivery of online video advertising to all inter-net-connected devices for on-demand and linear content. As a leading programmatic video platform and technological innovator, smartclip develops marketing technologies such as addressable TV and out-stream video advertising. In a nutshell, we intend to merge TV with digital ad technologies to effectively combine ads and delivery logistics. This is a huge step forward for the adver-tising sector and for RTL in turn. It also represents real value added compared to Google and Facebook, because as of now, they don't have any comparable, perfectly combined TV and digital products.
How does smartclip position itself when set against other offers?
Addressable TV advertising is the new wave of inno-vation, and experts predict that it will have a major >
Addressable TV in Europe
Thorsten Schütte-GravelaarManaging Director
Interview.

40%of all households
are already receiving addressable TV ads
in Germany
Addressable
TV advertising
will have a major
impact on the TV
advertising
industry within
the next few
years.
114 115
TV K
EY F
ACTS
201
7

impact on the TV advertising industry within the next few years. For instance, Google has recently an-nounced the availability of traditional TV inventory in the US through DBM. But, addressable TV in the US and Europe must be considered separately, as the status, technologies and key players in these regions are very different.
Addressable TV in the USA study conducted by the Video Advertising Bureau1 claims that the footprint of addressable TV is 50 mil-lion households in the US alone. Addressable TV households are enabled through set-top boxes using the infrastructure of operators like AT&T, DISH and Comcast, with the inventory limited to two minutes per hour. Google’s scoop about ad-dressable TV is about ad inventory now accessible on DBM through partnerships with SSPs like WideOrbit, or using their own ecosystem, Google Fiber. Most of these concepts make TV inventory available in pro-prietary ecosystems, and only allows 1:1 real-time ad delivery on a limited scale, if at all. In some cases, addressable TV refers to delivering ads to TV content that isn’t broadcasted, but available through the op-erator or TV channel’s on-demand selections.
Addressable TV in EuropeIn Europe, addressable TV is defined as the merge of online ad technology and traditional TV broad-casting. Advertisers and broadcasters have already been delivering 1:1 real-time ads into the broadcast live stream since the end of 2015. Market-wide tech-nology standards in Europe have paved the way in allowing advertisers to provide real-time ad delivery into broadcast TV on a large scale. In Germany, more than 40% of all households are already receiving ad-dressable TV ads, delivered by ad serving technology, for more than 90% of all adfunded TV channels.Smartclip is one of the key players for standardizing addressable TV ad technology in Europe. By the end of this year, smartclip will serve more than 50 pre-mium TV channels throughout Europe using its ad-dressable TV solution.In 2015, the first live case of addressable TV in Europe
Addressable TV
is about to take off
in all major
European TV
markets like France,
Spain, the UK, Italy
and Sweden.

was set up via the smartclip addressable TV plat-form. This allowed advertisers and agencies to deliv-er their advertising into linear TV in adserver-based real-time. Based on the HbbTV model, which is in-tegrated in web-enabled TV sets, advertising can be served via the smartclip adserver structure into broadcast channels according to online criteria. With more than 16 million TV sets to control in Germany, which can be addressed when activated, the criti-cal reach for digitally-controlled advertising cam-paigns has long been achieved. This doesn’t make traditional ads any less valuable. On the contrary, it strengthens TV as an advertising medium overall. Smartclip makes this advanced technology available to broadcasters and is constantly enhancing it. The next step is the ATV programmatic platform “A-TVx” (SSP), which is especially catered to linear TV and al-lows broadcasting partners to take full advantage of data-driven, real-time advertising.
How can you explain the fast and successful development of addressable TV in Germany versus other countries?
Addressable TV is about to take off in all major Euro-pean TV markets like France, Spain, the UK and Swe-den. With an estimated budget volume of three digit million euros by 2020 in Germany alone, addressable TV is expected to be a very healthy expansion of the core business for broadcasters. So, it’s no surprise that European broadcasters strive for solutions that keep them in the driver’s seat and oversee the mone-tization and data points of their TV inventory. As of this year, all relevant commercial TV broadcast-ers are offering addressable TV ad formats in Ger-many to their customers, and they’ve been in high demand. The reason is simple – because it’s possible. The ATV platform lets broadcasters use an existing infrastructure for their marketing business, which makes for a fast, seamless integration. It also lets them zero in on their core business, programmer de-velopment and marketing. About two-thirds of all relevant broadcasters in Germany use the smartclip ATV platform for their marketing scheme. Now it’s
Addressable TV combines the best of both worlds: broadcast TV & online advertising. Thanks to this technology, broadcasters allow brands to deliver a more personal and relevant ad experience.
also possible for broadcasters at a European level to get on board.
What is the benefit of this technology for advertisers in terms of reach, repetition, and digital similarities?
A crucial asset is the intelligence, which allows the contact classes to be controlled precisely and with-out any scatter loss. This includes frequency capping, creative optimization and targeting, to mention just a few. Addressable TV can add value to the TV ad-vertising landscape in many ways. It’s particularly attractive because you can advertise regionally and reach specific target groups, then use the feedback to assess campaigns as well. Advertising messages can therefore be placed more efficiently and in a more logical order.Almost all the well-known free TV channels are hop-ing to use smartclip to tap into a new customer market – such as a regional furniture chain – as ad campaigns can be applied from as little as 50,000 euros. On the other hand, existing customers should be able to increase their TV campaigns’ effectiveness by targeting their traditional ads. >
TV K
EY F
ACTS
201
7
116 117

The next step is
sketched out:
the TV channels
will connect
their offer to the
automated
booking process
and will then be
able to deliver
TV ads in data-
based real-time
via adservers.

Smartclip technology is founded on three key el-ements: monetization, technology and servicer. Thanks to the new reverse channel capability, broad-casters can now use reach and awareness in real time and customized TV – from product storytelling to POS integration. Again, this doesn’t make tradi-tional ads superfluous, but actually strengthens TV as an advertising medium overall. Traditional linear TV can now match up with global, digital platforms. Data-based advertising is possible in TV, which is the leading medium for engaging an audience.The technology boosts TV channels’ access to new customers and extends the opportunities for their existing customers. This is real growth potential in an increasingly fragmented market. The number of networked smart TV devices in households is growing at a rapid pace, along with addressable advertising.
What are the results so far? In recent months, campaigns adding up to more than three figures have been carried out via our platform in Germany. As we’ve been teaming up with many well-known broadcasting partners, we’ve been able to achieve the necessary reach that ma-jor advertising clients in the FMCG, automotive and finance sectors need for their advertising strategies. Addressable TV can add value to the TV advertising landscape. It’s particularly attractive that the ad-vertising can be controlled for target groups or even regionally, and then data can also be obtained to assess the campaigns, too. Advertising messages can thus be placed more efficiently and in a more meaningful sequence. No other digital advertising format is on par with such a high reach, while still offering targeted delivery in a high-quality, brand-safe environment. The forecasts are correspondingly optimistic: ad-dressable TV is a significant key to branching out businesses and is leading the market’s evolution. This is confirmed in Germany by the surge in campaigns
and campaign volumes.
What does the HbbTV1 norm allow and what would be the benefit of an HbbTV2?
Further enhancement of HbbTV2 would make the in-terplay between TV and online video even more fluid. It would replace the ad break with digitally targeted spots. All the know-how that suppliers and advertis-ers have gained today through addressable TV ad formats (HbbTV 1) can be immediately put into ac-tion for the next development stage. As planning at a 1:1 level for devices is a completely new approach to TV, we have to learn the ins and outs to offer totally new opportunities for the creative process, and ways to address customers. All in all, timing and experience are the determining factors in the competitive world of advertisers.
What’s in the cards for the coming months and years?
With addressable TV, we’ve ushered in a new field of TV marketing that we’re continually developing. As of now, we’ve launched the first programmatic broad-caster platform, the A-TVx, that is especially devised for linear TV market. The next step is sketched out; the TV channels will connect their offer to the auto-mated booking process and will then be able to deliv-er TV ads in data-based real-time via adservers. The first live tests have been successfully carried out in Germany with IP Deutschland. It’s a unique market strength for broadcasters as they have access to TV usage data. They’re the only ones who can offer a necessary marketing push to the top advertisers, who invest the biggest part of their advertising budget in TV. We’re now conducting intensive test stages with large broadcasting groups throughout Europe to branch out their marketing offer. x1Video Advertising Bureau Addressability Report: www.thevab.com/wp-content/uploads/2016/11/VAB-Addressability-Report.pdf
TV K
EY F
ACTS
201
7
118 119


NCIS Enquêtes Spéciales
RTL TVI, Belgium
120 121
TV K
EY F
ACTS
201
7

In a more
distant future,
we’ll even
be able to
share smells
and thoughts
[...] even if
we’re actually
sitting alone
in our living
room.
The Future of Connected ExperiencesWhen we look at how Gen Z kids go about their daily routines, there is rarely a single situation in which they’re isolated.
Technology enables a constant connection with our peers; we let our friends have a peek at what music we are listening to, we tag each other in relatable memes, and have a constant stream of messages in our numerous WhatsApp groups. With continuously evolving technological devices, the question remains: what’s next for the future of connected experiences?What digitally empowered forms of apart-to-getherness will we witness in the upcoming years? Let’s see.Facebook recently announced plans to produce TV-like shows. In the future, social platforms will be our prime source for content. Not only for news content or personally shared content, but for all media and entertainment content as well. Twitch, the social gaming platform, is already paving the way in this direction. We might live in different cities but we can meet up on Facebook to watch a TV-like series. We’ll laugh and cry, and when we tell other people about it, it’ll sound as if it were a real date, because digitally connected experiences will be just as real as a get-together in person. Even though video live streaming has taken a bit of a hit after a big hype two years ago, the ball is still rolling towards real-time connection. Will it take off again? I say yes. Right now, we’re on the brink
Bianca Stockreiter Innovation Analyst

of moving from pre-recorded stories to live stories, like on Instagram or Snapchat for example. But there still are limitations, such as data bandwidth and de-vice maturity. Soon, the next wireless telco-standard 5G will roll out. What’s more, smartphones and oth-er wearable devices will have much better technical specs for cameras, microphones and sensors. Once these barriers are gone, there is – technically – nothing getting in the way of a live stream for everyone’s daily life.Let’s look even further down the line. Virtual reality will expand our understanding of what it can mean to be apart together. Social Hangouts in headsets like Oculus Rift and PlayStation VR will bring on a much deeper level of connection. Friendships and dating will have a second home. The next gen-erations of VR will charm us with the trans-mission of touch or temperature. In a more distant future, we’ll even be able to share smells and thoughts, and design virtual experiences exactly the way we want to. We’ll be able to really feel what’s hap-pening, even if we’re actually sitting alone in our living room.
Whatever the future holds – as long as the emotions we feel are real – the con-nected experience will be real for us. x
122 123
TV K
EY F
ACTS
201
7
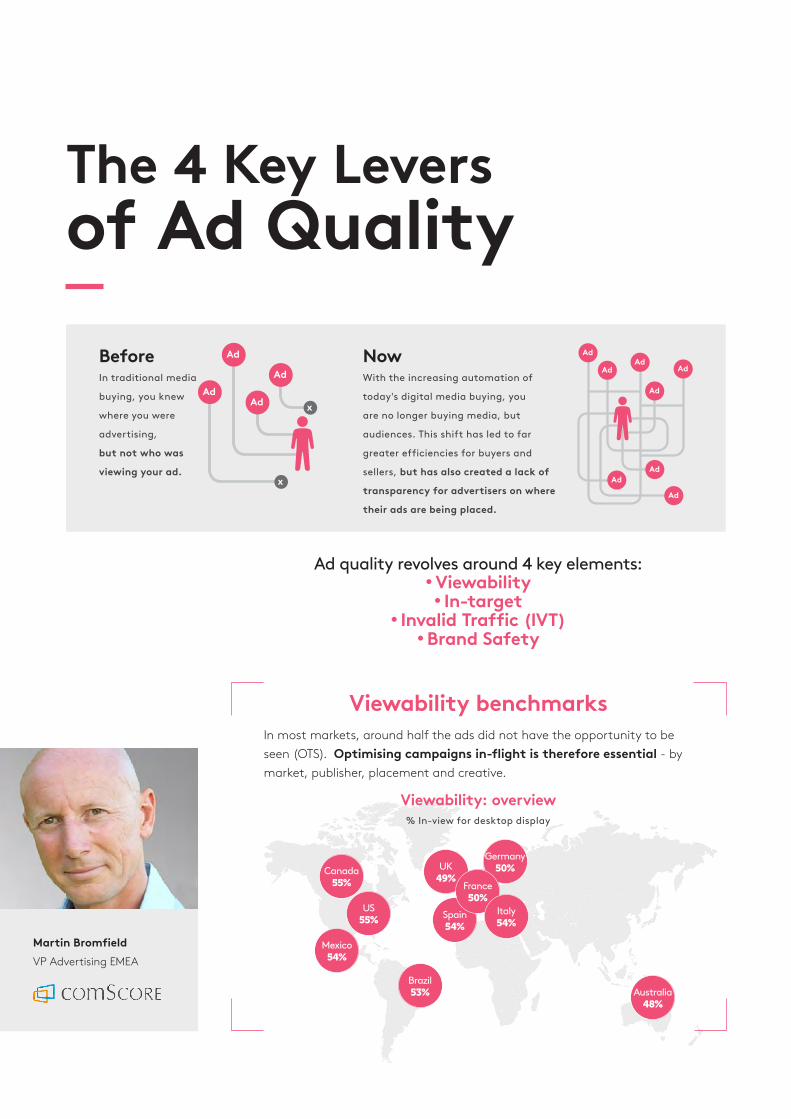
Martin BromfieldVP Advertising EMEA
The 4 Key Levers of Ad Quality
BeforeIn traditional media
buying, you knew
where you were
advertising,
but not who was
viewing your ad.
Ad quality revolves around 4 key elements:• Viewability
• In-target• Invalid Traffic (IVT)
• Brand Safety
NowWith the increasing automation of
today's digital media buying, you
are no longer buying media, but
audiences. This shift has led to far
greater efficiencies for buyers and
sellers, but has also created a lack of
transparency for advertisers on where
their ads are being placed.
Viewability benchmarks
Canada55%
US55%
Mexico54%
Brazil53% Australia
48%
Spain54%
UK49%
Germany50%
France50%
Italy54%
% In-view for desktop display
Viewability: overview
Ad
AdAd
x
x
Ad AdAd
Ad
Ad
Ad
Ad
Ad
Ad
In most markets, around half the ads did not have the opportunity to be seen (OTS). Optimising campaigns in-flight is therefore essential - by market, publisher, placement and creative.

Canada44%
US48%
Mexico40%
Brazil52%
India47% Taiwan
51%
Australia43%
Spain43%
UK44%
Germany44%
France39%
Italy47%
Programmatic buys are more susceptible to invalid traffic than are direct buys. IVT rates on programmatic video more than triple those seen through direct buys.
With the amount of negative publicity that brands have endured from advertising against inappropriate content, this is becoming an ever more vital part of the campaign validation process, not only to reduce wasted spend but, more importantly, to reduce reputational damage.
Across the globe, the majority of display ads delivered did not reach their primary target. In-target rates ranged from: 39% in France to 52% in Brazil.
In-target benchmarks In-target benchmarks
Invalid traffic Invalid traffic
Brand safetyBrand safety
In a nutshell
1. Filter-out unsafe impressions pre-bid
• Choose from a rich set of brand protection category filters to avoid bidding on unsafe inventory
• Customize and refine your brand safety criteria with your own keywords
• Create and maintain black – and/or white-lists based on page-level brand safety criteria
2. Protect your brand in-flight
• Set real-time alerting and blocking to identify and protect against unsafe content throughout the campaign lifecycle
3. Evaluate delivery post-campaign
• Understand where threats persist across all media partners through comprehensive post-campaign reporting
• Refine black- and whitelists to target
Overview% In-target for desktop display
Source: comScore Global Snapshots based on Q1 2017 comScore vCE Advertising Benchmarks
High-value ads attract the most IVTIVT rates
(desktop display)
Direct DirectProgrammatic
IVT rates (video)
3.6% 2.0%5.2% 7.6%
Source: comScore vCE Q1 2017 Advertising Benchmarks
ProgrammaticTV
KEY
FAC
TS 2
017
124 125


La France a un Incroyable Talent
M6, France
126 127
TV K
EY F
ACTS
201
7
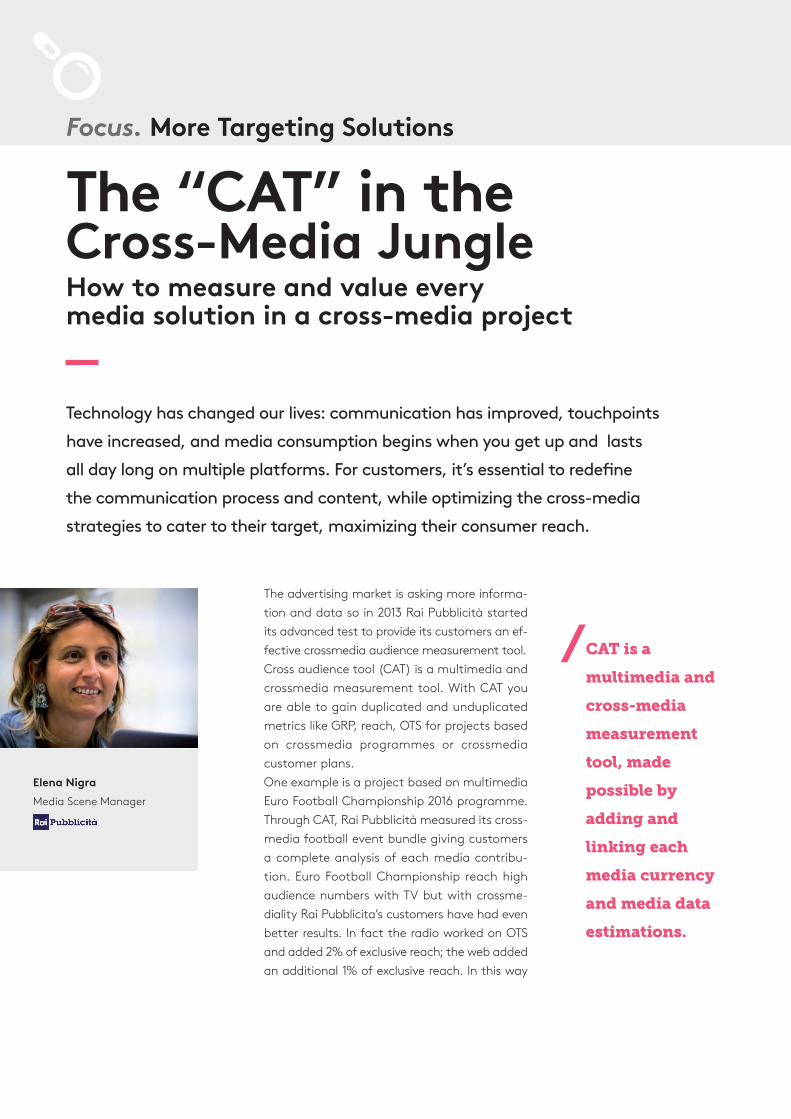
Technology has changed our lives: communication has improved, touchpoints have increased, and media consumption begins when you get up and lasts alldaylongonmultipleplatforms.Forcustomers,it’sessentialtoredefinethe communication process and content, while optimizing the cross-media strategies to cater to their target, maximizing their consumer reach.
The advertising market is asking more informa-tion and data so in 2013 Rai Pubblicità started its advanced test to provide its customers an ef-fective crossmedia audience measurement tool.Cross audience tool (CAT) is a multimedia and crossmedia measurement tool. With CAT you are able to gain duplicated and unduplicated metrics like GRP, reach, OTS for projects based on crossmedia programmes or crossmedia customer plans. One example is a project based on multimedia Euro Football Championship 2016 programme. Through CAT, Rai Pubblicità measured its cross-media football event bundle giving customers a complete analysis of each media contribu-tion. Euro Football Championship reach high audience numbers with TV but with crossme-diality Rai Pubblicita’s customers have had even better results. In fact the radio worked on OTS and added 2% of exclusive reach; the web added an additional 1% of exclusive reach. In this way
CAT is a
multimedia and
cross-media
measurement
tool, made
possible by
adding and
linking each
media currency
and media data
estimations.
Elena Nigra Media Scene Manager
Focus. More Targeting Solutions
The “CAT” in theCross-Media JungleHow to measure and value every media solution in a cross-media project

the plan reached a bigger total audience of 85.3%.An interesting CAT example is a crossmedia customer planning: brand x wanted to reach a socio demograph-ic target, the Rai plan had the following investment share: TV 69%, radio 14%, digital 10% and cinema 7%Also in this case the contribution of each media is fun-damental and for many reasons, complementary to the tv one, the total audience was almost 14 million. The TV reach was 41.8% and as usual the crossmedia planning gave back better KPI results than a mono-media planning. Thanks to crossmedia planning with radio the customer was able to reach 19% of its tar-get and 10.6% was exclusive; with digital it has had a reach of around 1,9% with an exclusive reach of 1.1%.Today with the increased touchpoints for customers it’s essential redefining the communication process, it’s fundamental taking the best of each media and using crossmedia project they can reach higher effi-ciency. Rai Pubblicita’s tools can also measure cross-media projects on many different targets like con-sumption or value targets.
In the age of multimedia and addressable media, companies have more and more interest in talking to specific consumers, minimizing the dispersion of contacts. With CAT they can plan on consumers, non-consumers of the brand or product catego-ry; consumers of competing products or they can choose heavy, medium and light users.The tool can also work on value target: engaging communication must be integrated and coherent and has to communicate the values of a brand to people that can understand them, because they are also their own. This means not only to get a mes-sage, but also to establish a relationship.Rai Pubblicità has reconstructed the 10 categories of values that are most frequent in communication strategies and those being used to understand the identity of the commercial brands. Finally CAT and others tools helps Rai Pubblicità to be more competitive on crossmedia measurable projects around quality content, using all the touchpoints in the best context to be engaging, integrated and coherent. x
C.A.T. Euro Football Championship 2016
TV Reach82.5%
Overlapping Radio
27.4%
Overlapping Web
4.2%
Exclusive Radio 1.8%
Exclusive Web
1.0%
85.3% Total Audience
44 618 000 Adults 14+
Total TV 82.5%Total Radio 29.2%Total Web 5.2%
Source: Rai Pubblicità on GfK-Mediasoft data
TV K
EY F
ACTS
201
7
128 129

Behavioural Targeting at M6Whilesocio-demographictargetingonTVhasprovedtobeanefficientwaytoselect the right audience, M6 Publicité has enriched the targeting approach byaddinganaffinityandbehaviouralbricktotheexistingcoretargetgroup:Adults 25-49.
Methodology: a merger between Kantar TGI and Mediametrie dataThe Kantar TGI panel is a media-market tool that links socio-demographic, media consumption, con-sumer behaviours and attitudes on an individual level. Based on Kantar TGI items reflecting behav-iour and attitudes, M6 has defined 6 key target groups as heavy consumers, digitally connected and receptive to innovation. Individuals in these target groups were linked to Mediametrie panel members to fuse data from both panels allowing to focus on their TV consumption.. This new way of
Focus. More Targeting Solutions
Thibault Ozil ---
Manual spot by spot optimization of planning
1st plan Optimized plan
7878
GRP Women 25-49
80
98
GRP Stylistas
102
125
Impact index

targeting consumers will generate common value between M6 thematic programmes and advertis-ing sectors.
Usage: implemented in agency planning tools to control and optimize TV plans Behavioural targeting will help advertisers and agen-cies select the ad-breaks in affinity with the new target groups and achieve better business results for an equal budget & cost per GRP. This targeting has delivered daily data on the 6 target groups since September 2016 and back data from September 2015 onwards in audience, planning, ad tracks and post-campaign analysis tools. These target groups cannot be bought, they only serve to optimize plans on existing target groups.An example of optimized plan : Manual spot by spot optimization of planning to select ad breaks with a higher impact index (+23 pts gain on Stylistas vs Women 25-49), while maintaining the same budget, CGRP, day parts & reach on the reference target group, Wom-en 25-49. x
The 6 Profiles
Stylistas/Women 25-49 (3.3M Individuals)
Foodistas/Women 25-49 (4.7M Individuals)
Home Movers/Adults 25-49 (3.7M Individuals)
Deco lovers/Women & Adults 25-49 (4M Women & 6.2M Adults)
Connected Shoppers/Adults 25-49 (8.6M Individuals)
TV K
EY F
ACTS
201
7
130 131

E-Shopping for products seen on screenSpott allows viewers to buy products seen on pro-grammes in one click. The app is active for numerous TV shows on RTL TVI, Club RTL & Plug RTL – 3 and a half hours of broadcast per day – addressing many different viewer profiles.
Interactive advertisingDuring ad breaks, TV Spott, marked with the Spott logo, allows viewers to interact immediately with the advertiser’s brand using the app, to activate a call-to-action promotion. Interactive spots will be placed in preferential position (last position).
Spott by Appiness & IP Belgium
IPBelgiumisofferingnewformsofinteractivitytoadvertisersthankstotheBelgianSpottapplication!Twofeaturesareoffered.
Ludovic de Barrau IP TV Director
Spott downloads in Belgium
70,400 57,600
Focus. More Targeting Solutions

The case: JBC & Spott interactive advertising campaign on IP Belgium channelsOnline fashion retailer JBC has added Spott’s inter-active feature provided to its TV Campaign from October 10th 2017 to 22nd of November 2017. The in-centive includes a 10% rebate for viewers who syn-chronize their Spott Apps with the spots!
The campaign resulted in 10,000 new JBC brand sub-scriptions on the Spott app, 106,000 page views for the brand via theapp, 9,400 products clicked and 310 products bought! Using Spott as an interactive ele-ment boosted viewer engagement for their TV cam-paign and made the JBC brand more likeable and innovative. x
TV K
EY F
ACTS
201
7
132 133


Scorpion
RTL TVI, Belgium
134 135
TV K
EY F
ACTS
201
7

Advertisers' insightsGlobal versus Local 10 years ago “Globalisation” was the buzz word in every country. Advertisers loved the idea of bun-dling together know how and centralised steering of budgets and negotiations. What many seem to have forgotten these days is the old but timeless phrase “All business is local”. As a service company with more than 350 branches throughout Germany localisation is extremely important for us. In case of any damage incurred, a customer needs help imme-diately; he wants somebody who understands his needs. Proximity not simply in terms of local availa-bility but also as an emotion is a very relevant need. This is something we can deliver locally, supported by the quality and safety guaranteed by a huge globally active company. Over the years we learned that in terms of glass damage all people throughout the world seem to have similar needs. This is why we share best practice with our colleagues across the world. However, when it comes to local needs and specifics we strongly believe in local strategies.
Strengths of video advertisingUntil 2009 Carglass® was famous for a com-pletely unusual com-munication strategy. The brand was built by a mono radio cam-paign. With 60 second spots and massive ad pressure we managed to build a remarkably high brand awareness. However, after increas-ing budgets and ad pressure year after year
Focus.
visibility turned out to be missing. As a service provid-er with branches all over Germany it is important to show the logo and the colours so that customers can find us. Additionally our offer needs to be explained. It is much easier to understand how windscreens can be repaired if you can see the technology.In a nutshell: With video we are able to explain our relatively complex product. What’s more, it enables us to bring emotionality to a technological topic and to educate people quickly and in an entertaining manner.
Challenges for data usageIn the early stages, our customers could reach us by telephone or drive directly to one of our service cen-tres. Today, increasing digitization has created fur-ther touchpoints for our customers and has made things like “opening hours” obsolete. Nowadays, our customers seek further information on the website by using different mobile devices (smartphones, tablets, etc.) or receive detailed information of their appointment via the Carglass® App. The challenge nowadays is to collect and merge all these data and make it attributable to each unique user from the very beginning and to create insights for a holistic statement to derive a strategic recommendation. Especially when advertising we need to understand the effects of this on our business. We can do so by identifying the isolated advertising impact of either mono campaigns or the synergy effect of media mix campaigns. x
Bianca Brueck-SartoriusSenior Media Manager

Global versus Local Media strategies need to remain fully attuned to the local media landscape specificities and capitalize on the local cultural events to best maximize our return on investments. In a world where the last decades of globalization are being challenged, the acceleration of automations are looming over the labour market and consumers' trust in all institutions is at the low-est, being closer to the people we seek to engage into our brand experiences is paramount. Having said that, we also have to adjust to strong and growing global trends: people around the world keep on migrating from local traditional media scenes to global digital platforms and we cannot ignore that, in this space, companies like ours need to equip themselves with new organizational set up, systems and talents to best deal with both the grow-ing complexity of the new media plan and the higher consumer and technological expectations. The role of the global teams are very rapidly evolving and we are gravitating towards a much more complementa-ry set up where all teams within the matrix deliver a unique contribution.
Strengths of video advertisingVideo advertising re-mains the most effective tactic into marketers' ar-senal to bring consum-ers down the purchase funnel. Video tells both consumer and product stories in a multisensory way at scale. The higher the attention the highest
its impact on both equity and sales. We know that vid-eo does not need to have our consumers full attention to work, frequency contributes to building the necessary familiarity which removes barriers to purchase and its strong weekly reach across standard and digital screens to driving our sales. Short unskippable format is our pre-ferred standard in this space.We have however realized that we now need to com-municate on topics we were not used to communicate (quality, sourcing) and that we need to increase the relevance of our products among our consumers life-style either by involving them in the construction of our brands, entertaining them, helping them or educating them. Video is obviously a fantastic tool to help us ful-filling those objectives but we then need to ensure that we deliver content on our audience terms and we will track our success in terms of first engagement (com-pletion / likes / comments) and then when the content is really strong shareability.We know that high quality placements and better tar-geting drive both higher returns and stronger engage-ment so we will favour and be ready to pay a premium for it, as long as it remains proportional to the return and brand equity uplift we notice in our effectiveness analysis. Obviously, this will be among human, visible and measured inventories.
Challenges for data usageI have a plethora: sourcing it, scrutinizing it, assess-ing it cost effectiveness once you have paid all the tech taxes, scaling it, exploiting it with marketers. just to name a few.And with the European laws drafted by people remotely interested and educated on the topic, a growing consumers' concern around data privacy. We are left with a lot of questions as to its true sus-tainability at least in Europe. x
Geraud BenoitGroup Media Director
TV K
EY F
ACTS
201
7
136 137

When Lastminute.com Meets Talent Shows
Case Studies. Online Campaign, Product Placement, TV Spots & Sponsorship
The Plan.UKA strong online campaign kicked off with pre-show warm-up Facebook lives and the broadcast of “Last-Minutes.com moments”, a short & entertain-ing video series hosted on Youtube, the X-Factor app & the website. On top of that, an in-show product placement was organized around travel thematic: the Girls & the Overs received a magenta envelope with a branded card announcing that they were go-ing to the dream judges’ house in Los Angeles & Mal-ibu with lastminute.com.
The Results.
The Objective.To make Lastminute.com increase its popularity and visibility in France and the UK, and attract new cus-tomers.
The Media Partners.The campaign was based in the UK on the famous X-Factor TV show broadcasted on ITV and the affiliat-ed Facebook page, as well as the French talent show, La France a un Incroyable Talent, broadcasted on M6.
The Brand Idea.Associate the brand with the most popular French & British talent shows and create an original operation focused on brand storytelling around travel, music and entertainment, to impress and galvanize the target audience.
UKFacebook Lives Results
126.3K total views
63.15K average views
67.67K views on most watched video
An exclusive package was set up, surprising a con-testant with a sightseeing tour across London and a museum visit. New York and Los Angeles holiday prizes were arranged for the home viewer competi-tion. Finally, a live final partnership was put in place with the Top Secret Hotel’s Package: purchase a ho-tel room in London and earn 2 live final tickets.FranceThe brand sets up a sponsorship deal for the program for 8 weeks, and a series of 20” licensed TV spots fea-turing Eric Antoine, a famous French magician & hu-morist, who invited the audience to play on Twitter using the hashtag #vacancesmagiques, to win a trip offered by Lastminute.com. In addition, a microsite was launched with contest explanations, added con-tent about the show, brand presence and promotions activation. This buzz was posted on Facebook as well.
“Lastminutes.com Moments” Results
338.39K total views
56.39K average views
89.49K views on most watched video
Live Final Partnership
Lastminute.com sold 65 hotel rooms in a week
FranceTV SPOTS
123.6 GRP 25-49 y.o.
23 090 952 contacts
SPONSORSHIP794.6 GRP 25-49 y.o.148 447 172 contacts

Paypal Attracts Attention of Consumers with Telepromotion!
Case Studies. Telepromocion & Licensed spot
The Plan.A telepromotion package has been set up during the show: a 45 seconds endorsement with Pablo Motos and Ana Morgade. During this special operation, the two hosts focus on PayPal services through a creative dramatization in which Ana explains how she bought her new glasses. She highlights the us-er-friendliness and the safety of the online payment, and finally convinces Pablo to use it. Plus, PayPal ran a series of licensed TV spots (25 x 30 seconds) with Ana Morgade, in which she gave a breakdown of PayPal’s services. The environment for this spot was El Hormiguero (Antena 3) and Zapean-do (La Sexta). Ana Morgrade sent out 3 tweets and 3 Instagram posts for a social media boost.
The Objective.PayPal was looking to attract the attention of Span-ish consumers, develop its brand visibility and moti-vate the target audience by linking up with a famous talk show.
The Media Partners.The first talk show in Spain, El Hormiguero, broad-casted on Antena 3 & hosted by Pablo Motos and Ana Morgade.
The Brand Idea.A creative idea for effective package based on tel-epromotion, and a special licensed spot to promote services and be in affinity with the core target – urban upper-class adults – while reaching a large audience.
The Results.
106.5 GRP on Adults 16+ (50,9% REACH)
84.8 GRP on Adults 25-44 ABC 1 (44,5% REACH)
The plan was a success with a great volume of
reach generated in a minimum of time:
El Hormiguero
Antena 3, Spain
Zapeando
La Sexta, Spain
TV K
EY F
ACTS
201
7
138 139

Exclusive Concept to Boost Marc Cain Image
Case Studies. Special Ads
The Plan.Marc Cain becomes the official sponsor of the show, with a presence on 36 billboards and 9 exclusive TV episodes. Midrolls have also been set up for a strong-er online presence.Anna Nooshin is about to become the ambassador of the brand through several strategies. The TV host will wear Marc Cain outfits during 3 episodes and create additional on-air brand moments: shopping, backstage before show, after show, etc.To push the campaign further, an online integra-tion and a vlogger endorsement with Anna Nooshin will be launched to motivate the online community. There’ll be a raffle of one outfit, 3 vlogs on her You-Tube channel and 3 posts on her Instagram page.
The Results.
The Objective.Marc Cain, a premium women’s fashion brand, wants to increase client loyalty with content devel-opment and create a closer connection and identifi-cation with the format.
The Media Partners.Holland’s Next Top Model, a popular fashion TV show broadcasted on RTL 5. This year, the programme is going through a few changes that are beneficial for the brand image: more up-market positioning, clos-er connection to YouTube & social media, and a new presenter called Anna Nooshin.
The Brand Idea.To develop the brand image using an original pack-age: a sponsorship with Holland’s Next Top Model and partnering up with a famous fashion expert who’ll become the spokesperson for Marc Cain.
A plan to create more buzz is in the works: media posts on Marc Cain website and setting up MCN pre-rolls on Anna’s YouTube channel.
200,000Ads Impression Mid-rolls
Holland’s Next Top Model
RTL 5, The Netherlands
Anna Nooshin

Haier & Das Perfekte Dinner: a Powerful Sponsorship
Case Studies. Sponsorship and 360°
The Objective.To help Haier, the world's top refrigerator producer, to promote its range of products in Germany and create a positive sales impact with an efficient op-eration.
The Media Partners.Vox, a strong channel in Germany, associated with the popular cooking TV show Das perfekte Dinner.
The Brand Idea.To gain viewers’ confidence in Haier’s products and help them identify with the participants of the culi-nary TV show thanks to a combined sponsorship with content affinity, as well as a licensing agreement for instore impact.
The Plan.A comprehensive double package: firstly, a sponsor-ship campaign from May to July 2017 that boosts the brand image and increases its reliability. Secondly, a one-year 360° licensing campaign to raise brand visibility. This licensing offer includes distribution dis-cussion & events, website homepage presence, social media activation, mailings, and a presence on sever-al point of sales.
TV K
EY F
ACTS
201
7
140 141

1Including guests; 2Data for 2013/2014; 3Data for 2014/2015; 4Data for 2015/2016; 6Weighted average without Malta; 7Kanto region.*RTL AdConnect's own calculations. Source: EURODATA TV, local institutes - reproduction forbidden, all rights reserved by MEDIAMETRIE
Country
Target Group
Individuals
2014
Mon–Sun
2015
Mon–Sun
2016
Mon–Sun
Maximum Peak
Mon–Fri
Viewers During Peak
Mon-Fri
Austria 3+ 162 161 +4.3% 168 20:45 2839080
Belarus 4+ 227 227 +2.6% 233 21:15 2584294
Belgium North 4+1 201 197 = 197 21:00-21:15 2619815
Belgium South 4+1 233 237 +3.0% 244 21:15 1822128
Bulgaria 4+ 223 231 +2.2% 236 21:15 2587440
Croatia 4+ 259 266 = 266 21:15 1750111
Cyprus 4+ 210 205 -0.5% 204 21:45 312245
Czech Republic 4+ 207 206 +1.5% 209 20:45 4107464
Denmark 3+ 173 172 -7.0% 160 20:45 2006819
Estonia 4+ 221 228 +2.6% 234 21:00 541632
Finland 4+ 176 171 +0.6% 172 20:45-21:00 1970202
France 4+ 221 224 -0.4% 223 21:15 25199776
Germany 3+ 221 223 = 223 21:00 31458101
Greece 4+ 257 269 -4.1% 258 22:30 4008207
Hungary 4+ 288 286 -1.4% 282 20:45 4285939
Ireland 4+ 184 185 -3.2% 179 21:15 1509293
Italy 4+1 262 254 -2.4% 248 21:30 26182430
Latvia 4+ 210 211 -7.6% 195 21:00 753876
Lithuania 4+ 204 214 +5.1% 225 21:15 1007188
Luxembourg 12+ 1412 1603 +0.7% 1614 21:00 223000
Macedonia 4+ 272 280 -1.8% 275 21:30 779554
Netherlands 6+ 200 190 -3.7% 183 21:00 6657200
Norway 2+ 163 161 -3.7% 155 21:45 1559066
Poland 4+ 260 264 -0.8% 262 20:45 15330105
Portugal 4+ 296 283 +1.4% 287 21:45 4832316
Romania 4+ 340 327 +0.6% 329 21:00 8203607
Russia 4+ 244 246 +0.8% 248 20:45 23887630
Serbia 4+ 304 315 +0.6% 317 21:15 3039350
Slovakia 4+ 228 228 +1.0% 235 21:00 2241635
Slovenia 4+ 199 206 +4.4% 215 n.a. n.a.
Spain 4+ 239 234 -1.7% 230 22:30 18033030
Sweden 3+ 153 154 -3.2% 149 21:00 3439000
Switzerland (G) 3+ 128 124 = 124 21:15 1573200
Switzerland (F) 3+ 143 144 = 144 21:15 600399
Switzerland (I) 3+ 177 172 -0.6% 171 21:30 135600
Turkey 5+ 247 244 = 244 21:45 22413727
Ukraine 4+ 262 249 -0.8% 247 21:15 14775894
United Kingdom 4+ 221 216 -1.9% 212 21:15 14775894
Total Europe 237 235 -0.4% 234*
EU6 234 232 -0.9% 230 China 4+ 157 155 -5.8% 146 n.a. n.a.
India 4+ n.a. 136 +4.4% 142 n.a. n.a.
Japan7 4+ 264 262 = 262 n.a. n.a.
United States 2+ 282 274 -1.5% 270 21:15-21:30 106234672
Viewing TimeKey Tables.
Viewing Time Per Individual in Minutes

Digital TV
CountryTV HH in 000
All Digital in % of TVHH
IPTVin % of TVHH
Digital Cable
in % of TVHH
Digital Satellite
in % of TVHH
Digital Terrestrial
in % of TVHH
Only Analogue
Terrestrial in % of TVHH
Austria 3693 90.3% 8.7% 22.5% 54.1% 5.0% 0.0%
Belarus 3797 65.0% 38.0% 7.7% 7.3% 12.1% 0.0%
Belgium 5264 91.8% 32.2% 51.9% 6.2% 1.5% 0.0%
Bulgaria 2926 96.6% 10.2% 18.9% 36.7% 30.8% 0.0%
Croatia 1507 99.2% 26.1% 9.7% 10.7% 52.7% 0.0%
Cyprus 302 94.8% 42.5% 11.6% 3.9% 36.8% 0.0%
Czech Republic 4312 95.7% 7.3% 11.7% 29.9% 46.8% 0.0%
Denmark 2384 100.0% 21.4% 53.9% 6.6% 18.1% 0.0%
Estonia 561 90.5% 32.7% 30.2% 6.6% 21.0% 0.0%
Finland 2495 100.0% 13.9% 60.9% 4.5% 20.7% 0.0%
France 28383 98.4% 41.4% 5.8% 28.2% 23.4% 0.0%
Germany 38320 75.8% 6.0% 19.4% 43.8% 6.6% 0.0%
Greece 4372 100.0% 3.0% 0.0% 26.6% 70.3% 0.0%
Hungary 3890 79.6% 15.4% 21.5% 23.1% 19.6% 0.0%
Ireland 1578 98.2% 5.0% 16.9% 55.5% 20.7% 0.0%
Italy 23412 100.0% 1.9% 0.0% 29.5% 68.5% 0.0%
Latvia 741 88.9% 21.1% 25.9% 13.9% 28.0% 0.0%
Lithuania 1209 82.5% 16.9% 14.4% 8.3% 42.8% 0.0%
Luxembourg 232 100.0% 23.2% 37.2% 19.9% 19.7% 0.0%
Macedonia 560 76.7% 18.0% 12.5% 4.0% 42.2% 0.0%
Netherlands 7451 90.8% 30.3% 47.8% 7.7% 4.9% 0.0%
Norway 2300 98.6% 20.2% 31.2% 29.8% 17.4% 0.0%
Poland 13008 87.8% 3.4% 21.7% 48.6% 14.0% 0.0%
Portugal 3869 100.0% 41.9% 32.9% 16.8% 8.3% 0.0%
Romania 6952 74.3% 1.1% 33.5% 36.2% 3.4% 0.0%
Russia 52707 73.9% 10.8% 7.7% 40.9% 14.5% 3.3%
Serbia 2430 78.9% 20.3% 18.7% 11.6% 28.3% 0.0%
Slovakia 1720 82.3% 15.7% 17.5% 33.6% 15.4% 0.0%
Slovenia 849 97.7% 37.1% 28.9% 6.3% 25.3% 0.0%
Spain 18162 100.0% 20.3% 8.0% 6.6% 65.1% 0.0%
Sweden 4450 74.8% 17.4% 16.5% 15.7% 25.2% 0.0%
Switzerland 3321 97.8% 41.3% 51.1% 3.5% 1.9% 0.0%
Turkey 21148 86.7% 3.6% 4.6% 78.6% 0.0% 12.1%
Ukraine 15011 87.7% 0.9% 5.8% 24.9% 56.1% 0.0%
United Kingdom 26460 100.0% 9.1% 13.7% 47.6% 29.6% 0.0%
Total Europe 307 684 87.7% 13.5% 14.2% 35.1% 24.9% 1.4%
EU1 206 494 91.5% 15.0% 16.8% 31.3% 28.5% 0.0%
China 412981 92.1% 21.0% 45.7% 22.7% 2.7% 1.3%
India 174485 84.0% 0.1% 42.3% 41.7% 0.0% 0.5%
Japan 51291 100.0% 7.8% 56.2% 30.7% 5.3% 0.0%
United States 119864 98.9% 9.3% 42.0% 28.2% 18.3% 0.0%
1Without Malta.Source: IHS Markit, EURODATA TV, local institutes – reproduction forbidden, all rights reserved by MEDIAMETRIE.
Key Tables.
TV K
EY F
ACTS
201
7
142 143

Best Single Programme 2016
Country Name Channel GenreRating
in %Share
in %
all individuals
Austria ZEITIMBILD1 ORF2 News 20.6% 53.8%
Belarus NOVOGODNIYGOLUBOYOGONEK(NEWYEAR'SPROGRAMME) ROSSIA-Belarus Variety Show 14.3% 34.2%
Belgium North DE SLIMSTE MENS TER WERELD (THE SMARTEST PERSON IN THE WORLD) Vier Game Show 26.9% 52.9%
Belgium South L'AMOURESTDANSLEPRÉ(FARMERWANTSAWIFE) RTL TVI Reality Show 19.5% 42.8%
Bulgaria KONCERT NA SLAVI TRIFONOV I KU-KU BEND (SLAVI TRIFONOV AND KU-KU BAND CONCERT) BTV Variety Show 20.2% 51.5%
Croatia SUPER TALENT Nova TV Talent Show 21.3% 43.3%
Cyprus EUROVISIONSONGCONTEST2016FINAL(EUROSONG/FINAL) RIK1 Variety Show 18.9% 67.1%
Czech Republic PRAVÝ RYTÍR (THE TRUE KNIGHT) ČT1 TV Movie 31.2% 65.0%
Denmark X FACTOR AFGØRELSEN (X FACTOR/RESULTS) DR1 Reality Show 30.1% 72.4%
Estonia SU NÄGU KÕLAB TUTTAVALT-FINAAL (YOUR FACE SOUNDS FAMILIAR) TV 3 Variety Show 29.8% 55.0%
Finland ITSENÄISYYSPÄIVÄ: LINNAN JUHLAT (INDEPENDENCE DAY CELEBRATION) YLETV1 Variety Show 50.3% 88.0%
France AURENDEZ-VOUSDESENFOIRÉS TF1 Variety Show 19.9% 49.9%
Germany FACK JU GÖHTE Pro 7 Movie 11.8% 27.0%
Greece AL TSANTIRI NEWS Alpha News 18.4% 40.2%
Hungary A NAGY DUETT (CELEBRITY DUETS) TV2 Game Show 17.6% 35.9%
Ireland THE LATE LATE TOY SHOW RTÉONE Talk Show 38.4% 76.2%
Italy 66FESTIVALDISANREMO(66TH SANREMO MUSIC FESTIVAL) Rai1 Variety Show 21.7% 48.7%
Latvia ES MILU TEVI, LATVIJA! TV3 Variety Show 13.8% 31.1%
Lithuania EUROVIZIJOSDAINŲKONKURSAS2016.FINALAS(EUROSONG/FINAL) LRT Variety Show 20.2% 61.5%
Macedonia SE ILI NESHTO (DEAL OR NO DEAL) Sitel Game Show 18.9% 42.9%
Netherlands EUROVISIE SONGFESTIVAL/FINALE (EUROSONG/FINAL) NPO1 Variety Show 27.5% 64.5%
Norway MESTERNES MESTER (ETERNAL GLORY) NRK1 Reality Show 33.0% 69.1%
Poland ROLNIK SZUKA ZONY (FARMER WANTS A WIFE) TVP1 Reality Show 14.4% 31.7%
Portugal A UNICA MULHER II TVI Telenovela 18.7% 35.1%
Romania ROMANII AU TALENT (GOT TALENT) Pro TV Reality Show 20.1% 37.1%
Russia NEW YEARS ADDRESS OF RUSSIAN PRESIDENT PUTIN Perviy Special Event 13.2% 29.8%
Serbia DNEVNIK2RTS(NEWS19:30) RTS1 News 23.4% 44.2%
Slovakia TŘIOŘÍŠKYPROPOPELKU(THREEWISHESFORCINDERELLA) Markíza Movie 18.7% 35.6%
Slovenia NAŽARUODDAJA Pop TV Comedy Show 35.5% 66.4%
Spain Y AHORA,TODOS CON LA EUROCOPA Tele5 Magazine-Sports 15.5% 44.0%
Sweden KALLE ANKA OCH HANS VÄNNE (A DISNEY CHRISTMAS GIFT) SVT1 TV Movie 39.3% 95.9%
Switzerland (G) GOTTHARD SRF 1 TV Movie 21.5% 47.1%
Switzerland (F) 19H30 RTS Un News 21.2% 61.5%
Switzerland (I) VIA COL VENTI (GONE WITH THE WIND) TSI1 Game Show 24.9% 52.8%
Turkey SURVIVOR (EXPEDITION ROBINSON) TV8 Reality Show 12.1% 27.2%
Ukraine NOVOGODNEEPOZDRAVLENIEPREZIDENTAUKRAINY(PRESIDENTIALNEWYEAR'SADDRESS) 1+1 Special Event 15.2% 32.8%
United Kingdom THE GREAT BRITISH BAKE OFF BBC1 Reality Show 26.9% 52.7%
China 2016CCTVSPRINGFESTIVALEVENING CCTV1 Special Event 7.0% 16.7%
India PREM RATAN DHAN PAYO STAR GOLD Movie 27.0% 25.2%
Japan THE67TH NHK KOHUTA UTA GASSEN NHK G Music Show 27.5% 52.9%
United States 88TH ACADEMY AWARDS ABC Variety Show 12.0% 31.5%
1No single programme was featured in the top programmes listNote: In this table sports events are excluded.Source: EURODATA TV, local institutes - reproduction forbidden, all rights reserved by MEDIAMETRIE
Key Tables.

Best Recurrent Series 2016
Country Name Channel Genre Runs Rating in %
Share in %
all individuals
Austria DIE ROSENHEIM COPS ORF2 Crime 41 10.1% 29.9%
Belarus PAUTINA-9 NTV Belarus Crime 1 12.8% 29.8%
Belgium North EIGEN KWEEK ÉEN Drama 7 32.2% 61.0%
Belgium South NCIS,ENQUETESSPECIALES(NAVYNCIS) RTL TVI Crime 15 11.9% 29.9%
Bulgaria TVOIAT MOI JIVOT (PARAMPARÇA) BTV Drama 1 20.8% 49.1%
Croatia TUDI ZIVOT (PARAMPARÇA) Nova TV Drama 83 16.5% 38.1%
Cyprus DIDYMA FEGGARIA ANT1 Drama 1 15.4% 34.5%
Czech Republic ORDINACEVRUŽOVÉZAHRADE Nova Drama 1 16.2% 37.7%
Denmark BADEHOTELLET (THE BEACH HOTEL) TV2 Drama 6 29.8% 64.7%
Estonia n.a.2 n.a.2 n.a.2 n.a.2 n.a.2 n.a.2
Finland KORPELAN KUJANJUOKSU YLETV1 Comedy 1 20.3% 53.2%
France SAM TF1 Comedy 6 12.4% 29.2%
Germany TATORT ARD Crime 46 11.1% 23.5%
Greece MPRISKO Antenna Daily Soap 185 11.7% 28.4%
Hungary BARÁTOK KÖZT (AMONG FRIENDS) RTL Klub Daily Soap 249 10.4% 22.4%
Ireland REBELLION RTÉOne Drama 5 15.3% 38.3%
Italy IL COMMISSARIO MONTALBANO Rai1 Crime 8 14.7% 33.2%
Latvia UGUNSGRĒKS TV3 Daily Soap 1 10.5% 24.8%
Lithuania n.a.2 n.a.2 n.a.2 n.a.2 n.a.2 n.a.2
Macedonia CRNATA ROZA (KARAGÜL) Sitel Drama 1 26.4% 48.1%
Netherlands DIVORCE RTL4 Drama 12 14.4% 28.1%
Norway NOBEL - FRED FOR ENHVER PRIS NRK1 Drama 7 16.5% 39.1%
Poland MJAKMILOŚĆ(LFORLOVE) TVP2 Daily Soap 78 17.5% 38.6%
Portugal A UNICA MÚLHER TVI Telenovela 248 14.7% 30.2%
Romania LAS FIERBINTI Pro TV Sitcom 1 15.3% 30.3%
Russia MAZHOR II (SILVER SPOON II) Perviy Drama 6 8.1% 25.4%
Serbia SELO GORI, A BABA SE CESLJA RTS1 Comedy 1 24.8% 55.2%
Slovakia HORNÁ DOLNÁ Markíza Sitcom 1 17.0% 37.5%
Slovenia GORSKI ZDRAVNIK (DER BERGDOKTOR) Pop TV Drama 1 18.6% 43.6%
Spain EL PRÍNCIPE Tele5 Drama 8 9.8% 24.4%
Sweden MORDEN I MIDSOMER (MIDSOMER MURDERS) SVT1 Crime 6 17.4% 54.0%
Switzerland (G) DER BESTATTER SRF1 Crime 6 13.4% 37.5%
Switzerland (F) CLEM RTS Un Comedy 8 9.2% 25.6%
Switzerland (I) CASTLE TSI1 Crime 27 13.0% 29.8%
Turkey DIRILIS: ERTUGRUL TRT1 Drama 31 9.2% 21.7%
Ukraine LESTNITSA V NEBESA Channel Ukraine Drama 1 11.8% 31.8%
United Kingdom CALL THE MIDWIFE BBC1 Drama 61 16.6% 34.2%
China HERO DOG III HUNAN TV SAT Comedy 1 4.2% 12.7%
India NAAGIN Colors Drama 1 3.4% 12.0%
Japan ASA GA KITA NHK G Drama 78 12.7% 43.0%
United States THE BIG BANG THEORY Sitcom CBS 31 6.7% 19.2%
1Only the best episode is taken into account; 2No recurrent series was featured in the top programmes listSource: EURODATA TV, local institutes - reproduction forbidden, all rights reserved by MEDIAMETRIE
Key Tables.
TV K
EY F
ACTS
201
7
144 145
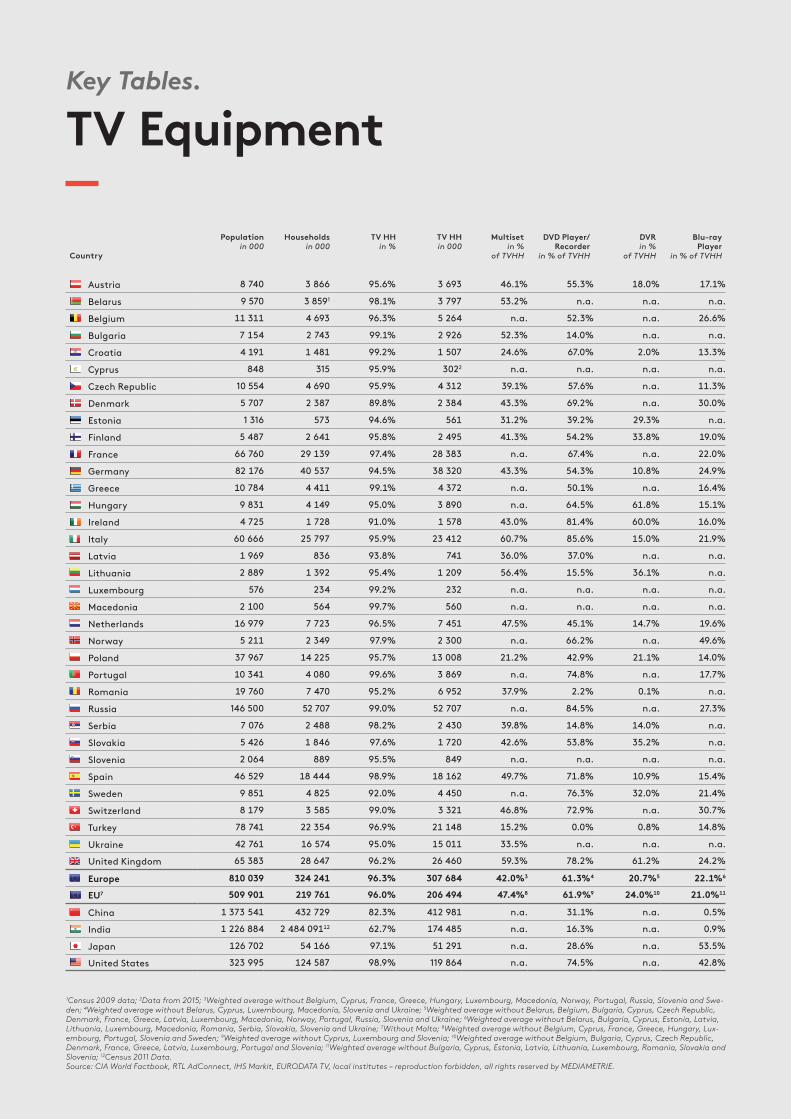
TV Equipment
Country
Population in 000
Householdsin 000
TV HH in %
TV HH in 000
Multisetin %
of TVHH
DVD Player/Recorder
in % of TVHH
DVRin %
of TVHH
Blu-ray Player
in % of TVHH
Austria 8740 3866 95.6% 3693 46.1% 55.3% 18.0% 17.1%
Belarus 9 570 3 8591 98.1% 3797 53.2% n.a. n.a. n.a.
Belgium 11311 4693 96.3% 5264 n.a. 52.3% n.a. 26.6%
Bulgaria 7154 2743 99.1% 2926 52.3% 14.0% n.a. n.a.
Croatia 4191 1481 99.2% 1507 24.6% 67.0% 2.0% 13.3%
Cyprus 848 315 95.9% 3022 n.a. n.a. n.a. n.a.
Czech Republic 10 554 4 690 95.9% 4312 39.1% 57.6% n.a. 11.3%
Denmark 5707 2387 89.8% 2384 43.3% 69.2% n.a. 30.0%
Estonia 1 316 573 94.6% 561 31.2% 39.2% 29.3% n.a.
Finland 5487 2641 95.8% 2495 41.3% 54.2% 33.8% 19.0%
France 66760 29139 97.4% 28383 n.a. 67.4% n.a. 22.0%
Germany 82176 40537 94.5% 38320 43.3% 54.3% 10.8% 24.9%
Greece 10784 4411 99.1% 4372 n.a. 50.1% n.a. 16.4%
Hungary 9831 4149 95.0% 3890 n.a. 64.5% 61.8% 15.1%
Ireland 4725 1728 91.0% 1578 43.0% 81.4% 60.0% 16.0%
Italy 60666 25797 95.9% 23412 60.7% 85.6% 15.0% 21.9%
Latvia 1969 836 93.8% 741 36.0% 37.0% n.a. n.a.
Lithuania 2889 1392 95.4% 1209 56.4% 15.5% 36.1% n.a.
Luxembourg 576 234 99.2% 232 n.a. n.a. n.a. n.a.
Macedonia 2100 564 99.7% 560 n.a. n.a. n.a. n.a.
Netherlands 16979 7723 96.5% 7451 47.5% 45.1% 14.7% 19.6%
Norway 5211 2349 97.9% 2300 n.a. 66.2% n.a. 49.6%
Poland 37967 14225 95.7% 13008 21.2% 42.9% 21.1% 14.0%
Portugal 10341 4080 99.6% 3869 n.a. 74.8% n.a. 17.7%
Romania 19760 7470 95.2% 6952 37.9% 2.2% 0.1% n.a.
Russia 146 500 52 707 99.0% 52707 n.a. 84.5% n.a. 27.3%
Serbia 7076 2488 98.2% 2430 39.8% 14.8% 14.0% n.a.
Slovakia 5426 1846 97.6% 1720 42.6% 53.8% 35.2% n.a.
Slovenia 2 064 889 95.5% 849 n.a. n.a. n.a. n.a.
Spain 46529 18444 98.9% 18162 49.7% 71.8% 10.9% 15.4%
Sweden 9851 4825 92.0% 4450 n.a. 76.3% 32.0% 21.4%
Switzerland 8179 3585 99.0% 3321 46.8% 72.9% n.a. 30.7%
Turkey 78741 22354 96.9% 21148 15.2% 0.0% 0.8% 14.8%
Ukraine 42761 16574 95.0% 15011 33.5% n.a. n.a. n.a.
United Kingdom 65383 28647 96.2% 26460 59.3% 78.2% 61.2% 24.2%
Europe 810 039 324 241 96.3% 307 684 42.0%3 61.3%4 20.7%5 22.1%6
EU7 509 901 219 761 96.0% 206 494 47.4%8 61.9%9 24.0%10 21.0%11
China 1373541 432729 82.3% 412981 n.a. 31.1% n.a. 0.5%
India 1226884 248409112 62.7% 174485 n.a. 16.3% n.a. 0.9%
Japan 126702 54166 97.1% 51291 n.a. 28.6% n.a. 53.5%
United States 323995 124587 98.9% 119 864 n.a. 74.5% n.a. 42.8%
1Census 2009 data; 2Data from 2015; 3Weighted average without Belgium, Cyprus, France, Greece, Hungary, Luxembourg, Macedonia, Norway, Portugal, Russia, Slovenia and Swe-den; 4Weighted average without Belarus, Cyprus, Luxembourg, Macedonia, Slovenia and Ukraine; 5Weighted average without Belarus, Belgium, Bulgaria, Cyprus, Czech Republic, Denmark, France, Greece, Latvia, Luxembourg, Macedonia, Norway, Portugal, Russia, Slovenia and Ukraine; 6Weighted average without Belarus, Bulgaria, Cyprus, Estonia, Latvia, Lithuania, Luxembourg, Macedonia, Romania, Serbia, Slovakia, Slovenia and Ukraine; 7Without Malta; 8Weighted average without Belgium, Cyprus, France, Greece, Hungary, Lux-embourg, Portugal, Slovenia and Sweden; 9Weighted average without Cyprus, Luxembourg and Slovenia; 10Weighted average without Belgium, Bulgaria, Cyprus, Czech Republic, Denmark, France, Greece, Latvia, Luxembourg, Portugal and Slovenia; 11Weighted average without Bulgaria, Cyprus, Estonia, Latvia, Lithuania, Luxembourg, Romania, Slovakia and Slovenia; 12Census 2011 Data.Source: CIA World Factbook, RTL AdConnect, IHS Markit, EURODATA TV, local institutes – reproduction forbidden, all rights reserved by MEDIAMETRIE.
Key Tables.

Multi-Screen Technology
Country
TV Flat Screen
in % of TVHH
TV High Definition
in % of TVHH
Connected TV
in % of TVHH
PCin % of HH
Tablet PCin % of Pop.
Mobilein % of Pop.1
Smartphonesin % of Pop.
Broadband in % of HH
Austria 91.5% 87.5% 33.7% 78.4% 43.9% 157.6% 58.2% 63.3%
Belarus 57.2% 55.4% 14.7% n.a. n.a. 124.9% n.a. n.a.
Belgium 90.5% 87.2% 30.5% 77.2% 44.9% 127.5% 55.9% 77.9%
Bulgaria 61.9% 60.0% 17.6% 58.4% 17.0% 153.3% 53.8% 44.6%
Croatia 59.3% 56.8% 16.3% 80.3% 7.8% 112.5% 64.0% 35.9%
Cyprus 91.3% 87.5% 27.8% 60.3% n.a. n.a. n.a. 86.4%
Czech Republic 81.1% 79.1% 30.5% 80.4% 35.4% 137.8% 56.8% 54.5%
Denmark 90.9% 87.1% 41.1% 85.5% 56.4% 165.4% 80.1% 92.8%
Estonia 82.0% 80.5% 33.1% 73.8% 29.7% 155.6% 59.8% 67.1%
Finland 89.0% 84.8% 33.7% 77.4% 55.2% 182.1% 41.5% 71.9%
France 94.4% 91.4% 36.2% 73.3% 50.4% 110.4% 65.6% 71.1%
Germany 94.1% 92.7% 46.7% 83.1% 43.6% 141.2% 62.6% 72.7%
Greece 88.4% 83.7% 22.6% 77.1% 17.6% 151.2% 57.5% 66.5%
Hungary 76.8% 74.8% 27.2% 77.6% 6.9% 115.6% 60.4% 63.6%
Ireland 89.4% 83.0% 30.7% 79.0% 46.1% 108.9% 72.9% 69.0%
Italy 92.9% 90.3% 33.7% 78.9% 28.1% 136.1% 67.5% 50.5%
Latvia 72.1% 70.2% 26.1% n.a. 22.3% 138.8% 56.2% 61.1%
Lithuania 67.9% 66.8% 13.6% 66.6% 26.1% 145.5% 53.8% 48.9%
Luxembourg 93.0% 89.6% 47.4% n.a. n.a. 132.6% n.a. 90.4%
Macedonia 66.5% 65.0% 16.8% 71.2% n.a. 113.5% n.a. n.a.
Netherlands 92.6% 89.9% 36.8% 81.3% 48.3% 107.1% 72.4% 84.1%
Norway 95.2% 92.5% 42.9% 85.2% 40.9% 100.1% 81.9% 85.3%
Poland 76.9% 75.3% 29.4% 72.7% 45.6% 138.1% 62.6% 48.5%
Portugal 89.1% 84.7% 24.2% 78.0% 27.2% 163.4% 54.2% 74.6%
Romania 74.7% 73.1% 25.2% 53.5% n.a. 143.3% 47.2% 58.5%
Russia 77.2% 75.3% 26.7% 71.5% 26.2% 175.0% 52.3% 40.0%
Serbia 75.4% 74.0% 22.0% 61.6% n.a. 139.5% n.a. n.a.
Slovakia 81.6% 79.9% 35.2% 79.6% 39.7% 128.9% 60.0% 65.4%
Slovenia 78.9% 76.7% 28.0% 81.3% 34.4% 107.5% 62.8% 60.8%
Spain 92.6% 89.1% 30.7% 75.5% 34.0% 110.6% 82.7% 64.2%
Sweden 88.4% 85.5% 38.1% 80.2% 45.4% 148.4% 75.4% 76.1%
Switzerland 94.0% 92.0% 38.5% 85.1% 37.0% 129.8% 72.9% 93.4%
Turkey 73.5% 71.7% 23.6% 68.4% 39.2% 96.1% 71.6% 38.0%
Ukraine 44.3% 43.2% 6.3% 52.6% n.a. 136.3% 36.5% n.a.
United Kingdom 94.1% 90.2% 35.7% 83.6% 62.5% 128.1% 73.5% 85.4%
Europe 83.8% 81.4% 31.1% 74.7%2 38.5%3 135.7%4 62.6%5 61.2%6
EU7 89.7% 87.0% 35.0% 77.7%8 42.1%9 131.1%4 66.0%10 67.8%
China 64.7% 64.7% 30.8% 59.6% 28.3% 96.1% 81.5% 48.2%
India 28.2% 31.0% 1.7% 23.2% 11.7% 85.0% 28.4% 6.5%
Japan 95.5% 92.6% 55.3% 79.8% 44.8% 130.0% 53.6% 62.3%
United States 91.5% 92.2% 39.2% 81.8% 66.8% 124.9% 76.7% 81.7%
1Figure is calculated on the number of private mobile phone contracts, in reference to the total population. One person can have more than one contract; 2Weighted average without Belarus, Latvia and Luxembourg; 3Weighted average without Belarus, Cyprus, Luxembourg, Macedonia, Romania, Serbia and Ukraine; 4Weighted average without Cyprus; 5Weighted average without Belarus, Cyprus, Luxembourg, Macedonia and Serbia; 6Weighted average without Belarus, Macedonia, Serbia and Ukraine; 7Without Malta; 8Weighted average without Latvia and Luxembourg; 9Weighted average without Cyprus, Luxembourg and Romania; 10Weighted average without Cyprus and Luxembourg.Source: IHS Markit, local institutes.
Key Tables.
TV K
EY F
ACTS
201
7
146 147

Electronic Audience Measurement
Country Population in 000
TV HH in 000
Service Population Represented by the Panel
in %
Launch of People-
meter System
Panel SizeHH
Interval of Measu-
rement
Austria 8740 3693 GfK Austria, since 1968 100% 1991 1628 1sec
Belarus 9570 3797 Real'noe Izmerenie1, since 2008 73.3%2 2010 500 1min3
Belgium North 5995 2589 Audimétrie S.A., since 1996 100% 1989 750 1sec
Belgium South 4466 2000 Audimétrie S.A., since 1996 100% 1985 750 1sec
Bulgaria 7154 2926 GARB Audience Measurement Bulgaria, since 2006 100% 2001 1045 30sec
Croatia 4191 1507 Nielsen Audience Measurement, since 2002 100% 2002 810 1min
Cyprus 848 302 Nielsen Audience Measurement, since 1998 100% 1998 425 1min
Czech Republic 10554 4312 Nielsen Admosphere, since 2002 100% 1997 1833 1sec
Denmark 5707 2384 Kantar Gallup, since 1992 100% 1992 1200 1min
Estonia 1316 561 Kantar Emor, since 1990 100% 2003 383 1min
Finland 5487 2495 Finnpanel Oy, since 1975 100% 1987 1100 1min3
France 66760 28383 Médiamétrie, since 1985 100% 1989 5006 1sec
Germany 82176 38320 GfK Fernsehforschung, since 1985 100% 1985 5000 1sec
Greece 10784 4372 Nielsen Television Audience Measurement, since 1988 100% 1988 1406 1min
Hungary 9831 3890 Nielsen Audience Measurement, since 1992 100% 1994 1120 1min
Ireland 4725 1578 Nielsen TAM, since 1996 100% 1996 1050 1min
Italy 60666 23412 Auditel/Nielsen TV Audience Measurement, since 1986 100% 1986 5666 1min
Latvia 1969 741 Kantar TNS, since 1993 100% 1999 3904 1min
Lithuania 2889 1209 Kantar TNS, since 1995 100% 2000 460 1min
Macedonia 2100 560 Nielsen Audience Measurement, since 2007 100% 2008 400 1min
Netherlands 16979 7451 Intomart/GfK & Nielsen Media Research, since 2000 100% 1987 1220 1sec
Norway 5211 2300 Kantar TNS, since 2000 100% 1992 1000 1min
Poland 37967 13008 Nielsen Audience Measurement, since 1996 100% 1996 2002 1min
Portugal 10341 3869 CAEM/GfK, since 2012 100% 1993 1100 1min
Romania 19760 6952 Kantar Media, since 2012 100% 1998 1320 1min
Russia 146500 52707 Wciom, since 1994 46.6%5 1996 5000 1min
Serbia 7076 2430 Nielsen Audience Measurement, since 2002 100% 2002 880 1min
Slovakia 5426 1720 TNS Slovakia, since 2004 100% 2004 1200 1min3
Slovenia 2064 849 AGB Nielsen Media Research, since 1999 100% 1999 450 1min
Spain 46449 18162 Kantar Media, since 1988 100% 1988 4496 1min
Sweden 9851 4450 AGB Nielsen Media Research, since 1993 100% 1993 1350 1min
Switzerland (G) 5175 2367 Kantar Media, since 2013 100% 1985 1000 1sec7
Switzerland (F) 1803 796 Kantar Media, since 2013 100% 1985 600 1sec7
Switzerland (I) 339 158 Kantar Media, since 2013 100% 1985 270 1sec7
Turkey 78741 21148 TNS/Kantar Media, since 2012 73.0%6 1990 4000 1min
Ukraine 42761 15011 Nielsen Ukraine, since 2014 100% 1998 2840 1sec
United Kingdom 65383 26460 Kantar Media, since 2010 100% 1981 5100 1min
China 1373541 412981 CSM Media Research, since 1997 100% 1999 8000 1min
India 1266884 174485 Broadcast Audience Research Council India n.a. n.a. 22000 n.a.
Japan 126702 51291 iNEX2 Video Research, since 1962 76.0% 1997 900 1min
United States 323995 119864 The Nielsen Company, since 1950 100% 1987 42041 1min
1Former name: GEVS; 2Urban population 4+; 31 second is technically possible, but 1 minute data is being used; 4Only TV households covered; 4Annual average panel size; 5Urban population 4+ in cities with 100 000+ inhabitants; 6Individuals in TV households in cities with a population 5 000+; 7On the basis of 1 second but the system requires 15 seconds to allocate the signal to a channel Source: EURODATA TV, RTL AdConnect, local institutes - reproduction forbidden, all rights reserved by MEDIAMETRIE
Overview
Key Tables.
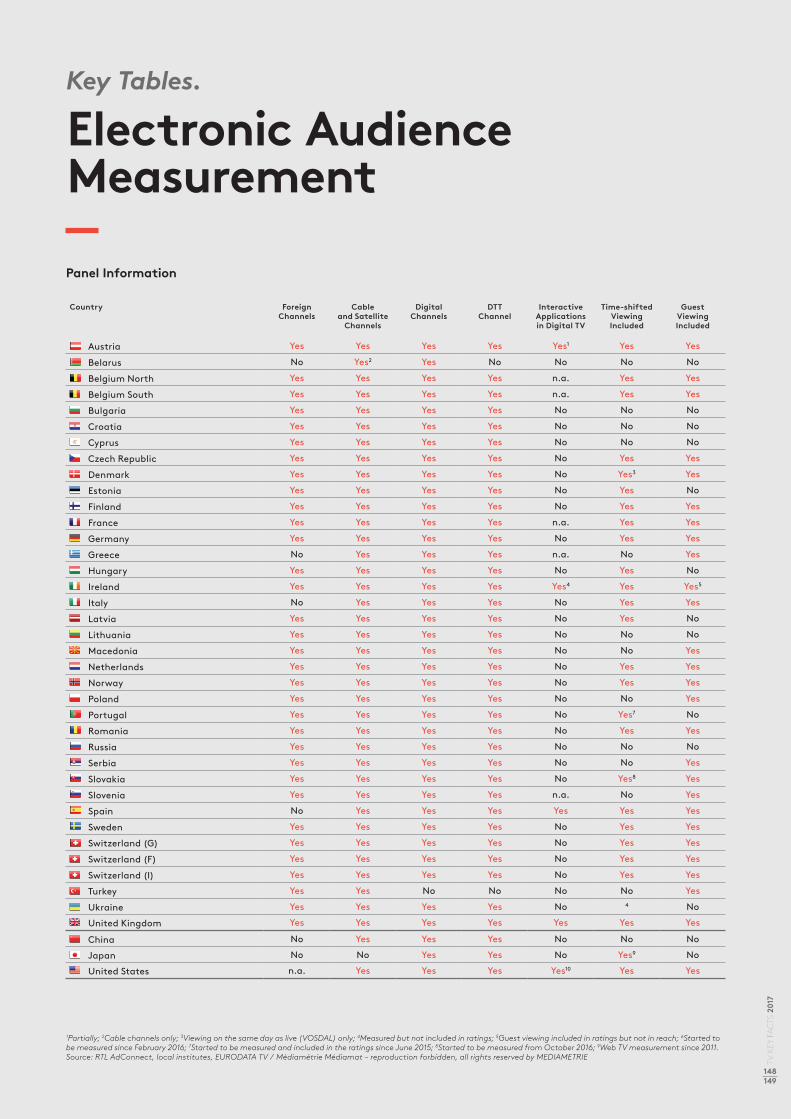
Electronic Audience Measurement
Country Foreign Channels
Cable and Satellite
Channels
Digital Channels
DTT Channel
Interactive Applications in Digital TV
Time-shifted Viewing Included
Guest Viewing Included
Austria Yes Yes Yes Yes Yes1 Yes Yes
Belarus No Yes2 Yes No No No No
Belgium North Yes Yes Yes Yes n.a. Yes Yes
Belgium South Yes Yes Yes Yes n.a. Yes Yes
Bulgaria Yes Yes Yes Yes No No No
Croatia Yes Yes Yes Yes No No No
Cyprus Yes Yes Yes Yes No No No
Czech Republic Yes Yes Yes Yes No Yes Yes
Denmark Yes Yes Yes Yes No Yes3 Yes
Estonia Yes Yes Yes Yes No Yes No
Finland Yes Yes Yes Yes No Yes Yes
France Yes Yes Yes Yes n.a. Yes Yes
Germany Yes Yes Yes Yes No Yes Yes
Greece No Yes Yes Yes n.a. No Yes
Hungary Yes Yes Yes Yes No Yes No
Ireland Yes Yes Yes Yes Yes4 Yes Yes5
Italy No Yes Yes Yes No Yes Yes
Latvia Yes Yes Yes Yes No Yes No
Lithuania Yes Yes Yes Yes No No No
Macedonia Yes Yes Yes Yes No No Yes
Netherlands Yes Yes Yes Yes No Yes Yes
Norway Yes Yes Yes Yes No Yes Yes
Poland Yes Yes Yes Yes No No Yes
Portugal Yes Yes Yes Yes No Yes7 No
Romania Yes Yes Yes Yes No Yes Yes
Russia Yes Yes Yes Yes No No No
Serbia Yes Yes Yes Yes No No Yes
Slovakia Yes Yes Yes Yes No Yes8 Yes
Slovenia Yes Yes Yes Yes n.a. No Yes
Spain No Yes Yes Yes Yes Yes Yes
Sweden Yes Yes Yes Yes No Yes Yes
Switzerland (G) Yes Yes Yes Yes No Yes Yes
Switzerland (F) Yes Yes Yes Yes No Yes Yes
Switzerland (I) Yes Yes Yes Yes No Yes Yes
Turkey Yes Yes No No No No Yes
Ukraine Yes Yes Yes Yes No 4 No
United Kingdom Yes Yes Yes Yes Yes Yes Yes
China No Yes Yes Yes No No No
Japan No No Yes Yes No Yes9 No
United States n.a. Yes Yes Yes Yes10 Yes Yes
1Partially; 2Cable channels only; 3Viewing on the same day as live (VOSDAL) only; 4Measured but not included in ratings; 5Guest viewing included in ratings but not in reach; 6Started to be measured since February 2016; 7Started to be measured and included in the ratings since June 2015; 8Started to be measured from October 2016; 9Web TV measurement since 2011.Source: RTL AdConnect, local institutes, EURODATA TV / Médiamétrie Médiamat – reproduction forbidden, all rights reserved by MEDIAMETRIE
Panel Information
Key Tables.
TV K
EY F
ACTS
201
7
148 149

Top Advertisers & Advertising Sectors
CountryTV Shareof Media
ExpenditureTrend
Austria 29.3% D
Belarus1 45.3% F
Belgium 43.0% D
Bulgaria 93.0% D
Croatia 82.5% D
Cyprus1 64.3% F
Czech Republic 52.8% D
Denmark 31.2% D
Estonia1 29.3% F
Finland1 21.7% F
France 39.0% D
Germany 48.2% D
Greece n.a. n.a.
Hungary 83.5% D
Ireland 33.3% F
Italy1 63.1% D
Latvia 45.5% F
Lithuania 79.2% D
Luxembourg 10.1% D
Macedonia 48.9% F
Netherlands 56.2% D
Poland 41.1% F
Romania1 65.5% D
Russia1 41.9% F
Serbia1 54.8% D
Slovakia 59.5% F
Spain1 40.5% D
Sweden 49.5% D
Switzerland 32.3% F
Turkey1 51.2% D
Ukraine1 48.8 D
United Kingdom 38.6% F
Japan n.a. n.a.
United States1 37.4% F
Europe
1 2 3
Ferrero Procter & Gamble XXXLutz
Nestlé TV Shop Orimi Trade
Procter & Gamble Reckitt & Benckiser Unilever
Procter & Gamble Nestlé Mobiltel
Agrokor T-Hrvatski Telekom VIP
Lidl Alphamega Carrefour S/M
Procter & Gamble Henkel Unilever
Danske Spil Bilka Peugeot
n.a. n.a. n.a.
Veikkaus Unilever Procter & Gamble
Procter & Gamble Unilever Ferrero
Procter & Gamble Ferrero L'Oréal
n.a. n.a. n.a.
Sanofi-Aventis Procter & Gamble Reckitt Benckiser
Procter & Gamble Sky Diageo
Procter & Gamble Ferrero Barilla
Rimi Reckitt Benckiser Procter & Gamble
Tele 2 Procter & Gamble Studio Moderna
Post Luxembourg Coca-Cola Kichechef
Procter & Gamble Coca-Cola Chipita
Unilever Procter & Gamble Jumbo
Aflofarm Lidl Unilever
Procter & Gamble Unilever Reckitt Benckiser
Nestlé Pepsi Co Procter & Gamble
Proton System Agrokor Procter & Gamble
Slovak Telekom Orange Lidl
Procter & Gamble Reckitt Benckiser L Oréal
Procter & Gamble Arla Foods Unilever
Procter & Gamble Ferrero Unilever
Unilever Reckitt Benckiser Turk Telekom
Nestlé Procter & Gamble Pharmak
Procter & Gamble Reckitt Benckiser Sky
n.a. n.a. n.a.
Procter & Gamble General Motors Geico
Procter & Gamble Unilever Reckitt Benckiser
TV Share of Media Expenditure Top 3 Advertisers
1Net figuresSource: Local institutes, gross figures
Key Tables.

Top Advertisers & Advertising Sectors
Country 1 2 3
Austria Food Cosmetics, Pharmaceuticals Home & Garden
Belarus Soft Drinks Cosmetics, Perfumery, Body & Hair Care TV, Communication, Mobile, Press
Belgium Culture, Tourisme, Loisirs Alimentation Beauty, Hygiene
Bulgaria Pharmaceuticals Food Cosmetics
Croatia Retailers Food Communications, Telecommunications
Cyprus Stores, Shops Services Financial Services
Czech Republic Other Processing Industry Foods, Drinks Cross-Section Categories
Denmark Cars Mobile Communications Fast Moving Consumer Goods
Estonia n.a. n.a. n.a.
Finland Retail Food Pharmaceutical Products & Medicines
France Food Beauty, Hygiene Automotive, Transports
Germany Retail & Mail-Order Cosmetics & Toiletries Food
Greece n.a. n.a. n.a.
Hungary Medicinal Products Food Trade
Ireland Retail Household Services Food
Italy Food Automotive Telecommunication
Latvia Retail In General Remedies Financial Institutions, Services
Lithuania Retail Remedies Mobile Communication
Luxembourg Transport Household Equipment Retail
Macedonia Medicaments & Vitamins Beers Soft Drinks Sparkling
Netherlands Retail Food Personal Care
Poland Pharmaceutical Products, Medicine Food Retail
Romania Pharmaceuticals & Health Food Beverages
Russia Pharmaceuticals Food Retail
Serbia Food, Non-Alcoholic Beverages Pharmaceuticals Cosmetics
Slovakia Banking, Insurance, Financial Services Telecommunication Food
Spain Food Beauty Retail
Sweden Retailers Financial Advertising Food, Beverage, Tobacco
Switzerland Food Personal Hygiene, Cosmetics Beverages
Turkey Food Communication Cosmetics & Personal Care
Ukraine Pharmaceuticals Food Alcohol
United Kingdom Food Entertainment & Leisure Finance
Japan n.a. n.a. n.a.
United States Automobile Financial Retail
Europe Food Retail Pharmaceuticals
Top 3 Advertising Sectors
Source: Local institutes, gross figures
Key Tables.
TV K
EY F
ACTS
201
7
150 151

Special Thanks
TV Key Facts 2017 is founded by the RTL AdConnect sales houses and the RTL Group. The project is directed under the control of Stéphane Coruble, Managing Director of RTL AdConnect.
To the authors A very special thanks for their contributions in form of articles or interviews.Martin Bromfield (comScore), Duncan Stewart (Deloitte), Alain Beerens (egta), Candice Alessan-dra, Abed Laraqui, Florent Carême & Siglinde Martinez (Eurodata TV Worldwide), Stephanie Hor-baczewski (StyleHaul), Brigitte Bayer, Cornelia Krebs & Jens Poppelmann (Mediengruppe RTL Deutschland), Guillaume Charles (M6 Publicité), Rupert Schäfer (Nunatak), Elena Nigra (Rai Pub-blicita), Thorsten Schütte-Gravelaar (Smartclip), Ludovic de Barrau (IP Belgium), Carsten Göttel (Super RTL), Bianca Stockreiter (TrendOne), Nico Hofmann (UFA).
To our world partnersSpecial thanks to all our partners from all around the world who have taken part to this project and with-out whom the report could not be possible.Analytical Centre (Anna Vorontsova), ARBOme-dia Vilnius (Remigijus Mikšys), ARMA (Costin Juncu), AS Kanal 2 (Margus Paas), AVMU (Emilia Janevs-ka), Dentsu Aegis Network (Müge Atakan, Gülşah Balten), GARB Audience Measurement Bulgaria (Doroteia Dervisheva), ITV (Tony Mawer), Kantar Me-dia (Wanda Świętek), Kantar Sifo (Lars Näsström), Kantar TNS Finland (Orvokki Tervo), Kantar TNS Lithuania (Lina Petraitiene, Giedrė Juronienė), Kan-tar TNS Slovakia (Jana Tibenská), Magna Global (Vincent Letang, Michael Leszega), Magnet Media Ltd. (Ivars Bebrišs), McCann-Erickson Universal (Maria Yaznevich-Khasenevich), Media Advertising
(Goran Stojanovic), Media Master (Martin Procház-ka), MTG Denmark (Kristian Arnaa), MTG Swe-den (Johann Nelander, Sofie Thermænius), MTV Oy (Taina Mecklin), Nielsen Audience Measurement Cyprus (Maria Mavrommatis), Nielsen Audience Measurement Macedonia (Simeon Lavciski), Niels-en Audience Measurement Serbia (Silvija Atijas-Ris-tić), PMT s.r.o. (Vladimir Fatika), Publitalia ’80 (Giulio Bello), RTÉ (Paul Cantwell, Mariya Zhabska), Television Industry Committee (Semen Syzov), TVB (Ron Salmon), TVP (Anna Smycz).
To our local IPs and other RTL Group companiesAtresmedia (Rosa Riestro Sastre), Goldbach Media (Irène Durrer), RTL Belgium (Christine Pirmez - De Kempeneer), IP Luxembourg (Laurent Friob), IP Ös-terreich (Nadine Aigner, Sabrina Fischer, Christian Sattler), Mediengruppe RTL (Armin Bluhm, Holger Brock, Simone Seewald, Philipp Schlichting), R-Time (Frigyes Ur, Aracsi Zoltán, Anett Varga), RTL Hrvat-ska (Nenad Lukić, Vedran Škrinjar, Ana Anđal, Adri-jano Hafner), RTL Nederland (Cindy Borrenberg, Bob van de Vijfeijke).
Thanks also to our team at RTL AdConnect for their effort and dedicationDaniel Bischoff, Emilie Demarquay, Yvonne Eschbach, Charles Fletcher, Carine Jean-Jean, Krane Jeffery, Franck Litewka, Christophe Loisel, Jean-Baptiste Moggio, Jonas Noffz, Coraline Sainte-Beuve and Di-ane Sarkis.

Imprint
Stéphane Coruble, Managing DirectorChristophe Loisel, Deputy Managing DirectorRTL AdConnect SA45, Boulevard Pierre Frieden – L 1543 Luxembourg – T. +352 42142 [email protected] Carine Jean-Jean, Communications DirectorT. +33 1 56 69 42 85 – cjeanjean@ rtladconnect.comCoraline Sainte-Beuve, Corporate Communication Project ManagerT. +33 1 56 69 42 82 - [email protected] AdConnect – 58 avenue Charles-de-Gaulle – 92200 Neuilly-sur-Seine – France
Jonas Noffz, Senior Media and Markets AnalystT. +49 221 456 21950 – [email protected] Eschbach, Junior Media and Markets Analyst T. +49 221 456 21980 – [email protected] AdConnect – Picassoplatz 1 – D 50679 Cologne
Emilie Demarquay – [email protected]ée8ter, rue Jeanne d’Asnières – F 92110 Clichy – France – T. +33 1 47 37 47 46
Publication Directors.
Editors-in-chief & Communications.
Data Research.
Graphic Design.Printing.
Photo credits.???
Price: € 950. ISSN 2227-1945. Copyright IP and RTL Group, September 2016. All rights reserved. No part of this publication may be reproduced in any fashion whatsoever without the publisher’s prior written permission. Whilst every effort has been made to ensure accuracy of the information in this publication, neither IP nor RTL Group accept responsibility for errors or omissions.
TV Key Facts 201724th Edition – September 2017
152 153
TV K
EY F
ACTS
201
7

In-depth analysis for a savvy media answer
We can accurately gauge performances with our tar-geted ad strategies based on trend research, data col-lection and our comprehensive expertise.Extensive multi-market knowledge, data & trendsWe havea total video expertise. Thanks to our full-scale
Reach More Insights.
#1 broadcast and digital
offer in Europe
+100 TV channels
+300 Digital platforms
+30Radio station
Premium digital talents
80,000 Content creators
160 million daily TV viewers
90% weekly reach in
Europe on our Radio stations
Brand safe digital
content
26+ Bn monthly online video views on RTL Group's catch-up TV services, websites and MCNs
Powerful & engaging
content
#1 prime time shows
in most of major TV markets
#1 global MCN reach
Access the Number One Global & Premium Total Video Inventory
We connect advertisers to new markets and engage their audience via our wide range of channels, radios, digital platforms and talents.
Reach More Audiences.
country-by-country analysis, our valued studies offer a simplified, global picture and a transversal overview of a multitude of markets (country profile, equipment, advertising markets, audiences, ROI...).

Customised broadcast and digital media solutions.Data insight, strategy, planning & performance.Ad tech solutions.
Reach More Solutions.
80% Daily reach
in Europe on TV
95% global completion
rate on our digital platform
95% total
video reach with
RTL AdConnect
Broadcast offer
Television
Special ads
Radio
Reach More with RTL AdConnect.
Digital offer
Digital Premium & Brand Safe environment
Digital Audience Extension
YouTube pre-rolls
MCNs & Talents,
Marketing influencer on YouTube
Brand Content
154 155
TV K
EY F
ACTS
201
7

RTL AdConnectTeam
International Advertising Solutions
Reach more.
RTL AdConnect est la première régie publicitaire total video en Europe. Elle offre un accès direct à l’ensemble des contenus premium de RTL Group et ses partenaires (ITV, Rai, Medialaan...) pour créer des campagnes total video pan-Européennes.Grâce à sa plateforme de commercialisation programmatique, elle met à disposition l’intégralité de l’inventaire video de ses partenaires et propose ainsi un ciblage avancé dans un environnement premium et sécurisé.
www.rtl-adconnect.com
*Rayonnez plus loin
*
156 157
TV K
EY F
ACTS
201
7

RTL Group is a leader across broadcast, content and digital, with interests in 56 television channels and 31 radio stations, content production throughout the world and rapidly growing digital video businesses.
The television portfolio of Europe’s largest broadcast-er includes RTL Television in Germany, M6 in France, the RTL channels in the Netherlands, Belgium, Lux-embourg, Croatia, Hungary and Antena 3 in Spain. RTL Group’s families of TV channels are either the number one or number two in eight European coun-tries. The Group’s flagship radio station is RTL in France, and it also owns or has interests in other sta-tions in France, Germany, Belgium, the Netherlands, Spain and Luxembourg.
RTL Group’s content production arm, Fremantle-Media, is one of the largest international creators,
producers and distributors of multi-genre content outside the US. With operations in 31 countries, Fre-mantleMedia’s comprehensive global network is responsible for approximately 12,000 hours of pro-gramming a year and distributes over 20,000 hours of content worldwide.
Combining the catch-up TV services of its broad-casters, the multi-platform networks BroadbandTV, StyleHaul and Divimove as well as FremantleMedia’s more than 280 YouTube channels, RTL Group has be-come the leading European media company in on-line video. RTL Group also owns the advanced video ad serving platform SpotX.
For more information, please visit RTLGroup.com and follow RTL Group on Twitter @rtlgroup.

158 C
TV K
EY F
ACTS
201
7
Reach More.
ISSN 2227-1945 | Dépôt légal Bibliothèque nationale de Luxembourg - 31 boulevard K. Adenauer - L-1115 Luxembourg | Print: www.printvallee.com
www.rtl-adconnect.com/[email protected]