
Amazon to become the undisputed retail champion?
100
Amazon to become the undisputed retail champion? Francisco Morais Correia Dissertation written under the supervision of António Luís Borges de Assunção Dissertation submitted in partial fulfilment of requirements for the MSc in Finance, at the Universidade Católica Portuguesa, January 2021.
-
Upload
khangminh22 -
Category
Documents
-
view
1 -
download
0
Transcript of Amazon to become the undisputed retail champion?

Amazon to become the
undisputed retail
champion?
Francisco Morais Correia
Dissertation written under the supervision of António Luís Borges de
Assunção
Dissertation submitted in partial fulfilment of requirements for the MSc in
Finance, at the Universidade Católica Portuguesa, January 2021.

Católica Lisbon SBE | MSc in Finance Thesis | Mergers & Acquisitions | 2020
- 1 -
Abstract
The purpose of this dissertation is to analyze the potential acquisition of Target Corporation by
Amazon.
The retail industry has been consistently growing in past years, without any signs of slowing
down. Even though the Covid-19 pandemic fueled the global shift from physical to online
retailing, this acquisition is presented as viable option for a company like Amazon.
In order to leverage on its remarkable year results and accentuate its position as the worldwide
market leader in the retailing industry, it is proposed a possible strong entrance in the brick-
and-mortar retail, in the US, hinted by the 2017 acquisition of Whole Foods.
The proposed acquisition is a direct response to Walmart, Amazon’s main competitor in the
US, which has recently gained market share in the online retail industry.
The recommended bid price is $202.60 per share, which accounts for a 27% acquisition
premium over the market price at the 11th of December 2020. This valued is justified by net
synergies of $37,369.
The transaction should be carried as a friendly takeover and is expected to be an all-cash deal,
financed 60% Amazon’s cash reserves and 40% by debt issuance. Amazon’s shareholders have
the potential of capturing $15,800 million and an accretion of 27.5% in 2020.
Keywords: Mergers and acquisitions, Retail, E-commerce
Title: Amazon to become the undisputed retail champion?
Author: Francisco Maria Marques Batista de Morais Correia

Amazon to become the undisputed retail champion? | Francisco Morais Correia
- 2 -
Abstrato
O objetivo da presente dissertação é analisar a potencial aquisição da Target Corporation pela
Amazon.
A indústria do retalho tem vindo a crescer bastante nos últimos anos, sem quaisquer sinais de
abrandamento. Apesar da pandemia do Covid-19 ter contribuído para acentuar a mudança
global de retalho físico para “online”, a aquisição proposta é considerada como viável para uma
empresa como a Amazon.
De forma a poder tirar partido dos seus resultados notáveis de 2020 e a enfatizar a sua posição
de líder mundial na sua indústria, é proposta uma forte entrada na indústria de retalho físico
norte-americana, denunciada pela aquisição da Whole Foods em 2017.
A aquisição seria uma resposta ao Walmart, o principal competidor da Amazon nos Estados
Unidos, que tem vindo a capturar uma quota de mercado considerável no retalho “online”.
A licitação recomendada é de $202.60 por ação, que inclui 27% de prémio de aquisição acima
do valor de mercado no dia 11 de dezembro de 2020. Este valor justificado por sinergias
líquidas de $37,369.
É esperado que a transação seja de forma amigável e que a oferta seja composta por dinheiro,
financiando 60% pelas reservas da Amazon e 40% pela emissão de dívida. Os acionistas da
Amazon podem potencialmente capturar $15,800 milhões e uma acreção de 27.5% ainda em
2020.
Palavras-chave: Fusões e aquisições, Retalho, E-commerce
Título: Será que a Amazon se pode tornar o campeão indiscutível do retalho?
Autor: Francisco Maria Marques Batista de Morais Correia

Católica Lisbon SBE | MSc in Finance Thesis | Mergers & Acquisitions | 2020
- 3 -
Acknowledgements:
It is a bittersweet sensation to have finally concluded my studies at Católica Lisbon, and what
a journey it has been. These the past five years have shaped my life completely, from an 18-
year-old boy who knew nothing about business, to a 23-year-old man who now works in an
investment bank.
I know that I owe a great part of my success to inspiring professors I found at Católica. I would
like to thank my academic advisor António Borges de Assunção, for his competency and
outstanding availability while guiding me in the last months.
I would also like to express my gratitude to my friends, namely Maria Oliveira, Francisco Reis
and Luís Costa, who supported me throughout this challenge.
To my classmates, who then became friends, for setting high standards and promoting a healthy
competition environment amongst peers.
To my family, a true example of union and selfless care, which reminds every day to have a
unique loving perspective in everything I do.
Finally, I would like to specially thank my parents and siblings, for making me a resilient hard
worker, allowing me the privilege me to study at one of the best business schools in Europe,
but, above all, for their unconditional love and confidence in me.
Amazon to become the undisputed retail champion? | Francisco Morais Correia
- 4 -
Table of Contents
List of figures ........................................................................................................................ - 8 -
List of equations .................................................................................................................. - 11 -
List of tables ........................................................................................................................ - 12 -
List of abbreviations ............................................................................................................ - 14 -
1. Introduction ................................................................................................................ - 16 -
2. Literature Review ....................................................................................................... - 16 -
2.1. Mergers and acquisitions ..................................................................................... - 16 -
2.1.1. Overview ....................................................................................................... - 16 -
2.1.2. Takeover defense tactics ............................................................................... - 18 -
2.1.3. Motivations behind Mergers and Acquisitions ............................................. - 18 -
2.1.4. Synergies ....................................................................................................... - 20 -
2.1.5. Acquisition premium ..................................................................................... - 22 -
2.1.6. Methods of payment ...................................................................................... - 22 -
2.1.7. Profitability of M&A deals ........................................................................... - 23 -
2.2. Firm valuation ...................................................................................................... - 24 -
2.2.1. Valuation overview ....................................................................................... - 24 -
3. Company Profiles ....................................................................................................... - 25 -
3.1. Amazon company profile ...................................................................................... - 25 -
3.1.1. Company overview ....................................................................................... - 25 -
3.1.2. Ownership ..................................................................................................... - 25 -
3.1.3. Product and services portfolio ....................................................................... - 26 -
3.1.4. Geographical footprint .................................................................................. - 27 -
3.1.5. Recent developments ..................................................................................... - 28 -
3.1.6. Financial analysis .......................................................................................... - 28 -
3.1.7. SWOT analysis .............................................................................................. - 32 -
3.2. Target company profile ........................................................................................ - 33 -
3.2.1. Company overview ....................................................................................... - 33 -
3.2.2. Ownership ..................................................................................................... - 33 -
3.2.3. Product and services portfolio ....................................................................... - 33 -
3.2.4. Geographical footprint .................................................................................. - 34 -
3.2.5. Recent developments ..................................................................................... - 34 -

Católica Lisbon SBE | MSc in Finance Thesis | Mergers & Acquisitions | 2020
- 5 -
3.2.6. Financial analysis .......................................................................................... - 35 -
3.2.7. SWOT analysis .............................................................................................. - 39 -
3.3. Share price performance ...................................................................................... - 39 -
4. Industry Analysis ....................................................................................................... - 40 -
4.1. US Multiline retail ................................................................................................ - 40 -
4.1.1. Industry overview .......................................................................................... - 40 -
4.1.2. Market size and segmentation ....................................................................... - 41 -
4.1.3. Porter’s five forces ........................................................................................ - 43 -
4.1.4. Main drivers and trends ................................................................................. - 43 -
4.1.5. Growth projections ........................................................................................ - 44 -
4.2. Global online retail .............................................................................................. - 44 -
4.2.1. Industry overview .......................................................................................... - 44 -
4.2.2. Market size and segmentation ....................................................................... - 45 -
4.2.3. Main drivers and trends ................................................................................. - 46 -
4.2.4. Growth projections ........................................................................................ - 46 -
5. Deal Rationale............................................................................................................. - 48 -
6. Valuation ..................................................................................................................... - 49 -
6.1. Amazon valuation ................................................................................................. - 50 -
6.1.1. Discounted cash flow valuation .................................................................... - 50 -
6.1.2. Relative valuation .......................................................................................... - 53 -
6.1.2.1. Peer group .................................................................................................. - 53 -
6.1.2.2. Trading multiples valuation ....................................................................... - 53 -
6.2. Target valuation ................................................................................................... - 53 -
6.2.1. Discounted cash flow model ......................................................................... - 53 -
6.2.2. Relative valuation .......................................................................................... - 56 -
6.3. Valuation summary ............................................................................................... - 57 -
7. Synergies Valuation ................................................................................................... - 58 -
7.1. Introduction .......................................................................................................... - 58 -
7.2. Operating synergies .............................................................................................. - 58 -
7.3. Financial synergies............................................................................................... - 59 -
8. Transaction Details .................................................................................................... - 60 -
8.1. Takeover approach ............................................................................................... - 60 -
8.2. Transaction premium ............................................................................................ - 60 -

Amazon to become the undisputed retail champion? | Francisco Morais Correia
- 6 -
8.3. Transaction fees and integration costs ................................................................. - 61 -
8.4. Financing .............................................................................................................. - 62 -
8.5. Accretion/Dilution analysis .................................................................................. - 63 -
8.6. Post-merger integration ....................................................................................... - 63 -
8.7. Alternative target .................................................................................................. - 64 -
9. Limitations .................................................................................................................. - 65 -
10. Conclusion ................................................................................................................... - 65 -
11. Bibliography ............................................................................................................... - 66 -
12. Appendix ..................................................................................................................... - 70 -
Appendix 1 – Valuation Techniques ................................................................................ - 70 -
Appendix 2 – Amazon’s company profile additional information ................................... - 80 -
Appendix 3 – Target’s company profile additional information ..................................... - 83 -
Appendix 4 – Amazon’s number of stores ....................................................................... - 86 -
Appendix 5 – Amazon Prime’s fees per country .............................................................. - 86 -
Appendix 6 – Amazon’s SWOT analysis .......................................................................... - 87 -
Appendix 7 – Target’s SWOT analysis ............................................................................ - 87 -
Appendix 8 – Multiline retail industry’s Porter’s five forces analysis ............................ - 88 -
Appendix 9 – Amazon’s historical income statement ...................................................... - 89 -
Appendix 10 – Amazon’s historical balance sheet .......................................................... - 89 -
Appendix 11 – Amazon’s historical cash flow statement ................................................ - 90 -
Appendix 12 – Target’s historical income statement ...................................................... - 91 -
Appendix 13 – Target’s historical balance sheet ............................................................ - 91 -
Appendix 14 – Target’s historical cash flow statement ................................................... - 92 -
Appendix 15 – Amazon’s revenues forecast .................................................................... - 93 -
Appendix 16 – Amazon’s forecasted income statement ................................................... - 93 -
Appendix 17 – Amazon’s beta computation .................................................................... - 94 -
Appendix 18 – Amazon’s discounted cash flow model .................................................... - 94 -
Appendix 19 – Amazon’s trading multiples valuation ..................................................... - 95 -
Appendix 20 – Target’s revenues forecast ...................................................................... - 95 -
Appendix 21 – Target’s forecasted income statement ..................................................... - 96 -
Appendix 22 – Target’s beta computation ....................................................................... - 96 -
Appendix 23 – Target’s discounted cash flow model ...................................................... - 96 -
Appendix 24 – Target’s trading multiples valuation ....................................................... - 97 -
Appendix 25 – Target’s transaction multiples valuation................................................. - 97 -

Católica Lisbon SBE | MSc in Finance Thesis | Mergers & Acquisitions | 2020
- 7 -
Appendix 26 – Combined entity’s discounted cash flow model without synergies ......... - 98 -
Appendix 27 – Combined entity’s discounted cash flow model with synergies............... - 98 -
Appendix 28 – Accretion / Dilution analysis ................................................................... - 99 -
Appendix 29 – Deal summary .......................................................................................... - 99 -

Amazon to become the undisputed retail champion? | Francisco Morais Correia
- 8 -
List of figures
Figure 1 - Amazon’s historic revenues by business segment; adapted from Amazon’s annual
reports .................................................................................................................................. - 26 -
Figure 2 - Amazon’s historic revenues by geographical area; adapted from Amazon’s annual
reports .................................................................................................................................. - 27 -
Figure 3 – Amazon’s historic cost structure; adapted from Amazon’s annual reports ....... - 29 -
Figure 4 - Amazon's historic cost of sales as a percentage of revenues; adapted from Amazon’s
annual reports ...................................................................................................................... - 29 -
Figure 5 - Amazon's historic depreciations and amortizations; adapted from Amazon’s annual
reports .................................................................................................................................. - 30 -
Figure 6 - Amazon's historic capital expenditures; adapted from Amazon’s annual reports- 30
-
Figure 7 - Amazon's historic capital structure; adapted from Amazon’s annual reports .... - 31 -
Figure 8 - Amazon's historic net financial debt and cash and cash equivalents; adapted from
Amazon’s annual reports ..................................................................................................... - 31 -
Figure 9 - Target's historic revenues by business segment; adapted from Target's annuals reports
............................................................................................................................................. - 34 -
Figure 10 - Target's historic revenues by channel; adapted from Target's annual reports .. - 35 -
Figure 11 - Target’s historic cost structure; adapted from Target’s annual reports ............ - 36 -
Figure 12 - Target's historic cost of sales as a percentage of revenues; adapted from Target’s
annual reports ...................................................................................................................... - 36 -
Figure 13 - Target's historic depreciations and amortizations; adapted from Target’s annual
reports .................................................................................................................................. - 36 -
Figure 14 - Target's historic capital expenditures; adapted from Target’s annual reports .. - 37 -
Figure 15 - Target's historic capital structure; adapted from Target’s annual reports ........ - 37 -
Figure 16 - Target's historic net financial debt and cash and cash equivalents; adapted from
Amazon’s annual reports ..................................................................................................... - 38 -
Figure 17 - Amazon's share price performance; from Thomson Reuters Eikon ................. - 39 -

Católica Lisbon SBE | MSc in Finance Thesis | Mergers & Acquisitions | 2020
- 9 -
Figure 18 - Target's share price performance, adjusted to its dividend yield; from Thomson
Reuters Eikon ...................................................................................................................... - 40 -
Figure 19 - Whole retail industry geographical segmentation; adapted from MarketLine (2019)
............................................................................................................................................. - 41 -
Figure 20 – US multiline retail industry segmented by product category; adapted from
MarketLine (2019) .............................................................................................................. - 41 -
Figure 21 - US retail industry (excluding food service) segmented by channel; adapted from
MarketLine (2019) .............................................................................................................. - 42 -
Figure 22 - US retail industry (excluding food service) expected growth; adapted from
MarketLine (2019) .............................................................................................................. - 44 -
Figure 23 - Online retail industry segmented by geography; adapted from MarketLine (2019) -
45 -
Figure 24 - Historical and forecasted US online retail industry segmentation by channel;
adapted from MarketLine (2019) ........................................................................................ - 47 -
Figure 25 - Historical and forecasted global online retail industry segmentation by product
segment; adapted from MarketLine (2019) ......................................................................... - 48 -
Figure 26 - Amazon's valuation football field ..................................................................... - 57 -
Figure 27 - Target's valuation football field ........................................................................ - 58 -
Figure 28 - Present value of synergies ................................................................................ - 59 -
Figure 29 – Present value of net synergies .......................................................................... - 61 -
Figure 30 - Valuation summary .......................................................................................... - 62 -
Figure 31 - Post-transaction integration matrix; adapted from Haspeslagh & Jemison (1991) .. -
64 -
Figure 32 - Amazon's historic changes in working capital; adapted from Amazon’s annual
reports .................................................................................................................................. - 81 -
Figure 33 - Amazon's historic interest expenses; adapted from Amazon’s annual reports. - 82 -
Figure 34 - Amazon's historic income statement earnings; adapted from Amazon’s annual
reports .................................................................................................................................. - 82 -
Figure 35 - Amazon's historic earnings per share and return on equity; from Thomson Reuters
Eikon ................................................................................................................................... - 83 -

Amazon to become the undisputed retail champion? | Francisco Morais Correia
- 10 -
Figure 36 - Target's historic changes in working capital; adapted from Target’s annual reports
............................................................................................................................................. - 84 -
Figure 37 - Target's historic interest expenses; adapted from Target’s annual reports ....... - 84 -
Figure 38 - Target's historic income statement earnings; adapted from Target’s annual reports -
85 -
Figure 39 - Target's historic dividend yield; from Thomson Reuters Eikon ....................... - 85 -
Figure 40 - Target's historic earnings per share and return on equity; from Thomson Reuters
Eikon ................................................................................................................................... - 86 -

Católica Lisbon SBE | MSc in Finance Thesis | Mergers & Acquisitions | 2020
- 11 -
List of equations
Equation 1 - Valuation generic equation ............................................................................. - 70 -
Equation 2 - WACC formula .............................................................................................. - 71 -
Equation 3 - CAPM formula ............................................................................................... - 72 -
Equation 4 - Interest coverage ratio .................................................................................... - 73 -
Equation 5 - After-tax cost of debt formula ........................................................................ - 73 -
Equation 6 - Beta levered formula ...................................................................................... - 74 -
Equation 7 - Adjusted levered beta formula ........................................................................ - 74 -
Equation 8 - FCFF formula based on net income ............................................................... - 74 -
Equation 9 - FCFF formula based on EBIT ........................................................................ - 74 -
Equation 10 - FCFF formula based on FCFE ..................................................................... - 74 -
Equation 11 - WACC model enterprise value ..................................................................... - 75 -
Equation 12 - WACC model terminal value ....................................................................... - 75 -
Equation 13 - FCFE formula ............................................................................................... - 76 -
Equation 14 - FCFE model equity value formula ............................................................... - 76 -
Equation 15 - CAPM formula to compute the unlevered cost of capital ............................ - 77 -
Equation 16 - APV firm value formula ............................................................................... - 77 -
Equation 17 - APV model PVTS formula ........................................................................... - 77 -
Equation 18 - APV model PV of bankruptcy costs ............................................................. - 78 -
Equation 19 - Return on capital formula ............................................................................. - 78 -
Equation 20 - EVA formula ................................................................................................ - 79 -
Amazon to become the undisputed retail champion? | Francisco Morais Correia
- 12 -
List of tables
Table 1 - Amazon's presence by country; adapted from the company’s website ............... - 27 -
Table 2 - Amazon's historic key figures; from Thomson Reuters Eikon ............................ - 32 -
Table 3 - Target's historic key figures; from Thomson Reuters Eikon ............................... - 38 -
Table 4 - Amazon's and Nasdaq 100 share price CAGR and last year price change .......... - 40 -
Table 5 - Target's and S&P 500 share price CAGR and last year price change ................. - 40 -
Table 6 - Top 10 most valuable companies on the US multiline retail industry; adapted from
Thomson Reuters Eikon ...................................................................................................... - 42 -
Table 7 - Top 10 most valuable companies on the global online retail industry; adapted from
Thomson Reuters Eikon ...................................................................................................... - 45 -
Table 8 - Amazon's forecast summary, values in millions USD ......................................... - 51 -
Table 9 - WACC computation for Amazon ........................................................................ - 51 -
Table 10 - Amazon's sensitivity analysis ............................................................................ - 52 -
Table 11 - Target's forecast summary, values in millions USD .......................................... - 54 -
Table 12 - WACC computation for Target ......................................................................... - 55 -
Table 13 - Target's sensitivity analysis ............................................................................... - 56 -
Table 14 - Default spread for large non-financial service companies; adapted from Damodaran
(2018) .................................................................................................................................. - 73 -
Table 15 - Amazon's number of stores; adapted from Amazon’s annual reports ............... - 86 -
Table 16 - Amazon Prime’s fees; adapted from Amazon's annual report ........................... - 86 -
Table 17 - Amazon's SWOT analysis ................................................................................. - 87 -
Table 18 - Target's SWOT analysis..................................................................................... - 87 -
Table 19 - Amazon's historical income statement; adapted from Amazon's annual report - 89 -
Table 20 - Amazon's historical balance sheet; adapted from Amazon's annual report ....... - 89 -
Table 21 - Amazon's historical cash flow statement; adapted from Amazon's annual report- 90
-
Table 22 - Target's historical income statement; adapted from Target's annual report ...... - 91 -
Table 23 - Target's historical balance sheet; adapted from Target's annual report ............. - 91 -

Católica Lisbon SBE | MSc in Finance Thesis | Mergers & Acquisitions | 2020
- 13 -
Table 24 - Target's historical cash flow statement; adapted from Target's annual report ... - 92 -
Table 25 - Amazon's revenue forecast by business segment .............................................. - 93 -
Table 26 - Amazon's forecasted income statement ............................................................. - 93 -
Table 27 - Amazon's beta computation ............................................................................... - 94 -
Table 28 - Amazon's discounted cash flow model .............................................................. - 94 -
Table 29 - Amazon's trading multiples valuation................................................................ - 95 -
Table 30 - Target's revenues forecast by business segment ................................................ - 95 -
Table 31 - Target's forecasted income statement ................................................................ - 96 -
Table 32 - Target's beta computation .................................................................................. - 96 -
Table 33 - Target's discounted cash flow model ................................................................. - 96 -
Table 34 - Target's trading multiples valuation ................................................................... - 97 -
Table 35 - Target's transaction multiples valuation ............................................................ - 97 -
Table 36 - Combined entity’s discounted cash flow model without synergies ................... - 98 -
Table 37 - Combined entity’s discounted cash flow model with synergies ........................ - 98 -
Table 38 - Accretion / Dilution analysis ............................................................................. - 99 -
Table 39 - Deal summary .................................................................................................... - 99 -

Amazon to become the undisputed retail champion? | Francisco Morais Correia
- 14 -
List of abbreviations
M&A Mergers and acquisitions
FCFF Free cash flow to the firm
WACC Weighted average cost of capital
FCF Operating free cash flow
FCFE Free cash flow to equity
EFE Equity free cash flow
Ke Cost of equity
Kd Cost of debt
APV Adjusted present value
Ku Unlevered cost of capital
PVTS Present value of tax shields
CFF Capital free cash flow
E Equity
D Debt
Vu Value of the unlevered firm
Tc Corporate tax rate
t Tax rate
CAPM Capital asset pricing model
SG&A Selling, general and administrative (costs)
AWS Amazon Web Services
NPV Net present value
R&D Research and development
CAGR Compound annual growth rate
CAPEX Capital expenditures
NWC Net working capital
DCF Discounted cash flow (model)
NASDAQ National Association of Securities Dealers Automated Quotations

Católica Lisbon SBE | MSc in Finance Thesis | Mergers & Acquisitions | 2020
- 15 -
S&P Standard and Poor’s
AI Artificial intelligence
IT Information technology
API’s Application programming interfaces
ROE Return on Equity
EPS Earnings per shares
PER Price earnings ratio
EBITDA Earnings before interests, taxes, depreciations and amortizations
EBIT Earnings before interests and taxes
SWOT Strengths, weaknesses, opportunities and threats
CAGR Compounded annual growth rate
GICS Global industry classification standard
Mkt Cap Market capitalization
EV Enterprise value
TV Terminal value
EVA Economic value added
NFD Net financial debt
NOPAT Net operating profit after taxes

Amazon to become the undisputed retail champion? | Francisco Morais Correia
- 16 -
1. Introduction
The present dissertation addresses the topic of Mergers and Acquisitions (M&A), applying its
concepts to a case study, mainly focused on valuation techniques. The aim of this thesis is to
understand the viability of a potential acquisition of Target Corporation by the largest player
on the retail industry, Amazon. The main reasoning behind this acquisition is for Amazon to
get a competitive advantage over its main competitor in North America, Walmart.
The year of 2020 has reminded society that even the near future is uncertain, and nothing can
be taken for granted. From an unprecedented global pandemic, that will shape the way we are
going to live for the next generations; to constant riots and protests, mainly in Hong Kong and
the US; 2020 has been full of historic events that promise to change the economic landscape
for the long run.
According to the United Nations, in 2019, the world’s gross product growth and world trade
growth fell to their lowest level in a decade. Rising tariffs and the escalation of global trade
tensions have fueled policy uncertainty, significantly curtailed investment, pushing global trade
growth down to 0.3%. Bilateral trade between the United States of America and China has
plummeted, with significant disruptions to international supply chains. The impeachment of the
US president Donald Trump and the uncertainty regarding the outcome of the US presidential
elections contributed to a climate of increasing volatility, mainly in the US.
All in all, the measures taken to contain covid-19 have caused major economic disruptions due
to countries being on quarantine. This resulted, on the supply side, in major cutbacks in services
provisions and harsh supply chain disruptions. On the demand side, there was a loss of
confidence by the consumers (which is, for many economists, the main pillar of the economy).
Nonetheless, with great uncertainty come great opportunities.
2. Literature Review
2.1. Mergers and acquisitions
2.1.1. Overview
All firms desire to maximize their shareholder value and expand their business, to do so they
can implement a set of growth strategies that can be either organic or inorganic (Demirci, 2007).

Católica Lisbon SBE | MSc in Finance Thesis | Mergers & Acquisitions | 2020
- 17 -
Firms that rely on organic growth utilize their internal resources and capabilities to achieve
growth. Contrarily, if a company chooses to look for external sources of growth, they incur in
inorganic growth. Some of the limitless examples of this kind are: joint-ventures, alliances,
mergers and acquisitions (Bruner, 2004).
Regarding the last examples referred above, i.e. M&A, both assign the joining of two or more
entities. However, they bear slight differences that lead to three scenarios (Garzella &
Fiorentino, 2016):
1. Merger by incorporation, where an existing firm embodies one or more companies;
2. Pure merger, where companies combine forces to create a new joint organization;
3. Acquisition, where one entity gets taken over by another separate entity, therefore,
ceasing to exist.
Additionally, mergers can be classified based on relatedness of business activities and Lubatkin
(1983) executed it by grouping them in four different categories:
1. Product concentric, where companies with distinct products that operate in the same
market bundle their product offerings.
2. Horizontal and market concentric, where the author used Howell’s (1970) rationale to
group these classifications due to the little distinction between the two, given the ease
with which a firm can geographically expand its markets. Therefore, this classification
is related to mergers between companies that operate in a similar industry.
3. Vertical, that are the combination of firms operating in different industries but along the
same supply chain.
4. Conglomerate, these mergers are related to the combination of firms that are involved
in unrelated business activities.
Moreover, takeovers can be distinguished between friendly or hostile. Friendly takeovers have
the target’s management approval of the proposal and their collaboration to implement it.
Whereas, in hostile takeovers the managers of the acquired firm oppose the intended proposal.
Subsequently, the managers of the firm hope the transaction will result in increased
competitiveness, higher cost-efficiency, more advanced technology and access to new talents,
resources and capabilities. Finally, M&A activity is a prompt route that firms use to move to
new markets and obtain new capabilities (Rappaport & Sirower, 1999), widening the nature of
their business.

Amazon to become the undisputed retail champion? | Francisco Morais Correia
- 18 -
2.1.2. Takeover defense tactics
In hostile bids the strategic direction and leadership of the target firm are at risk. Consequently,
its executives can enact defenses against hostile takeovers to promote the interests of the target
firm’s shareholders by raising takeover premiums, improving management, or protecting the
firm’s long-term strategy (Rice, 1983). Nevertheless, they can also be seen as the managers’
defensive actions on behalf of their self-interests, resulting in significant negative returns for
shareholders. (Byrd & Stammerjohan, 1997).
Anti-takeover tactics can be allocated in two different categories: preventive and reactive.
On one hand, preventive measures are elaborated before an eventual attack as a response to the
firm’s vulnerability due to its market condition, financial constraints, depressed stock price, or
competitive weakness. They can assume three different paths: poison pills; corporate charter
amendments; and golden parachutes.
On the other hand, reactive measures are taken in response to an undesired takeover attempt.
They can be branched in four categories: litigation; greenmail; standstill agreements; and capital
structure changes.
Concluding, regardless of the success of the takeover, the defense tactics applied by targets
typically benefit them. As a matter of fact, these actions produce double gains: positive wealth
effect for stockholders ranging from 9% to 14% and significantly lower chances of a bid
success, resulting in more job security for the target’s executives (Pearce & Robinson, 2004).
Nonetheless, some strategies have proved to have better results than the others and poison pills
are the preferred ones, since they show evidence of increasing stockholders’ wealth.
2.1.3. Motivations behind Mergers and Acquisitions
The motivations behind M&A transactions are possibly as many as the number of firms acting
as bidders and targets, and behind every takeover are various motives. For a better
comprehension they can be combined into different categories.
Several studies attempted to group them in the most clustering and rational manner, although
scholars are aware that one single theoretical approach cannot take into full consideration the
motives behind every M&A deal (Steiner, 1975; Ravenshaft & Sherer, 1987; Melin & Hellgren,
1994).
Trautwein’s (1990) approach tries to explain the reasoning that backs M&A transactions
through seven theories, sectioned in three categories:

Católica Lisbon SBE | MSc in Finance Thesis | Mergers & Acquisitions | 2020
- 19 -
1. Merger as a rational choice (planned to achieve something), where most theories focus
on shareholders’ interests (efficiency, monopoly, raider, valuation), while empire-
building theory focuses on managers’ interests and how they deviate from the goal of
value maximization.
2. Merger as process outcome, the process theory considers strategic business decisions as
the result of organizational processes, without any rational influence.
3. Merger as a macroeconomic phenomenon, the disturbance theory points to economic
disturbances as the causes for mergers in an environment of high uncertainty and change.
Trautwein’s literature critiques the strategic motivation of M&A, i.e. the efficiency theory that
refers to synergetic value. The author defends that motives behind mergers are interpreted more
clearly through decision processes, clashing interests and information asymmetries (valuation
theory).
In contrast, Berkovitch & Narayanan (1993) recognized three main motives for takeovers:
synergy, hubris and agency.
Furthermore, they prove synergies are the dominant motivation for M&A transactions with
positive total gains. The study stresses the premise that both managers want to maximize
shareholder value, therefore will only engage in the operation if it results in economic gains for
both firms. Several other authors corroborate this statement, such as Bradley et al. (1988) that
refer to a 7.4% increase in the combined value of firms in successful tender offers. Nevertheless,
there is no consensus regarding this topic and authors, namely Mueller & Sirower (2003), reject
the synergy hypothesis as a main motive for M&A.
The Hubris hypothesis addresses the overconfidence of bidders about their ability to add value
to the target company, leading to deals that, if correctly assessed, would not take place. The
authors conclude that this hypothesis has zero correlation between target and total gains. Other
articles (Roll, 1986) acknowledge the influence of hubris in the overvaluation of target
companies.
Respecting agency hypothesis, which justifies takeovers with management’s interests in mind
instead of value maximization, Berkovitch & Narayanan (1993) found a negative correlation
between the target and total gains. In addition, Mueller & Sirower (2003) described agency as
managerial discretion and found significant support for it as a M&A motive. In Trautwein’s
(1990) approach, this hypothesis is found under the empire-building theory.

Amazon to become the undisputed retail champion? | Francisco Morais Correia
- 20 -
In conclusion, there are numerous studies which explain part of the multiple motives for
mergers and acquisitions with different approaches. Nonetheless, synergetic value is generally
highlighted as the main motivation behind these transactions.
2.1.4. Synergies
As mentioned above, synergies are proved to be the fundamental motivation for mergers and
acquisitions. Managers that prompt these transactions expect the value created by the combined
firm to be higher than that of the two firms independently (Sirower, 1997).
2.1.4.1. Types of synergies
Damodaran (2005) mentions the distinction of synergies between two types: operating and
financial. Past literature (Houston & Ryngaert, 1996) on this topic suggests that operating and
financial synergies are the most desirable factors for successful acquisitions.
Operating synergies reflect the efficiency gains or economies of scale achieved through the
combination of both firms. Regarding revenue enhancement, they can be accomplished because
of complementary products, geographies and customers or patents. With respect to cost savings,
the merger can improve operational activities through shared information technology, supply
chain efficiency, improved sales and marketing, R&D, lower salaries and wages, or the removal
of patents. Moreover, Goold & Campbell (1998) indicated shared know-how, pooled
negotiating power, coordinated strategies, vertical integration, combined business creation and
shared tangible resources as possible operating synergies that could arise from a merger.
Finally, Mukherjee et al. (2004) refer to these operating synergies as the main motive for
acquisitions.
Financial synergies emerge from the improved efficiency of financing activities, leading to a
risk reduction, i.e., a reduction in the cost of capital of the new firm. Grinblatt & Titman (2002)
characterize periods (from the 1960s to the 1980s) where financial synergies, such as tax
benefits and incentive improvement were the primary motive for acquisitions. However, in later
periods operational synergies became viewed as the main motivation for strategic acquisitions.
Even though this is not a unanimous topic, most authors agree that both operational and
financial synergies contribute to the creation of value in a merger.

Católica Lisbon SBE | MSc in Finance Thesis | Mergers & Acquisitions | 2020
- 21 -
2.1.4.2. Synergies in the context of multi-channel retailing
The concept of multi-channel retailing emerged after the proliferation of several sales channels
through which consumers could interact with companies (Neslin, 2006). The most common
examples are brick-and-mortar stores, printed catalogs and the internet. Accordingly, through
the different channels, companies can expand their target groups, increase customer loyalty by
satisfying the variety needs of existing customers (Schramm-Klein, 2003) and search for
improved financial performance (Geyskens et al., 2002). With respect to the last objective
referred, firms look for an increase in efficiency and profiling against the competition, which
hopefully results in a synergistic effect.
The “clicks and mortar” strategy combines internet and physical stores and, the retailers that
undertake this multi-channel tactic mostly want to build customer confidence by giving them a
demonstration of appropriateness of their product range (Morschett, 2006).
Nevertheless, past literature (Zhang et al., 2010) suggested that retailers may face some
constraints before going multi-channel due to three main reasons: consumer access to
broadband Internet service, which nowadays is almost a non-existing problem in developed
countries; operational difficulties of integration; and the costs of multi-channel offering.
Even so, the authors concluded that when companies confront those constraints and start a
multi-channel retail business, they can create different synergies from it: cross-channel
customer communication and promotions; leveraging cross-channel information and research
from one channel to improve decisions in other channels; cross-channel price comparisons;
digitization; shared common physical assets and operations (Neslin & Shankar, 2009).
2.1.4.3. Valuing synergies
Damodaran (2005) states, after several inconclusive past research (Barker, 1999; Ludholm &
O’Keefe, 2001; Penman, 2001) about the effectiveness of synergy valuation models in M&A
deals, that the key question is “how synergies should be evaluated and how firms should avoid
risks of potential synergy mis-assessment?”.
Consequently, with the evolution of times managers started to prefer more sophisticated
methods in order to correctly assess the potential synergies of their mergers. The two most
consensual models are:

Amazon to become the undisputed retail champion? | Francisco Morais Correia
- 22 -
1. NPV: that gives importance to each type of synergy that is forecasted (Gupta &
Gerchak, 2002); Often adopted when representing dimensions of corporate strategy and
organizational structure; This is the primary method used on valuation of synergies.
2. Relative valuation: this model values synergies stand on how similarly they are priced
in the market (Liu et al., 2002).
As the correct assessment of potential synergies has a huge impact on the outcome of M&A
transactions, this theme will be further discussed ahead in this literature review.
2.1.5. Acquisition premium
When an acquisition takes place, both companies are aware that the purchase price will not be
the same as the intrinsic value of the target firm. So, to be successful, the bidder will need to
pay a premium (Eccles et al., 1999). The acquisition premium represents the difference in
percentage between the acquisition price and the real value of the target (Berk & DeMarzo,
2017). Past literature suggests that the average bid premium ranges between 20% and 40% in
M&A transactions (Goergen & Renneboog, 2004). Also, BCG’s 2018 report on M&A, states
that the long-term average for acquisition premiums is 32,7%, even though 2017’s results were
considerably below this average (24,8%).
Moreover, there are some circumstances that can increase the potential bid premium, including:
the expected synergies that will result from the merger that make executives of the acquirer
firm pressured to guarantee they will close the deal; the expected growth rate of the target firm
(Tarabay, H, 2018); defensive tactics in hostile takeovers (Dennis & McConnell, 1986);
payment in cash, or cash combined with stock due to tax consequences (Mukherjee et al., 2004).
However, this last aspect was opposed by other authors, such as Huang & Walkling (1987);
lastly, the wrong analysis of the acquisition price done by the bidder firm (Mukherjee et al.,
2004).
2.1.6. Methods of payment
The decision that the acquirer firm undertakes on which method of payment to use is proved to
be crucial in the outcome of the acquisition deal. The bidders can adopt three distinct options:
all-cash, all-stock, or a mixed payment of both.
In an all-cash transaction, the shareholders of the acquiring firm detain the whole value and
risks of the transaction, while in all-stock deals, the synergies and risks are split amongst both
parties (Rappaport & Sirower, 1999).
Católica Lisbon SBE | MSc in Finance Thesis | Mergers & Acquisitions | 2020
- 23 -
Regarding the results of the choice, past literature (Bruner et al., 1986; Travlos, 1987) found
out that the returns to bidders who chose cash were almost insignificantly positive and when
they chose stock their returns were significantly negative. Furthermore, equity-financed
transactions yield an inferior long-term performance than all-cash deals (Agrawal et al., 1992).
Accordingly, the choice over the method of payment has a signaling effect about: (1) the
bidder’s confidence in the post-acquisition gains; and (2) the valuation of the bidder’s assets.
On this wise, all-stock transactions are expected in friendly takeovers; when acquirers’ have
lower liquidity; overvalued bidders’ assets; and when there is dispersed ownership (Stulz,
1988). Contrarily, all-cash transactions are often used in tender offers (Kalinowska & Mielcarz,
2014), in companies with high percentage of managerial ownership (Amihud et al., 1990) and
when there is an auction environment (Fishman, 1989).
2.1.7. Profitability of M&A deals
Eccles et al. (1999) state that due to high premiums, overestimation of synergies, irrational
exuberance about the strategic concern of the deal, enthusiasm built up during negotiations,
weak integration skills, or inaccurate due diligence, the most recurring view on M&A is that it
is a “loser’s game” and therefore destroys value (Grubb & Lamb 2000). Likewise, Christensen
et al. (2011) suggest that the failure rate of mergers and acquisitions is somewhere between
70% and 90%.
Notwithstanding, there is an uneven distribution of the returns as target shareholders tend to
gain with the transaction. So, when the combined bidder and target returns are positive, targets
account for the majority of the gains, while acquiring firms show neutral or negative returns
(Haleblian et al., 2009; Sirower & Sahni, 2006).
Despite all these discoveries, past empirical studies are proved to give inaccurate information
about value creation as a result of unrepresentative data collection, short timespan covered,
misuse of statistical tools (Berkovitch & Narayanan, 1993), overvalued stock and exogenous
shocks (Bruner, 2004). Moreover, literature is inconsistent in specifying clear conclusions
regarding M&A efficacy. According to Bruner (2004), the appropriate technique to evaluate
M&A compares the current situation after the merger, with a hypothetical one if the deal had
not occurred.
In fact, at the macroeconomic level, M&A transactions do create value (Sirower & Sahni,
2006), since the sellers captivate a large percentage of gains balancing out the minor percentage
losses of the buyers.

Amazon to become the undisputed retail champion? | Francisco Morais Correia
- 24 -
Lastly, by aiming attention at hunting managerial talent, creating original operating synergies,
offering cash flow related incentives to executives and promoting the speed of the integration
process, the acquirer firm can gather shareholder value (Anslinger & Copeland, 1996).
2.2. Firm valuation
2.2.1. Valuation overview
Many analysts acknowledge valuation as the heart of corporate finance, considering that a
manager’s objective is to increase firm value through investment, financing and dividend
decisions.
Damodaran (2012) described four generic approaches to valuation:
1. The discounted cash flow (DCF) valuation: related to the value of an asset. This is an
intrinsic value approach because the underlying assumption of this model is that the
company is worth what it will generate.
2. Relative valuation, which estimates the value of an asset by looking at the pricing of
“comparable” assets relative to a common variable, such as earnings, cash flows, book
value or sales. This is an analogical approach since that the company is considered to
be worth what other companies are worth.
3. The liquidation and accounting valuation built around valuing existing assets of a firm.
This is considered a patrimonial approach, in the sense that the company is worth what
it owns.
4. The contingent claim valuation, that uses option pricing models to measure the value
of assets which share option characteristics. This final approach is an external
benchmark approach, since a company is worth what others buy/sell it for.
According to Kaplan & Ruback (1996), the first and second previously described approaches
are the ones that lead to more reliable results.
Extensive literature review regarding these valuation techniques is available on appendix 1.
Católica Lisbon SBE | MSc in Finance Thesis | Mergers & Acquisitions | 2020
- 25 -
3. Company Profiles
3.1. Amazon company profile
3.1.1. Company overview
Amazon was founded in 1994 by Jeffrey Bezos in Seattle, Washington, where its headquarters
are located to this day. The company was initially an online bookstore and after a great first
year the firm announced that it would become public, with the initial public offering taking
place in 1997. The company managed to survive the early 2000’s dot-com bubble burst which
destroyed many e-companies at the time. From that time to this day the company managed to
diversify its services and shifted even more to the technology sector, by growing both
organically and inorganically, the company became one of the big four technology companies,
alongside Google, Apple and Facebook.
Amazon is mainly engaged in the provision of online retail shopping services. The company
operates through the following three business segments: North America, International, and
Amazon Web Services (AWS). The North America segment includes retail sales of consumer
products and subscriptions through North America-focused websites. The International
segment offers retail sales of consumer products and subscriptions through internationally
focused websites. The Amazon Web Services segment is involved in the global sales of
compute, storage, database, and AWS service offerings for start-ups, enterprises, government
agencies, and academic institutions.
3.1.2. Ownership
Amazon is a publicly traded company at the NASDAQ by the ticker AMZN. The company is
also one of the main components of the NASDAQ 100, the main technology derived index.
Amazon’s insider shareholders hold a total of 15% of the firm’s equity, quite a significant
amount. The main insider shareholder is Jeffrey Bezos, CEO and founder of the firm, owning
10.9% of it. Jeffrey is followed by Mackenzie Bezos, with 3.9% of the company and, finally,
by Softbank Group, which owns 0.1% of the firm.
Institutional shareholders own a total of 59.7% of the company. The main institutional holders
of Amazon are the Vanguard Group, owning 6.2% of the firm, followed by BlackRock, which
has a 3.7% stake in the company and Ssga Funds Management which owns 3.3% of the firm.

Amazon to become the undisputed retail champion? | Francisco Morais Correia
- 26 -
3.1.3. Product and services portfolio
Amazon breaks down its revenues into five major business segments: online stores; physical
stores; third-party seller services; Amazon prime; and AWS which provides on-demand cloud
computing platforms. Further information on the matter is available in appendix 2.
Additionally, there is a sixth business segment, named “other revenues” which mainly includes
sales of advertising services, as well as sales related to other services offerings.
In 2019, Amazon’s revenues amounted to $280,522 million, a 20.5% increase when compared
to the previous year. Its revenues by business segment is as follows:
Figure 1 - Amazon’s historic revenues by business segment; adapted from Amazon’s annual reports
Firstly, around 50% of Amazon’s revenues comes from its online sales business segment, a
percentage that has been decreasing every year since its value of 72% back in 2015. Secondly,
its third-party seller services divisions represent 19% of the firm’s total revenues, which has
been increasing every year as well when compared to the 15% value in 2015. In third place,
AWS, whose revenues only started being discriminated in 2017 (being 3% at the time),
contributes, in 2019, to 12% of the firm’s revenues.
Amazon’s revenues growth is expected to increase in the next year, since its net sales in the
first half of 2020 totalled to $164,364 million, a 33.5% increase compared with the $123,104
million in the same period of 2019. In its second quarter report, the company also stresses a
42% increase operating cash flow, when comparing to the same quarter of 2019.
107,006
135,987
177,866
232,877
280,522
0
50,000
100,000
150,000
200,000
250,000
300,000
2015 2016 2017 2018 2019
Online stores Physical stores
Third-party seller services Subscription services
AWS Other
in millions USD

Católica Lisbon SBE | MSc in Finance Thesis | Mergers & Acquisitions | 2020
- 27 -
3.1.4. Geographical footprint
Having a workforce of over 876,800 people, Amazon has currently 17 country-specific sites
spanning some of the largest e-commerce markets all over the world:
Geographical area Country
Americas
USA
Canada
Mexico
Brazil
Europe
UK
Germany
France
Italy
Spain
Netherlands
Asia-Pacific
China
Japan
India
Australia
Singapore
Middle East United Arab Emirates
Turkey
Table 1 - Amazon's presence by country; adapted from the company’s website
Its revenues by geographical area are as follows:
Figure 2 - Amazon’s historic revenues by geographical area; adapted from Amazon’s annual reports
It is noticeable that 69% of the firm’s revenues come from its home country, however it has
been experiencing a deaccelerated growth. It is also worth mentioning that the “rest of the
world” contribution to Amazon’s revenues has been increasing, from 7% in 2015, to 11% in
107,006
135,987
177,866
232,877
280,522
0
50,000
100,000
150,000
200,000
250,000
300,000
2015 2016 2017 2018 2019
United States Germany United Kingdom Japan Rest of the world
in millions USD
Amazon to become the undisputed retail champion? | Francisco Morais Correia
- 28 -
2019, while the values of Germany, UK and Japan have been relatively stable in the last five
years.
3.1.5. Recent developments
In August 2017, Amazon acquired Whole Foods for over $12 billion, corresponding to a 9.94x
EBITDA multiple. The US-based retailer of natural and organic foods is the largest acquisition
of Amazon so far. This deal represents undoubtably Amazon’s strategy of shifting more towards
physical retailing.
In September 2018, Amazon was involved in its second healthcare deal, after acquiring
PillPack, a US-based pharmacy that fills, sorts and delivers clients medications, for over $750
million with the objective to crack in the pharmaceutical’s prescription market.
Amazon has also invested over $700 million on Rivian Automotive, along with other investors
including BlackRock and Soros Fund Management, a US-based developer of electric self-
driving trucks, which raised over $2.5 billion in a funding round. The company is currently
viewed as the future competitor of Tesla by some analysts. The objective of this venture is to
include the vehicles that are set to bet hitting the roads in 2021 in the future of Amazon’s
operations. In line with this strategy, Amazon acquired Zoox, in June 2020, for over $1.3
billion, a California-based developer of self-driving, zero emissions vehicles on ride-hailing
customers.
3.1.6. Financial analysis
Amazon’s cost structure has been quite stable in the past five years, being costs of sales, as
expected, the company’s main operating expense, representing about 62%, however this value
has been steadily decreasing from its 2015 value of 67%. This decline can be justified by the
increasingly diversified business segments the company has been developing.

Católica Lisbon SBE | MSc in Finance Thesis | Mergers & Acquisitions | 2020
- 29 -
The company’s historic cost structure is as follows:
Figure 3 – Amazon’s historic cost structure; adapted from Amazon’s annual reports
It is worth mentioning that the costs of sales as a percentage of total revenues has been
decreasing, meaning that the company has been able to maintain more capital for each dollar of
sales and can use to pay other costs or satisfy debt obligations. Historic cost of sales are as
follows:
Figure 4 - Amazon's historic cost of sales as a percentage of revenues; adapted from Amazon’s annual reports
In terms of depreciations and amortizations, its value has been increasing over the years, since
the company’s assets have increased as well, however assets increased by 38% from 2018 to
2019 and depreciations and amortizations have increased by only 19%.
104,773
131,801
173,760
220,466
265,981
0
50,000
100,000
150,000
200,000
250,000
300,000
2015 2016 2017 2018 2019
Cost of sales Fulfillment
Marketing Technology and content
General and administrative Other operating expenses
66.96%
64.91%
62.93%
59.75%
59.01%
58%
60%
62%
64%
66%
68%
2015 2016 2017 2018 2019
in millions USD

Amazon to become the undisputed retail champion? | Francisco Morais Correia
- 30 -
Amazon’s historic depreciations and amortisations are as follows:
Figure 5 - Amazon's historic depreciations and amortizations; adapted from Amazon’s annual reports
Capital expenditures are the funds used by a company to acquire, upgrade and maintain physical
assets such as property plants, buildings technology or equipment. Amazon’s Capex has been
increasing over the last five years and is highly related to Amazon’s strategy of increasing the
scope of its operations. Comparing Capex with sales, it can be observed that the company’s
decisions regarding these investments have a direct and positive relationship with the behaviour
of sales. Amazon’s historic Capex is as follows:
Figure 6 - Amazon's historic capital expenditures; adapted from Amazon’s annual reports
Amazon has been financing mainly through debt in the past five years, however, this value
has been decreasing when compared with its equity.
228
287
366
475
565
0
100
200
300
400
500
600
2015 2016 2017 2018 2019
5,387
7,804
11,95513,427
16,861
0
100,000
200,000
300,000
400,000
0
4,000
8,000
12,000
16,000
20,000
2015 2016 2017 2018 2019
Total revenues Capital Expenditures
in millions USD
in millions USD

Católica Lisbon SBE | MSc in Finance Thesis | Mergers & Acquisitions | 2020
- 31 -
Amazon’s historic capital structure is as follows:
Figure 7 - Amazon's historic capital structure; adapted from Amazon’s annual reports
The following figure represents Amazon’s net financial debt, which was negative in 2015 and
2018 has been increasing due to the firm’s financial debt superior growth rate when compared
with cash and cash equivalents growth rate. It important to reference that the right axis is the
scale of net financial debt, and the left axis is the scale for the remaining items:
Figure 8 - Amazon's historic net financial debt and cash and cash equivalents; adapted from Amazon’s annual
reports
79.3% 76.9% 78.9%73.2% 72.4%
20.7% 23.1% 21.1%26.8% 27.6%
50%
60%
70%
80%
90%
100%
2015 2016 2017 2018 2019
Total equity as a percentage of total assets
Total liabilities as a percentage of total assets
-5,395
-9,712
7,040
-132
22,52219,280
-20,000
-10,000
0
10,000
20,000
30,000
0
20,000
40,000
60,000
80,000
100,000
2015 2016 2017 2018 2019 3Q 2020
Total long-term financial debt Total short-term financial debt
Cash and cash equivalents Net financial debt
in millions USD

Amazon to become the undisputed retail champion? | Francisco Morais Correia
- 32 -
The following table provides key metrics and ratios of Amazon’s financial health, comparing
them with the industry median.
2015 2016 2017 2018 2019 Industry Median
Profitability
Gross Margin 33.0% 35.1% 37.1% 40.2% 41.0% 50.0%
EBITDA Margin 6.9% 8.0% 7.5% 10.7% 10.8% 5.3%
Operating Margin 2.1% 3.1% 2.3% 5.3% 5.2% 1.5%
Net Margin 0.6% 1.7% 1.7% 4.3% 4.1% (1.1%)
Earning Power
Asset Turnover 1.79 1.84 1.66 1.58 1.45 0.77
ROE 4.9% 14.5% 9.6% 27.8% 21.9% 6.5%
x Earnings Retention 1.00 1.00 1.00 1.00 1.00 1.00
Reinvestment Rate 4.9% 14.5% 9.6% 27.8% 21.9% 0.9%
Liquidity
Quick Ratio 0.75 0.78 0.76 0.85 0.86 1.08
Current Ratio 1.05 1.04 1.04 1.10 1.10 1.55
Leverage
Assets/Equity 4.8 4.3 4.7 3.7 3.6 2.23
Debt/Equity 3.8 3.3 3.7 2.7 2.6 0.12
% LT Debt to Total
Capital 51.4% 38.3% 52.8% 42.9% 39.0% 6.8%
Operating
A/R Turnover 19.0 19.4 16.5 15.6 15.1 13.5
Inv Turnover 7.7 8.1 8.1 8.4 8.8 9.1
ROIC 2.2% 7.0% 4.0% 11.8% 10.0% -
Table 2 - Amazon's historic key figures; from Thomson Reuters Eikon
It is important to highlight that Amazon’s EBITDA, operating and net margin are significantly
superior to the industry median. Amazon, unlike Target, has not payed any dividend;
reinvesting and paying debt obligations every single year. Amazon is also more levered than its
average industry peers. Amazon’s historical financials are available from appendix 9 to
appendix 11 and additional data on appendix 2.
3.1.7. SWOT analysis
Amazon’s SWOT analysis (available in appendix 6) was constructed in order to analyse
Amazon’s position within the industry how internal and external factors affect the company’s
performance.

Católica Lisbon SBE | MSc in Finance Thesis | Mergers & Acquisitions | 2020
- 33 -
3.2. Target company profile
3.2.1. Company overview
Target Corporation was founded in 1902 by George Dayton. Firstly named Dayton Company,
and later, in 1962-1975, John F. Geisse developed the concept of upscale discount retailing and
the first discount store was opened in Minnesota. In 1969, the company merged with J.L.
Hudson Company, becoming Dayton-Hudson Corporation. From 1982-1999 the company
focused on a nationwide expansion. In January 2000, the company changed its name to the
current one, since, at that time, 80% of the firm’s earnings came from Target, while the four
chains: Dayton’s, Hudson’s, Marshall Field’s and Mervyn’s were used to fuel the growth of the
discount chain. On October 2017, Target announced a new online order service, known as Drive
Up, which allowed costumers to order merchandise online for pickup outside the store.
Nowadays, Target Corporation is engaged in owning and operating discount stores. It offers
curated general merchandise and food assortments, including perishables, dry grocery, dairy
and frozen items (at discount).
3.2.2. Ownership
Target is a publicly traded company, traded in the New York Stock Exchange (NYSE) by the
ticker TGT and is a component of the S&P 100 and the S&P 500 indexes.
Target’s insider shareholders do not own a significant stake of the firm’s equity, owning 0.3%
of the firm, the largest of which is the current CEO and chairman, Brian Cornell, who has 0.1%
of the firm estimated to be worth $62.3 million.
On the other hand, Target’s institutional shareholders own a total of 83.8% of the firm. The
three largest institutional shareholders are the same as Amazon’s: The Vanguard Group with
8.4%, Ssga Funds Management with 8.1% and, finally, Blackrock with a 4.9% stake on the
firm.
3.2.3. Product and services portfolio
Target divides its business in five segments: beauty and household essentials; food and
beverages; apparel and accessories; home furnishings and décor business; and hardlines. This
topic is further developed in appendix 3.

Amazon to become the undisputed retail champion? | Francisco Morais Correia
- 34 -
Target’s revenues per business segment are as follows:
Figure 9 - Target's historic revenues by business segment; adapted from Target's annuals reports
The weights of each business segment have been relatively stable throughout the last five years.
It is important to mention that the revenues growth rate has been around 3.7% in the past two
years. Nonetheless, the first half of 2020 is an exception and Target announced a growth rate
of 18.2% in revenues, when compared with the same period of the previous year.
3.2.4. Geographical footprint
Employing over 350,000 people, Target has 1,880 stores and 42 distribution centers, all in the
US. The firm also has 6 offices across the country, including the corporate headquarters in
Minneapolis, Minnesota. It has one global capability centre in Bangalore, India and more than
a dozen sourcing offices globally. Since the firm only has stores in the US, all its revenues come
from that same country, but that was not always the case.
On January 2011, Target announced its expansion to Canada, by purchasing 220 stores of the
Canadian sale chain Zellers. However, there were several supply chain issues, which resulted
in a loss of $2.1 billion in the short life of the project. Inevitably, in 2015, the company closed
and liquidated all its Canadian outlets.
3.2.5. Recent developments
Target invested over $75 million between 2014 and 2019 in Casper Sleep, a New York City-
based e-commerce company that sells mattresses. Target tried to buy the business in that same
73,78569,495 72,714 75,356 78,112
0
20,000
40,000
60,000
80,000
100,000
2015 2016 2017 2018 2019
Beauty and household essentials Food and beverage
Apparel and accessories Home furnishings and décor
Hardlines Other
in millions USD

Católica Lisbon SBE | MSc in Finance Thesis | Mergers & Acquisitions | 2020
- 35 -
year for one billion dollars, but the bid was rejected. Nowadays, Casper’s products are available
in Target stores and on Target’s website.
In August 2017, Target bought Grand Junction, a US-based company which operates a
software-as-a-service technology platform for accessing and manging local deliveries, for an
undisclosed consideration. The acquisition formed as a part of the company’s strategy to
strengthen its supply chain and provide better speed, reliability and convenience for costumers.
In December 2017 Target acquired Shipt for $550 million, a US-based operator of online same-
day delivery platform, with the objective of speeding up its digital fulfilment efforts, aiming to
bring same-day delivery services to guests at approximately half of Target’s stores in early
2018. The acquisition would also enable Target to expand its network of stores. In line with this
strategy, earlier in the year, Target acquired Zettata, a US-based company that creates software
for e-commerce search.
Considering the last-mentioned acquisitions, Target’s revenues by channel (physical and
digital) are as follows:
Figure 10 - Target's historic revenues by channel; adapted from Target's annual reports
Even though the percentage of revenues coming from the company’s website has been
increasing, the number is still quite low when compared to its main competitors (mainly
Walmart, which has over 12% e-commerce revenues), demonstrating that the Target must
increase its investmente in order to be competitive in the online retail market.
3.2.6. Financial analysis
Target’s cost structure is quite simple, only cost of sales and SG&A make up the total operating
expenses. It has been stable over the last five years and overall total operating expenses’ yearly
growth has matched the revenues yearly growth.
96.6% 95.6% 94.5% 92.9% 91.2%
3.3% 4.4% 5.5% 7.1% 8.8%
80%
85%
90%
95%
100%
2015 2016 2017 2018 2019
Stores Digital

Amazon to become the undisputed retail champion? | Francisco Morais Correia
- 36 -
Figure 11 - Target’s historic cost structure; adapted from Target’s annual reports
Regarding cost of sales a percentage of revenues, its value has decreased from 2018 to 2019,
despite sales growing about 3.7%, meaning the company became more cost efficient. Historic
cost of sales as a percentage of revenues is as follows:
Figure 12 - Target's historic cost of sales as a percentage of revenues; adapted from Target’s annual reports
Depreciations and amortizations have increased about 6% from last year, despite total assets
growth being only 4%. Target’s historic depreciations are as follows:
Figure 13 - Target's historic depreciations and amortizations; adapted from Target’s annual reports
Target’s Capex has had a negative growth rate from 2018 to 2019 of 14%, meaning the
company has divested in its physical assets when compared with the previous year. Target’s
78.2% 78.6% 78.3% 77.2% 77.2%
66,66262,501 65,265
69,022 71,097
0
20,000
40,000
60,000
80,000
2015 2016 2017 2018 2019
Cost of sales SG&A
70.47%
70.72%
71.22%
71.61%
71.13%
70%
71%
71%
72%
72%
2015 2016 2017 2018 2019
2,213
2,045
2,225 2,224
2,357
1,900
2,100
2,300
2,500
2015 2016 2017 2018 2019
in millions USD
in millions USD

Católica Lisbon SBE | MSc in Finance Thesis | Mergers & Acquisitions | 2020
- 37 -
historic Capex are as follows (please notice that the left axis is the scale of the firm’s Capex
and that the right axis is the scale for the firm’s total revenues):
Figure 14 - Target's historic capital expenditures; adapted from Target’s annual reports
Target has been tending to finance more with debt in the past five years. Target’s historical
capital structure is as follows:
Figure 15 - Target's historic capital structure; adapted from Target’s annual reports
1,4381,547
2,533
3,516
3,027
64,000
66,000
68,000
70,000
72,000
74,000
76,000
78,000
80,000
0
500
1,000
1,500
2,000
2,500
3,000
3,500
4,000
2015 2016 2017 2018 2019
Total revenues Capital Expenditures
67.8% 70.7% 71.1% 72.6% 72.3%
32.2% 29.3% 28.9% 27.4% 27.7%
50%
60%
70%
80%
90%
100%
2015 2016 2017 2018 2019
Total equity as a percentage of total assets
Total liabilities as a percentage of total assets
in millions USD

Amazon to become the undisputed retail champion? | Francisco Morais Correia
- 38 -
The following figure shows that Target’s net financial debt has been stable over the past four
years, due to a stable financial debt and cash and cash equivalents:
Figure 16 - Target's historic net financial debt and cash and cash equivalents; adapted from Amazon’s annual
reports
The following table provides key metrics and ratios of Target’s financial health, comparing it
with the industry median:
2015 2016 2017 2018 2019
Industry
Median
Profitability
Gross Margin 29.5% 30.1% 29.7% 29.3% 29.8% 39.2%
EBITDA Margin 9.7% 10.3% 9.3% 8.9% 9.3% 9.5%
Operating Margin 7.5% 6.3% 5.6% 5.5% 6.0% 6.1%
Net Margin 4.5% 3.8% 3.5% 3.8% 4.2% 4.2%
Earning Power
Asset Turnover 1.81 1.81 1.87 1.85 1.86 1.48
ROE 24.6% 22.3% 22.7% 25.2% 28.3% 14.1%
x Earnings Retention 0.59 0.49 0.47 0.53 0.59 0.80
Reinvestment Rate 14.4% 10.9% 10.7% 13.5% 16.6% 13.9%
Liquidity
Quick Ratio 0.44 0.29 0.30 0.20 0.27 0.28
Current Ratio 1.12 0.94 0.96 0.83 0.89 1.20
Leverage
Assets/Equity 3.11 3.42 3.46 3.65 3.62 3.32
Debt/Equity 2.11 2.42 2.46 2.65 2.62 0.56
% LT Debt to Total
Capital 46.4% 46.5% 48.2% 45.3%
48.6% 18.0%
Operating
A/R Turnover 77.5 92.0 86.7 74.3 75.8 119.6
Inv Turnover 6.2 5.8 6.0 5.9 5.9 3.5
ROIC 12% 10% 10% 11% 12% - Table 3 - Target's historic key figures; from Thomson Reuters Eikon
7,593
10,248 9,948 9,842 9,9759,434
0
4,000
8,000
12,000
16,000
20,000
2015 2016 2017 2018 2019 3Q 2020
Total long-term financial debt Total short-term financial debt
Cash and cash equivalents Net financial debt
in millions USD
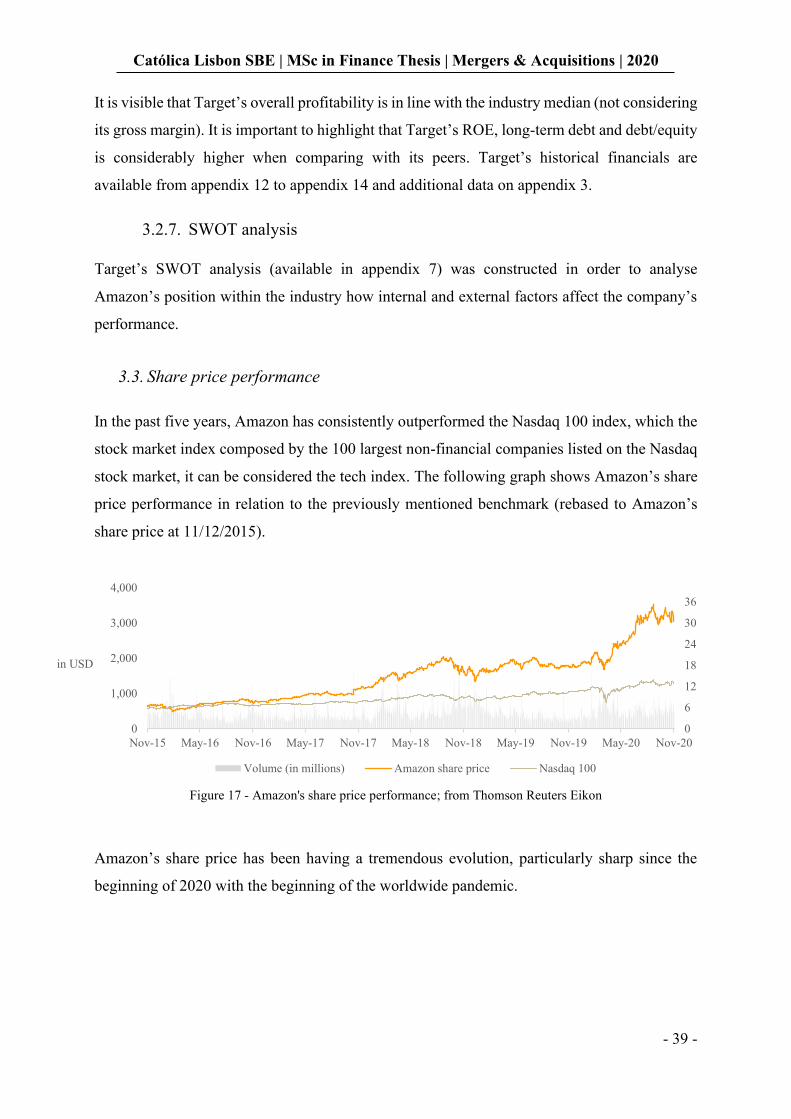
Católica Lisbon SBE | MSc in Finance Thesis | Mergers & Acquisitions | 2020
- 39 -
It is visible that Target’s overall profitability is in line with the industry median (not considering
its gross margin). It is important to highlight that Target’s ROE, long-term debt and debt/equity
is considerably higher when comparing with its peers. Target’s historical financials are
available from appendix 12 to appendix 14 and additional data on appendix 3.
3.2.7. SWOT analysis
Target’s SWOT analysis (available in appendix 7) was constructed in order to analyse
Amazon’s position within the industry how internal and external factors affect the company’s
performance.
3.3. Share price performance
In the past five years, Amazon has consistently outperformed the Nasdaq 100 index, which the
stock market index composed by the 100 largest non-financial companies listed on the Nasdaq
stock market, it can be considered the tech index. The following graph shows Amazon’s share
price performance in relation to the previously mentioned benchmark (rebased to Amazon’s
share price at 11/12/2015).
Figure 17 - Amazon's share price performance; from Thomson Reuters Eikon
Amazon’s share price has been having a tremendous evolution, particularly sharp since the
beginning of 2020 with the beginning of the worldwide pandemic.
in USD
0
6
12
18
24
30
36
0
1,000
2,000
3,000
4,000
Nov-15 May-16 Nov-16 May-17 Nov-17 May-18 Nov-18 May-19 Nov-19 May-20 Nov-20
Volume (in millions) Amazon share price Nasdaq 100

Amazon to become the undisputed retail champion? | Francisco Morais Correia
- 40 -
The following table shows Amazon’s five-year CAGR and price change of the previous year
Amazon Nasdaq 100
CAGR (5y) 36.1% 17.1%
Last year price change (%) 77.9% 22.1% Table 4 - Amazon's and Nasdaq 100 share price CAGR and last year price change
On the other hand, Target’s share price has been significantly outperformed by its benchmark,
the S&P 500, in August 2020, as follows
Figure 18 - Target's share price performance, adjusted to its dividend yield; from Thomson Reuters Eikon
Target’s five-year CAGR and price change of the previous year are presented in the following
table:
Target S&P 500
CAGR (5y) 16.3% 29.0%
Last year price change (%) 26.8% 25.6%
Table 5 - Target's and S&P 500 share price CAGR and last year price change
4. Industry Analysis
In this section of the dissertation, it is going to be performed an analysis of the industries of
Target Corporation and Amazon, which are not quite the same.
4.1. US Multiline retail
4.1.1. Industry overview
According to the global industry classification standard (GICS) Target Corporation operates in
the consumer discretionary sector, in the retailing industry group. The firm operates on the
multiline retail industry, that is, the retail industry as a whole, since it sells its products both
in USD
0
6
12
18
24
30
36
42
48
54
60
0
40
80
120
160
200
240
280
320
Nov-15 May-16 Nov-16 May-17 Nov-17 May-18 Nov-18 May-19 Nov-19 May-20 Nov-20
Volume (in millions) S&P 500 Target Corporation share price

Católica Lisbon SBE | MSc in Finance Thesis | Mergers & Acquisitions | 2020
- 41 -
through its stores and digital channels (from now on referred as only retail industry), since its
earnings are clearly more dependent on its physical stores, associated with the traditional retail
industry.
4.1.2. Market size and segmentation
The multiline retail industry can be subdivided according to geography, product segments or
channel.
The whole retail industry is divided geographically, according to its value, below:
Figure 19 - Whole retail industry geographical segmentation; adapted from MarketLine (2019)
Since the totality of Target’s revenues comes from US, the focus of this industry analysis will
be on the US retail industry. The US multiline retail industry can be divided into product
categories value, as follows
Figure 20 – US multiline retail industry segmented by product category; adapted from MarketLine (2019)
46%
30%
22%
3%
Asia-Pacific Americas Europe MEA
54%
18%
9%
9%
6%
5%
Food and groceries Home products
Food service Apparel
Consumer electrics Furniture
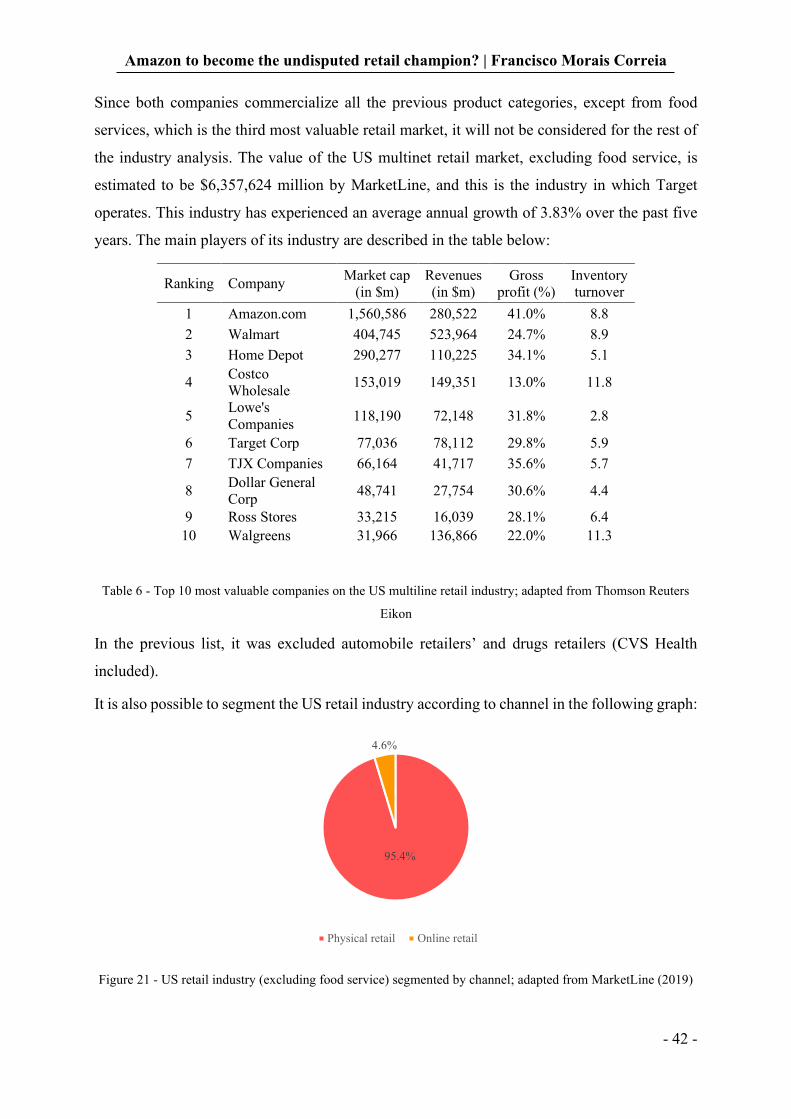
Amazon to become the undisputed retail champion? | Francisco Morais Correia
- 42 -
Since both companies commercialize all the previous product categories, except from food
services, which is the third most valuable retail market, it will not be considered for the rest of
the industry analysis. The value of the US multinet retail market, excluding food service, is
estimated to be $6,357,624 million by MarketLine, and this is the industry in which Target
operates. This industry has experienced an average annual growth of 3.83% over the past five
years. The main players of its industry are described in the table below:
Ranking Company Market cap
(in $m)
Revenues
(in $m)
Gross
profit (%)
Inventory
turnover
1 Amazon.com 1,560,586 280,522 41.0% 8.8
2 Walmart 404,745 523,964 24.7% 8.9
3 Home Depot 290,277 110,225 34.1% 5.1
4 Costco
Wholesale 153,019 149,351 13.0% 11.8
5 Lowe's
Companies 118,190 72,148 31.8% 2.8
6 Target Corp 77,036 78,112 29.8% 5.9
7 TJX Companies 66,164 41,717 35.6% 5.7
8 Dollar General
Corp 48,741 27,754 30.6% 4.4
9 Ross Stores 33,215 16,039 28.1% 6.4
10 Walgreens 31,966 136,866 22.0% 11.3
Table 6 - Top 10 most valuable companies on the US multiline retail industry; adapted from Thomson Reuters
Eikon
In the previous list, it was excluded automobile retailers’ and drugs retailers (CVS Health
included).
It is also possible to segment the US retail industry according to channel in the following graph:
Figure 21 - US retail industry (excluding food service) segmented by channel; adapted from MarketLine (2019)
95.4%
4.6%
Physical retail Online retail

Católica Lisbon SBE | MSc in Finance Thesis | Mergers & Acquisitions | 2020
- 43 -
4.1.3. Porter’s five forces
The Porter’s five forces analysis is important to understand the forces that shape competition
within an industry. This analysis was performed solely for the target’s industry, since it is the
industry in which Amazon is expected to enter (available on appendix 8).
4.1.4. Main drivers and trends
According to Deloitte 2020 retail industry report, 2019 was a year in transition. There was
stability in the position of the previously mentioned top five retailers but uncertainty regarding
the majority and few noticeable bankruptcies.
With the convergence of supply chain, digital technologies, and other innovations, including
contactless payment methods for instance, convenience is becoming a much more important
piece of the equation (Deloitte, 2019).
The main drivers of the US retail industry are the following
1. Economic growth, the increase in disposable income due to the economic growth,
especially in the past four years
2. Demographics, millennials are now the largest adult generation in the US
3. Urbanization, as more people move to urban areas and spend longer hour at work, they
require products which make life easier for them
4. Credit availability, whose availability spurs a proportional growth in spend
5. Supply chain,
The increase in digital touchpoints requires an understanding of consumer preferences for
different platforms and applications (e.g., emails, websites, blogs, discussion forums, videos,
search engines, mobile apps, Facebook, and Twitter) (Nizar Souiden et. al, 2019).
Francisco Paredes and Marisela Rodríguez (2016) concluded that technology-based resources
can contribute to improving interactions between the store and its customers, supporting the
latter to make decisions about purchases.
Retail companies are also facing new challenges with an increasingly intensified competition
due to the accelerated pace of technological change, more sophisticated management practices
and industry consolidation. This resulted on shifting of focus in retail companies from not only
boosting sales but also to innovative to attract new customers.

Amazon to become the undisputed retail champion? | Francisco Morais Correia
- 44 -
4.1.5. Growth projections
The US retail industry is expected to grow 3.83% in 2020, 3.77% in 2021 and 9.21% by 2022.
The following figured represents the industry growth projections per business segments:
Figure 22 - US retail industry (excluding food service) expected growth; adapted from MarketLine (2019)
The segment which is expected to grow the most is home and garden products, but the overall
growth is derived the online stores channel and not by physical stores.
4.2. Global online retail
4.2.1. Industry overview
It is not easy to attribute Amazon to a single industry due to variety of business segments of the
company, but according to the GICS, is the internet and direct marketing retail, part of the
retailing industry group, which is under the consumer discretionary sector. Stating that Amazon
operates under the consumer discretionary sector can be criticized since the company does
considerably more than that, being also one of the biggest players on the technology sector,
from producing electronics, including tablets, e-readers, smartphones and portable speakers, to
providing AI assistance, digital streaming and cloud computing, through AWS, the premise
that Amazon is a technology company has strong arguments. Many analysts claim that the
reason behind this discussion has its genesis on an outdated industry classification system such
as GICS, which does not include the e-commerce and online retailing industry under the
technology sector.
0
2,000,000
4,000,000
6,000,000
8,000,000
2014 2015 2016 2017 2018 2019 2020e 2021e 2022e
Food and groceries Home and garden products Apparel
Consumer electrics Furniture
in millions USD

Católica Lisbon SBE | MSc in Finance Thesis | Mergers & Acquisitions | 2020
- 45 -
Amazon, similarly, to Target Corporation, thus, operates in the consumer discretionary sector,
in the retailing industry group as well. Amazon operates on the internet and marketing retail
industry (from now on referred as online retailing industry or simply e-commerce), a
subcategory on the previously mentioned retail industry.
4.2.2. Market size and segmentation
Even tough Amazon’s products are available in all continents, 70% of its revenues come from
the US. The company actively stated the desire to be more present outside of the US and
compete globally, especially in Asia, therefore, it is important to understand the global online
retail geographical breakdown, which is as follows:
Figure 23 - Online retail industry segmented by geography; adapted from MarketLine (2019)
The main players in the worldwide retail industry are presented in the following table, as
follows:
Rankin
g Company
Market cap
(in $m)
Revenues
(in $m)
Gross
profit (%)
Inventory
turnover Country
1 Amazon.com 1,703,123 280,522 41.0% 8.8 US
2 Alibaba 761,339 73,184 45.1% 23.9 China
3 JD.com 123,491 83,516 14.9% 9.7 China
4 Wayfair 24,891 9,127 19.6% 136 US
5 Ocado 23,289 2,235 34% 21.3 UK
6 ETSY 13,369 818 66.9% - US
7 B2W 10,797 1,715 29.7% 5.2 Brazil
8 MonotaRO 9,950 1,206 28.2% 8.8 Japan
9 ZOZO 8,323 1,155 90.6% 3.1 Japan
10 ASOS 6,094 3,502 48.8% 3 UK
Table 7 - Top 10 most valuable companies on the global online retail industry; adapted from Thomson Reuters
Eikon
42%
34%
24%
0.01%
Asia-Pacific Americas Europe MEA
Amazon to become the undisputed retail champion? | Francisco Morais Correia
- 46 -
As previously mentioned, for industry analysis purposes, there is going to be a focus on
Amazon’s online retail segment due to the high diversity of Amazon’s product and services
portfolio. Amazon’s online stores segment’s market in the US is $308,917 million, which is
4.6% of the overall US retail industry, excluding food service (online retail portion of the US’s
multiline retail). It was not possible to retrieve the same type of segmentation for the global
retail industry, but it is possible to assume it sits well below the US’s 4.6%, since it is one of
the pioneers regarding e-commerce, largely due to Amazon. This assumption can be supported
by the fact that the US accounts for 93.9% of the North America online retail sector value.
4.2.3. Main drivers and trends
The development of the internet and its related technology has led to a tremendous increase in
e-commerce. The contemporary online retail is characterized by the extensive use of mobile
technologies and high connectivity.
There is quite an overlap regarding the main drivers and trends of the online retail industry and
the US multiline retail industry. Even tough, some specific drivers of the recent e-commerce
growth are the following:
1. Third party logistics, which play a critical role in the creation of visibility in the online
retail supply chain; since most online retailers are finding it financially feasible to
outsource the logistics component of the supply chain given its complex and capital-
intensive nature.
2. Mobile internet penetration explosive growth, that now reaches almost 5 billion people;
together with the increase in disposable income, have been two of the main drivers of
the recent online retail growth.
3. Increased political willingness for the promotion of e-commerce. In 2016 there was an
overall lowering of customs, clearance procedures and other procedures which usually
increased the delivery time, especially in emerging markets. This led to an increase of
online retailers’ shipments to emerging markets.
4. Growth of big data analytics, since there is a high correlation between quality service
and strong analytics of customers’ needs.
4.2.4. Growth projections
The North American online retail sector has grown impressively in the historic period, with
strong growth forecast to continue in the coming years. The sector includes a variety of online

Católica Lisbon SBE | MSc in Finance Thesis | Mergers & Acquisitions | 2020
- 47 -
pureplay retailers, as well as firms which offer ecommerce as part of a multi-channel business
model. The largest player is Amazon, which commands significant market share; other leading
players include Walmart, The Home Depot and even Apple. Some firms offer a wide range of
products, whereas others specialize within a certain segment, providing trusted and high-quality
products. The sector is highly competitive with numerous other large firms contesting for
leading player status and a vast array of smaller firms providing additional online platforms.
The historical growth of the online retail industry in the US (around a 11% yearly) is expected
to slightly decrease for the upcoming three years (to around 8% per year). This growth rate is
slightly higher to the one forecasted for the US physical retail industry (around 5% yearly), thus
leading to increase of the online retail industry value when compared with physical retail’s,
from the current 4.6% to 5% in 2022, as follows:
Figure 24 - Historical and forecasted US online retail industry segmentation by channel; adapted from
MarketLine (2019)
The global online retail sector has experienced very strong double-digit growth in the historic
period and is expected to continue in the upcoming years, globally, albeit at a decelerated rate
as the sector matures. It expected to grow 15.2% until 2020, then 14.2% for 2021 and decrease
to an 8.3% growth rate for 2022.
0
2,000,000
4,000,000
6,000,000
8,000,000
2014 2015 2016 2017 2018 2019 2020e 2021e 2022e
Physical retail Online retail
in millions USD

Amazon to become the undisputed retail champion? | Francisco Morais Correia
- 48 -
The global online retail value is expected to grow as follows:
Figure 25 - Historical and forecasted global online retail industry segmentation by product segment; adapted
from MarketLine (2019)
The consumer electronics was the most lucrative segment, even though its importance is
decreasing when compared to the other product categories (39% in 2014, to 36% in 2019 and a
forecasted 35% in 2022).
5. Deal Rationale
In this section of the dissertation, the proposed deal rationale, motivations and underlying
assumptions will be exposed.
In the past two decades, Amazon has become, undoubtedly, the largest tech company acting in
the online retailing market in the world. But, in the past few years, some of its market share, in
the United States, has been shared increasingly more with Walmart, a company which
specialists point as Amazon's main competitor.
Walmart owns more than 5,400 retail stores in the United States being crowned the biggest
traditional physical retail company in the country. More recently, with the acquisition of
Jet.com in 2016 for $3.3 billion, Walmart was able to significantly scale up its online sales and
to place themselves as a big player in online retail market. In the first six months of 2020,
Walmart’s e-commerce revenue was reported to increase 97%, in comparison to the same
quarter last year. Although these numbers were largely fueled by the Covid-19 pandemic, which
0
400,000
800,000
1,200,000
1,600,000
2,000,000
2014 2015 2016 2017 2018 2019 2020e 2021e 2022e
Consumer electronics Apparel Food and groceries
Home and garden products Furniture
in millions USD
Católica Lisbon SBE | MSc in Finance Thesis | Mergers & Acquisitions | 2020
- 49 -
shifted a lot of consumers to use the online methods instead of doing presential shopping,
changing consumer habits probably not only for the short-run, this shows how Walmart’s online
business is not slowing down.
One of the driving forces behind Walmart’s constant growth is the online grocery orders, an
area of the market where Walmart competes in a league of its own and where it has already a
big logistics infrastructure in place, with more than 3,300 grocery pickup locations and more
than 1,400 thousand same-day grocery delivery locations around the country. More recently, it
has been reported that Walmart is on its way to release a direct competitor to Amazon Prime,
the Walmart +, a subscription program that offers special discounts and promotions to their
subscribers.
In terms of retail, Amazon deeply betting it all on the online retail market and the grocery retail
is where Walmart differentiates itself from the big tech online retailer. Without any real
presence on the grocery retail market before, Amazon made its first real step with the
acquisition of Whole Foods. Even with the acquisition of Whole Foods there is still a large gap
between Walmart and Amazon in terms of number of stores and presence in the country.
Having all of this in mind, Target was rumored, back in 2018, as a possible next step for
Amazon.
Target could present a good move towards stealing market cap to Walmart because of its
national presence and its place on the grocery retail market but also, it would make it possible
for Amazon to expand even more its presence with the installation of delivery lockers on Target
stores as well as pushing Amazon Prime like it was done with Whole Foods. These synergies
can possibly become a major competitive advantage to Amazon.
6. Valuation
In this section of the dissertation, the companies will be valued according to two main valuation
models, which described and explained in the literature review, the discounted cash flow model
(DCF) using the WACC and FCFF approach and the relative valuation model (using the
comparable companies multiples and the comparable transactions multiples approach
specifically for Target).

Amazon to become the undisputed retail champion? | Francisco Morais Correia
- 50 -
6.1. Amazon valuation
6.1.1. Discounted cash flow valuation
6.1.1.1. Financial forecasts
In order to estimate the intrinsic value of a firm, one must forecast a company’s income
statement and cash flow statement. It is going to be forecasted seven financial years, due the
high growth recently experienced by the company, mainly in the first quarter of this year. As
expected, most of the items in a retail company’s financials are driven by its revenues, a
relationship also visible on Amazon’s historical financials as well.
In order to forecast Amazon’s revenues, it was performed a forecast for each business segment
of the company. The main insights used for forecasting Amazon’s revenues were company’s
guidance and outlook included on its 2019 annual report and 3Q 20120 earnings release and
industry specific benchmarks. Regarding Amazon’s guidance, it was used specifically the
firm’s forecasted short-term revenues growth rate and the continuity of the historical trends
regarding the weight of each business segment’s revenues as a percentage of total revenues).
Regarding industry specific benchmarks, it was established a pattern between the benchmarks
(historical and forecasted by MarketLine) growth rates and each business segment revenues.
Online stores revenues and third-party seller services revenues were agglomerated into a single
category: “e-commerce revenues” and the benchmark used was the US online retail industry
value. It is expected that these two business units contribute less to Amazon’s total revenues in
the future, a trend visible in the past five years.
The benchmark used to estimate AWS’s revenues was the US cloud computing industry value.
This industry is also expected to increase in importance when compared to the total of
Amazon’s revenues, following the recent past trend and the optimistic growth rate of the
industry in the country. Using the same reasoning and insights, the remaining benchmarks used
were the number of Amazon Prime users for the subscription services business segments and
the US physical retail industry value for Amazon’s physical stores business segments revenues
forecast.
The forecasting scenario is considered an optimistic and likely scenario, assuming that the
firm’s next two year’s (2020 and 2021) revenues growth is derived by the momentum the 2019
as 2018’s high growth rates and overall industry not showing any signs of slowing down.

Católica Lisbon SBE | MSc in Finance Thesis | Mergers & Acquisitions | 2020
- 51 -
Cost of sales as a percentage of revenues is expected to continue the historical declining trend
verified on the company profile. Therefore, this percentage decrease is assumed be
incrementally smaller by-the-year, tending to a value of 55% in 2026.
Analysing SG&A as a percentage of gross profit, it is possible to analyse an historical
stabilization of around 87%, therefore, for the forecasting period it was assumed that operating
expenses would maintain that same proportion when compared with gross profit. Since the
value of each operating cost (excluding cost of sales) as a percentage of total operating expenses
was extremely stable, the cost mix was calculated based on the five-year average of cost
structure mix. Depreciations and amortizations were forecasted as a function of capital
expenditure, which was forecasted according to the firm’s guidance.
Amazon’s revenues forecast is available on appendix 15 and its forecasted income statement
on appendix 16. The following figure summarizes the forecast of Amazon’s main financial
items, in the context of a FCFF DCF model:
Forecast summary 2020 2021 2022 2023 2024 2025 2026
Revenues 356,989 443,764 527,659 610,958 699,860 789,502 877,760
Depreciations and
amortizations 26,514 31,669 36,825 41,980 47,136 52,291 57,447
Changes in working
capital (3,437) (4,535) (5,633) (6,731) (7,829) (8,927) (10,025)
Capital expenditures (20,206) (23,390) (26,575) (29,759) (32,944) (36,128) (39,312)
FCFF 17,801 22,686 27,524 32,498 37,644 42,868 48,036
Table 8 - Amazon's forecast summary, values in millions USD
6.1.1.2. Weighted average cost of capital
The WACC used was 7.28%, which was calculated according to the following components
Rf 3.18%
Beta 0.820
Market risk
premium 5.50%
Re 7.69%
Rd 0.63%
Net debt to EV 5.63%
Equity to EV 94.37%
Tax rate 27%
WACC 7.28%
Table 9 - WACC computation for Amazon

Amazon to become the undisputed retail champion? | Francisco Morais Correia
- 52 -
The risk-free rate used was the US’s 10-year treasury bond yield and the corporate tax rate
applicable was fixed at 27% (KPMG, 2020). The market risk premium was assumed to be
5.50%.
Regarding the beta computation (available on appendix 17), it was used the 5-year monthly
levered beta, retrieved from Thomson Reuters, which was unlevered according to the Target’s
capital structure according to equation 6 (in appendix 1) and adjusted according to equation 7
(in appendix 1).
The cost of debt was selected via table 14 (in appendix 1), since the interest coverage ratio of
the company is superior to 8.50.
6.1.1.3. Free cash flow to the firm
The FCFF estimations and WACC-based DCF model are in appendix 18. The company was
assumed to reach a steady growth rate of 4% in 2026. The DCF model performed lead to a
valuation of $1,620,027.
After performing the bridge from enterprise to equity value, where it was added financial debt,
subtracted cash and marketable securities and added minority interests, it was possible to
conclude that, according to this model, the company was considered to be undervalued by
3.81%.
6.1.1.4. Sensitivity analysis
7.24% 7.26% 7.28% 7.30% 7.32%
3.60% 1,481,965 1,474,628 1,467,370 1,460,190 1,453,086
3.80% 1,556,372 1,548,188 1,540,096 1,532,096 1,524,185
4.00% 1,639,966 1,630,773 1,620,027 1,612,718 1,603,851
4.20% 1,734,559 1,724,154 1,713,882 1,703,742 1,693,731
4.40% 1,842,475 1,830,595 1,818,878 1,807,322 1,795,923
Table 10 - Amazon's sensitivity analysis
Perpetuity growth rate (%)
WACC (%)

Católica Lisbon SBE | MSc in Finance Thesis | Mergers & Acquisitions | 2020
- 53 -
6.1.2. Relative valuation
6.1.2.1. Peer group
The peer group were selected according to each of the business segments of Amazon and the
main criteria was to choose only publicly traded companies. As performed on the discounted
cash flow model, the business segments online stores and third-party seller services were
aggregated and named e-commerce. The peers chosen for this business segments were no
focused in geography, but rather in size (eBay was chosen specifically to be the peer to third-
party seller services). For the AWS business group, it was chosen the largest tech companies in
the US which provided cloud computing solutions. Netflix was chosen as the peer of Amazon’s
subscription services business segment, since it is the market leader in the entertainment
streaming industry. Finally, in order to choose peers to Amazon’s physical stores segments, it
was chosen three of the main multiline retailers in the US.
6.1.2.2. Trading multiples valuation
The multiples chosen were EV/Sales, EV/EBITDA, EV/EBIT and PER. The computation of
the multiples is presented in appendix 19.
It was performed a forward-looking weighted average of the multiples, according to the
forecasted 6-year average business segments revenues as percentage of total revenues as
previously forecasted on the discounted cash model, in order to incorporate the company’s
trends regarding its revenue structure. The exception was the EV/EBITDA multiples, whose
weighted average was based on the 6-year average forecasted EBITDA weights per business
segment.
It is possible to conclude that according to this valuation, Amazon is slightly undervalued when
compared with its peers, in line with what was concluded from the DCF model, since its share
price can range from $3,004.48 to $3,322.00.
6.2. Target valuation
6.2.1. Discounted cash flow model
Similarly to what was performed with Amazon, in this section, it is going to be forecasted the
income statement, and specific balance sheet and cash flow statement item of Target
Corporation, in order to perform the valuation same valuation methods. Being an almost fully

Amazon to become the undisputed retail champion? | Francisco Morais Correia
- 54 -
“physical” retail company, the large majority of the firm’s financial have a high correlation
with its revenues.
Target’s revenues were also forecasted separately by business segment. The short-term growth
rates used to forecast revenues were given by company’s guidance and outlook statement
present in its 2019 annual report and 2020 Q3 earnings release. For the remaining forecasting
period (until 2026 for consistency purposes) it was used the historical and forecasted US
industry-specific benchmarks (previously used in the industry analysis) to estimate revenues.
Target’s cost of sales as a percentage of total revenues have been historically stable, so it is safe
to assume a smooth and stable tendency to 70% in 2026, which is the five-year average.
The same rationale was applied to SG&A costs, which were assumed to be 22% of operating
expenses (five year-average). Depreciations and amortizations were forecasted as function of
capital expenditures, which were forecasted according to Target’s guidance.
Working capital items were assumed to maintain the same proportion of total revenues. Target’s
revenue forecast in included in appendix 20 and its forecasted income statement in appendix
21. The following figure summarizes the forecast of Target’s main financial items, in the
context of a FCFF DCF model:
Forecast summary 2020 2021 2022 2023 2024 2025 2026
Revenues 81,083 83,763 86,068 87,121 87,636 87,948 88,124
Depreciations and
amortizations 2,743 2,860 2,957 3,001 3,024 3,040 3,046
Changes in
working capital 927 967 999 1,014 1,022 1,027 1,029
Capital
expenditures (3,189) (3,351) (3,513) (3,675) (3,838) (4,000) (4,162)
FCFF 4,332 4,849 5,257 5,321 5,240 5,104 4,923
Table 11 - Target's forecast summary, values in millions USD

Católica Lisbon SBE | MSc in Finance Thesis | Mergers & Acquisitions | 2020
- 55 -
6.2.1.1. Weighted average cost of capital
To calculate the WACC, the proxy to the risk-free rate was the 10-year U.S. treasury bond yield,
retrieved from Thomson Reuters. The market risk premium was set at 5.50%. The WACC used
was 8.29%.
Rf 3.18%
Beta 0.983
Market risk premium 5.50%
Re 8.58%
Rd 0.63%
Net debt to EV 3.67%
Equity to EV 96.33%
Tax rate 27%
WACC 8.29%
Table 12 - WACC computation for Target
Regarding the Beta computation, it was used the 5-year monthly levered beta, retrieved from
Thomson Reuters, which was unlevered according to the Target’s capital structure according
to equation 6 in appendix 1 and adjusted according to equation 7 in appendix 1. The beta
computation is available on appendix 22. Applying the CAPM formula (equation 3 in appendix
1), it was reached a cost of equity of 8.58%. The cost of debt was selected via table 14 (in
appendix 1) since the interest coverage ratio of the company is superior to 8.50.
6.2.1.2. Free cash flow to the firm
The FCFF estimations and WACC-based DCF are in appendix 23. The company was assumed
to reach a steady growth rate of 0.5% in 2026. The DCF model performed lead to a valuation
of $88,863, meaning that the company is slightly overvalued by the market.
After performing the bridge from enterprise to equity value, where it was added financial debt,
subtracted cash and marketable securities and added minority interests, it was possible to
conclude that, according to this model, the company was considered to be overvalued by
11.24%.

Amazon to become the undisputed retail champion? | Francisco Morais Correia
- 56 -
6.2.1.3. Sensitivity analysis
8.25% 8.27% 8.29% 8.31% 8.33%
0.10% 86,376 86,246 86,116 85,987 85,859
0.30% 87,643 87,579 87,443 87,307 87,172
0.50% 89,125 88,981 88,863 88,695 88,863
0.70% 90,608 90,457 90,306 90,155 90,006
0.90% 92,173 92,013 91,853 91,695 91,537
Table 13 - Target's sensitivity analysis
6.2.2. Relative valuation
6.2.2.1. Peer group
The peer group were selected consist on the main US multiline retailers, some of which are
present in Amazon’s physical stores business segment’s peers.
6.2.2.2. Trading multiples valuation
The multiples chosen were the same as Amazon’s and the computation in available on appendix
24.
Based on this model, it the minimum share price for Target should be range from $159.41 to
$168.54, meaning that it is easily concluded that the results are aligned with the DCF performed
and that Target is slightly undervalued when compared with its peers.
6.2.2.3. Transaction multiples valuation
In order to have a more completed understanding of Target’s valuation and understand the
average acquisition premiums used in this type of deals, it was performed a transaction
multiples valuation, available on appendix 25.
Based on this computation the share price of Target can range from $150.18 to a maximum of
$173.61, meaning that the company is slightly overvalued, when compared to past transactions
evolving similar companies, results which are aligned with the trading multiple valuation
model.
WACC (%)
Perpetuity growth rate (%)

Católica Lisbon SBE | MSc in Finance Thesis | Mergers & Acquisitions | 2020
- 57 -
6.3. Valuation summary
The following two figures are a visual representation of the valuation techniques used to value
both companies and show the median of the share prices for each valuation.
The share prices maximum and minimum reflect the share prices range of the last 15 trading
days of the analysed period (i.e. between 22/10/2020 and 11/12/2020) and the value in the
centre of the box plot is the current share price (at 11/12/2020).
The DCF minimum and maximum were defined based on the first-degree sensitivity analysis
presented in tables 10 and 13, and the value in the centre is the output of the valuation model.
The trading and transaction multiples maximums and minimums refer to the highest and lowest
valuation points of each of the combined multiples valuation, being the centre value the median.
Figure 26 - Amazon's valuation football field
3,397.94
3,228.75
3,011.28
2,400 2,600 2,800 3,000 3,200 3,400 3,600
Trading multiples
DCF
Share Price
Share price in USD
USD
3,004.48
3,322.00
3,436.27
3,053.50
3,315.33
|
3,465.22

Amazon to become the undisputed retail champion? | Francisco Morais Correia
- 58 -
Figure 27 - Target's valuation football field
7. Synergies Valuation
7.1. Introduction
Even tough synergies are not the main motivation behind the proposed transaction, which is
clearly more related with market power, there are clearly significant synergies. The main
synergy driver is expected to be revenues, even though cost savings also play an important role,
due to Target’s strong supply chain.
According to Damodaran (2005), the integration of two firms is an ongoing process and,
therefore, synergies hardly ever manifest instantly. Thus, it is assumed that 2020 does not bear
any synergies, and that they gradually increase from 2021 until 2023, reaching its full potential
in 2024 (under the assumption that the transaction in settled in 2020.
7.2. Operating synergies
Synergies calculations are present on appendix 27. Target’s revenues were divided according
to channel and its online revenues were included in Amazon’s online stores business segment
and its physical revenues included in Amazon’s physical stores business segment. The merged
entity’s revenues synergies come from these two business segments.
153.38
165.88
177.46
159.53
100 110 120 130 140 150 160 170 180 190
Transaction multiples
Trading multiples
DCF
Share Price
Share price in USD
152.22
|
163.29
|
173.00
|
180.64
|
159.41
|
168.54
|
150.18
|
173.61
|

Católica Lisbon SBE | MSc in Finance Thesis | Mergers & Acquisitions | 2020
- 59 -
Regarding online stores synergies, it’s expected that Target’s product, once sold solely
physically, to be included in Amazon’s websites, therefore easily available to online consumers.
The same rationale can be applied to Amazon’s most popular and signature products, which be
taken to physical stores and, therefore, being accessible to physical retail consumers.
The main costs synergies are related with fulfilment costs, which include several warehousing
expenses, namely storage, packing and shipping costs. Marketing and S&G costs present
significant synergies as well, since it will be expected to be an absorption integration these types
of division are expected to be integrated.
In conclusion, expected synergies are rather optimistic, similarly to what Amazon stated when
acquired Whole Foods in 2017. The present value of synergies are as follows:
Figure 28 - Present value of synergies
7.3. Financial synergies
Being aware that Amazon and Target have enough cash reserves to fund their own projects and
assuming that bot are under an optimal capital structure, it is expected that the borrowing
capacity of the combined entity may suffer a possible cost of debt.
In respects to tax benefits, they were assumed to be of small significance, since both companies
are headquartered in the US, since Target’s only operates in the US and almost 70% of
Amazon’s come from the same country. The combined entity’s DCF model without synergies
can be found on appendix 26 and the combined entity’s DCF model with synergies is on
appendix 27.
in millions USD
23,199
10,090
2,7981,933 1,274
0
5,000
10,000
15,000
20,000
25,000
Revenues
synergies
Cost of sales
synergies
Fulfillment
costs synergies
Marketing
costs synergies
SG&A costs
synergies
Amazon to become the undisputed retail champion? | Francisco Morais Correia
- 60 -
8. Transaction Details
8.1. Takeover approach
The prospective deal would be a friendly takeover, with a proposal to Target’s board members.
This approach is appealing for both firms because a hostile takeover attempt is often costly;
also, Amazon has historical evidence of undertaking an all-cash deal and paying an above
average acquisition premium for a company in the physical retail industry (Whole Foods 2017,
27% premium).
8.2. Transaction premium
In order to perform a premium analysis, it is important to understand this process is a
negotiation, therefore, it expected for Amazon to make an initial bid lower than the maximum
that it is willing to pay, but competitive enough in order to solidify the status as a friendly
takeover, and possibly avoiding an auction process evolving other companies, which would
probably drive the premium to higher values, but not over Amazon’s maximum premium that
it was willing to pay.
Considering that the expected net synergies of the deal represent 46.8% of Target’s market
capitalization, that is the upper bound limit for premium which Amazon is willing to pay, since
that any premium above that value would mean that Amazon shareholders would not capture
the synergies of the deal.
The most similar, as well as largest, acquisition deal made by Amazon was the Whole Foods
acquisition, in which it was payed a 27% premium, which is the value that will be assumed a
for the transaction. This value is quite high when compared to the industry average, following
the historical trend of Amazon to pay above-average premiums. A 27% premium is also
justified by the optimistic expected synergies and by the fact that Target is considered
undervalued.
All in all, this value will likely be accepted by Target’s shareholders and accounts for a small
discount considering that it would be a friendly takeover approach. Therefore, the price
expected to be paid is $202.60 per share (27% over the actual share price in the 11th of
December 2020), amounting to a total $21,569 million as the acquisition premium.

Católica Lisbon SBE | MSc in Finance Thesis | Mergers & Acquisitions | 2020
- 61 -
8.3. Transaction fees and integration costs
Transaction fees, in the context of M&A, can be defined as legal, advisory and intermediation
services in a deal. By analysing the transaction fees in the Whole Foods acquisition, which were
estimated to have totalled $74 million, it is assumed that the proposed deal transaction fees total
$518 million (in present value), since the deal is approximately seven times larger.
Integration costs, which in this case include fulfilment operations, IT systems, workforce
adjustments, knowledge transfer and overall supply chain optimizations, are assumed to be 2%
of Target’s Corporation’s enterprise value, which totals at $1,407 million.
Accounting for these values, it is possible to conclude that net synergies total $37,369 million,
as follows:
Figure 29 – Present value of net synergies
In conclusion, both companies were valued separately and then as a combined entity, using the
WACC-based DCF model and multiples valuation techniques, available on the following figure
which represents the enterprise value of each entity juxtaposed to its NFD (values in million
USD):
23,199
10,090
2,7981,933
1,274(518) (1,407)
(5,000)
0
5,000
10,000
15,000
20,000
25,000
Revenues
synergies
Cost of sales
synergies
Fulfillment
costs
synergies
Marketing
costs
synergies
SG&A costs
synergies
Transaction
fees
Integration
costs
in millions USD

Amazon to become the undisputed retail champion? | Francisco Morais Correia
- 62 -
Figure 30 - Valuation summary
8.4. Financing
Amazon proposed bid is $101,455 million, which accounts for a 27% premium over the market
value of Target Corporation at the 11th of December 2020. Amazon has a strong history of all-
cash deals, in order to signal the market that it is confident on the success of the deal and because
it has the liquidity to do so. However, due to the tremendous size of the proposed transaction,
that would not be possible with the current cash reserves of the company (which totalled
$71,391 million) without resorting to debt, therefore it proposed an all-cash deal, but financed
60% through the firm’s cash reserves and 40% through debt. The all-cash deal seems likely in
the sense that Target Corporation is considered undervalued from a trading and transaction
multiples valuation point of view.
Even though friendly takeovers commonly include equity, in this case, that possibility is not
likely due to strong growth experimented by the company’s stock in the recent past which is
expected to continue in the short run.
It is important to acknowledge that a possible consequence of such a large debt issuance could
be the firm’s rating decrease, which is, however, unlikely the difference in sizes of the
companies. Theoretically, the firm’s weighted average cost of capital is expected to be
maintained (as explained in the literature review, the WACC is independent of a firm’s capital
structure), possibly even decreasing to tax benefits.
-168,289
-168,289
-16,745
-151,544
1,699,363
1,651,968
79,337
1,620,027
-300,000 200,000 700,000 1,200,000 1,700,000
EV Net financial debt
Amazon
Target
Combined entity
without synergies
Combined entity
with synergies
Católica Lisbon SBE | MSc in Finance Thesis | Mergers & Acquisitions | 2020
- 63 -
8.5. Accretion/Dilution analysis
It was performed an accretion/dilution analysis (available in appendix 28), in order to measure
the impact on the acquiring firm’s shareholder’s earnings per share. Amazon’s shareholders are
expected to capture $15,800 million until 2026 (in present value) and their EPS are expected to
have a 27.5% accretion in 2020.
8.6. Post-merger integration
After the merger, there are two important phenomena to choose from: structural integration; or
target autonomy. Amazon’s strategy falls on the first one. Integration requires changes in the
functional activity arrangements, organizational structures and systems, and cultures of
combining organizations to facilitate their consolidation into a functioning whole.
In regard to the strategic independence to realize synergies, it is important to understand that
the main synergies are related with revenues, which are derived from the selling of Amazon’s
products, once sold solely online through its websites, but expected to reach physical stores
through Target, and vice-versa, that is, Target’s products, once sold solely physically, which
are expected to be included in Amazon’s websites. Thus, there is a low strategic independence
to realize synergies. The conclusion of this analysis is visualized in the following figure, which
enumerates the four long-term integration choices (Haspeslagh & Jemison, 1991), leading to a
holding of the target company.
The major concern every manager has is the fear of failure to effectively integrate. Multiple
challenges arise in this process, such as: organizational incompatibility; executive departure;
cross-cultural differences; or operational disruption. Amazon has faced many of these problems
and dealt with unsatisfied employees; downfall in the target’s customer experience; shift in the
culture and environment of the acquired firm; and departure of crucial executives. Nevertheless,
the integration with Amazon’s other services, sales increase and technological development
were the determinant factors for their success in the past and can potentially be replicated in
this deal.

Amazon to become the undisputed retail champion? | Francisco Morais Correia
- 64 -
Figure 31 - Post-transaction integration matrix; adapted from Haspeslagh & Jemison (1991)
8.7. Alternative target
For Amazon to complement its brick-and-mortar retail expansion as a response to the ferocious
online growth of Walmart, several other US retailers were considered as possible targets. These
alternative target companies are smaller in terms of size, since the main possible setbacks of
the original proposed deal were issues related with competition regulation entities, possible
difficulties in terms of integration and full synergies being expected to be reach only four years
after the transaction.
Firstly, Best Buy, an american multinational consumer electronics retailers, which is Amazon’s
largest product segment in its online stores business segments and the overall retail industry
segment with higher expected growth in the short-term, as shown in the industry analysis. The
company has a market capitalization of $27,876 million, considerably smaller than Target’s. It
also possesses 1,036 stores across all states of the US, a large number for Amazon to face-off
Walmart’s physical presence in the US.
Secondly, Big Lots, an american discount stores retailer which operates 1,400 stores in 47
states. The company’s market cap is $1,942.
All in all, both companies are good alternatives, however they are not quite as good as a fit as
Target, due to being smaller (in respects to market cap), not having as much “store area” across
the US as Target (a fundamental requirement to compete with Walmart) and not being as well-
known (brand value).
Preservation Symbiosis
Absorption Holding
Low High
High
Low
Strategic independence to realize synergies
Target’s organizational autonomy

Católica Lisbon SBE | MSc in Finance Thesis | Mergers & Acquisitions | 2020
- 65 -
9. Limitations
It is important to consider that the proposed could be rejected by a regulatory body, such as the
Department of Justice, if they consider it to be a violation of the competition laws. The same
happened with the Amazon’s previous deal in 2017, however the analysis of the combined
firms’ market share in the grocery industry was only 3,5%, which was a determinant factor for
the unsuccess of this process. Moreover, the combined market share of Amazon and Target in
the Department & Discount Retail industry would only be 4,79%, way below Walmart’s (16%)
and close to competitors like Costco and Kroger. One of the possible consequences could be
that Amazon might be required to sell a portion of Target’s stores in order to have green light
in the deal.
10. Conclusion
The objective of the present dissertation was to analyse the possible acquisition of Target
Corporation by Amazon.
The retail industry has been consistently growing in past years, without any signs of slowing
down, fueled by a tremendous M&A activity and ferocious competition. Even though the
Covid-19 pandemic fueled the global shift from physical to online retailing, this acquisition is
considered as a viable option for a company like Amazon.
In order to leverage on its remarkable recent year results and accentuate its position as the
worldwide market leader in the retailing industry, it was proposed a possible strong entrance in
the brick-and-mortar retail, in the US, hinted by the 2017 acquisition of Whole Foods.
The proposed acquisition is a response to Walmart, Amazon’s main competitor in the US, which
has recently gained market share in the online retail industry. Acquiring Target would certainly
crown Amazon as the undisputed retail champion, not only in the US, but globally.
The recommended bid is $101,455 million ($202.60 per share), which accounts for a 27%
acquisition premium over the market price at the 11th of December 2020. This valued is justified
by net synergies of $37,369 million. The transaction should be carried as a friendly takeover
and is expected to be an all-cash deal, financed 60% Amazon’s cash reserves and 40% by debt
issuance. Amazon’s shareholders have the potential of capturing $15,800 million and an
accretion of 27.5% in 2020. The deal summary is available on appendix 29.

Amazon to become the undisputed retail champion? | Francisco Morais Correia
- 66 -
11. Bibliography
Demirci, E. (2007). The Impact of Strategic Entrepreneurship on Firm Innovation. Gebze
Institute of Technology, Institute of Social Sciences, Kocaeli, Unpublished Master's
Thesis.
Bruner, R. (2004). Applied Mergers and Acquisitions. Hoboken, New Jersey: John
Wiley&Sons, Inc.
Durmaz, Y. and İlhan, A. (2015). Growth Strategies in Businesses and A Theoretical Approach.
Garzella, S. and Fiorentino, R. (2016). Synergy Value and Strategic Management: Inside the
Black Box of Mergers and Acquisitions.
Rappaport, A. and Sirower, M. (1999). "STOCK or CASH?" Harvard Business Review, 77(6),
p. 147.
Pierce II, J. and Robinson, R.B. (2004). Hostile takeover defenses that maximize shareholder
wealth. Business Horizons, 47(5), pp.15–24.
Hellgren, B., Löwstedt, J. and Werr, A. (2011). The Reproduction of Efficiency Theory: The
Construction of the AstraZeneca Merger in the Public Discourse. International Journal of
Business and Management, 6(5).
Rohra, N. and Chawla, K. (2015). Motives behind Mergers & Acquisitions: Theory & Critical
Review of Literature. EPRA International Journal of Economic and Business Review, 3(4).
Mukherjee, T., Kiymaz, H. and Baker, H.K. (2004). Merger Motives and Target Valuation: A
Survey of Evidence from CFOs. Journal of Applied Finance.
Damodaran, A. (2005). The Value of Synergy. Stern School of Business.
Schramm-Klein, H. and Morschett, D. (2003). Multi-Channel Retailing. The Journal of Internet
Banking and Commerce, [online] 10(1), pp.1–8.
Zhang, J., W. Irvin, J., J. Steenburgh, T., W. Farris, P., Kushwaha, T. and A. Weitz, B. (2010).
Crafting Integrated Multichannel Retailing Strategies. Harvard Business School.
Fiorentino, R. (2014). The Synergy Valuation Models: Towards the Real Value of Mergers and
Acquisitions. International Research Journal of Finance and Economics, (124), pp.72–80.
Ţivanović, M. and Dţudović, N. (2019). Why Pay More - World Evidence on M&A Bid
Premium Determinants. Facta Universitatis, 16(3), pp.299–314.

Católica Lisbon SBE | MSc in Finance Thesis | Mergers & Acquisitions | 2020
- 67 -
Kengelbach, J., Keienburg, G., Schmid, T., Degen, D. and Sievers, S. (2018). The 2018 M&A
Report: Synergies Take Center Stage. BCG.
Tarabay, M.N., Hammoud, J. (2018). Determinants of M&A premiums: empirical evidence
from Kuwaiti firms. Journal of Business, Economics and Finance (JBEF), 7(1), pp.130-
138.
Zhang, P. (1999). What Really Determines the Payment Methods in M&A Deals. Social
Science Research Network Electronic Paper Collection.
Emery, G. and Switzer, J. (1999). Expected Market Reaction and the Choice of Method of
Payment for Acquisitions. Financial Management, 28(4), pp.73–86.
Kalinowska, A. and Mielcarz, P. (2014). Methods of Payment in M&A Transactions and the
Operational Performance of Acquirers. Finanse, Rynki Finansowe, Ubezpieczenia,
804(67), pp.739–746.
Bruner, R. (2001). Does M&A Pay? A Survey of Evidence for the Decision-Maker. University
of Virginia Darden School Foundation.
Das, A. and Kapil, S. (2012). Explaining M&A performance: a review of empirical research.
Emerald Journal of Strategy and Management, 5(3), pp.284–330.
Damodaran, A. (2012). Investment Valuation: Tools and techniques for determining the value
of any asset. Hoboken, New Jersey: John Wiley&Sons, Inc.
Kaplan, S. and Ruback, R. (1996). The Market Pricing of Cash Flow Forecasts: Discounted
Cash Flow vs. the Method of “Comparables.” Journal of Applied Corporate Finance, 8(4).
Samis, M. and Davis, G. (2014). Using Monte Carlo simulation with DCF and real options risk
pricing techniques to analyse a mine financing proposal. International Journal of Financial
Engineering and Risk Management.
Cooper, I. and Nyborg, K. (2006). Consistent methods of valuing companies by DCF: Methods
and assumptions. Social Science Research Network.
Sharpe, W. (1964). Capital Asset Prices: A Theory of Market Equilibrium Under Conditions of
Risk. The Journal of Finance, 19(3).
McKinsey & Company. (2005). Valuation Measuring and Managing the Value of Companies.
Hoboken, New Jersey: John Wiley&Sons, Inc.
Damodaran, A. (2018). Country Risk: Determinants, Measures and Implications – The 2018
Edition. Social Science Research Network.

Amazon to become the undisputed retail champion? | Francisco Morais Correia
- 68 -
Berk, J. and DeMarzo, P. (2017). Corporate Finance. 5th ed.
Damodaran, A. (1999). Estimating Risk Parameters. Stern School of Business.
Blume, M. (1975). Betas and Their Regression Tendencies. The Journal of Finance, 30(3).
Pinto, J., Henry, E., Robinson, T., Stowe, J. and Cohen, A. (2010). Equity Asset Valuation. 2nd
ed. CFA Institute.
Luehrman, T. (1997). Using APV (adjusted present value): a better tool for valuing operations.
Harvard Business Review.
Koller, T., Goedhart, M. and Wessels, D. (2010). Valuation: Measuring and Managing the
Value of Companies. 5th ed. McKinsey & Company.
Damodaran, A. (2006). Damodaran on Valuation. 2nd ed. Hoboken, New Jersey: John
Wiley&Sons, Inc.
Acharya, V., Davydenko, S. and Strebulaev, I. (2012). Cash Holdings and Credit Risk. The
Review of Financial Studies, 25(12), pp.3572–3609.
Koller, T., Goedhart, M. and Wessels, D. (2005). The Right Role for Multiples in Valuation.
McKinsey on Finance. (15), pp.7-11.
Schwartz, E. (2013). The Real Options Approach to Valuation: Challenges and Opportunities.
Latin American journal of economics, 50(2).
Souiden, N., Ladhari, R. and Chiadm, N.-E. (2019). New trends in retailing and services.
Journal of Retailing and Consumer Services, 50, pp.286–288.
Haspeslagh, P., & Jemison, D. (1991). The challenge of renewal through acquisitions. Planning
review, 19 (2)
Rodriguez M., Paredes F. and Yi G. (2016). Towards Future Customer Experience: Trends and
Innovation in Retail. Foresight and STI Governance, 10 (3), pp.18–28.
KPMG. (2020). Corporate tax rates table - KPMG Global. [online] Available at:
https://home.kpmg/xx/en/home/services/tax/tax-tools-and-resources/tax-rates-
online/corporate-tax-rates-table.html.
Deloitte United States. (2019). 2019 Retail Industry Trends. [online] Available at:
https://www2.deloitte.com/us/en/pages/consumer-business/articles/retail-distribution-
industry-outlook.html.
Amazon.com Inc. (2014). Annual Report
Amazon.com Inc. (2015). Annual Report

Católica Lisbon SBE | MSc in Finance Thesis | Mergers & Acquisitions | 2020
- 69 -
Amazon.com Inc. (2016). Annual Report
Amazon.com Inc. (2017). Annual Report
Amazon.com Inc. (2018). Annual Report
Amazon.com Inc. (2019). Annual Report
Amazon.com Inc. (2020). 10-Q form
Target Corporation Inc. (2014). Annual Report
Target Corporation Inc. (2015). Annual Report
Target Corporation Inc. (2016). Annual Report
Target Corporation Inc. (2017). Annual Report
Target Corporation Inc. (2018). Annual Report
Target Corporation Inc. (2019). Annual Report
Target Corporation Inc. (2020). 10-Q form

Amazon to become the undisputed retail champion? | Francisco Morais Correia
- 70 -
12. Appendix
Appendix 1 – Valuation Techniques
1. Discounted cash flow
This valuation approach consists in estimating the NPV of expected generated cash flows of an
asset, discounted back at a rate that reflects the risk of the mentioned cash flows. The valuation
of the company is based on assumptions regarding its outlook. This is the approach that comes
with the most extensive literature and with the best theoretical credentials. Mainly due to its
future assessment of an assets cash flow stream and expected overall economic creation
(contrasting with the other three previously mentioned approach is that aspect), this approach
gets the most play in academia, although its day-to-day usage on today’s financial sector can
be questioned.
Samis & Davis (2014) suggest that, in a more formal approach, a Monte Carlo simulation, as
an alternative to general assumptions of a company’s financials, can be used to compute future
expected cash flows of a firm, thus reaching the expected values with a smaller error margin.
The main underlying assumption of this approach is that a company will operate and generate
cash flows as a perpetuity.
Cooper & Nyborg (2006) mention the four most common methods regarding this approach: the
WACC, the FCFE method, the CFF and the APV methods.
All of the methods previously mentioned have the same general idea: that the value of a levered
firm equals the value of the firm plus the present value of the tax shields arising from debt
financing (PVTS), not considering costs of financial distress, as follows:
E + D = Vu + PVTS
Equation 1 - Valuation generic equation
Where:
E: Equity
D: Debt
Vu: Value of the unlevered firm

Católica Lisbon SBE | MSc in Finance Thesis | Mergers & Acquisitions | 2020
- 71 -
1.1. Weighted average cost of capital
The free cash flow to the firm (FCFF) or weighted average cost of capital (WACC) method,
which consists in discounting the operating free cash flow (FCF) that can be defined as the free
cash flow after tax, assuming that the firm is solely financed with equity, at WACC, in order to
have the value of the leveraged firm, subtracting debt afterwards.
The WACC represents the blended cost of capital across all financing sources, including equity
and debt holders, each weighted by its percentage of total capital. It be seen as the minimum
expected return that a firm’s new investments must yield in order for its value not to decrease.
It reflects both the financial and operational risk of the company and, all in all, it can be
interpreted as the long-term opportunity cost of the funds used by a company. The WACC
formula is as follows:
WACC = (E
D+E) * Ke + (
D
D+E) * Kd * (1-Tc)
Equation 2 - WACC formula
Where:
Ke: Cost of equity
Kd: Cost of debt
Tc: Corporate tax rate
For publicly traded companies, the market value of equity is given by a firm’s market
capitalization (Mkt Cap), which is calculated by multiplying the current stock price by the total
number of outstanding shares.
For the WACC computation, the level of debt is always a market value and never the book
value (stated on a firm’s financials). For companies with publicly traded bonds, the market
value of debt is given by the same rationale as the market capitalization is calculated by
multiplying the total bonds traded in the market by its current market price.
1.2. Cost of equity
The cost of equity used in the WACC formula is the return a company requires to decide if an
investment meets capital returns requirements. It can be computed using the capital asset pricing
model (CAPM) introduced independently by Sharpe (1964), Linter (1965) and Mossin (1996)
and is development of the mean-variance optimization theory of Markowitz (1952).

Amazon to become the undisputed retail champion? | Francisco Morais Correia
- 72 -
The CAPM formula is as follows:
E(Ri) = Rf + βi (E(Rm) - Rf)
Equation 3 - CAPM formula
Where:
E(Ri): Expected return of a security
Rf: Risk-free rate
E(Rm)-Rf: Market risk premium
βi = βL: Firm’s levered Beta
Using the CAPM, the expected return of a security can be interpreted as the cost of equity of
firm. Berk & DeMarzo (2017) define the CAPM’s risk-free rate as the rate at which investors
can both borrow and save. As suggested by Bruner (1998), the yield of long term (10 to 30
years) bonds can be used to determine the risk-free interest rate. The market risk premium is
the excess return that investing in the market yields over the risk-free rate. It quantifies the extra
return demanded by market participants for the increased risk.
1.3. Cost of debt
According to McKinsey & Company (2005), the yield to maturity of liquid long-term option
free bonds is a suitable proxy for the cost of debt (in the case that the firm has publicly traded
bonds). Damodaran (2018) suggests that the pre-tax cost of debt can be computed by summing
of a default spread to the risk-free rate. The default spread is a function of the credit rating of a
firm’s publicly traded bond or is related to its interest coverage ratio (in the case that the
company is not publicly traded).

Católica Lisbon SBE | MSc in Finance Thesis | Mergers & Acquisitions | 2020
- 73 -
The following table discriminates the relationship between these three variables for developed
market firms with a market capitalization above $5 billion companies.
If interest coverage ratio
is
> ≤ to Rating is Spread is
8.50 100000 Aaa/AAA 0.63%
6.5 8.499999 Aa2/AA 0.78%
5.5 6.499999 A1/A+ 0.98%
4.25 5.499999 A2/A 1.08%
3 4.249999 A3/A- 1.22%
2.5 2.999999 Baa2/BBB 1.56%
2.25 2.249999 Ba1/BB+ 2.00%
2 2.2499999 Ba2/BB 2.40%
1.75 1.99999 B1/B+ 3.51%
1.5 1.749999 B2/B 4.21%
1.25 1.499999 B3/B- 5.15%
0.8 1.249999 Caa/CCC 8.20%
0.65 0.799999 Ca2/CC 8.64%
0.2 0.649999 C2/C 11.34%
-1000000 0.199999 D2/D 15.12%
Table 14 - Default spread for large non-financial service companies; adapted from Damodaran (2018)
The interest coverage ratio is given as follows:
Interest coverage ratio = EBIT
Interest expenses
Equation 4 - Interest coverage ratio
In order to account for the tax shield savings from interest payments, it is possible to compute
the after-tax cost of debt by the following formula:
After-tax Kd = Kd * (1 - Tc)
Equation 5 - After-tax cost of debt formula
1.4. Beta
Beta is a coefficient that measures the systematic risk (or non-diversifiable risk) or volatility of
a given portfolio. According to McKinsey & Company (2005), it refers to the stock’s co-
movement with the stock market and emphasis the stock’s capability to further diversify the
market portfolio. Berk & DeMarzo (2017) define it as being the percentual change in the return
of a security for a 1% change in the return of the market portfolio.
Kaplan and Ruback (1996) studied the impact of three different measures of risk on valuations,
being the first one a firm-based measure, the second one an industry-based measure and the
final one a market-based measure. They concluded that the industry and market-based betas

Amazon to become the undisputed retail champion? | Francisco Morais Correia
- 74 -
consistently outperformed the firm-based beta, therefore, as explained by Damodaran (1999),
a firm’s capital structure must be considered when computing a levered beta because this
coefficient is a function of the firm’s financial risk, as follows:
βL = βu
1 + (1 - Tc) * (DE)
Equation 6 - Beta levered formula
Where:
βu: Unlevered Beta
According to Blume (1975), firm’s betas tend to the mean of all firm’s betas. This sustained the
following adjustment to the beta levered formula:
Adjusted βL = 2
3 * βL +
1
3
Equation 7 - Adjusted levered beta formula
1.5. Free cash flow to the firm
As previously mentioned, the WACC’s method approach to the discounted cash flow model
relevant cash flow is the free cash flow to the firm. Pinto et al. (2010) define the FCFF as the
after-tax cash flow available to all the firm’s equity and debt holders. In other words, it is the
amount of cash flow earned by a firm after paying all operating expenses, tax and reinvestment
needs, but before paying any interests or dividends. Kaplan & Ruback (1996) formulated two
different ways to compute the FCFF, the first one is based on Net income (NI) and the second
starts with earnings before interest (EBIT). Later, Damodaran (2012) proposed another way of
calculating the FCFF, having the free cash flow to equity (FCFE) as a starting point. These
formulas are the following:
FCFF = NI + D&A - ∆NWC + Interest expenses - Capex + After tax asset sales
Equation 8 - FCFF formula based on net income
FCFF = EBIT - Corporate taxes + D&A - ∆NWC - Capex + After tax asset sales
Equation 9 - FCFF formula based on EBIT
FCFF = FCFE + Interest expenses *(1-Tc) + Principal repayments - New debt issues +
+ Preferred dividends
Equation 10 - FCFF formula based on FCFE

Católica Lisbon SBE | MSc in Finance Thesis | Mergers & Acquisitions | 2020
- 75 -
Where:
NI: Net income
D&A: Depreciations and amortizations
ΔNWC: Change in net working capital
Capex: Capital expenditures
1.6. Enterprise Value
The final stage of this model is the computation of the firm’s enterprise value (EV), which is a
measure of a company’s total value, often used as more comprehensive alternative to equity
market capitalization, that refers to the market value of a publicly traded company’s outstanding
shares.
The EV formula is the following:
EV = ∑ FCFFt
(1 + WACC)t +
TVn
(1 + WACC)n
t=n
t=0
Equation 11 - WACC model enterprise value
Where:
FCFFt: Free cash flow to the firm in period t
TV: Terminal value
n: number of periods representative of the asset’s life
The terminal value (TV) used in the previous formula is the firm’s value beyond the forecasted
period, when the future cash flows are estimated. The TV is computed, as a perpetuity, as
follows
TVn = FCFFn+1
(WACC - g)
Equation 12 - WACC model terminal value
Where:
g: Long term growth rate
This previously described equation is the perpetual growth method to compute the TV, an
academic approach. However, it is relevant to mention that the exit multiple method, an
industry-based approach, can be an alternative to the academic approach. Instead of computing

Amazon to become the undisputed retail champion? | Francisco Morais Correia
- 76 -
the TV based on a perpetuity formula, this value is calculated assuming that the firm is sold, at
the end of the projected period, for a value based on the existing public market valuations.
This alternative method consists on estimating the TV by multiplying financial metrics, such as
EBITDA or EBIT, of the firm that one wants to value, by a factor that is similar to that of
recently acquired companies.
1.7. Free cash flow to equity
The free cash flow to equity method consists of discounting the future free cash flow available
for equity holders, at the cost of equity. This approach can be interpreted as a calculation of the
NPV of equity of a firm. The FCFE can defined the residual cash flows after meeting all
expenses, reinvestment needs, tax obligations and interest and principal payments. The Ke is
the rate of return a firm theoretically pay to the equity holders. The output of this DCF approach
is the value of the equity of the firm and not the EV, as the WACC model. The FCFE can be
computed using equation 9 of the present dissertation (having the FCFF as a starting point) or,
as formulated by Pinto et al. (2010), using net income as the starting point of the calculation:
FCFE = NI + Cash charges - ∆NWC - ∆Capex + Net borrowing
Equation 13 - FCFE formula
Where:
Δ Capex: Change in capital expenditures
Therefore, the value of equity of the firm is given in a similar way of the previous EV and TV
formulas in the WACC method of the DCF model, as presented below:
Equity value = ∑FCFEt
(1 + Ke)t +
FCFEn+1
Ke - g *
1
(1 + Ke)n
t=n
t=0
Equation 14 - FCFE model equity value formula
1.8. Capital cash flow
The capital cash flow method (CFF), which consists on discounting the FCFF, which is the free
cash flow available to both debt and equity holders, at the unlevered cost of capital (Ku),
resulting on the value of the levered firm and subtracting debt afterwards. Using equation 5 of
the present dissertation, it is possible to calculate the unlevered Beta. By applying the same

Católica Lisbon SBE | MSc in Finance Thesis | Mergers & Acquisitions | 2020
- 77 -
rationale of equation 3 of the present dissertation (the CAPM formula as a way to calculate the
cost of equity), if one uses the βu instead of βL, it is possible to compute Ku as follows:
Ku = Rf + βu(E(Rm) - Rf)
Equation 15 - CAPM formula to compute the unlevered cost of capital
This approach to the DCF might be very similar to the WACC, but it is advantageous to use it
since it is more practical to apply this model when the level of debt of a company changes and,
on that case, it is a model less prone to errors. Since there is an almost a direct correspondence
between this model and the WACC approach, the WACC will be one used in this dissertation,
due to the level of debt of Amazon not having significant changes which justify this alternative.
1.9. Adjusted present value
Through the adjusted present value (APV) method, each part of a firm is valuated separately,
as stated by Luehrman (1997), this approach to the DCF model relies on the value additivity,
that is, the value of a firm corresponds to the sum of its cash flow generating parts. Moreover,
by segregating the sources of value creation of the firm, it is not only possible for managers to
assess the intrinsic value of the company, but also to understand the origin of value creation
(Kaplan & Ruback, 1996). The APV is a recommended alternative to WACC for changing
capital structure valuations (Koller et al., 2010)
Firstly, it is assumed that the company is fully equity financed, by discounting the FCFF at the
unlevered cost of capital, secondly it is added the present value of tax shields and finally the
present value of the costs of bankruptcy are added as well (Kaplan & Ruback, 1996). Therefore,
by the APV approach of the DCF, the value of the firm is given as follows:
Firm value = ∑FCFF
(1 + Ku)t + PVTS + PV bankruptcy costs
t=n
t=1
Equation 16 - APV firm value formula
The PVTS formula is given by Cooper & Nyborg (2006), having the underlying assumption
that future debt values and future tax saving are proportional to the value of the firm’s operation.
Additionally, the author stated that the growth rate used in the following formula is the entire
firm’s growth rate. The formula is as follows:
PVTS = ∑Tc * Interest ratet * Debt
(1 + Kd - g)t
t=n
t=1
Equation 17 - APV model PVTS formula

Amazon to become the undisputed retail champion? | Francisco Morais Correia
- 78 -
Finally, the present value of bankruptcy costs is given by the following formula:
PV bankruptcy costs = Prob. bankruptcy * PV bankruptcy costs
Equation 18 - APV model PV of bankruptcy costs
Damodaran (2006) suggests that one of the possibilities to estimate the probability of
bankruptcy (Prob. bankruptcy) is through the firm’s bond rating.
Acharya et al. (2012) studied the values of past bankruptcies, making available a set of industry-
based and type of operation-based means and medians which can be used to estimate the present
value of bankruptcy costs.
2. Relative valuation
In order to value a firm using this analogic approach, one calculates the average or median of a
financial ratio from the guideline companies (also called competitors or peer group) and applies
that proportion to the firm which one wants to value, by multiplying that same financial metric
by the performance measure of the company being valued.
Kaplan & Ruback (1996), highlight two different approaches for this valuation model: the
comparable transaction (the value of a firm is inferred through past transactions in the same
industry and of companies with similar size) and the comparable company (which is the most
popular relative valuation method and the one in which this literature review is more focused
on), in which a set of comparable companies multiples are used to infer the value of a firm .
Koller et al. (2005) state that peer companies should be chosen based on similar future growth
projections and similar return on invested capital (which can be interpreted as a measure of
risk), the multiples used should be forward-looking and not historical averages. The return on
capital is given as follows:
Return on capital = EBIT * (1 - Tc)
Capital invested
Equation 19 - Return on capital formula
The main multiples used are usually based on enterprise value, such as EV/Revenues,
EV/EBITDA, EV/EBITDA or EV/Invested capital. These EV-based multiples should be
adjusted for non-operating items. However, some equity-based multiples are also often when,
for instance, an investor aspires to acquire a minority position in a company, such as the price
earnings ratio (PER), the Price/Book ratio or the dividend yield. This external approach to
valuation is useful to get some insights regarding the market perception of a firm’s value,

Católica Lisbon SBE | MSc in Finance Thesis | Mergers & Acquisitions | 2020
- 79 -
whether it is overvalued by the market (if it is over the benchmark) or undervalued (if it is
traded under the benchmark). For the relative valuation model to be reliable, it is required a
high level of market efficiency as well as a high level of market transparency. Therefore, this
approach to valuation is not recommended in times of crisis or bubbles.
3. Other valuation methods
There are other methods to value firms, such as the liquidation and accounting valuation.
According to this approach, a firm’s value is the net value of its physical assets, as if the they
were going to be sold. Assets such as real estate, equipment, inventory and fixtures are included
in this model, nonetheless intangible assets are disregarded. The value of a firm calculated
through this approach will always be smaller than the DCF’s output, since the assets are
assumed to be sold at the present time (and at discount) and future investments are disregarded
(Damodaran, 2006).
The contingent claim valuation uses an option-pricing model to value projects or firms. This
model is relevant for businesses which are dependent on the occurrence of certain events
(Schwartz, 2013), such as companies which the business models are highly dependent of the
price fluctuation of certain commodities, for instance ore exploration or agricultural companies.
According to Leuhrman (1997), this approach is mostly used for future investments or
individual projects.
According to the excess return valuation, there is a distinction between a firm’s cash flows:
normal return cash flows and excess return cash flows. The earnings that are in line with a
firm’s cost of capital are considered normal return cash flows, all of the others which differ
from that value are considered excess returns (meaning they can be positive or negative). The
underlying rationale of this model is that a company with positive excess returns should be
value higher than its book values and the opposite for negative excess returns. Accordingly, a
project should only be taken on by a company if the project’s return is higher than the firm’s
equity cost of capital. According to Damodaran (2006), the most popular model used for this
valuation approach is the economic value added (EVA), which can be computed as follows
EVA = NOPAT - WACC * Capital invested
Equation 20 - EVA formula
Where:
NOPAT: Net operating profit after tax

Amazon to become the undisputed retail champion? | Francisco Morais Correia
- 80 -
Appendix 2 – Amazon’s company profile additional information
1. Product and services portfolio
The online stores segment, which includes product sales and digital media content where they
record revenue gross. The company leverages on their retail infrastructure to offer a wide
selection of consumable and durable goods including media products (books, music, videos,
games and software) available in both physical and digital format, all sold on a transactional
basis. This business segment of Amazon includes the infamous Kindle (company’s trademark
android-powered portable e-book reader device, developed by Amazon), the Fire tablets
(formerly known as Kindle Fire, which is a low-priced tablet computer developed by Amazon),
the Amazon Fire TV (a line of digital media player and micro consoles that delivers digital
audio and video content streamed via internet to a high-definition television, fully developed
by Amazon), Echo (the brand of smart speakers developed by Amazon) and Alexa, the voice-
controlled virtual assistant AI technology. All the previously mentioned signature Amazon
products are available on all the company’s websites. As of 2019, there are over 300 million
active customers’ accounts worldwide.
The physical store segment includes product sales where a costumer physically selects items in
a store. It is worth mentioning that sales from customers who order goods online for delivery
or pickup at a physical store are included in the previously mentioned online stores segment.
This segment includes the sales from Whole Foods, the supermarket chain which exclusively
sells products free from hydrogenated fats and artificial colours, flavours and preservatives,
acquired by Amazon in 2017. Amazon also has other physical stores besides Whole Foods,
available on appendix 4.
Third-party seller services enable these sellers to sell new or used products on a fixed-price
online marketplace alongside Amazon’s regular offering. This business segment includes
commissions and any related fulfilled and shipping fees and other third-party seller services.
Subscription services includes digital product subscriptions which provide unlimited viewing
or usage rights. It is mainly associated with the annual and monthly fees associated with
Amazon Prime memberships, as well as audiobook, digital video, digital music (through
Amazon Music), e-book and other non-AWS subscription services.
Amazon Prime provides discounts on shipping (for instance free two-day shipping with no
minimum order size applied to millions of eligible items, a free membership to Prime Video
(Amazon’s streaming video service included with membership and offers titles exclusive to

Católica Lisbon SBE | MSc in Finance Thesis | Mergers & Acquisitions | 2020
- 81 -
Amazon), Twitch Prime (which gives customers a free channel subscription to a video game
streamer of choice, plus numerous discounts and free in-game content to popular titles),
Amazon Drive (a subscription which offers its users unlimited storage for files and make them
accessible from anywhere) and early access to lightning deals on the company’s website. As of
2019, there are over 150 million paid Prime members globally. Amazon Prime’s fees per
country are available on appendix 3.
Finally, the AWS business segment which provides on-demand cloud computing platforms,
that is, the delivery of IT resources over the Internet. Instead of buying, owning and maintaining
physical data centers and servers, it is possible for a costumer to access technology services,
including computing power, storage and databases through the cloud provider. AWS also
provides application programming interfaces (API’s), which are interfaces that define
interactions between multiple software intermediaries, to individuals, companies and
governments. All of AWS services are charged on a pay-as-you-go basis.
2. Financial Analysis
Working capital represents the diffrence between a firm’s current assets and current liabilities.
Amazon’s working capital has been decreasing over the past three years meaning its current
liabilities have increased in relation to its current assets.The relationship between the changes
in working capital and revenues growth is almost irrelevant, meaning that the behaviour of
each is not affected by the other. Amazon’s historic changes in working capital are as follows:
Figure 32 - Amazon's historic changes in working capital; adapted from Amazon’s annual reports
A company’s interest expense is the cost incurred for borrowed funds. In Amazon’s case, it has
decreased 51.3% in the last year. This can be explained by an increase in long-term debt when
2557.0
3847.0
(242)
(1,043)
(2,438)
2.0%
2.7%
3.1% 3.1%
2.0%
0.0%
1.0%
2.0%
3.0%
4.0%
(4000.0)
(2000.0)
.0
2000.0
4000.0
6000.0
2015 2016 2017 2018 2019
Changes in Working Capital Total revenues growth
in millions USD

Amazon to become the undisputed retail champion? | Francisco Morais Correia
- 82 -
compared with its current debt, postponing its interest expenses. Amazon’s historic interest
expenses are as follows:
Figure 33 - Amazon's historic interest expenses; adapted from Amazon’s annual reports
The following figure is the visual representation of Amazon’s income statement earnings in the
past five years. The right axis is the scale for revenues, whereas the left axis is the scale for the
other earnings.
Figure 34 - Amazon's historic income statement earnings; adapted from Amazon’s annual reports
It is worth mentioning that Amazon’s quarterly EPS, which are calculated by dividing the net
income by shares outstanding, have been increasing due to the earnings boost, especially in the
first half of 2020. The number of shares outstanding also increased but in a lower scale.
A company’s return on equity (ROE), which is calculated by dividing the company’s earnings
by the book value of equity and it measures if the company’s executives are managing it
665.0
294.0 300.0
1160.0
565.0
.0
300.0
600.0
900.0
1200.0
1500.0
2015 2016 2017 2018 2019
0
50,000
100,000
150,000
200,000
250,000
300,000
0
5,000
10,000
15,000
20,000
25,000
30,000
35,000
2015 2016 2017 2018 2019
EBITDA EBIT EBT Net Income Revenues
in millions USD
in millions USD

Católica Lisbon SBE | MSc in Finance Thesis | Mergers & Acquisitions | 2020
- 83 -
effectively, using the company’s assets to create profits. When comparing Amazon’s historic
ROE with the firm’s EPS, they recently show inverse, when historically they were positively
correlated. Amazon’s historic EPS and ROE are as follows (notice that the EPS curve is related
to the left axis and the ROE curve is related the right axis):
Figure 35 - Amazon's historic earnings per share and return on equity; from Thomson Reuters Eikon
Appendix 3 – Target’s company profile additional information
1. Product and services portfolio
The first one is the beauty and household essentials segment, which includes all beauty and
personal, baby gear, cleaning, paper products, and pet supplies. This segment represents 26%
of 2019 Target’s total revenues.
The second business segment is food and beverage, which includes dry grocery, dairy, frozen
food, beverages, candy, snacks, deli, bakery, meat, produce, and food service in stores. Food
and beverage revenues were over $15 million in 2019 (representing 19% of total revenues).
Apparel and accessories are the third business segment, contributing to 18% of Target’s
revenue. This segment includes apparel for women, men, boys, girls, toddlers, infants and new-
borns, as well as jewellery, accessories and shoes. This business segment represents 18% of
Target’s total revenues.
In fourth place, home furnishings and décor business segment, which represents also 18% of
the firm’s total revenues. It includes furniture, lighting, storage, kitchenware, small appliances,
home décor, bed and bath, home improvement, school/office supplies, greeting cards and party
supplies, and other seasonal merchandise.
0%
5%
10%
15%
20%
25%
30%
35%
0
2
4
6
8
10
12
14
Q2 2015Q4 2015Q2 2016Q4 2016Q2 2017Q4 2017Q2 2018Q4 2018Q2 2019Q4 2019Q2 2020Q3 2020
Quarterly EPS ROE
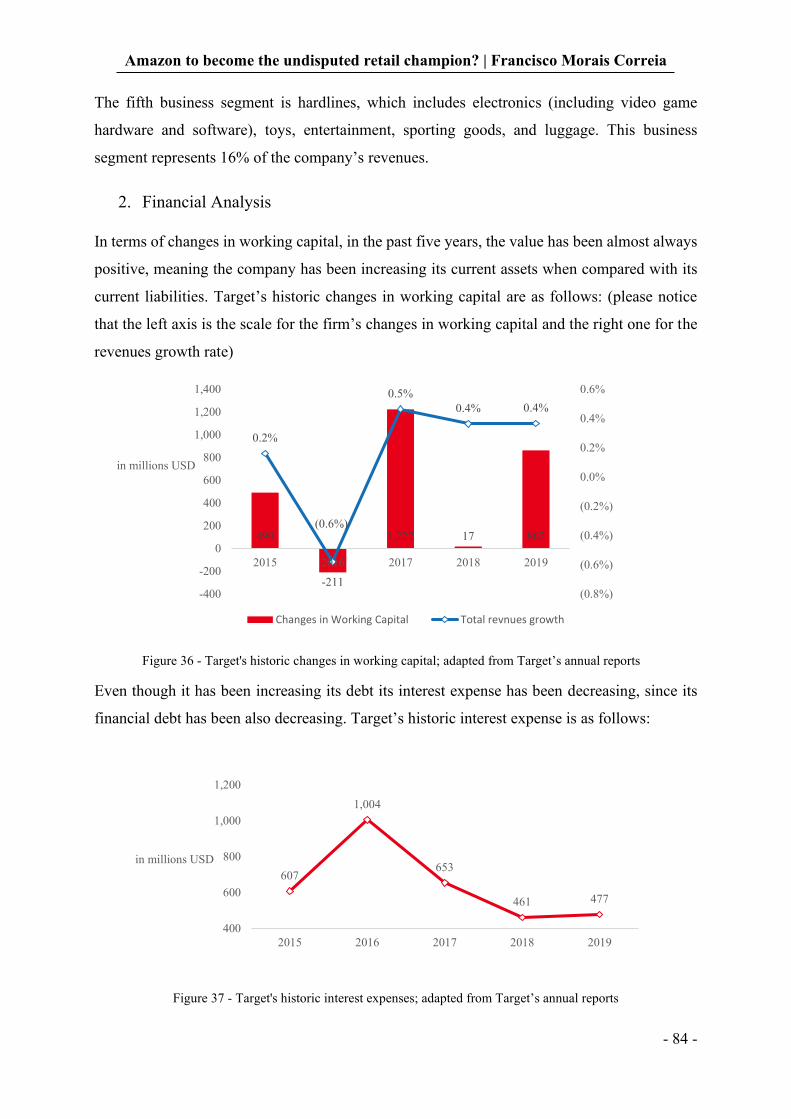
Amazon to become the undisputed retail champion? | Francisco Morais Correia
- 84 -
The fifth business segment is hardlines, which includes electronics (including video game
hardware and software), toys, entertainment, sporting goods, and luggage. This business
segment represents 16% of the company’s revenues.
2. Financial Analysis
In terms of changes in working capital, in the past five years, the value has been almost always
positive, meaning the company has been increasing its current assets when compared with its
current liabilities. Target’s historic changes in working capital are as follows: (please notice
that the left axis is the scale for the firm’s changes in working capital and the right one for the
revenues growth rate)
Figure 36 - Target's historic changes in working capital; adapted from Target’s annual reports
Even though it has been increasing its debt its interest expense has been decreasing, since its
financial debt has been also decreasing. Target’s historic interest expense is as follows:
Figure 37 - Target's historic interest expenses; adapted from Target’s annual reports
490
-211
1,222 17 862
0.2%
(0.6%)
0.5%
0.4% 0.4%
(0.8%)
(0.6%)
(0.4%)
(0.2%)
0.0%
0.2%
0.4%
0.6%
-400
-200
0
200
400
600
800
1,000
1,200
1,400
2015 2016 2017 2018 2019
Changes in Working Capital Total revnues growth
607
1,004
653
461 477
400
600
800
1,000
1,200
2015 2016 2017 2018 2019
in millions USD
in millions USD

Católica Lisbon SBE | MSc in Finance Thesis | Mergers & Acquisitions | 2020
- 85 -
The following figure is the visual representation of Target’s income statement earnings in the
past five years. The right axis is the scale for revenues, whereas the left axis is the scale for the
other earnings.
Figure 38 - Target's historic income statement earnings; adapted from Target’s annual reports
Unlike Amazon, Target has a historical pay-out policy, although its dividend yield, which is
calculated by dividing dividends paid by the firms share price, has been decreasing, mainly due
to its recent share price increase. Target’s historical dividend yield is as follows:
Figure 39 - Target's historic dividend yield; from Thomson Reuters Eikon
Target’s EPS’s recent increase has been fuelled by the decrease in total shares outstanding. The
firm’s ROE evolution is in line with Amazon’s, since it has been recently declining as well.
Target’s historical EPS and ROE are as follows: (please notice that the right axis is the scale of
the firm’s ROE and the left axis the scale for the firm’s EPS’s)
50,000
55,000
60,000
65,000
70,000
75,000
80,000
0
2,000
4,000
6,000
8,000
10,000
12,000
2015 2016 2017 2018 2019
EBITDA EBIT EBT Net Income Revenues
0%
1%
2%
3%
4%
5%
6%
Nov-15 Jul-16 Mar-17 Nov-17 Jul-18 Mar-19 Nov-19 Jul-20
in millions USD

Amazon to become the undisputed retail champion? | Francisco Morais Correia
- 86 -
Figure 40 - Target's historic earnings per share and return on equity; from Thomson Reuters Eikon
Appendix 4 – Amazon’s number of stores
Table 15 - Amazon's number of stores; adapted from Amazon’s annual reports
Appendix 5 – Amazon Prime’s fees per country
Table 16 - Amazon Prime’s fees; adapted from Amazon's annual report
0%
5%
10%
15%
20%
25%
30%
0
0.5
1
1.5
2
2.5
Q2 2015Q4 2015Q2 2016Q4 2016Q2 2017Q4 2017Q2 2018Q4 2018Q2 2019Q4 2019Q2 2020Q3 2020
Quarterly EPS ROE
Number of stores
Amazon Go Groceries 2
Amazon Go 26
Amazon Books 24
Amazon 4-Star 31
Amazon Pop Up 7
Whole Foods 500
Total 590
CountryPrime annual membership
fee (in local currency)
Prime annual membership
fee (in USD)
Countries which contribute to 89% of revenues in 2019
United States $ 99 $ 99
Germany € 69 $ 81.13
United Kindgdom £ 79 $ 61.05
Japan ¥ 3,900 $ 36.75
Average $ 69.48
Rest of the world (11% of revenues in 2019)
Canada $ 79 $ 59.74
France € 49 $ 57.62
Austria € 69 $ 81.13
Netherlands € 49 $ 57.62
Belgium € 49 $ 57.62
Luxemborg € 49 $ 57.62
Italy € 20 $ 23.52
Spain € 20 $ 23.52
Mexico $ 899 $ 41.28
India ₹ 999 $ 13.48
China ¥ 388 $ 56.67
Average $ 48.17
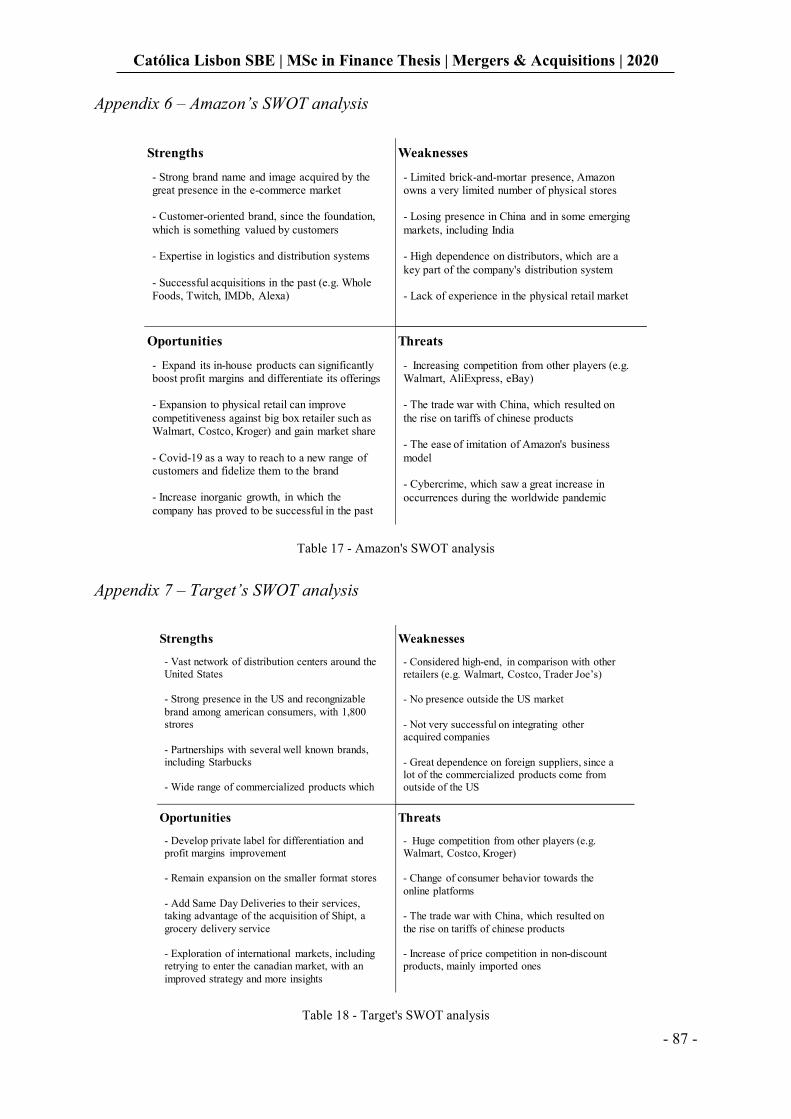
Católica Lisbon SBE | MSc in Finance Thesis | Mergers & Acquisitions | 2020
- 87 -
Appendix 6 – Amazon’s SWOT analysis
Table 17 - Amazon's SWOT analysis
Appendix 7 – Target’s SWOT analysis
Table 18 - Target's SWOT analysis
Strengths Weaknesses
Oportunities Threats
- Strong brand name and image acquired by the great presence in the e-commerce market
- Customer-oriented brand, since the foundation,
which is something valued by customers
- Expertise in logistics and distribution systems
- Successful acquisitions in the past (e.g. Whole
Foods, Twitch, IMDb, Alexa)
- Expand its in-house products can significantly
boost profit margins and differentiate its offerings
- Expansion to physical retail can improve
competitiveness against big box retailer such as
Walmart, Costco, Kroger) and gain market share
- Covid-19 as a way to reach to a new range of
customers and fidelize them to the brand
- Increase inorganic growth, in which the
company has proved to be successful in the past
- Limited brick-and-mortar presence, Amazon owns a very limited number of physical stores
- Losing presence in China and in some emerging
markets, including India
- High dependence on distributors, which are a
key part of the company's distribution system
- Lack of experience in the physical retail market
- Increasing competition from other players (e.g. Walmart, AliExpress, eBay)
- The trade war with China, which resulted on
the rise on tariffs of chinese products
- The ease of imitation of Amazon's business
model
- Cybercrime, which saw a great increase in
occurrences during the worldwide pandemic
Strengths Weaknesses
Oportunities Threats
- Vast network of distribution centers around the United States
- Strong presence in the US and recongnizable
brand among american consumers, with 1,800
strores
- Partnerships with several well known brands,
including Starbucks
- Wide range of commercialized products which
- Develop private label for differentiation and
profit margins improvement
- Remain expansion on the smaller format stores
- Add Same Day Deliveries to their services, taking advantage of the acquisition of Shipt, a
grocery delivery service
- Exploration of international markets, including
retrying to enter the canadian market, with an
improved strategy and more insights
- Considered high-end, in comparison with other retailers (e.g. Walmart, Costco, Trader Joe’s)
- No presence outside the US market
- Not very successful on integrating other
acquired companies
- Great dependence on foreign suppliers, since a
lot of the commercialized products come from outside of the US
- Huge competition from other players (e.g. Walmart, Costco, Kroger)
- Change of consumer behavior towards the
online platforms
- The trade war with China, which resulted on
the rise on tariffs of chinese products
- Increase of price competition in non-discount products, mainly imported ones

Amazon to become the undisputed retail champion? | Francisco Morais Correia
- 88 -
Appendix 8 – Multiline retail industry’s Porter’s five forces analysis
Competitive Rivalry
The retail industry is a very competitive industry mainly due to the huge number of firms
exploring it, although ranging from very small to massive companies. Also, since it is a big
industry, there is a lot of segmentation and variety of firms exploring smaller, and more specific
niches of this market. It is also important to mention that in this industry there is high
aggressiveness, especially amongst bigger companies, mainly on prices since it is one of the
main aspects that the consumer notices.
Suppliers Power
The bargaining power of the suppliers has low intensity, this has mainly to do with the fact that
there are, like in the retail industry, a lot of players with high competitiveness between them.
These suppliers tend to be smaller than the big players of the retail industry, making them very
dependent on these retailers and their supply contracts and so having low bargaining power.
Buyers Power
The bargaining power of the buyers has low intensity, this happens a lot because of the large
population of buyers which makes it difficult for them to be able to impose any kind of
significant pressure on the retail companies. This population, of buyers, is also characterized
by their own high diversity, which also makes it difficult to find a common ground that could
possibly involve every type of buyer in order to increase their power over the retail companies.
Another relevant point to raise is that the great majority of the consumers present a small sized
purchase for these companies making it almost irrelevant as an individual.
Threat of Substitution
The threat of substitution is relatively low. It is evident the existence of substitutes, although
not very varied, but these substitutes are normally accompanied either by lower quality or
higher prices. These factors make it difficult for a consumer to move away from the normal
retailers, either because of the higher price or because of the lack of variety.
Threat of New Entry
The threat of new entries can be classified moderately high. There is a constant threat of new
companies entering this industry, mainly in the smaller sized stores segment, where with their
small size they can win over a customer due to their convenience and location. Smaller stores
are much more easily found near residential areas when compared with big retailers’ spaces. It

Católica Lisbon SBE | MSc in Finance Thesis | Mergers & Acquisitions | 2020
- 89 -
is difficult and costly to create and develop a new brand, but it is becoming a little less difficult
due to the internet. Although the cost of opening a new business is high (equipment, human
resources, business space), maintaining a retail store is considered moderate to low which
provides an incentive to do it, mainly in smaller sized stores which have less expenses when
compared with bigger ones.
Appendix 9 – Amazon’s historical income statement
(Values in million USD)
Table 19 - Amazon's historical income statement; adapted from Amazon's annual report
Appendix 10 – Amazon’s historical balance sheet
(Values in million USD)
Table 20 - Amazon's historical balance sheet; adapted from Amazon's annual report
Income statement 2015 2016 2017 2018 2019
Revenues 107,006 135,987 177,866 232,887 280,522
Cost of sales (71,651) (88,265) (111,934) (139,156) (165,536)
Gross profit 35,355 47,722 65,932 93,731 114,986
Fulfillment (13,410) (17,619) (25,249) (34,027) (40,232)
Technology & content (5,254) (7,233) (10,069) (13,814) (18,878)
Marketing (12,540) (16,085) (22,620) (28,837) (35,931)
General & adminstrative (1,747) (2,432) (3,674) (4,336) (5,203)
Other (171) (167) (214) (296) (201)
Operating income 2,233 4,186 4,106 12,421 14,541
Interest income 50 100 202 440 832
Interest expense (459) (484) (848) (1,417) (1,600)
Other income (expense) (256) 90 346 (183) 203
Net income before taxes 1,568 3,892 3,806 11,261 13,976
Provision for income taxes (950) (1,425) (769) (1,197) (2,374)
Equity method investment activity, net of tax (22) (96) (4) 9 (14)
Net income 596 2,371 3,033 10,073 11,588
Balance sheet 2015 2016 2017 2018 2019
Cash and cash equivalents 15,890 19,334 20,522 31,750 36,092
Marketable securities 3,918 6,647 10,464 9,500 18,929
Inventories 10,243 11,461 16,047 17,174 20,497
Accounts receivable, net and other 5,654 8,339 13,164 16,677 20,816
Total current assets 35,705 45,781 60,197 75,101 96,334
Property plant and equipment, net 21,838 29,114 48,866 61,797 72,705
Operating leases - - - - 25,141
Goodwill 3,759 3,784 13,350 14,548 14,754
Other assets 3,445 4,723 8,897 11,202 16,314
Total assets 64,747 83,402 131,310 162,648 225,248
Accounts payable 20,397 25,309 34,616 38,192 47,183
Accrued expenses and other 10,372 13,739 18,170 23,663 32,439
Unearned revenue 3,118 4,768 5,097 6,536 8,190
Total current liabilities 33,887 43,816 57,883 68,391 87,812
Long-term lease liabilities - - - 9,650 39,791
Long-term debt 8,227 7,694 24,743 23,495 23,414
Other long-term liabilities 9,249 12,607 20975 17,563 12,171
Total liabilities 51,363 64,117 103,601 119,099 163,188
Common stock 5 5 5 5 5
Treasury stock (1,837) (1,837) (1,837) (1,837) (1,837)
Additional paid-in capital 13,394 17,186 21,389 26,791 33,658
Retained earnings 2,545 4,916 8,636 19,625 31,220
Acummulated other comprehensive loss (723) (985) (484) (1,035) (986)
Total equity 13,384 19,285 27,709 43,549 62,060

Amazon to become the undisputed retail champion? | Francisco Morais Correia
- 90 -
Appendix 11 – Amazon’s historical cash flow statement
(Values in million USD)
Table 21 - Amazon's historical cash flow statement; adapted from Amazon's annual report
Cash flow statement 2015 2016 2017 2018 2019
Cash flow - operating activities
Net income 596 2,371 3,033 10,073 11,588
Depreciations and amortizations 6,281 8,116 11,478 15,341 21,789
Stock-based compensation 2,119 2,975 4,215 5,418 6,864
Other operating expenses, net 155 160 202 274 164
Other expenses (income), net 250 (20) (292) 219 (249)
Deferred taxes 81 (246) (29) 441 796
Excess tax benefits (119) (829) - -
Non-cash expenses 8,767 10,156 15,574 21,693 29,364
Inventories (2,187) (1,426) (3,583) (1,314) (3,278)
Accounts receivable (1,755) (3,367) (4,780) (4,615) (7,681)
Accounts payable 4,294 5,030 7,100 3,263 8,193
Accrued expenses 913 1,724 283 472 (1,383)
Unearned revenue 1,292 1,955 738 1,151 1,711
Changes in working capital 2,557 3,916 (242) (1,043) (2,438)
Cash from operating activities 11,920 16,443 18,365 30,723 38,514
Cash flow from investing activities
Capital expenditures (4,589) (6,737) (11,955) (13,427) (16,861)
Proceeds from PP&E incentives - - 1,897 2,104 4,172
PP&E acquired under capital and finance leases - - - - -
Acquisitions, net of cash acquired, and other (795) (116) (13,972) (2,186) (2,461)
Sales and maturities of marketable securities 3,025 4,733 9,677 8,240 22,681
Purchases of marketable securities (4,091) (7,756) (12,731) (7,100) (31,812)
Cash from investing activities (6,450) (9,876) (27,084) (12,369) (24,281)
Cash flow from financing activities
Excess tax benefits from stock-based compensation 119 829 - - -
Dividends paid - - - - -
Proceeds from long-term debt 353 621 16,228 768 2,273
Repayments of long-term debt (1,652) (354) (1,301) (668) (2,684)
Proceeds from leasing - - - - -
Principal repayments of capital and finance lease
obligations(2,583) (4,007) (4,999) (7,786) (9,655)
Cash from financing activities (3,763) (2,911) 9,928 (7,686) (10,066)
Foreign currency effect on cash and cash equivalents (374) (212) 713 (351) 70
Net change in cash 1,333 3,444 1,922 10,317 4,237
Cash and equivalents, beggining of the period 14557 15,890 19,334 21,856 32,173
Cash and equivalents, end of the period 15,890 19,334 21,856 32,173 36,410

Católica Lisbon SBE | MSc in Finance Thesis | Mergers & Acquisitions | 2020
- 91 -
Appendix 12 – Target’s historical income statement
(Values in million USD)
Table 22 - Target's historical income statement; adapted from Target's annual report
Appendix 13 – Target’s historical balance sheet
(Values in million USD)
Table 23 - Target's historical balance sheet; adapted from Target's annual report
Income statement 2015 2016 2017 2018 2019
Revenues 73,785 69,495 72,714 75,356 78,112
Cost of sales (51,997) (48,872) (51,125) (53,299) (54,864)
Gross profit 21,788 20,623 21,589 22,057 23,248
SG&A (14,045) (13,356) (15,140) (15,723) (16,233)
Depreciation and amortization (2,213) (2,298) (2,225) (2,224) (2,357)
Operating income 5,530 4,969 4,224 4,110 4,658
Interest expense (607) (1,004) (653) (461) (477)
Other income (expense) - - 59 27 9
Net income before taxes 4,923 3,965 3,630 3,676 4,190
Provisoin for income taxes (1,602) (1,296) (722) (746) (921)
Discounted operations, net of tax 42 68 6 7 12
Net income 3,363 2,737 2,914 2,937 3,281
Balance sheet 2015 2016 2017 2018 2019
Cash and cash equivalents 4,046 2,512 2,643 1,556 2,577
Inventories 8,601 8,309 8,657 9,497 8,992
Other current assets 1483 1169 1264 1466 1333
Total current assets 14,130 11,990 12,564 12,519 12,902
Property plant and equipment, net 25,217 24,658 25,018 25,533 26,283
Operating leases - - - 1965 2236
Other noncurrent assets 915 783 1417 1,273 1,358
Total assets 40,262 37,431 38,999 41,290 42,779
Accounts payable 7,418 7,252 8,677 9,761 9,920
Accrued and other current liabilities 4,236 3,737 4,254 4,201 4,406
Current portion of long-term debt 968 1,719 270 1,052 161
Total current liabilities 12,622 12,708 13,201 15,014 14,487
Long-term debt 11945 11,031 11,317 10,223 11,338
Noncurrent operating lease liabilities - - - 2,004 2,275
Deferred income taxes 823 861 713 972 1122
Other noncurrent liabilities 1915 1878 2059 1780 1724
Total liabilities 27,305 26,478 27,290 29,993 30,946
Common stock 50 46 45 43 42
Additional paid-in capital 5,348 5,661 5,858 6,042 6,226
Retained earnings 8,188 5,884 6,553 6,017 6,433
Acummulated other comprehensive loss (629) (638) (747) (805) (868)
Total equity 12,957 10,953 11,709 11,297 11,833

Amazon to become the undisputed retail champion? | Francisco Morais Correia
- 92 -
Appendix 14 – Target’s historical cash flow statement
(Values in million USD)
Table 24 - Target's historical cash flow statement; adapted from Target's annual report
Cash flow statement 2015 2016 2017 2018 2019
Cash flow - operating activities
Net income 3,363 2,737 2,914 2,937 3,281
Earnings from discontinued operations, net of tax (42) (68) (6) (7) (12)
Depreciations and amortizations 2,213 2,298 2,476 2,474 2,604
Stock-based compensation 115 113 112 132 147
Deferred taxes (322) 41 (188) 322 178
Gain on sale (620) - - - -
Loss on debt extinguishment - 422 123 - 10
Non-cash and other, net 57 - 208 95 29
Non-cash expenses 1,401 2,806 2,725 3,016 2,956
Inventories (316) 293 (348) (900) 505
Other assets 227 36 (156) (299) 18
Accounts payable and accrued liabilities 579 (543) 1,726 1,216 339
Cash provided by operating activities—discontinued
operations704 107 74 3 18
Changes in working capital 1,194 (107) 1,296 20 880
Cash from operating activities 5,958 5,436 6,935 5,973 7,117
Cash flow from investing activities
Capital expenditures (1,438) (1,547) (2,533) (3,516) (3,027)
Proceeds from disposal of property and equipment 28 46 31 85 63
Proceeds from sale of businesses 1,875 - - - -
Acquisitions, net of cash acquired, and other - - (518) - -
Other investments 24 28 (55) 15 20
Cash provided by investing activities—discontinued
operations19 - - -
Cash from investing activities 508 (1,473) (3,075) (3,416) (2,944)
Cash flow from financing activities
Change in commercial paper, net - - - - -
Proceeds from long-term debt - 1,977 739 - 1,739
Repayments of long-term debt (85) (2,641) (2,192) (281) (2,069)
Dividends paid (1,362) (1,348) (1,338) (1,335) (1,330)
Repurchase of stock (3,483) (3,706) (1,046) (2,124) (1,565)
Principal repayments of capital and finance lease
obligations300 221 108 96 73
Cash from financing activities (4,630) (5,497) (3,729) (3,644) (3,152)
Net change in cash 1,836 (1,534) 131 (1,087) 1,021
Cash and equivalents, beggining of the period 2210 4,046 2,512 2,643 1,556
Cash and equivalents, end of the period 4,046 2,512 2,643 1,556 2,577

Católica Lisbon SBE | MSc in Finance Thesis | Mergers & Acquisitions | 2020
- 93 -
Appendix 15 – Amazon’s revenues forecast
(Values in million USD)
Table 25 - Amazon's revenue forecast by business segment
Appendix 16 – Amazon’s forecasted income statement
(Values in million USD)
Table 26 - Amazon's forecasted income statement
2015 2016 2017 2018 2019 2020e 2021e 2022e 2023e 2024e 2025e 2026e
Online stores revenues 76,863 91,431 108,354 122,987 141,247 166,309 192,752 218,002 245,035 272,724 298,823 323,924
growth (%) 19.0% 18.5% 13.5% 14.8% 17.7% 15.9% 13.1% 12.4% 11.3% 9.6% 8.4%
Online stores revenues as a percentage of total revenues 71.8% 67.2% 60.9% 52.8% 50.4% 46.6% 43.4% 41.3% 40.1% 39.0% 37.8% 36.9%
Third-party seller services revenues 16,086 22,993 31,881 42,745 53,762 72,095 96,030 121,190 143,489 167,882 191,722 213,578
growth (%) 42.9% 38.7% 34.1% 25.8% 34.1% 33.2% 26.2% 18.4% 17.0% 14.2% 11.4%
Third-party seller services revenues as a percentage of total revenues 15.0% 16.9% 17.9% 18.4% 19.2% 20.2% 21.6% 23.0% 23.5% 24.0% 24.3% 24.3%
Total e-commerce revenues 92,949 114,424 140,235 165,732 195,009 238,404 288,782 339,193 388,524 440,606 490,545 537,502
growth (%) 23.1% 22.6% 18.2% 17.7% 22.3% 21.1% 17.5% 14.5% 13.4% 11.3% 9.6%
Total e-commerce revenues as percentage of total revenues 86.9% 84.1% 78.8% 71.2% 69.5% 66.8% 65.1% 64.3% 63.6% 63.0% 62.1% 61.2%
US online retail industry value 208,826 241,337 256,417 282,343 308,917 335,560 364,255 388,998
growth (%) 11.9% 15.6% 6.2% 10.1% 9.4% 8.6% 8.6% 6.8%
Online stores revenues and US online retail industry growth differencial 0.0338 bp 0.1226 bp 0.0339 bp 0.0544 bp 0.0912 bp 0.0735 bp 0.0631 bp
Third-party seller services revenues and US online retail industry - growth differential 0.2737 bp 0.3241 bp 0.2397 bp 0.1636 bp 0.2548 bp 0.2465 bp 0.1941 bp
AWS revenues 7,880 12,219 17,459 25,655 35,026 53,625 75,128 96,164 119,725 146,064 175,277 206,827
growth (%) 55.1% 42.9% 46.9% 36.5% 53.1% 40.1% 28.0% 24.5% 22.0% 20.0% 18.0%
AWS revenues as a percentage of total revenues 7.4% 9.0% 9.8% 11.0% 12.5% 15.0% 16.9% 18.2% 19.6% 20.9% 22.2% 23.6%
US Cloud computing industry value 40,735 52,935 68,018 85,387 107,899 137,584 175,927 225,774
growth (%) 34.3% 29.9% 28.5% 25.5% 26.4% 27.5% 27.9% 28.3%
AWS revenues and US Cloud computing industry - growth differential 0.2511 bp 0.1439 bp 0.2141 bp 0.1016 bp 0.2559 bp 0.1223 bp (0.0033) bp
Subscription services revenues 4,467 6,394 9,721 14,168 19,210 26,375 33,576 40,761 47,487 54,182 60,792 66,385
growth (%) 43.1% 52.0% 45.7% 35.6% 37.3% 27.3% 21.4% 16.5% 14.1% 12.2% 9.2%
Subscription services as percentage of total sales 4.2% 4.7% 5.5% 6.1% 6.8% 7.4% 7.6% 7.7% 7.8% 7.7% 7.7% 7.6%
Number of Amazon Prime users 54 65 90 101 112 124 133 138.9 143
growth (%) 35.0% 20.4% 38.5% 12.2% 10.9% 10.7% 7.3% 4.4% 3.0%
Subscription services revenues and number of Amazon Prime users - growth differential 0.2277 bp 0.1357 bp 0.3352 bp 0.2470 bp 0.2659 bp 0.2004 bp 0.1696 bp 0.1355 bp
Physical stores revenues 0 0 5,798 17,224 17,192 18,585 20,257 21,331 21,992 22,454 22,678 22,814
growth (%) 197.1% (0.2%) 8.1% 9.0% 5.3% 3.1% 2.1% 1.0% 0.6%
Physical stores revenues as a percentage of total revenues 0.0% 0.0% 3.3% 7.4% 6.1% 5.2% 4.6% 4.0% 3.6% 3.2% 2.9% 2.6%
US physical retail industry value 5,530,734 5,718,150 5,926,047 6,134,961 6,357,624 6,585,484 6,817,548 7,454,426
growth (%) 3.6% 3.4% 3.6% 3.5% 3.6% 3.6% 3.5% 9.3%
Physical stores revenues and US physical retail industry - growth differential (0.0038) bp 0.0387 bp 0.0250 bp 0.0162 bp 0.0104 bp (0.0530) bp
Other revenues 1,710 2,950 4,653 10,108 14,085 20,001 26,021 30,210 33,231 36,554 40,210 44,231
growth (%) 72.5% 57.7% 117.2% 39.3% 42.0% 30.1% 16.1% 10.0% 10.0% 10.0% 10.0%
Other revenues as percentage of total revenues 1.6% 2.2% 2.6% 4.3% 5.0% 5.6% 5.9% 5.7% 5.4% 5.2% 5.1% 5.0%
Amazon's total revenues 107,006 135,987 177,866 232,887 280,522 356,989 443,764 527,659 610,958 699,860 789,502 877,760
growth (%) 20.2% 27.1% 30.8% 30.9% 20.5% 27.3% 24.3% 18.9% 15.8% 14.6% 12.8% 11.2%
Income statement 2015 2016 2017 2018 2019 2020 2021 2022 2023 2024 2025 2026
Revenues 107,006 135,987 177,866 232,887 280,522 356,989 443,764 527,659 610,958 699,860 789,502 877,760
Cost of sales (71,651) (88,265) (111,934) (139,156) (165,536) (208,365) (255,718) (300,672) (343,601) (390,313) (436,944) (482,768)
Gross profit 35,355 47,722 65,932 93,731 114,986 148,624 188,046 226,987 267,358 309,547 352,559 394,992
Fulfillment (13,410) (17,619) (25,249) (34,027) (40,232) (52,708) (66,689) (80,499) (94,816) (109,779) (125,032) (140,081)
Technology & content (5,254) (7,233) (10,069) (13,814) (18,878) (21,877) (27,680) (33,412) (39,354) (45,564) (51,896) (58,142)
Marketing (12,540) (16,085) (22,620) (28,837) (35,931) (47,257) (59,792) (72,174) (85,010) (98,425) (112,101) (125,593)
General & adminstrative (1,747) (2,432) (3,674) (4,336) (5,203) (7,068) (8,943) (10,795) (12,715) (14,721) (16,767) (18,785)
Other (171) (167) (214) (296) (201) (468) (593) (715) (843) (976) (1,111) (1,245)
Operating income 2,233 4,186 4,106 12,421 14,541 19,245 24,350 29,392 34,620 40,083 45,652 51,147
Interest income 50 100 202 440 832 1,224 1,616 2,008 2,400 2,792 3,184 3,576
Interest expense (459) (484) (848) (1,417) (1,600) (1,783) (1,966) (2,149) (2,332) (2,515) (2,698) (2,881)
Other income (expense) (256) 90 346 (183) 203 - - - - - - -
Net income before taxes 1,568 3,892 3,806 11,261 13,976 18,686 24,000 29,251 34,688 40,360 46,138 51,842
Provision for income taxes (950) (1,425) (769) (1,197) (2,374) (3,551) (4,728) (5,905) (7,082) (8,259) (9,436) (10,613)
Equity method investment activity, net of tax (22) (96) (4) 9 (14) (16) (18) (20) (22) (24) (26) (28)
Net income 596 2,371 3,033 10,073 11,588 15,119 19,254 23,326 27,584 32,077 36,676 41,201

Amazon to become the undisputed retail champion? | Francisco Morais Correia
- 94 -
Appendix 17 – Amazon’s beta computation
Table 27 - Amazon's beta computation
Appendix 18 – Amazon’s discounted cash flow model
(Values in million USD)
Table 28 - Amazon's discounted cash flow model
Levered beta 0.762
Tax rate 27%
Net debt to EV 5.63%
Equity to EV 94.37%
Unlevred beta 0.730
Adjusted beta 0.820
DCF 2019 2020 2021 2022 2023 2024 2025 TV 2026
Revenues 280,522 356,989 443,764 527,659 610,958 699,860 789,502 877,760
EBITDA 34,165 43,417 53,703 63,927 74,336 84,980 95,731 106,407
EBIT 12,376 16,903 22,034 27,102 32,356 37,845 43,440 48,961
NOPAT 11,360 14,931 18,942 22,908 27,008 31,281 35,631 39,927
Depreciations and amortizations 21,789 26,514 31,669 36,825 41,980 47,136 52,291 57,447
Changes in working capital (2,438) (3,437) (4,535) (5,633) (6,731) (7,829) (8,927) (10,025)
Capital expenditures (16,861) (20,206) (23,390) (26,575) (29,759) (32,944) (36,128) (39,312)
FCFF 13,850 17,801 22,686 27,524 32,498 37,644 42,868 48,036
Terminal Value 1,521,395
Discount factor 0.93 0.87 0.81 0.75 0.70 0.66 0.61
Discounted cash flow 1,600,606 16,593 19,710 22,290 24,532 26,487 28,114 1,462,880
Enterprise Value 1,600,606
implied EV / EBITDA 15.04x
Financial debt 90,671
Cash and cash equivalents 71,391
Minority interests 141
Equity value 1,620,027
Number of shares 501.75
Implied share price 3,229
Actual share price 3,110

Católica Lisbon SBE | MSc in Finance Thesis | Mergers & Acquisitions | 2020
- 95 -
Appendix 19 – Amazon’s trading multiples valuation
Table 29 - Amazon's trading multiples valuation
Appendix 20 – Target’s revenues forecast
(Values in million USD)
Table 30 - Target's revenues forecast by business segment
Company name Industry EV / Sales EV / EBITDA EV / EBIT P/E
Amazon E-commerce 6.0x 47.7x 120.5x 147.0x
Alibaba E-commerce 9.3x 53.2x 157.9x 173.5x
JD.com E-commerce 1.2x 63.3x 136.1x 157.1x
Wayfair E-commerce 3.1x - - -
Ocado E-commerce 8.8x - - -
eBay E-commerce 3.7x 63.4x 143.2x 172.0x
Apple Technology 7.2x 25.1x 36.8x 39.9x
Alphabet Technology 6.4x 21.9x 37.3x 36.2x
Microsoft Technology 11.8x 26.4x 33.2x 38.0x
Oracle Technology 4.3x 19.3x 37.3x 32.1x
IBM Technology 1.4x 12.2x 18.5x 17.8x
Netflix Entertainment 17.7x 21.1x 82.9x 165.6x
Target Retail 0.9x 10.1x 16.3x 23.8x
Walmart Retail 0.4x 4.2x 4.1x 5.3x
Costco Retail 0.9x 14.8x 30.0x 39.9x
Lowe's Retail 1.2x 13.9x 17.8x 28.4x
Average 5.2x 26.8x 57.8x 71.5x
Weighted average 6.2x 49.2x 121.0x 146.0x
Median 3.7x 21.1x 36.8x 38.0x
Minimum 0.4x 4.2x 4.1x 5.3x
Maximum 17.7x 63.4x 157.9x 173.5x
2015 2016 2017 2018 2019 2020e 2021e 2022e 2023e 2024e 2025e 2026e
Beauty and household essentials revenues 19,184 15,289 18,364 19,296 20,616 21,647 22,469 23,009 23,308 23,378 23,424 23,448
growth (%) 0 (20.3%) 20.1% 5.1% 6.8% 5.0% 3.8% 2.4% 1.3% 0.3% 0.2% 0.1%
Beauty and household essentials revenues as a percentage of revenues 26.0% 22.0% 25.3% 25.6% 26.4% 26.7% 26.8% 26.7% 26.8% 26.7% 26.6% 26.6%
US beauty and household essentials industry value 1,059,598 1,113,538 1,172,392 1,235,701 1,301,603 1,369,561 1,439,110 1,510,849
growth (%) 4.3% 5.1% 5.3% 5.4% 5.3% 5.2% 5.1% 5.0%
Beauty and household essentionals revenues and US beauty and household essentials industry - growth
differential0.2171 bp (0.2539) bp 0.1483 bp (0.0032) bp 0.0151 bp (0.0022) bp (0.0128) bp (0.0258) bp
Food and beverage revenues 15,495 15,289 14,256 14,585 15,039 15,385 15,739 16,227 16,275 16,292 16,324 16,341
growth (%) 0 (1.3%) (6.8%) 2.3% 3.1% 2.3% 2.3% 3.1% 0.3% 0.1% 0.2% 0.1%
Food and beverage revenues as a percentage of revenues 21.0% 22.0% 19.6% 19.4% 19.3% 19.0% 18.8% 18.9% 18.7% 18.6% 18.6% 18.5%
US Food and groceries industry value 3,455,746 3,564,761 3,679,903 3,800,806 3,926,193 4,053,018 4,180,944 4,709,808
growth (%) 3.3% 3.2% 3.2% 3.3% 3.3% 3.2% 3.2% 12.6%
Food and beverage revenues and US Food and groceries industry - growth differential (0.0163) bp (0.0448) bp (0.0999) bp (0.0098) bp (0.0019) bp (0.0093) bp (0.0086) bp (0.0955) bp
Apparel and accessories revenues 14,019 13,899 13,323 13,434 14,304 15,076 15,845 16,543 16,989 17,295 17,451 17,555
growth (%) (0.9%) (4.1%) 0.8% 6.5% 5.4% 5.1% 4.4% 2.7% 1.8% 0.9% 0.6%
Apparel and accessories as a percentage of total revenues 19.0% 20.0% 18.3% 17.8% 18.3% 18.6% 18.9% 19.2% 19.5% 19.7% 19.8% 19.9%
US Apparel industry value 565,354 592,976 604,546 627,389 651,687 676,658 703,139 728,061
growth (%) 4.3% 4.9% 2.0% 3.8% 3.9% 3.8% 3.9% 3.5%
Apparel and accessories revenues and US apparel industry - growth diffrential (0.0574) bp (0.0610) bp (0.0295) bp 0.0260 bp 0.0157 bp 0.0119 bp 0.0086 bp
Home furnishings and décor revenues 12,543 13,204 13,672 14,298 14,430 14,603 14,720 14,823 14,912 14,957 14,987 15,002
growth (%) 1.6% 5.3% 3.5% 4.6% 0.9% 1.2% 0.8% 0.7% 0.6% 0.3% 0.2% 0.1%
Home furnishings and décor revenues as a percentage of total revenues 17% 19.0% 18.8% 19.0% 18.5% 18.0% 17.6% 17.2% 17.1% 17.1% 17.0% 17.0%
US furniture industry value 279,795 292,233 305,555 319,657 334,552 350,204 366,404 382,949
growth (%) 7.1% 4.4% 4.6% 4.6% 4.7% 4.7% 4.6% 4.5%
Home furnishings and décor revenues growth and US furniture industry - growth differential 0.0988 bp 0.1455 bp 0.1424 bp 0.1436 bp 0.1381 bp 0.1333 bp 0.1295 bp 0.1271 bp
Hardlines revenues 12,543 11,814 12,062 12,709 12,595 13,162 13,741 14,181 14,337 14,408 14,451 14,466
growth (%) (4.0%) (5.8%) 2.1% 5.4% (0.9%) 4.5% 4.4% 3.2% 1.1% 0.5% 0.3% 0.1%
Hardlines as a percentage of total revnues 17.0% 17.0% 16.6% 16.9% 16.1% 16.2% 16.4% 16.5% 16.5% 16.4% 16.4% 16.4%
US Consumer electrics industry value 379,067 395,979 420,068 433,751 452,506 471,603 492,206 511,757
growth (%) 5.6% 4.5% 6.1% 3.3% 4.3% 4.2% 4.4% 4.0%
Hardlines revenues and US Consumer electrics industry - growth differential (0.1028) bp (0.0399) bp 0.0211 bp (0.0522) bp 0.0028 bp 0.0003 bp (0.0077) bp
Other revenues 0 0 1,037 1,034 1,128 1,210 1,249 1,287 1,301 1,307 1,311 1,312
growth (%) - - - (0.3%) 9.1% 7.3% 3.2% 3.0% 1.1% 0.5% 0.3% 0.1%
Other revenues as a percentage of total revenues - - 1.4% 1.4% 1.4% 1.5% 1.5% 1.5% 1.5% 1.5% 1.5% 1.5%
Target's total revenues 73,785 69,495 72,714 75,356 78,112 81,083 83,763 86,068 87,121 87,636 87,948 88,124
growth (%) 1.6% (5.8%) 4.6% 3.6% 3.7% 3.8% 3.3% 2.8% 1.2% 0.6% 0.4% 0.2%

Amazon to become the undisputed retail champion? | Francisco Morais Correia
- 96 -
Appendix 21 – Target’s forecasted income statement
(Values in million USD)
Table 31 - Target's forecasted income statement
Appendix 22 – Target’s beta computation
Levered beta 0.974
Tax rate 27%
Net debt to EV 3.67%
Equity to EV 96.33%
Unlevred beta 0.861
Adjusted beta 0.983
Table 32 - Target's beta computation
Appendix 23 – Target’s discounted cash flow model
(Values in million USD)
Table 33 - Target's discounted cash flow model
Income statement 2015 2016 2017 2018 2019 2020 2021 2022 2023 2024 2025 2026
Revenues 73,785 69,495 72,714 75,356 78,112 81,083 83,763 86,068 87,121 87,636 87,948 88,124
Cost of sales (51,997) (48,872) (51,125) (53,299) (54,864) (57,158) (59,047) (60,672) (61,415) (61,778) (61,998) (62,121)
Gross profit 21,788 20,623 21,589 22,057 23,248 23,925 24,716 25,396 25,707 25,859 25,951 26,003
SG&A (14,045) (13,356) (15,140) (15,723) (16,233) (16,233) (16,233) (16,233) (16,233) (16,233) (16,233) (16,233)
Depreciation and amortization (2,213) (2,298) (2,225) (2,224) (2,357) (2,434) (2,514) (2,596) (2,682) (2,769) (2,860) (2,954)
Operating income 5,530 4,969 4,224 4,110 4,658 5,258 5,969 6,567 6,792 6,856 6,858 6,816
Interest expense (607) (1,004) (653) (461) (477) (493) (509) (525) (541) (557) (573) (589)
Other income (expense) - - 59 27 9 - - - - - - -
Net income before taxes 4,923 3,965 3,630 3,676 4,190 4,765 5,460 6,042 6,251 6,299 6,285 6,227
Provisoin for income taxes (1,602) (1,296) (722) (746) (921) (1,096) (1,271) (1,446) (1,621) (1,796) (1,971) (2,146)
Discounted operations, net of tax 42 68 6 7 12 17 22 27 32 37 42 47
Net income 3,363 2,737 2,914 2,937 3,281 3,686 4,211 4,623 4,662 4,540 4,356 4,128
DCF 2019 2020 2021 2022 2023 2024 2025 TV 2026
Revenues 78,112 81,083 83,763 86,068 87,121 87,636 87,948 88,124
EBITDA 6,317 7,015 7,811 8,474 8,711 8,766 8,752 8,684
EBIT 3,713 4,272 4,951 5,517 5,710 5,742 5,712 5,638
NOPAT 3,416 3,851 4,373 4,813 4,982 5,032 5,037 5,010
Depreciations and amortizations 2,604 2,743 2,860 2,957 3,001 3,024 3,040 3,046
Changes in working capital 880 927 967 999 1,014 1,022 1,027 1,029
Capital expenditures (3,027) (3,189) (3,351) (3,513) (3,675) (3,838) (4,000) (4,162)
FCFF 3,873 4,332 4,849 5,257 5,321 5,240 5,104 4,923
Terminal Value 63,544
Discount factor 0.92 0.85 0.79 0.73 0.67 0.62 0.57
Discounted cash flow 79,337 3,800 3,731 3,548 3,151 2,721 2,325 60,059
Enterprise Value 79,337
implied EV / EBITDA 9.14x
Financial debt 16,745
Cash and cash equivalents 7,311
Minority interests 92
Equity value 88,863
Number of shares 500.76
Implied share price 177.46
Actual share price 159.53

Católica Lisbon SBE | MSc in Finance Thesis | Mergers & Acquisitions | 2020
- 97 -
Appendix 24 – Target’s trading multiples valuation
Table 34 - Target's trading multiples valuation
Appendix 25 – Target’s transaction multiples valuation
Table 35 - Target's transaction multiples valuation
Company name Industry EV / Sales EV / EBITDA EV / EBIT P/E
Target Retail 0.88x 10.1x 16.3x 23.8x
Walmart Retail 0.4x 4.2x 4.1x 5.3x
Home Depot Retail 1.3x 12.6x 28.2x 26.3x
Costco Retail 0.9x 14.8x 30.0x 39.9x
Lowe's Retail 1.2x 13.9x 17.8x 28.4x
Best buy Retail 0.3x 9.6x 13.4x 17.7x
Average 0.82x 11.0x 18.7x 23.5x
Median 0.90x 12.6x 17.8x 26.3x
Minimum 0.3x 4.2x 4.1x 5.3x
Maximum 1.3x 14.8x 30.0x 39.9x
xSales xEBITDA xEBIT PER
Aug-17 Whole Foods USA Retailer of natural and organic foods Amazon 100% 13,430 27% 0.86x 9.94x 15.71x 27.10x
Sep-17 Staples USA Office supplies retail companySycamore
Parteners100% 6,900 12% 0.36x 29.33x - -
May-18 Ocado Group UKOnline retail and distribution of
groceriesKroger 5% 135 5.6% 3x 57.75x 277x 3,451x
Jan-14Harris Teeter
SupermarketsUSA
Engaged in operating a chain of food
retail storesKroger 100% 2,443 5.2% 0.56x 8.80x 16.51x 24.21x
Feb-19 Sears USA Apparel reatailer ELS Investments 100% 5,200 - - - - ~-
Apr-20Smart
FoodserviceUSA
Operator of small cash and carry
department stores
US Food
Holdings100% 970 - 0.88x 11.41x - -
Oct-18 SuperValu USAGrocery store retailer of natural food
and related products
Unied Natural
Foods100% 1,250 52.7% 0.20x 7.22x 14.59x 26.00x
Apr-16The Fresh
MarketUSA Grocery supermaket chain operator
Apollo Global
Management100% 1,340 24% 0.72x 7.53x 12.31x 21.59x
Mar-11Netto
FoodstroresUK Discount supermaket chain operator ASDA 100% 1,158 - 1.04x 34.15x 102.30x 371.36x
Apr-19 ASDA UKCompany enagaged in consumer retail
activitiesJ Sainsbury 100% 9,052 - 0.33x 6.26x 10.20x -
Average 21.1% 0.9x 19.2x 64.1x 110.8x
Median 18.0% 0.7x 9.9x 15.7x 26.6x
Minimum 5.2% 0.2x 6.3x 10.2x 21.6x
Maximum 52.7% 2.8x 57.8x 277.4x 3,451x
EV
(in $m)
Implied multiplesCountry
Premium
(in %)Date Target Business overview Acquiror % acquired

Amazon to become the undisputed retail champion? | Francisco Morais Correia
- 98 -
Appendix 26 – Combined entity’s discounted cash flow model without synergies
(Values in million USD)
Table 36 - Combined entity’s discounted cash flow model without synergies
Appendix 27 – Combined entity’s discounted cash flow model with synergies
(Values in million USD)
Table 37 - Combined entity’s discounted cash flow model with synergies
DCF 2020 2021 2022 2023 2024 2025 TV 2026
Revenues 438,072 527,528 613,727 698,080 787,497 877,451 965,883
Cost of sales (265,523) (314,766) (361,344) (405,015) (452,091) (498,941) (544,889)
Gross profit 172,549 212,762 252,383 293,065 335,406 378,510 420,994
Other operating expenses (148,046) (182,443) (216,425) (251,653) (288,467) (326,000) (363,032)
EBITDA 50,432 61,514 72,401 83,047 93,746 104,483 115,091
EBIT 21,175 26,985 32,619 38,066 43,587 49,152 54,599
NOPAT 18,781 23,315 27,721 31,990 36,313 40,668 44,937
Depreciations and amortizations 29,257 34,530 39,782 44,981 50,159 55,331 60,493
Changes in working capital (2,510) (3,568) (4,634) (5,717) (6,807) (7,900) (8,996)
Capital expenditures (23,395) (26,742) (30,088) (33,435) (36,781) (40,128) (43,474)
FCFF 17,723 22,134 27,535 32,781 37,820 42,884 47,972
Terminal Value 2,007,895
Discount factor 0.95 0.90 0.85 0.80 0.76 0.72
Discounted cash flow 20,950 24,668 27,797 30,354 32,578 1,478,252
Enterprise Value 1,614,599
DCF 2020 2021 2022 2023 2024 2025 TV 2026
Revenues 438,072 527,921 614,620 699,573 789,700 878,608 966,532
E-commerce 238,404 289,071 339,871 389,690 442,368 491,526 538,040
Synergies assumed 0% 0.1% 0.2% 0.3% 0.4% 0.2% 0.1%
AWS 53,625 75,128 96,164 119,725 146,064 175,277 206,827
Synergies assumed 0% 0% 0% 0% 0% 0% 0%
Subscription services 26,375 33,576 40,761 47,487 54,182 60,792 66,385
Synergies assumed 0% 0% 0% 0% 0% 0% 0%
Physical stores 99,668 104,125 107,614 109,441 110,531 110,803 111,049
Synergies assumed 0% 0.1% 0.2% 0.3% 0.4% 0.2% 0.1%
Other revenues 20,001 26,021 30,210 33,231 36,554 40,210 44,231
Synergies assumed 0% 0% 0% 0% 0% 0% 0%
Cost of sales (265,523) (314,608) (360,982) (404,408) (451,412) (497,694) (544,616)
Synergies assumed 0% (0.1%) (0.1%) (0.2%) (0.2%) (0.3%) (0.1%)
Other operating expenses (148,046) (182,055) (216,294) (251,381) (288,129) (325,565) (362,864)
Fulfillment (52,708) (66,356) (80,459) (94,674) (109,614) (124,720) (140,011)
Synergies assumed 0% (0.5%) (0.1%) (0.2%) (0.2%) (0.3%) (0.1%)
Technology & content (21,877) (27,680) (33,412) (39,354) (45,564) (51,896) (58,142)
Synergies assumed 0% 0% 0% 0% 0% 0% 0%
Marketing (47,257) (59,762) (72,138) (84,968) (98,376) (112,045) (125,530)
Synergies assumed 0% (0.1%) (0.1%) (0.1%) (0.1%) (0.1%) (0.1%)
General & adminstrative (23,301) (25,151) (26,974) (28,861) (30,830) (32,934) (34,983)
Synergies assumed 0% (0.1%) (0.2%) (0.3%) (0.4%) (0.2%) (0.1%)
Depreciations and amortizations (2,434) (2,514) (2,596) (2,682) (2,769) (2,860) (2,954)
Synergies assumed 0% 0% 0% 0% 0% 0% 0%
Other (468) (593) (715) (843) (976) (1,111) (1,245)
Synergies assumed 0% 0% 0% 0% 0% 0% 0%
EBITDA 50,432 62,453 73,786 85,419 96,965 226,243 245,697
EBIT 23,809 30,980 37,395 44,089 50,683 56,097 59,994
NOPAT 19,043 24,679 29,630 34,930 40,119 44,117 46,637
Depreciations and amortizations 29,257 34,530 39,782 44,981 50,159 55,331 60,493
Changes in working capital (2,510) (3,568) (4,634) (5,717) (6,807) (7,900) (8,996)
Capital expenditures (23,395) (26,742) (30,088) (33,435) (36,781) (40,128) (43,474)
FCFF 22,395 28,898 34,690 40,760 46,690 51,420 54,660
Terminal Value 2,123,540
Discount factor 0.95 0.90 0.85 0.80 0.76 0.72
Discounted cash flow 27,352 31,078 34,563 37,474 39,063 1,482,439
Enterprise Value 1,651,968
Present value of net synergies 37,369

Católica Lisbon SBE | MSc in Finance Thesis | Mergers & Acquisitions | 2020
- 99 -
Appendix 28 – Accretion / Dilution analysis
(Values in million USD)
Table 38 - Accretion / Dilution analysis
Appendix 29 – Deal summary
(Values in million USD)
Table 39 - Deal summary
2020 2021 2022 2023 2024 2025 2026
Combined NOPAT 19,043 24,679 29,630 34,930 40,119 44,117 46,637
Acquirer NOPAT 14,931 18,942 22,908 27,008 31,281 35,631 39,927
Pro-forma diluted shares outstanding 501.8 501.8 501.8 501.8 501.8 501.8 501.8
Pro-forma combined diluted EPS 38.0 49.2 59.1 69.6 80.0 87.9 92.9
Acquirer standalone EPS 29.8 37.8 45.7 53.8 62.3 71.0 79.6
Accretion / (Dilution) $ 8.2 11.4 13.4 15.8 17.6 16.9 13.4
Accretion / (Dilution) % 27.5% 30.3% 29.3% 29.3% 28.3% 23.8% 16.8%
Bid price 101,455
Bid price per share 202.60
Premium (%) 27%
PV of Synergies 36,261
Transaction fee (518)
Integration costs (1,407)
Net synergies 34,335