
Streaming media: audience and industry shifts in a networked ...
Upload
khangminh22Category
view
0download
0
Communication Laboratory Community and Family Study Center
University of Chicago
Media Monograph
/,'K ..

0audience research
for improving family planning
communication programs
by
JANE T. BERTRAND
Media Monograph 7
Communication Laboratory Community and Family Study Center
University of Chicago

THE MEDIA MONOGRAPH SERIES
Monograph One: Mass Mailings for Family Planning Bjbin Berendtson and Donald J. Bogue
Monograph Two: Twenty-five Communication Obstacles to the Success of Family Planning Programs Donald J. Bogue
Monograph Three: Radio and Television Spot Announcements for Family Planning Bonnie Remsberg, et al.
Monograph Four: Relevant Posters for Family Planning Bj~rn Berendtson, Donald J. Bogue, and George McVicker
Monograph Five: The Use of Radio in Social Development Terry Peigh, Donald J. Bogue, Martin Maloney, and Robert Higgins
Monograph Six: Communications Pretesting Jane T. Bertrand
Monograph Seven: Audience Research for Improving Family Planning Communication Programs Jane T. Bertrand
NOTE: Permissionis hereby freely given to any nonprofitorganizationto reproduce,translateinto other languages,or otherwisepublish partsor all of this report without obtainingpriorwritten consentfrom the authoror publishers.
International Standard Book Number: 0-89836-015-3
Library of Congress Catalog Card Number: 80-66649
© 1980 by The Community and Family Study Center
Printed in the United States of America
Cover design by George McVicker

CONTENTS
Acknowledgements ..... ................. .... vi
Chapter One: Audience Research and the Systematic Approach to I-E-C for Family Planning .... ........ 1
Chapter Two: The Purpose of Audience Research ... ...... 5
Chapter Three: Sample Questionnaire . .......... 12
Chapter Four: Methodological Considerations ........ . . . 49
Chapter Five: Guidelines for Analyzing the Sample Questionnaire ..... .............. ... 56
Chapter Six: Applying the Results to an I-E-C Strategy ..... .. ............... 7
\\

ACKNOWLEDGEMENTS
This monograph was based on audience research conducted in 1976 in rural Guatemala by the Asociaci6n ProBienestar de la Familia (APROFAM), in collaboration with the Community and Family Study Center of the University of Chicago. The questionnaire used in that study was developed in part from a series of questions regarding fertility, family planning, and communications, which Professor Donald J. Bogue had previously assembled from diverse sources.
The author wishes to thank the staff of APROFAM for their role in implementing this study and refining its methodology-in particular, Dr. Roberto Santiso G., Executive Director, for strongly supporting the research-based approach to family planning communication; Maria Antonieta Pineda, Head of the Evaluation Unit for overseeing all aspects of the iesearch process; and Fidel Enrique Soto, Head of the Information and Education Division, for directly participating in the supervision of the data collection and subsequently for implementing the results in APROFAM's communication program.
The author gratefully acknowledges the efforts of the Manuscript Unit of the Community and Family Study Center in the publication of this monograph. Special thanks go to George Rumsey, the CFSC Editor, and to the typing staff: Jim Adler, Mark Halperin, Catherine Howard, Grace Lee, Judith McCarthy, Anne O'Neill, Doug Pappas, B.J. Putterman-Crigger, Cathy Reiff, and Motoko Tamura.
Jane T. Bertrand
Ai

Chapter One
AUDIENCE RESEARCH AND THE SYSTEMATIC APPROACH TO I-E-C FOR FAMILY PLANNING
The family planning movement is well out of its infancy. Most countries in the developing world have had a family planning program for more than a decade, 1 and many are beginning to see the results of their efforts. 2 Indeed, much useful knowledge has been accumulated-often through trial and errorabout the running of an effective family planning program. For example, thedelivery of services through clinics is gradually being supplemented by more accessible commercial and community-based distribution systems. 3 Cumbersome statistical record systems are being replaced by simplified means of data collection with emphasis on truly useful statistics. 4 Techniques of voluntarysurgical contraception for both men and women have been improved and simplified, making permanent solutions to fertility control more accessible to couples all over the world.
Just as there have been improvements in the delivery of services, so too has there been an evolution in information-education-communication (I-E-C) programs for family planning. Incontrast to the early days when family planningcommunication was often an ad hoc process of hastily designing a pamphlet,poster, or radio spot, today there is a much greater tendency to develop an I-E-C strategy for reaching the target population. s The audience is no longerconsidered as a homogeneous whole, but rather as a series of subgroups each requiring specialized messages directed to its specific interests. The endless repetition of the "small-family-happy-family" theme has been replaced by a much broader motivational appeal, based on such elements as family finances,women's rights, infant health, environmental protection, and also specific motivational appeals regarding the convenience and safety of the methods themselves.

2 AUDIENCE RESEARCH
An integral part of this evolution in I-E-C for family planning has been the
increased use of a systematic or research-basedapproach to communication.
This approach, diagrammed in Figure I-1, allows the communicator to design,
implement, and evaluate an I-E-C program on the basis of concrete, objective
information about the target population rather than on speculation and
hunch. Three types of research useful to I-E-C programs include:
I. Audience Research--to be carried out before designing a new I-E-C
program or a new round of communications. Its purpose (specified in greater
detail in Chapter Two) is to define appropriate content, identify subaudi
ences, detect obstacles, and determine potentially effective channels of com
munication. (Audience research is sometimes referred to as "diagnostic re
search," in that it attempts to "diagnose" the current family planning situa
tion, including existing obstacles, and to prescribe strategies for making I-E-C
efforts more effective.) 2. Pretesting*- -to be perfotired after preliminary message design and be
fore final production and diffusion. Its purpose is to determine tile extent to
which the intended audience understands and accepts tile messages. Pretesting helps eliminate an ineffective communication before large amounts of money
are invested in its production and diffusion. 3. Evaluation--to be conducted at a certain period after the communica
tion is in the field. This period can range from a few weeks after tile onset of
the program (to obtain feedback on how it is being received) to a year or
longer afterwards (to monitor its effect over time). Its purpose is to measure
the effect of the I-E-C program on the target audience in terms of changes in
knowledge, attitudes, and practice. It can also be used to obtain feedback on
the program itself regarding the reach of distinct communications, the audi
ence reaction to these messages, the relative impact of different messages or
spots, or subgroups within the larger population who have been reached to a
lesser extent than others. The purpose of this manual is to describe how to carry out audience re
search, analyze the results, and incorporate them into an I-E-C program for
family planning. Readers interested in knowing more about pretesting are re
*This use of the word "pretesting" should not be confused with the "pretesting of a
questionnaire," that is, the standard procedure of administering a questionnaire to a small number of respondents prior to the interviewing for the actual study, to determine if all the questions are readily understood; the questionnaire is then revised if necessary. Indeed, those who use the sample questionnaire included herein will want to "pretest" it to make sure that the wording and concepts are appropriate to local circumstances (as described in Chapter Four).
In contrast, pretesting communications refers to the process of assessing an audience's reaction to, and comprehension of, a given communication (radio or TV spot, pamphlet, poster, etc.) before it is produced in final form.

3 TIIE SYSTEMATIC APPROACH TO I-E-C
RESEARCH PRODUCTION-DIFnUSION
DIAGNOSTIC RESEARCH: for the design of an I-E-C strategy
--audiences --content --channels
PRELIMINARY DESIGN UPATERIALS PRETESTING:
M.kto measure
audience reaction to materials before final production
FINAL PRODUCTIONOF MA-TERIALS (based on pretest results) and DIFFUSION
SIIORT-TERM EVALUATION OF MATERIALS: in terms of reach and audience reaction
(if necessary) MODIFICATION IN DIFFUSION SYSTEM OR MA
_______________________ TERI ALS~ L.ONG-TERMEVALVATION OF IMPACT OF MATERIALS; also, of some diagnostic elements
BEGIN NEW CYCLE
Figure I-I. Research-Based Approach to I-E-C for Family Planning:
Steps in the Process.

4 AUDIENCE RESEARCH
ferred to a similar manual written by this author, CommunicationsPretesting (Chicago: Community and Family Study Center, TLe University of Chicago, 1978). The third volume in this series on evaluation of communication programs is scheduled for publication at a later date.
Notes
1Nortman, Dorothy L. and Ellen Hofstatter. Populationand FamilyPlan
ning Programs(New York: The Population Courcil, 1978).
2 Tsui, Amy 0. and Donald J. Bogue. "Declining World Fertility: Trends, Causes, Implications." PopulationBulletin 33, Number 4, October, 1978.
3 Foreit, James R., Martin E. Gorosh, Duff G. Gillespie, and C. Gary Merritt. "Community-Based and Commercial Contraceptive Distribution: An Inventory and Appraisal." PopulationReports, Series J, Number 19 (1978).
4 Elkins, Henry and Olivia Schieffelin Nordberg. "Service Statistics: Aid to More Effective Family Planning Program Management." PopulationReports, Series J, Number 17 (1977).
5 Rogers, Everett M. CommunicationStrategiesfor Family Planning(New York: Free Press, 1973), p. 94.

Chapter Two
THE PURPOSE OF AUDIENCE RESEARCH
The chief goal of family planning organizations is to improve the well-beingof the family by providing a means to avoid unwanted pregnancies. It is well documented that excessive childbearing is detrimental to the health of the mother, especially in areas where nutritional standards are low. The birth of each additional child can further strain the limited resources of the family, with the result that the family has increasing difficulty providing the basic necessities for each child.
Whatever the type of family planning organization-governmental or private, "integrated" with other health services or "vertical" (in which the sole purpose is family planning)-the major objectives are first to inform and educate the population about family planning, and second, to make contraceptives readily available to as large asector of the target population as possible. The result of the goals being reached isgenerally referred to as increased contraceptiveuse.
In countries where family planning programs are just starting, their efforts may be initially directed toward women with high-risk pregnancies only.however, in the majority of countries, family planning is promoted for the humanistic reason of improving the health and well-being of the family. In those countries where demographic pressures are exacerbated, family planning is advocated for nationalistic reasons as well. In short, one major objective of most family planning organizations is to increase the number of couples who use family planning.
Consequently, the purpose of audience research is to aid in developing an I-E-C strategy for increasingvoluntary contraceptive use. Theoretically, "audience research" could be applied to any of the distinct subaudiences for family planning:
5

6 AUDIENCE RESEARCH
(a) Active reproducers (generally considered to be men and women 15 to 45 years old)
(b) Leadership "controllers" who set local policy and influence opinion (c) "On-coming reproducers" (young people in and out of schools) (d) Personnel responsible for providing family planning information and
services (e) The public at large. However, the major portion of I-E-C efforts in most family planning organ
izations is directed toward the audience of active reproducers; therefore, this manual deals with audience research in the context of active reproducers.* Specifically, it is important for audience research involving individuals of reproductive age to;
I. Assess the current family planning situation, not only in terms of use, but also in terms of knowledge and attitudes, beliefs, motives, values about family size and spacing, and the methods of contraceptives.
2. Identify factors that influence the acceptance or rejection of family planning within the given population, since these data will serve as a basis for the I-E-C strategy, especially in terms of content.
3. Identify the most effective channels of mass and interpersonal communication; determine the media habits and preferences of the target audience, as well as channels of interpersonal communication-information which will serve as a basis for logistic decisions regarding the diffusion of information.
Audience research combines elements from several different types of research, and yields a unique collection of information that is useful in designing an I-E-C strategy. Readers familiar with the World Fertility Study and contraceptive prevalence studies will recognize certain elements regarding reproductive behavior and contraceptive use. Those familiar with market research will note similarities in terms of detecting current use patterns as well as media habits and preferences. However, relatively little previous work has been done on combining these different approaches in order to provide a tool for improving family planning 1-E-C.
The rationale for obtaining the three types of information is as follows.
1. Assess the current family planning situation In this first aspect, audience research is similar to (though more sophisti
cated than) the knowledge-attitude-practice (K-A-P) surveys of the 1960s and early 1970s. Many of the items included in the questionnaire contained in this manual were originally used in K-A-P surveys in different parts of the world. The difference between K-A-P surveys and audience research is that
*Organizations interested in focusing on leaders, adolescents, or other special groups
might use the methodology outlined in this manual for studying their target populations, but should modify the questions in the sample questionnaire to fit their own interests.

7 THE PURPOSE OF AUDIENCE RESEARCH
audience research goes far beyond K-A-P surveys in determining the reasons for lack of contraceptive use and in identifying effective means of reaching the target population in an attempt to counter these barriers.
In comparison to K-A-P research, which was often considered academic in nature, audience research is much more dynamic in that it exists to be used. The questions (variables) to be included are selected on the basis of their usefulness in developing an I-E-C strategy for increasing contraceptive use. (Itshould be emphasized that this practical approach also yields new insights on a number of theoretical, academic questions.)
2. Identify factors that influence acceptance of family planning This second objective represents the most challenging aspect of audience
research, since the situation is often complex. According to other literature on family planning, three sets of factors (see Figure 2-1 ) can be shown to explain attitudes and use of family planning, as follows:
A. Sociodemographicvariables. It is widely documented that acceptance of family planning is greater among thosc with a higher standard of living. Indicators of socioeconomic status include educational achievement, family income,and occupational status, as well as type of housing, nutritional intake (in developing countries), and other indirect measures of income.
Certain demographic variables also predict family planning acceptance in some countries. For example, in most developing countries, contraceptive use
Sociodemographic
factors
Social psychological contraceptive
factors use
Service-related
factors
Figure 2-1. Three Major Factors Affecting the Acceptance of Family Planning.

8 AUDIENCE RESEARCH
is higher among women in their late 20s and 30s who have already had three
or more children. racial (or ethnic) group and religiousFinally, other social factors such as
sect have been documented as influencing this process in a number of differ
ent countries. B. Social psychological variables. It is widely acknowledged that certain at
titudes and beliefs of the target po:,iulation (often based on supposition or ru
mor) are key to the acceptance of family planning. While the list of possible
attitudes representing barriers to family planning is long (see Donald J.
Bogue's Twenty-five Communication Obstaclesto the Success ofFamily Plan
ning Programs'),not all attitudes exist with equal intensity in a given coun
try. Indeed, audience researchattempts to identify those attitudesand beliefs
which prevail waong a given target group and the relative importance of
each for family planning adoption. It should be stressed that audience research can be valuable in initially de
tecting and then countering particular rumors about family planning methods
or services. Specific questions regarding methods and services can be included
in the questionnaire (or in a highly condensed questionnaire if there is interest
in performing a quick survey) that can indicate the nature of prevailing ru
mors or attitudes affecting family planning acceptance.
C. Factorsrelated to service delivery. I-E-C programs are of little measur
able practical value where family planning services are not available. Moreover
the type of family planning service may also greatly influence its acceptabili
ty: clinical distribution versus commercial distribution (pharmacies) versus
community-based distribution. Finally, the variety of available contraceptive
methods must be considered. For example, voluntary surgical contracep
tion is increasingly popular among women who reject the temporary methods
as being ineffective or inconvenient. However, such acceptance is of little
practical value if surgical services are not avalable.
3. Identify the most effective channels of mass and
interpersonal communication In developing an I-E-C strategy, it is crucial to know what types of media
are readily available to the target population, what amount of contact the tar
get population has with each, and what audience preferences are for programs,
stations, and listening times (for radio and TV), or favorite titles and types of
articles (for newspapers and magazines). Moreover, it is important to identify
the interpersonal channels that could be useful in diffusing the message, such
as home visits, group meetings, or informal communication with opinion lead
ers.
The use of data in developing an I-E-C strategy Chapter Three contains a sample questionnaire, designed to provide data

9 THE PURPOSE OF AUDIENCE RESEARCH
on these different aspects of family planning for a specific target population. How can these data be used to develop an I-E-C strategy? Although this question is answered in more detailed terms in Chapter Six, the following overview of the different uses for these data suggests their value in the planning of future I-E-C efforts.
Assessment of the current situation. These data enable the communicator to abide by a basic rule of communication theory: know the audience. In this case, "knowing the audience" refers to assessing the current level of acceptance for family planning so that the communications program can be designed accordingly. The messages appropriate for a population with almost comp!ete acceptance and high levels of use are far different from those needed in an area where family planning is not readily accepted and/or its acceptance faces serious obstacles. While persons with years of experience in a family planning program may be able to speculate on levels of knowledge and use, the results of audience research provide a concrete basis for communication design.
Moreover, these data may provide unexpected insight into the dynamics of a family planning program that might otherwise be neglected. For example, the data could reveal a relative lack of knowledge about a particular method which program planners had thought was well publicized. Similarly, some of tie less widely promoted methods (such as the injection) may prove to have great popular appeal among the target group, a factor which should not be overlooked by the local family planning association.
Finally, the data regarding attitudes and use of specific methods can be valuable in revealing sources of resistance and/or motives for discontinuance of a method. While coinniunications should not dwell on the negative aspects of the given product, a counter-campaign-especially as part of person-toperson activities-can be indispensible in dispelling unfounded rumors.
As such, the data on the current family planning situation serve as a means of determining the potential receptivity of the audience to family planning messages and the degree of knowledge/use among the target population; in addition, they suggest content of the messages aimed at dispelling rumors and reducing discontinuance.
Sociodemographic factors. This information is very useful in identifying subgroups or segments of the target population who are potentially most receptive to family plinning, as well as those most resistant to the concept.
There may be grea ' disparities from one ethnic or regional group to another. Indeed, according to a study conducted in Guatemala, the differences between the Spanish-speaking "ladinos" and the Indian groups were so great that a single "blanket" campaign was ruled out as inappropriate. 2 Rather, it was found that the ladinos were ready for straightforward messages about methods and sources of contraceptives, whereas the Indian groups needed more basi messages about the existence of family planning and its benefits.

10 AUDIENCE RESEARCH
Finally, these data on socioeconomic factors relating to family planning may suggest motivational appeals that could be incorporated into messages. For example, if the data reveal that contraceptive use is higher among working women than among those with no paying job, this would indicate a felt need on the part of some women to avoid a pregnancy that might interfere with their jobs. If some women demonstrate this tendency, it is likely that similar motivations exist among o'her working women who may not as yet be contracepting. In short, one can capitalize on a phenomenon which is already apparent and which can be extended with a positive result.
Social psychologicalfactors. This section of the analysis, while most difficult, is also the most useful in providing meaningful content for family planning messages. Indeed, since there is increasing criticism of "small-familyhappy-family" propaganda, many communicators are asking themselves what should be used in its place.
The inventory of social psychological obstacles to family planning, provided by audience research, indicates the problem areas to be tackled through a communicator's program. While the research may reveal some topics too sensitive to attack (such as religious and moral beliefs), it shows that most topics do lend themselves to messages via one medium or more. In fact, the creative department of an organization, or even an outside advertising agency contracted to do a family planning campaign, may indeed welcome the new approaches provided by audience research.
In short, the main use for this information on social psychological obstacles to family planning is content of the communication program. It especially helps a communicator to determine the relative importance of different obstacles (as well as to identify those factors which apparently do not represent obstacles) so that appropriate attention can be given to the different topics.
Service-related variables. These data provide valuable feedback on previous family planning program activities, and suggest the reach and effectiveness of distinct activities. For example, if few people have received a home visit, but those who have are far more likely to be contracepting, then this activity could be given higher priority in planning the overall communication program. By contrast, if a relatively large percentage of respondents have received a visit, but they are no more likely than others to be using contraceptives, then the program director might want to consider making such visits more effective or investing those funds in other activities. Responses to the open-ended questions on the different activities may provide suggestions.
This section of the diagnostic study also provides information on the allimportant question of perceived availability of contraceptives. If the target population does not know local sources for obtaining contraceptives, then the effect of a motivational campaign will be small indeed. In such a case, the communication program should focus heavily on sources of contraceptives. On the other hand, if most respondents could name one or more sources of contraceptives but are not using them, then it becomes necessary to identify

THE PURPOSE OF AUDIENCE RESEARCH I I
the reasons for this nonuse. Many of these reasons will be apparent in other sections of the questionnaire.
Mass and interpersonalchannelsof conmunuication.This final aspect of the study is invaluable in making decisions regarding the use of the media. For example, the findings indicate the frequency with which the target populationis exposed to the various media and thus would be potential recipients of family planning messages. For organizations with limited b'dgets, the findings suggest media that could be eliminated from the media mix to be used in the campaign, and indic,,te priorities to be given to one over another.
Once the overall priorities are determined, these data will provide gfidelines for the placement of family planning messages. For example, if radio proves to be one of the most important media to be used, then the communi. cator will need to know the peak listening times, popular stations, and favorite programs, in order to capture as large an audience as possible for the messages.
The sample questionnaire also provides feedback on existing media efforts that may aid in planning for future campaigns. For example, an organizationwith a limited budget may only be able to afford four messages a day on the leading radio station. The I-E-C chief may worry that this is not enough to have an impact, and that other activities should be neglected so that radio coverage can be improved. However, if the research reveals that the vast majority of respondents report having heard a family planning message at least once a day, then ,o I L-t _!,efW might want to reconsider and (for example) invest th," . .,,onal funds in more person-to-person activities.
Finally, it is important to identify patterns in interpersonal communication. If a given family member or community figure emerges as a key link in informal communication on family planning, then future program activitiesespecially those involving person-to-person communication-could try to capitalize on this individual's natural role in the communication process.
The questionnaire that provides information on these different aspects of family planning among the target audience is presented in the following chapter.
Notes
1Bogue, Donald J.Tiventy-five Communication Obstacles to the Success of Family Planning Programs (Chicago: Community and Family Study Center, The University of Chicago, 1975).
2APROFAM and CSC. Perspectivas para la Planificaci6n Familiar en Areas Rurales de Guatemafa (Chicago: Community and Family Study Center, The University of Chicago, !978).

Chapter Three
SAMPLE QUESTIONNAIRE
The purpose of this sample questionnaire is to indicate the range of possible
items that can be included in an interview. The actual amount and type of inthree factors: available resources,formation to be collected will depend on
local circumstances, and other sources of information. Available resources. Before undertaking this type of study, the researcher
should assess the available resources in terms of personnel, time, and funds.
If the personnel to be involved in conducting the field work and analyzing
the data have had only limited experience in this area, it might be advisable to
shorten the interview by omitting certain questions or sections, and thus
simplify their task. If time is a factor, it might be necessary to shorten the
questionnaire in an effort to cut down on the time required not only for
interviewing, but also for coding and tabulating. Shortening the required time
would also reduce the overall cost of the study, and should be considered if
there are financial constraints to carrying out the research. It should also be mentioned that one relatively inexpensive means of ob
taining data is to "piggy-back" (add on) family planning questions to aquesa related topic such as health, nutrition, ortionnaire used for research on
agriculture. While this method can yield a large savings, it has the disadvantage
of limiting the number of questions that can be included; it also makes it dif
ficult to control the research process. Local circumstances. In the following nuestionnaire, an attempt has been
anmade to include as many items as possible in order to give idea of the
large range of available topics. However, not all will apply to every country
or every situation. For example, if there is only one existing religion in an
area, questions about religious sects would be meaningless since everyone
12

13 SAMPLE QUESTIONNAIRE
would be expected to answer in the same way (no variance in response). Likewise, if television has not yet come to the area, it would be useless to include items on this topic; even if a handful of respondents have seen television elsewhere, it does not represent a potatial channel of communication for the target population.
Other sources of information. It is possible that some of the information which the researcher wishes to obtain has already been collected and reported in connection with other studies of the target population. Thus, it may not be necessary to devote as much attention to these items; instead, the researcher can concentrate on other "unexplored" areas.
The items incuded in the sample questionnaire represent possible questions to be included in a diagnostic interview. Each individual researcher should be selective in choosing what to include in any particularstudy.
The questions in the following questionnaire are arranged in an appropriate order for actual interviewing, rather than the exact order in which these topics were presented in Chapter Two. However, the items are reorganized by topic in Chapter Five in discussing procedures for analysis.

14 AUDIENCE RESEARCH
SAMPLE QUESTIONNAIRE
Code
No. of
A. Control Data (to be completed by the interviewer)* cola.
1. Case Number: 4
2. Name of interviewer: 2
3. Month of interview: 2
4. Year of inter'iew? _________ 2
5. Name of town or city: 2
6. Name of state (or department, etc.): 2
B. Reproductive Ideals
1. What is the best age for a girl to marry?
99. Don't know (DK)
2. What is the best age for a boy to marry?
99. DK
3. How long should a couple wait after getting married to have their first child? (code in months): 2
4. What Is tlhe ideal number of children that a couple in this community should have during
their lifetime?
children 2
77. Number that come, that God sends
99. DK
5. Before my visit (this interview) today, have you ever thought about the number of children
you want to have?
1. yes I
2. no
6. (ONLY FOR WOMEN) Before this interview (visit), had you ever worried about an accidental pregnancy (getting pregnant when you didn't want another child)?
1. yes 1
2. no
B. __ not applicable (male respondent)
*Usually the name and address of the respondent is
also obtained, but not coded.

SAMPLE QUESTIONNAIRE
Code
No.
7. (IFYES) How often have you worried about of this? col5.
1. often 1
2. once in a while
3. almost never
4. -- _ not applicable (NA)
9. DK
8. If you were recently married and could have just the number of children ycu wanted, how many would you want to have?
children 2 77. Number that come, that God sends
99. DK
(9-10) Of the total number (of desired children), how many boys and how many girls would you want?
9. Boys.: children 2
77. __ Number that come, that
God sends
99. DK
10. Girls: children 2
77. Number that come, that God sends
99. DK
(11-12) Some people talk about families with "too many children" or "too few children." For you, how Laay is:
11. "Too many children": 2
99. DK
12. "Too few children": 2 99. DK
13. Some people say it is best to have a large family with at least 4 children, while others think a small family of only 2 or 3 children is better. Which do you think is best:
1. a large family
2. a small family
3. indifferent, it's the same
9. DK
14. (IF"LARGE" ASK) Why?
88. NA
99. DK

16 AUDIENCE RESEARCH
Code
No.
of cols.
15. (IF"SHALL"ASK) Why?
2
88. NA
99. DK
16. How long should a couple wait between the birth of one child and the next? (CODE IN MONTHS):
2months
77. What God wishes
99. DK
C. Marital Status
1. Marital Status: Are you:
1. _ Single
2. Married
3. _ Living in consensual union
4. _ Separated
5. Divorced
6. Widowed
D. Pregnancy History (1I-.Q L
1. How many children have you had that are currently living?
children 2
(2-3) Of these, how many are:
22. Male:
23. Female:
4. How many children have you had who were born alive but have died since then?
children who have died 2
5. How old is the last child you had (or how old would he have been? (CODEIN MONTHS)
months 3
6. How many miscarriages have you had?
miscarriages
7. How many times have you had an abortion (induced)?
abortions

17 SAMPLE QUESTIONNAIRE
Code
No. Of
B. Are you currently pregnant? Colo.
1. -- yes 1 2. no
3. _ maybe, unsure
9. (IF UNCERTAIN) When was your last menstrual period?
weeks ago 2 88. NA
BASED ON THIS INFORMATION, THE INTERVIEWER RE-CHECKS WITH THE RESPONDENTON THE FOLLOWING TOTALS:
10. Total Number of Live Births (Items 1 + 4) 2
11. Total Number of Pregnancy Losses (Items 2
6 + 7) _
12. Total Number of Pregnancies (Items I + 4 +6 + 7) (NOTE: UNLESS THERE HAVE BEEN MUL-TIPLE BIRTHS OR THE RESPONDENT IS CURRENTLYPREGNANT):
2 13. So you think you could become pregnant now
if you wanted to?
1. - . yes (fertile 1 2. - no (sterile)
3. _ uncertain (possible sterile)
14. (IF "NO" OR "UNCERTAIN") Why?
2
88. NA
99. DK
E. Number of Children (FOR MEN ONLY)
1. How many children do you have (in your curren marriage)?
children 2
2. How many children have you had (in this marriage) that have died?
children have died 2
F. Desire for More Children
1. Do you want to have another child (or to have children, IF NEVER PREGNANT) acme day, or do you have all you want?
1. Wants at least one more 1 2. - Doesn't want any more
3. _ Whatever God sends 9. DK

18 AUDIENCE RESEARCH
Code
No.
of
(or not want) more children? 0:os. 2. Why do you want
2
88. NA
99. DK
3. (IFWANTS "NO MORE") After the birth of which
child did you feel you had enough?
21. after Ist child
2. after 2nd child
3. after 3rd child
etc.
88. NA
99. DK, don't remember
4. (IF WANTS MORE CHILDREN) How many more child7en do you want?
child(ren) 2
77. Whatevei God wishes
88. NA
99. DK
5. Does your spouse want to have more children
or not?
yes1. _
2. no
8. NA (not married or in union)
9. DK
6. (IFYES) How many more children does he (she)
want to have?
children more 2
88. NA
99. DK
C. Importance of Having One or MoreSons
1. How important is it for a family to have at least one son? Would you say it is:
1. very important
2. somewhat important
3. not very important
9. DK

19 SAMPLE QUESTIONNAIRE
Code
2. Suppose that you had four daughters, but no No. sons. Would you try to have a.fifth child of in hopes of having a son or not? Cols.
1. -- yes
2. no
9. DK
3. Suppose you had a family with three daughtersand one son. Would you try to have a fifth child in hopes of having another son, or not?
1. yes
2. no
9. DK
H. Awareness of the Demographic Problem
1. Do you believe that the number of people in this country is increasing, staying about the same, or decreasing?
1. increasing
2. same
3. --_ decreasing
9. DK
2. Do you feel that in this country there are:
1. _ too many people
2. Just the right number of people
3. too few people
9. DK
3. Do you feel the number of people in this country is increasing:
1. too slowly (GO TO QUESTION 1-1)
2. at the right rate (GO TO QUES-
TION 1-1) 3. too rapidly
9. DK
4. (IF "TOO RAPIDLY" ASK) Do you believe that anything should be done to avoid this rapidincrease in the number of people in this country?
1. -- yes
2. no
8. NA (didn't answer "too rapidly")
9. DK

20 AUDIENCE RESEARCH
Code
No. of
(IF "YES") What do you believe should be col5. COle.
done?
2
88. NA (didn't answer "yes")
99. DK
I. Knowledge of Family Planning
1. Some couples today take measures to avoid pregnancy, when they don't want to have a child. This is called "family planning." Have you heard of this?
1. _ yes
2. no
2. (IFNO) There are medicines and other products that can be used to avoid pregnancy. Have you heard of this?
1. yes
2. no
8. NA (answered "yes" above)
J. Husband-Wife Communication (ASK SECTION J ONLY OF PEOPLE WHOARE CURRENTLY MARRIED OR IN UNION)
1. In general, do you talk to your spouse about
family-related problems?
1. yes
2. no
8. NA (no. spouse)
9. DK
2. Have you and your spouse ever talked about the ideal number of children to have?
1. yes
2. no
8. NA (no spouse)
9. DK
3. Have you and your spouse ever talked about using some method of family planning?
1. yes
2. no
A (no spouse)8. N__
9. OK

21 SAMPLE QUESTIONNAIRE
Code
No. Of4. (IF YES) When was the last time you dis
cussed family planning? (CODE IN MONTHS)
monthc ago 3
888. NA
999. __ I), don't remember
5. (IF "YES" TO Q. 3) How many children did you 4;.ready have when you talked about family planning for the first time?
children 2 88. NA (never discussed FP or no
spouse)
99. DK
K. Attitude toward Family Planning
1. In general do you approve or do you disapprove of couples using family planning (or "something to avoid pregnancy")?
1. approve
2. disapprove
3. neutral
2. (IF "APPROVE") Would you say that you
1. strongly approve
2. somewhat approve
8. __ NA (doesn't approve)
9. _ K
3. (IF "DISAPPROVE") Wuuld you say that ju
1. strongly disapprove
2. somewhat disapprove
8. _ NA (doesn't disapprove)
9. DK
4. (IF "DISAPPROVE") Why do you disapprove of family planning?
88. NA
99. DK
5. (IF R. HAS SPOUSE) What does your spouse think about the use of family planning? Does he (she):
1. apprve
2. disapprove
3. is neutral
8. _ NA (no spouse)
9. DK

22 AUDIENCE RESEARCH
Code
L. Social Acceptability of Family Planning No.
1. Of the women who live in this town (city),
how many approve of family planning? Would
you say:
of cola.
1. none 1
2. some
3. __ many
4. all
9. DK
(2-17) I am going to read a list of persons whose opinions you may respect. Please tell me if you think that each person would approve or would disapprove of your using family planning: (NOTE: CODE EACH AS:
1. would approve 2. would disapprove 3. indifferent 8. NA (R. doesn't have an aunt, uncle,
etc., or no longer has contact with this person)
9. OK)
2. Aunt 1
3. Uncle 1
4. Mother-in-law 1
5. Father-in-law 1
6. Sister 1
7L Brother 1
8. Mother 1
9. Father 1
10. Grandmother 1
11. Grandfather 1
12. Best friend 1
13. Doctor (nurse) 1
14. Teacher at nearby school 1
15. Priest 1
16. President of the country 1
17. Your closest neighbor 1

23 SAMPLE QUESTIONNAIRE
. Popular Beliefs bout Family Planning No. Code
Do you believe that family planning goes of
against God's will? cola.
1. yes 1
2. no
9. DK
2. Do you believe that family planning encourages couples to be unfaithful to each other?
1. yes
2. no
9. DK
3. Do you believe that teenagers learn about family planning, more of them will hav premarital relations?
1. yes
2. no
9. DK
4. Do you believe that teenagers who want to have premarital relations will do so, whether or not they know about family planning?
1. _ _ yes
2. no
9. DR
N. Knowledge and Previous Use of Contraceptive Methods
(NOTE: FOR EACH OF 12 CONTRACEPTIVE IS OF INTEREST TO DETERMINE:
METHODS, IT
a) KNOWLEDGE: i) R. SPONTANEOUSLY MENTIONS IT
ii) R. REMEMBERSHEARING ABOUT IT WHEN INTERVIEWER MENTIONS IT
iii) N. HAS NEVER HEARDOF IT (EVEN WHEN INTERVIEWER MENTIONS IT)
b) USE: i)
ii) R. HAS (EVER) USEDTHE METHOD R. HAS NEVERUSED THE METHOD
THIS INFORMATION CAN BE OBTAINED BY ASKING THE FOLLOWING QUESTIONS AND CIRCLING TH1ENUMBERSINTHE APPROPRIATE COLUMNIN THE TABLE BELOW.)
a) What family planning methods do you know? (PROBE: Do you know of any other things which people take or do to keep from getting pregnant?)

24 AUDIENCE RESEARCH
Code
No. (NOTE: INTERVIEWER CONTINUES TO PROBE UNTIL of R. IS UNABLETO NAMEANY OTHER METHOD. AT THIS col. POINT THE INTERVIEWER THEN PROCEEDS TO NAME EACH OF THE METHODSNOT MENTIONEDBY THE RESPONDENT,
ASKING IN RELATION TO EACH:)
b) Have you ever heard of (method)?
(WHEN THE LIST HAS BEEN COMPLETFD, THE INTER-
VIEWER PROCEEDS TO "PREVIOUS USE.")
c) I am going to read this list of family plan
ning methods again and I would like you to
tell me if you or your spouse has ever used
the method.
Have you (or your spouse) ever used the (method)?
(IN THE CASE OF STERILIZATION ASK:)
Have you (or your husband) had a vasectomy? Have you (or your wife) had the female sterili
zation operation?
(NOTE: IF R. CLAIMS TO HAVE USED A METHOD HE/SHE
HAS NEVER HEARDOF, CLARIFY THE CONTRADICTION.)
KNOWLEDGE PREVIOUS USE'
mentions has heard of has not heard has has not
spontaneously the method of the method used used
1) Pill 1 2 3 1 2
.) IUD 1 2 3 1 2
3) Female 1 2 3 2 2 Sterilization
I Male Sterili- 1 2 3 1 2
zation
Injections 1 2 3 1 2
1 2Condom 1 2 3
7) Creams, jellies, 1 2 3 1 2
foam
2N) Supposltories 1 2 3 1
29) Rhythm 1 2 3 1
2111) Withdrawal 1 2 3 1
1 2 3 1 211) Diaphragm
212) Herbs, teas, 1 2 3 1 etc.
1:) Other (specify) 1 2 3 1 2
'For coding and tabulation purposes, the questions on use are numbered from
141to 26; example: use of pill - 14, use of IUD - 15,.,.use of other - 26.

25 SAMPLE QUESTIONNAIRE
rede
27. Of all the methods you know, which do No.
you believe is the most reliable (aside of
from sterilization)? cols.
2
99. DK
28. Are you or your spouse currently using any method of family planning?
1. yes
2. no
29. (IF YES) What method are you currently using?
R8. NA (not using FP)
30. How long have you been using this method?
(CODE IN 11ONTHS) 2
88. NA
99. DK
31. Where 1j you obtain your contraceptives (pills, condoms, etc.)?
1. FP center or clinic
2. Health center or post
3. Pharmacy
4. Private doctor
5. (Community-based) Distributor
6. Other (specify)
P. NA
9. DK
32. (IF RESPONDENT HAS USED SOME METHOD BEFORE BUT IS NOT NOW ASK) What was the last method you used?
88. NA
99. DK
33. Why did you stop using it?
88. NA
99. OK

26 AUDIENCE RESEARCH
(34-42) If a couple in this town wants to use
family planning, where can they get those services or products? Please name all the places you can think of. (PROBE: Can you think of any other?) (NOTE: CODE "I" FOR EACH LOCATIONWHICH R. MENTIONS)
3,,. Family planning center or clinic
35. _ Health center or post in the town
36. Health center or post in another town
37. Pharmacy
38. Private doctor
39. Midwife
40. (Conmunity-based) Distributor
41. Folk healer, other traditional medical personnel
42. Other (specify: )
43. Of these lcations (WNTIONED BY THE RESPON-DENT, JUST ABOVE) which is (FOR NON-USERS, ASK: which would be) most convenient for you?
88. NA (doesn't know any FP location)
99. DK
44. How long does it (or would it) take you to get from your house to this place? (kOt IN MINUTES)
888. NA (doesn't know any FP location)
999. DK
0. Attitudes and Opinions regarding the Pill (NOTE: THIS SECTION IS ONLY rOR RESPONDENTS t,1iC HAVE HEARD OF THE PILL)
1. How often does a woman have to take the pill to keep from getting prognant:
1. Once a day
2. Other (spe:ifv)
8. NA 'hasntt heard of the Ipil1
9. OK
2. What should a woman do if ,io ferret to take the pill for just one dav and she ,ioetlt wian
to get pregnant?
1. Take two pills the next day
2. Other (specify)
8. NA
9. OK
Code
No. of
cols.
I
1
1
1
I
I
1
1
I
I

27 SAMPLE QUESTIONNAIRE
Code
3. What should a woman do if she forgets to No. take the pill for 3 or 4 days in a row and olshe doesn't want to get pregnant? Colo
I. Use another method 1 2. -- Consult clinic br doctor
3. Other (specify)
8. NA
9. DK 4. Is it safe for most women to take the pill
or not?
1. Yes
2. No
3. Depends on woman
8. NA
9. DK
5. (IF "NO" OR "DEPENDS" ASK) In what way is it unsafe? (PROBE: What could happen to a woman who takes the pill?)
88. NA
99. LX 6. Would you personally (IFMALE, ASK: Would
you advise your wife to) take the pill?
1. Yes I 2. No
8. NA
9. DK
7. (IF NO) Why not?
88. NA
99.. DK
P. Attitudes and Opinions regarding the I.D.D. (NOTE: THIS SECTION IS ONLY FOR RESPONDENTS WHO HAVE HEARD OF THE I.U.D.)
1. In what part of the body is the IUD placed?
1. uterus, womb, etc. 1 2. other (specify)
8. NA
9. DK
2. How can a woman know if the £UD is correctly in place, without making a special trip to the clinic or doctor?
88. NA
99. DK

28 AUDIENCE RESEARCH
Code
NO of
3. What types of side effects do some women cols feel when they first have the IUD inserted? c
88. NA
99. DK
4. Do you feel that the IUD is safe for most women or not?
1. safe
2. unsafe
8. NA
9. DK
5. Would you personally (IFHALE, ASK: Would you advise your wife to) use the IUD?
1. Yes
2. No
8. NA
9. DK
6. (IFNOT) Why not?
2
88. NA
99. DK
Attitudes and Opinions Regarding Female Sterilization (NOTE: THIS SECTION IS JUST FOR THOSE WHO HAVE HEARD OF FEMALE STERILIZATION)
1. Is female sterilization a quick, simple operation or is it a lengthy, complicated operation?
1. quick, simple
2. lengthy, complicated
8. NA
9. DK
2. After the sterilization is a woman's sex drive (desire to have sexual relations) greater, less, or the same as before the operation?
1. greater
2. less
3. same
8. NA
9. DK

29 SAMPLE QUESTIONNAIRE
Code
3. Is female sterilization harmful to a woman s No. health, does it improve her health, or is ol there no change in her health? cols.
1. _ harmful
2. improves health
3. no change
8. NA
9. DK
4. (IF "HARMFUL" ASK:) In what way is it harm
ful?
88. NA
99. DK
5. Would you personally (IFHALE, ASK: Would you advise your wife to) have this operation to be sterilized once you have all the children you wanted?
1. yes
2. no
8. NA
9. DK
6. (IF NO) Why not?
88. NA
99. DK
R. Attitudes and Opinions about Vasectomy (NOTE: THIS SECTION IS JUST FOR THOSE WHO HAVE HEARD OF MALE STERILIZATION)
1. Is male sterilization a quick, simple operation or is it a lengthy, complicated operation?
1. quick, simple
2. lengthy, complicated
8. NA
9. DK
2. After the sterilization is a man's sex drive (desire to have sexual relations) greater,less, or the same as before the operation?
I. greater
2. less
3. same
8. NA
9. DK

30 AUDIENCE RESEARCH
Code No. of
3. Is vasectomy harmful to a man's health, does
or is there no change cols. it improve his health, in his health?
11. harmful
2. improves health
3. no change
8. NA
9. DK
ASK:) In what way is it harm4. (IF "HARMFUL" ful?
2
88. NA
99. DK
5. Would you personally get (IF FEMALE, ASK:
Would you like it if your husband had) a
vasectomy?
1. --- yes
2. no
8. NA
9. DK
6. (IF NO, ASK:) Why not?
2
88. NA
99. DK
S. Previous Contact with F.P.: Interpersonal Activities
1. Have you ever received a visit here in your home from someone who came to talk about family planting or invite you to a F.P. clinic?
1. - yes
2. no (GO TO QUESTION S-5)
2. (IFYES) How many of these family planning
visits have you received?
visits
8. NA
9. DK
3. Was this visit(s) useful or not very useful?
useful1.
2. not very useful
8. NA
9. DK

31 SAMPLE QUESTIONNAIRE
Code
No.
of 4. Why (was it useful or not useful)? cols.
2
88. NA
99. DK
5. Have you ever attended a public meeting about family planning? (i.e., a meeting that was announced to the general public, to be held in a school, community center or other meetint place)
1. yes
2. no (GO TO QUESTION S-9)
6. (IF YES TO Q. 5) How many public meetings on family planning have you attended?
meetings
8. NA
9. DK
7. Was this public meeting(s) useful or not
useful?
1. useful
2. _ not very useful
8. NA
9. DK
8. Why (was it useful or not very useful)?
88. NA
99. DK
9. Have you ever attended a small group discussion on family planning (i.e., where youpersonally were invited to discuss this with some friends ur other people)?
1. yes
2. no (GO TO 1r!ESTION T-I)
10. ( YES TO Q. 9) How many times have you attended a small group discussion of fanily planning?
times
.. . NA
9 . . DK

32 AUDIENCE RESEARCH
Code
No. ofof
11. Was this SnAl eroupl discussion useful or
1. ___ useful 1
2. _not very useful
.____NA
9. DK
12. Wh' (was this discussion useful or not very
useful)
2
88. NA
99. DK
T. Informal Communication on Family Planning
1. In general, do you feel that women can talk
to each other about family planning without
being embarrassed?
1. yes
2. no
9. DK
2. In general, do you feel that men can talk to
eazh other about family planning without being embarrassed?
I. yes
2. no
9. DK
3. In general, do you feel that husbands and
wives can talk to each other about family planning .ithout being embarrassed?
1. yes
2. no
9. DK

33 SAMPLE QUESTIONNAIRE
Code
(4-17) I am going to read a list of persons and I'd like you to tell me if you have ever discussed family planning with this perso.
o of c
(NOTE: CODE EACH AS: I. Yes 2. No 8. NA (no such person, e.g., 9. VK)
4. Spouse
5. Mother
6. Father
7. Uncle or aunt
8. Other female relatives
9. Other male relatives
10. Close friends
11. Neighbors
12. Doctor
13. Nurse
14. Midwife
15. Health promoter
16. - Pharmacist
17. Priest
no spouse)
18. In the past month, how many people have you discussed family planning with?
people 2 99. DK, don't remember
19. When you talk to other people about family
planning, do you usually:
I. _ _ give advice
2. _ receive advice
3. both give and receive advice
8. NA
9. DK
U. Methods of Communication: Radio
1. Do you have a radio (IFNOT, ASK) or any place you can listen to radio?
1. _ has own radio
2. _ can listen to it elsewhere
3. has no access to radio (GO TO QUESTION V-1)

34 AUDIENCE RESEARCH
Code
What times during the day do you usually No.(2-25)
listen to radio? (PROBE: What hours in the of . . . in the cols. . . . in the afternoon
evening?) (NOTE: CODE "I" FOR EACHIIOUR MENTIONED)
morning
2. 1 am
3. 2 am
4. 3 am
5. 4 am
6. 5 am
7. 6 am
B. 7 am
9. 8 am
10. 9 a1
11. 10 a1
12. 11 am
13. 12 pm
14. 1 pm
15. 2 pm
16. 3 pm
17. 4 pm I
18. 5 pm I
19. 6 pm
20. 7 pm 1
21. 8 pm
22. 9 pm 1
23. 10 pm I
24. 11 pm I
25. 12 am
26. How often to you listen to radio:
1. every day
2. several times a week
3. once a week
4. less than once a week
5. never (INCLUDES THOSE WITH NO ACCESS TO RADIO)
9. DK

35 SAMPLE QUESTIONNAIRE
Code
No. 27. At what time do you usually turn the radio of
on in the morning (or during the day)? ol hour 2
88. NA
99. DK
28. What is your favorite radio station?
2 88. _ NA
99. _ DK
29. What is your favorite radio program?
2 88. _ NA
99. _ DK
(30-37) I'm going to read a list of radio programs, and I'd like you to tell me which youlisten to "always," "sometimes," or "almost never." (NOTE: CODE EACH AS:
1. always 2. sometimes 3. almost never 8. NA (no access to radio) 9. DK)
30. Music, songs, etc.
31. News 1
32. Soap operas 1
33. Sports 1
34. Religious programs
35. Advice for homemakers
36. _ Advice on agriculture
37. Programs on education
38. Have you ever heard anything about FP on the radio?
1. _ -_ yes
2. no
8. NA
9. DK

36 AUDIENCE RESEARCH
Code
No.39. (IF YES TO Q. 38) About how often do you Of hear something about family planning on cola. the radio?
1. several times a day 1
2. once a day
3. at least once a week
4. at least once a month
5. less t- n once a month
6. never
9. DK
(NOTE: INCLUDE THOSE WllODON'T HAVE ACCESS TO RADIO OR HAVEN'T HEARD ANYTHING ABOUT FP IN CATEGORY '61)
V. Other Mass Media
1. Do you have a television in this house? (IF NOT, ASK:) or do you have one you can watch at least once a week?
I. has TV
2. can watch elsewhere
3. no access t, T' (GO TO qUESTIjN V-25)
2. How often do you watch TV?
I. every day
2. several times a week
3. once a week
4. less than once a week
5. never (INCLUDES THOSE WITH NO
ACCESS TO TV)
9. DK

37 SAMPLE QUESTIONNAIRE
Code
(3-21) At vhat times during the day do you usu- No. ally watch TV? (PROBE: What hours in the of morning . . . in the afternoon . . . in the cola. evening?) (NOTE:
3.
4.
5.
6.
7.
8. _
9.
10.
11.
12.
13. _
14. __
15.
16.
17.
18.
19.
20.
21.
CODE"I" FOR EACHHOURMENTIONED)
6am
7am
8am
9am
10 am
11am
12 pm
l pm
2 pm
3 pm
4pm
5 pm
6 pm
7 pm
8 pm
9 pm
10 pm
11 pm
12 am
22. What is your favorite TV program?
88. NA
99. DK
23. Have you ever heard anything about FP on TV?
1. - yes
2. no
8. NA
9. DK

38 AUDIENCE RESEARCH
Code
No. ofcols.24. (IF "YES":) About how often do you hear
something about FP on TV?
1. several times a day I
2. once a day
3. at least once a week
4. at least once a month
5. less than once a month
6. never (INCLUDE THOSEWHODON'T HAVE ACCESS TO OR NEVER HEARD ANYTHING ABOUT FP)
9. DK
25. Are there newspapers in this town?
1. yes
2. no (GO TO QUESTION V-30)
26. How often do you get a chance to read the newspaper?
I. every day
2. several times a week
3. once a week
4. once every two weeks
5. once a month or less
6. never (or not applicable)
9. DK
27. What newspaper do you usually buy or read?
88. NA
99. DK
28. Have you ever seen anything on FP in the
newspaper?
I. __ yes
2. no
8. NA
9. DK
29. (ow often do you see something on family
planning in the newspaper?
1. every day
2. several times a week
3. once a week
4. once every two weeks
5. once a month or less
6. never (or not applicable)
9. DK

39 SAMPLE QUESTIONNAIRE
Code
No. of
30. Are there magazines in this town? cols.
I. - yes
2. _ no (GO TO QUESTION V-35)
31. How often do you get a chance to read a
magazine?
1. once a day
2. several times a week
3. once a week
4. once every two weeks
5. once a month or less
6. _ never (or not applicable)
9. DK
32. What magazines do you usually buy or read?
2 88. NA
99. DK
33. Have you ever seen anything on FP in a
magazine?
1. _ yes
2. no
8. NA
9. DK
34. How often do you see s6mething on FP in a
magazine?
1. _ every day
2. several times a t-ek
3. once a week
4. once every two weeks
5. once a month or 1-~s 6. never (or not applicable)
9. DK
35. Is there a movie theater nearby?
1. yes 2. _ no (GO TO QUESTION V-38)

40 AUDIENCE RESEARCH
Code
No. of cols.
36. Do you go tu the movies?
1. several titues a week I
2. once a week
3. once every two weeks
4. once a month
5. less than once a month
6. never (INCLUDE "NO THEATER NEARBY")
9. DK
37. Have yod ever seen anything about family planning at the movie theater?
1. _ yes
2. no
8. NA
9. DK
38. Have you ever seen a pamphlet or booklet
on family planning?
1. _ yes
2. __ no (GO TO QUESTION V-41)
39. How many different pamphlets have you ever sitil?
__ pamphlets 2
88. NA
99. DK
40. When was the last time you saw a pamphlet on family planning? (CODE IN MONTHS)
months 2
88. NA
99. DK
41. Have you ever seen a poster on family planning?
1. - yes
2. no (GO TO QUESTION W-l)
42. Where did you see the poster on family planning?
88. NA
99. DK

41 SAMPLE QUESTIONNAIRE
~de
No. 43. When was the last time you saw a poster on of
family planning? (CODE IN MONTHS) cols.
_ months ago 2
W. Perceptions of Infant Mortality
1. If a woman in this town gives birth to ten children, how many do you think will live to grow up?
children 2
99. DK
2 If a woman in this town gives birth to five children, how many do you think will live to grow up?
children
99. DK
3. Do you believe that the number of infants who die today is greater or less than five years ago?
1. greater
2. less
3. same
9. DK
4. If a woman wants t o have three cildren, should she have four in case one dies or Isn't this necessary?
1. should have four
2. isn't necessary
9. DK
X. Awareness of the Effect of Pregnancy on the Woman's Health
1. Do you believe that having too many childrcn can be harmful to a woman's health or is thmt just a rumor?
1. can be harmful
2. _ is just a rumor
9. DK
2. Can it harm a woman's health to have tierchil dren one right after the other or doesn't it affect her health?
1. harmful
2. doesn't affect health
9. DK

42 AUDIENCE RESEARCH
Code
No. of
(ONLY FOR THOSE RESPONDENTS WHO USE FAMILY
PLANNING) cols. During the time you (IF MALE, ASK: or your
wife) have used family planning, do you feel
that your health (IF MALE, ASK: or your wife's health) is better, worse, or the same as before?
3.
I. better
2. worse
3. same
S. NA
9. DK
Y. Economic Value of Children
1. Do you feel that a son shoulL stay in school as long as possible or should he stop going
to school when he get big enough to help the family earn a living?
1. stay in school
2. drop out to earn a living
9. DK
2. At what age should a boy leave school and begin earning a living? (CODE IN YEARS)
years old 2
99. DK
3. Do you feel that a daughter should stay in
school as long as possible or should she stop going to school when she gets big enough
to work or to help around the house?
I. stay in school
2. drop out
9. DK
4. At wiat age should a girl leave school and
begin working (either at a job or around the
house)? (CODE IN YFARS)
years 2
99. DK
5. Some people say that the more children one
has, the easier it is to make a living. Do you agree or disagree with this?
1. agree
2. disagree
3. neutral; it's the same
9. DK

43 SAMPLE QUESTIONNAIRE
Z. Children and Security in Old Age No. Of
1. Do you feel that children should support ols. their parents during their old age or should the parents be able to support themselves? . - children should support parents I
2. __ parents should support themselves
9. DK
2. If the tine arrives when you can no longerwork because of age, do you plan to live with your children or will you live elsewhere?
1. with children
2. elsewhere
8. NA (no children)
9. DK
3. Does hlavinga lot of children mean more security for one's old age, ur can one feel secure having just two or thiee children?
I. lots of children
2. two or three children
3. it's the same
9. :DK
BB. Level of Aspirations for One's Children
L If a son can make a better living (earn. money) in some other place, should he leavehome or should he stay with his fa.il:.:
I. leave home
2. :tay with family
3. indifferent
9. DK
2. Would you like your son (IF !;0 Sol:, you had ene) to have tile sa.e t.pe , his father (IF MLE, ASK: as 'o hae1.u would you like him to do soretiur. e_
I. same
2. something else
3. indifferent
9. DR
3. (IF "SOMETHING ELSE", tlrt klt . would you like him to have:
88. NA
99. K)

44 AUDIENCE RESEARCH
Code
No.of
4. If a daughter can earn a better living in cola.
some other place, should she leave home or
should she stay with her family?
1. leave home
2. __ stay with family
3. indifferent
9. DK
5. Do you think it is best for a girl to stay
home until she marries, or do you think she should work for a while before getting married?
1. stay at home
2. work for a while
3. indifferent
9. DK
CC. Sex Education
1. How old should boys be before they learn about sex? (CODE IN YEARS)
years 2
99. DK
2. How old should girls be before they learn
aiout sex? (CODE IN YEARS)
years 2
99. DK
3. Do you approve of giving young people classes on sex education at school or other places, or do you disapprove of this?
1. approve
2. disapprove
3. indifferent
9. DK
DD. Desire t' Learn More about Family Planning
1. Would yuu like to learn more about family
planning or not?
1. yes
2. no
2. (IF NO, ASK:) Why not?
88. NA
99. DK

45 SAMPLE QUESTIONNAIRE
Code
(FOR THOSE WHO WANT MORE INFO) No. I would like to know how you would like to re- ofceive more information on family planning. For cols example:
3. Would you like to attend a meeting with other people in this town to talk to a nurse or doctor about family planning?
1. _ _ yes
2. no
8. - NA (doesn't want more info)
9. DK
4. Would you like to receive a home visit from a nurse or family planning worker to talk with you and your spouse about family planning?
1. yes
2. no
8. NA
9. DK
5. Would you like to receive more information on family planning from radio (and TV) programs?
1. yes
2. no
8. NA
9. DK 6. Would you like to receive free written ma
terial about family planning?
1. _ - yes
2. no
8. NA
9. DK
EE. Sociodemographic Variables
1. Sex of respondent (INTERVIEWER RECORDS THIS. WITHOUT ASKING)
1. male
2. female
2. Ethnic or racial group (INTERVIEVEg ASKS ONLY IF IT IS NOT OBVIOUS)
3. (IF APPROPRIATE) What language do you generally speak at home?

46 AUDIENCE RESEARCH
Code
No. of
4. How ol 're you (as of last birthday)? cola.
years 2
5. How old is your spouse?
___ years 2
6. What is your religious affiliation? (To
what religion do you belong?)
1. Protestant I
2. Catholic
3. Jewish
4. other
8. no religion
7. Would you consider yourself to be a person who is
I. very religious 1
2. somewhat religious
3. not very religious
8. NA (ass no religion)
9. DK
8. Do you know how to read? For example, are you able to read a newspaper?
1. yes
2. no
9. (IF"YES" ASK:) Would you say that for you
reading is:
1. NA: doesn't read
2. __ very difficult
3. somewhat difficult
4. __ not very difficult
9. DK
10. How would you describe your spouse's ability
to read?
1. doesn't read at all
2. reads with great difficulty
3. reads with some difficulty
4. reads with little difficulty
8. -- NA (no spouse)
9. DK

47 SAMPLE QUESTIONNAIRE
11. Did you ever attend school? cols.
. _ yes
2. no 12. (IF YES) What was the last grade you com
pleted?
grade 2
00. NA (didn't attend)
99. _ DK, don't remember
13. Die your spouse attend school?
1. _ . yes
2. no
8. NA (no spouse)
14. What was the last grade ho/she completed?
grade
00. spouse never attended school
88. NA (no spouse)
99. DK
15. Do you do some type of work which allows you to earn money?
1. yes
2. no
16. (IF YES) What is your current occupation?
88. NA 17. Does your spouse do some type of work which
allows him/her to earn mcaey?
1. yes
2. no
8. NA (no spouse)
18. (IF YES) What is his (her) current occupation?
88. - NA (no spouse or t100'n't work)

48 AUDIENCE RESEARCH
Ne,. No.
What is the average monthly income of this
19. family? (NOTE: INCLUDE INCOME OF ALL FAMILY MEMBERS
WHO WORK) 4
20. How many people live in this house and are
supported by this income?
2 _ persons
THAT WAS MY LAST QUESTION. THANK YOU VERY MUCH FOR
YOUR TIME AND EFFORT. IT IS MOST USEFUL TO US.

Chapter Four
METHODOLOGICAL CONSIDERATIONS
This manual is not intended as an introductory text to social research. Rather, it assumes that those who will carry out the audience research will have experience in the following areas or will have access to experts to provide guidance in these aspects:
* basic concepts of sampling * pretesting the questionnaire to detect any questions not readily un
derstood in their current form * selecting, training, and supervising the interviewers who conduct the
fieldwork * precoding the questionnaire (as has been done on the sample ques
tionnaire in Chapter Three), preparing a codebook for all open-ended questions
* data processing by computer (although the questionnaire could be tabulated by hand, the number of questions and respondents makes this option unrealistic; furthermore, the analyses outlined in ChapterFive are based on computer processing).
The current chapter focuses on issues that are particular to audience research and/or have proven to cause difficulties in previous fieldwork experiences.
Sampling The problem of sampling in audience research is not uncommon in other
types of social research as well. On one hand, the researcher would like to take all possible measures to assure the validity of the data. In terms of sampling, the desire for such assurances would imply the need for a random
49

50 AUDIENCE RESEARCH
or "probability" sample of the target population. With an adequate sample size and rigorous sampling techniques, the research will yield representative data for which confidence intervals can be calculated. In short, random sampling allows for a high degree of confidence in the findings, if the fieldwork is conducted properly. However, the price of obtaining the random sample is often very high and the process time-consuming.
At the same time, family planning or other social development groups conducting audience research usually have very limited resources, especially for research. For audience research to be of real value to the organization, it must yield results in a relatively short period of time at a minimum cost.
Moreover, because of the applied nature of audience research, the researcher is often more interested in the general trends than in the specific percents and confidence intervals. For example, if a researcher found that 77 percent of the population were in favor of family planning, the implications of the finding would be the same whether the research showed the number to be 80 percent, 75 percent, or even 70 percent. The extra precision gained by having a probability sample will not necessarily translate into greater benefits for the program in terms of the actual use of the results.
In short, if the researcher has the resources of time and money to obtain a probability sample of the target population, he or she should certainly take advantage of the situation. The results will have greater precision and more measurable confidence intervals; in addition, they will be truly representative of the target population :n the strict sense of the word.
On the other hand, if obtaining a truly random sample of the population represents too great a cost to the organization (making it impossible to conduct the research), then it is recommended that the sample be drawn in another way. Other methods are available that will yield results approximately the same as if a strict probability sample had been used.
One type of compromise sample is to make a "judgmental" selection of areas to be studied. For example, if the researcher wishes to collect data in order to design a nationwide communications program but has no resources for a national probability sample, then he or she might select several different states or departments in which to conduct the research. If the country is fairly homogeneous on ethnic or cultural traits, then the researcher would select according to geographical criteria. If there are several distinct ethnic or racial groups within the country, the researcher might select one area that would be typical of each group.
In making this "judgmental" selection, the researcher must be wary of unusual circumstances that would eliminate an area as being "typical." For example, if an intensive pilot project for community-based distribution of
contraceptives has been initiated in a given area, then this area can no longer be considered as "typical" of the communities in the area.
Even if the judgmental approach is used to select areas, random sampling

51 METHODOLOGICAL CONSIDERATIONS
should also be used to select the communities and even the actual households in which the research will be conducted. As a result, the research findings will be truly representative of the area studied, even if they can only be generalized to other areas with caution.
Criteria for selecting respondentsOnce the method for selecting households has been determined, the re
searcher must decide who should be interviewed. For the purposes of audience research for family planning, both men and
women should be included, since both play a significant role in the decision to practice family planning. However, this study isnot designed so that both the husband and the wire would be interviewed. Interviewing couples is generally more time-consuming, since it is usually difficult to find both at home at the same time. Moreover, there are relatively few questions which take fu!l advantage of matched data on couples. Instead, since both men and women are included, only the husband or the wife should be interviewed from agiven household. There should be an equal number of male and female interviewers to interview respondents of their own sex, each conducting a specified number of interviews in each community included in the sample in order to yield the requisite number of interviews for men and women.
Moreover, in most cases the researcher will want to limit the sample to adults for whom family planning is a real issue: men and women of reproductive age, which might be approximated as 18 to 49 years for men and 18 to 39 for women. The decision to include only those people who currently have spouses (as opposed to single, divorced, separated, or widowed persons) will depend on the interests of the organization. The first option yields data from the true target group, whereas the latter provides a clearer reflection of "public opinion."
Precoding of the questionnaire, including "NA" and "DK" Especially on a long interview, it is extremely helpful-both for the inter
viewer and later for the coder-to have a precoded questionnaire. For every"close-ended question" (that is, for every question which has apredeterminednumber of answers), there should be a code assigned to the answer. Thus, theinterviewer merely circles or checks off the appropriate response. For example:
A. Sex of respondent:
1. male 2. - female

52 AUDIENCE RESEARCH
B. Do you approve or disapprove of couples' using family planning?
1. approve 2. disapprove 3. indifferent, neutral
(Note: Although the interviewer does not mention or suggest the neu
tral category, this is a valid response which can be expected from some
respondents. Thus, it is far easier to include it as a possible code for the
interviewer to check than to require the interviewer to write it in each
time.)
The NA code. There are two other codes which appear on the sample or not applicable. This isquestionnaire in Chapter Three. The first is "NA"
the time of the interview or afterwards when the interchecked-either at viewer reviews the questionnaire-for all questions that were not asked of the
are sets of questionsrespondent. A typical case would be when there whole
that are only asked of certain types of respondents. For example, specific
questions on knowledge and attitudes are only asked of people who have
ever heard of the pill; this section would be skipped for those who have not
heard of the pill, and the response NA would be checked in each case.
of the NA is for follow-up questions. Often, aA second common use second question is asked as a "follow-up" to the first, and it should be an
swered only by persons who gave a certain answer to the first. For other per
sons who were not asked the question, NA should be checked. For example:
First Question: 1. Do you do some type of work which allows you to earn money?
1 yes 2 no
Second Question: I -A. (IF YES) What is your current occupation?
88. _ NA
Some researchers will argue that this type of coding for NA is unneces
sary, that it can be done automatically by computer at a later time. However,
such coding does have the advantage of every item in the questionnaire being
filled in-even if it is with NA-which tends to minimize the number of ques
tions accidentally skipped. Finally, the response of NA is very different from DK (which stands for

53 METHODOLOGICAL CONSIDERATIONS
"don't know"), explained below. Inexperienced researchers have a tendency to confuse the two, which can create a misleading result. If a person is not
asked a given question, he or she should not be recordedas "don't know." Likewise, it s erroneous to check NA for a question that was asked of the respondent but which he or she was unable to answer.
77Te DK answer. As most interviewers know, respondents are very prone to answer "I don't know" to questions. In some cases, they truly do not know the answer. However, it is often the case that "don't know" has several meanings:
1. Thle respondent is simply giving himself time to think. For example: "I don't know ...(pause)... I guess you could say I approve of that."
2. Th7e respondent is hesitant to say what he reallyfeels. However, with an additional probe by the interviewer, a respondent will usually express his true fceling. For example:
Interviewer: Do you approve or disapprove of couples using family planning?
Respondent: Oh, I don't know.... Interviewer: Well, generally speaking, are you in favor of family plan
ning or against family planning? Respondent: Well, I really don't think it is a very good idea....
3. The respondentdoesn 't want to give the wronganswer,even if he has a good idea of what the correct answer might be, and thus avoids embarrassment by answering, '7don't know. "Again, a probe is in order. For example:
Interviewer: What should a woman do if she forgets to take her pill just one day?
Respondent: Let's see ... they said something about that on the radio last week ...(pause) ...but I don't really remember....
Interviewer: Think about it a minute. What should a woman do if she forgets to take her pill just one day?
Respondent: ...Oh, yes... she should just take two the next day.
In each of the above cases, valuable information would have been lost if the interviewer had readily accepted "don't know" as an answer. Thus, it is extremely important to train the interviewers to probe for more information and to accept "don't know" only when it is certain that the respondentdoes not have a better answer.
The reason for emphasizing this point is the inclusion of "9. _ DK"

54 AUDIENCE RESEARCH
on the majority of items in the sample questionnaire, even for questions on which it is hard to imagine a person's not being able to give a concrete yes-orno answer. This possible response has been included in order to facilitatethe
recording of data during the interview and the subsequent coding. However, the very presence of it on the interview will cause inexperienced interviewers to assume that it is as good an answer as any other, when in fact probing will often reveal a more concrete answer. This point should be stressed repeatedly during interviewer training.
Spaces for coding. On the sample questionnaire, the number of spaces in
the "code" column varies from one to four. As researchers familiar with computerized data collection will easily recognize, the number of spaces depends on the number of possible responses to a given question, as follows:
Number of spaces or Number of possille "column spaces" responses
I . . . . . . . . . . . . I to 9 2 ...... ............ 1 to 99 3 ...... ............ 1 to 999 4 ...... ............ 1 to 9999
Most closed-ended questions will only require one space, since there are less
than 9 possible responses (example: yes, no, DK; approve, disapprove, neutral; Catholic, Protestant, Jewish, other). The types of questions that require more spaces include the following:
2 spaces: age, last grade of school completed, reason for disapproving of family planning
3 spaces: age of last child, coded in months; case number for "the study (both could easily be greater than 99)
4 spaces: incomc per month in pesos (which could be higher than 999). If the data are to be processed by computer, it is important to check thai
each item has enough spaces (columns) for subsequent coding before the
forms areprintedfor use in the field. If there is any doubt, it is better to have too tnanj' columns than too few. It is easy enough to write "4" as "04," but there is no way to fit "14" into one space (coluni).
The meaning of 8 and 88, 9 and 99. The codes associated with a given answer are arbitrary. It would be equally valid to have 2 =yes and 1 = no or the reverse. Generally, it is simply a matter of the researcher's preference.
Likewise, most researchers find it helpful to use the same numbers
throughout the questionnaire for NA and DK, especially for computerized processing (as explained in the next chapter).
The convention used in this study is as follows:

55 METHODOLOGICAL CONSIDERATIONS
8 (for one-column responses)
NA = 88 (for two-column responses) 888 (for three-column responses) 8888 (for four-column responses)
9 (for one-column responses)
DK = 99 (for two-column responses) 999 (for three-column responses) 9999 (for four-column responses).
This point should also be checked carefully after the questionnaires are typed and before they are printed. If "DK" is accidentally coded as "3" on some questions and "9" on others, it tends to create confusion and complicate the data processing.
Conclusion The items covered in this chapter are isolated technical points that should
be kept in mind when preparing for and carrying out the fieldwork. However, they are not intended Ps a guide to social research.
Organizations or individuals interested in conducting audience research but having only limited experience with social research will benefit from consulting local researchers who have conducted studies in related areas. It is generally easier to plan carefully and avoid errors than to correct for short-sightedness at a later date.

Chapter Five
GUIDELINES FOR ANALYZING THE SAMPLE QUESTIONNAIRE
One of the classic problems of survey research on family planning has been the quantity of data which has been collected around the world but never analyzed or analyzed but never applied. The purpose of this chapter is to show how the data in the sample questionnaire can be analyzed in a simple, straightforward manner. In the following chapter, these analyses are used in developing an I.E-C strategy.
There is no set formula for analyzing data. Although there are standard statistical techniques and tests that are used widely in the social sciences, each researcher usually takes a slightly different approach to the problem. Thus, it would be a mistake to suggest that there is only one way to analyze the data collected with the sample questionnaire (Chapter Three). At the same time, the amount of data generated by the sample questionnaire is considerable, and to provide no guidelines for possible analysis would be a disservice to those who are unfamiliar with audience research.
In short, the guidelinesgiven below representone possible approachto the analysisof this datafor the purpose of designingan I-E-Cstrategy. However, these guidelines by no means constitute an exhiustive list of possible analyses, and the individual researcher may want to adapt them to a particular situation.
While most readers will be familiar with the jargon of social research, a few key terms are reviewed in the next section before proceeding to the guidelines.
56

57 GUIDELINES FOR ANALYSIS
I Key Terms in Social Research
Level of measurement The way in which a variable is measured determines in part the statistical
procedure one can use for analysis of the data. There are four levels of measurement.
I.Nominal. The variable has two or more categories which have no special order (numerical relation) (i.e., one is not "larger" than the other). Example: Religious affiliation, with the categories "Protestant, Catholic, Jewish, other."
2. Ordinal The categories have a numerical order or sequence, but the interval between categories is variable or nondetermined. Example: "How often do you listen to soap operas: often, sometimes, or never?"
3. Interval. The categories have a numerical order with a set interval between categories; however, there is no fixed "zero point" so that one score can be considered "twice as much" as another. Example: Temperature in degrees (60 degrees is not "twice as much" as 30 degrees; yet there is a set, nonvariable interval between one category and the next: one degree).
4. Ratio. The categories have a numerical order with a set interval between each and a fixed zero point so that the quantitative relationship between categories can be determined. Example: Age of respondent (a man of 60 has lived twice as long as a man of 30 years).
Nominal and ordinal level variables are also referred to as categoricalor nonmetric. Interval and ratio level variables are referred to as continuous or metric. Certain types of analysis are appropriate for one level, whereas other levels require other types, as discussed in detail below.
Occasionally in social research, ordinal variables are treated Is continuous because that allows for a great range of analysis. For example, a five-point scale for attitude toward family planning might have the categories "strongly approve, approve, neutral, disapprove, and strongly disapprove." It is not unusual to find such a variable treated as continuous, even though in rigorous statistical terms it is not a continuous variable.
Collapsing categories In some cases the researcher will want to convert a continuous variable to
categorical form in order to do cross-tabulation, for example, with a manageable number of categories. One such case would be if a researcher were to cross-tabulate current contraceptive use by age of respondent, which could result in some 30 categories for age (the continuous variable). Instead, it is

58 AUDIENCE RESEARCH
frequently advisable to combine or "collapse" categories into a smaller number, so that age might then have only six categories: less than 24, 25-29,
30-34, 35-39, 40-44, and 45-49.
Dependent and independent variables Often researchers are interested in determining the relationship between
variables. For example, who would be more likely to approve of family plan
ning in a country: men or women? Or, what factors influence the decision to
use contraceptives? In the above cases, the dependent variable refers to the condition or situa
tion to be explained (attitude and use of family planning). The independent (or "explanaiory") variable(s) refers to the items used to explain the condi
tion or situation ( sex of the respondent or the "factors" mentioned above
such as availability of contraceptives, social psychological factors, etc.).
There is nothing about the variable per se that necessarily makes it depen
dent or independent: rather, it is the way in which it is used. In the above ex
ample, attitude and use were both dependent variables; however, if one asks,
"Are people with favorable attitudes more likely to use family planning than
those with unfavorable attitudes?" then attitude is independent, use is de
pendent.
Dummy variables Often, researchers wish to use a categorical variable in analysis which
requires continuous variables, such as multiple regression. In this case, it is
possible to resort to "dummy variables." Although this procedure will not be
described herein, researchers who face the problem of wishing to incorporate
categorical variables into a multiple regression or other analysis are referred to
standard texts or the manuals for standard computer programs (e.g., Statisti
cal Packagefor the SocialSciences).
Hypothesis testing In addition to describing a given situation (e.g., that 30 percent of the
eligible women in country X are currently contracepting), it is also of inter
est to test certain hypotheses involving the variables under study. Specifically,
the researcher may wish to determine if certain factors such as the use of con
traceptives are related to others. Most introductory statistics textbooks cover the topic of hypothesis test
ing in detail, and it will not be discussed in this monograph. However, it
should be stressed that most of the cross-tabulations and the multiple re
gression procedures suggested in the plan of analysis in this chapter have
tests of significance (of chi-square and the F-statistic, respectively). These
tests of significance are the key to determining if the relationships found are
statistically significant and to drawing valid conclusions from the data.

59 GUIDELINES FOR ANALYSIS
II
Steps in Preparing the Data for Analysis
Editing or "cleaning" the data In a large study, it is inevitable that some mistakes will be made-when the
interviewer records the responses, when the coder translates verbal responses to numbers, or when the keypuncher prepares the computer cards for processing. Thus, the first data processing task is to edit or "clean" the data. This cleaning task would be tedious if not impossible to do by hand for a large data set. Instead, it is recommended that the editing be lone by computer. One such program that is very simple to learn and use is described by Henry G. Elkins in his manual, Alini-tab Edit, Mini-tab Frequencies, and Mini-tab Tables: A Set of Three InterrelatedStatisticalProgramsfor Small Computers (Chicago: Community and Family Study Center, The University of Chicago, 1971).
The Mini-tab edit program allows the researcher to define and then to locate within the data set three types of errors:
1. Out-of-range: Usually, only certain numbers are valid codes to a given question. Any others are "out-of-range." For example:
Sex ofRespondent 1 = male
2 = female If the researcher finds cases with 3s, 4s, or 5s, he or she can be sure that there is an error which needs to be corrected.
2. Arithmetic errors: In some instances, the values from two or more variables must add to the value of another variable; if not, there is an error. For example,
Number of male children + Number of female children
Total number of children
3. Logical errors: In some cases, the answer to a given question is logically related to a second question. As such, the errors can often be detected if this "logic" is violated. An example would be if a male respondent reports having two pregnancies.
Wlhile many researchers are anxious to continue with the actual analysis and avoid this extra step in the process, editing of the data yields results that provide the researcher with fewer problems (what does one do with a third sex?) and results that inspire greater confidence in the final analysis.
Preparing the computer program for processing the data As mentioned above, the quantity of data generated by the sample ques
tionnaire dictates that the data be analyzed by computer if the full benefit of

60 AUDIENCE RESEARCH
the research is to be realized. There are certain standard or "canned" computer programs that can be used for this purpose. The selection of one versus another depends in large part on what isavailable through the local computer facility. Two programs frequently used in the social sciences are SPSS (the Statistical Package for the Social Sciences)' and SAS (StatisticalAnalysis System).2
However, these systems are not always available at computer facilities in developing countries since they must be run on large computers. One canned program appropriate for use on small computers which could also be used
3for processing the data for this survey is the Mini-tab program.
F' the researcher is not familiar with computer programming, he or she should nonetheless be able to obtain assistance from the local computer facil. ity in locating a person who can do the necessary programming for the project. The lack of computer programmingskills should not be a deterrent to carrying out audience research.
Defining "values to be excluded" The researcher will usually want to know exactly what percent of respon
dents gave what answer to each variable. However, there will often be codes that the researcher does not want to include in later statistical procedures.
For example, suppose that in response to a question on "ideal number of children," 15 out of 100 respondents answered "don't know." This response would then be coded as "99" on the sample questionnaire. If the answers for all 100 respondents were included in a calculation of the mean (average) "ideal number of children," the result would be deceivingly high. That is, the 99s would have the effect of raising the average considerably. What the researcher really wants is to calculate the awrage, excluding the 15 respondents who "don't know."
Most of the standard programs for analyzng social science data have this option available, although the number of valucs (codes) that can be excluded on a given item varies. One convenient feature in several of these programs (such as SPSS) is that the percentage data will be calculated in two ways for each variable-once without recognizing the excluded values and a second time excluding them. Another important feature is that the researcher can request for the definition of the excluded values to be overridden for a given procedure, which is equivalent to never having defined valtes to be excluded in the first place.
Since this procedure of defining values to be excluded affects all subsequent analysis, it is recommended that these values be defined from the start.
Table 5-1 provides an abbreviated listing of all variables in the sample questionnaire, re-ordered for the purpose of analyzing these data as a basis for designing an I-E-C strategy. Also included is a listing of possible values to be excluded from statistical calculations. It can be argued that the category "don't

61 GUIDELINES FOR ANALYSIS
know" should be included in some cases (such as in cross-tabulations). Thus, the researcher is recommended to review carefully the list in Table 5-1 before deciding on values to exclude.
IIl Frequency Distributions: A Preliminary Look at the Findings
The chief purpose of the first round of analysis is to familiarize the researcher with the data that has been collected. The easiest way to do this is to run frequencies (percentages) for every variable in the study (listed in Table 5-1). This process has the added advantage of revealing any (still uncoirected) out-of-range errors and allowing the researcher to recheck or reconsider the defi'nitions of values to be excluded.
Frequency distributions contain large amounts of valuable information. They provide an overall idea of the opinions, attitudes, and beliefs of the audience which will aid in developing a project strategy. For example, what percent of respondents already know about family plannihg methods? What percent believe that children are an economic asset? What are the hours of the day when the greatest percent of the population listen to radio?
Also as part of the first round, it may be interesting to run cross-tabulations on some or all of the variables in the study by some key variable hypothesized to show considerable variance on these family planning and communication questions (for example, ethnic group, sex, or age).
Once the researcher has some feeling for the data, as well as for variation by ethnic group, sex, or other key variable, the in-depth analysis can begin.
[VAppropriate Procedures for Analyzing the Sample Questionnaire
As discussed in Chapter Two, the types of information to be obtained from this audience research include:
1. An assessment of the current family planning situation (including current levels of knowledge and use of contraceptives)
2. Analysis of factors which relate to acceptance (a) Sociodemographic (b) Social psychological (c) Variables related to family planning services
3. Most effective channels of mass and interpersonal communication for family planning.
All of the variables included in the sample questionnaire have been listed in summary form in Table 5-1; however, they have been re-ordered to reflect

62 AUDIENCE RESEARCH
the purpose of audience research and the different tvpes of information ;t
provides, as outlined in Chapter Two. This summary list is useful as a reminder of what data will be available for analysis.
The question remains, however, as to how to deal with this information. Unquestionably, some researchers will be more interested in certain aspects
of the questionnaire, while others will have different concerns. There is no
single format for analyzing these data. Nonetheless, in Tables 5-2 to 5-5, a series of "issues of interest" are listed for each of the different types of information provided by the survey (assessment of the current family planning situation, analysis of sociodemographic and social psychological factors af
fecting family planning, etc.). This list of issues is intended to aid the researcher in identifying those questions that are of greatest interest.
In each instance, the "issue of interest" is also accompanied by the suggested statistical procedure for obtaining the desired information. Thus, once the researcher identifies the key points to analyze, lie or she can select those statistical procedures that will provide such information. In this way, the researcher can avoid costly and unnecessary computer runs (or worse yet, hand tabulations) of information that is of little interest.
Since most researchers will want to get as much information as possible from their study without making it unduly tedious for potential readers, the following approach is suggested for synthesizing this sizable quantity of in
formation into a digestable report. The areas to cover include the following.
Assessment of the current family planning situation The main information regarding knowledge and use of contraceptives can
be obtained through a series of frequencies and cross-tabulations. The key questions to be answered about the current status of family planning among the target population are listed in Table 5-2, along with the suggested statistical procedures for obtaining the information.
Analysis of factors which relate to acceptance This section of the analysis is perhaps the most difficult because of: (a) the quantity of hypotheses to test (b) the different levels of measurement (categorical vs. continuous vari
ables) (c) the variety of possible definitions of "acceptance." 1. Hypotheses. The sample questionnaire provides data for testing both
sociodemographic and social psychological variahles in relation to acceptance.
These variables are listed in Table 5-1 and outlined again below. Even if the researcher thinks it is highly unlikely that a given variable is related to acceptance, lie or she should put it to the test if the data are available.
2. Levels o.f measurement. If the relationship between two variables that

63 GUIDELINES FOR ANALYSIS
Table 5-1. LISTING OF ALL VARIABLES IN SAMPLE QUESTIONNAIRE BY TOPIC AREAS.*
Possible values to be excluded
A. CURRENT FAMILY PLANNING SITUATION
I-1. Knowledge of Concept of Family Planning (first question)
1-2. Knowledge of Concept of Family Planning (second question)
Knowledge of Contraceptives
N-I. Knowledge of Pill N-2. Knowledge of IUD N-3. Knowledge of female sterilization N-4. Knowledge of male sterilization N-5. Knowledge of injections N-6. Knowledge of condom N-7. Knowledge of creams, jellies, foams N-8. Knowledge of suppositories N-9. Knowledge of rhythm N-1O. Knowledge of withdrawal N-11. Knowledge of diaphragm N-12. Knowledge of herbs, teas, etc. N-13. Knowledge of other
N-27. Which method most reliable 99
Attitude
K-1. Attitude toward family planning K-2. Strength of family planning attitude: 8,9
approval K-3. Strength of family planning attitude: 8,9
disapproval K-4. Reason for disapproval 88,99 K-5. Attitude of spouse toward family planning
Attitudes and Opinions about Pill
0-1. Frequency--take the pill 8,9 0-2. If forgets pill one day 8,9 0-3. If forgets pill 3 or 4 days 8,9 0-4. Is the pill safe for most women? 8,9 0-5. In what way is the pill unsafe? 88,99 0-6. Would take pill or advise it 8,9 0-7 Reason: against taking pill 88,99
Attitudes and Opinions about IUD
P-i. Where is IUD placed? 8,9 P-2. How to tell if IUD is in place? 8,9
* The numbers on this list correspond to the questionnaire in Chapter Three.

64 AUDIENCE RESEARCH
Table 5-1. LISTING OF ALL VARIABLES IN SAMPLE QUESTIONNAIRE BY TOPIC AREAS (Continued).
A. CURRENT FAHILY PLANNING SITUATION (CONT'D)
Attitudes and Opinions about IUD (Cont'd)
P-3. Side effects of IUD when inserted
P-4. Is ZUDsafe for most women? P-5. Would use IUD or advise it P-6. Reason: against IUD
Attitudes and Opinions about Female Sterilization
Q-1. Nature of female sterilization operation Q-2. Effect of female sterilization on sex
drive Q-3. Effect of female sterilization on health Q-4. What are harmful effects of female steri-
lization? Q-5. Would have female sterilization or advise
it Q-6. Reason: against female sterilization
Attitudes and Opinions about Vasectomy
R-l. Nature of vasectomy operation
R-2. Effect of vasectomy on man's sex drive R-3. Effect of vasectomy on man's health R-4. What are harmful effects of vasectomy? R-5. Would have vasectomy or advise it R-6. Reason: against vasectomy
Attitudes on Sex Education
CC-l. Boys: age to learn about sex CC-2. Girls: age to learn about sex CC-3. Attitude: sex education
Use
N-14. Has ever used pill N-15. Has ever used IUD N-16. has ever used female sterilization N-17. Has ever used male sterilization N-18. Has ever used injections N-19. Has ever used condom N-20. Has ever used cream, jellies, foam
N-21. Has ever used suppositories N-22. Has ever used rhythm N-23. Has ever used withdrawal N-24. Has ever used diaphragm N-25.. Has ever used herbs, teas, etc. N-26. Has ever used other N-28. Current use of a family planning method
N-29. Method currently using
Possible values to
be excluded
88,99
8,9 8,9
88.99
8,9 8,9
8.9 88,99
8,9
88.99
8,9 8.9 8,9
88,99 8.9
88,99
99 99 9
88

65 GUIDELINES FOR ANALYSIS
Table 5-1. LISTING OF ALL VARIABLES IN SAMPLE QUESTIONNAIRE BY TOPIC AREAS (Continued).
A. CURRENT FAMILY PLANNING SITUATION (CONTID)
Use (Cont'd)
N-30. Time--has used current method N-31. Source of contraceptives N-32. Non-usera: last method used N-33. Reason for abandoning method
B. FACTORS RELATING TO ACCEPTANCE: SOCIODEDOGRAPHIC
A-6. State, department C-1. Marital status
(Pregnancy history--women only)
D-1. Number of living children D-2. Number of male children D-3. Number of female children D-4. Number of children who have died D-5. Age of last child in months D-6. Number of miscarriages D-7. Number of (induced) abortions D-8. Current pregnancy status D-9. Number of weeks since last period D-1O. Total number live births D-11. Total number pregnancy losses D-12. Total number pregnancies D-13. Currently fertile? D-14. Reason for infertility
(Number of children--men only)
E-1. Number of living children E-2. Number of children who have died
EE-I. Sex of respondent EE-2. Ethnic or racial group EE-3. Language spoken at home EE-4. Age of respondent EE-5. Age of spouse EE-6. Religious sect EE-?. Degree of religiosity EE-8. Literacy EE-9. Respondent's facility for reading EE-IO. Spouse's facility for reading EE-11. Ever attended school EE-12. Last grade of school completed EE-13. Spouse--eer attended school EE-14. Spouse--last grade of school completed EE-15. Respondent has paying job EE-16. Respondent's current occupation EE-17. Spouse has paying job EE-18. Spouse's current occupation EE.'q. Average monthly family income EE-lL Number of persons living in house
Possible values to be excluded
88,99 8,9 88
88,99
88
88.99
88
8,9
9 9
99 8
88.99
8 88

66 AUDIENCE RESEARCH
Table 5-1. LISTING OF ALL VARIABLES IN SAMPLE QUESTIONNAIRE BY TOPIC AREAS (Continued).
Pessible values to be excluded
C. FACTORSRELATING 10 ACCEPTANCE: SOCIAL PSYCHOLOGICAL
Reproductive Ideals
B-1. Best age--girl to marry 99 B-2. Best age--boy to marry 99 B-3. Length of time before first child 77,99 B-4. Ideal number of children-for couples in 77,99
community B-5. Previously thought--how many children B-6. (Women only) Previously worried about 8
accidental pregnancy B-7. (Women only) Extent of worry-accidental 8.9
pregnancy B-8. Ideal number of children--if just married 77,99
B-9. Ideal number--boys 77.99 B-IO. Ideal number--girls 77,99
B-11. What is "too many children" ? 99 B-12. What is "too few children" ? 99
B-13. Opinion: large vs. small family 9 B-14. Reasons for favoring large family 88,99 B-15. Reasons for favoring smal. family 88,99 B-16. Ideal length of time--betveen births 77.99
Desire for More Children
F-1. WantE more children? 9 F-2. Reason: wants more children 88,99 F-3. Number of children--when respondent had 88,99
"erough" F-4. How many more children desired ? 77,88,99 F-5. Spouse wants more children? 8,9 F-6. Number of additional children--spouse 88,99
wants
Importance of Having One or More Sons
G-1. Importance of having at least one son 9 G-2. If 4 daughters, would try for son? 9 G-3. If 3 daughters and I son, would try for 9
2nd son?
Awareness of Demographic Problem
H-1. Population increasing? 9
H-2. Number of people--too many? 9
H-3. Rate of population increase 9
H-4. Action to avoid population increase? 8.9
H-5. What action should be taken? 88.99

67 GUIDELINES FOR ANALYSIS
Table 5-1. LISTING OF ALL VARIABLES IN SAMPLE QUESTIONNAIRE BY TOPIC AREAS (Continued).
Possible values to be excluded
C. FACTORS RELATING TO ACCEPTANCE: SOCIAL PSYCHOLOGICAL (CONT'n)
Husband-Wife Communication
J-1. Discusses family-related problems with 8,9spouse8,
J-2. Has discussed ideal number of children with spouse 8,9
J-3. Has discussed family planning with spouseJ-4. Last time discussed fauily planning with
spouse 88,99 J-5. Number children when first discussed
family planning
Social Acceptability of Family Planning
L-1. Extent of approval for family planning-communiLy women
L-2. Perception of attitude: aunt 8,9L-3. Perception of attitude: uncle 8,9 L-5. Perception of attitude: mother-in-law 8,9L-6. Perception of attitude: father-in-law 8.9 L-7. Perception of attitude: brother 8,9 L-8. Perception of attitude: mother 8,9L-9. Perception of attitude: father 8,9 L-10. Perception of attitude: grandmother 8,9L-11. Perceptlon of attitude: grandfather 8,9 L-12. Perception of attitude: beat friend 8,9L-13. Perception of attitude: doctor 8,9L-14. Perception of attitude: teacher 8,9 L-15. Perception of attitude: priest 8,9L-16. Perception of attitude: president of
countryL-17, Perception of attitude: closest neighbor 8,9
Popular Beliefs about Family Planning
H-1. Family planning goes against God's will 9 H-2. Family planning encourages infidelity 9 14-3. Family planning encourages premarital sex 9 H-4. Teens will have sex relations anyway 9
Perceptions of Infant Mortality
W-1. Of 10 infants born, how many will grow up? 99 W-2. Of 5 infents born, how many will grow up? 9 W-3. Greater or fewer infants die now 9 W-4. Woman should bear 4 to get 3 9
Effect of Pregnancy on Woman's Health
X-1. Harmful to have too many children 9X-2. Harmful to have children too close to
gether 9

68 AUDIENCE RESEARCH
Table 5-1. LISTING OF ALL VARIABLES IN SAMPLE QUESTIONNAIRE BY TOPIC AREAS (Continued).
Possible values to be excluded
C. FACTORS RELATING TO ACCEPTANCE: SOCIAL PSYCHOLOGICAL
(CONT'D)
Perceived Economic Value of Children
Y-1. Sons: School vs. drop out to work 9 Y-2, Sons: Age to leave school 99. Y-3. Daughter: School vs. drop out to work 9 Y-4. Daughter: Age to leave school 99 Y-5. More children, easier to make a living? 9
Children and Security in Old Age
Z-l. Should children support parents in old age? 8,9 Z-2. Plans to live with children in old age? 9 Z-3. Are lots of children more security? 9
Aspirations for One's Children
BB-1. Son: should leave home for better job? BB-2. Son: should have same job as father?
BB-3. Son: work he should have 88-4. Daughter: should leave home for better job? B8-5. Daughter: should work before marriage?
9 9
88,99 9 9
D. FACTORS RELATING TO ACCEPTANCE: SERVICE-RELATED
Previous Contact with Program Activities
S-l. Has received home visit S-2. S-3. S-4. S-5.
S-6.
S-7. S-8. S-9.
S-10. S-11. S-12.
Number of home visits received Perceived utility of home visit Explanation: utility of visit Has attended public meetin& on family planning
Number of public meetings attended
Perceived utility of public meeting Explanation: utility of public meeting Has attended small group discussion-family planning
Number of small group discussions attended Perceived utility: small group discussion Explanation: utility of discussion
8,9 8,9
R8,99
8,9
8,9 88,99
8,9 8,9
88.99
Knowledge of Sources of Contraceptives
N-34. Respondent mentions family planning center
or clinic N-35.
N-36.
Respondent mentions health center or post in town
Respondent mentions health center or post in another town
N-37. N-38. N-39. N-40. N-41. N-42.
Respondent mentions pharmacist Respondent mentions private doctor Respondent mentions midwife Respondent mentions distributor
Respondent mentions faith healer Respondent mentions other source

69 GUIDELINES FOR ANALYSIS
Table 5-1. LISTING OF ALL VARIABLES IN SAMPLE QUESTIONNAIRE BY TOPIC AREAS (Continued).
Possible values to
D. FACTORS RELATING TO ACCEPTANCE: SERVICE-RELATED
(CONT'0)
Distance to Family Planning Location
N-43. Most convenient family planning location N-44. Time required to get to moat convenient
family planning location
E. CHANNELS OF COMMUNICATION: MASS MEDIA
U-1. Have radio or access to one? U-2 to U-25-- Hours at which respondent listens to
U-26. U-27. U-28. U-29.
U-30. U-31. U-32. U-33. U-34. U-35. U-36. U-37. U-38. U-39.
radio Frequency of listening to radio Hour at which radio is turned on Favorite radio station Favorite radio program Frequency of listening to: music, songs Frequency of listening to: news Frequency of listening to: soap operas Frequency of listening to: sports Frequency of listening to: religious programs Frequency of listening to: advice to home-makers 8,9 Frequency of listening to: advice on agriculture 8,9 Frequency of listening to: education/health Ever heard family planning on radio? Frequency: hears family planning on radio
Other Mass Media
V-1. Have TV or access to one V-2. Frequency of watching TV V-3 to V-21-- Hours at which respondent watches TV V-22. V-23. V-24. V-25. V-26. V-27. V-28. V-29.
V-30. V-31. V-32. V-33. V-34.
V-35. V-36. V-37. V-38. V-39.
V-40. V-41. V-42. V-43.
Favorite TV program Ever heard of family planning on TV? Frequency: hears family planning on TV Are there newspapers in town? Frequency of reading newspaper Name of newspaper Ev'r saw family planning in newspaper? Frequency: sees family planning in newspaper Are there magazines in town? Frequency of reading magazines Name of magazine Ever seen family planning in magazine? Frequency: sees family planning in magazin,! Is there a movie theater nearby? Frequency: goes to movies Ever seen family planning at movie theater? Ever seen pamphlet on family planning? Number of family planning pamphlets has seen Last time: saw family planning pamphlet Ever seen family planning poster? Where: saw family planning poster Last time: saw family planning poster
be excluded
88,99 888,999
9 88,99 88,99 88.99
8.9 8,9 8,9 8,9 8,9
8,9 8,9 8,9
9
88,99 8,9 9
9 88,99 8,9 9
9 88,99 8,9 9
9 8.9
88,99
88,99
88,99 88,99

70 AUDIENCE RESEARCH
Table 5-1. LISTING OF ALL VARIABLES IN SAMPLE QUESTIONNAIRE BY TOPIC ARE'iS (Continued).
Possible values to
be excluded
F. CHANNELS OF COMMUNICATION: PERSON-TO-PERSON
T-1. Can women discuss family planning easily? 9 T-2. Can men discuss family planning easily? 9
T-3. Can husbands and wives discuss family planning easily? 9
T-4. Has ever discussed family planning with: spouse 8,9
T-5. Has ever discussed family planning with: mother 8,9
T-6. Has ever discusbed family planning with: father 8,9
T-7. Has ever discussed family planning with: aunt or uncle 8,9
T-8. Has ever discussed family planning with: other female relatives 8,9 *-9.Has ever discussed famfly planning with: other male relatives 8.9
T-10. Has ever discussed family planning with:
close friends 8,9 T-11. Has ever discussed family planning with:
neighbors 8,9
7-12. Has ever discussed family planning with: doctor 8,9
T-13. Has ever discussed family planning with:
nurse 8,9 T-14. Has ever discussed family planning with:
midwife 8,9
T-15. Has ever discussed family planning with: health promotor 8,9
T-16. Has ever discussed family planning with: pharmacist 8,9
T-17. Has ever discussed family planning with: priest 8,9
T-18. Number of ,eople: discussed family plan
ning in past month 99
T-19. Give or receive family planning advice? 8,9
Desire to Learn More About Family Planning
DO-1. DD-2. DD-3.
DD-4. DD-5. DD-6.
Desire to learn more about family planning Reason: does not want more information 88,99
Attitude: public meeting on family planning 8,9
Attitude: home visit on family planning 8,9
Attitude: radio and TV on family planning 8,9
Attitude: written material on family planning 8,9

71 GUIDELINES FOR ANALYSIS
Table 5-2. ASSESSMENT OF THE CURRENT FAMILY PLANNING
Issues of interest
What percentage of respondents have ever heard of family planning?
Are these differences in knowledge by some key variable (ethnic group, reli-gion, sex)?
What methods are best-known and how widespread Is this knowledge?
What method is judged most reliable (apart from sterilization)?
What are the most common misconceptions or rumors concerning certain methods?
Which methods are most widely approved? Least approved? Why?
What percentage approve of family planning?
What are the chief reasons for disap-proval?
Do respondents and their spouses generally agree on family planning?
What percentige of respondents are currently using family planning?
What percentage of respondents have ever used family planning?
What methods are most widely used?
On the average, how long have these people used family planning?
What are the chief sources of family planning?
Are there differences in use by ethnic group or region?
What percentage of respondents has ever tried the different methods and how widespread is this experimentation?
What are the chief reasons for abandon-ing a family planning method?
What are the prevalent attitudes toward sex education?
SITUATION.
Statistical procedures
Combine I-1 and I-2 into a single variable; run frequencies
Cross-tabulations of knowledge (combine I-1 and 1-2) by the key variables
Run frequencies for N-1 to N-13, list all in a single table in order of most-to-least frequently mentioned
Run frequencies for N-27
Run frequencies for 0-1 to 0-5, P-1 to P-4, Q-1 to Q-4, R-l to R-4
Run frequencies for 0-6, 0-7, P-5, P-6, Q-5, Q-6, R-5, R-6
Combine information from K-i, K-2, and K-3 into a single 5-point attitude scale; run frequencies
Frequencies for K-4
Cross-tabulation of K-1 by K-5
Frequencies of N-28
Frequencies of N-28 and N-32
Frequencies of N-29
Frequencies of N-30
Frequencies of N-31
Cross-tabulation of N-36 by key variables
Run frequencies for N-14 to N-26; list all in a single table in order of mostto-least frequently mentioned
Cross-tabulation of N-32 by N-33
Run frequencies for CC-I, CC-2, CC-3

72 AUDIENCE RESEARCH
Table 5-3. ANALYSIS OF SOCIODEMOGRAPHIC FACTORS AFFECTING FAMILY PLANNING.
Issues of interest* Statistical procedures
What are the characteristics of family Cross-tabulation of N-28 by all socioplanning acceptors (i.e., what socio- demographic variables of interest,
demographic variables relate to which could include:
contraceptive use)? A-6.
C-1. D-l. D-4.
EE-1, EE-2. EE-4. EE-5.
EE-6. EE-7. EE-8. EE-9.
State or department
Harital status (E-l) Number of living children (E-2) Number of children who have died Sex of respondent Ethnic or racial group Age of respondent** Age of spouse**
Religious sect Degree of religiosity Literacy Respondent's facility for reading
EE-lO. Spouse's facility for reading EE-ll. Ever attended uchool EE-12. Last grade of school completed EE-13. Spouse ever attended school EE-14. Spouse last grade completed
EE-15. Respondent--paying job EE-16. Respondent's current occupation EE-17. Spouse--paying job
EE-18. Spouse's current occupation EE-19. Average monthly family income
(or divide this by EE-20 to get per capita monthly income)
*If contraceptive use is very low, the researcher may wish to focus on attitude
instead of actual use. In general, however, use is the key concern.
**If both men and women are interviewed, the researcher may prefer to tabulate
age of husband (be it*a male respondent or a female respondent's husband) and
age of wife (be it a female respondent or a male respondent's wife) rather than
of respondent and spouse, since the latter tends to obscure the effect of sex of
the respondent. This may also be done for the literacy and education variables.

73 GUIDELINES FOR ANALYSIS
Table 5-4. ANALYSIS OF SOCIAL PSYCHOLOGICAL FACTORS AFFECTING FAMILY PLANNING.
Issues of interest
What social psychological factors repre-sent obstacles to the acceptance of family planning?
Which of these social psychological obstacles are most important is tnis country (or study area)?
Statistical procedures
Cross-tabulations of N-28 by each of the variables or indices listed below (which may be collapsed to 4 or less categories as necessary):
Ideal family size: B-4 or B-8 Concern for pregnancy and childbearing:
B-5, B-6, B-7 Attitude toward spacing: B-3, B-16 Importance of having sons: G-1, G-2,
G-3 Awareness of demographic problem: H-I,
H-2, H-3 Husband-wife communication: J-l, J-2,
J-3 Social acceptability of family plan
ning:* L-2 to L-17 Religions/moral attitudes toward family
planning: H-1, M-2, M-3 Perception of infant mortality:** W-l,
V-2, V'-3, W-4
Awareness of health effects: X-l, X-2 Perceived economic value of children:
Y-l, Y-2, Y-3, Y-4, Y-5 Children and security in old age: Z-l,
Z-2, Z-3 Aspirations for one's children: BB-l.
BB-2, BB-4, BB-5 Degree of informal communication:***
T-4 to T-17
Ascertain that all the above variables and indices are in continuous form; define family planning acceptance in continuous form. Obtain Pearson correlations and/or use multiple regression.
*Recommendation for constructing this index: Calculate the proportion of people on the list L-2 to L-17, who would approve of family planning (ex.: 8 of 16 0.50). "Not applicable" responses should be excluded from the denominators (ex.: a respondent who did not have a grandmother or grandfather would have a total of 14 for the denominator; if 8 people would approve, the proportion would be 8 of 14, or 0.57). These calculations can all be done by computer.
**Recommendation for constructing this index: Give one point for each of the
following answers: To W-1. 8 or less will live To W-2. 4 or less will live To W-3. More die now than before To W-4. Women should bear 4 to get 3.
The resulting index ranges from 0 to 4, with 4 indicating strong perceptions of infant mortality.
***Recommendation for constructing this index: Follow same procedure as for index of social acceptability of family planning.

74 AUDIENCE RESEARCH
Table 5-5. ANALYSIS OF SERVICE-RELATED VARIABLES AFFECTING FAMILY PLANNING.
Issues of interest Statistical procedures
What degree of contact has the target Run frequencieg for S-1, S-2, S-5, S-6, population had with family planning 3-9, S-10 program activities?
What haa been the reaction to these Run frequencies for S-3, S-4, S-7, S-8, contacts with program activities? S-11, S-12
To what extent does the target popu- Run frequencies for N-34 to N-42 lation know where to obtain contraceptives, and what are the moat commonly mentioned sources?
How convenient are family planning Run frequencies for N-43 and N-44 service locations to potential users?
Does the degree of contact with program Construct index for number of contacts activities or knowledge of contracep- (combining S-1, S-2, S-5, S-6, S-9, tive sources differ on some key S-10) and for knowledge of sources variable (sex, ethnic group, etc.)? (summing the number of "yes" responses
on N-34 to N-42); cross-tabulate these
indices by the key variables.
are both categorical is being tested, the logical choice of procedure is crosstabulation.
If, on the other hand, both variables are in continuousform, the researcher has several options.
(a) If each variable has four or less categories, use cross-tabulation (b) If one or both have numerous categories, "collapse" these categories
to four or less, and use cross-tabulation (c) If one or both have numerous categories, determine the correlation
between these variables rather than run a cross-tabulation (this latter procedure provides a convenient "summary" measure, but often means a loss of information).
3. Multiple items to meavirea single social psychological factor.As shown in Table 5-1, most of the social psychological factors are measured by a series of three or four relevant questions. This measurement raises an additional problem as to whether each separate item should be tested in relation to family planning acceptance or combined into an index and then tested in regard to family ptunning acceptance.
The construction of indices has the great advantage of synthesizing tis large amount of available data. By contrast, the testing of every variable becomes very tedious; readers of the final report may be so overwhelmed by small details that they lose sight of the main findings.

75 GUIDELINES FOR ANALYSIS
Thus, it is highly recommended that a single index be constructed for each social psychological factor.* This index can be made by combining the responses to the three or more questions on a given topic into an index score. For example, the index for "husband-wife communication" could be constructed so that it would range from "0" to "3," with one point given for each "yes" answer to the following:t
J-1: Has discussed family-related problems with spouse J-2: Has discussed ideal number of children with spouse J-3: Has discussed family planning with spouse.
The completed indices will have three, four, or five categories. This result is advantageousin that the indices can then be used in either cross-tabulations orcorrelations.
4. Definition of acceptance of family planning.This issue is both substantive and methodological. On the substantive side, the definition may depend on the current family planning situation in the country and the goals of the family planning program. For ex.mple, in the 1976 audience research done i. rural areas of Guatemala, there had been little previous promotion and little availability of contraceptives, so that actual use was predictably low. Thus, much of the analysis of "acceptance" was done in terms of the fivepoint attitude-towards-family-planning scale. By contrast, in a country where contraceptive use is fairly high, should be ancurrent use integral part of the definition of "acceptance."
On the methodological side, it is preferable to have acceptance defined as a continuous variable, if possible. In tis form, it can eventually be used in a multiple regression procedure, to determine the relative importance of the different sociodemographicandsocialpsychologicalfactorsin the acceptance of family planning.
However, in some cases the single most important concern is currentuse of contmceptives, which is clearly a categorical variable ("yes," "no").
The two definitions of "acceptance" are included below for possible use in the analysis. Each researcher will want to select the one which seems most
*Those with experience in factor analysismay wish to construct an index by running a factor analysis of all variables under question, determining which items group together("load high") on a single concep, and possibly discarding those which do not load on any factor, thereby obtaining the social psychological indices to be tested. For a concrete example of this, see J.T. Bertrand, Maria Antonieta Pineda, and Fidel EnriqueSoto, Communicating Family Planning to Rural Guatemala (Chicago: Community and Family Study Center, The University of Chicago, 1978), Chapter Two.
t"Follow-up questions" that are only asked of some of the respondents, accordingto their resprnse to the previous question, should not be included in indices. They tend to bias the index by automatically "lowering" the index scores of people who were not asked the question.

76 AUDIENCE RESEARCH
Table 5-6. ASSESSMENT ON MASS AND INTERPERSONAL CHANNELS OF COMMUNICATION FOR
FAMILY PLANNING.
Issues of interest
What are the potentially most effective mass media for reaching the target population (i.e., what percentage of respondents have access to each media and with what frequency)?
What are the media habits and prefer-ences of the target population (which would suggest the best stations, programs, times, etc., to reach the audience)?
To what extent have family planning messages used in the past reached the target population?
In terms of interpersonal communication. with whom are respondents most likely to have discussed family planning?
To what extent is family planning a difficult subject to discuss for this population?
On the average, with how many people have the respondents discussed family planning in the past month?
What are the characteristics of family planning opinion leaders?
What percentage of the target population wants more information on family plan-ning? How would they like to receive it?
What are the main reasons for not wanting more family planning information?
Statistical procedures
Run frequencies for U-1, U-26, V-l, V-2, V-25, V-26, V-30, V-31, V-35, V-36
Run frequencies for U-2 to U-25. U-27, U-28, U-29, U-30 to U-37, V-3 to V-21, V-22, V-27, V-32
Run frequencies for U-38, U-39, V-23, V-24, V-28, V-29, V-33, V-34, V-37, V-38, V-39, V-40, V-41, V-42, V-43
Run frequencies for T-4 to T-7; list in rank order of importance
Run frequencies for T-] to T-3
Run frequencies for T-18
Cross-tabulation of T-19 by the list of sociodemographic variables in Table 5-3
Run frequencies for DD-l, DD-3, DC-4, DD-5, DD-6
Run frequencies for DD-2
appropriate or to create a different definition more suited to particular circumstances.
(a) Attitude and use are treated separately as categorical variables. Both variables are used in their categorical form and tested with all sociodemographic and social psychological factors. This definition has the advantage of providing clear-cut evidence of the relationships by categories. It has the disadvantage of not permitting a final ranking of the order of importance of different factors; also, the results for each factor must be "presented twice" (once for attitude, once for use).
(b) Attitude and use are treated separately as continuous variables. Attitudes toward family planning is used as a five-point scale. "Use" is expanded into three categories: (1)never used, (2) has used but abandoned method, and (3) currently using. These two variables are then tested with all sociodemographic and social psychological factors.

77 GUIDELINES FOR ANALYSIS
This definition has the advantage of allowing for a ranking of importance of the different factors in each instance, using multiple regression. Its disadvantage is that results for each factor must still be"presented twice"; also, in rigorous terms, neither variable is strictly continuous.
The decision as to which of these options (or possibly others) to use restswith the individual researcher, and depends in part on the purpose of the research and the intended audience. For example, in a country where familyplanning acceptance is fairly widespread and the research report needs to be short and concise, the best option might be simply to report the relationshipof each different variable to contraceptive use.
Summary. Before attempting to identify factors that affect family plan.ning acceptance, the researcher will need to construct indics for the social psychological factors as well as to define "family planning acceptance" and its level of measurement.
As discussed above, th" sample questionnaire provides data on three typesof factors that may relate to family planning acceptance: sociodemographic,social psychological, and service-related. Suggested plans of analysis for each type are presented in Tables 5-3, 5-4, and 5-5, respectively.
Presentation of data on mass and interpersonal channels of communication
The analysis of the data is relatively simple in comparison to the abovesection on factors affecting the acceptance of family planning. It mainly involves frequency data and a few cross-tabulations. The main questions to beanswered are listed in Table 5-6, along with the suggested statistical procedures for obtaining these answers.
Notes
1Nie, Norman et al. StatisticalPackagefor the Social Sciences (2nd ed.)(New York: McGraw Hill, 1975).
2Barr, Anthony J. et al. A User's Guide to SAS 76 (Raleigh, N.C.: SparksPress, Inc., 1976).
3Elkins, Henry G. Mini-tab Edit, Mini-tab Frequencies and Mini-tab Tablcs: A Set of Interrelated Statistical Programs for Small Computers(Chicago: Community and Family Study Center, The University of Chicago, 1971).

Chapter Six
APPLYING THE RESULTS TO AN I-E-C STRATEGY
The final and most important step in audience research is to use the results in designing (or modifying) an I.E-C strategy. The end product of audience research should be more than an academic report with graphs and tables.
Rather, it should indicate the implications of the findings for future I-E-C
activities and should provide specific recommendations for the communica
tion program, This result is especially true when the research has been
carried out by a special research team or evaluation unit, with the implemen
tation of the results being the responsibility of the I-E-C Division of a given
organization. It should be stressed that the research findings do not in themselves pro
vide the "perfect formula" for an I-E-C program. One cannot, for example, translate the percent distributions obtained from this research into the number of spots needed on x number of channels to motivate x percent of the population to use family planning. Rather, the findings provide information
about several different aspects of the I-E-C program-content, channels, audi
ence characteristics, etc.-which can aid program designers in making appropriate choices and decisions.
This final chapter illustrates the way in which specific findings can be used to design or modify an I-E-C strategy. Key "issues" have been selected from the items listed in Tables 5-2 to 5-6, and hypothetical "research findings" are given to illustrate the types of recommendations that can be derived from the findings.*
*For an account of this implementation process in an actual family planning pro
gram, see Jane T. Bertrand, Maria Antonieta Pineda, and Fidel Enrique Soto, Communi
cating Family Planning to Rural Guatemala (Chicago: Community and Family Study
Center, The University of Chicago, 1978).
78

79 APPLYING THE RESULTS
The "research findings" presented below may be quite different from wnat the reader would expect to find if he or she were to carry out this type of audience research in his or her own country or state. Nonetheless, this section is included in order to provide a concrete example of how research findings can be translatedinto recommendations for an I-E-C program.
Again, it should be stressed that the findings themselves do not provide instantaneous answers or fixed formulas. Rather, the results require careful interpretation, with special attention to what each piece of information means in terms of the overall I-E-C program. Once information is available on the different aspects, then the researcher can begin to combine the different pieces of information into a comp:ehensive strategy. The different categoriesof information that will be useful in this process include the following.
A.Current family planning situation -If the audience research yielded the following results (left column), one
could derive specific program implications (right column) as shown below:
Research Findings ProgramImplications
1. Ninety percent of the target au- There is a need for more infordience have heard about family mation on the various contracep. planning, but only forty percent tive mp '.ods. can name at least 3 contraceptive methods.
2. The best-known methods are the Special attention should be givenpill, condoms, and rhythm; the to informing and educating the majority do not know of the public about voluntary contramore effective methods such as ceptive surgery and the IUD. voluntary contraceptive surgery or the IUD.
3. The majority (75 percent) be- The program should try to counlieve that the pill is the most re- ter the rumors regarding the pill,liable method. However, many by emphasizing its effectiveness report that it can cause cancer and the large numbers of women or seriously harm a woman's who use it safely, and stressinghealth. There are no damaging the availability of different niethrumors about ihe c""e,,methods ods and the need to find the one that are mentioned by more which "suits you best." than a few respondents.
4. The vast majority of those who Same as above; also, emphasizehave heard of family planning that family planning improves approve of it (80 percent). A- health by preventing closelymong those who disapprove, spaced or excessive pregnancies.

80 AUDIENCE RESEARCH
Research Findings
the chief reason is because it could ah,' a woman's health.
5. Although the majority approve of family planning, only 25 per-cent of the fertile-aged women are using contraceptives at the time of the interview. Another 25 percent have experimented with contraceptives, especially the pill, but have stopped taking it for fear of health effects.
ProgramImplications
The program needs to determine if therz are other obstacles to family planning use, in addition to fear of negative effects on health (see social psychological obstacles in section C below).
B. Sociodemographic factors and acceptance
of family planning
Research Findings
1. The women are much more favorable than men toward fam-fly planning.
2. Acceptance of family planning (both attitude and use) is high-er among couples with 3 or 4 children than among those with less than 3 or 5 or more.
3. Similirly, acceptance is higher among women 25 to 34 than among younger or older women.
4. People in the western region of the country are less favorable to family planning than those in the eastern region, even though the two groups are simi-lar in ethnic and socioeconomic characteristics.
ProgramImplications
Special programming should be designed that would be directed toward and would appeal to men; it should be broadcast at times when men are able to listen.
Communications should emphasize the desirability of spacing children from the start; also, that older women should protect themselves against unwanted pregnancy that could he harmful to their health.
Same as above.
I-E-C efforts in this geographical area should be intensified; at the same time, efforts should be made to identify obstacles unique to this area.
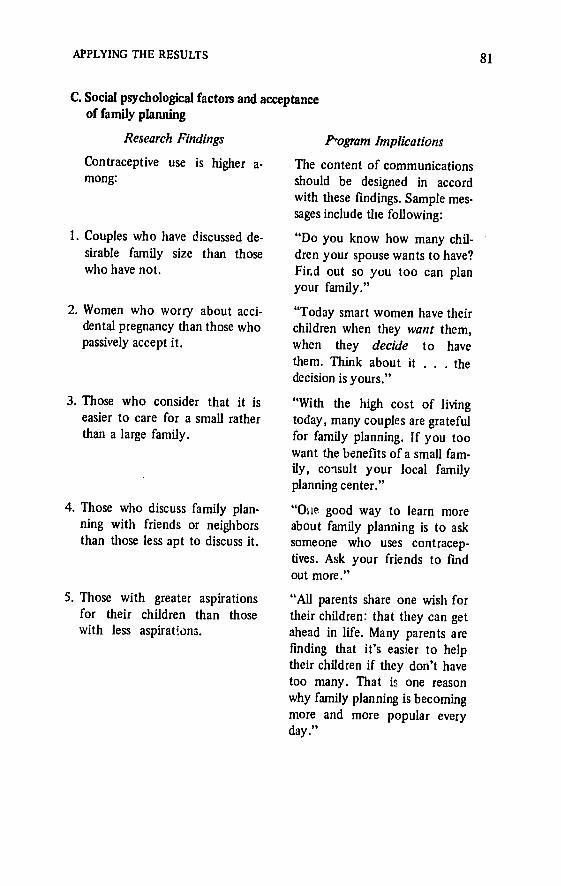
81 APPLYING THE RESULTS
C. Social psychological factors and acceptance of family planning
Research Findings
Contraceptive use is higher a-mong:
1. Couples who have discussed de-sirable family size than those who have not.
2. Women who worry about acci-dental pregnancy than those who passively accept it.
3. Those who consider that it is easier to care for a small rather than a large family.
4. Those who discuss family plan-ning with friends or neighbors than those less apt to discuss it.
5. Those with greater aspirations for their children than those with less aspirations.
ProgramImplications
The content of communications should be designed in accord with these findings. Sample messages include the following:
"Do you know how many children your spouse wants to have? Fird out so you too can plan your family."
"Today smart women have their children when they want them, when they decide to have them. Think about it . . . the decision is yours."
"With the high cost of living today, many couples are grateful for family planning. If you too want the benefits of a small family, consult your local family planning center."
"One good way to learn more about family planning is to ask someone who uses contraceptives. Ask your friends to find out more."
"All parents share one wish for their children: that they can get ahead in life. Many parents are finding that it's easier to help their children if they don't have too many. That is one reason why family planning is becoming more and more popular every day."

82
D. Service-related factors and acceptance of family planning
ResearchFindings
1. The use of family planning is twice as high among women who have attended a family planning talk than among others; yet only 20 percent of the tar. get population have had this contact.
2. Women who have received a home visit on family planning are no more likely than others to be favorable toward or to use family planning.
3. Women who have attended pub-lic meetings report them to be useful because they allow wom-en to %ear about others' exper-iences. In contrast, those who have recieved home visits objected to being "singled out."
4. Only 50 percent of the respon-dents can name at least one lo-cation at which to obtain con-traceptives. The percentage is even lower among those in the western region.
5. Most people mention health clinics as the source of contra-ceptives, yet they do not like using this service. Few people mention community-based dis-tribution, yet those who did spoke favorably of it.
AUDIENCE RESEARCH
ProgramImplications
Efforts should be made to expand this interpersonal component of the communication program.
The activity should be reconsidered and resources should perhaps be channelled into other more productive activities.
Same as above (although these descriptive data provide an explanation of tLe above phenomenon, to be taken into account in future programs).
Future communications should stress the locations at which family planning information and services are available, and additional messages should be programmed for the western region.
Messages should stress that there are various outlets for obtaining family planning services. Also, interpersonnel communication efforts should be intensified in areas with CBD programs for greater use of these services.

83 APPLYING THE RESULTS
E. Mass media and interpersonal channels for reaching the target population
Research Findings
1. A total of 85 percent of the target audience own a radio, whereas 15 percent own or have access to TV. Also, while liter-acy is 60 percent, only 20 per-cent have frequent access to newspapers or magazines.
2. The most popular radio stations, in order of importance, are
I. 2. 3. etc.
3. The target population reports a preference (in this order) for:
1. Music 2. Soap operas 3.News 4. Homemakers' program 5. etc.
4. Peak listening hours are: 1. 7-8 a.m. 2. 12-2 p.m. 3. 6-7 p.m.
5. Previous family planning com-munication programs have reached the following percent of people via the different chan-nels:
Radio... ....... 55 TV. .......... 5 Newspapers ........ 11 Magazines .. ..... 4 Posters ... ...... 7 Pamphlets .. ..... 10
Program Implications
The potentially most effective medium for reaching the target audience is radio. Since the majority are literate, one could complement radio programming with simple posters and pamphlets. However,TV, newspapers, and magazines will not be effective in reaching the target group.
Radio programming should be concentrated on the most popular stations.
Radio spots should be broadcast in conmection with preferred programming.
Scheduling should also take listening times into consideration.
Since none of the channels have even begun to have their potential effect, further I-E-C is indicated (especially via the channels described earlier as having the greatest potential reach).

84 AUDIENCE RESEARCH
Research Findings ProgramImplications
Family Planning Workers at Clinic. 40
Family Planning Workers-Home Visit. . . . 15
Family Planning Workers-Public Meeting. .
Other ... ....... 20
7
6. Sixty percent of the population There is still a felt need among would like more information on the target population for I-E-C family planning, and the pre- on family planning; this need ferred ways to receive it are: should be met (to the extent
1. Public meetings with a possible) through public meetfamily planning worker ings, pamphlets, and radio pro
2. Pamphlets describing the grams. methods
3. Radio programs or spots.
Conclusion In summary, percent distributicns and cross-tabulations alone do not
provide a very useful blueprint for designing or modifying an I-E-C program. Rather, each must be interpreted in light of its significance to the overall I-E-C program. In drawing together this body of information provided by the audience research, the researcher can make informed decisions regarding:
Content of the messages Necessary information to be diffused Motivational themes to be emphasized Obstacles to be addressed Rumors to be combated
Audience characteristics Special subgroups to be reached Sociodemographic traits that may affect acceptance
Channelsto be used Potentially most effective media
Most popular programs, stations, listening times Indicated types of interpersonnel activities.
The ultimate value of diagnostic research depend6 not only on the care with which the questionnaire is designed, the fieldwork conducted, or the analysis completed. The final step in the process is to present the findings in

85 APPLYING THE RESULTS
intelligible form and to draw the implications of the findings for a communications program. Without this final step, there is a strong possibility that the research results will never be incorporated into the ongoing programs and little will be gained for all one's efforts. In contrast, the researcher who provides a concrete information base for a program's I-E-C workers as well as specific suggestions regarding content, audiences, and channels will be performing a valuable service to the organization as a whole. Such a researcher is likely to have the satisfaction of seeing his or her research applied to ongoing and future communication programs.
Copyright © 2022 FDOKUMEN