Audience-Measurement-and-Broadcasting-Industry-Trends ...
66
AUDIENCE MEASUREMENT AND INDUSTRY TRENDS REPORT FOR Q1 2019-2020
-
Upload
khangminh22 -
Category
Documents
-
view
0 -
download
0
Transcript of Audience-Measurement-and-Broadcasting-Industry-Trends ...

AUDIENCE MEASUREMENT AND INDUSTRY TRENDS REPORT FOR
Q1 2019-2020


PAGE 1 OF 66
CONTENTS BACKGROUND ............................................................................................................................2
METHODOLOGY ........................................................................................................................2 NATIONAL INCIDENCE OF ACCESS TO MEDIA ...............................................................4
AUDIENCE DEMOGRAPHICS FOR FREE-TO-AIR AND PAY TV RADIO AND TELEVISION DATA. ........................................................................................................... ..5-16 MEDIA CONSUMPTION HABITS BY PRIME TIME AND OTHER TIME SEGMENTS………………………………………………………………………………....17-24
RADIO LISTENERSHIP BY TOPOGRAPHIES (REGIONS) ............................... 25-49
OVERALL ALLOCATION BY INDUSTRIES ................................................................. 50-51 ALLOCATIONS BY MEDIUM ....................................................................................... …51-52
TELEVISION – DETAILS ............................................................................................... …52-56 RADIO – DETAILS ........................................................................................................... …57-61
PROGRAM CATEGORIZATION ........................................................................................…62

BACKGROUND
In Kenya, broadcasting which is mainly done using Radio and TV is a medium for entertainment, information and education. Both Radio and Television outlets are accessible to nearly all of the people of Kenya, and are a powerful medium for influencing culture, beliefs and values as well as a tool for economic growth and development.
In view of the above, the Communications Authority of Kenya (CA), in fulfilment of its mandate in regard to administering the broadcasting content aspects of the ICT law, carries out monitoring of television and Radio broadcasters’ programmes in order to assess the level of broadcasters’ compliance with the regulatory requirements.
This monitoring provides insight into appropriateness of content aired as well as compliance with the requirements on: 40% Local content quota; PWDs accessibility mechanisms provisions; Advertisements requirements (10 minutes in every 30 minutes of programming, 40% local advertisement requirements; and the requirement to provide 5hrs per week of children’s programs during the watershed period.
In this regard, CA contracted the Kenya Audience Research Foundation (KARF) to provide Quarterly Audience measurement and Industry Trends Data for the fiscal years 2019/2020 and 2020/2021. Detailed here below is the data received for Quarter 1 (July-September 2019).
METHODOLOGY
(a). AUDIENCE MEASUREMENT (KARF TRACKING SURVEY)
1. Fixed panel Target: 3000 daily sample nationally aged 15+ years
2. Single Data Sourcing for TV, Radio, Print (Newspaper & Magazine) and Online data
3. Sampling frame is based on KARF Establishment Survey 2015(Using KNBS, NASSEP V)
4. Face to Face recruitment of panelists to verify LSM’s and training on the process
5. CATI- (Computer Aided Telephonic Interviews)
6. Key Analysis Variables - Age, gender, LSM, topography, rural/urban
7. Survey Period: Daily data collection, reported Monthly
8. Time Segment: 30 minutes blocks for Television & Radio, daily readership for print and daily Internet usage habits.
The Research Covers Quantitative research and NOT Qualitative

PAGE 3 OF 66
(b). MEDIA MONITORING (REELFORGE) Reelforge has specialized in media monitoring services since 2008. Over the years, we have developed a world-class process for tagging and analyzing all advertising across multiple stations in the region. We believe passionately that the work we do impacts brands across the region especially since we focus on providing you with analysis you can use to drive your brand’s growth. Our Ad monitoring methodology is as below; Stage 1 –Data capture: Reelforge has specialized recording servers in various locations across the country. At each location, the recording servers are connected to TV and radio antennas. This allows them to capture all the stations within that region. For example, in Mombasa we capture over eight fm stations from the coast region. All the servers in each of the locations are networked (wide-area network). Reelforge has collaborated with one of Kenya’s largest internet backbone providers. This interconnectivity allows us to capture and monitor all the TV and FM stations in real-time. Stage two –Storage: All recordings from all over the country are then stored on our central storage servers located in Nairobi. Reelforge has a policy of keeping all recordings; we have broadcast recordings of all stations in Kenya going back to 2009. STAGE 3 –DETECTION STAGE: Reelforge uses two methods of detecting ads. The first method is the auto-detection of pre-recorded ads. Reelforge has analysts who inputs new ads into our auto-detection servers. The software then produces a digital fingerprint of the ad. Once this is done, the servers automatically detect that ad every time it is aired on any station countrywide. The second method is manual entry. Reelforge has employed media analysts who monitor all the stations and input presenter mentions. It is not possible to auto-detect these mentions and so this is a manual process. However, the analysts input the mentions onto very advanced software. This allows our clients to be able to listen and view all ads directly from their computers.

AD Monitoring Services Stage 4 –Analysis Stage: once both automated and manual ads are inserted into our database, our specialized analysis servers crunch all that data then pass it onto our client website. There are over 10,000 ads and dimensions logged into our database every day. We have therefore developed software that looks at that data and presents the relevant data to our various clients dynamically.
Stage 4 –Ad Values:
Reelforge has procured advertising rate cards from all stations that we monitor. Once both manual and auto-detected Ads are uploaded on our portal, the system automatically assigns the advertising value of that Ad given that relevant parameters such as station, time and length of the Ad will already have been put in the detection stage.
Stage 6 –Quality Control:
Reelforge has a full Quality Control department whose function is to manage the daily reconciliation process. The department is responsible for managing this system and ensuring all client/ Media house queries are adequately catered to
Stage 7 –Client website:
Reelforge has the most advanced media-monitoring website in the region. Our model is different from other monitors. We allow our clients to generate their own reports as and when needed. Clients can generate proof-of-flight (brand) reports, industry competitor reports

PAGE 5 OF 66
NATIONAL INCIDENCE OF ACCESS TO MEDIA
Chart 1: Average daily incidence of Radio listenership is the highest across the month, with a decline in August and September. The decline is also noticed on all other media channels. This could be attributed to the absence of trending political news or sports during the period. In the month of July there was AFCON.
63.9%
48.6%
8.7%
28.5%
60.5%
42.8%
8.2%
24.3%
56.2%
41.7%
6.4%
22.8%
RadioIncidence TelevisionIncidence NewspaperIncidence onlineIncidence
July'19 Aug'19 Sept'19
N=19.0: Past 7 days media Consumers as per Establishment Survey 2015

AUDIENCE DEMOGRAPHICS FOR FREE-TO-AIR AND PAY TV RADIO AND TELEVISION DATA.
Chart 2: Free to Air channels remains high at over at over 90%, this is a clear indication that Kenyans acquired the set top box to watch the Free to Air channels.
95.0%
5.0%
94.0%
6.0%
95.0%
5.1%
Free-to-Air Pay TV
July'19 Aug'19 Sept'19
N=7.5M: Average Daily TV Viewers in September 2019

PAGE 7 OF 66
THE CURRENT AUDIENCE DEMOGRAPHICS FOR FREE TO AIR AND PAY TV STATTIONS
Chart 3:Free to Air channels viewership is higher in the rural areas but not significantly, while Pay TV is higher in the urban with the similar margin.
96%
4%
93%
7%
Free-to-Air PayTV
Rural Urban

Chart 4:Among the different age segments of the media consumers, Free to Air channels viewership dominate all, Pay TV is slightly higher in the age brackets 25-44, this is the segment that watch mainly sports on Super sport.
98%
93% 94%96% 96%
2%
7% 6%4% 4%
15to17 18to24 25to34 35to44 45+
Free-to-Air PayTV

PAGE 9 OF 66
Chart 5:Male TV viewers are higher in slightly higher on the Pay TV, this again is due to sports on the Super sport.
93%
7%
97%
3%
Free-to-Air PayTV
Male Female
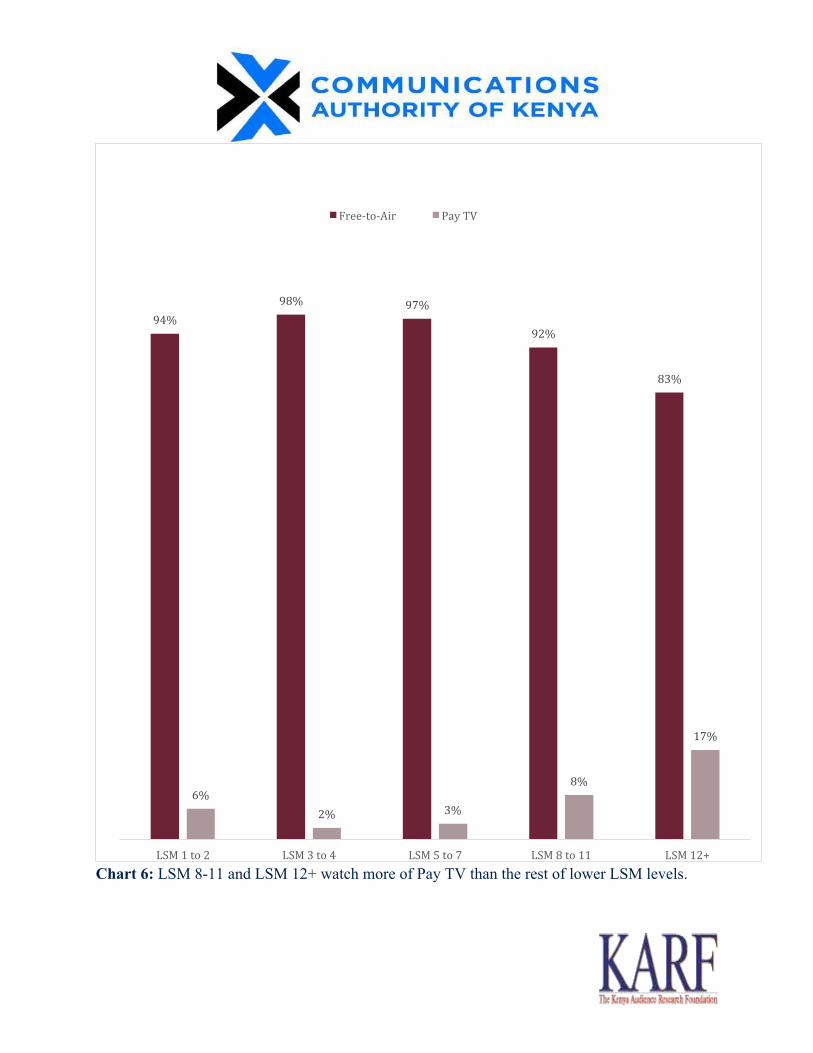
Chart 6: LSM 8-11 and LSM 12+ watch more of Pay TV than the rest of lower LSM levels.
94%98% 97%
92%
83%
6%2% 3%
8%
17%
LSM1to2 LSM3to4 LSM5to7 LSM8to11 LSM12+
Free-to-Air PayTV

PAGE 11 OF 66
Chart 7:Nairobi and North Western topographies watch more of Pay TV compared to the rest of the topos, North Western could be attributed to the weak signals of the Free to Air channels. While Nairobi is driven by sports.
91.0%
96.1% 92.3%
95.1% 95.7% 93.5%
96.4% 98.7% 99.7%
96.6%
88.6%
9.0%
3.9%7.7%
4.9% 4.3%6.6%
3.6%1.3% 0.3%
3.4%
11.4%
Nairobi Central Rift Western South Nyanza
Lake Lower Eastern
Coast Upper Eastern
North Eastern
North Western
Free-to-Air Pay TV

Free-To-Air stations Viewership
Chart 8:Citizen TV, KTN News and KTN Home are ranked as the most popular top three Free-to-Air stations across the 3 months. KBC TV declined by 8% in September after the AFCON tournament.
0.6%
0.8%
1.0%
0.7%
1.7%
2.1%
2.8%
4.0%
12.2%
7.3%
10.0%
10.2%
10.3%
11.0%
39.0%
0.8%
0.6%
0.7%
0.7%
1.4%
3.8%
2.8%
3.5%
4.4%
7.4%
12.0%
9.9%
10.3%
11.9%
43.1%
0.6%
0.6%
1.0%
1.0%
1.3%
2.3%
2.3%
2.7%
3.1%
7.8%
10.9%
11.5%
11.9%
12.1%
43.3%
Lolwe TV/LTN
Raia TV
Nyota TV
MT Kenya TV
Gikuyu TV
Switch TV
Kameme TV
Ebru TV
KBC TV
K24 TV
Inooro TV
NTV
KTN Home
KTN News
Citizen TV
Sept'19 Aug'19 July'19

PAGE 13 OF 66
Chart 9: Sports mainly football, drama and International News seem to be the key drivers of PAY TV channels. This evident as Super sport channels, Al Jazeera and Zee world are the most watched channels.
2.0%
3.5%
2.6%
1.5%
1.9%
7.1%
2.8%
3.2%
2.2%
2.0%
3.8%
4.0%
7.4%
14.6%
5.4%
12.2%
0.5%
0.2%
1.2%
1.1%
1.7%
1.8%
1.7%
2.2%
0.1%
4.3%
3.0%
3.2%
9.8%
20.3%
6.9%
15.1%
0.0%
0.0%
0.2%
1.8%
2.2%
2.2%
2.4%
2.4%
3.0%
3.3%
4.8%
6.5%
7.4%
9.2%
10.3%
23.5%
Afro Pop Music
e TV Africa
Big Brother Naija
Maisha Magic Bongo
Border TV
SuperSport 7
Kwese Free Sports/KFS
AMC (African Movie Channel)_Bamba
SuperSport 4
Nat Geo Wild
Supersport 9
AfricaMagic Epic
Maisha Magic East
Zee World TV
Al Jazeera
SuperSport 3
Sept'19 Aug'19 July'19
Pay TV – Channels Viewership
N=PayTVViewers400,533

Chart 9: TV is an evening media channel, picks as from 1800hrs – 2200hrs in the evening. Just as the reach, Citizen TV is rated higher than the rest of the stations.
0.0%
5.0%
10.0%
15.0%
20.0%
25.0%
30.0%
35.0%
40.0%
00:
00:0
0 - 0
0:30
:00
00:
30:0
0 - 0
0:59
:59
00:
59:5
9 - 0
1:30
:00
01:
30:0
0 - 0
2:00
:00
02:
00:0
0 - 0
2:29
:59
02:
29:5
9 - 0
3:00
:00
03:
00:0
0 - 0
3:30
:00
03:
30:0
0 - 0
3:59
:59
03:
59:5
9 - 0
4:30
:00
04:
30:0
0 - 0
5:00
:00
05:
00:0
0 - 0
5:29
:59
05:
29:5
9 - 0
6:00
:00
06:
00:0
0 - 0
6:30
:00
06:
30:0
0 - 0
6:59
:59
06:
59:5
9 - 0
7:30
:00
07:
30:0
0 - 0
8:00
:00
08:
00:0
0 - 0
8:29
:59
08:
29:5
9 - 0
9:00
:00
09
:00:
00 -
09:3
0:00
09:3
0:00
- 09
:59:
59
09
:59:
59 -
10:3
0:00
10:3
0:00
- 11
:00:
00
11
:00:
00 -
11:2
9:59
11:2
9:59
- 12
:00:
00
12
:00:
00 -
12:3
0:00
12:3
0:00
- 12
:59:
59
12
:59:
59 -
13:3
0:00
13:3
0:00
- 14
:00:
00
14:
00:0
0 - 1
4:29
:59
14
:29:
59 -
15:0
0:00
15:0
0:00
- 15
:30:
00
15
:30:
00 -
15:5
9:59
15:
59:5
9 - 1
6:30
:00
16
:30:
00 -
17:0
0:00
17:0
0:00
- 17
:29:
59
17
:29:
59 -
18:0
0:00
18:
00:0
0 - 1
8:30
:00
1
8:30
:00
- 18:
59:5
9
18:
59:5
9 - 1
9:30
:00
1
9:30
:00
- 20:
00:0
0
20:
00:0
0 - 2
0:29
:59
2
0:29
:59
- 21:
00:0
0
21:
00:0
0 - 2
1:30
:00
2
1:30
:00
- 21:
59:5
9
21:
59:5
9 - 2
2:30
:00
2
2:30
:00
- 23:
00:0
0
23:
00:0
0 - 2
3:29
:59
2
3:29
:59
- 00:
00:0
0
Citizen TV KTN Home Inooro TV KTN News NTV
K24 TV Ebru TV KBC TV Kameme TV Switch TV
N=7.5M: Average Daily TV Viewers in September 2019

PAGE 15 OF 66
Chart 10: Nat Geo Wild and Zee World, are rated higher on the morning hours 8am – 1400hrs. Super sport channels pick during the afternoon (1500hrs – 1000hrs) when EPL is being aired, Al Jazeera also has a spike in the evening for international News.
0.00%
2.00%
4.00%
6.00%
8.00%
10.00%
12.00%
14.00%
16.00%
18.00%
20.00%
SuperSport 3 Zee World TV Al Jazeera TV AfricaMagic Epic
Supersport 9 Maisha Magic East Nat Geo Wild SuperSport 4
Easter TV SuperSport 7
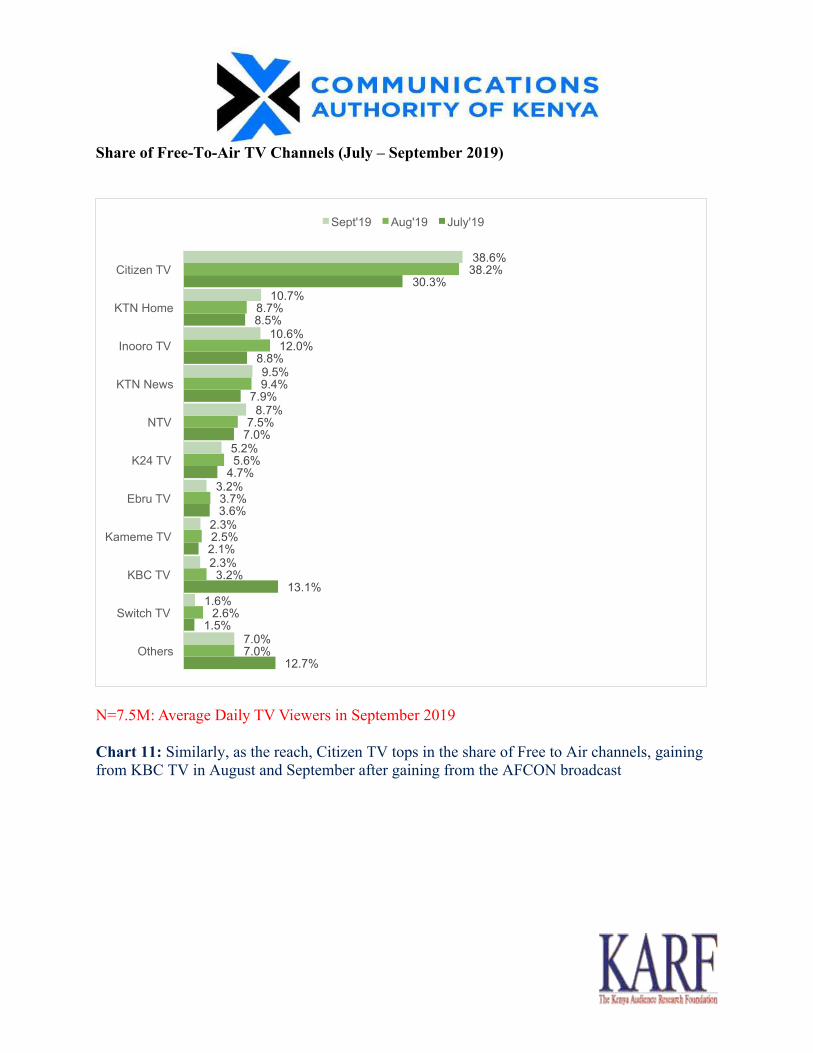
Share of Free-To-Air TV Channels (July – September 2019)
N=7.5M: Average Daily TV Viewers in September 2019 Chart 11: Similarly, as the reach, Citizen TV tops in the share of Free to Air channels, gaining from KBC TV in August and September after gaining from the AFCON broadcast
12.7%
1.5%
13.1%
2.1%
3.6%
4.7%
7.0%
7.9%
8.8%
8.5%
30.3%
7.0%
2.6%
3.2%
2.5%
3.7%
5.6%
7.5%
9.4%
12.0%
8.7%
38.2%
7.0%
1.6%
2.3%
2.3%
3.2%
5.2%
8.7%
9.5%
10.6%
10.7%
38.6%
Others
Switch TV
KBC TV
Kameme TV
Ebru TV
K24 TV
NTV
KTN News
Inooro TV
KTN Home
Citizen TV
Sept'19 Aug'19 July'19
PAGE 17 OF 66
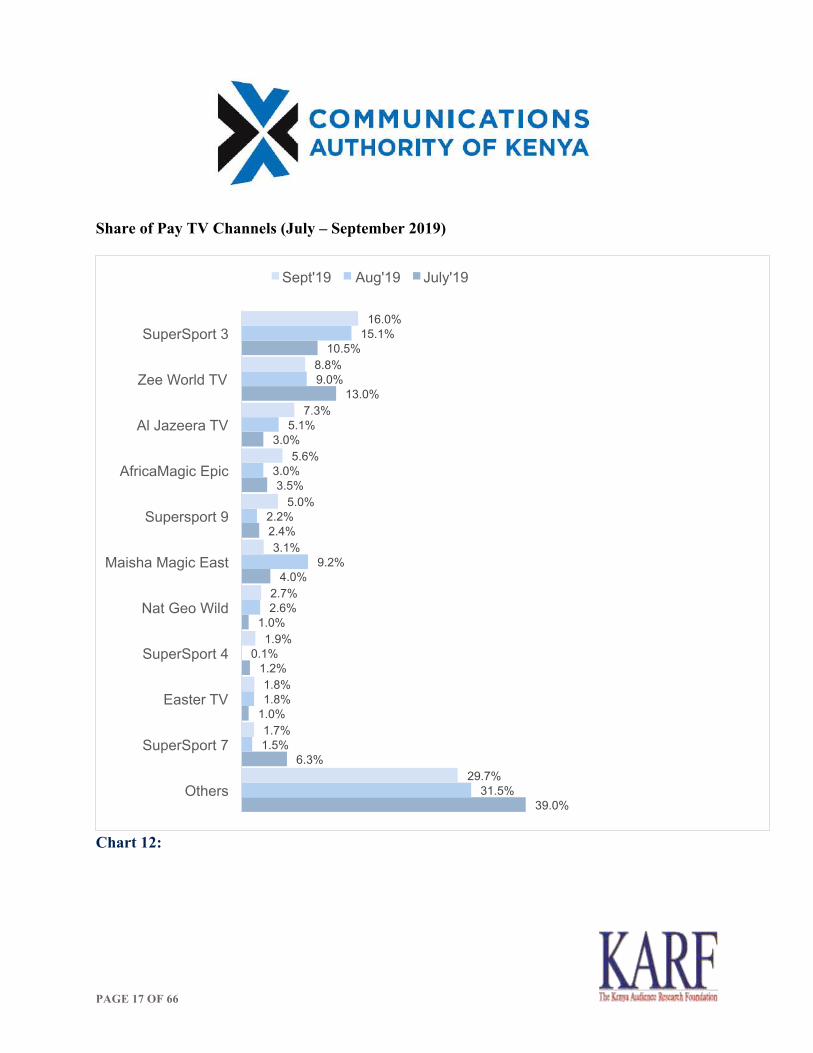
Share of Pay TV Channels (July – September 2019)
Chart 12:
39.0%
6.3%
1.0%
1.2%
1.0%
4.0%
2.4%
3.5%
3.0%
13.0%
10.5%
31.5%
1.5%
1.8%
0.1%
2.6%
9.2%
2.2%
3.0%
5.1%
9.0%
15.1%
29.7%
1.7%
1.8%
1.9%
2.7%
3.1%
5.0%
5.6%
7.3%
8.8%
16.0%
Others
SuperSport 7
Easter TV
SuperSport 4
Nat Geo Wild
Maisha Magic East
Supersport 9
AfricaMagic Epic
Al Jazeera TV
Zee World TV
SuperSport 3
Sept'19 Aug'19 July'19

MEDIA CONSUMPTION HABITS BY PRIME TIME AND OTHER TIME SEGMENTS
N=7.5M: Average Daily TV Viewers in September 2019 Chart 13:TV Viewership is predominantly during prime time (1800hrs – 2200hrs), its ranked at averagely over 80% across the 3 months as compared to the rest of the time segments, this is because TV requires active visual participation which is not possible as consumers engage in other activities during the day.
89.0%
36.5%
88.1%
34.8%
87.5%
31.5%
0.0%
10.0%
20.0%
30.0%
40.0%
50.0%
60.0%
70.0%
80.0%
90.0%
100.0%
PrimeTime Otherprogrammingtimeblocks
July'19 Aug'19 Sept'19

PAGE 19 OF 66
N=7.5M: Average Daily TV Viewers in September 2019 Chart 14: There is no major difference in terms of consumption during prime time among rural and urban consumers.
86.9%
31.2%
88.3%
31.9%
Prime Time Other programming time blocks
Setting
Rural Urban

N=7.5M: Average Daily TV Viewers in September 2019 Chart 15: The older segment of 45+ seems to be watching TV during other programming time segments than the others age segments.
85.2% 85.4% 88.8%
86.5% 88.6%
31.6% 31.5% 29.7%
27.4%
36.8%
15 to 17 18 to 24 25 to 34 35 to 44 45+
Age
Prime Time Other programming time blocks

PAGE 21 OF 66
N=7.5M: Average Daily TV Viewers in September 2019 Chart 16:
86.0%
34.8%
89.2%
27.8%
Prime Time Other programming time blocks
Gender
Male Female
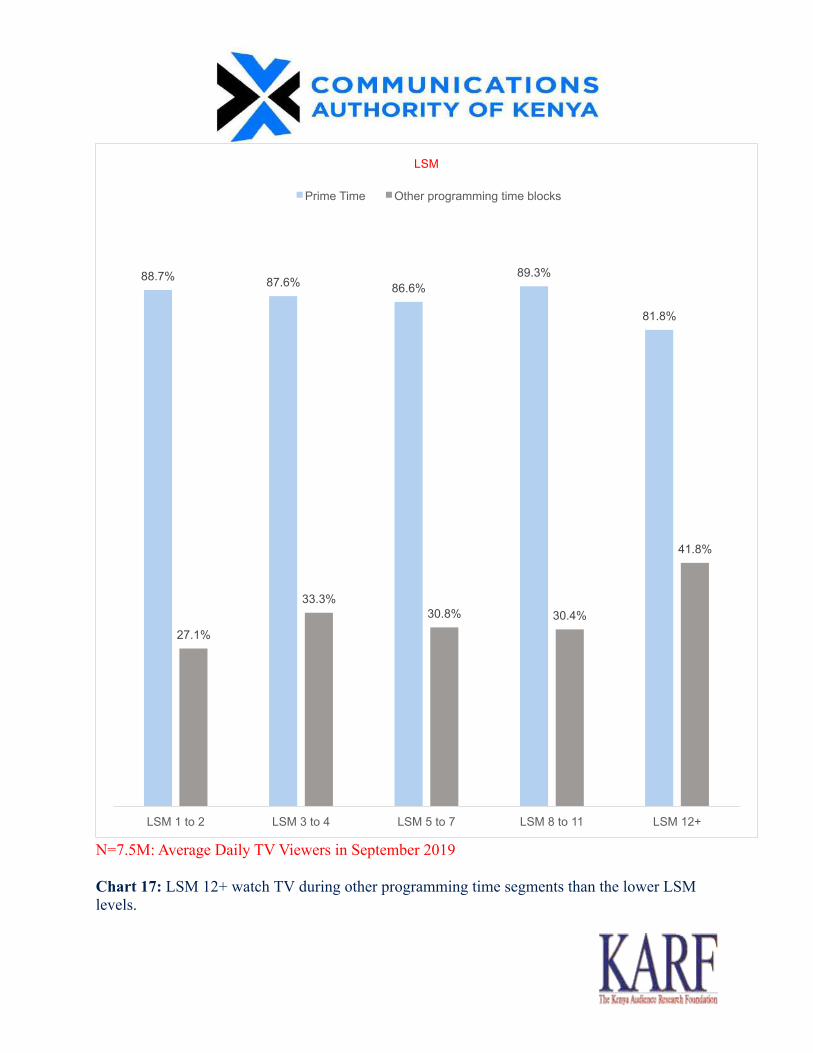
N=7.5M: Average Daily TV Viewers in September 2019 Chart 17: LSM 12+ watch TV during other programming time segments than the lower LSM levels.
88.7% 87.6% 86.6% 89.3%
81.8%
27.1%
33.3% 30.8% 30.4%
41.8%
LSM 1 to 2 LSM 3 to 4 LSM 5 to 7 LSM 8 to 11 LSM 12+
LSM
Prime Time Other programming time blocks

PAGE 23 OF 66
Chart 18
0.8%
1.4%
1.0%
0.7%
0.6%
2.7%
2.3%
4.1%
11.6%
7.4%
9.8%
10.8%
10.3%
10.7%
39.1%
0.6%
1.0%
0.6%
0.6%
0.8%
2.6%
3.8%
3.6%
3.9%
7.5%
11.7%
11.5%
11.0%
11.6%
43.8%
0.5%
0.8%
0.8%
1.0%
1.2%
2.2%
2.3%
2.8%
2.8%
7.6%
10.7%
11.9%
11.9%
12.4%
43.5%
RaiaTV
GikuyuTV
NyotaTV
MT.Kenya
SuperSport3
KamemeTV
SwitchTV
EbruTV
KBC
K-24
InooroTV
KTNNews
NTV
KTNHome
CitizenTV
Sept'19 Aug'19 July'19
N=Prime Time Viewers6,944,360
Prime Time Stations viewership

Chart 19
1.9%
19.7%
2.6%
4.0%
4.1%
4.8%
5.5%
8.6%
8.5%
9.5%
11.0%
34.9%
3.5%
4.3%
2.7%
2.8%
5.8%
5.1%
6.6%
11.0%
10.7%
11.7%
11.4%
41.8%
1.3%
2.6%
2.8%
3.1%
3.4%
5.2%
6.8%
8.9%
9.3%
12.9%
14.1%
38.0%
ZeeWorldTV
KBC
KamemeTV
GikuyuTV
SwitchTV
EbruTV
K-24
KTNHome
NTV
InooroTV
KTNNews
CitizenTV
Sept'19 Aug'19 July'19
N=Other Programing time blocks Viewers 2,499,993
Otherprogrammingtimeblocksstationsviewership

PAGE 25 OF 66
N=7.5M: Average Daily TV Viewers in September 2019 Chart 20
0.00%
5.00%
10.00%
15.00%
20.00%
25.00%
30.00%
35.00%
40.00%
18:00:00 - 18:30:00
18:30:00 - 18:59:59
18:59:59 - 19:30:00
19:30:00 - 20:00:00
20:00:00 - 20:29:59
20:29:59 - 21:00:00
21:00:00 - 21:30:00
21:30:00 - 21:59:59
21:59:59 - 22:30:00
Citizen TV KTN Home Inooro TV KTN News NTV
K24 TV Ebru TV KBC TV Kameme TV Switch TV

Chart 21
0.00%
2.00%
4.00%
6.00%
8.00%
10.00%
12.00%
14.00%
16.00%
18.00%
20.00%
00:
00:0
0 - 0
0:30
:00
00:
30:0
0 - 0
0:59
:59
00:
59:5
9 - 0
1:30
:00
01:
30:0
0 - 0
2:00
:00
02:
00:0
0 - 0
2:29
:59
02:
29:5
9 - 0
3:00
:00
03:
00:0
0 - 0
3:30
:00
03:
30:0
0 - 0
3:59
:59
03:
59:5
9 - 0
4:30
:00
04:
30:0
0 - 0
5:00
:00
05:
00:0
0 - 0
5:29
:59
05:
29:5
9 - 0
6:00
:00
06:
00:0
0 - 0
6:30
:00
06:
30:0
0 - 0
6:59
:59
06:
59:5
9 - 0
7:30
:00
07:
30:0
0 - 0
8:00
:00
08:
00:0
0 - 0
8:29
:59
08:
29:5
9 - 0
9:00
:00
09
:00:
00 -
09:3
0:00
09:3
0:00
- 09
:59:
59
09
:59:
59 -
10:3
0:00
10:3
0:00
- 11
:00:
00
11
:00:
00 -
11:2
9:59
11:2
9:59
- 12
:00:
00
12
:00:
00 -
12:3
0:00
12:3
0:00
- 12
:59:
59
12
:59:
59 -
13:3
0:00
13:3
0:00
- 14
:00:
00
14:
00:0
0 - 1
4:29
:59
14
:29:
59 -
15:0
0:00
15:0
0:00
- 15
:30:
00
15
:30:
00 -
15:5
9:59
15:
59:5
9 - 1
6:30
:00
16
:30:
00 -
17:0
0:00
17:0
0:00
- 17
:29:
59
17
:29:
59 -
18:0
0:00
21:
59:5
9 - 2
2:30
:00
2
2:30
:00
- 23:
00:0
0
23:
00:0
0 - 2
3:29
:59
2
3:29
:59
- 00:
00:0
0
Citizen TV Inooro TV KTN News KTN Home NTV
Ebru TV K24 TV Kameme TV SuperSport 3 Gikuyu TV
N=Other Programing time blocks Viewers2,499,993

PAGE 27 OF 66
RADIO LISTENERSHIP SECTION Radio Listenership - National
Chart 22
1.5%
1.6%
1.6%
1.7%
2.6%
2.9%
2.9%
3.3%
4.5%
5.8%
6.5%
12.1%
Egesa FM
Kass FM
Classic FM
Musyi FM
Radio Taifa
Milele FM
Ramogi FM
Kameme Radio
Inooro FM
Radio Maisha
Jambo FM
Citizen Radio

Radio Listenership by topographies (Regions) - Nairobi
Chart 23
1.5%
1.6%
1.6%
1.6%
2.4%
3.0%
3.5%
4.1%
5.2%
12.0%
13.2%
Egesa FM
Milele FM
Classic FM
Radio Taifa
Inooro FM
Ramogi FM
Radio Maisha
Kameme Radio
Ghetto Radio
Citizen Radio
Jambo FM

PAGE 29 OF 66
Radio Listenership by topographies (Regions) –Central -(Nyandarua, Nyeri, Kirinyaga, Muranga’, Kiambu, Embu, Laikipia, Nakuru and Kajiado)
Chart 24
0.8%
0.8%
1.0%
1.0%
1.2%
1.9%
2.1%
2.5%
2.6%
3.6%
3.8%
6.5%
10.4%
15.1%
Kigooco FM
Meru FM
Kiss FM
Milele FM
Radio Taifa
Gukena FM
Coro FM
Classic FM
Wimwaro FM
Radio Maisha
Jambo FM
Citizen Radio
Kameme Radio
Inooro FM

Radio Listenership by topographies (Regions) - Rift - (Baringo, Uashin Gishu, Elgeyo Marakwet, Nandi, Narok, Kericho and Bomet)
Chart 25
1.3%
1.3%
2.1%
2.7%
3.4%
3.7%
3.8%
4.9%
6.2%
7.1%
9.9%
14.1%
Taach FM
Classic FM
Milele FM
Touch FM
Jambo FM
Radio Taifa
Mayian FM
Emoo FM
Chamgei FM
Radio Maisha
Kass FM
Citizen Radio

PAGE 31 OF 66
Radio Listenership by topographies (Regions) - Western - (West Pokot, Trans Nzoia, Kakamega, Bungoma, Vihiga and Busia)
Chart 26
1.5%
1.8%
1.9%
1.9%
2.1%
2.4%
3.0%
4.5%
8.5%
9.0%
13.3%
20.9%
Radio Mambo
West FM
Qwetu Radio (Kwetu)
Radio Ingo
Sulwe FM
Radio Taifa
Mulembe FM
Nyota FM
Radio Maisha
Milele FM
Jambo FM
Citizen Radio

Radio Listenership by topographies (Regions) – South Nyanza - (Kisii and Nyamira)
Chart 27
0.2%
0.2%
0.2%
0.3%
0.9%
1.9%
2.1%
4.6%
4.8%
5.4%
7.9%
14.5%
15.0%
30.6%
Tarumbeta Radio
Voice of Victory FM
Qwetu Radio (Kwetu)
KBC English Radio
Sayare Radio
Kisima Radio
Kisii FM
Milele FM
Radio Minto
Jambo FM
Radio Taifa
Citizen Radio
Radio Maisha
Egesa FM

PAGE 33 OF 66
Radio Listenership by topographies (Regions) – Lake- (Kisumu, Siaya, Homa-Bay and Migori)
Chart 28
0.7%
0.8%
0.9%
1.0%
1.2%
1.8%
2.5%
3.5%
5.7%
6.6%
6.7%
8.8%
10.8%
23.3%
Hope FM
Classic FM
Jesus is Lord Radio
Dala FM
Milele FM
Radio Lake Victoria/Osienala
Tarumbeta Radio
Radio Taifa
Radio Maisha
Mayienga FM
Citizen Radio
Jambo FM
Nam Lolwe FM
Ramogi FM

Radio Listenership by topographies (Regions) – Coast- (Mombasa, Kilifi ,Kwale, Tana River, Lamu and Taita Taveta)
Chart 29
0.8%
1.1%
1.2%
1.4%
1.5%
1.6%
1.7%
1.7%
2.6%
2.6%
3.9%
4.0%
5.2%
9.4%
24.7%
Msenangu FM
Baraka FM
Bahari FM
Anguo FM
Pwani FM
Musyi FM
Ramogi FM
Tana FM
Classic FM
Radio Taifa
Jambo FM
Milele FM
Radio Maisha
Kaya FM
Citizen Radio

PAGE 35 OF 66
Radio Listenership by topographies (Regions) – Lower Eastern- (Kitui, Machakos and Makueni)
Chart 30
0.5%
0.9%
1.3%
1.6%
1.6%
1.7%
2.2%
2.4%
3.9%
4.4%
5.7%
10.9%
11.3%
17.3%
Mwatu FM
Inooro FM
Radio Taifa
Radio Maisha
Ene FM
Biblia Husema/BBH Radio
Kigooco FM
Milele FM
Jambo FM
County FM
Mbaitu FM
Athiani FM
Citizen Radio
Musyi FM

Radio Listenership by topographies (Regions) – Upper Eastern- (Meru, Isiolo and Tharaka)
Chart 31
1.5%
1.5%
1.6%
1.9%
2.5%
3.4%
3.6%
5.1%
5.8%
10.3%
10.7%
11.6%
TulizaFM
KamemeRadio
MileleFM
ThiiriFM
MwagoFM
RadioTaifa
RadioMaisha
InooroFM
JamboFM
CitizenRadio
MuugaFM
MeruFM
PAGE 37 OF 66
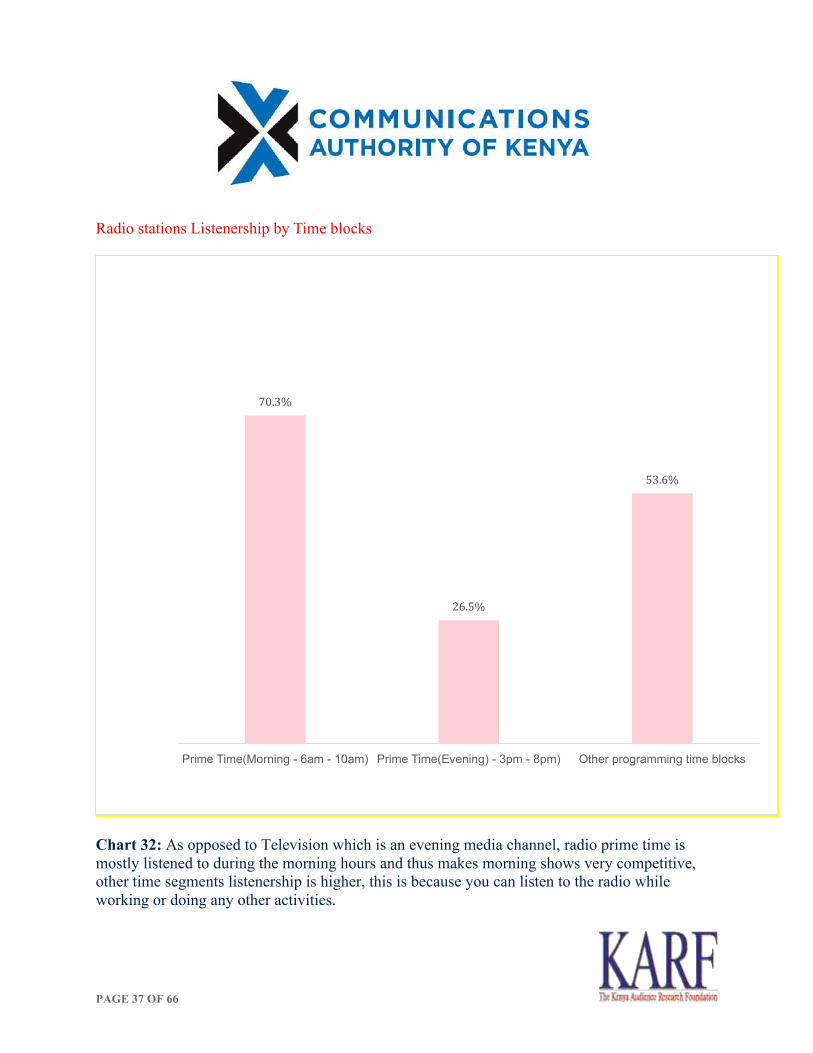
Radio stations Listenership by Time blocks
Chart 32: As opposed to Television which is an evening media channel, radio prime time is mostly listened to during the morning hours and thus makes morning shows very competitive, other time segments listenership is higher, this is because you can listen to the radio while working or doing any other activities.
70.3%
26.5%
53.6%
Prime Time(Morning - 6am - 10am) Prime Time(Evening) - 3pm - 8pm) Other programming time blocks

Chart 33: The morning prime time segment is consistent at 70% across the 3 months.
69.8%
27.3%
54.4%
70.4%
26.8%
53.5%
70.7%
25.1%
52.8%
0.0%
10.0%
20.0%
30.0%
40.0%
50.0%
60.0%
70.0%
80.0%
Prime Time(Morning - 6am - 10am) Prime Time(Morning - 3pm - 8pm) Other programming time blocks
Jul-19 Aug-19 Sep-19
N=34.3M:Average Daily Radio Listeners in July - September 2019

PAGE 39 OF 66
Demographics of prime-time vs other programming time radio listeners
Chart 34: The morning prime time segment is the same in urban and rural, other programming time segments is higher in rural areas than in urban.
69.6%
27.7%
55.0%
71.4%
24.5%
51.3%
Prime Time(Morning - 6am - 10am) Prime Time(Morning - 3pm - 8pm) Other programming time blocks
Rural Urban

Chart 35: Female radio listeners are in the morning in the morning prime time and other programing time segments, males are in the evening prime time.
69.2%
27.0%
52.1%
71.5%
25.9%
55.3%
Prime Time(Morning - 6am - 10am)
Prime Time(Morning - 3pm - 8pm)
Other programming time blocks
Male
Female

PAGE 41 OF 66
Chart 36
73.3%
26.2%
58.2%
63.3%
28.2%
53.7%
71.6%
23.1%
51.9%
70.1%
28.9%
52.6%
72.1%
26.9%
55.0%
Prime Time(Morning - 6am - 10am) Prime Time(Morning - 3pm - 8pm) Other programming time blocks
15 to 17 18 to 24 25 to 34 35 to 44 45+

Chart 37
69.8%
27.7%
54.9%
70.3%
26.9%
52.1%
70.4%
26.7%
55.7%
71.5%
22.9%
53.3%
68.0%
25.4%
49.6%
Prime Time(Morning - 6am - 10am) Prime Time(Morning - 3pm - 8pm) Other programming time blocks
LSM 1 to 2 LSM 3 to 4 LSM 5 to 7 LSM 8 to 11 LSM 12+

PAGE 43 OF 66
Stations listenership by prime time vs other programming time .
Chart 38
1.4%
1.6%
1.6%
2.5%
2.6%
2.9%
3.1%
4.7%
4.9%
5.4%
6.1%
7.8%
9.6%
12.5%
20.7%
2.8%
1.2%
2.8%
2.1%
3.6%
3.3%
1.6%
3.9%
4.2%
5.7%
5.3%
6.9%
10.0%
9.5%
24.7%
1.8%
1.4%
1.9%
3.0%
3.4%
2.8%
1.8%
4.8%
5.7%
6.3%
4.5%
7.5%
9.9%
9.6%
21.3%
Nam Lolwe FM
Chamgei FM
Athiani FM
Kass FM
Egesa FM
Musyi FM
Classic FM
Radio Taifa
Milele FM
Ramogi FM
Kameme Radio
Inooro FM
Radio Maisha
Jambo FM
Citizen Radio
Otherprogrammingtimeblocks
PrimeTime(Morning-3pm-8pm)
PrimeTime(Morning-6am-10am)

Morning Prime Time stations rating. (600hrs – 1000hrs)
Chart 39: Citizen Radio is the most listened to during the morning shows, followed closely by Radio Jambo, which picks from 800am.
0.00%
2.00%
4.00%
6.00%
8.00%
10.00%
12.00%
14.00%
16.00%
18.00%
20.00%
06:00:00-06:30:00
06:30:00-06:59:59
06:59:59-07:30:00
07:30:00-08:00:00
08:00:00-08:29:59
08:29:59-09:00:00
09:00:00-09:30:00
09:30:00-09:59:59
09:59:59-10:30:00
CitizenRadio JamboFM RadioMaisha InooroFM
KamemeRadio RamogiFM MileleFM RadioTaifa
MusyiFM EgesaFM
PAGE 45 OF 66
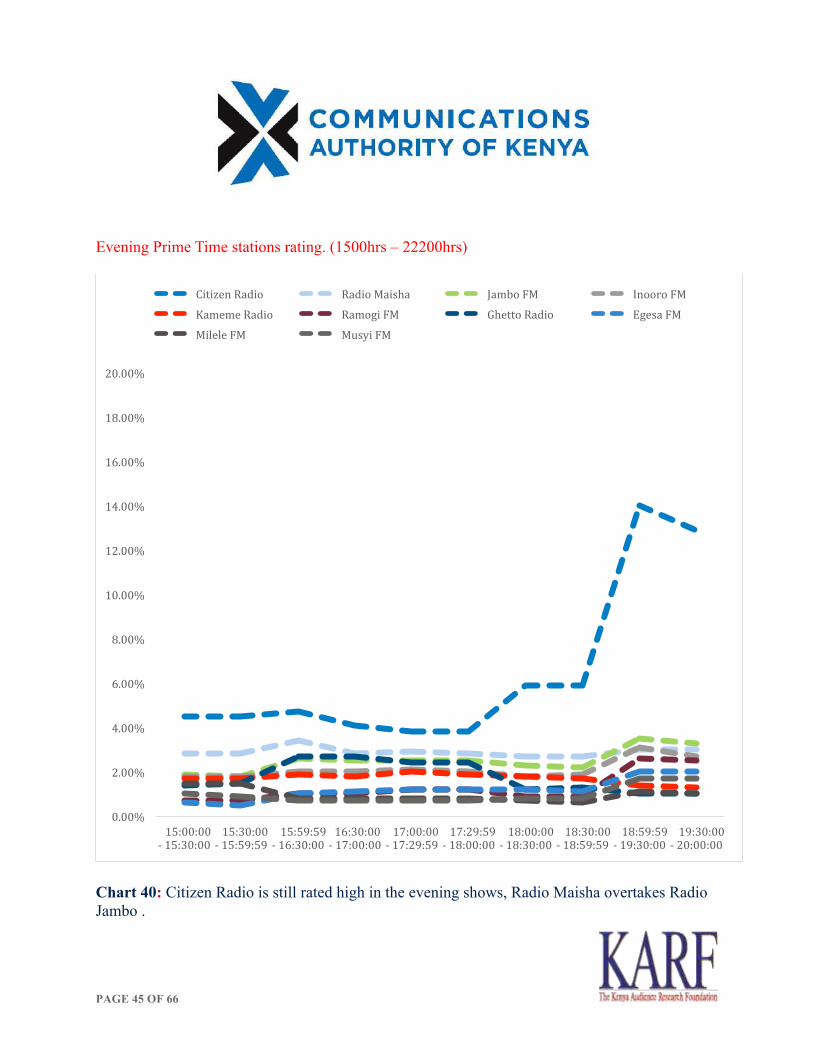
Evening Prime Time stations rating. (1500hrs – 22200hrs)
Chart 40: Citizen Radio is still rated high in the evening shows, Radio Maisha overtakes Radio Jambo .
0.00%
2.00%
4.00%
6.00%
8.00%
10.00%
12.00%
14.00%
16.00%
18.00%
20.00%
15:00:00-15:30:00
15:30:00-15:59:59
15:59:59-16:30:00
16:30:00-17:00:00
17:00:00-17:29:59
17:29:59-18:00:00
18:00:00-18:30:00
18:30:00-18:59:59
18:59:59-19:30:00
19:30:00-20:00:00
CitizenRadio RadioMaisha JamboFM InooroFM
KamemeRadio RamogiFM GhettoRadio EgesaFM
MileleFM MusyiFM
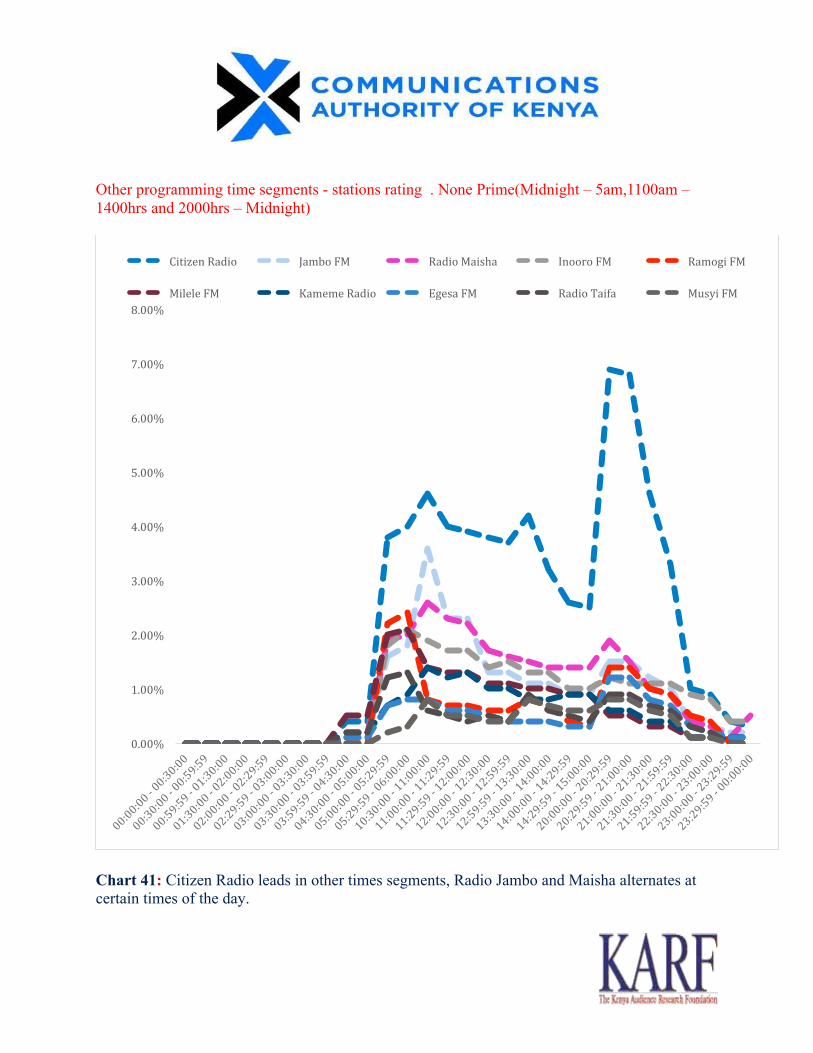
Other programming time segments - stations rating . None Prime(Midnight – 5am,1100am – 1400hrs and 2000hrs – Midnight)
Chart 41: Citizen Radio leads in other times segments, Radio Jambo and Maisha alternates at certain times of the day.
0.00%
1.00%
2.00%
3.00%
4.00%
5.00%
6.00%
7.00%
8.00%
CitizenRadio JamboFM RadioMaisha InooroFM RamogiFM
MileleFM KamemeRadio EgesaFM RadioTaifa MusyiFM

PAGE 47 OF 66
Share of listenership
Chart 42
1.6%
2.2%
1.7%
1.5%
1.7%
2.0%
2.7%
2.7%
3.3%
5.1%
4.3%
4.1%
7.8%
6.8%
9.2%
18.0%
1.6%
2.5%
1.7%
1.6%
1.6%
1.8%
3.0%
2.5%
3.4%
5.2%
4.5%
3.8%
7.5%
6.4%
9.5%
18.3%
1.4%
1.5%
1.5%
1.6%
2.0%
2.1%
2.1%
2.7%
3.1%
4.3%
4.5%
4.6%
7.6%
7.8%
9.1%
18.6%
MayianFM
ClassicFM
WimwaroFM
AthianiFM
KassFM
GhettoRadio
EgesaFM
MusyiFM
RadioTaifa
KamemeRadio
RamogiFM
MileleFM
RadioMaisha
InooroFM
JamboFM
CitizenRadio
Sept'19 Aug'19 July'19

Listenership of Commercial Vs Community Stations
Chart 43: Radio stations ownership is Commercial at 93.7; Community stations are yet to penetrate the market trailing at 0.7%.
CommunityRadio,0.7%
CommercialRadio,93.7%
Foreign/NotClassified,5.7%

PAGE 49 OF 66
Listenership of Community Stations
Chart 44 : Ghetto FM tops in the ranking of Community Radio Stations.
0.6%
1.5%
1.9%
1.9%
4.5%
5.5%
11.2%
14.8%
19.9%
38.3%
0.0%
5.3%
0.0%
0.0%
0.0%
0.0%
8.3%
19.8%
30.9%
35.7%
0.0%
0.0%
3.7%
5.1%
12.1%
0.0%
13.7%
2.4%
17.5%
45.5%
1.6%
0.0%
1.5%
0.0%
0.0%
15.7%
10.7%
24.1%
13.7%
32.7%
Mikai FM
Light & Life FM
Bikapkoret (BK) FM
Onagi FM
Wajir Community Radio
Milambo FM
Radio Maria
Tana FM
Pamoja FM Radio
Ghetto FM
Sept'19 Aug'19 July'19 Total

Listenership of Commercial Stations
Chart 45
3.1%
3.3%
3.8%
5.0%
6.4%
7.0%
8.4%
10.7%
11.1%
23.8%
3.2%
3.3%
3.7%
6.1%
6.0%
6.8%
8.3%
10.7%
11.5%
23.4%
3.1%
3.1%
4.4%
5.2%
5.6%
7.3%
7.9%
10.4%
11.2%
24.7%
3.2%
3.5%
3.2%
3.7%
7.7%
7.1%
9.0%
11.1%
10.5%
23.2%
Musyi FM
Kass FM
Egesa FM
Kameme Radio
Milele FM
Ramogi FM
Inooro FM
Jambo FM
Radio Maisha
Citizen Radio
Sep-19 Aug-19 Jul-19 Total

PAGE 51 OF 66
OVERALL ALLOCATION BY INDUSTRIES
The overall advertising spectrum has been posting multidirectional shifts in terms of ad spends, with a specific incline in the previous quarter. The ad expenditures then declined by 9% in Q1 2019/20. This shift is largely attributable to the tussles in the Betting and Gambling Industry, which has posted consistent declines through the quarter. High advertising of Shabiki brand campaigns in the month of July influenced the overall advertising space of the quarter, which saw the Betting and Gambling industry remaining the top industry of the quarter (there was, however, unidirectional declines in the industry’s ad spends allocations month-on-month). Safaricom’s Skiza Tunes and RMS’ Viusasa campaigns were also highly advertised, influencing the dominance of Communication and Media industries. Table 1: Overall Industry Advertising Spectrum

Overall Advertising Trends (Jan – Sep) Fig 1 below shows the seismic movements of the advertising trends, which rose consistently through to mid-year and then declined before rising and declining again is a sigmoidal pattern. The trends are greatly influenced by top industries in the advertising space (See Above). Before the sports betting impasse, the Betting and Gambling controlled about 30% of the overall advertising spends in the Kenyan media space. Figure 1: Year to date Advertising trends.
ALLOCATIONS BY MEDIUM
Generally, electronic media are preferred for advertising, with an especial inclination towards Radio. The radio platform has higher audience rating point, hence reaches a higher audience share as compared to other media. Radio also offers leverage in its higher geodemographic presence, as well as wide array of advertising descriptive edges (ad types). Generally, the world is experiencing paradigm shift to enhance inclusivity across domains, hence regional stations are highly utilized to advance campaigns to enhance sensitization as well as brand mobility across regional topographies, in order to par with their urban counterparts who have higher exposure chances.
0
1,000
2,000
3,000
4,000
5,000
6,000
7,000
8,000
9,000
10,000
Jan Feb Mar Apr May Jun Jul Aug Sep
Ad
Spe
nds
Allo
catio
n (M
illio
ns)
Radio TV

PAGE 53 OF 66
Figure 2: Overall Ad allocations by medium
TELEVISION
FTA and Pay TV categories observe similar audience patterns whereby Audience numbers grow as the day progresses with the 1900hrs to 2200 hrs window being prime time on FTA channels, while late-night sporting activities influenced the self-relative spike in viewership on Pay TV platforms. Figure 3: Overall TV Audience Trends by Time Slots (FTA and Pay TV)
0 2 4 6 8
10 12 14 16
00:
00:0
0 -
00:
30:0
0 -
01:
00:0
0 -
01:
30:0
0 -
02:
00:0
0 -
02:
30:0
0 -
03:
00:0
0 -
03:
30:0
0 -
04:
00:0
0 -
04:
30:0
0 -
05:
00:0
0 -
05:
30:0
0 -
06:
00:0
0 -
06:
30:0
0 -
07:
00:0
0 -
07:
30:0
0 -
08:
00:0
0 -
08:
30:0
0 -
09:
00:0
0 -
09:
30:0
0 -
10:
00:0
0 -
10:
30:0
0 -
11:
00:0
0 -
11:
30:0
0 -
12:
00:0
0 -
12:
30:0
0 -
13:
00:0
0 -
13:
30:0
0 -
14:
00:0
0 -
14:
30:0
0 -
15:
00:0
0 -
15:
30:0
0 -
16:
00:0
0 -
16:
30:0
0 -
17:
00:0
0 -
17:
30:0
0 -
18:
00:0
0 -
18:
30:0
0 -
19:
00:0
0 -
19:
30:0
0 -
20:
00:0
0 -
20:
30:0
0 -
21:
00:0
0 -
21:
30:0
0 -
22:
00:0
0 -
22:
30:0
0 -
23:
00:0
0 -
23:
30:0
0 -
Mill
ions
Audiences on Free to Air Audiences on Subscription

AD SPENDS ON PAY TV On the Pay TV platforms SuperSport outlets dominate the coverage highly influenced by the high audience numbers during live games especially the English premier league. MultiChoice Kenya Ltd’s brand campaigns dominated the category ad scene during the quarter, as BetWay Betting Company and Airtel also consistently utilized the channels through the three months under review Figure 4: Pay TV Ad Spends Share
AD SPENDS ON FTA CHANNELS Citizen TV emerged as the top TV station across both PayTV and FTA channels during the quarter with “Safaricom Skiza Tunes” and “Viusasa” campaigns dominating in Ad volumes and consequently Ad allocations. With the paradigm shift that inclines the role of consumerism in brand visibility for businesses, the emergence of vernacular stations is explainable from the consumer-centric perspective; hence larger portion of the targeted niche is reached. Ideally, regional populace has a higher Radio consumption proportion as compared to the more affluent urban populace.
SuperSport Blitz Super Sport 3 Super Sport 7 Super Sport 2 Super Sport 1 Super Sport 5 July 90,635,710 7,209,220 27,985,440 11,195,340 4,817,150 648,870
August 35,174,560 17,414,730 6,130,880 15,993,220 3,576,970 1,926,850
September 25,618,310 24,474,420
91
7
28
11 5
1
35
17
6
16
4 2
26 24
0
10
20
30
40
50
60
70
80
90
100
Mill
ions
Ad Spends on Pay TV

PAGE 55 OF 66
July saw KBC advance a lot of campaigns highly influenced by the exclusive rights to air the AFCON games that influenced its becoming the second most watched station during the month at 5.7% of TV viewership. Figure 5: FTA TV Channels comparison by Ad Spends.
ADVERTISING ACTIVITIES ACROSS THE DAY On Figure 6, it is identifiable that ad spends allocation has unidirectional correlation with audience behaviors, where the prime hours (1800 – 2200hrs) are the most potent as a lot of activities are witnessed at this hours highly influenced by the News bulletins and the nature of programming whereby most channels air Soap operas pre the 7 O’clock and the 9 O’clock bulletins.
Citizen TV KTN Inooro TV NTV Kameme TV K24 KTN News Kass TV Switch TV Gikuyu TV KBC Channel 1 Others
July 1,589,873,690 1,000,181,920 801,932,300 812,177,050 441,875,990 453,869,530 336,374,970 172,284,070 164,411,990 219,700,110 192,504,680 324,989,520
August 1,630,467,030 773,699,940 661,813,430 696,352,580 402,651,690 406,764,850 322,257,570 301,364,670 308,726,960 143,204,170 22,214,770 495,501,090
September 1,487,437,410 799,222,500 815,546,610 670,103,070 479,053,470 441,641,040 402,254,200 370,636,550 345,902,410 125,788,030 40,418,040 670,208,740
0
200
400
600
800
1,000
1,200
1,400
1,600
1,800
Mill
ions
Ad Spends on Free to Air TV

Figure 6: Trends of Ad Spends in relation to Ad Volume
TOP INDUSTRIES ON TV Broadcast media emerged as the most advanced sub industry on media Industry during the quarter fueled by the high advertising of the Channels whereas Viusasa was the most advanced brand on the industry attributed to the rigorous advertising on Royal media Platforms. In spite of the crackdown on the sports betting firms which influenced a decline in Betting and Gambling industry advertising scene during the quarter, the high allocations are influenced by Lotto’s and Tatau’s (both Lottery and gambling firms) rigorous advertising. Figure 7: Industry advertising on TV
0
2,000
4,000
6,000
8,000
10,000
12,000
0 200 400 600 800
1,000 1,200 1,400 1,600
00:0
0-0
01:0
0-0
02:0
0-0
03:0
0-0
04:0
0-0
05:0
0-0
06:0
0-0
07:0
0-0
08:0
0-0
09:0
0-0
10:0
0-1
11:0
0-11
12:0
0-1
13:0
0-1
14:0
0-1
15:0
0-1
16:0
0-1
17:0
0-1
18:0
0-1
19:0
0-1
20:0
0-2
21:0
0-2
22:0
0-2
23:0
0-2
Ad
Volu
me
Ad
Spe
nds
in M
illio
ns
Ad spends Vis a vis Ad Volume
Ad Spends Ad Volume
3,572 2,776
2,442 2,160 1,724
1,229 1,052 1,003 663 501
2,200
0 500
1,000 1,500 2,000 2,500 3,000 3,500 4,000
ME
DIA
BE
TTIN
G A
ND
G
AM
BLI
NG
CO
MM
UN
ICAT
ION
FIN
AN
CE
PE
RS
ON
AL
CA
RE
HO
US
EH
OLD
FOO
DS
ED
UC
ATIO
N
PH
AR
MA
CE
UTI
CA
LS
BE
VE
RA
GE
S
OTH
ER
S
Mill
ions
Ad Spends

PAGE 57 OF 66
TOP COMPANIES ON TV Safaricom Limited, the top advertiser on the platform during the quarter, advanced an array of campaigns with “Safaricom Skiza Tunes” being the most consistent campaign across the three months in terms of Ad allocations. Figure 8: Top 10 Companies
AD TYPES ON TV In a bid to create brand awareness different campaigns are advanced utilizing different Ad types or a fusion of different Ad types thus during the quarter Spot ad, which is basically a public notice describing or praising a product and at times where to find them, was highly utilized for brand visibility through the quarter.
1,590
1,409
930 799 744 701
626 579 521
367
0
200
400
600
800
1,000
1,200
1,400
1,600
1,800
Safaricom Limited
Royal Media Services
Lotto Reckitt Benckiser
The Standard Group
Tatua KCB Shabiki MultiChoice Kenya Ltd
Nation Media Group
Mill
ions
Top 10 Companies
Ad Spends

Figure 9: Ad Types on TV

PAGE 59 OF 66
ADVERTISING ON RADIO
Breakfast shows enjoy massive listenership highly influenced by the high number of points of listening as most people are on the move. Figure 10: Overall Audience Trend on Radio.
AD SPENDS ON RADIO PLATFORM Radio remains the best platform for enhancing brand visibility among the virgin niches. The platform is highly penetrative and popular, unhindered by geodemographic factors, besides offering a wide array of advertising options, which sets it up as the most effective platform for advertising. Vernacular stations were highly preferred for visibility during the quarter largely influenced by their specific target audience and penetration especially in the rural areas. The general perspective of inclusivity influences the emerging presence of Vernacular outlets in the media space.
0 2 4 6 8
10 12 14 16 18
00:
00-0
0:29
0
1:00
-01:
29
02:
00-0
2:29
0
3:00
-03:
29
04:
00-0
4:29
0
5:00
-05:
29
06:
00-0
6:29
0
7:00
-07:
29
08:
00-0
8:29
0
9:00
-09:
29
10:
00-1
0:29
1
1:00
-11:
29
12:
00-1
2:29
1
3:00
-13:
29
14:
00-1
4:29
1
5:00
-15:
29
16:
00-1
6:29
1
7:00
-17:
29
18:
00-1
8:29
1
9:00
-19:
29
20:
00-2
0:29
2
1:00
-21:
29
22:
00-2
2:29
2
3:00
-23:
29 M
illio
ns

Fig 11: Ad Spends Share by Stations
ADVERTISING ACTIVITIES ACROSS THE DAY Breakfast shows and Evening Drive shows remain to be the most potent time blocks on radio influenced by the high contact, as a large portion of the populace is the communizing working class. Figure 12: Ad Spends vs Ad Volume distribution across the day by Time Slots
Kass FM Ramogi FM Inooro FM Citizen Radio Kameme FM Chamgei FM Radio Maisha Hot 96 Muuga FM BAHARI FM Others
July 631,827,600 486,169,500 572,971,710 470,509,620 374,981,740 424,828,340 366,854,690 368,635,560 335,926,950 246,664,880 2,486,012,440
August 707,571,670 548,670,560 466,035,470 431,190,580 383,564,160 397,966,930 362,713,310 419,271,570 348,846,160 246,440,610 3,130,668,640
September 713,762,030 450,393,370 384,081,170 483,149,080 419,696,040 348,519,780 413,625,520 352,053,130 301,342,130 216,066,050 3,107,194,030
0
500
1,000
1,500
2,000
2,500
3,000
3,500
Mill
ions
Ad Spends on Free to Air Radio
-5,000
0
5,000
10,000
15,000
20,000
25,000
-500
0
500
1,000
00:0
0-00
:29
01:0
0-01
:29
02:0
0-02
:29
03:0
0-03
:29
04:0
0-04
:29
05:0
0-05
:29
06:0
0-06
:29
07:0
0-07
:29
08:0
0-08
:29
09:0
0-09
:29
10:0
0-10
:29
11:0
0-11
:29
12:0
0-12
:29
13:0
0-13
:29
14:0
0-14
:29
15:0
0-15
:29
16:0
0-16
:29
17:0
0-17
:29
18:0
0-18
:29
19:0
0-19
:29
20:0
0-20
:29
21:0
0-21
:29
22:0
0-22
:29
23:0
0-23
:29
Ad
Volu
me
Ad
Spe
nds
Mill
ions
Ad spends Vis a vis Ad Volume
Ad Spends Ad Volume

PAGE 61 OF 66
TOP INDUSTRIES ON RADIO Similar to TV platform “Safaricom Skiza Tunes and Viusasa” were the most advanced campaigns on Radio, influencing the high allocations on Communication and Media Industries respectively during the month under review. Rigorous sensitization of the public on “New Generation Bank Notes” catapulted Finance industry’s Ad allocations during the months of August and September. Figure 13: Industries ad spends allocation on Radio.
4,150
3,765
3,297
2,354
1,453
891 816 794 587
414
2,877
0
500
1,000
1,500
2,000
2,500
3,000
3,500
4,000
4,500
COMMUNICATION BETTING AND GAMBLING
FINANCE MEDIA STATE BODIES AGRICULTURE FOODS EDUCATION BEVERAGES PERSONAL CARE OTHERS
Mill
ions
Top Industries Ad Spends

TOP COMPANIES ON RADIO Shabiki emerges among the top companies during the quarter having been exclusively advanced on Royal media stations. Figure 14: Top advertisers on Radio
4,24
4
1,81
7
1,69
4
1,48
8
749
614
606
597
308
295
0
500
1,000
1,500
2,000
2,500
3,000
3,500
4,000
4,500
Safaricom Limited
Shabiki Royal Media Services
Central Bank of Kenya
KCB Lotto Tatua Pwani Oil Limited
Barclays Bank
Co-operative Bank of Kenya
Mill
ions
Top 10 Companies
Ad Spends

PAGE 63 OF 66
AD TYPES ON RADIO Radio boasts of Ad types such as presenter mentions that encourage engagement with the listeners hence the high utilization of such means to reach the consumers. Figure 15: Radio Ad Types

PROGRAM CATEGORISATION
Among the select TV stations, Local content dominates the air space as more stations embrace more local dramas and engage in current affairs debates. Figure 16: Content Split