Chemical and Petrochemical Statistics at a Glance
188
CHEMICAL AND PETROCHEMICAL STATISTICS AT A GLANCE - 2021 Government of India Ministry of Chemicals and Fertilizers Department of Chemicals and Petrochemicals Statistics and Monitoring Division New Delhi Website: www.chemicals.nic.in
-
Upload
khangminh22 -
Category
Documents
-
view
3 -
download
0
Transcript of Chemical and Petrochemical Statistics at a Glance

CHEMICAL AND PETROCHEMICAL
STATISTICS AT A GLANCE - 2021
Government of IndiaMinistry of Chemicals and Fertilizers
Department of Chemicals and PetrochemicalsStatistics and Monitoring Division
New DelhiWebsite: www.chemicals.nic.in


CONTENTS
Title Description Page No.
Message from Hon’ble Minister
Message from Hon’ble Minister of State
Message from Secretary
Preface
Introduction 6-8
Acronyms 9-10
Coverage, Data Sources, Definitions & Limitations 11-15
Chapter 1 An Overview of Chemical and Petrochemical Sectors 16-21
Chapter 2 Global Scenario 22-23
Chapter 3 Important Economic Indicators 24-27
Chapter 4 Indian Trade Classification (Harmonized System) [ITC(HS)]- 2017– An Abstract
28
Chapter 5 National Industrial Classification (NIC) – A Digest 29-31
Chapter 6 Indices released by Government of India 32-37
Chapter 7 Glimpses of Important Trends during 2016-17 to 2020-21 38-78
Appendices
Section – I Chemical Sector
Table -1 Performance of Selected Major Chemicals (Group-wise) during 2013-14 to 2020-21 at a Glance
79
Table -1A Projection of Production, Installed Capacity, Export and Import of Selected Major Chemical (Group-wise) from the year 2021-22 to 2026-27
80
Table -2 Production, Installed Capacity & Growth of Selected Major Chemicals (Group –wise) during 2013-14 to 2020-21
81
Table -3 Production, Capacity Utilization & Growth of Major Chemicals (Product–wise) during 2013-14 to 2020-21
82-84
Table -4 Installed Capacities of Selected Chemicals (Group-wise) during 2013-14 to 2020-21
85
Table -5 Consumption of Selected Major Chemicals (Product -wise) during 2013-14 to 2020-21
86
Table -5A Consumption of Chemical Pesticides in various States/UTs During 2013-14 to 2020-21
87
Section – II Petrochemical Sector
Table - 6 Performance of Selected Basic Major Petrochemicals (Group- wise) during 2013-14 to 2020-21at a Glance
88
Table – 6A
Projection of Production, Installed Capacity, Export and Import of Selected Basic Major Petrochemical (Group-wise) from the year 2021-22 to 2026-27
89
Table- 7 Production, Installed Capacity & Growth of Selected Basic Major Petrochemicals (Group- wise) during 2013-14 to 2020-21
90
Table – 8 Production, Capacity Utilization & Growth of Selected Major Petrochemicals (Product-wise) during 2013-14 to 2020-21
91-93
Table – 9 Installed Capacities of Selected Major Petrochemicals (Group- wise) from 2013-14 to 2020-21
94
Table - 10 Consumption of selected Major Petrochemicals (Product wise) during 2013-14 to 2020-21
95-96

Title Description Page No.
Section-III Foreign Trade
Table – 11 Exports and Imports of Chemicals (excluding Pharmaceutical Products and Fertilizers) during 2013-14 to 2020-21 97
Table – 12
Exports and Imports of Chemicals and Petrochemical Products
(including Pharmaceutical Products and Fertilizers) during 2013-14
to 2020-21 98
Table –12A Net Imports of Chemicals and Chemical Products (excluding Pharmaceutical Products and Fertilizers) during 2013-14 to 2020-21
99
Table – 13 Exports of Major Chemicals (Group-wise) during 2013-14 to 2020-21 100
Table – 14 Imports of Major Chemicals (Group-wise) during 2013-14 to 2020-21 101
Table – 15 Net Imports of Major Chemicals (Group-wise) during 2013-14 to 2020-21 102
Table – 16 Exports of Major Chemicals (Product-wise) during 2013-14 to 2020-21 103-105
Table – 17 Imports of Major Chemicals ((Product-wise) during 2013-14 to 2020-21 106-108
Table – 18 Net Imports of Major Chemicals (Product-wise) during 2013-14 to 2020-21 109-111
Table – 19 Top Five Export Destinations of Selected Chemicals During 2020-21 112-118
Table – 20 Top Five Sources (countries) of Import of selected Chemicals to India during 2020-21 119-124
Table – 21 Exports of Major Petrochemicals (Group-wise) during 2013-14 to 2020-21 125
Table – 22 Imports of Major Petrochemicals (Group-wise) during 2013-14 to 2020-21 126
Table – 23 Net Imports of Major Petrochemicals (Group-wise) during 2013-14 to 2020-21 127
Table – 24 Exports of Major Petrochemicals (Product-wise) 2013-14 to 2020-21 128-130
Table – 25 Imports of Major Petrochemicals ((Product-wise) during 2013-14 to 2020-21 131-133
Table – 26 Net Imports of Major Petrochemicals (Product-wise) during 2013-14 to 2020-21 134-136
Table – 27 Top Five Export Destinations of Selected Petrochemicals During 2020-21 137-143
Table – 28 Top Five Sources (countries) of Import of selected Petrochemicals to India During 2020-21 144-150
Table – 29 Exchange Rates of Indian Rupee vis-a-vis US$ 151
Table – 30 World Exports of Chemicals by top 10 countries-2020 152-153
Table – 31 World Imports of Chemicals by top 10 countries-2020 154-155
Table – 32 India’s share in World Exports and Imports of Chemicals -2020 156
Section-IV Foreign Direct Investment (FDI)
Table – 33 Sector –wise FDI Inflows during 2018-19 to 2020-21 (in US $ million) 157
Section-V Index of Industrial Production
Table – 34
Monthly Production Growth in ‘Chemicals and Chemical Products' vis-a-vis Manufacturing Sector during April 2020 to March 2021 (Based on Index of Industrial Production with base year: 2011-12)
158
Table – 35
Annual Production Growth in Chemicals and Chemical Products Vis -a-Vis Manufacturing Sector during 2015-16 to 2020-21 (Based on Index on Industrial Production with base year: 2011- 12)
159

Title Description Page No.
Table – 36 Weights of Products Covered Under Chemical and Chemical Products (Industry Division 20 of NIC- 2008)
160-161
Section-VI Inflation Based on Wholesale Price Index
Table – 37
Annual Inflation of Chemicals & Chemical products vis-à-vis other commodities during 2015-16 to 2020-21 (Based on Wholesale Price Index with base year: 2011-12)
162
Table –38
Monthly Inflation of Chemicals & Chemical Products vis-a-vis Other Commodities during April, 2020 to March, 2021 (Based on Wholesale Price Index with base year: 2011-12)
163
Table –39 WPI (Base year 2011-12) of Chemicals & Chemical Products (Group Wise) during 2015-16 to 2020-21 164
Section-VII Miscellaneous
Table –40 Growth Rates of Core Industries (%) from 2015-16 to 2020-21 (Base Year: 2011-12) 165
Table –41 Index of Core Industries from 2015-16 to 2020-21 (Base Year: 2011-12) 166
Table –42 Consumption of Naphtha, Natural Gas and Fuel oil 167
Table –43 Important Indicators of Industry Division 29, 21 (Unincorporated Sector) in 2015-16 (July 2015- June 2016) 168
Table –44 Employment in Chemicals and Chemicals products ( Industry Division 20, NIC-2008) during 2013-14 to 2018-19 169
Table –45
Gross Value Added from Chemical and Chemical products (Industry Division 20: NIC 2008) and Pharmaceutical; medicinal chemicals and botanical product (Industry Division 21: NIC 2008) vis-a-vis Manufacturing sector and all Economic Activities (at Current prices)
170
Table –46
Gross Value Added from Chemical and Chemical products (Industry Division 20:NIC 2008) and Pharmaceutical; medicinal chemicals and botanical product (Industry Division 21: NIC 2008) vis-a-vis Manufacturing sector and all Economic Activities (at constant prices) (2011-12)
171
Table –47
Value of Output from Chemicals and Chemical products (Industry Division 20: NIC 2008) and Pharmaceutical; medicinal chemicals and botanical product (Industry Division 21: NIC 2008) vis-a-vis Manufacturing sector (at Current prices)
172
Table –48
Value of Output from Chemicals and Chemical products (Industry Division 20: NIC 2008) and Pharmaceutical; medicinal chemicals and botanical product (Industry Division 21: NIC 2008) vis-a-vis Manufacturing sector (at constant prices) (2011-12)
173
Table –49
All India Estimate of Selected Characteristics of Factory Sector for Chemical and Chemical products (Industry Division 20: NIC 2008), Pharmaceutical; medicinal chemicals and botanical product (Industry Division 21: NIC 2008) and manufacture of Magnetic and Optical Media (Industry Division 268)
174
Table –50 State wise Estimate of Selected Characteristics of Factory Sector for Industry Division 20: NIC 2008: Chemicals and Chemical Products 175
Table –51
Production , import , Export , Consumption of Major Chemicals and Petrochemicals and Export as % of Production and Imports as % of Consumption
176
Table –52 Exports of all Chemicals as % of Value of output and Imports of all Chemicals as % of Consumption 177

Introduction
Chemical and Petrochemical Sector is one of the pioneering sector having an impact on
day to day needs of the society. Chemical Industry is playing a vital role in addressing our basic
needs in the fields of food and water security, shelter, clothing and textiles, health care,
information, communication and entertainment. In order to boost domestic production capacities
as a part of Petroleum, Chemicals and Petrochemicals Investment Regions (PCPIRs) policy, a
perspective planning for the chemical industry has been initiated to study demand supply
scenario keeping in view the existing and under execution capacities. This will help to realize
India’s vision of becoming self-reliance and provide substantial employment to the youth in the
Chemical Sector. The share of Gross Value Added (GVA) in the Manufacturing Sector during
2019-20 is about 8.97% at current prices. GVA of Chemical Sector has grown with CAGR of
12.57% during the period 2014-15 to 2019-20.
2. Statistics and Monitoring (S&M) Division under the Department of Chemicals &
Petrochemicals (DCPC) compiles statistics on monthly production data and installed capacity
of selected Chemicals and Petrochemicals products from Large and Medium Scale units. It also
derives estimates of consumption of the chemicals products in the country. Data on Export and
Import of Chemicals and Petrochemicals items are being maintained by the Department based
on the data received from the Directorate General of Commercial Intelligence and Statistics
(DGCIS), Ministry of Commerce and Industry.
3. This publication consists seven chapters, namely, Chapter-1: An overview of Chemical
and Petrochemical Sector; Chapter-2: Global Scenario; Chapter-3: Important Economic
Indicators; Chapter-4: India Trade classification (Harmonized System) [ITC (HS)]-2017-An
Abstract; Chapter-5: National Industrial Classification (NIC)-A Digest. Chapter-6: Indices
released by Government of India; Chapter-7: Glimpses of Important Trends during 2015-16 to
2019-20. Chapter-1 besides defining Basic Chemicals, Specialty Chemicals & Agro-chemicals,
also presents the latest status of Chemical Sector in India. Chapter-2 presents the status of
Indian Chemical Sector vis-a-vis other countries of the world. Chapter-3 provides important
statistics like GVA, Index of Industrial production, Export and Import of Chemical sector.
Chapter-6 describes important indices like Index of Industrial Production (IIP), Consumer Price
Index (CPI) & Whole Sale Price Index (WPI). Chapter-7 provides graphical presentation of
trends for the period 2016-17 to 2020-21 on Production, Installed Capacity, Import and Export
for various groups under Major Chemicals and Major Petrochemicals along with brief analysis.
At the end of the Appendices Section, Statistical tables presenting information inter-alia on
Production, Installed Capacity, Capacity Utilization, Imports / Exports along with their growth
6

rates during 2013-14 to 2020-21 have also been provided. Detailed table on Foreign Trade, FDI,
IIP, WPI etc. related to Chemical and Petrochemical Sector have been included in the
Appendices Section.
4. The production of Selected Major Chemicals and selected Major Petrochemicals for
each Group is generally found to be growing consistently over the years. The annual growth of
production during 2020-21 over previous year was showing contraction of 5.86% with CAGR of
2.22% over a period of 8 years, in case of Major Chemicals. The annual growth of Basic Major
Petrochemicals was contracted by 5.79% over preceding year with CAGR of 4.24% during the
same period.
5. Installed Capacity utilization of basic Major Chemicals was 72% in 2020-21 as against
79% in 2019-20 while it was around 83.6% as against 89.5% in case of Basic Major
Petrochemicals over last year. The utilization of installed capacity was hovered around 62-74%
for the Alkali Chemicals and Dyes & Pigments, whereas it was in the range of 63-72% in case
of Organic, Inorganic Chemicals, Pesticides (Technical Grade) in 2020-21. The utilization of
installed capacity was 108.3% for the Synthetic Detergent Intermediates. Whereas, it was
70.3%, 94.9%, 87.1% and 49.9% for Synthetic Fibres/Yarn, Polymers, Synthetic Rubber and
Performance Plastics respectively during 2020-21.
6. Among Selected Major Chemicals, there was a substantial import of Inorganic
Chemicals and Organic Chemicals into the country during 2020-21. Amongst Inorganic
Chemicals, three products, namely, Carbon Black (Rs.1,276/- crore), Calcium Carbonate
(Rs.694/-crore) and Aluminium Fluoride (Rs. 481/- crore) had been imported worth of more than
Rs.2,450/- crores. (Table 17). Amongst Organic Chemicals, four products, namely, Methanol
(Rs.4,348/- crore), Acetic Acid (Rs.2,757/- crore), Phenol (Rs.898/- crore), and Acetone
(Rs.537/- crore) had approximately worth of Rs.8,500/- crore of imports into the country (Table
17).
7. Amongst Selected Basic Major Petrochemicals, substantial import was seen for
Polymers, Synthetic Rubber and Synthetic Fibres/Yarn into the country during 2020-21.
Amongst Polymers, three products, namely, Polypropylene (Inc. Co-Polymer) (Rs.7,465/-crore),
High Density Polyethylene (Rs.6,484/-crore) and Poly Vinyl Chloride (Rs.3,010/-crore) had
import of approximately Rs.17,000/-crore (Table 25). Amongst Synthetic Rubber, four products,
namely, Ethyl Vinyl Acetate (Rs.2,125/-crore), Styrene Butadiene Rubber (SBR) (Rs.1,491/-
crore), Butyl Rubber (Rs.1,388/-crore) and Poly Butadiene Rubber (Rs.1,135/-crore), was
imported of approximately worth Rs.6,100/-crore into the country (Table 25). Amongst Synthetic
Detergent Intermediates, one product, namely, Linear Alkyl Benzene was imported worth of
more than Rs.2,150/- crore in the country (Table 25).
7

8. The trade deficit during 2020-21 (i.e. net import) in Chemicals and Petrochemicals
Sector (comprising chapters 28, 29, 32, 38, 39,4002,54 and 55 of HS code) was Rs. 94,377/-
crore as per information on DGCIS portal (as on 10.02.2021 (Table 12 A). The trade deficit of
selected Major Chemicals and Petrochemical Products was around Rs.7,570/-crore as per
figures received from DGCIS, Kolkata (Tables 15 & 23). The export / import monitored by DCPC
are basically intermediate in nature.
9. In respect of Major Chemicals at group level, it is observed that Alkali Chemicals,
Organic Chemicals and Inorganic Chemicals were in trade deficit, whereas Pesticides
(Technical Grade and formulation both) and Dyes & Pigments were trade surplus, during 2020-
21 (Table 18). However, in respect of Major Petrochemicals at group level Polymers, Fiber
Intermediates, Synthetic rubber, Performance Plastics, Synthetic Detergent Intermediates and
Other Petro-based Chemicals were in trade deficit, whereas Synthetic Fibre, Aromatics and
Olefins were in trade surplus during the same period (Table 26). This aggregates to overall trade
surplus in Major Chemicals and overall trade deficit in Major Petrochemicals which resulted into
net trade deficit for Chemicals and Petrochemicals sector.
8

ACRONYMS
AF Acrylic Fibre (including Dry Spun)
ASI Annual Survey of Industries
ACN Acrylonitrile
CAGR Compound Annual Growth Rate
CEFIC European Chemical Industry Council
NSO National Statistical Office
CSO Central Statistics Office
CPI Consumer Price Index
DGCI&S Directorate General of Commercial Intelligence & Statistics
DIPP Department of Industrial Policy and Promotion
DMT Dimethyl Terephthalate
EO Ethylene Oxide
EPDM Ethyl Propylene Dimers
EVA Ethyl Vinyl Acetate
EX-PS Expandable Polystyrene
FDI Foreign Direct Investment
GVA Gross Value Added
HBR Halo Butyl Rubber
HDPE High Density Polyethylene
IIP Index of Industrial Production
IIR Iso Butylene Isoprene Rubber
ISIC International Standard Industrial Classification
ITC (HS) Indian Trade Classification (Harmonized System)
KTPA Thousand Tonnes Per Annum
LAB Linear Alkyl Benzene
LDPE Low Density Polyethylene
LLDPE Linear Low Density Polyethylene
MEG Mono Ethylene Glycol
MEK Methyl Ethyl Ketone
MMA Methyl Methacrylate
MMSCM Million Standard Cubic Meters
MOSPI Ministry of Statistics and Programme Implementation
9

MT Metric Tonne
NBR Nitrile Butadiene Rubber
NFY Nylon Filament Yarn
NIC National Industrial Clasification
NIY Nylon Industrial Yarn
ONCB Ortho Nitro Chloro Benezne
PAN Phthalic Anhydride
PBR Poly Butadiene Rubber
PBT Polybutylene Terephthalate
PET Polyethylene terephthalate
PIB Poly Isobutylene
PFY Polyester Filament Yarn
PG Propylene Glycol
PMMA Polymethyl Methacrylate
PNCB Para Nitro Chloro Benzene
PO Propylene Oxide
PP Polypropylene
PPFY Polypropylene Filament Yarn
PPSF Polypropylene Staple Fibre
PS Polyestyrene
PSF Polyester Staple Fibre
PSFF Polyester Staple Fibrefil
PTA Purified Terephthalic Acid
PVC Poly Vinyl Chloride
SAN Styrene Acrylonitrile
SBR Styrene Butadiene Rubber
UNSC United Nations Statistical Commission
VAM Vinyl Acetate Monomer
WPI Wholesale Price Index
10

COVERAGE
Major Chemicals
Sl. No. Group Products
I Alkali
Chemicals
Soda Ash Caustic Soda
Liquid Chlorine
II Inorganic
Chemicals
Aluminium Fluoride Calcium Carbide
Carbon Black Potassium Chlorate
Sodium Chlorate Titanium Dioxide
Red Phosphorous Hydrogen Peroxide
Calcium Carbonate
III Organic
Chemicals
Acetic Acid Acetic Anhydride
Acetone Phenol
Methanol Formaldehyde
Nitrobenzene Citric Acid
Maleic Anhydride Pentaerythritol
Aniline Chloro Methanes
ONCB PNCB
MEK Acetaldehyde
Ethanolamines Ethyl Acetate
Menthol Ortho- Nitro Toluene
Isobutyl Benzene
IV
Pesticides
(Technical
Grade)
D.D.T. Malathion
Parathion(Methyl) Dimethoate
D.D.V.P. Quinalphos
Monocrotophos Phosphamidon
Phorate Ethion
Endosulphan Fenvalerate
Cypermethrin Anilophos
Acephate Chlorpyriphos
Phosalone Metasystox
Abate Fenthion
Triazophos Lindane
Temephos Deltamethrin
Alphamethrin Profenofos Technical
11

Sl. No. Group Products Sl. No.
Pretilachlor Technical Lambda Cyhalothrin
Phenthoate Permethrin Tech
Imidacaloprid Tech Captan & Captafol
Ziram(Thio Barbamate) Carbendzim (Bavistin)
Calixin Mancozab
Copper-Oxychloride Hexaconazole
Metconazole 2, 4-D
Butachlor Ethofumesate Technical
Thiamethoxam Technical Pendimethalin
Metribuzin Triclopyr Acid Tech
Isoproturon Basalin
Glyphosate Paraquat
Diuron Atrazin
Fluchloralin Zinc Phosphide
Aluminium Phosphide Methyl Bromide
Dicofol
V Dyes and
Pigments
Acid Direct Dyes (other
than AZO)
Azo Dyes
Basic Dyes Disperse Dyes
Oil soluble (Solvent Dyes) Fast Colour Bases
Ingrain Dyes Solubilised Vat Dyes
Optical Whitening Agents Organic Pigments
Inorganic Pigments Pigment Emulsion
Reactive Dyes Sulphur Dyes
Vat Dyes Food Colours
Napthols Other Dyes
12

Major Petrochemicals A. Basic Major Petrochemicals
S. No. Group Products
I
Synthetic Fibres
Acrylic Fibre Polyester Staple Fibrefill
Nylon Filament Yarn Nylon Industrial Yarn/Tyre Cord
Polyester Filament Yarn Polyester Staple Fibre
Polypropylene Filament Yarn
Polypropylene Staple Fibre
Polyster Industrial Yarn Elastomeric/Spandex Filament Yarn
II
Polymers
Low Density Polyethylene High Density Polythylene
Polyestyrene Polypropylene (Inc. Co- Polymer)
Expandable Polyestyrene Poly Vinyl Chloride
Linear Low Density Polythylene
PVC Compound
III Synthetic Rubber
(Elastomers)
Styrene Butadiene Rubber (SBR)
Poly Butadiene Rubber (PBR)
Nitrile Butadiene Rubber (NBR)
Ethyl Propylene Dimers (EPDM)
Ethyl Vinyl Acetate (EVA) Butyl Rubber
IV Synthetic Detergent
Intermediates Linear Alkyl Benzene (LAB)
Ethylene Oxide (EO)
V Performance
Plastics
Acrylonitrile Butadiene Styrene (ABS) Resin
Nylon-6
Nylon 6,6 Polymethyl Methacrylate
(PMMA)
Styrene Acrylonitrile (SAN) Resin
Polytetrafluoroethylene(PTFE)
Polyester Chips/PET Chips B. Intermediates
I. Fibre
Intermediates
Acrylonitrile Caprolactum
Mono Ehylene Glycol (MEG)
Dimethyl Terephthalate (DMT)
Purified Terephthalic Acid (PTA)
II. Building Blocks
I Olefins Ethylene Propylene
Butadiene
II Aromatics
Benzene Toluene
Orthoxylene Paraxylene
Mixed Xylene
13

C. Other Petro-based Chemicals
Diethylene Glycol Diacetone Alcohol Ethylene Dichloride
Butanol Oxo Alcohol 2-Ethyl Hexanol
Vinyl Chloride Monomer Epichlohydrine Iso Butylene
PET PIB Polycarbonate
Propylene Oxide Propylene Glycol Polyvinyl Acetate Resin
Unsaturated Polyster Resin Methyl Methacrylate Iso-Butanol
Ethyl Benzene C4-Raffinate Cellulose Acetate Butyrate
Polyacetal Resin Phthalic Anhydride Styrene
Vinyl Actate Monomer Isopropanol Polyol
Metaxylene Methyl Isobutyl Ketone PBT
Cellulose Acetate Sheet Cellulose Nitrate Sheet Melamine Moulding Powder
14

Data Sources & Definitions
The major sources of data presented in this publication are:
(i) Production &
Installed capacities
Production of Major Chemicals and Petrochemicals and their installed
capacities have been aggregated based on monthly returns received
directly of Chemicals & Petrochemicals industries in the countries from
the manufacturers under large and medium scale.
(ii) Imports &
Exports
Directorate General of Commercial Intelligence & Statistics, Ministry of
Commerce & Industry, Kolkata.
(iii) FDI Ministry of Commerce & Industry, Department of Industrial Policy &
Promotion.
(iv) Index of
Industrial
Production
Ministry of Statistics & Programme Implementation, National Statistical
Office (NSO), New Delhi.
(v) Wholesale Price
Index
Office of the Economic Adviser, Department for Promotion of Industry
and Internal Trade, Ministry of Commerce & Industry, New Delhi.
(vi) Chemical
Industry (Broad
definition)
The Chemical industry includes organic chemicals, inorganic chemicals,
pharmaceuticals products, fertilizers, tanning or dyeing extracts, dyes
pigments, paints and varnishes, putty and other mastics inks, essential
oils, perfumery cosmetic, soap, organic surface, active agents, washing,
lubricating, artificial waxes, dental waxes, polishing, albuminoidal
substance, modified starches, glues, enzymes, explosive, pyrotechnic
products, beverages, spirits and vinegar, matches, pyrophoric alloys,
photographic or cinematographic goods, miscellaneous chemical
products, petrochemicals, plastics synthetic, rubber, man- made
filaments, manmade fibre.
(vii) Chemicals and
Petrochemicals
(Narrow definition)
The Chemicals and Petrochemical products monitored by the
Department of Chemicals & Petrochemicals are selected major
products and the list of these products is given in the tables 3 & 8
respectively. Unless contrary is mentioned, the terms ‘Major Chemicals’
and ‘Major Petrochemicals’ refer to the products or groups thereof as
enumerated in the tables 3 & 8.
15

Chapter 1
An Overview of Chemical and Petrochemical Sector
The chemical industry is the backbone of industrial and agricultural development of the
country and provides building blocks for several downstream industries, such as textiles,
papers, paints, soaps, detergents, pharmaceuticals, varnish etc. It is one of the most diversified
of all industrial sectors covering thousands of commercial products. Indian chemical industry
comprises of both small scale as well as large scale units. With initiatives like "Make in India"
program gaining steam, investments, innovation and infrastructure are going to be the major
thrust areas for chemical industry players. The current per capita consumption of chemical
products in India is about 1/10 of the world average, indicating that the demand potential is yet
to be realized. The industry is important as it has several linkages with other sectors of an
economy. Petrochemicals have backward linkages with other industries in petroleum refining,
natural gas processing and forward linkages with industries dealing variety of downstream
products. Also, the industry offers alternatives, which serve as substitutes for natural products
and therefore, it has the capacity to meet the constantly growing demand that would otherwise
strain the natural resources. The value additions in the petrochemicals chain offer immense
possibilities and cater to the need of textiles and clothing, agriculture, packaging, infrastructure,
healthcare, furniture, automobiles, information technology, power, electronics and
telecommunication, irrigation, drinking water, construction needs and host of other articles of
daily and specialized usage, amidst other emerging areas.
2. In Chemicals sector, 100% FDI in India is allowed under the automatic route (except in
the case of certain hazardous chemicals). Manufacture of most chemical products, inter-alia,
covering organic / inorganic, dyestuffs & pesticides is de-licensed. The entrepreneurs need to
submit only Industries Entrepreneur Memorandum (IEM) with the Department of Industrial
Policy & Promotion provided location of the project falls outside standard urban area limits of
metropolitan cities and municipal cities. Only the following items are covered in the compulsory
licensing list because of their hazardous nature as required by international conventions.
• Hydrocyanic acid & its derivatives
• Phosgene & its derivatives
• lsocynates & di-isocynates of hydrocarbons.
3. Chemicals can be broadly divided into the following sub-groups:-
i. Basic Chemicals
16

Chemicals, such as organic and inorganic chemicals, bulk petrochemicals, other
chemical intermediates, plastic resins, synthetic rubber, man-made fibers, dyes and pigments,
printing inks, are basic chemicals. These are also known as commodity chemicals.
ii. Specialty Chemicals
Specialty Chemicals, also known as performance chemicals, are low-volume but high-
value compounds. These chemicals are derived from basic chemicals and are sold on the basis
of their functions. For example, paints, adhesives, electronic chemicals, water management
chemicals, oilfield chemicals, flavours and fragrances, rubber additives, paper additives,
industrial cleaners and fine chemicals, sealants, coatings, catalysts etc. come under this
category.
iii. Pesticides
Chemicals which essentially are meant for protecting agriculture crops against insects
and pests are covered under this sub-group. Fertilizers and Pesticides played an important role
in the "Green Revolution”, during the 1960s and 1970s.
4. Based on composition, building blocks for petrochemicals are divided into two
sub- groups:-
i. Olefins:
Olefin, also called as alkenes contains one or more pairs of carbon atoms linked by a
double bond. Examples include ethylene, propylene and butadiene. Both ethylene and
propylene are used in the industrial production of chemicals, plastics and plastics products while
butadiene is used in the industrial production of synthetic rubber.
ii. Aromatics:
Aromatics are hydrocarbons derived from petroleum, characterized by a ring-like
molecular structure. Examples include benzene, toluene, and xylene. Benzene is used in
making dyes as well as in making synthetic detergents. A combination of benzene and toluene
are used in making isocyanates which are required in making polyurethanes while xylenes are
used in the industrial production of both plastics and synthetic fibres.
5. Growth Drivers for the Chemical Sector:
• A large population, huge domestic market, dependence on agriculture and strong export
demand are the key growth drivers for this industry.
• A global shift towards Asia as the World’s chemicals manufacturing hub.
17

• Per capita consumption of chemicals in India is lower compared to western countries,
so immense scope for new investments.
• Rise in GDP and purchasing power generates huge growth potential for the domestic
market.
• A focus on new segments such as specialty and knowledge chemicals.
• Skilled science professionals.
• World-class engineering and strong R&D capabilities.
6. Research & Development (R&D)
The Chemical sector is highly heterogeneous encompassing many segments like
organic, in-organics, dyestuffs, pesticides, paints, soaps and petrochemicals etc. Research and
Development is critical and of paramount importance for the growth & development of this
sector. Continued R&D efforts in the part of the industry helps to improve the quality standards,
obtain higher yields resulting reduction in cost of production and to earn competitive edge in the
International Market. Indian Chemical Industry spends on R&D to the extent of 2-3% of their
total turnover, as against 9-10% by the multi-national companies in overseas countries. The
industry would, therefore, have to make large investments in R&D to successfully counter
competition from the international chemicals industry. India has a number of scientific
institutions and the country’s strength lies in its large pool of highly trained scientific manpower.
With the introduction of the Patent Act 2005, product innovation has assumed high importance.
7. Foreign Technology Agreements
Foreign Technology Agreements in India cater to the growth of the technology in the
Indian industries. The foreign technology is transferred from foreign sources such as research
and development agencies, foreign parent companies and other manufacturers to the Indian
counterparts. The transfer of foreign technology takes place by the means of foreign direct
investments and foreign technology collaboration agreements. Foreign Technology Agreements
in India permit transfer of technology by the means of Government approval or through the
automatic route delegated by the RBI.
8. The Chemical and Petrochemical Industries occupies a pivotal position in meeting some
basic human needs and in improving the quality of life. It is extremely important to the economy
and is an integral part of everyday life. India has a high population base and thus, faces
formidable problems in providing sufficient food, medicines and adequate shelter. From a very
18

modest level of 52 million MT in 1951-52, food grain production increased to about 296.65
million MT during 2019-20 in the country. The chemical industry provides the vital inputs
required, chemical fertilizers and pesticides, to augment food production and save crops from
attack by a variety of pests in a safe and selective way. The marked improvements in the
average life expectancy of our countrymen can be at-least partially attributed to the Chemical
Industry which has provided lifesaving drugs and other chemicals required for managing public
health care. The problem of housing can be tackled effectively with the assistance of the
Chemicals Industry. It plays a crucial role in housing development.
9. The Chemical Industry converts raw materials like water, salt, crude oil, natural gas, air,
metals minerals, etc. into other valuable products. It is involved in almost every industrial
process and therefore plays a significant role in economic and social development. Without
Chemical Industry, there would be no electronics or microelectronics, refrigerators, recording
tapes, automobiles, laser discs, super magnets, processed foods and virtually all consumer
products etc. Even the power industry depends on the Chemical Industry for its operations. The
use of chemicals (ion exchange resins) becomes indispensable for removing dissolved salts
needs in boilers and other applications. In gold mining, cyanide solution is used for extracting
gold. The crude oil refining process uses chemicals, catalysts, heat and pressure to separate
and combine the basic types of hydrocarbon molecules naturally found in crude oil into groups
of similar molecules. Apart from providing a variety of drugs for alleviation of human sufferings,
the chemical industry provides safe anaesthetic agents and high quality artificial aids including
a hip joint made from ultra-low molecular weight polyethylene. Other health products including
dental fills, contact lenses and dialyses also depend on the Chemicals Industry.
10. Some of the most useful materials, synthetic polymers, also known as plastics, have
transformed our lives in the last few decades. The driving force for this development was
provided by the need for conservation of natural resources and energy efficiency and inherent
advantages of the material which created possibilities of innovative designs and cost savings.
Its usefulness, adaptability and flexibility of usage have led to a shift in manufacturing from the
conventional material based products to synthetic products. The production of polymers has
increased from 7.88 million tonne in 2013-14 to 12.14 million ton in 2020-21 (CAGR of 6.38%)
while it consumption has increased from 9.81 million ton to 13.30 million ton (CAGR of 5.81%)
during the same period.
11. Chemicals from petroleum may range from basic petrochemicals such as ethylene,
propylene, benzene, xylenes to finished end-products like plastics, rubbers, fibers, detergents,
pesticides, dyes etc. These may be classified as (a) first generation, (b) second generation and
(c) third generation petrochemicals. First generation petrochemicals are chemicals directly
19

available from basic inputs such as petroleum crude oil or natural gas, either by fractionation,
isomerization, cracking etc. These can also be derived from coal gasification and bio mass.
These generally represent the basic petrochemicals, which are the building blocks for various
chemical syntheses. Examples of this class of chemicals are methane, ethane, propane,
ethylene, propylene, toluene, xylenes etc. Second generation petrochemicals are the
derivatives of the first generation petrochemicals. Example of such products are styrene
(derived from benzene and ethylene), dimethyl terephthalate or terephthalic acid (derived from
p-xylene), acrylonitrile (derived from propylene), ethylene glycol (derived from ethylene), vinyl
chloride monomer (derived from acetylene or ethylene) etc. Second generation petrochemicals
constitute the intermediate chemicals which serve as the raw materials for consumer industries
like plastics, rubbers, fibres, dyes, detergents etc. Third Generation Petrochemicals are the
consumer commodities derived generally from second generation petrochemicals and
represent the most important commercial products such as plastics, rubbers, fibres, detergents
etc. Examples are polystyrene (from vinyl chloride monomer), DDT from (chlorobenzene), azo
dyes (from styrene), Polyvinyl chloride (from aniline) etc. However, some of the products may
be directly synthesized from first generation petrochemicals. Polybutadiene rubber, for instance,
is obtained by polymerizing butadiene. Since most of the plastics or rubbers are derived from
second generation petrochemicals, polybutadiene rubber is regarded as a third generation
petrochemical. #
12. Chemical sector is predominantly based on feedstock derived from crude oil, natural
gas, salt and minerals. Naphtha (used for production of Urea, Aromatics and Olefins), Heavy
Gas oil (propylene and ethylene) and Kerosene (Linear Alkyl Benzene) are derived from crude
oil. Steam cracking/ Catalytic Reforming of low and high aromatic naphtha in oil refineries
provide Olefins (Ethylene, Propylene and Butadiene) and Aromatics (benzene, toluene and
xylenes). Natural gas contains Methane (CH4), Ethane (C2H6), Propane (C3H8) and Butane
(C4H10). Rich natural gas, which contains C2 and C3 in extractable quantity, is used in
producing Ethylene and Propylene. Methane is converted into synthesis gas. Synthesis gas is
a mixture of carbon monoxide & hydrogen which is used to make ammonia & methanol.
Ammonia is used to make Urea and Methanol is used to make acetic acid and derivatives.
Consumption of naphtha in petrochemical sector has increased from 10351 thousand ton in
2016-17 to 11339 (Provisional) thousand ton in 2020-21. The consumption of natural gas for
petrochemical sector has increased from 4170 million.
13. Olefins and Fibre Intermediates (Acrylonitrile, Caprolactum, Mono Ehylene Glycol,
Purified Terephthalic Acid, Dimethyl Terephthalate) form the basis of the petrochemical
industries. Olefins and Aromatics are used in producing Fibre Intermediates. Salt is the feed
stock for the chlor-alkali chemical industry, just as crude oil and Natural Gas for the
20

petrochemical industry. Salt, Aromatics, Minerals (Limestone, Bauxite ore (Aluminium), Rock
Phosphate, Sulphur, Iron ore, Indium ore (Tin), Chromite ore, Mica, Silca, Manganese ore, etc)
and Basic metals (Copper, Zinc, Titanium, Aluminium, Iron, Chromium, Tin, Nickel, etc) form
the basis of chemical industries producing Chlor-Alkali, Organic Chemicals, Inorganic
Chemicals, Pesticides and Dyes & Pigments. Dyes are organic compounds and are mainly
based on Benzene, Toluene, Naphthalene (from petroleum fractions and coke oven batteries of
steel plants), Anthracene and Cyanuric Chloride. Pesticides are mainly based on Benzene,
Naphthalene, Phosphorous (produced from phosphate rock) and Sulphur. Pharmaceuticals are
mainly based on Benzene, Toluene and Xylene.
14. Innovations in additives, alloys, blends, compounds, composites and high grade
reinforcement materials such as glass, nano-clays, carbon nano-tubes and carbon fibres require
attention for technology development. New developments in the field of bio and
photodegradable plastics, are also taking place all over the world. The chemical and
petrochemical industries face the challenge to operate in an environmentally acceptable
manner. Chemicals are globally tradable and unless chemicals produced in India are cost
effective, these cannot contribute usefully to the Nation’s economy. With an eye on emerging
usages, research and development efforts may focus on the need to modernize and upgrade
the existing manufacturing processes, improve the quality of existing products and make them
safe for environment and human health.
15. According to the National Sample Survey Office (NSSO)'s latest survey (July 2015-June
2016 NSS 73rd round), 3.72 lakh persons were engaged in Unincorporated Chemicals and
Chemical Products Sector (Industry Division 20) while 3.6 crore persons engaged in
Unincorporated Manufacturing sector. There is around 1.73 lakh Unincorporated Enterprises in
Chemicals and Chemical Products Sector (Industry Division 20) industries while 1.97 crore
Unincorporated Enterprises in manufacturing sector.
# Dr. G.N.Sarkar, Advanced Petrochemicals, First Edition, Khanna Publishers, New Delhi
21

Chapter 2
Global Scenario
As per the Cefic Report 2022, the world chemicals (excluding pharmaceuticals) sales in
2020 are valued at €3,471 billion. India ranks 4th in Asia and 6th in world with chemicals sales
valued at €92 billion in 2020. India’s Capital spending in World Chemicals (excluding
pharmaceuticals) is valued at €3.9 billion in 2020, as compared to €2.4 billion in 2010. India’s
R&I spending in the chemicals industry is valued at €1.8 billion in 2020, as compared to €0.8
billion in 2010. Top ten countries in World Chemical sales during 2020 are as under:
Rank Country Sales in 2020 (in Euro Billion)
1 China 1547
2 European Union (EU27) 499
3 USA 426
4 Japan 144
5 South Korea 102
6 India 92
7 Taiwan 66
8 Brazil 54
9 Russia 40
10. UK 36
Source: Cefic Facts & Figures-2022
2. As per UN Comtrade Database for 2020, India ranks 12th in the world exports of
chemicals (excluding pharmaceutical products) and ranks 5th in the world imports of chemicals
(excluding pharmaceutical products). India’s exports of chemicals (excluding pharmaceutical
products) was 36.59 US$ billion in 2020. India’s share in World exports of chemicals (excluding
pharmaceutical products) was 2.38% in 2020. India’s imports of chemicals (excluding
pharmaceutical products) was 53.10 US$ billion in 2020. India’s share in World imports of
chemicals (excluding pharmaceutical products) was 3.42% in 2020.
3. The top five Chemical Products (in terms of value) exported to different countries during
2020-21 were Other Herbicides-anti Sprouting Products (Rs.8,578/-Cr.), Other Insecticides
(Rs.8,337/-Cr.), Pigment Emulsion (Rs.5812/-Cr.), Other Fungicide NSE (Rs.4,967/-Cr.) and
Reactive Dyes (Rs.4,265/-Cr.). Other Herbicides-anti Sprouting Products exported to USA,
Brazil, Australia, France & Vietnam SOC REP; Other Insecticides exported to Brazil, USA,
Bangladesh PR, Nigeria & Mexico; Pigment Emulsion exported to China P RP, USA,
22

Netherland, Brazil & Belgium; Other Fungicide NSE exported to Brazil, Bangladesh PR, USA,
Costa Rica & France and Reactive Dyes exported to Bangladesh Pr, Turkey, Singapore
Honduras, & Brazil.
4. During 2020-21, top five Chemical products (in terms of value) imported from different
countries were Methanol (Rs.4,348/-Cr.), Other Insecticides (Rs.3,435/-Cr.), Acetic Acid
(Rs.2,757/-Cr.), Other Pesticides (Rs.2,163/-Cr.) and Other Herbicides-Anti Sprouting Products
(Rs.1,894/-Cr.). Methanol mainly imported from Saudi Arab, Qatar, Oman, Iran, & U Arab Emts;
Other Insecticides imported from China P RP, USA, Israel, Netherland & Korea RP; Acetic Acid
imported from Malaysia, Singapore, China P RP, Taiwan & Saudi Arab; Other Pesticides
imported from China P RP, Taiwan, USA, Austria & Russia and Other Herbicides-Anti Sprouting
Products imported from China P RP, Israel, Taiwan, Japan & UK.
5. Export of top five Petrochemical Products (in terms of value) to different countries during
2020-21 were Paraxylene (Rs.11,571/-Cr), Polypropylene (Inc. Co-Polymer) (Rs.5,618/-Cr),
Benzene (Rs.5,596/-Cr), Polyester Filament Yarn (Rs.5,456/-Cr) and High Density Polythylene
(Rs.2,475/-Cr). Paraxylene was mainly exported to China P RP, Malaysia, Indonesia, USA &
Thailand; Polypropylene (Inc. Co-Polymer) exported to China P RP, Turkey, Vietnam SOC REP,
Bangladesh PR & Nepal; Benzene was exported to Saudi Arab, China P RP, Belgium, Spain,
& U S A; Polyester Filament Yarn was exported to Turkey, Brazil, Egypt A RP, Bangladesh PR,
& Argentina and High Density Polythylene was exported to China P RP, Vietnam SOC REP,
Nepal, Kenya & Bangladesh PR.
6. Top five Petrochemical products (in terms of value) imported from different countries
during 2020-21 were Polypropylene (Inc. Co-polymer) (Rs.7,465/- Cr.), High Density
Polythylene (Rs.6,484/- Cr.), Styrene (Rs.4,594/-Cr.), Vinyl Chloride Monomer (Rs. 3,153/- Cr.)
and Poly Vinyl Chloride (Rs.3,010/-Cr.). Polypropylene (Inc. Co-Polymer) mainly imported from
Saudi Arab, U Arab Emts, Singapore, Korea RP & Thailand; High Density Polythylene imported
from U Arab Emts, USA, Qatar, Saudi Arab & Singapore; Styrene mainly imported from USA,
Singapore, Kuwait, Saudi Arab & Korea RP; Vinyl Chloride Monomer imported from Qatar,
Japan, France, Indonesia & China P RP and Poly Vinyl Chloride imported from Japan, Taiwan,
Korea RP, Thailand & China P RP.
23

Chapter 3
Important Economic Indicators
According to the National Accounts Statistics 2021, brought out by the Central Statistics
Office (CSO), Chemical and Chemical products sector, excluding pharmaceuticals (Industry
Division 20 of NIC 2008), accounted for 1.32% of the GVA for All Economic Activity in 2019-20.
The share of Gross Value Added (GVA) in the Manufacturing Sector during 2019-20 is about
8.97%. GVA of Chemical Sector has grown with CAGR of 12.57% during the period 2014-15 to
2019-20. The average Indices of Industrial Production (IIP) for the Chemical and Chemical
products (Industry Division 20 of NIC 2008) for the year 2020- 21 stood at 116.0, which is 2.5%
less as compared to the previous year. The size of the Indian Chemical industry, excluding
Pharmaceuticals (Industry Division 20 of NIC 2008), in terms of Value of Output in the year
2019-20 was Rs.9,33,042/- crores and it was 8.08% of Value of Output of Manufacturing Sector.
The size of Chemical industry, including Pharmaceuticals (i.e. Industry Division 20 and 21 of
NIC 2008), in terms of Value of Output in the year 2019-20 was Rs.13,22,136/- crores and it
was 11.45% of the Total Value of Output of Manufacturing sector. During last six years, i.e.
within 2014-15 to 2019-20, real growth rate in Output of Chemical Industry excluding
Pharmaceuticals Industry (i.e. Industry Division 20) was 8.10% which was 8.18% for Chemical
Industry including Pharmaceutical Industry {i.e. Industry Division 20 &21}. Growth in Value of
Output for Manufacturing Sector during the same period was 6.32%.
2. The exports and imports data of 2020-21 shows that in the Chemical Sector, comprising
of chapters 28, 29, 30, 31, 32, 38, 39, 4002, 54 and 55 of HS code, India was net importer in all
categories except of four categories, namely, Pharmaceuticals Products (Chapter 30 HS code),
Man-made staple fibers (Chapter 55 HS code), Man-Made Filaments (Chapter 54 HS code) and
Tanning or Dyeing (Chapter 32 HS code). Pharmaceuticals products accounted Rs.1,24,804/-
crore, Man-made staple fibres accounted Rs.3,379/- crore, Man-Made Filaments accounted
Rs.4,743/- crore and Tanning or Dyeing accounted Rs.8,624/- crore in net exports while
Fertilizers (chapter 31 HS code) accounted Rs.50,255/- crore, Plastic and Articles thereof
(Chapter 39 HS code) accounted Rs.47,388/- crore, Organic Chemicals (Chapter 29 HS code)
accounted Rs.12,194/- crore, Inorganic Chemicals (Chapter 28 HS code) accounted
Rs.38,654/- crore, Miscellaneous Chemical Products (Chapter 38 HS code) accounted
Rs.7,438/- crore and Synthetic Rubber and Factice (4002 HS code) accounted Rs.5,448/-
crores in the net imports during 2020-21. {Table No. 12A}
3. As per Annual Survey of Industries (Factory Sector), 2018-19, top seven States, namely,
Gujarat (34.28%), Maharashtra (15.03%), Uttar Pradesh (5.52%), Uttarakhand (5.51%), Tamil
Nadu (4.34%), Odisha (3.46%), and Himachal Pradesh(3.31), contributed around 71.5% in the
24

Gross Value Added (GVA) for the Chemical & Chemical products Sector (Industry Division 20
of NIC 2008) and seven States, namely, Gujarat (35.51%), Maharashtra (15.93%), Uttar
Pradesh (6.15%), Tamil Nadu (4.36%), Rajasthan (4.19%), West Bengal (4.09%) and Dadra &
N Haveli (3.85%), contributed around 74.1% in the Value of Output.
4. The exports of chemicals & petrochemicals (excluding pharmaceutical products and
fertilizers) has increased from Rs.1,77,862/- crores in 2013-14 to Rs.2,79,337/-crore in 2020-
21. The percentage share of the exports of chemicals & petrochemicals (excluding
pharmaceutical products and fertilizers) in the total national exports increased from 9.3% to
12.9% during the same period.
At the product level, the following products accounted more than Rupees One Thousand crore
in the exports during 2020-21:
5. The imports of Chemicals & Petrochemicals (excluding Pharmaceutical products and
fertilizers) has increased from Rs.2,41,311/- crores in 2013-14 to Rs.3,73,714/- crores in 2020-
21. The percentage share of the imports of Chemicals & Petrochemicals (excluding
Pharmaceutical products and fertilizers) in the total national imports increased from 8.9% to
12.8% during the same period {Table 11, 17 & 25}.
Product Export
(Rs. Crore) Product
Export (Rs. Crore)
Paraxylene 11571 High Density Polythylene
2475
Other Herbicides-Anti Sprouting Products
8578 Menthol 2404
Other Insecticides 8337 Azo Dyes 1792
Pigment Emulsion 5812 Polyester Staple Fibre 1722
Polypropylene (Inc. Co-Polymer)
5618 Ortho-Xylene 1279
Benzene 5596 Food Colours 1183
Polyester Filament Yarn
5456 Polyester Chips/Pet Chips
1180
Other Fungicide Nes 4967 Cypermethrin 1063
Reactive Dyes 4265 Mono Ehylene Glycol 1057
25

At the product level, the following products accounted for more than Rs. One Thousand crores
in the imports in 2020-21:
Product Import
(Rs. Crore) Product
Import (Rs. Crore)
High Density Polythylene
6484 Low Density Polyethylene 2085
Styrene 4594 Polyester Filament Yarn 1970
Methanol 4348 Other Herbicides-Anti Sprouting Products
1894
Other Insecticides 3435 Isopropanol 1647
Vinyl Chloride Monomer 3153 Linear Low Density Polythylene 1517
Poly Vinyl Chloride 3010 Ethylene Dichloride 1505
Paraxylene 2839 Styrene Butadiene Rubber 1491
Acetic Acid 2757 Other Fungicide Nes 1457
Polycarbonate 2679 Butyl Rubber 1388
Purified Terephthalic Acid
2456 Abs Resin 1296
Toluene 2384 Carbon Black 1276
Polyol 2286 Acrylonitrile 1211
Mono Ehylene Glycol 2263 Soda Ash 1148
Other Pesticides 2163 Poly Butadiene Rubber 1135
Linear Alkyl Benzene 2159
6. The net imports of Chemicals & Petrochemicals (excluding Pharmaceutical products and
fertilizers) has increased from Rs.63,449/-crore in 2013-14 to Rs.94,377/-crore in 2020-21. The
percentage share of the net imports of Chemicals & Petrochemicals (excluding Pharmaceutical
products and fertilizers) in the total national net imports increased from 7.8% to 12.5% during
the same period. At the product level, the following products accounted more than Rs. One
Thousand crores in the net imports in 2020-21. {Table 12(a), 18 & 26}
Product Net Import (Rs. crore)
Product Net Import (Rs. crore)
Styrene 4523 Other Pesticides 1927
Methanol 4322 Polypropylene (Inc. Co-Polymer)
1847
High Density Polythylene
4009 Low Density Polyethylene
1727
Vinyl Chloride Monomer
3153 Polyol 1685
Poly Vinyl Chloride 2925 Isopropanol 1552
Acetic Acid 2694 Ethylene Dichloride 1419
Polycarbonate 2622 Abs Resin 1289
Toluene 2286 Mono Ehylene Glycol 1206
Linear Alkyl Benzene 2150 Styrene Butadiene Rubber
1203
Ethyl Vinyl Acetate 2108 Acrylonitrile 1129
Purified Terephthalic Acid
2012 Butyl Rubber 1125
26

The following products accounted more than Rupees One Thousand crore in the total
net exports in 2020-21: -
Product Net Export (Rs. crore)
Product Net Export (Rs. crore)
Benzene 5513 Reactive Dyes 4045
Polyester Filament Yarn
3485 Other Fungicide NES
3510
Ortho-Xylene 1166 Menthol 1952
Polyester Staple Fibre 1076 Azo Dyes 1753
Other Herbicides-Anti Sprouting Products
6684 Food Colours 1120
Pigment Emulsion 5278 Cypermethrin 1063
7. Chemical Sector (including Pharmaceutical) in India {i.e. 99.5% GVA of Chemical Sector
(including Pharmaceutical) comes from the organized Sector. The estimates of the Total Output
(Factory Sector) of at 4-digit Industry class in the Chemicals and Chemical Products (Division
20-NIC 2008) during the year 2017- 18 and 2018-19 are given in the table below:
Class Description Total Output (Rs. Crore)
2017-18 2018-19
2011 Manufacture of basic chemicals 175960 226165
2012 Manufacture of fertilizers and nitrogen compounds 120736 138193
2013 Manufacture of plastics and synthetic rubber in primary forms 103265 109899
2021 Manufacture of pesticides and other agrochemical products 43907 57753
2022 Manufacture of paints, varnishes and similar coatings, printing
ink and mastics 44633 60905
2023 Manufacture of soap and detergents, cleaning and polishing
preparations, perfumes and toilet preparations 81478 86521
2029 Manufacture of other chemical products n.e.c. 66814 77310
2030 Manufacture of man-made fibres 24706 64379
Total 661499 821125
Source: - Annual Survey of Industries, 2017-18 and 2018-19 (Factory sector), Ministry of
Statistics & Programme Implementation
27

Chapter 4
Indian Trade Classification (Harmonised System)
[ITC (HS)] 2017- An Abstract
Indian Trade Classification (Harmonized System), 2017 was compiled and notified by
the Directorate General of Foreign Trade, Ministry of Commerce and Industry, Government of
India in January 2017. ITC-HS codes are divided into two schedules. ITC (HS) Import Schedule
I describe the rules and guidelines related to import policies whereas Schedule II describes the
rules and regulation related to export policies. Schedule I of the ITC-HS code is divided into 21
sections and each section is further divided into chapters. The total number of chapters in the
schedule I is 98. The chapters are further divided into sub- heading under which different HS
codes are mentioned. Export Policy Schedule II of the ITC-HS code contains 97 chapters giving
all the details about the guidelines related to the export policies.
The Chapters dealing with Chemicals and Petrochemical products are falling under
Section VI, VII & XI as depicted below:
Chapter Description Section
Chapter 28 Inorganic chemicals; organic or inorganic compounds of precious metals, of rare- earth metals, of radioactive elements or of; isotopes SECTION VI
Chapter 29 Organic chemicals
Chapter 38 Miscellaneous chemical products
Chapter 39 Plastics and articles thereof
SECTION VII.
Chapter 40 Rubber and articles thereof
EXIM Code 4002
Synthetic rubber and factice derived from oils, in primary Forms or in plates, sheets or strip; mixtures of any product of heading 4001 with any product of this heading, in primary forms or in plates, sheets or strip
Chapter 54 Man-made filaments SECTION XI
Chapter 55 Man-made staple fibres
Illustration of 8 digit Product Code:
Chapter Exim Code Item Description
28 Inorganic chemicals; organic or inorganic compounds of precious metals, of rare-earth metals, of radioactive elements or of; isotopes
2801 Fluorine, Chlorine, Bromine And Iodine
28011000 Chlorine
39 Plastics and articles thereof
3902 Polymers Of Propylene Or Of Other Olefins, In Primary Forms
39021000 Polypropylene
*Source: website of Directorate General Foreign trade (DGFT), Ministry of Commerce and
Industry, Government of India. http://dgft.gov.in/exim/2000/itchs2017/ITCHS2017.html may be
followed for further details.
28

Chapter 5
National Industrial Classification (NIC) - A Digest
The Central Statistics Office (CSO), Ministry of Statistics & Programme Implementation
being nodal Statistical Authority in the Country is vested with the responsibility of setting up
Standards for collection, compilation and dissemination of Statistical data. The Official statistics
is required to be collected and presented according to classification designed to facilitate its use
for National Economic Policies and conform to International comparison. The need for
comparability of Statistics available from various sources, on different aspects of the economy
and usability of such data for economic analysis necessitated the need of standardization of a
system of classification.
CSO being responsible for coordination of statistical activities in the country and with a
view to evolve and maintain statistical standards initiated task of bringing out Standard Industrial
Classification as early as in 1960 and evolved a Standard Industrial Classification (SIC) in 1962.
To take care of emerging changes in organizations and structure of Industries, the need for
revision of this document was felt from time to time. With this objective, the CSO revised SIC
1962 in 1970 (NIC-70), NIC-1970 in 1987 (NIC-87) and NIC-87 in 1998 (NIC-98). It is during
1998 that 4-digit system of International Standard Industrial Classification (ISIC- 3) was followed
and these 4 digits were extended up to 5 digits based on national needs. Consequent upon
release of United Nations International Standard Industrial Classification (ISIC) – 2002 Rev. 3.1,
NIC- 1998 was updated to bring out NIC – 2004. After adoption of ISIC Revision-4 by the United
Nations Statistical Commission (UNSC) in the year 2008, an expert committee under the
chairmanship of DG, CSO deliberated on the issues and approved the draft NIC -2008
incorporating revision in NIC- 2004 consistent with ISIC revision 4.
Basic features of NIC 2008
All the activities are grouped into several “activity groups” or “tabulation categories” in a
hierarchical manner. Activities are first grouped into ‘section’ alphabetically coded from A
through U, every section is divided into ‘division’ with 2-digit numeric code, every division into
‘group’ with 3-digit numeric code, every group into ‘class’ with 4-digit numeric code and every
4-digit class into 5-digit ‘sub-class’. The structure is illustrated below.
29

Level Description
Section Manufacturing
Division 20 Manufacture of Chemicals and Chemical Products
Group 201
Manufacture of Basic Chemicals, Fertilizer and Nitrogen Compounds, Plastics and Synthetic Rubber in Primary Forms
203 Manufacture of man-made fibres
Class 2011 Manufacture of Basic Chemicals
2030 Manufacture of man-made fibres
Sub- Class
20111 Manufacture of liquefied or compressed inorganic industrial or medical gases (elemental gases, liquid or compressed air, refrigerant gases, mixed industrial gases etc.)
20301 Manufacture of synthetic or artificial filament tow
The structure of NIC-2008 is identical to the structure of ISIC Revision up to 4-digit level
‘class’. Classes were then divided into 5-digit ‘sub classes” according to national requirements.
Salient features of NIC-2008
The sections A to Q of NIC-2004 have been replaced by sections A to U in respect of NIC-
2008. NIC-2008 has 21 sections, 88 divisions, 238 groups, 403 classes and 1304 sub-
classes.
NIC-2008 is comparable with ISIC Rev.4 till 4-digit classes in totality.
The concept of shadow classes introduced in NIC-2004 has been done away with in NIC-
2008 as the emphasis has been given on activity rather than type of operation and scale of
operation.
In NIC-2008 some of the 5-digit sub-classes of NIC-2004 have been made separate 4- digit
classes e.g. ‘Growing of Sugarcane (01115)”, ‘Growing of tobacco (01114)’, ‘Growing of
fibre crops (01113)” ‘Growing of flowers (01122)”.
Repair and installation of machinery and equipment has been classified as separate
division (Division-33) in NIC-2008.
Repair of Personal Household goods (5260 of NIC-2004) has been removed from Section-
G (wholesale and retail trade; repair of motor vehicles and motor cycles) and now included
in Section-S (other service activities).
Publishing activity which was included in division-22 of manufacturing section in NIC- 2004
is now included in division-58 (publishing activities) of NIC-2008 under Section-J
(information and communication).
Activity ‘water supply’ under division-41 (Electricity, Gas and Water Supply) of NIC- 2004
is now included in Section-E (water supply; sewerage, waste management and remediation
activities).
Explanatory notes of ISIC Rev.4 at 1/2/3-digit level have been incorporated in NIC- 2008
as Annexure for better understanding of the revised classification.
30

Under 4-digit classes of NIC-2008, inclusion and exclusion statements have been included
in the detailed structure itself to remove ambiguity in the scope of classification and to
facilitate the classification of economic activity distinctly.
Division 20 and 21 of NIC -2008 relates to “Chemical and Chemical Products” and
“Pharmaceutical, Medicinal and botanical products” respectively.
*Source: website of Ministry of Statistics and Programme Implementation, Government of India
http://mospi.nic.in/sites/default/files/main_menu/national_industrial_classification/nic_2008_17apr0 9.pdf
may be followed for further details.
31

Chapter 6
Indices released by Government of India
Indices are important economic indicators to demonstrate the relative change in the parameters
over a specified period of time. Some of the important indices compiled and released by different
Departments under the Government of India along with their inception and uses in different
sectors of economy are summarized below:
A. Index of Industrial Production (IIP)
B. Consumer Price Index (CPI)- Industrial Worker, Agricultural Labourer / Rural Labourer,
Rural / Urban / Combined
C. Wholesale Price Index (WPI)
A. Index of Industrial Production-(IIP)
1. The Central Statistics Office (CSO), Ministry of Statistics and Programme
Implementation Compiles and brings out an index of Industrial Production. CSO revises the
base year of the macroeconomic indicators, as a regular exercise, to capture structural changes
in the economy and improve the quality and representativeness of the indices. In this direction,
the base year of the all-India Index of Industrial Production (IIP) has also been revised from
2004-05 to 2011-12 to not only reflect the changes in the industrial sector but also to align it with
the base year of other macroeconomic indicators like the Gross Domestic Product (GDP),
Wholesale Price Index (WPI) etc.
2. IIP in the revised series is continued to represent the Mining, Manufacturing and
Electricity sectors. The revised series uses the National Industrial Classification (NIC) 2008 for
the purpose of classification of industrial production. 15 source agencies are proving production
data for Index of Industrial Production (IIP) base year 2011-12.
Summary of Source Agencies of IIP in the new series with base 2011-12
Sl No Source Weights (%)
1 Department of Industrial Policy and Promotion (DIPP) 47.54
2 Indian Bureau of Mines 14.37
3 Ministry of Petroleum & Natural Gas 11.29
4 Joint Plant Committee 10.52
5 Central Electricity Authority 7.99
6 Department of Chemicals and Petrochemicals 2.54
7 Office of Textile Commissioner 1.94
32

8 Department of Fertilizers 1.06
9 Directorate Of Sugar and Vegetable Oils (for Edible Oils only) 0.97
10 Directorate Of Sugar and Vegetable Oils (for Sugar only) 0.76
11 Office of Coal Controller 0.49
12 Tea Board 0.29
13 Railway Board 0.13
14 Office of Jute Commissioner 0.07
15 Coffee Board 0.04
GENERAL 100.00
3. Highlights of the changes in New Series of Index of Industrial Production are
summarized below:
a. The selection of items in the new series has been done at the 3 digit level of NIC for
better representation as compared to selection at 2 digit level done in 2004-05 series.
b. At the broad level, the new series has a total of 809 items occurring in the manufacturing
sector in the item basket (405 item groups), where 149 new items like Steroids and
hormonal preparations, Cement clinkers, Medical/ surgical accessories, Pre-fabricated
concrete blocks, refined Palm Oil have been added and 124 items such as Biaxially
Oriented Polypropylene (BOPP) Films, Calculators, Colour TV picture tubes, Gutka have
been deleted from the 2004-05 series in the manufacturing sector. The sectoral
composition of the IIP is as follows:
Sector Base year 2011-12 Base year 2004-05
Weights (%) Item groups Weights (%) Item groups
Mining 14.373 1 14.157 1
Manufacturing 77.633 405 75.527 397
Electricity 7.994 1 10.316 1
Total 100 407 100 399
c. To reflect the increasing significance of electricity generation from renewable sources, it
was decided to include data on electricity generation figures from these sources in the
new series. This inclusion was done from April, 2014 onwards as monthly data for
electricity generation from renewable sources for earlier months were not available.
d. For capital goods, data in the new series is captured in terms of ‘work in progress‘ to
better represent the growth of capital goods and to avoid reporting of production figures
in bulk after the completion of production. Details on this methodology are available in
the Report of the Working Group set up for the revision of base year, which may be
accessed in the official website of this Ministry.
33

e. The number of source agencies reporting data for compilation of IIP in the new series is
14 as compared to 15 in its previous. This is on account of the fact that data on ‘Iodised
Salt’ in the new series is being provided by the Department of Industrial Policy and
Promotion (DIPP) as O/o Salt Commissioner was not in a position to supply Salt
production data after abolition of Salt Cess Act, 1953 in Finance Bill 2016.
f. In the Mining Sector the coverage was undergone a change on account of the MCDR
Amendment Rules, 2016 resulting in 27 non-metallic minerals being designated as minor
minerals and which were no longer monitored by Indian Bureau of Mines.
B. Consumer Price Index (CPI)
1. A Consumer Price Index (CPI) is designed to measure the changes over time in general
level of retail prices of selected goods and services that households purchase for the purpose
of consumption. Such changes affect the real purchasing power of consumer’s income and their
welfare. CPI numbers are widely used as macroeconomic indicator of inflation, and also as a
tool by government and central banks for targeting inflation and monitoring price stability. CPI
is also used as deflators in the National Accounts. Therefore, CPI is considered as one of the
most important economic indicators.
2. Different types of CPIs, namely, CPI (IW), CPI (AL/RL), CPI (UNME) and CPI (R/U/C)
compiled by different agencies of Government of India, are available for users in our country.
First three indices, including CPI (UNME), are specific to population segments. The price
collection for CPI (UNME) was discontinued with effect from April 2008 and linked all India CPI
(UNME) numbers were brought out from April 2008 to December 2010. The fourth one i.e. CPI
(R/U/C) is for general population, sector-wise, to be explained in subsequent paragraphs.
3. Salient features of different types of CPIs:
Consumer Price Index for Industrial Workers - CPI (IW)
This index is compiled by the Labour Bureau, Ministry of Labour and Employment. The
target population is working class family, defined as a family: (i) located within the centre for
industrial worker, (ii) has at least one member working as manual worker in an establishment in
any of the seven sectors of employment covered viz., factories, plantations, mining, ports and
docks, public motor transport undertakings, electricity generating and distributing
establishments, and railways; and (iii) derived 50 per cent or more of its income during the
calendar month preceding the day of enquiry through any manual work.
The present series of CPI (IW) is on base 2016=100. The weighting diagrams for the
purpose of compilation of index numbers had been derived on the basis of average monthly
34

family expenditure of the working class obtained from the Working Class Family Income
Expenditure Survey conducted during 1999-2000.
The CPI (IW) is released every month (on the last working day of succeeding month)
for each of the selected 88 centres as well at all India level. It is mainly used for the determination
of Dearness Allowance (DA) being paid to Central/State Government employees and also to
the workers in the industrial sectors, besides fixation and revision of minimum wages in
scheduled employments. It is also used in moving the base year poverty lines for urban areas
to the subsequent years.
Consumer Price Index for Agricultural /Rural Labourers - CPI (AL/RL)
These indices are compiled by the Labour Bureau, Ministry of Labour and Employment.
The target populations are agricultural and rural labourers. A rural labour household is defined
as one, which derives major income from manual employment (rural labour) during the last 365
days. From amongst the rural labour households, those households, which earn 50% or more
of their total income from gainful employment as manual labour in agriculture during the last 365
days, are categorized as agricultural labour households. Agricultural labour households form a
major subset of rural labour households. A person is considered engaged in agricultural labour
if he/she follows one or more of the agricultural occupations in the capacity of wage paid manual
labourer, whether paid in cash or kind (excluding exchange labour) or both. A person who does
manual work in return for wages in cash or kind or partly in cash and partly in kind (excluding
exchange labour) is a wage paid manual labourer. Persons who are self-employed doing
manual work are not treated as wage paid manual labourers. People living in rural areas and
engaged in manual labour by working in agricultural and/or non-agricultural occupations in
return for wages paid either in cash or kind (excluding exchange labour) or both, are considered
as rural labourers. Thus, rural labourers include both agricultural and other labourers.
The present series of CPI (AL/RL) is on base 1986-87=100. Estimates of average
consumer expenditure per household generated from the results of the NSS 38th round (1983),
CES formed the source of weights for different items of goods and services, used in compilation
of CPI (AL) and CPI (RL).
For both the current series of CPI (AL) and CPI (RL), the retail prices in respect of goods
and services are collected on monthly basis, from fixed markets in 600 sample villages in 20
states by the field workers of the Field Operations Division (FOD) of the National Sample Survey
Office (NSSO). The various items (12) of goods and services are categorized into four main
groups namely, (i) Food, (ii) Fuel and Light, (iii) Clothing, Bedding and Footwear; and (iv)
Miscellaneous. The items of goods and services are common for the state as a whole but the
35

varieties of most of the items differ from village to village. The collection of retail prices is
staggered over four weeks of a month with one- fourth of the sample covered every week.
The CPI (AL/RL) is released every month (20th or preceding working day of the following
month) for each of the selected states as well at all India level. It is mainly used for the
determination/ fixation and revision of minimum wages in agricultural sector. CPI (AL) is also
used in moving the base year poverty lines for rural areas to the subsequent years.
Consumer Price Index for Rural, Urban and Combined - CPI (R/U/C)
The indices are compiled by the CSO on base 2010 = 100. The consumption patterns
(weighting diagrams) for this series of CPI have been derived on the basis of average monthly
consumer expenditure of an urban/rural household obtained from the results of the 61st Round
of CES conducted by the National Sample Survey Office during 2004-05.
C. Wholesale Price Index (WPI)
WPI is an important measure to monitor the dynamic movement of prices at the
wholesale level. In a dynamic world, prices keep on changing. WPI is used as a deflator of
various nominal macroeconomic variables including Gross Domestic Product (GDP). The WPI
based inflation estimates also serve as an important determinant, in formulation of trade, fiscal
and other economic policies by the Government. WPI is also used for the purpose of escalation
clauses in the supply of raw materials, machinery and construction work. Business firms in
search of effective methods for coping with changes in prices often employ price adjustment
(escalation) clauses in long-term sales and purchase contracts. WPI is widely recognized
among business people, economists, statisticians and accountants as a useful objective
indexing tool in price adjustment clauses.
The base year of All-India WPI has been revised from 2004-05 to 2011-12 by the Office
of Economic Advisor (OEA), Department of Industrial Policy and Promotion, Ministry of
Commerce and Industry to align it with the base year of other macroeconomic indicators like the
Gross Domestic Product (GDP) and Index of Industrial Production (IIP). The Wholesale Price
Index (WPI) series in India has undergone six revisions in 1952-53, 1961-62, 1970-71, 1981-
82, 1993- 94 and 2004-05 so far. The current series is the seventh revision.
36

Features of WPI
• In the current series of WPI, prices used for compilation do not include indirect taxes in
order to remove impact of fiscal policy. This is in consonance with international practices
and will make the current WPI conceptually closer to ‘Producer Price Index’.
• A current “WPI Food Index” is compiled to capture the rate of inflation in food items.
• Seasonality of fruits and vegetables has been updated to account for more months as
these are now available for longer duration.
• Item level aggregates for current WPI are compiled using Geometric Mean (GM) following
international best practice and as is currently used for compilation of All India CPI.
• A high level Technical Review Committee was set up for the first time to carry out dynamic
review process in order to keep pace with the changing structure of the economy.
37

Chapter 7
Glimpses of Important Trends during 2016-17 to 2020-21
This Chapter has been included in this publication to highlight important trends of
chemicals and petrochemicals sector during the last five years i.e. 2016-17 to 2020-21, through
graphical presentation with concise analysis. The graphical presentation contains tables
alongside displays trend during the considered period in respect of Production, Installed
Capacity, Export, Import and Net Export / Net Import relating to various groups of Major
Chemicals and Major Petrochemicals with compound annual growth rate (CAGR) during the
period 2016-17 to 2020-21. The Chapter also contains Pie Charts depicting share of Major
groups under Major Chemicals and Major Petrochemicals in respect of Production, Installed
Capacity, Export and Import along with Net Import / Net Export during 2020-21.
2. This Publication has also contained detailed tables in Appendices Section showing
group-wise, product-wise, year-wise information to selected Major Chemicals and Major
Petrochemicals along with top five import and export destinations. The information relating to
exchange rates of Indian Rupees’ vis-a-vis US$, World export of Chemicals by top ten countries-
2020, sector–wise FDI inflows etc. are also included in the Appendices Section.
3. Many of statistical tables appended in the Publication present temporal data for the
period 2013-14 to 2020-21. CAGR in these tables has also been reflected over the period of 8
years.
4. Hope trends indicated in this chapter and data contained in the publication would help
users in understanding the emerging scenario in the sector with clarity and ease.
*****
38

Alkali Chemicals
Installed Capacity-Production
It is observed that installed capacity and production of Alkali Chemicals has shown
increasing trend during 2016-17 to 2020-21. The actual production was always lower than the
installed capacity during the period.
Quantity Imported-Quantity Exported of Alkali Chemicals
It is observed that the Export of Alkali Chemicals was much lower than its imports
during the period 2016-17 to 2020-21. However, it is observed that the gap between import
and Export of Alkali Chemicals was gradually narrowed over the period.
Year Installed Capacity
(In ‘000 MT)
Production (In ‘000 MT)
2016-17 8422 6802
2017-18 8822 7009
2018-19 9274 7631
2019-20 9422 8043
2020-21 10089 8457
CAGR (%) 4.6 5.6
Year Import (In ‘000 MT)
Export (In ‘000 MT)
2016-17 1121 154
2017-18 1194 273
2018-19 1049 239
2019-20 1157 329
2020-21 968 429
CAGR (%) -3.6 29.1
0
2000
4000
6000
8000
10000
12000
8822 9274 942210089 10473
70097631 8043 8457
7776
Installed Capacity Production
0
200
400
600
800
1000
1200 11211194
10491157
968
154273 239
329429
Import (Qty) Export (Qty)
39

Alkali Chemicals
Value of Import- Value of Export
Year Import (Rs. In Crore)
Export (Rs. In Crore)
2016-17 2151 396
2017-18 2653 869
2018-19 2255 878
2019-20 2408 828
2020-21 1705 853
CAGR (%) -5.6 21.2
It is evident that the values of Export of Alkali Chemicals were significantly lower than the
values of Import during 2016-17 to 2020-21. However, the gap between the values of Import and
Export of Alkali Chemicals was least in 2020-21 over the previous years.
Net Import of Alkali Chemicals
India is a Net Importer of Alkali Chemicals. However, its net Imports from Rs.1755 crore in
2016-17 have come down to Rs.852 crore in 2020-2021.
Year Net Import (Rs. In Crore)
2016-17 1755
2017-18 1785
2018-19 1377
2019-20 1580
2020-21 852
CAGR (%) -16.5
0
500
1000
1500
2000
2500
3000
2151
2653
22552408
1705
396
869 878 828 853
Import (Rs. In Crore) Export (Rs. In Crore)
1755 1785
1377
1580
852
600
800
1000
1200
1400
1600
1800
2000
Net Import (Rs. In Crore)
40

Inorganic Chemicals
Installed Capacity-Production
Year Installed Capacity
(In ‘000 MT)
Production (In ‘000 MT)
2016-17 1313 1053
2017-18 1315 1058
2018-19 1300 1064
2019-20 1538 1063
2020-21 1560 978
CAGR (%) 4.4 -1.8
It is observed that the installed capacity of Inorganic Chemicals increased from 1313
thousand MT in 2016-17 to 1560 thousand MT in 2020-21, However, the production was almost
stagnant during 2016-17 to 2020-21 (except in 2020-21). Also the actual production was always
lower than the installed capacity during the same period.
Quantity Imported-Quantity Exported of Inorganic Chemicals
The Import of Inorganic Chemicals was significantly higher than its Export (during 2016-
17 to 2020-21).
Year Import (In ‘000 MT)
Export (In ‘000 MT)
2016-17 1010 378
2017-18 1229 173
2018-19 1580 177
2019-20 1532 196
2020-21 1188 195
CAGR (%) 4.1 -15.2
0
200
400
600
800
1000
1200
1400
16001313 1315 1300
1538 1560
1053 1058 1064 1063978
Installed Capacity Production
0
200
400
600
800
1000
1200
1400
1600
1010
1229
1580 1532
1188
378
173 177 196 195
Import (Qty) Export (Qty)
41

Inorganic Chemicals
Value of Import- Value of Export
It is evident that the value of Exports of Inorganic Chemicals was significantly lower than
the values of Import during 2016-17 to 2020-21. During the same, the maximum Export was
seen during the year 2018-19.
Net Import of Inorganic Chemicals
The Net Imports of Inorganic Chemicals increased from 2016-17 to 2018-19, but it
was declined again in the next two consecutive financial years.
Year Import (Rs. In Crore)
Export (Rs. In Crore)
2016-17 2352 1113
2017-18 3084 1023
2018-19 4858 1332
2019-20 3546 1341
2020-21 3021 1192
CAGR (%) 6.5 1.7
Year Net Import (Rs. In Crore)
2016-17 1239
2017-18 2061
2018-19 3525
2019-20 2205
2020-21 1829
CAGR (%) 10.2
0
500
1000
1500
2000
2500
3000
3500
4000
4500
5000
23523084
4858
3546
3021
1113
10231332 1341 1192
Import (Rs. In Crore) Export (Rs. In Crore)
1239
2061
3525
2205
1829
1000
1500
2000
2500
3000
3500
4000
Net Import (Rs. In Crore)
42

Organic Chemicals
Installed Capacity-Production
Year Installed Capacity
(In ‘000 MT)
Production (In ‘000 MT)
2016-17 2529 1638
2017-18 2535 1799
2018-19 2575 1884
2019-20 2671 1847
2020-21 2664 1906
CAGR (%) 1.3 3.9
It is observed that the installed capacity and production of Organic Chemicals showed
increasing trend during 2016-17 to 2020-21. Also, the actual production was always lower than
the installed capacity during the period.
Quantity Imported-Quantity Exported of Organic Chemicals
It is observed that the Exports of Organic Chemicals were very low as compared to its
Import during the period 2016-17 to 2020-21.
Year Import (In ‘000 MT)
Export (In ‘000 MT)
2016-17 3170 190
2017-18 3407 205
2018-19 3645 233
2019-20 3775 245
2020-21 3716 296
CAGR (%) 4.0 11.7
0
500
1000
1500
2000
2500
30002529 2535 2575 2671 2664
16381799 1884 1847 1906
Installed Capacity Production
0
500
1000
1500
2000
2500
3000
3500
40003170
34073645 3775 3716
190 205 233 245 296
Import (Qty) Export (Qty)
43

Organic Chemicals
Value of Import- Value of Export
It is evident that the values of Export of Organic Chemicals were significantly lower than
the values of Import during 2016-17 to 2020-21. During the period, the maximum Export was
seen in 2020-21.
Net Import of Organic Chemicals
The net Imports of Organic Chemicals were increasing during 2016-17 to 2018-19, but it
was significantly declined in 2019-20 and 2020-21.
Year Import (Rs. In Crore)
Export (Rs. In Crore)
2016-17 9044 2329
2017-18 12077 3205
2018-19 15203 4257
2019-20 10781 4227
2020-21 11247 4380
CAGR (%) 5.6 17.1
Year Net Import (Rs. In Crore)
2016-17 6714
2017-18 8873
2018-19 10945
2019-20 6553
2020-21 6867
CAGR (%) 0.6
0
2000
4000
6000
8000
10000
12000
14000
16000
9044
12077
15203
10781 11247
23293205
4257 4227 4380
Import (Rs. In Crore) Export (Rs. In Crore)
6714
8873
10945
65536867
6000
7000
8000
9000
10000
11000
12000
Net Import (Rs. In Crore)
44

Pesticides
Installed Capacity-Production (Technical Grades)
It is observed that the production of Pesticides was almost stagnant during 2016-17 to
2018-19 and decreased in 2019-20. Further, it was increased in 2020-21. Moreover, the actual
production was always lower than the installed capacity during 2016-17 to 2020-21.
Quantity Imported-Quantity Exported (Technical Grades & Formulations) of Pesticides
The quantity of Export of Pesticides was significantly large as compared to its Import
during the period 2016-17 to 2020-21.
Year Installed Capacity
(In ‘000 MT)
Production (In ‘000 MT)
2016-17 322 214
2017-18 325 213
2018-19 324 217
2019-20 334 192
2020-21 371 255
CAGR (%) 3.7 4.5
Year Import (In ‘000 MT)
Export (In ‘000 MT)
2016-17 43 342
2017-18 44 358
2018-19 49 405
2019-20 43 398
2020-21 66 471
CAGR (%) 11.7 8.3
0
50
100
150
200
250
300
350
400
322 325 324 334
371
214 213 217192
255
Installed Capacity Production
050
100150200250300350400450500
43 44 49 4366
342 358405 398
471
Import (Qty) Export (Qty)
45

Pesticides
Value of Import- Value of Export (Technical Grades & Formulations)
It is evident that the values of Export of Pesticides (Technical Grades & Formulations) were
significantly higher than the values of Import during 2016-17 to 2020-21. Further, significant
increasing trend of Exports was evident during the same period.
Net Export (Technical Grades & Formulations) of Pesticides
The net Exports of Pesticides (Technical Grades & Formulations) were significantly
increased from 2016-17 to 2019-20. However, it was marginally decreased in 2020-21.
Year Import (Rs. In Crore)
Export (Rs. In Crore)
2016-17 4906 13150
2017-18 5814 14810
2018-19 6326 20041
2019-20 6111 21633
2020-21 8991 23806
CAGR (%) 16.4 16.0
Year Net Export (Rs. In Crore)
2016-17 8244
2017-18 8996
2018-19 13715
2019-20 15522
2020-21 14815
CAGR (%) 15.8
0
5000
10000
15000
20000
25000
4906 5814 6326 6111
8991
1315014810
2004121633
23806
Import (Rs. In Crore) Export (Rs. In Crore)
82448996
13715
1552214815
7000
8000
9000
10000
11000
12000
13000
14000
15000
16000
Net Export (Rs. In Crore)
46

Dyes and Pigments
Installed Capacity-Production
It is observed that the installed capacity of Dyes and Pigments enhanced during 2016-
17 to 2020-21. However, the production increased from 2016-17 to 2019-20 and further
decreased in 2020-21.
Quantity Imported-Quantity Exported of Dyes and Pigments
The Export of Pesticides (Technical Grades & Formulations) was significantly higher as
compared to its Import during the period 2016-17 to 2020-21.
Year Installed Capacity
(In ‘000 MT)
Production (In ‘000 MT)
2016-17 471 320
2017-18 478 367
2018-19 492 382
2019-20 528 384
2020-21 532 327
CAGR (%) 3.1 0.6
Year Import (In ‘000 MT)
Export (In ‘000 MT)
2016-17 56 419
2017-18 63 486
2018-19 56 525
2019-20 51 530
2020-21 45 514
CAGR (%) -5.1 5.2
0
100
200
300
400
500
600
471 478 492528 532
320367 382 384
327
Installed Capacity Production
0
100
200
300
400
500
600
56 63 56 51 45
419
486525 530 514
Import (Qty) Export (Qty)
47

Dyes and Pigments
Value of Import- Value of Export
It is evident that the values of Export of Dyes and Pigments were significantly higher than
the values of Import during 2016-17 to 2020-21. During the same, the maximum Export was seen
during the year 2019-20.
Net Export of Dyes and Pigments
The Net Exports of Dyes and Pigments were significantly increased from 2016-17 to
2019-20, but it was marginally abated in 2020-21.
Year Import (Rs. In Crore)
Export (Rs. In Crore)
2016-17 2149 13075
2017-18 2314 14393
2018-19 2784 18007
2019-20 2814 19284
2020-21 2527 17704
CAGR (%) 4.1 7.9
Year Net Export (Rs. In Crore)
2016-17 10926
2017-18 12079
2018-19 15223
2019-20 16470
2020-21 15177
CAGR (%) 8.6
0
2000
4000
6000
8000
10000
12000
14000
16000
18000
20000
2149 2314 2784 2814 2527
1307514393
1800719284
17704
Import (Rs. In Crore) Export (Rs. In Crore)
10926
12079
15223
16470
15177
10000
11000
12000
13000
14000
15000
16000
17000
Net Export (Rs. In Crore)
48

Total Major Chemicals
Installed Capacity-Production
It is observed that the installed capacity and production of Total Major Chemicals showed
an increasing trend during 2016-17 to 2020-21 except the marginally declined in its production
during 2020-2021. Also the actual production was always lower than the installed capacity
during 2016-17 to 2020-21.
Quantity Imported-Quantity Exported of Total Major Chemicals
Import and Export in quantity terms of Total Major Chemicals showed an increasing trend
during 2016-17 to 2020-21 except the marginally declined in its Import during 2020-21. Also,
the Import quantities were around four times larger than its Export quantities during the period.
Year Installed Capacity
(In ‘000 MT)
Production (In ‘000 MT)
2016-17 13456 10234
2017-18 13927 11069
2018-19 14112 11589
2019-20 15160 11943
2020-21 15601 11243
CAGR (%) 3.8 2.4
Year Import (In ‘000 MT)
Export (In ‘000 MT)
2016-17 5400 1484
2017-18 5937 1496
2018-19 6379 1579
2019-20 6557 1698
2020-21 5983 1905
CAGR (%) 2.6 6.4
0
2000
4000
6000
8000
10000
12000
14000
1600013456 13927 14112
15160 15601
1023411069 11589 11943
11243
Installed Capacity Production
0
1000
2000
3000
4000
5000
6000
7000
54005937
6379 65575983
1484 1496 1579 1698 1905
Import (Qty) Export (Qty)
49

Total Major Chemicals
Value of Import- Value of Export
It is evident that the values of Export of Total Major Chemicals were significantly higher than
the values of Import during 2016-17 to 2020-21. Even though, the imported quantities of Total Major
Chemicals were approximately four times higher than its Export quantities.
Net Export of Total Major Chemicals
The net Exports of Total Major Chemicals were significantly increased from 2017-18 to
2019-20, but it was marginally abated in 2020-21.
Year Import (Rs. In Crore)
Export (Rs. In Crore)
2016-17 20601 30064
2017-18 25942 34300
2018-19 31426 44516
2019-20 25659 47313
2020-21 27490 47935
CAGR (%) 7.5 12.4
Year Net Export (Rs. In Crore)
2016-17 9463
2017-18 8357
2018-19 13091
2019-20 21653
2020-21 20445
CAGR (%) 21.2
05000
100001500020000250003000035000400004500050000
20601
25942 3142625659 27490
30064
34300
4451647313 47935
Import (Rs. In Crore) Export (Rs. In Crore)
94638357
13091
2165320445
5000
7000
9000
11000
13000
15000
17000
19000
21000
23000
Net Export (Rs. In Crore)
50

67%
10%
17%
2% 4%
Share of different groups of Major Chemical in Installed Capacity during 2020-21
1. Alkali Chemicals
2. Inorganic Chemicals
3. Organic Chemicals
4. Pesticides (Tech.)
5. Dyes & Pigments
69%
9%
17%
2% 3%
Share of different groups of Major Chemical in Production during 2020-21
1. Alkali Chemicals
2. Inorganic Chemicals
3. Organic Chemicals
4. Pesticides (Tech.)
5. Dyes & Pigments
51

16%
20%
62%
1% 1%
Share of different groups of Major Chemical in total Import (Qty.) during 2020-21
1. Alkali Chemicals
2. Inorganic Chemicals
3. Organic Chemicals
4. Pesticides (Tech.)
5. Dyes & Pigments
6%
11%
41%
33%
9%
Share of different groups of Major Chemical in total Import (Value) during 2020-21
1. Alkali Chemicals
2. Inorganic Chemicals
3. Organic Chemicals
4. Pesticides (Tech.)
5. Dyes & Pigments
52

22%
10%
16%25%
27%
Share of different groups of Major Chemical in total Export (Qty.) during 2020-21
1. Alkali Chemicals
2. Inorganic Chemicals
3. Organic Chemicals
4. Pesticides (Tech.)
5. Dyes & Pigments
2% 2%
9%
50%
37%
Share of different groups of Major Chemical in total Export (Value) during 2020-21
1. Alkali Chemicals
2. Inorganic Chemicals
3. Organic Chemicals
4. Pesticides (Tech.)
5. Dyes & Pigments
53

Synthetic Fibres/Yarn
Installed Capacity-Production
It is observed that the installed capacity of Synthetic Fibres/Yarn increased during 2016-
17 to 2020-21.
Quantity Imported-Quantity Exported of Synthetic Fibres/Yarn
The Export quantities of Synthetic Fibres/Yarn were significantly higher as compared to
its imported quantities during the period 2016-17 to 2020-21.
Year Installed Capacity
(In ‘000 MT)
Production (In ‘000 MT)
2016-17 4393 3599
2017-18 4379 3625
2018-19 4440 3601
2019-20 4521 3893
2020-21 4529 3185
CAGR (%) 0.8 -3.0
Year Import (In ‘000 MT)
Export (In ‘000 MT)
2016-17 280 1026
2017-18 260 1001
2018-19 276 1016
2019-20 347 1059
2020-21 403 879
CAGR (%) 9.6 -3.8
0
500
1000
1500
2000
2500
3000
3500
4000
4500
5000 4393 4379 4440 4521 4529
3599 3625 36013893
3185
Installed Capacity Production
0
200
400
600
800
1000
1200
280 260 276347
403
1026 1001 1016 1059
879
Import (Qty) Export (Qty)
54

Synthetic Fibres/Yarn
Value of Import- Value of Export
It is evident that the values of Export of Synthetic Fibres/Yarn were significantly higher than
the values of Import during 2016-17 to 2020-21. During the same, the maximum Export was seen
in the year 2018-19.
Net Export of Synthetic Fibres/Yarn
India is a net exporter of Synthetic Fibres/Yarn. Its net Export was Rs.7,187 crore in 2018-
19, which was declined to Rs.5,941 crore in 2019-2020 and further declined to Rs.3,763 in 2020-
21.
Year Import (Rs. In Crore)
Export (Rs. In Crore)
2016-17 3430 9220
2017-18 3631 9780
2018-19 4534 11720
2019-20 4609 10550
2020-21 4107 7870
CAGR (%) 4.6 -3.9
Year Net Export (Rs. In Crore)
2016-17 5790
2017-18 6149
2018-19 7187
2019-20 5941
2020-21 3763
CAGR (%) -10.2
0
2000
4000
6000
8000
10000
12000
3430 36314534 4609 4107
92209780
1172010550
7870
Import (Rs. In Crore) Export (Rs. In Crore)
57906149
7187
5941
3763
3000
3500
4000
4500
5000
5500
6000
6500
7000
7500
Net Export (Rs. In Crore)
55

Polymers
Installed Capacity-Production
It is observed that installed capacity and production of Polymers shown increasing with
the CAGR of 6.1% and 7.3% respectively during 2016-17 to 2020-21.
Quantity Imported-Quantity Exported of Polymers
The imported quantities of Polymers shown decreasing trend and its Export increased
with CAGR of 13.0% during the period 2016-17 to 2020-21.
Year Installed Capacity
(In ‘000 MT)
Production (In ‘000 MT)
2016-17 10110 9163
2017-18 10112 9276
2018-19 10115 10040
2019-20 12754 12404
2020-21 12799 12144
CAGR (%) 6.1 7.3
Year Import (In ‘000 MT)
Export (In ‘000 MT)
2016-17 4452 912
2017-18 4751 1188
2018-19 4479 1934
2019-20 3430 1615
2020-21 2641 1489
CAGR (%) -12.2 13.0
0
2000
4000
6000
8000
10000
12000
14000
10110 10112 10115
12754 12799
91639276 10040
1240412144
Installed Capacity Production
0500
100015002000250030003500400045005000 4452
47514479
3430
2641
9121188
19341615 1489
Import (Qty) Export (Qty)
56

Polymers
Value of Import- Value of Export
Even though the Import values of Polymers always was being higher than its Export
values, the gap between them decreased significantly from 2016-17 to 2020-21.
.
Net Import of Polymers
India is a net importer of Polymers. However, the trend of net Import was significantly
decreased during the period 2016-17 to 2020-21.
Year Import (Rs. In Crore)
Export (Rs. In Crore)
2016-17 32672 6674
2017-18 35493 8918
2018-19 36848 15584
2019-20 26394 10953
2020-21 21423 9681
CAGR (%) -10.0 9.7
Year Net Import (Rs. In Crore)
2016-17 25998
2017-18 26575
2018-19 21264
2019-20 15440
2020-21 11742
CAGR (%) -18.0
0
5000
10000
15000
20000
25000
30000
35000
4000032672
35493 36848
26394
21423
66748918
15584
10953 9681
Import (Rs. In Crore) Export (Rs. In Crore)
25998 26575
21264
15440
11742
10000
12000
14000
16000
18000
20000
22000
24000
26000
28000
Net Import (Rs. In Crore)
57

Synthetic Rubber
Installed Capacity-Production
Although the installed capacity of Synthetic Rubber was decreased with CAGR of 1.2%,
its production was increased with the CAGR of 5.5%.
Quantity Imported-Quantity Exported of Synthetic Rubber
The imported quantities of Synthetic Rubber were significantly higher than its Export
during the period 2016-17 to 2020-21.
Year Installed Capacity
(In ‘000 MT)
Production (In ‘000 MT)
2016-17 425 285
2017-18 425 308
2018-19 425 351
2019-20 411 358
2020-21 406 353
CAGR (%) -1.2 5.5
Year Import (In ‘000 MT)
Export (In ‘000 MT)
2016-17 560 38
2017-18 608 52
2018-19 619 64
2019-20 575 74
2020-21 747 95
CAGR (%) 7.5 25.6
0
50
100
150
200
250
300
350
400
450425 425 425 411 406
285308
351 358 353
Installed Capacity Production
0
100
200
300
400
500
600
700
800
560608 619
575
747
38 52 64 74 95
Import (Qty) Export (Qty)
58

Synthetic Rubber
Value of Import- Value of Export
The Import values of Synthetic Rubber were significantly higher than its Export during the
period 2016-17 to 2020-21.
Net Import of Synthetic Rubber
The net Imports of Synthetic Rubber increased from 2016-17 to 2018-19, but it was
significantly declined again in 2019-20.
Year Import (Rs. In Crore)
Export (Rs. In Crore)
2016-17 6280 464
2017-18 7418 546
2018-19 8514 707
2019-20 7095 731
2020-21 7189 794
CAGR (%) 3.4 14.4
Year Net Import (Rs. In Crore)
2016-17 5817
2017-18 6872
2018-19 7807
2019-20 6365
2020-21 6394
CAGR (%) 2.4
0
1000
2000
3000
4000
5000
6000
7000
8000
9000
6280
7418
8514
7095 7189
464 546 707 731 794
Import (Rs. In Crore) Export (Rs. In Crore)
5817
6872
7807
6365 6394
5500
6000
6500
7000
7500
8000
Net Import (Rs. In Crore)
59

Synthetic Detergent Intermediates
Installed Capacity-Production
The average production of Synthetic Detergent Intermediates was more than its installed
capacity during 2016-17 to 2020-21.
Quantity Imported-Quantity Exported of Synthetic Detergent Intermediates
The imported quantities of Synthetic Detergent Intermediates was significantly higher
than its Export during the period 2016-17 to 2020-21.
Year Installed Capacity
(In ‘000 MT)
Production (In ‘000 MT)
2016-17 687 664
2017-18 687 743
2018-19 687 687
2019-20 680 715
2020-21 680 736
CAGR (%) -0.3 2.6
Year Import (In ‘000 MT)
Export (In ‘000 MT)
2016-17 228 7
2017-18 206 1
2018-19 227 1
2019-20 264 1
2020-21 265 2
CAGR (%) 3.8 -28.2
620
640
660
680
700
720
740
760
687 687 687 680 680
664
743
687
715
736
Installed Capacity Production
0
50
100
150
200
250
300
228206
227
264 265
7 1 1 1 2
Import (Qty) Export (Qty)
60

Synthetic Detergent Intermediates
Value of Import- Value of Export
The Import values of Synthetic Detergent Intermediates were significantly higher than its
Export during the period 2016-17 to 2020-21.
Net Import of Synthetic Detergent Intermediates
The net Imports of Synthetic Detergent Intermediates increased with CAGR of 5.5%
during 2016-17 to 2018-19.
Year Import (Rs. In Crore)
Export (Rs. In Crore)
2016-17 1790 59
2017-18 1645 15
2018-19 2104 15
2019-20 2374 15
2020-21 2163 19
CAGR (%) 4.8 -24.4
Year Net Import (Rs. In Crore)
2016-17 1731
2017-18 1631
2018-19 2089
2019-20 2359
2020-21 2143
CAGR (%) 5.5
0
500
1000
1500
2000
2500
17901645
2104
23742163
59 15 15 15 19
Import (Rs. In Crore) Export (Rs. In Crore)
1731
1631
2089
2359
2143
1400
1600
1800
2000
2200
2400
2600
2016-17 2017-18 2018-19 2019-20 2020-21
Net Import (Rs. In Crore)
61

Performance Plastic
Installed Capacity-Production
It is observed that installed capacity of Performance Plastic increased gradually and its
production decreased with CAGR of 4.1% during the period 2016-17 to 2020-21.
Quantity Imported-Quantity Exported of Performance Plastic
The exported quantities of Performance Plastic were higher than its Import during the
period 2016-17 to 2019-20. However, the Export quantity was lower than Import in the year
2020-21.
Year Installed Capacity
(In ‘000 MT)
Production (In ‘000 MT)
2016-17 2945 1799
2017-18 2947 1719
2018-19 2963 1589
2019-20 2919 1672
2020-21 3046 1520
CAGR (%) 0.9 -4.1
Year Import (In ‘000 MT)
Export (In ‘000 MT)
2016-17 417 973
2017-18 583 1051
2018-19 684 1080
2019-20 741 969
2020-21 299 217
CAGR (%) -8.0 -31.3
0
500
1000
1500
2000
2500
3000
35002945 2947 2963 2919 3046
1799 1719 1589 16721520
Installed Capacity Production
0
200
400
600
800
1000
1200
417
583684
741
299
9731051 1080
969
217
Import (Qty) Export (Qty)
62

Performance Plastic
Value of Import- Value of Export
The import and Export values of Performance Plastic were significantly increased during
the year 2016-17 to 2018-19. Whereas, they were significantly further decreased in the years
2019-20 and 2020-21.
Net Import of Performance Plastic
It is observed that India was net exporter of Performance Plastic during 2016-17 to 2018-
19 and becomes net importer during 2019-20 and 2020-21.
Year Import (Rs. In Crore)
Export (Rs. In Crore)
2016-17 4723 6365
2017-18 6210 7473
2018-19 8917 10188
2019-20 7825 7390
2020-21 2938 1987
CAGR (%) -11.2 -25.2
Year Net Import (Rs. In Crore)
2016-17 -1642
2017-18 -1262
2018-19 -1271
2019-20 435
2020-21 951
0
2000
4000
6000
8000
10000
12000
4723
6210
89177825
2938
63657473
10188
7390
1987
Import (Rs. In Crore) Export (Rs. In Crore)
-1642
-1262 -1271
435
951
-2000
-1500
-1000
-500
0
500
1000
1500
2016-172017-182018-192019-202020-21
Net Import (Rs. In Crore)
63

Fibre Intermediates
Installed Capacity-Production
The installed capacity and production of Fibre Intermediates was increased with CAGR
of 5.3% and 2.5% respectively during the period 2016-17 to 2020-21.
Quantity Imported-Quantity Exported of Fibre Intermediates
The Import quantities of Fibre Intermediates were significantly higher than its Export
during the period 2016-17 to 2020-21. However, the Import was decreased with CGAR of 6.0%
and Export was increased with CGAR of 10.1% during 2016-17 to 2020-21.
Year Installed Capacity
(In ‘000 MT)
Production (In ‘000 MT)
2016-17 5067 4588
2017-18 5187 4711
2018-19 5187 4657
2019-20 5885 5359
2020-21 6228 5059
CAGR (%) 5.3 2.5
Year Import (In ‘000 MT)
Export (In ‘000 MT)
2016-17 1842 323
2017-18 1808 351
2018-19 1455 457
2019-20 1920 234
2020-21 1441 475
CAGR (%) -6.0 10.1
0
1000
2000
3000
4000
5000
6000
7000
5067 5187 5187
58856228
45884711
4657
53595059
Installed Capacity Production
0200400600800
100012001400160018002000 1842 1808
1455
1920
1441
323 351457
234
475
Import (Qty) Export (Qty)
64

Fibre Intermediates
Value of Import- Value of Export
In the Import value of Fibre Intermediates no specific trend was seen during the year
2016-17 to 2018-19. Whereas, it was significantly decreased during 2020-21. The mix trend was
seen in Export during 2016-17 to 2020-21.
Net Import of Fibre Intermediates
India is a net importer of Fibre Intermediates. Net Import of Fibre Intermediates was
decreased significantly to Rs. 4,866 crore in 2020-21 as compare to its earlier four years which
was highest to Rs. 9,359 crore in 2019-20.
Year Import (Rs. In Crore)
Export (Rs. In Crore)
2016-17 9431 1536
2017-18 10723 1811
2018-19 10569 2759
2019-20 10595 1236
2020-21 6495 1629
CAGR (%) -8.9 1.5
Year Net Import (Rs. In Crore)
2016-17 7896
2017-18 8913
2018-19 7810
2019-20 9359
2020-21 4866
CAGR (%) -11.4
0
2000
4000
6000
8000
10000
12000
9431
10723 10569 10595
6495
1536 18112759
1236 1629
Import (Rs. In Crore) Export (Rs. In Crore)
7896
8913
7810
9359
4866
4000
5000
6000
7000
8000
9000
10000
Net Import (Rs. In Crore)
65

Olefins
Installed Capacity-Production
The installed capacity and production of Olefins was increased with CAGR of 7.4% and
8.2% respectively during the period 2016-17 to 2020-21.
Quantity Imported-Quantity Exported of Olefins
It is observed that the Export quantities of Olefins were significantly its Import during the
period 2016-17 to 2020-21. The Exports were increased with a CAGR of 24.8% during 2016-17
to 2020-21.
Year Installed Capacity
(In ‘000 MT)
Production (In ‘000 MT)
2016-17 9683 8794
2017-18 9683 9013
2018-19 9683 8857
2019-20 12890 11835
2020-21 12890 12039
CAGR (%) 7.4 8.2
Year Import (In ‘000 MT)
Export (In ‘000 MT)
2016-17 83 117
2017-18 51 261
2018-19 70 369
2019-20 76 336
2020-21 44 285
CAGR (%) -14.8 24.8
0
2000
4000
6000
8000
10000
12000
14000
9683 96839683
12890 12890
8794 9013 8857
11835 12039
Installed Capacity Production
0
50
100
150
200
250
300
350
400
8351
70 7644
117
261
369336
285
Import (Qty) Export (Qty)
66

Olefins
Value of Import- Value of Export
The Export values of Olefins were significantly increased during the year 2016-17 to
2018-19. Whereas, it was decreased during the period 2018-19 and further went down in 2020-
21. The Export values of Olefins increased with CAGR of 7.5% during 2016-17 to 2020-21.
Net Import of Olefins
The net Exports of Olefins were significantly increased during the year 2016-17 to 2018-
19. Whereas, it was decreased during the period 2018-19 to 2020-21 from this earlier years.
Year Import (Rs. In Crore)
Export (Rs. In Crore)
2016-17 607 1017
2017-18 433 1798
2018-19 578 2767
2019-20 510 1881
2020-21 340 1361
CAGR (%) -13.5 7.5
Year Net Import (Rs. In Crore)
2016-17 411
2017-18 1365
2018-19 2189
2019-20 1371
2020-21 1021
CAGR (%) 25.6
0
500
1000
1500
2000
2500
3000
607433
578 510340
1017
1798
2767
1881
1361
Import (Rs. In Crore) Export (Rs. In Crore)
411
1365
2189
1371
1021
0
500
1000
1500
2000
2500
Net Export (Rs. In Crore)
67

Aromatics
Installed Capacity-Production
It is observed that installed capacity and production of Aromatics had not shown any
specific trend during 2016-17 to 2020-21. The actual productions were always lower than the
installed capacity during the same period.
Quantity Imported-Quantity Exported of Aromatics
The Export quantity of Aromatics was significantly increased with CAGR of 27.8%.
Whereas, its Import decreased with CAGR of 5.3% during the period 2016-17 to 2020-21.
Year Installed Capacity
(In ‘000 MT)
Production (In ‘000 MT)
2016-17 6305 5361
2017-18 6305 5339
2018-19 6305 5543
2019-20 6460 4925
2020-21 7404 4805
CAGR (%) 4.1 -2.7
Year Import (In ‘000 MT)
Export (In ‘000 MT)
2016-17 1615 1749
2017-18 1321 3303
2018-19 1320 4551
2019-20 1328 4271
2020-21 1300 4661
CAGR (%) -5.3 27.8
0
1000
2000
3000
4000
5000
6000
7000
8000
6305 6305 6305 6460
7404
5361 5339 55434925 4805
Installed Capacity Production
0500
100015002000250030003500400045005000
1615 1321 1320 1328 1300
1749
3303
45514271
4661
Import (Qty) Export (Qty)
68

Aromatics
Value of Import- Value of Export
The Export value of Aromatics was significantly increased with CAGR of 20.3%.
Whereas, its Import decreased with CAGR of 11.0% during the period 2016-17 to 2020-21.
Net Import of Aromatics
The net Export of Aromatics was significantly increased during the year 2016-17 to 2018-
19. Whereas, it was decreased in 2019-20 and further went down in 2020-21.
Year Import (Rs. In Crore)
Export (Rs. In Crore)
2016-17 8648 8851
2017-18 7085 17550
2018-19 9102 28803
2019-20 7728 23374
2020-21 5421 18547
CAGR (%) -11.0 20.3
Year Net Export (Rs. In Crore)
2016-17 203
2017-18 10465
2018-19 19701
2019-20 15646
2020-21 13126
CAGR (%) 183.6
0
5000
10000
15000
20000
25000
30000
8648
7085
91027728
5421
8851
17550
28803
23374
18547
Import (Rs. In Crore) Export (Rs. In Crore)
203
10465
19701
15646
13126
0
5000
10000
15000
20000
25000
Net Export (Rs. In Crore)
69

Other Petro-based Chemicals
Installed Capacity-Production
It is observed that the actual production of Other Petro-based Chemicals was always
lower than the installed capacity during 2016-17 to 2020-21. The highest production was seen
in the year 2019-20.
Quantity Imported-Quantity Exported of Other Petro-based Chemicals
The Import quantity of Other Petro-based Chemicals was significantly higher than its
Import during the period 2016-17 to 2020-21.
Year Installed Capacity
(In ‘000 MT)
Production (In ‘000 MT)
2016-17 2273 2174
2017-18 2271 2080
2018-19 2271 2192
2019-20 2413 2364
2020-21 2458 2314
CAGR (%) 2.0 1.6
Year Import (In ‘000 MT)
Export (In ‘000 MT)
2016-17 2651 144
2017-18 3255 193
2018-19 3227 147
2019-20 3543 238
2020-21 3069 171
CAGR (%) 3.7 4.4
1800
1900
2000
2100
2200
2300
2400
2500
2273 2271 2271
24132458
2174
2080
2192
23642314
Installed Capacity Production
0
500
1000
1500
2000
2500
3000
3500
4000
2651
3255 32273543
3069
144 193 147 238 171
Import (Qty) Export (Qty)
70

Other Petro-based Chemicals
Value of Import- Value of Export
The Import values of Other Petro-based Chemicals were significantly higher than its
Import during the period 2016-17 to 2020-21. The maximum Import of Other Petro-based
Chemicals was seen in the year 2018-19.
Net Import of Other Petro-based Chemicals
The net Import of Other Petro-based Chemicals was significantly increased during the years
2016-17 to 2018-19. Whereas, it was decreased in 2019-20 and further went down in the year
2020-21.
Year Import (Rs. In Crore)
Export (Rs. In Crore)
2016-17 17649 1168
2017-18 22321 1386
2018-19 27092 1398
2019-20 23883 1949
2020-21 21521 1691
CAGR (%) 5.1 9.7
Year Net Import (Rs. In Crore)
2016-17 16482
2017-18 20935
2018-19 25695
2019-20 21934
2020-21 19829
CAGR (%) 4.7
0
5000
10000
15000
20000
25000
30000
17649
22321
2709223883
21521
1168 1386 1398 1949 1691
Import (Rs. In Crore) Export (Rs. In Crore)
16482
20935
25695
21934
19829
15000
17000
19000
21000
23000
25000
27000
Net Import (Rs. In Crore)
71

Total Major Petrochemical
Installed Capacity-Production
The installed capacity and production of Total Major Petrochemical were increased with
CAGR of 4.8% and 3.7% respectively during the period 2016-17 to 2020-21.
Quantity Imported-Quantity Exported of Total Major Petrochemical
The Export quantity of Total Major Petrochemical was significantly increased with CAGR
of 11.8%. Whereas, its Import decreased with CAGR of 4.2% during the period 2016-17 to 2020-
21.
Year Installed Capacity
(In ‘000 MT)
Production (In ‘000 MT)
2016-17 41888 36427
2017-18 41998 36813
2018-19 42077 37519
2019-20 48933 43524
2020-21 50439 42155
CAGR (%) 4.8 3.7
Year Import (In ‘000 MT)
Export (In ‘000 MT)
2016-17 12129 5290
2017-18 12843 7401
2018-19 12356 9619
2019-20 12222 8798
2020-21 10211 8274
CAGR (%) -4.2 11.8
0
10000
20000
30000
40000
50000
60000
41888 41998 42077
48933 50439
36427 36813 3751943524
42155
Installed Capacity Production
0
2000
4000
6000
8000
10000
12000
14000 1212912843 12356 12222
10211
5290
7401
96198798 8274
Import (Qty) Export (Qty)
72

Total Major Petrochemical
Value of Import- Value of Export
The Import and Export values of Total Major Petrochemical were significantly increased
during the period 2016-17 to 2018-19 and then both Import and Export were shown decreasing
trend during 2018-19 to 2020-21.
Net Import of Total Major Petrochemical
India is a net importer of Total Major Petrochemical during the period 2016-17 to 2020-21.
Whereas, the Import was showing decreasing trend during the same period.
Year Import (Rs. In Crore)
Export (Rs. In Crore)
2016-17 85231 35355
2017-18 94960 49276
2018-19 108259 73941
2019-20 91013 58079
2020-21 71596 43581
CAGR (%) -4.3 5.4
Year Net Import (Rs. In Crore)
2016-17 49877
2017-18 45684
2018-19 34318
2019-20 32934
2020-21 28015
CAGR (%) -13.4
49877
45684
3431832934
28015
25000
30000
35000
40000
45000
50000
55000
Net Import (Rs. In Crore)
0
20000
40000
60000
80000
100000
120000
8523194960
108259
91013
71596
35355
49276
73941
58079
43581
Import (Rs. In Crore) Export (Rs. In Crore)
73

9%
25%
1%
1%
6%
12%
26%
15%
5%
Share of different groups of Major Petrochemical in Installed Capacity during 2020-21
1. Synthetic Fibres / Yarn
2. Polymers
3. Synthetic Rubber
4. Synthetic Detergent Intermediate
5. Performance Plastics
6. Fibre Intermediates
7. Olefins
8. Aromatics
9. Other Petro-based Chemicals
7%
29%
1%
2%4%
12%
29%
11%
5%
Share of different groups of Major Petrochemical in Production during 2020-21
1. Synthetic Fibres / Yarn
2. Polymers
3. Synthetic Rubber
4. Synthetic Detergent Intermediate
5. Performance Plastics
6. Fibre Intermediates
7. Olefins
8. Aromatics
9. Other Petro-based Chemicals
74

4%
14%
26%
7%
3%3%
0%
13%
30%
Share of different groups of Major Petrochemicals under total Import (Qty.) during 2020-21
1. Synthetic Fibres / Yarn
2. Polymers
3. Synthetic Rubber
4. Synthetic Detergent Intermediate
5. Performance Plastics
6. Fibre Intermediates
7. Olefins
8. Aromatics
9. Other Petro-based Chemicals
6%9%
30%
10%
3%4%
0%
8%
30%
Share of different groups of Major Petrochemicals under total Import (Value) during 2020-21
1. Synthetic Fibres / Yarn
2. Polymers
3. Synthetic Rubber
4. Synthetic Detergent Intermediate
5. Performance Plastics
6. Fibre Intermediates
7. Olefins
8. Aromatics
9. Other Petro-based Chemicals
75

11%6%
18%
1%0%3%3%
56%
2%
Share of Groups under total Export (Qty.) of Major Petrochemicals during year 2020-21
1. Synthetic Fibres / Yarn
2. Polymers
3. Synthetic Rubber
4. Synthetic Detergent Intermediate
5. Performance Plastics
6. Fibre Intermediates
7. Olefins
8. Aromatics
9. Other Petro-based Chemicals
18%
4%
22%
2%0%
5%
3%
42%
4%
Share of Groups under total Export (Value) of Major Petrochemicals during year 2020-21
1. Synthetic Fibres / Yarn
2. Polymers
3. Synthetic Rubber
4. Synthetic Detergent Intermediate
5. Performance Plastics
6. Fibre Intermediates
7. Olefins
8. Aromatics
9. Other Petro-based Chemicals
76

Total Major Chemicals & Major Petrochemicals
Installed Capacity-Production
The installed capacity and production of Total Major Chemicals & Major Petrochemicals
was increased with CAGR of 4.5% and 3.4% respectively during the period 2016-17 to 2020-
21.
Quantity Imported-Quantity Exported of Total Major Chemicals & Major Petrochemicals
The Export quantity of Total Major Chemicals & Major Petrochemicals was significantly
increased with CAGR of 10.7%. Whereas, its Import decreased with CAGR of 2.0% during the
period 2016-17 to 2020-21.
Year Installed Capacity
(In ‘000 MT)
Production (In ‘000 MT)
2016-17 55344 46661
2017-18 55925 47882
2018-19 56189 49108
2019-20 64093 55467
2020-21 66039 53398
CAGR (%) 4.5 3.4
Year Import (In ‘000 MT)
Export (In ‘000 MT)
2016-17 17529 6773
2017-18 18780 8897
2018-19 18735 11198
2019-20 18780 10497
2020-21 16194 10179
CAGR (%) -2.0 10.7
0
10000
20000
30000
40000
50000
60000
70000
55344 55925 56189
64093 66039
46661 47882 4910855467 53398
Installed Capacity Production
02000400060008000
100001200014000160001800020000 17529
18780 18735 18780
16194
6773
8897
11198 10497 10179
Import (Qty) Export (Qty)
77

Total Major Chemicals & Major Petrochemicals
Value of Import- Value of Export
The Import and Export values of Total Major Chemicals & Major Petrochemicals were
increased from 2016-17 to 2018-19 and showing decreasing trend in 2018-19 to 2020-21.
Net Import of Total Major Chemicals & Major Petrochemicals
India is a net importer of Total Major Chemicals & Major Petrochemicals during the period
2016-17 to 2020-21. The net Import was significantly decreased with CAGR of 34.2%.
Year Import (Rs. In Crore)
Export (Rs. In Crore)
2016-17 105833 65419
2017-18 120902 83575
2018-19 139685 118457
2019-20 116673 105392
2020-21 99086 91516
CAGR (%) -1.6 8.8
Year Net Import (Rs. In Crore)
2016-17 40414
2017-18 37327
2018-19 21228
2019-20 11281
2020-21 7570
CAGR (%) -34.2
0
20000
40000
60000
80000
100000
120000
140000
105833
120902
139685116673
99086
65419
83575
118457
10539291516
Import (Rs. In Crore) Export (Rs. In Crore)
4041437327
21228
112817570
0
5000
10000
15000
20000
25000
30000
35000
40000
45000
Net Import (Rs. In Crore)
78

Section – I
Chemical Sector

Table 1: Performance of Selected Major Chemicals (Group-Wise) during 2013-14 to 2020-21 at a Glance (Figures in 000'MT)
GROUP 2013-14 2014-15 2015-16 2016-17 2017-18 2018-19 2019-20 2020-21 CAGR (%)
(1) (2) (3) (4) (5) (6) (7) (8) (9) (10)
1. Alkali Chemicals
Capacity 8075 8214 8422 8822 9274 9422 10089 10473 3.78
Production 6481 6625 6802 7009 7631 8043 8457 7776 2.64
Capacity Utilisation (%) 80 81 81 79 82 85 84 74
Imports 874 1134 1118 1121 1194 1049 1157 968 1.46
Exports 164 74 107 154 273 239 329 429 14.70
2. Inorganic Chemicals
Capacity 1228 1259 1316 1313 1315 1300 1538 1560 3.48
Production 906 944 1002 1053 1058 1064 1063 978 1.09
Capacity Utilisation (%) 74 75 76 80 81 82 69 63
Imports 874 912 1010 1010 1229 1580 1532 1188 4.48
Exports 167 164 157 378 173 177 196 195 2.20
3. Organic Chemicals
Capacity 2463 2537 2580 2529 2535 2575 2671 2664 1.13
Production 1792 1619 1589 1638 1799 1884 1847 1906 0.88
Capacity Utilisation (%) 73 64 62 65 71 73 69 72
Imports 2496 2886 3143 3170 3407 3645 3775 3716 5.85
Exports 335 241 232 190 205 233 245 296 -1.77
4. Pesticides (Tech.)
Capacity 297 302 307 322 325 324 334 371 3.26
Production 179 186 188 214 213 217 192 255 5.16
Capacity Utilisation (%) 60 62 61 66 65 67 58 69
Imports $ 37 41 34 43 44 49 43 66 8.62
Exports $ 207 230 267 342 358 405 398 471 12.46
5. Dyes & Pigments
Capacity 434 460 456 471 478 492 528 532 2.95
Production 284 285 304 320 367 382 384 327 2.08
Capacity Utilisation (%) 65 62 67 68 77 78 73 62
Imports 52 52 55 56 63 56 51 45 -2.02
Exports 347 353 376 419 486 525 530 514 5.81
Total Major Chemicals (1 to 5)
Capacity 12496 12772 13082 13456 13927 14112 15160 15601 3.22
Production 9643 9660 9884 10234 11069 11589 11943 11243 2.22
Capacity Utilisation (%) 77 76 76 76 79 82 79 72
Imports 4333 5025 5360 5400 5937 6379 6557 5983 4.72
Exports 1221 1061 1138 1484 1496 1579 1698 1905 6.57
Note : 1.Production and Installed Capacity data based on MPRs received from manufacturer of chemicals under large
and medium scale units only monitored by S&M Division of DCPC.
2. Data Source in respect of imports and exports is DGCIS, M/O Commerce and Industry.
3. $ Import and Export includes both technical and formulations.
79

Table 1A: Projection of Production, Installed Capacity, Export and Import of Selected Major Chemical (Group-wise) from the year 2021-22 to
2026-27
(Figures in 000'MT)
GROUP Actual Values Forecast Values
2015-16 2016-17 2017-18 2018-19 2019-20 2020-21 2021-22 2022-23 2023-24 2024-25 2025-26 2026-27
(1) (2) (3) (4) (5) (6) (7) (8) (9) (10) (11) (12) (13)
1. Alkali Chemicals
Capacity 8422 8822 9274 9422 10089 10473 10838 11254 11678 12140 12507 12932
Production 6802 7009 7631 8043 8457 7776 8583 8788 8885 9024 9222 9578
Capacity Utilisation (%) 81 79 82 85 84 74 79 78 76 73 73 73
Imports 1118 1121 1194 1049 1157 968 1022 979 927 908 852 846
Exports 107 154 273 239 329 429 466 526 582 662 717 772
2. Inorganic Chemicals
Capacity 1316 1313 1315 1300 1538 1560 1578 1664 1753 1831 1867 1947
Production 1002 1053 1058 1064 1063 978 1028 1004 986 969 958 958
Capacity Utilisation (%) 76 80 81 82 69 63 65 59 53 48 46 42
Imports 1010 1010 1229 1580 1532 1188 1539 1593 1579 1555 1632 1740
Exports 157 378 173 177 196 195 178 124 150 133 112 97
3. Organic Chemicals
Capacity 2580 2529 2535 2575 2671 2664 2681 2734 2774 2803 2826 2869
Production 1589 1638 1799 1884 1847 1906 2007 2060 2090 2143 2217 2270
Capacity Utilisation (%) 62 65 71 73 69 72 75 76 76 77 79 80
Imports 3143 3170 3407 3645 3775 3716 3968 4118 4218 4321 4457 4620
Exports 232 190 205 233 245 296 285 318 341 361 382 398
4. Pesticides (Tech.)
Capacity 307 322 325 324 334 371 366 378 392 408 419 427
Production 188 214 213 217 192 255 241 246 257 269 283 282
Capacity Utilisation (%) 61 66 65 67 58 69 66 65 65 66 68 66
Imports $ 34 43 44 49 43 66 63 68 74 80 87 89
Exports $ 267 342 358 405 398 471 497 522 559 592 632 658
5. Dyes & Pigments
Capacity 456 471 478 492 528 532 549 567 586 603 616 636
Production 304 320 367 382 384 327 380 378 369 367 371 383
Capacity Utilisation (%) 67 68 77 78 73 62 70 67 62 60 59 58
Imports 55 56 63 56 51 45 47 43 38 35 33 30
Exports 376 419 486 525 530 514 582 600 612 631 660 689
Total Major Chemicals (1 to 5)
Capacity 13082 13456 13927 14112 15160 15601 16012 16596 17184 17785 18236 18810
Production 9884 10234 11069 11589 11943 11243 12238 12476 12588 12772 13051 13470
Capacity Utilisation (%) 76 76 79 82 79 72 77 75 73 71 71 71
Imports 5360 5400 5937 6379 6557 5983 6639 6801 6835 6899 7062 7324
Exports 1138 1484 1496 1579 1698 1905 2006 2091 2242 2379 2504 2614
Note : 1.Production and Installed Capacity data based on MPRs received from manufacturer under large and medium scale units only
2. Data Source in respect of imports and exports is DGCIS, M/o Commerce and Industry.
3. $ Import and Export includes both technical and formulations.
4. Projected figures have been calculated by using Forecast formula in MS Excel.
80

Table 2: Production, Installed Capacity & Growth Over its Previous Year of Selected Major Chemicals (Group-wise) during 2013-14 to 2020-21
(Figures in 000'MT)
Group Installed Capacity
Production / Growth Rate
2013-14
2014-15
2015-16
2016-17
2017-18
2018-19
2019-20
2020-21 2018-19 2019-20 2020-21
(1) (2) (3) (4) (5) (6) (7) (8) (9) (10) (11) (12) (13)
Alkali Chemicals
9422
10089
10473 Production 6481 6625 6802 7009 7631 8043 8457 7776
Growth Rate (%) -0.09 2.22 2.67 3.04 8.89 5.39 5.15 -8.04
Inorganic Chemicals
1300
1538
1560 Production 906 944 1002 1053 1058 1064 1063 978
Growth Rate (%) 1.70 4.18 6.08 5.13 0.53 0.51 -0.03 -8.06
Organic Chemicals
2575
2671
2664 Production 1792 1619 1589 1638 1799 1884 1847 1906
Growth Rate (%) 6.28 -9.67 -1.87 3.12 9.79 4.76 -2.01 3.23
Pesticides
324
334
371 Production 179 186 188 214 213 217 192 255
Growth Rate (%) 15.41 3.95 0.57 13.97 -0.48 1.88 -11.33 32.76
Dyes & Pigments
492
528
532 Production 284 285 304 320 367 382 384 327
Growth Rate (%) 18.40 0.58 6.68 5.26 14.67 3.88 0.71 -14.77
Note: Production and Installed Capacity data based on MPRs received from manufacturer of chemicals under large and medium scale units only monitored by
S&M Division of DCPC.
81

Table 3: Production, Capacity Utilization & growth of Major Chemicals (Product-wise) during 2013-14 to 2020-21
(Figures in 000'MT)
Major Groups / Products
Installed Capacity Production CAGR (%)
Capacity
Utilization
in 2020-21 2018-19 2019-20 2020-21 2013-14 2014-15 2015-16 2016-17 2017-18 2018-19 2019-20 2020-21
(1) (2) (3) (4) (5) (6) (7) (8) (9) (10) (11) (12) (13) (14)
Alkali Chemicals
SODA ASH 3489.00 3614.00 3614.00 2392.17 2462.00 2583.01 2613.42 2989.57 3048.19 3069.43 2638.12 1.41 73.00
CAUSTIC SODA 3397.34 3700.34 3898.20 2391.66 2442.89 2503.96 2594.50 2742.31 2925.35 3136.94 2964.08 3.11 76.04
LIQUID CHLORINE 2535.25 2774.73 2961.23 1697.33 1720.10 1714.82 1800.67 1899.41 2069.11 2250.43 2174.26 3.60 73.42
Total 9421.59 10089.07 10473.43 6481.15 6624.99 6801.78 7008.58 7631.30 8042.65 8456.80 7776.46 2.64 74.25
Inorganic Chemicals
ALUMINIUM FLUORIDE 25.60 25.60 25.60 5.40 6.73 9.51 8.14 7.51 5.70 5.05 3.70 -5.26 14.45
CALCIUM CARBIDE 112.00 112.00 112.00 78.78 87.18 83.47 85.02 87.30 83.17 81.34 86.78 1.39 77.48
CARBON BLACK 696.00 696.00 696.00 406.41 444.35 469.56 535.27 530.36 546.39 500.15 384.78 -0.78 55.28
POTASSIUM CHLORATE 4.60 28.60 28.60 0.68 0.45 0.41 0.01 0.35 0.70 16.18 17.08 58.62 59.72
SODIUM CHLORATE 0.00 0.00 22.32 0.00 0.00 0.00 0.00 0.00 0.00 0.00 17.92 80.27
TITANIUM DIOXIDE 82.50 82.50 82.50 52.78 47.88 58.53 58.46 57.82 57.06 49.49 51.22 -0.43 62.09
RED PHOSPHORUS 1.68 1.68 1.68 0.75 0.89 0.84 0.77 0.88 1.03 1.03 1.07 5.13 63.45
HYDROGEN PEROXIDE 145.85 218.63 218.63 128.37 119.75 153.08 148.87 157.02 156.45 122.84 139.90 1.24 63.99
POTASSIUM IODATE 0.00 1.20 1.20 0.00 0.00 0.00 0.00 0.00 0.00 0.56 0.54 45.17
CALCIUM CARBONATE 231.55 371.55 371.55 233.12 236.93 226.13 216.33 217.25 213.33 286.83 274.79 2.38 73.96
Total 1299.78 1537.75 1560.07 906.27 944.15 1001.53 1052.87 1058.48 1063.83 1063.47 977.78 1.09 62.68
Organic Chemicals
ACETIC ACID 141.62 142.05 142.05 157.17 159.61 157.91 158.51 157.07 153.80 167.86 154.76 -0.22 108.95
ACETIC ANHYDRIDE 113.33 119.18 119.18 80.85 93.84 92.99 94.82 97.09 95.47 74.15 75.09 -1.05 63.01
ACETONE 47.14 47.14 47.14 28.58 25.98 24.96 26.79 32.87 40.74 36.27 39.03 4.55 82.80
PHENOL 76.75 76.75 76.75 46.39 42.26 40.42 43.57 53.45 65.39 57.85 61.27 4.06 79.83
METHANOL 474.30 474.30 474.30 307.26 209.83 162.62 176.96 260.49 271.93 176.05 234.03 -3.81 49.34
FORMALDEHYDE 411.30 411.30 397.80 268.29 255.95 242.09 244.19 248.23 226.61 260.41 244.66 -1.31 61.50
NITROBENZENE 112.05 129.45 126.45 76.51 69.72 68.37 69.71 71.41 68.80 61.14 76.09 -0.08 60.18
MALEIC ANHYDRIDE 6.40 7.66 7.66 2.92 3.20 3.54 3.53 3.31 4.56 5.02 5.38 9.15 70.26
PENTAERYTHRITOL 15.76 15.76 15.76 12.18 13.46 13.97 14.01 14.10 14.99 15.21 11.65 -0.63 73.93
ANILINE 54.10 54.10 54.10 40.62 34.47 39.40 41.45 41.88 37.85 25.44 33.53 -2.70 61.98
CHLORO METHANES 279.25 279.25 279.25 214.03 220.71 220.18 221.51 222.43 285.53 296.91 326.95 6.24 117.08
ISOBUTYLBENZENE 13.80 16.80 16.80 6.08 4.30 7.24 6.92 8.95 9.70 9.44 12.72 11.13 75.71
ONCB 30.00 30.00 30.00 16.82 16.13 19.26 22.55 24.90 23.70 19.84 23.27 4.75 77.56
PNCB 48.40 48.40 48.40 27.06 26.96 31.27 34.19 37.78 36.07 31.90 38.89 5.32 80.34
MEK 10.00 10.00 10.00 3.72 4.02 5.75 6.54 6.40 7.00 9.83 8.00 11.57 80.01
ACETALDEHYDE 151.01 151.01 151.01 79.66 67.77 58.96 60.46 65.74 61.89 77.10 55.97 -4.92 37.06
ETHANOLAMINES 17.76 17.76 27.00 11.20 13.76 13.25 13.11 13.20 16.70 15.39 16.70 5.88 61.86
82

Table 3: Production, Capacity Utilization & growth of Major Chemicals (Product-wise) during 2013-14 to 2020-21
(Figures in 000'MT)
Major Groups / Products
Installed Capacity Production CAGR (%)
Capacity
Utilization
in 2020-21 2018-19 2019-20 2020-21 2013-14 2014-15 2015-16 2016-17 2017-18 2018-19 2019-20 2020-21
(1) (2) (3) (4) (5) (6) (7) (8) (9) (10) (11) (12) (13) (14)
ETHYL ACETATE 517.83 562.06 562.06 382.39 327.94 360.40 371.27 411.49 440.56 473.39 453.13 2.45 80.62
MENTHOL 33.65 33.65 33.65 18.34 17.45 14.73 14.54 13.68 6.24 7.44 7.48 -12.02 22.23
ORTHO NITRO TOLUENE 20.69 44.80 44.80 12.31 11.74 11.52 13.80 14.39 16.89 25.98 27.67 12.27 61.77
Total 2575.12 2671.41 2664.15 1792.34 1619.11 1588.83 1638.44 1798.85 1884.42 1846.62 1906.27 0.88 71.55
Pesticides and Insecticides
D.D.T. 3.14 6.34 6.34 2.79 3.63 2.09 2.26 1.27 1.37 1.10 0.57 -20.31 8.97
MALATHION 3.20 3.80 3.80 2.04 2.24 2.04 2.26 3.29 4.39 3.79 3.84 9.47 101.00
DIMETHOATE 1.45 1.45 1.45 1.36 1.43 1.44 1.37 1.18 1.26 1.45 1.45 0.91 100.14
D.D.V.P. 33.62 33.62 33.62 5.52 6.66 7.22 8.13 8.13 9.14 0.00 0.94 -22.39 2.78
QUINALPHOS 2.20 2.20 3.40 1.74 1.88 0.84 1.29 1.18 0.89 0.86 1.06 -6.89 31.06
MONOCROTOPHOS 13.84 13.94 13.94 4.27 6.97 5.48 6.58 5.50 5.30 5.82 7.92 9.23 56.79
PHOSPHAMIDON 2.00 2.00 2.00 0.05 0.13 0.13 0.09 0.11 0.00 0.00 0.00 -100.00 0.00
PHORATE 12.40 12.40 12.40 6.85 6.62 5.92 5.91 7.02 5.85 0.00 0.00 -100.00 0.00
ETHION 2.20 2.80 2.80 1.51 1.60 1.72 2.11 2.38 1.32 2.13 2.22 5.62 79.29
FENVALERATE 3.60 4.96 4.96 0.75 0.51 0.56 0.53 0.74 0.70 0.67 0.49 -5.84 -241.57
CYPERMETHRIN 25.10 23.83 23.83 9.26 8.59 8.53 7.88 8.25 10.95 10.87 12.29 4.12 51.59
ACEPHATE 17.50 20.50 20.50 14.51 17.97 16.58 16.27 18.27 19.63 21.08 29.59 10.72 144.33
CHLORPYRIPHOS 18.08 13.60 13.80 9.54 9.73 6.87 5.87 7.98 7.14 6.50 8.53 -1.59 61.80
TRIAZOPHOS 3.36 3.36 3.36 0.99 1.00 1.72 2.37 1.54 0.89 0.00 0.00 -100.00 0.00
TEMEPHOS 0.25 0.25 0.25 0.25 0.00 0.08 0.08 0.10 0.08 0.15 0.15 -7.22 59.20
DELTAMETHRIN 0.73 0.79 0.79 0.52 0.51 0.38 0.37 0.55 0.68 0.69 0.59 1.93 74.68
ALPHAMETHRIN 0.49 0.48 0.50 0.56 0.75 0.23 0.10 0.32 0.34 0.44 0.54 -0.67 107.20
PROFENOFOS TECHNICAL 10.50 10.50 10.50 7.18 7.58 6.85 10.50 9.95 12.45 12.36 16.08 12.21 153.14
PRETILACHLOR TECHNICAL 4.24 4.24 4.24 2.22 1.88 1.94 2.58 3.60 3.63 3.07 3.59 7.12 84.60
LAMBDA CYHALOTHRIN 2.60 2.85 3.20 0.55 0.47 0.42 0.74 1.14 0.62 2.30 1.68 17.42 52.41
PHENTHOATE 0.90 0.90 0.90 1.24 1.40 1.11 1.14 1.32 1.53 1.41 1.35 1.19 149.89
PERMETHRIN TECH 1.67 1.80 1.80 1.39 1.70 1.30 1.10 1.53 1.86 1.22 1.66 2.53 92.00
IMIDACALOPRID TECH 0.20 0.15 0.15 0.94 0.56 0.20 0.18 0.34 0.10 0.02 0.03 -39.19 19.33
CAPTAN & CAPTAFOL 3.43 3.43 3.43 1.12 2.38 2.12 1.79 1.76 1.93 1.46 1.46 3.92 42.65
ZIRAM(THIO BARBAMATE) 0.70 0.70 0.70 0.60 0.58 0.51 0.60 0.72 0.76 0.63 0.88 5.72 126.40
CARBENDZIM(BAVISTIN) 0.98 0.78 0.78 0.31 0.36 0.24 0.13 0.03 0.02 0.00 0.00 -100.00 0.00
MANCOZAB 84.70 84.70 119.80 57.82 61.40 66.38 78.48 70.25 69.33 60.88 97.43 7.74 81.33
HEXACONAZOLE 1.20 1.70 1.70 0.58 0.59 0.62 0.46 0.59 0.50 0.75 0.81 4.97 47.59
METCONAZOLE 0.75 0.75 0.75 0.70 0.61 0.39 0.35 0.40 0.34 0.21 0.20 -16.42 26.67
2, 4-D 27.00 27.00 27.00 17.90 11.62 18.46 23.36 25.83 24.24 22.56 27.05 6.07 100.19
83

Table 3: Production, Capacity Utilization & growth of Major Chemicals (Product-wise) during 2013-14 to 2020-21
(Figures in 000'MT)
Major Groups / Products
Installed Capacity Production CAGR (%)
Capacity
Utilization
in 2020-21 2018-19 2019-20 2020-21 2013-14 2014-15 2015-16 2016-17 2017-18 2018-19 2019-20 2020-21
(1) (2) (3) (4) (5) (6) (7) (8) (9) (10) (11) (12) (13) (14)
BUTACHLOR 0.50 0.50 0.50 0.04 0.00 0.00 0.00 0.00 0.00 0.00 0.00 -100.00 0.00
ETHOFUMESATE TECHNICAL 1.43 1.65 1.65 1.01 0.62 0.50 1.04 1.29 1.04 0.79 0.43 -11.45 26.24
THIAMETHOXAM TECHNICAL 3.75 4.55 5.10 3.31 1.66 1.92 2.51 3.28 5.57 6.15 5.21 6.69 102.18
PENDIMETHALIN 4.70 6.00 5.80 1.71 2.26 2.82 4.04 3.78 2.82 2.75 3.64 11.42 62.74
METRIBUZIN 1.35 1.95 2.52 0.74 0.52 0.91 1.12 0.88 1.92 2.65 3.19 23.17 126.73
TRICLOPYR ACID TECH 0.30 0.30 0.30 0.20 0.19 0.30 0.28 0.15 0.13 0.13 0.00 -100.00 0.00
ISOPROTURON 6.25 6.00 6.00 2.35 2.43 1.95 0.13 0.00 0.00 0.00 0.00 -100.00 0.00
GLYPHOSATE 12.87 12.92 12.92 8.48 9.69 6.96 6.35 6.29 6.68 5.91 6.13 -4.53 47.44
DIURON 3.72 6.00 6.00 0.07 0.12 1.26 3.68 3.26 3.62 3.40 3.42 74.67 57.05
ATRAZIN 0.50 1.20 1.20 1.24 1.20 1.21 1.90 2.25 1.48 1.73 1.61 3.85 134.25
ZINC PHOSPHIDE 1.92 1.92 1.92 0.65 1.29 1.50 1.31 1.40 1.26 1.32 1.47 12.42 76.46
ALUMINIUM PHOSPHIDE 4.74 4.74 4.74 4.47 5.05 5.75 6.40 4.77 4.91 4.91 7.61 7.91 160.63
DICOFOL 0.10 0.15 0.15 0.07 0.11 0.09 0.09 0.08 0.05 0.01 0.00 -100.00 0.00
Total 324.16 333.69 371.48 179.38 186.47 187.52 213.72 212.70 216.70 192.15 255.09 5.16 68.67
Dyes and Pigments
AZO DYES 21.14 21.14 21.14 13.46 10.59 9.82 9.98 11.04 9.05 8.54 6.62 -9.64 31.34
ACID DIRECT DYES(OTHER THAN AZO) 40.90 40.90 40.90 19.00 17.23 20.57 19.86 21.15 24.13 22.75 20.22 0.89 49.45
DISPERSE DYES 67.21 75.01 77.93 29.21 29.56 43.57 41.35 46.72 55.24 61.94 51.79 8.53 66.46
FAST COLOUR BASES 0.00 0.00 0.00 0.01 0.01 0.00 0.00 0.00 0.00 0.00 0.00 -100.00
INGRAIN DYES 0.00 0.00 0.00 0.51 0.44 0.30 0.00 0.00 0.00 0.00 0.00 -100.00
OIL SOLUBLE (SOLVENT DYES) 3.60 3.60 3.60 2.26 1.80 2.20 2.23 2.07 2.29 2.41 0.44 -20.80 12.25
OPTICAL WHITENING AGENTS 41.16 67.68 67.68 23.74 22.94 24.70 23.77 23.21 29.30 20.74 18.18 -3.74 26.85
ORGANIC PIGMENT 87.04 88.36 88.36 68.67 76.89 61.31 63.74 73.34 73.94 75.08 67.27 -0.29 76.14
PIGMENT EMULSION 5.41 5.41 5.41 7.34 9.64 9.67 10.61 10.16 9.78 9.69 8.60 2.29 158.77
REACTIVE DYES 194.69 195.73 196.33 95.42 89.47 106.23 120.96 151.91 151.38 156.71 132.13 4.76 67.30
SULPHUR DYES (SULPHUR BLACK) 8.25 8.25 8.25 7.57 9.38 9.55 10.07 7.32 7.54 7.45 5.09 -5.49 61.77
VAT DYES 3.04 2.86 2.86 1.60 1.77 1.44 1.52 1.65 1.78 2.13 1.99 3.16 69.44
SOLUBILISED VAT DYES 0.13 0.13 0.13 0.02 0.03 0.03 0.02 0.02 0.00 0.00 0 -100.00 0.00
FOOD COLOURS 0.00 0.00 0.00 0.62 0.66 0.71 0.75 0.78 0.79 0.67 0.493 -3.24
NAPTHOLS 0.90 0.90 0.90 0.00 0.00 0.00 0.00 0.00 0.00 0.00 0.00 0.00
INORGANIC PIGMENTS 18.05 18.05 18.05 14.18 14.82 14.19 15.41 17.88 16.29 16.12 14.64 0.46 81.07
Total 491.52 528.02 531.54 283.60 285.23 304.28 320.27 367.25 381.51 384.22 327.46 2.08 61.61
Total (All Group) 14112.17 15159.94 15600.67 9642.75 9659.94 9883.95 10233.88 11068.57 11589.11 11943.25 11243.05 2.22 72.07
Note: Production and Installed Capacity data based on MPRs received from manufacturer under large and medium scale units only monitored by S&M Division of DCPC.
84

Table 4: Installed Capacities of Selected Chemicals ( Group-Wise) from 2013-14 to 2020-21
(Figures in 000'MT)
GROUP / PRODUCT 2013-14 2014-15 2015-16 2016-17 2017-18 2018-19 2019-20 2020-21
(1) (2) (3) (4) (5) (6) (7) (8) (9)
1. Alkali Chemicals 8075 8214 8422 8822 9274 9422 10089 10473
2. Inorganic Chemicals 1228 1259 1316 1313 1315 1300 1538 1560
3. Organic Chemicals 2463 2537 2580 2529 2535 2575 2671 2664
4. Pesticides (Tech.) 297 302 307 322 325 324 334 371
5. Dyes & Pigments 434 460 456 471 478 492 528 532
TOTAL MAJOR CHEMICALS 12496 12772 13082 13456 13927 14112 15160 15601
Note: Installed Capacity data based on MPRs received from manufacturer of chemicals under large and medium scale units only monitored by S&M
Division of DCPC.
85

Table 5: Consumption of Selected Major Chemicals (Product-Wise) during 2013-14 to 2020-21
(Figures in 000'MT)
PRODUCTS 2013-14 2014-15 2015-16 2016-17 2017-18 2018-19 2019-20 2020-21
(1) (2) (3) (4) (5) (6) (7) (8) (9)
Alkali Chemicals
SODA ASH 2877.33 3159.80 3197.66 3244.35 3652.11 3826.32 3779.39 3208.13
CAUSTIC SODA 2620.25 2808.67 2905.94 2935.48 3003.98 2961.45 3258.79 2936.76
LIQUID CHLORINE 1693.52 1717.03 1709.31 1795.64 1895.73 2064.68 2246.29 2170.53
Inorganic Chemicals
ALUMINIUM FLUORIDE 26.28 34.02 34.98 54.39 57.07 67.63 44.05 62.88
CALCIUM CARBIDE 142.75 165.10 145.04 140.22 142.48 128.17 112.19 119.32
CARBON BLACK 428.67 469.70 478.95 331.84 594.29 702.09 553.62 436.53
POTASSIUM CHLORATE 6.99 5.96 2.81 -1.55 -1.57 -2.19 13.06 15.39
SODIUM CHLORATE 28.08 21.79 17.29 7.33 7.75 13.43 24.08 29.50
TITANIUM DIOXIDE 60.60 60.30 70.52 64.18 61.96 64.26 59.67 58.13
RED PHOSPHORUS 0.61 0.56 0.35 0.32 0.43 0.45 0.40 0.49
HYDROGEN PEROXIDE 190.35 175.78 196.82 205.66 225.38 240.45 174.76 159.18
POTASSIUM IODATE 0.00 0.00 0.00 0.00 0.00 0.00 0.56 0.54
CALCIUM CARBONATE 728.40 759.32 907.92 882.97 1026.48 1252.32 1416.88 1088.88
Organic Chemicals
ACETIC ACID 814.63 865.50 942.30 993.41 1029.36 1073.28 1081.60 1048.40
ACETIC ANHYDRIDE 76.21 76.43 77.30 76.65 81.83 89.30 74.15 69.94
ACETONE 144.66 149.63 152.58 159.46 174.69 146.60 97.67 92.93
PHENOL 258.34 240.37 282.35 321.74 337.27 292.48 179.58 179.17
METHANOL 1535.78 1801.99 1830.49 1801.79 2034.32 2247.70 2449.38 2445.52
FORMALDEHYDE 262.35 248.90 233.68 235.87 237.66 214.15 246.27 229.43
NITROBENZENE 76.36 70.78 74.16 83.80 86.73 86.91 76.54 85.86
CITRIC ACID 62.09 65.63 74.49 80.01 81.87 92.96 88.55 92.67
MALEIC ANHYDRIDE 39.64 41.56 50.86 54.11 55.71 74.39 71.80 64.87
PENTAERYTHRITOL 26.37 25.58 31.82 31.35 29.95 31.11 33.94 23.93
ANILINE 72.27 70.48 77.61 85.94 107.14 126.17 106.32 106.23
CHLORO METHANES 214.14 220.68 220.75 221.68 222.85 286.87 299.26 329.35
ISOBUTYLBENZENE -8.05 -9.64 -5.33 -6.51 -3.39 -2.04 -0.26 -3.44
ONCB 14.94 14.29 18.66 22.42 24.90 23.70 19.84 23.27
PNCB 25.09 29.96 38.01 39.26 37.78 36.07 31.90 38.89
MEK 30.50 30.89 46.45 37.25 51.71 53.69 35.10 50.48
ACETALDEHYDE 79.72 67.80 59.03 60.55 65.81 60.84 76.08 55.02
ETHANOLAMINES 19.98 24.02 22.19 23.08 24.50 30.21 30.40 33.01
ETHYL ACETATE 192.44 213.04 255.88 279.24 305.98 324.80 367.17 344.54
MENTHOL 3.80 4.82 6.83 4.05 2.31 -5.78 -6.59 -7.98
ORTHO NITRO TOLUENE 11.73 11.67 10.47 13.30 12.01 12.67 18.76 23.99
Note: 1. Production and Installed Capacity data based on MPRs received from manufacturer of chemicals under large
and medium scale units only monitored by S&M Division of DCPC.
2. Data Source in respect of Imports and Exports is DGCIS, M/o Commerce and Industry.
3. Derived consumption as Production + Imports - Exports
86

Table 5A: Consumption of Selected Pesticides (Tech. Grade) (State -wise) during 2016-17 to 2020-21
(Figures in MT)
S. No. States/UTs 2016-17 2017-18 2018-19 2019-20 2020-21
1 Andhra Pradesh 2,015 1,738 1,689 1559 1559
2 Bihar 790 840 850 850 995
3 Chhattisgarh 1,660 1,685 1,770 1672 1639
4 Goa 22 24 25 30 30
5 Gujarat 1,713 1,692 1,608 1784 1573
6 Haryana 4,050 4,025 4,015 4200 4050
7 Himachal Pradesh 341 467 322 881 56
8 Jharkhand 541 619 646 681 1161
9 Karnataka 1,288 1,502 1,524 1568 1930
10 Kerala 895 1,067 995 656 585
11 Madhya Pradesh 694 502 540 540 691
12 Maharashtra 13,496 15,568 11,746 12783 13243
13 Orissa 1,050 1,633 1,609 1115 1158
14 Punjab 5,843 5,835 5,543 4995 5193
15 Rajasthan 2,269 2,307 2,290 2088 2330
16 Tamil Nadu 2,092 1,929 1,901 2225 1834
17 Telangana 3,436 4,866 4,894 4915 4986
18 Uttar Pradesh 10,614 10,824 11,049 12217 11557
19 Uttarakhand 198 210 195 224 135
20 West Bengal 2,624 2,982 3,190 3630 3630
Sub Total 55,631 60,315 56,401 58,613 58,335
North-Eastern
21 Arunachal Pradesh 18 NR 5 5 2
22 Assam 306 241 256 410 420
23 Manipur 33 27 NR 25 46
24 Meghalaya Organic State Organic State Organic State Organic State Organic State
25 Mizoram 9 NR 26 27 NR
26 Nagaland 20 20 21 19 36
27 Sikkim Organic State Organic State Organic State Organic State Organic State
28 Tripura 298 330 349 364 NR
Sub Total 684 618 657 850 504
Union Territories
29 Andaman & Nicobar NR NR NR NR 1
30 Chandigarh NR NR NR NR NR
31 Dadra & Nagar Haveli NR NR NR NR NR
Daman & Diu NR NR NR NR NR
32 Delhi 88 NR 110 NR NR
33 Jammu & Kashmir 2,188 2,430 2459 2198 3352
34 Ladakh NR NR NR NR NR
35 Lakshadweep NR NR NR NR NR
36 Pondicherry 43 43 42 40 NR
Sub Total 2,319 2,473 2,611 2,238 3,353
Grand Total 58,634 63,406 59,669 61,701 62,192
Note: States/UTs Zonal Conferences on Inputs (Plant Protection). NR- Not reported
Source: Direcorate of Plant Protection,Quarantine & Storage, Department of Agriculture & Farmers Welfare, Ministry of
Agriculture and Farmers Welfare
87

Section – II
Petrochemical Sector

Table 6: Performance of Selected Basic Major Petrochemicals (Group Wise) during 2013-14 to 2020-21
(Figures in 000'MT)
Group 2013-14 2014-15 2015-16 2016-17 2017-18 2018-19 2019-20 2020-21 CAGR (%)
(1) (2) (3) (4) (5) (6) (7) (8) (9) (10)
1. Synthetic Fibres/Yarn
Capacity 3769 4213 4452 4393 4379 4440 4521 4529 2.66
Production 3149 3532 3558 3599 3625 3601 3893 3185 0.16
Capacity Utilisation (%) 83.6 83.8 79.9 81.9 82.8 81.1 86.1 70.3
Imports 164 236 264 280 260 276 347 403 13.70
Exports 908 887 878 1026 1001 1016 1059 879 -0.46
2. Polymers
Capacity 8905 8905 9768 10110 10112 10115 12754 12799 5.32
Production 7876 7558 8839 9163 9276 10040 12404 12144 6.38
Capacity Utilisation (%) 88.4 84.9 90.5 90.6 91.7 99.3 97.3 94.9
Imports 3125 3737 4214 4452 4751 4479 3430 2641 -2.37
Exports 1188 903 998 912 1188 1934 1615 1489 3.28
3. Synthetic Rubber
Capacity 244 425 425 425 425 425 411 406 7.51
Production 105 172 242 285 308 351 358 353 19.00
Capacity Utilisation (%) 42.8 40.3 56.8 67.0 72.3 82.5 87.1 87.1
Imports 580 578 596 560 608 619 575 747 3.68
Exports 13 26 43 38 52 64 74 95 33.11
4. Synthetic Detergent Intermediates
Capacity 687 687 687 687 687 687 680 680 -0.16
Production 597 596 566 664 743 687 715 736 3.06
Capacity Utilisation (%) 86.8 86.7 82.3 96.6 108.1 100.0 105.1 108.3
Imports 124 134 218 228 206 227 264 265 11.50
Exports 33 28 10 7 1 1 1 2 -33.60
5. Performance Plastics
Capacity 2958 2983 3018 2945 2947 2963 2919 3046 0.42
Production 1685 1591 1700 1799 1719 1589 1672 1520 -1.46
Capacity Utilisation (%) 56.9 53.3 56.3 61.1 58.3 53.6 57.3 49.9
Imports 311 395 389 417 583 684 741 299 -0.56
Exports 475 409 814 973 1051 1080 969 217 -10.57
Total Basic Major Petrochemicals (1 to 5)
Capacity 16563 17213 18351 18561 18551 18630 21286 21460 3.77
Production 13410 13448 14905 15510 15670 16269 19041 17938 4.24
Capacity Utilisation (%) 81.0 78.1 81.2 83.6 84.5 87.3 89.5 83.6
Imports 4304 5080 5681 5938 6408 6284 5356 4356 0.17
Exports 2616 2254 2743 2956 3293 4095 3719 2681 0.35
Note : 1.Production and Installed Capacity data based on MPRs received from manufacturer under large and medium scale
units only monitored by S&M Division of DCPC.
2. Data Source in respect of imports and exports is DGCIS, M/o Commerce and Industry.
88

Table 6A: Projection of Production, Installed Capacity, Export and Import of Selected Basic Major Petrochemical (Group-wise) from the year 2021-22
to 2026-27
(Figures in 000'MT)
Group Actual Values Forecast Values
2015-16 2016-17 2017-18 2018-19 2019-20 2020-21 2021-22 2022-23 2023-24 2024-25 2025-26 2026-27
(1) (2) (3) (4) (5) (6) (7) (8) (9) (10) (11) (12) (13)
1. Synthetic Fibres/Yarn
Capacity 4452 4393 4379 4440 4521 4529 4535 4590 4634 4660 4685 4725
Production 3558 3599 3625 3601 3893 3185 3476 3398 3308 3211 3100 3149
Capacity Utilisation (%) 79.9 81.9 82.8 81.1 86.1 70.3 76.6 73.9 71.1 68.5 65.6 66.0
Imports 264 280 260 276 347 403 396 435 482 519 544 575
Exports 878 1026 1001 1016 1059 879 988 944 926 900 879 891
2. Polymers
Capacity 9768 10110 10112 10115 12754 12799 13252 14165 15172 16040 16476 17426
Production 8839 9163 9276 10040 12404 12144 13012 14028 15058 15864 16458 17543
Capacity Utilisation (%) 90.5 90.6 91.7 99.3 97.3 94.9 99 100 101 101 103 104
Imports 4214 4452 4751 4479 3430 2641 2875 2245 1590 1100 770 336
Exports 998 912 1188 1934 1615 1489 1887 2050 2098 2097 2313 2469
3. Synthetic Rubber
Capacity 425 425 425 425 411 406 406 399 393 387 383 378
Production 242 285 308 351 358 353 398 413 430 445 468 491
Capacity Utilisation (%) 56.8 67.0 72.3 82.5 87.1 87.1 98 102 108 112 118 125
Imports 596 560 608 619 575 747 699 741 773 814 856 864
Exports 43 38 52 64 74 95 99 115 127 140 152 164
4. Synthetic Detergent Intermediates
Capacity 687 687 687 687 680 680 679 676 673 671 670 667
Production 566 664 743 687 715 736 780 780 789 823 840 857
Capacity Utilisation (%) 82.3 96.6 108.1 100.0 105.1 108.3 115 115 117 122 125 128
Imports 218 228 206 227 264 265 271 287 307 318 326 342
Exports 10 7 1 1 1 2 -2 -3 -3 -4 -5 -7
5 : Performance Plastics
Capacity 3018 2945 2947 2963 2919 3046 2981 3010 3028 3044 3065 3059
Production 1700 1799 1719 1589 1672 1520 1525 1448 1409 1371 1299 1268
Capacity Utilisation (%) 56.3 61.1 58.3 53.6 57.3 49.9 51 48 47 45 42 41
Imports 389 417 583 684 741 299 581 553 483 428 411 462
Exports 814 973 1051 1080 969 217 554 337 111 -96 -237 -297
Total Basic Major Petrochemicals (1 to 5)
Capacity 18351 18561 18551 18630 21286 21460 21853 22841 23899 24802 25279 26256
Production 14905 15510 15670 16269 19041 17938 19191 20068 20994 21713 22165 23307
Capacity Utilisation (%) 81.2 83.6 84.5 87.3 89.5 83.6 88.2 88.3 88.5 88.3 88.6 90.2
Imports 5681 5938 6408 6284 5356 4356 4821 4261 3636 3179 2908 2581
Exports 2743 2956 3293 4095 3719 2681 3526 3442 3259 3037 3102 3220
Note : 1.Production and Installed Capacity data based on MPRs received from manufacturer under large and medium scale units only monitored by S&M Division of DCPC 2. Data Source in respect of imports and exports is DGCIS, M/o Commerce and Industry.
3. Projected figures have been calculated by using Forecast formula in MS Excel.
89

Table 7: Production, Installed Capacity & Growth of Selected Basic Major Petrochemicals (Group-wise) during 2013-14 to 2020-21.
(Figures in 000' MT)
Group
Installed Capacity Production / Growth Rate
2013-14
2014-15
2015-16
2016-17
2017-18
2018-19
2019-20
2020-21
2018-19 2019-20 2020-21
(1) (2) (3) (4) (5) (6) (7) (8) (9) (10) (11) (12) (13)
Synthetic Fibers
4440
4521
4529
Production 3149 3532 3558 3599 3625 3601 3893 3185
Growth Rate (%) 0.7 12.2 0.7 1.2 0.7 -0.7 8.1 -18.2
Polymers
10115
12754
12799
Production 7876 7558 8839 9163 9276 10040 12404 12144
Growth Rate (%) 4.9 -4.0 17.0 3.7 1.2 8.2 23.5 -2.1
Elastomers (S.Rubber)
425
411
406
Production 105 172 242 285 308 351 358 353
Growth Rate (%) 8.7 64.1 40.8 17.9 8.0 14.0 2.1 -1.3
Synth. Detergent
Intermediates
687
680
680
Production 597 596 566 664 743 687 715 736
Growth Rate (%) -4.8 -0.1 -5.1 17.4 11.9 -7.5 4.0 3.0
Performance Plastics
2963
2919
3046
Production 1685 1591 1700 1799 1719 1589 1672 1520
Growth Rate (%) -0.4 -5.5 6.9 5.8 -4.5 -7.6 5.2 -9.1
Total Basic Major
Petrochemicals
18630
21286
21460
Production 13410 13448 14905 15510 15670 16269 19041 17938
Growth Rate %) 2.8 0.3 10.8 4.1 1.0 3.8 17.0 -5.8
Note : Production and Installed Capacity data based on MPRs received from manufacturer under large and medium scale units only monitored by S&M Division of
DCPC.
90

Table 8: Production, Capacity Utilization & Growth of Selected Major Petrochemicals (Product-Wise) during 2013-14 to 2020-21.
(Figures in 000'MT)
Major Groups / Products Installed Capacity Production
CAGR (%) Capacity
Utilisation 2018-19 2019-20 2020-21 2013-14 2014-15 2015-16 2016-17 2017-18 2018-19 2019-20 2020-21
(1) (2) (3) (4) (5) (6) (7) (8) (9) (10) (11) (12) (13) (14)
A : BASIC MAJOR PETROCHEMICALS
I : Synthetic Fibres / Yarn
POLYESTER FILAMENT YARN ($) 2827.42 2719.79 2727.37 1811.28 2178.75 2179.00 2200.91 2283.41 2316.43 2520.33 1997.93 1.41 73.25
NYLON FILAMENT YARN ($$) 24.62 58.52 58.52 24.32 32.45 37.25 40.91 40.01 46.62 48.29 33.27 4.58 56.86
NYLON INDUSTRIAL YARN/TYRE CORD($$) 90.50 152.02 152.02 103.83 100.52 94.87 103.56 107.59 109.55 99.75 90.29 -1.98 59.39
POLYPROPYLENE FILAMENT YARN($$) 3.60 3.60 3.60 5.91 5.14 3.47 3.39 3.15 2.36 2.52 2.17 -13.34 60.22
Sub Total Yarn (1+2+3+4) 2946.14 2933.92 2941.50 1945.34 2316.86 2314.59 2348.77 2434.15 2474.95 2670.89 2123.65 1.26 72.20
ACRYLIC FIBRE (AF) 107.00 107.00 107.00 94.38 89.63 105.87 95.39 90.97 99.45 102.90 77.02 -2.86 71.98
POLYESTER STAPLE FIBREFILL 69.00 69.00 69.00 56.46 57.30 51.05 53.65 51.33 52.99 49.89 40.30 -4.70 58.40
POLYESTER STAPLE FIBRE 1256.56 1350.46 1350.46 1010.05 1021.25 1039.65 1056.00 1005.30 931.44 1027.49 909.38 -1.49 67.34
POLYPROPYLENE STAPLE FIBRE 30.93 30.93 30.93 23.01 25.42 27.04 24.56 22.24 20.74 18.82 15.34 -5.63 49.59
POLYSTER INDUSTRIAL YARN 21.50 21.50 21.50 14.75 16.58 15.38 16.33 15.04 14.83 14.73 12.36 -2.49 57.49
10.ELASTOMERIC/SPANDEX FILAMENT YARN 8.50 8.50 8.50 4.74 4.95 4.81 4.70 6.18 7.08 8.06 6.60 77.65
Total Synth. Fibre / Yarn 4439.63 4521.31 4528.88 3148.73 3531.98 3558.39 3599.40 3625.20 3601.48 3892.78 3184.65 0.16 70.32
II : Polymers
LINEAR LOW DENSITY POLYETHYLENE (LLDPE) No separate Capacity 1036.58 910.26 1204.57 1318.26 1290.05 1581.22 2994.03 2958.92 16.17
HIGH DENSITY POLYETHYLENE (HDPE) No separate Capacity 1195.04 1155.79 1317.15 1520.04 1578.38 1597.68 1897.57 1910.04 6.93
LLDPE/HDPE (Combined) ($$$) 3348.10 5158.10 5158.10 2231.62 2066.05 2521.72 2838.30 2868.42 3178.90 4891.59 4868.96 11.79 94.39
LOW DENSITY POLYETHYLENE (LDPE) 160.00 560.00 610.00 190.01 184.40 200.03 201.76 185.66 193.05 613.29 616.61 18.31 101.08
POLYSTYRENE (PS) 471.00 471.00 471.00 270.33 281.17 308.58 311.35 301.58 292.86 291.72 217.45 -3.06 46.17
POLYPROPYLENE(PP) 4514.00 4933.80 4933.80 3739.64 3614.82 4284.42 4253.39 4350.20 4779.02 4982.82 4919.10 3.99 99.70
EXPANDABLE POLYSTYRENE (EXPS) 128.70 133.30 133.30 77.35 80.68 86.20 96.77 103.91 108.27 110.68 87.39 1.76 65.56
POLY VINYL CHLORIDE PVC) 1493.00 1498.00 1493.00 1367.00 1330.44 1437.89 1461.53 1466.08 1488.40 1513.59 1434.12 0.69 96.06
Total Polymers 10114.80 12754.20 12799.20 7875.96 7557.57 8838.84 9163.10 9275.85 10040.50 12403.69 12143.62 6.38 94.88
III : Synthetic Rubber
STYRENE BUTADIENE RUBBER (SBR) 271.00 271.00 277.00 11.95 57.25 124.80 167.33 193.97 228.64 227.83 212.91 50.90 76.86
POLY BUTADIENE RUBBER (PBR) 114.00 100.00 100.00 80.87 107.54 113.93 117.09 113.63 122.23 130.25 128.55 6.85 128.55
ETHYL VINYL ACETATE (EVA) 15.00 15.00 15.00 11.21 6.42 2.41 0.00 0.00 0.00 0.00 0.00 -100.00 0.00
NITRILE BUTADIENE RUBBER (NBR) 25.30 25.30 13.70 0.52 0.38 0.39 0.35 0.05 0.00 0.00 11.88 56.57 86.72
Total Synthetic Rubber 425.30 411.30 405.70 104.54 171.59 241.53 284.78 307.66 350.87 358.08 353.34 19.00 87.09
IV : Synthetic Detergent Intermediates
LINEAR ALKYL BENZENE (LAB) 547.40 544.79 544.79 405.64 410.54 377.20 447.65 451.53 454.82 413.50 457.07 1.72 83.90
ETHYLENE OXIDE (EO) 140.00 135.00 135.00 190.89 185.32 188.31 216.06 291.30 232.34 301.18 279.37 5.59 206.94
Total Synth. Detergent Intermediates 687.40 679.79 679.79 596.53 595.86 565.51 663.71 742.82 687.16 714.68 736.44 3.06 108.33
V : Performance Plastic
91

Table 8: Production, Capacity Utilization & Growth of Selected Major Petrochemicals (Product-Wise) during 2013-14 to 2020-21.
(Figures in 000'MT)
Major Groups / Products Installed Capacity Production
CAGR (%) Capacity
Utilisation 2018-19 2019-20 2020-21 2013-14 2014-15 2015-16 2016-17 2017-18 2018-19 2019-20 2020-21
(1) (2) (3) (4) (5) (6) (7) (8) (9) (10) (11) (12) (13) (14)
ABS RESINS 156.00 210.00 213.00 102.19 107.28 117.01 117.77 145.23 148.18 136.46 121.94 2.56 57.25
NYLON-6/ NYLON 6,6 28.20 68.50 83.50 20.45 20.75 21.44 21.54 20.56 21.52 41.57 55.39 15.30 66.33
POLYMETHYL METHACRYLATE (PMMA) 3.50 3.90 3.90 2.48 1.05 1.47 0.29 0.02 0.00 0.00 0.00 -100.00 0.00
STYRENE ACRYLONITRILE (SAN) 148.00 148.00 167.00 87.61 88.77 98.68 99.24 114.69 131.76 133.79 118.61 4.42 71.03
PET Chips/Polyester Chips 2607.66 2468.50 2558.55 1459.85 1361.98 1452.93 1548.70 1424.60 1271.09 1344.70 1208.99 -2.66 47.25
PTFE (TEFLON) 19.80 20.30 20.30 11.95 11.35 8.75 11.73 13.72 16.24 15.11 14.64 2.94 72.11
Total Performance Plastics 2963.16 2919.20 3046.25 1684.53 1591.18 1700.27 1799.27 1718.81 1588.79 1671.63 1519.57 -1.46 49.88
TOTAL BASIC MAJOR PETROCHEMICALS
(I+II+III+IV+V) 18630.29 21285.80 21459.82 13410.29 13448.16 14904.54 15510.25 15670.34 16268.79 19040.86 17937.61 4.24 83.59
B : INTERMEDIATES
I : FIBRE INTERMEDIATES
ACRYLONITRILE (ACN) 41.00 24.00 24.00 37.04 33.70 1.94 0.00 0.00 0.00 0.00 0.00 -100.00 0.00
CAPROLACTUM 120.00 120.00 120.00 84.86 87.05 86.30 86.96 85.97 92.56 84.06 80.41 -0.77 67.00
MONO ETHYLENE GLYCOL (MEG) 1153.40 1868.10 2210.60 1069.28 1001.14 1158.97 1110.50 1132.65 1159.76 2007.78 1981.98 9.22 89.66
PURIFIED TEREPHTHALIC ACID (PTA) 3873.00 3873.00 3873.00 3476.51 3755.28 3431.78 3390.56 3492.44 3404.93 3267.07 2996.76 -2.10 77.38
Total Fibre Intermediates 5187.40 5885.10 6227.60 4667.68 4877.16 4678.98 4588.01 4711.06 4657.25 5358.91 5059.15 1.16 81.24
II : BUILDING BLOCKS
(a) Olefins
BUTADIENE 433.00 552.00 552.00 235.53 239.45 343.45 347.36 332.38 385.76 481.01 458.80 9.99 83.12
ETHYLENE 4446.50 7147.30 7147.30 3346.39 3191.90 3727.39 4021.73 4222.68 3831.89 6466.75 6364.89 9.62 89.05
PROPYLENE 4803.38 5190.38 5190.38 3988.06 3869.40 4456.69 4425.21 4457.91 4639.53 4887.62 5215.76 3.91 100.49
Total Olefins 9682.88 12889.68 12889.68 7569.97 7300.74 8527.53 8794.29 9012.97 8857.18 11835.39 12039.45 6.85 93.40
(b) Aromatics
BENZENE 1566.35 1721.35 1884.35 1030.79 1094.38 1332.59 1332.04 1318.03 1414.56 1346.24 1407.87 4.55 74.71
MIXED XYLENE 898.33 898.33 898.33 247.54 215.00 269.35 296.03 271.35 249.05 269.63 146.68 -7.20 16.33
ORTHOXYLENE 420.00 420.00 511.00 412.41 462.46 499.51 444.88 447.76 406.30 386.39 522.12 3.43 102.18
TOLUENE 288.27 288.27 288.27 120.39 108.16 115.74 126.76 106.94 141.14 140.16 113.99 -0.78 39.54
PARAXYLENE (PX) 3131.70 3131.70 3821.70 2263.76 2757.84 3266.36 3161.30 3194.52 3331.81 2782.33 2614.21 2.08 68.40
Total Aromatics 6304.65 6459.65 7403.65 4074.89 4637.84 5483.55 5361.02 5338.60 5542.87 4924.74 4804.86 2.38 64.90
Total Intermidates
(I+II(a)+II(b)) 21174.93 25234.43 26520.93 16312.54 16815.75 18690.06 18743.32 19062.62 19057.29 22119.04 21903.46 4.30 82.59
C : OTHER PETRO-BASED CHEMICALS
DIETHYLENE GLYCOL 83.30 132.90 170.90 106.65 100.96 114.24 108.24 105.70 107.41 167.74 172.33 7.10 100.83
DIACETONE ALCOHOL 9.50 9.50 9.50 0.00 0.00 0.00 0.00 0.21 4.07 6.04 2.93 30.81
ETHYLENE DICHLORIDE 593.20 593.20 593.20 278.03 285.30 277.35 282.57 282.35 339.20 345.29 326.24 2.31 55.00
92

Table 8: Production, Capacity Utilization & Growth of Selected Major Petrochemicals (Product-Wise) during 2013-14 to 2020-21.
(Figures in 000'MT)
Major Groups / Products Installed Capacity Production
CAGR (%) Capacity
Utilisation 2018-19 2019-20 2020-21 2013-14 2014-15 2015-16 2016-17 2017-18 2018-19 2019-20 2020-21
(1) (2) (3) (4) (5) (6) (7) (8) (9) (10) (11) (12) (13) (14)
BUTANOL 26.00 26.00 26.00 5.48 4.20 11.08 12.47 17.39 21.69 16.44 20.29 20.55 78.02
2-ETHYL HEXANOL** 55.20 55.20 55.20 20.19 13.89 44.41 45.59 56.64 58.89 48.75 49.67 13.72 89.99
VINYL CHLORIDE MONOMER 541.30 541.30 541.30 735.47 717.88 790.71 791.26 777.98 803.62 874.47 799.22 1.19 147.65
PBT* 0.00 0.00 0.00 0.43 0.50 0.50 0.61 0.58 1.29 6.25 6.09 45.97
POLYCARBONATE* 0.00 0.00 0.00 0.16 0.16 0.17 0.15 0.09 0.12 0.11 0.00 -100.00
PROPYLENE OXIDE 36.00 36.00 51.00 33.43 36.61 25.59 29.34 36.00 35.12 34.56 44.42 4.14 87.09
PROPYLENE GLYCOL 20.00 20.00 22.00 14.04 16.25 13.65 16.35 17.64 19.13 19.51 19.71 4.96 89.57
POLYVINYL ACETATE RESIN 17.34 17.34 12.00 0.00 0.00 0.00 0.00 0.00 0.00 0.00 2.96 24.68
UNSATURATED POLYSTER RESIN 0.00 34.00 34.00 0.00 0.00 0.00 0.00 0.00 0.00 16.44 8.79 25.85
METHYL METHACRYLATE 4.38 4.38 4.38 3.23 3.47 2.28 0.54 2.83 3.99 1.71 0.00 -100.00 0.00
ISO-BUTANOL 2.80 2.80 2.80 0.79 0.67 1.86 1.96 2.23 2.21 1.71 2.07 14.86 73.96
C4-RAFFINATE 291.60 291.60 291.60 392.64 364.61 428.64 437.17 339.20 380.26 413.33 433.42 1.42 148.63
PHTHALIC ANHYDRIDE 349.05 401.91 401.91 263.75 291.52 305.78 296.07 290.01 275.07 269.64 292.96 1.51 72.89
VINYL ACTATE MONOMER 30.00 30.00 30.00 0.00 0.00 0.00 0.00 0.00 0.00 0.00 0.00 0.00
ISOPROPANOL 70.20 70.20 70.20 75.90 74.98 71.18 72.47 71.83 58.27 60.51 55.31 -4.42 78.79
POLYOL 141.63 146.76 142.03 40.12 51.78 71.80 78.72 79.43 82.13 81.75 77.83 9.93 54.80
Total Other Petro-based Chemicals 2271.49 2413.09 2458.01 1970.31 1962.81 2159.22 2173.50 2080.10 2192.46 2364.23 2314.22 2.32 94.15
Total Major Petrochemical (9 group) 42076.70 48933.31 50438.76 31693.14 32226.72 35753.82 36427.08 36813.06 37518.55 43524.13 42155.29 4.16 83.58
( $) : Includes capacity of all the units producing PFY, NFY, NIY and PPFY under broadbanding as Synthetic Filament Yarn :
* Nylon 6, 66 includes installed capacity of PBT and Polycarbonate.
($$) : Independent capacity of units producing only NFY, NIY and PPFY.
As the capacities of these products are also included in Synthetic Filament yarn, capacity utilisation can not be worked out.
($$$) : Combined capacity to produce both LLDPE and HDPE and hence capacity utilisation can not be worked out. However production is independent.
( ** : Combined capacity of 2-EH, Butanol & Iso Butanol is given under 2 - EH)
Note : Production and Installed Capacity data based on MPRs received from manufacturer under large and medium scale units only monitored by S&M Division of DCPC.
93

Table 9: Installed Capacities of Selected Major Petrochemicals (Group Wise) from 2013-14 to 2020-21.
(Figures in 000'MT)
GROUP / PRODUCT 2013-14 2014-15 2015-16 2016-17 2017-18 2018-19 2019-20 2020-21
(1) (2) (3) (4) (5) (6) (7) (8) (9)
A : BASIC PETROCHEMICALS
I : SYNTHETIC FIBRES 3769 4213 4452 4393 4379 4440 4521 4529
II : POLYMERS 8905 8905 9768 10110 10112 10115 12754 12799
III : SYNTHETIC RUBBER (ELASTOMERS) 244 425 425 425 425 425 411 406
IV : SYNTH. DETERGENT INTERMEDIATE 687 687 687 687 687 687 680 680
V : PERFORMANCE PLASTICS 2958 2983 3018 2945 2947 2963 2919 3046
MAJOR PETROCHEMICALS (I TO V) 16563 17213 18351 18561 18551 18630 21286 21460
B : INTERMEDIATES
VI : FIBRE INTERMEDIATES 5067 5067 5067 5067 5187 5187 5885 6228
VII : OLEFINS 8484 8484 9462 9683 9683 9683 12890 12890
VIII : AROMATICS 5077 6274 6304 6305 6305 6305 6460 7404
Total (VI TO VIII) 18629 19826 20834 21055 21175 21175 25234 26521
C : OTHER PETRO-BASED CHEMICALS 2169 2244 2272 2273 2271 2271 2413 2458
Total (A,B & C) 37361 39283 41457 41888 41998 42077 48933 50439
Note: Installed Capacity data based on MPRs received from manufacturer under large and medium scale units only monitored by S&M Division of DCPC.
94

Table 10: Consumption of Selected Major Petrochemicals (Product-wise) during 2013-14 to 2020-21
(Figures in 000'MT)
PRODUCT NAME 2013-14 2014-15 2015-16 2016-17 2017-18 2018-19 2019-20 2020-21
(1) (2) (3) (4) (5) (6) (7) (8) (9)
I. SYNTHETIC FIBRE
ACRYLIC FIBRE 95.81 88.54 97.20 83.83 83.94 94.00 118.72 93.38
POLYESTER STAPLE FIBREFILL 56.46 57.30 51.05 53.65 51.33 52.99 49.89 40.30
NYLON FILAMENT YARN 46.60 58.41 64.58 70.11 58.73 64.08 65.02 44.23
NYLON INDUSTRIAL YARN/TYRE CORD 107.96 102.52 98.16 109.826 112.53 115.76 103.02 95.452
POLYESTER FILAMENT YARN 1210.26 1602.69 1616.81 1537.24 1648.48 1703.72 1924.18 1695.96
POLYESTER STAPLE FIBRE 847.34 919.53 957.55 941.91 866.85 767.76 860.51 702.26
POLYPROPYLENE FILAMENT YARN 4.83 3.62 1.32 2.01 3.62 3.22 2.47 2.19
POLYPROPYLENE STAPLE FIBRE 8.52 15.14 21.39 16.82 16.02 16.19 12.08 9.29
POLYSTER INDUSTRIAL YARN 14.75 16.58 15.38 16.33 15.04 14.83 14.73 12.36
Elastomeric/Spandex Filament Yarn 12.69 16.04 20.36 21.93 27.24 28.89 29.42 13.89
Total 2405.22 2880.39 2943.80 2853.65 2883.77 2861.43 3180.03 2709.30
II. POLYMERS
LOW DENSITY POLYETHYLENE 427.79 488.78 550.79 566.35 541.99 369.97 825.64 833.46
HIGH DENSITY POLYTHYLENE 1656.81 1947.02 2122.78 2372.35 2365.65 2042.53 2198.64 2321.85
POLYESTYRENE 224.14 247.12 264.80 273.18 284.55 285.18 296.48 250.86
POLYPROPYLENE (INC. CO-POLYMER) 3275.54 3499.59 4249.93 4460.35 4737.19 4915.80 5438.39 4911.79
EXPANDABLE POLYESTYRENE 77.69 78.99 85.42 96.85 103.44 106.44 108.98 91.18
POLY VINYL CHLORIDE 2574.19 2621.79 2936.15 3157.90 3305.72 3523.84 2439.91 1836.44
LINEAR LOW DENSITY POLYTHYLENE 1522.95 1449.51 1778.76 1734.12 1486.21 1349.40 2910.40 3050.91
PVC COMPOUND 54.20 58.29 65.91 42.13 14.35 -7.69 0.00 0.00
Total 9813.31 10391.10 12054.52 12703.23 12839.10 12585.47 14218.42 13296.48
III. SYNTHETIC RUBBER
STYRENE BUTADIENE RUBBER 244.01 262.79 266.55 289.75 286.26 305.47 285.64 325.53
POLY BUTADIENE RUBBER 166.80 176.09 182.59 196.89 201.39 213.72 207.64 220.18
ETHYL PROPYLENE DIMERS 28.27 30.43 36.65 40.13 42.58 50.34 43.17 40.44
ETHYL VINYL ACETATE 124.76 144.70 166.40 143.11 182.45 178.15 192.67 188.54
NITRILE BUTADIENE RUBBER 29.67 26.66 51.93 36.35 39.93 38.01 40.46 166.57
BUTYL RUBBER 78.53 83.29 90.83 100.26 111.02 120.12 89.29 64.33
Total 672.04 723.95 794.94 806.50 863.63 905.82 858.88 1005.58
IV. SYNTHETIC DETERGENT INTERMEDIATES
LINEAR ALKYL BENZENE 496.97 517.34 585.94 669.30 656.51 681.61 677.34 721.54
ETHYLENE OXIDE 190.44 184.56 188.03 215.58 290.89 231.64 300.36 278.43
Total 687.41 701.90 773.97 884.88 947.39 913.25 977.70 999.97
V. PERFORMANCE PLASTICS
ABS RESIN 164.91 176.97 206.62 220.16 242.99 267.13 240.78 220.38
NYLON-6 118.59 136.67 150.18 161.53 174.07 216.48 237.01 55.39
POLYMETHYL METHACRYLATE 11.63 7.11 12.62 18.90 26.45 25.22 24.70 28.48
STYRENE ACRYLONITRILE 93.30 95.07 107.67 107.11 122.94 140.56 143.78 131.73
NYLON 6,6 0.91 1.25 1.23 1.17 1.08 1.02 0.73 0.00
POLYESTER CHIPS/PET CHIPS 1123.03 1153.57 792.03 729.45 676.37 534.81 789.58 1158.62
POLYTETRAFLUOROETHYLENE(PTFE) 8.52 5.95 4.75 5.64 7.07 7.14 6.84 6.79
Total 1520.90 1576.58 1275.10 1243.96 1250.96 1192.35 1443.41 1601.38
TOTAL BASIC MAJOR PETROCHEMICALS
(I+II+III+IV+V) 15098.88 16273.91 17842.34 18492.22 18784.85 18458.32 20678.44 19612.71
FIBRE INTERMEDIATE
ACRYLONITRILE 137.90 131.08 159.82 139.70 158.26 180.36 172.88 126.70
CAPROLACTUM 107.84 119.33 130.87 138.86 144.33 158.98 151.85 131.83
DIMETHYL TEREPHTHALATE 1.79 2.09 2.22 1.76 2.26 1.45 1.81 1.77
MONO EHYLENE GLYCOL 1822.97 1931.46 2198.31 2283.68 2061.67 1501.89 2644.05 2277.78
PURIFIED TEREPHTHALIC ACID 4454.58 4799.80 3955.64 3543.14 3801.61 3812.26 4073.60 3487.24
Total 6525.06 6983.76 6446.86 6107.15 6168.12 5654.95 7044.19 6025.31
OLEFINS
BUTADIENE 117.19 170.19 214.64 242.62 231.81 250.62 306.78 292.02
ETHYLENE 3371.18 3235.80 3743.33 4102.62 4125.38 3699.24 6379.34 6301.90
PROPYLENE 3988.31 3871.53 4445.58 4415.14 4445.97 4608.31 4888.99 5204.42
95
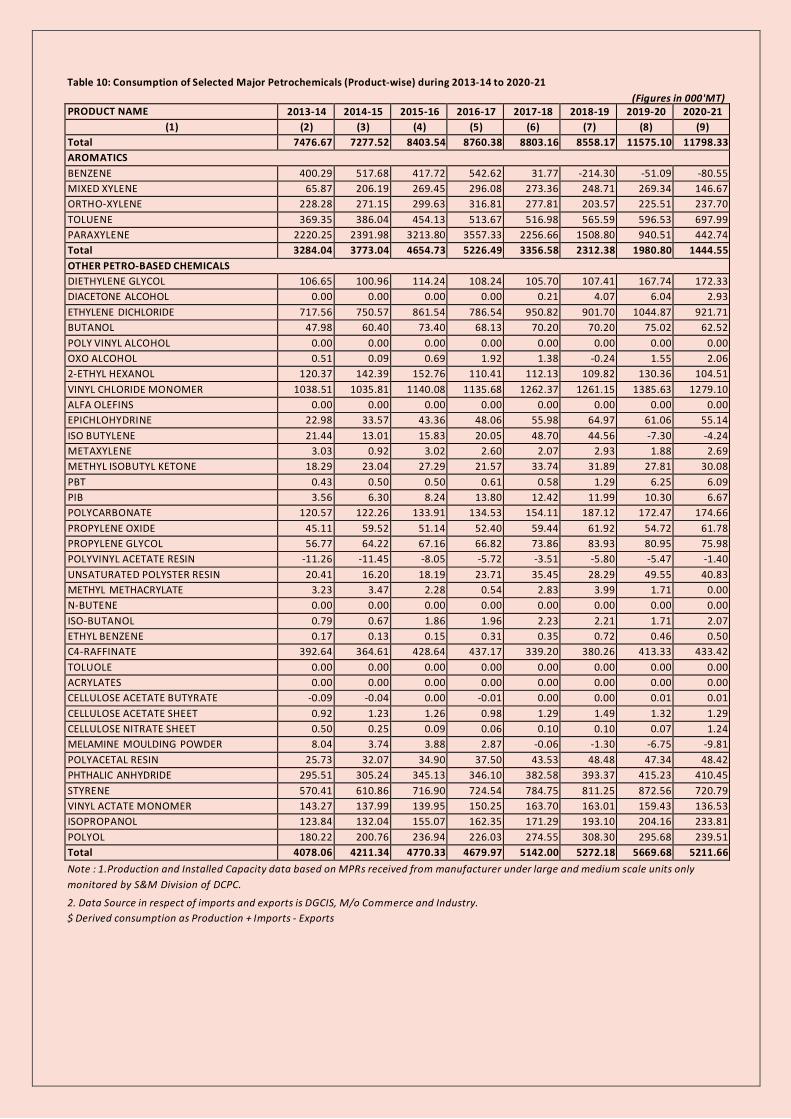
Table 10: Consumption of Selected Major Petrochemicals (Product-wise) during 2013-14 to 2020-21
(Figures in 000'MT)
PRODUCT NAME 2013-14 2014-15 2015-16 2016-17 2017-18 2018-19 2019-20 2020-21
(1) (2) (3) (4) (5) (6) (7) (8) (9)
Total 7476.67 7277.52 8403.54 8760.38 8803.16 8558.17 11575.10 11798.33
AROMATICS
BENZENE 400.29 517.68 417.72 542.62 31.77 -214.30 -51.09 -80.55
MIXED XYLENE 65.87 206.19 269.45 296.08 273.36 248.71 269.34 146.67
ORTHO-XYLENE 228.28 271.15 299.63 316.81 277.81 203.57 225.51 237.70
TOLUENE 369.35 386.04 454.13 513.67 516.98 565.59 596.53 697.99
PARAXYLENE 2220.25 2391.98 3213.80 3557.33 2256.66 1508.80 940.51 442.74
Total 3284.04 3773.04 4654.73 5226.49 3356.58 2312.38 1980.80 1444.55
OTHER PETRO-BASED CHEMICALS
DIETHYLENE GLYCOL 106.65 100.96 114.24 108.24 105.70 107.41 167.74 172.33
DIACETONE ALCOHOL 0.00 0.00 0.00 0.00 0.21 4.07 6.04 2.93
ETHYLENE DICHLORIDE 717.56 750.57 861.54 786.54 950.82 901.70 1044.87 921.71
BUTANOL 47.98 60.40 73.40 68.13 70.20 70.20 75.02 62.52
POLY VINYL ALCOHOL 0.00 0.00 0.00 0.00 0.00 0.00 0.00 0.00
OXO ALCOHOL 0.51 0.09 0.69 1.92 1.38 -0.24 1.55 2.06
2-ETHYL HEXANOL 120.37 142.39 152.76 110.41 112.13 109.82 130.36 104.51
VINYL CHLORIDE MONOMER 1038.51 1035.81 1140.08 1135.68 1262.37 1261.15 1385.63 1279.10
ALFA OLEFINS 0.00 0.00 0.00 0.00 0.00 0.00 0.00 0.00
EPICHLOHYDRINE 22.98 33.57 43.36 48.06 55.98 64.97 61.06 55.14
ISO BUTYLENE 21.44 13.01 15.83 20.05 48.70 44.56 -7.30 -4.24
METAXYLENE 3.03 0.92 3.02 2.60 2.07 2.93 1.88 2.69
METHYL ISOBUTYL KETONE 18.29 23.04 27.29 21.57 33.74 31.89 27.81 30.08
PBT 0.43 0.50 0.50 0.61 0.58 1.29 6.25 6.09
PIB 3.56 6.30 8.24 13.80 12.42 11.99 10.30 6.67
POLYCARBONATE 120.57 122.26 133.91 134.53 154.11 187.12 172.47 174.66
PROPYLENE OXIDE 45.11 59.52 51.14 52.40 59.44 61.92 54.72 61.78
PROPYLENE GLYCOL 56.77 64.22 67.16 66.82 73.86 83.93 80.95 75.98
POLYVINYL ACETATE RESIN -11.26 -11.45 -8.05 -5.72 -3.51 -5.80 -5.47 -1.40
UNSATURATED POLYSTER RESIN 20.41 16.20 18.19 23.71 35.45 28.29 49.55 40.83
METHYL METHACRYLATE 3.23 3.47 2.28 0.54 2.83 3.99 1.71 0.00
N-BUTENE 0.00 0.00 0.00 0.00 0.00 0.00 0.00 0.00
ISO-BUTANOL 0.79 0.67 1.86 1.96 2.23 2.21 1.71 2.07
ETHYL BENZENE 0.17 0.13 0.15 0.31 0.35 0.72 0.46 0.50
C4-RAFFINATE 392.64 364.61 428.64 437.17 339.20 380.26 413.33 433.42
TOLUOLE 0.00 0.00 0.00 0.00 0.00 0.00 0.00 0.00
ACRYLATES 0.00 0.00 0.00 0.00 0.00 0.00 0.00 0.00
CELLULOSE ACETATE BUTYRATE -0.09 -0.04 0.00 -0.01 0.00 0.00 0.01 0.01
CELLULOSE ACETATE SHEET 0.92 1.23 1.26 0.98 1.29 1.49 1.32 1.29
CELLULOSE NITRATE SHEET 0.50 0.25 0.09 0.06 0.10 0.10 0.07 1.24
MELAMINE MOULDING POWDER 8.04 3.74 3.88 2.87 -0.06 -1.30 -6.75 -9.81
POLYACETAL RESIN 25.73 32.07 34.90 37.50 43.53 48.48 47.34 48.42
PHTHALIC ANHYDRIDE 295.51 305.24 345.13 346.10 382.58 393.37 415.23 410.45
STYRENE 570.41 610.86 716.90 724.54 784.75 811.25 872.56 720.79
VINYL ACTATE MONOMER 143.27 137.99 139.95 150.25 163.70 163.01 159.43 136.53
ISOPROPANOL 123.84 132.04 155.07 162.35 171.29 193.10 204.16 233.81
POLYOL 180.22 200.76 236.94 226.03 274.55 308.30 295.68 239.51
Total 4078.06 4211.34 4770.33 4679.97 5142.00 5272.18 5669.68 5211.66
Note : 1.Production and Installed Capacity data based on MPRs received from manufacturer under large and medium scale units only
monitored by S&M Division of DCPC.
2. Data Source in respect of imports and exports is DGCIS, M/o Commerce and Industry.
$ Derived consumption as Production + Imports - Exports
96

Section – III
Foreign Trade

Note : $ Import and Export includes both technical and formulations.
Note: Data Source in respect of Imports and Exports is DGCIS, M/o Commerce and Industry.
Table 11: Exports and Imports of Chemicals & Chemical Products (excluding Pharmaceutical Products and Fertilizers) during 2013-14 to 2020-21
Values in Rs. Crore HS Code Commodity 2013-14 2014-15 2015-16 2016-17 2017-18 2018-19 2019-20 2020-21 CAGR (%)
(1) (2) (3) (4) (5) (6) (7) (8) (9) (10) (11)
Total National Exports of which 1905011 1896445 1716384 1849434 1956515 2307726 2219854 2159043 1.8
28 INORGANIC CHEMICALS 8258 8749 7913 9138 11175 14056 12512 12301 5.9
29 ORGANIC CHEMICALS 72860 73069 75295 78386 95381 127855 124195 133637 9.1
32 TANNING OR DYEING 15455 17206 16165 17189 18951 23124 24409 22660 5.6
38 MISCELLANEOUS CHEMICAL PRODUCTS. 18694 19432 20083 21792 25080 32397 35663 37886 10.6
39 PLASTIC AND ARTICLES THEREOF. 34154 31022 34381 35502 40928 56079 48970 51004 5.9
4002 SYNTHETIC RUBBER AND FACTICE 245 379 452 480 571 739 759 821 18.8
54 MAN-MADE FILAMENTS. 15575 14621 13460 13334 13984 16018 16962 11470 -4.3
55 MAN-MADE STAPLE FIBRES. 12621 13334 13625 14373 13212 13308 11824 9559 -3.9
A: Total Chemicals and Petrochemical Products 177862 177813 181374 190193 219281 283575 275294 279337 6.7
Share in Total Export (%) 9.3 9.4 10.6 10.3 11.2 12.3 12.4 12.9
Total National Imports of which 2715434 2737087 2490306 2577675 3001033 3594675 3360954 2915958 1.0
28 INORGANIC CHEMICALS 29063 31413 33170 31654 38927 53237 45045 50955 8.4
29 ORGANIC CHEMICALS 103180 108320 101986 103798 123761 156552 140205 145830 5.1
32 TANNING OR DYEING 9254 9821 10467 11186 12995 15460 14518 14036 6.1
38 MISCELLANEOUS CHEMICAL PRODUCTS. 23084 25494 27207 30642 35521 41748 39069 45324 10.1
39 PLASTIC AND ARTICLES THEREOF. 61072 71398 74566 77573 89768 106591 100607 98392 7.1
4002 SYNTHETIC RUBBER AND FACTICE 7339 6697 5205 5654 6687 7896 6079 6269 -2.2
54 MAN-MADE FILAMENTS. 4597 5042 4879 4856 5538 6843 7351 6727 5.6
55 MAN-MADE STAPLE FIBRES. 3722 4539 4401 3826 4658 6508 6785 6180 7.5
B: Total Chemicals and Petrochemical Products 241311 262722 261880 269189 317856 394834 359660 373714 6.4
Share in Total Import (%) 8.9 9.6 10.5 10.4 10.6 11.0 10.7 12.8
Chapter 28: Inorganic Chemicals; Organic or Inorganic Compounds of Precious Metals, of Rare-Earth Metals, of Radioactive Elements or of Isotopes; Chapter 29:
Organic Chemicals; Chapter 32: Tanning or Dyeing Extracts; Tannins and their Derivatives; Dyes, Pigments and Other Colouring Matter; Paints and Varnishes; Putty and
other Mastics; Inks; Chapter 38: Miscellaneous Chemical Products; Chapter 39: Plastics and articles thereof; 4002: Synthetic rubber and factice derived from oils, in
primary forms or in plates, sheets or strip; mixtures of any product of heading No.4001 with any product of this heading, in primary forms or in plates, sheets; Chapter
54: Man-made Filaments and Chapter 55: Man-made staple fibres
97

Note : $ Import and Export includes both technical and formulations.
Note: Data Source in respect of Imports and Exports is DGCIS, M/o Commerce and Industry.
Table 12: Exports and Imports of Chemicals & Chemical Products (including Pharmaceutical Products and Fertilizers) during 2013-14 to 2020-21
Values in Rs. Crore
HS Code Commodity 2013-14 2014-15 2015-16 2016-17 2017-18 2018-19 2019-20 2020-21 CAGR (%)
(1) (2) (3) (4) (5) (6) (7) (8) (9) (10) (11)
Total National Exports of which 1905011 1896445 1716384 1849434 1956515 2307726 2219854 2159043 1.8
28,29,32,38,39,4
002, 54 & 55
Chemicals and Chemical Products (excluding
Pharmaceutical Products and Fertilizers) 177862 177813 181374 190193 219281 283575 275294 279337 6.7
Share in Total Exports (%) 9.3 9.4 10.6 10.3 11.2 12.3 12.4 12.9
30 Pharmaceutical Products 67404 70815 84481 86705 85447 103240 115473 143738 11.4
Share in Total Exports (%) 3.5 3.7 4.9 4.7 4.4 4.5 5.2 6.7
31 Fertilisers 492 555 673 466 685 1038 837 779 6.8
Share in Total Exports (%) 0.03 0.03 0.04 0.03 0.04 0.04 0.04 0.04
A: Total Chemicals and Chemical Products (including
Pharmaceutical Products and Fertilizers) 245758 249183 266528 277364 305413 387853 391604 423855 8.1
Share in Total Exports (%) 12.90 13.14 15.53 15.00 15.61 16.81 17.64 19.63
Total National Imports of which 2715434 2737087 2490306 2577675 3001033 3594675 3360954 2915958 1.0
28,29,32,38,39,4
002, 54 & 55
Chemicals and Chemical Products (excluding
Pharmaceutical Products and Fertilizers) 241311 262722 261880 269189 317856 394834 359660 373714 6.4
Share in Total Imports (%) 8.9 9.6 10.5 10.4 10.6 11.0 10.7 12.8
30 Pharmaceutical Products 9371 9961 10742 11515 12241 14581 16530 18934 10.6
Share in Total Imports (%) 0.3 0.4 0.4 0.4 0.4 0.4 0.5 0.6
31 Fertilisers 32639 39106 45973 28754 30108 46457 47397 51034 6.6
Share in Total Imports (%) 1.20 1.43 1.85 1.12 1.00 1.29 1.41 1.75
B: Total Chemicals and Petrochemical Products (including
Pharmaceutical Products and Fertilizers) 283322 311790 318595 309458 360205 455872 423587 443683 6.6
Share in Total Imports (%) 10.43 11.39 12.79 12.01 12.00 12.68 12.60 15.22
Chapter 28: Inorganic Chemicals; Organic or Inorganic Compounds of Precious Metals, of Rare-Earth Metals, of Radioactive Elements or of Isotopes; Chapter 29: Organic
Chemicals; Chapter 30: Pharmaceutical Products; Chapter 31: Fertilisers; Chapter 32: Tanning or Dyeing Extracts; Tannins and their Derivatives; Dyes, Pigments and Other
Colouring Matter; Paints and Varnishes; Putty and other Mastics; Inks; Chapter 38: Miscellaneous Chemical Products; Chapter 39: Plastics and articles thereof; 4002:
Synthetic rubber and factice derived from oils, in primary forms or in plates, sheets or strip; mixtures of any product of heading No.4001 with any product of this heading,
in primary forms or in plates, sheets; Chapter 54: Man-made Filaments and Chapter 55: Man-made staple fibres
98

Table 12A: Net Imports of Chemicals and Chemical Products (including Pharmaceutical Products and Fertilizers) during 2013-14 to 2020-21.
Values in Rs. Crore
HS Code Commodity 2013-14 2014-15 2015-16 2016-17 2017-18 2018-19 2019-20 2020-21
(1) (2) (3) (4) (5) (6) (7) (8) (9) (10)
Total National Net Imports of which 810423 840641 773921 728242 1044519 1286948 1141100 756914
28 INORGANIC CHEMICALS 20805 22664 25256 22516 27752 39181 32533 38654
29 ORGANIC CHEMICALS 30319 35251 26692 25412 28380 28696 16009 12194
32 TANNING OR DYEING -6201 -7385 -5698 -6004 -5956 -7664 -9891 -8624
38 MISCELLANEOUS CHEMICAL PRODUCTS. 4390 6061 7124 8850 10441 9352 3407 7438
39 PLASTIC AND ARTICLES THEREOF. 26918 40376 40185 42071 48841 50512 51638 47388
4002 SYNTHETIC RUBBER AND FACTICE 7094 6318 4753 5174 6116 7157 5320 5448
54 MAN-MADE FILAMENTS. -10978 -9579 -8582 -8479 -8446 -9175 -9611 -4743
55 MAN-MADE STAPLE FIBRES. -8899 -8795 -9224 -10546 -8554 -6800 -5039 -3379
Net Imports of Total Chemicals and Chemical Products
(excluding Pharmaceutical Products and Fertilizers) 63449 84909 80506 78995 98575 111259 84366 94377
Share in Total National Net Imports (%) 7.8 10.1 10.4 10.8 9.4 8.6 7.4 12.5
30 Pharmaceutical Products -58032 -60854 -73739 -75190 -73206 -88659 -98943 -124804
31 Fertilisers 32147 38551 45300 28289 29423 45419 46560 50255
Net Imports of Total Chemicals and Chemical Products
(including Pharmaceutical Products and Fertilizers) 37564 62607 52067 32094 54792 68019 31983 19828
Share in Total National Net Imports (%) 4.6 7.4 6.7 4.4 5.2 5.3 2.8 2.6
Chapter 28: Inorganic Chemicals; Organic or Inorganic Compounds of Precious Metals, of Rare-Earth Metals, of Radioactive Elements or of Isotopes; Chapter 29: Organic Chemicals;
Chapter 32: Tanning or Dyeing Extracts; Tannins and their Derivatives; Dyes, Pigments and Other Colouring Matter; Paints and Varnishes; Putty and other Mastics; Inks; Chapter 38:
Miscellaneous Chemical Products; Chapter 39: Plastics and articles thereof; 4002: Synthetic rubber and factice derived from oils, in primary forms or in plates, sheets or strip; mixtures of
any product of heading No.4001 with any product of this heading, in primary forms or in plates, sheets; Chapter 54: Man-made Filaments and Chapter 55: Man-made staple fibres.
Note : (i) $ Import and Export includes both technical and formulations.
(ii) Data Source in respect of imports and exports is DGCIS, M/o Commerce and Industry.
99

Table-13: Exports of Major Chemicals (Group Wise) during 2013-14 to 2020-21
(Qty. in MT ; Value in Rs. Lakh)
GROUP
2013-14 2014-15 2015-16 2016-17 2017-18 2018-19 2019-20 2020-21
QTY. VALUE QTY. VALUE QTY. VALUE QTY. VALUE QTY. VALUE QTY. VALUE QTY. VALUE QTY. VALUE
(1) (2) (3) (4) (5) (6) (7) (8) (9) (10) (11) (12) (13) (14) (15) (16) (17)
ALKALI CHEMICALS 164213 35747 73639 17660 106744 29210 154244 39591 273456 86880 239321 87844 329459 82760 428873 85310
INORGANIC CHEMICALS 167449 116036 163592 100558 156683 74466 377587 111322 173071 102270 176900 133248 196035 134079 194941 119206
ORGANIC CHEMICALS 335353 343064 240545 249461 231728 216771 190306 232940 204923 320492 233147 425738 244524 422713 295922 438010
PESTICIDES &
INSECTICIDES $ 206960 985161 230227 974682 266915 1126874 342331 1315026 358481 1481031 404783 2004132 398069 2163297 470787 2380601
DYES & PIGMENTS 346539 1145588 353220 1285827 376046 1219795 419272 1307546 485741 1439290 525170 1800681 530297 1928414 514395 1770381
EXPORTS OF MAJOR CHEMICALS
1220514 2625596 1061223 2628188 1138116 2667116 1483740 3006425 1495672 3429963 1579321 4451643 1698384 4731263 1904918 4793508
Source: Imports & Exports data have been received from DGCIS, Ministry of Commerce & Industry.
Note : $ Import and Export includes both technical and formulations.
100

Table-14: Imports of Major Chemicals (Group Wise) during 2013-14 to 2020-21
(Qty. in MT ; Value in Rs. Lakh)
GROUP
2013-14 2014-15 2015-16 2016-17 2017-18 2018-19 2019-20 2020-21
QTY. VALUE QTY. VALUE QTY. VALUE QTY. VALUE QTY. VALUE QTY. VALUE QTY. VALUE QTY. VALUE
(1) (2) (3) (4) (5) (6) (7) (8) (9) (10) (11) (12) (13) (14) (15) (16) (17)
ALKALI CHEMICALS 874159 152967 1134146 206474 1117878 218199 1121137 215051 1193978 265347 1049124 225523 1157130 240752 967827 170499
INORGANIC CHEMICALS 873906 265840 911969 267873 1009821 237368 1010071 235237 1228854 308363 1579667 485763 1531826 354602 1187990 302101
ORGANIC CHEMICALS 2495989 957223 2885815 995356 3143476 865684 3170287 904366 3407051 1207748 3644781 1520278 3775333 1078053 3715724 1124697
PESTICIDES &
INSECTICIDES $
37099
335996
40674
374050
33868
390707
42591
490581
44145
581385
49233
632590
42580
611078
66190
899057
DYES & PIGMENTS 52315 208985 51935 214741 54691 219304 55868 214913 62971 231383 56452 278422 50583 281435 45339 252666
IMPORTS OF MAJOR
CHEMICALS 4333468 1921011 5024539 2058494 5359734 1931262 5399954 2060148 5936999 2594226 6379257 3142576 6557452 2565920 5983070 2749020
Source: Imports & Exports data have been received from DGCIS, Ministry of Commerce & Industry.
Note : $ Import and Export includes both technical and formulations.
101

Table-15: Net Imports of Major Chemicals (Group Wise) during 2013-14 to 2020-21
(Qty. in MT ; Value in Rs. Lakh)
GROUP
2013-14 2014-15 2015-16 2016-17 2017-18 2018-19 2019-20 2020-21
QTY. VALUE QTY. VALUE QTY. VALUE QTY. VALUE QTY. VALUE QTY. VALUE QTY. VALUE QTY. VALUE
(1) (2) (3) (4) (5) (6) (7) (8) (9) (10) (11) (12) (13) (14) (15) (16) (17)
ALKALI CHEMICALS 709946 117220 1060507 188814 1011134 188989 966893 175460 920522 178467 809803 137679 827671 157992 538954 85189
INORGANIC CHEMICALS 706457 149804 748377 167315 853138 162902 632484 123915 1055783 206093 1402767 352515 1335791 220523 993049 182895
ORGANIC CHEMICALS 2160636 614159 2645270 745895 2911748 648913 2979981 671426 3202128 887256 3411634 1094540 3530809 655340 3419802 686687
PESTICIDES &
INSECTICIDES $ -169861 -649165 -189553 -600632 -233047 -736167 -299740 -824445 -314336 -899646 -355550 -1371542 -355489 -1552219 -404597 -1481544
DYES & PIGMENTS -294224 -936603 -301285 -1071086 -321355 -1000491 -363404 -1092633 -422770 -1207907 -468718 -1522259 -479714 -1646979 -469056 -1517715
NET IMPORTS OF
MAJOR CHEMICALS 3112954 -704585 3963316 -569694 4221618 -735854 3916214 -946277 4441327 -835737 4799936 -1309067 4859068 -2165343 4078152 -2044488
Source: Imports & Exports data have been received from DGCIS, Ministry of Commerce & Industry.
Note : $ Import and Export includes both technical and formulations.
102

Table 16 : Exports of Major Chemicals (Productwise) during 2013-14 to 2020-21
[QTY in MT & VAL in Rs. Lakh]
PRODUCT
2013-14 2014-15 2015-16 2016-17 2017-18 2018-19 2019-20 2020-21
QTY VAL QTY VAL QTY VAL QTY VAL QTY VAL QTY VAL QTY VAL QTY VAL
(1) (2) (3) (4) (5) (6) (7) (8) (9) (10) (11) (12) (13) (14) (15) (16) (17)
ALKALI CHEMICALS
SODA ASH 84254 12506 27720 5166 18613 3927 64377 10793 110087 19377 62457 15202 137749 27137 149721 23725
CAUSTIC SODA 76059 22568 42200 11973 82144 23807 84809 27773 159630 66829 172165 71663 187494 54532 275374 60246
LIQUID CHLORINE 3900 673 3719 521 5987 1476 5058 1025 3739 674 4699 979 4216 1091 3778 1339
TOTAL 164213 35747 73639 17660 106744 29210 154244 39591 273456 86880 239321 87844 329459 82760 428873 85310
INORGANIC CHEMICALS
ALUMINIUM FLUORIDE 3658 2571 2831 1980 1796 1240 321 265 206 204 442 363 1362 1210 2046 1872
CALCIUM CARBIDE 268 148 412 230 371 206 493 284 464 258 325 204 371 244 129 112
CARBON BLACK 123679 88731 114119 77832 114668 55019 332172 87414 122287 72959 122832 103643 144017 103457 138724 85640
POTASSIUM CHLORATE 724 451 634 492 758 576 1658 1145 1941 1245 3024 2124 3178 2190 2595 1803
SODIUM CHLORATE 7 10 31 21 13 13 118 56 1075 256 810 41 0 6 5 5
TITANIUM DIOXIDE 9051 12853 5158 7108 4436 5582 8183 10216 9560 15377 7345 12743 6235 10654 6483 11521
RED PHOSPHORUS 411 1557 360 1299 482 1777 454 1757 455 1716 595 2242 650 2567 582 2460
HYDROGEN PEROXIDE 544 217 244 143 351 222 270 284 116 214 263 225 808 482 3077 1053
CALCIUM CARBONATE 29107 9498 39803 11453 33808 9831 33918 9901 36967 10041 41264 11663 39414 13269 41300 14740
TOTAL 167449 116036 163592 100558 156683 74466 377587 111322 173071 102270 176900 133248 196035 134079 194941 119206
ORGANIC CHEMICALS
ACETIC ACID 7338 3134 6489 3449 8378 5181 12914 6277 12220 5401 17821 10476 12746 6265 10697 6270
ACETIC ANHYDRIDE 6430 3470 20098 11565 18605 9941 20443 10277 19644 13743 18444 13582 20529 12815 23960 15302
ACETONE 674 628 3182 2975 10778 6392 3225 2201 5054 3173 10901 5904 11004 5646 28161 19355
PHENOL 2142 3230 2009 3338 6841 7379 4013 8192 4750 9709 4724 11740 22273 23408 53100 39575
METHANOL 81917 22584 49463 11525 44013 8196 12624 3123 9466 2846 10943 3819 12941 3482 8451 2607
FORMALDEHYDE 6369 2020 7467 1213 8480 1383 8406 1548 10616 2098 12484 2495 14153 2484 15241 2734
NITROBENZENE 146 131 150 137 49 38 344 231 60 49 103 110 133 131 98 99
CITRIC ACID 2013 1671 1737 1364 1487 1144 1670 1244 2393 1931 2323 2010 2411 1942 2296 2018
MALEIC ANHYDRIDE 27 36 37 47 80 67 232 164 233 227 87 105 167 193 50 62
PENTAERYTHRITOL 1460 2277 1557 2516 1632 2958 2044 3470 2110 3399 2287 4161 2584 4741 1336 2550
ANILINE 94 143 86 141 129 134 168 207 162 614 137 341 68 148 68 89
103

Table 16 : Exports of Major Chemicals (Productwise) during 2013-14 to 2020-21
[QTY in MT & VAL in Rs. Lakh]
PRODUCT
2013-14 2014-15 2015-16 2016-17 2017-18 2018-19 2019-20 2020-21
QTY VAL QTY VAL QTY VAL QTY VAL QTY VAL QTY VAL QTY VAL QTY VAL
(1) (2) (3) (4) (5) (6) (7) (8) (9) (10) (11) (12) (13) (14) (15) (16) (17)
CHLORO METHANES 35 353 144 236 38 41 89 121 101 283 75 149 49 107 68 156
ISOBUTYLBENZENE 14156 21087 13944 19250 12572 14186 13430 14854 12341 14384 11740 16320 9705 14150 16156 20894
ONCB 2555 2428 2231 2283 843 883 973 950 0 0 0 0 0 0 0 0
PNCB 2370 1763 843 564 1670 1114 1023 738 0 0 0 0 0 0 0 0
MEK 460 2382 673 922 184 795 189 98 19 36 465 477 243 245 66 75
ACETALDEHYDE 37 118 25 140 2 4 40 44 3 6 1148 912 1139 893 1027 692
ETHANOLAMINES 1235 4665 1027 3696 1129 7119 1692 4996 4801 14201 3143 13553 1686 10522 2760 11850
ETHYL ACETATE 190187 103855 115096 67934 104814 54269 93699 48020 105551 62174 118682 82170 108384 63095 108725 69937
MENTHOL 14988 166411 13135 115160 8836 94548 12006 125246 12749 183951 13351 253213 17089 265334 19980 240427
ORTHO NITRO TOLUENE 720 678 1152 1006 1168 999 1082 939 2650 2267 4289 4201 7220 7112 3682 3318
TOTAL 335353 343064 240545 249461 231728 216771 190306 232940 204923 320492 233147 425738 244524 422713 295922 438010
PESTICIDES & INSECTICIDES
MALATHION 415 819 1260 2346 1010 1943 1264 2274 1977 3682 2499 5792 2318 6230 1673 5079
DIMETHOATE 184 679 369 1327 20 52 24 58 24 62 126 429 199 603 154 590
D.D.V.P. 298 707 564 1449 550 1461 322 1145 493 1835 689 2716 12 41 639 2620
QUINALPHOS 950 3360 996 3900 235 1036 384 1772 382 1645 281 1439 338 1606 522 2909
ENDOSULPHAN 45 59 0 0 0 0 0 0 0 1 0 0 0 0 0 0
CYPERMETHRIN 11982 58546 10487 50407 8837 45949 9416 45742 9706 62713 13609 112381 15122 95462 18945 106342
FENTHION 0 0 0 0 0 0 10 18 0 0 0 0 0 0 0 0
OTHER PESTICIDES 48228 206246 37862 178366 41058 214054 45560 208648 43320 216510 39174 233275 7416 28448 6155 23536
OTHER INSECTICIDES 48918 372937 45483 344754 31146 276427 41471 311285 50008 393497 62714 580271 106352 840555 111743 833725
COPPER-OXYCHLORIDE 417 1155 867 2311 810 1818 871 1921 723 1732 806 2427 2240 5896 1603 5135
2, 4-D 14851 27924 10938 18095 19449 29770 20677 27496 24125 36076 22242 46347 19623 32924 21097 33198
ISOPROTURON 2114 7804 2150 7972 1087 3830 356 1295 0 0 0 0 0 0 0 0
ALUMINIUM PHOSPHIDE 853 3703 223 562 64 226 127 515 505 1703 481 2084 426 1909 764 3024
METHYL BROMIDE 383 1333 551 1940 1274 4641 1756 6229 2000 7292 2208 8384 1628 6682 2089 9966
SPROUTING PRODUCTS 15005 130898 19150 151055 32381 266182 50720 362041 67039 425113 74058 595122 79434 717390 101726 857814
OTHER FUNGICIDE NES 62317 168991 99327 210198 128994 279485 169373 344587 158179 329170 185896 413465 162961 425551 203677 496663
104

Table 16 : Exports of Major Chemicals (Productwise) during 2013-14 to 2020-21
[QTY in MT & VAL in Rs. Lakh]
PRODUCT
2013-14 2014-15 2015-16 2016-17 2017-18 2018-19 2019-20 2020-21
QTY VAL QTY VAL QTY VAL QTY VAL QTY VAL QTY VAL QTY VAL QTY VAL
(1) (2) (3) (4) (5) (6) (7) (8) (9) (10) (11) (12) (13) (14) (15) (16) (17)
TOTAL 206960 985161 230227 974682 266915 1126874 342331 1315026 358481 1481031 404783 2004132 398069 2163297 470787 2380601
DYES & PIGMENTS
AZO DYES 57392 172261 51902 194665 55327 161970 60390 162456 69996 181785 72999 225224 68352 210313 64125 179167
THAN AZO) 5637 21363 4004 20146 3559 17300 4434 19689 5098 21655 5103 26145 5601 28666 5892 29584
BASIC DYES 7148 19082 7646 21701 8173 23896 9229 26186 10757 32222 12017 44585 12730 48887 13585 51140
DISPERSE DYES 9248 33190 12065 48545 13117 52818 16078 59912 14460 56914 20552 107647 23362 133160 18521 93517
FAST COLOUR BASES 2619 10191 2806 11890 2262 11868 2174 15766 2042 9726 2652 14987 5364 46929 3667 21816
OIL SOLUBLE (SOLVENT DYES) 4965 23306 6826 32614 6123 31703 8702 39439 8995 42906 10195 66808 11091 76571 9106 65358
OPTICAL WHITENING AGENTS 23381 36889 27211 44223 25203 46519 26957 46240 30124 48069 30259 66858 26084 82724 21458 44381
ORGANIC PIGMENT 15 100 191 500 75 531 71 293 62 185 15 98 50 333 67 229
PIGMENT EMULSION 71335 353119 76407 365943 81536 374190 88980 392700 102051 441253 110526 494598 110669 534039 116980 581196
REACTIVE DYES 110018 340284 107369 392147 113224 344963 128417 379350 147417 413080 158530 511426 169648 502283 152579 426490
BLACK) 1141 1575 1993 2627 1472 1945 2023 2682 5467 5794 5720 7303 4510 5233 3701 4115
VAT DYES 1955 24387 2132 31855 1364 20523 1404 22737 1707 26607 4475 46284 4524 64023 3643 63587
SOLUBILISED VAT DYES 31 491 29 283 36 354 31 265 46 529 63 789 71 1185 83 759
FOOD COLOURS 22893 65439 26034 77218 27101 79537 28359 79492 31110 87129 29007 107344 25347 107786 30271 118294
NAPTHOLS 887 2597 1139 3113 1489 3463 2076 4753 2329 5725 3276 8341 4169 11467 4982 10894
OTHER DYES 9558 23840 9612 27865 10159 22693 12711 24977 13735 26227 13621 31196 15218 34504 17473 34086
INORGANIC PIGMENTS 18316 17474 15854 10492 25826 25522 27236 30609 40345 39484 46160 41048 43507 40311 48262 45768
TOTAL 346539 1145588 353220 1285827 376046 1219795 419272 1307546 485741 1439290 525170 1800681 530297 1928414 514395 1770381
Note: Data Source in respect of Imports and Exports is DGCIS, M/o Commerce and Industry.
105

Table 17 : Imports of Major Chemicals (Productwise) during 2013-14 to 2020-21
[QTY in MT & VAL in Rs. Lakh]
PRODUCT 2013-14 2014-15 2015-16 2016-17 2017-18 2018-19 2019-20 2020-21
QTY VAL QTY VAL QTY VAL QTY VAL QTY VAL QTY VAL QTY VAL QTY VAL
(1) (2) (3) (4) (5) (6) (7) (8) (9) (10) (11) (12) (13) (14) (15) (16) (17)
ALKALI CHEMICALS
SODA ASH 569420 79817 725517 112616 633263 101707 695307 102490 772622 111757 840591 144900 847704 152515 719731 114804
CAUSTIC SODA 304653 73038 407981 93584 484133 116303 425795 112391 421298 153382 208267 79927 309345 87982 248057 55495
LIQUID CHLORINE 86 112 648 274 482 189 35 170 58 208 266 696 81 255 39 200
TOTAL 874159 152967 1134146 206474 1117878 218199 1121137 215051 1193978 265347 1049124 225523 1157130 240752 967827 170499
INORGANIC CHEMICALS
ALUMINIUM FLUORIDE 24542 17383 30120 20259 27258 18102 46564 26437 49758 29075 62374 56075 40362 37910 61224 48059
CALCIUM CARBIDE 64239 26743 78332 31525 61935 25429 55692 23652 55651 23941 45321 21554 31218 14507 32666 17749
CARBON BLACK 145939 112823 139468 108915 124059 83401 128740 82424 186224 143618 278531 249368 197491 153367 190469 127583
POTASSIUM CHLORATE 7040 4357 6147 3856 3160 2026 100 61 29 22 128 272 55 119 909 884
SODIUM CHLORATE 28083 11570 21818 9085 17298 6400 7447 2907 8822 3041 14240 5884 24082 11254 11589 5118
TITANIUM DIOXIDE 16875 29196 17574 28243 16421 25709 13901 22943 13701 24771 14546 28686 16416 30825 13389 25107
RED PHOSPHORUS 266 750 36 98 0 0 0 1 0 3 14 51 18 57 4 18
HYDROGEN PEROXIDE 62527 16443 56276 14311 44084 11211 57068 15910 68474 19305 84261 36931 52727 15858 22355 8150
CALCIUM CARBONATE 524395 46575 562198 51581 715606 65090 700559 60902 846195 64587 1080252 86942 1169457 90705 855385 69433
TOTAL 873906 265840 911969 267873 1009821 237368 1010071 235237 1228854 308363 1579667 485763 1531826 354602 1187990 302101
ORGANIC CHEMICALS
ACETIC ACID 664797 197806 712384 234821 792775 206305 847808 193958 884515 290624 937298 422360 926492 273709 904345 275694
ACETIC ANHYDRIDE 1792 985 2689 1538 2918 1780 2272 1118 4381 2346 12275 9700 20529 11716 18807 10479
ACETONE 116758 81421 126832 82658 138402 55796 135887 63055 146878 74975 116760 52108 72402 28094 82056 53673
PHENOL 214096 172402 200115 183502 248769 147715 282187 176601 288572 202842 231808 217710 144005 99070 170993 89789
METHANOL 1310438 341804 1641624 319399 1711879 285259 1637457 295762 1783293 400004 1986712 519474 2286274 425567 2219944 434805
FORMALDEHYDE 433 216 412 225 66 42 84 248 46 44 22 13 5 111 6 148
NITROBENZENE 0 4 1208 802 5838 2733 14429 6944 15384 8207 18204 10721 15533 8073 9866 5008
CITRIC ACID 64099 31694 67369 33345 75978 36119 81681 39558 84262 45489 95283 45136 90958 38453 94966 47550
MALEIC ANHYDRIDE 36751 39695 38388 35773 47399 31392 50813 34618 52627 42928 69920 61694 66942 46858 59533 46705
PENTAERYTHRITOL 15650 16423 13681 14646 19486 21468 19380 20690 17963 19614 18407 23000 21311 23116 13613 13022
ANILINE 31742 34853 36095 36876 38341 26965 44650 29368 65416 58924 88454 81524 80946 53293 72770 47402
CHLORO METHANES 143 296 113 289 608 364 258 223 519 429 1413 1089 2404 2122 2469 2111
ISOBUTYLBENZENE 26 19 0 0 0 0 0 0 0 0 0 0 2 4 0 0
ONCB 672 589 395 410 237 192 839 628 0 0 0 0 0 0 0 0
PNCB 398 295 3838 2301 8408 3886 6095 2899 0 0 0 0 0 0 0 0
MEK 27239 23186 27539 25599 40883 26950 30901 16629 45331 36027 47158 40994 25509 19145 42542 33013
106

Table 17 : Imports of Major Chemicals (Productwise) during 2013-14 to 2020-21
[QTY in MT & VAL in Rs. Lakh]
PRODUCT 2013-14 2014-15 2015-16 2016-17 2017-18 2018-19 2019-20 2020-21
QTY VAL QTY VAL QTY VAL QTY VAL QTY VAL QTY VAL QTY VAL QTY VAL
(1) (2) (3) (4) (5) (6) (7) (8) (9) (10) (11) (12) (13) (14) (15) (16) (17)
ACETALDEHYDE 97 436 53 176 74 299 130 357 81 243 94 275 113 375 82 568
ETHANOLAMINES 10023 10652 11286 17183 10072 10321 11662 10202 16101 16140 16648 19347 16694 16398 19070 17807
ETHYL ACETATE 240 466 201 453 290 909 1664 861 43 127 2917 2358 2157 1768 141 1697
MENTHOL 457 3889 507 4307 936 7112 1511 10211 1372 8573 1334 12718 3057 30181 4521 45226
ORTHO NITRO TOLUENE 138 92 1086 1053 117 77 579 436 267 212 74 57 0 0 0 0
TOTAL 2495989 957223 2885815 995356 3143476 865684 3170287 904366 3407051 1207748 3644781 1520278 3775333 1078053 3715724 1124697
PESTICIDES & INSECTICIDES
DIMETHOATE 46 106 0 0 0 0 0 0 0 0 0 0 0 0 63 326
D.D.V.P. 70 99 20 36 64 116 16 28 35 66 1561 3167 0 0 0 0
QUINALPHOS 0 0 0 0 0 0 0 0 0 0 0 0 15 81 0 0
CYPERMETHRIN 4 11 0 0 0 0 0 0 8 47 5 53 93 849 6 57
FENTHION 35 173 50 236 0 0 0 0 0 0 0 0 0 0 0 0
OTHER PESTICIDES 2255 13747 2007 12072 1318 12700 1176 91641 1907 139991 1868 163792 4534 131268 5453 216253
OTHER INSECTICIDES 19563 194422 19369 205845 15634 213829 18067 208838 17307 239549 17188 240036 13525 268040 16512 343526
COPPER-OXYCHLORIDE 48 122 0 0 0 0 0 1 0 1 0 2 0 0 0 0
2, 4-D 0 0 34 77 72 123 16 27 1824 2735 2819 5935 2382 4311 2412 3657
ISOPROTURON 0 0 0 0 0 0 0 0 0 0 3 4 0 0 0 0
ALUMINIUM PHOSPHIDE 8 61 3 54 6 98 0 0 0 0 5 39 1 27 7 40
METHYL BROMIDE 460 1652 269 1150 53 250 24 70 18 107 2 14 28 141 12 63
OTHER HERBICIDES-ANTI SPROUTING
PRODUCTS 10056 85938 12294 86257 10171 85167 16149 104626 15248 100387 18044 122207 14232 104807 30307 189422
OTHER FUNGICIDE NES 4554 39665 6628 68323 6550 78424 7143 85350 7798 98502 7738 97341 7770 101554 11418 145713
TOTAL 37099 335996 40674 374050 33868 390707 42591 490581 44145 581385 49233 632590 42580 611078 66190 899057
DYES & PIGMENTS
AZO DYES 669 3559 1114 5148 716 4016 630 3509 514 3734 437 4207 306 4096 298 3880
ACID DIRECT DYES(OTHER THAN AZO) 729 2136 436 2036 312 1685 188 1348 248 1942 322 2639 133 1295 163 1073
BASIC DYES 1075 6569 724 5266 475 4135 560 4183 647 5445 487 6868 529 8213 735 9836
DISPERSE DYES 8788 33194 4671 26330 6199 28647 4970 23618 4051 23972 1731 19295 2322 23128 2314 20496
FAST COLOUR BASES 499 2653 327 2864 510 3058 426 2314 379 2113 169 1743 265 2149 260 2414
OIL SOLUBLE (SOLVENT DYES) 1131 7329 782 6414 689 5967 762 5446 846 6414 710 7812 590 6250 525 6140
OPTICAL WHITENING AGENTS 675 4708 565 4442 664 5376 612 5455 593 5540 565 6978 738 8746 588 6492
ORGANIC PIGMENT 178 694 142 575 190 889 100 678 65 271 138 471 98 272 107 646
PIGMENT EMULSION 7069 46089 6663 48423 6578 47122 7085 47759 8261 52679 7985 57272 7303 54365 6443 53389
107

Table 17 : Imports of Major Chemicals (Productwise) during 2013-14 to 2020-21
[QTY in MT & VAL in Rs. Lakh]
PRODUCT 2013-14 2014-15 2015-16 2016-17 2017-18 2018-19 2019-20 2020-21
QTY VAL QTY VAL QTY VAL QTY VAL QTY VAL QTY VAL QTY VAL QTY VAL
(1) (2) (3) (4) (5) (6) (7) (8) (9) (10) (11) (12) (13) (14) (15) (16) (17)
REACTIVE DYES 3352 24425 3146 26556 3148 27009 3460 28744 3340 24642 3117 26440 3661 27931 2962 21959
SULPHUR DYES (SULPHUR BLACK) 1781 2498 1151 2537 1332 2636 1283 2638 1252 2916 1116 3286 1041 3128 1337 3294
VAT DYES 13801 36889 17449 43388 20580 48846 23527 53539 26368 59134 21571 77638 16400 63470 13310 40263
SOLUBILISED VAT DYES 91 418 82 252 473 1007 337 756 319 764 358 1289 170 810 108 463
FOOD COLOURS 391 2978 653 3872 1083 5225 1041 4859 1162 5057 1364 6747 1215 6695 375 6268
NAPTHOLS 1142 4190 1024 3896 1051 3824 1107 3750 1286 4446 1255 5267 1374 6559 1465 5757
OTHER DYES 291 1927 271 1868 177 1531 183 1533 512 2239 2337 7151 2265 7188 2332 7239
INORGANIC PIGMENTS 10653 28729 12735 30874 10514 28331 9597 24784 13128 30075 12790 43319 12173 57140 12017 63057
TOTAL 52315 208985 51935 214741 54691 219304 55868 214913 62971 231383 56452 278422 50583 281435 45339 252666
Note: Data Source in respect of Imports and Exports is DGCIS, M/o Commerce and Industry.
108

Table 18: Net Imports of Major Chemicals (Product-wise) during 2013-14 to 2020-21
[QTY in MT & VAL in Rs. Lakh]
PRODUCT 2013-14 2014-15 2015-16 2016-17 2017-18 2018-19 2019-20 2020-21
QTY VAL QTY VAL QTY VAL QTY VAL QTY VAL QTY VAL QTY VAL QTY VAL
(1) (2) (3) (4) (5) (6) (7) (8) (9) (10) (11) (12) (13) (14) (15) (16) (17)
ALKALI CHEMICALS
SODA ASH 485166 67311 697797 107450 614650 97780 630930 91697 662535 92380 778134 129698 709955 125378 570010 91079
CAUSTIC SODA 228594 50470 365781 81611 401989 92496 340986 84618 261668 86553 36102 8264 121851 33450 -27317 -4751
LIQUID CHLORINE -3814 -561 -3071 -247 -5505 -1287 -5023 -855 -3681 -466 -4433 -283 -4135 -836 -3739 -1139
TOTAL 709946 117220 1060507 188814 1011134 188989 966893 175460 920522 178467 809803 137679 827671 157992 538954 85189
INORGANIC CHEMICALS
ALUMINIUM FLUORIDE 20884 14812 27289 18279 25462 16862 46243 26172 49552 28871 61932 55712 39000 36700 59178 46187
CALCIUM CARBIDE 63971 26595 77920 31295 61564 25223 55199 23368 55187 23683 44996 21350 30847 14263 32537 17637
CARBON BLACK 22260 24092 25349 31083 9391 28382 -203432 -4990 63937 70659 155699 145725 53474 49910 51745 41943
POTASSIUM CHLORATE 6316 3906 5513 3364 2402 1450 -1558 -1084 -1912 -1223 -2896 -1852 -3123 -2071 -1686 -919
SODIUM CHLORATE 28076 11560 21787 9064 17285 6387 7329 2851 7747 2785 13430 5843 24082 11248 11584 5113
TITANIUM DIOXIDE 7824 16343 12416 21135 11985 20127 5718 12727 4141 9394 7201 15943 10181 20171 6906 13586
RED PHOSPHORUS -145 -807 -324 -1201 -482 -1777 -454 -1756 -455 -1713 -581 -2191 -632 -2510 -578 -2442
HYDROGEN PEROXIDE 61983 16226 56032 14168 43733 10989 56798 15626 68358 19091 83998 36706 51919 15376 19278 7097
CALCIUM CARBONATE 495288 37077 522395 40128 681798 55259 666641 51001 809228 54546 1038988 75279 1130043 77436 814085 54693
TOTAL 706457 149804 748377 167315 853138 162902 632484 123915 1055783 206093 1402767 352515 1335791 220523 993049 182895
ORGANIC CHEMICALS
ACETIC ACID 657459 194672 705895 231372 784397 201124 834894 187681 872295 285223 919477 411884 913746 267444 893648 269424
ACETIC ANHYDRIDE -4638 -2485 -17409 -10027 -15687 -8161 -18171 -9159 -15263 -11397 -6169 -3882 0 -1099 -5153 -4823
ACETONE 116084 80793 123650 79683 127624 49404 132662 60854 141824 71802 105859 46204 61398 22448 53895 34318
PHENOL 211954 169172 198106 180164 241928 140336 278174 168409 283822 193133 227084 205970 121732 75662 117893 50214
METHANOL 1228521 319220 1592161 307874 1667866 277063 1624833 292639 1773827 397158 1975769 515655 2273333 422085 2211493 432198
FORMALDEHYDE -5936 -1804 -7055 -988 -8414 -1341 -8322 -1300 -10570 -2054 -12462 -2482 -14148 -2373 -15235 -2586
NITROBENZENE -146 -127 1058 665 5789 2695 14085 6713 15324 8158 18101 10611 15400 7942 9768 4909
CITRIC ACID 62086 30023 65632 31981 74491 34975 80011 38314 81869 43558 92960 43126 88547 36511 92670 45532
MALEIC ANHYDRIDE 36724 39659 38351 35726 47319 31325 50581 34454 52394 42701 69833 61589 66775 46665 59483 46643
PENTAERYTHRITOL 14190 14146 12124 12130 17854 18510 17336 17220 15853 16215 16120 18839 18727 18375 12277 10472
ANILINE 31648 34710 36009 36735 38212 26831 44482 29161 65254 58310 88317 81183 80878 53145 72702 47313
CHLORO METHANES 108 -57 -31 53 570 323 169 102 418 146 1338 940 2355 2015 2401 1955
ISOBUTYLBENZENE -14130 -21068 -13944 -19250 -12572 -14186 -13430 -14854 -12341 -14384 -11740 -16320 -9703 -14146 -16156 -20894
ONCB -1883 -1839 -1836 -1873 -606 -691 -134 -322 0 0 0 0 0 0 0 0
PNCB -1972 -1468 2995 1737 6738 2772 5072 2161 0 0 0 0 0 0 0 0
109

Table 18: Net Imports of Major Chemicals (Product-wise) during 2013-14 to 2020-21
[QTY in MT & VAL in Rs. Lakh]
PRODUCT 2013-14 2014-15 2015-16 2016-17 2017-18 2018-19 2019-20 2020-21
QTY VAL QTY VAL QTY VAL QTY VAL QTY VAL QTY VAL QTY VAL QTY VAL
(1) (2) (3) (4) (5) (6) (7) (8) (9) (10) (11) (12) (13) (14) (15) (16) (17)
MEK 26779 20804 26866 24677 40699 26155 30712 16531 45312 35991 46693 40517 25266 18900 42476 32938
ACETALDEHYDE 60 318 28 36 72 295 90 313 78 237 -1054 -637 -1026 -518 -945 -124
ETHANOLAMINES 8788 5987 10259 13487 8943 3202 9970 5206 11300 1939 13505 5794 15008 5876 16310 5957
ETHYL ACETATE -189947 -103389 -114895 -67481 -104524 -53360 -92035 -47159 -105508 -62047 -115765 -79812 -106227 -61327 -108584 -68240
MENTHOL -14531 -162522 -12628 -110853 -7900 -87436 -10495 -115035 -11377 -175378 -12017 -240495 -14032 -235153 -15459 -195201
ORTHO NITRO TOLUENE -582 -586 -66 47 -1051 -922 -503 -503 -2383 -2055 -4215 -4144 -7220 -7112 -3682 -3318
TOTAL 2160636 614159 2645270 745895 2911748 648913 2979981 671426 3202128 887256 3411634 1094540 3530809 655340 3419802 686687
PESTICIDES & INSECTICIDES
MALATHION -415 -819 -1260 -2346 -1010 -1943 -1264 -2274 -1977 -3682 -2499 -5792 -2318 -6230 -1673 -5079
DIMETHOATE -138 -573 -369 -1327 -20 -52 -24 -58 -24 -62 -126 -429 -199 -603 -91 -264
D.D.V.P. -228 -608 -544 -1413 -486 -1345 -306 -1117 -458 -1769 872 451 -12 -41 -639 -2620
QUINALPHOS -950 -3360 -996 -3900 -235 -1036 -384 -1772 -382 -1645 -281 -1439 -323 -1525 -522 -2909
ENDOSULPHAN -45 -59 0 0 0 0 0 0 0 -1 0 0 0 0 0 0
CYPERMETHRIN -11978 -58535 -10487 -50407 -8837 -45949 -9416 -45742 -9698 -62666 -13604 -112328 -15029 -94613 -18939 -106285
FENTHION 35 173 50 236 0 0 -10 -18 0 0 0 0 0 0 0 0
OTHER PESTICIDES -45973 -192499 -35855 -166294 -39740 -201354 -44384 -117007 -41413 -76519 -37306 -69483 -2882 102820 -702 192717
OTHER INSECTICIDES -29355 -178515 -26114 -138909 -15512 -62598 -23404 -102447 -32701 -153948 -45526 -340235 -92827 -572515 -95231 -490199
COPPER-OXYCHLORIDE -369 -1033 -867 -2311 -810 -1818 -871 -1920 -723 -1731 -806 -2425 -2240 -5896 -1603 -5135
2, 4-D -14851 -27924 -10904 -18018 -19377 -29647 -20661 -27469 -22301 -33341 -19423 -40412 -17241 -28613 -18685 -29541
ISOPROTURON -2114 -7804 -2150 -7972 -1087 -3830 -356 -1295 0 0 3 4 0 0 0 0
ALUMINIUM PHOSPHIDE -845 -3642 -220 -508 -58 -128 -127 -515 -505 -1703 -476 -2045 -425 -1882 -757 -2984
METHYL BROMIDE 77 319 -282 -790 -1221 -4391 -1732 -6159 -1982 -7185 -2206 -8370 -1600 -6541 -2077 -9903 OTHER HERBICIDES-ANTI SPROUTING
-4949 -44960 -6856 -64798 -22210 -181015 -34571 -257415 -51791 -324726 -56014 -472915 -65202 -612583 -71419 -668392
OTHER FUNGICIDE NES -57763 -129326 -92699 -141875 -122444 -201061 -162230 -259237 -150381 -230668 -178158 -316124 -155191 -323997 -192259 -350950
TOTAL -169861 -649165 -189553 -600632 -233047 -736167 -299740 -824445 -314336 -899646 -355550 -1371542 -355489 -1552219 -404597 -1475726
DYES & PIGMENTS
AZO DYES -56723 -168702 -50788 -189517 -54611 -157954 -59760 -158947 -69482 -178051 -72562 -221017 -68046 -206217 -63827 -175287
ACID DIRECT DYES(OTHER THAN AZO) -4908 -19227 -3568 -18110 -3247 -15615 -4246 -18341 -4850 -19713 -4781 -23506 -5468 -27371 -5729 -28511
BASIC DYES -6073 -12513 -6922 -16435 -7698 -19761 -8669 -22003 -10110 -26777 -11530 -37717 -12201 -40674 -12850 -41304
DISPERSE DYES -460 4 -7394 -22215 -6918 -24171 -11108 -36294 -10409 -32942 -18821 -88352 -21040 -110032 -16207 -73021
FAST COLOUR BASES -2120 -7538 -2479 -9026 -1752 -8810 -1748 -13452 -1663 -7613 -2483 -13244 -5099 -44780 -3407 -19402
OIL SOLUBLE (SOLVENT DYES) -3834 -15977 -6044 -26200 -5434 -25736 -7940 -33993 -8149 -36492 -9485 -58996 -10501 -70321 -8581 -59218
110

Table 18: Net Imports of Major Chemicals (Product-wise) during 2013-14 to 2020-21
[QTY in MT & VAL in Rs. Lakh]
PRODUCT 2013-14 2014-15 2015-16 2016-17 2017-18 2018-19 2019-20 2020-21
QTY VAL QTY VAL QTY VAL QTY VAL QTY VAL QTY VAL QTY VAL QTY VAL
(1) (2) (3) (4) (5) (6) (7) (8) (9) (10) (11) (12) (13) (14) (15) (16) (17)
OPTICAL WHITENING AGENTS -22706 -32181 -26646 -39781 -24539 -41143 -26345 -40785 -29531 -42529 -29694 -59880 -25346 -73978 -20870 -37889
ORGANIC PIGMENT 163 594 -49 75 115 358 29 385 3 86 123 373 48 -61 40 417
PIGMENT EMULSION -64266 -307030 -69744 -317520 -74958 -327068 -81895 -344941 -93790 -388574 -102541 -437326 -103366 -479674 -110537 -527807
REACTIVE DYES -106666 -315859 -104223 -365591 -110076 -317954 -124957 -350606 -144077 -388438 -155413 -484986 -165987 -474352 -149617 -404531
SULPHUR DYES (SULPHUR BLACK) 640 923 -842 -90 -140 691 -740 -44 -4215 -2878 -4604 -4017 -3469 -2105 -2364 -821
VAT DYES 11846 12502 15317 11533 19216 28323 22123 30802 24661 32527 17096 31354 11876 -553 9667 -23324
SOLUBILISED VAT DYES 60 -73 53 -31 437 653 306 491 273 235 295 500 99 -375 25 -296
FOOD COLOURS -22502 -62461 -25381 -73346 -26018 -74312 -27318 -74633 -29948 -82072 -27643 -100597 -24132 -101091 -29896 -112026
NAPTHOLS 255 1593 -115 783 -438 361 -969 -1003 -1043 -1279 -2021 -3074 -2795 -4908 -3517 -5137
OTHER DYES -9267 -21913 -9341 -25997 -9982 -21162 -12528 -23444 -13223 -23988 -11284 -24045 -12953 -27316 -15141 -26847
INORGANIC PIGMENTS -7663 11255 -3119 20382 -15312 2809 -17639 -5825 -27217 -9409 -33370 2271 -31334 16829 -36245 17289
TOTAL -294224 -936603 -301285 -1071086 -321355 -1000491 -363404 -1092633 -422770 -1207907 -468718 -1522259 -479714 -1646979 -469056 -1517715
Note: Data Source in respect of Imports and Exports is DGCIS, M/o Commerce and Industry.
111

Table 19: Top Five Export Destinations of selected Chemicals during 2020-21
PRODUCT COUNTRY QUANTITY(MT) VALUE(RS.Lakhs)
(1) (2) (3) (4)
SODA ASH
BANGLADESH PR 78949.607 11471.279
PHILIPPINES 16800.060 2219.562
INDONESIA 16244.152 2484.135
NEPAL 15613.022 2555.005
SRI LANKA DSR 9724.590 1702.846
Product Total 137331.431 20432.827
CAUSTIC SODA
SAUDI ARAB 23641.095 4080.539
TANZANIA REP 21755.435 4740.191
U ARAB EMTS 20318.244 3755.084
KENYA 20071.700 4169.648
Product Total 85786.474 16745.462
LIQUID CHLORINE
KENYA 1034.400 271.100
U ARAB EMTS 593.975 116.389
SRI LANKA DSR 427.000 37.381
QATAR 420.942 72.410
NIGERIA 302.000 201.578
Product Total 2778.317 698.858
ALUMINIUM FLUORIDE
U ARAB EMTS 1800.000 1705.756
JAPAN 120.000 137.904
TURKEY 100.060 12.449
SOUTH AFRICA 24.000 12.773
U K 1.000 1.354
Product Total 2045.060 1870.236
CALCIUM CARBIDE
BANGLADESH PR 82.000 62.212
BHUTAN 46.718 47.055
MOZAMBIQUE 0.200 0.721
GERMANY 0.190 0.298
U ARAB EMTS 0.140 0.245
Product Total 129.248 110.531
CARBON BLACK
SRI LANKA DSR 29468.043 16699.569
THAILAND 16834.685 10537.412
VIETNAM SOC REP 16146.610 8846.214
KOREA RP 13828.464 7575.604
U ARAB EMTS 9023.522 6923.208
Product Total 85301.324 50582.007
POTASSIUM CHLORATE
KENYA 600.000 390.691
MEXICO 553.000 379.785
PHILIPPINES 252.000 207.047
SRI LANKA DSR 150.000 103.140
TANZANIA REP 150.000 105.120
Product Total 1705.000 1185.783
SODIUM CHLORATE
SINGAPORE 5.000 3.677
NEPAL 0.119 0.819
MALAWI 0.002 0.120
UGANDA 0.002 0.030
ETHIOPIA 0.001 0.085
Product Total 5.124 4.731
TITANIUM DIOXIDE
U S A 2463.584 4327.552
ITALY 1220.100 2411.436
JAPAN 1135.000 1585.621
SRI LANKA DSR 147.907 250.698
EGYPT A RP 142.224 227.515
Product Total 5108.815 8802.822
112

Table 19: Top Five Export Destinations of selected Chemicals during 2020-21
PRODUCT COUNTRY QUANTITY(MT) VALUE(RS.Lakhs)
(1) (2) (3) (4)
RED PHOSPHORUS
U S A 144.067 566.695
U ARAB EMTS 90.500 436.383
RUSSIA 67.500 231.362
BRAZIL 40.000 181.406
EGYPT A RP 33.000 139.209
Product Total 375.067 1555.055
HYDROGEN PEROXIDE
QATAR 878.005 233.190
U ARAB EMTS 362.600 95.709
GHANA 308.000 91.643
MAURITIUS 292.282 102.049
NEPAL 274.759 108.373
Product Total 2115.646 630.964
CALCIUM CARBONATE
NEPAL 20609.359 4723.616
SOUTH AFRICA 3779.972 1171.730
BANGLADESH PR 3036.791 2329.172
SRI LANKA DSR 2617.469 606.346
ETHIOPIA 1573.258 470.527
Product Total 31616.849 9301.391
ACETIC ACID
BANGLADESH PR 4037.965 2041.124
SPAIN 1500.000 1110.075
SRI LANKA DSR 645.770 363.972
U ARAB EMTS 481.850 198.678
OMAN 452.574 273.758
Product Total 7118.159 3987.607
ACETIC ANHYDRIDE
BELGIUM 18750.979 11593.829
NETHERLAND 1920.000 1394.281
BANGLADESH PR 1240.800 828.071
U S A 520.975 261.491
VIETNAM SOC REP 370.200 303.429
Product Total 22802.954 14381.101
ACETONE
BRAZIL 5690.380 3716.203
NETHERLAND 4744.778 2934.733
CHINA P RP 3879.740 2204.640
U S A 3308.750 2213.627
MEXICO 2531.000 1712.649
Product Total 20154.648 12781.852
PHENOL
CHINA P RP 29934.267 16335.861
IRAN 5152.570 3546.503
BRAZIL 5137.792 3549.704
TURKEY 3509.441 2484.803
U ARAB EMTS 2724.132 1925.010
Product Total 46458.202 27841.881
METHANOL
NEPAL 3620.283 1026.339
SRI LANKA DSR 1747.692 464.709
KENYA 1227.108 380.480
TANZANIA REP 889.663 255.908
UGANDA 388.543 112.904
Product Total 7873.289 2240.340
FORMALDEHYDE
NEPAL 12061.889 1871.562
BHUTAN 661.735 125.718
KENYA 502.970 126.246
U ARAB EMTS 280.360 66.938
QATAR 260.600 53.910
113

Table 19: Top Five Export Destinations of selected Chemicals during 2020-21
PRODUCT COUNTRY QUANTITY(MT) VALUE(RS.Lakhs)
(1) (2) (3) (4) Product Total 13767.554 2244.374
NITROBENZENE
THAILAND 46.250 43.346
JAPAN 20.000 15.675
NEPAL 17.665 16.845
U S A 10.000 17.707
CAMBODIA 3.000 3.977
Product Total 96.915 97.550
CITRIC ACID
U S A 835.434 760.737
LITHUANIA 700.000 434.259
SPAIN 200.000 128.845
SRI LANKA DSR 84.712 104.816
PUERTO RICO 74.000 72.660
Product Total 1894.146 1501.317
MALEIC ANHYDRIDE
BANGLADESH PR 24.500 33.286
SRI LANKA DSR 16.000 15.874
NEPAL 9.400 12.133
GERMANY 0.050 0.103
ETHIOPIA 0.010 0.118
Product Total 49.960 61.514
PENTAERYTHRITOL
U S A 640.000 1181.041
NETHERLAND 216.020 293.771
BELGIUM 190.000 671.929
COLOMBIA 108.000 151.540
NEPAL 90.207 102.233
Product Total 1244.227 2400.514
ANILINE
U S A 32.000 37.569
TURKEY 18.004 24.942
THAILAND 10.000 11.605
MEXICO 6.000 9.594
BRAZIL 0.800 1.833
Product Total 66.804 85.543
CHLORO METHANES
SAUDI ARAB 37.741 58.373
U ARAB EMTS 16.450 28.617
SINGAPORE 7.260 17.366
U S A 6.080 29.460
MALAWI 0.810 0.599
Product Total 68.341 134.415
ISOBUTYLBENZENE
CHINA P RP 11435.004 15246.050
U S A 4714.000 5627.522
NETHERLAND 5.000 16.674
VIETNAM SOC REP 2.000 3.478
Product Total 16156.004 20893.724
MEK
U ARAB EMTS 61.200 54.920
CONGO D. REP. 1.980 9.199
NEPAL 1.528 4.143
BANGLADESH PR 0.380 0.530
ETHIOPIA 0.350 1.596
Product Total 65.438 70.388
ACETALDEHYDE
TURKEY 962.440 652.313
NEPAL 62.925 14.419
BANGLADESH PR 0.950 20.344
SAUDI ARAB 0.530 4.190
MYANMAR 0.028 0.267
114

Table 19: Top Five Export Destinations of selected Chemicals during 2020-21
PRODUCT COUNTRY QUANTITY(MT) VALUE(RS.Lakhs)
(1) (2) (3) (4) Product Total 1026.873 691.533
ETHANOLAMINES
U ARAB EMTS 648.373 1329.859
U S A 504.515 1196.737
TURKEY 373.862 280.098
CHINA P RP 253.132 949.527
U K 201.316 1232.845
Product Total 1981.198 4989.066
ETHYL ACETATE
BELGIUM 15102.438 9308.943
ITALY 12850.330 8015.576
NIGERIA 9508.500 5891.882
U ARAB EMTS 8682.025 5390.303
SPAIN 8594.455 5460.683
Product Total 54737.748 34067.387
MENTHOL
CHINA P RP 14613.595 163124.051
U S A 1185.910 17728.072
SINGAPORE 716.852 8456.936
NETHERLAND 482.500 7563.223
JAPAN 471.222 6844.309
Product Total 17470.079 203716.591
ORTHO NITRO TOLUENE
GERMANY 2511.140 2385.053
CHINA P RP 567.051 331.818
JAPAN 553.616 550.884
NETHERLAND 50.110 50.290
Product Total 3681.917 3318.045
MALATHION
MEXICO 360.000 1156.822
EGYPT A RP 340.000 851.080
NETHERLAND 272.000 1034.575
TURKEY 232.000 662.768
MALAYSIA 123.000 364.701
Product Total 1327.000 4069.946
DIMETHOATE
ECUADOR 48.000 180.998
NEPAL 25.541 67.428
CHILE 21.040 83.893
ETHIOPIA 19.500 98.532
MADAGASCAR 17.750 80.905
Product Total 131.831 511.756
D.D.V.P.
UGANDA 546.560 2354.894
NIGERIA 80.000 218.953
ZAMBIA 8.960 36.833
NEPAL 3.500 9.230
Product Total 639.020 2619.910
QUINALPHOS
VIETNAM SOC REP 373.275 2343.002
SAUDI ARAB 101.600 353.844
BANGLADESH PR 41.358 152.466
AUSTRALIA 4.000 45.057
NEPAL 0.941 7.084
Product Total 521.174 2901.453
CYPERMETHRIN
CHINA P RP 3181.975 22261.735
BRAZIL 1575.906 10479.830
INDONESIA 1271.340 4640.107
THAILAND 1237.643 8339.713
NIGERIA 893.115 1741.401
Product Total 8159.979 47462.786
115

Table 19: Top Five Export Destinations of selected Chemicals during 2020-21
PRODUCT COUNTRY QUANTITY(MT) VALUE(RS.Lakhs)
(1) (2) (3) (4)
OTHER PESTICIDES
NEPAL 2092.419 5630.763
GHANA 569.932 3092.337
BRAZIL 344.460 1591.706
THAILAND 258.701 303.844
INDONESIA 258.562 868.715
Product Total 3524.074 11487.365
OTHER INSECTICIDES
BRAZIL 45270.016 372313.095
U S A 7742.065 100158.923
BANGLADESH PR 5316.435 24888.026
NIGERIA 4552.162 11124.215
MEXICO 2297.167 14032.936
Product Total 65177.845 522517.195
COPPER-OXYCHLORIDE
SPAIN 307.800 1069.688
EGYPT A RP 176.400 489.542
ALGERIA 120.800 297.265
BELGIUM 109.410 344.540
MOROCCO 100.000 319.038
Product Total 814.410 2520.073
2, 4-D
ARGENTINA 4135.400 6334.986
AUSTRALIA 4029.800 6762.405
BRAZIL 3032.001 4781.417
U S A 2180.600 3294.602
GUATEMALA 1242.000 1856.308
Product Total 14619.801 23029.718
ALUMINIUM PHOSPHIDE
BANGLADESH PR 297.538 909.400
TURKEY 116.595 508.103
RUSSIA 69.120 276.896
NIGERIA 66.145 324.542
ETHIOPIA 51.840 275.196
Product Total 601.238 2294.137
METHYL BROMIDE
NEW ZEALAND 493.200 2138.147
VIETNAM SOC REP 419.942 1893.333
LIBYA 397.100 2089.406
AUSTRALIA 378.000 1761.263
EGYPT A RP 90.000 443.531
Product Total 1778.242 8325.680
OTHER HERBICIDES-ANTI
SPROUTING PRODUCTS
U S A 29820.278 313875.857
BRAZIL 11307.882 143913.827
AUSTRALIA 7329.845 33464.947
FRANCE 3744.413 24438.239
VIETNAM SOC REP 3617.726 17495.530
Product Total 55820.144 533188.400
OTHER FUNGICIDE NES
BRAZIL 31562.663 112927.148
BANGLADESH PR 21256.432 19871.310
U S A 13119.273 35337.495
COSTA RICA 12396.808 15259.795
FRANCE 10497.963 29300.319
Product Total 88833.139 212696.067
AZO DYES
CHINA P RP 8892.255 23891.259
ITALY 8710.474 31496.455
NETHERLAND 4324.483 8755.964
SPAIN 3916.443 13038.353
POLAND 3588.900 4135.722
116

Table 19: Top Five Export Destinations of selected Chemicals during 2020-21
PRODUCT COUNTRY QUANTITY(MT) VALUE(RS.Lakhs)
(1) (2) (3) (4) Product Total 29432.555 81317.753
ACID DIRECT DYES(OTHER
THAN AZO)
U S A 1476.552 6027.820
CHINA P RP 533.699 2604.999
ITALY 530.221 2953.174
MALAYSIA 257.090 711.080
KOREA RP 245.332 1317.618
Product Total 3042.894 13614.691
BASIC DYES
CHINA P RP 2062.344 8371.438
U S A 864.426 4607.904
NETHERLAND 827.072 3223.212
BRAZIL 720.419 1858.007
INDONESIA 719.026 1319.529
Product Total 5193.287 19380.090
DISPERSE DYES
CHINA P RP 3860.412 22470.936
TURKEY 2640.430 9434.218
HONDURAS 1715.938 8552.893
EGYPT A RP 1220.190 4101.114
KOREA RP 905.270 4603.898
Product Total 10342.240 49163.059
FAST COLOUR BASES
CHINA P RP 871.298 4589.879
NETHERLAND 778.500 5434.647
GERMANY 371.080 2242.276
U S A 315.759 2026.056
INDONESIA 224.385 964.638
Product Total 2561.022 15257.496
OIL SOLUBLE (SOLVENT DYES)
U K 2131.363 10581.520
U S A 1052.033 10494.348
ITALY 705.817 4989.506
CHINA P RP 531.302 6062.454
SINGAPORE 519.031 2327.751
Product Total 4939.546 34455.579
OPTICAL WHITENING AGENTS
AUSTRALIA 2252.300 1986.662
BANGLADESH PR 1864.414 2442.672
SOUTH AFRICA 1786.123 2848.116
GERMANY 1297.375 2745.501
JAPAN 1224.947 975.016
Product Total 8425.159 10997.967
ORGANIC PIGMENT
BANGLADESH PR 58.100 170.151
NIGERIA 5.542 47.106
AUSTRALIA 2.080 6.054
BHUTAN 0.904 5.324
SPAIN 0.071 0.015
Product Total 66.697 228.650
PIGMENT EMULSION
CHINA P RP 20304.640 81128.857
U S A 12336.855 68978.192
NETHERLAND 6126.121 33162.781
BRAZIL 5103.021 24723.995
BELGIUM 4975.841 23999.478
Product Total 48846.478 231993.303
REACTIVE DYES
BANGLADESH PR 37155.499 78688.285
TURKEY 36370.503 86339.836
SINGAPORE 7342.690 26921.520
HONDURAS 7213.183 22301.680
117

Table 19: Top Five Export Destinations of selected Chemicals during 2020-21
PRODUCT COUNTRY QUANTITY(MT) VALUE(RS.Lakhs)
(1) (2) (3) (4)
BRAZIL 7174.216 19470.142
Product Total 95256.091 233721.463
SULPHUR DYES (SULPHUR
BLACK)
BANGLADESH PR 1147.535 1142.697
EGYPT A RP 553.900 542.931
ITALY 521.250 592.931
TURKEY 360.220 362.300
Product Total 2582.905 2640.859
VAT DYES
CHINA P RP 922.943 13601.396
BANGLADESH PR 403.009 5071.619
GERMANY 250.053 9130.047
TAIWAN 239.000 562.846
U S A 198.735 5045.633
Product Total 2013.740 33411.541
SOLUBILISED VAT DYES
INDONESIA 35.742 600.962
BANGLADESH PR 35.279 26.868
NEPAL 3.930 3.545
VIETNAM SOC REP 3.400 57.484
CHINA P RP 1.475 28.680
Product Total 79.826 717.539
FOOD COLOURS
U S A 2924.071 14253.227
CHINA P RP 2219.759 8783.956
MEXICO 1607.815 6249.866
INDONESIA 1575.267 8056.363
BRAZIL 1413.724 6290.770
Product Total 9740.636 43634.182
NAPTHOLS
SOUTH AFRICA 1227.750 1647.262
RUSSIA 813.217 1393.761
KENYA 433.992 813.667
U ARAB EMTS 374.725 548.622
POLAND 358.475 428.914
Product Total 3208.159 4832.226
OTHER DYES
CHINA P RP 2240.295 5543.535
NETHERLAND 2117.022 2992.288
POLAND 2077.400 2830.930
U K 1824.936 2102.034
KOREA RP 846.365 1145.661
Product Total 9106.018 14614.448
INORGANIC PIGMENTS
KENYA 5074.885 3381.497
TANZANIA REP 2568.025 1713.067
ECUADOR 2501.083 1422.721
BANGLADESH PR 2230.494 2932.080
ALGERIA 1989.150 2932.135
Product Total 14363.637 12381.500
Note: Data Source in respect of Imports and Exports is DGCIS, M/o Commerce and Industry.
118

Table 20: Top Five Import Destinations of selected Chemicals during 2020-21
PRODUCT COUNTRY QUANTITY(MT) VALUE(RS.Lakhs)
(1) (2) (3) (4)
SODA ASH
U S A 198121.185 33269.181
U ARAB EMTS 125233.606 18390.644
BULGARIA 98584.12 16191.192
RUSSIA 87836.343 12916.162
TURKEY 86511.192 12900.049
Product Total 596286.446 93667.228
CAUSTIC SODA
JAPAN 138719.003 31005.054
QATAR 54976.11 11524.452
CHINA P RP 24206.03 6302.485
U ARAB EMTS 15885.007 3112.249
IRAN 12883 1848.441
Product Total 246669.15 53792.681
LIQUID CHLORINE
KOREA RP 37.686 193.972
FRANCE 0.951 3.454
U K 0.002 0.392
U S A 0 2.314
Product Total 38.639 200.132
ALUMINIUM FLUORIDE
CHINA P RP 22845.51 20143.586
ITALY 13284 11561.181
QATAR 7496.289 948.533
MEXICO 7000 5768.871
U ARAB EMTS 5323.5 4942.44
Product Total 55949.299 43364.611
CALCIUM CARBIDE
CHINA P RP 29248.5 15807.882
INDONESIA 3384 1933.335
DOMINICA 33 7.299
Product Total 32665.5 17748.516
CARBON BLACK
KOREA RP 58562.624 35234.877
CHINA P RP 37091.568 21589.238
RUSSIA 31459.299 17060.372
U ARAB EMTS 24537.533 11725.155
EGYPT A RP 5864.8 3326.035
Product Total 157515.824 88935.677
POTASSIUM CHLORATE
CHINA P RP 822.75 596.291
NETHERLAND 77 261.824
U K 8.022 23.174
GERMANY 0.814 2.279
BELGIUM 0.002 0.06
Product Total 908.588 883.628
SODIUM CHLORATE
URUGUAY 5200 2137.038
BRAZIL 3050 1382.568
FRANCE 1311.002 613.232
FINLAND 1100 502.6
U S A 925.036 451.969
Product Total 11586.038 5087.407
TITANIUM DIOXIDE
KOREA RP 5678 9389.566
CHINA P RP 4322.401 7200.438
JAPAN 795.674 1771.497
GERMANY 718.976 2027.666
BELGIUM 463.96 1232.858
Product Total 11979.011 21622.025
RED PHOSPHORUS
PHILIPPINES 4 17.995
GERMANY 0.001 0.078
U K 0 0.049
U S A 0 0.256
Product Total 4.001 18.378 BANGLADESH PR 11943 4111.935
119

Table 20: Top Five Import Destinations of selected Chemicals during 2020-21
PRODUCT COUNTRY QUANTITY(MT) VALUE(RS.Lakhs)
(1) (2) (3) (4)
HYDROGEN PEROXIDE
THAILAND 6664.883 2479.018
EGYPT A RP 2238 522.177
INDONESIA 1241.4 370.804
BELGIUM 174.418 197.549
Product Total 22261.701 7681.483
CALCIUM CARBONATE
VIETNAM SOC REP 317224.285 22651.541
MALAYSIA 263262.901 25595.916
EGYPT A RP 238604.089 14323.08
JORDAN 15580.762 1150.53
GREECE 6129.5 522.454
Product Total 840801.537 64243.521
ACETIC ACID
MALAYSIA 268949 83495.721
SINGAPORE 220879.418 65022.307
CHINA P RP 163086.461 55686.277
TAIWAN 108607 26737.562
SAUDI ARAB 67583 18846.554
Product Total 829104.879 249788.421
ACETIC ANHYDRIDE
SAUDI ARAB 17725.756 9773.869
SINGAPORE 1081.29 699.168
U S A 0.058 6.32
Product Total 18807.104 10479.357
ACETONE
THAILAND 39480.009 24318.346
KOREA RP 15151.68 9016.025
BELGIUM 9638.701 5315.812
SINGAPORE 7495 4615.158
NETHERLAND 4714 2976.977
Product Total 76479.39 46242.318
PHENOL
U S A 65937.083 30184.445
THAILAND 25036 13355.141
SOUTH AFRICA 19026.98 8824.19
CHINA P RP 18485.85 13633.06
KOREA RP 13341.28 7425.482
Product Total 141827.193 73422.318
METHANOL
SAUDI ARAB 835791.212 163206.989
QATAR 558596.681 99303.988
OMAN 287686 61605.62
IRAN 174998 30944.091
U ARAB EMTS 126172 26978.722
Product Total 1983243.893 382039.41
FORMALDEHYDE
CHINA P RP 4.203 109.473
GERMANY 1.328 26.329
SPAIN 0.858 4.876
U S A 0.077 6.24
JAPAN 0.002 0.046
Product Total 6.468 146.964
NITROBENZENE
KOREA RP 9830.2 4978.466
INDONESIA 20 17.436
CHINA P RP 16 12.273
Product Total 9866.2 5008.175
CITRIC ACID
CHINA P RP 92386.937 44691.844
THAILAND 1159.105 1067.375
HONG KONG 1000 447.264
GERMANY 199.37 1058.075
SINGAPORE 57.692 55.762
Product Total 94803.104 47320.32
TAIWAN 17380 12107.905
CHINA P RP 16072 13208.176
120

Table 20: Top Five Import Destinations of selected Chemicals during 2020-21
PRODUCT COUNTRY QUANTITY(MT) VALUE(RS.Lakhs)
(1) (2) (3) (4)
MALEIC ANHYDRIDE MALAYSIA 12636.71 10550.378
KOREA RP 8541.57 6978.771
INDONESIA 3933.5 3136.657
Product Total 58563.78 45981.887
PENTAERYTHRITOL
SAUDI ARAB 5060 4740.604
TAIWAN 3290.69 2901.266
SPAIN 1937 1616.813
GERMANY 1234.778 1434.894
CHINA P RP 1140.101 1203.238
Product Total 12662.569 11896.815
ANILINE
CHINA P RP 48946.28 31441.533
NETHERLAND 8583 4283.246
U S A 4887.006 4054.043
U K 3867 3333.644
PORTUGAL 2835.3 1798.891
Product Total 69118.586 44911.357
CHLORO METHANES
CHINA P RP 1970.08 1230.441
NETHERLAND 391.1 697.408
U S A 48.825 77.81
U K 39.016 68.938
ITALY 19.5 35.953
Product Total 2468.521 2110.55
MEK
CHINA P RP 9857.395 8443.61
NETHERLAND 8917 6227.996
TAIWAN 8127.044 6107.947
SOUTH AFRICA 5776 5062.276
BELGIUM 5464 3655.038
Product Total 38141.439 29496.867
ACETALDEHYDE
SWITZERLAND 45.04 73.156
GERMANY 17.543 308.77
FRANCE 16.207 71.718
U K 1.563 49.533
CHINA P RP 0.82 35.219
Product Total 81.173 538.396
ETHANOLAMINES
U ARAB EMTS 5617.494 3494.944
SAUDI ARAB 3973.28 2573.037
MALAYSIA 2135.52 1442.56
THAILAND 1552.445 1145.937
BELGIUM 1337.426 1616.223
Product Total 14616.165 10272.701
ETHYL ACETATE
SWITZERLAND 67.204 1103.387
BELGIUM 28.872 461.704
SINGAPORE 15.735 7.933
ITALY 14.08 13.324
CHINA P RP 7.553 18.688
Product Total 133.444 1605.036
MENTHOL
MALAYSIA 2388.96 24750.928
SINGAPORE 1085.94 10013.686
GERMANY 470.822 4498.858
BELGIUM 204.5 1862.331
CHINA P RP 109.9 1502.596
Product Total 4260.122 42628.399
DIMETHOATE
DENMARK 34.8 164.273
CHINA P RP 28.203 161.254
Product Total 63.003 325.527
CYPERMETHRIN
BRAZIL 6.24 52.014
U ARAB EMTS 0.03 4.203
121

Table 20: Top Five Import Destinations of selected Chemicals during 2020-21
PRODUCT COUNTRY QUANTITY(MT) VALUE(RS.Lakhs)
(1) (2) (3) (4) U K 0.005 0.768
Product Total 6.275 56.985
OTHER PESTICIDES
CHINA P RP 4729.751 206550.2
TAIWAN 404.8 815.255
U S A 164.499 7855.952
AUSTRIA 130 832.09
RUSSIA 15 64.198
Product Total 5444.05 216117.695
OTHER INSECTICIDES
CHINA P RP 10487.742 131152.495
U S A 981.983 51383.24
ISRAEL 967.246 9421.034
NETHERLAND 892.504 36021.956
KOREA RP 876.114 25075.654
Product Total 14205.589 253054.379
COPPER-OXYCHLORIDE
GERMANY 0.021 0.194
NETHERLAND 0.001 0.027
Product Total 0.022 0.221
2, 4-D
CHINA P RP 2394 3626.724
TURKEY 18.005 30.273
GERMANY 0.021 0.265
PHILIPPINES 0.004 0.03
Product Total 2412.03 3657.292
ALUMINIUM PHOSPHIDE
LEBANON 7 38.594
FRANCE 0.003 0.129
ITALY 0.002 0.623
ISRAEL 0.001 0.061
BELGIUM 0 0.052
Product Total 7.006 39.459
METHYL BROMIDE
HONG KONG 10.608 58.165
CANADA 1 4.446
U S A 0.004 0.178
Product Total 11.612 62.789
OTHER HERBICIDES-ANTI
SPROUTING PRODUCTS
CHINA P RP 13506.591 54928.647
ISRAEL 5788.547 36701.66
TAIWAN 4329.6 7741.643
JAPAN 1574.737 20303.07
U K 1309.108 5541.603
Product Total 26508.583 125216.623
OTHER FUNGICIDE NES
CHINA P RP 2834.873 28892.678
THAILAND 1746.78 6702.273
GERMANY 1717.677 28297.535
SINGAPORE 943.431 17927.503
NETHERLAND 682.886 16346.346
Product Total 7925.647 98166.335
AZO DYES
CHINA P RP 49.934 517.052
GERMANY 42.414 439.747
SPAIN 37.267 1748.459
U K 29.029 48.522
ITALY 25.876 135.234
Product Total 184.52 2889.014
ACID DIRECT DYES(OTHER
THAN AZO)
MALAYSIA 56 147.047
CHINA P RP 51.571 356.83
HONG KONG 20.02 50.666
U S A 9.542 110.097
ITALY 7.413 70.177
Product Total 144.546 734.817 CHINA P RP 649.52 8975.349
122

Table 20: Top Five Import Destinations of selected Chemicals during 2020-21
PRODUCT COUNTRY QUANTITY(MT) VALUE(RS.Lakhs)
(1) (2) (3) (4)
BASIC DYES
ICELAND 36 360.743
GERMANY 16.768 168.335
TAIWAN 10.22 150.362
MALAYSIA 8.12 15.543
Product Total 720.628 9670.332
DISPERSE DYES
CHINA P RP 1403.616 12977.948
ICELAND 403.9 1239.408
BRAZIL 137.4 492.378
INDONESIA 93.495 1373.51
SINGAPORE 67.902 1217.927
Product Total 2106.313 17301.171
FAST COLOUR BASES
CHINA P RP 239.5 1800.745
NETHERLAND 11.203 530
GERMANY 6.395 30.593
UNSPECIFIED 1.045 19.971
SINGAPORE 0.55 6.472
Product Total 258.693 2387.781
OIL SOLUBLE (SOLVENT DYES)
CHINA P RP 293.684 4313.907
KOREA RP 137.01 744.779
U ARAB EMTS 34.585 191.312
BELGIUM 14.443 151.183
TAIWAN 12.317 70.102
Product Total 492.039 5471.283
OPTICAL WHITENING AGENTS
CHINA P RP 250.922 2325.231
SWITZERLAND 180.001 2199.264
BELGIUM 48 748.68
NETHERLAND 27.12 374.33
HONG KONG 24.24 320.284
Product Total 530.283 5967.789
ORGANIC PIGMENT
ITALY 52.849 401.655
U S A 43.273 189.487
CHINA P RP 9.305 29.962
SPAIN 0.7 5.224
GERMANY 0.193 4.631
Product Total 106.32 630.959
PIGMENT EMULSION
CHINA P RP 3045.312 18524.746
GERMANY 657.796 9790.122
KOREA RP 448.05 3341.041
MALAYSIA 391.863 998.723
ITALY 341.037 1124.314
Product Total 4884.058 33778.946
REACTIVE DYES
THAILAND 1276.158 10161.435
KOREA RP 749.303 3411.253
CHINA P RP 264.552 4256.245
TURKEY 227.91 651.994
SINGAPORE 78.61 923.834
Product Total 2596.533 19404.761
SULPHUR DYES (SULPHUR
BLACK)
CHINA P RP 1125.015 2532.435
SPAIN 184.456 554.987
TURKEY 12.555 19.382
SINGAPORE 5.98 17.919
JAPAN 5.58 85.043
Product Total 1333.586 3209.766
VAT DYES
CHINA P RP 6842.144 27724.197
SINGAPORE 6184.541 11505.782
MEXICO 167.04 325.591
BELGIUM 43.1 187.256
123

Table 20: Top Five Import Destinations of selected Chemicals during 2020-21
PRODUCT COUNTRY QUANTITY(MT) VALUE(RS.Lakhs)
(1) (2) (3) (4) GERMANY 31.985 324.554
Product Total 13268.81 40067.38
SOLUBILISED VAT DYES
SINGAPORE 89.175 210.717
NETHERLAND 10.975 41.239
CHINA P RP 5.442 125.54
SWITZERLAND 1.095 33.244
GERMANY 0.95 34.031
Product Total 107.637 444.771
FOOD COLOURS
TAIWAN 57.467 190.155
U S A 49.077 718.14
YEMEN REPUBLC 48 35.931
CHINA P RP 33.541 2055.471
SPAIN 31.806 226.063
Product Total 219.891 3225.76
NAPTHOLS
CHINA P RP 1289.627 5606.9
U S A 168.514 60.032
GERMANY 3.171 13.951
ITALY 1.28 18.904
KOREA RP 0.765 6.506
Product Total 1463.357 5706.293
OTHER DYES
U K 2050.3 5233.411
U S A 133.968 1430.003
CHINA P RP 97.617 194.235
THAILAND 19.85 60.295
ITALY 18.553 144.43
Product Total 2320.288 7062.374
INORGANIC PIGMENTS
U ARAB EMTS 3199.598 4199.696
CHINA P RP 1892.925 7080.543
ISRAEL 1851.966 4140.188
THAILAND 803.548 2687.798
U S A 723.942 4498.422
Product Total 8471.979 22606.647
Note: Data Source in respect of Imports and Exports is DGCIS, M/o Commerce and Industry.
124

Table -21: Exports of Major Petrochemicals (Group-wise) during 2013-14 to 2020-21
[QTY in MT & VAL in Rs. Lakh]
GROUP 2013-14 2014-15 2015-16 2016-17 2017-18 2018-19 2019-20 2020-21
QTY VAL QTY VAL QTY VAL QTY VAL QTY VAL QTY VAL QTY VAL QTY VAL
(1) (2) (3) (4) (5) (6) (7) (8) (9) (10) (11) (12) (13) (14) (15) (16) (17)
SYNTHETIC FIBRES
907646
1015940
887182
917327
878358
833783
1025740
922018
1001053
977982
1015666
1172008
1059348
1054987
878619
787040
FIBRE INTERMEDIATES
67873
53980
73270
57347
247540
121394
323096
153574
351358
181069
456955
275919
234372
123612
475165
162929
POLYMERS
1187634
1078251
903266
793550
998339
732497
912124
667432
1188233
891771
1934155
1558391
1615451
1095332
1488512
968069
SYNTHETIC RUBBER
(ELASTOMERS)
12834
21597
26040
34492
42688
42428
38204
46387
51889
54589
63550
70696
74036
73065
95037
79421
SYNTHETIC DETERGENT
INTERMEDIATES
32971
35845
27992
29004
9634
7768
7058
5941
1413
1468
1048
1534
1044
1479
1876
1939
PERFORMANCE PLASTICS
474528
440224
409365
353492
813967
527737
972750
636450
1050548
747271
1080286
1018773
968791
739010
217142
198743
OLEFINS
119411
88308
72479
45302
149389
76055
117365
101742
260597
179804
368714
276701
336140
188100
284988
136102
AROMATICS
1789251
1344539
1888275
1163302
2033143
942807
1749173
885136
3303041
1754998
4550911
2880299
4271477
2337408
4660796
1854685
OTHER PETRO-BASED
CHEMICALS
96237
107611
124125
143644
128670
101261
144135
116773
193342
138613
147298
139759
237571
194934
171468
169127
TOTAL EXPORT OF MAJOR
PETRO-CHEMICALS
4688385
4186295
4411994
3537460
5301728
3385730
5289645
3535453
7401474
4927565
9618583
7394080
8798230
5807927
8273603
4358055
Note: 1. Data source in respect of Imports and Exports is DGCIS, M/o Commerce and Industry.
2. The data of 2012-13 is based on ITCHS 2007 and the data from 2013-14 is based on ITCHS 2012
125

Table -22: Imports of Major Petrochemicals (Group-wise) during 2013-14 to 2020-21
[QTY in MT & VAL in Rs. Lakh]
GROUP 2013-14 2014-15 2015-16 2016-17 2017-18 2018-19 2019-20 2020-21
QTY VAL QTY VAL QTY VAL QTY VAL QTY VAL QTY VAL QTY VAL QTY VAL
(1) (2) (3) (4) (5) (6) (7) (8) (9) (10) (11) (12) (13) (14) (15) (16) (17)
SYNTHETIC FIBRES 164136 274315 235590 346205 263774 346368 279993 342993 259632 363079 275617 453356 346600 460883 403273 410701
FIBRE INTERMEDIATES 1925258 1304669 2179870 1273665 2015419 1026126 1842229 943136 1808425 1072331 1454656 1056882 1919655 1059484 1441326 649525
POLYMERS 3124986 2531008 3736798 3177068 4214022 3132488 4452258 3267230 4751478 3549286 4479129 3684829 3430180 2639363 2641372 2142272
SYNTHETIC RUBBER
(ELASTOMERS) 580333 793037 578400 758949 596101 612690 559919 628042 607867 741750 618500 851418 574832 709547 747278 718860
SYNTHETIC DETERGENT
INTERMEDIATES 123846 139467 134035 138461 218097 177489 228229 179003 205984 164533 227136 210428 264058 237426 265406 216258
PERFORMANCE PLASTICS 310899 438390 394766 496367 388796 445847 417442 472270 582692 621047 683851 891721 740577 782460 298958 293817
OLEFINS 26109 21482 49255 43981 25398 20177 83453 60651 50791 43283 69700 57846 75857 51011 43875 33958
AROMATICS 998399 850360 1023472 712564 1204325 633048 1614652 864845 1321018 708548 1320424 910212 1327535 772834 1300486 542096
OTHER PETRO-BASED
CHEMICALS 2203984 1817179 2372654 1897349 2739780 1775978 2650608 1764933 3255244 2232102 3227017 2709229 3543017 2388328 3068899 2152067
TOTAL IMPORT OF MAJOR
PETRO-CHEMICALS 9457950 8169907 10704840 8844609 11665712 8170211 12128783 8523103 12843131 9495959 12356030 10825921 12222311 9101336 10210873 7159554
Note: 1. Data source in respect of Imports and Exports is DGCIS, M/o Commerce and Industry.
2. The data of 2012-13 is based on ITCHS 2007 and the data from 2013-14 is based on ITCHS 2012
126

Table 23: Net Imports of Major Petrochemicals (Group-wise) during 2013-14 to 2020-21
[Qty in MT & Value in Rs. Lakh]
GROUP 2013-14 2014-15 2015-16 2016-17 2017-18 2018-19 2019-20 2020-21
QTY VAL QTY VAL QTY VAL QTY VAL QTY VAL QTY VAL QTY VAL QTY VAL
(1) (2) (3) (4) (5) (6) (7) (8) (9) (10) (11) (12) (13) (14) (15) (16) (17)
SYNTHETIC FIBRES -743510 -741625 -651592 -571122 -614584 -487415 -745747 -579025 -741421 -614903 -740049 -718652 -712748 -594104 -475346 -376339
FIBRE INTERMEDIATES 1857385 1250689 2106600 1216318 1767879 904732 1519133 789562 1457067 891262 997701 780963 1685283 935872 966161 486596
POLYMERS 1937352 1452757 2833532 2383518 3215683 2399991 3540134 2599798 3563245 2657515 2544974 2126438 1814729 1544031 1152860 1174203
SYNTHETIC RUBBER (ELASTOMERS) 567499 771440 552360 724457 553413 570262 521715 581655 555978 687161 554950 780722 500796 636482 652241 639439
SYNTHETIC DETERGENT
INTERMEDIATES 90875 103622 106043 109457 208463 169721 221171 173062 204571 163065 226088 208894 263014 235947 263530 214319
PERFORMANCE PLASTICS -163629 -1834 -14599 142875 -425171 -81890 -555308 -164180 -467856 -126224 -396435 -127052 -228214 43450 81816 95074
OLEFINS -93302 -66826 -23224 -1321 -123991 -55878 -33912 -41091 -209806 -136521 -299014 -218855 -260283 -137089 -241113 -102144
AROMATICS -790852 -494179 -864803 -450738 -828818 -309759 -134521 -20291 -2E+06 -1E+06 -3230487 -1970087 -2943942 -1564574 -3360310 -1312589
OTHER PETRO-BASED CHEMICALS 2107747 1709568 2248529 1753705 2611110 1674717 2506473 1648160 3061902 2093489 3079719 2569470 3305446 2193394 2897431 1982940
TOTAL NET IMPORT OF MAJOR PETRO-
CHEMICALS 4769565 3983612 6292846 5307149 6363984 4784481 6839138 4987650 5441657 4568394 2737447 3431841 3424081 3293409 1937270 2801499
Note: 1. Data source in respect of Imports and Exports is DGCIS, M/o Commerce and Industry.
2. The data of 2012-13 is based on ITCHS 2007 and the data from 2013-14 is based on ITCHS 2012
127

Table -24: Exports of Major Petrochemicals (Product-wise) 2013-14 to 2020-21
[Qty in MT & Value in Rs. Lakh]
PRODUCT 2013-14 2014-15 2015-16 2016-17 2017-18 2018-19 2019-20 2020-21
QTY VAL QTY VAL QTY VAL QTY VAL QTY VAL QTY VAL QTY VAL QTY VAL
(1) (2) (3) (4) (5) (6) (7) (8) (9) (10) (11) (12) (13) (14) (15) (16) (17)
SYNTHETIC FIBRES
ACRYLIC FIBRE 31562 47385 37420 59176 47911 58966 48332 60060 39213 52227 45932 71700 40505 59726 25569 33923
NYLON FILAMENT YARN 2023 7402 1848 6939 1639 6236 1857 6462 4014 12111 5794 18888 7748 22360 6098 15495
NYLON INDUSTRIAL YARN/TYRE CORD 2896 5696 1752 2937 1122 1471 1474 1872 1620 2239 1895 2827 3624 5116 4296 5939
POLYESTER FILAMENT YARN 647732 743768 648773 677742 634799 624444 748037 690836 717714 730282 696668 839555 711319 750466 540650 545550
POLYESTER STAPLE FIBRE 205341 187652 183575 151547 181813 129129 213903 150316 227441 169364 255455 225045 285157 204876 291399 172242
POLYPROPYLENE FILAMENT YARN 1863 2813 2232 3234 2844 3878 2077 2690 869 1117 494 713 720 965 729 1005
POLYPROPYLENE STAPLE FIBRE 14892 16220 10611 11862 7531 6885 9755 8767 9497 8663 7892 8446 9509 9103 8212 7668
Elastomeric/Spandex Filament Yarn 1337 5004 971 3890 699 2774 305 1015 685 1979 1536 4834 766 2375 1666 5218
TOTAL 907646 1015940 887182 917327 878358 833783 1025740 922018 1001053 977982 1015666 1172008 1059348 1054987 878619 787040
FIBRE INTERMEDIATES
ACRYLONITRILE 2 5 4 85 2323 2132 6 39 1514 1900 1872 3059 2988 3262 8533 8178
CAPROLACTUM 514 902 0 1 0 8 1010 867 53 93 77 129 258 327 6225 4672
DIMETHYL TEREPHTHALATE 1 2 0 0 1 1 1 1 0 0 1 2 0 1 0 0
MONO EHYLENE GLYCOL 67032 53008 73216 57216 72239 52081 62199 45932 137462 90499 292583 175325 151301 81361 325429 105684
PURIFIED TEREPHTHALIC ACID 324 63 50 45 172977 67172 259880 106735 212329 88577 162422 97404 79825 38661 134978 44395
TOTAL 67873 53980 73270 57347 247540 121394 323096 153574 351358 181069 456955 275919 234372 123612 475165 162929
POLYMERS
LOW DENSITY POLYETHYLENE 18369 20153 21519 23853 24007 26531 26909 27321 108257 88430 164142 132765 140022 98135 39442 35801
HIGH DENSITY POLYTHYLENE 113344 103538 51663 51095 116114 97840 148142 117815 205797 155550 457416 365235 486892 315945 398659 247524
POLYESTYRENE 83962 91765 73695 69174 86290 72301 82542 75483 69814 67452 63990 64060 49611 43139 36502 27805
POLYPROPYLENE (INC. CO-POLYMER) 943284 832814 726906 620745 735410 503124 574234 382678 552002 397646 718053 596611 539045 386684 861712 561818
EXPANDABLE POLYESTYRENE 3646 4413 4810 5489 3762 3735 3697 3548 3119 3272 3064 3818 2745 2762 894 895
POLY VINYL CHLORIDE 1332 2754 1988 2085 3054 3272 6484 6127 6662 6015 2133 1788 2060 1471 16985 8467
LINEAR LOW DENSITY POLYTHYLENE 13451 13366 10854 10267 15825 14160 53215 41558 228952 163632 508135 380841 395076 247196 134318 85759
PVC COMPOUND 10246 9448 11831 10842 13877 11534 16901 12902 13630 9774 17222 13273 0 0 0 0
TOTAL 1187634 1078251 903266 793550 998339 732497 912124 667432 1188233 891771 1934155 1558391 1615451 1095332 1488512 968069
SYNTHETIC RUBBER (ELASTOMERS)
STYRENE BUTADIENE RUBBER 7483 8024 18007 17961 31053 23969 27139 27423 40704 36382 46179 43572 44929 37838 39757 28768
POLY BUTADIENE RUBBER 267 388 1919 1978 5988 4008 5114 4942 7012 7376 13175 15311 20323 19289 23329 15059
128

Table -24: Exports of Major Petrochemicals (Product-wise) 2013-14 to 2020-21
[Qty in MT & Value in Rs. Lakh]
PRODUCT
2013-14 2014-15 2015-16 2016-17 2017-18 2018-19 2019-20 2020-21
QTY VAL QTY VAL QTY VAL QTY VAL QTY VAL QTY VAL QTY VAL QTY VAL
(1) (2) (3) (4) (5) (6) (7) (8) (9) (10) (11) (12) (13) (14) (15) (16) (17)
ETHYL PROPYLENE DIMERS 2075 7096 2915 8114 2725 8882 3282 9531 2517 7696 2463 7958 2292 7284 1371 3275
ETHYL VINYL ACETATE 1215 1494 1141 1734 1274 1510 1494 1751 901 1314 530 1251 999 1614 1042 1650
NITRILE BUTADIENE RUBBER 446 1557 444 1124 400 970 451 1092 427 1128 507 1316 719 1316 3823 4326
BUTYL RUBBER 1348 3038 1614 3581 1248 3089 724 1648 328 693 696 1288 4774 5724 25715 26343
TOTAL 12834 21597 26040 34492 42688 42428 38204 46387 51889 54589 63550 70696 74036 73065 95037 79421
SYNTHETIC DETERGENT INTERMEDIATES
LINEAR ALKYL BENZENE 32493 34657 27199 27204 9256 7034 6440 4816 930 809 323 367 193 253 926 956
ETHYLENE OXIDE 478 1188 793 1800 378 734 618 1125 483 659 725 1167 851 1226 950 983
TOTAL 32971 35845 27992 29004 9634 7768 7058 5941 1413 1468 1048 1534 1044 1479 1876 1939
PERFORMANCE PLASTICS
ABS RESIN 303 424 225 281 465 682 294 473 273 445 449 622 328 598 407 673
NYLON-6 15308 25961 16715 28775 14577 25321 17656 29593 21353 34774 19744 38965 21214 40855 0 0
POLYMETHYL METHACRYLATE 9775 12115 9306 11215 9158 10541 8557 10230 3563 3584 4323 5218 4632 5586 3296 4774
STYRENE ACRYLONITRILE 275 249 120 158 579 459 671 450 1179 682 387 380 460 362 230 212
POLYESTER CHIPS/PET CHIPS 443104 372102 375421 274943 783106 460787 937251 557185 1014588 655326 1043386 889691 930982 618181 202297 117960
POLYTETRAFLUOROETHYLENE(PTFE) 5763 29373 7578 38120 6082 29947 8321 38519 9592 52460 11997 83897 11175 73428 10912 75124
TOTAL 474528 440224 409365 353492 813967 527737 972750 636450 1050548 747271 1080286 1018773 968791 739010 217142 198743
OLEFINS
BUTADIENE 119410 88301 72479 45301 129808 66961 106838 97268 103426 73371 136191 113889 174252 103916 166809 72272
ETHYLENE 1 7 0 1 5119 3789 27 23 136426 97327 193233 140672 152230 79955 102895 57712
PROPYLENE 0 0 0 0 14462 5305 10500 4451 20745 9106 39290 22140 9658 4229 15284 6118
TOTAL 119411 88308 72479 45302 149389 76055 117365 101742 260597 179804 368714 276701 336140 188100 284988 136102
AROMATICS
BENZENE 635749 437813 576741 348900 914875 371288 789425 366822 1286323 662408 1651123 822052 1408477 635303 1507626 559554
MIXED XYLENE 187239 139394 10464 6923 8 49 66 110 418 278 981 668 410 297 535 330
ORTHO-XYLENE 229010 172190 227007 138341 234386 107621 154347 74761 185675 86881 225703 122734 177267 100950 309550 127934
TOLUENE 14798 11449 9994 6409 5268 3314 5843 3764 4103 2772 13601 9501 8124 5564 17834 9791
PARAXYLENE 722455 583693 1064069 662729 878606 460535 799492 439679 1826522 1002659 2659503 1925344 2677199 1595294 2825251 1157076
TOTAL 1789251 1344539 1888275 1163302 2033143 942807 1749173 885136 3303041 1754998 4550911 2880299 4271477 2337408 4660796 1854685
129

Table -24: Exports of Major Petrochemicals (Product-wise) 2013-14 to 2020-21
[Qty in MT & Value in Rs. Lakh]
PRODUCT 2013-14 2014-15 2015-16 2016-17 2017-18 2018-19 2019-20 2020-21
QTY VAL QTY VAL QTY VAL QTY VAL QTY VAL QTY VAL QTY VAL QTY VAL
(1) (2) (3) (4) (5) (6) (7) (8) (9) (10) (11) (12) (13) (14) (15) (16) (17)
OTHER PETRO-BASED CHEMICALS
ETHYLENE DICHLORIDE 9 5 21 14 15839 3103 16 8 44861 6510 19181 4478 80857 20134 37412 8605
BUTANOL 2186 3583 759 993 195 162 2292 1189 863 703 452 655 282 287 1032 1288
OXO ALCOHOL 1188 1133 1191 907 582 565 1271 731 890 682 2935 1505 1328 1146 740 2021
2-ETHYL HEXANOL 321 654 6391 6405 746 654 2055 1437 2636 1701 3175 2781 46 54 1408 1412
VINYL CHLORIDE MONOMER 1 8 0 0 0 0 0 0 0 0 0 3 0 0 0 1
EPICHLOHYDRINE 4 7 14 19 28 33 54 55 49 76 48 90 106 183 58 306
ISO BUTYLENE 1815 1382 1 2 28 249 1 3 0 2 0 1 18085 9028 6048 2593
METAXYLENE 4 13 23 146 46 140 64 217 4 263 15 282 35 587 18 857
METHYL ISOBUTYL KETONE 24 53 206 364 287 266 918 788 940 878 2038 1817 2165 1525 667 882
PIB 5896 7554 4993 5925 6128 7200 2237 2448 2620 2711 4297 4788 5828 5839 9729 8097
POLYCARBONATE 3022 6103 2459 2772 4790 4597 3990 3284 4926 5370 3432 4605 3331 3621 4447 5685
PROPYLENE GLYCOL 818 986 773 1043 531 724 865 1113 1117 1713 1697 2419 5934 6573 3254 3931
POLYVINYL ACETATE RESIN 15509 13643 15456 15384 11259 11415 8767 8927 6958 6522 8510 8622 9048 7767 8175 7358
UNSATURATED POLYSTER RESIN 10750 14533 12660 17074 12112 15025 16263 18552 14436 18212 14667 21668 15498 22694 17443 27544
CELLULOSE ACETATE BUTYRATE 93 163 44 93 6 81 8 30 1 18 1 15 0 0 9 39
CELLULOSE ACETATE SHEET 63 152 33 84 34 116 85 178 59 145 22 79 33 106 25 102
CELLULOSE NITRATE SHEET 3 14 12 16 3 5 19 14 2 5 7 24 5 9 4 31
MELAMINE MOULDING POWDER 2168 1431 6339 2284 7993 2541 10124 3072 14754 3747 16578 4758 21691 6495 21800 6695
POLYACETAL RESIN 540 654 537 598 312 383 387 439 141 279 276 402 334 540 590 1081
PHTHALIC ANHYDRIDE 23182 20259 38634 26744 40448 22378 42033 25960 37869 25156 26495 18956 28898 17976 23296 12668
STYRENE 2242 2392 6940 6623 793 669 5088 4176 4524 3842 6531 6690 4366 3326 17361 7081
VINYL ACTATE MONOMER 4096 2635 1562 1392 1695 1388 11755 6285 21261 13220 8344 6623 3434 2260 1834 1231
ISOPROPANOL 3334 4053 6139 6508 3716 2805 7385 5106 11004 7850 6281 5336 10442 7773 8298 9567
POLYOL 18969 26201 18938 48254 21099 26760 28458 32760 23427 39008 22316 43162 25825 77010 7820 60051
TOTAL 96237 107611 124125 143644 128670 101259 144135 116772 193342 138613 147298 139759 237571 194933 171468 169126
TOTAL EXPORT OF MAJOR PETRO-
CHEMICALS 4688385 4186295 4411994 3537460 5301728 3385728 5289645 3535452 7401474 4927565 9618583 7394080 8798230 5807926 8273603 4358054
Note: Data source in respect of Imports and Exports is DGCIS, M/o Commerce and Industry.
130

Table - 25 : Imports of Major Petrochemicals (Product-wise) 2013-14 to 2020-21
[Qty in MT & Value in Rs. Lakh]
PRODUCT 2013-14 2014-15 2015-16 2016-17 2017-18 2018-19 2019-20 2020-21
QTY VAL QTY VAL QTY VAL QTY VAL QTY VAL QTY VAL QTY VAL QTY VAL
(1) (2) (3) (4) (5) (6) (7) (8) (9) (10) (11) (12) (13) (14) (15) (16) (17)
SYNTHETIC FIBRES
ACRYLIC FIBRE 32990 53051 36339 60959 39238 53809 36771 44394 32184 46549 40475 71158 56316 84841 41928 53586
NYLON FILAMENT YARN 24295 54650 27813 59448 28972 54485 31063 53352 22731 43317 23259 52088 24476 49669 17058 34533
NYLON INDUSTRIAL YARN/TYRE CORD 7022 13749 3750 7035 4411 6803 7741 10247 6566 10070 8108 16323 6893 11802 9459 15174
POLYESTER FILAMENT YARN 46713 67653 72718 89105 72605 86166 84367 92492 82784 100756 83954 118045 115170 129162 238680 197017
POLYESTER STAPLE FIBRE 42635 41577 81864 71552 99719 73357 99809 70113 88990 71053 91775 89685 118176 94729 84273 64616
POLYPROPYLENE FILAMENT YARN 792 1056 716 1002 697 1001 695 850 1343 1715 1362 2007 670 954 755 1418
POLYPROPYLENE STAPLE FIBRE 401 567 329 461 1885 1997 2016 2181 3281 3378 3333 3863 2778 3097 2164 2316
Elastomeric/Spandex Filament Yarn 9288 42012 12061 56643 16247 68750 17531 69364 21753 86241 23351 100187 22121 86629 8956 42041
TOTAL 164136 274315 235590 346205 263774 346368 279993 342993 259632 363079 275617 453356 346600 460883 403273 410701
FIBRE INTERMEDIATES
ACRYLONITRILE 100862 111632 97388 118956 160202 121692 139709 108192 159778 172707 182234 244043 175867 200713 135230 121075
CAPROLACTUM 23494 34307 32276 43571 44577 45299 52906 50601 58413 75965 66497 99336 68049 75256 57649 55553
DIMETHYL TEREPHTHALATE 1786 1466 2094 1594 2216 1400 1761 1051 2256 1520 1455 1137 1807 1199 1766 982
MONO EHYLENE GLYCOL 820724 512134 1003540 550364 1111582 539689 1235385 604838 1066477 584695 634714 371592 787574 312149 621221 226286
PURIFIED TEREPHTHALIC ACID 978392 645130 1044572 559180 696842 318046 412468 178454 521501 237444 569756 340774 886358 470167 625460 245629
TOTAL 1925258 1304669 2179870 1273665 2015419 1026126 1842229 943136 1808425 1072331 1454656 1056882 1919655 1059484 1441326 649525
POLYMERS
LOW DENSITY POLYETHYLENE 256147 239302 325901 295717 374761 313547 391501 330125 464591 398992 341063 310441 352372 282510 256287 208489
HIGH DENSITY POLYTHYLENE 575117 545552 842892 811233 921743 798927 1000457 824364 993072 840665 902265 872720 787964 634354 810467 648402
POLYESTYRENE 37772 49378 39647 50104 42514 47364 44374 54225 52790 64224 56312 69827 54371 62759 69916 81878
POLYPROPYLENE (INC. CO-POLYMER) 479176 472948 611673 589950 700914 574265 781188 611882 938998 762085 854828 837001 994615 853958 854399 746492
EXPANDABLE POLYESTYRENE 3978 4682 3113 3441 2981 2723 3779 3554 2644 2744 1241 1611 1037 1184 4684 4308
POLY VINYL CHLORIDE 1208529 755732 1293338 854467 1501311 878823 1702852 1015835 1846296 1123738 2037570 1354121 928376 587544 419309 300980
LINEAR LOW DENSITY POLYTHYLENE 499817 413556 550109 515931 590015 459471 469075 381387 425112 335698 276313 228745 311445 217054 226310 151723
PVC COMPOUND 64450 49858 70125 56225 79783 57368 59032 45858 27975 21140 9537 10363 0 0 0 0
TOTAL 3124986 2531008 3736798 3177068 4214022 3132488 4452258 3267230 4751478 3549286 4479129 3684829 3430180 2639363 2641372 2142272
SYNTHETIC RUBBER (ELASTOMERS)
STYRENE BUTADIENE RUBBER 239544 287779 223549 264399 172802 155614 149559 155436 132989 161301 123010 156987 102738 118659 152373 149081
POLY BUTADIENE RUBBER 86200 109762 70471 79518 74646 63210 84910 93064 94772 122673 104671 138315 97712 107321 114961 113497
ETHYL PROPYLENE DIMERS 30347 50127 33348 54653 39370 60759 43411 54947 45099 59035 52800 80061 45465 59429 41810 52572
131

Table - 25 : Imports of Major Petrochemicals (Product-wise) 2013-14 to 2020-21
[Qty in MT & Value in Rs. Lakh]
PRODUCT 2013-14 2014-15 2015-16 2016-17 2017-18 2018-19 2019-20 2020-21
QTY VAL QTY VAL QTY VAL QTY VAL QTY VAL QTY VAL QTY VAL QTY VAL
(1) (2) (3) (4) (5) (6) (7) (8) (9) (10) (11) (12) (13) (14) (15) (16) (17)
ETHYL VINYL ACETATE 114764 125169 139414 155970 165264 162033 144604 141686 183348 184503 178684 202884 193671 212988 189581 212461
NITRILE BUTADIENE RUBBER 29596 45051 26719 44760 51937 44391 36451 45999 40310 63203 38519 73014 41179 60140 158510 52408
BUTYL RUBBER 79882 175149 84899 159649 92082 126683 100984 136910 111349 151035 120816 200157 94067 151010 90043 138841
TOTAL 580333 793037 578400 758949 596101 612690 559919 628042 607867 741750 618500 851418 574832 709547 747278 718860
SYNTHETIC DETERGENT INTERMEDIATES
LINEAR ALKYL BENZENE 123825 139218 133994 137918 217997 176537 228092 177675 205910 163748 227111 210012 264026 236771 265392 215927
ETHYLENE OXIDE 21 249 41 543 100 952 137 1328 74 785 25 416 32 655 14 331
TOTAL 123846 139467 134035 138461 218097 177489 228229 179003 205984 164533 227136 210428 264058 237426 265406 216258
PERFORMANCE PLASTICS
ABS RESIN 63020 86113 69910 94132 90081 100935 102685 114201 98026 131230 119398 173631 104643 126833 98848 129553
NYLON-6 114365 214028 133891 237580 144545 218291 158810 233711 175945 299915 215718 430268 217382 345202 0 0
POLYMETHYL METHACRYLATE 18924 25935 15367 21697 20309 30401 27175 35588 29994 47445 29540 55142 29331 45525 31774 44980
STYRENE ACRYLONITRILE 5973 7523 6411 7884 9569 9061 8542 8299 9430 10630 9188 11431 10452 11103 13347 14631
POLYESTER CHIPS/PET CHIPS 106283 90135 167015 123074 122206 74948 117996 68960 266358 113614 307111 199059 375865 233917 151926 85030
POLYTETRAFLUOROETHYLENE(PTFE) 2334 14656 2172 12000 2086 12211 2234 11511 2939 18213 2896 22190 2904 19880 3063 19623
TOTAL 310899 438390 394766 496367 388796 445847 417442 472270 582692 621047 683851 891721 740577 782460 298958 293817
OLEFINS
BUTADIENE 1071 820 3223 2823 994 706 2105 1657 2859 3104 1048 1363 14 82 29 108
ETHYLENE 24791 19461 43905 38467 21050 14753 80917 57116 39119 32795 60583 50604 64816 43283 39902 28526
PROPYLENE 247 1201 2127 2691 3354 4718 431 1878 8813 7384 8069 5879 11027 7646 3944 5324
TOTAL 26109 21482 49255 43981 25398 20177 83453 60651 50791 43283 69700 57846 75857 51011 43875 33958
AROMATICS
BENZENE 5250 3146 47 35 0 5 0 8 60 66 22264 12820 11153 5330 19212 8254
MIXED XYLENE 5567 4339 1647 1155 108 96 113 125 2424 1200 641 433 122 139 524 293
ORTHO-XYLENE 44879 41678 35697 23547 34502 16871 26275 14609 15730 8337 22974 15464 16382 9962 25136 11309
TOLUENE 263759 193333 287877 183823 343662 163765 392749 183101 414144 194854 438055 235492 464497 238119 601835 238357
PARAXYLENE 678944 607864 698204 504004 826053 452311 1195515 667002 888660 504091 836490 646003 835381 519284 653779 283883
TOTAL 998399 850360 1023472 712564 1204325 633048 1614652 864845 1321018 708548 1320424 910212 1327535 772834 1300486 542096
OTHER PETRO-BASED CHEMICALS
ETHYLENE DICHLORIDE 439537 98004 465292 117028 600033 104976 503987 86304 713334 108450 581677 141440 780433 182591 632881 150504
BUTANOL 44683 37454 56954 42657 62512 31380 57959 26234 53679 30719 48955 35342 58865 33488 43270 27054
132

Table - 25 : Imports of Major Petrochemicals (Product-wise) 2013-14 to 2020-21
[Qty in MT & Value in Rs. Lakh]
PRODUCT 2013-14 2014-15 2015-16 2016-17 2017-18 2018-19 2019-20 2020-21
QTY VAL QTY VAL QTY VAL QTY VAL QTY VAL QTY VAL QTY VAL QTY VAL
(1) (2) (3) (4) (5) (6) (7) (8) (9) (10) (11) (12) (13) (14) (15) (16) (17)
OXO ALCOHOL 1698 3182 1285 3866 1270 4347 3186 6713 2272 6324 2696 7376 2873 6210 2798 4355
2-ETHYL HEXANOL 100495 88209 134894 117375 109095 66012 66867 37312 58129 39652 54107 44522 81656 56216 56250 38505
VINYL CHLORIDE MONOMER 303042 167918 317925 178829 349371 167169 344423 177368 484390 247256 457532 252913 511166 280807 479876 315306
EPICHLOHYDRINE 22986 22594 33588 33629 43383 37643 48112 34563 56024 51446 65013 83311 61163 72337 55202 58174
ISO BUTYLENE 23254 21809 13010 12222 15853 10526 20051 14133 48702 36009 44558 40254 10787 7475 1806 1231
METAXYLENE 3029 3223 946 902 3064 2755 2667 2600 2078 2064 2943 3306 1910 1991 2711 2492
METHYL ISOBUTYL KETONE 18318 21987 23243 26643 27576 22104 22487 17388 34684 31270 33932 29589 29977 18245 30744 31945
PIB 9456 13554 11290 16394 14367 17322 16034 16949 15041 16964 16287 20089 16125 19857 16396 18107
POLYCARBONATE 123434 183633 124555 189828 138535 207756 138365 204195 158944 256209 190435 369272 175692 263317 179111 267899
PROPYLENE OXIDE 11676 13076 22914 25917 25552 25697 23064 21699 23446 23594 26800 30694 20160 20127 17361 22038
PROPYLENE GLYCOL 43547 40750 48749 50720 54045 46881 51339 39956 57333 49579 66498 69089 67372 54615 59532 55321
POLYVINYL ACETATE RESIN 4246 8824 4003 8300 3209 5941 3043 3829 3448 5059 2713 3894 3578 4955 3818 4871
UNSATURATED POLYSTER RESIN 31157 40025 28855 33910 30303 36568 39975 42255 49888 53751 42954 59992 48616 58735 49482 58712
ETHYL BENZENE 172 228 128 182 150 146 308 267 351 320 719 806 463 471 500 490
CELLULOSE ACETATE BUTYRATE 0 1 1 5 2 12 3 18 3 10 0 0 12 18 19 14
CELLULOSE ACETATE SHEET 980 569 1260 749 1295 775 1066 564 1346 921 1516 1122 1356 1013 1311 1059
CELLULOSE NITRATE SHEET 502 843 263 467 88 260 75 250 99 327 106 396 75 270 1243 538
MELAMINE MOULDING POWDER 10210 12619 10081 12356 11872 13961 12997 15304 14699 16993 15280 20127 14945 18772 11992 15425
POLYACETAL RESIN 26266 25418 32605 29992 35212 34173 37883 37829 43672 43617 48759 59046 47673 53004 49011 56158
PHTHALIC ANHYDRIDE 54934 48521 52350 39837 79803 44118 92058 53567 130440 86282 144801 107477 174482 110039 140781 80887
STYRENE 572654 602695 617800 543696 717696 516539 729627 557571 789273 654655 817779 744118 876922 610879 738149 459419
VINYL ACTATE MONOMER 147364 87273 139553 114477 141649 88260 162004 87159 184964 117193 171353 135851 162866 98977 138364 88247
ISOPROPANOL 51271 42756 63194 51016 87606 47646 97262 55519 110464 71816 141113 98531 154095 83539 186792 164736
POLYOL 159073 232014 167916 246352 186239 243011 175766 225387 218541 281622 248491 350672 239755 330380 169499 228580
TOTAL 2203984 1817179 2372654 1897349 2739780 1775978 2650608 1764933 3255244 2232102 3227017 2709229 3543017 2388328 3068899 2152067
TOTAL IMPORT OF MAJOR PETRO-
CHEMICALS 9457950 8169907 1.1E+07 8844609 1.2E+07 8170211 1.2E+07 8523103 1.3E+07 9495959 1.2E+07 1.1E+07 1.2E+07 9101336 1E+07 7159554
Note: Data source in respect of Imports and Exports is DGCIS, M/o Commerce and Industry.
133

Table 26: Net Imports of Major Petrochemicals (Product-wise) 2013-14 to 2020-21
[Qty in MT & Value in Rs. Lakh]
PRODUCT 2013-14 2014-15 2015-16 2016-17 2017-18 2018-19 2019-20 2020-21
QTY VAL QTY VAL QTY VAL QTY VAL QTY VAL QTY VAL QTY VAL QTY VAL
(1) (2) (3) (4) (5) (6) (7) (8) (9) (10) (11) (12) (13) (14) (15) (16) (17)
SYNTHETIC FIBRES
ACRYLIC FIBRE 1428 5666 -1081 1783 -8673 -5157 -11561 -15666 -7029 -5678 -5457 -542 15811 25115 16359 19663
NYLON FILAMENT YARN 22272 47248 25965 52509 27333 48249 29206 46890 18717 31206 17465 33200 16728 27309 10960 19038
NYLON INDUSTRIAL YARN/TYRE CORD 4126 8053 1998 4098 3289 5332 6267 8375 4946 7831 6213 13496 3269 6686 5163 9235
POLYESTER FILAMENT YARN -601019 -676115 -576055 -588637 -562194 -538278 -663670 -598344 -634930 -629526 -612714 -721510 -596149 -621304 -301970 -348533
POLYESTER STAPLE FIBRE -162706 -146075 -101711 -79995 -82094 -55772 -114094 -80203 -138451 -98311 -163680 -135360 -166981 -110147 -207126 -107626
POLYPROPYLENE FILAMENT YARN -1071 -1757 -1516 -2232 -2147 -2877 -1382 -1840 474 598 868 1294 -50 -11 26 413
POLYPROPYLENE STAPLE FIBRE -14491 -15653 -10282 -11401 -5646 -4888 -7739 -6586 -6216 -5285 -4559 -4583 -6731 -6006 -6048 -5352
Elastomeric/Spandex Filament Yarn 7951 37008 11090 52753 15548 65976 17226 68349 21068 84262 21815 95353 21355 84254 7290 36823
TOTAL -743510 -741625 -651592 -571122 -614584 -487415 -745747 -579025 -741421 -614903 -740049 -718652 -712748 -594104 -475346 -376339
FIBRE INTERMEDIATES
ACRYLONITRILE 100860 111627 97384 118871 157879 119560 139703 108153 158264 170807 180362 240984 172879 197451 126697 112897
CAPROLACTUM 22980 33405 32276 43570 44577 45291 51896 49734 58360 75872 66420 99207 67791 74929 51424 50881
DIMETHYL TEREPHTHALATE 1785 1464 2094 1594 2215 1399 1760 1050 2256 1520 1454 1135 1807 1198 1766 982
MONO EHYLENE GLYCOL 753692 459126 930324 493148 1039343 487608 1173186 558906 929015 494196 342131 196267 636273 230788 295792 120602
PURIFIED TEREPHTHALIC ACID 978068 645067 1044522 559135 523865 250874 152588 71719 309172 148867 407334 243370 806533 431506 490482 201234
TOTAL 1857385 1250689 2106600 1216318 1767879 904732 1519133 789562 1457067 891262 997701 780963 1685283 935872 966161 486596
POLYMERS
LOW DENSITY POLYETHYLENE 237778 219149 304382 271864 350754 287016 364592 302804 356334 310562 176921 177676 212350 184375 216845 172688
HIGH DENSITY POLYTHYLENE 461773 442014 791229 760138 805629 701087 852315 706549 787275 685115 444849 507485 301072 318409 411808 400878
POLYESTYRENE -46190 -42387 -34048 -19070 -43776 -24937 -38168 -21258 -17024 -3228 -7678 5767 4760 19620 33414 54073
POLYPROPYLENE (INC. CO-POLYMER) -464108 -359866 -115233 -30795 -34496 71141 206954 229204 386996 364439 136775 240390 455570 467274 -7313 184674
EXPANDABLE POLYESTYRENE 332 269 -1697 -2048 -781 -1012 82 6 -475 -528 -1823 -2207 -1708 -1578 3790 3413
POLY VINYL CHLORIDE 1207197 752978 1291350 852382 1498257 875551 1696368 1009708 1839634 1117723 2035437 1352333 926316 586073 402324 292513
LINEAR LOW DENSITY POLYTHYLENE 486366 400190 539255 505664 574190 445311 415860 339829 196160 172066 -231822 -152096 -83631 -30142 91992 65964
PVC COMPOUND 54204 40410 58294 45383 65906 45834 42131 32956 14345 11366 -7685 -2910 0 0 0 0
TOTAL 1937352 1452757 2833532 2383518 3215683 2399991 3540134 2599798 3563245 2657515 2544974 2126438 1814729 1544031 1152860 1174203
SYNTHETIC RUBBER (ELASTOMERS)
STYRENE BUTADIENE RUBBER 232061 279755 205542 246438 141749 131645 122420 128013 92285 124919 76831 113415 57809 80821 112616 120313
POLY BUTADIENE RUBBER 85933 109374 68552 77540 68658 59202 79796 88122 87760 115297 91496 123004 77389 88032 91632 98438
ETHYL PROPYLENE DIMERS 28272 43031 30433 46539 36645 51877 40129 45416 42582 51339 50337 72103 43173 52145 40439 49297
134

Table 26: Net Imports of Major Petrochemicals (Product-wise) 2013-14 to 2020-21
[Qty in MT & Value in Rs. Lakh]
PRODUCT 2013-14 2014-15 2015-16 2016-17 2017-18 2018-19 2019-20 2020-21
QTY VAL QTY VAL QTY VAL QTY VAL QTY VAL QTY VAL QTY VAL QTY VAL
ETHYL VINYL ACETATE 113549 123675 138273 154236 163990 160523 143110 139935 182447 183189 178154 201633 192672 211374 188539 210811
NITRILE BUTADIENE RUBBER 29150 43494 26275 43636 51537 43421 36000 44907 39883 62075 38012 71698 40460 58824 154687 48082
BUTYL RUBBER 78534 172111 83285 156068 90834 123594 100260 135262 111021 150342 120120 198869 89293 145286 64328 112498
TOTAL 567499 771440 552360 724457 553413 570262 521715 581655 555978 687161 554950 780722 500796 636482 652241 639439
SYNTHETIC DETERGENT INTERMEDIATES
LINEAR ALKYL BENZENE 91332 104561 106795 110714 208741 169503 221652 172859 204980 162939 226788 209645 263833 236518 264466 214971
ETHYLENE OXIDE -457 -939 -752 -1257 -278 218 -481 203 -409 126 -700 -751 -819 -571 -936 -652
TOTAL 90875 103622 106043 109457 208463 169721 221171 173062 204571 163065 226088 208894 263014 235947 263530 214319
PERFORMANCE PLASTICS
ABS RESIN 62717 85689 69685 93851 89616 100253 102391 113728 97753 130785 118949 173009 104315 126235 98441 128880
NYLON-6 99057 188067 117176 208805 129968 192970 141154 204118 154592 265141 195974 391303 196168 304347 0 0
POLYMETHYL METHACRYLATE 9149 13820 6061 10482 11151 19860 18618 25358 26431 43861 25217 49924 24699 39939 28478 40206
STYRENE ACRYLONITRILE 5698 7274 6291 7726 8990 8602 7871 7849 8251 9948 8801 11051 9992 10741 13117 14419
POLYESTER CHIPS/PET CHIPS -336821 -281967 -208406 -151869 -660900 -385839 -819255 -488225 -748230 -541712 -736275 -690632 -555117 -384264 -50371 -32930
POLYTETRAFLUOROETHYLENE(PTFE) -3429 -14717 -5406 -26120 -3996 -17736 -6087 -27008 -6653 -34247 -9101 -61707 -8271 -53548 -7849 -55501
TOTAL -163629 -1834 -14599 142875 -425171 -81890 -555308 -164180 -467856 -126224 -396435 -127052 -228214 43450 81816 95074
OLEFINS
BUTADIENE -118339 -87481 -69256 -42478 -128814 -66255 -104733 -95611 -100567 -70267 -135143 -112526 -174238 -103834 -166780 -72164
ETHYLENE 24790 19454 43905 38466 15931 10964 80890 57093 -97307 -64532 -132650 -90068 -87414 -36672 -62993 -29186
PROPYLENE 247 1201 2127 2691 -11108 -587 -10069 -2573 -11932 -1722 -31221 -16261 1369 3417 -11340 -794
TOTAL -93302 -66826 -23224 -1321 -123991 -55878 -33912 -41091 -209806 -136521 -299014 -218855 -260283 -137089 -241113 -102144
AROMATICS
BENZENE -630499 -434667 -576694 -348865 -914875 -371283 -789425 -366814 -1286263 -662342 -1628859 -809232 -1397324 -629973 -1488414 -551300
MIXED XYLENE -181672 -135055 -8817 -5768 100 47 47 15 2006 922 -340 -235 -288 -158 -11 -37
ORTHO-XYLENE -184131 -130512 -191310 -114794 -199884 -90750 -128072 -60152 -169945 -78544 -202729 -107270 -160885 -90988 -284414 -116625
TOLUENE 248961 181884 277883 177414 338394 160451 386906 179337 410041 192082 424454 225991 456373 232555 584001 228566
PARAXYLENE -43511 24171 -365865 -158725 -52553 -8224 396023 227323 -937862 -498568 -1823013 -1279341 -1841818 -1076010 -2171472 -873193
TOTAL -790852 -494179 -864803 -450738 -828818 -309759 -134521 -20291 -1982023 -1046450 -3230487 -1970087 -2943942 -1564574 -3360310 -1312589
OTHER PETRO-BASED CHEMICALS
ETHYLENE DICHLORIDE 439528 97999 465271 117014 584194 101873 503971 86296 668473 101940 562496 136962 699576 162457 595469 141899
BUTANOL 42497 33871 56195 41664 62317 31218 55667 25045 52816 30016 48503 34687 58583 33201 42238 25766
OXO ALCOHOL 510 2049 94 2959 688 3782 1915 5982 1382 5642 -239 5871 1545 5064 2058 2334
135

Table 26: Net Imports of Major Petrochemicals (Product-wise) 2013-14 to 2020-21
[Qty in MT & Value in Rs. Lakh]
PRODUCT 2013-14 2014-15 2015-16 2016-17 2017-18 2018-19 2019-20 2020-21
QTY VAL QTY VAL QTY VAL QTY VAL QTY VAL QTY VAL QTY VAL QTY VAL
2-ETHYL HEXANOL 100174 87555 128503 110970 108349 65358 64812 35875 55493 37951 50932 41741 81610 56162 54842 37093
VINYL CHLORIDE MONOMER 303041 167910 317925 178829 349371 167169 344423 177368 484390 247256 457532 252910 511166 280807 479876 315305
EPICHLOHYDRINE 22982 22587 33574 33610 43355 37610 48058 34508 55975 51370 64965 83221 61057 72154 55144 57868
ISO BUTYLENE 21439 20427 13009 12220 15825 10277 20050 14130 48702 36007 44558 40253 -7298 -1553 -4242 -1362
METAXYLENE 3025 3210 923 756 3018 2615 2603 2383 2074 1801 2928 3024 1875 1404 2693 1635
METHYL ISOBUTYL KETONE 18294 21934 23037 26279 27289 21838 21569 16600 33744 30392 31894 27772 27812 16720 30077 31063
PIB 3560 6000 6297 10469 8239 10122 13797 14501 12421 14253 11990 15301 10297 14018 6667 10010
POLYCARBONATE 120412 177530 122096 187056 133745 203159 134375 200911 154018 250839 187003 364667 172361 259696 174664 262214
PROPYLENE OXIDE 11676 13076 22914 25917 25552 25697 23064 21698 23446 23594 26800 30694 20160 20126 17361 22037
PROPYLENE GLYCOL 42729 39764 47976 49677 53514 46157 50474 38843 56216 47866 64801 66670 61438 48042 56278 51390
POLYVINYL ACETATE RESIN -11263 -4819 -11453 -7084 -8050 -5474 -5724 -5098 -3510 -1463 -5797 -4728 -5470 -2812 -4357 -2487
UNSATURATED POLYSTER RESIN 20407 25492 16195 16836 18191 21543 23712 23703 35452 35539 28287 38324 33118 36041 32039 31168
ETHYL BENZENE 172 228 128 182 150 144 308 267 351 320 719 806 463 471 500 490
CELLULOSE ACETATE BUTYRATE -93 -162 -43 -88 -4 -69 -5 -12 2 -8 -1 -15 12 18 10 -25
CELLULOSE ACETATE SHEET 917 417 1227 665 1261 659 981 386 1287 776 1494 1043 1323 907 1286 957
CELLULOSE NITRATE SHEET 499 829 251 451 85 255 56 236 97 322 99 372 70 261 1239 507
MELAMINE MOULDING POWDER 8042 11188 3742 10072 3879 11420 2873 12232 -55 13246 -1298 15369 -6746 12277 -9808 8730
POLYACETAL RESIN 25726 24764 32068 29394 34900 33790 37496 37390 43531 43338 48483 58644 47339 52464 48421 55077
PHTHALIC ANHYDRIDE 31752 28262 13716 13093 39355 21740 50025 27607 92571 61126 118306 88521 145584 92063 117485 68219
STYRENE 570412 600303 610860 537073 716903 515870 724539 553395 784749 650813 811248 737428 872556 607553 720788 452338
VINYL ACTATE MONOMER 143268 84638 137991 113085 139954 86872 150249 80874 163703 103973 163009 129228 159432 96717 136530 87016
ISOPROPANOL 47937 38703 57055 44508 83890 44841 89877 50413 99460 63966 134832 93195 143653 75766 178494 155169
POLYOL 140104 205813 148978 198098 165140 216251 147308 192627 195114 242614 226175 307510 213930 253370 161679 168529
TOTAL 2107747 1709568 2248529 1753705 2611110 1674717 2506473 1648160 3061902 2093489 3079719 2569470 3305446 2193394 2897431 1982940
TOTAL IMPORT OF MAJOR PETRO-
CHEMICALS 4769565 3983612 6292846 5307149 6363984 4784481 6839138 4987650 5441657 4568394 2737447 3431841 3424081 3293409 1937270 2801499
Note: Data source in respect of Imports and Exports is DGCIS, M/o Commerce and Industry.
136

Table 27: Top Five Export Destinations of selected Petrochemicals during 2020-21
PRODUCT COUNTRY QUANTITY(MT) VALUE(RS.Lakhs)
(1) (2) (3) (4)
ACRYLIC FIBRE
KENYA 7993.367 6903.733
IRAN 7252.885 9513.181
ETHIOPIA 2395.251 1796.921
SOUTH AFRICA 873.166 2224.231
U S A 858.461 3467.07
Product Total 19373.13 23905.136
NYLON FILAMENT YARN
BRAZIL 928.399 1952.764
TURKEY 675.219 1050.907
NEW ZEALAND 549.261 1612.031
AUSTRALIA 416.044 1045.761
BANGLADESH PR 415.513 764.127
Product Total 2984.436 6425.59
NYLON INDUSTRIAL
YARN/TYRE CORD
U ARAB EMTS 987.378 1542.956
MEXICO 483.248 648.041
U S A 468.72 709.723
BANGLADESH PR 380.41 464.572
CHILE 299.641 385.847
Product Total 2619.397 3751.139
POLYESTER FILAMENT YARN
TURKEY 143810.589 140352.015
BRAZIL 101747.04 81573.993
EGYPT A RP 37962.054 30199.514
BANGLADESH PR 29075.471 37334.649
ARGENTINA 24638.219 21687.713
Product Total 337233.373 311147.884
POLYESTER STAPLE FIBRE
BANGLADESH PR 40394.408 21678.628
U S A 28791.364 18946.767
TURKEY 26859.917 17809.969
NEPAL 25521.81 14745.282
INDONESIA 18134.862 8946.744
Product Total 139702.361 82127.39
POLYPROPYLENE FILAMENT
YARN
MEXICO 159.208 196.941
NIGERIA 110.338 145.457
MALAYSIA 65.995 109.769
ETHIOPIA 51.239 69.455
NEPAL 48.611 67.088
Product Total 435.391 588.71
POLYPROPYLENE STAPLE
FIBRE
U S A 5893.767 5147.931
BANGLADESH PR 1483.938 1437.886
SAUDI ARAB 458.571 568.928
NEPAL 234.696 328.423
AUSTRALIA 66.368 80.323
Product Total 8137.34 7563.491
Elastomeric/Spandex Filament
Yarn
BRAZIL 499.358 1568.501
TURKEY 259.582 890.147
CHINA P RP 252.141 495.148
BANGLADESH PR 114.963 350.758
ARGENTINA 89.818 310.817
Product Total 1215.862 3615.371
ACRYLONITRILE
U ARAB EMTS 4172.001 3262.278
OMAN 2778 2969.312
TURKEY 1580 1920.528
BANGLADESH PR 3.04 6.374
THAILAND 0.2 19.232
Product Total 8533.241 8177.724
CHINA P RP 6171 4154.125
SAUDI ARAB 20 21.006
137

Table 27: Top Five Export Destinations of selected Petrochemicals during 2020-21
PRODUCT COUNTRY QUANTITY(MT) VALUE(RS.Lakhs)
(1) (2) (3) (4)
CAPROLACTUM INDONESIA 14.7 21.798
NIGERIA 11 10.365
UGANDA 5.6 9.115
Product Total 6222.3 4216.409
MONO EHYLENE GLYCOL
CHINA P RP 286352 77428.662
U S A 10164.022 7735.913
EGYPT A RP 6182 2786.52
INDONESIA 5346 4461.135
TAIWAN 4862.005 3732.276
Product Total 312906.027 96144.506
PURIFIED TEREPHTHALIC ACID
TURKEY 49214.6 15057.981
OMAN 33713 11044.861
CHINA P RP 23054 6796.271
SOUTH AFRICA 19160.005 6565.986
SAUDI ARAB 4465 1520.436
Product Total 129606.605 40985.535
LOW DENSITY POLYETHYLENE
CHINA P RP 8473.501 5650.987
TURKEY 7404.96 6742.308
EGYPT A RP 2838.425 2729.865
OMAN 2022.21 1953.237
PORTUGAL 1862 1741.662
Product Total 22601.096 18818.059
HIGH DENSITY POLYTHYLENE
CHINA P RP 270997.968 149234.877
VIETNAM SOC REP 41812.866 25768.058
NEPAL 31747.418 23848.965
KENYA 8180.434 5865.279
BANGLADESH PR 7778.51 5226.949
Product Total 360517.196 209944.128
POLYESTYRENE
BANGLADESH PR 6564.777 4610.832
HONG KONG 4481 2784.44
CHINA P RP 2372.7 2693.946
SPAIN 2192 1244.368
SRI LANKA DSR 1917.227 1505.494
Product Total 17527.704 12839.08
POLYPROPYLENE (INC. CO-
POLYMER)
CHINA P RP 387538.501 225135.132
TURKEY 102274.235 73778.662
VIETNAM SOC REP 57771.025 37726.85
BANGLADESH PR 46200.341 29056.008
NEPAL 42329.174 32400.341
Product Total 636113.276 398096.993
EXPANDABLE POLYESTYRENE
INDONESIA 308 252.859
VIETNAM SOC REP 249.81 280.989
TAIWAN 132 125.987
U ARAB EMTS 96.48 110.303
NEPAL 44.5 50.39
Product Total 830.79 820.528
POLY VINYL CHLORIDE
CHINA P RP 15962 7306.789
NEPAL 492.088 510.849
TURKEY 161 215.716
SRI LANKA DSR 143 173.793
IRAN 55 62.938
Product Total 16813.088 8270.085
LINEAR LOW DENSITY
POLYTHYLENE
CHINA P RP 57589.191 32058.96
KENYA 17004.162 11685.14
BANGLADESH PR 11014 6869.519
NEPAL 8378.504 6005.406
138

Table 27: Top Five Export Destinations of selected Petrochemicals during 2020-21
PRODUCT COUNTRY QUANTITY(MT) VALUE(RS.Lakhs)
(1) (2) (3) (4) GHANA 5640 4027.742
Product Total 99625.857 60646.767
STYRENE BUTADIENE RUBBER
THAILAND 9115.115 6322.066
CHINA P RP 8707.789 4900.404
VIETNAM SOC REP 4208.75 2767.572
SRI LANKA DSR 2199.557 2213.711
U ARAB EMTS 2130.713 1240.939
Product Total 26361.924 17444.692
POLY BUTADIENE RUBBER
CHINA P RP 17217.9 9304.594
THAILAND 2321.34 2076.92
SRI LANKA DSR 2189.985 2265.911
VIETNAM SOC REP 942.9 766.735
BANGLADESH PR 240.545 284.479
INDONESIA 141.785 91.634
Product Total 23054.455 14790.273
ETHYL PROPYLENE DIMERS
TURKEY 334.109 983.336
VIETNAM SOC REP 293.287 841.786
BANGLADESH PR 260.188 200.372
U ARAB EMTS 79.393 109.587
U S A 77.192 384.783
Product Total 1044.169 2519.864
ETHYL VINYL ACETATE
NEPAL 522.575 668.494
U ARAB EMTS 192.14 406.224
KENYA 100.9 121.642
BANGLADESH PR 83.98 130.43
NIGERIA 43.88 145.166
Product Total 943.475 1471.956
NITRILE BUTADIENE RUBBER
MALAYSIA 3031.22 2975.06
INDONESIA 207 236.557
U ARAB EMTS 147.355 182.486
THAILAND 137.955 211.87
U S A 127.46 338.495
Product Total 3650.99 3944.468
BUTYL RUBBER
CHINA P RP 15304.56 14601.349
KOREA RP 3138.63 3479.937
SRI LANKA DSR 1248.412 1671.633
THAILAND 1227.14 1348.142
BANGLADESH PR 1093.675 1225.162
Product Total 22012.417 22326.223
LINEAR ALKYL BENZENE
BANGLADESH PR 495 519.322
NEPAL 187.349 162.973
ANGOLA 100 82.117
U ARAB EMTS 59.508 73.025
SRI LANKA DSR 30 44.391
Product Total 871.857 881.828
ETHYLENE OXIDE
VIETNAM SOC REP 278.22 233.614
MALAYSIA 272.136 214.639
THAILAND 240.06 386.482
INDONESIA 144 111.181
BANGLADESH PR 15.74 25.256
Product Total 950.156 971.172
ABS RESIN
CHINA P RP 156.962 232.587
U S A 110.943 161.667
U ARAB EMTS 34.2 47.01
NEPAL 33.895 69.084
AUSTRALIA 26.05 21.364
139

Table 27: Top Five Export Destinations of selected Petrochemicals during 2020-21
PRODUCT COUNTRY QUANTITY(MT) VALUE(RS.Lakhs)
(1) (2) (3) (4) Product Total 362.05 531.712
POLYMETHYL METHACRYLATE
NEPAL 1606.707 1364.418
BANGLADESH PR 553.905 585.808
GERMANY 223.908 845.82
KENYA 214.33 165.392
ISRAEL 150.16 162.078
Product Total 2749.01 3123.516
STYRENE ACRYLONITRILE
NIGERIA 160.09 78.232
CANADA 23.94 37
PHILIPPINES 23.5 33.988
U ARAB EMTS 9.98 35.576
SAUDI ARAB 8 11.708
Product Total 225.51 196.504
POLYESTER CHIPS/PET CHIPS
BAHARAIN IS 54056 32150.839
U ARAB EMTS 24993 14092.431
NIGERIA 21189.05 11912.236
MEXICO 21100 12750.18
TURKEY 12083.675 6876.116
Product Total 133421.725 77781.802
POLYTETRAFLUOROETHYLENE(
PTFE)
GERMANY 3092.359 21519.148
U S A 2755.305 19164.353
ITALY 1379.008 7634.833
CHINA P RP 787.057 4429.98
TURKEY 722.29 5544.116
Product Total 8736.019 58292.43
BUTADIENE
MALAYSIA 62040 25898.062
KOREA RP 44221 19598.63
TAIWAN 25327 12813.377
CHINA P RP 20713 4464.105
INDONESIA 14166 8437.762
Product Total 166467 71211.936
ETHYLENE
INDONESIA 55106 28708.647
QATAR 25741 15710.525
OMAN 12072.047 7468.791
CHINA P RP 9975 5811.116
THAILAND 1 5.037
Product Total 102895.047 57704.116
PROPYLENE
INDONESIA 10034 4482.097
EGYPT A RP 5250 1636.235
UGANDA 0.001 0.129
Product Total 15284.001 6118.461
BENZENE
SAUDI ARAB 766369.96 286901.339
CHINA P RP 154143.008 50918.797
BELGIUM 139539 55458.622
SPAIN 139435.196 54238.01
U S A 106983.688 36696.84
Product Total 1306470.852 484213.608
MIXED XYLENE
QATAR 499.8 277.412
NEPAL 17.106 15.723
SAUDI ARAB 12 25.766
U ARAB EMTS 3.05 4.234
SRI LANKA DSR 1.68 4.458
Product Total 533.636 327.593
ORTHO-XYLENE
CHINA P RP 129683.52 47974.081
TAIWAN 74001.4 32041.054
BELGIUM 55337.48 26096.917
140

Table 27: Top Five Export Destinations of selected Petrochemicals during 2020-21
PRODUCT COUNTRY QUANTITY(MT) VALUE(RS.Lakhs)
(1) (2) (3) (4) ITALY 36449 15930.785
NETHERLAND 8800 3794.262
Product Total 304271.4 125837.099
TOLUENE
CHINA P RP 9618 4454.123
KENYA 1454.726 775.337
UGANDA 1426.187 747.355
U ARAB EMTS 1010.104 951.199
NIGERIA 994 482.407
Product Total 14503.017 7410.421
PARAXYLENE
CHINA P RP 1461389 591051.985
MALAYSIA 471319.44 193532.831
INDONESIA 391393.863 160015.693
U S A 243015.48 100402.1
THAILAND 76156.5 30961.352
Product Total 2643274.283 1075963.961
ETHYLENE DICHLORIDE
U ARAB EMTS 14556 3292.305
EGYPT A RP 13405 2482.424
THAILAND 9358 2784.492
SAUDI ARAB 90 42.136
ITALY 2.75 2.604
Product Total 37411.75 8603.961
BUTANOL
U ARAB EMTS 392.92 556.751
BELGIUM 204 257.398
VIETNAM SOC REP 119.26 127.13
QATAR 98 82.541
U S A 85.14 140.377
Product Total 899.32 1164.197
OXO ALCOHOL
NETHERLAND 305.245 345.805
CHINA P RP 302 145.151
U S A 91.689 500.843
JAPAN 28 29.02
MYANMAR 3.001 2.861
Product Total 729.935 1023.68
2-ETHYL HEXANOL
TURKEY 1195.05 1166.227
U ARAB EMTS 157.35 175.941
BRUNEI 24.55 29.701
QATAR 14.01 16.915
NEPAL 9.52 10.44
Product Total 1400.48 1399.224
VINYL CHLORIDE MONOMER
OMAN 0.15 0.796
U S A 0.002 0.333
UZBEKISTAN 0.001 0.151
Product Total 0.153 1.28
EPICHLOHYDRINE
IRAN 35.52 59.041
SOUTH AFRICA 10.09 21.654
U ARAB EMTS 10.082 18.388
U S A 2.258 191.793
TAIWAN 0.045 2.011
Product Total 57.995 292.887
ISO BUTYLENE
SAUDI ARAB 3948 1883.08
CHINA P RP 2100 710.224
Product Total 6048 2593.304
METAXYLENE
BELGIUM 8.97 46.717
DENMARK 8.7 810.03
CONGO D. REP. 0.04 0.203
INDONESIA 0.004 0.066
141

Table 27: Top Five Export Destinations of selected Petrochemicals during 2020-21
PRODUCT COUNTRY QUANTITY(MT) VALUE(RS.Lakhs)
(1) (2) (3) (4) U ARAB EMTS 0.002 0.057
Product Total 17.716 857.073
METHYL ISOBUTYL KETONE
U ARAB EMTS 451.912 607.823
NIGERIA 73.755 63.29
KENYA 37.833 46.358
VIETNAM SOC REP 26.4 57.672
NEPAL 24.769 36.539
Product Total 614.669 811.682
PIB
CHINA P RP 4676.19 3474.062
SINGAPORE 2324 1704.308
U ARAB EMTS 678.58 723.184
THAILAND 610.18 426.843
IRAN 158.4 237.54
Product Total 8447.35 6565.937
POLYCARBONATE
SINGAPORE 1278.238 2353.222
KOREA RP 1272.996 1052.605
ITALY 527.4 536.43
BELGIUM 412 353.618
MALAYSIA 309.324 182.893
Product Total 3799.958 4478.768
PROPYLENE OXIDE
SINGAPORE 0.05 0.107
THAILAND 0.014 0.165
MYANMAR 0.01 0.227
U ARAB EMTS 0.002 0.001
LITHUANIA 0 0.026
Product Total 0.076 0.526
PROPYLENE GLYCOL
IRAN 2072.905 2276.759
U ARAB EMTS 333.623 246.217
SINGAPORE 199.085 253.755
NEPAL 166.39 228.806
U S A 91 150.803
Product Total 2863.003 3156.34
POLYVINYL ACETATE RESIN
U S A 1304.163 1694.346
NIGERIA 1012.5 396.434
TURKEY 721.6 935.551
U ARAB EMTS 576.508 348.23
TANZANIA REP 547.79 330.663
Product Total 4162.561 3705.224
UNSATURATED POLYSTER
RESIN
BANGLADESH PR 1797.088 3029.95
CHINA P RP 1598.265 3720.461
NEPAL 1594.815 1561.652
U ARAB EMTS 1166.03 2242.597
QATAR 1158.315 1549.163
Product Total 7314.513 12103.823
CELLULOSE ACETATE
BUTYRATE
SYRIA 5 7.134
BANGLADESH PR 4 29.541
SRI LANKA DSR 0.151 1.008
VIETNAM SOC REP 0.115 0.699
U ARAB EMTS 0.025 0.157
Product Total 9.291 38.539
CELLULOSE ACETATE SHEET
THAILAND 22.008 71.841
NEPAL 3.199 29.728
ITALY 0.006 0.05
Product Total 25.213 101.619
KENYA 1.84 9.266
NEPAL 1.604 1.51
142

Table 27: Top Five Export Destinations of selected Petrochemicals during 2020-21
PRODUCT COUNTRY QUANTITY(MT) VALUE(RS.Lakhs)
(1) (2) (3) (4)
CELLULOSE NITRATE SHEET CAMEROON 0.274 1.354
SOUTH AFRICA 0.1 0.516
TANZANIA REP 0.058 0.275
Product Total 3.876 12.921
MELAMINE MOULDING
POWDER
NEPAL 18366.492 3239.041
GHANA 640.15 350.737
GABON 538.9 366.828
SRI LANKA DSR 316.75 166.869
INDONESIA 306.605 367.212
Product Total 20168.897 4490.687
POLYACETAL RESIN
CHINA P RP 262.464 452.277
U S A 74.325 140.433
BANGLADESH PR 62.14 97.762
NEPAL 54.675 70.037
THAILAND 38.35 87.267
Product Total 491.954 847.776
PHTHALIC ANHYDRIDE
U ARAB EMTS 9673.006 5278.888
SAUDI ARAB 4195 2524.279
EGYPT A RP 4060 1680.088
TUNISIA 2022 1254.306
BANGLADESH PR 835 522.768
Product Total 20785.006 11260.329
STYRENE
KOREA RP 13581 4074.177
U ARAB EMTS 2264.691 1793.128
SRI LANKA DSR 1118.84 855.787
KENYA 172.44 149.086
NEPAL 111.99 90.282
Product Total 17248.961 6962.46
VINYL ACTATE MONOMER
U ARAB EMTS 479 305.503
BANGLADESH PR 410.2 258.054
SRI LANKA DSR 294.245 214.014
KENYA 199.12 128.391
NEPAL 113.3 115.699
Product Total 1495.865 1021.661
ISOPROPANOL
U ARAB EMTS 1363.972 1285.381
U S A 818.476 1275.751
IRAN 816.6 824.522
NETHERLAND 541.801 511.152
EGYPT A RP 498.44 682.028
Product Total 4039.289 4578.834
POLYOL
SINGAPORE 3237.89 48718.913
CHINA P RP 404.47 737.61
SAUDI ARAB 376.567 468.51
BANGLADESH PR 361.523 556.607
NEPAL 325.069 505.762
Product Total 4705.519 50987.402
Note: Data source in respect of Imports and Exports is DGCIS, M/o Commerce and Industry.
143

Table 28: Top Five Import Destinations of selected Petrochemicals during 2020-21
PRODUCT COUNTRY QUANTITY(MT) VALUE(RS.Lakhs)
(1) (2) (3) (4)
ACRYLIC FIBRE
THAILAND 8806.251 10632.239
TURKEY 8433.909 9751.446
GERMANY 7712.207 9950.221
NEPAL 3863.947 7241.309
JAPAN 3319.758 5307.193
Product Total 32136.072 42882.408
NYLON FILAMENT YARN
CHINA P RP 12309.216 20659.064
VIETNAM SOC REP 1247.691 1958.971
TAIWAN 873.266 1717.856
KOREA RP 589.177 987.606
SRI LANKA DSR 434.746 1564.61
Product Total 15454.096 26888.107
NYLON INDUSTRIAL
YARN/TYRE CORD
CHINA P RP 4997.36 7028.976
INDONESIA 1502.01 2354.365
LITHUANIA 850.672 1287.626
TAIWAN 809.588 1461.85
TURKEY 335.786 461.678
Product Total 8495.416 12594.495
POLYESTER FILAMENT YARN
CHINA P RP 193405.214 144182.896
INDONESIA 18356.625 17785.65
KOREA RP 6098.625 7244.011
MALAYSIA 4276.348 2872.233
TAIWAN 3762.285 4847.329
Product Total 225899.097 176932.119
POLYESTER STAPLE FIBRE
CHINA P RP 40640.376 29279.444
KOREA RP 12794.764 11123.768
THAILAND 10134.221 6911.804
INDONESIA 9352.007 6920.982
TAIWAN 3686.757 3250.301
Product Total 76608.125 57486.299
POLYPROPYLENE FILAMENT
YARN
TURKEY 234.715 305.52
U S A 184.473 544.12
SAUDI ARAB 160.789 222.94
TAIWAN 75.6 103.912
CHINA P RP 29.594 74.86
Product Total 685.171 1251.352
POLYPROPYLENE STAPLE
FIBRE
SAUDI ARAB 1478.507 1455.763
CHINA P RP 393.504 454.761
U ARAB EMTS 105 103.089
KOREA RP 78.56 128.754
BELGIUM 74.077 118.02
Product Total 2129.648 2260.387
Elastomeric/Spandex Filament
Yarn
KOREA RP 2775.152 10972.735
VIETNAM SOC REP 1917.114 7290.706
CHINA P RP 1834.855 9160.355
SINGAPORE 1632.876 10362.503
THAILAND 369.614 1810.013
Product Total 8529.611 39596.312
ACRYLONITRILE
NETHERLAND 33980.24 30064.171
U S A 33483.344 26277.803
KOREA RP 26864.16 27573.933
BELGIUM 12676 11196.344
CHINA P RP 11153 11482.976
Product Total 118156.744 106595.227
CAPROLACTUM
KOREA RP 24464 25815.575
RUSSIA 12300 10874.5
BELGIUM 8383.501 7386.787
THAILAND 5824.001 4919.591
JAPAN 2256.033 2110.531 144

Table 28: Top Five Import Destinations of selected Petrochemicals during 2020-21
PRODUCT COUNTRY QUANTITY(MT) VALUE(RS.Lakhs)
(1) (2) (3) (4) Product Total 53227.535 51106.984
DIMETHYL TEREPHTHALATE
TURKEY 1093 555.554
KOREA RP 594 317.79
JAPAN 36 20.998
GERMANY 20.009 12.393
CHINA P RP 16 74.544
Product Total 1759.009 981.279
MONO EHYLENE GLYCOL
KUWAIT 396112.812 142574.222
SAUDI ARAB 123081.56 45073.946
U S A 23614.063 6026.891
SINGAPORE 20650.728 8052.306
U ARAB EMTS 17085.79 7174.258
Product Total 580544.953 208901.623
PURIFIED TEREPHTHALIC ACID
TAIWAN 166008 66237.483
CHINA P RP 151047.56 61573.845
THAILAND 148338 55151.008
KOREA RP 63984 27260.62
BELGIUM 42667.123 14340.787
Product Total 572044.683 224563.743
LOW DENSITY POLYETHYLENE
U ARAB EMTS 39970.444 30807.645
U S A 35564.654 23480.655
SAUDI ARAB 32519.806 23984.043
BELGIUM 25623.271 25451.75
SINGAPORE 17854.247 15035.028
Product Total 151532.422 118759.121
HIGH DENSITY POLYTHYLENE
U ARAB EMTS 291704.85 226432.899
U S A 105630.057 72932.974
QATAR 99974.666 74080.685
SAUDI ARAB 65598.283 46667.224
SINGAPORE 37902.848 31884.561
Product Total 600810.704 451998.343
POLYESTYRENE
KOREA RP 18933.975 21111.951
U ARAB EMTS 18722.03 14454.359
TAIWAN 7729.382 7385.978
THAILAND 4883.243 4158.484
U S A 3011.652 10643.18
Product Total 53280.282 57753.952
POLYPROPYLENE (INC. CO-
POLYMER)
SAUDI ARAB 197034.505 149790.522
U ARAB EMTS 191514.062 150078.378
SINGAPORE 173608.437 162793.778
KOREA RP 64516.98 63774.117
THAILAND 52617.13 52612.484
Product Total 679291.114 579049.279
EXPANDABLE POLYESTYRENE
KOREA RP 1221 1113.046
CHINA P RP 1212.7 1087.259
TAIWAN 1162.003 1023.311
U ARAB EMTS 848.5 618.196
U S A 86.999 159.243
Product Total 4531.202 4001.055
POLY VINYL CHLORIDE
JAPAN 92654.457 61611.626
TAIWAN 80132.872 60072.969
KOREA RP 41304.647 29849.558
THAILAND 40369.635 33567.483
CHINA P RP 30878.326 26872.639
Product Total 285339.937 211974.275
LINEAR LOW DENSITY
POLYTHYLENE
U ARAB EMTS 61460.86 42048.342
SINGAPORE 37133.781 25749.116
U S A 30107.402 17632.449
MALAYSIA 20600.85 12132.769 145

Table 28: Top Five Import Destinations of selected Petrochemicals during 2020-21
PRODUCT COUNTRY QUANTITY(MT) VALUE(RS.Lakhs)
(1) (2) (3) (4) SAUDI ARAB 20219.612 14742.632
Product Total 169522.505 112305.308
STYRENE BUTADIENE RUBBER
KOREA RP 57713.872 57516.57
RUSSIA 21272.232 6125.896
POLAND 18323.706 16690.795
SINGAPORE 7215.78 11502.716
JAPAN 6033.146 7684.948
Product Total 110558.736 99520.925
POLY BUTADIENE RUBBER
KOREA RP 41576.31 40513.607
SINGAPORE 12330.285 14113.117
RUSSIA 11887.1 10751.049
SAUDI ARAB 7985.68 6993.891
GERMANY 7799.049 7853.86
Product Total 81578.424 80225.524
ETHYL PROPYLENE DIMERS
U S A 10176.197 11102.78
KOREA RP 8037.896 10714.328
JAPAN 7381.255 11030.237
BELGIUM 3956.561 4241.037
SAUDI ARAB 3220.85 3408.384
Product Total 32772.759 40496.766
ETHYL VINYL ACETATE
KOREA RP 74727.247 82410.878
SAUDI ARAB 43291.501 43387.422
U S A 13867.809 13286.966
THAILAND 12915.49 14255.402
BELGIUM 11673.7 12623.183
Product Total 156475.747 165963.851
NITRILE BUTADIENE RUBBER
RUSSIA 122943.268 3729.808
KOREA RP 13185.639 15930.107
JAPAN 8721.663 12378.782
BELGIUM 2255.517 3809.754
MALAYSIA 2247.384 3386.164
Product Total 149353.471 39234.615
BUTYL RUBBER
RUSSIA 32673.16 46726.703
SINGAPORE 19724.5 29365.389
U S A 14291.021 20784.837
U K 7029.656 13904.961
JAPAN 6299.578 11701.738
Product Total 80017.915 122483.628
LINEAR ALKYL BENZENE
SAUDI ARAB 141504.37 112587.074
QATAR 42737 32260.46
SPAIN 32763.502 30109.227
THAILAND 23017.61 19954.511
U ARAB EMTS 8426.11 4940.283
Product Total 248448.592 199851.555
ETHYLENE OXIDE
U S A 13.037 306.416
ARGENTINA 0.5 8.888
BELGIUM 0.3 1.692
CHINA P RP 0.3 14.383
Product Total 14.137 331.379
ABS RESIN
KOREA RP 66401.126 84749.027
TAIWAN 12343.075 17598.13
SAUDI ARAB 6708.86 7012.183
THAILAND 3996.189 6245.128
MALAYSIA 2578.766 3565.412
Product Total 92028.016 119169.88
POLYMETHYL METHACRYLATE
KOREA RP 13547.661 20853.736
SINGAPORE 6398.023 7657.534
SAUDI ARAB 5390.36 5952.863
CHINA P RP 1447.817 1676.915 146

Table 28: Top Five Import Destinations of selected Petrochemicals during 2020-21
TOLUENE
PRODUCT COUNTRY QUANTITY(MT) VALUE(RS.Lakhs)
(1) (2) (3) (4) U ARAB EMTS 1058.085 1138.133
Product Total 27841.946 37279.181
STYRENE ACRYLONITRILE
KOREA RP 6772.1 7187.798
JAPAN 2170.05 2261.192
THAILAND 1015.745 1388.087
BELGIUM 929.458 1056.023
MALAYSIA 745.55 888.107
Product Total 11632.903 12781.207
POLYESTER CHIPS/PET CHIPS
CHINA P RP 53420.52 32858.395
TAIWAN 26303.633 14482.3
VIETNAM SOC REP 24046 13701.914
U ARAB EMTS 13199.81 6199.209
THAILAND 6597.79 3976.675
Product Total 123567.753 71218.493
POLYTETRAFLUOROETHYLENE(
PTFE)
CHINA P RP 808.741 4256.722
U S A 759.062 5172.453
KOREA RP 413.111 1538.69
NETHERLAND 278.531 2821.576
ITALY 276.486 1399.508
Product Total 2535.931 15188.949
BUTADIENE
KOREA RP 15.13 24.247
CHINA P RP 10 40.905
GERMANY 3.962 37.905
HONG KONG 0.25 4.476
JAPAN 0.009 0.077
Product Total 29.351 107.61
ETHYLENE
U ARAB EMTS 26412.469 16842.613
SAUDI ARAB 6731.822 4245.303
MALAYSIA 3404.106 4977.439
SINGAPORE 3325 2275.478
HONG KONG 16.265 123.966
Product Total 39889.662 28464.799
PROPYLENE
U ARAB EMTS 3032 1902.375
CHINA P RP 908.765 3394.635
THAILAND 2.653 16.06
HONG KONG 0.368 3.61
U S A 0.228 6.53
Product Total 3944.014 5323.21
BENZENE
SAUDI ARAB 11491 4567.406
IRAN 7720 3663.337
GERMANY 0.386 6.534
U S A 0.242 15.709
JAPAN 0.107 0.564
Product Total 19211.735 8253.55
MIXED XYLENE
U ARAB EMTS 446.4 196.585
BELGIUM 28.413 29.933
GERMANY 22.583 28.254
KOREA RP 16.035 8.934
INDONESIA 10.013 24.312
Product Total 523.444 288.018
ORTHO-XYLENE
IRAN 6770 2862.262
SPAIN 4438.011 1639.279
TURKEY 3410 1529.213
SINGAPORE 3007 1698.63
U ARAB EMTS 3007 1449.003
Product Total 20632.011 9178.387 THAILAND 174061 69050.094
KOREA RP 150314.575 61282.486
SINGAPORE 103619.72 41754.322
147

Table 28: Top Five Import Destinations of selected Petrochemicals during 2020-21
PRODUCT COUNTRY QUANTITY(MT) VALUE(RS.Lakhs)
(1) (2) (3) (4) U ARAB EMTS 41913 16293.244
IRAN 40014 13269.43
Product Total 509922.295 201649.576
PARAXYLENE
JAPAN 282357.005 124059.651
SINGAPORE 272682 118317.742
KUWAIT 49024 20186.979
OMAN 20386.109 9789.047
THAILAND 10496.979 4116.292
Product Total 634946.093 276469.711
ETHYLENE DICHLORIDE
SAUDI ARAB 277234.902 65756.764
U S A 185814.384 46004.691
QATAR 88117.692 17060.67
KOREA RP 44265.484 11530.381
GERMANY 25412.973 7244.643
Product Total 620845.435 147597.149
BUTANOL
MALAYSIA 9806.06 6030.775
U S A 9657.112 5696.48
SOUTH AFRICA 9183 5154.103
RUSSIA 3423.624 2851.877
SINGAPORE 3169.005 1634.916
Product Total 35238.801 21368.151
OXO ALCOHOL
MALAYSIA 909.39 1182.064
SINGAPORE 722.213 1046.274
THAILAND 710.19 1045.766
INDONESIA 301.7 448.585
JAPAN 68.682 93.405
Product Total 2712.175 3816.094
2-ETHYL HEXANOL
NETHERLAND 14628 10397.448
SINGAPORE 14366.635 9725.962
BELGIUM 9664 7383.451
MALAYSIA 7762 4793.158
INDONESIA 2501 1672.42
Product Total 48921.635 33972.439
VINYL CHLORIDE MONOMER
QATAR 322344.633 208487.308
JAPAN 63300.141 41157.635
FRANCE 55329 34323.988
INDONESIA 29904 23471.274
CHINA P RP 8959 7851.387
Product Total 479836.774 315291.592
EPICHLOHYDRINE
THAILAND 33732.301 34877.837
FRANCE 4809.71 4578.363
TAIWAN 4710.8 5555.023
KOREA RP 3595.215 4068.132
BELGIUM 2351.91 2543.146
Product Total 49199.936 51622.501
ISO BUTYLENE
TAIWAN 1786 1163.042
CHINA P RP 12 14.88
THAILAND 7.206 32.524
U S A 0.563 8.063
GERMANY 0.023 0.678
Product Total 1805.792 1219.187
METAXYLENE
JAPAN 2336.63 2123.592
TAIWAN 319.03 302.354
THAILAND 53.74 56.471
CHINA P RP 1.415 1.342
GERMANY 0.156 8.094
Product Total 2710.971 2491.853
KOREA RP 18192.708 20932.615
U S A 5898.759 5015.356 148

Table 28: Top Five Import Destinations of selected Petrochemicals during 2020-21
PRODUCT COUNTRY QUANTITY(MT) VALUE(RS.Lakhs)
(1) (2) (3) (4)
METHYL ISOBUTYL KETONE SOUTH AFRICA 3700.5 3369.841
JAPAN 1276.387 1181.288
NETHERLAND 1229.12 1015.542
Product Total 30297.474 31514.642
PIB
KOREA RP 8985.56 8925.197
MALAYSIA 3023.22 3022.858
U S A 2941.892 3094.7
FRANCE 601.918 1022.276
BRAZIL 211.38 169.226
Product Total 15763.97 16234.257
POLYCARBONATE
THAILAND 73081.418 97144.843
KOREA RP 43883.144 77396.734
U S A 15643.128 19755.635
SPAIN 12232.558 17221.945
SAUDI ARAB 11150.625 14362.264
Product Total 155990.873 225881.421
PROPYLENE OXIDE
SINGAPORE 6187.56 5754.231
SAUDI ARAB 6153 9354.436
KOREA RP 2952.35 4045.834
TAIWAN 1733.09 2167.958
JAPAN 280.018 398.587
Product Total 17306.018 21721.046
PROPYLENE GLYCOL
SINGAPORE 17308.214 16876.883
SAUDI ARAB 12171.2 9193.02
CHINA P RP 8687.866 7955.693
KOREA RP 8120.25 8045.296
THAILAND 5498.571 5557.315
Product Total 51786.101 47628.207
POLYVINYL ACETATE RESIN
GERMANY 1481.055 1779.907
CHINA P RP 1025.771 1208.845
BELGIUM 382.801 554.893
INDONESIA 223.92 161.796
MALAYSIA 139.88 128.258
Product Total 3253.427 3833.699
UNSATURATED POLYSTER
RESIN
CHINA P RP 14255.498 15410.686
TAIWAN 12050.807 10380.708
MALAYSIA 7277.981 10488.045
SAUDI ARAB 2986 2138.718
KOREA RP 2653.146 4868.313
Product Total 39223.432 43286.47
ETHYL BENZENE
CHINA P RP 237.6 238.885
U S A 134.851 107.459
NETHERLAND 61.717 77.851
KOREA RP 36.045 39.132
SINGAPORE 15.54 4.731
Product Total 485.753 468.058
CELLULOSE ACETATE BUTYRATE
U S A 19.052 14.06
Product Total 19.052 14.06
CELLULOSE ACETATE SHEET
ITALY 652.8 357.666
CHINA P RP 549.883 587.865
HONG KONG 72.292 56.658
JAPAN 24 12.854
TAIWAN 11.451 37.535
Product Total 1310.426 1052.578
CELLULOSE NITRATE SHEET
BELGIUM 339.796 76.417
U K 337.47 82.502
POLAND 186.91 50.192
GERMANY 136.984 46.411
GREECE 101.456 28.179 149

Table 28: Top Five Import Destinations of selected Petrochemicals during 2020-21
PRODUCT COUNTRY QUANTITY(MT) VALUE(RS.Lakhs)
(1) (2) (3) (4) Product Total 1102.616 283.701
MELAMINE MOULDING
POWDER
THAILAND 2941.659 3357.53
CHINA P RP 2750.54 2862.119
TAIWAN 1891.54 2316.303
JAPAN 1274.848 1767.086
NORWAY 1029.68 1457.625
Product Total 9888.267 11760.663
POLYACETAL RESIN
MALAYSIA 13018.435 16157.386
KOREA RP 11632.676 13413.673
THAILAND 9477.888 9612.216
U S A 4220.956 4549.92
SINGAPORE 3183.266 3988.712
Product Total 41533.221 47721.907
PHTHALIC ANHYDRIDE
KOREA RP 37025 20756.099
TAIWAN 33412.001 18153.065
CHINA P RP 18322.392 12609.181
THAILAND 12512.18 6846.71
RUSSIA 12199.65 7262.75
Product Total 113471.223 65627.805
STYRENE
U S A 205610.212 138070.997
SINGAPORE 148674.884 89782.973
KUWAIT 142982 83904.903
SAUDI ARAB 111063 65824.706
KOREA RP 47606 28611.593
Product Total 655936.096 406195.172
VINYL ACTATE MONOMER
SINGAPORE 85775.941 55399.306
SAUDI ARAB 29134.246 17066.44
KOREA RP 12741.71 8287.496
CHINA P RP 10686.15 7473.826
MALAYSIA 25.745 15.481
Product Total 138363.792 88242.549
ISOPROPANOL
CHINA P RP 53303.242 49603.008
KOREA RP 36708.84 32303.956
U S A 28814.694 23376.9
TAIWAN 23335.632 20293.251
SINGAPORE 15920.901 13636.795
Product Total 158083.309 139213.91
POLYOL
CHINA P RP 45811.342 64746.248
U ARAB EMTS 40930.802 2361.041
KOREA RP 19393.324 28770.34
SINGAPORE 17487.946 28819.876
THAILAND 14553.222 25772.304
Product Total 138176.636 150469.809
Note: Data source in respect of Imports and Exports is DGCIS, M/o Commerce and Industry.
150

Table 29: Exchange Rates of Indian Rupee vis-a-vis US$
Month Rs./US$
(1) (2)
March 2021 72.79
February 2021 72.76
January 2021 73.11
December 2020 73.59
November 2020 74.22
October 2020 73.46
September 2020 73.48
August 2020 74.67
July 2020 74.99
June 2020 75.73
May 2020 75.66
April 2020 76.24
March 2020 74.35
February 2020 71.49
January 2020 71.31
December 2019 71.19
November 2019 71.45
October 2019 71.04
September 2019 71.33
August 2019 71.15
July 2019 68.81
June 2019 69.44
May 2019 69.77
April 2019 69.43
March 2019 69.48
February 2019 71.22
January 2019 70.73
December 2018 70.73
November 2018 71.85
October 2018 73.63
September 2018 72.22
August 2018 69.55
July 2018 68.69
June 2018 67.79
May 2018 67.54
April 2018 65.64
Note : Worked out on the basis of average daily exchange rates, as notified
by RBI. Source: 1. https://www.rbi.org.in
2. https://www.fbil.org.in
151

Table - 30 : World Exports of Chemicals by top 10 countries- 2020
HS Code Rank
World Export Ist 2nd 3rd 4th 5th 6th 7th 8th 9th 10th
28
Country China USA Germany Japan Rep. of Korea Netherlands Canada Brazil Dem. Rep. of
the Congo France
Trade Value 15208 11544 10733 6820 5278 4197 4172 3384 3144 3132 114206
29
Country China Ireland USA Switzerland Germany Belgium India Rep. of Korea Japan Netherlands
Trade Value 56963 40692 35078 25491 24869 20541 17427 15374 14913 14882 378058
30
Country Germany Switzerland Ireland USA Belgium France Italy Netherlands United
Kingdom Denmark
Trade Value 99258 88354 65605 61235 45825 37972 36034 34059 24956 19113 672638
31
Country Russian
Federation China Canada USA Morocco Belarus Netherlands Germany Belgium Qatar
Trade Value 6995 6567 5191 4532 3381 2910 2023 1926 1591 1320 53325
32
Country Germany China USA Japan Netherlands United
Kingdom Italy France India Spain
Trade Value 12332 7833 7168 4619 4556 3325 3209 3000 2924 2886 77879
38
Country USA Germany China Netherlands France Japan United
Kingdom Italy Rep. of Korea Singapore
Trade Value 32703 27174 22171 13931 12855 12082 8210 7362 6627 5908 222890
39
Country China USA Germany Rep. of Korea Japan Netherlands Italy France Other Asia,
nes Belgium
Trade Value 96411 64207 58376 31562 25570 23699 20528 19616 18604 17829 598675
4002
Country Rep. of Korea Thailand USA Japan Viet Nam Russian
Federation Germany
Other Asia,
nes Malaysia China
Trade Value 2501 2434 1962 1946 1569 1256 1178 1151 938 726 20636
54
Country China Other Asia,
nes Rep. of Korea India Japan Italy USA Turkey Germany Netherlands
Trade Value 18194 2044 1983 1635 1616 1602 1406 1334 1261 1076 41459
152

Table - 30 : World Exports of Chemicals by top 10 countries- 2020
HS Code Rank
World Export Ist 2nd 3rd 4th 5th 6th 7th 8th 9th 10th
55
Country China USA Indonesia Rep. of Korea India Turkey Japan Thailand Austria Germany
Trade Value 10062 1849 1573 1392 1277 1179 1046 1005 965 933 29466
All Chemicals
Country China Germany USA Switzerland Ireland Netherlands Belgium France Italy Japan
Trade Value 247349 238041 221683 122790 112363 98928 98499 88761 80509 76239 2209231
All Chemicals
excluding
Pharmaceuticals
Country China USA Germany Japan Rep. of Korea Netherlands Belgium France Ireland Italy
Trade Value 234134 160448 138784 68731 67506 64869 52674 50789 46758 44474 1536593
@-Includes all products covered under the HS code 28,29,30,31,32,38,39, 4002,54 and 55
Chapter 28: Inorganic Chemicals; Organic or Inorganic Compounds of Precious Metals, of Rare-Earth Metals, of Radioactive Elements or of Isotopes;
Chapter 29: Organic Chemicals; Chapter30: Pharmaceutical products; Chapter 31: Fertilizers ;
Chapter 32: Tanning or Dyeing Extracts; Tannins and their Derivatives; Dyes, Pigments and Other Colouring Matter; Paints and Varnishes; Putty and other Mastics Inks;
Chapter 38: Miscellaneous Chemical Products; Chapter 39: Plastics and articles thereof;
4002: Synthetic rubber and factice derived from oils, in primary forms or in plates, sheets or strip; mixtures of any pro;
Chapter 54: Man-made Filaments and Chapter 55: Man-made staple fibres
Source : http://comtrade.un.org./ (UN Comtrade Database)
153

Table 31: World Imports of Chemicals by top 10 countries - 2020
HS Code Rank
World Export Ist 2nd 3rd 4th 5th 6th 7th 8th 9th 10th
28
Country China USA Rep. of Korea Germany India Japan Canada France Netherlands Russian
Federation
Trade Value 11119 10740 7395 6241 6192 5825 4388 3872 3236 3070 115151
29
Country USA China Germany India Belgium Italy Japan France Rep. of Korea Netherlands
Trade Value 55882 45770 37977 18155 17884 16692 15808 14869 12094 11728 401623
30
Country USA Germany Switzerland Belgium China France Japan Italy United
Kingdom Netherlands
Trade Value 139518 67148 40286 36935 34927 28891 28642 28543 26106 21323 689568
31
Country Brazil India USA China France Australia Thailand Canada Mexico Indonesia
Trade Value 8708 7177 5795 2922 1895 1686 1509 1457 1451 1337 62054
32
Country Germany China USA France Netherlands Italy Rep. of Korea Canada United
Kingdom Mexico
Trade Value 6535 4855 4333 3718 3176 2529 2479 2274 2267 2217 76682
38
Country China USA Germany Netherlands France Rep. of Korea United
Kingdom Italy
Other Asia,
nes Japan
Trade Value 18978 18106 17637 10934 9452 7777 7511 7468 6240 6118 227080
39
Country China USA Germany France Mexico United
Kingdom Italy Canada Viet Nam Netherlands
Trade Value 72433 62465 41862 23002 21865 18459 18439 15964 15903 15687 589432
4002
Country China USA Malaysia Thailand Germany India Viet Nam Indonesia Brazil Turkey
Trade Value 7532 1169 1070 1033 952 724 648 542 496 495 21725
54
Country Viet Nam China Turkey USA Germany Indonesia Italy Brazil Egypt Rep. of Korea
Trade Value 2884 2308 1801 1786 1370 1178 1164 1023 864 851 32410
154

Table 31: World Imports of Chemicals by top 10 countries - 2020
HS Code Rank
World Export Ist 2nd 3rd 4th 5th 6th 7th 8th 9th 10th
55
Country Viet Nam China USA Germany Turkey Cambodia Italy Indonesia India Myanmar
Trade Value 2327 1702 1500 1396 1309 897 887 841 747 746 27507
All Chemicals
Country USA China Germany France Italy Belgium Japan United
Kingdom Netherlands Switzerland
Trade Value 301294 202546 182180 87377 79141 76451 74774 68501 68167 58490 2243231
All Chemicals
excluding
Pharmaceuticals
Country China USA Germany France India Italy Netherlands Japan Rep. of Korea Mexico
Trade Value 167619 161776 115032 58485 53098 50598 46844 46133 43597 43190 1553662
@-Includes all products covered under the HS code 28,29,30,31,32,38,39, 4002,54 and 55
Chapter 28: Inorganic Chemicals; Organic or Inorganic Compounds of Precious Metals, of Rare-Earth Metals, of Radioactive Elements or of Isotopes;
Chapter 29: Organic Chemicals; Chapter30: Pharmaceutical products; Chapter 31: Fertilizers ;
Chapter 32: Tanning or Dyeing Extracts; Tannins and their Derivatives; Dyes, Pigments and Other Colouring Matter; Paints and Varnishes; Putty and other Mastics Inks;
Chapter 38: Miscellaneous Chemical Products; Chapter 39: Plastics and articles thereof;
4002: Synthetic rubber and factice derived from oils, in primary forms or in plates, sheets or strip; mixtures of any pro;
Chapter 54: Man-made Filaments and Chapter 55: Man-made staple fibres
Source : http://comtrade.un.org./ (UN Comtrade Database)
155

Table 32: India's share in World Exports and Imports of Chemicals -2020
Value in US$ Million
HS Code
Commodity
Export Import
Trade Value % of World
Export
Rank in the
World
Trade Value % of World
Import
Rank in the
World India World India World
(1) (2) (3) (4) (5) (6) (7) (8) (9) (10)
28 INORGANIC CHEMICALS 1612 114206 1.41 19 6192 115151 5.38 5
29 ORGANIC CHEMICALS 17427 378058 4.61 7 18155 401623 4.52 4
30 PHARMACEUTICAL PRODUCTS 18427 672638 2.74 11 2477 689568 0.36 40
31 FERTILISERS. 118 53325 0.22 49 7177 62054 11.57 2
32 TANNING OR DYEING 2924 77879 3.75 9 1723 76682 2.25 17
38 MISCELLANEOUS CHEMICAL
PRODUCTS. 4889 222890 2.19 13 5661 227080 2.49 15
39 PLASTIC AND ARTICLES THEREOF 6598 598675 1.10 24 11975 589432 2.03 13
4002 SYNTHETIC RUBBER AND FACTICE 1277 20636 6.19 24 724 21725 3.33 6
54 MAN-MADE FILAMENTS 106 41459 0.25 4 745 32410 2.30 13
55 MAN-MADE STAPLE FIBRES 1635 29466 5.55 5 747 27507 2.72 9
All Chemicals @ 55012 2209231 2.49 13 55575 2243231 2.48 11
Chemicals (excluding Pharmaceutical
Products) 36585 1536593 2.38 12 53098 1553662 3.42 5
Total of All HS Code Commodities 275489 17436902 1.58 21 367980 17287885 2.13 13
@-Includes all products covered under the HS code 28,29,30,31,32,38,39, 4002,54 and 55
Chapter 28: Inorganic Chemicals; Organic or Inorganic Compounds of Precious Metals, of Rare-Earth Metals, of Radioactive Elements or of Isotopes; Chapter 29: Organic Chemicals;
Chapter30: Pharmaceutical products; Chapter 31: Fertilizers ; Chapter 32: Tanning or Dyeing Extracts; Tannins and their Derivatives; Dyes, Pigments and Other Colouring Matter; Paints
and Varnishes; Putty and other Mastics; Inks; Chapter 38: Miscellaneous Chemical Products; Chapter 39: Plastics and articles thereof; 4002: Synthetic rubber and factice derived from
oils, in primary forms or in plates, sheets or strip; mixtures of any pro; Chapter 54: Man-made Filaments and Chapter 55: Man-made staple fibres
Source : http://comtrade.un.org./ (UN Comtrade Database)
156

Section – IV
Foreign Direct Investment
(FDI)

Table 33: Sectors Attracting Highest FDI Equity Inflows during 2018-19 to 2020-21
Rs.in crores (US$ in million)
Ranks Sector 2018-19
(April – March) 2019-20
(April – March) 2020-21
(April – March)
(1) (2) (3) (4) (5)
1.
SERVICES SECTOR **
63,909
(9,158)
55,429
(7,854)
37,542
(5,060)
2.
COMPUTER SOFTWARE & HARDWARE
45,297
(6,415)
54,250
(7,673)
1,94,291
(26,145)
3.
TELECOMMUNICATIONS
18,337
(2,668)
30,940
(4,445)
2,884
(392)
4.
TRADING
30,963
(4,462)
32,406
(4,574)
19,349
(2,608)
5.
CONSTRUCTION DEVELOPMENT:
Townships, housing, built-up infrastructure and
construction- development projects
1,503
(213)
4,350
(617)
3,117
(422)
6.
AUTOMOBILE INDUSTRY
18,309
(2,623)
19,753
(2,824)
12,115
(1,637)
7.
CHEMICALS (OTHER THAN FERTILIZERS)
13,685
(1,981)
7,492
(1,058)
6,300
(847)
8.
CONSTRUCTION (INFRASTRUCTURE) ACTIVITIES
15,927
(2,258)
14,510
(2,042)
58,240
(7,875)
9.
DRUGS & PHARMACEUTICALS
1,842
(266)
3,650
(518)
11,015
(1,490)
10
METALLURGICAL INDUSTRIES
14,970
(2,101)
10,002
(1,340)
Note: (i)** Services sector includes Financial, Banking, Insurance, Non-Financial / Business, Outsourcing, R&D, Courier, Tech.
Testing and Analysis, Other
(ii) FDI Sectoral data has been revalidated / reconciled in line with the RBI, which reflects minor changes in the FDI figures
(increase/decrease) as compared to the earlier published sectoral data.
(iii) Source: https://dipp.gov.in
157

Section – V
Index of Industrial Production (IIP)

Table 34: Monthly Production Growth in 'Chemicals and Chemical Products' vis-a-vis Manufacturing Sector
during April 2020 to March 2021 (Based on Index of Industrial Production with Base year: 2011-12)
Period Chemicals and chemical
products Manufacturing General
Weight 7.87 77.63 100.00
Production Growth (%)
Apr-20 -47.6 -62.3 -53.9
May-20 80.9 100.5 67.0
Jun-20 22.3 26.9 19.6
Jul-20 4.2 10.6 9.3
Aug-20 -2.7 0.2 -0.6
Sep-20 5.6 6.6 5.9
Oct-20 2.0 4.3 4.4
Nov-20 -5.9 -2.7 -2.2
Dec-20 9.5 8.2 8.4
Jan-21 -0.2 -1.7 -0.6
Feb-21 -9.6 -5.1 -4.9
Mar-21 7.5 10.5 12.1
Index of Industrial Production (Base : 2011-12=100)
Mar-20 101.1 111.6 117.2
Apr-20 53.0 42.1 54.0
May-20 95.9 84.4 90.2
Jun-20 117.3 107.1 107.9
Jul-20 122.2 118.5 117.9
Aug-20 118.9 118.7 117.2
Sep-20 125.5 126.5 124.1
Oct-20 128.0 132.0 129.6
Nov-20 120.4 128.5 126.7
Dec-20 131.8 139.0 137.4
Jan-21 131.6 136.6 136.6
Feb-21 119.0 129.7 129.9
Mar-21 127.9 143.3 145.6
Source: Central Statistics Office (CSO), Ministry of Statistics and Programme Implementation
158

Table 35: Annual Production Growth in Chemicals and Chemical Products Vis -a-Vis Manufacturing
Sector during 2015-16 to 2020-21 (Based on Index on Industrial Production with Base year: 2011-12)
Years Chemicals and Chemical
Products Manufacturing General
Weight 7.9 77.6 100.0
Production Growth (%)
2015-16 4.1 2.8 3.3
2016-17 2.5 4.4 4.6
2017-18 -0.3 4.6 4.4
2018-19 2.5 3.9 3.8
2019-20 -0.4 -1.4 -0.8
2020-21 -2.1 -9.6 -8.4
Index of Industrial Production ( Base: 2011-12=100)
2014-15 109.2 112.7 111.0
2015-16 113.7 115.9 114.7
2016-17 116.5 121.0 120.0
2017-18 116.1 126.6 125.3
2018-19 119.0 131.5 130.1
2019-20 118.5 129.6 129.0
2020-21 116.0 117.2 118.1
Source: Central Statistics Office (CSO), Ministry of Statistics and Programme Implementation
159

Table 36: Weights of Products Covered under Chemical and Chemical Products (Industry Division 20 of NIC- 2008) in
the Index of Industrial Production (IIP) for Manufacting Sector
NIC 2008 Item groups Weights (in %) Name of Source
Agencies
(1) (2) (3) (4)
20111 Oxygen 0.0423 DIPP
20112 Acetic Acid 0.0191 DCPC
20112 Phosphoric acid 0.0157 DIPP
20112 Purified Terephthalic Acid (PTA) 0.3512 DCPC
20112 Sulphuric Acid 0.0479 DIPP
20114 Dyes and pigments 0.2355 DCPC
20115 ABS resin 0.0188 DCPC
20116 Calcium Carbonate 0.0572 DCPC
20116 Caustic soda (sodium hydroxide) 0.1638 DCPC
20116 Ethyl acetate 0.0571 DCPC
20116 Isopropyl alcohol 0.0178 DCPC
20116 Monoethylene glycol, MEG 0.0413 DCPC
20116 Soda ash/ washing soda 0.1200 DCPC
20116 Titanium dioxide 0.0362 DCPC
20116 Zinc sulphate 0.0150 DIPP
20118 Aromatic Chemicals 0.0806 DIPP
20119 Aniline 0.0154 DCPC
20119 Butadiene 0.0335 DCPC
20119 Catalyst, chemical 0.0415 DIPP
20119 Expandable Polystyrene , EPS
(thermocol) 0.0521 DCPC
20119 Fatty Acid 0.0254 DIPP
20119 Linear Alkyl Benzene 0.0563 DCPC
20119 Liquid chlorine 0.0595 DCPC
20119 Phthalic anhydride, PAN 0.0353 DCPC
20119 Polyol 0.0636 DCPC
20119 Sodium Silicate 0.0204 DIPP
20121 Urea 0.5590 D/o Fertilizers
20122 NPK fertilizers 0.3897 D/o Fertilizers
20123 Ammonia 0.2101 DIPP
20123 Ammonium nitrate 0.0118 DIPP
20123 Ammonium sulphate 0.0261 DIPP
20123 Formaldehyde 0.0121 DCPC
20123 Nitric Acid 0.0181 DIPP
20129 Diammonium Phosphate (DAP) 0.0761 D/o Fertilizers
20129 Superphosphate 0.0332 D/o Fertilizers
20131 Polyester chips or Polyethylene
terepthalate(PET) chips 0.1108 DCPC
20131 Polymers (incl. Polyethylene, PVC, Poly
propylene) 0.5954 DCPC
20131 PTFE (TEFLON) 0.0244 DCPC
20132 Caprolactam 0.0457 DCPC
20132 Synthetic rubber (incl. PBR, SBR) 0.0295 DCPC
20211 Detergent powder and washing powder 0.2578 DIPP
20211 Pesticides-technical grade 0.2116 DCPC
20221 Paints (all types) 0.3874 DIPP
160

Table 36: Weights of Products Covered under Chemical and Chemical Products (Industry Division 20 of NIC- 2008) in
the Index of Industrial Production (IIP) for Manufacting Sector
NIC 2008 Item groups Weights (in %) Name of Source
Agencies
(1) (2) (3) (4)
20221 Varnish (all types) 0.0209 DIPP
20223 Printing ink 0.0795 DIPP
20229 Thinner 0.0110 DIPP
20231 Toilet soap (excl. baby soap)- incl. liquid
soap and foam 0.6078 DIPP
20232
Organic surface active agents/
surfactants, except soap (incl.
dishwashing soaps, wetting and
cleansing agents)
0.1378
DIPP
20233 Detergent cake, washing soap cake/ bar 0.4607 DIPP
20235 Tooth paste 0.3223 DIPP
20236 Hair dye 0.0468 DIPP
20236 Hair oil 0.0556 DIPP
20236 Hair shampoo 0.0929 DIPP
20237 Creams and lotions for topical
application 0.1255 DIPP
20238 Agarbatti 0.1706 DIPP
20291 Safety matches (match box) 0.0638 DIPP
20292 Fire works/pyrotechnic articles 0.0366 DIPP
20292 Gun powder, detonators/ prepared
explosives 0.0397 DIPP
20293 Fragrances & Oil essentials 0.1967 DIPP
20295 Adhesive formulations other than
natural gum 0.3985 DIPP
20295 Gelatin 0.0233 DIPP
20297 Methanol 0.0291 DCPC
20299 Hydrogen Peroxide 0.0500 DCPC
20299 Mosquito coil 0.0215 DIPP
20302 Man-made fibres (incl. Viscose and
Artificial Fibres) 0.1614
DCPC & O/o Textile
Commissioner
Source: Central Statistics Office (CSO), Ministry of Statistics and Programme Implementation
DIPP: Department of Industrial Policy and Promotion
DCPC: Department of Chemicals and Petrochemicals
161

Section – VI
Inflation Based on
Wholesale Price Index

Table 37: Annual Inflation of Chemicals & Chemical products vis-à-vis other commodities during 2015-16 to 2020-21 ( Based on
Wholesale Price Index with base year: 2011-12)
Year All Commodities Food Articles Manufactured Products Chemicals & Chemical
Products
Weight 100 15.26 64.23 6.47
Inflation(%)
2015-2016 -3.69 2.59 -1.80 -3.01
2016-2017 1.73 4.00 1.37 -1.42
2017-2018 2.96 2.07 2.80 1.35
2018-2019 4.26 0.35 3.60 5.87
2019-2020 1.67 8.42 0.34 -1.34
2020-2021 1.31 3.15 2.70 0.60
Wholesale Price Index(Base : 2011-12=100)
2014-2015 113.90 131.50 111.20 116.10
2015-2016 109.70 134.90 109.20 112.60
2016-2017 111.60 140.30 110.70 111.00
2017-2018 114.90 143.20 113.80 112.50
2018-2019 119.80 143.70 117.90 119.10
2019-2020 121.80 155.80 118.30 117.50
2020-2021 123.40 160.70 121.50 118.20
Source :Office of the Economic Advisor (http://eaindustry.nic.in)
162

Table 38: Monthly Inflation of Chemicals & Chemical Products vis-a-vis Other Commodities during April-2020 to
March-2021 (Based on Wholesale Price Index with base year: 2011-12)
Month
All Commodities
Food Articles
Manufactured
Products
Chemicals & Chemical
Products
(1) (2) (3) (4) (5)
Apr-20 -1.00 2.18 0.08 -0.26
May-20 -1.43 -0.91 -0.42 0.26
Jun-20 1.53 1.50 0.34 0.17
Jul-20 1.42 3.80 0.08 0.17
Aug-20 0.83 1.05 0.59 0.17
Sep-20 0.74 3.31 0.59 0.00
Oct-20 0.57 1.84 0.25 0.60
Nov-20 1.21 -0.82 1.00 1.20
Dec-20 0.24 -5.29 1.40 1.27
Jan-21 0.88 -3.29 1.62 0.92
Feb-21 1.26 1.09 0.56 1.90
Mar-21 1.41 -0.70 1.51 2.03
Whole Sale Price Index (Base: 2011-12)
Mar-20 120.4 151.2 118.6 115.5
Apr-20 119.2 154.5 118.7 115.2
May-20 117.5 153.1 118.2 115.5
Jun-20 119.3 155.4 118.6 115.7
Jul-20 121.0 161.3 118.7 115.9
Aug-20 122.0 163.0 119.4 116.1
Sep-20 122.9 168.4 120.1 116.1
Oct-20 123.6 171.5 120.4 116.8
Nov-20 125.1 170.1 121.6 118.2
Dec-20 125.4 161.1 123.3 119.7
Jan-21 126.5 155.8 125.3 120.8
Feb-21 128.1 157.5 126.0 123.1
Mar-21 129.9 156.4 127.9 125.6
Source :Office of the Economic Advisor (http://eaindustry.nic.in)
163

Table 39: WPI (Base year 2011-12) of Chemicals & Chemical Products (Group Wise) during 2015-16 to 2020-21
(1) (2) (3) (4) (5) (6) (7) (8)
DESCRIPTION WEIGHT 2015-16 2016-17 2017-18 2018-19 2019-20 2020-21
Chemicals and Chemical Products
6.47
112.60
111.00
112.50
119.10
117.50
118.20
Basic Chemicals
1.43
105.80
104.70
111.20
125.00
119.90
118.60
Fertilizers and Nitrogen Compounds
1.48
121.40
118.70
117.10
121.10
123.10
123.60
plastic and synthetic rubber in primary
form
1.00
115.30
113.70
113.00
117.60
112.40
116.70
Pesticides and Other Agrochemical
Products
0.45
122.60
116.80
115.30
120.20
122.60
124.40
paints, Varnishes and Similar Coatings,
Printing Ink and Mastics
0.49
109.80
108.50
108.60
112.70
114.70
114.90
Soap and Detergents, Cleaning and
Polishing Preparations, Perfumes and Toilet
Preparations
0.61
112.30
113.70
115.20
116.80
118.60
120.60
Other Chemical Products
0.69
108.40
106.50
110.10
116.60
114.20
115.10
Man-Made Fibres
0.30
93.30
94.10
97.50
104.00
97.90
93.70
Source :Office of the Economic Advisor (http://eaindustry.nic.in)
164

Section – VII
Miscellaneous

Table 40: Growth Rates of Core Industries from 2015-16 to 2020-21 (Base Year 2011-12)
Sector Weight 2015-16 2016-17 2017-18 2018-19 2019-20 2020-21
(1) (2) (3) (4) (5) (6) (7) (8)
Coal (%) 10.3335 4.8 3.2 2.6 7.4 -0.4 -1.9
Crude Oil (%) 8.9833 -1.4 -2.5 -0.9 -4.1 -5.9 -5.2
Natural Gas (%) 6.8768 -4.7 -1.0 2.9 0.8 -5.6 -8.2
Refinery Products (%) 28.0376 4.9 4.9 4.6 3.1 0.2 -11.2
Fertilizers (%) 2.6276 7.0 0.2 0.0 0.3 2.7 1.7
Steel (%) 17.9166 -1.3 10.7 5.6 5.1 3.4 -8.7
Cement (%) 5.3720 4.6 -1.2 6.3 13.3 -0.9 -10.8
Electricity (%) 19.8530 5.7 5.8 5.3 5.2 0.9 -0.5
Overall Index 100 3.0 4.8 4.3 4.4 0.4 -6.4
Source: Office of The Economic Adviser,DPIIT (http://eaindustry.nic.in)
165

Table 41: Index of Core Industries from 2015-16 to 2020-21 (Base year 2011-12)
Sector Weight 2015-16 2016-17 2017-18 2018-19 2019-20 2020-21
(1) (2) (3) (4) (5) (6) (7) (8)
Coal 10.3335 118.0 121.8 124.9 134.1 133.6 131.1
Crude Oil 8.9833 97.0 94.5 93.7 89.8 84.5 80.1
Natural Gas 6.8768 67.2 66.5 68.4 69.0 65.1 59.8
Refinery Products 28.0376 114.1 119.7 125.2 129.1 129.4 114.9
Fertilizers 2.6276 106.4 106.6 106.6 107.0 109.8 111.6
Steel 17.9166 120.2 133.1 140.5 147.7 152.6 139.4
Cement 5.3720 123.5 122.0 129.7 147.0 145.7 130.0
Electricity 19.8530 133.8 141.6 149.2 156.9 158.4 157.6
Overall Index 100 115.1 120.5 125.7 131.2 131.6 123.2
Source: Office of Economic Adviser,DPIIT (http://eaindustry.nic.in)
166

Table 42: Consumption of Naphtha, Natural Gas and Fuel Oil
Name of Product Description Unit 2016-17 2017-18 2018-19 2019-20 2020-21*
(1) (2) (3) (4) (5) (6) (7) (8)
Naphtha
Production K Tonnes 19946 20006 19786 20679 19403
Import K Tonnes 2777 2212 2082 1662 1199
Value in Rs. Crore 8374 8161 9665 6678 3844
Export
K Tonnes 8727 8951 6963 8897 6509
Value in Rs. Crore 24616 29075 28893 31509 18643
Availability K Tonnes 13996 13266 14904 13444 14093
Consumption K Tonnes 13241 12889 14131 14268 14100
Natural Gas1
Gross Production MMSCM 31897 32649 32873 31184 28673
Net Production MMSCM 30849 31731 32054 30257 27784
Import $ MMSCM 24849 27439 28740 33887 33031
Value in Rs. Crore 41084 52122 71867 67383 54850
Availability MMSCM 55698 59170 60794 64143 60815
Consumption ** MMSCM 50778 52832 53840 56492 56117
Fuel Oil
Production K Tonnes 9962 9486 10032 8609 7242
Import K Tonnes 925 1213 1419 4583 6454
Value in Rs. Crore 1848 3231 4782 11791 14312
Export
K Tonnes 2248 2525 2197 1527 1177
Value in Rs. Crore 3930 5291 6537 3811 2318
Availability K Tonnes 8639 8174 9255 11665 12519
Consumption K Tonnes 7150 6721 6564 6302 5586
Naphtha Fertilizers Sector K Tonnes 349 368 352 150 66
Petrochemical Sector K Tonnes 10351 10011 10602 10875 11339
Natural Gas ** Fertilizer Industries MMSCM 15429 14676 14987 16115 17781
Petrochemicals Industry MMSCM 4170 4024 3386 3569 3072
Fuel Oil (Furnace
Oil+LSHS) Chemicals & allied K Tonnes 243 248 309 253 237
* Provisional ** Sectorial Sales $ Imports of LNG
Net Production = Gross Production-Flared/Losses
Source: Ministry of Petroleum and Natural Gas
167

Table 43: Important Indicators of Industry Division 20 & 21 (Unincorporated Sector) in 2015-16 (July 2015-June 2016)
Description Rural Urban Rural + Urban
(1) (2) (3) (4)
Estimated no. of workers in Industry Division 20
(Unincorporated) of NIC 2008 204480 167540 372020
Estimated no. of workers in Industry Division 21
(Unincorporated ) of NIC 2008 12692 9454 22146
Estimated no. of workers in Unincorporated
Manufacturing sector 18655607 17385712 36041319
Estimated no. of workers in Unincorporated sector
(All activities) # 49867273 61403553 111270826
Estimated no. of enterprises in Industry Division 20
(Unincorporated) of NIC 2008 105985 66721 172706
Estimated no. of enterprises in Industry Division 21
(Unincorporated) of NIC 2008 2935 3410 6345
Estimated no. of enterprises in Unincorporated
manufacturing sector 11414431 8250444 19664875
Estimated no. of enterprises in Unincorporated
sector ( All activities) # 32489670 30902305 63391975
Estimated GVA of Industry Division 20
(Unincorporated) (in Rs. Crore ) 780 1552 2332
Estimated GVA of Industry Division 21
(Unincorporated) (in Rs. Crore ) 130 143 273
Estimated GVA of Manufacturing Sector
(Unincorporated) (in Rs. Crore ) 89829 178233 268062
Estimated GVA of Unincorporated sector (All
activities) (in Rs. Crore ) 344872 807437 1152309
Share of GVA from Industry Division 20
(Unincorporated) in GVA Unincorporated sector (All 0.23 0.19 0.20
Share of GVA from Industry Division 21
(Unincorporated) in GVA Unincorporated sector (All 0.04 0.02 0.02
Share of GVA from Manufacturing sector
(Unincorporated) in GVA Unincorporated sector (All 26.05 22.07 23.26
GVA per worker of Industry Division 20
(Unincorporated) sector (in Rs.) 38146 92635 62685
GVA per worker of Industry Division 21
(Unincorporated) sector (in Rs.) 102427 151259 123273
GVA per worker of Manufacturing sector
(Unincorporated) (in Rs.) 48151 102517 74376
GVA per worker of unincorporated sector (All
Activities) in Rs. 69158 131497 103559
GVA per enterprise of Industry Division 20
(Unincorporated) sector (in Rs.) 73595 232610 135027
GVA per enterprise of Industry Division 21
(Unincorporated) sector (in Rs.) 442930 419355 430260
GVA per enterprise of Manufacturing Sector
(Unicorporated) (in Rs.) 78698 216028 136315
GVA per enterprise of Unincorporated Sector (All
activities) (in Rs.) 106148 261287 181775
# including Manufacturing activities , Noncaptive electricity generation , trading activities and other services (non
agricultural enterprises excluding constructions)
Source: NSS Report No. 582 : Economic Characterstics of Unincorporated Non-Agricultural Enterprises excluding
constructions in India. NSS 73rd Round (July 2015- June 2016)
168

Table 44: Employment in Chemicals and Chemical Products (Industry Division 20 of NIC-2008) during 2013-14 to 2018-19
S. No. Industry Number of Person Engaged
2013-14 2014-15 2015-16 2016-17 2017-18 2018-19
(1) (2) (3) (4) (5) (6) (7) (8)
1
Chemicals and Chemicals products
(Industry Division 20, NIC 2008)
708401
712994
743438
790263
828315
887240
2
Industries Other than Chemicals and
Chemicals products
12829713
13168392
13556272
14120926
14786304
15392971
3
All Industries
13538114
13881386
14299710
14911189
15614619
16280211
4
Share in Employment (%)
(a) Share of Chemicals and Chemicals
products
5.23
5.14
5.20
5.30
5.30
5.45
(b) Share of Other than C&PC
94.77
94.86
94.80
94.70
94.70
94.55
5
Growth Rate in Employment (%)
(a) Chemicals and Chemicals products
11.80
0.65
4.27
6.30
4.82
7.11
(b) Industries Other Than Chemicals and
Chemicals products
4.17
2.64
2.95
4.17
4.71
4.10
(c) All Industries
4.54
2.54
3.01
4.28
4.72
4.26
Note: As per NIC- 2008, Chemicals & Chemical Products are covered under the industry division 20. Source : Annual Survey of Industries (Factory Sector), Ministry of Statistics & Programme Implementation
169

Table 45: Gross Value Added from Chemical and Chemical products (Industry Division 20:NIC 2008) and Pharmaceutical; Medicinal Chemicals
and Botanical Product (Industry Division 21: NIC 2008) vis-a-vis Manufacturing Sector and All Economic Activities
At Current Prices (Rs. In Crore)
Description 2014-15 2015-16 2016-17 2017-18 2018-19 2019-20
(1) (2) (3) (4) (5) (6) (7)
Industry Division 20: Chemical and chemical products (Corporate)
133521
192668
207565
223172
245040
241158
Industry Division 20:Chemical and chemical products (Household)
1067
1222
1029
1423
2211
2173
Industry Division 20: Chemical and chemical products (Corporate
+Household)
134588
193890
208593
224595
247251
243330
Growth over previous year (%)
44.1
7.6
7.7
10.1
-1.6
Industry Division 21:Pharmaceutical; medicinal chemicals and
botanical products (Corporate)
112675
144319
157237
165019
182724
179578
Industry Division 21:Pharmaceutical; medicinal chemicals and
botanical products (Household)
625
567
667
585
620
638
Total Pharmaceutical; medicinal chemicals and botanical products
(Industry Division 21)
113300
144886
157904
165604
183344
180216
Total Chemical and chemical products including Pharmaceutical;
medicinal chemicals and botanical products (Industry Division 20 and
21)
247888
338776
366497
390199
430595
423546
Growth over previous year (%)
36.7
8.2
6.5
10.4
-1.6
Manufacturing (Corporate)
1631823
1850139
2042040
2248880
2457941
2375027
Manufacturing (Household)
246546
296050
291682
317743
347389
337242
Manufacturing (Corporate +Household)
1878369
2146189
2333721
2566623
2805330
2712269
Growth over previous year (%)
14.3
8.7
10.0
9.3
-3.3
GVA at basic prices for All Economic activities
11504279
12574499
13965200
15505665
17161213
18461343
Growth over previous year (%)
9.3
11.1
11.0
10.7
7.6
Share of GVA of Manufacturing sector in GVA for All Economic
Activities
16.3
17.1
16.7
16.6
16.3
14.7
Share of GVA of Chemical and chemical products excluding
Pharmaceutical; medicinal chemicals and botanical products (Industry
Division 20 )in GVA for All Economic Activities
1.17
1.54
1.49
1.45
1.44
1.32
Share of GVA of Chemical and chemical products including
Pharmaceutical; medicinal chemicals and botanical products (Industry
Division 20 and 21) in GVA for All Economic Activities
2.15
2.69
2.62
2.52
2.51
2.29
Share of GVA of chemical and chemical products (Industry Division 20
)in GVA for Manufacturing Sector
7.17
9.03
8.94
8.75
8.81
8.97
Share of GVA of chemical and chemical products including
Pharmaceutical; medicinal chemicals and botanical products (Industry
Division 20 and 21)in GVA for Manufacturing Sector
13.20
15.79
15.70
15.20
15.35
15.62
Source: National Accounts Statistics 2021, Ministry of Statistics & Programme Implementation.
170
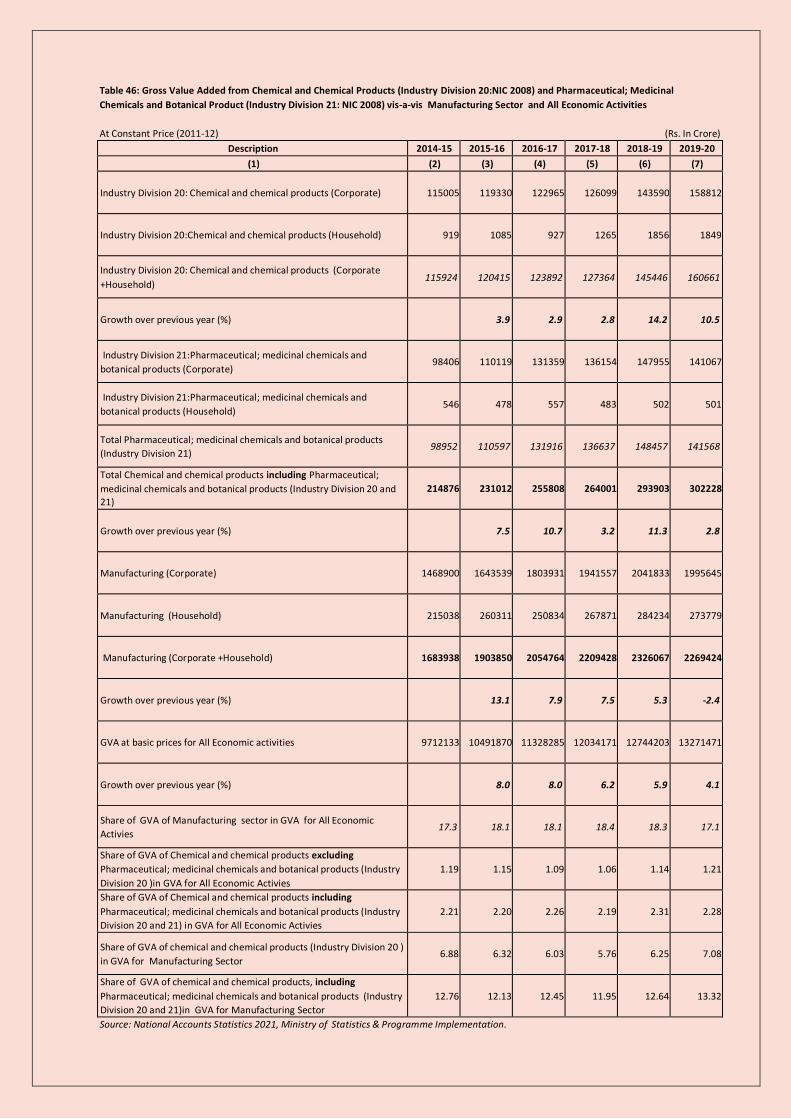
Table 46: Gross Value Added from Chemical and Chemical Products (Industry Division 20:NIC 2008) and Pharmaceutical; Medicinal
Chemicals and Botanical Product (Industry Division 21: NIC 2008) vis-a-vis Manufacturing Sector and All Economic Activities
At Constant Price (2011-12) (Rs. In Crore)
Description 2014-15 2015-16 2016-17 2017-18 2018-19 2019-20
(1) (2) (3) (4) (5) (6) (7)
Industry Division 20: Chemical and chemical products (Corporate)
115005
119330
122965
126099
143590
158812
Industry Division 20:Chemical and chemical products (Household)
919
1085
927
1265
1856
1849
Industry Division 20: Chemical and chemical products (Corporate
+Household)
115924
120415
123892
127364
145446
160661
Growth over previous year (%)
3.9
2.9
2.8
14.2
10.5
Industry Division 21:Pharmaceutical; medicinal chemicals and
botanical products (Corporate)
98406
110119
131359
136154
147955
141067
Industry Division 21:Pharmaceutical; medicinal chemicals and
botanical products (Household)
546
478
557
483
502
501
Total Pharmaceutical; medicinal chemicals and botanical products
(Industry Division 21)
98952
110597
131916
136637
148457
141568
Total Chemical and chemical products including Pharmaceutical;
medicinal chemicals and botanical products (Industry Division 20 and 21)
214876
231012
255808
264001
293903
302228
Growth over previous year (%)
7.5
10.7
3.2
11.3
2.8
Manufacturing (Corporate)
1468900
1643539
1803931
1941557
2041833
1995645
Manufacturing (Household)
215038
260311
250834
267871
284234
273779
Manufacturing (Corporate +Household)
1683938
1903850
2054764
2209428
2326067
2269424
Growth over previous year (%)
13.1
7.9
7.5
5.3
-2.4
GVA at basic prices for All Economic activities
9712133
10491870
11328285
12034171
12744203
13271471
Growth over previous year (%)
8.0
8.0
6.2
5.9
4.1
Share of GVA of Manufacturing sector in GVA for All Economic
Activies
17.3
18.1
18.1
18.4
18.3
17.1
Share of GVA of Chemical and chemical products excluding
Pharmaceutical; medicinal chemicals and botanical products (Industry
Division 20 )in GVA for All Economic Activies
1.19
1.15
1.09
1.06
1.14
1.21
Share of GVA of Chemical and chemical products including
Pharmaceutical; medicinal chemicals and botanical products (Industry
Division 20 and 21) in GVA for All Economic Activies
2.21
2.20
2.26
2.19
2.31
2.28
Share of GVA of chemical and chemical products (Industry Division 20 )
in GVA for Manufacturing Sector
6.88
6.32
6.03
5.76
6.25
7.08
Share of GVA of chemical and chemical products, including
Pharmaceutical; medicinal chemicals and botanical products (Industry
Division 20 and 21)in GVA for Manufacturing Sector
12.76
12.13
12.45
11.95
12.64
13.32
Source: National Accounts Statistics 2021, Ministry of Statistics & Programme Implementation.
171

Table 47: Value of Output from Chemicals and Chemical products ( Industry Division 20: NIC 2008) and Pharmaceutical;
Medicinal Chemicals and Botanical Products (Industry Division 21: NIC 2008) vis-a-vis Manufacturing Sector
At Current Prices (Rs. In Crore)
Value of Output 2014-15 2015-16 2016-17 2017-18 2018-19 2019-20
(1) (2) (3) (4) (5) (6) (7)
Manufacturing (Corporate)
7803213
7591834
8162260
9032405
10854443
10509487
Manufacturing (Household)
698250
825639
824799
936733
1060700
1037598
Manufacturing (Corporate + Household)
8501463
8417473
8987059
9969138
11915143
11547086
Chemical and chemical products (Corporate) (Industry
Division 20)
626716
668344
662125
729330
948677
922194
Chemical and chemical products (Household) (Industry
Division 20)
5327
6100
5137
7104
11038
10847
Total Chemical and chemical products excluding
Pharmaceutical; medicinal chemicals and botanical
products (Industry Division 20)
632043
674444
667262
736434
959715
933042
Pharmaceutical; medicinal chemicals and botanical
products --Corporate (Industry Division 21)
257134
300519
318143
325755
395757
385910
Pharmaceutical; medicinal chemicals and botanical
products --Household (Industry Division 21)
3121
2833
3330
2922
3095
3185
Total Pharmaceutical; medicinal chemicals and botanical
products (Industry Division 21)
260255
303352
321472
328677
398852
389094
Total Chemical and chemical products including
Pharmaceutical; medicinal chemicals and botanical
products (Industry Division 20 and 21)
892298
977796
988734
1065111
1358567
1322136
Source: National Accounts Statistics 2021, CSO, Ministry of Statistics & Programme Implementation.
172

Table 48: Value of Output from Chemicals and Chemical Products ( Industry Division 20: NIC 2008) and Pharmaceutical;
Medicinal Chemicals and Botanical Products (Industry Division 21: NIC 2008) vis-a-vis Manufacturing Sector
At Constant Price (2011-12) (Rs. In Crore)
Value of Output 2014-15 2015-16 2016-17 2017-18 2018-19 2019-20
(1) (2) (3) (4) (5) (6) (7)
Manufacturing (Corporate)
7057882
7245184
7675612
8200088
9409806
9123760
Manufacturing (Household)
612028
732581
712666
791191
868003
839868
Manufacturing (Corporate + Household)
7669910
7977765
8388278
8991280
10277809
9963628
Chemical and chemical products (Corporate) (Industry
Division 20)
539807
593556
596509
648293
796538
784846
Chemical and chemical products (Household) (Industry
Division 20)
4588
5417
4628
6315
9268
9232
Total Chemical and chemical products excluding
Pharmaceutical; medicinal chemicals and botanical products
(Industry Division 20)
544395
598973
601137
654608
805806
794078
Pharmaceutical; medicinal chemicals and botanical products --
Corporate (Industry Division 21)
224571
253175
265783
268775
320451
303150
Pharmaceutical; medicinal chemicals and botanical products --
Household (Industry Division 21)
2725
2387
2782
2411
2506
2502
Total Pharmaceutical; medicinal chemicals and botanical
products (Industry Division 21)
227296
255562
268565
271185
322957
305652
Total Chemical and chemical products including
Pharmaceutical; medicinal chemicals and botanical products
(Industry Division 20 and 21)
771691
854535
869702
925793
1128763
1099730
Source: National Accounts Statistics 2021, Ministry of Statistics & Programme Implementation.
173

Table 49: All India Estimate of Selected Characteristics of Factory Sector for Chemical and Chemical products
(Industry Division 20:NIC 2008) , Pharmaceutical; Medicinal Chemicals and Botanical Product (Industry Division
21: NIC 2008) and Maufacture of Megnetic and Optical Media (Industry Division 268)
Description 2014-15 2015-16 2016-17 2017-18 2018-19
Industry Division 20: Chemical and Chemical Products
No of factories (no.) 11715 12015 12168 12568 12902
No of workers (no.) 519000 541343 588806 614733 666623
Total Output (Rs. crore) 557244 609216 583008 661499 821126
Total Inputs (Rs. crore) 461953 473764 446877 517336 661207
Gross Value Added (Rs. crore) 95292 135452 136131 144163 159919
Industry Division 21: Pharmaceutical; Medicinal Chemicals and Botanical Products
No of factories (no.) 4908 5036 4946 5051 5161
No of workers (no.) 369196 395988 431732 454024 483238
Total Output (Rs. crore) 231833.53 265742.32 271958.53 285014 342227.15
Total Inputs (Rs. crore) 150713.14 174161.51 174413.61 182832 224273.68
Gross Value Added (Rs. crore) 81120.39 91580.81 97544.92 102182 117953.47
Industry Division 268: Maufacture of Megnetic and Optical Media
No of factories (no.) 4 5 3 10 15
No of workers (no.) 48 491 200 529 1970
Total Output (Rs. Lakh) 1105 31259 7534 75141 375859
Total Inputs (Rs. Lakh) 760 23350 5819 61256 283135
Gross Value Added (Rs. Lakh) 345 7909 1715 13885 92724
Source: Collated from Annual Survey of Industries 2018-19, Ministry of Statistics & Programme Implementation
174

Table 50: Statewise Estimate of Selected Characteristics of Factory Sector for Industry Division 20: NIC 2008: Chemicals and Chemical Products
State No. of Factories GVA (Rs. Lakh) Total Output (Rs Lakh)
2015-16 2016-17 2017-18 2018-19 2015-16 2016-17 2017-18 2018-19 2015-16 2016-17 2017-18 2018-19
(1) (2) (3) (4) (5) (6) (7) (8) (9) (10) (11) (12) (13)
Andhra Pradesh 401 405 368 394 399763 331177 356689 446176 1940284 2130755 2265003 2509301
Assam 109 129 120 133 251355 216239 264490 223202 594954 495458 789313 757604
Bihar 51 61 44 52 3609 5813 15373 16415 44830 50286 76265 84900
Chhattisgarh 102 113 109 110 10499 16917 8133 8010 92515 137414 85687 201584
Goa 45 45 38 36 206736 162389 137513 72231 986279 659576 701225 747163
Gujarat 2316 2459 2596 2757 3685024 4233550 4499173 5481852 19313596 19379723 22062065 29156214
Haryana 257 305 333 362 253744 295782 301646 371391 1059595 1375643 1507216 1831951
Himachal Pradesh 228 235 208 225 844599 585106 732011 528976 2255720 1723963 1722044 1480706
Jammu & Kashmir 131 126 148 134 212274 218570 211080 235599 843376 741058 701986 975425
Jharkhand 96 107 100 88 85458 121407 114797 82897 294274 301703 529388 317377
Karnataka 567 581 591 659 315071 295813 340167 464619 1540735 1419647 1600629 2079037
Kerala 149 141 139 127 100787 362628 263532 376499 529190 904458 818774 1019809
Madhya Pradesh 278 268 319 314 190960 346909 349899 276016 1294751 1101147 1530984 1451534
Maharashtra 1898 1842 1790 1772 2711485 2278858 2361059 2404081 10805377 9566108 10814777 13079364
Meghalya 3 4 5 4 4452 4177 2462 1171 9496 8910 4891 4997
Odisha 82 95 104 97 71247 336314 408461 553716 995024 1041620 1188177 1478344
Punjab 156 147 180 165 64196 106447 164390 104209 724185 698169 895038 815753
Rajasthan 308 336 398 372 279905 486262 336071 453739 1994750 2799626 2443874 3441389
Sikkim 4 3 3 3 42560 24694 9299 10771 161410 150743 23123 32609
Tamil Nadu 2588 2521 2639 2679 628206 646481 950622 694678 3669539 2918077 3610434 3582598
Tripura 9 10 8 9 226 70 74 1 438 198 119 78
Uttarkhand 243 219 232 233 1276355 808699 591227 880498 3134378 2091798 2064430 2563120
Uttar Pradesh 675 685 716 721 502485 522193 728207 883256 2974091 2870926 3813975 5049876
West Bengal 322 342 333 355 336783 584589 501561 445340 2585047 2911301 3278063 3360107
Dadra & N Haveli 168 177 167 202 84365 202142 218598 395490 702076 813926 1006494 3163327
Daman & Diu 108 118 152 168 144797 99930 163344 108722 693514 630760 1043393 1105225
Chandigarh NA NA NA NA NA NA NA NA NA NA NA NA
Delhi 77 72 69 95 20789 15696 21407 21751 103882 205669 225011 192024
Puducheery 91 97 96 99 182471 188074 179677 270689 503611 470007 463889 606063
Telagana 548 519 558 532 634399 115427 184446 178966 1066936 693463 874400 1016178
All India 12010 12162 12563 12897 13544600 13612353 14415408 15990961 60913853 58292132 66140667 82103657
Source: Annual Survey of Industries (Factory Sector), Ministry of Statistics & Programme Implementation
NA: Not Available
175

Table 51: Production, Import, Export, Consumption of Major Chemicals and Petrochemicals and Export as % of Production and Import as % of
Consumption
(In Thousand Tonnes)
Group Description 2013-14 2014-15 2015-16 2016-17 2017-18 2018-19 2019-20 2020-21
(1) (2) (3) (4) (5) (6) (7) (8) (9) (10)
Major Chemicals
Production
9643 9660 9884 10234 11069 11589 11943 11243
Major Petrochemicals
A. Basic major Petrochemicals 13410 13448 14905 15510 15670 16269 19041 17938
B. Intermediates 16313 16816 18690 18743 19063 19057 22119 21903
C. Other Petro-based Chemicals 1970 1963 2159 2174 2080 2192 2364 2314
Total Major Chemicals and
Petrochemicals 41336 41887 45638 46661 47881 49108 55468 53399
Major Chemicals
Exports
1221 1061 1138 1484 1496 1579 1698 1905
Major Petrochemicals
A. Basic major Petrochemicals 2616 2254 2743 2956 3293 4095 3719 2681
B. Intermediates 1977 2034 2430 2190 3915 5377 4842 5421
C. Other Petro-based Chemicals 96 124 129 144 193 147 238 171
Total Major Chemicals and
Petrochemicals 5909 5473 6440 6773 8897 11198 10497 10179
Major Chemicals
Imports
4333 5025 5360 5400 5937 6379 6557 5983
Major Petrochemicals
A. Basic major Petrochemicals 4304 5080 5681 5938 6408 6284 5356 4356
B. Intermediates 2950 3253 3245 3540 3180 2845 3323 2786
C. Other Petro-based Chemicals 2204 2373 2740 2651 3255 3227 3543 3069
Total Major Chemicals and
Petrochemicals 13791 15730 17026 17529 18780 18735 18780 16194
Major Chemicals
Consumption$
12756 13623 14106 14150 15510 16389 16802 15321
Major Petrochemicals
A. Basic major Petrochemicals 15098 16274 17843 18492 18785 18458 20678 19613
B. Intermediates 17286 18034 19505 20094 18328 16525 20600 19268
C. Other Petro-based Chemicals 4078 4211 4770 4680 5142 5272 5670 5212
Total Major Chemicals and
Petrochemicals 49218 52143 56224 57416 57765 56645 63750 59414
Major Chemicals
Exports as % of
Production
12.7 11.0 11.5 14.5 13.5 13.6 14.2 16.9
Major Petrochemicals
A. Basic major Petrochemicals 19.5 16.8 18.4 19.1 21.0 25.2 19.5 14.9
B. Intermediates 12.1 12.1 13.0 11.7 20.5 28.2 21.9 24.7
C. Other Petro-based Chemicals 4.9 6.3 6.0 6.6 9.3 6.7 10.0 7.4
Total Major Chemicals and
Petrochemicals 14.3 13.1 14.1 14.5 18.6 22.8 18.9 19.1
Major Chemicals
Imports as % of
Consumption
355.1 473.5 470.9 363.9 396.9 403.9 386.1 314.1
Major Petrochemicals
A. Basic major Petrochemicals 28.5 31.2 31.8 32.1 34.1 34.0 25.9 22.2
B. Intermediates 17.1 18.0 16.6 17.6 17.4 17.2 16.1 14.5
C. Other Petro-based Chemicals 54.0 56.3 57.4 56.6 63.3 61.2 62.5 58.9
Total Major Chemicals and
Petrochemicals 28.0 30.2 30.3 30.5 32.5 33.1 29.5 27.3
Note: $ Derived consumption as Production+ Imports-Exports
176

Table 52: Exports of All Chemicals as % of Value of Output and Imports of All Chemicals as % of Consumption
(Rs. in Crore)
Item Code 2015-16 2016-17 2017-18 2018-19 2019-20
Exports of Pharmaceutical products HS code 30 84481 86705 85447 103240 115473
Exports of Fertilizers HS code 31 673 466 685 1038 837
Exports of all Chemicals (including Pharmaceutical
products and Fertilizers)
HS codes 28,29,30,31,32,38,39,4002,54
and 55 266528 277364 305413 387853 391604
Imports of Pharmaceutical products HS code 30 10742 11515 12241 14581 16530
Imports of Fertilizers HS code 31 45973 28754 30108 46457 47397
Imports of Chemicals and Chemical products HS codes 28,29,30,31,32,38,39,4002,54
and 55 318595 309458 360205 455872 423587
Value of Output of Chemicals and Chemical
products at current prices Industry Division 20 and 21: NIC 2008 977796 988734 1065111 1358567 1322136
Consumption of Chemicals and Chemical products Value of Output + Imports - Exports 1029863 1020828 1119903 1426586 1354120
Exports of all Chemicals as % of Value of Output 27.3 28.1 28.7 28.5 29.6
Imports of all Chemicals as % of Derived Consumption 30.9 30.3 32.2 32.0 31.3
Chapter 28: Inorganic Chemicals; Organic or Inorganic Compounds of Precious Metals, of Rare-Earth Metals, of Radioactive Elements or of Isotopes; Chapter 29:
Organic Chemicals; Chapter30: Pharmaceutical products; Chapter 31: Fertilizers ; Chapter 32: Tanning or Dyeing Extracts; Tannins and their Derivatives; Dyes,
Pigments and Other Colouring Matter; Paints and Varnishes; Putty and other Mastics; Inks; Chapter 38: Miscellaneous Chemical Products; Chapter 39: Plastics
and articles thereof; 4002: Synthetic rubber and factice derived from oils, in primary forms or in plates, sheets or strip; mixtures of any proChapter 54: Man-
made Filaments and Chapter 55: Man-made staple fibres
Note 1: Data source in recspect of Imports, Exports (Chapter-wise) is DGCIS Portal
Note 2: Data Source in respect of value of output is National Account Statistics, 2021 (MoSPI)
177

Statistics and Monitoring DivisionDepartment of Chemicals and Petrochemicals
Ministry of Chemicals and FertilizersGovernment of India