Catalytic Conversion Of Crop Oil To Petrochemical Substitutes ...
274
University of North Dakota UND Scholarly Commons eses and Dissertations eses, Dissertations, and Senior Projects January 2015 Catalytic Conversion Of Crop Oil To Petrochemical Substitutes And Other Bio-Based Chemicals Swapnil Liladhar Fegade Follow this and additional works at: hps://commons.und.edu/theses is Dissertation is brought to you for free and open access by the eses, Dissertations, and Senior Projects at UND Scholarly Commons. It has been accepted for inclusion in eses and Dissertations by an authorized administrator of UND Scholarly Commons. For more information, please contact [email protected]. Recommended Citation Fegade, Swapnil Liladhar, "Catalytic Conversion Of Crop Oil To Petrochemical Substitutes And Other Bio-Based Chemicals" (2015). eses and Dissertations. 1768. hps://commons.und.edu/theses/1768
-
Upload
khangminh22 -
Category
Documents
-
view
2 -
download
0
Transcript of Catalytic Conversion Of Crop Oil To Petrochemical Substitutes ...

University of North DakotaUND Scholarly Commons
Theses and Dissertations Theses, Dissertations, and Senior Projects
January 2015
Catalytic Conversion Of Crop Oil ToPetrochemical Substitutes And Other Bio-BasedChemicalsSwapnil Liladhar Fegade
Follow this and additional works at: https://commons.und.edu/theses
This Dissertation is brought to you for free and open access by the Theses, Dissertations, and Senior Projects at UND Scholarly Commons. It has beenaccepted for inclusion in Theses and Dissertations by an authorized administrator of UND Scholarly Commons. For more information, please [email protected].
Recommended CitationFegade, Swapnil Liladhar, "Catalytic Conversion Of Crop Oil To Petrochemical Substitutes And Other Bio-Based Chemicals" (2015).Theses and Dissertations. 1768.https://commons.und.edu/theses/1768

CATALYTIC CONVERSION OF CROP OIL TO PETROCHEMICAL SUBSTITUTES
AND OTHER BIO-BASED CHEMICALS
by
Swapnil Liladhar Fegade
Bachelor of Technology in Polymer Engineering,
University of Mumbai, Institute of Chemical Technology, India
A Dissertation
Submitted to the Graduate Faculty
of the
University of North Dakota
in partial fulfillment of the requirements
for the degree of
Doctor of Philosophy
Grand Forks, North Dakota
May
2015

ii
Copyright 2015 Swapnil Fegade

iii
This Dissertation, submitted by Swapnil Liladhar Fegade in partial fulfillment of the
requirements for the Degree of Doctor of Philosophy from the University of North
Dakota, has been read by the Faculty Advisory Committee under whom the work has
been done and is hereby approved.
____________________________________
Dr. Brian Tande Co-Chairperson
____________________________________
Dr. Wayne Seames Co-Chairperson
____________________________________
Dr. Michael Mann Committee Member
____________________________________
Dr. Evguenii Kozliak Committee Member
____________________________________
Dr. Alena Kubátová Committee Member
This dissertation meets the standards for appearance, conforms to the style and
format requirements of the Graduate School of the University of North Dakota, and is
hereby approved.
___________________________________
Dean of the Graduate School
___________________________________
Date

iv
PERMISSION
Title Catalytic Conversion of Crop Oil to Petrochemical Substitutes and Other
Bio-Based Chemicals
Department Chemical Engineering
Degree Doctor of Philosophy
In presenting this dissertation in partial fulfillment of the requirements for a
graduate degree from the University of North Dakota, I agree that the library of this
University shall make it freely available for inspection. I further agree that permission
for extensive copying for scholarly purposes may be granted by the professor who
supervised my dissertation work or, in his absence, by the chairperson of the department
or the dean of the Graduate School. It is understood that any copying or publication or
other use of this dissertation or part thereof for financial gain shall not be allowed without
my written permission. It is also understood that due recognition shall be given to me
and to the University of North Dakota in any scholarly use which may be made of any
material in my dissertation.
Signature __Swapnil Fegade____________
Date ____05/04/2015______________

v
TABLE OF CONTENTS
LIST OF FIGURES………………………………………………..….…….......viii
LIST OF TABLES.................................................................................................xii
AKNOWLEDGMENTS.......................................................................................xiv
ABSTRACT........................................................................................................xvii
CHAPTER
I. INTRODUCTION AND BACKGROUND....................................1
Project motivation………………………………………………....1
Hypotheses………………………………………………………...2
Background………………………………………………………..4
Dissertation outline………………………………………………..7
II. AROMATIZATION OF PROPYLENE OVER HZSM-5……….9
Introduction.....................................................................................9
Experimental..................................................................................12
Results and Discussion..................................................................16
Conclusions....................................................................................33
III. AROMATIZATION OF PROPYLENE OVER NANOSCALE
HZSM-5……………………………………………….………..34

vi
Introduction and Background........................................................34
Experimental..................................................................................35
Results and Discussion..................................................................36
Conclusions....................................................................................51
IV. CONVERSION OF 1-TETRADECENE TO AROMATIC
COMPOUNDS……………………………………….………….53
Introduction...................................................................................53
Experimental..................................................................................55
Results and Discussion..................................................................60
Conclusions....................................................................................68
V. A NOVEL TWO STEP PROCESS FOR THE PRODUCTION OF
RENEWABLE AROMATIC HYDROCARBONS…………….69
Introduction...................................................................................69
Experimental..................................................................................71
Results and discussion...................................................................78
Conclusions....................................................................................95
VI. CONCLUSIONS AND RECOMMENDATIONS........................96

vii
APPENDIX A: PROCEDURES ......................................................................................97
APPENDIX B: RAW DATA OF STATISTICAL ANALYSIS...................................121
APPENDIX C: ADDITIONAL EXPERIMENTAL RUNS AND DATA.....................166
APPENDIX D: PUBLISHED PREPRINTS...................................................................191
REFERENCES................................................................................................................242

viii
LIST OF FIGURES
Figure Page
1. Schematic diagram of the propylene aromatization setup……………………….13
2. (a) Pareto chart of effects for yield of benzene, (b) main effects plot for yield
of benzene - each point in main effects plot represents the mean value of four
experimental data points, either at low or high level…………………………….18
3. a Pareto chart for effects for yield of toluene, (b) main effects plot for yield of
toluene……………………………………………………………………………19
4. (a) Pareto chart for effects for yield of p-xylene, (b) main effects plot for yield
of p-xylene……………………………………………………...………………..19
5. Pareto chart for effects for yield of o-xylene, (b) main effects plot for yield of
o-xylene………………………………………………………….……………….20
6. Pareto chart for effects for yield of total BTX, (b) main effects plot for yield
of total BTX……………………………………………………………………...22
7. Significant interaction effects plots for yields of (a) benzene, (b) toluene, (c1
& c2) p-xylene, (d) o-xylene and (e) total BTX…………………………………24
8. (a) Pareto chart, (b) main effects plot and (c) interaction plots for conversion
of propylene……………………………………………………………...………26
9. Scheme (1) for Propylene aromatization reaction pathways…………………….29
10. (a) XRD) pattern (b) TEM image of nanoscale HZSM-5……………………….37
11. Comparison between performance of nanoscale and microscale HZSM-5 on
aromatics yield at 4 different reaction conditions……………………………….39

ix
12. (a) Pareto chart, (b) main effects plot, and (c1 & c2) interaction plots for %
total BTX yield…………………………………………………………………..41
13. Propylene cracking activities over nanoscale and microscale HZSM-5 catalysts
at the same reaction conditions…………………………………………………..43
14. (a) Pareto chart, (b) main effects plot, and (c1 & c2) interaction plots for %
fraction of xylenes……………………………………………………………….46
15. (a) Pareto chart, (b) main effects plot, and (c) interaction plots for % fraction
of benzene………………………………………………………………………..49
16. (a) Pareto chart, (b) main effects plot, and (c) interaction plots for % fraction
of toluene………………………………………………………...………………50
17. Chromatogram of liquid products obtained by using HZSM-5. Operational
conditions were 375 ºC, OCR = 10 and reaction time of 30 minutes.…………..60
18. Comparison of aromatic hydrocarbon yields obtained by 1-tetradecene
aromatization varying a) reaction temperatures (where OCR was 10 and time
was 30 minutes), b) OCR (where temperature was 375 °C and time was 30
minutes). The Y axis represents the concentration (wt%) of aromatic
hydrocarbons in the product……………………………………………………..61
19. Homology profiles of the alicyclic and aromatic hydrocarbon products. The
reforming reaction conditions were 375 ºC, OCR = 10 and reaction time of 30
minutes.…………………………………………………………………………..66
20. Reactor setup for thermal cracking of soybean oil ……………………………...72
21. Reactor setup for the aromatization of thermally cracked soybean oil….………73
22. The effect of A) reaction temperature, B) OLP-to-catalyst ratio and C)
silica/alumina ratio on aromatics’ yields. Monoaromatics include all benzene
derivatives; total aromatics also include diaromatics, i.e., naphthalenes and
indanes. Polyaromatics were detected only in trace amounts….………………...82

x
23. Selected ion chromatograms showing the alkane and alkene peaks (common
ions 57 and 59) in A) the reformate and B) the feedstock (Organic Liquid
Product)……………………………………………………………………….….87
24. Selected ion chromatograms showing the carboxylic acid peaks (common ion
60) in A) the reformate and B) the feedstock (Organic Liquid Product)……...…88
25. A comparison of alkane homology profiles in the reformate (product) and in
the feedstock (Organic Liquid Product). The average values are provided for
the two samples in the product.…………………………………………………..89
26. Aromatic hydrocarbons and cyclohexa(e)nes in the feedstock (Organic Liquid
Product) and reformate ………………………………………………………....90
27. SEM instrument diagram and important components………………………….118
28. SEM column diagram…………………………………………………………..120
29. Results of preliminary catalytic reforming experiments performed on α-
olefins……………………………………………………………………….…..168
30. The effect of temperature on aromatization (BTEX concentration) at a
constant reaction time of 20 min. and OCR of 10…………………………..….173
31. The effect of reaction time on aromatization (BTEX concentration) at a
reaction temperature of 325 ºC and at a OCR of 10………………………..…..174
32. Main effect plots of coke/solids yields after OLP reforming…………………..177
33. Pareto chart of coke/solids yields after OLP reforming………………………...178
34. Interaction plots for coke/solids yield after OLP reforming……………………179
35. Contour plot of coke/solids yield after OLP reforming………………………...180
36. Main effects plots for a) Liquid yield, b) gases yield obtained after OLP
conversion………………………………………………………………………181

xi
37. Contour plot of liquid yield obtained after OLP conversion………….………..183
38. Contour plot of gases yield obtained after OLP conversion……………………184
39. Residual plots for BTEX yield obtained after OLP conversion………………..188
40. Contour plot of BTEX yield obtained after OLP conversion…………………..188
41. Surface plot of aromatics yield obtained after OLP conversion………………..189

xii
LIST OF TABLES
Table Page
1. Experimental factors and their uncoded set point values………………………...15
2. Factors and response table showing yields of benzene, toluene, p-xylene,
o-xylene, total BTX, and propylene conversion………………………………....17
3. Summary of the effect of each significant variable and 2-way interaction on
every response…………………………………………………………………....32
4. Factors and response table showing BTX yield and individual aromatic
compound fractions……………………………………………………..………..38
5. List of compound name, calibration standard and quantification ion …………...58
6. Detailed composition of the aromatic hydrocarbon product fraction formed
under the maximum yield conditions in runs #3 (Tables 7 and 8) and its
replicate. The reforming reaction conditions were as follows: 375 ºC,
OCR = 10 and reaction time of 30 minutes. The isomers are listed in the
order of their chromatographic elution……………………………..……………62
7. Gases, liquids and coke yields obtained from 1-tetradecene conversion…..….…63
8. Aromatic product yields (wt%) obtained in experiments on 1-tetradecene
conversion.…...………………………………………………….……………….64
9. Experimental conditions for the catalytic (SiO2/Al2O3=23) conversion of
OLP and the corresponding main product yields…………………..………….....74
10. Details of GC-MS analysis used for reformate identification ………………......76
11. Summary composition of OLP obtained from non-catalytically cracked crop
oil…………………………………………………………………………..…….78
12. Composition of the gas fraction obtained by catalytic OLP reforming……….....85
13. Detailed chemical composition (concentration) of both the original OLP and
liquid reformate …………………………………………………………….…...86
14. The concentrations of aromatic hydrocarbons in replicate liquid reformate
samples……………………………………………….…………………………..91

xiii
15. Chemicals and quantities required for nanoscale HZSM-5 synthesis……….…..97
16. GC Calibration components and the residence times…………………..……....115
17. Preliminary catalytic reforming experimental conditions for α-olefins
study……………………………….………………………….………………...167
18. Factors used to study OLP aromatization with their low and high values…..….171
19. List of preliminary experiments consisting of the reaction conditions and
BTEX concentrations in the liquid products…………………………………...171
20. Gases, liquids and coke and solid product yields after OLP conversion…..…..172
21. Experimental factors and their uncoded levels for OLP aromatization………..176
22. A full factorial experimental design consisting of the reaction conditions
and the responses…………………………………………..………………..…176
23. A Central Composite Design (CCD) design consisting of the experimental
reaction conditions and the responses……………………………………….….182
24. Gaseous components of OLP reforming reaction………………………………185
25. A full factorial experimental design consisting of the reaction conditions
and the response for initial OLP aromatization runs………………………...…186
26. A Central Composite Design consisting of the OLP aromatization
experimental reaction conditions and the responses………………………….187

xiv
ACKNOWLEDGEMENTS
I would like to thank my Savior, Lord, God Jesus who was always with me
throughout my work and is with me forever. Thank you Jesus Christ for everything that
you have done for me! I would like to thank God’s words (Holy Bible) which inspires me
all the time. It has all the answers to my questions. For example, through The Bible, I
came to know for sure that the petroleum (crude oil) has been in existence for more than
2000 years. Bible verse ‘Deuteronomy 32:13b’, states, 'He nourished him with honey
from the rock, and with oil from the flinty crag.’ This is an evidence of crude oil (from
rock) existing 2000 years ago. I would like to thank my advisors and committee members
Dr. Brian Tande, Dr. Wayne Seames, Dr. Michael Mann, Dr. Alena Kubátová and Dr.
Evguenii Kozliak for the valuable guidance throughout my doctoral studies. Financial
assistance from the USDA, the ND EPSCoR program, the ND Soybean Council, Bayer
Cropscience, the ND Department of Commerce Centers of Excellence Program through
the SUNRISE BioProducts Center of Excellence, the UND Chemical Engineering, and
the UND School of Graduate Studies is appreciated. I would also like to thank Dr Alena
Kubátová’s research group members for exceptional help in GC analysis. SUNRISE team
members, Dr. Kanishka Marasinghe, Dr.Julia Zhao’s research groups are also
acknowledged. I am also thankful to Dr. Darrin Muggli, Professor and Chair of
Engineering at Benedictine College, for providing guidance in the research. I would like
to thank UND Police Department (Captain Wayne Onger, officers Jeremy Cochran, Joseˊ

xv
Solis to name a few) for supporting me in the difficult situations and keeping me safe on
UND campus.
I would like to thank Cottonwood Community Church pastors, members and
attendees for supporting me and lifting me to Jesus. Thank you Jeff hall, Patrick Schultz,
Phondie Simolane, Andrew Rice, Dr. Tom Dunham, Bob Bartlett for leading me to
Christ. Thank you Jaimie, Taylor Miesel, Ryan Worstall, Katie Cavalli, Alyssa, Richard
& Sharon Schmidt for supporting me and throughout the tough times. I would also like to
thank Mary Tienburg, Mardene, Keith Bjerk, John Welch for helping me. Thanks to The
Schultz family (Andrea and family) and kids (Kaela, Erin, Josie, Marie, Lizzy) for
cheering me up with all your smiles all the times (especially when I was missing my son
Arnav).
I would also like to thank US Consulate-Mumbai for granting me US visa to
study, United States Department of States for the continuous help in the tough most
situation. I would like to thank Angie, Connie and chemical engineering department for
the continuous help. Thanks to ‘Taylor and Francis’ for providing permission to use my
published article as a chapter in this dissertation. The details of publication are: “Swapnil
L. Fegade et al (2013), Aromatization of propylene over HZSM-5: A design of
experiments (DOE) approach. Chemical Engineering Communications 200 (8): 1039-
1056.”

xvi
Thanks to my mother (Rajani Liladhar Fegade), father (Liladhar D. Fegade), sister
(Sanghavi Chaudhari), and son (Arnav Swapnil Fegade) for continuously supporting me
throughout my doctoral studies.

xvii
ABSTRACT
A two-step process was developed for the production of aromatic hydrocarbons
from triacyl glyceride (TG) oils such as crop oils, algae oils, and microbial oils. In the
first step, TG (soybean) oil was non-catalytically cracked to produce an organic liquid
product (OLP). The resulting OLP was then converted into aromatic compounds in a
second reaction using a zeolite catalyst, HZSM-5. In this second reaction three main
factors were found to influence the yield of aromatic hydrocarbons, namely the
SiO2:Al2O3 ratio in the HZSM-5, the reaction temperature and the OLP-to-catalyst ratio.
Upon optimization, up to 58 wt% aromatics were obtained. Detailed analyses revealed
that most of the alkenes and carboxylic acids, and even many of the
unidentified/unresolved compounds which are characteristic products of non-catalytic TG
cracking, were reformed into aromatic hydrocarbons and n-alkanes. Instead of BTEX
compounds that are the common products of alkene reforming with HZSM-5, longer-
chain alkylbenzenes dominated the reformate (along with medium-size n-alkanes).
Another novel feature of the two-step process was a sizable (up to 13 wt%) yield of
alicyclic hydrocarbons, both cyclohexanes and cyclopentanes. At optimum conditions,
the yields of coke (5 wt%) and gaseous products (14 wt%) were found to be lower than
those in a corresponding one-step catalytic cracking/aromatization process. Thus this
novel two-step process may provide a new route for the production of renewable
aromatic hydrocarbons.

xviii
Aromatization of propylene was performed in a continuous reactor over HZSM-5
catalysts. A full-factorial design of experiments (DOE) methodology identified the
effects of temperature (400-500 °C), Si:Al ratio (50-80), propylene feed concentration
(8.9-12.5 mol%), and catalyst amount (0.2-1.0 g) on propylene conversion as well as the
yields of benzene, toluene, p-xylene, o-xylene (BTX), and total BTX. The Si:Al ratio and
amount of the HZSM-5 catalyst influenced all of the responses, while temperature
impacted all the responses except the yield of p-xylene. An increase in feed concentration
significantly increased the yields of benzene, toluene, and total BTX. An interaction
between propylene feed concentration and catalyst amount influenced the yields of
benzene, toluene, and total BTX. This interaction indicated that a higher feed
concentration promotes aromatization at higher catalyst concentrations. By contrast, the
interaction of Si:Al ratio with propylene feed concentration was found significant for p-
xylene and o-xylene yields, but not for benzene and toluene, suggesting that xylenes are
synthesized on different sites than those for benzene and toluene. These interaction
effects demonstrate how the use of DOE can uncover significant information generally
missed using traditional experimental strategies.
The catalytic conversion of propylene to BTX (benzene, toluene, xylenes) over
nanoscale HZSM-5 zeolite was studied. A full-factorial design of experiments (DOE)
methodology identified three factors which significantly affected the aromatization
process: temperature (400-500 °C), propylene feed concentration (8.9-12.5 mol%), and
catalyst amount (0.2-1.0 g). An increase in all three factors significantly increased the

xix
yields of benzene, toluene, and total BTX but decreased the yield of xylene. A DOE
method was used to determine significant interaction effects which may be missed using
parametric experimental strategies. The observed effects showed that nanoscale HZSM-5
catalyst is better suited for facilitating cracking rather than aromatization reactions
presumably due to the smaller pore availability compared to micro-sized zeolites. Select
experiments in a batch reactor with soybean oil as a feedstock showed that the nanoscale
zeolite strongly retained large amounts of water, presumably within its pores, despite
prior high temperature calcinations.

1
CHAPTER I
INTRODUCTION AND BACKGROUND
Project Motivation
Fossil fuels, such as crude oil and natural gas, are the primary source for many of
the world’s most important chemicals, polymers, and composite materials. Petroleum is
the only source of petrochemicals. Although most crude oil is refined into products for
the transportation fuels market, a notable portion of it is used as a feedstock for aromatic
compounds and monomers for plastics and composites [1, 2]. However, there is
consensus in the scientific community that global climate change is and will continue to
occur due to the vast emission of fixed carbon into the atmosphere due to the extensive
use of fossil fuels [1, 3, 4]. Previous research at the University of North Dakota (UND)
[5, 6] and elsewhere [7-9] has led to the successful development processes that can
generate replacements for petroleum based fuels. However, there is still a need to
identify ways to use renewable feedstocks for producing chemicals and materials, which
could potentially replace petroleum derived chemicals and plastics materials.
Prior work performed under UND’s Sustainable Energy Research Initiative and
Supporting Education (SUNRISE) program has shown that during the non-catalytic
(thermal) cracking of TAG oil, gaseous hydrocarbons such as methane, propane,
propylene are generated [10] Similarly, during a single-step catalytic cracking of TAG oil
a major gaseous product was propylene. So, the first task of this research was to explore
the conversion of TAG oil cracking-derived propylene into aromatic compounds.
2
The organic liquid products (OLP’s) obtained from the non-catalytic cracking of
TAG oils consists primarily of alkanes and carboxylic acids, both of which can be
processed and separated into various transportation fuels (e.g. jet fuel, diesel) and other
by-products (e.g. naphtha). However, 10-20 % (wt % of feed oil) of these OLP’s was
found to be medium chain length (C6-C12) olefins [11, 12]. These olefins are undesirable
for fuels applications. They need to be converted into more valuable products because it
isn’t possible to separate them from the alkanes reasonably and they led to oxidative
stability problems in the fuel.
Hypotheses
In a previous catalytic cracking study at (UND SUNRISE) using a zeolite catalyst
to convert TAG oil into an OLP, it was found that unacceptable levels of coke were
formed resulting in catalyst deactivation. It was postulated [13] that the coke formation
was primarily occurring as a secondary reaction due to the formation of radical
intermediates during the initial TAG decomposition reactions. If true, then these
reactions compete with secondary aromatization reactions while also inhibiting the ability
of the catalyst to facilitate the desired reaction pathways. The primary objective of the
work presented in this dissertation was to test this hypothesis.
To test this hypothesis and to develop a reaction sequence that would minimize
catalyst deactivation due to coke formation on the catalyst surface, a two-step process
was proposed [13]. In this proposed process the TAG oil is cracked non-catalytically
under conditions favoring olefin formation in the first step. Any coke/tar formed due to
secondary reactions of decomposition radicals would then occur in the absence of a
catalyst. Techniques to minimize coke deposition onto reaction surfaces and to

3
collect/process tars produced in this first reactor are the subject of study by other UND
students and thus are outside of the scope of this dissertation.
The first reaction step is followed by intermediate purification steps to remove
highly volatile compounds (herein known as “gases” or “non-condensable”) from the
OLP that include compounds targeted from conversion into aromatics. This step is
followed by a second reaction step in which the OLP from the cracking reaction is
catalytically reformed to generate aromatics. Since the first step was well established
previously, the primary emphasis in the work documented by this dissertation was placed
on the second reaction step.
Previous studies [10] have also shown that a high concentration of propylene,
ethylene, and butylene is present in the gases produced during the initial non-catalytic
cracking reaction. These compounds are common feedstock chemicals for the production
of simple aromatics and thus could also be exploited to increase the aromatics production
from TAG oil.
A series of studies were performed to evaluate the production of aromatics from
the products of the initial TAG decomposition reactions. First, model alpha olefins were
chosen and reforming reactions to generate aromatics were studied for each compound
separately. Light alkenes present in the cracking reaction gases were represented by
propylene, while 1-tetradecene, 1-hexene, 1-octene, and 1-decene were used to represent
the alkenes present in the OLP. Finally the reforming of an actual alkene-rich
heterogeneous organic liquid product generated by non-catalytic TAG oil cracking was
studied.

4
Background
Catalytic Reforming
Aromatic compounds such as benzenes, toluene and xylenes (BTX) are of great
importance to the petrochemical industry because they are starting materials for
manufacturing polymers, resins, and elastomers. They are also used as solvents or as
additives to gasoline to increase its octane rating. Chemical grade aromatics, such as for
use in polymer production are usually produced from propylene and other light alkenes
that originate from natural gas; petroleum refineries produce aromatics from light straight
run naphtha for motor gasoline blend stock [14].
Reforming is a process in which hydrocarbon molecules are rearranged and reconstructed
into more complex molecules. When reforming is facilitated by catalytic action, the
process is called catalytic reforming. The liquid products obtained by reforming are
known as reformates. Reforming is the primary method used in the production of BTX
[15, 16] when it is often known as “aromatization” [17]. In this process, lighter
hydrocarbon molecules are also produced as unwanted byproducts, but they do have
some value as energy feedstocks [16].
In 1949, Universal Oil Products (UOP LLC) commercialized a catalytic
reforming process called ‘Platforming’. In this process, light naphtha feedstocks are
converted into aromatic rich high octane liquid products while generating byproducts
such as hydrogen, propane, butane, and other lighter gases. As the name suggests, it is a
‘Platinum’ based catalytic ‘reforming’ process.
The first improvement to this process was to introduce a bimetallic catalyst
containing platinum and rhenium which enabled operation of the reformer at lower

5
pressures while yielding a higher octane rated reformate. Unfortunately, catalyst coking
was a problem. As this problem could not be solved by catalyst development alone, UOP
eventually commercialized the CCR (continuous catalyst regeneration) Platforming
process, in which catalyst is taken out of the reformer continuously, regenerated and then
returned to the reformer. As the coke was burned off continuously, catalyst deactivation
due to coke deposition was minimized and longer run times between catalyst change outs
were possible. This process increased the liquid products and aromatics yields compared
to the original process [1].
Several other commercialized reforming processes for the production of aromatic
rich liquid products have been developed [1, 2]:
1) Magnaforming by Engelhard Minerals and Chemicals Corporation.
2) Powerforming by ExxonMobil.
3) Hydroforming by Standard Oil Development Co.
4) Rheniforming by Chevron.
5) Ultraforming by Amoco.
6) Thermofor catalytic reforming.
7) Houdriforming by Houdry Division of Air Products and Chemicals, Inc.
8) M2 forming process by Mobil (now ExxonMobil).
9) Aroforming by Salutec Australia and IFP France.
10) Cyclar process by BP-UOP.
From a review of the published reforming catalyst studies, it is clear that almost
all the commercialized (aromatization) reforming catalysts include either an individual

6
metallic active agent or single/bimetallic active agents supported by Al2O3. The metals
are typically platinum (Pt), rhenium (Re), and/or tin (Sn). A few processes also reportedly
use chromium oxide and molybdenum oxide as catalysts [2, 18].
Catalytic reforming is a complex process that involves many reactions. A summary of a
few reactions involved is as follows [2, 19, 20]
1) Dehydrogenation. The initial step in reforming is known as the activation step.
During this step, dehydrogenation via C-H bond scissioning of the feed molecules
occurs, resulting in the formation of double bonds in the linear or cyclic
molecules which eventually lead to aromatics formation. As the double bonds are
formed, hydrogen is released. Several studies had been conducted in order to
understand the mechanism of dehydrogenation. C-H bond scission either happens
because of an adsorption-desorption phenomena of feed molecules on the catalyst
surface or by collision between molecules (Zaera 2002). In short,
dehydrogenation is the loss of hydrogen from a molecule. During this step, radical
intermediates are formed.
2) Hydrocracking. The hydrogen generated in dehydrogenation and
dehydrocyclization, at elevated temperatures and pressures, converts and cracks
the feed into smaller saturated hydrocarbon molecules. This is called
hydrocracking.
3) Cyclization / Dehydrocyclization. During cyclization step, linear open chain
radical intermediates are converted into cyclic closed chain molecules. When
cyclization couples with dehydrogenation of terminal hydrogen of a linear
molecule, the reaction is called dehydrocyclization.

7
4) Isomerization / dehydroisomerization. Isomerization is the reaction in which a
molecule rearranges into another molecule without changing the number of atoms
in it. In the reforming process, isomerization couples with dehydrogenation
(called dehydroisomerization) and converts cyclic compounds into aromatics
keeping the number of carbon atoms same. e.g. methylcyclopentane through
dehydroisomerization gets converted into benzene.
5) Hydrogenolysis. In the hydrogenolysis reaction, C-C bonds are broken and C-H
bonds are formed. Although this is similar to hydrocracking, the product
distribution is different. In the reforming process, where the objective is to
produce aromatics-rich liquid products, hydrogenolysis is an unwanted reaction as
it generates low-value gaseous compounds.
6) Coke deposition. The deposition of carbonaceous (coke) material on the catalyst
surface is called coke deposition. This blocks the active sites on a catalyst and
hence is the major reason for undesired catalyst deactivation, resulting in the
decrease or complete loss of catalytic activity.
Dissertation Outline
This dissertation is written as a series of journal papers and is divided into
multiple chapters. The first chapter is an overall introduction to this research and provides
background for the results of this work. Chapter 2 is a paper on the aromatization of
propylene over commercially available zeolite catalysts. The third chapter is a research
manuscript on the performance of a nano-sized HZSM-5 on propylene aromatization.
Chapter 4 is a manuscript on the catalytic conversion of 1-tetradecene to aromatic

8
compounds. Chapter 5 mainly focuses on a two step process for the conversion of triacyl
glyceride (TAG) oil to aromatics and other chemicals that can replace their petroleum-
derived analogs. TAG oils are most commonly produced by plants and are known as crop
or vegetable oils. They can also be produced by algae (algal oil) or bacteria.
Conclusions and recommendations for future studies appear in the sixth chapter. The
appendices contain detailed procedures, equipment details, and additional original
information to support this dissertation. Appendices also include raw statistical data used
for the preparation of manuscripts listed in this dissertation. Unused data and the results
of additional experimental runs are also included. Appendices end with published
preprints based on additional experimentation and data.

9
CHAPTER II
AROMATIZATION OF PROPYLENE OVER HZSM-5
Introduction
Short chain (light) aliphatic hydrocarbons are abundant products of the
petrochemical industry that can be readily converted into valuable aromatic
hydrocarbons, such as benzene, toluene, and xylenes (BTX). Several companies,
including ExxonMobil and UOP, have developed and commercialized processes to
aromatize LPG and other light aliphatic hydrocarbons, e.g., propylene. While reforming
processes are important and well established in petroleum refining, they are also relevant
to the production of gasoline-like biofuels, where significant amounts of propylene can
be produced as a co-product.[21]
In addition to being an industrially important process, the aromatization of light
hydrocarbons over zeolites has been the subject of numerous studies.[22-32] The
aromatization of propane and propylene has been studied over several types of zeolites,
including zeolite beta, zeolite HY, and ZSM-5.[33-38]
Only limited mechanistic information has been obtained on propylene
aromatization over ZSM-5. Lukyanov et al., based on developed kinetic models, [34],
proposed that alkenes first form oligomers which yield dienes via a hydride transfer.
These dienes then form cyclic compounds, which are converted to aromatics through
another hydride transfer. Hydride transfer reactions were found to be catalyzed by

10
zeolitic protons.[35] Zeolites with a higher bulk Al content showed a greater alkane
aromatization capability than those with a lower Al content.
For propylene and n-butene aromatization, the aromatics distribution was found to
be similar.[35-38] This observation indicated that a simple scheme involving alkene
oligomerization followed by aromatization does not account for all steps of this complex
process. Significant transfer of small hydrocarbon fragments appears to occur, thus
yielding similar-size final products upon the conversion of different-size substrates.
The presence of gallium within the zeolite was also shown to increase the
aromatics selectivity. [36] This catalyst exhibited a high alkene aromatization activity due
to the presence of gallium and strong protonic acid sites. The product selectivity and
aromatics’ distribution were similar for both propylene and n-butene transformation
reactions. Para-xylene was the primary aromatic hydrocarbon formed and, depending
upon reaction time, the aromatics’ distribution was controlled by several reactions, such
as alkylation/dealkylation, isomerization and other inter-aromatics transformation.
n-Hexane, substituted cyclohexanes and trimerization products were found to be
important intermediates during propylene aromatization over HZSM-5.[39] Apparently,
zeolites combine and detach, i.e., ‘re-shuffle’ C1 and C2 fragments in small aliphatic
molecules either prior to or concomitantly with cyclization.[40] observed that HZSM-5
had a higher aromatization activity than that of alkali-exchanged ZSM-5 catalysts. The
authors proposed that propylene transformation on alkali-exchanged ZSM-5 proceeds via
oligomerization and then, after the dehydrocyclization step, the reaction directly routes to
benzene formation where Lewis acid and weakly basic sites are reactive instead of
Brønsted acid sites. A recent review summarizes the current state of understanding of

11
propane aromatization over HZSM-5, including experimental, theoretical, and modeling
insights.[41] It is thought that light alkanes are activated by HZSM-5 via penta-
coordinated carbonium-ion-like transition states, which result in neutral surface alkoxide
species. These intermediates are believed to subsequently react via carbenium-ion
transition states.
The major (upon addition of C2 fragments) and potential minor synthetic paths,
based on the current literature, are shown in Scheme 1. The system’s complexity
significantly complicates both the optimization of the process and determination of its
mechanism. Only applying a number of independent mechanistic tools and approaches
may lead to developing greater understanding of this multifactorial system with multiple
interactions and feedback loops.
Missing from the literature is the use of a systematic statistical approach. In this
present study, our main objective was to prepare a statistical model for this catalytic
reforming process for the purposes of optimizing the reaction conditions. DOE
methodology has been used in the optimization of many industrial processes.[31]. A two-
level factorial design allows one to determine the relative influence of several factors in
this process, within the studied range, while requiring fewer experimental runs than
traditional experimental methodology. Systematic errors can also be eliminated by using
a DOE approach. In this study, all the data, figures, information is generated with only 16
experimental runs.
However, in addition to process optimization, a significant benefit of the DOE
approach is the ability to identify significant interactions between factors. These
interactions are usually not found using a more traditional approach to experimentation,

12
yet they can play an important role in the optimization of a process. Thus, the novel
second objective of this study was to apply a factorial design of experiments (DOE)
strategy to this process as a mechanistic tool, i.e., to determine which factors and
interactions exert the greatest influence on the aromatization of propylene to BTX. We
postulated that the consideration of these factors and their interactions may provide
insight into some mechanistic details of such a complex process as propylene conversion
to aromatics, particularly the diversity of active sites producing different-size aromatic
products.
Obviously, the results obtained by DOE alone cannot be used as evidence proving
the occurrence of certain pathways; the current study could not provide definitive
answers to key mechanistic questions. Yet, the application of DOE led to several
mechanistic insights which can be used in future detailed studies in combination with the
other methods. In the current study, we matched our key DOE results with those
published in the literature, i.e., obtained by other experimental or theoretical methods.
Evidence was obtained to support the hypothesis that some BTX products are assembled
on different active sites.
Experimental
Materials
ZSM-5 zeolite catalysts featuring Si:Al ratios of 50 and 80 were obtained in the
powder form from Zeolyst International (Conshohocken, PA). Activation of ZSM-5 was
achieved by calcination at 500 °C for 5 hours in air to convert the ammonium form into
HZSM-5[37]. Ultra high purity propylene and nitrogen gases were obtained from Praxair.

13
Catalytic Activity Tests
Catalytic activity tests to produce aromatic compounds from propylene were
carried out in a continuous, downflow reactor having an inner diameter of 1 cm and a
length of 25.4 cm. Fig. 1 shows a schematic diagram of the experimental setup.
NitrogenPropylene
NitrogenHydrogen
Instrument Control/
Data Processing
ComputerGC
Temperature controller
Mass Flow Controllers Reactor
Vent
Figure 1. Schematic diagram of the propylene aromatization setup
A fixed bed of catalyst was prepared by loading an appropriate amount of
activated catalyst on quartz wool in the reactor. The amount of quartz wool was kept
constant for all the experimental runs. A type K thermocouple measured the temperature
at the center of the catalyst bed and a Eurotherm 2116 controller provided feedback to a
tube furnace. Separate Aalborg GFC17 mass flow controllers controlled the flow rates of
propylene and nitrogen.

14
An in-line gas chromatograph (SRI 8610C), fitted with a flame ionization detector
(GC-FID) and Alltech Hayesep Q 80/100 column, measured product concentrations in
the reactor effluent. Separation of peaks was obtained by temperature programming on
the GC. The temperature program initiated at 35 °C for 3 min, then ramped at 40 °C / min
to 120 °C and maintained at this temperature for 45 min. For GC sampling analysis, an
automatic gas sampling valve injected 1.00 mL of sample into a GC column. The
sampling frequency was 50 min and each activity run continued for 400 min.
For every experimental run, steady state was achieved when the aromatics’
concentration in the product stream became constant. Once steady state was achieved,
four GC sampling analyses were averaged to determine product yields and propylene
conversion. Propylene aromatization over zeolites is a reaction that occurs under severe
catalyst deactivation. To avoid loss of activity due to catalyst deactivation and coke
formation, fresh catalyst was loaded in the reactor for each experimental run.
Design of Experiments
A two-level, four-factor full-factorial design was set up to determine which
factors influence the aromatization of propylene. The four factors were the Si:Al ratio,
amount of catalyst, propylene feed concentration, and reaction temperature. The
responses measured were the propylene conversion as well as the yields of benzene,
toluene, p-xylene, o-xylene, and total BTX. Yields were determined on a carbon basis by
dividing the mass of carbon obtained for each product by the total mass of carbon fed to
the reactor as propylene. The design was unreplicated and the order of experiments was
randomized. Experimental noise was quantified using the method developed by
Lenth.[42] This method assumes that three-way interactions are not significant and uses

15
these to estimate the standard error. Hence, only individual factors and their two-way
interactions were considered for analysis.
The original experimental factors (uncoded units) were transformed into coded
units and designated as −1 (low) and +1 (high). The low and high values of these factors,
shown in Table 1, were determined using previously published studies as a guide [21, 33-
40, 43, 44].
Table 1. Experimental factors and their uncoded set point values.
Factors
(-)
Low values
(+)
High values
Si:Al ratio of HZSM-5 50 80
Catalyst amount (g) 0.2 1
Propylene concentration (mol%) 8.9 12.5
Reaction Temperature (°C) 400 500
The effect of each factor was obtained by using the difference between the
average responses at the high and low levels of each factor.[45] A larger absolute value
for an effect indicates that it has a greater impact on the response. To evaluate the
statistical significance of effects of various factors, a two-sample t-test using the means at
the high and low settings was performed and a probability value (p-value) was calculated.
For the effect to be statistically significant at a 95% confidence level, the p-value should
be less than or equal to 0.05.

16
An important part of this work was the study of interactions between the four
factors. The ability to determine interactions is the major benefit of using a factorial DOE
approach. An interaction occurs when the effect of one factor depends on the value of
one of the other factors. The magnitude of an interaction is defined as one-half of the
difference between the effect of a factor at the high value of a second factor and the effect
of the first factor at the low value of the second factor. For this analysis, the statistical
software package, MINITABTM
15, was used as an analysis tool to obtain main effects
and interactions and to create Pareto, interaction, and other charts for interpretation.[45]
Results and Discussion
All experimental runs were carried out according to the full factorial design
(Table 2). The responses are also shown in Table 2.

17
Table 2. Factors and response table showing yields of benzene, toluene, p-xylene, o-xylene, total BTX, and propylene
conversion.
Standard
Order
Run
Order
Si:Al
Ratio
Temperature
(°C)
Propylene
concentration
(%)
Catalyst
amount
(g)
Benzene Yield
(%)
Toluene
Yield
(%)
p-xylene
Yield
(%)
o-xylene
Yield
(%)
Total BTX
Yield
(%)
Propylene
conversion
(%)
1 4 50 400 8.9 0.2 1 5.6 6.2 1.4 14 75
2 2 80 400 8.9 0.2 0.27 1.6 2.3 0.48 4.7 66
3 8 50 500 8.9 0.2 2.1 8.1 5.9 1.7 18 64
4 14 80 500 8.9 0.2 0.64 2.5 2.6 0.68 6.4 39
5 10 50 400 12.5 0.2 1.4 7.2 6.2 1.3 16 76
6 3 80 400 12.5 0.2 0.47 2.5 2.8 0.59 6.4 71
7 12 50 500 12.5 0.2 3 8.8 5.6 1.5 19 67
8 15 80 500 12.5 0.2 0.87 3.5 3.3 0.81 8.5 48
9 9 50 400 8.9 1 3.1 11 7.7 1.9 24 74
10 5 80 400 8.9 1 0.75 3.9 4.1 0.89 9.6 78
11 6 50 500 8.9 1 3.4 12 7.9 2.2 25 67
12 13 80 500 8.9 1 2 6.7 4.8 1.3 15 63
13 16 50 400 12.5 1 3.8 12 7.2 1.7 25 71
14 11 80 400 12.5 1 2.5 9.9 7.3 1.4 21 79
15 7 50 500 12.5 1 7.9 15 6.3 1.6 31 67
16 1 80 500 12.5 1 4.7 13 7.4 2 27 66

18
The determination of significant factors and their interactions
AC
AD
AB
BD
BC
CD
C
B
A
D
876543210
Te
rm
Effect
2.57
A Si/A l Ratio
B Temperature (°C )
C Propy lene concentration (%)
D C ataly st amount (g)
Factor Name
8050
3.5
3.0
2.5
2.0
1.5
500400
12.58.9
3.5
3.0
2.5
2.0
1.5
1.00.2
Si/Al Ratio
Me
an
Temperature (°C)
Propylene concentration (%) Catalyst amount (g)
Main Effects Plot for Benzene (% yield)Data Means
Figure 2. (a) Pareto chart of effects for yield of benzene, (b) main effects plot for yield of
benzene - each point in main effects plot represents the mean value of four experimental
data points, either at low or high level.
Figures 2 through 6 include Pareto charts (Panel a in each figure) of the effects of
each factor and the interaction for all responses as well as main effects plots (Panel b).
For example, ‘CD’ in Fig. 2a represents the effect of the interaction between factors C
(propylene concentration) and D (catalyst amount). The vertical line in each Pareto chart
represents the line of significance, which is based on 95% confidence. Any bar
(representing the effect) in a Pareto chart extending beyond this line is considered a
significant term. For example, Fig. 2a shows that the Si:Al ratio and catalyst amount had
the greatest effects on aromatization. Reaction temperature is also significant for the yield
of all individual aromatics except p-xylene. A detailed discussion of the influence of
these factors on BTX yields is provided in the next two sections.

19
AB
BC
AD
BD
AC
CD
B
C
A
D
1086420
Te
rm
Effect
2.57
A Si/A l Ratio
B Temperature (°C )
C Propy lene concentration (%)
D C ataly st amount (g)
Factor Name
8050
10.0
7.5
5.0
500400
12.58.9
10.0
7.5
5.0
1.00.2
Si/Al Ratio
Me
an
Temperature (°C)
Propylene concentration (%) Catalyst amount (g)
Main Effects Plot for Toluene (% yield)Data Means
Figure 3. (a) Pareto chart for effects for yield of toluene, (b) main effects plot for yield of
toluene
Figures 2a and 3a show that the interaction between propylene concentration and
catalyst amount is significant for benzene and toluene production. By contrast, the yields
of p- and o-xylenes are significantly influenced by a different interaction, namely that
between the Si:Al ratio and the propylene feed concentration.
B
BD
BC
CD
AB
C
AD
AC
D
A
76543210
Te
rm
Effect
2.57
A Si/A l Ratio
B Temperature (°C )
C Propy lene concentration (%)
D C ataly st amount (g)
Factor Name
8050
6.5
6.0
5.5
5.0
4.5
4.0
1.00.2
Si/Al Ratio
Me
an
Catalyst amount (g)
Main Effects Plot for p-xylene (% yield)Data Means
Figure 4. (a) Pareto chart for effects for yield of p-xylene, (b) main effects plot for yield
of p-xylene

20
BD
C
BC
CD
AB
AD
B
AC
D
A
76543210
Te
rm
Effect
2.57
A Si/A l Ratio
B Temperature (°C )
C Propy lene concentration (%)
D C ataly st amount (g)
Factor Name
8050
1.6
1.4
1.2
1.0
500400
1.00.2
1.6
1.4
1.2
1.0
Si/Al Ratio
Me
an
Temperature (°C)
Catalyst amount (g)
Main Effects Plot for o-xylene (% yield)Data Means
Figure 5. (a) Pareto chart for effects for yield of o-xylene, (b) main effects plot for yield
of o-xylene
Moreover, the interaction between Si:Al ratio and catalyst amount is close to
being significant for the yields of p-xylene (Figure 4a) and o-xylene (Figure 5a). Figure 7
shows detailed information of how each significant interaction impacts product yields.
Since the yields of benzene and toluene account for more than 60% of the total aromatics
yield for all of the experiments conducted in this study, the results for total BTX and for
individual yields of benzene and toluene are similar.
The Effect of The Si:Al Ratio in The HZSM-5 Catalyst on BTX Yield
Panel b of Figures 2-6 indicates how changing each factor impacted the various
product yields. Increasing the Si:Al ratio decreased the yield of aromatics. This is

21
because the catalytic activity of HZSM-5 is mainly due to the Brönsted acid sites present
in the bridging hydroxyl groups in the Si-O-Al triad, in which it is the aluminum that
exhibits significant acidity.[46] Apparently, the Si:Al stoichiometry of active sites may
be higher than 1:1 and the additional alumina (Al-O-) fragments may boost their catalytic
activity. The active tetrahedral site (T-site) is occupied by tetrahedrally coordinated
silicon and aluminum atoms.
Several theoretical studies have been conducted on locating the active T-site
occupied by Al.[46] According to this study, the adsorbed propylene forms surface
intermediates, e.g., alkoxides responsible for β-scission and hydride transfer reactions.
The activation energy is required to form a protonated molecule when a feed propylene
molecule comes in contact with a Brønsted acid proton. The value of this activation
energy also depends on the interaction between the zeolite wall and the protonated
molecule.[47-49] The alkoxide formation energies were shown to depend on zeolite
structures. The Al sites greatly increase the heat of propylene adsorption on ZSM-5.[47-
49] The location and number of Al sites are known to affect catalytic activity. The proton
affinity, acid strength, and binding energies are greatly influenced by the composition of
ZSM-5 and its structure.[50, 51] For a Si:Al ratio of 50, the available Al sites are more
dense than for a ratio of 80.
This published information corroborates the results obtained in the current study.
The activity effects of Si:Al ratio appear to be due to the differences in total acidity. Acid
strength increases with a decrease in Si:Al ratio, which may demonstrate a higher
catalytic activity towards the BTX production for ZSM-5 having a lower Si:Al ratio, as
observed in this study.

22
The Effect of Reaction Temperature on Aromatization
AB
BC
BD
AD
AC
CD
B
C
A
D
1086420
Te
rm
Effect
2.57
A Si/A l Ratio
B Temperature (°C )
C Propy lene concentration (%)
D C ataly st amount (g)
Factor Name
8050
21
18
15
12
500400
12.58.9
21
18
15
12
1.00.2
Si/Al Ratio
Me
an
Temperature (°C)
Propylene concentration (%) Catalyst amount (g)
Figure 6. (a) Pareto chart for effects for yield of total BTX, (b) main effects plot for yield
of total BTX
The yields of all BTX but p-xylene increased significantly with temperature, as
shown in Figs. 2-6. An explanation of this trend can be offered based on previous
mechanistic studies. At lower and moderate temperatures, the bridging hydroxyl groups
in HZSM-5 were reported to form hydrogen bonds with the neighboring oxygen atoms.
With an increase in temperature, this hydrogen bond breaks, the availability of free
bridging hydroxyl groups increases, and thus the acidity and catalytic activity increases.
Therefore at higher temperatures, protons possess the necessary energy to overcome the
activation energy barrier.[52, 53] Moreover, at higher temperatures, the tendency of a
propylene molecule to crack into C2 intermediates increases, which is important for
promoting aromatics formation because the major pathway for aromatization is believed
to be through the combination of C2 fragments (Scheme 1). Based on the experimental
results obtained in this study, the temperature essential for this critical step is within the
range considered, i.e., between 400 and 500 oC.

23
The lack of a strong temperature effect on p-xylene yield is unusual and may be
the result of two competing temperature effects. It may indicate that not only are the
catalytic sites responsible for the synthesis of this product different from those specific
for toluene and benzene, but also that the specificity of these sites is reduced as
temperature increases. More specifically, at higher temperature, it would be expected that
increased catalytic activity increases the amount of xylenes produced, along with all other
BTX compounds. But at the same time, less thermodynamically stable p-xylene (or its
intermediates, Scheme 1) may, at high temperature and in the presence of hydrogen,
readily undergo hydrodealkylation to form toluene and benzene. Thus, the net increase in
yield of p-xylene may be offset, leading to a near-zero net temperature influence.[36]
Thus, the xylene/toluene ratio may be varied by adjusting the process operational
parameters.
The Effect of Propylene Feed Concentration and Catalyst Loading on
Aromatization
Increasing the feed propylene concentration increases the overall aromatics yield
(Fig. 6b). This effect cannot be explained by simple first-order kinetics. Not just the
process rate but the yield increases, i.e., a higher fraction of propylene in the feed is
converted into aromatics when more propylene is present. For a first order reaction,
conversion is independent of feed concentration. By contrast, a second order reaction
would show increasing conversion with feed concentration, as seen here. This implies
that the reactions to form aromatics may be bimolecular, i.e., more than one propylene
molecule is involved at the rate limiting step.

24
1.00.2
5
4
3
2
1
Catalyst amount (g)
Be
nze
ne
yie
ld (
Me
an
)
8.9
12.5
(%)
concentration
Propylene
1.00.2
13
12
11
10
9
8
7
6
5
4
Catalyst amount (g)
To
lue
ne
yie
ld (
Me
an
)
8.9
12.5
(%)
concentration
Propylene
(a) (b)
12.58.9
7
6
5
4
3
Propylene concentration (%)
p-x
yle
ne
yie
ld (
Me
an
)
50
80
Ratio
Si/Al
1.00.2
7
6
5
4
3
Catalyst amount (g)
p-x
yle
ne
yie
ld (
Me
an
)
50
80
Ratio
Si/Al
(c1) (c2)
12.58.9
1.8
1.6
1.4
1.2
1.0
0.8
Propylene concentration (%)
o-x
yle
ne
yie
ld (
Me
an
)
50
80
Ratio
Si/Al
1.00.2
26
24
22
20
18
16
14
12
10
Catalyst amount (g)
To
tal B
TX
yie
ld (
Me
an
)
8.9
12.5
(%)
concentration
Propylene
(d) (e)
Figure 7. Significant interaction effects plots for yields of (a) benzene, (b) toluene, (c1 &
c2) p-xylene, (d) o-xylene and (e) total BTX.
Increasing the catalyst amount leads to higher conversion, as expected. With an
increased catalyst amount, the number of available active sites also increases and this
eventually yields more aromatics. The results presented in sections 3.3 and 3.4 indicate

25
that increasing temperature and catalyst amounts increase the aromatics yields. However,
this is complicated by the fact that increased temperature also decreases propylene
conversion (Fig. 8).
(a)
BC
AC
CD
C
BD
AB
A
D
AD
B
20151050
Te
rm
Effect
2.57
A Si/A l Ratio
B Temperature (°C )
C Propy lene concentration (%)
D C ataly st amount (g)
Factor Name
8050
75
70
65
60
500400
12.58.9
75
70
65
60
1.00.2
Si/Al Ratio
Me
an
Temperature (°C)
Propylene concentration (%) Catalyst amount (g)
(b)

26
500400 12.58.9 1.00.2
72
64
56
72
64
56
72
64
56
Si/Al Ratio
Temperature (°C)
Propylene concentration (%)
Catalyst amount (g)
50
80
Ratio
Si/Al
50
80
Ratio
Si/Al
50
80
Ratio
Si/Al400
500
(°C)
Temperature
400
500
(°C)
Temperature
8.9
12.5
(%)
concentration
Propylene
(c)
Figure 8. (a) Pareto chart, (b) main effects plot and (c) interaction plots for conversion of
propylene
One potential explanation of this effect is based on kinetics. Higher temperatures,
along with the formation of BTX, may also cause coke formation and the deactivation of
catalyst that make side products (listed in section 3.5), e.g., aliphatic hydrocarbons. No
significant deactivation of the catalyst was observed, however, over the time of each
experimental run.
As an alternative explanation, not only kinetic but also thermodynamic factors
may cause this behavior. Thermodynamically, higher temperatures favor decomposition
reactions. Thus, while some propylene is converted into aromatics and other products,

27
additional propylene may be formed due to either side decomposition reactions or reverse
reactions catalyzed by zeolites. Supporting this statement, the concentration of
intermediate-size aliphatic side products, C6-C8, was low when the process was
conducted at 500 °C as compared to 400 °C, yet the concentration of low-MW aliphatics
-- propane, ethane and ethylene -- were much greater at the higher temperature (not
shown). Unfortunately, the obtained C6-C8 aliphatic hydrocarbon homology and isomer
profiles did not provide sufficient mechanistic information due to their low amounts.
Effects from Significant Interactions
Figure 7 shows that the interaction between hydrocarbon feed concentration and
catalyst amount was significant. The propylene concentration-catalyst amount interaction
plots for benzene, toluene, and total BTX yields are given in Fig. 7 (a), 7 (b), and 7 (e),
respectively. When the catalyst amount was increased from 0.2 g to 1.0 g, the effect of
changing propylene feed concentration on benzene yield increased.
Figures 7b and 7e show the same trend for the yields of toluene and total BTX,
respectively. At low catalyst amounts, only a small effect of propylene concentration was
observed as perhaps all propylene adsorption sites that produce benzene and toluene were
occupied. At greater catalyst amounts, these sites were not saturated at the low propylene
feed concentration. As a result, a simultaneous increase in propylene concentration and
catalyst amount significantly increased the yield of benzene and toluene (and hence total
BTX). Thus, the proper balance between the levels of these factors is important to control
the yields of benzene and toluene for process optimization.

28
In contrast to the yields of benzene and toluene, a significant interaction effect
was observed for xylenes between the Si:Al ratio and the propylene feed concentration,
Fig. 7 (c1) and (d). For a Si:Al ratio of 80, there was an increase in xylene yield when the
feed concentration was increased, but for a Si:Al ratio of 50, the effect was reversed and
more xylenes were produced at the lower propylene concentration. Thus, an increase in
the Al content in the catalyst increased xylene yields, even at lower feed concentrations.
The interaction of Si:Al ratio with the catalyst amount also had a closer
significant effect on the p-xylene yield , Fig. 7 (c2). When the catalyst amount was kept
constant at 0.20 g, the difference in the yields of p-xylene at Si:Al ratios of 50 and 80 was
almost double that at a 1.0 g catalyst loading. Apparently, specific xylene-producing
catalytic sites became saturated when the propylene concentration increased. The
observed positive interaction between the Si:Al ratio (i.e., density of active alumina sites)
and propylene concentration, which is specific only for xylene production, can be
explained by a greater than 1:1 catalyst : propylene stoichiometry of these specific
xylene-producing sites. Perhaps, xylene-producing sites would be more likely to form
with a greater aluminum content of the catalyst.

29
C3 olefin
C6 linear
benzene
dehydrocyclization
C2 olefinsCracking -C1 C4 intermediates
toluene
C5 intermediates C7 intermediates
C8 intermediates
dehydrocyclization
dehydrocyclization
xylenes
+C3 olefin
+C2 olefin
C4 olefin
+C3 olefin
+C2 olefin
+C3 olefin
Hydrodealkylation at high temperature
Cracking –C2 +C2 olefin
Minor path
Major path
Major path
Proposed path
Proposed major path
Major path
Proposed major path
Proposed minor path
Figure 9. Scheme (1) for Propylene aromatization reaction pathways
Stoichiometrically two molecules of propylene adsorbed on a catalyst may yield
benzene as a major product after their dimerization, cyclization, and dehydrogenation (a
minor path in Scheme 1). Similarly, 3-carbon units directly derived from propylene could
enter the process at various steps (other minor paths in Scheme 1). Prior theoretical
research indicates that aromatics are predominantly produced by the combination of C2
units (major paths in Scheme 1). This information has been confirmed by our analysis of
aliphatic products. Ethylene was, by far, the most abundant aliphatic by-product formed,
with its concentration being about 1/10 of the initial propylene feed (not shown). The
subsequent oligomerization of the resulting C2 fragments would yield xylenes. However,

30
the results of the experimental studies reported here suggest that HZSM-5 is rather
selective towards the production of C7 aromatics, irrespective of the reaction conditions
and Si:Al ratio.
Furthermore, considering only the major paths of Scheme 1 contradicts evidence
obtained in this study that xylenes are produced on different catalytic sites than benzene
and toluene. Thus, xylenes cannot be viewed as essential intermediates of toluene
synthesis, via subsequent methyl transfer, Scheme 1.
An alternative explanation, shown as hypothetical pathways in Scheme 1,
suggests that a C4 fragment would react with propylene to form toluene directly. By
contrast, xylenes would involve the combination of C2 units only. Then, toluene would be
expected to have the highest yield based on propylene’s specific chemical features as a
C3 alkene. Namely, to form ethylene or other reactive C2 intermediates, propylene has to
be cracked into C1 and C2 hydrocarbons. However, this process would require high
amounts of energy to break either a double bond or a single bond at the vinyl position to
the double bond.
This hypothesis, stating the participation of some C3 fragments in the process
mechanism, would explain why an increase in propylene feed concentration significantly
increases toluene yield but does not affect those of xylenes. This hypothetical route
should not overshadow the role of methyl transfer reactions, which appear to be
significant. Significant methane amounts were observed among the reaction products in
the current work. The effective C3 unit essential for toluene formation could actually be a
combination of a C2 and C1 fragments. These two routes would be kinetically
indistinguishable.

31
The ratios of the yields of benzene/toluene as well as that of benzene/xylene
increase with increasing temperature, keeping all other reaction factors constant (Table
II). These trends can be explained by possible hydrodealkylation of toluene and xylenes
or intermediates of their synthesis at high temperatures as shown in Scheme 1.
Statistical Model for Total BTX Yield
In fitting a statistical model, three assumptions must be verified: (1) residuals are
randomly and normally distributed, (2) residuals are not correlated with the predicted Y,
and (3) residuals do not exhibit any trends over time.[45] For this work, all of these
assumptions were verified by examining the appropriate residual plots.
The use of a statistical design of experiments methodology is an effective way to
determine and study the interactions between the reaction conditions and is an important
step in process optimization. The coefficients of estimated effects and interaction are
shown in Table 3. Note that these coefficients should be used with the coded values of
the four factors and their interactions. The impacts of each factor on the toluene yield are
greater than on the yield of any other individual aromatic compound because toluene is
the predominant BTX product. From the coefficients listed in Table 3, models for each
response can be constructed. For example, the statistical model for total BTX, in coded
units, is as follows:
Total BTX (% yield) = 17 – 4.6 (Si:Al ratio) + 1.8 (temperature) + 2.3
(propylene concentration) + 5.2 (catalyst amount) + 1.5 (propylene
concentration*catalyst amount).

32
Table 3. Summary of the effect of each significant variable and 2-way interaction on every response
Coefficient
Response
Mean
Factors 2-way interactions
Si/Al Ratio
[A]
Temperature
(°C)
[B]
Propylene
concentration
(mol%)
[C]
Catalyst
amount (g)
[D]
AB AC AD BC BD CD
% yield of benzene 2.4 -0.85 0.71 0.70 1.1 - - - - - 0.49
% yield of toluene 7.7 -2.3 0.95 1.3 2.7 - - - - - 0.77
% yield of p-xylene 5.5 -1.1 - 0.29 1.1 - 1.2 0.46 - - -
% yield of o-xylene 1.3 -0.31 0.14 0.017 0.28 - 0.16 - - - -
% yield of total BTX 17 -4.6 1.8 2.3 5.2 - - - - - 1.5
Propylene conversion
(%) 67 -3.2 -6.8 1.2 3.7 -2.9 1.1 4.1 - 1.9 -1.1

33
Conclusions
A statistical design of experiments (DOE) methodology identified the significant
reaction parameters and their interactions that influence propylene aromatization. Of the
factor-ranges studied, the HZSM-5 Si:Al ratio and catalyst amount had the greatest
impact on BTX yield. The reaction temperature significantly increased the yields of
benzene, toluene, o-xylene and total BTX, while the effect of feed concentration is
significant only for benzene, toluene and total BTX yields. The interaction between
initial propylene feed concentration and amount of catalyst was statistically significant
for benzene, toluene, and total BTX yields. By contrast, the Si:Al ratio-feed concentration
interaction only impacts the yields of xylenes, which follow different trends from
benzene and toluene. Thus, benzene and toluene appear to be produced on the same
catalyst sites whereas xylenes are produced on different sites. A consequence of this
insight is that it is possible to manipulate the toluene (plus benzene) to xylene yield ratio
in propylene aromatization. The present work demonstrates that the catalyst Si to Al
ratio is one such adjustable parameter. Others include zeolite size/structural conditions
and the presence or absence of dopants in the catalyst.
A statistical model was proposed for the prediction of each response. To
maximize overall aromatic yields, the Si:Al ratio of catalyst should be at a lower level,
and all the other reaction conditions should be at higher levels, based on the range of
factors included in this study. Since the interaction effects can be determined only by
using a design of experiments strategy, it can be concluded that this statistical DOE
approach is a useful tool in optimizing the reaction conditions for the catalytic reforming
process to produce aromatics using zeolite catalysts.

34
CHAPTER III
AROMATIZATION OF PROPYLENE OVER NANOSCALE HZSM-5
Introduction and Background
Propylene is one of the major short chain hydrocarbon byproducts in petroleum
refining. A high concentration of propylene and other light alkenes are also produced
from TAG oil cracking. TAG cracking generates relatively high concentrations of
propylene and as will be shown in later chapters, additional propylene is generated during
the reforming of middle volatility alkenes. The reforming of propylene is one of the most
common ways to generate chemical grade BTEX, especially toluene. The technology to
do this reforming is mature and thus traditional propene reforming is not of interest in
this research. However, recently it has been proposed that nano-sized zeolites may have
advantages over traditional micro-sized zeolites in certain applications. To our
knowledge, no one has studied the use of nano-sized zeolites for propene reforming.
Aromatization is a catalytic reforming process which converts light aliphatic
hydrocarbons into more valuable aromatic products.
Zeolites are widely used as catalysts for aromatization reactions. Available
literature shows that HZSM-5, either plain or doped with metals, efficiently converts
propylene to aromatic compounds with a high selectivity. It has been suggested, that
additional improvements may be possible using recently developed nanoscale zeolites.

35
Nanoscale zeolites have been synthesized at the laboratory scale [54-57].
Currently, the synthesis, application and comparison of nanoscale zeolites with
microscale zeolites is getting considerable attention in the academic and industrial
research communities [58]. Several researchers have reported the effectiveness of
nanocrystalline zeolites for the catalytic conversion of mid-chain hydrocarbons [59]. For
example, a nano-sized HZSM-5 catalyst was studied for the aromatization of olefins in
petroleum feedstock [55]. Successful attempts were also made to reduce the olefin
content in FCC gasoline [60] and nanoscale ZSM-5 was found to be a good catalyst for
the minimization of coke yield. Most of these aforementioned studies were focused on
the feasibility of using nanoscale ZSM-5 for mixtures of hydrocarbons.
However to our best knowledge, there is no existing published work on using a
nanoscale HZSM-5 for aromatization of propylene. In this study, nanoscale HZSM-5
catalyst is synthesized and used for aromatization of propylene with the application of
DOE-based parameterization, in comparison with the results obtained earlier for
microscale HZSM-5.
Experimental
Nanoscale Catalyst Synthesis and Characterization
Nanoscale HZSM-5 catalyst was synthesized by using a laboratory procedure
described elsewhere [61]. The detailed procedure for catalyst synthesis is listed in
Appendix A1. Activation of ZSM-5 was achieved by calcination at 500 °C for 5 hours in
air to convert the ammonium form into HZSM-5. X-ray diffraction (XRD) patterns of the
catalyst powder were obtained by using a Phillips X'Pert PRO X-ray Diffractometer.

36
Transmission electron micrographs (TEM) of HZSM-5 were obtained by using a JEOL
JEM-2100 microscope.
Nanoscale Catalyst Testing
A two-level, three-factor (temperature, propylene concentration and catalyst loading),
full-factorial design of experiments (DOE) was used. Catalyst activity tests were
performed and the results were analyzed as detailed in prior chapter 2. A fixed bed of
catalyst was prepared by loading an appropriate amount of activated catalyst on quartz
wool in the reactor. The amount of quartz wool was kept constant for all the experimental
runs. A type K thermocouple measured the temperature at the center of the catalyst bed
and a Eurotherm 2116 controller provided feedback to a tube furnace. Separate Aalborg
GFC17 mass flow controllers controlled the flow rates of propylene and nitrogen.
For every experimental run, steady state was achieved when the aromatics’
concentration in the product stream became constant. Once steady state was achieved,
four GC sampling analyses were averaged to determine product yields and propylene
conversion. To avoid the loss of activity due to the catalyst deactivation and coke
formation, fresh catalyst was loaded in the reactor for each experimental run. The
analytical methods and equipment are discussed in chapter 2 and in Appendix A4.
Results and Discussion
Characterization of Nanoscale HZSM-5
Fig.10a presents the XRD pattern of the nanoscale catalyst powder. These patterns
feature two distinct peaks between 2 Theta positions at 5-10 and well defined peaks
between positions 22-25. In XRD, Theta is an angle of incoming EM wave, as well as the

37
angle of diffracted EM in regard to Bragg's planes. So the total change in angle of the EM
wave equals 2 THETA. Small patterns are also observed around 2 Theta positions at 13-
17, 30, and 45-47. These patterns match the positions corresponding to the HZSM-5
framework structure [57, 61], which confirms that the prepared catalyst is a HZSM-5
type zeolite.
(a) (b)
Figure. 10. (a) XRD) pattern (b) TEM image of nanoscale HZSM-5

38
The transmission electron micrograph shown in figure 10b suggests that the particle size
of synthesized ZSM-5 is in a range of 20-50 nm which is consistent with the literature
[61]. The agglomeration of nanoparticles observed may be inevitable due to the attractive
van der Waals forces and the presence of moisture in the air at room temperature.
However, the agglomeration would be less likely at elevated reaction temperatures such
as 400-500 °C, thus being of little concern for propylene aromatization.
Effects of Factors, Interactions and Particle Size of HZSM-5 on BTX Yield
The experimental reaction conditions and their results are listed in table 4.
Table 4. Factors and response table showing BTX yield and individual aromatic
compound fractions
Runs
Temperature
(°C)
Propylene
concentration (%)
Catalyst
loading
(g)
Total
BTX (%
yield)
Benzene (%
fraction)
Toluene (%
fraction)
Xylenes (%
fraction)
1 500 12.5 1 29 31 48 21
2 500 12.5 0.5 21 13 44 43
3 400 12.5 0.5 17 8 43 49
4 500 12.5 0.5 22 12 43 43
5 400 8.9 1 17 11 44 45
6 500 8.9 1 23 24 47 29
7 400 8.9 0.5 15 7 41 52
8 500 8.9 1 23 24 47 29
9 400 12.5 1 19 13 47 40
10 400 12.5 0.5 17 8 43 49
11 400 8.9 1 17 10 44 46
12 400 12.5 1 20 13 48 39
13 500 12.5 1 29 32 49 19
14 500 8.9 0.5 14 12 43 45
15 500 8.9 0.5 15 11 42 47
16 400 8.9 0.5 14 6 40 54

39
The BTX yields obtained were lower for a nonoscale HZSM-5 than for a
commercial microscale HZSM-5 catalyst (Fig. 11).
0
5
10
15
20
25
30
35
1 2 3 4Reaction conditions set number
To
tal
BT
X %
yie
ld
Nanoscale HZSM-5
Microscale HZSM-5
Figure 11. Comparison between performance of nanoscale and microscale HZSM-5 on
aromatics yield at 4 different reaction conditions.
Aromatization of propylene is highly dependent on the diffusion of feed
molecules into HZSM-5 pores. For the formation of aromatics, shape selectivity of
HZSM-5 is an important factor. Since the number of active sites inside pores is lower in
nanoscale ZSM-5 and since the overall diffusion path is also smaller in the nanoscale
ZSM-5, it causes lower yields of aromatics in comparison with the commercial HZSM-5
catalyst. All three factors (temperature, propylene concentration and catalyst amount)
had a significant effect on the fraction of the propylene that converted to aromatics,
expressed as % yield of total BTX.

40
ABC
BC
AB
AC
B
A
C
20151050
Te
rm
Effect
2.31
A Temperature (°C )
B Propy lene concentration (%)
C C ataly st loading (g)
Factor Name
Pareto Chart of the Effects(response is Total BTX (% yield), Alpha = 0.05)
(a)
500400
22.5
21.0
19.5
18.0
12.58.9
1.00.5
22.5
21.0
19.5
18.0
Temperature (°C)
Me
an
Propylene concentration (%)
Catalyst loading (g)
Main Effects Plot for Total BTX (% yield)Data Means
(b)

41
1.00.5
27.5
25.0
22.5
20.0
17.5
15.0
Catalyst loading (g)
Me
an
400
500
(°C)
Temperature
Interaction Plot for Total BTX (% yield)Data Means
(c1) (c2)
12.58.9
25.0
22.5
20.0
17.5
15.0
Propylene concentration (%)
Me
an
400
500
(°C)
Temperature
Interaction Plot for Total BTX (% yield)Data Means
Figure 12. (a) Pareto chart, (b) main effects plot, and (c1 & c2) interaction plots for %
total BTX yield.

42
The Pareto chart (Fig. 12a) shows that the interactions of temperature with
propylene concentration (AB) as well as with catalyst amount (AC) had a significant
effect on the BTX yield because their effects exceed the vertical line of significance at
2.31 (Fig. 12a). Fig. 12b shows the main effects plots of reaction temperature, propylene
concentration and catalyst amount on the total BTX yield. The interaction plots of AB
and AC are shown in Figures 12c1 and 12c2. An increase in all three factors resulted in a
significant increase in BTX yield. Similar effects were observed and explained for the
microscale HZSM-5 in a prior chapter. Thus, the effects of factors on BTX yields are
irrespective the particle size. According to literature [54, 62, 63] a reduction in zeolite
catalyst particle size makes that catalyst efficient because of increased surface area.
However, this was not explicitly observed in this work.
A possible explanation may involve the active site concentration at the zeolite
surface. The postulate is that nanoscale increases the overall active site concentration
outside the catalyst pores. For most catalysts, this will result in a more efficient
conversion and may help to inhibit secondary, undesirable reactions. However, the
zeolite doesn’t just facilitate the reactions by surface sites, it appears to also induce ring
formation by the size/structure of the pores. As zeolite particle size is reduced, the outer
surface area available for the reaction increases. Thus, the total number of acid sites on
the outer surface area increases and the number of active sites inside pores decrease.
Similarly, the effective pore channel length is also small for the nanoscale zeolite. When
a propylene molecule comes in contact with the outer surface of HZSM-5, it undergoes
decomposition into C1 and C2 fragments over Lewis acid sites. By contrast, only
Brønsted acid sites distinctly small inner zeolite pores are responsible for cyclization.

43
Thus, the formation of cyclic intermediates on the outer surface of HZSM-5 is less likely
due to the absence of small specific porous shape which causes cyclization. Hence the
overall activity of nanoscale HZSM-5 to produce aromatics decreases.
0
5
10
15
20
25
30
Methane Ethane Ethylene Total cracked
poducts
% Y
ield
Nanoscale HZSM-5 Microscale HZSM-5
Figure 13. Propylene cracking activities over nanoscale and microscale HZSM-5
catalysts at the same reaction conditions
Fig. 13 confirms the formation of methane, ethane and ethylene as the presumed
byproducts of propylene cracking. Amounts of these cracking products are greater than
those formed by using microscale HZSM-5. This difference confirms that the cracking
reactions are dominant over aromatization reactions when the nanoscale HZSM-5 was
used. The significant interactions of temperature with propylene concentration and
catalyst loading (AB and AC) (Fig 12a) have a common factor, reaction temperature.

44
When the propylene feed concentration was increased, the simultaneous increase of
reaction temperature significantly increased the aromatics yield (Fig. 12c2). This is an
indication that aromatization of propylene is a multimolecular reaction.
Interaction AC (Fig. 12c1) indicates that, within the bounds of the DOE, at higher
catalyst loading and a higher reaction temperature the yield of aromatics increases. As
explained previously, cracking of propylene molecules at higher temperature yields more
C1 and C2 which readily diffuse through zeolite pores to form cyclic aromatic
compounds. When the catalyst loading is increased, acid sites on the outer surface or
zeolite enhance propylene cracking and, at the same time, more pores become available
for cyclization which increases the overall yield of aromatics.
Effects of Factors and Their Interactions on Xylene Yields
Xylene yield rises significantly with increased catalyst loading when
commercially available micro sized HZSM-5 is used [Chapter 2]. However, in this study
the yield (or concentration, whichever is more accurate) of xylene decreased (Fig. 14b)
with increased catalyst loading.
(a)
AB
ABC
BC
B
AC
A
C
302520151050
Te
rm
Effect
2.31
A Temperature (°C )
B Propy lene concentration (%)
C C ataly st loading (g)
Factor Name
Pareto Chart of the Effects(response is xylenes (% distribution), Alpha = 0.05)

45
500400
48
44
40
36
32
12.58.9
1.00.5
48
44
40
36
32
Temperature (°C)M
ea
nPropylene concentration (%)
Catalyst loading (g)
Main Effects Plot for xylenes (% distribution)Data Means
(b)
1.00.5
50
45
40
35
30
25
Catalyst loading (g)
Me
an
400
500
(°C)
Temperature
Interaction Plot for xylenes (% distribution)Data Means
(c1)

46
1.00.5
50
45
40
35
30
Catalyst loading (g)
Me
an
8.9
12.5
(%)
concentration
Propylene
Interaction Plot for xylenes (% distribution)Data Means
(c2)
Figure 14. (a) Pareto chart, (b) main effects plot, and (c1 & c2) interaction plots for %
fraction of xylenes.
At the same time, benzene and toluene yields significantly increased. This is
possibly due to a greater impact of the (hydro)dealkylation of xylenes. Large particles
contain layers of pore channels attached to each other. So, once the xylene molecule is
formed inside the pore, it travels from one pore to another pore of another layer inside
one single large catalyst particle (crystal). Thus, more xylene molecules are trapped
inside large particles and hence hydrodealkylation of xylene occurring on the outer
surface is limited. However, in a small nano sized zeolite particle, a xylene molecule
stays within the pores only for a short time due to the lack of adjacent crystal layer pores.
Since the amounts of xylene molecules outside zeolite pore are greater; they eventually
become hydrodealkylated into more benzene and toluene.

47
The interaction plot for xylenes (Fig. 14c1) shows that the effect of temperature
on xylene yield depends on the catalyst loading. Higher amounts of catalyst at higher
temperature are responsible for lowering the xylene yields because of a possible
dealkylation of xylenes. This confirms the assumption that nanoscale HZSM-5 favors
cracking, including hydrodealkylation. Similarly, an interaction plot for xylenes (Fig.
14c2) also confirms lower xylene yields when the catalyst amount is increased. Thus,
even though the reaction temperature and propylene feed concentrations are at higher
levels, they promote cracking of C8 intermediates and xylenes. As a result, nanoscale
HZSM-5 appears to be a great cracking/dealkylation catalyst rather than an aromatization
catalyst.
As the size of HZSM-5 catalyst decreases, its surface area increases which causes
an increase in external active acid sites and a significant reduction in acid sites inside the
pores. Acid sites on an external surface area cause cracking of feed and intermediate
molecules. On the other hand, cyclization of linear molecules is hindered due to a loss in
available acid sites inside pores.
Benzene/Toluene Yields and Mechanistic Considerations
Figs. 14 and 15 show that benzene and toluene are formed at the expense of
xylenes.

48
AB
ABC
BC
B
AC
C
A
403020100
Te
rm
Effect
2.31
A Temperature (°C )
B Propy lene concentration (%)
C C ataly st loading (g)
Factor Name
Pareto Chart of the Effects(response is Benzene (% distribution), Alpha = 0.05)
(a)
500400
20.0
17.5
15.0
12.5
10.0
12.58.9
1.00.5
20.0
17.5
15.0
12.5
10.0
Temperature (°C)
Me
an
Propylene concentration (%)
Catalyst loading (g)
Main Effects Plot for Benzene (% distribution)Data Means
(b)

49
12.58.9 1.00.5
30
20
10
30
20
10
T emperature (°C)
Propylene concentration (%)
Catalyst loading (g)
400
500
(°C)
Temperature
400
500
(°C)
Temperature
8.9
12.5
(%)
concentration
Propylene
Interaction Plot for Benzene (% distribution)Data Means
(c)
Figure 15. (a) Pareto chart, (b) main effects plot, and (c) interaction plots for % fraction
of benzene.
The interaction plot for the relative yield of toluene (Fig. 16c) shows that the effect of
reaction temperature depends on propylene feed concentration.
ABC
BC
AC
AB
A
B
C
1614121086420
Te
rm
Effect
2.31
A Temperature (°C )
B Propy lene concentration (%)
C C ataly st loading (g)
Factor Name
Pareto Chart of the Effects(response is Toluene (% distribution), Alpha = 0.05)

50
(a)
500400
47
46
45
44
43
12.58.9
1.00.5
47
46
45
44
43
Temperature (°C)
Me
an
Propylene concentration (%)
Catalyst loading (g)
Main Effects Plot for Toluene (% distribution)Data Means
(b)
12.58.9
46
45
44
43
42
Propylene concentration (%)
Me
an
400
500
(°C)
Temperature
Interaction Plot for Toluene (% distribution)Data Means
(c)
Figure 16. (a) Pareto chart, (b) main effects plot, and (c) interaction plots for % fraction
of toluene.

51
At the higher level of propylene concentration, toluene yields are almost the same,
regardless of the reaction temperatures. In other words, the effect of reaction temperature
diminishes at higher feed concentration. So, it can be inferred that toluene formation over
nanoscale HZSM-5 catalyst is diffusion controlled. The Pareto chart for toluene (Fig.
16a) also confirms the dominance of diffusion (catalyst loading shows a greater effect
than temperature).
From the observed trends in BTX and xylene production, two pathways for
toluene formation may be proposed
1) C2 + C2 + C3 (diffusion inside HZSM-5 pore/dehydrocyclization) = Toluene + H2
2) Xylene (dealkylation/hydrodealkylation) = Toluene + methane
This may be a possible reason for the formation of significant quantities of methane
during aromatization of propylene over nanoscale HZSM-5 catalyst.
Conclusions
Nanoscale zeolites are not suitable for aromatization of propene to BTX as they
appear to facilitate other reactions, such as propene cleavage to ethylene and methane. A
statistical design of experiments (DOE) approach determined that all the three reaction
factors (temperature, propylene concentration and catalyst loading) significantly
influenced the aromatization. In addition to benzene, toluene and xylenes, other
hydrocarbons such as methane, ethane, ethylene and butane were also formed over nano-
sized HZSM-5. Since shape selectivity is important for HZSM-5 zeolites, the
performance of nanoscale zeolite is highly dependent on the overall molecular diffusion
length and availability of active sites inside zeolite pores for dehydrocyclization to
aromatics. The nanoscale HZSM-5 catalyst was proven to be a hydrocarbon cracking

52
catalyst and less suitable for aromatization of propylene than microscale HZSM-5. This
work can potentially be beneficial for petroleum catalytic cracking and dealkylation
process

53
CHAPTER IV
CONVERSION OF 1-TETRADECENE TO AROMATIC COMPOUNDS
Introduction
Aromatic compounds, particularly BTEX (benzenes, toluene, ethylbenzene and
xylenes) are commercially used as starting materials for manufacturing polymers, resins,
industrial fibers and elastomers. The most common use of BTEX are as solvents. They
are also present in gasoline to increase its octane rating. The most promising method for
the production of aromatic compounds (BTEX) is catalytic conversion [23, 64].
Presently, the sources for the production of aromatics are petroleum and coal.
Various processes have been commercialized for converting light alkanes, olefins and
petroleum naphtha into aromatic compounds via catalytic cracking and reforming routes.
Current academic as well as industrial research is focused on the production of aromatic
compounds from light alkanes and alkenes [24-26, 28-32, 34-41, 44, 47, 64-70].
Fatty acids[71, 72] and olefins such as ethylene, propylene, butene, hexene and octene
have also been aromatized by using zeolite catalysts[73-75]. ZSM-5 catalysts in hydrogen
form or in the metal (Ga, Zn) doped forms showed the best results for conversion of
olefins into aromatic compounds.
1-hexene was successfully converted into aromatics in a plug flow reactor by
using Ga doped HZSM-5 catalysts by R. J. Nash et. al. [76] and it was observed that C8

54
aromatics are major aromatic products at lower temperatures. At higher temperatures,
dealkylation of C8 aromatics yield more benzene and toluene.
Most notably, at lower residence time, Nash observed that cracking dominates,
resulting in the formation of light alkenes, such as propylene, as primary products.
However, significant amounts of bulkier molecules and aromatics were produced when
the residence time was increased. This suggests that for C6 and greater carbon chain
lengths, aromatics formation is a multi-step process where cracking of the feedstock to
lighter alkenes occurs in the first step with cyclization and dehydrogenation occurring in
subsequent steps. Similar trends were observed for 1-octene aromatization in the same
study. Yuning Li and coauthors also reported [69, 77] the conversion of 1-hexene to
aromatic compounds in a continuous fixed bed reactor by using ZSM-5 type zeolites.
This conversion of α-olefins to aromatics was achieved between temperature ranges of
350 °C - 480 °C.
Aromatization of n-octene over nanoscale HZSM-5 catalysts were also carried
out in a continuous flow fixed bed reactor [70]. Toluene and xylenes were the major
aromatics and individual aromatic formation was greatly influenced by the levels of
strong acid sites within the catalyst. In another study of n-octene aromatization over
nanoscale HZSM-5 catalysts[59], it was observed that lower temperatures produced
greater concentrations of xylenes, and that selectivity towards benzene and toluene
formation increases with an increase in temperature.
Processes for the aromatization of C3-C6 olefins have been commercialized [see
chapter 1] while middle chain length (C6, C8) olefins have also been studied, as described

55
above. However, to our best knowledge, no work has been conducted to date to study the
aromatization of α-olefins having a chain length greater than 10 carbon atoms.
Distinguished by the chemical formula CnH2n, 1-tetradecene is a commercially important
α-olefin for the manufacture of detergents, surfactants, linear alkylbenzenes [78-81].
\Previous studies associated with 1-tetradecene have concentrated on its use as a
comonomer in copolymerization reactions [82-84]. 1-tetradecene is also used in
functional drilling fluids, lubricants, automotive additives, and metal working agents.
For the present study, 1-tetradecene was selected as one of a series of model
compounds to assist in developing a process to improve the ability to produce renewable
aromatics from triacyl glyceride (TAG) oils, such as crop oils (soy, corn, canola, etc.),
algal oil and microbial oils, and from fatty acids such as restaurant wastes and animal
fats. The primary objective was to determine if C10-C16 alpha olefins, which are present
in the organic liquid product generated during non-catalytic cracking, could be effectively
converted into aromatics. A secondary objective was to explore the reaction conditions
using DOE methodologies in order to gain insight into the significant effects of reaction
conditions and their interactions on aromatization
Experimental
Materials
The ZSM-5 catalyst (CBV 2314 – SiO2/Al2O3 ratio = 23) was purchased from
Zeolyst International, Conshohocken, PA, USA. 1-Tetradecene (97% purity), GC grade
standards, benzene, toluene, ethylbenzene, xylenes, naphthalene and 2-chlorotoluene
were purchased from Sigma-Aldrich, Saint Louis, Missouri, USA. The commercial ZSM-

56
5 catalyst was supplied in its ammonium form. The ammonium form was converted into
its hydrogen form by calcination at 550 °C for 5 hours in an air circulated oven,
generating activated HZSM-5 catalyst.
Experimental Setup
A Parr series 4575 fixed head, bench top, high temperature, high pressure
autoclave type reactor was used. This reactor (500 mL) was equipped with a cooling
channel to control the reaction temperature and a stirrer that agitated the catalyst and
reaction mixture. The reaction temperature was controlled and monitored by a K-type
thermocouple connected to Parr 4843 controller, which also monitored and controlled the
impeller speed. The reactor was equipped with a gas inlet connected to a nitrogen
cylinder to maintain initial reaction pressures.
Experimental Procedures
The required catalyst amounts (4-15 g) and 1-tetradecene (100 g) were charged to
the catalytic reactor. The reactor was purged with nitrogen gas to remove air prior to
heating. The reactor was heated to a desired temperature for the allotted time with its
contents being stirred at 300 rpm. Once the reaction was completed, reactor contents
were cooled down to room temperature and then the gaseous products were collected in a
gas bag by slowly opening the reactor vent. The entire reactor contents were weighed and
then filtered to separate coke/solid particles from liquid reformates. The collected
samples were dissolved in methanol to ensure miscibility and submitted to analysis.
The amount of coke formed was determined by subtracting the weight of the
catalyst fed to the reactor from that of the catalyst obtained after reaction, thus accounting

57
for the coke deposit developed on its surface. The yield of gases was determined by the
difference between the masses of the tetradecene fed and the combined mass of the
reformate and coke produced.
Chemical Characterization of Reformate
The reformate characterization was based on the adopted GC-FID/MS method
[85] but targeting quantification of aromatic standards using GC-FID-MS (Agilent 5890
Series II with 5973 MS). For detailed characterization of the reformate aromatic products,
a faster screening analytical protocol was adopted using GC-MS (Agilent 5890 Series II
with 5973 MS). The temperatures of the GC injector and transfer line to MS were set at
250 ºC and 280 ºC, respectively. The oven temperature program was started at 40 °C for
5 min and then ramped at 15 ºC/min to 310 °C and held at this temperature for 5 min. The
sample injections of 1 µL were performed in the split mode (1:20) at a helium constant
flowrate of 1.5 mL/min. The GC-MS analysis was performed with electron ionization,
the solvent delay was of 4 min in a mass range of 50-500 amu.
The aromatics were identified based on their GC retention time and pattern of
homolog and isomer elution as detailed elsewhere (Kubátová et al., 2011) . The retention
times for thus identified aromatic hydrocarbons are listed in Table 5. The aromatics’
quantification was based on BTEX (benzene, toluene, ethylbenzene and xylenes)
standards using a full calibration between 0.01 to 5.0 wt.%, with the addition of an
internal standard (chlorotoluene) to the sample. The BTEX were directly quantified based
on the major ions (Table 5).

58
Table 5. List of compound name, calibration standard and quantification ion
Compound name Formula
Molecular
weight
Retention
time (min.) Quantification Ion
Benzene C6H6 78 4.6 78
Toluene C7H8 92 7.1 91
Ethylbenzene C8H10 106 9.1 91
p-Xylene C8H10 106 9.3 91
o-Xylene C8H10 106 9.7 91
o-Xylene 105 C8H10 106 9.7 105
Naphthalene C10H8 128 13.7 128
Benzene C3z C9H12 120 10.2 105
Benzene, C3a C9H12 120 10.8 105
Benzene, C3b C9H12 120 10.9 105
Benzene, C3x C9H12 120 11.1 105
Benzene, C3y C9H12 120 11.3 105
Benzene, C4a C10H14 134 11.5 105
Benzene, C4b C10H14 134 11.6 119
Benzene, C4c C10H14 134 11.7 119
Indane C9H10 118 11.9 105
Benzene, C4y C10H14 134 12.0 105
Benzene, butyl- C10H14 134 12.1 91
Benzene, C4d C10H14 134 12.2 105
Benzene, C4x C10H14 134 12.28 105
Benzene C4e C10H14 134 12.37 105
Benzene C4f C10H14 134 12.4 105
Benzene, C4z C10H14 134 12.47 105
Indane, C1a C10H12 132 12.52 105
Benzene C5y C11H16 148 13.06 105
Indane, C1 C11H14 132 13.13 105
Benzene, C5a C11H14 148 13.17 105
Indane, C1x C11H14 132 13.27 105
Benzene, C5b C11H16 148 13.48 105
Benzene, C5z C11H16 148 13.61 105
Benzene, pentyl- C11H16 148 13.31 91
Benzene, C5x C11H16 148 13.41 105
Indane, C2 C11H14 146 13.73 105
Benzene, C6a C12H18 162 14.19 105
Benzene, C6y C12H18 162 14.27 105
Benzene, hexyl- C12H18 162 14.36 91
Benzene, C6x C12H18 162 14.44 105
Naphthalene, C1y C11H10 142 14.83 128
Naphthalene, C1x C11H10 142 15.01 128
Benzene, heptyl- C13H20 176 15.34 91
Benzene, C7x C13H20 176 15.41 105
Naphthalene, ethyl C12H12 156 15.75 128
Naphthalene, C2x C12H12 156 15.85 128

59
Naphthalene, C2y C12H12 156 16 128
Benzene, octyl- C14H22 190 16.25 91
Benzene, C8x C14H22 190 16.30 105
Naphthalene, C3x C13H14 170 16.71 128
Naphthalene, C3y C13H14 170 16.82 128
Benzene, nonyl- C15H24 204 17.10 91
Benzene, C9x C15H24 204 17.16 105
Benzene, decyl C16H26 218 17.91 91
Benzene, C10x C16H26 218 17.96 105
Benzene, C11a C17H28 232 18.11 105
Benzene, C11b C17H28 232 18.18 105
Benzene, undecenyl C17H28 232 18.67 91
Benzene, C11x C17H28 232 18.73 105
For quantitation of other alkyl aromatics, signals of representative ions were used
employing a calibration slope obtained ion of m/z 105 for o-xylene. In rare cases when
the m/z 105 signal was of low intensity, other characteristic ions were used listed in
Table 5. The mass balance closure for two selected samples was estimated based on the
percent response obtained from the total ion current chromatograms and its
proportionality to the aromatic compounds. A 2 level, 3 factor, full factorial experimental
design was used to study the catalytic conversion of 1-tetradecene over an HZSM-5
zeolite having a SiO2/Al2O3 (Si/Al) ratio of 23. The reaction temperature (oC), olefin
(tetradecene) to catalyst ratio (OCR), and reaction time (minutes) were chosen as the
factors to be studied. All the aromatization experiments were performed in a random
order.
The amount of feed 1-tetradecene used was kept constant for all experiments.
After each aromatization run, the mass of liquids and coke/solids formed were
determined and the organic liquid products were further analyzed to –quantify the
individual and total aromatics produced.
fegade
Typewritten Text
Table 5 continued

60
Results and Discussion
Aromatic Hydrocarbon Product Yields
A typical chromatogram of the reaction product mixture is shown in Fig. 17.
Figure 17. Chromatogram of liquid products obtained by using HZSM-5. Operational
conditions were 375 ºC, OCR = 10 and reaction time of 30 minutes.
The trends in monoaromatic hydrocarbon yields shown in Fig. 18 were similar for
BTEX and its higher-MW homologs: Lower OCR and higher temperature promoted the
formation of all aromatics, thus indicating the catalytic nature of their formation and
necessity of prior feedstock cracking, respectively.
5.00 6.00 7.00 8.00 9.00 10.00 11.00 12.00 13.00 14.00 15.00 16.00 500000
1000000 1500000 2000000 2500000 3000000 3500000 4000000 4500000 5000000 5500000
Time-->
Abundance
Polyalkylated benzenes & PAHs
Dienes and cyclic hydrocarbons

61
b)
Figure 18. Comparison of aromatic hydrocarbon yields obtained by 1-tetradecene
aromatization varying a) reaction temperatures (where OCR* was 10 and time was 30
minutes), b) OCR (where temperature was 375 °C and time was 30 minutes). The Y axis
represents the concentration (wt%) of aromatic hydrocarbons in the product.
* OCR = Olefin to catalyst ratio

62
A more detailed analysis distinguishing monoaromatics from diaromatics (Table
6) corroborated this conclusion with one exception: Low temperature promoted the
formation of diaromatics at the expense of monoaromatics. This observation may explain
the preferred formation of coke at a lower temperature as discussed in the next section.
Table 6. Detailed composition of the aromatic hydrocarbon product fraction formed
under the maximum yield conditions in runs #3 (Tables 7 and 8) and its replicate. The
reforming reaction conditions were as follows: 375 ºC, OCR = 10 and reaction time of 30
minutes. The isomers are listed in the order of their chromatographic elution.
Aromatic hydrocarbon Sample 1 Sample 2 Average StDev (+/-)
Benzene C3z 0.15 0.17 0.16 0.012
Benzene, C3a 5.6 6.0 5.8 0.25
Benzene, C3b 0.89 0.99 0.94 0.07
Benzene, C3x 0.61 0.67 0.64 0.045
Benzene, C3y 3.5 3.8 3.7 0.24
Benzene, C4a 0.057 0.068 0.062 0.01
Benzene, C4b 0.38 0.44 0.41 0.04
Benzene, C4c 0.33 0.37 0.35 0.03
Benzene, C4y 1.8 2.0 1.9 0.11
Benzene, C4x 0.20 0.22 0.21 0.01
Benzene C4e 0.55 1.4 0.99 0.63
Benzene C4f 0.49 1.4 0.96 0.67
Benzene, C4z 1.8 1.4 1.6 0.23
Benzene C5y 0.34 0.38 0.36 0.027
Benzene, C5a 0.94 1.0 0.99 0.08
Benzene, C5b 0.73 0.81 0.77 0.06
Benzene, C5x 0.13 0.13 0.13 0.00
Benzene, C6a 0.16 0.20 0.18 0.03
Benzene, C6y 0.11 0.12 0.12 0.01
Benzene, C6x 0.06 0.08 0.07 0.01
Benzene 0.06 0.06 0.06 0.01
Toluene 0.77 0.85 0.81 0.06
Ethylbenzene 0.26 0.29 0.28 0.02
p-Xylene 1.7 1.8 1.7 0.09
o-Xylene 0.41 0.46 0.43 0.04
Indane 0.03 0.03 0.03 0.005
Indane, C1a 0.11 0.30 0.21 0.13
Indane, C1 0.25 0.04 0.15 0.15
Indane, C1x 0.15 0.17 0.16 0.01
Indane, C2 0.12 0.16 0.14 0.03
Benzene, butyl- 0.47 0.52 0.49 0.03
Benzene, pentyl- 0.12 0.15 0.13 0.02

63
Benzene, hexyl- 0.04 0.05 0.05 0.01
Benzene, heptyl- 0.02 0.02 0.02 0.00
Naphthalene 0.09 0.09 0.09 0.00
Naphthalene, decahydro-C2 0.08 0.08 0.08 0.00
Naphthalene, C1y 0.35 0.39 0.37 0.03
Naphthalene, C1x 0.11 0.12 0.12 0.01
Naphthalene, ethyl 0.07 0.07 0.07 0.00
Naphthalene, C2x 0.30 0.33 0.32 0.02
Naphthalene, C2y 0.15 0.16 0.15 0.01
Naphthalene, C3x 0.16 0.18 0.17 0.01
Naphthalene, C3y 0.052 0.052 0.052 0.00
Liquid, Gas and Coke Product Yields
Table 7 shows the yields of gas, coke and liquid products from 1-tetradecene
obtained in the same runs as those discussed above.
Table 7. Gases, liquids and coke yields obtained from 1-tetradecene conversion
Expt. Reaction
Temp.
(°C)
Time
(Min.)
OCR Gases
produced,
%
Liquid
products
produced,
%
Coke
produced,
%
1 300 30 10 13 73 12
2 300 60 10 18 68 13
3 375 30 10 46 43 9.0
4 375 60 10 47 47 6.0
5 375 60 20 29 53 16
6 300 60 20 9.5 83 6.7
7 375 30 20 38 58 3.2
8 300 30 20 5.5 87 6.7
fegade
Typewritten Text
Table 6 continued

64
The yield of coke was maximized at low temperature. In combination with the
low yield of aromatics obtained under these conditions, low temperature appears to be
unsuitable for the reforming process. By contrast, gas phase yields were maximized at
high temperature. Furthermore, those runs that produced most aromatics were also
characterized by higher yields of gases, with the corresponding reduction of the OLP
yields. The available literature on zeolite catalysis corroborates this trend; it is often
explained by the formation of small C2-C3 size intermediates of aromatization [2, 3, 15].
Table 8. Aromatic product yields (wt%) obtained in experiments on 1-tetradecene
conversion. Expt.
No. Temp. (°C)
Time
(min) OCR
Alkyl
benzenes BTEX
mono-
aromatics
Indanes
Naphthalenes
diaromatics
Total
aromatics
1 300 30 10 1.7 0.05 1.7 0.00 0.50 2.2
2 300 60 10 3.0 0.20 3.2 0.030 0.50 3.7
3 375 30 10 22 3.5 25 0.70 1.5 28
4 375 60 10 15 2.2 17 0.40 1.1 19
5 375 60 20 8.0 1.1 9.2 0.10 0.70 10
6 300 60 20 1.4 0.30 1.7 0.00 0.50 2.2
7 375 30 20 5.7 0.70 6.4 0.020 0.60 7.0
8 300 30 20 0.30 0.00 0.30 0.00 0.40 0.70
Thus, the general main reactions postulated in literature on zeolite catalysis
appear to be similar for low-MW and high-MW alkenes as feedstocks. However, the data
shown in Table 7 and Fig. 18 showed one significant difference in the product
composition compared to zeolite-catalyzed reforming of lower-MW alkenes, for which
BTEX were the main aromatic products. The reformate obtained upon 1-tetradecene

65
conversion was dominated by predominantly branched alkylbenzenes of a larger size than
BTEX. prompted an even more detailed analysis of the reaction products, i. e., on the
level of individual chemical species, which is discussed in the next section.
Yields of Individual Compounds and Homology Profiles
The detailed composition of aromatics in the reformate for run #3 that yielded the
greatest amount of aromatic products, is shown in Table 8. As one can see, many if not
all of the possible isomers were formed, although their relative amounts vary. For C3-
substituted benzenes, isomers were observed in reasonable abundance. By contrast, only
seven C4- and C5-substituted aromatic products were observed, despite the increase of the
theoretical number of isomers in this homological series. Apparently, some isomers of
higher MW were formed in lower amounts, below their limit of quantification or even
identification.
To assess the products’ homology profile, the amounts of isomers were combined
to yield the plot shown in Fig. 19.

66
Figure 19. Homology profiles of the alicyclic and aromatic hydrocarbon products. The
reforming reaction conditions were 375 ºC, OCR = 10 and reaction time of 30 minutes.
The observed profile corroborated the hypothesis stated in the previous paragraph
that higher that C3-substituted products were formed in lower abundance. Furthermore,
C9 aromatics turned out to be the most abundant in contrast to the previous studies in
which BTEX were the most abundant products of zeolite action.
Mechanistic Implications
The obtained information on cyclic product homology profiles may lead to the
following mechanistic considerations. Perhaps, the main intermediates formed as a result
of 1-tetradecene cracking are larger in size than the C2 (adsorbed ethylene) intermediates,
which were earlier postulated for lower-MW feedstocks [39, 86]. This conclusion might,
at the first glance, contradict the well-known match of the sizes of BTEX molecules and
zeolite pores [87]. However, larger alkylbenzene molecules may be formed from larger
intermediates within the near-surface pores.
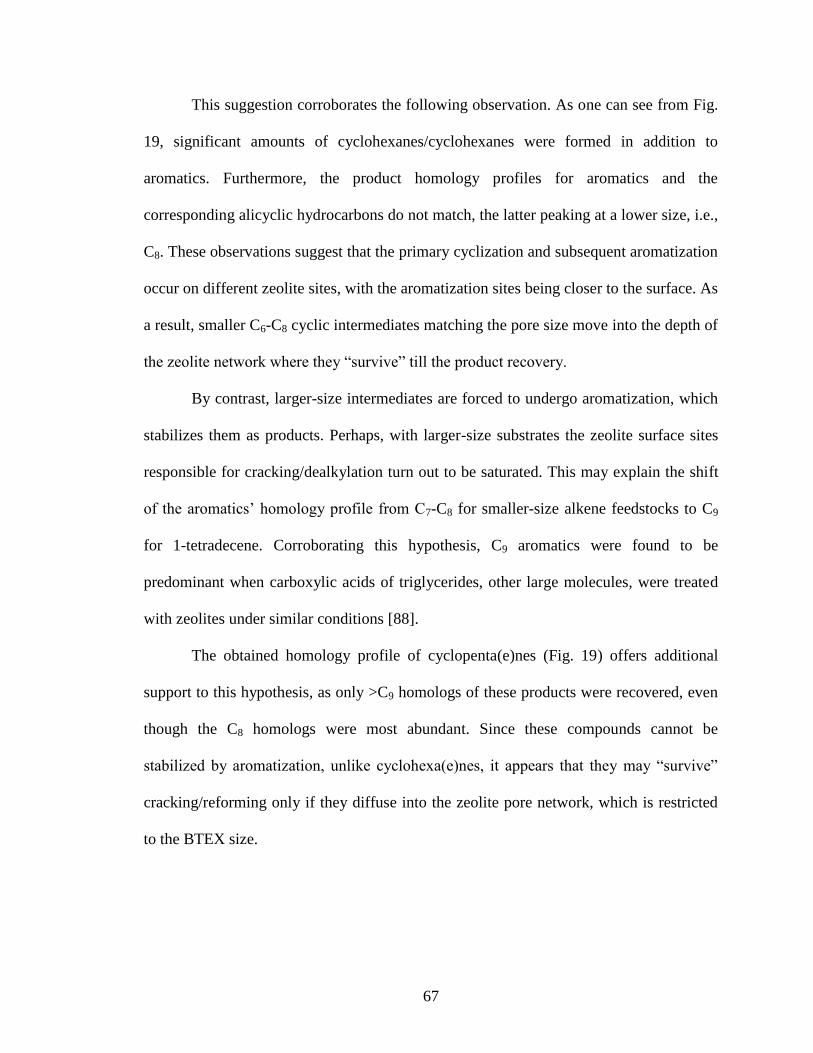
67
This suggestion corroborates the following observation. As one can see from Fig.
19, significant amounts of cyclohexanes/cyclohexanes were formed in addition to
aromatics. Furthermore, the product homology profiles for aromatics and the
corresponding alicyclic hydrocarbons do not match, the latter peaking at a lower size, i.e.,
C8. These observations suggest that the primary cyclization and subsequent aromatization
occur on different zeolite sites, with the aromatization sites being closer to the surface. As
a result, smaller C6-C8 cyclic intermediates matching the pore size move into the depth of
the zeolite network where they “survive” till the product recovery.
By contrast, larger-size intermediates are forced to undergo aromatization, which
stabilizes them as products. Perhaps, with larger-size substrates the zeolite surface sites
responsible for cracking/dealkylation turn out to be saturated. This may explain the shift
of the aromatics’ homology profile from C7-C8 for smaller-size alkene feedstocks to C9
for 1-tetradecene. Corroborating this hypothesis, C9 aromatics were found to be
predominant when carboxylic acids of triglycerides, other large molecules, were treated
with zeolites under similar conditions [88].
The obtained homology profile of cyclopenta(e)nes (Fig. 19) offers additional
support to this hypothesis, as only >C9 homologs of these products were recovered, even
though the C8 homologs were most abundant. Since these compounds cannot be
stabilized by aromatization, unlike cyclohexa(e)nes, it appears that they may “survive”
cracking/reforming only if they diffuse into the zeolite pore network, which is restricted
to the BTEX size.

68
Conclusions
In the presence of HZSM-5, 1-tetradecene is converted to aromatic hydrocarbons
of a predominantly larger size than BTEX (>C8). Higher reaction temperature (375 oC)
and lower olefin to catalyst ratio (OCR) increase the aromatics yield, although gas phase
products are also formed in abundance under such conditions. Besides aromatics,
significant amounts of cyclohexanes, cyclohexenes and cyclopenta(e)nes are recovered,
with the size of these products peaking at C8. Given the size of the zeolite pores matching
that of BTEX molecules, larger-size aromatic hydrocarbons may be formed at the pore
opening, near the zeolite surface; this factor may be characteristic and specific for large
substrates, such as 1-tetradecene. Also, cyclization and aromatization of the primary
intermediates appear to be uncoupled, with larger-size substrates promoting the formation
of slightly larger-size aromatic but not alicyclic products.

69
CHAPTER V
A NOVEL TWO STEP PROCESS FOR THE PRODUCTION OF RENEWABLE
AROMATIC HYDROCARBONS
Introduction
Crude oil is the major current source for production of aromatics, which are used
for gasoline octane enhancement. Aromatics from coal are produced commercially in
small amounts and most end up in the form of a pitch or asphalt products. Considering
the dwindling supply of petroleum, there is a growing interest in developing renewable
resources for producing aromatics and organic chemicals. These include several attempts
to produce phenolics by pyrolysis of lignin including zeolite catalysis [89].
Several studies [90-96] were conducted to convert biomass and pyrolytic bio-oils
into hydrocarbons by using porous catalysts such as H-Y zeolites, HZSM-5, H-
modernite. The reaction temperature was varied from 290 °C – 410 °C. For silica-
alumina catalysts, the yields of aromatics were only between 4-7 wt% even at higher
temperatures whereas the coke yields were as high as 30 wt%. By contrast, HZSM-5
produced only about 15 wt% coke. Although aromatics accounted for as much as 86 wt%
of the organic liquid product (OLP) formed, the OLP yield with HZSM-5 was merely 22
wt%. Thus, low OLP yields brought the total aromatics yield down to 19 wt% with
respect to the feedstock [97-99].
Triglyceride (TG) oils, such as palm, soybean, canola and other cooking oils, is
the third promising feedstock for the production of valuable organic chemicals; it is

70
particularly well-suited for production of aromatic hydrocarbons as opposed to phenolics
[100-105]. Thermal as well as catalytic cracking [106, 107] of TGs yield aromatic and
other hydrocarbon products [108-111] along with simple molecules, i.e., water, CO and
CO2. Catalytic conversion may occur at lower temperatures [5, 106-109, 112, 113] .
Various catalysts were explored for production of fuels and chemicals from crop
oil [111]. Among these catalysts, zeolite HZSM-5 showed a high selectivity towards the
production of specific-size (C6-C8) aromatics, i.e., benzene, toluene, ethylbenzenes and
xylenes (BTEX). Such a specificity of HZSM-5 is due to its defined pore size and
specific geometry of the active acid sites. Just as with lignin conversion, one significant
problem of using zeolite catalysts including HZSM-5 was high yield of coke and,
particularly, low-MW gas phase hydrocarbons.
Our previous studies demonstrated that thermal cracking of triacylglyceride oils
becomes significant only at temperatures above 400 °C [5]. Detailed protocols using gas
chromatography with mass spectrometry and flame ionization detection (GC-MS/FID)
enabled identification and quantification of more than 200 compounds [85].
The OLP of such thermally cracked triacylglyceride oils contained significant
amounts of C2-C12 fatty acids, fuel-incompatible products, which were nearly absent
when any catalysts were used [112, 114]. These fatty acids were successfully separated
from OLP produced during a scalable continuous process [115]. In the other studies of
soybean oil TG cracking at 400 °C, short chain fatty acids, alkanes, alkenes and about 5
% of aromatic hydrocarbons were produced [5, 109]. In an attempt to produce kerosene
type fuel from canola oil, the 2% yield of aromatic hydrocarbons was reported [6]
whereas experiments on soybean oil cracking at 430 °C showed a lower (1.1 wt%) yield

71
of aromatics, along with a high (34 wt%) yield of fatty acids. In a study of oleic acid
cracking at 400 °C [114], paraffins, aromatics and olefins were produced by the use of
HZSM-5 catalyst. The reaction pathways included decarboxylation, decarbonylation,
cracking, oligomerization, cyclization and aromatization, along with alkyl group
rearrangement. C7-C11 aromatics were produced in larger quantities than the other
homologs. However, a significant portion of the feedstock remained unreacted even at
400 °C.
This paper describes a novel two-step process for an efficient production of
aromatic hydrocarbons from a renewable source, soybean oil. Conducting the process in
two steps, i.e., thermal followed by HZSM-5 catalyzed TG cracking, addressed the main
problems of both processes when they were conducted in one step, i.e., high yield of
unwanted acid and gas products, respectively. A novel application of detailed GC-MS
analysis protocols revealed a significant yield of aromatics and other cyclic hydrocarbons
and demonstrated somewhat unexpected features of the product composition.
Experimental
Materials
Refined soybean oil was provided by Ag Processing Inc, a cooperative located in
the state of Minnesota, USA. The ammonium forms of two different ZSM-5 catalysts
having different SiO2/Al2O3 ratios (CBV5524G and CBV 2314) were purchased from
Zeolyst International, Conshohocken, PA, USA. These were converted into their
hydrogen forms by calcination at 550 °C for 5 hours in an air circulated oven, generating
HZSM-5 catalysts. Gas chromatographic (GC) grade standards for benzene, toluene,

72
ethylbenzene, xylenes, naphthalene and 2-chlorotoluene were purchased from Sigma-
Aldrich, Saint Louis, Missouri, USA.
Non-catalytic cracking experiments
The non-catalytic cracking of soybean oil was conducted in a small pilot-scale
(seven L/hr) continuous reactor [109] as shown in Fig. 20.
Figure 20. Reactor setup for thermal cracking of soybean oil
The feed oil was pumped (with a Neptune Chemical Pump Company
proportioning diaphragm pump model 515-A-N3, Lansdale, PA, USA) from a 68 L tank
through a filter to remove solids and other particles, then through a preheater where it
was heated to about 150 °C and into the cracking reactor. The cracking reactor was 9.7L
304SS surrounded by three independently controlled external ceramic band heaters used

73
to maintain the temperature within the reactor at the desired operating temperature (435
ºC). A mechanical agitator shaft, installed off-center to minimize vortexing, was operated
at rotation speeds of approximately 400 RPM. The two impellers were directionally
reversed (i.e., one ‘up-mixing’ and the other ‘down-mixing’) in order to promote
desirable mixing. The cracked products leaving the reactor passed through a condenser
cooled with tap water to room temperature. The liquid crackate was collected into a
storage tank and the gases were taken out through a gas vent.
The liquid crackate was further purified by distillation at 300 °C in a batch lab-
scale distillation apparatus to remove heavy polymeric compounds similar to tar.
Catalytic reforming experiments
A schematic of the experimental reactor setup is shown in Figure 21
Figure 21. Reactor setup for the aromatization of thermally cracked soybean oil
A Parr series 4575 fixed head, bench top, high temperature, high pressure
autoclave type reactor was used as the reforming reactor. This reactor (500 mL) was
equipped with a cooling channel to control the reaction temperature and a stirrer that
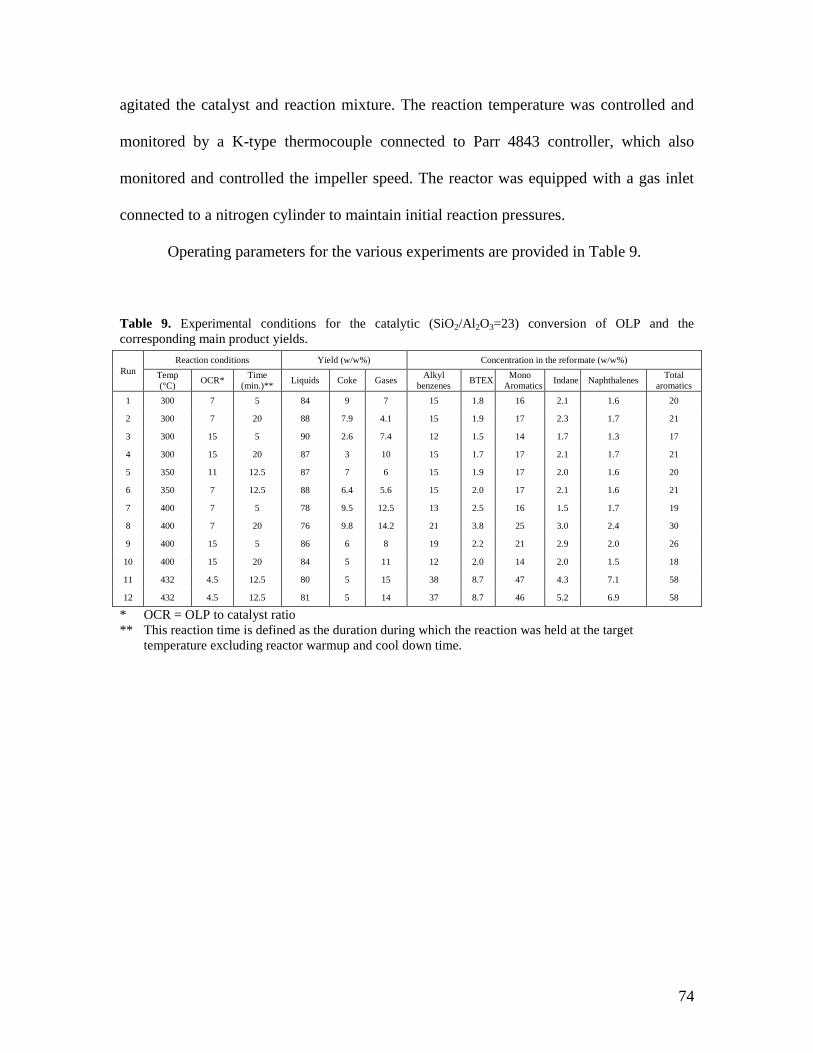
74
agitated the catalyst and reaction mixture. The reaction temperature was controlled and
monitored by a K-type thermocouple connected to Parr 4843 controller, which also
monitored and controlled the impeller speed. The reactor was equipped with a gas inlet
connected to a nitrogen cylinder to maintain initial reaction pressures.
Operating parameters for the various experiments are provided in Table 9.
Table 9. Experimental conditions for the catalytic (SiO2/Al2O3=23) conversion of OLP and the
corresponding main product yields.
Run
Reaction conditions Yield (w/w%) Concentration in the reformate (w/w%)
Temp
(°C) OCR*
Time
(min.)** Liquids Coke Gases
Alkyl
benzenes BTEX
Mono
Aromatics Indane Naphthalenes
Total
aromatics
1 300 7 5 84 9 7 15 1.8 16 2.1 1.6 20
2 300 7 20 88 7.9 4.1 15 1.9 17 2.3 1.7 21
3 300 15 5 90 2.6 7.4 12 1.5 14 1.7 1.3 17
4 300 15 20 87 3 10 15 1.7 17 2.1 1.7 21
5 350 11 12.5 87 7 6 15 1.9 17 2.0 1.6 20
6 350 7 12.5 88 6.4 5.6 15 2.0 17 2.1 1.6 21
7 400 7 5 78 9.5 12.5 13 2.5 16 1.5 1.7 19
8 400 7 20 76 9.8 14.2 21 3.8 25 3.0 2.4 30
9 400 15 5 86 6 8 19 2.2 21 2.9 2.0 26
10 400 15 20 84 5 11 12 2.0 14 2.0 1.5 18
11 432 4.5 12.5 80 5 15 38 8.7 47 4.3 7.1 58
12 432 4.5 12.5 81 5 14 37 8.7 46 5.2 6.9 58
* OCR = OLP to catalyst ratio
** This reaction time is defined as the duration during which the reaction was held at the target
temperature excluding reactor warmup and cool down time.

75
The required quantities of catalyst and OLP were charged to the reactor. The
reactor was purged with nitrogen to remove air prior to heating. The reactor was then
heated to the desired temperature and maintained at this temperature for an allotted time
with its contents being stirred at 300 rpm. Once the reaction was completed, the reactor
contents were cooled down to room temperature and then the gaseous products were
collected in a gas bag by slowly opening the reactor vent. The entire reactor contents
were weighed and then filtered to separate coke/solid particles from liquid reformates.
The collected samples were dissolved in methanol to ensure miscibility and submitted to
analysis.
The amount of coke formed was determined by subtracting the weight of the
catalyst fed to the reactor from that of the catalyst obtained after reaction, thus accounting
for the coke deposition on the catalyst surface. The yield of gases was determined by the
difference between the masses of the OLP fed to the reactor and the combined mass of
the reformate and coke produced.
Chemical characterization
For characterization of the OLP and reformate aromatic products, an analytical
protocol using GC-MS (Agilent 5890 Series II with 5973 MS) was based on a GC-
FID/MS method developed by Štávová et al. (2012) allowing for accurate identification
and tentative quantification of aromatics. The temperatures of the GC injector and the
transfer line to the MS were set at 250 ºC and 280 ºC, respectively. The oven temperature
program was started at 40 °C for 5 min and then ramped at 15 ºC/min to 310 °C and held

76
at this temperature for 5 min. The sample injections of 1 µL were performed in split
mode (1:20) at a helium constant flowrate of 1.5 mL/min. The GC-MS analysis was
performed with electron ionization using a solvent delay of 4 min in a mass range of 50-
500 amu.
The aromatic hydrocarbons were identified based on their GC retention time and
pattern of homologue and isomer elution as detailed elsewhere (Kubátová et al., 2011).
The retention times for the identified aromatic hydrocarbons are listed in Supplementary
Table 9.
The aromatics’ quantification was based on BTEX (benzene, toluene,
ethylbenzene and xylenes) standards using a full calibration between 0.01 to 5.0 wt.%,
with the addition of an internal standard (chlorotoluene) to the sample. The BTEX were
directly quantified based on the major ions (Table 10).
Table 10. Details of GC-MS analysis used for reformate identification
Compound name Formula Molecular
weight
Retention
time (min.)
Quantification
Ion
Benzene C6H6 78 4.6 78
Toluene C7H8 92 7.1 91
Ethylbenzene C8H10 106 9.1 91
p-Xylene C8H10 106 9.3 91
o-Xylene C8H10 106 9.7 91
o-Xylene 105 C8H10 106 9.7 105
Naphthalene C10H8 128 13.7 128
Benzene C3z C9H12 120 10.2 105
Benzene, C3a C9H12 120 10.8 105
Benzene, C3b C9H12 120 10.9 105
Benzene, C3x C9H12 120 11.1 105
Benzene, C3y C9H12 120 11.3 105
Benzene, C4a C10H14 134 11.5 105
Benzene, C4b C10H14 134 11.6 119
Benzene, C4c C10H14 134 11.7 119
Indane C9H10 118 11.9 105
Benzene, C4y C10H14 134 12.0 105
Benzene, butyl- C10H14 134 12.1 91
Benzene, C4d C10H14 134 12.2 105
Benzene, C4x C10H14 134 12.28 105
Benzene C4e C10H14 134 12.37 105

77
Benzene C4f C10H14 134 12.4 105
Benzene, C4z C10H14 134 12.47 105
Indane, C1a C10H12 132 12.52 105
Benzene C5y C11H16 148 13.06 105
Indane, C1 C11H14 132 13.13 105
Benzene, C5a C11H14 148 13.17 105
Indane, C1x C11H14 132 13.27 105
Benzene, C5b C11H16 148 13.48 105
Benzene, C5z C11H16 148 13.61 105
Benzene, pentyl- C11H16 148 13.31 91
Benzene, C5x C11H16 148 13.41 105
Indane, C2 C11H14 146 13.73 105
Benzene, C6a C12H18 162 14.19 105
Benzene, C6y C12H18 162 14.27 105
Benzene, hexyl- C12H18 162 14.36 91
Benzene, C6x C12H18 162 14.44 105
Naphthalene, C1y C11H10 142 14.83 128
Naphthalene, C1x C11H10 142 15.01 128
Benzene, heptyl- C13H20 176 15.34 91
Benzene, C7x C13H20 176 15.41 105
Naphthalene, ethyl C12H12 156 15.75 128
Naphthalene, C2x C12H12 156 15.85 128
Naphthalene, C2y C12H12 156 16 128
Benzene, octyl- C14H22 190 16.25 91
Benzene, C8x C14H22 190 16.30 105
Naphthalene, C3x C13H14 170 16.71 128
Naphthalene, C3y C13H14 170 16.82 128
Benzene, nonyl- C15H24 204 17.10 91
Benzene, C9x C15H24 204 17.16 105
Benzene, decyl C16H26 218 17.91 91
Benzene, C10x C16H26 218 17.96 105
Benzene, C11a C17H28 232 18.11 105
Benzene, C11b C17H28 232 18.18 105
Benzene, undecenyl C17H28 232 18.67 91
Benzene, C11x C17H28 232 18.73 105
For quantitation of other alkyl aromatics, signals of representative ions were used
employing a calibration slope obtained ion of m/z 105 for o-xylene. In rare cases when
the m/z 105 signal was of low intensity, other characteristic ions were used as listed in
Table 10. The other groups of products, i.e., cyclohexa(e)nes, cyclopenta(e)nes,
monocarboxylic acids, etc., were analyzed in a similar way, using for quantification the
characteristic ions listed in Table 10. The reformate compositions for two selected
fegade
Typewritten Text
Table 10 continued
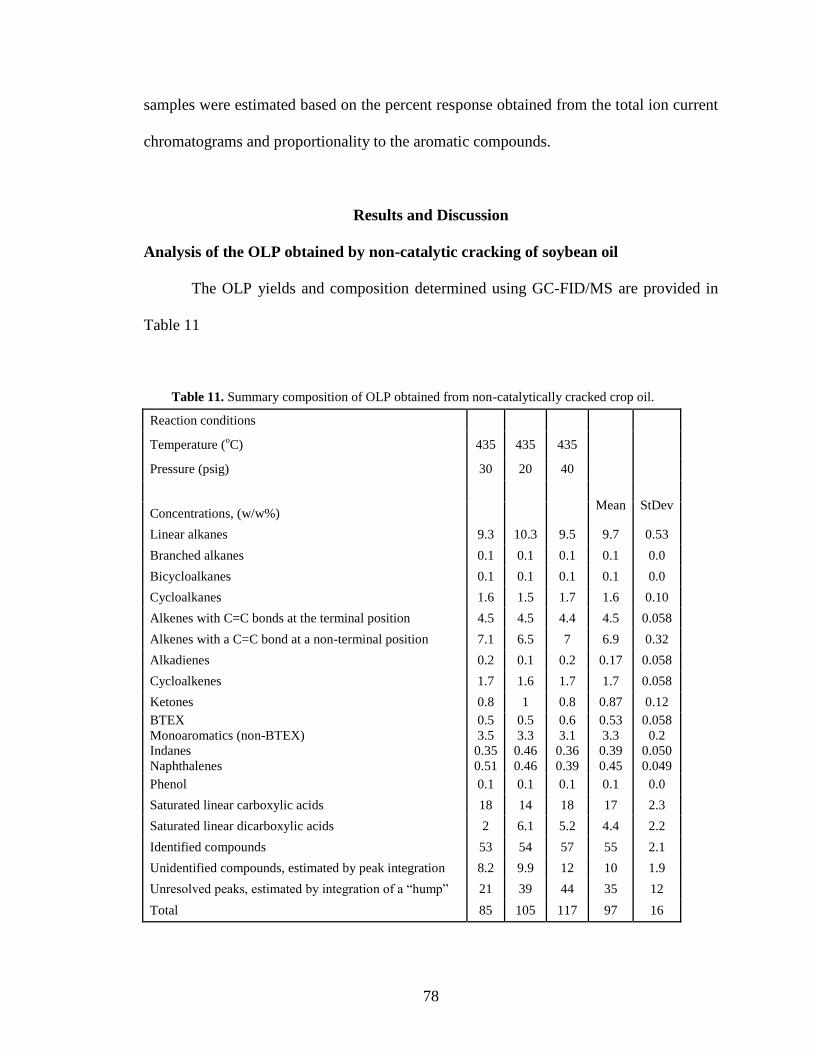
78
samples were estimated based on the percent response obtained from the total ion current
chromatograms and proportionality to the aromatic compounds.
Results and Discussion
Analysis of the OLP obtained by non-catalytic cracking of soybean oil
The OLP yields and composition determined using GC-FID/MS are provided in
Table 11
Table 11. Summary composition of OLP obtained from non-catalytically cracked crop oil.
Reaction conditions
Mean
StDev
Temperature (oC) 435 435 435
Pressure (psig) 30 20 40
Concentrations, (w/w%)
Linear alkanes 9.3 10.3 9.5 9.7 0.53
Branched alkanes 0.1 0.1 0.1 0.1 0.0
Bicycloalkanes 0.1 0.1 0.1 0.1 0.0
Cycloalkanes 1.6 1.5 1.7 1.6 0.10
Alkenes with C=C bonds at the terminal position 4.5 4.5 4.4 4.5 0.058
Alkenes with a C=C bond at a non-terminal position 7.1 6.5 7 6.9 0.32
Alkadienes 0.2 0.1 0.2 0.17 0.058
Cycloalkenes 1.7 1.6 1.7 1.7 0.058
Ketones 0.8 1 0.8 0.87 0.12
BTEX
Monoaromatics (non-BTEX)
Indanes
Naphthalenes
0.5
3.5
0.35
0.51
0.5
3.3
0.46
0.46
0.6
3.1
0.36
0.39
0.53
3.3
0.39
0.45
0.058
0.2
0.050
0.049
Phenol 0.1 0.1 0.1 0.1 0.0
Saturated linear carboxylic acids 18 14 18 17 2.3
Saturated linear dicarboxylic acids 2 6.1 5.2 4.4 2.2
Identified compounds 53 54 57 55 2.1
Unidentified compounds, estimated by peak integration 8.2 9.9 12 10 1.9
Unresolved peaks, estimated by integration of a “hump” 21 39 44 35 12
Total 85 105 117 97 16

79
for the non-catalytic cracking step. This composition is consistent with earlier
published results [12, 116].
The operational conditions for the non-catalytic cracking reaction, particularly the
use of a higher temperature (435 °C) compared to the prior published work (Kozliak et al.
2013; Luo et al., 2010), were selected to generate a higher abundance of alkenes for
reforming into aromatics. The resulting OLP, purified from the crackate liquid after the
first reaction step (i.e. non-catalytic cracking) also contained high concentrations of
alkanes and linear saturated carboxylic acids. Since the resulting OLP compositions
obtained in all three experimental runs were similar, the first sample of those shown in
Table 11 was selected as the feedstock for the second reaction step.
Analysis of reformate and other products obtained from the catalytic conversion of
soybean cracking-derived OLP
For the second reaction step, the catalytic reforming, a series of cursory
parameterization experiments were performed following a Design of Experiments
strategy, i.e., conducting the minimum experiments to cover the pertinent ranges of
several parameters. These parameters, i.e., operational conditions (temperature, OLP to
catalyst ratio, OCR and time) along with the resulting yields of the most significant
groups of products are listed in Table 9.

80
An increase of the reaction temperature from 300 ºC to 400 ºC resulted in a
significant increase in the yield of all types of aromatics (Fig. 22A). This trend is
consistent with the literature [10] and can be explained by the facilitation of adsorption
and diffusion of feed molecules into zeolite pores, where the formation of aromatic rings
takes place [73].
0
5
10
15
20
25
30
35
Linea
r alk
ylben
zenes
Bra
nched
alk
ylbe
nzenes
BTE
X
Monoar
omat
ics
Indan
es
Nap
hthal
enes
Total a
rom
atic
s
Yie
ld (
wt%
)
300 °C
350 °C
400 °C
A

81
0
5
10
15
20
25
30
35
Linea
r alkyl
benze
nes
Bra
nched
alk
ylbe
nzene
sBTEX
Mon
oaro
mat
ics
Indan
es
Nap
htha
lene
s
Total
aro
mat
ics
Yie
ld (
wt%
)
OCR = 15
OCR = 7
B

82
C
Figure 22. The effect of A) reaction temperature, B) OLP-to-catalyst ratio and C) silica/alumina ratio on
aromatics’ yields. Monoaromatics include all benzene derivatives; total aromatics also include diaromatics,
i.e., naphthalenes and indanes. Polyaromatics were detected only in trace amounts.
Higher temperatures may also encourage the cracking of long chain molecules,
which may be particularly significant for OLP reforming. Once this additional cracking
occurs, the additional smaller molecules produced may easily enter the HZSM-5 pore

83
channel network to yield more aromatics. Finally, thermal scission of hydrogen bonds
within the zeolite structure may lead to greater catalytic activity [52, 53].
The total aromatic hydrocarbon yields declined with an increase in the oil-to-
catalyst ratio (OCR), as expected (Fig. 22B). This relation confirms that the observed
significant reforming is truly catalytic and apparently taking place on the Brønsted acid
sites within the HZSM-5 pores.
Figure 22C depicts the yields of each type of aromatic hydrocarbon as a function
of the silica/alumina (SiO2/Al2O3) ratio at two different OCRs. The first two columns
(from the left) in each cluster in Fig. 22C present the results obtained with an OCR of 15
while the third and fourth columns present the results obtained for an OCR of 7. The first
and third columns in each cluster represent the yields over HZSM-5 with a SiO2/Al2O3
ratio of 50 whereas the second and fourth columns represent the yields when this ratio
was set at 23.
With both OCR ratios, the yields of all types of aromatic hydrocarbons almost
tripled when the SiO2/Al2O3 ratio was decreased from 50 to 23. The yields further
increased when the OCR was lowered to 4.5 and the temperature increased to 432 ºC at a
SiO2/Al2O3 ratio of 23 (the rightmost column in Fig. 22C). The detailed composition of
samples obtained in the runs under such conditions, which showed the maximum
concentration of aromatics with minimum coke formation, will be discussed henceforth.
The observation of a higher yield of aromatics at a lower Si/Al ratio corroborates the
well-known paradigm that the catalytic activity of HZSM-5 is mainly due to the Brönsted
acid sites present in the forms of bridging hydroxyl groups in the Si-O-Al triad, in which
it is the aluminum that exhibits significant acidity [46, 51]. The effects of the SiO2/Al2O3

84
ratio on HZSM-5 catalytic activity appear to be due to the differences in total acidity as
the acid strength increases with a decrease in this ratio. This difference may explain a
higher catalytic activity of such catalysts towards the production of aromatics as observed
in this study.
The gas and solid (coke) fractions of the product
Coke formation is an unavoidable step in acid catalyzed reactions over HZSM-5
catalysts [117-120]. However, our results showed that high yields of aromatics may be
combined with a low yield of coke (Table 9). Furthermore, it was observed that the lower
the silica/alumina ratio, the lower the coke yield. A similar trend was observed in
previously published work on hydrocarbon conversion [117, 121].
The yield of gaseous products was 15-28 w/w% of the OLP feed. Given that the
gas phase product yield for the first step (non-catalytic cracking of soybean oil) was 6
w/w%, the overall yield of gases was rather low, 21-34 w/w%. When soybean oil
conversion with HZSM-5 was attempted in one step (400-420 ºC) in our lab (Kadrmas et
al., 2015), the gas phase yield was in a range of 31-57 w/w%, consistent with literature
data [112, 114].
The results from a detailed analysis of the gaseous products formed during the
OLP reforming with HZSM-5 under optimized conditions are listed in Table 12.

85
Table 12. Composition of the gas fraction obtained by catalytic OLP*
reforming**
Coke yield (w/w%)
Liquid yield (w/w%)
Gas yield (w/w%)
Gas concentration
Sample 1
Concentration
5
80
15
(vol %)
Sample 2
Concentration
5
81
14
(vol %)
CO 3.0 2.8
Methane 6.3 6.4
CO2 1.3 1.5
Ethane 0.39 0.28
Ethylene 12 13
Propylene 55 54
Butane 16 16
Butane 2.4 2.1
Pentane 0.62 0.57
Hexane 0.53 0.58
Hydrogen 3.1 2.8
* OLP = Organic Liquid Products
** The reforming reaction conditions were: reaction temperature = 432 ºC, OLP to catalyst ratio = 4.5,
reaction time = 12.5 minutes, silica:alumina ratio = 23.
The observed significant production of CO and CO2 is consistent with
decarboxylation of oxygenated compounds as discussed in the next section. As a less
expected observation, propylene accounted for 54 vol % of gaseous products whereas the
concentrations of C2 hydrocarbons, ethylene and ethane, were low.
This selectivity towards propylene was not expected since the current paradigm is
that ethylene-like zeolite-bound intermediates are essential for reforming, so ethylene
was observed as the predominant gas phase product in earlier studies [112, 114]. This
unexpected result, combined with the low fraction of BTEX among the aromatic products
(as opposed to earlier studies with different feedstocks [112, 122] prompted the detailed
study of the reaction product speciation and homology provided in the next section.

86
Detailed chemical speciation analysis of a sample obtained at optimized reforming
reaction conditions
Table 13 shows the speciation of chemicals comprising both the feedstock and
reformate product associated with the second step reaction.
Table 13. Detailed chemical composition (concentration) of both the original OLP* and liquid reformate
(average of two replicates)**
.
Products
Feedstock
(w/w%)
Reformate
Sample 1
(w/w%)
Reformate
Sample 2
(w/w%)
Reformate Average
(w/w%)
Alkanes 9.8 20 22 21
Alkenes 11.4 0.58 0.61 0.6
Dienes 0.17 1.2 1.4 1.3
Cyclic compounds 3.4 13 14 13
Ketones 0.87 ND***
ND ND
BTEX 0.53 8.7 9.2 8.9
Monoaromatics (non-BTEX) 3.3 37 41 39
Indanes 0.39 5.2 4.6 4.9
Naphthalenes 0.45 6.9 7.7 7.3
Carboxylic (fatty) acids 21.4 ND ND ND
Unidentified & unresolved
Total
45
97
6.1
98
6.9
107
6.5
102.5
* OLP = Organic Liquid Products
** The reforming reaction conditions were 432 ºC, OLP to Catalyst Ratio = 4.5 and reaction time of
12.5 minutes under the silica:alumina ratio = 23
***
ND = not detected, i.e., below the limit of detection
As one can see, several drastic differences occur between the feedstock OLP and
product reformate compositions. The concentrations of aromatics, cyclic hydrocarbons
and alkanes increased in the product at the expense of alkenes, carboxylic acids and
unidentified compounds. Basically, just about anything in the feedstock including
unidentified and unresolved species was converted into either cyclic compounds or n-
alkanes or aromatics. The chemistry of this process will now be analyzed considering one
group of compounds at a time while trying to decipher its fate.

87
Figure 23. Selected ion chromatograms showing the alkane and alkene peaks (common ions 57 and 59) in
A) the reformate and B) the feedstock (Organic Liquid Product)
Figure 23a shows that the distinct peaks of alkenes were identified only in the
feedstock (OLP obtained after the first, non-catalytic cracking step). By contrast, a
similar selected ion chromatogram of the reformate showed only negligible
concentrations of alkenes (Fig. 23b). The reformate featured higher concentrations of
alkanes compared to the feedstock (Fig. 23b). To determine the origin of these alkanes,
the carboxylic acid profile was analyzed.
Carboxylic acids and alkanes
Figure 24 shows distinct carboxylic acid peaks identified only in the feedstock
OLP analysis (Fig. 24A).
5.00 6.00 7.00 8.00 9.00 10.00 11.00 12.00 13.00 0
Time-->
C7 alkenes C8 alkenes
C9 alkenes C10 alkenes C11 alkenes
C12 alkenes
5.00 6.00 7.00 8.00 9.00 10.00 11.00 12.00 13.00 0
Ab
un
dan
ce
e
C7 a
lka
ne
C10 a
lkan
e
alk
an
e
C9 a
lka
ne
alk
an
e
C8 a
lka
ne
alk
an
e
C11 a
lkan
e
alk
an
e
2200000
2200000
1100000
1100000
0
0
B) Feedstock
A) Reformate

88
Figure 24. Selected ion chromatograms showing the carboxylic acid peaks (common ion 60) in
A) the reformate and B) the feedstock (Organic Liquid Product)
Carboxylic acids exhibit broad specific front-tailing peaks due to their polar
nature. By contrast, a similar selected ion chromatogram of the reformate shows only
negligible concentrations of carboxylic acids (Fig. 24B). Combined with the observation
of higher concentrations of n-alkanes in the reformate (Table 13), it can be concluded that
carboxylic acids of OLP are most likely being converted into alkanes by
decarboxylation/decarbonylation.
6.00 8.00 10.00 12.00 14.00 16.00 18.00 0
6.00
8.00 10.00
12.00 14.00
16.00 18.00
0
Time-->
Ab
un
da
nc
e
e
C5 a
cid
C6 a
cid
acid
C7 a
cid
C8 a
cid
acid
C
9 a
cid
C10 a
cid
C11 a
cid
6.00 8.00 10.00 12.00 14.00 16.00 18.00 0
1100000
2200000
2200000
C4 a
cid
1100000
B) Feedstock
A) Reformate

89
0
1
2
3
4
5 6 7 8 9 10 11 12 13 14 15 16 17 18 &
highNumber of carbon atoms
Alk
an
e (
wt
%)
Product
Feedstock
Figure 25. A comparison of alkane homology profiles in the reformate (product) and in the feedstock
(Organic Liquid Product). The average values are provided for the two samples in the product.
Figure 25 depicts the homology profile of alkanes and shows the different fates of
various sized alkanes. The short-chain C5-C6 alkanes are absent from the reformate.
Apparently, they are essentially all reformed into aromatics. Similarly, the large-size C17+
alkanes missing from the reformate were most likely cracked into smaller alkanes, some
of which were then reformed into aromatics by the zeolite. It should be noted that alkanes
of this size do not typically crack under the reaction conditions employed (particularly, at
such a relatively low temperature), suggesting that these reactions were facilitated by the
HZSM-5 catalyst.
By contrast, the mid-size alkanes are more abundant in the reformate than in the
OLP feedstock. Yet, the homology profile of the carboxylic acids in the feedstock does
not match that of the alkanes in the product (Fig. 25). Thus, carboxylic acid
decarboxylation by itself does not account for the observed alkane homology profile,
reinforcing the postulate that C17+ alkanes are cracking in the reactor. Additionally, the

90
decarboxylation of carboxylic acids may be accompanied both by subsequent alkane
reforming (for smaller products) and cracking (for larger products), thus further skewing
the resulting alkane homology profile.
Aromatic and Other Cyclic Hydrocarbons
Figure 26 presents the homology profiles of aromatics and
cyclohexenes/cyclohexanes which comprise the bulk of the other cyclic compounds
present in both the OLP feedstock and reformate associated with the second reaction step.
Figure 26. Aromatic hydrocarbons and cyclohexa(e)nes in the feedstock (Organic Liquid Product) and reformate

91
Aromatics having carbon numbers 15-17 are present in nearly the same amounts
in both the feedstock and product (Fig. 26). Thus, they were not produced during the
second reaction and appear to be generated during the initial non-catalytic cracking step.
To enhance the observed homology profiles, Table 14 lists all of the identified
aromatic hydrocarbon compounds in the reformate.
Table 14. The concentrations of aromatic hydrocarbons in replicate liquid reformate
samples
Aromatic
hydrocarbon Formula
Sample1*
(w/w%)
Sample2*
(w/w%)
Average
(w/w%)
StDev (+/-,
w/w%)
Benzene, C3a C9H12 9.00 9.69 9.34 0.49
Benzene, C3b C9H12 0.67 0.76 0.72 0.06
Benzene, C3x C9H12 2.51 2.76 2.64 0.18
Benzene, C3y
Benzene C3z**
C9H12
C9H12
3.90
0.88
4.23
0.95
4.06
0.92
0.23
0.06
Benzene, C4a C10H14 0.33 0.38 0.36 0.04
Benzene, C4b C10H14 0.52 0.55 0.53 0.03
Benzene, C4c C10H14 0.53 0.59 0.56 0.04
Benzene, C4d C10H14 0.22 0.25 0.23 0.02
Benzene C4e C10H14 0.67 0.66 0.66 0.01
Benzene C4f
Benzene C4x
Benzene C4y
C10H14
C10H14
C10H14
0.68
1.56
3.02
0.66
1.71
3.33
0.67
1.64
3.17
0.02
0.11
0.22
Benzene, C4z C10H14 2.34 2.60 2.47 0.19
Benzene, C5a C11H16 0.80 1.43 1.12 0.44
Benzene, C5b C11H16 0.78 0.86 0.82 0.06
Benzene, C5x
Benzene C5y
Benzene C5z
C11H16
C11H16
C11H16
2.51
0.61
0.08
2.80
0.68
0.10
2.66
0.64
0.09
0.21
0.05
0.01
Benzene, C6a C12H18 0.55 0.63 0.59 0.06
Benzene, C6x
Benzene C6y
C12H18
C12H18
1.47
0.38
1.66
0.41
1.56
0.40
0.13
0.03
Benzene, C7x C13H20 0.61 0.67 0.64 0.04
Benzene, C8x C14H22 0.34 0.33 0.33 0.00
Benzene, C9x C15H24 0.16 0.19 0.17 0.02
Benzene, C10x C16H26 0.05 0.06 0.06 0.01
Benzene, C11a C17H28 0.40 0.43 0.41 0.03
Benzene, C11b C17H28 0.37 0.42 0.39 0.04
Benzene, C11x C17H28 0.07 0.09 0.08 0.01
Benzene C6H6 0.86 0.93 0.89 0.05
Toluene C7H8 2.68 2.88 2.78 0.14
Ethylbenzene C8H10 1.34 1.49 1.42 0.10
p-Xylene C8H10 2.66 2.85 2.76 0.13
o-Xylene C8H10 1.21 1.34 1.28 0.09
Indane C9H10 1.20 1.32 1.26 0.09
Indane, C1a C10H12 1.41 1.53 1.47 0.09

92
Indane, C1 C10H12 1.04 0.06 0.55 0.69
Indane, C1x C10H12 1.18 1.32 1.25 0.10
Indane, C2 C11H14 0.42 0.44 0.43 0.02
Benzene, butyl-***
C10H14 0.68 0.74 0.71 0.04
Benzene, pentyl-***
C11H16 0.53 0.61 0.57 0.05
Benzene, hexyl-***
C12H18 0.21 0.25 0.23 0.03
Benzene, heptyl-***
C13H20 0.23 0.26 0.24 0.02
Benzene, octyl-***
C14H22 0.07 0.09 0.08 0.01
Benzene, nonyl-***
C15H24 0.01 0.02 0.02 0.00
Naphthalene C10H8 1.69 1.88 1.79 0.13
Naphthalene, C1x
Naphthalene, C1y
C11H10
C11H10
1.04
2.14
1.13
2.34
1.09
2.24
0.06
0.10
Naphthalene, ethyl C12H12 0.44 0.49 0.47 0.04
Naphthalene, C2x C12H12 0.66 0.71 0.68 0.04
Naphthalene, C2y C12H12 0.41 0.46 0.43 0.04
Naphthalene, C3x C13H14 0.42 0.49 0.45 0.05
Naphthalene, C3y C13H14 0.14 0.09 0.11 0.04
*
Samples 1 and 2 represent the reformate samples obtained from the replicates of
experiments with conditions of 432 ºC, OCR = 4.5 and reaction time of 12.5 minutes
under the silica:alumina ratio = 23.
**
The number/character (e.g. C4a, C4b, C4x, C4y) represent the isomer profiles for the
given number of carbon atoms in the alkyl groups attached to the aromatic ring.
*** These n-alkylbenzenes are listed separately and not included in the isomer profiles.
fegade
Typewritten Text
Table 14 continued

93
Almost 3/4 of them by weight are the isomers of C3-, C4- and C5-substituted
benzenes. By contrast, the BTEX fraction, i.e., benzene along with the C1- and C2-
substituted benzenes (C6-C8 in Fig. 26 for aromatics), is rather small. This observation
was unexpected as BTEX were the main products of the zeolite-facilitated reactions in
most of the earlier studies regardless of the feedstock [112-114, 122, 123]. The only
exception was a study by Benson et al., 2009 in which the symmetric trimethylbenzene
also showed a large abundance. Perhaps in order for larger-size substrates to be
reformed, such as the alkenes, alkanes and carboxylic acids present in the OLP, the
mechanism of aromatics’ formation has to be re-visited.
This conclusion is echoed by the unexpectedly high concentration of non-
aromatized cyclic compounds recovered in the reformate. The concentration of alicyclic
compounds in the reformate (14 w/w%) was almost 5 times higher than in the OLP
feedstock (3 w/w%). This is an unexpected feature not observed earlier. The majority of
these cyclic compounds were cyclohexanes which, according to the current paradigm,
were expected to be immediately dehydrogenated resulting in benzene ring formation.
Cyclopentanes were also produced in sizable amounts. This feature has not been
observed before for zeolite catalysis. The unusual speciation and homology profiles of
cyclic products warranted further re-visiting of the mechanism of HZSM-5 catalysis.
The literature discusses the mechanisms for HZSM-5 facilitated reactions based
on its pore size of 5.4–5.6 Å [124]. The kinetic diameters [125] of benzene, toluene and
xylenes are of the size between 5.85 Å – 6.8 Å [126]. Thus the current generally
accepted explanation is that after BTEX are produced inside the porous HZSM-5
channels, they desorb out of the zeolite pores and then undergo alkylation on the zeolite

94
surface. This mechanism explains the prevalence of BTEX among the products in earlier
studies conducted with HZSM-5. However, the current study puts this hypothesis into
question. Not only are monoaromatics larger than BTEX in size prevalent in the
reformate, but even diaromatics (indane and naphthalenes) along with alicyclic
hydrocarbons are produced. Perhaps larger-size aromatics are formed at the pore
openings rather than in their depths. If the process is transport limited, this may create the
situation where the near-surface sites at such openings produce the bulk of the cyclic
products.
The formation of larger than BTEX aromatics is consistent with propylene rather
than ethylene being the main gas phase product. This finding indicates that C3 – size
intermediates rather than the earlier postulated C2 are predominant. The observed zeolite
specificity was still size-specific, as the yield of bicyclic aromatic (indanes and
naphthalenes) yield was lower than that of monoaromatics, and the polycyclic aromatics
were virtually absent. The low rate of polycyclics’ formation may be a reason for the low
coke yield observed in this study.
Notably, the predominant cyclohexane size produced was smaller than the
predominant size of aromatics produced. This finding indicates that cyclization and
aromatic hydrocarbon formation may occur on different sites. Just as with larger-size
aromatics, alicyclic hydrocarbons may be formed near the zeolite surface and then desorb
before cyclohexa(e)nes could be reformed to aromatic hydrocarbons.

95
The overall reformate composition
A comparison between the OLP feedstock components and the product reformate
compounds (Table 13) shows the success of the proposed two-step process. The reformed
product is devoid of the chemicals incompatible with fuel as alkenes and carboxylic acids
are virtually removed. Aromatic and alicyclic hydrocarbons comprise the bulk of the
reformate, along with the higher concentration of n-alkanes. This reformate may be used
as a high-octane-number fuel or as a source of valuable cyclic compounds to replace
petrochemicals. Additional aromatics may be formed by converting the main gas-phase
product, propylene, into BTEX [86].
Conclusions
Non-catalytically cracked and purified soybean oil was successfully converted into a
mixture containing high concentrations of aromatic and cyclic hydrocarbons by using
HZSM-5 as a catalyst. A low OCR, high silica:alumina ratio and high temperature in the
reformation reaction step were shown to increase the efficiency of aromatics production
during reforming as well as increased cyclization resulting in the highest concentration of
aromatic and alicyclic hydrocarbons (58 and 13 w/w%, respectively) along with the
lowest yields of coke/solids and non-condensible gases. Alkenes and carboxylic acids
were virtually completely converted in the second reaction step. The speciation and
homology profiles of cyclic products obtained bring into question the current
understanding of aromatics’ formation within the depth of zeolite pores. It appears that
cyclic and aromatic compounds are formed near the zeolite surface but on different sites,
with the varied-size intermediate precursors of cyclic compounds.

96
CHAPTER VI
CONCLUSIONS AND RECOMMENDATIONS
The results of this work showed that lower Silica/Alumina ratio of HZSM-5
yields more aromatics and lower coke. The minimum Silica/Alumina ratio used in this
study was 23. It would be interesting to try synthesizing HZSM-5 with a Silica/Alumina
ratio lower than 23 (preferably lower than 15) and use it for the catalytic conversion step.
In this work, a batch slurry process was used for the second step. Further
experiments in a continuous reactor might show some interesting results. Optimization
experiments in a continuous reactor may alter the coke formation, especially when
atmospheric pressure is used.
The results of this work are promising for the production of bio-based aromatic
compounds from cracked crop oils. This work was mostly focused on the conversion of
OLP. However, the results of an experimental run on tars/heavier liquid compounds
indicate the possibility of future research work on the catalytic conversion of heavies into
aromatic compounds. Response surface methodology could potentially lead to optimum
reaction conditions for catalytic cracking and reforming reactions of heavies and tars.
This work was focused on unused virgin soybean oil conversion. Currently, a
significant portion of used oil is being used in small scale industries for the production of
biodiesel. Most of this used oil comes from food courts, restaurants edible oil and food
industries. It would be worth trying this used oil as a feedstock for the proposed future
research work.

97
APPENDICES
APPENDIX A: PROCEDURES
A1: Procedure for synthesis of nanoscale HZSM-5 catalyst
Table 15. Chemicals and quantities required for nanoscale HZSM-5 synthesis
Total Volume mL 239.3 80 160 240 320
NaOH g 4 1.34 2.67 4.01 5.35
NaAlO2 g 1.64 0.55 1.10 1.64 2.19
Water mL 135 45.13 90.26 135.39 180.53
25wt% silica sol
(0.00499mol/mL) mL 104.3 34.87 69.74 104.61 139.47
30wt% silica sol
(0.00599mol/mL) mL 86.89 29.05 58.09 87.14 116.19
Water mL 17.41 5.82 11.64 17.46 23.28
Total Water mL 152.41 50.95 101.91 152.86 203.81
25wt% silica sol is equivalent to:
1. Weigh out NaOH according to table
2. Weigh out NaAlO2 according to table
3. Measure deionized water according to table
4. Add the NaOH and the NaAlO2 to the de-ionized (DI) water
5. Stir this solution at 300rpm
6. Measure 30wt% silica sol according to table
7. Slowly add the silica sol to the solution while it is spinning
8. Allow this solution to be mixed until homogeneous
9. Divide this solution into 1-4 separate autoclaves
10. Stir the mixture in each autoclave at 300rpm for 5 hours
11. Following the stirring period allow the solution to age in the autoclave for 24
hours

98
12. The autoclave is then closed and place in an oven for 24 hours at 180°C
Washing
13. The contents of each autoclave are then placed in separate centrifuge bottles
14. De-ionized water is then added to fill the bottle ¾ full
15. The bottle is then placed in the centrifuge for 10 minutes
16. The water is then decanted from the solids
17. Steps 14-16 are repeated 3 times.
Ion Exchange
18. Weigh out 5.4 grams of (NH4+)2SO4
2-
19. Measure 40mL DI water
20. Add the solid, DI water, and (NH4+)2SO4
2- to a beaker and stir at 300rpm for 1
hour
Washing
21. The contents of each autoclave are then placed in filtered using vacuum filtration
22. The zeolite is rinsed with DI water until the filtrate is free of sulfate anions as
indicated by adding BaCl2 dropwise and looking for a BaSO4 precipitate
Drying
23. Remove the zeolite from the filter and allow it to air dry
24. Place the zeolite solid in an oven and heat at 500°C for 4 hours.

99
A2: Procedure to operate the autoclave/reactor for catalytic experiments
Catalytic conversion experimental runs were performed by using the procedure
using the following steps.
Steps
1) Measure the required amount / quantity of the catalyst and starting materials.
2) Make sure that the autoclave is cleaned properly by wiping it with clean paper.
3) Add the starting materials into the autoclave reactor.
4) Use the sand paper to clean the upper part / surfaces of the reactor.
5) Apply grease / gel to the surface of reactor before closing it.
6) Close the reactor and tighten the screws. Apply the torques 5 lbs, 15 lbs, and 25
lbs.
7) Cover the autoclave reactor with the heating jacket.
8) Turn the water supply on.
9) Switch on the reactor controller unit. If the red light in ‘on’, then press the black
button inside (at the back of the controller)
10) Make sure that the controller displays temperature (0C), speed (R.P.M) and
pressure (psig)
11) Make sure that all the vent, lines, valves are open except the one on the reactor.
12) Make sure that all the knobs on the reactor are closed.
13) Purging with Nitrogen –
Start the Nitrogen flow by opening the valves on the N2 gas cylinder.

100
Open the knob on the reactor to supply Nitrogen into the reactor. The
pressure on the display will now increase.
When the pressure increases to about 150 psig, close Nitrogen inlet
knob.
Now open the vent slowly and vent off the Nitrogen to make the
pressure to 0 psig.
Repeat this purging twice to make sure that all of the air has been
removed from the reactor.
14) Set the temperature (on the controller) to a desired value. Switch on the
heating button.
15) Switch on the stirrer and increase the stirring speed (RPM) to a desired value.
16) As the temperature increases, the pressure also increases. So monitor the pressure
continuously to keep it below 3500 psig. If the pressure increases to / beyond
3500 psig, immediately shut down the process and vent off the products to reduce
the pressure and to avoid the damage.
17) Note down the reaction start time when the temperature on the controller first hits
the set value of temperature.
Mass Balance
1) Weigh the catalyst and mark this value as A.
2) Weigh the OLP and mark this value as B.
3) Feed the reactor with catalyst and OLP.
4) Close the reactor and apply the required torques on it.
5) Open the nitrogen valve and allow it to flow through the reactor to remove air

101
6) Once the purging is over, close nitrogen valve
7) Close all the inlet and outlet valves of the reactor.
8) Start the water flow for reactor cooling channel and for the condenser.
9) Set the desired temperature and impeller speed values on controller.
10) Start the heating and the stirring of the reaction mixture.
11) Ensure that there is no reactor leak by spraying soapy water on reactor parts.
12) During the experiment, ensure that the reaction pressure doesn’t exceed the limit.
13) Once the reaction is over, cool down the contents inside the reactor to 20 0C
without opening it.
14) Slowly open the vent and collect gaseous products in gas bag (plastic)
15) Weigh empty bottle with top (OR empty beaker).
16) Open the reactor and transfer all of its contents into the above bottle (or a beaker)
and close it
17) Weight the bottle or the beaker having the reactor contents
18) Weight of the contents is the difference in weights of full and empty
bottle/beaker. This is total weight of liquid products, solid products, coke and
catalyst. Mark this value as C
To separate liquids and solids (products, coke, catalyst):
1) Weigh a dry filter paper.
2) Filter the products.
3) Once filtration is over, immediately weigh filter paper with coke on it.
4) The difference in 1 and 3 is weight of catalyst+coke+solids+trapped volatile
materials.

102
5) Weigh the liquid (weight of full vial – weight of empty vial).
6) Dry the filter paper and contents and weigh again.
7) Now 3 – 6 gives weight of volatiles those were trapped in paper, and coke.
8) Now 6 – 1 gives weight of catalyst+coke+solids. Mark this value as D
D - A = weight of coke+solid products. Mark this value as E
C – D = weight of liquid products. Mark this value as F
B – E – F = weight of gaseous products. Mark this value as G
Final calculations:
· Coke and solid products yield = 100*E/B (%W/W)
· Liquid products yield = 100*F/B (%W/W)
· Gaseous products yield = 100*G/B (%W/W).
A3: Procedure for GC sample preparation and analysis
A3.1 Instructions for HP 5890 series II gas chromatograph
How to set the flow rates for the GC:
- Use soap bubble flow meter
- Attach the flow meter to split, purge, column or detector vent.
- Make a proper soap bubble and measure the flow rate by using the electronic display.
This can be done by measuring the time required for the bubble to cover certain volume
range.
- It takes a while to get hold on this, so practice measuring the flow rates several times.

103
- Adjust split vent He gas flow to about 30 mL/min.
- Adjust purge vent (septum) He gas flow to about 3 mL/min.
- Adjust column He gas flow to about 1 mL/min.
- Adjust FID air flow to about 400 mL/min.
- Adjust FID H2 flow to about 30 mL/min.
- Adjust FID He flow to about 35 mL/min
A3.2 Pocedure to start the GC:
1. Start the flows of He (UHP grade), H2, air, and N2 by turning on the main valves of
the gas cylinders. If the main pressure for any tank is less than 100 psi, it should be
replaced.
2. OPEN the He, H2, & air manifold valves (toggle on/off) to the GC (#1, 2, or 3) you
will be using.
3. Note which injector/detector ports have the column installed (A-front or B-back) and
confirm the pressures and flow rates as shown in table on 1st page. Use the manual
bubble meter to verify the flow rates (a stop watch on the instrument for determination is
a convenient tool for the determination). Set flow rates from lowest to highest.
The flow rates are determined by connecting the flow meter to the outlets of detector
(when detector is off and cold), split line, and septum purge.
If the flow rates need to be reset, open completely the total flow control, set the column
head pressure to achieve sufficient flow rate on the column; setup of the flow rate on the
septum purge; Open the makeup gas on the detector; and decrease the flow rate on split
line by the total flow control.

104
4. Turn on the GC main power and set the heated zones to nominal initial temperatures
(oven 35 °C, injector 250 °C, and detector 300 °C).
5. Configure the injector for split operation (set Purge A (or B) ON) and ignite the FID:
a. Through the GC keypad, set DET A (or B) ON, set SIG1 to A (or B), and press SIG1
(twice). This displays the FID signal (in pA), which should be less than 1 pA before
ignition.
b. Use a long-tip butane lighter to ignite flame. When the temperature of the detector
reaches 150 °C, the detector can be ignited. To ignite the FID, turn the HYGROGEN
fully ON, after 2-4 seconds proceed with AIR. Lower the butane flame to the collector
opening, observe the FID signal to see response. Although the ignitor button is disabled,
sometimes pushing it at the moment of igniting with butane lighter helps).
c. If the FID ignites, an audible pop may be heard. The signal will jump above 100 pA
then quickly drop back to between 10 – 20 pA and remain stable to with ± 0.1 pA (you
can use a glossy surface like mirror or spatula to verify there is a flame). Turn the AUX
GAS fully ON, make sure that flame stays lit.
6. Turn ON the integrator. Consult the instruction manual for operational commands.
A3.3 Important notes:
- Hydrogen, aux gas and air knobs must be completely on or off.
- To light FID, only long tip butane lighter must be used.
- Carrier gas flow must always be there while heating the column, otherwise the column
will be damaged.
- The pressure in the tanks of hydrogen, air and helium must be above 100 psi.

105
A3.4 Procedure to make standards for GC analysis (HP 5890 series II)
Make a mixture of benzene, toluene, ethylbenzene, ortho-xylene and paraxylene (BTEX).
Each 200 μL was added in a single vial and the vial was capped. This was 20 % mixture
of BTEX. Then 0.4 % mixture is prepared from this 20 % mixture by dilution. The
detailed procedure is written as follows:
To make 0.4 % solution:
Methylene chloride (CH2Cl2) is used as solvent. 20 μL of above (20 % BTEX) mixture is
added into 980 μL methylene chloride (CH2Cl2). The syringes of 10 μL, 100 μL and 1000
μL (1 ml) were used for the perfect measurement of the volume. This mixture was
prepared in a vial and once both solutions were added into a vial, the vial was capped
immediately. This capped vial was then shaken well using the vortex.
Thus 0.4 % solution was prepared.
To make 0.04 % solution:
In a vial 100 μL of above mixture (0.4 %) was taken and it was diluted with 900 μL of
methylene chloride (CH2Cl2) _ diluted 10 times. The vial was capped and shaken with the
vortex.
To make 0.004 % solution:
In a vial 100 μL of above mixture (0.4 %) was taken and it was diluted with 900 μL of
methylene chloride (CH2Cl2) _ diluted 10 times. The vial was capped and shaken with the

106
vortex. Similarly 0.0004 % and 0.00004 % solution were prepared using 10 times dilution
each time.
Internal Standards
2 – chlorotoluene was chosen as the internal standards.
2 – chlorotoluene was diluted to make 0.5 % solution with methylene chloride (CH2Cl2).
To make this solution, 20 μL of 2 – chlorotoluene was mixed with 3.980 ml (3980 μL) of
methylene chloride (CH2Cl2) in a vial. This was capped and mixed on vortex. Then 100
μL of this 0.5 % of 2 – chlorotoluene (Internal standards = IS) was added into each of the
diluted BTEX mixture solutions. The final vials were labeled and stored in the fridge.
A3.5 Protocol for standards and samples preparation for GC-MS
Preparing internal standards :
provide weights below
concentration of IS
1- take a 22 mL vial g mg/mL
2- weight the empty vial
3- add 200 µL of CT= 2-chlorotoluene
4- weight the vial
5- add 20 mL of MeOH
6- weight the vial

107
The IS is ready to use now
- Preparing the Standards for calibration Curve
To make 5% solution of B, T, E, O-X, P-X and dilute it 10 times:
Standard # 1: mg µL density g/mL mg/mL
1 weight the empty vial
2 add naphthalene 10 5
3 weight the vial
4 add anthracene 10 5
5 weight the vial
6 add p-xylene 90
7 weight the vial
8 add o-xylene 90
9 weight the vial
10 add ethyl benzene 90
11 weight the vial
12 add toluene 90
13 weight the vial
14 add benzene 90
15 weight the vial
16 add MeOH 1550 0.7916
total volume 2000
The above mentioned standard is further diluted 10x .
Standard # 2: in empty autosampler vial 900 µL above + 900 µL MeOH

108
Standard # 2: in empty autosampler vial 900 µL St#1 + 900 µL MeOH
Standard # 3: in empty autosampler vial 900 µL St#2+ 900 µL MeOH
Standard # 4: in empty autosampler vial 900 µL St#3+ 900 µL MeOH and so on
Preparing samples :
1- Weight a vial
2- Add 800 micro Liters of MeOH
3- Weight the vial
4- Add 100 micro liters of IS
5- Weight the vial
6- Add 100 micro liters of sample
7- Weight the vial
8- Cap the vial
A 4: Procedure for aromatization of propylene
1. Weigh 0.1g of “quartz support” by using a digital balance.
2. Weigh 1g or 0.2g of catalyst (β-zeolite or HZSM5) by using a digital balance.
3. Put a half of the quartz support in the reactor, put the catalyst and the rest of the
quartz support on it, making a fixed bed of catalyst
4. Assemble the reactor, turn on the thermo couple and adjust temperature of 400℃
or 500℃.
5. Open the valve of Nitrogen gas tank as carrier gas and adjust the mass flow
controller of the carrier gas to over 100 for purging the reactor.

109
6. Open the valves of Hydrogen and Nitrogen gas tank, turn on the GC and check if
the actual values of the gases are same as the set points on GC.
(set point: Carrier gas 1 = 12 or 13; Hydrogen 1= 25; Air = 4)
7. Push the “Flame Ignite” button on the GC and check the steam from the GC to
confirm that the flame is ignited. (Note: If no peak is detected, it means that you
need to ignite the flame.)
8. Adjust the detector to Medium or High or High (Filtered) as required.
9. Turn on the computer and open the software named “Peaksimple 378”.
10. Click [Edit] →[Channel]→[Postrun], then rename the file name and tick the
Auto-increment check box.
(e.g. SLF19May(2010).CHR)
11. Click [Edit] →[Channel]→[Event]. Load the file named “C:/peak372-
1/peak372/Ch1.evt”.

110
12. Press the spacebar or click [Acquisition]→[Run] for the “blank run” to check if
there is the propylene peak detected or not.
13. Open Microsoft Excel and input the data in the form as shown below.

111
14. When the temperature of the thermocouple reaches 400 °C or 500 °C, open the
valve of propylene gas tank and record the time. (e.g. Propylene started 11h35)
15. 1) Adjust the mass flows of Propylene (Process gas) and Nitrogen (Carrier gas) to
the value of 11 and 45 respectively on the mass flow controller if the
Concentration of the Propylene is 8.9%.
2) Adjust the mass flows of Propylene (Process gas) and Nitrogen (Carrier gas) to
the value of 11 and 31 respectively on the mass flow controller if the
Concentration of the Propylene is 12.5%.
16. Stop the “blank run” by clicking [Acquisition]→[Stop]. (Note: If you click
[Stop+Postrun], the file is saved on your computer. However, if you click [Stop],
the file is not saved.)
17. In order to start the first run, wait at least for 30 minutes since after starting
propylene flow because the whole system reaches steady-state after 30 minutes
from the opening the valve of propylene gas tank.)
18. When the temperature of the GC is at the room temperature (33 °C), start the run.
Every run takes about 33minutes and after that, click
[Acquisition]→[Stop+Postrun]. During the run the temperature reaches 219°C,
then it takes about 15 minutes to cool down from 219°C. Totally, it takes about 50
minutes for one run.
19. Click [Edit]→[Manual Integration], to adjust the baseline of the peaks.

112
20. Run the GC until 400 minutes of the reaction time is completed. It is necessary to
run the aromatization at least for 200 minutes in each and every set of the runs.
21. Prepare the chart as shown above.
22. After 3 minutes since you start the last run, you can hear the beep sound. Then,
turn off the thermocouple, close the valve of Propylene gas tank and adjust the

113
value of Nitrogen (Carrier gas) on mass flow controller to over 100 for cleaning
the whole system.
23. When the temperature of the GC is at 33℃, close the valve of Nitrogen gas tank,
then also, close the valves of Hydrogen and Nitrogen gas tanks.
24. Turn off the computer and GC.
25. On the paper, collect the previous catalyst and 0.1g of quartz support inside the
reactor.
26. By using about 0.005g of quartz support, get rid of the catalyst inside the reactor
and put it on the paper.
27. Weigh all the things you collect. (Catalyst, 0.1g of quartz support, 0.05g of quartz
support, and one paper)
28. Calculate the mass of coke on the catalyst.
Events ([Edit] →[Channel]→[Event])
c:/peak372-1/peak372/Ch1.evt
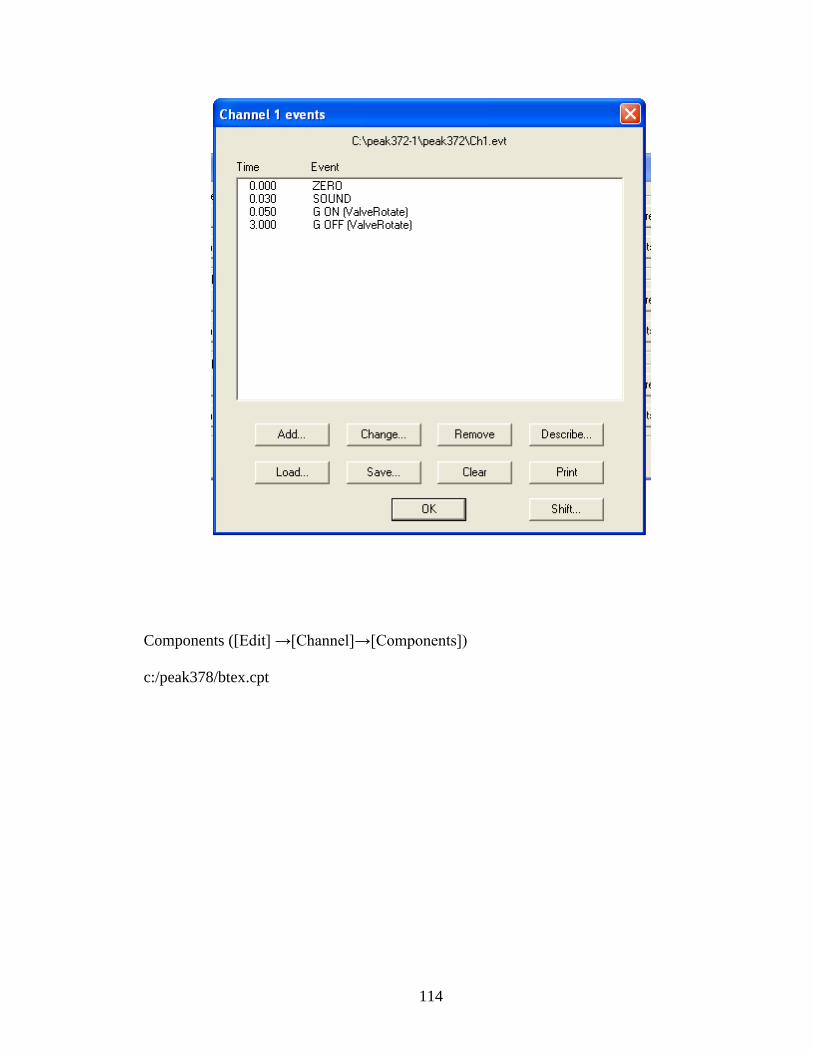
114
Components ([Edit] →[Channel]→[Components])
c:/peak378/btex.cpt

115
Table 16. GC Calibration components and the residence times
Peak Name Start End Calibration
1 CO 0.720 1.000 methane.cal
2 Methane 0.880 1.340 methane.cal
3 CO2 2.716 3.216 methane.cal
4 Ethane 3.880 4.380 methane.cal
5 Ethylene 4.340 4.840 methane.cal
6 Propane 6.320 6.414 methane.cal
7 Propylene 6.450 7.080 methane.cal
0 Methanol 7.280 7.780

116
8 Butane 7.816 8.216 methane.cal
9 Butane 8.050 8.500 methane.cal
10 Pentane 9.980 10.480 methane.cal
11 Benzene 12.500 13.500 methane.cal
0 Heptane 14.240 14.840
13 Toluene 17.000 19.000 methane.cal
15 p-xylene 26.000 28.500 methane.cal
17 o-xylene 29.000 32.000 methane.cal
Temperature ([Edit] →[Channel]→[Temperature])
c:/peak372-1/peak372/gasbtexhaeysep.tem

117
A 5: Procedure for non-catalytic cracking of crop oil
The non-catalytic cracking of soybean oil was conducted in a continuous reactor
applying the following steps.
1) Soybean oil was stored in the oil tank.
2) The reactor was preheated to the desired temperature by using the heating
jackets attached to all zones of the reactor (upper, middle, bottom).
3) The feed oil was passed through a filter to remove solids and other particles
from the feed oil.
4) The oil was pumped through the preheater to heat the oil to about 150 0C.
5) The preheated oil was continuously pumped into the reactor from its bottom
and stirred continuously and heated to about 420 0C where it was cracked into
smaller molecules.
6) The level of oil was maintained in the reactor throughout the experimental
run, in such a way that only cracked molecules present in vapor form come
out of the upper part of the reactor.
7) Thus the crackate, boiling only below 420 0C, was continuously passed
through the condenser and the condensed liquid products were stored into a
storage tank.
8) This liquid crackate was again distilled at 300 0C and used for further
aromatization experiments.

118
9) The reaction pressure of 50 psig was kept constant throughout the experiment.
Once the non-catalytic cracking reaction was over, the reactor was cooled
down to the room temperature.
10) The tars were taken out from the bottom of the reactor.
11) The coke deposited on the reactor walls and stirrer, was scraped off by using
an iron scraper and the reactor was cleaned properly with acetone, if needed.
12) The gases were taken out through a gas vent.
A 6: Procedure of obtaining SEM images of zeolite catalyst samples
The instrument details of Hitachi SU 8010 SEM (scanning electron microscope)
are shown in the following figure 27.
Figure 27. SEM instrument diagram and important components.

119
1) To obtain proper separation of zeolite particles, add a small quantity of zeolite in
methanol and use ultrasonic instrument until the aggregation of particles
disappears.
2) Add the dispersed particles in solution as a drop on a sample holder and let it dry
for about 5 minutes.
3) Load the sample into the sample chamber.
4) Turn on the electron gun and choose an initial voltage, for example 10 kV, and try
to get a clear image of the sample under low magnification by manipulating the
coarse and fine focus knobs.
5) If a clear image can not be obtained, then change the voltage and continue to
adjust the focus until the sample will be clearly visible.
6) First, observe the sample under low magnification, and then switch it to the high
magnification. Observe the focusing process.
7) Take the desired number of images of the samples at the desired voltage and at
the required magnification.
The section view of SU801O SEM column is as follows:

120
Figure 28. SEM column diagram
NOTE: Basic working parameters such as signal mode (secondary electron or
backscattered electron), accelerating voltage, working distance, and magnification times,
should be adjusted as needed.

121
APPENDIX B: RAW DATA OF STATISTICAL ANALYSIS
B1: Raw DOE Minitab data for OLP aromatization
Response Surface Regression: BTEX yield versus Block, Temperature , OCR, ...
The analysis was done using coded units.
Estimated Regression Coefficients for BTEX yield
Term Coef SE Coef T P
Constant 1.98627 0.11762 16.888 0.000
Block -0.06006 0.06559 -0.916 0.384
Temperature (°C) 0.50123 0.07871 6.368 0.000
OCR -0.23073 0.07871 -2.931 0.017
Time (min.) 0.11545 0.07871 1.467 0.177
Temperature (°C)*Temperature (°C) 0.26372 0.07909 3.335 0.009
OCR*OCR 0.03093 0.07909 0.391 0.705
Time (min.)*Time (min.) -0.03419 0.07909 -0.432 0.676
Temperature (°C)*OCR -0.19895 0.10161 -1.958 0.082
Temperature (°C)*Time (min.) 0.08970 0.10161 0.883 0.400
OCR*Time (min.) -0.17686 0.10161 -1.741 0.116
S = 0.287408 PRESS = 8.11649
R-Sq = 88.80% R-Sq(pred) = 0.00% R-Sq(adj) = 76.36%
Analysis of Variance for BTEX yield
Source DF Seq SS Adj SS Adj MS F
Blocks 1 0.06925 0.06925 0.06925 0.84
Regression 9 5.82759 5.82759 0.64751 7.84
Linear 3 4.23727 4.23727 1.41242 17.10
Temperature (°C) 1 3.34976 3.34976 3.34976 40.55
OCR 1 0.70981 0.70981 0.70981 8.59

122
Time (min.) 1 0.17770 0.17770 0.17770 2.15
Square 3 0.95908 0.95908 0.31969 3.87
Temperature (°C)*Temperature (°C) 1 0.92886 0.91850 0.91850 11.12
OCR*OCR 1 0.01478 0.01263 0.01263 0.15
Time (min.)*Time (min.) 1 0.01543 0.01543 0.01543 0.19
Interaction 3 0.63123 0.63123 0.21041 2.55
Temperature (°C)*OCR 1 0.31663 0.31663 0.31663 3.83
Temperature (°C)*Time (min.) 1 0.06436 0.06436 0.06436 0.78
OCR*Time (min.) 1 0.25024 0.25024 0.25024 3.03
Residual Error 9 0.74343 0.74343 0.08260
Lack-of-Fit 5 0.73628 0.73628 0.14726 82.35
Pure Error 4 0.00715 0.00715 0.00179
Total 19 6.64027
Source P
Blocks 0.384
Regression 0.003
Linear 0.000
Temperature (°C) 0.000
OCR 0.017
Time (min.) 0.177
Square 0.050
Temperature (°C)*Temperature (°C) 0.009
OCR*OCR 0.705
Time (min.)*Time (min.) 0.676
Interaction 0.121
Temperature (°C)*OCR 0.082
Temperature (°C)*Time (min.) 0.400
OCR*Time (min.) 0.116
Residual Error
Lack-of-Fit 0.000

123
Pure Error
Total
BTEX
Obs StdOrder yield Fit SE Fit Residual St Resid
1 10 1.925 1.926 0.128 -0.002 -0.01
2 6 3.793 3.500 0.243 0.294 1.90
3 5 1.933 1.920 0.243 0.013 0.09
4 7 1.749 1.503 0.243 0.247 1.60
5 12 1.980 1.926 0.128 0.054 0.21
6 8 1.986 2.287 0.243 -0.301 -1.95
7 2 2.458 2.736 0.243 -0.277 -1.80
8 1 1.785 1.515 0.243 0.270 1.75
9 11 1.994 1.926 0.128 0.067 0.26
10 3 1.481 1.805 0.243 -0.324 -2.10 R
11 4 2.186 2.230 0.243 -0.044 -0.29
12 9 1.929 1.926 0.128 0.003 0.01
13 18 1.974 2.144 0.235 -0.170 -1.03
14 15 2.307 2.506 0.235 -0.198 -1.20
15 20 2.019 2.046 0.141 -0.027 -0.11
16 13 1.791 1.931 0.235 -0.141 -0.85
17 16 1.996 1.752 0.235 0.244 1.48
18 14 3.755 3.568 0.235 0.187 1.13
19 19 1.936 2.046 0.141 -0.111 -0.44
20 17 1.982 1.767 0.235 0.215 1.31
R denotes an observation with a large standardized residual.
Estimated Regression Coefficients for BTEX yield using data in uncoded units
Term Coef
Constant 8.38721

124
Block -0.0600577
Temperature (°C) -0.0558654
OCR 0.321635
Time (min.) 0.0117202
Temperature (°C)*Temperature (°C) 0.000105489
OCR*OCR 0.00193314
Time (min.)*Time (min.) -6.07754E-04
Temperature (°C)*OCR -9.94727E-04
Temperature (°C)*Time (min.) 0.000239187
OCR*Time (min.) -0.00589537
Response Surface Regression: BTEX yield versus Temperature , OCR, Time (min.)
The analysis was done using coded units.
Estimated Regression Coefficients for BTEX yield
Term Coef SE Coef T P
Constant 1.94821 0.09561 20.376 0.000
Temperature (°C) 0.50123 0.07514 6.670 0.000
OCR -0.23073 0.07514 -3.071 0.011
Time (min.) 0.11545 0.07514 1.536 0.153
Temperature (°C)*Temperature (°C) 0.26616 0.07531 3.534 0.005
OCR*OCR 0.03337 0.07531 0.443 0.666
Temperature (°C)*OCR -0.19895 0.09701 -2.051 0.065
Temperature (°C)*Time (min.) 0.08970 0.09701 0.925 0.375
OCR*Time (min.) -0.17686 0.09701 -1.823 0.096
S = 0.274378 PRESS = 6.17448
R-Sq = 87.53% R-Sq(pred) = 7.01% R-Sq(adj) = 78.46%
Analysis of Variance for BTEX yield

125
Source DF Seq SS Adj SS Adj MS F
Regression 8 5.81216 5.81216 0.72652 9.65
Linear 3 4.23727 4.23727 1.41242 18.76
Temperature (°C) 1 3.34976 3.34976 3.34976 44.50
OCR 1 0.70981 0.70981 0.70981 9.43
Time (min.) 1 0.17770 0.17770 0.17770 2.36
Square 2 0.94365 0.94365 0.47182 6.27
Temperature (°C)*Temperature (°C) 1 0.92886 0.94039 0.94039 12.49
OCR*OCR 1 0.01478 0.01478 0.01478 0.20
Interaction 3 0.63123 0.63123 0.21041 2.79
Temperature (°C)*OCR 1 0.31663 0.31663 0.31663 4.21
Temperature (°C)*Time (min.) 1 0.06436 0.06436 0.06436 0.85
OCR*Time (min.) 1 0.25024 0.25024 0.25024 3.32
Residual Error 11 0.82811 0.82811 0.07528
Lack-of-Fit 6 0.82040 0.82040 0.13673 88.59
Pure Error 5 0.00772 0.00772 0.00154
Total 19 6.64027
Source P
Regression 0.001
Linear 0.000
Temperature (°C) 0.000
OCR 0.011
Time (min.) 0.153
Square 0.015
Temperature (°C)*Temperature (°C) 0.005
OCR*OCR 0.666
Interaction 0.090
Temperature (°C)*OCR 0.065
Temperature (°C)*Time (min.) 0.375
OCR*Time (min.) 0.096

126
Residual Error
Lack-of-Fit 0.000
Pure Error
Total
BTEX
Obs StdOrder yield Fit SE Fit Residual St Resid
1 10 1.925 1.948 0.096 -0.024 -0.09
2 6 3.793 3.561 0.224 0.233 1.47
3 5 1.933 1.981 0.224 -0.048 -0.30
4 7 1.749 1.564 0.224 0.186 1.17
5 12 1.980 1.948 0.096 0.032 0.12
6 8 1.986 2.348 0.224 -0.362 -2.29 R
7 2 2.458 2.797 0.224 -0.338 -2.14 R
8 1 1.785 1.576 0.224 0.209 1.32
9 11 1.994 1.948 0.096 0.045 0.18
10 3 1.481 1.866 0.224 -0.385 -2.44 R
11 4 2.186 2.291 0.224 -0.105 -0.66
12 9 1.929 1.948 0.096 -0.019 -0.07
13 18 1.974 2.137 0.156 -0.163 -0.72
14 15 2.307 2.414 0.207 -0.107 -0.59
15 20 2.019 1.948 0.096 0.071 0.28
16 13 1.791 1.839 0.207 -0.049 -0.27
17 16 1.996 1.660 0.207 0.336 1.87
18 14 3.755 3.476 0.207 0.278 1.55
19 19 1.936 1.948 0.096 -0.012 -0.05
20 17 1.982 1.760 0.156 0.222 0.98
R denotes an observation with a large standardized residual.
Estimated Regression Coefficients for BTEX yield using data in uncoded units

127
Term Coef
Constant 8.58226
Temperature (°C) -0.0565492
OCR 0.318277
Time (min.) -0.00347368
Temperature (°C)*Temperature (°C) 0.000106466
OCR*OCR 0.00208578
Temperature (°C)*OCR -9.94727E-04
Temperature (°C)*Time (min.) 0.000239187
OCR*Time (min.) -0.00589537
Response Surface Regression: BTEX yield versus Temperature , OCR, Time (min.)
Estimated Regression Coefficients for BTEX yield
Term Coef SE Coef T P
Constant 1.97195 0.07651 25.774 0.000
Temperature (°C) 0.50123 0.07258 6.906 0.000
OCR -0.23073 0.07258 -3.179 0.008
Time (min.) 0.11545 0.07258 1.591 0.138
Temperature (°C)*Temperature (°C) 0.26394 0.07258 3.636 0.003
Temperature (°C)*OCR -0.19895 0.09370 -2.123 0.055
Temperature (°C)*Time (min.) 0.08970 0.09370 0.957 0.357
OCR*Time (min.) -0.17686 0.09370 -1.887 0.084
S = 0.265031 PRESS = 5.33200
R-Sq = 87.31% R-Sq(pred) = 19.70% R-Sq(adj) = 79.90%
Analysis of Variance for BTEX yield
Source DF Seq SS Adj SS Adj MS F

128
Regression 7 5.79737 5.79737 0.82820 11.79
Linear 3 4.23727 4.23727 1.41242 20.11
Temperature (°C) 1 3.34976 3.34976 3.34976 47.69
OCR 1 0.70981 0.70981 0.70981 10.11
Time (min.) 1 0.17770 0.17770 0.17770 2.53
Square 1 0.92886 0.92886 0.92886 13.22
Temperature (°C)*Temperature (°C) 1 0.92886 0.92886 0.92886 13.22
Interaction 3 0.63123 0.63123 0.21041 3.00
Temperature (°C)*OCR 1 0.31663 0.31663 0.31663 4.51
Temperature (°C)*Time (min.) 1 0.06436 0.06436 0.06436 0.92
OCR*Time (min.) 1 0.25024 0.25024 0.25024 3.56
Residual Error 12 0.84290 0.84290 0.07024
Lack-of-Fit 7 0.83518 0.83518 0.11931 77.30
Pure Error 5 0.00772 0.00772 0.00154
Total 19 6.64027
Source P
Regression 0.000
Linear 0.000
Temperature (°C) 0.000
OCR 0.008
Time (min.) 0.138
Square 0.003
Temperature (°C)*Temperature (°C) 0.003
Interaction 0.073
Temperature (°C)*OCR 0.055
Temperature (°C)*Time (min.) 0.357
OCR*Time (min.) 0.084
Residual Error
Lack-of-Fit 0.000
Pure Error

129
Total
BTEX
Obs StdOrder yield Fit SE Fit Residual St Resid
1 10 1.925 1.972 0.077 -0.047 -0.19
2 6 3.793 3.549 0.215 0.244 1.58
3 5 1.933 1.969 0.215 -0.036 -0.23
4 7 1.749 1.552 0.215 0.197 1.27
5 12 1.980 1.972 0.077 0.008 0.03
6 8 1.986 2.336 0.215 -0.350 -2.26 R
7 2 2.458 2.785 0.215 -0.326 -2.11 R
8 1 1.785 1.564 0.215 0.221 1.43
9 11 1.994 1.972 0.077 0.022 0.09
10 3 1.481 1.854 0.215 -0.373 -2.41 R
11 4 2.186 2.279 0.215 -0.093 -0.60
12 9 1.929 1.972 0.077 -0.043 -0.17
13 18 1.974 2.160 0.141 -0.186 -0.83
14 15 2.307 2.349 0.141 -0.041 -0.18
15 20 2.019 1.972 0.077 0.047 0.19
16 13 1.791 1.857 0.197 -0.067 -0.38
17 16 1.996 1.595 0.141 0.401 1.79
18 14 3.755 3.494 0.197 0.260 1.46
19 19 1.936 1.972 0.077 -0.036 -0.14
20 17 1.982 1.783 0.141 0.199 0.89
R denotes an observation with a large standardized residual.
Estimated Regression Coefficients for BTEX yield using data in uncoded units
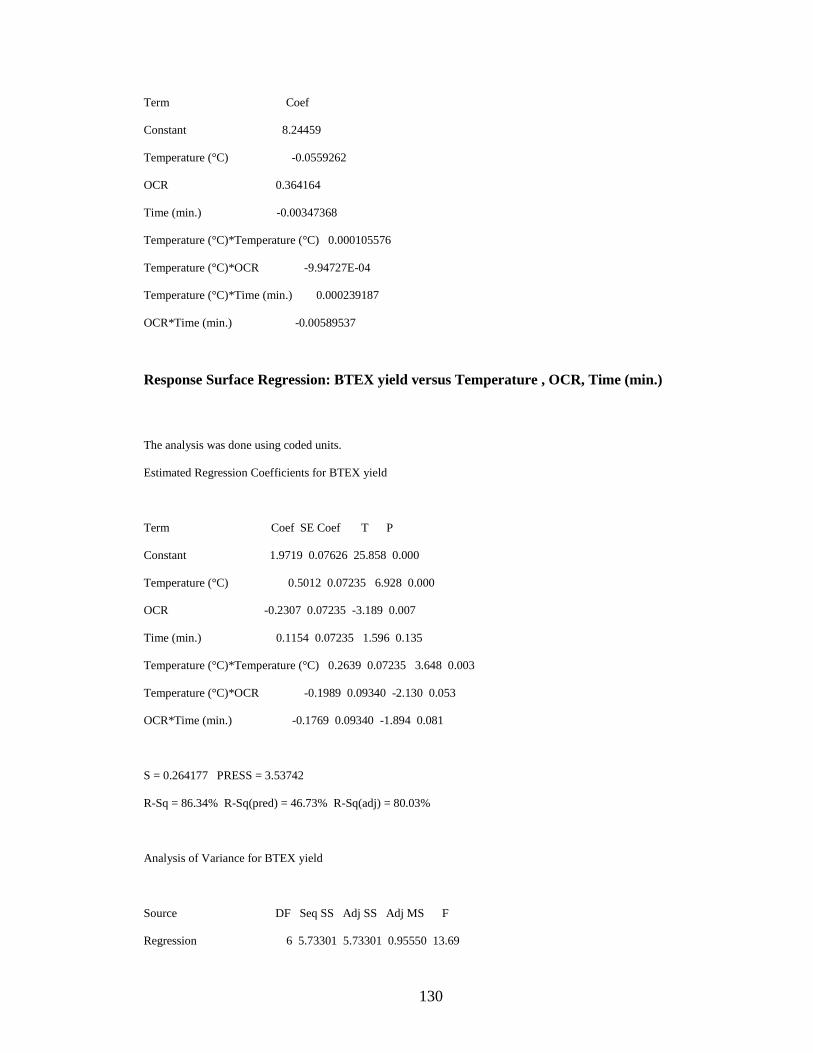
130
Term Coef
Constant 8.24459
Temperature (°C) -0.0559262
OCR 0.364164
Time (min.) -0.00347368
Temperature (°C)*Temperature (°C) 0.000105576
Temperature (°C)*OCR -9.94727E-04
Temperature (°C)*Time (min.) 0.000239187
OCR*Time (min.) -0.00589537
Response Surface Regression: BTEX yield versus Temperature , OCR, Time (min.)
The analysis was done using coded units.
Estimated Regression Coefficients for BTEX yield
Term Coef SE Coef T P
Constant 1.9719 0.07626 25.858 0.000
Temperature (°C) 0.5012 0.07235 6.928 0.000
OCR -0.2307 0.07235 -3.189 0.007
Time (min.) 0.1154 0.07235 1.596 0.135
Temperature (°C)*Temperature (°C) 0.2639 0.07235 3.648 0.003
Temperature (°C)*OCR -0.1989 0.09340 -2.130 0.053
OCR*Time (min.) -0.1769 0.09340 -1.894 0.081
S = 0.264177 PRESS = 3.53742
R-Sq = 86.34% R-Sq(pred) = 46.73% R-Sq(adj) = 80.03%
Analysis of Variance for BTEX yield
Source DF Seq SS Adj SS Adj MS F
Regression 6 5.73301 5.73301 0.95550 13.69

131
Linear 3 4.23727 4.23727 1.41242 20.24
Temperature (°C) 1 3.34976 3.34976 3.34976 48.00
OCR 1 0.70981 0.70981 0.70981 10.17
Time (min.) 1 0.17770 0.17770 0.17770 2.55
Square 1 0.92886 0.92886 0.92886 13.31
Temperature (°C)*Temperature (°C) 1 0.92886 0.92886 0.92886 13.31
Interaction 2 0.56687 0.56687 0.28344 4.06
Temperature (°C)*OCR 1 0.31663 0.31663 0.31663 4.54
OCR*Time (min.) 1 0.25024 0.25024 0.25024 3.59
Residual Error 13 0.90726 0.90726 0.06979
Lack-of-Fit 8 0.89954 0.89954 0.11244 72.85
Pure Error 5 0.00772 0.00772 0.00154
Total 19 6.64027
Source P
Regression 0.000
Linear 0.000
Temperature (°C) 0.000
OCR 0.007
Time (min.) 0.135
Square 0.003
Temperature (°C)*Temperature (°C) 0.003
Interaction 0.043
Temperature (°C)*OCR 0.053
OCR*Time (min.) 0.081
Residual Error
Lack-of-Fit 0.000
Pure Error
Total
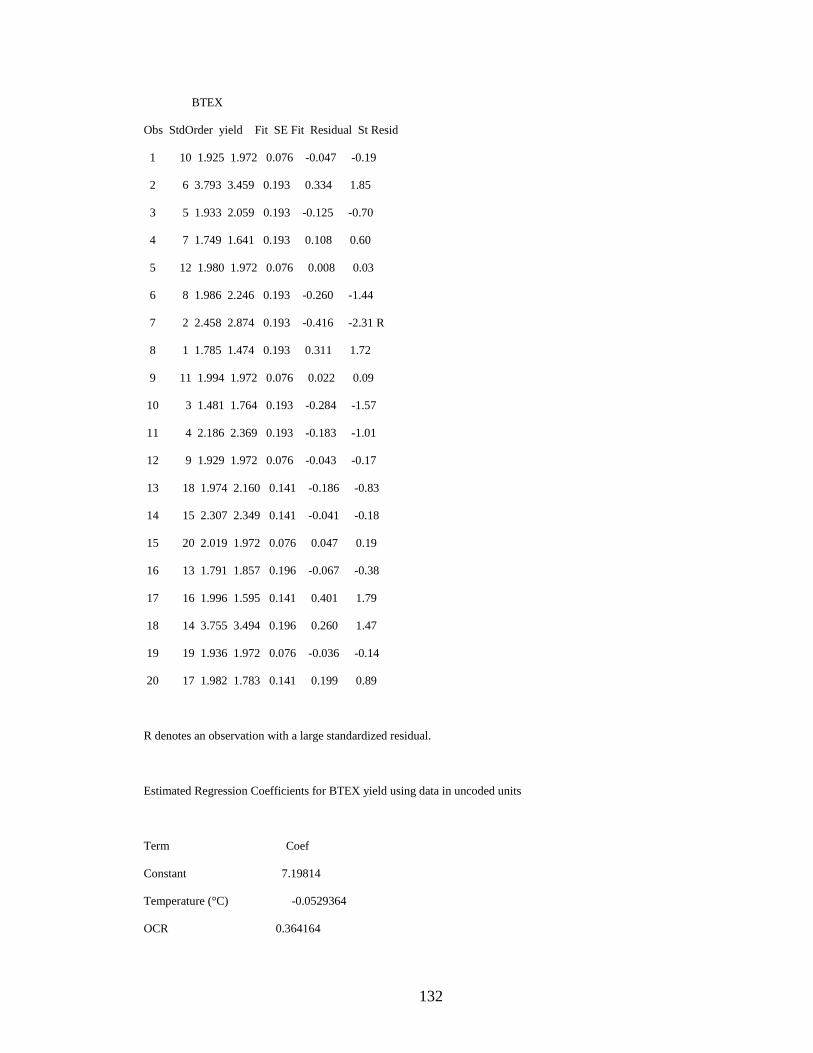
132
BTEX
Obs StdOrder yield Fit SE Fit Residual St Resid
1 10 1.925 1.972 0.076 -0.047 -0.19
2 6 3.793 3.459 0.193 0.334 1.85
3 5 1.933 2.059 0.193 -0.125 -0.70
4 7 1.749 1.641 0.193 0.108 0.60
5 12 1.980 1.972 0.076 0.008 0.03
6 8 1.986 2.246 0.193 -0.260 -1.44
7 2 2.458 2.874 0.193 -0.416 -2.31 R
8 1 1.785 1.474 0.193 0.311 1.72
9 11 1.994 1.972 0.076 0.022 0.09
10 3 1.481 1.764 0.193 -0.284 -1.57
11 4 2.186 2.369 0.193 -0.183 -1.01
12 9 1.929 1.972 0.076 -0.043 -0.17
13 18 1.974 2.160 0.141 -0.186 -0.83
14 15 2.307 2.349 0.141 -0.041 -0.18
15 20 2.019 1.972 0.076 0.047 0.19
16 13 1.791 1.857 0.196 -0.067 -0.38
17 16 1.996 1.595 0.141 0.401 1.79
18 14 3.755 3.494 0.196 0.260 1.47
19 19 1.936 1.972 0.076 -0.036 -0.14
20 17 1.982 1.783 0.141 0.199 0.89
R denotes an observation with a large standardized residual.
Estimated Regression Coefficients for BTEX yield using data in uncoded units
Term Coef
Constant 7.19814
Temperature (°C) -0.0529364
OCR 0.364164

133
Time (min.) 0.0802418
Temperature (°C)*Temperature (°C) 0.000105576
Temperature (°C)*OCR -9.94727E-04
OCR*Time (min.) -0.00589537
Response Surface Regression: BTEX yield versus Temperature , OCR, Time (min.)
Estimated Regression Coefficients for BTEX yield
Term Coef SE Coef T P
Constant 1.9719 0.08301 23.757 0.000
Temperature (°C) 0.5012 0.07875 6.365 0.000
OCR -0.2307 0.07875 -2.930 0.011
Time (min.) 0.1154 0.07875 1.466 0.165
Temperature (°C)*Temperature (°C) 0.2639 0.07875 3.352 0.005
Temperature (°C)*OCR -0.1989 0.10166 -1.957 0.071
S = 0.287539 PRESS = 3.22801
R-Sq = 82.57% R-Sq(pred) = 51.39% R-Sq(adj) = 76.34%
Analysis of Variance for BTEX yield
Source DF Seq SS Adj SS Adj MS F
Regression 5 5.48277 5.48277 1.09655 13.26
Linear 3 4.23727 4.23727 1.41242 17.08
Temperature (°C) 1 3.34976 3.34976 3.34976 40.52
OCR 1 0.70981 0.70981 0.70981 8.59
Time (min.) 1 0.17770 0.17770 0.17770 2.15
Square 1 0.92886 0.92886 0.92886 11.23
Temperature (°C)*Temperature (°C) 1 0.92886 0.92886 0.92886 11.23
Interaction 1 0.31663 0.31663 0.31663 3.83
Temperature (°C)*OCR 1 0.31663 0.31663 0.31663 3.83

134
Residual Error 14 1.15750 1.15750 0.08268
Lack-of-Fit 9 1.14978 1.14978 0.12775 82.77
Pure Error 5 0.00772 0.00772 0.00154
Total 19 6.64027
Source P
Regression 0.000
Linear 0.000
Temperature (°C) 0.000
OCR 0.011
Time (min.) 0.165
Square 0.005
Temperature (°C)*Temperature (°C) 0.005
Interaction 0.071
Temperature (°C)*OCR 0.071
Residual Error
Lack-of-Fit 0.000
Pure Error
Total
BTEX
Obs StdOrder yield Fit SE Fit Residual St Resid
1 10 1.925 1.972 0.083 -0.047 -0.17
2 6 3.793 3.282 0.184 0.511 2.31 R
3 5 1.933 1.882 0.184 0.051 0.23
4 7 1.749 1.818 0.184 -0.069 -0.31
5 12 1.980 1.972 0.083 0.008 0.03
6 8 1.986 2.423 0.184 -0.437 -1.98
7 2 2.458 3.051 0.184 -0.593 -2.68 R
8 1 1.785 1.651 0.184 0.134 0.60

135
9 11 1.994 1.972 0.083 0.022 0.08
10 3 1.481 1.587 0.184 -0.107 -0.48
11 4 2.186 2.192 0.184 -0.006 -0.03
12 9 1.929 1.972 0.083 -0.043 -0.15
13 18 1.974 2.160 0.153 -0.186 -0.77
14 15 2.307 2.349 0.153 -0.041 -0.17
15 20 2.019 1.972 0.083 0.047 0.17
16 13 1.791 1.857 0.213 -0.067 -0.35
17 16 1.996 1.595 0.153 0.401 1.65
18 14 3.755 3.494 0.213 0.260 1.35
19 19 1.936 1.972 0.083 -0.036 -0.13
20 17 1.982 1.783 0.153 0.199 0.82
R denotes an observation with a large standardized residual.
Estimated Regression Coefficients for BTEX yield using data in uncoded units
Term Coef
Constant 8.00876
Temperature (°C) -0.0529364
OCR 0.290472
Time (min.) 0.0153927
Temperature (°C)*Temperature (°C) 0.000105576
Temperature (°C)*OCR -9.94727E-04
Response Surface Regression: BTEX yield versus Temperature (°C), OCR
Estimated Regression Coefficients for BTEX yield
Term Coef SE Coef T P
Constant 1.9719 0.08613 22.896 0.000
Temperature (°C) 0.5012 0.08171 6.134 0.000

136
OCR -0.2307 0.08171 -2.824 0.013
Temperature (°C)*Temperature (°C) 0.2639 0.08171 3.230 0.006
Temperature (°C)*OCR -0.1989 0.10548 -1.886 0.079
S = 0.298351 PRESS = 3.14039
R-Sq = 79.89% R-Sq(pred) = 52.71% R-Sq(adj) = 74.53%
Analysis of Variance for BTEX yield
Source DF Seq SS Adj SS Adj MS F
Regression 4 5.3051 5.3051 1.32627 14.90
Linear 2 4.0596 4.0596 2.02978 22.80
Temperature (°C) 1 3.3498 3.3498 3.34976 37.63
OCR 1 0.7098 0.7098 0.70981 7.97
Square 1 0.9289 0.9289 0.92886 10.44
Temperature (°C)*Temperature (°C) 1 0.9289 0.9289 0.92886 10.44
Interaction 1 0.3166 0.3166 0.31663 3.56
Temperature (°C)*OCR 1 0.3166 0.3166 0.31663 3.56
Residual Error 15 1.3352 1.3352 0.08901
Lack-of-Fit 4 0.3691 0.3691 0.09226 1.05
Pure Error 11 0.9661 0.9661 0.08783
Total 19 6.6403
Source P
Regression 0.000
Linear 0.000
Temperature (°C) 0.000
OCR 0.013
Square 0.006
Temperature (°C)*Temperature (°C) 0.006
Interaction 0.079

137
Temperature (°C)*OCR 0.079
Residual Error
Lack-of-Fit 0.425
Pure Error
Total
BTEX
Obs StdOrder yield Fit SE Fit Residual St Resid
1 10 1.925 1.972 0.086 -0.047 -0.17
2 6 3.793 3.167 0.172 0.626 2.57 R
3 5 1.933 1.766 0.172 0.167 0.68
4 7 1.749 1.703 0.172 0.046 0.19
5 12 1.980 1.972 0.086 0.008 0.03
6 8 1.986 2.307 0.172 -0.322 -1.32
7 2 2.458 3.167 0.172 -0.708 -2.91 R
8 1 1.785 1.766 0.172 0.018 0.07
9 11 1.994 1.972 0.086 0.022 0.08
10 3 1.481 1.703 0.172 -0.222 -0.91
11 4 2.186 2.307 0.172 -0.122 -0.50
12 9 1.929 1.972 0.086 -0.043 -0.15
13 18 1.974 1.972 0.086 0.002 0.01
14 15 2.307 2.349 0.159 -0.041 -0.16
15 20 2.019 1.972 0.086 0.047 0.17
16 13 1.791 1.857 0.221 -0.067 -0.33
17 16 1.996 1.595 0.159 0.401 1.59
18 14 3.755 3.494 0.221 0.260 1.30
19 19 1.936 1.972 0.086 -0.036 -0.13
20 17 1.982 1.972 0.086 0.010 0.04
R denotes an observation with a large standardized residual.
Estimated Regression Coefficients for BTEX yield using data in uncoded units

138
Term Coef
Constant 8.20117
Temperature (°C) -0.0529364
OCR 0.290472
Temperature (°C)*Temperature (°C) 0.000105576
Temperature (°C)*OCR -9.94727E-04
Response Surface Regression: BTEX yield versus Temperature (°C), OCR
The analysis was done using coded units.
Estimated Regression Coefficients for BTEX yield
Term Coef SE Coef T P
Constant 1.9719 0.09275 21.260 0.000
Temperature (°C) 0.5012 0.08799 5.696 0.000
OCR -0.2307 0.08799 -2.622 0.018
Temperature (°C)*Temperature (°C) 0.2639 0.08799 3.000 0.008
S = 0.321309 PRESS = 2.93079
R-Sq = 75.12% R-Sq(pred) = 55.86% R-Sq(adj) = 70.46%
Analysis of Variance for BTEX yield
Source DF Seq SS Adj SS Adj MS F
Regression 3 4.9884 4.9884 1.66281 16.11
Linear 2 4.0596 4.0596 2.02978 19.66
Temperature (°C) 1 3.3498 3.3498 3.34976 32.45
OCR 1 0.7098 0.7098 0.70981 6.88
Square 1 0.9289 0.9289 0.92886 9.00
Temperature (°C)*Temperature (°C) 1 0.9289 0.9289 0.92886 9.00
Residual Error 16 1.6518 1.6518 0.10324
Lack-of-Fit 5 0.6857 0.6857 0.13714 1.56
Pure Error 11 0.9661 0.9661 0.08783
Total 19 6.6403

139
Source P
Regression 0.000
Linear 0.000
Temperature (°C) 0.000
OCR 0.018
Square 0.008
Temperature (°C)*Temperature (°C) 0.008
Residual Error
Lack-of-Fit 0.250
Pure Error
Total
BTEX
Obs StdOrder yield Fit SE Fit Residual St Resid
1 10 1.925 1.972 0.093 -0.047 -0.15
2 6 3.793 2.968 0.147 0.825 2.89 R
3 5 1.933 1.965 0.147 -0.032 -0.11
4 7 1.749 1.504 0.147 0.245 0.86
5 12 1.980 1.972 0.093 0.008 0.03
6 8 1.986 2.506 0.147 -0.521 -1.82
7 2 2.458 2.968 0.147 -0.509 -1.78
8 1 1.785 1.965 0.147 -0.181 -0.63
9 11 1.994 1.972 0.093 0.022 0.07
10 3 1.481 1.504 0.147 -0.023 -0.08
11 4 2.186 2.506 0.147 -0.321 -1.12
12 9 1.929 1.972 0.093 -0.043 -0.14
13 18 1.974 1.972 0.093 0.002 0.01
14 15 2.307 2.349 0.171 -0.041 -0.15
15 20 2.019 1.972 0.093 0.047 0.15
16 13 1.791 1.857 0.238 -0.067 -0.31
17 16 1.996 1.595 0.171 0.401 1.47

140
18 14 3.755 3.494 0.238 0.260 1.21
19 19 1.936 1.972 0.093 -0.036 -0.12
20 17 1.982 1.972 0.093 0.010 0.03
R denotes an observation with a large standardized residual.
Estimated Regression Coefficients for BTEX yield using data in uncoded units
Term Coef
Constant 12.0309
Temperature (°C) -0.0638784
OCR -0.0576821
Temperature (°C)*Temperature (°C) 0.000105576
B2: Raw DOE Minitab data for propylene aromatization
BENZENE:
Results for: NEW SI AL PROPYLENE REGRESSION.MTW
Factorial Fit: Benzene (% y versus Si/Al Ratio, Temperature , ...
Estimated Effects and Coefficients for Benzene (% yield) (coded units)
Term Effect Coef SE Coef T P
Constant 2.3704 0.1605 14.77 0.000
Si/Al Ratio -1.6924 -0.8462 0.1605 -5.27 0.003
Temperature (°C) 1.4179 0.7089 0.1605 4.42 0.007
Propylene concentration (%) 1.4080 0.7040 0.1605 4.39 0.007
Catalyst amount (g) 2.2892 1.1446 0.1605 7.13 0.001
Si/Al Ratio*Temperature (°C) -0.3650 -0.1825 0.1605 -1.14 0.307
Si/Al Ratio* -0.2015 -0.1007 0.1605 -0.63 0.558
Propylene concentration (%)
Si/Al Ratio*Catalyst amount (g) -0.3608 -0.1804 0.1605 -1.12 0.312
Temperature (°C)* 0.6331 0.3166 0.1605 1.97 0.106
Propylene concentration (%)

141
Temperature (°C)*Catalyst amount (g) 0.5531 0.2766 0.1605 1.72 0.145
Propylene concentration (%)* 0.9847 0.4923 0.1605 3.07 0.028
Catalyst amount (g)
S = 0.641884 PRESS = 21.0952
R-Sq = 96.47% R-Sq(pred) = 63.86% R-Sq(adj) = 89.41%
Analysis of Variance for Benzene (% yield) (coded units)
Source DF Seq SS Adj SS Adj MS F P
Main Effects 4 48.389 48.389 12.0974 29.36 0.001
2-Way Interactions 6 7.921 7.921 1.3202 3.20 0.111
Residual Error 5 2.060 2.060 0.4120
Total 15 58.371
Estimated Coefficients for Benzene (% yield) using data in uncoded units
Term Coef
Constant 7.9287
Si/Al Ratio 0.111055
Temperature (°C) -0.0159355
Propylene concentration (%) -1.35940
Catalyst amount (g) -8.72320
Si/Al Ratio*Temperature (°C) -2.43346E-04
Si/Al Ratio* -0.00373129
Propylene concentration (%)
Si/Al Ratio*Catalyst amount (g) -0.0300658
Temperature (°C)* 0.00351729
Propylene concentration (%)
Temperature (°C)*Catalyst amount (g) 0.0138276
Propylene concentration (%)* 0.683785
Catalyst amount (g)

142
Effects Pareto for Benzene (% yield)
Alias Structure
I
Si/Al Ratio
Temperature (°C)
Propylene concentration (%)
Catalyst amount (g)
Si/Al Ratio*Temperature (°C)
Si/Al Ratio*Propylene concentration (%)
Si/Al Ratio*Catalyst amount (g)
Temperature (°C)*Propylene concentration (%)
Temperature (°C)*Catalyst amount (g)
Propylene concentration (%)*Catalyst amount (g)
Factorial Fit: Benzene (% y versus Si/Al Ratio, Temperature , ...
Estimated Effects and Coefficients for Benzene (% yield) (coded units)
Term Effect Coef SE Coef T P
Constant 2.3704 0.1953 12.14 0.000
Si/Al Ratio -1.6924 -0.8462 0.1953 -4.33 0.001
Temperature (°C) 1.4179 0.7089 0.1953 3.63 0.005
Propylene concentration (%) 1.4080 0.7040 0.1953 3.60 0.005
Catalyst amount (g) 2.2892 1.1446 0.1953 5.86 0.000
Propylene concentration (%)* 0.9847 0.4923 0.1953 2.52 0.030
Catalyst amount (g)
S = 0.781225 PRESS = 15.6240
R-Sq = 89.54% R-Sq(pred) = 73.23% R-Sq(adj) = 84.32%
Analysis of Variance for Benzene (% yield) (coded units)
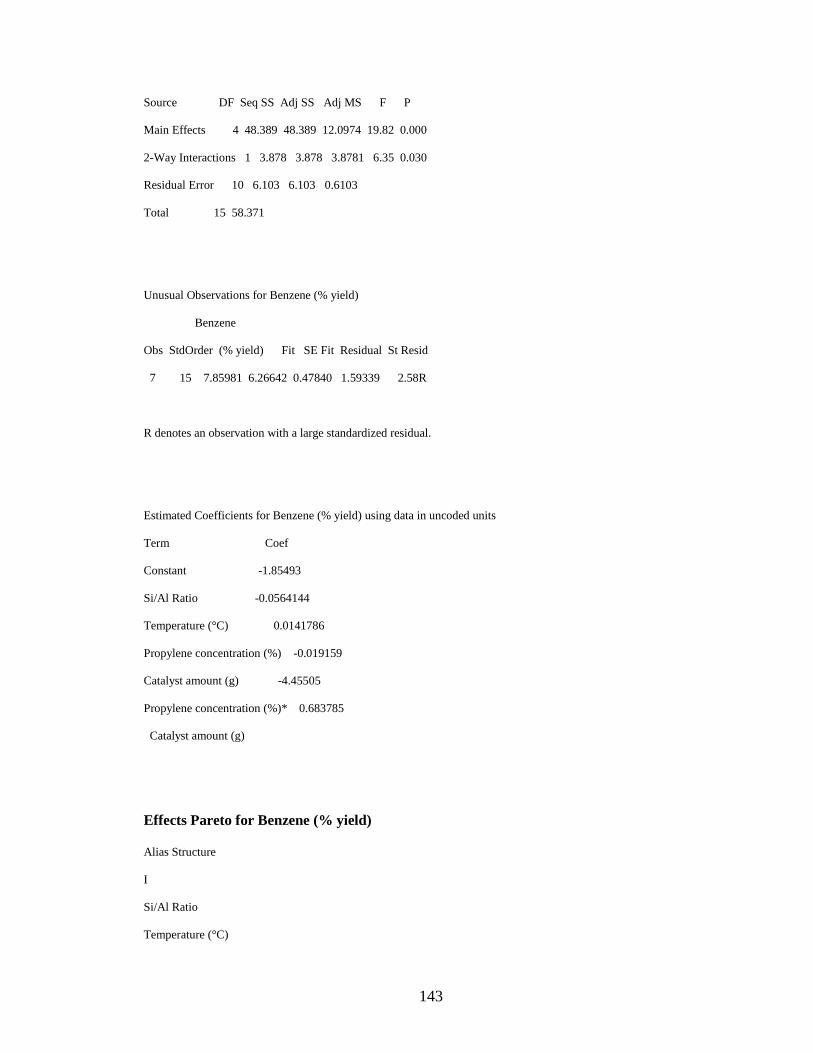
143
Source DF Seq SS Adj SS Adj MS F P
Main Effects 4 48.389 48.389 12.0974 19.82 0.000
2-Way Interactions 1 3.878 3.878 3.8781 6.35 0.030
Residual Error 10 6.103 6.103 0.6103
Total 15 58.371
Unusual Observations for Benzene (% yield)
Benzene
Obs StdOrder (% yield) Fit SE Fit Residual St Resid
7 15 7.85981 6.26642 0.47840 1.59339 2.58R
R denotes an observation with a large standardized residual.
Estimated Coefficients for Benzene (% yield) using data in uncoded units
Term Coef
Constant -1.85493
Si/Al Ratio -0.0564144
Temperature (°C) 0.0141786
Propylene concentration (%) -0.019159
Catalyst amount (g) -4.45505
Propylene concentration (%)* 0.683785
Catalyst amount (g)
Effects Pareto for Benzene (% yield)
Alias Structure
I
Si/Al Ratio
Temperature (°C)

144
Propylene concentration (%)
Catalyst amount (g)
Propylene concentration (%)*Catalyst amount (g)
-----x-----
TOLUENE:
Results for: NEW SI AL PROPYLENE REGRESSION.MTW
Factorial Fit: Toluene (% y versus Si/Al Ratio, Temperature , ...
Estimated Effects and Coefficients for Toluene (% yield) (coded units)
Term Effect Coef SE Coef T P
Constant 7.668 0.2760 27.78 0.000
Si/Al Ratio -4.567 -2.283 0.2760 -8.27 0.000
Temperature (°C) 1.902 0.951 0.2760 3.45 0.018
Propylene concentration (%) 2.616 1.308 0.2760 4.74 0.005
Catalyst amount (g) 5.401 2.700 0.2760 9.78 0.000
Si/Al Ratio*Temperature (°C) -0.094 -0.047 0.2760 -0.17 0.871
Si/Al Ratio* 0.790 0.395 0.2760 1.43 0.212
Propylene concentration (%)
Si/Al Ratio*Catalyst amount (g) 0.320 0.160 0.2760 0.58 0.587
Temperature (°C)* 0.202 0.101 0.2760 0.37 0.729
Propylene concentration (%)
Temperature (°C)*Catalyst amount (g) 0.407 0.204 0.2760 0.74 0.494
Propylene concentration (%)* 1.546 0.773 0.2760 2.80 0.038
Catalyst amount (g)
S = 1.10395 PRESS = 62.3977
R-Sq = 97.67% R-Sq(pred) = 76.13% R-Sq(adj) = 93.01%
Analysis of Variance for Toluene (% yield) (coded units)

145
Source DF Seq SS Adj SS Adj MS F P
Main Effects 4 241.962 241.962 60.491 49.64 0.000
2-Way Interactions 6 13.337 13.337 2.223 1.82 0.263
Residual Error 5 6.094 6.094 1.219
Total 15 261.393
Unusual Observations for Toluene (% yield)
Toluene
Obs StdOrder (% yield) Fit SE Fit Residual St Resid
9 9 10.9614 9.7049 0.9153 1.2566 2.04R
R denotes an observation with a large standardized residual.
Estimated Coefficients for Toluene (% yield) using data in uncoded units
Term Coef
Constant 21.6156
Si/Al Ratio -0.296636
Temperature (°C) 0.0049693
Propylene concentration (%) -1.37465
Catalyst amount (g) -11.0552
Si/Al Ratio*Temperature (°C) -6.27597E-05
Si/Al Ratio* 0.0146376
Propylene concentration (%)
Si/Al Ratio*Catalyst amount (g) 0.0267077
Temperature (°C)* 0.00112372
Propylene concentration (%)
Temperature (°C)*Catalyst amount (g) 0.0101773
Propylene concentration (%)* 1.07388
Catalyst amount (g)

146
Effects Pareto for Toluene (% yield)
Alias Structure
I
Si/Al Ratio
Temperature (°C)
Propylene concentration (%)
Catalyst amount (g)
Si/Al Ratio*Temperature (°C)
Si/Al Ratio*Propylene concentration (%)
Si/Al Ratio*Catalyst amount (g)
Temperature (°C)*Propylene concentration (%)
Temperature (°C)*Catalyst amount (g)
Propylene concentration (%)*Catalyst amount (g)
Factorial Fit: Toluene (% y versus Si/Al Ratio, Temperature , ...
Estimated Effects and Coefficients for Toluene (% yield) (coded units)
Term Effect Coef SE Coef T P
Constant 7.668 0.2483 30.88 0.000
Si/Al Ratio -4.567 -2.283 0.2483 -9.20 0.000
Temperature (°C) 1.902 0.951 0.2483 3.83 0.003
Propylene concentration (%) 2.616 1.308 0.2483 5.27 0.000
Catalyst amount (g) 5.401 2.700 0.2483 10.88 0.000
Propylene concentration (%)* 1.546 0.773 0.2483 3.11 0.011
Catalyst amount (g)
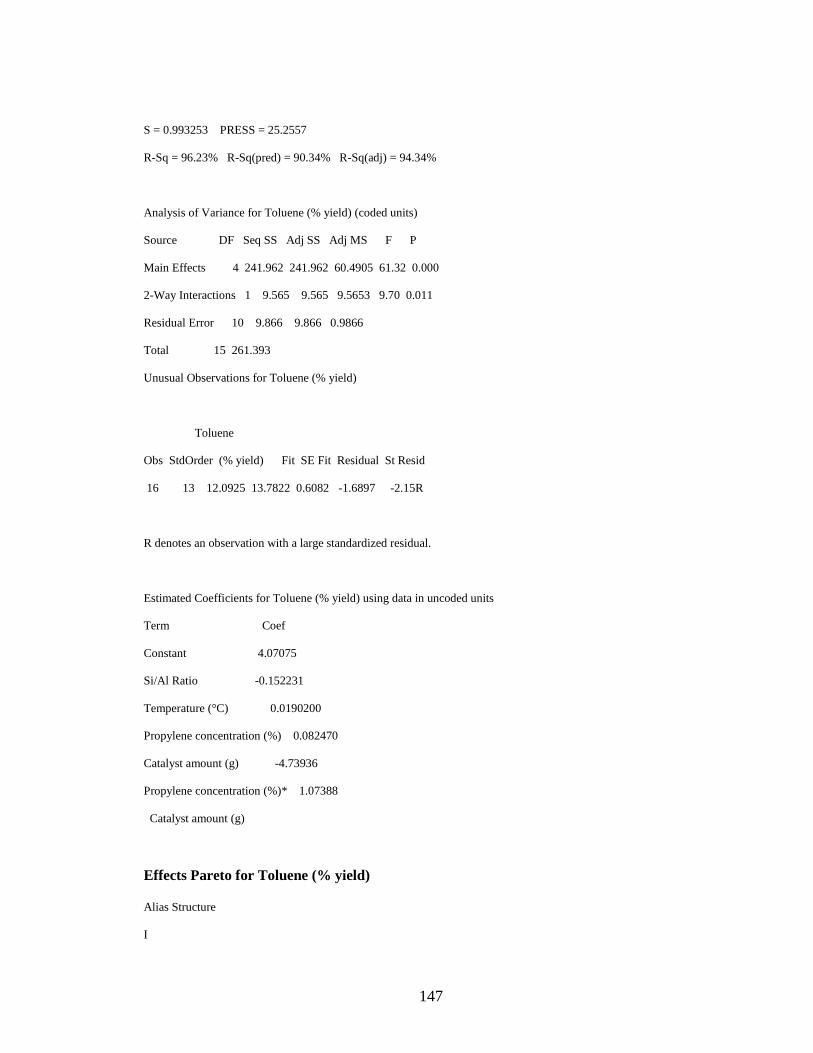
147
S = 0.993253 PRESS = 25.2557
R-Sq = 96.23% R-Sq(pred) = 90.34% R-Sq(adj) = 94.34%
Analysis of Variance for Toluene (% yield) (coded units)
Source DF Seq SS Adj SS Adj MS F P
Main Effects 4 241.962 241.962 60.4905 61.32 0.000
2-Way Interactions 1 9.565 9.565 9.5653 9.70 0.011
Residual Error 10 9.866 9.866 0.9866
Total 15 261.393
Unusual Observations for Toluene (% yield)
Toluene
Obs StdOrder (% yield) Fit SE Fit Residual St Resid
16 13 12.0925 13.7822 0.6082 -1.6897 -2.15R
R denotes an observation with a large standardized residual.
Estimated Coefficients for Toluene (% yield) using data in uncoded units
Term Coef
Constant 4.07075
Si/Al Ratio -0.152231
Temperature (°C) 0.0190200
Propylene concentration (%) 0.082470
Catalyst amount (g) -4.73936
Propylene concentration (%)* 1.07388
Catalyst amount (g)
Effects Pareto for Toluene (% yield)
Alias Structure
I

148
Si/Al Ratio
Temperature (°C)
Propylene concentration (%)
Catalyst amount (g)
Propylene concentration (%)*Catalyst amount (g)
-------X----------------
P-XYLENE
Results for: NEW SI AL PROPYLENE REGRESSION.MTW
Factorial Fit: p-xylene (% versus Si/Al Ratio, Temperature , ...
Estimated Effects and Coefficients for p-xylene (% yield) (coded units)
Term Effect Coef SE Coef T P
Constant 5.466 0.1858 29.42 0.000
Si/Al Ratio -2.286 -1.143 0.1858 -6.15 0.002
Temperature (°C) 0.012 0.006 0.1858 0.03 0.975
Propylene concentration (%) 0.578 0.289 0.1858 1.56 0.181
Catalyst amount (g) 2.212 1.106 0.1858 5.95 0.002
Si/Al Ratio*Temperature (°C) 0.384 0.192 0.1858 1.03 0.349
Si/Al Ratio* 1.165 0.582 0.1858 3.13 0.026
Propylene concentration (%)
Si/Al Ratio*Catalyst amount (g) 0.923 0.461 0.1858 2.48 0.056
Temperature (°C)* -0.206 -0.103 0.1858 -0.55 0.604
Propylene concentration (%)
Temperature (°C)*Catalyst amount (g) 0.056 0.028 0.1858 0.15 0.885
Propylene concentration (%)* 0.333 0.166 0.1858 0.90 0.412
Catalyst amount (g)
S = 0.743012 PRESS = 28.2658
R-Sq = 94.95% R-Sq(pred) = 48.24% R-Sq(adj) = 84.84%

149
Analysis of Variance for p-xylene (% yield) (coded units)
Source DF Seq SS Adj SS Adj MS F P
Main Effects 4 41.808 41.808 10.4521 18.93 0.003
2-Way Interactions 6 10.043 10.043 1.6738 3.03 0.122
Residual Error 5 2.760 2.760 0.5521
Total 15 54.612
Estimated Coefficients for p-xylene (% yield) using data in uncoded units
Term Coef
Constant 28.8270
Si/Al Ratio -0.468206
Temperature (°C) -0.0051229
Propylene concentration (%) -0.86557
Catalyst amount (g) -5.33854
Si/Al Ratio*Temperature (°C) 0.000255862
Si/Al Ratio* 0.0215660
Propylene concentration (%)
Si/Al Ratio*Catalyst amount (g) 0.0768755
Temperature (°C)* -0.00114297
Propylene concentration (%)
Temperature (°C)*Catalyst amount (g) 0.00141048
Propylene concentration (%)* 0.231050
Catalyst amount (g)
Effects Pareto for p-xylene (% yield)
Alias Structure
I
Si/Al Ratio
Temperature (°C)
Propylene concentration (%)
Catalyst amount (g)

150
Si/Al Ratio*Temperature (°C)
Si/Al Ratio*Propylene concentration (%)
Si/Al Ratio*Catalyst amount (g)
Temperature (°C)*Propylene concentration (%)
Temperature (°C)*Catalyst amount (g)
Propylene concentration (%)*Catalyst amount (g)
Factorial Fit: p-xylene (% versus Si/Al Ratio, Propylene co, ...
Estimated Effects and Coefficients for p-xylene (% yield) (coded units)
Term Effect Coef SE Coef T P
Constant 5.466 0.2048 26.69 0.000
Si/Al Ratio -2.286 -1.143 0.2048 -5.58 0.000
Propylene concentration (%) 0.578 0.289 0.2048 1.41 0.186
Catalyst amount (g) 2.212 1.106 0.2048 5.40 0.000
Si/Al Ratio* 1.165 0.582 0.2048 2.84 0.016
Propylene concentration (%)
S = 0.819037 PRESS = 15.6119
R-Sq = 86.49% R-Sq(pred) = 71.41% R-Sq(adj) = 81.57%
Analysis of Variance for p-xylene (% yield) (coded units)
Source DF Seq SS Adj SS Adj MS F P
Main Effects 3 41.808 41.808 13.9359 20.77 0.000
2-Way Interactions 1 5.425 5.425 5.4248 8.09 0.016
Residual Error 11 7.379 7.379 0.6708
Lack of Fit 3 6.361 6.361 2.1202 16.65 0.001
Pure Error 8 1.018 1.018 0.1273
Total 15 54.612
Estimated Coefficients for p-xylene (% yield) using data in uncoded units
Term Coef
Constant 22.0402

151
Si/Al Ratio -0.306943
Propylene concentration (%) -1.24127
Catalyst amount (g) 2.76532
Si/Al Ratio* 0.0215660
Propylene concentration (%)
Effects Pareto for p-xylene (% yield)
Alias Structure
I
Si/Al Ratio
Propylene concentration (%)
Catalyst amount (g)
Si/Al Ratio*Propylene concentration (%)
------X------
O-XYLENE
Results for: NEW SI AL PROPYLENE REGRESSION.MTW
Factorial Fit: o-xylene (% versus Si/Al Ratio, Temperature , ...
Estimated Effects and Coefficients for o-xylene (% yield) (coded units)
Term Effect Coef SE Coef T P
Constant 1.3362 0.04934 27.08 0.000
Si/Al Ratio -0.6280 -0.3140 0.04934 -6.36 0.001
Temperature (°C) 0.2690 0.1345 0.04934 2.73 0.041
Propylene concentration (%) 0.0337 0.0168 0.04934 0.34 0.747
Catalyst amount (g) 0.5618 0.2809 0.04934 5.69 0.002
Si/Al Ratio*Temperature (°C) 0.0817 0.0409 0.04934 0.83 0.445
Si/Al Ratio* 0.3258 0.1629 0.04934 3.30 0.021
Propylene concentration (%)
Si/Al Ratio*Catalyst amount (g) 0.2070 0.1035 0.04934 2.10 0.090
Temperature (°C)* -0.0434 -0.0217 0.04934 -0.44 0.679

152
Propylene concentration (%)
Temperature (°C)*Catalyst amount (g) 0.0299 0.0150 0.04934 0.30 0.774
Propylene concentration (%)* 0.0700 0.0350 0.04934 0.71 0.510
Catalyst amount (g)
S = 0.197354 PRESS = 1.99418
R-Sq = 95.11% R-Sq(pred) = 49.92% R-Sq(adj) = 85.33%
Analysis of Variance for o-xylene (% yield) (coded units)
Source DF Seq SS Adj SS Adj MS F P
Main Effects 4 3.1341 3.1341 0.78353 20.12 0.003
2-Way Interactions 6 0.6535 0.6535 0.10892 2.80 0.139
Residual Error 5 0.1947 0.1947 0.03895
Total 15 3.9823
Estimated Coefficients for o-xylene (% yield) using data in uncoded units
Term Coef
Constant 6.78236
Si/Al Ratio -0.120369
Temperature (°C) 0.00127680
Propylene concentration (%) -0.303618
Catalyst amount (g) -1.27603
Si/Al Ratio*Temperature (°C) 5.44948E-05
Si/Al Ratio* 0.00603392
Propylene concentration (%)
Si/Al Ratio*Catalyst amount (g) 0.0172492
Temperature (°C)* -2.40911E-04
Propylene concentration (%)
Temperature (°C)*Catalyst amount (g) 0.00074829
Propylene concentration (%)* 0.0486306
Catalyst amount (g)

153
Effects Pareto for o-xylene (% yield)
Alias Structure
I
Si/Al Ratio
Temperature (°C)
Propylene concentration (%)
Catalyst amount (g)
Si/Al Ratio*Temperature (°C)
Si/Al Ratio*Propylene concentration (%)
Si/Al Ratio*Catalyst amount (g)
Temperature (°C)*Propylene concentration (%)
Temperature (°C)*Catalyst amount (g)
Propylene concentration (%)*Catalyst amount (g)
Factorial Fit: o-xylene (% versus Si/Al Ratio, Temperature , ...
Estimated Effects and Coefficients for o-xylene (% yield) (coded units)
Term Effect Coef SE Coef T P
Constant 1.3362 0.05145 25.97 0.000
Si/Al Ratio -0.6280 -0.3140 0.05145 -6.10 0.000
Temperature (°C) 0.2690 0.1345 0.05145 2.61 0.026
Propylene concentration (%) 0.0337 0.0168 0.05145 0.33 0.750
Catalyst amount (g) 0.5618 0.2809 0.05145 5.46 0.000
Si/Al Ratio* 0.3258 0.1629 0.05145 3.17 0.010
Propylene concentration (%)
S = 0.205808 PRESS = 1.08434
R-Sq = 89.36% R-Sq(pred) = 72.77% R-Sq(adj) = 84.05%
Analysis of Variance for o-xylene (% yield) (coded units)
Source DF Seq SS Adj SS Adj MS F P

154
Main Effects 4 3.1341 3.1341 0.78353 18.50 0.000
2-Way Interactions 1 0.4247 0.4247 0.42467 10.03 0.010
Residual Error 10 0.4236 0.4236 0.04236
Total 15 3.9823
Unusual Observations for o-xylene (% yield)
o-xylene
Obs StdOrder (% yield) Fit SE Fit Residual St Resid
1 16 1.98147 1.61731 0.12603 0.36416 2.24R
R denotes an observation with a large standardized residual.
Estimated Coefficients for o-xylene (% yield) using data in uncoded units
Term Coef
Constant 5.16141
Si/Al Ratio -0.0854968
Temperature (°C) 0.00269019
Propylene concentration (%) -0.382850
Catalyst amount (g) 0.702248
Si/Al Ratio* 0.00603392
Propylene concentration (%)
Effects Pareto for o-xylene (% yield)
Alias Structure
I
Si/Al Ratio
Temperature (°C)
Propylene concentration (%)
Catalyst amount (g)
Si/Al Ratio*Propylene concentration (%)
-----X-----
TOTAL BTX:

155
Results for: NEW SI AL PROPYLENE REGRESSION.MTW
Factorial Fit: Total BTX (% versus Si/Al Ratio, Temperature , ...
Estimated Effects and Coefficients for Total BTX (% yield) (coded units)
Term Effect Coef SE Coef T P
Constant 16.840 0.5104 33.00 0.000
Si/Al Ratio -9.173 -4.586 0.5104 -8.99 0.000
Temperature (°C) 3.601 1.801 0.5104 3.53 0.017
Propylene concentration (%) 4.636 2.318 0.5104 4.54 0.006
Catalyst amount (g) 10.464 5.232 0.5104 10.25 0.000
Si/Al Ratio*Temperature (°C) 0.006 0.003 0.5104 0.01 0.995
Si/Al Ratio* 2.079 1.040 0.5104 2.04 0.097
Propylene concentration (%)
Si/Al Ratio*Catalyst amount (g) 1.089 0.545 0.5104 1.07 0.335
Temperature (°C)* 0.586 0.293 0.5104 0.57 0.591
Propylene concentration (%)
Temperature (°C)*Catalyst amount (g) 1.047 0.523 0.5104 1.03 0.352
Propylene concentration (%)* 2.934 1.467 0.5104 2.87 0.035
Catalyst amount (g)
S = 2.04142 PRESS = 213.370
R-Sq = 97.91% R-Sq(pred) = 78.57% R-Sq(adj) = 93.72%
Analysis of Variance for Total BTX (% yield) (coded units)
Source DF Seq SS Adj SS Adj MS F P
Main Effects 4 912.42 912.42 228.104 54.74 0.000
2-Way Interactions 6 62.22 62.22 10.371 2.49 0.168
Residual Error 5 20.84 20.84 4.167
Total 15 995.48
Estimated Coefficients for Total BTX (% yield) using data in uncoded units
Term Coef
Constant 65.1537
Si/Al Ratio -0.774156

156
Temperature (°C) -0.0148123
Propylene concentration (%) -3.90324
Catalyst amount (g) -26.3929
Si/Al Ratio*Temperature (°C) 0.000004252
Si/Al Ratio* 0.0385062
Propylene concentration (%)
Si/Al Ratio*Catalyst amount (g) 0.0907665
Temperature (°C)* 0.00325713
Propylene concentration (%)
Temperature (°C)*Catalyst amount (g) 0.0261637
Propylene concentration (%)* 2.03735
Catalyst amount (g)
Effects Pareto for Total BTX (% yield)
Alias Structure
I
Si/Al Ratio
Temperature (°C)
Propylene concentration (%)
Catalyst amount (g)
Si/Al Ratio*Temperature (°C)
Si/Al Ratio*Propylene concentration (%)
Si/Al Ratio*Catalyst amount (g)
Temperature (°C)*Propylene concentration (%)
Temperature (°C)*Catalyst amount (g)
Propylene concentration (%)*Catalyst amount (g)

157
Factorial Fit: Total BTX (% versus Si/Al Ratio, Temperature , ...
Estimated Effects and Coefficients for Total BTX (% yield) (coded units)
Term Effect Coef SE Coef T P
Constant 16.840 0.5513 30.54 0.000
Si/Al Ratio -9.173 -4.586 0.5513 -8.32 0.000
Temperature (°C) 3.601 1.801 0.5513 3.27 0.008
Propylene concentration (%) 4.636 2.318 0.5513 4.20 0.002
Catalyst amount (g) 10.464 5.232 0.5513 9.49 0.000
Propylene concentration (%)* 2.934 1.467 0.5513 2.66 0.024
Catalyst amount (g)
S = 2.20529 PRESS = 124.500
R-Sq = 95.11% R-Sq(pred) = 87.49% R-Sq(adj) = 92.67%
Analysis of Variance for Total BTX (% yield) (coded units)
Source DF Seq SS Adj SS Adj MS F P
Main Effects 4 912.42 912.42 228.104 46.90 0.000
2-Way Interactions 1 34.43 34.43 34.428 7.08 0.024
Residual Error 10 48.63 48.63 4.863
Total 15 995.48
Unusual Observations for Total BTX (% yield)
Total BTX
Obs StdOrder (% yield) Fit SE Fit Residual St Resid
16 13 24.7287 28.6429 1.3505 -3.9142 -2.25R
R denotes an observation with a large standardized residual.
Estimated Coefficients for Total BTX (% yield) using data in uncoded units
Term Coef
Constant 11.9611
Si/Al Ratio -0.305766
Temperature (°C) 0.0360136
Propylene concentration (%) 0.065377

158
Catalyst amount (g) -8.71944
Propylene concentration (%)* 2.03735
Catalyst amount (g)
Effects Pareto for Total BTX (% yield)
Alias Structure
I
Si/Al Ratio
Temperature (°C)
Propylene concentration (%)
Catalyst amount (g)
Propylene concentration (%)*Catalyst amount (g)
Results for: SI AL PROPYLENE REGRESSION CONVERSION PROPYLENE
DATA.MTW
Factorial Fit: Propylene co versus Si/Al Ratio, Temperature , ...
Estimated Effects and Coefficients for Propylene conversion (%) (coded units)
Term Effect Coef
Constant 66.938
Si/Al Ratio -6.375 -3.188
Temperature (°C) -13.625 -6.813
Propylene concentration (%) 2.375 1.187
Catalyst amount (g) 7.375 3.687
Si/Al Ratio*Temperature (°C) -5.875 -2.938
Si/Al Ratio* 2.125 1.062
Propylene concentration (%)

159
Si/Al Ratio*Catalyst amount (g) 8.125 4.063
Temperature (°C)* 1.375 0.688
Propylene concentration (%)
Temperature (°C)*Catalyst amount (g) 3.875 1.937
Propylene concentration (%)* -2.125 -1.063
Catalyst amount (g)
Si/Al Ratio*Temperature (°C)* 0.125 0.062
Propylene concentration (%)
Si/Al Ratio*Temperature (°C)* 1.625 0.812
Catalyst amount (g)
Si/Al Ratio* -0.375 -0.187
Propylene concentration (%)*
Catalyst amount (g)
Temperature (°C)* -0.125 -0.063
Propylene concentration (%)*
Catalyst amount (g)
Si/Al Ratio*Temperature (°C)* -0.375 -0.188
Propylene concentration (%)*
Catalyst amount (g)
S = * PRESS = *
Analysis of Variance for Propylene conversion (%) (coded units)
Source DF Seq SS Adj SS Adj MS F P
Main Effects 4 1145.25 1145.25 286.312 * *
2-Way Interactions 6 505.88 505.88 84.313 * *
3-Way Interactions 4 11.25 11.25 2.812 * *
4-Way Interactions 1 0.56 0.56 0.563 * *
Residual Error 0 * * *
Total 15 1662.94

160
Estimated Coefficients for Propylene conversion (%) using data in uncoded units
Term Coef
Constant 7.18519
Si/Al Ratio 2.56852
Temperature (°C) 0.250046
Propylene concentration (%) 1.85185
Catalyst amount (g) 104.861
Si/Al Ratio*Temperature (°C) -0.00826620
Si/Al Ratio* -0.0648148
Propylene concentration (%)
Si/Al Ratio*Catalyst amount (g) -2.02778
Temperature (°C)* -0.00787037
Propylene concentration (%)
Temperature (°C)*Catalyst amount (g) -0.302083
Propylene concentration (%)* -9.72222
Catalyst amount (g)
Si/Al Ratio*Temperature (°C)* 0.000254630
Propylene concentration (%)
Si/Al Ratio*Temperature (°C)* 0.00642361
Catalyst amount (g)
Si/Al Ratio* 0.138889
Propylene concentration (%)*
Catalyst amount (g)
Temperature (°C)* 0.0208333
Propylene concentration (%)*
Catalyst amount (g)
Si/Al Ratio*Temperature (°C)* -3.47222E-04
Propylene concentration (%)*
Catalyst amount (g)

161
Effects Pareto for Propylene conversion (%)
Alias Structure
I
Si/Al Ratio
Temperature (°C)
Propylene concentration (%)
Catalyst amount (g)
Si/Al Ratio*Temperature (°C)
Si/Al Ratio*Propylene concentration (%)
Si/Al Ratio*Catalyst amount (g)
Temperature (°C)*Propylene concentration (%)
Temperature (°C)*Catalyst amount (g)
Propylene concentration (%)*Catalyst amount (g)
Si/Al Ratio*Temperature (°C)*Propylene concentration (%)
Si/Al Ratio*Temperature (°C)*Catalyst amount (g)
Si/Al Ratio*Propylene concentration (%)*Catalyst amount (g)
Temperature (°C)*Propylene concentration (%)*Catalyst amount (g)
Si/Al Ratio*Temperature (°C)*Propylene concentration (%)*Catalyst amount (g)
* NOTE * Could not graph the specified residual type because MSE = 0 or the
degrees of freedom for error = 0.
Factorial Fit: Propylene co versus Si/Al Ratio, Temperature , ...
Estimated Effects and Coefficients for Propylene conversion (%) (coded units)
Term Effect Coef SE Coef T P
Constant 66.938 0.3843 174.20 0.000
Si/Al Ratio -6.375 -3.188 0.3843 -8.30 0.000
Temperature (°C) -13.625 -6.813 0.3843 -17.73 0.000
Propylene concentration (%) 2.375 1.187 0.3843 3.09 0.027

162
Catalyst amount (g) 7.375 3.687 0.3843 9.60 0.000
Si/Al Ratio*Temperature (°C) -5.875 -2.938 0.3843 -7.64 0.001
Si/Al Ratio* 2.125 1.062 0.3843 2.77 0.040
Propylene concentration (%)
Si/Al Ratio*Catalyst amount (g) 8.125 4.063 0.3843 10.57 0.000
Temperature (°C)* 1.375 0.688 0.3843 1.79 0.134
Propylene concentration (%)
Temperature (°C)*Catalyst amount (g) 3.875 1.937 0.3843 5.04 0.004
Propylene concentration (%)* -2.125 -1.063 0.3843 -2.77 0.040
Catalyst amount (g)
S = 1.53704 PRESS = 120.96
R-Sq = 99.29% R-Sq(pred) = 92.73% R-Sq(adj) = 97.87%
Analysis of Variance for Propylene conversion (%) (coded units)
Source DF Seq SS Adj SS Adj MS F P
Main Effects 4 1145.25 1145.25 286.312 121.19 0.000
2-Way Interactions 6 505.88 505.88 84.313 35.69 0.001
Residual Error 5 11.81 11.81 2.362
Total 15 1662.94
Estimated Coefficients for Propylene conversion (%) using data in uncoded units
Term Coef
Constant 122.149
Si/Al Ratio 0.722685
Temperature (°C) -0.0215278
Propylene concentration (%) -4.45023
Catalyst amount (g) -62.5955
Si/Al Ratio*Temperature (°C) -0.00391667
Si/Al Ratio* 0.0393519
Propylene concentration (%)
Si/Al Ratio*Catalyst amount (g) 0.677083
Temperature (°C)* 0.00763889

163
Propylene concentration (%)
Temperature (°C)*Catalyst amount (g) 0.0968750
Propylene concentration (%)* -1.47569
Catalyst amount (g)
Effects Pareto for Propylene conversion (%)
Alias Structure
I
Si/Al Ratio
Temperature (°C)
Propylene concentration (%)
Catalyst amount (g)
Si/Al Ratio*Temperature (°C)
Si/Al Ratio*Propylene concentration (%)
Si/Al Ratio*Catalyst amount (g)
Temperature (°C)*Propylene concentration (%)
Temperature (°C)*Catalyst amount (g)
Propylene concentration (%)*Catalyst amount (g)
Factorial Fit: Propylene co versus Si/Al Ratio, Temperature , ...
Estimated Effects and Coefficients for Propylene conversion (%) (coded units)
Term Effect Coef SE Coef T P
Constant 66.938 0.4492 149.00 0.000
Si/Al Ratio -6.375 -3.188 0.4492 -7.10 0.000
Temperature (°C) -13.625 -6.813 0.4492 -15.16 0.000
Propylene concentration (%) 2.375 1.187 0.4492 2.64 0.038
Catalyst amount (g) 7.375 3.687 0.4492 8.21 0.000
Si/Al Ratio*Temperature (°C) -5.875 -2.938 0.4492 -6.54 0.001

164
Si/Al Ratio* 2.125 1.062 0.4492 2.37 0.056
Propylene concentration (%)
Si/Al Ratio*Catalyst amount (g) 8.125 4.063 0.4492 9.04 0.000
Temperature (°C)*Catalyst amount (g) 3.875 1.938 0.4492 4.31 0.005
Propylene concentration (%)* -2.125 -1.063 0.4492 -2.37 0.056
Catalyst amount (g)
S = 1.79699 PRESS = 137.778
R-Sq = 98.83% R-Sq(pred) = 91.71% R-Sq(adj) = 97.09%
Analysis of Variance for Propylene conversion (%) (coded units)
Source DF Seq SS Adj SS Adj MS F P
Main Effects 4 1145.25 1145.25 286.312 88.66 0.000
2-Way Interactions 5 498.31 498.31 99.663 30.86 0.000
Residual Error 6 19.37 19.37 3.229
Total 15 1662.94
Estimated Coefficients for Propylene conversion (%) using data in uncoded units
Term Coef
Constant 85.3675
Si/Al Ratio 0.722685
Temperature (°C) 0.0602083
Propylene concentration (%) -1.01273
Catalyst amount (g) -62.5955
Si/Al Ratio*Temperature (°C) -0.00391667
Si/Al Ratio* 0.0393519
Propylene concentration (%)
Si/Al Ratio*Catalyst amount (g) 0.677083
Temperature (°C)*Catalyst amount (g) 0.0968750
Propylene concentration (%)* -1.47569
Catalyst amount (g)

165
Effects Pareto for Propylene conversion (%)
Alias Structure
I
Si/Al Ratio
Temperature (°C)
Propylene concentration (%)
Catalyst amount (g)
Si/Al Ratio*Temperature (°C)
Si/Al Ratio*Propylene concentration (%)
Si/Al Ratio*Catalyst amount (g)
Temperature (°C)*Catalyst amount (g)
Propylene concentration (%)*Catalyst amount (g)
166
APPENDIX C: ADDITIONAL EXPERIMENTAL RUNS AND DATA
C1: Aromatization of α-olefins
A set of preliminary experiments were performed to study the feasibility of
catalytic reforming of α-olefins. Four model compounds, 1-hexene, 1-octene, 1-decene
and 1-tetradecene were chosen and experiments were conducted by using zeolite
catalysts, as shown in Table 17. For all the experiments, the amount of feed olefin was
kept constant at 200 mL and the effects of three factors, reaction temperature, reaction
time and catalyst amount, was studied.
It was observed that significant amounts of aromatic compounds were produced
in each experiment. These include light aromatics like benzene, toluene, ethylbenzene, p-
xylene and o-xylene. P-xylene is the major individual aromatic compound among all the
aromatics produced. When the levels of the reaction conditions were changed, the
product distribution also changed. This suggests that the amount of a particular individual
aromatic compound could be controlled by changing the reaction conditions. From the
results of preliminary reforming reactions of model compounds, it can be concluded that
C6 - C14 α-olefins can be aromatized by zeolite catalysts and HZSM-5 catalyst yields
more aromatics than zeolite beta.
Apart from liquid reformates, certain larger amounts of gaseous products,
coke and solids were also produced during the α-olefin catalytic reforming reactions,
hence there was a need to quantify them. 1-hexene, alone was easily converted into light
aromatics (BTEX) and 1-tetradecene was found to be difficult to aromatize and hence
further aromatization experiments were conducted to convert it into BTEX by using
HZSM-5 as a catalyst.

167
Table 17. Preliminary catalytic reforming experimental conditions for α-olefins study
Experiment
Numbers Olefins
Temperature
(°C)
Time
(min.)
Catalyst amount
(g) and type
1 Octene 400 60 7 (HZSM-5)
2 1-Octene 300 30 5 (Zeolite beta)
3 1-Decene 400 15 5 (HZSM-5)
4 1-Decene 350 5 7 (HZSM-5)
5 1-Decene 400 5 5 (HZSM-5)
6 1-Tetradecene 400 5 5 (HZSM-5)
7 1-Hexene 400 30 5 (HZSM-5)
8 1-Hexene+1-tetradecene 400 30 5 (HZSM-5)
9 1-Hexene+1-Octene 350 15 5 (Zeolite beta)
10 1-Hexene+1-Decene 425 15 5 (HZSM-5)

168
BTEX obtained in each experiment
0
2
4
6
8
10
12
1 2 3 4 5 6 7 8 9 10
Experiment number
Aro
mati
cs (
% i
n O
LP
)
Benzene
Toluene
Ethylbenzene
p-xylene
o-xylene
Total BTEX
Figure 29. Results of preliminary catalytic reforming experiments performed on α-olefins.

169
C2: Catalytic conversion of thermally cracked crop (soybean) oil
Optimization of the reaction conditions for liquid, coke and gas yields during the
catalytic conversion of cracked crop oil over zeolite catalyst
Design of experiments (DOE) techniques were used for the optimization of
reaction conditions for the zeolite catalysis of cracked crop oil. A full factorial design
analysis allows one to obtain a basic knowledge of the effects of reaction conditions and
their statistical significance.
A two-level, three-factor full-factorial design was set up to determine which
factors influence each response. The three factors were the reaction temperature (A) in
ºC, OLP to catalyst ratio (OCR) designated as B, Reaction time (C) in minutes. The
responses measured were the % yields of liquids, coke/solids and gases. Yields were
determined by dividing the final weights of product responses by the mass of OLP fed to
the reactor. The design was unreplicated and the order of experiments was randomized.
Experimental noise was quantified using the method developed by Lenth [127]. This
method assumes that three-way interactions are not significant and uses these to estimate
the standard error. Hence, only individual factors and their two-way interactions were
considered for analysis.
Response Surface Methodology (RSM) consisting of a Central Composite Design (CCD)
was used for obtaining and processing the statistical experimental data.
Low and high levels were selected and coded into -1 and +1 whereas center points of the
factors were calculated by using a formula: [(high level-low level)/2] and coded as 0.
Results of experiments conducted at the center point levels were used for testing the

170
presence or absence of curvature in the statistical model. If there was a presence of a
significant curvature, then a quadratic model was proposed instead of a linear one. The
number of reaction factors in the factorial part of a CCD determined the alpha values
correspond to the star points [128].
A larger absolute value for an effect indicates that it has a greater impact on the
response. To evaluate the statistical significance of effects of various factors, a two-
sample t-test using the means at the high and low settings was performed and a
probability value (p-value) was calculated. For the effect to be statistically significant at a
95% confidence level, the p-value should be less than or equal to 0.05.
The ability to determine interactions is the major benefit of using a factorial DOE
approach. An interaction occurs when the effect of one factor depends on the value of
one of the other factors. The magnitude of an interaction is defined as one-half of the
difference between the effect of a factor at the high value of a second factor and the effect
of the first factor at the low value of the second factor. For this analysis, the statistical
software package, MINITABTM
15, was used as an analysis tool to obtain main effects
and interactions and to create Pareto, interaction, and other charts for interpretation.
Aromatization of OLP over HZSM-5 with a Silica:Alumina ratio of 50
A 2-level, 3-factor, full factorial experimental design was used to study the
feasibility of aromatizing soybean oil OLP. The low and high values of the factors are
shown in Table 18.

171
Table 18. Factors used to study OLP aromatization with their low and high values
Factors Low High
Temperature (ºC) 300 325
OLP to catalyst ratio (OCR) 5 10
Time (Min.) 20 60
All the OLP aromatization experiments were randomized and conducted using the
full factorial experimental design. It was observed that the liquid reformates contained
viscous (high molecular weight) compounds. The gluey (sticky) nature of these liquid
products might possibly be because of polymeric tar formation during the reforming step.
Liquids of high viscosity were non-elutable in GC. Hence, the liquid reformates were
distilled up to 300 ºC and these distilled samples were analyzed by GC-FID. The
concentrations of aromatic compounds were measured in the volume % of liquid
reformates. The results obtained are shown in Table 19.
Table 19. List of preliminary experiments consisting of the reaction conditions and
BTEX concentrations in the liquid products
Run
Temp.
(ºC)
OCR
Time
(Min.)
Benzene
(%)
Toluene
(%)
Ethylbenzene
(%)
p-xylene
(%)
o-xylene
(%)
Total
BTEX (%)
1 300 10 60 0.2492 1.271 0.9424 0.9852 0.8451 4.293
2 325 10 20 0.3368 1.614 1.127 1.554 0.9927 5.626
3 300 5 60 0.7668 4.182 2.101 6.451 2.005 15.50
4 300 5 20 0.2989 1.544 1.096 1.559 0.9750 5.474
5 325 5 20 0.6822 3.005 1.694 4.360 1.466 11.20
6 325 10 60 0.3605 1.732 1.176 1.988 1.028 6.285
7 300 10 20 0.2504 1.234 0.9095 0.8749 0.8252 4.094
8 325 5 60 0.9609 5.746 2.415 8.256 2.584 19.96
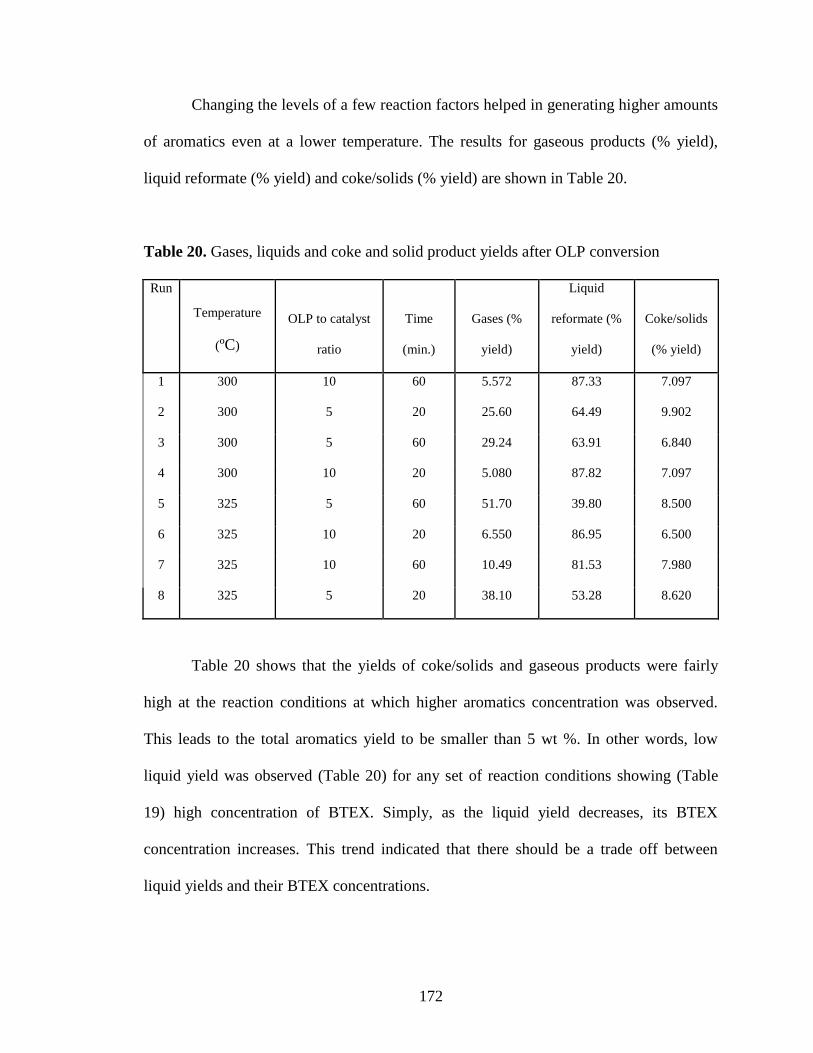
172
Changing the levels of a few reaction factors helped in generating higher amounts
of aromatics even at a lower temperature. The results for gaseous products (% yield),
liquid reformate (% yield) and coke/solids (% yield) are shown in Table 20.
Table 20. Gases, liquids and coke and solid product yields after OLP conversion
Run
Temperature
(ºC)
OLP to catalyst
ratio
Time
(min.)
Gases (%
yield)
Liquid
reformate (%
yield)
Coke/solids
(% yield)
1 300 10 60 5.572 87.33 7.097
2 300 5 20 25.60 64.49 9.902
3 300 5 60 29.24 63.91 6.840
4 300 10 20 5.080 87.82 7.097
5 325 5 60 51.70 39.80 8.500
6 325 10 20 6.550 86.95 6.500
7 325 10 60 10.49 81.53 7.980
8 325 5 20 38.10 53.28 8.620
Table 20 shows that the yields of coke/solids and gaseous products were fairly
high at the reaction conditions at which higher aromatics concentration was observed.
This leads to the total aromatics yield to be smaller than 5 wt %. In other words, low
liquid yield was observed (Table 20) for any set of reaction conditions showing (Table
19) high concentration of BTEX. Simply, as the liquid yield decreases, its BTEX
concentration increases. This trend indicated that there should be a trade off between
liquid yields and their BTEX concentrations.

173
As the reaction temperature increases from 300 ºC to 325 ºC, the concentration of
all the individual aromatics as well as total BTX increased (Table 19). A decrease in
OCR was responsible for an increase in aromatics contents in OLP. However, the
amounts of undesired gases products increased when OCR was low.
Effect of temperature
0
2
4
6
8
10
12
14
16
18
20
290 310 330 350 370 390
Temperature (°C)
Aro
ma
tic
s (
%) Benzene
Toluene
Ethylbenzene
p-xylene
o-xylene
Total BTEX
Figure 30. The effect of temperature on aromatization (BTEX concentration) at a
constant reaction time of 20 min. and OCR of 10.

174
Effect of reaction time
0
2
4
6
8
10
12
0 20 40 60 80 100
Reaction time (min.)
Aro
ma
tic
s (
%) Benzene
Toluene
Ethylbenzene
p-xylene
o-xylene
Total BTEX
Figure 31. The effect of reaction time on aromatization (BTEX concentration) at a
reaction temperature of 325 ºC and at a OCR of 10.
An increase in the reaction temperature from 325 ºC to 375 ºC and similar
increase in the reaction time from 60 minutes to 90 minutes, there was an abrupt rise in
the aromatics concentration in the reformates. It means that these two factors did not have
significant effects on aromatization up to 325 ºC and 60 minutes, but a significant rise in
aromatic concentration was observed beyond these limits. There was not much change
observed in the amount of gases formed. So, further optimization experiments will help
to study the effects of these factors on OLP aromatization optimum levels of factors.

175
New experimental design
With an increase in reaction temperature, the amount of liquid products obtained
was significantly lower. It was difficult to collect and separate liquids from coke/solids at
higher reaction temperature. (e.g. when the reaction conditions were reaction temperature
= 400 °C, OCR = 10 and reaction time = 90 minutes, yield of coke was about more than
20% by weight. Liquid product yield was low. Coke was deposited on the catalyst
particles and liquids were trapped in it. This caused difficulties in separating liquids).
Correspondingly, the yield of gaseous products also increased. Due to this effect, the
reaction pressure was difficult to control. When gas yield was higher, the reactor was shut
down to avoid explosion. It was concluded from the above facts that the present catalyst
produced very higher amounts of coke and gaseous products.
A new hypothesis was proposed and tested to control the yields of gases and coke.
According to this hypothesis, the silica:alumina (SiO2:Al2O3) ratio of HZSM-5 catalyst
was adjusted and activity tests were conducted (CBV 5524G vs CBV 2314). Our
previous studies [73] on propylene aromatization over HZSM-5 concluded that the
SiO2:Al2O3 ratio should be lowered for the greater yields of aromatic compounds. A new
HZSM-5 catalyst with a SiO2:Al2O3 ratio of 23 was used and a few exploratory
experiments were conducted. When the reaction conditions were reaction temperature =
400 °C, OCR = 10 and reaction time = 90 minutes, the yield of coke was less than 10%.
Thus coke formation was reduced to less than half. The reaction with a new catalyst was
easy to control and reaction pressure was significantly lowered within the range of
reactor’s safe operating limits.

176
Aromatization of OLP over HZSM-5 with a Silica:Alumina ratio of 23
Based on the above mentioned results, levels of experimental design were
changed, (Table 21).
Table 21. Experimental factors and their uncoded levels for OLP aromatization.
Factors Notation (-1)
Low values
(0)
Center
(+1)
High values
Reaction Temperature (ºC) A 300 350 400
OLP to catalyst ratio (OCR) B 7 11 15
Reaction time (minutes) C 5 12.5 20
Catalytic reforming experiments were conducted on the newly selected HZSM-5
catalyst having a SiO2:Al2O3 ratio of 23. Table 22 shows the reaction conditions chosen
and the yields of liquids, coke/solids as well as gaseous products.
Table 22. A full factorial experimental design consisting of the reaction conditions and
the responses
Expt
No.
Temperature
(ºC) OCR
Time
(min.)
%
Liquids
yield
% coke/solids
yield
% gases
yield
1 400 7 5 78 10 12
2 300 15 20 91 2.1 6.9
3 350 11 12.5 87 7 6
4 400 15 5 86 6 8
5 300 15 5 92 0.6 7.4
6 350 11 12.5 88 6.4 5.6
7 400 7 20 76 10 14
8 350 11 12.5 88 7 5
9 350 11 12.5 88 6.5 5.5
10 300 7 20 88 7.9 4.1
11 400 15 20 84 5 11
12 350 11 12.5 88 7 5
13 350 11 12.5 87 6.5 6.5
14 300 7 5 84 9 7

177
In the above listed full factorial design, six center point experiments were
included to test if any curvature is significant while preparing the statistical models. The
experimental design analysis was conducted by using Minitab 15 software. The main
effects plots are shown in the figure 32.
400350300
10
8
6
4
15117
20.012.55.0
10
8
6
4
Temperature (°C)
Me
an
OCR
Time (min.)
Corner
Center
Point Type
Main Effects Plot for % coke/solids yieldData Means
Figure 32. Main effect plots of coke/solids yields after OLP reforming
The main effects plots for coke / solid products yield (Fig. 32) indicate, the
outliers which represent the center point experiments (shown as red dots in all the plots).
The center points are not very far away from the main effects line. This usually happens
when there is an interaction effect which significantly affects the response. It also
suggests that the statistical model may be a linear model.

178
C
AC
BC
AB
A
B
2520151050
Te
rm
Standardized Effect
2.26
A Temperature
B O C R
C Time (min.)
Factor Name
Pareto Chart of the Standardized Effects(response is % coke/solids yield, Alpha = 0.05)
Figure 33. Pareto chart of coke/solids yields after OLP reforming
Figure 33 shows Pareto chart of the effects of each factor and the interaction for
the response (coke/solids yield). For example, ‘AB’ represents the effect of the
interaction between factors A (reaction temperature) and B (OCR). The vertical line in
this Pareto chart represents the line of significance, which is based on 95% confidence.
Any bar (representing the effect) in a Pareto chart extending beyond this line is
considered a significant term.
As per the method followed by Length [127], the three way interaction were
assumed to be insignificant and only two-way interactions were considered while
analyzing this full experimental factorial design. Two factors, namely reaction
temperature and OCR, were found to have significant effects on the yields of coke / solid
products. The reaction time did not affect coke yield at all.

179
15117 20.012.55.0
9
6
3
9
6
3
T emperature (°C)
OCR
T ime (min.)
300 Corner
350 Center
400 Corner
(°C)
Temperature
Point Type
7 Corner
11 Center
15 Corner
OCR Point Type
Interaction Plot for % coke/solids yieldData Means
Figure 34. Interaction plots for coke/solids yield after OLP reforming
One major advantage of using the DOE methodology is its ability to identify
significant interaction effects. The interaction between reaction temperature and OCR
was determined to have the largest significant effect on coke yield. The reaction time did
not show a significant effect on coke/solids yield. Hence, while proposing a statistical
model, reaction time factor was discarded and only the remaining two factors were taken
into account along with their interaction. Based on this information, the statistical model
for % coke/solids yield was proposed as follows:
Coke/solids yield=6.206+1.419*Temperature-2.906*OCR+0.531*Temperature*OCR
This can be represented as follows:
Y2=6.206+1.419*A-2.906*B+0.531*A*B
The contour plot appears as the following chart
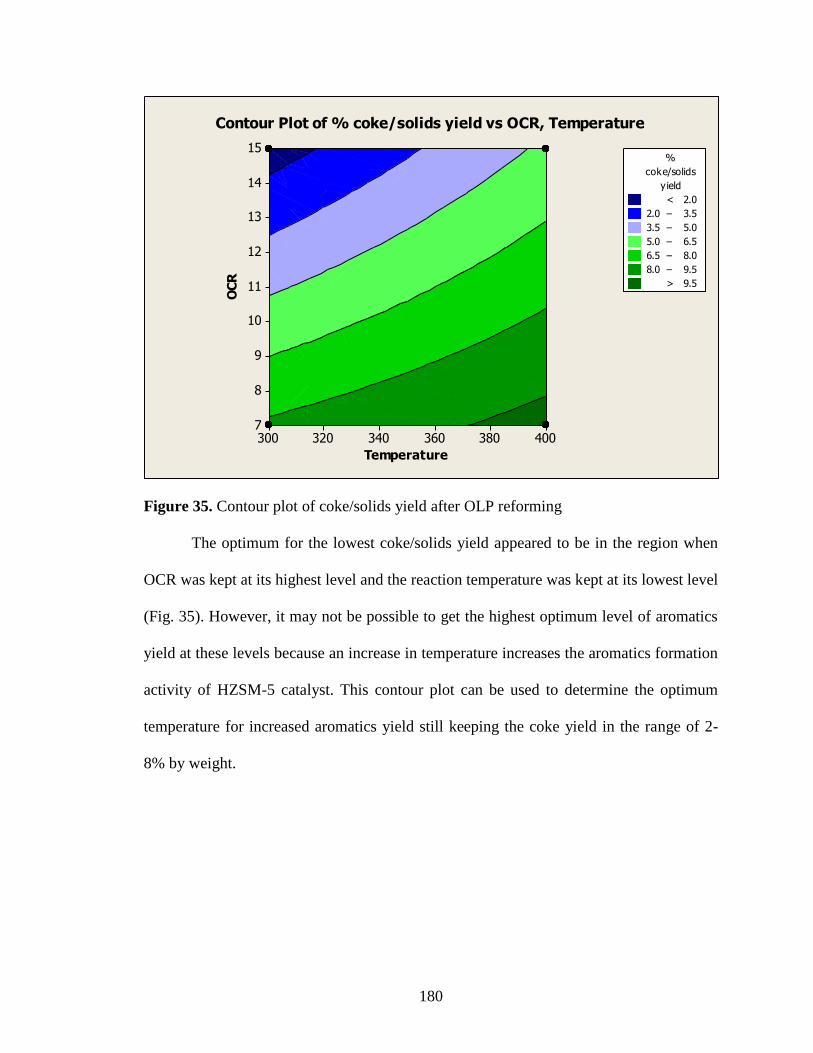
180
Temperature
OC
R
400380360340320300
15
14
13
12
11
10
9
8
7
>
–
–
–
–
–
< 2.0
2.0 3.5
3.5 5.0
5.0 6.5
6.5 8.0
8.0 9.5
9.5
yield
coke/solids
%
Contour Plot of % coke/solids yield vs OCR, Temperature
Figure 35. Contour plot of coke/solids yield after OLP reforming
The optimum for the lowest coke/solids yield appeared to be in the region when
OCR was kept at its highest level and the reaction temperature was kept at its lowest level
(Fig. 35). However, it may not be possible to get the highest optimum level of aromatics
yield at these levels because an increase in temperature increases the aromatics formation
activity of HZSM-5 catalyst. This contour plot can be used to determine the optimum
temperature for increased aromatics yield still keeping the coke yield in the range of 2-
8% by weight.

181
400350300
88
86
84
82
80
15117
20.012.55.0
88
86
84
82
80
Temperature (°C)
Me
an
OCR
Time (min.)
Corner
Center
Point Type
Main Effects Plot for % Liquids yieldData Means
400350300
12.0
10.5
9.0
7.5
6.0
15117
20.012.55.0
12.0
10.5
9.0
7.5
6.0
Temperature (°C)
Me
an
OCR
Time (min.)
Corner
Center
Point Type
Main Effects Plot for % gases yieldData Means
(a) (b)
Figure 36. Main effects plots for a) Liquid yield, b) gases yield obtained after OLP
conversion
Fig. 36 shows main effects plots for liquids and gases yields. For the yields of liquids and
gases the center points have P values less than 0.05. Since the center point P-values were
less than 0.05, center points are significant. Significant center point means there is a
significant curvature. So we do not have linear models for all these responses [128]. So, a
simple linear model cannot explain which variable contributes how much in the response.
Hence, star points were added in the experimental design and further experiments were
conducted. Table 23 shows a new design for the Response Surface Methodology (RSM)

182
Table 23. A Central Composite Design (CCD) design consisting of the experimental
reaction conditions and the responses
Expt.
No.
Temperature
(°C) OCR
Time
(min.)
% Liquids
yield
% coke/solids
yield
% gases
yield
1 350 11 12.5 87 7 6
2 400 7 20 76 9.8 14.2
3 300 7 20 88 7.9 4.1
4 300 15 20 91 2.1 6.9
5 350 11 12.5 88 6.4 5.6
6 400 15 20 84 5 11
7 400 7 5 78 9.5 12.5
8 300 7 5 84 9 7
9 350 11 12.5 88 7 5
10 300 15 5 92 0.6 7.4
11 400 15 5 86 6 8
12 350 11 12.5 88 6.5 5.5
13 350 11 24.7475 87 7 6
14 350 4.468 12.5 78 14 8
15 350 11 12.5 88 7 5
16 268.35 11 12.5 87 7 6
17 350 17.532 12.5 92 3.3 4.7
18 431.65 11 12.5 82 5 13
19 350 11 12.5 87 6.5 6.5
20 350 11 0.2525 88 7 5
These star points represent the square points [e.g. (OCR)2 ] which contribute to the
curvature. The square points contain the value of alpha (1.633). The exponent terms
result in the curvature and this model could contain the exponents up to 2nd
power.
RSM application for liquids and gases yields
An initial analysis of RSM Central Composite Design analysis showed neither the
factor, reaction time (C), nor its interactions and square terms had a significant effect on
both responses (liquids and gases yields). This was confirmed by checking their P-values
which were higher than 0.05.
A statistical model for % liquids yield was proposed as follows:

183
Liquids yield=87.59-2.937*Temperature+3.710*OCR-1.299*(Temperature)2 -
1.112*(OCR)2
This can be represented as follows:
Y1=87.59-2.937*A+3.710*B-1.299*A*A-1.112*B*B
Temperature (°C)
OC
R
420400380360340320300280
17.5
15.0
12.5
10.0
7.5
5.0
Time (min.) 12.5
Hold Values
>
–
–
–
–
< 70
70 75
75 80
80 85
85 90
90
yield
Liquids
%
Contour Plot of % Liquids yield vs OCR, Temperature (°C)
Figure 37. Contour plot of liquid yield obtained after OLP conversion
The contour plot of liquid yield is shown in Fig.37. The optimum for the highest
liquids yield appeared to be in the region when OCR was kept at its highest level and the
reaction temperature was kept at its lowest level. Similar to coke/solids yields, this
contour plot can be used to determine the optimum conditions for increased aromatics
yield because higher temperatures will be required to produce large amounts of aromatics
for HZSM-5 catalyst.

184
The statistical model for % gas yield was proposed as follows:
Gases yield=5.653+2.38*Temperature-0.7417*OCR+1.804*Temperature* Temperature
+0.6228*OCR*OCR-1.363*Time*Time
This can be represented as follows:
Y1=5.653+2.38*A-0.7417*B+1.804*A* A +0.6228*B*B-1.363*A*B
Temperature (°C)
OC
R
420400380360340320300280
17.5
15.0
12.5
10.0
7.5
5.0
Time (min.) 12.5
Hold Values
>
–
–
–
–
–
–
< 5.0
5.0 7.5
7.5 10.0
10.0 12.5
12.5 15.0
15.0 17.5
17.5 20.0
20.0
yield
% gases
Contour Plot of % gases yield vs OCR, Temperature (°C)
Figure 38. Contour plot of gases yield obtained after OLP conversion
The contour plot of gas yield is shown in Fig.38. The optimum for the lowest gas
fraction yield appeared to be in the region when OCR was kept near midpoint (center)
level and the reaction temperature was kept slightly below the center point. Similar to
coke/solids yields, this contour plot can be used to determine the optimum conditions for
increased aromatics yield because higher temperatures will be required to produce large
amounts of aromatics for HZSM-5 catalyst.

185
Highest aromatics yield was observed at the reaction conditions 432 C, OCR of
4.47 and reaction time of 12.5 minutes. Total yield of gaseous products was 15 % (wt/wt)
of OLP feed. A detailed analysis of these gaseous products was performed and the results
are listed as follows:
Table 24. Gaseous components of OLP reforming reaction
Gas component
Concentration (wt
%)
CO 2.8
methane 6.4
CO2 1.5
ethane 0.28
ethylene 13
propylene 54
butane 16
butene 2.1
pentane 0.57
hexane 0.58
Hydrogen 2.8
The production of CO and CO2 confirms that the HZSM-5 catalyst is capable of
decarboxylation of oxygenated compounds of the feedstocks. Mechanistic considerations
of decarboxylation reactions over HZSM-5 are discussed in the forthcoming section of
liquid product analysis. 54 % of gaseous products constitute propylene alone. This shows
that the HZSM-5 catalyst is highly selective towards of propylene as a cracked gaseous
product.
Optimization of the reaction conditions for maximizing aromatics yield
A full factorial design with center points was prepared and experiments were
conducted. The results are listed in Table 25.

186
Table 25. A full factorial experimental design consisting of the reaction conditions and
the response for initial OLP aromatization runs
Experiment No. Temperature (ºC) OCR Time (min.) BTEX yield (wt %)
1 400 15 5 2.2
2 300 7 5 1.8
3 300 15 20 1.7
4 400 7 20 3.8
5 400 15 20 2.0
6 400 7 5 2.5
7 350 11 12.5 2.0
8 350 11 12.5 2.0
9 300 15 5 1.5
10 300 7 20 1.9
The DOE analysis shows that the reaction time did not significantly affect the
BTEX yield. An increase in the aromatization reaction temperature significantly
increases the BTEX yield. In contrast, a decrease in OCR was responsible for a
significant increase in the BTEX yield. The center point does not fit linearly because it
deviate from the linear plots of reaction temperature, time as well as OCR. This leads to a
conclusion that a curvature exists and the final model is nonlinear (quadratic). This was
also confirmed by verifying the p-values of center point/curvature in the regression
analysis.
The Central composite design with the star points was then used for the
optimization of reaction conditions through a proposal of a quadratic model. The results
are listed in Table 26.

187
Table 26. A Central Composite Design consisting of the experimental reaction conditions
and the responses
Table 26 summarizes the yields of aromatic compounds for the respective sets of
experimental conditions. The statistical model was trimmed to only the significant factors
and the interactions as per the CCD methodology [128]. The residual vs. fits, residual vs.
order and the Normal Probability plots indicate the verification and satisfaction of the
three assumptions:
(1) Residuals are randomly and normally distributed, (2) residuals are not correlated with
the predicted Y, and (3) residuals do not exhibit any trends over time [128].
This means that the model statistically fits well.

188
0.500.250.00-0.25-0.50
99
90
50
10
1
Residual
Pe
rce
nt
3.53.02.52.01.5
0.50
0.25
0.00
-0.25
-0.50
Fitted Value
Re
sid
ua
l
86420
Residual
2018161412108642
0.50
0.25
0.00
-0.25
-0.50
Observation Order
Re
sid
ua
l
Normal Probability Plot Versus Fits
Versus Order
Residual Plots for BTEX yield
Figure 39. Residual plots for BTEX yield obtained after OLP conversion
The contour and surface plots were obtained by the Response Surface
Methodology technique (shown in the following Figs. 40 and 41). The areas of greater
aromatics yields are distinctly visible in these plots.
Temperature (°C)
OC
R
420400380360340320300280
17.5
15.0
12.5
10.0
7.5
5.0
>
–
–
–
–
< 1.5
1.5 2.0
2.0 2.5
2.5 3.0
3.0 3.5
3.5
BTEX yield
Contour Plot of BTEX yield vs OCR, Temperature (°C)
Figure 40. Contour plot of BTEX yield obtained after OLP conversion

189
15
1
20.0
0
22.5
25.0
27.5
300350 5
400450
Total aromatics
OCR
Temperature (°C)
Surface Plot of Total aromatics vs OCR, Temperature (°C)
Figure 41. Surface plot of aromatics yield obtained after OLP conversion
A statistical model was proposed as follows:
Model: 1.97 + 0.501*Temperature – 0.231*OCR + 0.264*(Temperature)2
By the use of Response Optimizer tool, the predicted optimized conditions were
found as the reaction temperature of 432 ºC and the OCR of 4.47. Aromatization
experiments were performed in duplicate at these reaction conditions and the results were
as follows:
Coke yield = 5 % (5 % for the replicate)
Liquid products yield = 80% (81% for the replicate)
Gaseous products yield = 15 % (14 %or the replicate)
The detailed identification of non-BTEX aromatics was performed. Surprisingly,
this sample contained significant amounts of alkyl benzenes totaling to about 60 %
aromatics in the liquid reformate products.
Conclusions

190
Non-catalytically cracked soybean oil can be aromatized by using HZSM-5
catalysts. Initial feasibility experiments suggested that the OLP to the catalyst ratio was
the only factor having a significant detrimental effect on aromatization. Reaction time
and temperature tend to have a positive incremental effect on aromatization. Further
experiments were conducted in search of optimum reaction conditions for highest yields
of aromatics and liquids products as well as the lowest possible yields of coke/solids and
gases. Response Surface Methodology (RSM) was used for optimization and the contour
plots clearly showed the regions of optimum levels of liquids, coke and gases yields. The
reaction temperature and OCR were found to have significant effects on the responses
whereas reaction time was not significant. A statistical linear model was proposed for
coke/solids yield. However the resulting data did not fit in linear models and hence
quadratic models were proposed for liquids and gases yields. It was found that the highest
yield of total aromatics (47 wt%) was obtained at optimum reaction temperature 432 °C
and OCR 4.47. Alkanes and cyclic compounds were also produced in significant
quantities. The negligible yields of alkenes and carboxylic acids in the catalytic
reforming step lead to the conclusion that the smaller silica:alumina ratio of HZSM-5 is
preferred for aromatization reactions in which decarboxylation is desired.

191
APPENDIX D: PUBLISHED PREPRINTS
This section represents the published part of this research work. The papers are
listed as they are published by American Chemical Society. The figure numbers, table
numbers of these preprints are not changed into the dissertation format to distinguish
them as published material (as is).
D1: Preprint Paper - American Chemical Society, Div. Fuel Chem. 2011, 56 (2), 596.
TRIGLYCERIDES AS AN ALTERNATIVE FEEDSTOCK FOR
AROMATIC COMPOUNDS
Swapnil L. Fegade1, Brian Tande
1, Wayne Seames
1, Alena Kubátová
2, Evguenii Kozliak
2
1Department of Chemical Engineering, University of North Dakota, 241 Centennial
Drive, Grand Forks, ND 58202-7101, USA
2Department of Chemistry, University of North Dakota, P.O. Box 9024, Grand Forks, ND
58202, USA
ABSTRACT
A successful attempt was made to convert cracked soybean oil into aromatic
compounds by using HZSM-5 catalyst. The reaction temperature tends to have lower
effect on aromatization below 325 °C. A significant increase in aromatics concentration
was observed when the reaction temperature was increased to 375 °C. Similarly, an
increase in reaction time also resulted in an increase in aromatics concentration in the
liquid products. Individual products distribution was greatly influenced by the ratio of
organic liquid product (OLP) to catalyst ratio. Soybean oil could be an effective
alternative feedstock for the production of aromatic compounds.

192
Introduction
Currently, the primary source of BTEX, other aromatics, and industrial organic
chemicals is petroleum. Considering the limited availability of petroleum, there is a
growing interest in developing renewable resources for aromatics and other organic
chemicals. For example, because lignins are polymeric materials made of complex
aromatic rings, many attempts have been made to produce aromatics from lignin. These
include several successful attempts to prepare phenolics by the pyrolysis of lignin present
the wood[129]. In the oxidative environment, the pyrolysis and depolymerization of
lignin based polymeric materials produce aromatic aldehydes; while reductive
environment was responsible for producing alkyl phenols[130].
Low temperature catalytic pyrolysis and hydropyrolysis of woody biomass showed a
product distribution of a wide range of aromatic hydrocarbons. The first step is the
decomposition of this woody biomass. The decomposed mass then undergoes secondary
reactions to produce light hydrocarbon molecules. It was also observed that the catalyst
selection is very important in aromatization of biomass. This product distribution could
be controlled by controlling the reaction conditions[131].
Triglyceride oils, such as palm oil, canola oil and other crop oils, are also a promising
feedstock for the production of valuable organic chemicals, including aromatics. The
non-catalytic as well as catalytic cracking of these molecules under FCC conditions
yields aromatic hydrocarbon molecules. The catalytic cracking of triglyceride oils also
produces water, CO, CO2 and other hydrocarbons by removing oxygen carbon and
hydrogen from the molecule[132].
Katikaneni et. al., studied the catalytic cracking of canola oil to convert it into fuels

193
and chemicals[133] and found that the organic liquid products (OLP) obtained by canola
oil cracking consisted of aliphatic as well as aromatic hydrocarbons. They also found that
the amount of aromatics formed was more when the reaction temperature and catalyst
acidity were increased. The comparative studies of the catalysts showed that HZSM-5
yields more aromatic compounds. The objective of this work is to determine the
feasibility of converting cracked soybean oil into more valuable aromatic compounds
such as benzene, toluene, ethylbenzene, p-xylene, o-xylene (BTEX).
Experimental
Materials. The catalyst ZSM-5 (CBV5524G) was purchased from Zeolyst International.
GC grade standards, benzene, toluene, ethylbenzene, p-xylene, o-xylene and 2-
chlorotoluene were also purchased from Sigma-Aldrich. Organic liquid products (OLP)
were obtained from cracked soybean oil[134].
Catalytic conversion of OLP. The required amounts of catalyst and soybean oil
OLP were charged to the autoclave reactor. This reactor was closed, and then was purged
with nitrogen gas to remove air. Once the purging was over, the nitrogen valve was
closed. All the inlet and outlet valves of the reactor were also closed. The water flows
were started for the reactor cooling channels and for a condenser connected to reactor.
The reactor was heated while the reactor contents were stirred at set values. Once the
reaction was over, the reactor contents were allowed to cool down to room temperature
and then the gaseous products were collected in a gas bag by slowly opening reactor vent.
The coke/solid particles were separated from liquid products. The reaction temperature
(°C), OLP to catalyst ratio (OCR), and reaction time (minutes) were chosen as the
reaction conditions to be studied. After each aromatization run, the amounts of gases,

194
liquids and coke/solids formed were determined and the liquid products were further
analyzed to find out % total BTEX (benzene, toluene, ethylbenzene and xylenes) in liquid
products.
The liquid products obtained from the above experimental runs, were analyzed on HP
5890 series II gas chromatograph by using 2-cholrotoluene as an internal standard. The
injector and detector temperatures of GC were set at 250 °C and 300 °C respectively. A
proper separation of peaks was obtained by temperature programming on GC. The
temperature program was started at 30 °C for 1 minute and then ramped at 10 °C / minute
to 250 °C and maintained at this temperature for 15 minutes.
Results and Discussion
After the products analysis on GC, it was observed that the liquid products obtained
after catalytic conversion contained benzene, toluene, ethylbenzene and xylenes. A
decrease in the feed OLP to catalyst ratio significantly increased the % of all individual
aromatics as well as total BTEX present in the liquid products. From fig. 1, it can be
clearly seen that this increase in all individual aromatics is not directly proportional to a

195
decrease in the OLP to catalyst ratio. The products distribution is greatly influenced by
the OCR.
0
5
10
15
20
25
Benze
ne
Toluene
Eth
ylben
zene
p-xylene
o-xylene
Total B
TEX
Vo
l. %
OLP to catalyst ratio = 5 OLP to catalyst ratio = 10
Figure 1. The Individual aromatics volume % along with total BTEX present in the
liquid products obtained by using two different OLP to catalyst ratios.
Table 1. The % yields of gases, liquids and coke/solids obtained along with the
reaction conditions
Temperature
(oC)
OLP to
catalyst
ratio
Time
(min.)
Gases
(%
yield)
Liquid
reformate
(% yield)
Coke/solids
(% yield)
300 10 60 5.6 87 7.1
300 5 20 26 66 9.9
300 5 60 29 64 6.8
300 10 20 5.1 88 7.1
325 5 60 52 40 8.5
325 10 20 6.6 87 6.5

196
325 10 60 11 82 8.0
325 5 20 38 53 8.6
Table 1 shows the % yields of gases, liquids as well as solids/coke produced in each
experiment. The OLP to catalyst ratio is the only factor which had a significant effect on
the yields of gases and liquid products. When organic chemicals come in contact with
HZSM-5, they also undergo catalytic cracking and produce many small gaseous
molecules. If OCR is at a lower level, an amount of catalyst available for cracking
activity increases, therefore amount of gases formed also increases. None of these factors
showed a significant effect on the % yield of coke and solid products.
Effect of temperature
0
2
4
6
8
10
12
14
16
18
20
290 310 330 350 370 390
Temperature (°C)
Aro
ma
tic
s (
%) Benzene
Toluene
Ethylbenzene
p-xylene
o-xylene
Total BTEX
Figure 2. The effect of temperature on aromatization of OLP keeping reaction time of 20
min. and OCR of 10 as constants.

197
Effect of reaction time
0
2
4
6
8
10
12
0 20 40 60 80 100
Reaction time (min.)
Aro
ma
tic
s (
%) Benzene
Toluene
Ethylbenzene
p-xylene
o-xylene
Total BTEX
Figure 3. The effect of reaction time on aromatization keeping reaction temperature of
325 °C and OCR of 10 as constants.
Figures 2 and 3 as shown above, clearly indicate that with an increase in the reaction
temperature from 325 °C to 375 °C and similar increase in the reaction time from 60
minutes to 90 minutes, there was an abrupt rise in the aromatics contents of the liquid
products. This indicates that the catalyst is more active for aromatization above 325 °C.
These two factors did not have significant effects on aromatization up to 325 °C and 60
minutes, but significant rise in aromatics contents was observed beyond these limits.
There was not much change observed in the amount of gases formed at these conditions.
So, further optimization experiments will help to study the effects of these factors on
OLP aromatization at optimum levels of reaction conditions.
Conclusions
Soybean oil OLP can be successfully aromatized by using HZSM-5 catalysts. OLP to
the catalyst ratio was found to have a greater detrimental effect on aromatization.
Reaction time and temperature tend to have a positive incremental effect on

198
aromatization. The yields of gaseous products as well as liquid reformates are
significantly affected by OLP to catalyst ratio. Yield of gases are lowered and yields of
liquid reformates are increased with the increase in this ratio. Further experiments at
optimum levels of reaction temperatures and time will be beneficial to increase the yield
of OLP, amount of BTEX and to decrease the yield of gases.
Acknowledgements. USDA (contract 2008-35504-04515) and the ND Department
of Commerce Centers of Excellence Program were greatly acknowledged for financial
support.
199
D2: Preprint Paper - American Chemical Society, Div. Pet. Chem. 2011, 56(2), 238.
CATALYTIC CONVERSION OF 1-TETRADECENE TO AROMATIC
COMPOUNDS OVER ZEOLITES UNDER MILD CONDITIONS
Swapnil L. Fegade1, Brian Tande
1, Wayne Seames
1, Alena Kubátová
2, Evguenii Kozliak
2
1Department of Chemical Engineering, University of North Dakota, 241 Centennial
Drive, Grand Forks, ND 58202-7101, USA
2Department of Chemistry, University of North Dakota, P.O. Box 9024, Grand Forks, ND
58202, USA
ABSTRACT
Catalytic cracking of1-tetradecene was performed by using HZSM-5 catalyst to
determine the feasibility of producing value-added aromatic compounds such as benzene,
toluene, ethylbenzene and xylenes (BTEX). A two level, full factorial design of
experiments was applied to determine which factors significantly influence the catalytic
cracking process. Three factors, temperature (300-3750C), olefin to catalyst ratio (10-20)
and reaction time (30-60 Min.) were chosen for this study. An increase in the reaction
temperature increases the % total BTEX in liquid products and an increase in olefin to
catalyst ratio decreases the amount of total BTEX in liquid products. However, these
trends were exactly opposite for the % yield of liquid products. The results of this study
may be used to recycle waste 1-tetradecene from functional drilling fluids, and may likely
be applicable to other alpha olefins.

200
Introduction
Presently, the sources for the production of aromatic compounds are petroleum,
fossil fuels and coal. Various processes were commercialized for converting light
alkanes, olefins and petroleum naphtha into aromatic compounds via catalytic cracking
and reforming routes. Current academic as well as industrial research is focused on the
production of aromatic compounds from light alkanes and alkenes[28, 34, 38, 41, 41, 44,
47, 65, 67]. Although there is work done on aromatization of lower olefins and mid chain
(C6, C8) olefins, there is a lack of work on aromatization of α-olefins having more than
10 carbon atoms[59, 76]. The α-olefin 1-tetradecene is commercially important for the
manufacture of detergents, surfactants, linear alkylbenzenes and most of the academic
and industrial research studies about 1-tetradecene have been presently concentrated on
using it as comonomer in copolymerization reactions[83]. 1-tetradecene is also used in
functional drilling fluids, lubricants, automotive additives, metal working agents. Apart
from these, the applications of 1-tetradecene are limited and hence there is a need to
explore new applications for this α-olefin. In the present study, our preliminary objective
is to study the feasibility of using 1-tetradecene as a source for producing aromatics rich
liquids and to determine what factors significantly influence this aromatization process.
Experimental
Materials. The catalysts ZSM-5 (CBV5524G) was purchased from Zeolyst
International. 1-tetradecene was purchased from Sigma-Aldrich. GC grade standards,
benzene, toluene, ethylbenzene, p-xylene, o-xylene and 2-chlorotoluene were also
purchased from Sigma-Aldrich.

201
Catalyst preparation. The catalyst calcination was first performed at 500 °C for 5
hours in an air circulated oven. This commercial catalyst was present in ammonium form.
During calcination, the catalyst was converted into the hydrogen form and this catalyst
was then identified as HZSM-5. This HZSM-5 catalyst was then used for catalytic
conversion of 1-tetradecene.
Catalytic conversion of 1-tetradecene. The required amounts of catalyst and 1-
tetradecene were charged to the autoclave reactor. This reactor was closed, and then was
purged with nitrogen gas to remove air. Once the purging was over, the nitrogen valve
was closed. All of the inlet and outlet valves of reactor were also closed. The water flows
were started for the reactor cooling channel and for a condenser connected to reactor. The
reactor was heated and the reactor contents were stirred at set values. Once the reaction
was over, the reactor contents were allowed to cool down to room temperature and then
the gaseous products were collected in a gas bag by slowly opening the reactor vent. The
coke/solid particles were then separated from the liquid products.
The liquid products obtained from the experimental runs, were analyzed on an HP
5890 series II gas chromatograph by using 2-cholrotoluene as an internal standard. The
injector and detector temperatures of GC were set at 250 °C and 300 °C, respectively. A
proper separation of peaks was obtained by temperature programming on GC. The
temperature program was started at 50 °C for 1 minute and then ramped at 10 °C / minute
to 250 °C and maintained at this temperature for 15 minutes.
Statistical design of experiments (DOE). A 2 level, 3 factor, full factorial
experimental design was used to find out which factors significantly affected the catalytic
conversion of 1-tetradecene. The reaction temperature (°C), olefin (1-tetradecene) to

202
catalyst ratio (OCR), and reaction time (minutes) were chosen as the factors. After each
aromatization run, the amounts of gases, liquids and coke/solids formed were determined
and the organic liquid products were further analyzed to determine the total composition
of BTEX (benzene, toluene, ethylbenzene and xylenes). The low and high values of the
factors are shown in Table 1.
Factors Low High
(A) Temperature (°C) 300 375
(B) Olefin to catalyst ratio
(OCR)
10 20
(C) Time (Min.) 30 60
Results and Discussion
It was found that temperature has a significant effect on % total BTEX present in
liquid products, as shown by the Pareto charts of the standardized effects (Fig. 1). Fig. 2
shows the main effects plots and it is clearly seen that as the reaction temperature
increases from 300 °C to 375 °C, the % of the total BTX in liquid products increases. The
olefin to catalyst ratio showed a positive incremental effect on aromatization. On the
other hand, the third factor, reaction time, was not significant for BTEX production.
From Fig. 2, it was observed that the aromatic content in the reformates decreased when
the olefin to catalyst ratio was increased from 10 to 20.

203
AC
C
BC
AB
B
A
6050403020100
Term
Standardized Effect
12.71
A Temperature (°C )
B O lefin to cataly st ratio
C Time (min.)
Factor Name
Pareto Chart of the Standardized Effects(response is Total BTEX (%), Alpha = 0.05)
Figure 1. A Pareto chart of the standardized effects for % total BTEX present in OLP.
Bars extending beyond the vertical line represent effects that are considered statistically
significant.
375300
15.0
12.5
10.0
7.5
5.0
2010
6030
15.0
12.5
10.0
7.5
5.0
Temperature (°C)
Me
an
Olefin to catalyst ratio
Time (min.)
Main Effects Plot for Total BTEX (%)Data Means
Figure 2. Main effects plots for % total BTEX present in OLP. These plots compare the
average value for % yield at the two levels for each factor. Each point represents the
average of four experiments.
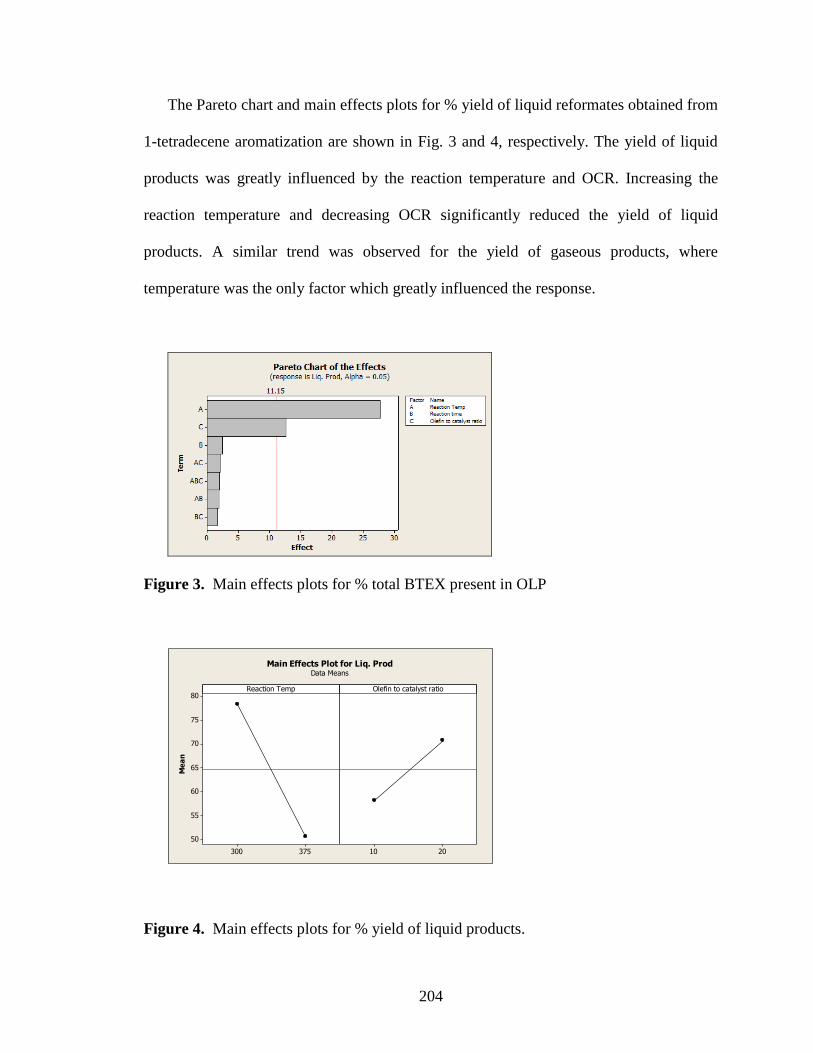
204
The Pareto chart and main effects plots for % yield of liquid reformates obtained from
1-tetradecene aromatization are shown in Fig. 3 and 4, respectively. The yield of liquid
products was greatly influenced by the reaction temperature and OCR. Increasing the
reaction temperature and decreasing OCR significantly reduced the yield of liquid
products. A similar trend was observed for the yield of gaseous products, where
temperature was the only factor which greatly influenced the response.
Figure 3. Main effects plots for % total BTEX present in OLP
375300
80
75
70
65
60
55
50
2010
Reaction Temp
Me
an
Olefin to catalyst ratio
Main Effects Plot for Liq. ProdData Means
Figure 4. Main effects plots for % yield of liquid products.

205
Conclusions
Aromatics rich, naphtha - like, liquid products were produced by using HZSM-5 as a
catalyst under mild conditions via catalytic cracking of 1-tetradecene. Temperature
significantly increased the concentration of total BTEX, while olefin to catalyst ratio
significantly decreased the concentration of BTEX in liquid products. These trends were
significantly reversed for % yields of liquid products. This study, in future, may open
doors for pure or waste 1-tetradecene to be used as a feedstock for the production of
value-added aromatic compounds.
Acknowledgement. USDA, the ND Soybean Council, the ND Department of
Commerce Centers of Excellence Program, ND EPSCoR and ND SUNRISE were greatly
acknowledged for financial support.

206
D3: Preprint Paper - American Chemical Society, Div. Pet. Chem. 2011, 56(1), 159.
PRODUCTION OF BIO-BASED AROMATIC COMPOUNDS FROM CROP OIL
Swapnil Fegade1, Swastika Bithi
1, Brian Tande
1, Wayne Seames
1, Darrin Muggli
2, Alena
Kubátová3, Evguenii Kozliak
3
1Department of Chemical Engineering, University of North Dakota, 241 Centennial
Drive, Stop 7101, Grand Forks, ND 58202-7101, USA
2Department of Engineering, Benedictine College, 1020 North 2
nd Street Atchison, KS
66002, USA
3Department of Chemistry, University of North Dakota, Grand Forks, ND 58202,USA
Abstract
In this work we evaluate the feasibility of producing bio-based aromatic compounds
from crop oil via catalytic cracking. Experiments were conducted in a continuous flow
reactor by using doped zeolite catalysts. A design of experiments (DOE) strategy was
applied and six factors were included. In the DOE analysis, the responses of interest were
the selectivities for individual aromatics, such as benzene, toluene, ethylbenzene, and
xylenes, as well as the overall yield of BTEX. It was found that reaction temperature and
the amount of initial oil charged (oil to catalyst ratio) negatively influenced the overall
aromatics yield, while dopant concentration was positively correlated to aromatic yields.
A significant interaction between dopant concentration and initial oil charged was found
and could be used for controlling toluene yield and thus overall BTEX yield. Our work

207
suggests that crop oils could be a very effective renewable feedstock for the production of
aromatic compounds.
Introduction
Aromatic compounds such as benzenes, toluene ethylbenzene and xylenes (BTEX),
are of greatest interest to the petrochemical industries and petroleum refineries because
they are starting materials for manufacturing polymers, resins and elastomers. They are
also present in gasoline to increase its octane rating. The most common use of BTEX is
as solvents and thus they have unlimited applications. The promising method for the
production of aromatic compounds (BTEX) is catalytic conversion [1, 2]. Currently, the
primary source of BTEX, other aromatics and industrial organic chemicals is petroleum.
Considering the limits of availability of petroleum, there is a need and growing interest in
exploring the renewable resources for producing aromatics and organic chemicals. As we
know that lignins are polymeric materials made of complex aromatic rings. There were
several successful attempts made to prepare phenolics by the pyrolysis of lignin present
in the wood [3]. In the oxidative environment, the pyrolysis and depolymerization of
lignin based polymeric materials produce aromatic aldehydes; while reductive
environment was responsible for producing alkyl phenols [4]. Crop oil can be converted
into fuels and other hydrocarbons by catalytic cracking over HZSM-5, hydrogen-zeolite
Y, silica –alumina, H-mordenite, silica alumina-pillared clay and other solid acid
catalysts [5-9]. Among all catalysts, HZSM-5 showed the greatest selectivity to
aromatics. Doped and composite catalyst (mesoporous molecular sieves and HZSM-5)
and nano size ZSM-5 can also be used for increasing the conversion of crop oil into

208
aromatics[10-11]. In this present study, our main objective is apply the fractional factorial
design of experiments strategy [12-14] for crop oil catalytic cracking process and to
screen significant factors and interactions influencing aromatization of crop oils to
produce BTEX. The other objective is to prepare a statistical model for this catalytic
cracking process for efficient production of renewable aromatics.
Experimental
The experimental apparatus used in catalytic cracking and aromatization is shown in
Figure 1. This batch catalyst reaction system contains four main components: an oil
flask, a quartz reactor column, two condensers and a product collector.
FI
Nitrogen
T
T
Catalyst Bed Temperature Display
Soybean Oil Heating Mantle
Rotameter
H2O In
H2O Out
Product
Catalyst
Heater
Thermocouple
Condenser
Oil Temperature Display
Reactor Column

209
Figure 1. Experimental Setup for Cracking and Aromatization Reaction.
The total length of the quartz reactor column, connected to the center neck of the oil
flask, was 300 mm. The reactor had a 24/40 top outer joint, sealed to 25 mm ID tubing
and a 24/40 bottom inner joint. There were 5 indents above the inner joint.
Catalysts. Zeolite catalyst, ZSM-5(SiO2/Al2O3 ratio 50) in the NH4–form, was
purchased from Zeolyst International. The NH4-form was calcinated in air oven (500°C;
4h) to yield HZSM-5. Zn-ZSM-5 and Ga-ZSM-5 were prepared by a slight modification
of the procedure by Saha et al. [15].
Fractional factorial design. A one-quarter (1/4), two level, resolution-IV fractional
factorial screening design was constructed. Six factors were studied to determine their
effects on seven responses. Because the design is of resolution IV, main effects are clear
of two-factor interactions but two factor interactions are confounded with each other. The
six factors studied were as follows:
Dopant identity (A); (Zn. Ga)
Dopant concentration (B); (0.5wt%, 3wt%)
Reaction temperature (C), (400, 500°C)
Initial oil charge (D);(37, 64g)
N2 flow rate (E); (100, 150ml/min)
Reaction time (F); (80, 120 min)

210
For each experiment, exactly 8.19 g of catalyst was used. The oil heating rate was
same for all 16 experiments. Seven responses (% yields of benzene, toluene,
ethylbenzene, m-xylene, p-xylene, o-xylene and total BTEX) were measured during the
cracking reactions.
The original experimental factors (uncoded units) were transformed into coded units
and designated as −1 (low) and +1 (high).The net effect was found out by using a
difference between the responses of high and low levels of factors. The relative strength
of an estimated effect over the response was determined by its calculated value. Higher
the value of the effect higher is the influence over the response. To evaluate the statistical
significance of effects of factors, the probability value (p-Value) is used for the effect to
be statistically significant, at a 95% confidence level the p-value should be less than or
equal to 0.05. The most important part was to study the effect of interactions of factors.
We have to define interaction when the effect of one factor relies on the adjustment of
one or more other factors. An interaction between two factors is known as ‘two way
interaction’. The extent of an interaction can be defined as the difference between the
average of half the responses and the average of the other half of the responses. For a
fractional factorial design, manual estimation of above mentioned tasks becomes
complicated and hence we used MINITABTM
15 as a tool for DOE analysis to obtain
significant data, main effects, Pareto, interactions and other charts [13, 15].
Lab scale catalytic cracking and aromatization procedure. The catalyst bed was
prepared between the bottom and top quartz wool sections inside the reactor. Then the
thermocouple was inserted inside the reactor. The 4-neck flask contained certain weighed
amounts of soybean oil. The reactor was then connected to the center neck of the flask.

211
Then the N2 flow rate was set according to the experimental design by use of a rotameter.
The reaction temperature was set in the temperature controller. Usually the catalyst bed
temperature reached the set point within 20-30min. Then the oil started heating at a rate
of 9.5°C/min until the oil temperature reached 405±5°C using the heating mantle. The
mantle controller maintained this temperature throughout the reaction. Depending on the
experiment, a cracking reaction was continued for 80-120 min and the condensed organic
liquid product (OLP) was collected in the collection flask. A semi quantitative analysis of
OLP was performed by using GC-FID.
Results and Discussion
All experimental runs were carried out according to the fractional factorial design.
The analysis of this factorial design data was conducted at 95% confidence level.
Fig. 2a represents the pareto charts for yield of toluene. The vertical red line in this
chart represents the line of significance, determined by using the ‘t’ statistics. Any term
having the effect/bar beyond this line, is called known a significant term. If a term is
combined with another term in pareto chart, then it is known as the interaction term. For
example, ‘BD’ in Fig. 2c shows the effect of the interaction between B (dopant
concentration) and D (initial oil charged).
Factors and interactions influencing yield of toluene
From fig. 2a and 2b, it can be clearly seen that initial oil charge, reaction
temperature and dopant concentration significantly influence the yield of toluene. Highest
yield of toluene was observed when the dopant concentration was at a higher level and
when the reaction temperature and initial oil charge were at a lower level. An interaction

212
of the factors, dopant concentration and initial oil charged, was found to have a
significant effect on toluene yield. At a higher level of initial oil charge, the yield of
toluene was almost the same, regardless of the level of dopant concentration. At a lower
level of initial oil charge, toluene yield was increased and was the highest when the
dopant concentration was raised to 3 %.
(2 a)
(2 b)
3.00.5
2.5
2.0
1.5
1.0
500400
6437
2.5
2.0
1.5
1.0
Dopant concentration (wt%)
Me
an
Reaction temperature(°C)
Initial oil charge (g)
Main Effects Plot for Toluene (% yield)Data Means

213
(2 c)
6437
3.5
3.0
2.5
2.0
1.5
1.0
Initial oil charge (g)
Me
an
0.5
3.0
(wt%)
concentration
Dopant
Interaction Plot for Toluene (% yield)Data Means
Figure 2. Pareto chart, main effects and interaction plots for toluene (% yield)
Factors and interactions influencing yields of xylenes
Fig. 3a, 3c, 3e represent Pareto charts and Fig. 3b, 3d, 4f represent the main
effects plots for individual % yields of m-xylene, p-xylene and o-xylene respectively. It
was found that initial oil charged was the only factor showing a significant effect on
yields of all the individual xylenes. When the amount of initial oil charged was increased
from 37 grams to 64 grams, the % yields of xylenes tend to decrease greatly. There were
no interactions affecting the yields of xylenes.

214
(3 a)
(3 b)
6437
1.0
0.9
0.8
0.7
0.6
0.5
0.4
0.3
0.2
Initial oil charge (g)
Me
an
Main Effects Plot for m-xylene (% yield)Data Means
(3 c)

215
(3 d)
6437
0.35
0.30
0.25
0.20
0.15
0.10
Initial oil charge (g)
Me
an
Main Effects Plot for p-xylene (% yield)Data Means
(3 e)

216
(3 f)
6437
0.45
0.40
0.35
0.30
0.25
0.20
0.15
0.10
Initial oil charge (g)
Me
an
Main Effects Plot for o-xylene (% yield)Data Means
Figure 3. Pareto charts and main effects plots for individual xylenes (% yield)
Factors and interactions influencing overall yield of total BTEX
Pareto chart of the effects is shown in Fig. 4a. It was observed that, the reaction
temperature, initial oil charge and dopant concentration were the factors those showed a
significant effect on the % yield of total BTEX. From Fig. 4b, it can be seen that the
highest overall yield of total BTEX was observed when the dopant concentration was at a
higher level. This is a clear indication of the fact that doped catalysts help in increasing
the aromatics yields.
When the reaction temperature was increased from 400 0C to 500
0C, the overall
yield of aromatics (BTEX) decreased. This may be because of the increase in coke
formation at higher temperature. At higher temperatures, doped catalysts tend to increase
the amounts of polycyclic aromatic hydrocarbons, which eventually leads to coke
formation.

217
From Fig. 4b, it can be seen that an increase in amount initial oil charge
significantly reduced the overall yield of aromatic compounds. Throughout this study, we
kept the amount of catalyst loaded in the continuous reactor, constant for all the
experiments. We only changed the amount of oil charged to the reactor and thus there
was change in oil to catalyst ratio. Higher the amount of oil charged to the reactor, higher
was the oil to catalyst ratio. When we increase amount of oil charged, that means we
decreased the amount of catalyst available for the reaction. At a lower catalyst amount,
the availability of active sites for the catalytic reaction was less and hence the overall
yield of aromatic compounds was lower. We can conclude that lower oil to catalyst ratio
was preferred for increasing aromatics yields.
We also found an interesting interaction of the factors, dopant concentration and
initial oil charged, showing a significant effect on overall BTEX yield. At a higher level
of initial oil charge, the yield of BTEX was almost the same, regardless of the level of
dopant concentration. When amount of initial oil charged was decreased, the overall %
yield of BTEX was increased and was the highest at increased dopant concentration. The
confounding structure was ‘BD+CF+ABEF+ACDE’, and the factors C (reaction
temperature and F (reaction time) were not significant. Both B (dopant concentration)
and D (amount of initial oil charged) were significant and hence the BD interaction
comes only from significant factors B and D only.
These doped catalysts were found to be very selective towards toluene. Since
toluene contributed to the highest among all the aromatics yields, the results for overall
BTEX yield and for toluene yield look similar. The dopant concentration-initial oil
charged interaction could be used for controlling toluene yield and thus overall BTEX

218
yield. We found that the statistical approach is the only one best way to study the
significant interactions of factors influencing the responses.
(4 a)
(4 b)
3.00.5
6
5
4
3
2
500400
6437
6
5
4
3
2
Dopant concentration (wt%)
Me
an
Reaction temperature(°C)
Initial oil charge (g)
Main Effects Plot for Total BTEX (% yield)Data Means

219
(4 c)
6437
9
8
7
6
5
4
3
2
1
Initial oil charge (g)
Me
an
0.5
3.0
(wt%)
concentration
Dopant
Interaction Plot for Total BTEX (% yield)Data Means
Figure 4. Pareto charts, main effects and interaction plots for total BTEX (% yield)
None of the factors or interactions showed significant effect on the yield of benzene
and ethylbenzene.
Statistical model for % yield of total BTX
To propose the statistical model, there are three assumptions we need to prove true.
These assumptions are, (1) Residuals should be randomly and normally distributed, (2)
residuals should not correlate with the predicted Y, (3) residuals should not exhibit any
trends over time [13]. We verified the validity of these assumptions by residual plots.
Based on the above interpretation and coefficients of estimated effects, the statistical
model for coded units is as follows:
Total BTEX (% yield) = 3.836 + 1.416 Dopant concentration - 1.591 Reaction
temperature - 1.984 Initial oil charged - 1.296 Dopant concentration* Initial oil
charged.

220
Based on the interpretation and coefficients of estimated effects, the statistical model
for uncoded units is as follows:
Total BTEX (% yield) = 16.8056 + 5.01030 Dopant concentration - 0.0318129
Reaction temperature - 0.0125981 Initial oil charged - 0.0767802 Dopant
concentration* Initial oil charged.
These statistical models are applicable in the dopant concentration range of 0.5 wt %,
3 wt %, temperature range of 400 0C to 500
0C and initial oil charge range of 37 g to 64
g. Since there are more than two factors in this statistical model, contour plots were
prepared to present this model in a graphical form. Fig. 5 represents the contour plots
showing how the % yield of total BTEX relates to two factors (at low settings). The areas
of highest BTEX yield are clearly visible in contour plots. A curved nature of contour
level lines as shown in Fig. (5 a) confirms that dopant concentration-Initial oil charge
interaction is significant.

221
(5 a)
Dopant concentration (wt%)
Init
ial o
il ch
arg
e (
g)
3.02.52.01.51.00.5
60
55
50
45
40
Reaction temperature(°C) 400
Hold Values
>
–
–
–
–
–
–
< 4
4 5
5 6
6 7
7 8
8 9
9 10
10
yield)
(%
BTEX
Total
Contour Plot of Total BTEX (% yield) vs Initial oil charged, Dopant concentration
(5 b)
Reaction temperature(°C)
Init
ial o
il ch
arg
e (
g)
500480460440420400
60
55
50
45
40
Dopant concentration (wt%) 0.5
Hold Values
>
–
–
–
< 1
1 2
2 3
3 4
4
yield)
(%
BTEX
Total
Contour Plot of Total BTEX (% yield) vs Initial oil charged, Reaction temperature

222
(5 c)
Dopant concentration (wt%)
Re
acti
on
te
mp
era
ture
(°C
)
3.02.52.01.51.00.5
500
480
460
440
420
400
Initial oil charge (g) 37
Hold Values
>
–
–
–
–
< 2
2 4
4 6
6 8
8 10
10
yield)
(%
BTEX
Total
Contour Plot of Total BTEX (% yield) vs Reaction temperature, Dopant concentration
Figure 5. Contour plots for total BTEX (% yield)
Conclusions
Bio-based aromatic compounds can be produced from crop oil via catalytic cracking
over doped zeolite catalysts. Reaction temperature, dopant concentration and the amount
of initial oil charged to the reactor (oil to catalyst ratio) were the most significant factors
for the overall aromatics yield. Dopant concentration positively influenced aromatic
yields, while reaction temperature and amount of initial oil charged tend to affect the
aromatics yield negatively. An interaction between dopant concentration and initial oil
charged was found to be significantly affecting the toluene yield as well as the overall
BTEX yield. These factors and interactions could be used for maximizing the yields of
aromatic compounds. Crop oil could be very efficiently used as a renewable resource for
manufacturing bio-based aromatic compounds.
Acknowledgement. This work was supported by Federal Aviation Administration
(FAA) and United States Department of Agriculture (USDA). The authors like to
acknowledge the contributions from biofuels research group members of the University
of North Dakota.

223
D4: Preprint Paper - American Chemical Society, Div. Fuel Chem. 2011, 56 (1), 482.
DETERMINATION OF SIGNIFICANT FACTORS INFLUENCING
AROMATIZATION OF PROPYLENE VIA STATISTICAL PATH
Swapnil L. Fegade1, Hyunwook Cho
1, Brian Tande
1,, Wayne Seames
1, Darrin Muggli
2,
Evguenii Kozliak3
1Department of Chemical Engineering, University of North Dakota, 241 Centennial
Drive, Stop 7101, Grand Forks, ND 58202-7101, USA
2Department of Engineering, Benedictine College, 1020 North 2nd Street Atchison, KS
66002, USA
3Department of Chemistry, University of North Dakota, P.O. Box 9024, Grand Forks, ND
58202, USA
Introduction
Short chain, light, aliphatic hydrocarbons are of great interest for petrochemical
industries and academic research units. There is a great need of converting these
feedstocks into highly valuable products like aromatics. The most important aromatics
are benzene, toluene and xylene (BTX) [1, 2]. Propylene (propene) is one of the lighter
olefin hydrocarbon having limited applications including polypropylene, acrylics and
propylene oxide manufacturing. Currently, the major amount of propylene comes from
the petroleum refineries and petrochemical complexes during steam cracking and fluid

224
catalytic cracking (FCC) processes [3]. We are now moving from conventional fossil
fuels to biofuels and it is clear that during the production of gasoline-like biofuels, a lot
of propylene is also produced [4]. The catalytic activity tests for propylene on HY
zeolites resulted in the formation of intermediates and oligomers [4]. Although the
conversion of hydrocarbons to aromatic compounds over zeolite beta was successfully
carried out [2], there is a very limited knowledge available on it. Propylene aromatization
over ZSM-5 was studied and kinetic models were also developed to explain the steps and
routes of aromatics formation [6]. The studies in the space velocity of feed stream and its
impact on the product selectivity, and aromatics distribution at atmospheric pressure were
successfully done for propylene and other alkanes aromatization reactions over ZSM-5
catalyst [7,8,9]. Although extensive work is being done on the conversion of propylene to
aromatics, there is a lack of the use of systematic statistical approach under controlled
reaction conditions for this process. In this present study, our main objective is apply the
full factorial design of experiments strategy for catalytic reforming process and to screen
significant factors and interactions influencing aromatization of propylene to produce
BTX. The other objective is to prepare a statistical model for this catalytic reforming
process.
Experimental
Zeolite catalysts ZSM-5 having Si:Al ratio of 50 and 80, were obtained in the
powder form from Zeolyst International. These catalysts were commercially available in
the ammonium forms. The activation of ZSM-5 catalysts was achieved by calcination at

225
500 0C for 5 hours to convert ammonium form into hydrogen form known as HZSM-5.
High purity propylene gas and nitrogen was obtained from Praxair.
The catalytic activity tests to produce aromatic compounds from propylene were
carried out in a continuous, down flow, tubular reactor having inner diameter of 0.4
inches and the length of about 10 inches. The reactor is surrounded by the furnace for the
heating purpose. Fig. 1 shows the schematic diagram of the reaction setup.
Figure 1. Schematic diagram of the propylene aromatization setup
An appropriate amount of activated catalyst was loaded on a quartz support to
make a fixed bed in the reactor. The weight of quartz support was kept constant for all the
experimental runs. A type K thermocouple was set at the center of the catalyst bed for
proper temperature control. The products were analyzed by a in-line gas chromatograph,
fitted with flame ionization detector (GC-FID).
Four factors, catalyst type, catalyst weight, propylene concentration and reaction
temperature, were selected to study the responses, benzene, toluene, p-xylene, o-xylene,
total xylenes produced. Each response was specified as its % yield calculated on the
amount of carbon basis. A full factorial, two level, four factors design of experiments was

226
created to assess the factors those influence the aromatization of propylene. The low and
high values of the factors are shown in Table 1.
Table 1. Factors and Their Low and High Values.
Factors Si Al
ratio of
HZSM-5
Cata
lyst
amo
unt
propyle
ne
concent
ration
Reactio
n
Temper
ature
Low
level
50 0.2
(g)
8.9 (%) 400
(0C)
High
level
80 1 (g) 12.5
(%)
500
(0C)
Four factors, two level design means minimum of 24 = 16 runs should be
performed [10]. No replicates were conducted. Each aromatization reaction run was
performed until 400 minutes of reaction time and products were analyzed on GC-FID
every 50 minutes.
The full factorial design created by using MINITABTM
15 was a random order
design and the catalytic activity test experiments were conducted in this random order.
The experimental data for all the 16 runs was analyzed by using MINITABTM
15 to
obtain significant data, main effects, pareto, interactions and other charts.

227
Results and Discussion
All experimental runs were carried out according to the full factorial design. All
the responses are in terms of the % yields of each aromatic component (BTX) as well as
total BTX, calculated on the amount of carbon basis. The analysis of this factorial design
data was conducted at 95% confidence level.
Pareto charts of the standardized effects
Fig. 2 represents the pareto charts for all the responses. The vertical red line in
each chart represents the line of significance, determined by using the ‘t’ statistics. Any
term having the effect/bar beyond this line, is called known a significant term. If a term is
combined with another term in pareto chart, then it is known as the interaction term. For
example, ‘CD’ in Fig. 2. shows the effect of the interaction between C (propylene
concentration) and D (catalyst amount) [10].
(2 a)
AC
AD
AB
BD
BC
CD
C
B
A
D
876543210
Te
rm
Standardized Effect
2.571
A Si/A l Ratio
B Temperature (°C )
C Propy lene concentration (%)
D C ataly st amount (g)
Factor Name
Pareto Chart of the Standardized Effects(response is Benzene (% yield), Alpha = 0.05)

228
(2 b)
AB
BC
AD
BD
AC
CD
B
C
A
D
1086420
Te
rm
Standardized Effect
2.57
A Si/A l Ratio
B Temperature (°C )
C Propy lene concentration (%)
D C ataly st amount (g)
Factor Name
Pareto Chart of the Standardized Effects(response is Toluene (% yield), Alpha = 0.05)
(2 c)
B
BD
BC
CD
AB
C
AD
AC
D
A
76543210
Te
rm
Standardized Effect
2.571
A Si/A l Ratio
B Temperature (°C )
C Propy lene concentration (%)
D C ataly st amount (g)
Factor Name
Pareto Chart of the Standardized Effects(response is p-xylene (% yield), Alpha = 0.05)
(2 d)
BD
C
BC
CD
AB
AD
B
AC
D
A
76543210
Te
rm
Standardized Effect
2.571
A Si/A l Ratio
B Temperature (°C )
C Propy lene concentration (%)
D C ataly st amount (g)
Factor Name
Pareto Chart of the Standardized Effects(response is o-xylene (% yield), Alpha = 0.05)

229
(2 e)
AB
BC
BD
AD
AC
CD
B
C
A
D
1086420
Te
rm
Standardized Effect
2.57
A Si/A l Ratio
B Temperature (°C )
C Propy lene concentration (%)
D C ataly st amount (g)
Factor Name
Pareto Chart of the Standardized Effects(response is Total BTX (% yield), Alpha = 0.05)
Figure 2. Pareto charts for standardized effects for % yields of (a) benzene, (b) toluene,
(c) p-xylene, (d) o-xylene, and (e) total BTX.
Thus from Fig. 2, it can be inferred that Si:Al ratio and catalyst amount had the
greatest significant effect on aromatization to produce all individual aromatics (benzene,
toluene, p-xylene, o-xylene). The effect of reaction temperature is also significant for the
yield of individual aromatics except p-xylene. Similarly, it can be seen that the effect of
the interaction between propylene concentration and catalyst amount is significant for
benzene and toluene production. The yields of p-xylene and o-xylenes are significantly
affected by interaction between Si:Al ratio and propylene feed concentration. Apparently,
the effect of interaction of Si:Al ratio and catalyst amount is close to be significant. In
this study, since the yields of benzene and toluene accounts for more than 60 % yields of
total aromatics for all the experiments, the results for total BTX and for individual yields
of benzene and toluene are similar.

230
Effect of the Si:Al ratio of HZSM-5 on aromatization
Currently, there is limited knowledge available on the effect of Si:Al ratio on
propylene aromatization. The catalytic activity of the HZSM-5 is mainly due to the
Bronsted acid sites present in the bridging hydroxyl groups in the Si-O-Al triad. The
active tetrahedral site (T - site) is occupied by tetrahedrally coordinated silicon and
aluminum atom. Several theoretical studies have been conducted on locating the active T
- site occupied by Al [11]. The feed propylene molecule gets adsorbed on the HZSM-5 at
the active acid site and form adsorbed intermediates like alkoxides. The alkoxide
formation is a very important step in propylene aromatization because it is responsible for
β-scission and hydride transfer reactions. The protonation energy is required to form a
protonated molecule when a feed propylene molecule comes in contact with Bronsted
acid proton. This protonation energy also depends on the interaction between the zeolite
catalyst wall and the protonated molecule. The alkoxide formation energies depend on
zeolite structures. The Al sites greatly affect the energy of adsorption of propylene on
ZSM-5[12-14]. The location and the number of Al sites change the catalytic activity. The
proton affinity, acid strength and the binding energies are greatly influenced by the
composition of ZSM-5 and its structure [15-16]. Although a lot of work has been done to
study the Al content of the ZSM-5, most of the work was concentrated on the theoretical
approaches. In this study we used an experimental approach including the statistical
techniques for data analysis. We used HZSM-5 with Si:Al ratios of 50 and 80. For the
ratio of 50, the available Al sites are more than that for Si:Al ratio of 80. In the HZSM-5
cluster, there are many active acid sites present near the aluminum atom. Thus it is clear
from Fig. 3 that increasing Al content, consequently decreases the Si:Al ratio and

231
therefore, the catalytic activity increases. Hence, at the lower Si:Al ratio, % yields of
BTX are higher and it can be concluded that the aromatization activity of HZSM-5
increases when the Si:Al ratio decreases.
(3 a)
8050
3.5
3.0
2.5
2.0
1.5
500400
12.58.9
3.5
3.0
2.5
2.0
1.5
1.00.2
Si/Al Ratio
Me
an
Temperature (°C)
Propylene concentration (%) Catalyst amount (g)
Main Effects Plot for Benzene (% yield)Data Means
(3 b)
8050
10.0
7.5
5.0
500400
12.58.9
10.0
7.5
5.0
1.00.2
Si/Al Ratio
Me
an
Temperature (°C)
Propylene concentration (%) Catalyst amount (g)
Main Effects Plot for Toluene (% yield)Data Means
(3 c)
8050
6.5
6.0
5.5
5.0
4.5
12.58.9
1.00.2
6.5
6.0
5.5
5.0
4.5
Si/Al Ratio
Me
an
Propylene concentration (%)
Catalyst amount (g)
Main Effects Plot for p-xylene (% yield)Data Means

232
(3 d)
8050
1.6
1.4
1.2
1.0
500400
12.58.9
1.6
1.4
1.2
1.0
1.00.2
Si/Al Ratio
Me
an
Temperature (°C)
Propylene concentration (%) Catalyst amount (g)
Main Effects Plot for o-xylene (% yield)Data Means
(3 e)
8050
21
18
15
12
500400
12.58.9
21
18
15
12
1.00.2
Si/Al Ratio
Me
an
Temperature (°C)
Propylene concentration (%) Catalyst amount (g)
Main Effects Plot for Total BTX (% yield)Data Means
Figure 3. Main effects plots for % yields of (a) benzene, (b) toluene, (c) p-xylene, (d) o-
xylene, and (e) total BTX.
Effect of the reaction temperature on aromatization
At lower and moderate temperatures the bridging hydroxyl groups in HZSM-5,
form the hydrogen bonds with the neighboring oxygen atoms. With the increase in the
temperatures, this hydrogen bond is broken and the availability of free bridging hydroxyl
groups increases and thus the acidity and catalytic activity increases. At the higher
temperatures, the protons defeat the barrier for activation by acquiring the required
energy [17-18]. Thus, the temperature positively affects the acidity of HZSM-5 and hence

233
there is a significant increase in the aromatics yields at the higher temperature as shown
in Fig. 3.
Effect of the propylene feed concentration, catalyst amount on aromatization
When the feed hydrocarbon stream passes through the HZSM-5 pore system,
some of the feed molecules fill the straight channels and some fill the sinusoidal channels
of the catalyst cluster [19]. In our study, we found that increasing the feed propylene
concentration, also increases the yields of all the aromatics as seen in the Fig. 3. At the
lower propylene feed concentration, some molecules do not fill the HZSM5 channels and
because of the nitrogen, they are pushed through the void spacing between the catalyst
particles. When we increase the feed concentration, more propylene molecules are
available to fill up both the channels and hence there is an increase in the % yield of
benzene, toluene, and xylenes. When we increase the catalyst amount, there is an increase
in the number of active protonation and acid sites available; which eventually yields more
aromatics. This is confirmed from the main effects plots for catalyst amount shown in
Fig. 3.
Effects of the significant interactions
Currently, in the academic as well as industrial research, hydrocarbon feed and
catalyst amount are combined into a single factor known as gas hourly space velocity
(GHSV). In this present study, we used the ‘feed propylene concentration’ and ‘catalyst
amount’ as separate factors and found that the effect of interaction between these two
factors was also found significant (shown in Fig. 3). The interaction plots for benzene,
toluene and total BTX yields, are given in the Fig. 4 (a), 4(b), and 4 (e). It was observed
that higher feed concentration is favored for aromatization. There is a little difference in

234
the responses at 0.2 g of catalyst, but when the catalyst amount is increased to 1 g, the
difference between the aromatics yields at 8.9 % and 12.5 % increases abruptly. Thus it
can be concluded that a slight increase in propylene concentration and catalyst amount,
significantly increases the aromatics yield. Thus the proper balance between the levels of
these factors is very important to control the yields of benzene and toluene for process
optimization.
(4 a)
1.00.2
5
4
3
2
1
Catalyst amount (g)
Me
an
8.9
12.5
(%)
concentration
Propylene
Interaction Plot for Benzene (% yield)Data Means
(4 b)
1.00.2
13
12
11
10
9
8
7
6
5
4
Catalyst amount (g)
Me
an
8.9
12.5
(%)
concentration
Propylene
Interaction Plot for Toluene (% yield)Data Means

235
(4 c1)
12.58.9
7
6
5
4
3
Propylene concentration (%)
Me
an
50
80
Ratio
Si/Al
Interaction Plot for p-xylene (% yield)Data Means
(4 c2)
1.00.2
7
6
5
4
3
Catalyst amount (g)
Me
an
50
80
Ratio
Si/Al
Interaction Plot for p-xylene (% yield)Data Means
(4 d)
12.58.9
1.8
1.6
1.4
1.2
1.0
0.8
Propylene concentration (%)
Me
an
50
80
Ratio
Si/Al
Interaction Plot for o-xylene (% yield)Data Means

236
(4 e)
1.00.2
26
24
22
20
18
16
14
12
10
Catalyst amount (g)
Me
an
8.9
12.5
(%)
concentration
Propylene
Interaction Plot for Total BTX (% yield)Data Means
Figure 4. Significant interaction effects plots for (a) benzene, (b) toluene, (c1 & c2) p-
xylene, (d) o-xylene, and (e) total BTX.
From Fig. 4 (c1) and (d), it was observed that there is a significant interaction
effect on xylenes, between the factors Si:Al ratio and propylene feed concentration. For
Si:Al ratio of 80, there is increase in response when feed concentration is increased, but
for Si:Al ratio of 50, the response is reversed and there are more xylenes produced at
lower propylene concentration. Thus it is clear that the increase in the Al content in the
catalyst helps in increasing xylene production even at lower feed concentrations. The
decrease in the response for xylenes at higher feed concentration may be due to the
possible alkylation and isomerization of xylenes in the presence of increased propylene
concentration. It looks like that the HZSM-5 having Si:Al ratio of 50 tends to have higher
alkylation and isomerization ability than that having ratio of 80.
The interaction of Si:Al ratio with the catalyst amount also had a significant effect
on p-xylene yield. When the catalyst amount was kept constant at 0.2 g, the difference in
the % yields of p-xylene at Si:Al of 50 and 80 is very large. This difference is very small

237
when the catalyst amount is 1 g. This concludes that lower amount of catalyst with Si:Al
ratio of 50, is required for higher p-xylene selectivity.
We found that the statistical approach is the only one best way to study the
significant interactions of factors influencing the responses.
Statistical model for % yield of total BTX
Based on the above interpretation and coefficients of estimated effects, the
statistical model for coded units is as follows:
Total BTX (% yield) = 16.8 – 4.59 (Si:Al ratio) + 1.80 (temperature) + 2.32
(propylene concentration) + 5.23 (catalyst amount) + 1.47 (propylene
concentration*catalyst amount).
Based on the interpretation and coefficients of estimated effects, the statistical
model for uncoded units is as follows:
Total BTX (% yield) = 12.0 – 0.306(Si:Al ratio) + 0.0360(temperature) +
0.0654(propylene concentration) - 8.72(catalyst amount) + 2.04 (propylene
concentration*catalyst amount).
These statistical models are applicable in the Si:Al ratio range of 50 to 80,
temperature range of 400 0C to 500
0C, propylene feed concentration range of 8.9 % to
12.5 %, and catalyst amount range of 0.2g to 1g. Since there are more than two factors in
this statistical model, contour plots were prepared to present this model in a graphical

238
form. Fig. 5 represents the contour plots showing how the % yield of total BTX relates to
two factors (at high settings). The areas of highest BTX yield are clearly visible in
contour plots. A curved nature of contour level lines as shown in Fig. (5 b) confirms that
propylene concentration-catalyst amount interaction is significant.
(5 a)
Si/Al Ratio
Pro
py
len
e c
on
ce
ntr
ati
on
(%
)
80757065605550
12.5
12.0
11.5
11.0
10.5
10.0
9.5
9.0
Temperature (°C) 500
Catalyst amount (g) 1
Hold Values
>
–
–
–
–
–
–
–
–
<
31
15
15 17
17 19
19 21
21 23
23 25
25 27
27 29
29 31
yield)
BTX (%
Total
Contour Plot of Total BTX (% yield) vs Propylene concentration, Si/Al Ratio
(5 b)
Propylene concentration (%)
Ca
taly
st
am
ou
nt
(g)
12.512.011.511.010.510.09.59.0
1.0
0.9
0.8
0.7
0.6
0.5
0.4
0.3
0.2
Si/Al Ratio 80
Temperature (°C) 500
Hold Values
>
–
–
–
–
–
–
–
–
<
27.5
7.5
7.5 10.0
10.0 12.5
12.5 15.0
15.0 17.5
17.5 20.0
20.0 22.5
22.5 25.0
25.0 27.5
(% yield)
Total BTX
Contour Plot of Total BTX (% yield) vs Catalyst amount , Propylene concentration

239
(5 c)
Si/Al Ratio
Ca
taly
st
am
ou
nt
(g)
80757065605550
1.0
0.9
0.8
0.7
0.6
0.5
0.4
0.3
0.2
Temperature (°C) 500
Propylene concentration (%) 12.5
Hold Values
>
–
–
–
–
–
–
–
–
<
30.0
10.0
10.0 12.5
12.5 15.0
15.0 17.5
17.5 20.0
20.0 22.5
22.5 25.0
25.0 27.5
27.5 30.0
(% yield)
Total BTX
Contour Plot of Total BTX (% yield) vs Catalyst amount , Si/Al Ratio
(5 d)
Si/Al Ratio
Te
mp
era
ture
(°C
)
80757065605550
500
480
460
440
420
400
Propylene concentration (%) 12.5
Catalyst amount (g) 1
Hold Values
>
–
–
–
–
–
–
–
–
<
31.6
22.0
22.0 23.2
23.2 24.4
24.4 25.6
25.6 26.8
26.8 28.0
28.0 29.2
29.2 30.4
30.4 31.6
(% yield)
Total BTX
Contour Plot of Total BTX (% yield) vs Temperature (°C), Si/Al Ratio
(5 e)
Temperature (°C)
Ca
taly
st
am
ou
nt
(g)
500480460440420400
1.0
0.9
0.8
0.7
0.6
0.5
0.4
0.3
0.2
Si/Al Ratio 80
Propylene concentration (%) 12.5
Hold Values
>
–
–
–
–
–
–
–
–
<
27.5
7.5
7.5 10.0
10.0 12.5
12.5 15.0
15.0 17.5
17.5 20.0
20.0 22.5
22.5 25.0
25.0 27.5
(% yield)
Total BTX
Contour Plot of Total BTX (% yield) vs Catalyst amount , Temperature (°C)

240
(5 f)
Temperature (°C)
Pro
py
len
e c
on
ce
ntr
ati
on
(%
)
500480460440420400
12.5
12.0
11.5
11.0
10.5
10.0
9.5
9.0
Si/Al Ratio 80
Catalyst amount (g) 1
Hold Values
>
–
–
–
–
–
–
< 10.0
10.0 12.5
12.5 15.0
15.0 17.5
17.5 20.0
20.0 22.5
22.5 25.0
25.0
(% yield)
Total BTX
Contour Plot of Total BTX (% yield) vs Propylene concentration, Temperature (°C)
Figure 5. Contour plots for total BTX yield.
Conclusions
For maximizing the yields of all aromatics, the most influential parameters are
HZSM-5 Si:Al ratio and the catalyst amount taken for the reforming process. The
reaction temperature tends to affect % yields of benzene, toluene, o-xylene and total
BTX; while the effect of feed concentration is significant for yielding benzene, toluene
and total BTX only. The most striking point found out from this study, was the effect of
interaction between initial propylene feed concentration and amount of catalyst, and it is
significant for producing benzene, toluene and total BTX. Si:Al ratio-feed concentration
interaction only impacts % yields of xylenes. These interactions are important for
controlling the yield a particular individual aromatic compound. For maximizing the
overall aromatics yields, Si:Al ratio of catalyst should be at lower level, and all the other
reaction conditions should be set at higher levels. Statistical models for both the coded as
well as uncoded units were successfully proposed for the prediction of total BTX yield
and it can be concluded that a statistical approach is necessary for studying the interaction
effects of factors.

241
Acknowledgement. This work was supported by the National Science
Foundation Experimental Program to Stimulate Competitive Research (NSF EPSCoR).
The authors like to acknowledge the contributions from Dr. Alena Kubátová of chemistry
department, University of North Dakota, and Dr. Aditya Bhan of CEMS, University of
Minnesota, Minneapolis.

242
References
[1] R. A. Meyers. Handbook of petroleum refining processes. McGraw-Hill, 2003.
[2] G. J. Antos,, Aitani, A. M. Aitani, J. M. Parera. Catalytic Naphtha Reforming :
Science and Technology. Dekker, 1995.
[3] A. J. Ragauskas, C. K. Williams, B. H. Davison, G. Britovsek, J. Cairney, C. A.
Eckert, W. J. Frederick Jr., J. P. Hallett, D. J. Leak, C. L. Liotta, J. R. Mielenz, R.
Murphy, R. Templer and T. Tschaplinski. The path forward for biofuels and biomaterials.
Science 311(5760), pp. 484-489. 2006.
[4] J. Scott. Zeolite Technology and Applications : Recent Advances. Park Ridge, 1980.
[5] A. Kubátová, Y. Luo, J. Štávová, S. M. Sadrameli, T. Aulich, E. Kozliak and W.
Seames. New path in the thermal cracking of triacylglycerols (canola and soybean oil).
Fuel 90(8), pp. 2598-2608. 2011.
[6] Y. Luo. Master's thesis, Chemical Engineering, University of North Dakota. 2006.
[7] B. A.V. Renewable fuels and chemicals by thermal processing of biomass. Chem.
Eng. J. 91(2–3), pp. 87-102. 2003.
[8] J. Q. Bond, D. M. Alonso, D. Wang, R. M. West and J. A. Dumesic. Integrated
catalytic conversion of γ-valerolactone to liquid alkenes for transportation fuels. Science
327(5969), pp. 1110-1114. 2010.
[9] L. T. H. Nam, T. Q. Vinh, N. T. T. Loan, V. D. S. Tho, X. Yang and B. Su.
Preparation of bio-fuels by catalytic cracking reaction of vegetable oil sludge. Fuel 90(3),
pp. 1069-1075. 2011.
[10] E. Kozliak, R. Mota, D. Rodriguez, P. Overby, A. Kubátová, D. Stahl, V. Niri, G.
Ogden and W. Seames. Non-catalytic cracking of jojoba oil to produce fuel and chemical
by-products. Industrial Crops and Products 43(1), pp. 386-392. 2013.
[11] R. O. Idem, S. P. Katikaneni, N. N. Bakhshi. Thermal cracking of canola oil:
reaction products in the presence and absence of steam. Energy & Fuels, 10(6), pp. 1150-
1162.1996

243
[12] W. Seames, Y. Luo, I. Ahmed, T. Aulich, A. Kubátová, J. Št'ávová and E. Kozliak.
The thermal cracking of canola and soybean methyl esters: Improvement of cold flow
properties. Biomass Bioenergy 34(7), pp. 939-946. 2010.
[13] B. Tande, W. Seames, "Production of aromatics from noncatalytically cracked fatty
acid based oils," CA 2831485 A1, Oct 26, 2012.
[14] J. Weitkamp, L. Puppe. Catalysis and Zeolites : Fundamentals and Applications.
Springer, 1999.
[15] J. Ancheyta-Juárez and E. Villafuerte-Macías. Kinetic modeling of naphtha catalytic
reforming reactions. Energy and Fuels 14(5), pp. 1032-1037. 2000.
[16] G. Zahedi, S. Mohammadzadeh and G. Moradi. Enhancing gasoline production in an
industrial catalytic-reforming unit using artificial neural networks. Energy and Fuels
22(4), pp. 2671-2677. 2008.
[17] B. Cornils, A. Herrmann, R. Schogl, C. Wong. Catalysis for A to Z. Concise
Encyclopedia. 2000.
[18] J. G. Speight. The chemistry and technology of petroleum. CRC press, 2014.
[19] F. Zaera. Selectivity in hydrocarbon catalytic reforming: A surface chemistry
perspective. Applied Catalysis A: General 229(1-2), pp. 75-91. 2002.
[20] A. Askari, H. Karimi, M. R. Rahimi and M. Ghanbari. Simulation and modeling of
catalytic reforming process. Petroleum & Coal 54(1), pp. 76-84. 2012.
[21] P. Tamunaidu and S. Bhatia. Catalytic cracking of palm oil for the production of
biofuels: Optimization studies. Bioresour. Technol. 98(18), pp. 3593-3601. 2007.
[22] N. S. Gnep, J. Y. Doyemet and M. Guisnet. Conversion of light alkanes into
aromatic hydrocarbons. 3. aromatization of propane and propene on mixtures of HZSM5
and of Ga2O3. Studies in Surface Science and Catalysis 46(C), pp. 153-162. 1989.
[23] J. Ancheyta-Juárez and E. Villafuerte-Macías. Kinetic modeling of naphtha catalytic
reforming reactions. Energy and Fuels 14(5), pp. 1032-1037. 2000.
[24] B. S. Kwak and W. M. H. Sachtler. Aromatization of propane over zn/HZSM-5
catalysts prepared by chemical vapor deposition. Korean Journal of Chemical
Engineering 13(4), pp. 356-363. 1996.

244
[25] B. S. Kwak, W. M. H. Sachtler and W. O. Haag. Catalytic conversion of propane to
aromatics: Effects of adding Ga and/or Pt to HZSM-5. Journal of Catalysis 149(2), pp.
465-473. 1994.
[26] B. Liu, Y. Yang and A. Sayari. Non-oxidative dehydroaromatization of methane
over ga-promoted mo/HZSM-5-based catalysts. Applied Catalysis A: General 214(1), pp.
95-102. 2001.
[27] M. Rodrigues, M. Barre, P. Magnoux, V. R. Choudhary and M. Guisnet. Coking,
aging and regeneration of zeolites. XVIII coking and deactivation of HZSM-5 and
ga/HZSM-5 catalysts during propene aromatization. J. Chim. Phys. Phys. -Chim. Biol.
93(2), pp. 317-330. 1996.
[28] X. C. Shen, H. Lou, K. Hu and X. M. Zheng. Non-oxidative aromatization of C1 to
C3 hydrocarbons over pd-promoted ga/HZSM-5 catalyst under mild conditions. Chinese
Chemical Letters 18(4), pp. 479-482. 2007.
[29] A. Smiešková, E. Rojasová, P. Hudec and L. Šabo. Study of the role of zn in
aromatization of light alkanes with probe molecules. Reaction Kinetics and Catalysis
Letters 82(2), pp. 227-234. 2004.
[30] Y. Sun and T. C. Brown. Catalytic cracking, dehydrogenation, and aromatization of
isobutane over ga/HZSM-5 and zn/HZSM-5 at low pressures. Int J Chem Kinet 34(8), pp.
467-480. 2002.
[31] N. Viswanadham, A. R. Pradhan, N. Ray, S. C. Vishnoi, U. Shanker and T. S. R.
Prasada Rao. Reaction pathways for the aromatization of paraffins in the presence of H-
ZSM-5 and zn/H-ZSM-5. Applied Catalysis A: General 137(2), pp. 225-233. 1996.
[32] H. You. Influence of aromatization reaction conditions in the presence of HZSM-5
catalyst. Petrol Sci Technol 24(6), pp. 707-716. 2006.
[33] J. F. Haw, B. R. Richardson, I. S. Oshiro, N. D. Lazo and J. A. Speed. Reactions of
propene on zeolite HY catalyst studied by in situ variable-temperature solid-state nuclear
magnetic resonance spectroscopy. J. Am. Chem. Soc. 111(6), pp. 2052-2058. 1989.
[34] D. B. Lukyanov, N. S. Gnep and M. R. Guisnet. Kinetic modeling of ethene and
propene aromatization over HZSM-5 and GaHZSM-5. Industrial and Engineering
Chemistry Research 33(2), pp. 223-234. 1994.
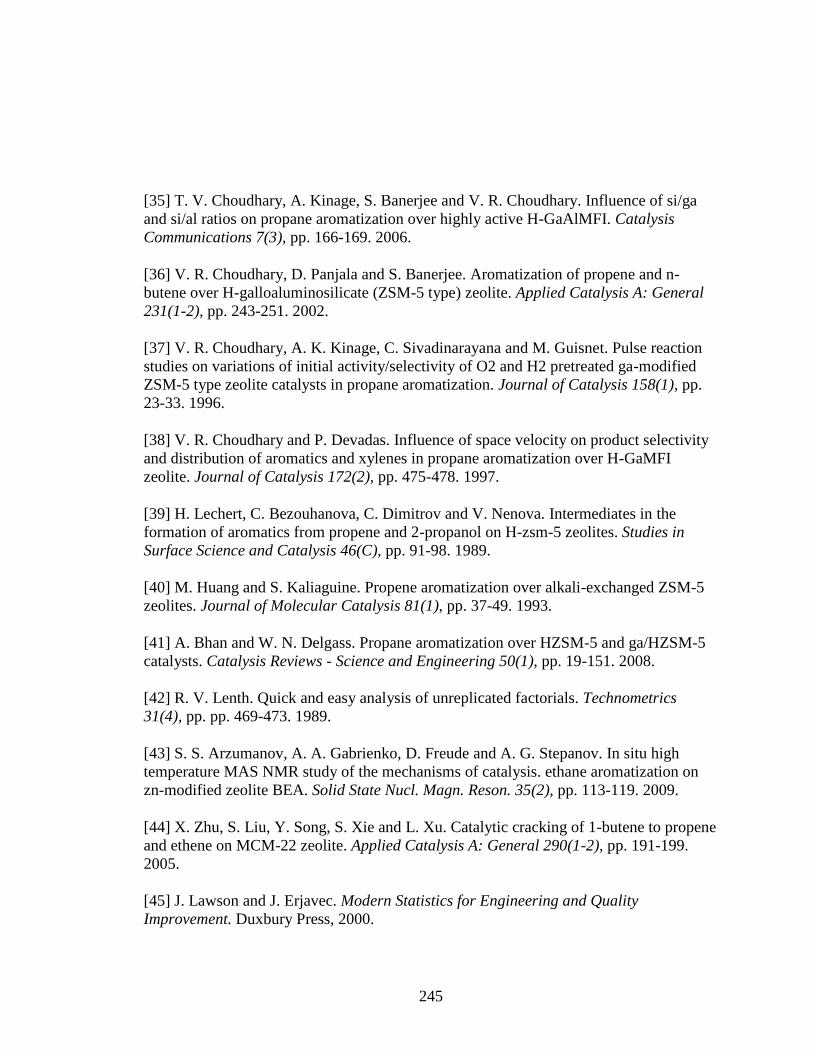
245
[35] T. V. Choudhary, A. Kinage, S. Banerjee and V. R. Choudhary. Influence of si/ga
and si/al ratios on propane aromatization over highly active H-GaAlMFI. Catalysis
Communications 7(3), pp. 166-169. 2006.
[36] V. R. Choudhary, D. Panjala and S. Banerjee. Aromatization of propene and n-
butene over H-galloaluminosilicate (ZSM-5 type) zeolite. Applied Catalysis A: General
231(1-2), pp. 243-251. 2002.
[37] V. R. Choudhary, A. K. Kinage, C. Sivadinarayana and M. Guisnet. Pulse reaction
studies on variations of initial activity/selectivity of O2 and H2 pretreated ga-modified
ZSM-5 type zeolite catalysts in propane aromatization. Journal of Catalysis 158(1), pp.
23-33. 1996.
[38] V. R. Choudhary and P. Devadas. Influence of space velocity on product selectivity
and distribution of aromatics and xylenes in propane aromatization over H-GaMFI
zeolite. Journal of Catalysis 172(2), pp. 475-478. 1997.
[39] H. Lechert, C. Bezouhanova, C. Dimitrov and V. Nenova. Intermediates in the
formation of aromatics from propene and 2-propanol on H-zsm-5 zeolites. Studies in
Surface Science and Catalysis 46(C), pp. 91-98. 1989.
[40] M. Huang and S. Kaliaguine. Propene aromatization over alkali-exchanged ZSM-5
zeolites. Journal of Molecular Catalysis 81(1), pp. 37-49. 1993.
[41] A. Bhan and W. N. Delgass. Propane aromatization over HZSM-5 and ga/HZSM-5
catalysts. Catalysis Reviews - Science and Engineering 50(1), pp. 19-151. 2008.
[42] R. V. Lenth. Quick and easy analysis of unreplicated factorials. Technometrics
31(4), pp. pp. 469-473. 1989.
[43] S. S. Arzumanov, A. A. Gabrienko, D. Freude and A. G. Stepanov. In situ high
temperature MAS NMR study of the mechanisms of catalysis. ethane aromatization on
zn-modified zeolite BEA. Solid State Nucl. Magn. Reson. 35(2), pp. 113-119. 2009.
[44] X. Zhu, S. Liu, Y. Song, S. Xie and L. Xu. Catalytic cracking of 1-butene to propene
and ethene on MCM-22 zeolite. Applied Catalysis A: General 290(1-2), pp. 191-199.
2005.
[45] J. Lawson and J. Erjavec. Modern Statistics for Engineering and Quality
Improvement. Duxbury Press, 2000.

246
[46] J. A. Van Bokhoven, T. Lee, M. Drakopoulos, C. Lamberti, S. Thie and J.
Zegenhagen. Determining the aluminium occupancy on the active T-sites in zeolites
using X-ray standing waves. Nature Materials 7(7), pp. 551-555. 2008.
[47] A. Bhan, Y. V. Joshi, W. N. Delgass and K. T. Thomson. DFT investigation of
alkoxide formation from olefms in H-ZSM-5. J Phys Chem B 107(38), pp. 10476-10487.
2003.
[48] P. Sarv, C. Fernandez, J. Amoureux and K. Keskinen. Distribution of tetrahedral
aluminium sites in ZSM-5 type zeolites: An 27Al (multiquantum) magic angle spinning
NMR study. J. Phys. Chem. 100(50), pp. 19223-19226. 1996.
[49] G. Krishnamurthy, A. Bhan and W. N. Delgass. Identity and chemical function of
gallium species inferred from microkinetic modeling studies of propane aromatization
over ga/HZSM-5 catalysts. Journal of Catalysis 271(2), pp. 370-385. 2010.
[50] N. O. Gonzales, A. K. Chakraborty and A. T. Bell. A density functional theory study
of the effects of metal cations on the brønsted acidity of H-ZSM-5. Catalysis Letters
50(3-4), pp. 135-139. 1998.
[51] M. J. Rice, A. K. Chakraborty and A. T. Bell. Al next nearest neighbor, ring
occupation, and proximity statistics in ZSM-5. Journal of Catalysis 186(1), pp. 222-227.
1999.
[52] K. Sillar and P. Burk. Computational study of vibrational frequencies of bridging
hydroxyl groups in zeolite ZSM-5. Chemical Physics Letters 393(4-6), pp. 285-289.
2004.
[53] K. Sillar and P. Burk. Hybrid quantum chemical and density functional theory
(ONIOM) study of the acid sites in zeolite ZSM-5. J Phys Chem B 108(28), pp. 9893-
9899. 2004.
[54] M. Firoozi, M. Baghalha and M. Asadi. The effect of micro and nano particle sizes
of H-ZSM-5 on the selectivity of MTP reaction. Catalysis Communications 10(12), pp.
1582-1585. 2009.
[55] Z. Jing, Z. Liang, C. Guojing, W. Haiyan, W. Min and M. Jun. The aromatization
properties of nano-HZSM-5 catalyst. Petrol Sci Technol 26(5), pp. 586-592. 2008.

247
[56] M. Khatamian, A. A. Khandar, M. Haghighi and M. Ghadiri. Nano ZSM-5 type
ferrisilicates as novel catalysts for ethylbenzene dehydrogenation in the presence of N2O.
Appl. Surf. Sci. 258(2), pp. 865-872. 2011.
[57] N. Viswanadham, R. Kamble, M. Singh, M. Kumar and G. Murali Dhar. Catalytic
properties of nano-sized ZSM-5 aggregates. Catalysis Today 141(1-2), pp. 182-186.
2009.
[58] K. Wang and X. Wang. Comparison of catalytic performances on nanoscale HZSM-
5 and microscale HZSM-5. Microporous and Mesoporous Materials 112(1–3), pp. 187-
192. 2008.
[59] H. Long, X. Wang, W. Sun and X. Guo. Conversion of n-octene over nanoscale
HZSM-5 zeolite. Catalysis Letters 126(3-4), pp. 378-382. 2008.
[60] P. Zhang, X. Wang and H. Guo. Reducing olefins in FCC gasoline by isomerization
and aromatization over modified nano-ZSM-5. Chinese Journal of Catalysis 24(3), pp.
159-160. 2003.
[61] Y. Cheng, R. H. Liao, J. S. Li, X. Y. Sun and L. J. Wang. Synthesis research of
nanosized ZSM-5 zeolites in the absence of organic template. J. Mater. Process. Technol.
206(1–3), pp. 445-452. 2008.
[62] Y. Ni, A. Sun, X. Wu, G. Hai, J. Hu, T. Li and G. Li. The preparation of nano-sized
H[zn, al]ZSM-5 zeolite and its application in the aromatization of methanol. Microporous
and Mesoporous Materials 143(2-3), pp. 435-442. 2011.
[63] J. Zhu, W. T. Wu, Y. Chang, X. H. Sun and H. Y. Wang. Application of nano-
HZSM-5 catalyst on aromatization of FCC gasoline. Petrol Sci Technol 28(1), pp. 7-12.
2010.
[64] D. Breck. Zeolite molecular sieves. Krieger, 1984.
[65] G. Krishnamurthy, A. Bhan and W. N. Delgass. Identity and chemical function of
gallium species inferred from microkinetic modeling studies of propane aromatization
over Ga/HZSM-5 catalysts. Journal of Catalysis 271(2), pp. 370-385. 2010.
[66] S. K. Saha and S. Sivasanker. Influence of Zn- and Ga-doping on the conversion of
ethanol to hydrocarbons over ZSM-5. Catalysis Letters 15(4), pp. 413-418. 1992.

248
[67] Y. Zhang, Y. Zhou, A. Qiu, Y. Wang, Y. Xu and P. Wu. Effect of alumina binder on
catalytic performance of PtSnNa/ZSM-5 catalyst for propane dehydrogenation. Industrial
and Engineering Chemistry Research 45(7), pp. 2213-2219. 2006.
[68] J. S. Buchanan, D. H. Olson and S. E. Schramm. Gasoline selective ZSM-5 FCC
additives: Effects of crystal size, SiO2/Al2O3, steaming, and other treatments on ZSM-5
diffusivity and selectivity in cracking of hexene/octene feed. Applied Catalysis A:
General 220(1-2), pp. 223-234. 2001.
[69] Y. Li, S. Liu, S. Xie and L. Xu. Promoted metal utilization capacity of alkali-treated
zeolite: Preparation of zn/ZSM-5 and its application in 1-hexene aromatization. Applied
Catalysis A: General 360(1), pp. 8-16. 2009.
[70] H. Long, X. Wang and W. Sun. Study of n-octene aromatization over nanoscale
HZSM-5 zeolite. Microporous and Mesoporous Materials 119(1-3), pp. 18-22. 2009.
[71] S. L. Fegade, S. Bithi, B. Tande, W. Seames, D. Muggli, A. Kubátová and E.
Kozliak. Production of bio-based aromatic compounds from crop oil. ACS National
Meeting Book of Abstracts. 2011.
[72] S. L. Fegade, B. Tande, W. Seames, A. Kubátová and E. Kozliak. Triglycerides as
an alternative feedstock for manufacturing aromatic compounds. ACS National Meeting
Book of Abstracts. 2011.
[73] S. L. Fegade, B. M. Tande, H. Cho, W. S. Seames, I. Sakodynskaya, D. S. Muggli
and E. I. Kozliak. Aromatization of propylene over hzsm-5: A design of experiments
(DOE) approach. Chem. Eng. Commun. 200(8), pp. 1039-1056. 2013.
[74] S. L. Fegade, B. Tande, W. Seames, A. Kubátová and E. Kozliak. Catalytic
conversion of 1-tetradecene to aromatic compounds over zeolites under mild conditions.
ACS National Meeting Book of Abstracts. 2011.
[75] S. L. Fegade, H. Cho, B. Tande, W. Seames, D. Muggli and E. Kozliak.
Determination of significant factors influencing the aromatization of propylene via
statistical path. ACS National Meeting Book of Abstracts. 2011.
[76] R. J. Nash, M. E. Dry and C. T. O'Connor. Aromatization of 1-hexene and 1-octene
by gallium/H-ZSM-5 catalysts. Applied Catalysis A: General 134(2), pp. 285-297. 1996.

249
[77] Y. Li, S. Liu, Z. Zhang, S. Xie, X. Zhu and L. Xu. Aromatization and isomerization
of 1-hexene over alkali-treated HZSM-5 zeolites: Improved reaction stability. Applied
Catalysis A: General 338(1-2), pp. 100-113. 2008.
[78] G. R. Lappin and J. D. Sauer. Alpha Olefins Applications Handbook. CRC Press,
1989.
[79] D. L. Burdick and W. L. Leffler. Petrochemicals in Nontechnical Language.
Pennwell Books, 2001.
[80] H. Wittcoff, B. G. Reuben, J. S. Plotkin. Industrial organic chemicals. John Wiley &
Sons, 2012.
[81] ASTM Committee D-2 on Petroleum Products and Lubricants., American Petroleum
Institute. Refining Dept. Technical Data Committee., Pennsylvania State University.
Dept. of Chemical Engineering. and ASTM Committee D-2 on Petroleum Products and
Lubricants. Physical Constants of Hydrocarbon and Non-Hydrocarbon Compounds
1991.
[82] J. Koivumäki. Properties of ethylene/1-octene, 1-tetradecene and 1-octadecene
copolymers obtained with Cp2ZrCl2/MAO catalyst: Effect of composition and
comonomer chain length. Polymer Bulletin 36(1), pp. 7-12. 1996.
[83] V. Kotzabasakis, N. Petzetakis, M. Pitsikalis, N. Hadjichristidis and D. J. Lohse.
Copolymerization of tetradecene-1 and octene-1 with silyl-protected 10-undecen-1-ol
using a Cs-symmetry hafnium metallocene catalyst. A route to functionalized poly(α-
olefins). J. Polym. Sci. Part A 47(3), pp. 876-886. 2009.
[84] A. I. Akhmedov and A. M. Levshina. Copolymers of decyl methacrylate with
tetradecene as VI Improvers. Chem. Technol. Fuels Oils 22(5-6), pp. 300-301. 1986.
[85] J. Štávová, D. C. Stahl, W. S. Seames and A. Kubátová. Method development for the
characterization of biofuel intermediate products using gas chromatography with
simultaneous mass spectrometric and flame ionization detections. Journal of
Chromatography A 1224pp. 79-88. 2012.
[86] P. Qiu, J. Lunsford, M. Rosynek. Characterization of Ga/ZSM-5 for the catalytic
aromatization of dilute ethylene streams. Catalysis letters. 52(1-2), 37-42. 1998.
[87] D. Olson, G. Kokotailo, S. Lawton and W. Meier. Crystal structure and structure-
related properties of ZSM-5. J. Phys. Chem. 85(15), pp. 2238-2243. 1981.

250
[88] T. J. Benson, R. Hernandez, M. G. White, W. Todd French, E. E. Alley, W. E.
Holmes and B. Thompson. Heterogeneous cracking of an unsaturated fatty acid and
reaction intermediates on H+ZSM-5 catalyst. Clean - Soil, Air, Water 36(8), pp. 652-656.
2008.
[89] H. E. Jegers and M. T. Klein. Primary and secondary lignin pyrolysis reaction
pathways. Industrial and Engineering Chemistry Process Design and Development 24(1),
pp. 173-183. 1985.
[90] B. Valle, A. G. Gayubo, A. T. Aguayo, M. Olazar and J. Bilbao. Selective
production of aromatics by crude bio-oil valorization with a nickel-modified HZSM-5
zeolite catalyst. Energy and Fuels 24(3), pp. 2060-2070. 2010.
[91] Y. Cheng, Z. Wang, C. J. Gilbert, W. Fan and G. W. Huber. Production of p-xylene
from biomass by catalytic fast pyrolysis using ZSM-5 catalysts with reduced pore
openings. Angewandte Chemie International Edition 51(44), pp. 11097-11100. 2012.
[92] P. Duan and P. E. Savage. Upgrading of crude algal bio-oil in supercritical water.
Bioresour. Technol. 102(2), pp. 1899-1906. 2011.
[93] P. A. Horne and P. T. Williams. The effect of zeolite ZSM-5 catalyst deactivation
during the upgrading of biomass-derived pyrolysis vapours. J. Anal. Appl. Pyrolysis
34(1), pp. 65-85. 1995.
[94] P. A. Horne and P. T. Williams. Upgrading of biomass-derived pyrolytic vapours
over zeolite ZSM-5 catalyst: Effect of catalyst dilution on product yields. Fuel 75(9), pp.
1043-1050. 1996.
[95] T. P. Vispute, H. Zhang, A. Sanna, R. Xiao and G. W. Huber. Renewable chemical
commodity feedstocks from integrated catalytic processing of pyrolysis oils. Science
330(6008), pp. 1222-1227. 2010.
[96] Q. Zhang, J. Chang, T. Wang and Y. Xu. Review of biomass pyrolysis oil properties
and upgrading research. Energy Conversion and Management 48(1), pp. 87-92. 2007.
[97] J. D. Adjaye and N. N. Bakhshi. Production of hydrocarbons by catalytic upgrading
of a fast pyrolysis bio-oil. part I: Conversion over various catalysts. Fuel Process Technol
45(3), pp. 161-183. 1995.

251
[98] J. D. Adjaye and N. N. Bakhshi. Production of hydrocarbons by catalytic upgrading
of a fast pyrolysis bio-oil. part II: Comparative catalyst performance and reaction
pathways. Fuel Process Technol 45(3), pp. 185-202. 1995.
[99] J. D. Adjaye, S. P. R. Katikaneni and N. N. Bakhshi. Catalytic conversion of a
biofuel to hydrocarbons: Effect of mixtures of HZSM-5 and silica-alumina catalysts on
product distribution. Fuel Process Technol 48(2), pp. 115-143. 1996.
[100] R. O. Idem, S. P. R. Katikaneni and N. N. Bakhshi. Catalytic conversion of canola
oil to fuels and chemicals: Roles of catalyst acidity, basicity and shape selectivity on
product distribution. Fuel Process Technol 51(1-2), pp. 101-125. 1997.
[101] N. Mo and P. E. Savage. Hydrothermal catalytic cracking of fatty acids with
HZSM-5. ACS Sustainable Chemistry and Engineering 2(1), pp. 88-94. 2014.
[102] J. Mikulec, J. Cvengroš, Ľ Joríková, M. Banič and A. Kleinová. Second generation
diesel fuel from renewable sources. J. Clean. Prod. 18(9), pp. 917-926. 2010.
[103] Y. Ooi, R. Zakaria, A. R. Mohamed and S. Bhatia. Catalytic conversion of palm
oil-based fatty acid mixture to liquid fuel. Biomass Bioenergy 27(5), pp. 477-484. 2004.
[104] S. M. Sadrameli, A. E. S. Green and W. Seames. Modeling representations of
canola oil catalytic cracking for the production of renewable aromatic hydrocarbons. J.
Anal. Appl. Pyrolysis 86(1), pp. 1-7. 2009.
[105] H. M. Teeter, E. W. Bell and M. J. Danzig. Reactions of conjugated fatty acids.
VII. catalytic cyclization and aromatization of cis,trans-octadecadienoic acid with
selenium. J. Org. Chem. 23(8), pp. 1156-1158. 1958.
[106] K. D. Maher and D. C. Bressler. Pyrolysis of triglyceride materials for the
production of renewable fuels and chemicals. Bioresour. Technol. 98(12), pp. 2351-2368.
2007.
[107] T. Ngo, J. Kim, S. K. Kim and S. Kim. Pyrolysis of soybean oil with H-ZSM5
(proton-exchange of zeolite socony Mobil #5) and MCM41 (mobil composition of matter
no. 41) catalysts in a fixed-bed reactor. Energy 35(6), pp. 2723-2728. 2010.
[108] S. Gandhi, J. Kadrmas, J. Št'ávová, A. Kubátová, D. Muggli, W. S. Seames, S. M.
Sadrameli and B. M. Tande. Extraction of fatty acids from noncatalytically cracked
triacylglycerides with water and aqueous sodium hydroxide. Sep. Sci. Technol. 47(1), pp.
66-72. 2012.

252
[109] E. Kozliak, R. Mota, D. Rodriguez, A. Kubatova, D. C. Stahl, V. H. Niri, G. Ogden
and W. S. Seames. Non-catalytic cracking of jojoba oil to produce fuel and chemical by-
products. 20th International Congress of Chemical and Process Engineering and PRES
2012 - 15th Conference PRES. 2012 .
[110] A. Kubátová, Y. Luo, J. Šťávová, S. M. Sadrameli, T. Aulich, E. Kozliak and W.
Seames. New path in the thermal cracking of triacylglycerols (canola and soybean oil).
Fuel 90(8), pp. 2598-2608. 2011.
[111] C. M. R. Prado and N. R. Antoniosi Filho. Production and characterization of the
biofuels obtained by thermal cracking and thermal catalytic cracking of vegetable oils. J.
Anal. Appl. Pyrolysis 86(2), pp. 338-347. 2009.
[112] S. P. R. Katikaneni, J. D. Adjaye, R. O. Idem and N. N. Bakhshi. Performance
studies of various cracking catalysts in the conversion of canola oil to fuels and chemicals
in a fluidized-bed reactor. JAOCS, Journal of the American Oil Chemists' Society 75(3),
pp. 381-391. 1998.
[113] J. A. Melero, M. M. Clavero, G. Calleja, A. García, R. Miravalles and T. Galindo.
Production of biofuels via the catalytic cracking of mixtures of crude vegetable oils and
nonedible animal fats with vacuum gas oil. Energy and Fuels 24(1), pp. 707-717. 2010.
[114] T. J. Benson, R. Hernandez, W. T. French, E. G. Alley and W. E. Holmes.
Elucidation of the catalytic cracking pathway for unsaturated mono-, di-, and
triacylglycerides on solid acid catalysts. Journal of Molecular Catalysis A: Chemical
303(1–2), pp. 117-123. 2009.
[115] M. P. Braegelmann, A. D. Azure, D. C. Stahl, A. Kubátová, W. S. Seames and B.
M. Tande. Extraction of fatty acids from noncatalytically cracked triacylglycerides using
aqueous amines. Sep. Sci. Technol. 46(14), pp. 2167-2173. 2011.
[116] Y. Luo, I. Ahmed, A. Kubátová, J. Štávová, T. Aulich, S. M. Sadrameli and W. S.
Seames. The thermal cracking of soybean/canola oils and their methyl esters. Fuel
Process Technol 91(6), pp. 613-617. 2010.
[117] D. M. Bibby, N. B. Milestone, J. E. Patterson and L. P. Aldridge. Coke formation
in zeolite ZSM-5. Journal of Catalysis 97(2), pp. 493-502. 1986.
[118] K. -. Lee, M. -. Kang and S. -. Ihm. Deactivation by coke deposition on the HZSM-
5 catalysts in the methanol-to-hydrocarbon conversion. Journal of Physics and Chemistry
of Solids 73(12), pp. 1542-1545. 2012.

253
[119] K. I. Patrilyak, L. K. Patrilyak, V. V. Ivanenko, M. V. Okhrimenko and Y. G.
Voloshina. Oscillatory motion of coke in deactivated HZSM-5 zeolite. Theoretical and
Experimental Chemistry 46(4), pp. 256-262. 2010.
[120] I. Torre, J. M. Arandes, M. J. Azkoiti, M. Olazar and J. Bilbao. Cracking of coker
naphtha with gas-oil. effect of HZSM-5 zeolite addition to the catalyst. Energy and Fuels
21(1), pp. 11-18. 2007.
[121] H. G. Karge, J. Weitkamp. Characterization II, Springer, 2007.
[122] K. D. Maher and D. C. Bressler. Pyrolysis of triglyceride materials for the
production of renewable fuels and chemicals. Bioresour. Technol. 98(12), pp. 2351-2368.
2007.
[123] K. M. Doll, B. K. Sharma, P. A. Z. Suarez and S. Z. Erhan. Comparing biofuels
obtained from pyrolysis, of soybean oil or soapstock, with traditional soybean biodiesel:
Density, kinematic viscosity, and surface tensions. Energy and Fuels 22(3), pp. 2061-
2066. 2008.
[124] C. R. A. Catlow. Modelling of Structure and Reactivity in Zeolites 1992.
[125] S. Ernst. Advances in nanoporous materials. Elsevier, 2009.
[126] K. Kim and H. Ahn. The effect of pore structure of zeolite on the adsorption of
VOCs and their desorption properties by microwave heating. Microporous and
Mesoporous Materials 152pp. 78-83. 2012.
[127] R. V. Lenth. Quick and easy analysis of unreplicated factorials. Technometrics
Technometrics 31(4), pp. 469-473. 1989.
[128] B. A. Bodt. Modern Statistics for Engineering and Quality Improvement.
Technometrics, 2002.
[129] H. E. Jegers and M. T. Klein. Primary and secondary lignin pyrolysis reaction
pathways. Industrial and Engineering Chemistry Process Design and Development 24(1),
pp. 173-183. 1985.
[130] E. Dorrestijn, L. J. J. Laarhoven, I. W. C. E. Arends and P. Mulder. Occurrence and
reactivity of phenoxyl linkages in lignin and low rank coal. J. Anal. Appl. Pyrolysis
54(1), pp. 153-192. 2000.

254
[131] C. WANG, Q. HAO, D. LU, Q. JIA, G. LI and B. XU. Production of light aromatic
hydrocarbons from biomass by catalytic pyrolysis. Chinese Journal of Catalysis 29(9),
pp. 907-912. 2008.
[132] J. A. Melero, M. M. Clavero, G. Calleja, A. García, R. Miravalles and T. Galindo.
Production of biofuels via the catalytic cracking of mixtures of crude vegetable oils and
nonedible animal fats with vacuum gas oil. Energy and Fuels 24(1), pp. 707-717. 2010.
[133] S. P. R. Katikaneni, J. D. Adjaye, R. O. Idem and N. N. Bakhshi. Performance
studies of various cracking catalysts in the conversion of canola oil to fuels and chemicals
in a fluidized-bed reactor. JAOCS, Journal of the American Oil Chemists' Society 75(3),
pp. 381-391. 1998.
[134] W. Seames, Y. Luo, I. Ahmed, T. Aulich, A. Kubátová, J. Št'ávová and E. Kozliak.
The thermal cracking of canola and soybean methyl esters: Improvement of cold flow
properties. Biomass Bioenergy 34(7), pp. 939-946. 2010.