Correction of ADCP Compass Errors Resulting from Iron in the ...

ORIGINAL PAPER
Soil chemical changes resulting from irrigatingwith petrochemical effluents
N. K. Sharma • S. Bhardwaj • P. K. Srivastava •
Y. J. Thanki • P. K. Gadhia • M. Gadhia
Received: 16 September 2010 / Revised: 23 May 2011 / Accepted: 19 October 2011 / Published online: 23 March 2012
� CEERS, IAU 2012
Abstract Irrigating food crops with treated wastewater is
a popular management option in India. This study evalu-
ated the impacts of land application of treated petro-
chemical effluent on soil chemical properties. Soil samples
were collected from different depths from sites irrigated
with petrochemical effluent for 2 years and from control
sites. The effluent collected was analysed for different
physic–chemical properties and its impact on Lagenaria
siceraria (Bottle gourd) growth. 100% concentrated efflu-
ent was used for the study and compared with the control.
It was observed that application of effluent significantly
increased the major cations and anions in the field. On the
basis of the study, it may be suggested that treated petro-
chemical effluent can be used as an alternate source for
irrigating crops as it increases the nutrient content of the
soil. The overall application indicates a lavishing growth of
L. siceraria crop in petrochemical irrigated soil than con-
trol sites. This study provides information for better
understanding of changes in soil properties due to land
application of petrochemical effluent. These changes must
be considered in developing possible criteria for preserving
delicate ecosystems.
Keywords Soil quality � Heavy metal �Petrochemical industries � Wastewater
Introduction
Water is critical for sustainable development and is
indispensable for human health and well-being round the
globe. Water quality, which is influenced by various
natural processes and anthropogenic activities, is now
worldwide current environmental issue in research (Sri-
vastava et al. 2008, 2011). In India, agriculture is the
largest single user of water with about one-third of fresh
water being currently used for the irrigation. With
increasing pressure on fresh water resources, there is need
to conserve this important valuable natural resource. Non-
conventional water resources such as treated wastewater
represent complementary water resources and can be used
as an alternative to fresh water irrigation (Angelakis and
Bontoux 2001; Friedler 2001; Al-Jayyousi 2003; Ander-
son 2003; Toze 2006).
The oil industry has made great technological advances
since exploration began 150 years ago (Kerr 1998;
Campbell 2001; Hirsch et al. 2005; Rajesh et al. 2009;
Refaat 2009). Indian refineries have been provided stable
and higher returns than the predicted ones. Currently, India
has oil refining capacity of 2.6 million barrels per day
against domestic consumption of about 2.2 million barrels
per day. The refining capacity is expected to rise to
4.84 million bpd by 2012, an increase of 62% from current
levels. According to an estimate from India’s Petroleum
N. K. Sharma (&) � P. K. Srivastava
Department of Biological and Environmental Science,
N. V. Patel College of Pure and Applied Sciences,
Vallabh Vidya Nagar, Anand, Gujarat, India
e-mail: [email protected]
S. Bhardwaj
Department of Botany, Bareily College, Bareily, UP, India
Present Address:P. K. Srivastava
Water and Environment Management Research Centre,
Department of Civil Engineering, University of Bristol,
Bristol, UK
Y. J. Thanki � P. K. Gadhia � M. Gadhia
Department of Biosciences, V.N. South Gujarat University,
Surat, Gujarat, India
123
Int. J. Environ. Sci. Technol. (2012) 9:361–370
DOI 10.1007/s13762-012-0039-5

ministry, the country ranks sixth in the world in terms of
petroleum demand. In future, India is projected to replace
South Korea and emerge as the fourth largest consumer of
energy after United States, China and Japan.
The optimum utilization and benefits from crude oil are
derived by converting crude oil (through processing in
petrochemical) into a wide range of products such as
petroleum fuels, lubricants, bitumen and waxes based on
market demand (Speight and Knovel 2002; Ojumu et al.
2005; Speight 2007). For processing, the Oil and Natural
Gas Corporation (petrochemical) uses a large amount of
water and generates about approximately 0.6 barrels of
wastewater per barrel of oil processed. This equates to
1.7 billion gallons of wastewater that must be treated to
meet environmental discharge (Wong and Hung 2004;
Devold 2007). This water was contaminated by waste oil
and other impurities from refining processes. Its uncon-
trolled disposal may result in the degradation of environ-
ment and depreciation of aesthetic quality (Hegg et al.
1978; Fano et al. 1986; Pessala et al. 2004). Therefore,
petroleum refineries around the world have adopted dif-
ferent technological options to manage the wastes gener-
ated during the refining process and stocking of crude oil
(Joseph and Joseph 2009). (Lee et al. 2004) suggested a
two-stage sequencing batch reactor system for the treat-
ment of oily wastewater. Electrocoagulation of phenol
using aluminium electrodes has emerged as a promising
process to remove phenol from petrochemical waste
(Ojumu et al. 2005; Abdelwahab et al. 2009). Biological
degradation has also been reported, pseudomonas strains
have a strong ability to degrade kerosene, gasoline, diesel,
engine oil and crude oil (Obayori et al. 2009; Rajesh et al.
2009). Due to the strict enforcement of environmentalists
and environmental government regulators, industries are
opting for reuse of effluent for irrigation purposes in
agricultural fields. Though the concept seems to be prom-
ising, the real success can be attributed only if there is no
toxic accumulation in the long run. The prevention of such
problems lies in the detailed analysis of different industrial
effluents and their treatment before discharge and even
more crucial is the effect produced by the effluent on soil,
water and crop plants (Aziz et al. 1996; Bond 1998; NE
and JC 2005; Tandi et al. 2005; Ganeshamurthy et al. 2008;
Singh and Agrawal 2008; O’Connor et al. 2008; Rajesh
et al. 2009). Nutrient supplying potential of petrochemical
effluent is directly related to the type of crude oil used in
refinery, which in turn depends on the source of crude oil.
The petrochemical effluent has been found to contain
nearly all major cations and anions (Sharma 2010). The
effect of wastewater application on the land varied with
soil type, wastewater characteristics and the vegetation of
the irrigated soil (Pound and Crites 1973; Magesan et al.
2000).
Oil and Natural Gas Corporation (petrochemical) is
most valuable company situated in Gujarat state which is
about 13 km away from Surat, contributes 77% of India’s
natural gas production (Fig. 1). Hazira plant of petro-
chemical has a great importance due to its contribution of
gas production. It has various unit viz., LPG, recovery, gas
sweetening, gas dehydration, condensation, fractionation,
dew points depression and boiler unit. The wastewater
treatment plant of petrochemical, Hazira is designed to
treat wastewater and meet the water quality standards.
Hazira wastewater unit releases 15,000 m3/day. Pre-
liminary work has also been reported on the irrigational
utility of petrochemical wastewater (Schmidt et al. 1975;
Al-A’ama and Nakhla 1995; Aziz et al. 1995; Sastry and
Sundaramoorthy 1996; Hussain et al. 2002). Some works
have been done on the performance of a few crops irrigated
with wastewaters discharged from various sources (Day
et al. 1979; Chakrabarti and Chakrabarti 1988; Greene
et al. 1980; Day et al. 1981; Reddy et al. 1990; Herpin et al.
2007). The present study was designed to attain compre-
hensive information on the effect of treated-gas processing
effluent on soil characteristics temporally and to assess its
suitability as an alternate source of fresh water irrigation.
Materials and methods
Field experiments and sampling
The impact of various dilutions of petrochemical effluent
on soil properties was studied under field experiments. The
experiment was laid out in random block design. The sizes
of plots are 20 9 20 m2. The seeds of L. siceraria were
sown at the rate of 20 per plot at random on the leveled and
moistened sandy loam soil. The seeds were placed about
3–4 cm depth as per the garden guide available on
http://www.gardenguides.com. Soil samples collected from
the fresh-water-irrigated fields were taken as pre-treated
soil and considered as control. The samples were taken
between 10.00 am to 12.00 pm every month, for the period
March 2005–February 2007. All samplings represent
instantaneous soil and water quality at the particular time.
These samples are collected from 0 to 15 cm depth as the
average root depth of bottle gourd plant lies in-between this
range, also confirmed through the measurements of some
previous plants.
Irrigation water analysis
The effluent was collected from the Surat petrochemical in
pre-cleaned polyethylene bottles of 2-L capacity with
necessary precautions. The collected water samples were
divided in two bottles. One bottle was acidified with nitric
362 Int. J. Environ. Sci. Technol. (2012) 9:361–370
123

acid to pH \ 2 and stored at 4�C for the later analysis of
the heavy metals. These were carried out according to the
protocols of ultra-trace-metal analysis (Bruland et al. 1979)
using AAS-Graphite furnace technique, and Zn was
determined using AAS method (Shimadzu, 6800). The
other bottle was stored at 4�C without the addition of
preservatives for the analysis of major water parameters.
The effluent was then analyzed for different physic–
chemical properties (i.e., TH, TDS, Ca2?, Mg2?, alkalinity,
Cl-, SO42-, carbonate, bicarbonate, etc) using the standard
methods (APHA et al. 1995) and compared with physic–
chemical characteristics of control water. pH and EC were
measured using pH conductivity meter in the field. Bicar-
bonate was determined by potentiometric titration method.
Chloride ion is one of the major inorganic anions in water
and was estimated by Mohr’s titration method. Calcium
and magnesium ions were analysed using atomic absorp-
tion spectrophotometer (AAS) (Shimadzu, 6800), turbidity
by Nephelo-turbidity meter, total hardness by titrimetric
method, BOD as per standard method (NEERI 1991), and
Fig. 1 Location of Surat
Refinery (Petrochemical), India
(Source: http://www.
mapsofindia.com)
Int. J. Environ. Sci. Technol. (2012) 9:361–370 363
123

Ta
ble
1P
hy
sic–
chem
ical
char
acte
rist
ics
of
pet
roch
emic
alef
flu
ent
inco
mp
aris
on
wit
hco
ntr
ol
wat
er(a
llu
nit
sar
ein
mg
/Lex
cep
tp
H)
Du
rati
on
pH
CO
DT
DS
TA
TH
Oan
dG
PO
4
FW
TW
FW
TW
FW
TW
FW
TW
FW
TW
FW
TW
FW
TW
Mar
ch2
00
5–
Jun
e2
00
57
.2±
0.0
05
7.5
±0
.00
76
.3±
0.0
01
28
.0±
0.0
07
87
.2±
0.0
08
29
7.0
±0
.04
55
8.0
±0
.01
29
5.0
±0
.04
51
09.0
±0
.02
31
97
.5±
0.0
13
N.D
.2
.0±
0.0
65
14
.7±
0.0
05
33
.2±
0.0
06
July
20
05
–O
ct2
00
57
.2±
0.0
02
7.6
±0
.00
68
.0±
0.0
02
14
.1±
0.0
09
17
2.5
±0
.01
23
34
.0±
0.0
23
12
8.5
±0
.01
31
28.5
±0
.03
41
07.7
±0
.03
11
68
.2±
0.0
14
N.D
.1
.5±
0.0
60
30
.0±
0.0
03
59
.0±
0.0
07
No
v2
00
5–
Feb
20
06
7.1
±0
.00
27
.4±
0.0
06
5.0
±0
.00
11
0.6
±0
.00
61
26
.0±
0.0
13
23
5.3
±0
.03
19
7.7
±0
.01
71
30.5
±0
.04
39
9.0
±0
.02
41
54
.8±
0.0
15
N.D
.1
.0±
0.0
34
19
.7±
0.0
08
37
.7±
0.0
08
Mar
ch2
00
6–
Jun
e2
00
67
.1±
0.0
01
7.6
±0
.00
56
.1±
0.0
04
11
.7±
0.0
05
13
6.8
±0
.01
23
12
.0±
0.0
24
10
5.7
±0
.01
21
33.7
±0
.04
17
3.0
±0
.02
41
06
.5±
0.0
15
N.D
.0
.93
±0
.23
21
.7±
0.0
09
50
.7±
0.0
09
July
20
06
–O
ct2
00
67
.6±
0.0
07
7.6
±0
.00
29
.1±
0.0
08
37
.2±
0.0
08
15
6.3
±0
.02
13
40
.7±
0.0
31
13
7.0
±0
.01
31
33.5
±0
.01
41
66.3
±0
.03
51
41
.3±
0.0
17
N.D
.0
.92
±0
.03
12
7.7
±0
.00
73
4.2
±0
.00
7
No
v2
00
6–
Feb
20
07
7.4
±0
.00
27
.5±
0.0
07
3.9
±0
.00
59
.60
±0
.00
71
01
.5±
0.0
14
25
5.5
±0
.04
76
7.5
±0
.01
41
11.0
±0
.01
31
13.3
±0
.03
41
50
.0±
0.0
18
N.D
.1
.20
±0
.02
32
7.7
±0
.00
66
0.7
±0
.00
5
Du
rati
on
NO
3C
aM
gN
aK
Cl-
SO
4
FW
TW
FW
TW
FW
TW
FW
TW
FW
TW
FW
TW
FW
TW
Mar
ch
20
05
–Ju
ne
20
05
0.0
9±
0.0
23
1.5
±0
.00
21
3.0
±0
.00
42
3.0
±0
.00
31
0.8
±0
.00
41
7.6
±0
.00
41
7.5
±0
.00
31
06
.5±
0.0
14
3.1
±0
.00
41
39
.0±
0.0
12
65
.8±
0.0
22
8.9
±0
.00
37
2.0
±0
.02
48
0.0
±0
.05
6
July 2
00
5–
Oct
20
05
0.2
5±
0.0
02
2.2
±0
.00
31
4.8
±0
.00
32
0.6
±0
.00
22
0.8
±0
.00
22
3.3
±0
.00
42
7.9
±0
.00
21
08
.0±
0.0
12
2.4
±0
.00
31
33
.3±
0.0
23
19
.0±
0.0
36
5.8
±0
.01
27
0.0
±0
.03
88
5.0
±0
.06
1
No
v 20
05
–F
eb2
00
6
0.3
2±
0.0
03
1.4
±0
.00
41
7.1
±0
.00
42
6.8
±0
.00
41
4.6
±0
.00
24
3.6
±0
.00
84
0.1
±0
.00
41
50
.0±
0.0
17
3.6
±0
.00
21
32
.5±
0.0
45
19
.5±
0.0
07
71
.5±
0.0
23
68
.0±
0.0
33
88
.0±
0.0
33
Mar
ch
20
06
–Ju
ne
20
06
0.3
6±
0.0
05
1.9
±0
.00
21
5.1
±0
.00
82
5.7
±0
.00
37
.90
±0
.00
11
7.8
±0
.00
52
3.4
±0
.00
51
47
.3±
0.0
19
2.9
±0
.00
41
30
.3±
0.0
76
3.6
0±
0.0
01
71
.1±
0.0
30
58
.0±
0.0
25
74
.0±
0.0
42
July 2
00
6–
Oct
20
06
1.3
±0
.00
50
.57
±0
.00
11
5.2
±0
.00
42
6.6
±0
.00
91
4.2
±0
.00
52
3.6
±0
.00
42
4.3
±0
.00
41
40
.0±
0.0
20
3.4
±0
.00
51
24
.5±
0.0
25
4.3
0±
0.0
03
40
.4±
0.0
39
74
.0±
0.0
33
78
.0±
0.0
12
No
v 20
06
–F
eb2
00
7
0.0
8±
0.0
05
1.0
±0
.00
11
0.9
±0
.00
32
6.1
±0
.00
54
.60
±0
.00
18
.7±
0.0
02
30
.8±
0.0
06
23
8.0
±0
.03
14
.8±
0.0
05
13
2.5
±0
.03
33
.90
±0
.00
19
4.3
±0
.04
65
6.0
±0
.01
86
8.0
±0
.01
4
FW
Fre
shw
ater
,T
Wtr
eate
dp
etro
chem
ical
effl
uen
t
364 Int. J. Environ. Sci. Technol. (2012) 9:361–370
123

COD by potassium dichromate open reflex method (APHA
et al. 1995).
Soil analysis
Soil samples were air dried, sieved through a 2 mm mesh
and homogenized and then were analyzed for different
physic–chemical, cation-exchange capacity, hydrogen ion
concentration, EC, organic carbon, N, P, Na, K, Ca2?,
Mg2?, SO42-, alkalinity, heavy metals mainly Fe, Pb, Zn,
Co, Cr and Cu. Soil analysis was done as per the methods
given in USDA Handbook No. 60 (Richards 1954). All
heavy metal concentrations in solution phase were deter-
mined by using AAS. Extractable metals were determined
by AAS (Shimadzu, 6800) using DTPA as single extractant
(Lindsay 1978).
Statistical analysis
The data obtained were subjected to mean and standard
deviation. The relationship between various soil parameters
was analysed through correlation coefficients following
(Nagelkerke 1991). The data were analysed on SPSS 17.0
software. The coefficient of correlation (r) is a measure of
the strength of the straight-line or linear relationship
between two variables. The correlation coefficient takes on
values ranging between ?1 and -1. ?1 indicates a per-
fectly positive linear relationship, while 0 and -1 indicate
no or perfectly negative correlation, respectively (Hedges
and Olkin 1985; Nagelkerke 1991). The mathematical
equation for r computation is:
r ¼ nP
xy�P
xð ÞP
yð ÞffiffiffiffiffiffiffiffiffiffiffiffiffiffiffiffiffiffiffiffiffiffiffiffiffiffiffiffiffiffiffiffiffiffiffiffinP
x2ð Þ �P
xð Þ2q ffiffiffiffiffiffiffiffiffiffiffiffiffiffiffiffiffiffiffiffiffiffiffiffiffiffiffiffiffiffiffiffiffiffiffiffi
nP
y2ð Þ �P
yð Þ2q
where x and y are the variables chosen for the analysis
and n is the number of pairs of data.
Results and discussion
Characterization of effluent
Petrochemical effluent was found to be having high amount
of nutrients than that of control as well as Central Pollution
Control Board standards (Table 1). The effluent had nor-
mal hydrogen ion concentration within the range (7.4–7.6)
of CPCB standards given in 2000 (http://www.cpcb.nic.in).
Electrical conductivity, total dissolved solids and other
characteristics were also higher than the control water but
within the CPCB standards limit. Such a nutritious effluent
might help to accumulate the required nutrients in the soil,
and hence, it can result in the better growth of crop plants.
Characterization of soil before and after irrigating
with fresh water and petrochemical effluent
The soil before irrigating with petrochemical effluent was
analysed for different physic–chemical properties
(Table 2). The soil was slightly alkaline in nature with very
low electrical conductivity (0.780 lX). The cation
exchange capacity and water holding capacity of the pre-
treated soil were observed to be slightly lesser than that of
treated soils. Temporally, the soil was supplemented with
petrochemical effluent under 100% concentrated regularly
for irrigation in the field in triplicates. Impact of petro-
chemical effluent on different physic–chemical properties
of soil was studied as shown in Table 3. The decrease in
bulk density and specific gravity of the soil might have
occurred due to the different concentrated petrochemical
effluent irrigation. When soil is irrigated with petrochem-
ical effluent, water holding capacity was found to be
improved at each successive level of plant growth. The
water holding capacity of the soil ranged from 32.12%
under control 39.02% at 100% effluent concentration. The
hydrogen ion concentration of the petrochemical effluent
treated-soil showed an increase from 8.5 to 8.6 at different
concentrations of effluent during various time intervals.
This might be due to the high value of alkalinity and sol-
uble salts present in the petrochemical effluent (Sharma
2010). The higher electrical conductivity at fresh-
water-irrigated soil was 1.26 lX reported in the period
between November 2006 and February 2007 and in soil of
treated effluent irrigated was 3.06 lX during July 2006–
October 2006. The irrigation of treated effluent has
increased the soil conductivity.
Organic matter of the treated soil irrigated with different
concentrations of the effluent increased with the increase in
concentration of the petrochemical effluent and ranged
from 0.43 to 1.37%. Organic matter was reported
Table 2 Physic–chemical properties of soil of both sites before
irrigation (all units are in mg/100 gm except pH)
Parameters Control Petrochemical
pH 7.8 ± 0.010 7.8 ± 0.010
Electrical conductivity 0.81 ± 0.012 0.83 ± 0.010
Available phosphorus (mg/100 gm) 0.72 ± 0.090 0.76 ± 0.080
Total alkalinity (mg/100 gm) 54 ± 1.02 68 ± 1.00
Organic matter 0.60 ± 0.031 0.58 ± 0.020
Calcium (mg/100 gm) 19.8 ± 0.02 21.0 ± 0.015
Magnesium (mg/100 gm) 7.5 ± 0.210 7.9 ± 0.016
Sodium (mg/100gm) 2.5 ± 0.067 2.8 ± 0.078
Potassium (mg/100 gm) 3.1 ± 0.132 5.8 ± 0.012
Sulphate (mg/100 gm) 4.8 ± 0.013 5.1 ± 0.013
Nitrate (mg/100 gm) 12.1 ± 0.048 14.0 ± 0.052
Int. J. Environ. Sci. Technol. (2012) 9:361–370 365
123
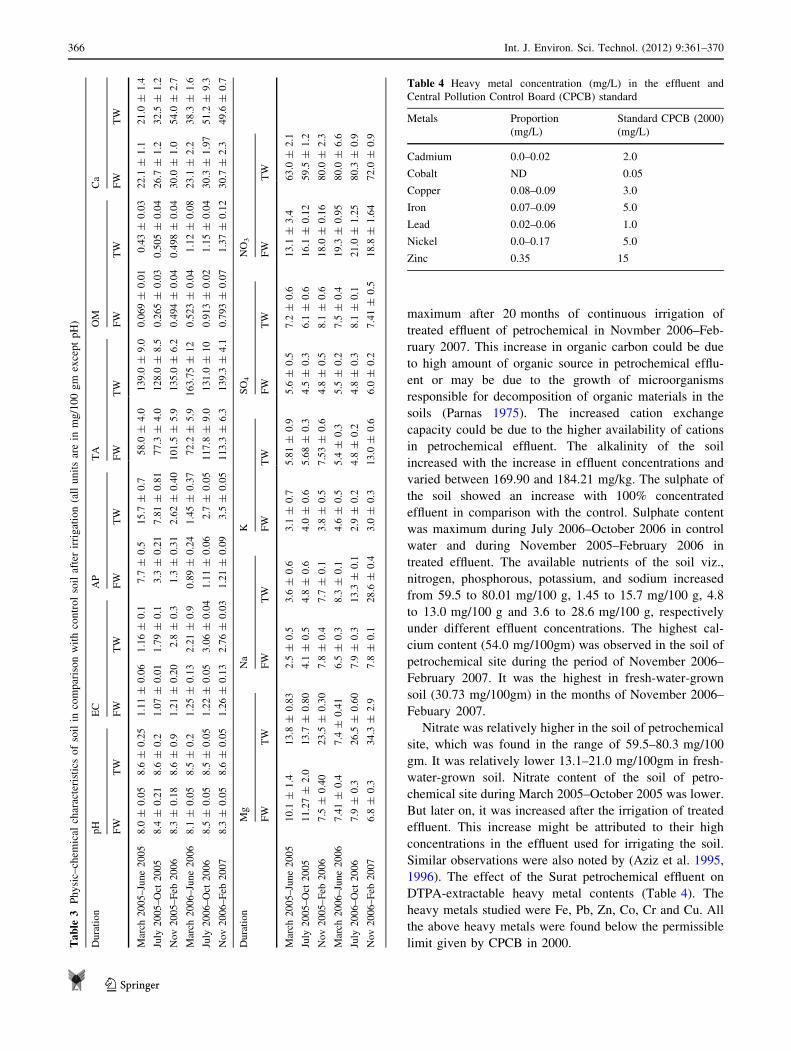
maximum after 20 months of continuous irrigation of
treated effluent of petrochemical in Novmber 2006–Feb-
ruary 2007. This increase in organic carbon could be due
to high amount of organic source in petrochemical efflu-
ent or may be due to the growth of microorganisms
responsible for decomposition of organic materials in the
soils (Parnas 1975). The increased cation exchange
capacity could be due to the higher availability of cations
in petrochemical effluent. The alkalinity of the soil
increased with the increase in effluent concentrations and
varied between 169.90 and 184.21 mg/kg. The sulphate of
the soil showed an increase with 100% concentrated
effluent in comparison with the control. Sulphate content
was maximum during July 2006–October 2006 in control
water and during November 2005–February 2006 in
treated effluent. The available nutrients of the soil viz.,
nitrogen, phosphorous, potassium, and sodium increased
from 59.5 to 80.01 mg/100 g, 1.45 to 15.7 mg/100 g, 4.8
to 13.0 mg/100 g and 3.6 to 28.6 mg/100 g, respectively
under different effluent concentrations. The highest cal-
cium content (54.0 mg/100gm) was observed in the soil of
petrochemical site during the period of November 2006–
February 2007. It was the highest in fresh-water-grown
soil (30.73 mg/100gm) in the months of November 2006–
Febuary 2007.
Nitrate was relatively higher in the soil of petrochemical
site, which was found in the range of 59.5–80.3 mg/100
gm. It was relatively lower 13.1–21.0 mg/100gm in fresh-
water-grown soil. Nitrate content of the soil of petro-
chemical site during March 2005–October 2005 was lower.
But later on, it was increased after the irrigation of treated
effluent. This increase might be attributed to their high
concentrations in the effluent used for irrigating the soil.
Similar observations were also noted by (Aziz et al. 1995,
1996). The effect of the Surat petrochemical effluent on
DTPA-extractable heavy metal contents (Table 4). The
heavy metals studied were Fe, Pb, Zn, Co, Cr and Cu. All
the above heavy metals were found below the permissible
limit given by CPCB in 2000.Ta
ble
3P
hy
sic–
chem
ical
char
acte
rist
ics
of
soil
inco
mp
aris
on
wit
hco
ntr
ol
soil
afte
rir
rig
atio
n(a
llu
nit
sar
ein
mg
/10
0g
mex
cep
tp
H)
Du
rati
on
pH
EC
AP
TA
OM
Ca
FW
TW
FW
TW
FW
TW
FW
TW
FW
TW
FW
TW
Mar
ch2
00
5–
June
20
05
8.0
±0
.05
8.6
±0
.25
1.1
1±
0.0
61
.16
±0
.17
.7±
0.5
15
.7±
0.7
58
.0±
4.0
13
9.0
±9
.00
.069
±0
.01
0.4
3±
0.0
32
2.1
±1
.12
1.0
±1
.4
July
20
05–
Oct
20
05
8.4
±0
.21
8.6
±0
.21
.07
±0
.01
1.7
9±
0.1
3.3
±0
.21
7.8
1±
0.8
17
7.3
±4
.01
28
.0±
8.5
0.2
65
±0
.03
0.5
05
±0
.04
26
.7±
1.2
32
.5±
1.2
No
v2
00
5–
Feb
20
06
8.3
±0
.18
8.6
±0
.91
.21
±0
.20
2.8
±0
.31
.3±
0.3
12
.62
±0
.40
10
1.5
±5
.91
35
.0±
6.2
0.4
94
±0
.04
0.4
98
±0
.04
30
.0±
1.0
54
.0±
2.7
Mar
ch2
00
6–
June
20
06
8.1
±0
.05
8.5
±0
.21
.25
±0
.13
2.2
1±
0.9
0.8
9±
0.2
41
.45
±0
.37
72
.2±
5.9
16
3.7
5±
12
0.5
23
±0
.04
1.1
2±
0.0
82
3.1
±2
.23
8.3
±1
.6
July
20
06–
Oct
20
06
8.5
±0
.05
8.5
±0
.05
1.2
2±
0.0
53
.06
±0
.04
1.1
1±
0.0
62
.7±
0.0
51
17
.8±
9.0
13
1.0
±1
00
.913
±0
.02
1.1
5±
0.0
43
0.3
±1
.97
51
.2±
9.3
No
v2
00
6–
Feb
20
07
8.3
±0
.05
8.6
±0
.05
1.2
6±
0.1
32
.76
±0
.03
1.2
1±
0.0
93
.5±
0.0
51
13
.3±
6.3
13
9.3
±4
.10
.793
±0
.07
1.3
7±
0.1
23
0.7
±2
.34
9.6
±0
.7
Du
rati
on
Mg
Na
KS
O4
NO
3
FW
TW
FW
TW
FW
TW
FW
TW
FW
TW
Mar
ch2
00
5–
June
20
05
10
.1±
1.4
13
.8±
0.8
32
.5±
0.5
3.6
±0
.63
.1±
0.7
5.8
1±
0.9
5.6
±0
.57
.2±
0.6
13
.1±
3.4
63
.0±
2.1
July
20
05–
Oct
20
05
11
.27
±2
.01
3.7
±0
.80
4.1
±0
.54
.8±
0.6
4.0
±0
.65
.68
±0
.34
.5±
0.3
6.1
±0
.61
6.1
±0
.12
59
.5±
1.2
No
v2
00
5–
Feb
20
06
7.5
±0
.40
23
.5±
0.3
07
.8±
0.4
7.7
±0
.13
.8±
0.5
7.5
3±
0.6
4.8
±0
.58
.1±
0.6
18
.0±
0.1
68
0.0
±2
.3
Mar
ch2
00
6–
June
20
06
7.4
1±
0.4
7.4
±0
.41
6.5
±0
.38
.3±
0.1
4.6
±0
.55
.4±
0.3
5.5
±0
.27
.5±
0.4
19
.3±
0.9
58
0.0
±6
.6
July
20
06–
Oct
20
06
7.9
±0
.32
6.5
±0
.60
7.9
±0
.31
3.3
±0
.12
.9±
0.2
4.8
±0
.24
.8±
0.3
8.1
±0
.12
1.0
±1
.25
80
.3±
0.9
No
v2
00
6–
Feb
20
07
6.8
±0
.33
4.3
±2
.97
.8±
0.1
28
.6±
0.4
3.0
±0
.31
3.0
±0
.66
.0±
0.2
7.4
1±
0.5
18
.8±
1.6
47
2.0
±0
.9
Table 4 Heavy metal concentration (mg/L) in the effluent and
Central Pollution Control Board (CPCB) standard
Metals Proportion
(mg/L)
Standard CPCB (2000)
(mg/L)
Cadmium 0.0–0.02 2.0
Cobalt ND 0.05
Copper 0.08–0.09 3.0
Iron 0.07–0.09 5.0
Lead 0.02–0.06 1.0
Nickel 0.0–0.17 5.0
Zinc 0.35 15
366 Int. J. Environ. Sci. Technol. (2012) 9:361–370
123

Ta
ble
5C
orr
elat
ion
coef
fici
ent
(r)
val
ue
calc
ula
ted
wit
hin
soil
(1–
10
),w
ith
infr
esh
wat
er(1
1–
19
)an
din
-bet
wee
nso
ilan
dfr
esh
wat
er(1
–1
0an
d1
1–
19
*)
pHC
on.
AP
TA
OM
Ca
Mg
Na
KN
O3−
pHT
AC
OD
PO
4N
O3−
Ca
Mg
Na
K
12
34
56
78
910
1112
1314
1516
1718
19
12
34
56
78
910
1112
1314
1516
1718
19
11.
00
20.
611.
00
3−
0.66
−0.
371.
00
40.
600.
41−
0.61
1.00
50.
180.
05−
0.41
0.57
1.00
60.
720.
58−
0.46
0.83
0.40
1.00
7−
0.46
−0.
530.
60−
0.46
−0.
43−
0.47
1.00
80.
630.
59−
0.60
0.93
0.46
0.90
−0.
531.
00
90.
620.
25−
0.13
0.39
−0.
030.
310.
040.
351.
00
100.
300.
11−
0.18
0.41
0.32
0.36
0.20
0.48
0.53
1.00
11−
0.20
−0.
410.
47−
0.26
−0.
67−
0.32
0.56
−0.
330.
32−
0.03
1.00
12−
0.10
−0.
53−
0.07
0.04
0.44
−0.
140.
43−
0.09
0.08
0.48
0.05
1.00
13−
0.21
−0.
470.
54−
0.28
−0.
29−
0.29
0.79
−0.
360.
350.
460.
620.
391.
00
140.
44−
0.20
−0.
310.
230.
220.
17−
0.17
0.06
0.33
−0.
200.
040.
32−
0.20
1.00
150.
470.
15−
0.71
0.57
0.56
0.38
−0.
320.
560.
300.
45−
0.27
0.57
−0.
310.
461.
00
160.
420.
45−
0.57
0.29
0.43
0.31
−0.
420.
38−
0.02
0.30
−0.
420.
23−
0.41
0.03
0.64
1.00
170.
30−
0.12
−0.
290.
270.
20−
0.14
−0.
11−
0.02
0.52
−0.
030.
210.
210.
060.
530.
290.
081.
00
180.
13−
0.15
−0.
510.
620.
740.
29−
0.12
0.52
0.16
0.66
−0.
270.
670.
010.
110.
760.
410.
251.
00
19−
0.40
−0.
160.
180.
330.
150.
19−
0.14
0.36
−0.
190.
080.
17−
0.09
−0.
08−
0.29
−0.
01−
0.18
−0.
240.
311.
00
Int. J. Environ. Sci. Technol. (2012) 9:361–370 367
123

Ta
ble
6C
orr
elat
ion
coef
fici
ent
(r)
val
ue
calc
ula
ted
wit
hin
soil
(1–
10
),w
ith
inp
etro
chem
ical
effl
uen
t(1
1–
19
)an
din
-bet
wee
nso
ilan
dfr
esh
wat
er(1
–1
0an
d1
1–
19
)
12
34
56
78
910
1112
1314
1516
1718
19
11.
00
2−
0.24
1.00
3−
0.39
−0.
521.
00
4−
0.50
−0.
100.
791.
00
50.
010.
17−
0.02
−0.
171.
00
6−
0.15
0.94
−0.
65−
0.21
0.15
1.00
7−
0.17
0.68
−0.
150.
010.
410.
631.
00
8−
0.50
0.77
−0.
330.
16−
0.19
0.82
0.49
1.00
90.
090.
41−
0.13
−0.
120.
580.
240.
36−
0.18
1.00
10−
0.20
0.71
−0.
40−
0.05
0.00
0.81
0.53
0.71
0.19
1.00
11−
0.03
−0.
120.
420.
320.
20−
0.20
0.37
−0.
220.
11−
0.33
1.00
12−
0.03
0.24
−0.
34−
0.04
−0.
110.
350.
000.
45−
0.32
0.12
−0.
011.
00
130.
24−
0.82
0.56
0.10
−0.
17−
0.80
−0.
37−
0.66
−0.
28−
0.36
0.01
−0.
481.
00
14−
0.55
−0.
070.
320.
33−
0.06
−0.
22−
0.27
0.09
−0.
25−
0.55
0.10
0.18
−0.
261.
00
150.
51−
0.06
−0.
21−
0.36
0.08
−0.
14−
0.06
−0.
380.
09−
0.50
0.20
−0.
20−
0.07
0.16
1.00
160.
300.
27−
0.13
0.04
0.09
0.14
0.02
0.07
0.27
0.04
−0.
340.
30−
0.15
0.01
0.07
1.00
17−
0.17
0.36
−0.
300.
01−
0.04
0.47
0.00
0.56
−0.
160.
46−
0.39
0.83
−0.
380.
01−
0.53
0.46
1.00
18−
0.06
0.40
−0.
210.
09−
0.21
0.44
0.36
0.58
−0.
230.
360.
080.
79−
0.33
−0.
05−
0.39
0.40
0.74
1.00
190.
14−
0.15
0.14
−0.
120.
13−
0.21
0.20
−0.
400.
27−
0.16
0.37
−0.
820.
26−
0.22
0.46
−0.
57−
0.94
−0.
711.
00
pHC
on.
AP
TA
OM
Ca
Mg
Na
KN
O3−
pHT
AC
OD
PO
4N
O3−
Ca
Mg
Na
K
12
34
56
78
910
1112
1314
1516
1718
19
368 Int. J. Environ. Sci. Technol. (2012) 9:361–370
123

Correlation analysis of soil with petrochemical effluent
and fresh water
The correlation analysis between physic–chemical parame-
ters of soil after irrigation with petrochemical effluent was
given in Tables 5 and 6. The results showed positive signif-
icant correlation among all the physic–chemical parameters
of the soil except with bulk density and specific gravity.
Effect of petrochemical effluent on plant height
The effect of the effluent on plant height of bottle gourd crop
plant is shown in Table 7. The length of bottle gourd plants
cultivated at petrochemical site was higher than the plants of
control site on 10th day. The growth was slower in the period
between 10 and 30 days after germination in bottle gourd of
control site than petrochemical site. Maximum plant height
was reported in petrochemical effluent in the period of
November 2006–February 2007, after 30 days of plant
growth. This might be due to the availability of more nutrients
in the effluent as compared to control.
Conclusion
This study showed that petrochemical effluent has con-
siderable prospect to use as an irrigation source in India. It
provides farmers with a high-nutrient water supply with a
reliable and low-cost system for wastewater disposal. The
study showed that application of petrochemical effluent
enhanced the growth of bottle gourd plant in all replicates.
This study is important to evaluate the monitoring pro-
gramm at a reclaimed water irrigation site to satisfy reg-
ulatory discharge requirements, and to provide timely
information regarding the potential accumulation of con-
stituents that may reach toxic concentrations. The study is
important to appraise short and long-term effects of efflu-
ent irrigation. The results can be used both as a tactical
planning tool to address broad-scale water vulnerability
concerns and also as a premeditated guide to help managers
in designing efficient pollution control measures.
Acknowledgments Authors are highly thankful to the Department
of Biosciences, Veer Narmad South Gujarat University, Surat, Guj-
arat, India for providing the necessary facilities for the research.
Authors would also like to thanks Oil and Natural Gas Corporation,
India for their help and support during the analysis.
References
Abdelwahab O, Amin N, El-Ashtoukhy E (2009) Electrochemical
removal of phenol from oil refinery wastewater. J Hazard Mater
163(2–3):711–716
Al-A’ama MS, Nakhla G (1995) Wastewater reuse in Jubail. Saudi
Arab Water Res 29(6):1579–1584
Al-Jayyousi OR (2003) Greywater reuse: towards sustainable water
management. Desalination 156(1–3):181–192
Anderson J (2003) The environmental benefits of water recycling and
reuse. Water Sci Tech Water Supply 3(4):1–10
Angelakis A, Bontoux L (2001) Wastewater reclamation and reuse in
Eureau countries. Water Pol 3(1):47–59
APHA, AWWA, WEF (1995) Standard methods for the examination
of water and wastewater. American Public Health Association,
American Water Works Association and the Water Environment
Federation, Washington DC
Aziz O, Manzar M, Inam A (1995) Suitability of petrochemical industry
wastewater for irrigation. J Environ Sci Health 30(4):735–751 (Part A)
Aziz O, Inam A, Siddiqi R (1996) Long term effects of irrigation with
petrochemical industry wastewater. J Environ Sci Health
31(10):2595–2620 (Part A)
Bond W (1998) Effluent irrigation-an environmental challenge for
soil science. Australian J. Soil Res. 36(4):543–555
Bruland KW, Franks RP, Knauer GA, Martin JH (1979) Sampling and
analytical methods for the determination of copper, cadmium,
zinc, and nickel at the nanogram per liter level in sea water. Anal
Chim Acta 105:233–245
Campbell CJ (2001) The imminent peak of world oil production:
speech to the House of Commons. All-Party Committee, London
Chakrabarti C, Chakrabarti T (1988) Effects of irrigation with raw and
differentially diluted sewage and application of primary settled
sewage-sludge on wheat plant growth, crop yield, enzymatic
changes and trace element uptake. Environ Pollut 51(3):219–235
Day A, McFadyen J, Tucker T, Cluff C (1979) Wastewater helps the
barley grow. Water and Wastes Engineering August 1979,
p 26–28 OWRT-A-050-ARIZ (2), 14–31-0001–5003
Day A, McFadyen J, Tucker T, Cluff C (1981) Safflower grown with
municipal wastewater and pump water. J Arizona–Nevada
Academy of Sci 16(2):62–64
Table 7 Effect of petrochemical effluent on plant height (cm ± SE)
Duration Plant height of Lagenaria siceraria L.
(cm ± S.D.)
Days Control Petrochemical
effluent
March 2005–June
2005
10 days 6.0 ± 0.005 14.0 ± 0.090
20 days 12.5 ± 0.012 42.0 ± 0.250
30 days 18.0 ± 0.023 50.0 ± 0.320
July 2005–Oct 2005 10 days 6.5 ± 0.004 15.0 ± 0.089
20 days 12.0 ± 0.020 39.0 ± 0.120
30 days 17.0 ± 0.018 49.0 ± 0.098
Nov 2005–Feb 2006 10 days 6.2 ± 0.005 13.0 ± 0.085
20 days 12.0 ± 0.005 41.0 ± 0.090
30 days 16.9 ± 0.025 52.0 ± 0.220
March 2006–June
2006
10 days 5.9 ± 0.002 14.5 ± 0.079
20 days 11.2 ± 0.022 39.5 ± 0.450
30 days 16.4 ± 0.023 47.0 ± 0.320
July 2006–Oct 2006 10 days 7.5 ± 0.014 17.0 ± 0.098
20 days 12.0 ± 0.020 40.0 ± 0.220
30 days 19.0 ± 0.021 53.0 ± 0.081
Nov 2006–Feb 2007 10 days 5.9 ± 0.005 11.0 ± 0.065
20 days 11.0 ± 0.005 38.0 ± 0.078
30 days 15.8 ± 0.045 62.0 ± 0.170
Int. J. Environ. Sci. Technol. (2012) 9:361–370 369
123

Devold H (2007) Oil and gas production handbook: an introduction to
oil and gas production. ABB Oil and Gas
Fano E, Brewster M, Thompson T (1986) Managing water quality in
developing countries. Wiley Online Library, USA
Friedler E (2001) Water reuse- an integral part of water resources
management: Israel as a case study. Water Pol 3(1):29–39
Ganeshamurthy A, Varalakshmi L, Sumangala H (2008) Environ-
mental risks associated with heavy metal contamination in soil,
water and plants in urban and periurban agriculture. J Horticultur
Sci 3(1):1–29
Greene MC, Delaney RH, Moyer JL, Borrelli J (1980) Forage
production utilizing cheese plant effluent under high-altitude
conditions. J Water Pollut Cont Federat 52(12):2855–2864
Hedges LV, Olkin I (1985) Statistical methods for meta-analysis.
Academic Press, New York
Hegg BA, Rakness KL, Schultz JR (1978) Evaluation of operation
and maintenance factors limiting municipal wastewater treat-
ment plant performance. J Water Pollut Cont Federat
50(3):419–426
Herpin U, Gloaguen TV, Da Fonseca AF, Montes CR, Mendonca FC,
Piveli RP, Breulmann G, Forti MC, Melfi AJ (2007) Chemical
effects on the soil–plant system in a secondary treated waste-
water irrigated coffee plantation: a pilot field study in Brazil.
Agri Water Manag 89(1–2):105–115
Hirsch RL, Bezdek R, Wendling R (2005) Peaking of world oil
production. Impacts, Mitigation and Risk Management. NY,
USA
Hussain IR, Hanjra L, Marikar M, van der Hoek F (2002) Wastewater
use in agriculture: review of impacts and methodological issues
in valuing impacts. Iwmi
Joseph P, Joseph A (2009) Microbial enhanced separation of oil from
a petroleum refinery sludge. J Hazard Mater 161(1):522–525
Kerr RA (1998) The next oil crisis looms large–and perhaps close.
Science 281(5380):1128
Lee L, Hu J, Ong S, Ng W, Ren J, Wong S (2004) Two-stage SBR for
treatment of oil refinery wastewater. Water Sci Tech J Internat
Assoc Water Pollut Res 50(10):243
Lindsay WL (1978) Development of a DTPA soil test for zinc, iron,
manganese, and copper1. Soil Sci Soc Am J 42(3):421
Magesan G, Williamson J, Yeates G, Lloyd-Jones AR (2000)
Wastewater C:N ratio effects on soil hydraulic conductivity
and potential mechanisms for recovery. Bioresour Tech
71(1):21–27
Nagelkerke NJD (1991) A note on a general definition of the
coefficient of determination. Biometrika 78(3):691
Ne O, Jc I (2005) Risk and health implications of polluted soils for
crop production. Afr J Biotechnol 4(13):1521–1524
NEERI (1991) Manual on water and waste water analysis. National
Environmental Engineering Research Institute, Nagpur, India
O’Connor G, Elliott H, Bastian R (2008) Degraded water reuse: an
overview. J Environ Qual. 37(5)
Obayori OS, Adebusoye SA, Adewale AO, Oyetibo GO, Oluyemi
OO, Amokun RA, Ilori MO (2009) Differential degradation of
crude oil (Bonny Light) by four pseudomonas strains. J Environ
Sci 21(2):243–248
Ojumu T, Bello O, Sonibare J, Solomon B (2005) Evaluation of
microbial systems for bioremediation of petroleum refinery
effluents in Nigeria. Afr J Biotech 4(1)
Parnas H (1975) Model for decomposition of organic material by
microorganisms. Soil Biol Biochem 7(2):161–169
Pessala P, Schultz E, Nakari T, Joutti A, Herve S (2004) Evaluation of
wastewater effluents by small-scale biotests and a fractionation
procedure. Ecotoxic Environ Safe 59(2):263–272
Pound CE, Crites RW (1973) Wastewater treatment and reuse by land
application. For sale by the Supt. of Docs., US Govt. Print. Off
Rajesh D, Sunil C, Lalita R, Sushila S (2009) Impact assessment of
soils treated with refinery effluent. Europ J Soil Bio
45(5–6):459–465
Reddy K, Agami M, Tucker J (1990) Influence of phosphorus on
growth and nutrient storage by water hyacinth (Eichhornia
crassipes (Mart.) Solms) plants. Aqua Botany 37(4):355–365
Refaat AA (2009) Correlation between the chemical structure of
biodiesel and its physical properties. Int J Environ Sci Tech
6(4):677–694
Richards L (1954) USDA Handbook No. 60: diagnosis and improve-
ment of saline and alkali soils
Sastry C, Sundaramoorthy S (1996) Industrial use of fresh water vis-
a-vis reclaimed municipal wastewater in Madras. India Desali-
nation 106(1–3):443–448
Schmidt CJ, Kugelman I, Clements EV (1975) Municipal wastewater
reuse in the US. J Water Pollut Control Feder 47(9):2229–2245
Sharma NK (2010) Studies on morpho-histology and effect of treated
effluent of ONGC on some agricultural plants. PhD Thesis,
Department of Biosciences, Veer Narmad South Gujarat Uni-
versity, Surat, Gujarat, India
Singh R, Agrawal M (2008) Potential benefits and risks of land
application of sewage sludge. Waste Manage 28(2):347–358
Speight JG (2007) The chemistry and technology of petroleum, vol
114. CRC
Speight JG, Knovel (2002) Handbook of petroleum product analysis.
Wiley
Srivastava P, Mukherjee S, Gupta M (2008) Groundwater quality
assessment and its relation to land use/land cover using remote
sensing and GIS. International Conference on Groundwater-08,
organized by Rajasthan University, March 19–22, 2008, Jaipur,
India
Srivastava PK, Mukherjee S, Gupta M, Singh S (2011) Characterizing
monsoonal variation on water quality index of River Mahi in
India using geographical information system. Water Qual Expo
Health 2(3):193–203
Tandi N, Nyamangara J, Bangira C (2005) Environmental and
potential health effects of growing leafy vegetables on soil
irrigated using sewage sludge and effluent: a case of Zn and Cu.
J Environ Sci Health 39(3):461–471 (Part B)
Toze S (2006) Reuse of effluent water-benefits and risks. Agri Water
Manage 80(1–3):147–159
Wong JM, Hung YT (2004) Treatment of oilfield and refinery wastes.
Handbook of industrial and hazardous wastes treatment. p. 131
370 Int. J. Environ. Sci. Technol. (2012) 9:361–370
123
Copyright © 2022 FDOKUMEN