Equity and Trusts 06 – Resulting Trusts PART VI — RESULTING TRUSTS I Introduction A Definition

University of Massachusetts Amherst
Department of Resource Economics Working Paper No. 2003-7
Mechanisms for Addressing Third Party Impacts
Resulting From Voluntary Water Transfers
James J. Murphy1, Ariel Dinar2, Richard E. Howitt3, Erin Mastrangelo4, Stephen J. Rassenti5, and Vernon L. Smith6
Abstract: This paper uses laboratory experiments to test alternative water market institutions designed to protect third party interests. The institutions tested include taxing mechanisms that raise revenue to compensate affected third parties and a market in which third parties actively participate. The results indicate that there are some important trade-offs in selecting a policy option. Active third party participation in the market is likely to result in free riding that may erode some or all of the efficiency gains, and may introduce volatility into the market. Taxing transfers and compensating third parties offers a promising balance of efficiency, equity and market stability. Keywords: arbitration, experiments, third party impacts, environmental impacts, water markets JEL Classification: Q25, C9, H41, Q28 ___________________________________
1James J. Murphy, Department of Resource Economics University of Massachusetts, 219A Stockbridge Hall, 80 Campus Center Way Amherst, MA 01003 E: [email protected] P: 413-545-5716 F: 413-545-5853 2Ariel Dinar, World Bank, Agriculture and Rural Development Department 1818 H Street NW, Washington, DC 20433 3Richard E. Howitt, Department of Agricultural and Resource Economics University of California, Davis, Davis, CA 95616 4Erin Mastrangelo, Department of Resource Economics University of Massachusetts, Stockbridge Hall, 80 Campus Center Way Amherst, MA 01003 5Stephen J. Rassenti, Interdisciplinary Center for Economic Science, George Mason University 4400 University Blvd., MSN 1 B2, Fairfax, VA 22030 6Vernon L. Smith, Interdisciplinary Center for Economic Science, George Mason University
4400 University Blvd., MSN 1 B2, Fairfax, VA 22030
1
Mechanisms for Addressing Third Party Impacts Resulting from Voluntary Water Transfers
Running title: Water markets and third party impacts
James J. Murphy
Dept. of Resource Economics and Center for Public Policy and Administration, Stockbridge Hall, University of Massachusetts, 80 Campus Center Way, Amherst, MA 01003
email: [email protected] phone: (413) 545-5716
fax: (413) 545-5853
Ariel Dinar World Bank, Agriculture and Rural Development Dept.,
1818 H Street NW, Washington, DC 20433
Richard E. Howitt Dept. of Agricultural and Resource Economics, University of California, Davis,
Davis, CA 95616
Erin Mastrangelo Dept. of Resource Economics, Stockbridge Hall, University of Massachusetts,
80 Campus Center Way, Amherst, MA 01003
Stephen J. Rassenti Interdisciplinary Center for Economic Science, George Mason University,
4400 University Blvd., MSN 1B2, Fairfax, VA 22030
Vernon L. Smith Interdisciplinary Center for Economic Science, George Mason University,
4400 University Blvd., MSN 1B2, Fairfax, VA 22030
July 2003
Acknowledgements Funding for this research was provided by the University of California Water Resources Center, the joint NSF, EPA grant # SBR-9513406 as part of the Human Dimensions of Global Climate Change Initiative, the Center for Public Policy and Administration at the University of Massachusetts-Amherst, and the Cooperative State Research Extension, Education Service, U. S. Department of Agriculture, Massachusetts Agricultural Experiment Station, under Project No. 871. Anil Roopnarine programmed the software. We take full responsibility for any errors or omissions.
2
Mechanisms for Addressing Third Party Impacts Resulting from Voluntary Water Transfers
Abstract
This paper uses laboratory experiments to test alternative water market institutions designed to
protect third party interests. The institutions tested include taxing mechanisms that raise revenue
to compensate affected third parties and a market in which third parties actively participate. The
results indicate that there are some important trade-offs in selecting a policy option. Active third
party participation in the market is likely to result in free riding that may erode some or all of the
efficiency gains, and may introduce volatility into the market. Taxing transfers and
compensating third parties offers a promising balance of efficiency, equity and market stability.
Keywords: arbitration, experiments, third party impacts, environmental impacts, water markets,
water transfers
3
1. Introduction
Despite the comparatively short experience of the western US states with water markets,
voluntary transfers are now regarded as a central instrument in balancing and reallocating the
changing demand and supply for water in the state [3]. However, until it can be demonstrated
that a water market institution is capable of protecting environmental and third party values,
voluntary water transfers will not realize their full potential as an integral part of a water
management strategy in the 21st century. Hanak [7] examines the rise of local governmental
resistance to water markets in California. Currently, 22 of the state’s 58 counties have passed
local county ordinances preventing or restricting the export of water. Seventy three percent of
these ordinances were passed since 1996. Water markets in the western US are now at a stage
where third party compensation rules that are perceived to be equitable and efficient are required
to move the adoption of water markets beyond the current level.
This paper uses laboratory experiments to test alternative water market institutions
designed to incorporate the value of non-consumptive water into the allocation process.1 We
focus on third parties, specifically rural communities that depend upon irrigated agriculture but
are not party to the market transaction, however the results apply to most non-consumptive uses
including environmental impacts and instream flow values. Water is frequently made available
for transfer by fallowing land. The effects of reduced crop production can be widespread in the
local economy due to changes in the sales of farm inputs. For example, McClurg [16] reports
that the water transfers out of Yolo County, California after the 1991 Drought Water Bank
resulted in 450 lost jobs. More recently, an agreement between the Metropolitan Water District
of Southern California and the Palo Verde Irrigation District includes a $6 million payment to
the community to offset economic harm from land fallowing [19]. Although these third party
4
impacts may be pecuniary externalities and the result of a well-functioning market, for a
proposed new exchange mechanism to be viable it cannot ignore these effects.
Successful implementation of an institution that can facilitate long-distance water
transfers requires a substantial amount of coordination to achieve an efficient water allocation,
especially in the presence of interdependent uses, such as third party impacts or instream flows
[1, 6, 8, 10]. Most water rights are defined in terms of consumptive use, and non-consumptive
rights are often protected by constraints on water transfers such as minimum instream flow
requirements, taxes on transfers, restrictions on the quantity of water that may be exported from
a region, or “no injury” rules. When these constraints on transfers are binding, the resulting
allocation will be inefficient [20]. Both Huffman [8] and Griffin and Hsu [6] suggest that the
creation of property rights for non-consumptive use may lead to more efficient allocations. Since
the externalities associated with water transfers vary by location, efficiency will usually require
location-specific pricing [6, 20]. However, a water market with spatially discriminative prices is
likely to be complex and face high transaction costs associated with finding trading partners.
Thus, institutional design plays an important role in the transmission of information and the
evolution of prices such that the water market yields efficient allocations [20].
With the advent of high-speed communication networks and low-cost computing
resources, the landscape of exchange system architectures has changed dramatically over the past
decade. The recent development of ‘smart,’ computer-coordinated markets provides the promise
of developing decentralized solutions to such complex resource allocation problems. McCabe et
al. [11, 12, 13, 14, 15], have demonstrated the ability of these ‘smart’ markets to achieve
efficient allocations in the natural gas and electricity industries. Dinar et al. [4] and Murphy et
al. [18], subsequently apply the ‘smart’ market concept to spot water markets with similar

5
success. These markets allow decentralized agents, who best know their own circumstances, to
submit virtually unlimited messages (bids to buy, offers to sell, logical and budgetary
constraints) to a computer dispatch center. The center can then compute prices and allocations
by applying a set of rules, often a sophisticated optimization algorithm that maximizes the
possible gains from exchange, while observing constraints. By doing so, these markets can
lower transaction costs, facilitate trades that may not have otherwise been effected, and increase
overall market efficiency. The ability of these electronic markets to address complex allocation
problems is a particularly attractive feature for water markets, especially in the presence of
environmental and third party impacts.
It is critical that any water market mechanism not only be efficient and stable, but also
acceptable to all parties involved. This means a viable water market institution must incorporate
the third party impacts into the allocation mechanism. Hence, this paper uses laboratory
experiments to test three different ‘smart,’ computer-assisted water market institutions that are
designed to account for third party impacts in the allocation process. The institutions tested are
primarily based on policy options that have been proposed by government agencies and
academics.
One of the options provides no regulatory protection of third parties but allows these
individuals to actively participate in the water allocation process by bidding for water to
supplement existing flows to the region. The remaining two options, based on the California
Model Water Transfer Act [5], explore different tax schemes which decouple the water
allocation process from victim compensation. The basic process is simple: A regulator sets the
tax rate at the beginning of the water year and trading occurs with participants paying the tax on
all water transfers. Tax revenue goes directly into a fund which is managed by a neutral
6
arbitrator. At the end of the water year, victims of a water transfer may file a claim requesting
compensation from the fund and the arbitrator renders a binding final decision to each claimant.
Any surplus or deficit in the fund after compensation is carried over to the next water year.
This paper describes a series of laboratory experiments designed to test these alternative
institutions. The key results are: (1) although third party participation in the market has the
advantage of allowing those affected by the transfers to express their willingness-to-trade, it is
prone to strategic behavior and free riding that may erode the efficiency gains; and (2) taxing
transfers to compensate victims as described above may not be able to maximize total social
welfare, but the market still yields highly efficient and stable outcomes, and is more flexible than
fixed limits on water transfers. Although further research is necessary, a tax on water transfers is
a promising means of promoting highly efficient allocations while ensuring that third parties are
fully compensated.
2. Experimental Design
In this paper, we use a controlled, laboratory setting to test three different water market
institutions designed to account for third party impacts. The first institution facilitates direct
third party participation in the allocation process, the last two institutions tested in this paper
incorporate taxes on water transfers to compensate victims. In all three institutions, we assume
that third parties derive a benefit from water consumed in their region. Higher levels of water
consumption imply increased economic activity and higher levels of employment. Similarly,
exporting water out of a region generates third party damages. During droughts, rapid approval
of short-term transfers is critical and there may not be adequate time for a lengthy transfer review
process to quantify third party damages. Thus, we assume that although third parties know the
7
expected level of damages with certainty, government regulators do not have this information
until after the transfers have been completed and the damages have been realized.
2.1. Alternative 1: Third parties participate in the water market (3PBuyer)
The first alternative, denoted 3PBuyer, tests a market structure that allows third parties to
actively participate in the water allocation process. This mechanism is similar to the design by
Murphy [17], in which an Instream Flow District was created to represent instream flow values
in the market. In this institution, the third parties do not have property rights to the water, but
can participate in the market by subsidizing consumptive demands in their region. By
contributing to the provision of the water, they have the ability to increase the flow into their
region thereby lowering third party impacts. Since third parties best know their own
circumstances and willingness to trade, the perfectly competitive equilibrium would yield
efficient outcomes, assuming clearly defined property rights and no strategic behavior.2
However, it is important to note that because of the public good nature of non-
consumptive water uses, the third parties receive a benefit for any water in their region or district
regardless of whether they contribute to its provision. The theory of public goods predicts that
when multiple parties independently derive benefits from a good and they cannot be excluded
from doing so, there is little economic incentive for these agents to voluntarily contribute to the
provision of the good. As with any public good, this may cause third parties to under-contribute
or free ride. The results of Murphy [17] suggest that free riding in this type of market structure
does exist, and tends to reduce market efficiency and introduce volatility into the market.
8
2.2. Alternatives 2 and 3: Water transfer taxes and third party compensation
The California Model Water Transfer Act [5] provides the basis for the two taxing mechanisms.
Under the proposed Act, all short-term water transfers are allowed to occur, but water transfers
are taxed and the revenue goes into a fund from which affected third parties can be compensated.
At the end of the water year, anyone damaged by a water transfer may file a claim for
compensation. An impartial arbitrator evaluates any claims and uses the tax revenue to
compensate victims. Because the water transfer is decoupled from third party compensation, this
type of institution requires two components: (1) a taxing mechanism to generate revenue to
compensate third parties, and (2) an arbitration mechanism through which victims can file claims
for damages.
Taxing mechanism. In the two tax treatments examined, either a per-unit or a revenue
tax is imposed on all transfers, and the revenue placed in third party compensation fund. At the
end of the water year, an arbitrator evaluates any third party claims and fully compensates them
for any damages. For such a compensation mechanism to be viable, it needs to guarantee that (a)
third parties are fully compensated, (b) water traders are not paying taxes in excess of damages,
and (c) the fund will remain solvent over time. This is equivalent to ensuring that each year total
tax revenue equals total damages. The tax rate is set at the beginning of the water year by a
regulator who has perfect information on all market participants. With this information, the
regulator can estimate the damages that would occur in a competitive equilibrium. What he
cannot predict, however, is how participants will actually trade. With perfect foresight, the
regulator would set the tax rate such that revenues collected from water transfers would exactly
equal the level of third party damages. The fund balance at the end of each year would then be
zero.3 In reality, because estimated third party damages and tax revenues may not exactly match
9
actual damages and revenues, it is possible that at the end of the water year the compensation
fund may run a surplus or a deficit, depending upon whether revenues or damages were greater.
If there is any revenue remaining in the fund after all third parties are compensated, the residual
funds are carried over to the next water year, resulting in a lower tax rate in the next year.
Similarly, if there is insufficient tax revenue to fully compensate all third parties, the fund goes
into a deficit and will make up for the shortfall by raising the tax rate in the subsequent year.
We consider two types of taxes: a per-unit tax (UnitTax) and a revenue or ad valorem tax
(RevTax). Tax revenue from a per-unit tax is based on the total volume of water traded, whereas
tax revenue from a revenue tax is based on the total value of the water traded. In our
experiments, the water seller is responsible for collecting the tax.4 Because the tax rate is
imperfect (due to the difference between the actual and competitive equilibrium outcomes), there
may be a fund balance from the previous year. This balance may be positive or negative and will
affect the tax rate in the next period. The per-unit tax rate for a given water year is determined as:
Predicted Damages Fund BalancePer Unit Tax RatePredicted Quantity of Water
−= (1)
where Predicted Damages are the level of third party damages that would occur in the coming
water year in the perfectly competitive equilibrium, Predicted Quantity is the total quantity of
water that would be traded in the competitive equilibrium, and Fund Balance is the amount of
money left over in the third party compensation fund from the previous year. The revenue tax is
calculated similar to the per-unit tax except that the denominator in equation (1) is replaced with
Predicted Revenue, which is the total revenue collected by all sellers in the perfectly competitive
equilibrium.
10
Arbitration mechanism. The second element necessary for the California Model Water
Transfer Act is an arbitration scheme to render judgments on how the money collected from the
tax is to be distributed. Arbitration has become one of the more popular methods of dispute
resolution outside the public court system. In typical arbitration systems, the negotiators on both
sides are given an opportunity to settle on their own. If unable to do this, a neutral third party
arbitrator decides on a binding final award.
In a “smart market,” such as the one used in this research, traditional two-sided
arbitration schemes are meaningless. These arbitration schemes require that one can identify
both the party that caused the damage and the victim of these damages. In the case of a single
bilateral trade, we could say that the water buyer and seller of this particular transfer jointly
caused the damages to the third party. In the case of “smart markets,” however, because all
water allocations are determined simultaneously, the buyer and seller are decoupled and the
“system” generates the externality. Therefore, we cannot utilize traditional arbitration schemes
and have assumed a one-sided mechanism in which third parties can file claims to a neutral
arbitrator who is responsible for managing the third party compensation fund.
Clearly, in such an arbitration mechanism there are strong incentives for third parties to
over-estimate damages and file frivolous claims. It is incumbent upon the arbitrator to determine
the true damages. In this research, we avoid this incentive problem by assuming a perfectly
informed neutral arbitrator. This computerized robot arbitrator has perfect information on the
value of water for all market participants, including third parties. Using this information, we
assume the arbitrator knows the exact level of third party damages and fully compensates
victims. Although, in reality, this is obviously not the case, this assumption allows us to take out
the role of the arbitrator and award exact compensation to third parties. By taking out the
11
vagaries of the arbitration process, we can focus solely on the ability of the tax scheme to
account for actual damages.
2.3. A comment on the efficiency of the tax mechanisms
We should note that such a tax-and-compensation mechanism will not generally produce
efficient allocations, essentially because those trades that generate the third party impacts may
not be facing the full marginal damages. Instead, these costs are shared by all water users, not
only in the current water year, but possibly by those in past or future years. Even in a world with
perfect information the tax rate would not be efficient because: (1) there is an additional revenue-
neutrality constraint which requires the tax rate to be set such that total (not marginal) damages
and total revenues are equal to ensure victims are fully compensated, and (2) allocations are
determined simultaneously in a computer-assisted market and it is impossible to identify which
trade “caused” the damages. Rather, the damages are caused by the system as a whole.
Efficiency would require location-specific tax rates (and subsidies) based on marginal benefits
and costs. Although the mechanism is not designed to yield the maximum possible total surplus,
it is a practical and viable means of balancing the need to rapidly facilitate water transfers while
protecting third parties, particularly when the external effects are unknown at the time of
transfer. Lastly, Baumol and Oates [2] point out that there could be additional incentive
problems with compensating victims.
2.4. Experimental procedures
This research focuses on three different market institutions described in the previous
section. These are: (1) third parties as Buyers in the water market (3PBuyer); (2) a per-unit tax
imposed on all water trades (UnitTax); (3) a revenue tax imposed on all water trades (RevTax).
We present the results collected from eighteen computer-based experiments. Participants for the
12
experiments were recruited from the university’s student population. The experiments utilized
web-based water market software designed specifically for this research. Participants were
required to commit to two days for two hours each day. The first day was used as a training day
in which all participants read through online instructions and took part in several rounds of
practice trading. None of the data collected on the training days was used for analysis. The
second day was reserved for the experiments in which usable data were collected. Participants
were paid at the end of the second day and averaged $50 for the two days. This includes a $20
payment for showing up on time both days plus earnings during the experiments.
The software used for the experiments displayed the entire water network to each
participant on his or her computer screen and showed information about the network. The
network consisted of various buy nodes at which there is a demand for water, reservoir nodes
from which water is sold, and canals that connect the nodes. Each participant was assigned
specific locations at which he or she was active, and was given an induced demand or supply
schedule at each of these nodes. These schedules consisted of five price and quantity steps and
only the experimenter, the participant, and the computerized arbitrator and regulator knew these
values for water.5
All sellers received an inflow of water each period which represents water from rain or
melting snow. The supply schedule they saw represented their costs for selling water. The costs
were the lowest price for which the sellers could profitably sell their water. Sellers earned
money by selling their water at a price above the costs. Profit was calculated by the price they
receive in the market multiplied by the quantity sold less any costs.
Buyers submitted bids in each round based on an induced demand schedule. The values
they saw were also price and quantity steps which represented the benefit they received from
13
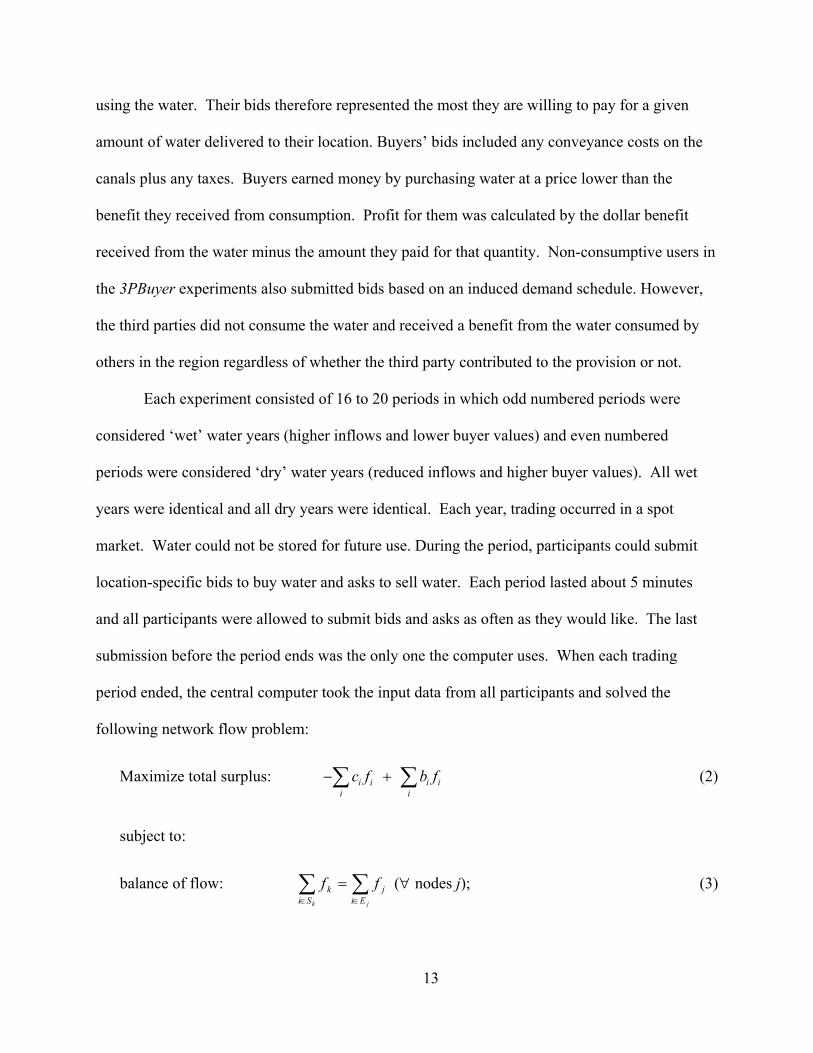
using the water. Their bids therefore represented the most they are willing to pay for a given
amount of water delivered to their location. Buyers’ bids included any conveyance costs on the
canals plus any taxes. Buyers earned money by purchasing water at a price lower than the
benefit they received from consumption. Profit for them was calculated by the dollar benefit
received from the water minus the amount they paid for that quantity. Non-consumptive users in
the 3PBuyer experiments also submitted bids based on an induced demand schedule. However,
the third parties did not consume the water and received a benefit from the water consumed by
others in the region regardless of whether the third party contributed to the provision or not.
Each experiment consisted of 16 to 20 periods in which odd numbered periods were
considered ‘wet’ water years (higher inflows and lower buyer values) and even numbered
periods were considered ‘dry’ water years (reduced inflows and higher buyer values). All wet
years were identical and all dry years were identical. Each year, trading occurred in a spot
market. Water could not be stored for future use. During the period, participants could submit
location-specific bids to buy water and asks to sell water. Each period lasted about 5 minutes
and all participants were allowed to submit bids and asks as often as they would like. The last
submission before the period ends was the only one the computer uses. When each trading
period ended, the central computer took the input data from all participants and solved the
following network flow problem:
Maximize total surplus: i i i ii i
c f b f− +∑ ∑ (2)
subject to:
balance of flow: ∑∑∈∈
=jk Ei
jSi
k ff (∀ nodes j); (3)
14
conveyance capacity: iii ufd ≤≤ (∀ arcs i) (4)
Each arc (i) in this formulation represents one bid or offer. If a buyer makes a multi-part bid,
then each part is represented by separate, parallel arcs. Multi-part offers by sellers are
represented similarly. Thus, each bid or offer is represented by the vector (si, ei, di, ui, ci) with si
being its starting node, ei its end node, di the least permissible flow on that arc, ui the greatest
permissible flow on that arc (determined by the bid or offer quantity entered), and ci the bid
value or offer price per-unit of flow on that arc (bid values are treated as negative costs) and bi is
the third party bid for flow along that arc. The flow on arc i is fi, Sj is the set of arcs which begin
at node j, and Ej is the set of arcs which end at node j. Note that constraint set (3) maintains the
balance of flow at each node j. Intuitively, equation (3) describes the network and defines the set
of feasible trades. Constraint set (4) ensures that the flow on each conveyance arc does not
exceed the stated lower or upper bounds. In the tax treatments, third parties are not active, so
0ib = , and the seller’s bid includes both the seller’s asking price and the tax.
Solving the linear programming problem above yields not only the optimal flows (and
production and consumption patterns), but also the set of location-specific shadow prices, jλ , for
all nodes in the network. Since the shadow prices are marginal nodal values at which water is
bought and sold, the difference in shadow prices at the start and end nodes of an arc gives us the
value of the marginal unit of flow on that arc, i.e., the price associated with water conveyance.
The software displays the results immediately following each period including profits and which
bids or asks were accepted.
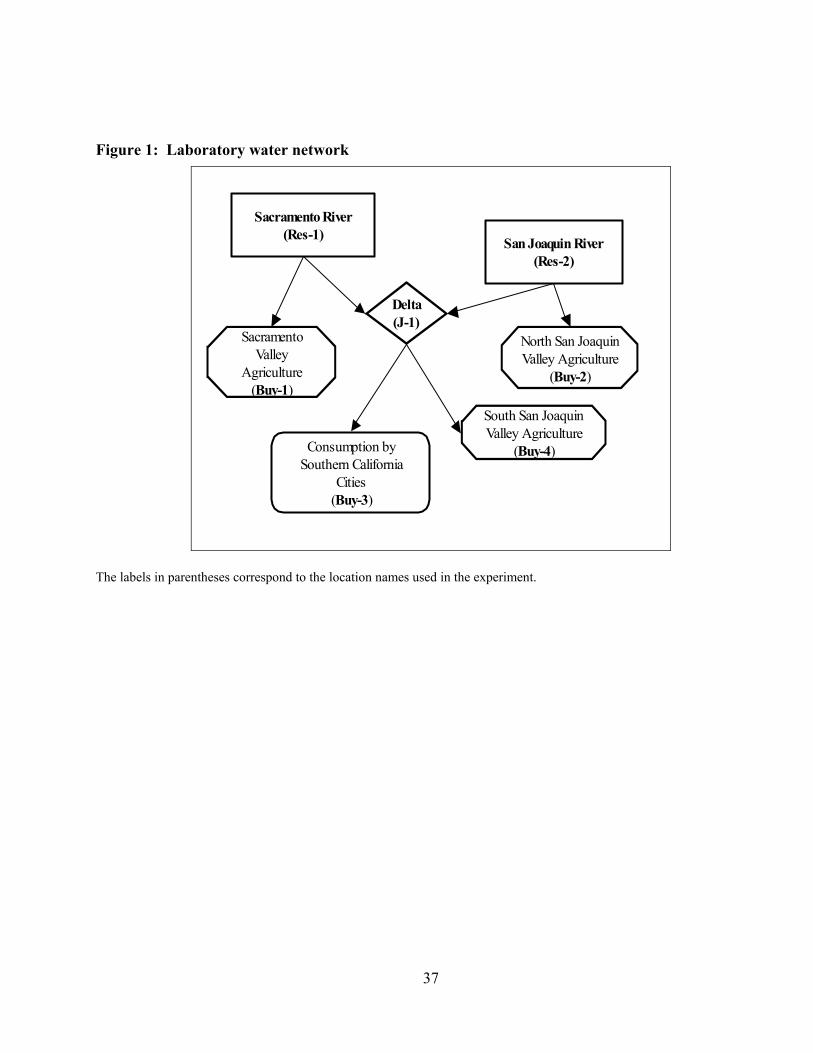
The laboratory water market was a simplified version of the California water network.
Figure 1 contains an illustration of the laboratory water market. There were two main surface
water sources: the Sacramento and San Joaquin Rivers. These flow into the Delta from which
15
water flows to Southern California cities through the Central Valley Project and the State Water
Project. In addition to consumption by Southern California cities, there were three agricultural
centers that use the water: Sacramento Valley Agriculture, North San Joaquin Valley
Agriculture, and South San Joaquin Valley Agriculture.
<<INSERT FIGURE 1>>
The market was a sealed-bid uniform-price double-auction and consists of 16 roles. Each
subject in the experiment may have played more than one role. The two upper consumption
nodes, Buy-1 and Buy-2, each had three buyers active. Consumption nodes Buy-3 and Buy-4
each had a single buyer. There were three water sellers located at each of the two reservoirs. In
addition to the water being traded between the buyers and sellers, third party impacts occurred at
the two regions represented by nodes Buy-1 and Buy-2. There was one participant at each of
these nodes who had non-consumptive demand for water in that region. Third party damages
were dependent on the amount of water consumed in the region (damages increase as
consumption decreases).
3. Results
There are three measures of market performance that we discuss in this section: efficiency, price
stability, and distribution of surplus. After defining the terms, we use these criteria to evaluate
the performance of the water market. Each buyer of water, b, located at node j has a resale
value, or benefit, schedule )( bjbj QB . In equilibrium, all buyers b at node j pay the same market
price for delivered water, *jP , and each buyer b earns a profit of:
**** )( bjjbjbjbj QPQB −=Π , (5)
16
where *bjQ is the equilibrium quantity of water delivered to buyer b at node j. Each seller of
water, s, located at node j, has a cost schedule )( sjsj QC , and in equilibrium all sellers s at node j
receive the same market price, *jP , and each seller s earns a profit of:
)( ****sjsjsjjsj QCQP −=Π . (6)
Similarly, each third party, p, located at node j, has a benefit schedule that is a function of
the aggregate consumption in the region pj bjb
B Q ∑ . In the 3PBuyer sessions, the third party
may contribute to the provision of water at his location (but will receive benefits from aggregate
consumption at his node regardless of third party contributions). In equilibrium, each third
party’s contribution, or subsidy, to the provision of water at his location is *jS , and each third
party p at node j earns a profit of:
* * * *pj bj bj j bj
j jB Q S Q
Π = −
∑ ∑ . (7)
Conveyance along each arc was provided at a constant marginal cost. The price for the
water itself is uniform throughout the network, and any location-specific differences in the price
for delivered water reflect conveyance costs and third party contributions. Aggregate earnings
for all buyers, *BuyΠ , are the sum of the individual buyers’ earnings:
∑∑Π=Πb j
bjBuy** . (8)
Aggregate seller earnings, *SellΠ , and aggregate third party earnings, *
3PΠ , are defined similarly.
17
Note that the computer calculates the realized equilibrium values, denoted by the asterisk
superscript, based on the submitted bids and asks of each agent. Using the true supply and
demand schedules, we can also calculate the competitive equilibrium prices, allocations, and
earnings for each subject. The competitive equilibrium values will be denoted by replacing the
asterisk superscript * with the superscript ce. Because the competitive equilibrium maximizes
the possible gains from trade, we use this as a baseline against which the realized market
outcomes can be compared.
Efficiency measures the ability of the market to extract all of the potential gains from
trade. It is the share of potential surplus realized by the market:
* * *
3
3
100 [0,100%]Buy Sell Pce ce ceBuy Sell P
EfficiencyΠ + Π + Π
= ⋅ ∈Π + Π + Π
. (9)
The competitive equilibrium results in an allocation that maximizes the total possible surplus for
a given institution and environment, thus, a perfectly competitive market will be 100 percent
efficient.
Result 1. The revenue tax treatment clearly produced the most efficient outcomes. The
evidence is mixed about whether active third party participation and a unit tax yield comparable
levels of efficiency.
The tax rate in each period of an experiment is likely to vary to account for any non-zero
balances in the compensation fund (equation 1). Therefore, we adjust the definition of
competitive equilibrium surplus to reflect the total surplus that would occur in a competitive
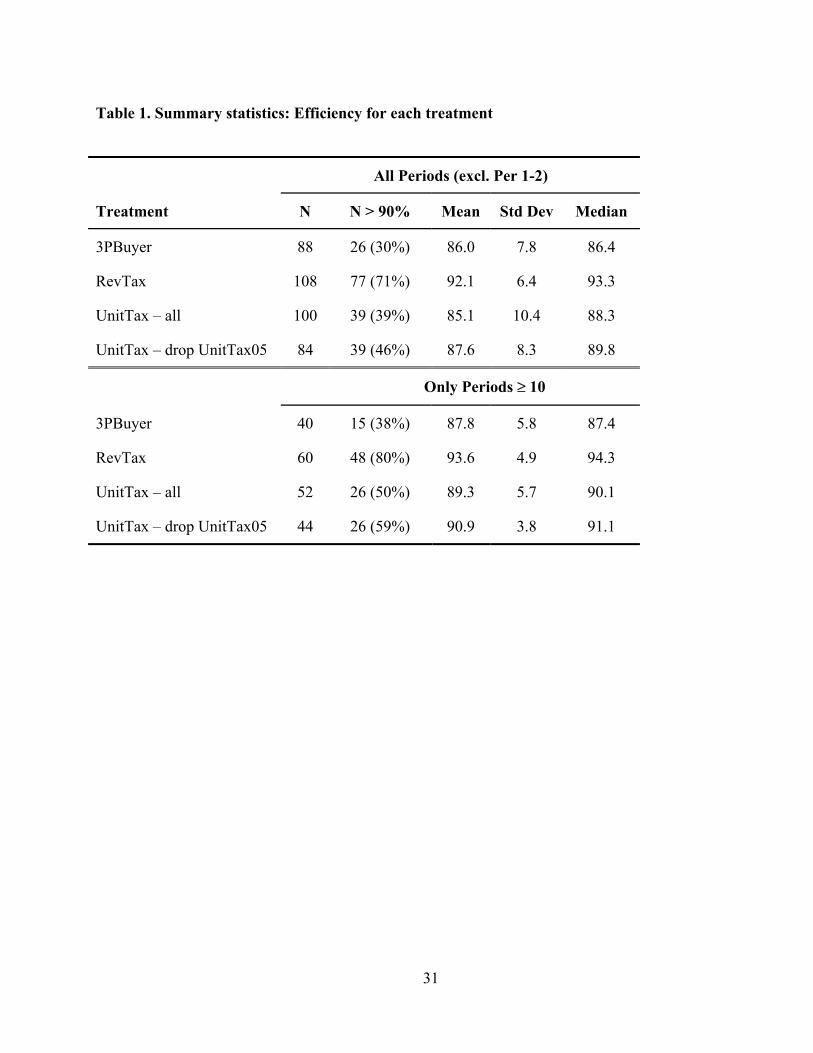
market given the actual tax rate for that period. Table 1 presents the mean and median efficiency
for each of the three treatments. We present the summary statistics for all periods (excluding
18
periods 1 and 2),6 and again after dropping periods 1 through 10 to get a sense for how these
markets converge in the later rounds as participants gain experience. By all measures, the
RevTax treatment consistently yielded the highest efficiency. Mean and median efficiency in all
periods (92% and 93%, respectively) was greater than either of the other two treatments.
Moreover, the efficiency in 71% of the RevTax periods exceeded 90%, whereas less than one-
third of the periods in 3Buyer and about 40% of the periods in UnitTax exceeded this benchmark.
For all three treatments, performance increased in the later rounds.
<<INSERT TABLE 1>>
One of the UnitTax experiments, UnitTax05, appears to be an aberration, with mean
efficiency only 72%, compared to 88% for the other five UnitTax experiments. This group
started slow: the average efficiency in the first five periods (not including periods 1-2) was 61%,
but in the last five periods efficiency increased substantially to 83%. In Table 1, we present
descriptive statistics with and without this experiment.
The 3PBuyer treatment has the lowest median efficiency in all periods, as well as just the
later rounds. 3PBuyer also has the lowest mean efficiency in the later rounds and the lowest
share of periods with efficiency above 90%. We used both Wilcoxon rank sum and median two-
sample tests to determine whether these differences in efficiency across treatments were
statistically significant. The results of these pairwise comparisons strongly reject (p-value
<.0001) the null hypothesis that the efficiency in the RevTax equals that of either UnitTax or
3PBuyer. However, the comparison of efficiency for UnitTax vs. 3PBuyer are mixed. When
UnitTax05 is included, there is no statistically significant difference (at 5% level) in efficiency
using all periods, however in the later rounds this difference does become significant. If
UnitTax05 is excluded, the null hypothesis of equal efficiency is strongly rejected.
19
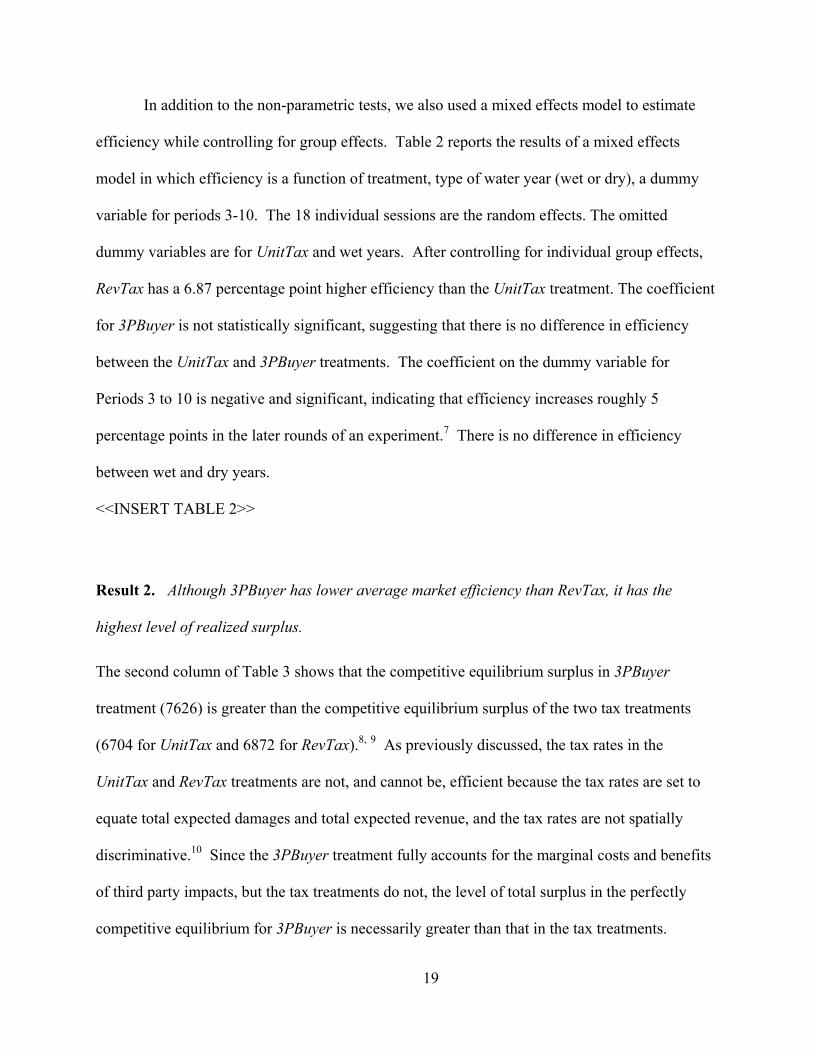
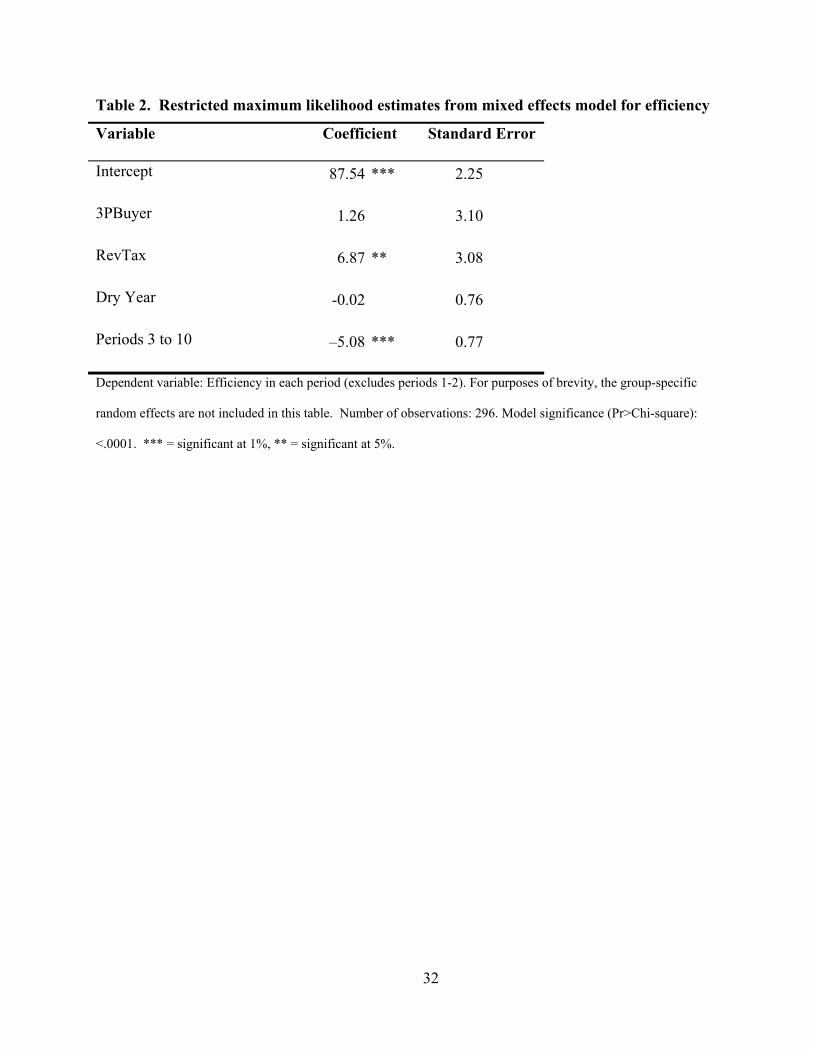
In addition to the non-parametric tests, we also used a mixed effects model to estimate
efficiency while controlling for group effects. Table 2 reports the results of a mixed effects
model in which efficiency is a function of treatment, type of water year (wet or dry), a dummy
variable for periods 3-10. The 18 individual sessions are the random effects. The omitted
dummy variables are for UnitTax and wet years. After controlling for individual group effects,
RevTax has a 6.87 percentage point higher efficiency than the UnitTax treatment. The coefficient
for 3PBuyer is not statistically significant, suggesting that there is no difference in efficiency
between the UnitTax and 3PBuyer treatments. The coefficient on the dummy variable for
Periods 3 to 10 is negative and significant, indicating that efficiency increases roughly 5
percentage points in the later rounds of an experiment.7 There is no difference in efficiency
between wet and dry years.
<<INSERT TABLE 2>>
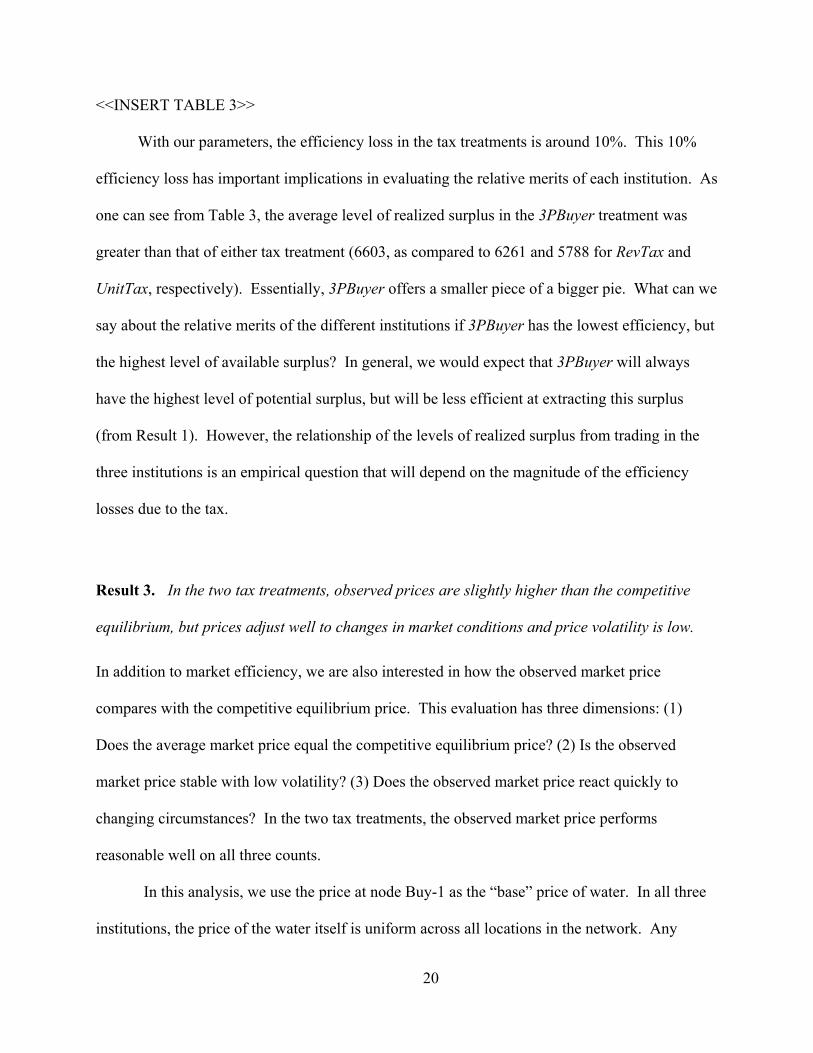
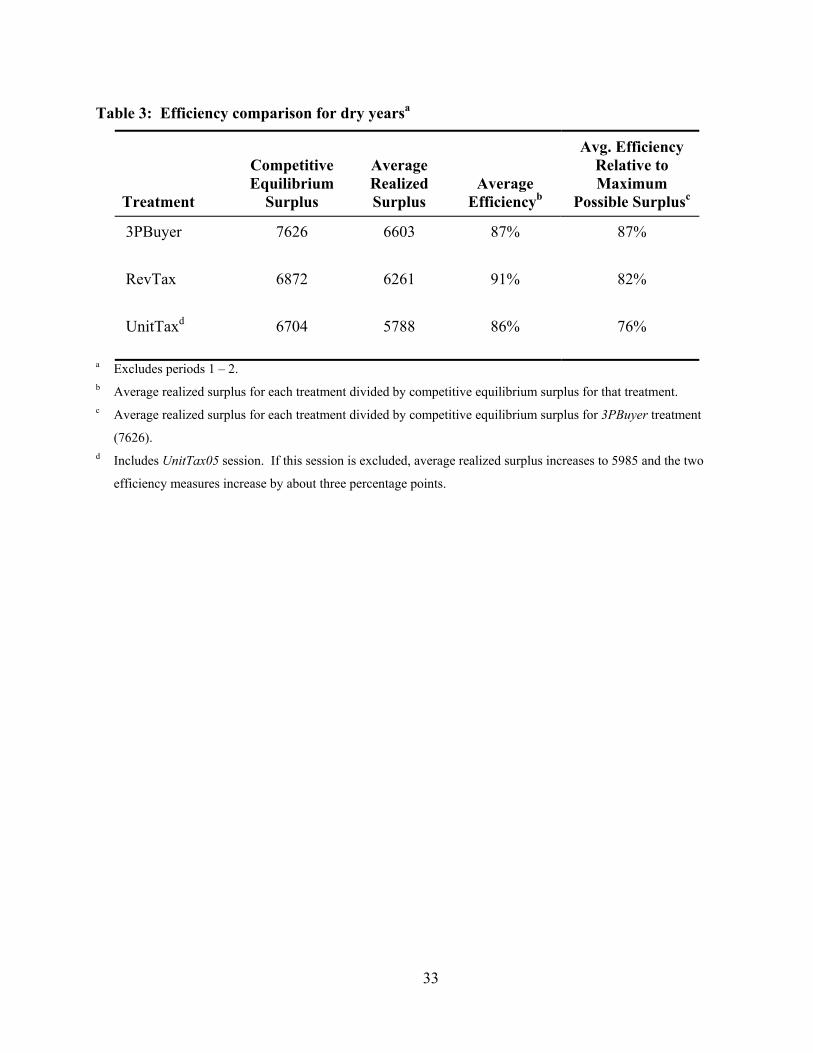
Result 2. Although 3PBuyer has lower average market efficiency than RevTax, it has the
highest level of realized surplus.
The second column of Table 3 shows that the competitive equilibrium surplus in 3PBuyer
treatment (7626) is greater than the competitive equilibrium surplus of the two tax treatments
(6704 for UnitTax and 6872 for RevTax).8, 9 As previously discussed, the tax rates in the
UnitTax and RevTax treatments are not, and cannot be, efficient because the tax rates are set to
equate total expected damages and total expected revenue, and the tax rates are not spatially
discriminative.10 Since the 3PBuyer treatment fully accounts for the marginal costs and benefits
of third party impacts, but the tax treatments do not, the level of total surplus in the perfectly
competitive equilibrium for 3PBuyer is necessarily greater than that in the tax treatments.
20
<<INSERT TABLE 3>>
With our parameters, the efficiency loss in the tax treatments is around 10%. This 10%
efficiency loss has important implications in evaluating the relative merits of each institution. As
one can see from Table 3, the average level of realized surplus in the 3PBuyer treatment was
greater than that of either tax treatment (6603, as compared to 6261 and 5788 for RevTax and
UnitTax, respectively). Essentially, 3PBuyer offers a smaller piece of a bigger pie. What can we
say about the relative merits of the different institutions if 3PBuyer has the lowest efficiency, but
the highest level of available surplus? In general, we would expect that 3PBuyer will always
have the highest level of potential surplus, but will be less efficient at extracting this surplus
(from Result 1). However, the relationship of the levels of realized surplus from trading in the
three institutions is an empirical question that will depend on the magnitude of the efficiency
losses due to the tax.
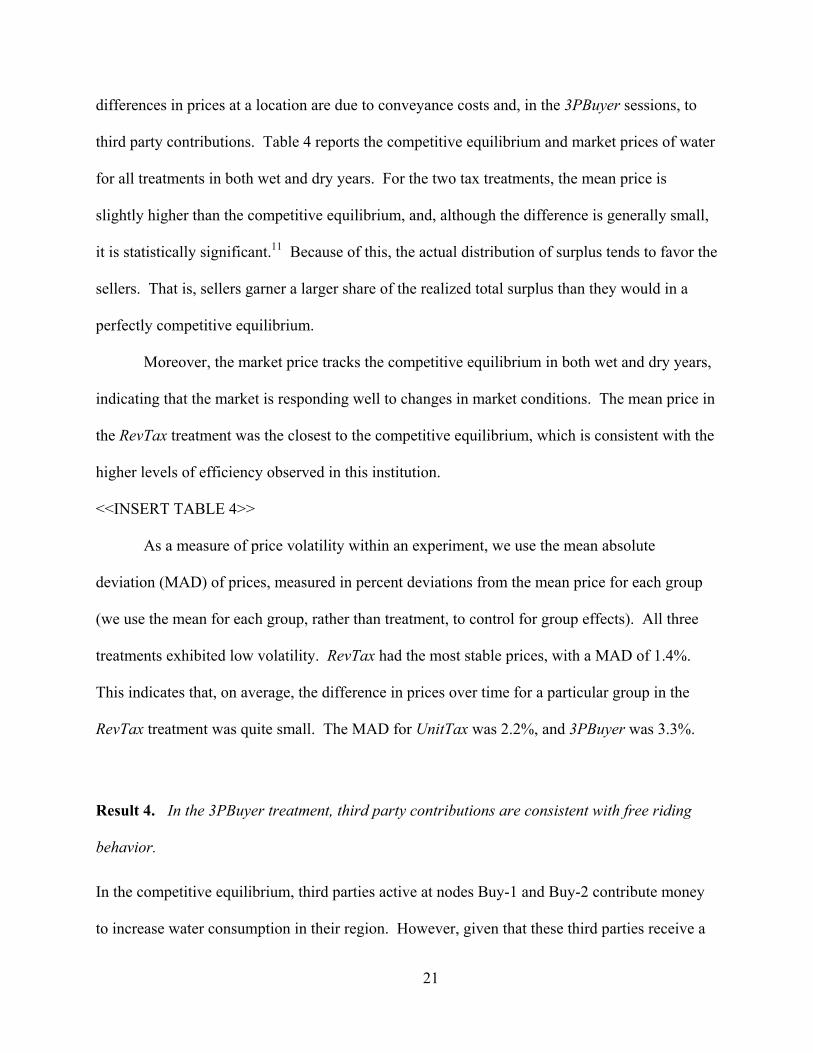
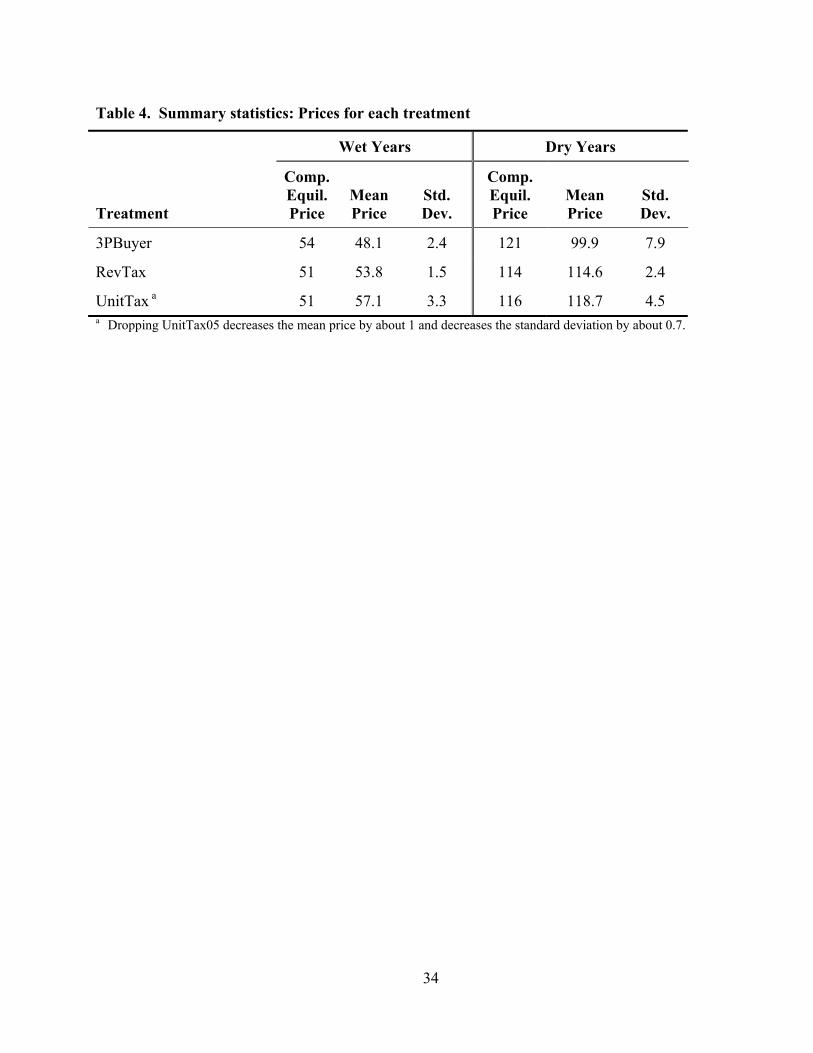
Result 3. In the two tax treatments, observed prices are slightly higher than the competitive
equilibrium, but prices adjust well to changes in market conditions and price volatility is low.
In addition to market efficiency, we are also interested in how the observed market price
compares with the competitive equilibrium price. This evaluation has three dimensions: (1)
Does the average market price equal the competitive equilibrium price? (2) Is the observed
market price stable with low volatility? (3) Does the observed market price react quickly to
changing circumstances? In the two tax treatments, the observed market price performs
reasonable well on all three counts.
In this analysis, we use the price at node Buy-1 as the “base” price of water. In all three
institutions, the price of the water itself is uniform across all locations in the network. Any
21
differences in prices at a location are due to conveyance costs and, in the 3PBuyer sessions, to
third party contributions. Table 4 reports the competitive equilibrium and market prices of water
for all treatments in both wet and dry years. For the two tax treatments, the mean price is
slightly higher than the competitive equilibrium, and, although the difference is generally small,
it is statistically significant.11 Because of this, the actual distribution of surplus tends to favor the
sellers. That is, sellers garner a larger share of the realized total surplus than they would in a
perfectly competitive equilibrium.
Moreover, the market price tracks the competitive equilibrium in both wet and dry years,
indicating that the market is responding well to changes in market conditions. The mean price in
the RevTax treatment was the closest to the competitive equilibrium, which is consistent with the
higher levels of efficiency observed in this institution.
<<INSERT TABLE 4>>
As a measure of price volatility within an experiment, we use the mean absolute
deviation (MAD) of prices, measured in percent deviations from the mean price for each group
(we use the mean for each group, rather than treatment, to control for group effects). All three
treatments exhibited low volatility. RevTax had the most stable prices, with a MAD of 1.4%.
This indicates that, on average, the difference in prices over time for a particular group in the
RevTax treatment was quite small. The MAD for UnitTax was 2.2%, and 3PBuyer was 3.3%.
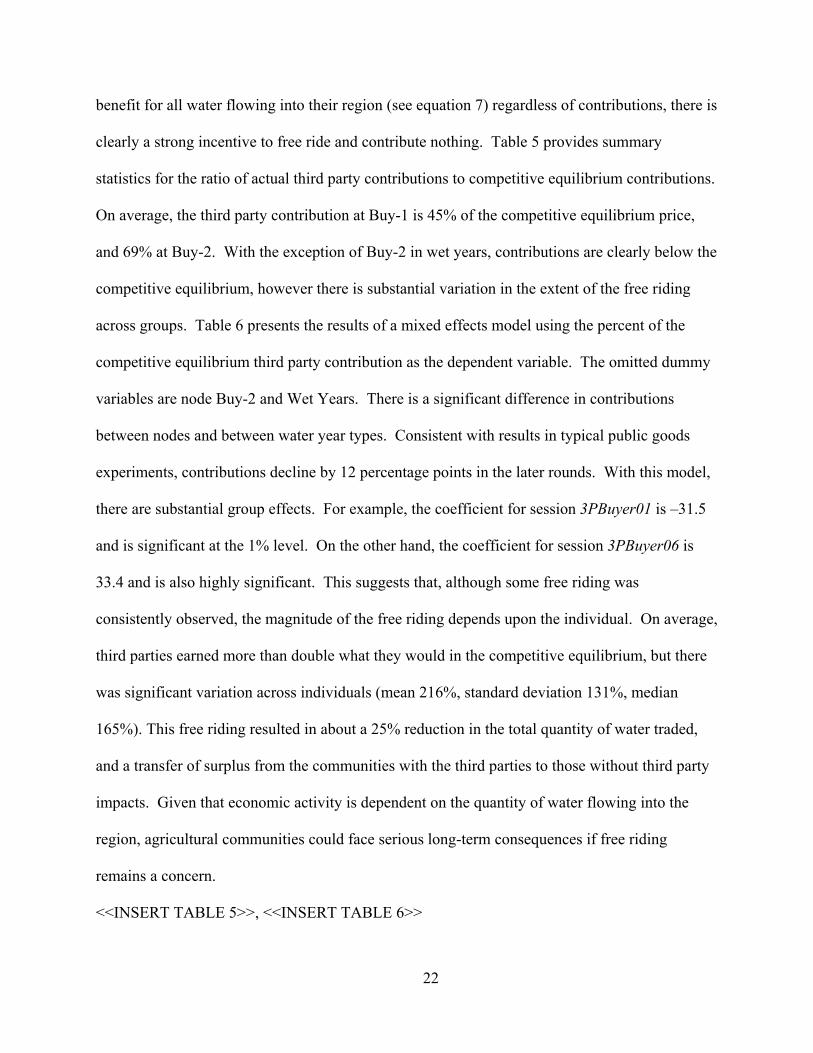
Result 4. In the 3PBuyer treatment, third party contributions are consistent with free riding
behavior.
In the competitive equilibrium, third parties active at nodes Buy-1 and Buy-2 contribute money
to increase water consumption in their region. However, given that these third parties receive a
22
benefit for all water flowing into their region (see equation 7) regardless of contributions, there is
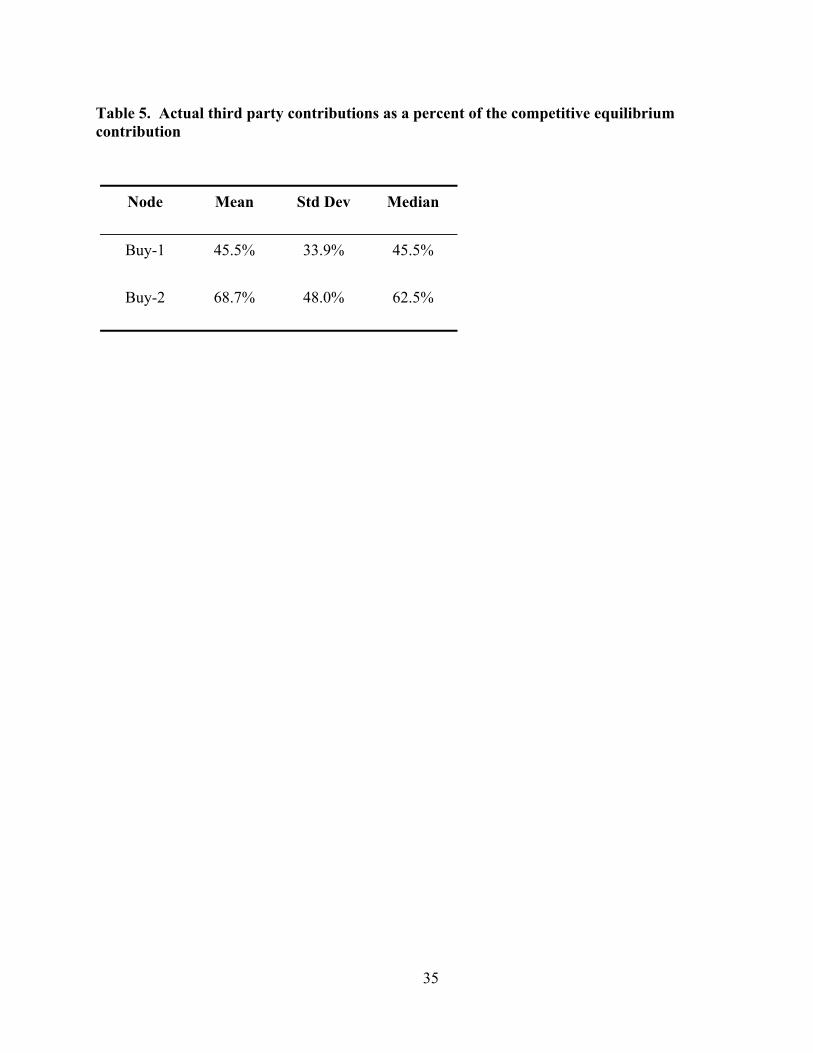
clearly a strong incentive to free ride and contribute nothing. Table 5 provides summary
statistics for the ratio of actual third party contributions to competitive equilibrium contributions.
On average, the third party contribution at Buy-1 is 45% of the competitive equilibrium price,
and 69% at Buy-2. With the exception of Buy-2 in wet years, contributions are clearly below the
competitive equilibrium, however there is substantial variation in the extent of the free riding
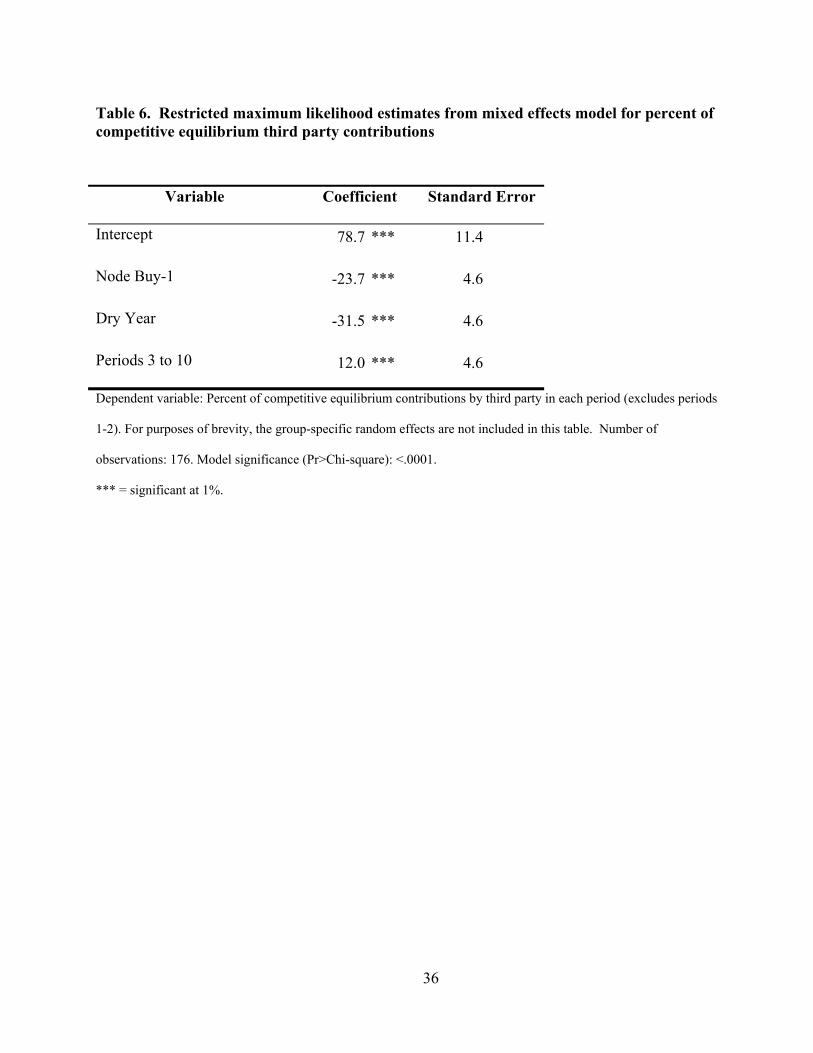
across groups. Table 6 presents the results of a mixed effects model using the percent of the
competitive equilibrium third party contribution as the dependent variable. The omitted dummy
variables are node Buy-2 and Wet Years. There is a significant difference in contributions
between nodes and between water year types. Consistent with results in typical public goods
experiments, contributions decline by 12 percentage points in the later rounds. With this model,
there are substantial group effects. For example, the coefficient for session 3PBuyer01 is –31.5
and is significant at the 1% level. On the other hand, the coefficient for session 3PBuyer06 is
33.4 and is also highly significant. This suggests that, although some free riding was
consistently observed, the magnitude of the free riding depends upon the individual. On average,
third parties earned more than double what they would in the competitive equilibrium, but there
was significant variation across individuals (mean 216%, standard deviation 131%, median
165%). This free riding resulted in about a 25% reduction in the total quantity of water traded,
and a transfer of surplus from the communities with the third parties to those without third party
impacts. Given that economic activity is dependent on the quantity of water flowing into the
region, agricultural communities could face serious long-term consequences if free riding
remains a concern.
<<INSERT TABLE 5>>, <<INSERT TABLE 6>>
23
Result 5. The tax schemes could have equity implications if traders are not the same from year
to year.
As stated earlier, because the tax rate is calculated a priori and the actual outcomes do not equal
the competitive equilibrium, the tax rate is imperfect. If the tax were perfect, we would see a tax
rate of zero in all wet years, but in the laboratory we consistently witnessed tax rates of up to $10
per-unit or 14% revenue. The dry year tax rates exhibit less volatility than the wet years due to
the fact that most of the negative fund balance is recovered in the wet years when no damages
occur. The dry year tax rates tended to converge at or near the perfectly competitive tax rate.
Any deficits were generally made up for in the wet years.
Although these results suggest that the mechanism is successful in its intent to
compensate third parties, the results also point to important equity implications. Because no
damages occur in the wet years, a non-zero tax rate in these years means that traders who
participate are paying for damages that occurred in previous years. Essentially, part of the
burden of the tax is passed on from dry years to wet years.
An additional point on equity takes into consideration the dry year tax rate as compared
to the competitive equilibrium. As mentioned earlier, in the RevTax experiments in the dry
years, often there was a positive fund balance after compensation. In this case, traders are again
paying more than the damages that actually occurred in that period.
One last comment on the tax rates regards the threat of bankruptcy. This market
environment was designed so that dry years (when damages are high) alternate with wet years.
We found that increasing the tax in the wet years was often sufficient to make up for any
shortcomings in the dry years. In the real world, however, a prolonged drought could keep the
fund balance in a deficit for a number of consecutive years. Because a deficit causes the tax rate
24
to increase in the following year, the tax rate could potentially rise to a point where it makes the
water transfers prohibitively expensive. One possible means of reducing the likelihood of this
occurring is to spread the surplus deficit across multiple years. We recommend this as a
possibility for more research before any tax system is implemented.
4. Conclusion
In the early 1990’s, the drought water banks clearly demonstrated the economic benefits that
voluntary short-term water transfers can provide to California. However, the water banks relied
upon predetermined “prices” set by the California Department of Water Resources, and these
fixed “prices” did not adjust with changes in supply or demand. The use of computer-
coordinated “smart” markets for water offer California the potential to increase the efficiency of
short-term water transfers while protecting environmental, social and economic interests. This
paper extends that research by testing whether and how these computer-coordinated water
markets can incorporate third party values into the water allocation mechanism.
This research used laboratory experiments and a computer-coordinated market to analyze
three alternatives designed to protect third parties. These are all based on policy options
proposed by government agencies and academics to address this issue. The options tested range
from (1) a free-market environment in which third parties are allowed to directly participate in
the market and bid for water; (2) a combination regulation and market mechanism which allows
all transfers to occur but places a per unit tax on the system in order to create a fund from which
third parties are compensated post-market; and (3) a similar mechanism to the previous one, but
a revenue tax is used to collect funds.
25
The RevTax experiments produced the most efficient results using this definition with an
average efficiency in each period (excluding periods one through four) of 92 percent. The
UnitTax experiments exhibited some volatility in early periods but by later periods reached
average efficiencies of over 90 percent. The 3PBuyer experiments, on the other hand, rarely
reached average efficiencies of 90 percent in any given period. Further analysis showed that the
losses in the 3PBuyer treatment can partly be attributed to free riding by the third parties.
An important aspect to realize is that the lower efficiencies described here do not alone
imply that any market mechanism is more or less preferred than another. As pointed out in
Result 2, this is because the level of potential surplus varies across institutions. Taking this
difference of available surplus into consideration, efficiency can be thought of in a second way:
compare average realized surplus with competitive equilibrium surplus for the institution that
yields the highest possible level of total surplus. If an institution reaches 100% efficiency by this
definition, then it has realized the maximum amount of total surplus for any institution. This
distinction is particularly important when considering a command and control type mechanism to
regulate water transfers. These markets typically reach average efficiencies of almost 100%
quickly by the first definition and show little variation. However, because of the fixed
constraints, the amount of available surplus is drastically lower so although they perform well
given the constraints, there may be other more flexible institutions that can increase overall
welfare.
Our results showed that although the 3PBuyer institution had the potential for high
efficiencies by both definitions, free riding and strategic behavior eroded most of the potential
gains. The RevTax experiments were able to realize high levels of efficiency by the first
definition and still realize levels of surplus comparable to the 3PBuyer market. Although we
26
have pointed out issues such as the distribution of surplus and equity that need further attention,
a tax on water transfers as proposed by the California Model Water Transfer Act [5] offers a
promising alternative as it offers high levels of efficiency and market stability but is still more
flexible than fixed limits on water transfers.
One unmentioned aspect of the tax option, however, that needs further research is the
arbitration mechanism. In this research, we assumed a perfectly informed neutral arbitrator to
distribute monetary compensation to injured parties. Of course, in the real world, this is not the
case. Third parties damaged by a water transfer have an incentive to misrepresent damages in
order to receive higher amounts of compensation. Finally, this paper evaluates third party
compensation in a market for short-term water leases. In the long-run, continued third party
compensation minimizes any incentives to engage in some other, more productive economic
behavior. A policy that includes third party compensation for long-term transfers might benefit
from a sunset provision that phases this compensation out over time.
27
5. References
1. T.L. Anderson and R.N. Johnson, The problem of instream flows, Econom. Inquiry 24, 535-
554 (1986).
2. W.J. Baumol and W.E. Oates, The Theory of Environmental Policy, Second Edition,
Cambridge University Press, New York, NY (1993).
3. California Department of Water Resources, California Water Plan Update, Bulletin 160-98,
volume 1, California Department of Water Resources, Sacramento, CA (1998).
4. A. Dinar, R.E., Howitt, S.J., Rassenti, and V.L. Smith, Development of Water Markets Using
Experimental Economics, in “Markets for Water Potential and Performance” (K.W.
Easter, M. Rosegrant, and A. Dinar, Eds.), Kluwer Academic Publishers, Boston, MA
(1998).
5. B.E. Gray, Maintaining Momentum on California Water Issues: Business Leaders’ Findings.
A Model Water Transfer Act for California, Sacramento, CA (1996).
6. R.C. Griffin and S.H. Hsu, The potential for water market efficiency when instream flows
have value, Amer. J. Agri. Econom. 75, 292-303 (1993).
7. E. Hanak, Who Should Be Allowed to Sell Water in California? Third Party Issues and the
Water Market. Public Policy Institute of California, San Francisco, California, 2003
8. J. Huffman, Instream water use, public and private alternatives, in “Water Rights: Scarce
Resource Allocation, Bureaucracy, and the Environment” (T.L. Anderson, Ed.), Pacific
Institute for Public Policy Research, San Francisco, CA (1983).
28
9. J.O. Ledyard, “Public Goods: A Survey of Experimental Research.” In Handbook of
Experimental Economics. J.H. Kagel and A.E. Roth, eds. Princeton, NJ: Princeton
University Press. (1995).
10. M.L. Livingston and T.A. Miller, A framework for analyzing the impact of western instream
water rights on choice domains: transferability, externalities, and consumptive use,
Land Econom. 62, 269-277 (1986).
11. K.A. McCabe, S.J. Rassenti and V.L. Smith, Designing ‘smart’ computer-assisted markets:
an experimental auction for gas networks, European J. Polit. Econom. 5, 259-283
(1989).
12. K.A. McCabe, S.J. Rassenti and V.L. Smith, Auction design for composite goods: the natural
gas industry, J. Econom. Behav. Organ. 14, 127-149 (1990).
13. K.A. McCabe, S.J. Rassenti and V.L. Smith, Auction institutional design: theory and
behavior of simultaneous multiple-unit generalizations of the Dutch and English
auctions, Amer. Econom. Rev. 80, 1276-1283 (1990).
14. K.A. McCabe, S.J. Rassenti and V.L. Smith, Smart computer assisted markets, Science 254,
534-538 (1991).
15. K.A. McCabe, S.J. Rassenti and V.L. Smith, Designing a uniform-price double auction, in
“The Double Auction Market: Institutions, Theories, and Evidence. Proceedings
Volume XIV, Santa Fe Institute” (D. Friedman and J. Rust, Eds.), Addison-Wesley,
Reading, MA (1993).
16. S. McClurg, Unresolved issues in water marketing, Western Water, May/June, (1992).
29
17. J.J. Murphy, Incorporating Instream Flow Values into a Water Market, Doctoral Thesis,
Office of Graduate Studies, University of California at Davis, CA (1999).
18. J.J. Muphy, A. Dinar, R.E. Howitt, S.J. Rassenti and V.L. Smith, The design of ‘smart’ water
market institutions using laboratory experiments, Environ. Resource Econom. 17, 375-
394 (2000).
19. N. Vogel, Water exchanges help state through dry years, Los Angeles Times, California
Metro, part 2, page 1 (April 4, 2002).
20. M.L. Weber, Markets for water rights under environmental constraints, J. Environ. Econom.
Management 42, 53-64 (2001).
30
ENDNOTES
1 A non-consumptive or non-rival water use includes any activity that derives a benefit (pecuniary or non-
pecuniary) from the water without actually consuming it. For example, water consumed in an agricultural
region may stimulate local economic growth and water flowing instream may provide water quality and
environmental benefits.
2 The payment to the Palo Verde community (Vogel, 2002) could be loosely interpreted as an example of such a
transaction. In that case, the community received $6 million as compensation for local economic damages. The
efficiency and equity implications of this particular payment are an empirical question beyond the scope of this
paper.
3 We assume that the tax rate is set at the start of the water year and remains fixed until the following year.
4 Although the statutory incidence of the tax falls on sellers, the economic incidence will be shared by both
buyers and sellers.
5 The induced values for all agents are available from the authors upon request.
6 Throughout the analysis in this paper, we drop the results from periods 1 and 2 to minimize learning effects
unless otherwise noted.
7 We also modeled learning using Period and Period2; this yields the same conclusions.
8 The competitive equilibrium surplus of the UnitTax and RevTax treatments differs slightly due to the discrete
nature of the supply and demand step functions.
9 Table 3 reports the efficiency comparison only for dry years. A comparison for wet years yields similar results.
10 Efficiency would require that consumption be subsidized at locations with third party impacts. The subsidy rate
would differ by location based on marginal third party impacts. The subsidy would be identical to the
competitive equilibrium prices in the 3PBuyer treatment.
11 It is possible that these small deviations are at least partially to the discrete, step-wise nature of the supply and
demand functions.
31
Table 1. Summary statistics: Efficiency for each treatment
All Periods (excl. Per 1-2)
Treatment N N > 90% Mean Std Dev Median
3PBuyer 88 26 (30%) 86.0 7.8 86.4
RevTax 108 77 (71%) 92.1 6.4 93.3
UnitTax – all 100 39 (39%) 85.1 10.4 88.3
UnitTax – drop UnitTax05 84 39 (46%) 87.6 8.3 89.8
Only Periods ≥ 10
3PBuyer 40 15 (38%) 87.8 5.8 87.4
RevTax 60 48 (80%) 93.6 4.9 94.3
UnitTax – all 52 26 (50%) 89.3 5.7 90.1
UnitTax – drop UnitTax05 44 26 (59%) 90.9 3.8 91.1
32
Table 2. Restricted maximum likelihood estimates from mixed effects model for efficiency
Variable Coefficient Standard Error
Intercept 87.54 *** 2.25
3PBuyer 1.26 3.10
RevTax 6.87 ** 3.08
Dry Year -0.02 0.76
Periods 3 to 10 –5.08 *** 0.77
Dependent variable: Efficiency in each period (excludes periods 1-2). For purposes of brevity, the group-specific
random effects are not included in this table. Number of observations: 296. Model significance (Pr>Chi-square):
<.0001. *** = significant at 1%, ** = significant at 5%.
33
Table 3: Efficiency comparison for dry yearsa
Treatment
Competitive Equilibrium
Surplus
Average Realized Surplus
Average Efficiencyb
Avg. Efficiency Relative to Maximum
Possible Surplusc
3PBuyer 7626 6603 87% 87%
RevTax 6872 6261 91% 82%
UnitTaxd 6704 5788 86% 76%
a Excludes periods 1 – 2. b Average realized surplus for each treatment divided by competitive equilibrium surplus for that treatment. c Average realized surplus for each treatment divided by competitive equilibrium surplus for 3PBuyer treatment
(7626). d Includes UnitTax05 session. If this session is excluded, average realized surplus increases to 5985 and the two
efficiency measures increase by about three percentage points.
34
Table 4. Summary statistics: Prices for each treatment
Wet Years Dry Years
Treatment
Comp. Equil. Price
Mean Price
Std. Dev.
Comp. Equil. Price
Mean Price
Std. Dev.
3PBuyer 54 48.1 2.4 121 99.9 7.9
RevTax 51 53.8 1.5 114 114.6 2.4
UnitTax a 51 57.1 3.3 116 118.7 4.5 a Dropping UnitTax05 decreases the mean price by about 1 and decreases the standard deviation by about 0.7.
35
Table 5. Actual third party contributions as a percent of the competitive equilibrium contribution
Node Mean Std Dev Median
Buy-1 45.5% 33.9% 45.5%
Buy-2 68.7% 48.0% 62.5%
36
Table 6. Restricted maximum likelihood estimates from mixed effects model for percent of competitive equilibrium third party contributions
Variable Coefficient Standard Error
Intercept 78.7 *** 11.4
Node Buy-1 -23.7 *** 4.6
Dry Year -31.5 *** 4.6
Periods 3 to 10 12.0 *** 4.6
Dependent variable: Percent of competitive equilibrium contributions by third party in each period (excludes periods
1-2). For purposes of brevity, the group-specific random effects are not included in this table. Number of
observations: 176. Model significance (Pr>Chi-square): <.0001.
*** = significant at 1%.
37
Figure 1: Laboratory water network
Sacramento River (Res-1) San Joaquin River
(Res-2)
Delta (J-1)
Consumption by Southern California
Cities (Buy-3)
North San Joaquin Valley Agriculture
(Buy-2)
South San Joaquin Valley Agriculture
(Buy-4)
Sacramento Valley
Agriculture (Buy-1)
The labels in parentheses correspond to the location names used in the experiment.
Copyright © 2022 FDOKUMEN