Stochastic distribution of small soil eukaryotes resulting from ...
12
ORIGINAL ARTICLE Stochastic distribution of small soil eukaryotes resulting from high dispersal and drift in a local environment Mohammad Bahram 1,2 , Petr Kohout 1,3,4 , Sten Anslan 1 , Helery Harend 1 , Kessy Abarenkov 5 and Leho Tedersoo 5 1 Institute of Ecology and Earth Sciences, University of Tartu, Tartu, Estonia; 2 Department of Organismal Biology, Evolutionary Biology Centre, Uppsala University, Uppsala, Sweden; 3 Institute of Botany, Academy of Sciences of the Czech Republic, Průhonice, Czech Republic; 4 Department of Experimental Plant Biology, Charles University in Prague, Prague, Czech Republic and 5 Natural History Museum, University of Tartu, Tartu, Estonia A central challenge in ecology is to understand the relative importance of processes that shape diversity patterns. Compared with aboveground biota, little is known about spatial patterns and processes in soil organisms. Here we examine the spatial structure of communities of small soil eukaryotes to elucidate the underlying stochastic and deterministic processes in the absence of environmental gradients at a local scale. Specifically, we focus on the fine-scale spatial autocorrelation of prominent taxonomic and functional groups of eukaryotic microbes. We collected 123 soil samples in a nested design at distances ranging from 0.01 to 64 m from three boreal forest sites and used 454 pyrosequencing analysis of Internal Transcribed Spacer for detecting Operational Taxonomic Units of major eukaryotic groups simultaneously. Among the main taxonomic groups, we found significant but weak spatial variability only in the communities of Fungi and Rhizaria. Within Fungi, ectomycorrhizas and pathogens exhibited stronger spatial structure compared with saprotrophs and corresponded to vegetation. For the groups with significant spatial structure, autocorrelation occurred at a very fine scale (o2 m). Both dispersal limitation and environmental selection had a weak effect on communities as reflected in negative or null deviation of communities, which was also supported by multivariate analysis, that is, environment, spatial processes and their shared effects explained on average o10% of variance. Taken together, these results indicate a random distribution of soil eukaryotes with respect to space and environment in the absence of environmental gradients at the local scale, reflecting the dominant role of drift and homogenizing dispersal. The ISME Journal (2016) 10, 885–896; doi:10.1038/ismej.2015.164; published online 22 September 2015 Introduction Niche-based and niche-neutral models constitute two alternative but complementary paradigms for understanding diversity patterns (Hubbel, 2001; Chase and Leibold, 2003). Niche theory posits that communities are shaped by deterministic processes (that is, environmental selection and niche partitioning) owing to different habitat prefer- ences and fitness of species. According to neutral theory, random fluctuations in species abundance (ecological drift) and limited dispersal shape the communities. Emerging evidence suggests that both groups of processes jointly regulate ecological communities (Chave, 2004) with varying relative effects depending on geographic scales and strength of environmental gradients (see Hanson et al., 2012) and type of organism (body size, dispersal mode, see Soininen et al., 2007). At smaller scales, habitat heterogeneity declines, which generally results in lower habitat preference and therefore greater importance of stochastic processes over deterministic factors (Legendre et al., 2009; Chase, 2014). However, the evolutionary and ecological factors that influence dispersal of organisms may also diminish with decreasing geographic scale (Warren et al., 2014). Thus reducing the study scale enables to control for both environmental filtering and dispersal limitation as a result of recruitment failure (Wang et al., 2013; Lowe and McPeek), which minimizes the confounding effects of unmeasured variables. Diversity patterns provide evidence for the processes underlying community assembly (Vellend, 2010). Correspondence: M Bahram, Institute of Ecology and Earth Sciences, University of Tartu, 40 Lai Street, Tartu 50411, Estonia. E-mail: [email protected] Received 27 May 2015; revised 27 July 2015; accepted 30 July 2015; published online 22 September 2015 The ISME Journal (2016) 10, 885– 896 © 2016 International Society for Microbial Ecology All rights reserved 1751-7362/16 www.nature.com/ismej
-
Upload
khangminh22 -
Category
Documents
-
view
0 -
download
0
Transcript of Stochastic distribution of small soil eukaryotes resulting from ...

ORIGINAL ARTICLE
Stochastic distribution of small soil eukaryotesresulting from high dispersal and drift in a localenvironment
Mohammad Bahram1,2, Petr Kohout1,3,4, Sten Anslan1, Helery Harend1, Kessy Abarenkov5
and Leho Tedersoo5
1Institute of Ecology and Earth Sciences, University of Tartu, Tartu, Estonia; 2Department of OrganismalBiology, Evolutionary Biology Centre, Uppsala University, Uppsala, Sweden; 3Institute of Botany, Academy ofSciences of the Czech Republic, Průhonice, Czech Republic; 4Department of Experimental Plant Biology,Charles University in Prague, Prague, Czech Republic and 5Natural History Museum, University of Tartu,Tartu, Estonia
A central challenge in ecology is to understand the relative importance of processes that shape diversitypatterns. Compared with aboveground biota, little is known about spatial patterns and processes in soilorganisms. Here we examine the spatial structure of communities of small soil eukaryotes to elucidatethe underlying stochastic and deterministic processes in the absence of environmental gradients at alocal scale. Specifically, we focus on the fine-scale spatial autocorrelation of prominent taxonomic andfunctional groups of eukaryotic microbes. We collected 123 soil samples in a nested design at distancesranging from 0.01 to 64m from three boreal forest sites and used 454 pyrosequencing analysis ofInternal Transcribed Spacer for detecting Operational Taxonomic Units of major eukaryotic groupssimultaneously. Among the main taxonomic groups, we found significant but weak spatial variabilityonly in the communities of Fungi and Rhizaria. Within Fungi, ectomycorrhizas and pathogens exhibitedstronger spatial structure compared with saprotrophs and corresponded to vegetation. For the groupswith significant spatial structure, autocorrelation occurred at a very fine scale (o2m). Both dispersallimitation and environmental selection had a weak effect on communities as reflected in negative or nulldeviation of communities, which was also supported by multivariate analysis, that is, environment,spatial processes and their shared effects explained on average o10% of variance. Taken together,these results indicate a random distribution of soil eukaryotes with respect to space and environment inthe absence of environmental gradients at the local scale, reflecting the dominant role of drift andhomogenizing dispersal.The ISME Journal (2016) 10, 885–896; doi:10.1038/ismej.2015.164; published online 22 September 2015
Introduction
Niche-based and niche-neutral models constitutetwo alternative but complementary paradigms forunderstanding diversity patterns (Hubbel, 2001;Chase and Leibold, 2003). Niche theory positsthat communities are shaped by deterministicprocesses (that is, environmental selection andniche partitioning) owing to different habitat prefer-ences and fitness of species. According to neutraltheory, random fluctuations in species abundance(ecological drift) and limited dispersal shape thecommunities. Emerging evidence suggests thatboth groups of processes jointly regulate ecological
communities (Chave, 2004) with varying relativeeffects depending on geographic scales and strengthof environmental gradients (see Hanson et al., 2012)and type of organism (body size, dispersal mode,see Soininen et al., 2007). At smaller scales,habitat heterogeneity declines, which generallyresults in lower habitat preference and thereforegreater importance of stochastic processes overdeterministic factors (Legendre et al., 2009; Chase,2014). However, the evolutionary and ecologicalfactors that influence dispersal of organisms mayalso diminish with decreasing geographic scale(Warren et al., 2014). Thus reducing the studyscale enables to control for both environmentalfiltering and dispersal limitation as a result ofrecruitment failure (Wang et al., 2013; Lowe andMcPeek), which minimizes the confounding effectsof unmeasured variables.
Diversity patterns provide evidence for the processesunderlying community assembly (Vellend, 2010).
Correspondence: M Bahram, Institute of Ecology and EarthSciences, University of Tartu, 40 Lai Street, Tartu 50411, Estonia.E-mail: [email protected] 27 May 2015; revised 27 July 2015; accepted 30 July2015; published online 22 September 2015
The ISME Journal (2016) 10, 885–896© 2016 International Society for Microbial Ecology All rights reserved 1751-7362/16www.nature.com/ismej

One of the most common patterns in ecologicalcommunities is the negative relationship betweencommunity similarity and spatial distance, known asdistance–decay of similarity (DDS; Nekola andWhite, 1999; Poulin, 2003). DDS constitutes ageneral pattern across different groups of organisms,and it is widely employed to disentangle the relativeimportance of neutral and niche processes in main-taining biodiversity (Condit et al., 2002; Cottenie,2005; Hanson et al., 2012; Stegen et al., 2013). DDSresults from the joint effects of environmentalselection and dispersal limitation coupled withecological (or evolutionary) drift. Drift acting aloneand high dispersal rates homogenize the communityand thus lead to weaker DDS patterns (Vellend,2010). As a result, the rate and extent of DDS variesacross different organism groups with differenthabitat preference and also organism type, that is,body size and dispersal mode (Soininen et al., 2007).
In contrast to macro-organisms, microbes aredispersed more easily owing to their smaller size,which allows them to inhabit temporarily unsuitablehabitats. There is an old assumption that free-livingsoil microbial eukaryotes do not face dispersallimitation (Finlay, 2002), but several molecularstudies provide evidence for their biogeographicpatterns (for example, Green et al., 2004; Bahramet al., 2013; Bates et al., 2013; but see Queloz et al.,2011). Recent findings also suggest that similarly tomacro-organisms, microbes are influenced by neu-tral processes (for example, Cottenie 2005; Hájeket al., 2011; Astorga et al., 2012). Furthermore, somestudies provide evidence for limited dispersal andbiogeographic patterns in soil mesofauna (Wu et al.,2011; Porco et al., 2012). Greater dispersal limitationin soil matrix, compared with air, may lead to astronger spatial structure in soil biota compared withaboveground organisms (Ettema and Wardle, 2002).Although dispersal limitation is commonly consid-ered a neutral process, the overlap between dispersaland establishment success, which can result fromenvironmental filtering, complicates accurate esti-mates of dispersal limitation per se (Lowe andMcPeek, 2014). Besides, dispersal may not be neutralif species differ in traits related to dispersal abilitiesor when dispersal is density dependent.
Differential dispersal abilities may lead to con-trasting DDS patterns in macro-organisms andmicroorganisms (Nekola and White, 1999; Soininenet al., 2007; Hájek et al., 2011; Farjalla et al., 2012).These studies provide evidence that the effect ofdeterministic processes in community assemblyincreases with increasing body size, while stochasticprocesses are dominant in small organisms withpassive dispersal. Most of our knowledge about DDSof various organisms is derived from meta-analyses(Nekola and White, 1999; Soininen et al., 2007;Hanson et al., 2012) that comprise studies withdifferent sampling grain and geographic scale, whichmay strongly bias the understanding of DDS relation-ships (Steinbauer et al., 2012). Thus simultaneous
analyses of DDS in organisms with different dis-persal traits (owing to their varying size and active vspassive motility) are needed for better understandingthe relative contribution of deterministic and neutralprocesses (Soininen et al., 2007; Hájek et al., 2011;Bie et al., 2012). Small-scale studies are subject tofewer confounding factors such as climate, soil type,random environmental fluctuations and history andthus provide a good basis to determine neutralstochasticity (drift and dispersal limitation per se;Vellend et al., 2014).
Our knowledge about the spatial structure ofeukaryotic microbes is very limited. Only a fewstudies have studied the DDS relationship at the finescale (Lekberg et al., 2007; Dumbrell et al., 2010).These studies were performed along an environ-mental gradient, which prevents assessing the effectsof neutral processes in shaping communities. Byusing a spatially explicit experimental design, weexamined DDS patterns in the communities of soileukaryotic microbes and mesofauna that provide thekey ecosystem services, such as plant nutrition,herbivory, decomposition and propagule dispersal(Wardle, 2002). Our main goal was to examine thestochastic component and thus to elucidate therelative importance of stochastic (dispersal andecological drift) and deterministic factors (soil,vegetation parameters) in structuring communitiesof soil biota in the absence of environmentalgradients. Our hypothesis was that microbial com-munities exhibit significant DDS due to their morepronounced intrinsic spatially aggregated distribu-tion (Morlon et al., 2008) as a result of the weakenvironmental variation and thus its weak confound-ing effect at homogeneous local habitats. Our secondaim was to define the range of spatial aggregation indifferent microbial groups, with contrasting disper-sal ability and body size. We simultaneously exam-ined the spatial structure of protists, mesofauna andthe major taxonomic as well as functional groups offungi that differ in dispersal traits (for example,passive spore dispersal in protists and fungi vsmesofauna) and body size (1–103 μm in protists;1 μm to 102m in fungi; 102–104 μm in mesofauna).We carefully performed a neighbourhood analysis(Canham et al., 2004) of the surrounding tree coverand examined soil nutrients properties to account forenvironmental effects.
Material and methodsSampling and site characteristicsThis study was carried out in three replicated sites inmixed temperate forests in southern Estonia.The Järvselja site (58°15' N, 27°19' E) representsan old-growth forest (130 years) on Luvisols thatis dominated by Picea abies (L.) H.Karst. withabundant Tilia cordata Mill., understorey. TheMaarjaküla site (58° 07' N, 27° 02' E) constitutes amixed forest of P. abies and Pinus sylvestris L.
Stochastic distribution of small soil eukaryotesM Bahram et al
886
The ISME Journal

(age, 110 years) on podzols with abundant Vacciniummyrtillus L. shrubs and moss layer. The Elva site(58°11' N, 26°26' E) is a 100-year-old forest domi-nated by P. sylvestris with P. abies undergrowth,V. myrtillus shrub layer and mosses on podzols.In each site, we established a 64× 64m2 plot inhomogeneous areas in terms of vegetation (that is,tree basal area and plant community and coverage)and topography. There were no noticeable environ-mental gradients in these plots.
Within a single day in the summer of 2012, 41 soilcores (5 cm diameter to 5 cm depth) were takenfrom each plot in a nested design with base-2-logarithmically increasing distance between samplesfrom 0.01 to 64m (Figure 1). Such a samplingscheme enables to account for soil patchiness on amillimetre scale (Zhou et al., 2004) and providessufficient replication for distance classes from 0.01to 32m. The central sampling spot was randomlyselected with the constraint that it had to comprise auniform 40.25-m2 patch of microtopography andground vegetation and lie 41m from any surround-ing tree (41 cm diameter at the base). Around eachsample, a 0.5 × 0.5m2 quadrat was established, andthe cover of understorey plant species was recorded.Precise location of all trees and their diameter at~ 1.5m height were determined to account for thepotential neighbourhood effects on spatial distribu-tion of pathogens and mycorrhizal fungi (Bahramet al., 2011; Gómez‐Aparicio et al., 2012). Soils werekept at − 30 °C for 24 h to suspend motile organismsbefore air-drying at 25 °C for 48 h. The soil sampleswere pulverized and 0.2 g of soil dust was taken toDNA extraction using the UltraClean 100 Kit (MoBio,Carlsbad, CA, USA), following the manufacturer’sinstructions. The remaining soil was used for
chemical analysis of pHKCl and concentrations ofPtotal, K, Ca, Mg, C, N, 15N and 13C (SupplementaryTable S1) as described in Tedersoo et al., (2012). Ineach soil sample, the proportion of O, A and Ehorizons were measured because of differences infunctional composition of soil microbes (Zhou et al.,2004; Lindahl et al., 2007). There were only minordifferences in the thickness of soil layers within eachplot (mean± s.d.: Organic layer, 3.40 ± 1.08 cm;Mineral layer, 1.60 ± 1.08 cm).
Molecular methodsWe used the Internal Transcribed Spacer 2 (ITS2) asa locus for DNA metabarcoding, which offers higherresolution at species level compared with 18S rDNA(Bates et al., 2013) and provides less primer biascompared with mitochondrial cytochrome oxidase Iacross multiple eukaryote kingdoms (Deagle et al.,2014). PCR was carried out using a mixture of 11modified ITS3ngs forward primers (in equimolarconcentration) and a degenerate ITS4ngs reverseprimer (Tedersoo et al., 2016; Supplementary TableS2). PCR was performed with four replicates andprogrammed as follows: an initial 15min at 95 °C,followed by 30 cycles of 95 °C for 30 s, 55 °C for 30 s,72 °C for 1min, and a final cycle of 10min at 72 °C.These primers were modified to perfectly match theprominent soil eukaryotes, including Fungi, Viridi-plantae, Ciliophora, Rhizaria, Straminipila andgroups of mesofauna (such as Nematoda, Annelidaand Collembola). Both forward and reverse primerswere tagged with 1 of the 64 identifiers (10–12bases). Negative (DNA extraction and PCR) andpositive controls (single fungal specimens) wereused throughout the experiment. The ampliconswere purified using EXO-saprotrophic enzymes(Sigma, St Louis, MO, USA), normalized using aSequalPrep Normalization Kit (Invitrogen Inc.,Carlsbad, CA, USA), pooled and subjected to 454adaptor ligation, emulsion PCR and 454 pyrosequen-cing using the GS-FLX+ technology and Titaniumchemistry. Sequences were submitted to Short ReadArchive under accession number SRP045587.
BioinformaticsPyrosequencing reads were denoised by using thedefault settings (average quality cutoff = 30; signifi-cance level = –9) in Acacia (Bragg et al., 2012). Readswere further trimmed using Mothur (Schloss et al.,2009) by discarding regions with any ambiguousnucleotides and 410-bp homopolymers. Reads withmismatches to primer and tag combination ando150 bp were removed. Chimeras were checked inUCHIME (Edgar et al., 2011). The full ITS2 regionwas extracted in the ITSx (Bengtsson‐Palme et al.,2013). The extracted sequences were assembled intoOperational Taxonomic Units (OTUs) based on 97%pairwise similarity using CD-hit 4.6.1 (Fu et al.,2012). We evaluated different clustering algorithms
Figure 1 Schematic map of sampling design in each study site.
Stochastic distribution of small soil eukaryotesM Bahram et al
887
The ISME Journal

(Uclust, Crop, CD-hit, Swarm and CAP3) by comparingthe outcomes with phylogenetic trees of selecteddominant genera (Tomentella, Russula). The phylo-genetic trees were prepared under maximum like-lihood model in RAxML 7.0.4 (Stamatakis et al.,2008). Among available pairwise clustering methods,CD-hit gave very similar results to that deduced fromthe phylogenetic trees and resulted in the fewestOTUs. Singletons were removed from downstreamanalysis to eliminate potentially artefactual taxa(Tedersoo et al., 2010). Blast searches were per-formed against both NCBI and UNITE databases.OTUs without any blast match or with o60%identity to best blast matches were removed fromsubsequent analyses. The taxonomy of OTUs wasdetermined based on 10 best matches against thesedatabases. The lifestyle of fungal OTUs was deter-mined based on functional annotation of databasesequences (Tedersoo and Smith, 2013; Tedersooet al., 2014). Because of high abundance ofunidentified taxa in public databases, taxonomy ofOTUs with blast score o100 and identity o80%were considered to be unknown.
Data analysisBecause of low representation in our data set, weexcluded Straminipila, Alveolata and arbuscularmycorrhizal fungi from the analyses. We focussednot only on mesofauna, Rhizaria and Chlorophyta aswell as major functional groups within Fungi such assaprotrophs, ectomycorrhizal (EcM) symbionts andplant pathogens but also on fungal taxonomic groups(Ascomycota, Basidiomycota, Chytridiomycota andZygomycota s.lato). We used a modified Raup–Crickdissimilarity metric that is independent of samplesize (Chase et al., 2011). This measure calculatesthe proportion of observed dissimilarities acrosssamples that are higher than those estimated fromthe null model (1000 randomized matrices); it rangesfrom –1 to 1, with values near –1 (–0.95 to –1)indicating homogenizing dispersal (that is, masseffect), values near 1 (0.95 to 1) indicating environ-mental selection and other values (–0.95 to 0.95)indicating drift. Because beta diversity may resultfrom both species replacement (species turnovercomponent) and variation of species richness (nest-edness component), we followed the approach ofBaselga (2010) to address both processes in parallel.This approach enables partitioning variation thatresults from either nestedness or species turnoverinto individual distance matrices. Each group fromeach site was analysed individually; however, forsimplicity, if possible, the average (± s.d. or con-fidence interval (CI)) statistics of the three sites arereported. Analyses were performed in Vegan, Ape,Betapart and Ecodist packages of R (R DevelopmentCore Team, 2007) and custom scripts in Python 2.7.
For each DDS relationship, we calculated the slopeof relationship that indicates the rate of spatialturnover (Soininen et al., 2007). The overall spatial
structure was analysed by Mantel test. Using simpleMantel correlograms and semivariograms (based onthe exponential fit of the relationship betweendissimilarity of samples vs spatial distance), wecalculated the spatial autocorrelation range, that is,the distance up to which the composition of samplesis significantly more similar than expected (Robesonet al., 2011). For each data set, we explored linear,exponential or no significant fit according to deter-mination coefficients. For the groups with significantspatial autocorrelation, partial Mantel tests wereperformed to examine the correspondence of indivi-dual environmental variables with the observedspatial autocorrelation.
Principal Coordinates of Neighbouring Matricesvectors were calculated based on geographicaldistances among samples to represent differentspatial scales (Borcard and Legendre, 2002). Varia-tion partitioning was performed using the varpartfunction of the package Vegan (Oksanen et al., 2013)to disentangle the effects of major componentsources of variation, that is, vegetation, soil andspace. Variables from each category (that is, vegeta-tion, soil, spatial) were forward selected (Po0.05)before using in variation partitioning. For vegetation,both plant community and neighbourhood effects ofsurrounding trees were included. For soil variables,pH and concentrations of P, K, C and N and C:N ratiowere included (Supplementary Table S1). Prior tothe analysis, soil variables were log-transformed toapproximate normal distribution. We tested thespatial autocorrelation in soil variables and vegeta-tion (separately for trees and understorey vegetation)using Moran’s I correlograms. We further exploredthe effect of individual environmental variables onthe spatial distribution of belowground communitiesby incorporating biotic factors (neighbourhoodeffect, estimated herb and shrub cover and theircommunity composition), and abiotic factors (soilpH, nutrients and depth of horizons) in partialMantel correlograms as implemented in mpmcorre-logram package. Because of their potential influenceon soil chemistry, neighbouring trees may have agreat effect on spatial structure of soil communities.Using a neighbourhood analysis, we included theeffect of conspecific and heterospecific neighbouringtrees within 10m radius based on the followingequation:
NIF ¼Xni¼0
Area at breast heighti ´1
Distancei
� �;
where NIF is the neighbourhood effect. Distributionrange of OTUs in different groups was calculatedbased on the average distance among samples whereOTUs were present, and it was compared with theaverage distance among all samples as the expectednull range. Further details on the Materials andMethods used in this study are provided in theSupplementary Methods.
Stochastic distribution of small soil eukaryotesM Bahram et al
888
The ISME Journal
Results
A total of 4131 OTUs (including 2282 singletons)were retrieved from 90 761 high-quality ITS2sequences and 123 soil samples. Of the non-singleton OTUs, 1458 belonged to fungi (including588 Basidiomycota, 243 Ascomycota, 476 Zygomy-cota and 69 Chytridiomycota), 70 to Metazoa, 66 toRhizaria, 41 to Alveolata and 29 to Chlorophyta. Ofthe fungal OTUs, 197 were determined to be EcM,818 saprotrophic, 38 pathogens and 5 arbuscularmycorrhizal symbionts (Supplementary Figure S1).
Mantel tests showed significant spatial turnoveronly in certain groups (Table 1). The rate of DDS wasthe greatest for Rhizaria, followed by fungal phylaBasidiomycota, Zygomycota and Chytridiomycota(Table 1). There was no significant DDS in the othertaxonomic groups. EcM fungi showed the greatestDDS rate among the functional groups (mean ± s.d. ofthe slope of DDS in three sites: 0.139 ±0.133),followed by pathogens (0.087 ± 0.15) and sapro-trophs (0.018± 0.023). The semivariogram analysesand Mantel correlograms revealed significant auto-correlation within smaller distance classes (o3m) inthe majority of groups with significant autocorrela-tion (Table 1). In Basidiomycota and EcM fungi,significant autocorrelation was found in all threesites (mean± s.d. of autocorrelation ranges in threesites: 1.33 ± 0.76m; 1.16 ±1.58m; 2.50 ± 0.86m,respectively). For Rhizaria, spatial autocorrelationrange was significant in two sites (6 and 0.75m).In Chlorophyta, Chytridiomycota, Zygomycota,saprotrophic and pathogenic fungi, significant auto-correlation was found only in one of the three sites(at 0.9, 0.7, 1.5, 1.5 and 3m, respectively; Table 1). Insite III, a larger proportion of groups (81%) showedsignificant spatial autocorrelation compared withthe other sites (36% and 27% in sites II and I,
respectively). There was no significant spatial auto-correlation in Ascomycota and Metazoa. Across allgroups, the observed significant DDS was related tospecies replacement, whereas the nestedness compo-nent was not significant (Supplementary Table S3). Atest of correspondence among different communitiesbased on Mantel test revealed weak but in some casessignificant relationships between the communities ofdifferent groups (Supplementary Table S4).
Community turnover was lower than expected bythe null model (1000 randomized matrices) in themajority of organism groups (55% of communities;Figure 2). The average Raup–Crick distance wassignificantly lower than the null model in Basidio-mycota (mean±CI in three sites: − 0.406 ±0.037),saprotrophic fungi (−0.755± 0.026), Zygomycota(−0.586 ± 0.031) and Rhizaria (−0.227 ±0.041), but itwas slightly greater than expected by the null modelin EcM (0.018± 0.034) and pathogenic (0.044± 0.039)fungi. Similarly, the average Raup–Crick pairwisedistances within the smallest distance class (0–6m)was the highest in EcM fungi, followed by patho-genic and saprotrophic fungi. For all groups, envir-onmental selection and dispersal limitation(calculated as ratio of dissimilarity values between0.95 and 1) was negligible (o0.01). In contrast, masseffect (dissimilarity values between − 0.95 and − 1)was significant in Basidiomycota (15.56%) andZygomycota (28.4%) but not in Ascomycota (2.8%),Chytridiomycota (1.3%) or other eukaryotes(Supplementary Figure S2). The mass effect wassignificantly stronger in saprotrophic (51.87%) thanin EcM (4.63%) and pathogenic (1.43%) fungi.
The average distribution range of OTUs of themajority of groups was significantly higher thanpredicted by the null model, that is, the averagerange and its confidence intervals were higherthan average distance among samples (Figure 3).
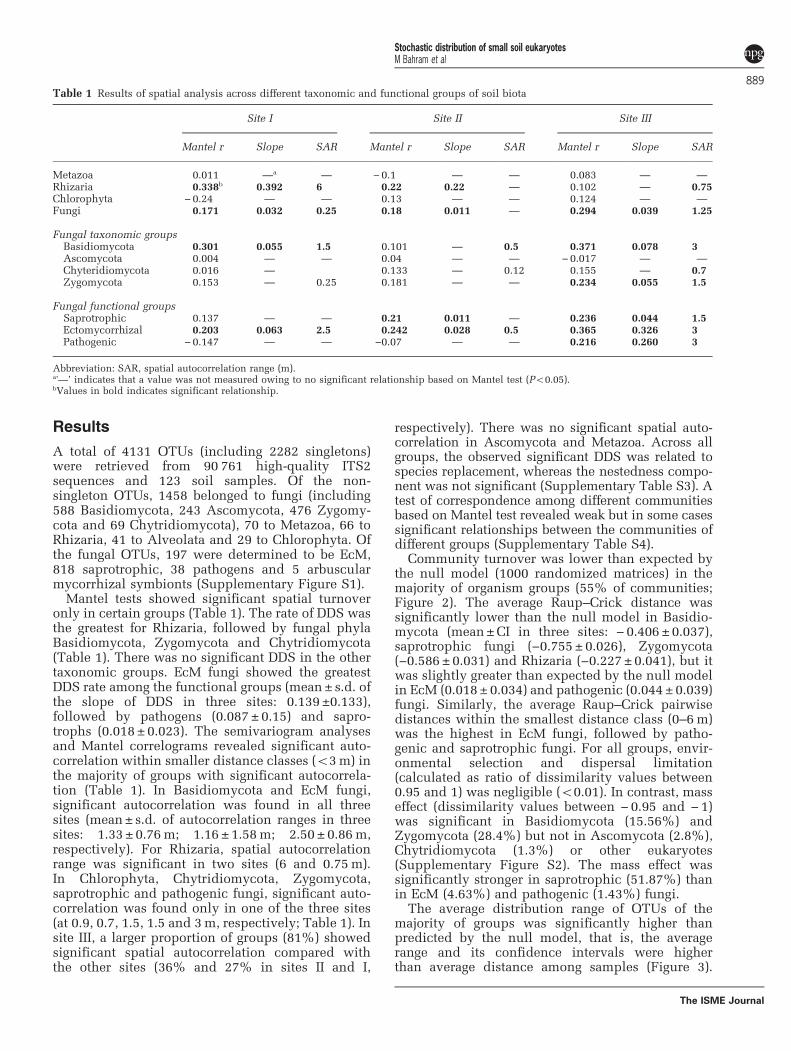
Table 1 Results of spatial analysis across different taxonomic and functional groups of soil biota
Site I Site II Site III
Mantel r Slope SAR Mantel r Slope SAR Mantel r Slope SAR
Metazoa 0.011 —a — −0.1 — — 0.083 — —
Rhizaria 0.338b 0.392 6 0.22 0.22 — 0.102 — 0.75Chlorophyta −0.24 — — 0.13 — — 0.124 — —
Fungi 0.171 0.032 0.25 0.18 0.011 — 0.294 0.039 1.25
Fungal taxonomic groupsBasidiomycota 0.301 0.055 1.5 0.101 — 0.5 0.371 0.078 3Ascomycota 0.004 — — 0.04 — — −0.017 — —
Chyteridiomycota 0.016 — 0.133 — 0.12 0.155 — 0.7Zygomycota 0.153 — 0.25 0.181 — — 0.234 0.055 1.5
Fungal functional groupsSaprotrophic 0.137 — — 0.21 0.011 — 0.236 0.044 1.5Ectomycorrhizal 0.203 0.063 2.5 0.242 0.028 0.5 0.365 0.326 3Pathogenic −0.147 — — −0.07 — — 0.216 0.260 3
Abbreviation: SAR, spatial autocorrelation range (m).a'—’ indicates that a value was not measured owing to no significant relationship based on Mantel test (Po0.05).bValues in bold indicates significant relationship.
Stochastic distribution of small soil eukaryotesM Bahram et al
889
The ISME Journal
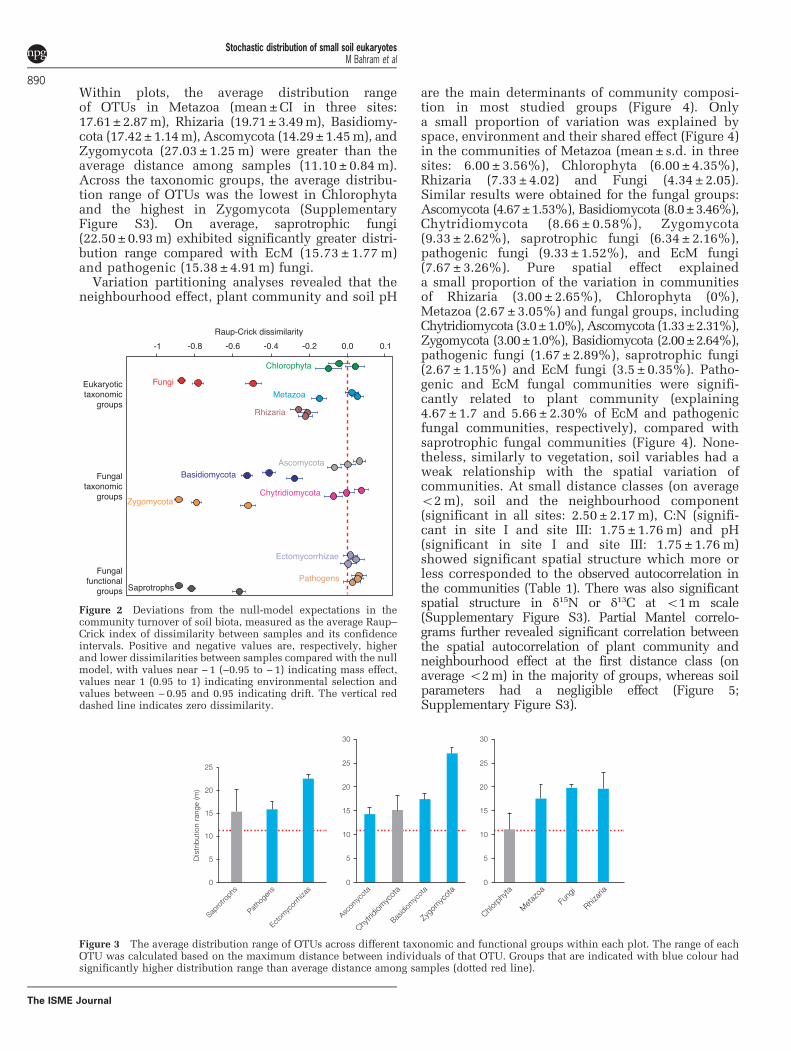
Within plots, the average distribution rangeof OTUs in Metazoa (mean±CI in three sites:17.61±2.87m), Rhizaria (19.71±3.49m), Basidiomy-cota (17.42±1.14m), Ascomycota (14.29±1.45m), andZygomycota (27.03 ± 1.25m) were greater than theaverage distance among samples (11.10 ± 0.84m).Across the taxonomic groups, the average distribu-tion range of OTUs was the lowest in Chlorophytaand the highest in Zygomycota (SupplementaryFigure S3). On average, saprotrophic fungi(22.50±0.93m) exhibited significantly greater distri-bution range compared with EcM (15.73 ± 1.77 m)and pathogenic (15.38 ± 4.91m) fungi.
Variation partitioning analyses revealed that theneighbourhood effect, plant community and soil pH
are the main determinants of community composi-tion in most studied groups (Figure 4). Onlya small proportion of variation was explained byspace, environment and their shared effect (Figure 4)in the communities of Metazoa (mean± s.d. in threesites: 6.00 ± 3.56%), Chlorophyta (6.00 ± 4.35%),Rhizaria (7.33 ±4.02) and Fungi (4.34 ± 2.05).Similar results were obtained for the fungal groups:Ascomycota (4.67±1.53%), Basidiomycota (8.0±3.46%),Chytridiomycota (8.66 ± 0.58%), Zygomycota(9.33 ± 2.62%), saprotrophic fungi (6.34 ± 2.16%),pathogenic fungi (9.33 ±1.52%), and EcM fungi(7.67 ± 3.26%). Pure spatial effect explaineda small proportion of the variation in communitiesof Rhizaria (3.00 ±2.65%), Chlorophyta (0%),Metazoa (2.67 ±3.05%) and fungal groups, includingChytridiomycota (3.0±1.0%), Ascomycota (1.33±2.31%),Zygomycota (3.00±1.0%), Basidiomycota (2.00±2.64%),pathogenic fungi (1.67 ± 2.89%), saprotrophic fungi(2.67 ± 1.15%) and EcM fungi (3.5 ± 0.35%). Patho-genic and EcM fungal communities were signifi-cantly related to plant community (explaining4.67 ± 1.7 and 5.66 ± 2.30% of EcM and pathogenicfungal communities, respectively), compared withsaprotrophic fungal communities (Figure 4). None-theless, similarly to vegetation, soil variables had aweak relationship with the spatial variation ofcommunities. At small distance classes (on averageo2m), soil and the neighbourhood component(significant in all sites: 2.50 ± 2.17m), C:N (signifi-cant in site I and site III: 1.75± 1.76m) and pH(significant in site I and site III: 1.75 ± 1.76m)showed significant spatial structure which more orless corresponded to the observed autocorrelation inthe communities (Table 1). There was also significantspatial structure in δ15N or δ13C at o1m scale(Supplementary Figure S3). Partial Mantel correlo-grams further revealed significant correlation betweenthe spatial autocorrelation of plant community andneighbourhood effect at the first distance class (onaverage o2m) in the majority of groups, whereas soilparameters had a negligible effect (Figure 5;Supplementary Figure S3).
Figure 2 Deviations from the null-model expectations in thecommunity turnover of soil biota, measured as the average Raup–Crick index of dissimilarity between samples and its confidenceintervals. Positive and negative values are, respectively, higherand lower dissimilarities between samples compared with the nullmodel, with values near −1 (−0.95 to −1) indicating mass effect,values near 1 (0.95 to 1) indicating environmental selection andvalues between −0.95 and 0.95 indicating drift. The vertical reddashed line indicates zero dissimilarity.
Figure 3 The average distribution range of OTUs across different taxonomic and functional groups within each plot. The range of eachOTU was calculated based on the maximum distance between individuals of that OTU. Groups that are indicated with blue colour hadsignificantly higher distribution range than average distance among samples (dotted red line).
Stochastic distribution of small soil eukaryotesM Bahram et al
890
The ISME Journal

Discussion
Small-scale biogeography of eukaryotic microbes hasreceived little empirical attention so far, perhapsowing to the common assumption of no dispersal
limitation in microbes (Finlay, 2002). Our studycontributes to understanding the fine-scale spatialstructure of different taxonomic and functionalgroups of soil eukaryotes and sheds light into theunderlying processes. Small scale and homogeneousvegetation of our study sites enabled us to minimizethe effects of environmental and historical factors.Our analysis revealed that most groups of theaddressed soil biota exhibit negligible fine-scalespatial distribution patterns (Table 1; Figure 2). Inspite of some level of heterogeneity in the soilvariables (Supplementary Figure S3), tree neighbour-hood and soil had a small effect on communitycomposition of most groups of soil biota. Althoughour sampling addressed fine-scale spatial distancesspanning three orders of magnitude, most of the soilbiota was only marginally structured by the spatialframework, and generally 490% of communityvariation remained unexplained by space or theenvironment. This could be ascribed to stochasticityin these spatially homogeneous systems, unmea-sured environmental variables or methodologicalissues (see below).
Our results support the prominent role of stochas-tic processes, that is, mass effect coupled withstochastic ecological drift (Chase et al., 2011) instructuring microbial communities at the small scale.A large fraction of pairwise community comparisonsdid not deviate from the null model, that is, 1000randomized matrices (Figure 2), indicating ecologi-cal drift acting alone as the main determinant ofcommunity structure (Stegen et al., 2013). In themajority of groups, the average distribution range ofOTUs was greater than expected by chance(Figure 3), reflecting homogenizing effect of disper-sal (that is, mass effect). Together with the relativelyminor spatial effect on communities, the widedistribution range of taxa suggests that dispersallimitation has only a weak influence on spatialturnover in soil biota at the local scale. A fewprevious studies on arbuscular mycorrhizal fungiover a similar geographical scale revealed significantDDS and the dominance of deterministic processesin structuring soil communities along strong envir-onmental gradients (Lekberg et al., 2007; Dumbrellet al., 2010). Focussing on a local scale in theabsence of environmental gradients enabled us toreduce the effect of deterministic processes. Hightaxonomic richness coupled with short generationperiods, functional redundancy and strong priorityeffects (Soininen et al., 2007; Vellend, 2010) add tothe stochasticity. This may override the weak effectof environmental factors as well as dispersal limita-tion and lead to weak microbial spatial structure inthe absence of strong environmental heterogeneity atthe local scale. Moreover, soil comprises restingpropagules such as pollen, seeds, spores and eggs,the passive dispersal of which and detection alongwith the active community may reduce the resolu-tion of environmental and spatial effects. Severalstudies at larger scales provide evidence for the
Metazoa
Chlorophyta Rhizaria
Fungi Pathogens
Ectomycorrhizas Saprotrophs
2.33 2.67
0.67
1.67
2.33 3.003.00
1.00
2.00
1.67
2.33
3.33
1.331.67 1.67
1.00
0.67
1.67 2.67
1.00 1.00
1.00
0.67 2.33
4.00
0.67
Figure 4 Venn diagram of variation partitioning analysis,illustrating the effects of soil, vegetation and spatial variables onthe community structure of soil biota. Values show the percentageof variation explained by each fraction, including pure soil effect(a), shared effect between soil and space (b), pure spatial effect (c),shard effect of soil and vegetation (d), shared effect of soil, spaceand vegetation (e), shared effect of space and vegetation (f) andpure vegetation effect (g). Vegetation includes both plant commu-nity and spatial distribution of trees diameters at breast height(that is, neighbourhood component). Note that the fraction ofunexplained variation and values o1% are not shown forsimplicity.
Stochastic distribution of small soil eukaryotesM Bahram et al
891
The ISME Journal

significant DDS in microbial communities indepen-dent of environmental heterogeneity (Martiny et al.,2011; Robeson et al., 2011; Talbot et al., 2014),indicating substantial historical dispersal limitationand drift.
Communities of different taxonomic and func-tional groups may be structured by contrastingunderlying factors. We found the weakest DDS ratein soil mesofauna that could relate to their highdispersal rate at the fine scale (Table 1). EcM andpathogenic fungi exhibited relatively higher spatialturnover than expected by the null model, whereassaprotrophic fungi and Rhizaria had significantlylower spatial turnover than expected (Figure 3).These results are consistent with random dispersalthat has been reported for soil protozoa and
mesofauna (Petersen and Luxton, 1982; Estebanet al., 2006; Lara et al., 2011). This can be attributedto their high dispersal rate, which overwhelmsboth environmental selection and ecological drift.The high dispersal in this group was also supportedby their greater distribution range than the nullmodel. In particular, the distribution range ofsaprotrophic fungal OTUs exceeded that of the othergroups, for which we found the largest ratio ofdeviations from the null model (Figure 2). The weakDDS was observed across all taxonomic groups ofsaprotrophic fungi (that is, saprotrophic Basidiomy-cota, Ascomycota and Zygomycota). Spatial struc-ture of saprotrophic fungi was mainly related to soilvariables, whereas EcM and pathogenic fungishowed little correspondence with soil. This is
Figure 5 Spatial structure of the communities at various distance classes as revealed by Mantel and Partial Mantel correlograms inrelation to biotic and abiotic factors, including pure spatial (black line and squares) plant community (blue line and squares), soilparameters (red line and squares) and neighbourhood effect (green line and squares). Distance classes were defined as follows (in m):0–0.5, 0.5–1, 1–2.5, 2.5–3.5, 3.5–5, 5–11, 11–21, 21–41 and 41–64. Filled squares represent significant Mantel r after Bonferroni multipletest correction.
Stochastic distribution of small soil eukaryotesM Bahram et al
892
The ISME Journal

expected given that EcM and pathogenic fungi gainmost of their C demand directly from host plants,while saprotrophic fungi rely on organic material ofsoil (Plett and Martin, 2011). Compared with theother studied groups, we detected relatively strongerspatial structure as well as greater vegetation andneighbourhood effect in EcM fungal communities.We also found a strong spatial structure in apathogenic fungal community in one site, whichwas mainly related to plant community based onpartial Mantel test, by testing the correlation betweenplant and fungal communities while controlling forsoil and spatial components. These results indicatestronger spatial structuring of biotrophic groups thatcorrespond to vegetation patchiness. The importanceof aboveground interactions on these groups wasalso supported by the scale of the observed spatialautocorrelation range in EcM fungi, which nearlycorresponded to that in the spatial distribution oftrees in our study sites. Spatial distance has animportant role in maintaining symbiotic (Bever et al.,2009) and pathogenic relationships (Kerr et al., 2006)through positive and negative soil feedbacks,respectively.
At very fine scales (o2m), spatial autocorrelationresulting from aggregate growth of individuals affectscommunity turnover in certain eukaryotic microbes.In aboveground macro-organisms, body size isstrongly linked to dispersal limitation and thusspatial aggregation (Nekola and White, 1999). Infungi, most of their body comprises vegetativelyspreading mycelium in soil, reaching up to 100m inextreme cases (Douhan et al., 2011). Therefore, incertain fungal groups, our sampling may capture thesame individual multiple times, which less likelyoccurs in mesofauna or protists. This could result inspatial aggregation of species that may consequentlyaffect DDS (Morlon et al., 2008). The spatial structurein other groups may be detectable beyond the scaleof our study. For example, spatial structure innematode populations can be detected at the scaleof more than tens of metres (Liang et al., 2005),whereas bacterial communities shift within a fewmillimetres because of differences in soil microha-bitats (Zhou et al., 2004). Soil animals compriseorganisms of very different size and mobility, whichmay blur their distribution patterns because ofmultiple conflicting signals. Because of the strongeffect of grain size on the detection of spatialstructure (Nekola and White, 1999), the resolutionof our samples, including their lag distance (1 cm)and grain size (5 cm), could have been insufficientfor detecting spatial aggregation in some of thegroups.
Our data also indicate that heterogeneity ofvegetation rather than edaphic variables may con-tribute to spatial patterning of soil microbes at thevery fine scale, that is, o2m (Figure 5). We foundsignificant spatial autocorrelation in plant commu-nities, neighbourhood effect as well as soil pH andC:N ratio at the scale ofo2m (Supplementary Figure
S3). These factors exhibited relatively strongercorrelation with community, and partial Mantelcorrelograms indicated that these could explain theobserved spatial autocorrelation in certain studiedgroups, in particular Rhizaria, EcM, saprotrophicand pathogenic fungi. Previous studies have shownthat soil chemistry, particularly pH, strongly impactsmicrobial communities (Franklin and Mills, 2003;Rousk et al., 2010). Soil pH and N may be spatiallyautocorrelated up to 5m (Ettema and Wardle, 2002;Pärtel et al., 2008; Baldrian et al., 2010). Besides thegreat spatial variability of soil nutrients and pH thatis commonly observed in forest soil (Ettema andWardle, 2002; Štursová and Baldrian, 2011), soilmicrobial biomass may also be spatially autocorre-lated up to 10m (Ritz et al., 2004), which may affectsoil spatial heterogeneity and in turn microbialcommunities (Lauber et al., 2009). The neighbour-hood effect of trees and influence of understoreyvegetation were relatively more important in shapingcommunities of biotrophic fungi rather than free-living organisms.
Conclusions
Our study provides empirical support for the assump-tion of no dispersal limitation in eukaryotic microbialdistribution at small scales. Communities of soileukaryote groups with varying size and dispersaltraits exhibit negligible DDS patterns and littlecorrespondence to deterministic factors along a weaklocal environmental gradient, indicating stochasticdistribution patterns consistent with neutral theory.For all groups, mass effect and ecological drift appearto be the main drivers of communities in the absenceof environmental gradients. Nevertheless, we detectedsome level of spatial autocorrelation in certain groups,in particular EcM and pathogenic fungi, which mainlyreflects their correspondence to the spatial structure ofvegetation.
Conflict of Interest
The authors declare no conflict of interest.
AcknowledgementsWe thank MMett for help during field sampling. M Nõukasand R Puusepp for sample preparation. We also thank AriJumpponen and five anonymous referees for their con-structive comments on the earlier version of this manu-script. This study was funded by ESF grant nos. 9286,PUT0171, NPUI LO1417 MSMT and FIBIR.
ReferencesAstorga A, Oksanen J, Luoto M, Soininen J, Virtanen R,
Muotka T (2012). Distance decay of similarity in
Stochastic distribution of small soil eukaryotesM Bahram et al
893
The ISME Journal

freshwater communities: do macro‐and microorgan-isms follow the same rules? Glob Ecol Biogeogr 21:365–375.
Bahram M, Põlme S, Kõljalg U, Tedersoo L (2011). A singleEuropean aspen (Populus tremula) tree individualmay potentially harbour dozens of Cenococcumgeophilum ITS genotypes and hundreds of speciesof ectomycorrhizal fungi. FEMS Microbiol Ecol 75:313–320.
Bahram M, Koljalg U, Courty P, Diedhiou AG, Kjøller R,Polme S et al. (2013). The distance decay of similarityin communities of ectomycorrhizal fungi in differentecosystems and scales. J Ecol 101: 1335–1344.
Baldrian P, Merhautová V, Cajthaml T, Petránková M,Šnajdr J (2010). Small-scale distribution of extracellularenzymes, fungal, and bacterial biomass in Quercuspetraea forest topsoil. Biol Fertil Soils 46: 717–726.
Baselga A (2010). Partitioning the turnover and nestednesscomponents of beta diversity. Glob Ecol Biogeogr 19:134–143.
Bates ST, Clemente JC, Flores GE, Walters WA, Parfrey LW,Knight R et al. (2013). Global biogeography ofhighly diverse protistan communities in soil. ISME J7: 652–659.
Bengtsson‐Palme J, Ryberg M, Hartmann M, Branco S,Wang Z, Godhe A et al. (2013). Improved softwaredetection and extraction of ITS1 and ITS2 fromribosomal ITS sequences of fungi and other eukaryotesfor analysis of environmental sequencing data.Methods Ecol Evol 4: 914–919.
Bever JD, Richardson SC, Lawrence BM, Holmes J,Watson M (2009). Preferential allocation to beneficialsymbiont with spatial structure maintains mycorrhizalmutualism. Ecol Lett 12: 13–21.
Bie T, Meester L, Brendonck L, Martens K, Goddeeris B,Ercken D et al. (2012). Body size and dispersal mode askey traits determining metacommunity structure ofaquatic organisms. Ecol Lett 15: 740–747.
Borcard D, Legendre P (2002). All-scale spatial analysis ofecological data by means of principal coordinates ofneighbour matrices. Ecol Model 153: 51–68.
Bragg L, Stone G, Imelfort M, Hugenholtz P, Tyson GW(2012). Fast, accurate error-correction of ampliconpyrosequences using acacia. Nat Methods 9: 425–426.
Canham CD, LePage PT, Coates KD (2004). A neighbor-hood analysis of canopy tree competition: effectsof shading versus crowding. Can J Forest Res 34:778–787.
Chase JM, Kraft NJB, Smith KG, Vellend M, Inouye BD(2011). Using null models to disentangle variation incommunity dissimilarity from variation in α-diversity.Ecosphere 2: 1–11.
Chase JM (2014). Spatial scale resolves the niche versusneutral theory debate. J Veg Sci 25: 319–322.
Chase JM, Leibold MA (2003). Ecological Niches: LinkingClassical and Contemporary Approaches. Universityof Chicago Press: Chicago, IL, USA.
Chave J (2004). Neutral theory and community ecology.Ecol Lett 7: 241–253.
Condit R, Pitman N, Leigh EG Jr, Chave J, Terborgh J,Foster RB et al. (2002). Beta-diversity in tropicalforest trees. Science 295: 666–669.
Cottenie K (2005). Integrating environmental and spatialprocesses in ecological community dynamics. Ecol Lett8: 1175–1182.
Deagle BE, Jarman SN, Coissac E, Pompanon F, Taberlet P(2014). DNA metabarcoding and the cytochrome c
oxidase subunit I marker: not a perfect match. Biol Lett10: 20140562.
Douhan GW, Vincenot L, Gryta H, Selosse MA (2011).Population genetics of ectomycorrhizal fungi: fromcurrent knowledge to emerging directions. Fungal Biol115: 569–597.
Dumbrell AJ, Nelson M, Helgason T, Dytham C, Fitter AH(2010). Relative roles of niche and neutral processesin structuring a soil microbial community. ISME J 4:337–345.
Edgar RC, Haas BJ, Clemente J C, Quince C, Knight R(2011). UCHIME improves sensitivity and speed ofchimera detection. Bioinformatics 27: 2194–2200.
Esteban GF, Clarke KJ, Olmo JL, Finlay BJ (2006).Soil protozoa—an intensive study of populationdynamics and community structure in an uplandgrassland. Appl Soil Ecol 33: 137–151.
Ettema CH, Wardle DA (2002). Spatial soil ecology. TrendsEcol Evol 17: 177–183.
Farjalla VF, Srivastava DS, Marino NAC, Azevedo FD,Dib V, Lopes PM et al. (2012). Ecological deter-minism increases with organism size. Ecology 93:1752–1759.
Finlay BJ (2002). Global dispersal of free-living microbialeukaryote species. Science 296: 1061–1063.
Franklin RB, Mills AL (2003). Multi‐scale variation inspatial heterogeneity for microbial community struc-ture in an eastern Virginia agricultural field. FEMSMicrobiol Ecol 44: 335–346.
Fu L, Niu B, Zhu Z, Wu S, Li W (2012). CD-HIT:accelerated for clustering the next-generationsequencing data. Bioinformatics 28: 3150–3152.
Gómez‐Aparicio L, Ibánez B, Serrano MS, De Vita P,Avila JM, Pérez‐Ramos IM et al. (2012). Spatialpatterns of soil pathogens in declining Mediterraneanforests: implications for tree species regeneration. NewPhytol 194: 1014–1024.
Green JL, Holmes AJ, Westoby M, Oliver I, Briscoe D,Dangerfield M et al. (2004). Spatial scaling of microbialeukaryote diversity. Nature 432: 747–750.
Hájek M, Roleček J, Cottenie K, Kintrová K, Horsák M,Poulíčková A et al. (2011). Environmental andspatial controls of biotic assemblages in a discretesemi‐terrestrial habitat: comparison of organisms withdifferent dispersal abilities sampled in the same plots.J Biogeogr 38: 1683–1693.
Hanson CA, Fuhrman JA, Horner-Devine MC, Martiny JB(2012). Beyond biogeographic patterns: processesshaping the microbial landscape. Nat Rev Microbiol10: 497–506.
Hubbell SP (2001). The Unified Neutral Theory ofBiodiversity and Biogeography. Princeton UniversityPress: Princeton, NJ, USA.
Kerr B, Neuhauser C, Bohannan BJ, Dean AM (2006).Local migration promotes competitive restraint in ahost–pathogen 'tragedy of the commons'. Nature 442:75–78.
Lara E, Heger TJ, Scheihing R, Mitchell EA (2011). COIgene and ecological data suggest size-dependent highdispersal and low intra-specific diversity in free-livingterrestrial protists (Euglyphida: Assulina). J Biogeogr38: 640–650.
Lauber CL, Hamady M, Knight R, Fierer N (2009).Pyrosequencing-based assessment of soil pH as apredictor of soil bacterial community structure atthe continental scale. Appl Environ Microbiol 75:5111–5120.
Stochastic distribution of small soil eukaryotesM Bahram et al
894
The ISME Journal

Legendre P, Mi X, Ren H, Ma K, Yu M, Sun I et al. (2009).Partitioning beta diversity in a subtropical broad-leaved forest of China. Ecology 90: 663–674.
Lekberg Y, Koide R T, Rohr J R, Aldrich‐Wolfe L, Morton JB(2007). Role of niche restrictions and dispersal in thecomposition of arbuscular mycorrhizal fungal commu-nities. J Ecol 95: 95–105.
Liang W, Jiang Y, Li Q, Liu Y, Wen D (2005). Spatialdistribution of bacterivorous nematodes in a ChineseEcosystem Research Network (CERN) site. Ecol Res 20:481–486.
Lindahl BD, Ihrmark K, Boberg J, Trumbore SE,Hogberg P, Stenlid J et al. (2007). Spatial separa-tion of litter decomposition and mycorrhizalnitrogen uptake in a boreal forest. New Phytol 173:611–620.
Lowe WH, McPeek MA (2014). Is dispersal neutral? TrendsEcol Evol 29: 444–450.
Martiny JB, Eisen JA, Penn K, Allison SD,Horner-Devine MC (2011). Drivers of bacterial beta-diversity depend on spatial scale. Proc Natl Acad SciUSA 108: 7850–7854.
Morlon H, Chuyong G, Condit R, Hubbell S, Kenfack D,Thomas D et al. (2008). A general framework forthe distance–decay of similarity in ecological commu-nities. Ecol Lett 11: 904–917.
Nekola JC, White PS (1999). The distance decay ofsimilarity in biogeography and ecology. J Biogeogr 26:867–878.
Oksanen J, Blanchet FG, Kindt R, Legendre P, Minchin PR,O’Hara R et al. (2013). Package ‘vegan’.
Pärtel M, Laanisto L, Wilson SD (2008). Soil nitrogen andcarbon heterogeneity in woodlands and grasslands:contrasts between temperate and tropical regions. GlobEcol Biogeogr 17: 18–24.
Petersen H, Luxton M (1982). A comparative analysis ofsoil fauna populations and their role in decompositionprocesses. Oikos 39: 288–388.
Plett JM, Martin F (2011). Blurred boundaries: lifestylelessons from ectomycorrhizal fungal genomes. TrendsGenet 27: 14–22.
Porco D, Potapov M, Bedos A, Busmachiu G, Weiner WM,Hamra-Kroua S et al. (2012). Cryptic diversity in theubiquist species Parisotoma notabilis (Collembola,Isotomidae): a long-used chimeric species? PLoS One7: e46056.
Poulin R (2003). The decay of similarity with geographicaldistance in parasite communities of vertebrate hosts.J Biogeogr 30: 1609–1615.
Queloz V, Sieber TN, Holdenrieder O, McDonald BA,Grünig C R (2011). No biogeographical pattern for aroot‐associated fungal species complex. Glob EcolBiogeogr 20: 160–169.
R Development Core Team (2007). R: A Languageand Environment for Statistical Computing. R.F.f.S.Computing: Vienna, Austria.
Ritz K, McNicol J, Nunan N, Grayston S, Millard P,Atkinson D et al. (2004). Spatial structure in soilchemical and microbiological properties in an uplandgrassland. FEMS Microbiol Ecol 49: 191–205.
Robeson MS, King AJ, Freeman KR, Birky CW Jr,Martin AP, Schmidt SK (2011). Soil rotifer commu-nities are extremely diverse globally but spatiallyautocorrelated locally. Proc Natl Acad Sci USA 108:4406–4410.
Rousk J, Bååth E, Brookes PC, Lauber CL, Lozupone C,Caporaso JG et al. (2010). Soil bacterial and fungal
communities across a pH gradient in an arable soil.ISME J 4: 1340–1351.
Schloss PD, Westcott SL, Ryabin T, Hall JR, Hartmann M,Hollister EB et al. (2009). Introducing mothur:open-source, platform-independent, community-supported software for describing and comparingmicrobial communities. Appl Environ Microbiol 75:7537–7541.
Soininen J, McDonald R, Hillebrand H (2007). The distancedecay of similarity in ecological communities. Ecography30: 3–12.
Stamatakis A, Hoover P, Rougemont J (2008). A rapidbootstrap algorithm for the RAxML web servers. SystBiol 57: 758–771.
Stegen JC, Lin X, Fredrickson J K, Chen X, Kennedy DW,Murray CJ et al. (2013). Quantifying communityassembly processes and identifying features thatimpose them. ISME J 7: 2069–2079.
Steinbauer MJ, Dolos K, Reineking B, Beierkuhnlein C(2012). Current measures for distance decay insimilarity of species composition are influenced bystudy extent and grain size. Glob Ecol Biogeogr 21:1203–1212.
Štursová M, Baldrian P (2011). Effects of soil propertiesand management on the activity of soil organicmatter transforming enzymes and the quantificationof soil-bound and free activity. Plant Soil 338:99–110.
Talbot JM, Bruns TD, Taylor JW, Smith DP,Branco S, Glassman SI et al. (2014). Endemismand functional convergence across the North Americansoil mycobiome. Proc Natl Acad Sci USA 111:6341–6346.
Tedersoo L, Bahram M, Cajthaml T, Põlme S, Hiiesalu I,Anslan S et al. (2016). Tree diversity and speciesidentity effects on soil fungi, protists and animals arecontext-dependent. ISME J 10: 346–362.
Tedersoo L, Bahram M, Põlme S, Kõljalg U, Yorou NS,Wijesundera R et al. (2014). Global diversity andgeography of soil fungi. Science 346: 1256688.
Tedersoo L, Nilsson RH, Abarenkov K, Jairus T, Sadam A,Saar I et al. (2010). 454 pyrosequencing and sangersequencing of tropical mycorrhizal fungi providesimilar results but reveal substantial methodologicalbiases. New Phytol 188: 291–301.
Tedersoo L, Smith ME (2013). Lineages of ectomycorrhizalfungi revisited: foraging strategies and novel lineagesrevealed by sequences from belowground. Fungal BiolRev 27: 83–99.
Tedersoo L, Naadel T, Bahram M, Pritsch K, Buegger F,Leal M et al. (2012). Enzymatic activities and stableisotope patterns of ectomycorrhizal fungi in relation tophylogeny and exploration types in an afrotropicalrain forest. New Phytol 195: 832–843.
Vellend M (2010). Conceptual synthesis in communityecology. Q Rev Biol 85: 183–206.
Vellend M, Srivastava DS, Anderson KM, Brown CD,Jankowski JE, Kleynhans EJ et al. (2014). Assessing therelative importance of neutral stochasticity in ecologi-cal communities. Oikos 123: 1420–1430.
Wang J, Shen J, Wu Y, Tu C, Soininen J, Stegen JC et al.(2013). Phylogenetic beta diversity in bacterial assem-blages across ecosystems: deterministic versus stochas-tic processes. ISME J 7: 1310–1321.
Wardle DA (2002). Communities and Ecosystems: Linkingthe Aboveground and Belowground Components.Princeton University Press: Princeton, NJ, USA.
Stochastic distribution of small soil eukaryotesM Bahram et al
895
The ISME Journal

Warren DL, Cardillo M, Rosauer DF, Bolnick DI (2014).Mistaking geography for biology: inferring processes fromspecies distributions. Trends Ecol Evol 29: 572–580.
Wu T, Ayres E, Bardgett RD, Wall DH, Garey JR (2011).Molecular study of worldwide distribution and
diversity of soil animals. Proc Natl Acad Sci USA108: 17720–17725.
Zhou J, Xia B, Huang H, Palumbo AV, Tiedje JM (2004).Microbial diversity and heterogeneity in sandy subsurfacesoils. Appl Environ Microbiol 70: 1723–1734.
Supplementary Information accompanies this paper on The ISME Journal website (http://www.nature.com/ismej)
Stochastic distribution of small soil eukaryotesM Bahram et al
896
The ISME Journal