Ligand-binding assays for cyanobacterial neurotoxins targeting cholinergic receptors

© 2008 Wiley-VCH Verlag GmbH & Co. KGaA, Weinheim 311
Biotechnol. J. 2008, 3, 311–324 DOI 10.1002/biot.200700222 www.biotechnology-journal.com
1 Introduction
Every cellular process involves the dynamic regu-lation of transient and constitutive protein-proteininteractions.This includes regulation of the cell cy-cle and cell differentiation, DNA replication andtranscription, mRNA translation, receptor-ligandbinding and signal transduction. Progress in ge-nomics and proteomics has elucidated a large num-ber of potential new drug targets. Abnormal regu-lation (hyperactivation or inhibition) of proteins isfrequently observed in human disease, for instancein cancers or neurodegenerative diseases, and of-
ten modifies receptor activation, protease activityor protein-protein interactions. Characterization ofsmall chemical compounds that inhibit the enzy-matic activity related to a specific disease is a strat-egy frequently used to identify new therapeuticdrugs. Target-driven screening of different collec-tions of natural and synthetic compounds have ledto the identification of numerous families of mole-cules that are already on the market or under eval-uation in clinical trials. One example is (R)-roscov-itine (CYC202, Seliciclib), an inhibitor of severalprotein kinases involved in human disease [1]. Toincrease the specificity of drug candidates and thusto limit undesirable side effects, various strategiesare currently undergoing evaluation such as tar-geting molecular surfaces on therapeutic targetsthat are crucial for the interaction with cellular ef-fectors [2]. Nowadays, the list of protein-protein in-teraction inhibitors (PPII) is growing rapidly [3].Different methods are now available to detect theseinteractions. In vitro experiments, such as co-im-
Review
The BRET technology and its application to screening assays
Johan Bacart1*, Caroline Corbel2*, Ralf Jockers3,4, Stéphane Bach2 and Cyril Couturier1
1 UMR 8090, CNRS, Université Lille 2, Lille, France2 CNRS UPS 2682, Protein Phosphorylation and Disease laboratory, Station Biologique, Roscoff, France3 Institut Cochin, Université Paris Descartes, CNRS UMR 8104, Département de Biologie Cellulaire, Paris, France4 Inserm, U567, Paris, France
The bioluminescence resonance energy transfer (BRET) method is based on resonance energytransfer between a light-emitting enzyme and a fluorescent acceptor. Since its first description in1999, several versions of BRET have been described using different substrates and energydonor/acceptor couples. Today, BRET is considered as one of the most versatile techniques forstudying the dynamics of protein-protein interactions in living cells. Various studies have appliedBRET-based assays to screen new receptor ligands and inhibitors of disease-related-proteases. In-hibitors of protein-protein interactions are likely to become a new major class of therapeutic drugs,and BRET technology is expected to play an important role in the identification of such com-pounds. This review describes the original BRET-based methodology, more recent variants, andpotential applications to drug screening.
Keywords: Bioluminescence resonance energy transfer · Drug discovery · High throughput screening assays · Protein-proteininteraction
Correspondence: Dr. Cyril Couturier, UMR 8090, CNRS, Université Lille 2,1 rue du Professeur Calmette, 59019 Lille Cedex, FranceE-mail: [email protected]: +33-3-2087-7229
Abbreviations: BRET, bioluminescence resonance energy transfer; FRET,fluorescence resonance energy transfer; GPCR, G protein-coupled receptor;HTS, high throughput screening; PPII, protein-protein interaction in-hibitors; QD, quantum dot; Rluc, Renilla luciferase; YFP, yellow fluorescentprotein * These authors contributed equally to this work.
Received 23 October 2007Revised 11 December 2007Accepted 17 December 2007

BiotechnologyJournal Biotechnol. J. 2008, 3, 311–324
312 © 2008 Wiley-VCH Verlag GmbH & Co. KGaA, Weinheim
munoprecipitation or GST pull-down, have been,and are still largely used, but cannot detect dynam-ic interactions in a cellular context. To circumventthese limits, efforts have been put forth to developnew detection methods to monitor protein interac-tions in living cells.This includes the yeast two-hy-brid-related mammalian protein-protein interac-tion trap (MAPPIT) [4–9], fluorescence polariza-tion [10–13], homogeneous time resolved fluores-cence (HTRF), fluorescence resonance energytransfer (FRET) [14–17], and bioluminescence res-onance energy transfer (BRET) [18–20]. This re-view focuses on the highly sensitive BRET technol-ogy, which has already made a substantial contri-bution to our understanding of G protein-coupledreceptor (GPCR) homo- and hetero-oligomeriza-tion and other receptor interactions [21, 22]. Theapplication of new BRET detection systems to high throughput screening (HTS) will most likelyhave a significant impact on future drug discovery.This review covers the description of the differentBRET-based assays including optimization of assayconditions, proper data analysis and screening applications.
2 Description of the BRET technology
2.1 Principle
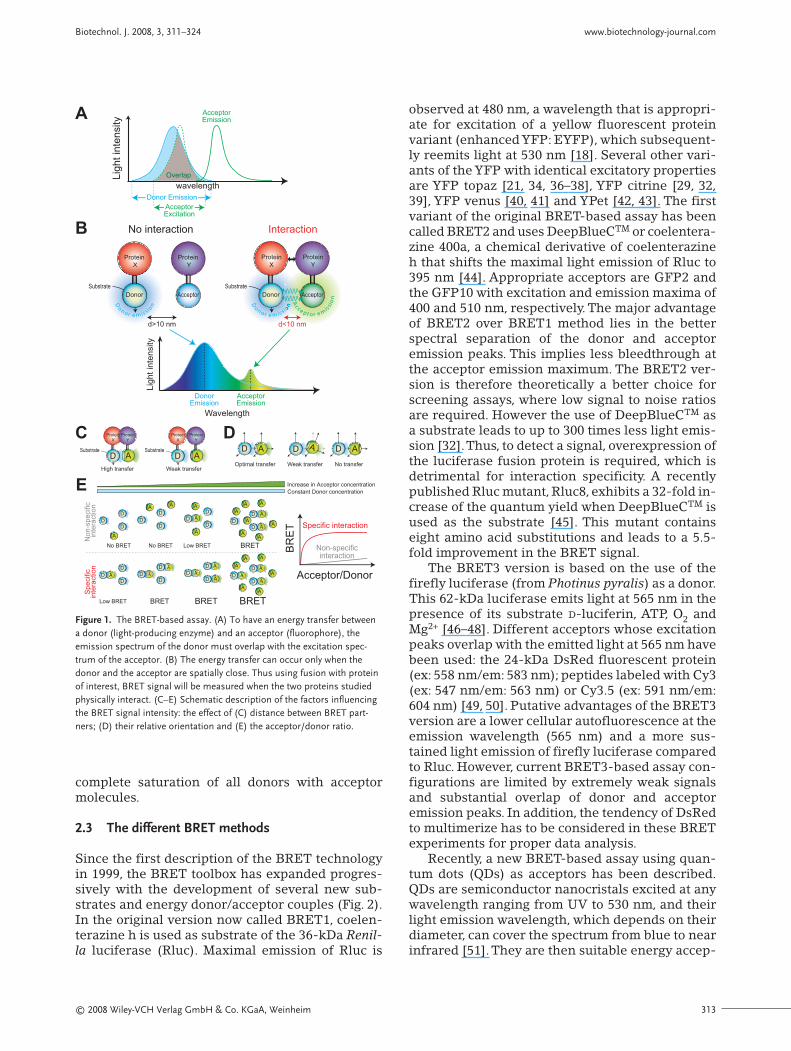
The BRET method is based on the Förster reso-nance energy transfer occurring in some marinespecies (for instance in the sea pansy, Renilla reni-formis) and leading to a non-radiative energytransfer between an energy donor and an energyacceptor. This method was originally developed tostudy the interactions of circadian clock proteins inbacteria [18] and was subsequently applied to liv-ing mammalian cells [21], plant cells [23] and bud-ding yeast [24]. The energy donor is a luciferase,which emits light in the presence of its correspon-ding substrate. The energy acceptor is a fluo-rophore, typically a fluorescent protein, which ab-sorbs light at a given wavelength and reemits lightat a longer wavelength. To fulfill the conditions forenergy transfer, the emission spectrum of thedonor must overlap with the excitation spectrum ofthe acceptor (Fig. 1A) [25–27]. To investigate pro-tein-protein interactions, one protein is fused tothe donor and the other to the acceptor. If the twofusion proteins do not interact, only light emittedfrom the substrate transformation by the energydonor can be monitored (Fig. 1B). If the two fusionproteins interact and the distance between the en-ergy donor and acceptor is less than 10 nm, a reso-nance energy transfer occurs and an additional
light signal corresponding to the acceptor reemis-sion can be detected [18–20]. When the energydonor and acceptor are fused to the same protein,an intramolecular BRET can be monitored in thisdouble-fusion protein [28, 29]. Depending on theposition at which the energy donor and acceptorare fused, structural rearrangements (conforma-tional changes) within the protein of interest canbe measured as changes of the intramolecularBRET signal.
2.2 Parameters influencing the BRET signal
At least three different parameters determine theBRET signal intensity. First is the distance betweenthe donor and acceptor (Fig. 1C), which is inverse-ly proportional to transfer signal intensity: the en-ergy transfer progressively decreases when thedistance between the donor and acceptor increas-es from 1 to 10 nm, the maximal distance forFörster resonance energy transfer [25, 30].
Second is the relative orientation of BRET part-ners due to the dipole-dipole nature of the reso-nance energy transfer mechanism (Fig. 1D) [30,31]. Having said this, it becomes evident that theabsence of BRET signal between two proteins doesnot necessarily mean that these proteins do not in-teract with each other. The strategy often used tocircumvent this specific problem is the variation ofthe energy donor and acceptor insertion site intothe protein of interest.Typically N- and C-terminalfusions are used and various peptide linkers are in-troduced between the donor and acceptor and theprotein of interest. The linker size typically variesbetween 5 and 10 amino acids. Linkers composed ofGGGGS or (GGGGS)×2 residues have been used topromote a turn in the orientation of BRET partnersand to facilitate proper and independent folding ofthe two moieties of the fusion proteins [32].
Third is the acceptor/donor ratio (Fig. 1E). Pro-tein-protein interactions take place in finite spacessuch as cellular organelles, cell membranes, cyto-plasm, or the extracellular space. Of course, twoproteins that do not interact will meet each othermore frequently as their concentrations increase ina given space, and will finally lead to a detectablebut non-specific BRET signal. These signals aregenerally weak but progressively rise with increas-ing acceptor concentrations.This can be illustratedin BRET donor saturation assays, where a fixedamount of luciferase is coexpressed with increas-ing quantities of acceptor-tagged protein [33–36].Whereas nonspecific BRET signals tend to in-crease linearly with increasing acceptor concentra-tions, specific BRET signals augment in a hyper-bolic manner and reach a plateau representing the
© 2008 Wiley-VCH Verlag GmbH & Co. KGaA, Weinheim 313
complete saturation of all donors with acceptormolecules.
2.3 The different BRET methods
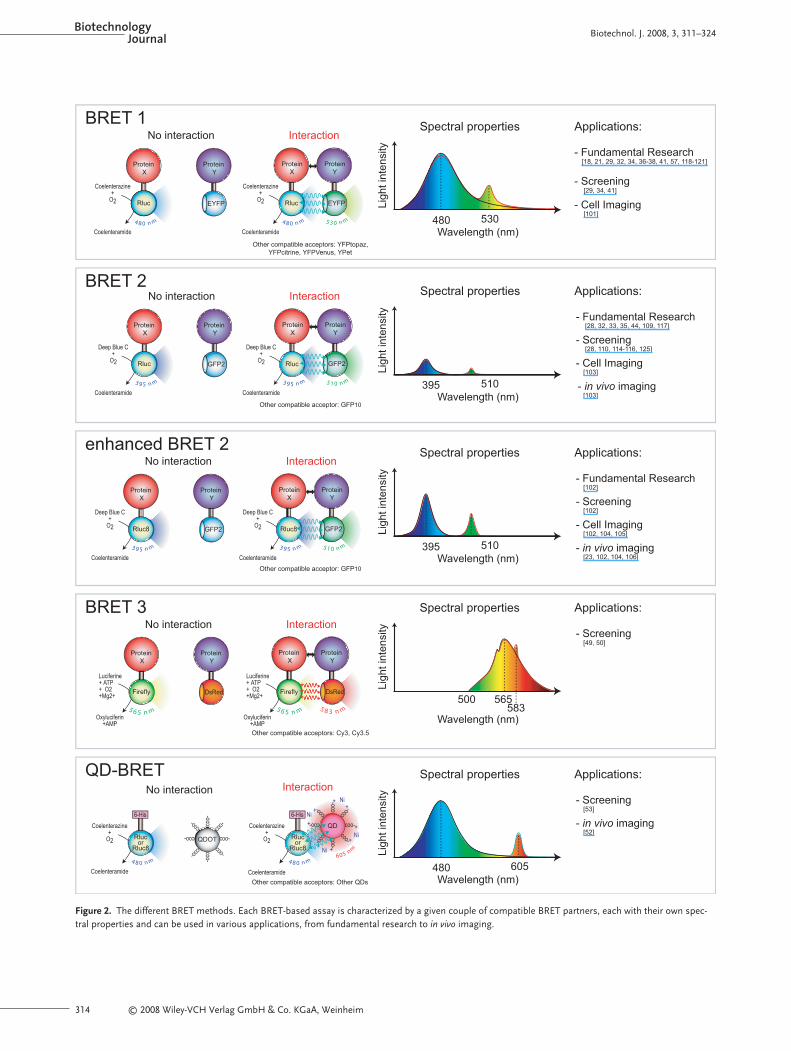
Since the first description of the BRET technologyin 1999, the BRET toolbox has expanded progres-sively with the development of several new sub-strates and energy donor/acceptor couples (Fig. 2).In the original version now called BRET1, coelen-terazine h is used as substrate of the 36-kDa Renil-la luciferase (Rluc). Maximal emission of Rluc is
observed at 480 nm, a wavelength that is appropri-ate for excitation of a yellow fluorescent proteinvariant (enhanced YFP: EYFP), which subsequent-ly reemits light at 530 nm [18]. Several other vari-ants of the YFP with identical excitatory propertiesare YFP topaz [21, 34, 36–38], YFP citrine [29, 32,39], YFP venus [40, 41] and YPet [42, 43]. The firstvariant of the original BRET-based assay has beencalled BRET2 and uses DeepBlueCTM or coelentera-zine 400a, a chemical derivative of coelenterazine h that shifts the maximal light emission of Rluc to395 nm [44]. Appropriate acceptors are GFP2 andthe GFP10 with excitation and emission maxima of400 and 510 nm, respectively. The major advantageof BRET2 over BRET1 method lies in the betterspectral separation of the donor and acceptoremission peaks. This implies less bleedthrough atthe acceptor emission maximum. The BRET2 ver-sion is therefore theoretically a better choice forscreening assays, where low signal to noise ratiosare required. However the use of DeepBlueCTM asa substrate leads to up to 300 times less light emis-sion [32].Thus, to detect a signal, overexpression ofthe luciferase fusion protein is required, which isdetrimental for interaction specificity. A recentlypublished Rluc mutant, Rluc8, exhibits a 32-fold in-crease of the quantum yield when DeepBlueCTM isused as the substrate [45]. This mutant containseight amino acid substitutions and leads to a 5.5-fold improvement in the BRET signal.
The BRET3 version is based on the use of thefirefly luciferase (from Photinus pyralis) as a donor.This 62-kDa luciferase emits light at 565 nm in thepresence of its substrate D-luciferin, ATP, O2 andMg2+ [46–48]. Different acceptors whose excitationpeaks overlap with the emitted light at 565 nm havebeen used: the 24-kDa DsRed fluorescent protein(ex: 558 nm/em: 583 nm); peptides labeled with Cy3(ex: 547 nm/em: 563 nm) or Cy3.5 (ex: 591 nm/em:604 nm) [49, 50]. Putative advantages of the BRET3version are a lower cellular autofluorescence at theemission wavelength (565 nm) and a more sus-tained light emission of firefly luciferase comparedto Rluc. However, current BRET3-based assay con-figurations are limited by extremely weak signalsand substantial overlap of donor and acceptoremission peaks. In addition, the tendency of DsRedto multimerize has to be considered in these BRETexperiments for proper data analysis.
Recently, a new BRET-based assay using quan-tum dots (QDs) as acceptors has been described.QDs are semiconductor nanocristals excited at anywavelength ranging from UV to 530 nm, and theirlight emission wavelength, which depends on theirdiameter, can cover the spectrum from blue to nearinfrared [51].They are then suitable energy accep-
Biotechnol. J. 2008, 3, 311–324 www.biotechnology-journal.com
Substrate
Protein
X
Protein
Y
DSubstrate
Protein
X
Protein
Y
AD
High transfer
A
Weak transfer
C
Optimal transfer
AD
Weak transfer
AD AD
No transfer
D
Constant Donor concentration
Increase in Acceptor concentration
BR
ET
Acceptor/Donor
Specific interaction
Non-specificinteraction
No
n-s
pe
cific
in
tera
ctio
n
DD
D
DD
D
D
D
DA
A
A
A
A
AA
AA A
A
AD AA
No BRET No BRET Low BRET BRET
AD
D
DAD
D
DAD
AAD
A
AAD
A
A
A
A
A
A
A
ASp
ecific
inte
ractio
n
Low BRET BRET BRET BRET
D
D
D
DD
E
B
Protein
Y
Protein
X
No interaction
Acceptor
Substrate
Donor
noissimerono
D
Substrate
Donor
noissimerono
D
Protein
Y
Interaction
Protein
X
Acceptor noissi
merotpeccA
DonorEmission
AcceptorEmission
Wavelength
Lig
ht in
tensity
A
wavelength
Lig
ht in
tensity
AcceptorEmission
Overlap
AcceptorExcitation
Donor Emission
d<10 nmd>10 nm
Figure 1. The BRET-based assay. (A) To have an energy transfer betweena donor (light-producing enzyme) and an acceptor (fluorophore), theemission spectrum of the donor must overlap with the excitation spec-trum of the acceptor. (B) The energy transfer can occur only when thedonor and the acceptor are spatially close. Thus using fusion with proteinof interest, BRET signal will be measured when the two proteins studiedphysically interact. (C–E) Schematic description of the factors influencingthe BRET signal intensity: the effect of (C) distance between BRET part-ners; (D) their relative orientation and (E) the acceptor/donor ratio.
BiotechnologyJournal Biotechnol. J. 2008, 3, 311–324
314 © 2008 Wiley-VCH Verlag GmbH & Co. KGaA, Weinheim
Luciferine+ ATP + O2+Mg2+
Oxyluciferin+AMP
Luciferine+ ATP + O2+Mg2+
Oxyluciferin+AMP
BRET 3
Wavelength (nm)
Lig
ht
inte
nsity
500 565583
Spectral properties
Protein
Y
Protein
X
mn565
Interaction
Protein
Y
Protein
X
mn565
No interaction
Applications:
- Screening [49, 50]
Firefly Firefly
mn385
DsRedDsRed
Other compatible acceptors: Cy3, Cy3.5
GFP2
Deep Blue C+
O2
Coelenteramide
Deep Blue C+
O2
Coelenteramide
Rluc
BRET 2
Protein
Y
Protein
X
No interaction
mn593 mn593
Protein
Y
Interaction
Protein
X
mn015 395 510
Wavelength (nm)
Lig
ht
inte
nsity
Spectral properties Applications:
- Fundamental Research [28, 32, 33, 35, 44, 109, 117]
- Screening [28, 110, 114-116, 125]
- Cell Imaging [103]
- in vivo imaging [103]
Rluc GFP2
Other compatible acceptor: GFP10
enhanced BRET 2
Protein
Y
Protein
X
No interaction
Deep Blue C+
O2
Coelenteramide
mn593 395 510
Wavelength (nm)
Lig
ht
inte
nsity
Spectral propertiesInteraction
mn593
Deep Blue C+
O2
Coelenteramide
Protein
Y
Protein
X
mn015
Applications:
- Fundamental Research [102]
- Screening [102]
- Cell Imaging [102, 104, 105]
- in vivo imaging [23, 102, 104, 106]
Rluc8 2PFG8culR GFP2
Other compatible acceptor: GFP10
EYFP EYFP
BRET 1
Protein
Y
Protein
X
No interaction
Coelenterazine+
O2
Coelenteramide
Rluc
mn084
Coelenterazine+
O2
Coelenteramide
Protein
Y
Interaction
Protein
X
mn035mn084 480 530
Wavelength (nm)
Lig
ht
inte
nsity
Spectral properties Applications:
- Fundamental Research [18, 21, 29, 32, 34, 36-38, 41, 57, 118-121]
- Screening [29, 34, 41]
- Cell Imaging [101]
Rluc
Other compatible acceptors: YFPtopaz,
YFPcitrine, YFPVenus, YPet
Coelenterazine+
O2
Coelenteramide
Coelenterazine+
O2
Coelenteramide
QD-BRET
480 605
Wavelength (nm)
Lig
ht
inte
nsity
Spectral properties
No interaction
Rlucor
Rluc8
mn084
6-His
QDOT coo-
coo-
coo-coo-
coo-
coo-
coo-
coo-
Interaction
Rlucor
Rluc8
mn084
6-His
mn506Ni
+
+
QD coo-
coo-
coo-coo-
coo-
coo-
coo-
coo-
Ni+
+ Ni+
+
Ni
+
+
Applications:
- Screening [53]
- in vivo imaging [52]
Other compatible acceptors: Other QDs
Figure 2. The different BRET methods. Each BRET-based assay is characterized by a given couple of compatible BRET partners, each with their own spec-tral properties and can be used in various applications, from fundamental research to in vivo imaging.

© 2008 Wiley-VCH Verlag GmbH & Co. KGaA, Weinheim 315
Biotechnol. J. 2008, 3, 311–324 www.biotechnology-journal.com
Box 1: BRET protocol
Cells are transfected with a constant amount of cDNAcoding for the BRET donor fusion protein to obtain a lu-minescence signal that is higher than the threshold ofthe BRET reader but not too high to avoid problems dueto protein overexpression. Some of the cells are trans-fected with the donor alone and the remainder withdonor and increasing quantities of the BRET acceptor fu-sion protein to determine the characteristic “plateau” ofBRET donor saturation. After 24–48 h, the BRET signalcan be measured in adherent cells, cell suspensions,subcellular fractions, purified proteins, or also in culturemedium for secreted proteins. For adherent cells or se-creted proteins, colored additives such as phenol redshould be avoided. To perform BRET-based experimentswith cell suspensions, cells are detached with standardtechniques from six-well plates and rinsed first in 1 mlcomplete medium and then in 1 ml PBS 1X. Cells arethen resuspended in 400 μL PBS 1X and kept on ice un-til use. For subcellular fractions or purified proteins, thecompatibility of the buffer conditions required to main-tain full activity of the protein of interest with luciferaseactivity must be checked.
The BRET signal is meas-ured using a BRET reader ca-pable of measuring light emit-ted at donor and acceptorwavelengths in a quasi-simul-taneous manner. Two kinds ofapparatuses are available:those using a filter wheel con-taining the specific emissionfilters or those containing twophotomultipliers devoted tothe detection at each wave-length (using filters or beamsplitter). White plates are usedto read the BRET signals toavoid light absorption. The bio-logical material (40 μL) is thendispatched into a 96-well plateand 10 μL substrate is added(5 μM final concentration forcoelenterazin h). BRET signalsare measured immediately af-ter substrate addition and re-peated several times (usually4–6) to cover a time windowof approximately 15 min. TheBRET ratio is given by dividingthe light signal recorded at theacceptor wavelength by thedonor signal. To correct for
background signal due to the overlap of donor emissionat the acceptor wavelength, the BRET ratio is always de-termined in parallel for cells expressing the donor alone.The BRET value is calculated by subtracting this BRETbackground ratio from the BRET ratio obtained in cellscoexpressing the two BRET partners. Results can be ex-pressed in milliBRET (mB) by multiplying by 1000. Theamount of donor can be estimated from the maximal lu-ciferase activity measured when performing the BRETreading. The amount of acceptor has to be determined inan independent reading by exciting all donor moleculesin a fluorometer (preferentially using a black microplateto avoid light scattering). The calculated acceptor/donorratio can be used to compare different experiments. Toobtain acceptor/donor ratios that correspond to real pro-tein quantities, luciferase and fluorescence values haveto be converted into protein amounts using independ-ently established standard curves correlating these twoexperimental parameters with real protein quantities(e.g., determined in radioligand binding experimentswith fusion proteins).
Donor and Acceptor co-expressed
Donoremission
Acceptoremission
Lig
ht
inte
nsity
Donor expressed alone
Donoremission
Acceptoremission
Lig
ht
inte
nsity
Bret ratio= light emitted at donor λ
light emitted at acceptor λBackgroung Bret ratio=
light emitted at donor λlight emitted at acceptor λ
BRET (mB) = (Bret ratio - Background Bret ratio) X 1000
BRET calculation
BRET readers
shuttlingfilter wheel
(wheel turn)light emitted at acceptor λ
light emitted at donor λ
PMT1
light emittedat donor λ
light emittedat acceptor λ
PMT1 PMT2

BiotechnologyJournal Biotechnol. J. 2008, 3, 311–324
316 © 2008 Wiley-VCH Verlag GmbH & Co. KGaA, Weinheim
tors for BRET1- and BRET2-based assays as theirbroad interval of excitation wavelengths overlapsthe currently used luciferase emitted light. So far,QDs have only been used in BRET1-based assays,where QDs, directly linked to Rluc, were injectedinto mice and energy transfer monitored in thepresence of coelenterazine h [52]. The major limi-tations of QDs are their large size, ranging from 1.5to 6 nm, and the fact that QD-protein fusions can-not be genetically coded and thus cannot be pro-duced in living cells. However, in vitro labeling hasbeen performed using a self-assembling QDsnanosensor composed of Rluc8 linked to a 6×Histag that associated with QDs presenting carboxylgroups on their surface (QD-COOH). In the pres-ence of Ni2+ cations, QD-COO– are covered by nick-el ions and bind the 6×His tag [53]. The major ad-vantage of this promising new BRET version is theclear separation of donor and acceptor emissionpeaks, i.e., a property that is highly desirable for invitro screening assays, thereby avoiding donorbleedthrough.
Luciferases from marine organisms other thanRenilla reniformis have been cloned and applied toBRET-based assays. The 19.9-kDa Gaussia lu-ciferase shares the 480-nm emission peak withRluc but is slightly smaller [54–56]. The 62-kDaVargula luciferase is bigger and emits light at460 nm [57]. Further studies are needed to evaluatethe full potential of these luciferases in the BRET-based assay.
Several coelenterazine derivatives have beendeveloped with brighter (ViviRenTM) or extended(EnduRenTM) light emission [58, 59]. Stable lightemission for longer durations may be an advantagein large scale screening programs. However, theamplitude of luminescence signal generated by En-duRenTM is much smaller compared to coelenter-azine h.
3 Considerations for setting up aBRET-based assay
3.1 Methods used in screening assays
In response to the productivity crisis faced by thepharmaceutical industry, several new technologieshave been developed and applied to drug screen-ing assays. To increase throughput, special atten-tion has been given to miniaturization of samplevolumes and easy and fast readouts [60–63]. Meth-ods meeting these criteria have benefited fromprogress made in the fields of robotics, control soft-ware, liquid handling devices, sensitive detectors,and data processing. These improvements allow
specific activation of receptors and signaling path-ways as well as protein-protein interactions to bemonitored. Non-homogenous enzyme linked im-munosorbent assay (ELISA) or radioactive label-ing-based assays have been widely used in HTS tomonitor kinase activity [64–66] or search for recep-tors [67–71]. Reporter gene assays have been usedto monitor receptor activation [72–75]. An obviouslimitation of these assays is the lack of specificitydue to crosstalk between different pathways. Directmonitoring of second messenger accumulationsuch as cyclic AMP, calcium ions, and inositol phos-phates have somewhat limited these problems[76–80].
To easily monitor specific events in cells, recenthomogeneous and HTS-compliant methods havebeen developed. The surface plasmon resonance(SPR) is a method enabling the monitoring of mol-ecule binding to a specified target [81, 82]. Thismethod has been used in almost all areas of drugdiscovery and diagnostics [82–84].
The MAPPIT assay is an evolution of the yeasttwo-hybrid system that allows monitoring of pro-tein interactions in mammalian cells using an arti-ficially engineered STAT3-activating receptor andthe corresponding reporter gene [5, 85–88]. Theproblems of the reporter gene assays are circum-vented by the overexpression of the engineered re-ceptor generating a high signal to noise ratio. Thistechnology has been modified to enable the detec-tion of interaction disruptants (Reverse MAPPIT)[6, 7].
Amongst suitable HTS-compliant methods, flu-orescence polarization, and energy transfer-basedmethods are promising tools for drug screening be-cause they are fast and sensitive. Fluorescence po-larization is based on the change of the polarizationproperties of a fluorescently labeled molecule rap-idly rotating in solution compared to its proteinbound form with a slower rotation rate [10–13].
The energy transfer methods include HTRF,FRET and BRET. HTRF is a combination of time re-solved fluorescence and FRET, which circumventsthe problem of cell autofluorescence due to thelong-lived emission of the donor (europiumcryptate) enabling the detection of the acceptoremission (XL665) once the excitatory light hasbeen turned off [89–92]. Whereas this method hasbeen developed and used for drug screening as-says, it is limited by the need to label proteinschemically with energy donors and acceptors [89,93–99].
In contrast, FRET and BRET methods general-ly rely on genetically engineered fusion proteins.The advantage of these methods relies on the pos-sibility to monitor protein-protein interactions in

© 2008 Wiley-VCH Verlag GmbH & Co. KGaA, Weinheim 317
Biotechnol. J. 2008, 3, 311–324 www.biotechnology-journal.com
Box 2: Setting up a BRET-based assay
To set up a BRET-based assay, the first step is to con-struct fusion proteins of the BRET acceptor and donorwith the protein(s) of interest to perform preliminaryBRET-based experiments. If no energy transfer is ob-served, the distance between BRET partners may begreater than 10 nm or their respective orientation maynot be appropriate. Several tips can help to solve theproblem like switching between donor and acceptor,changing the peptidic linker between each fusion pro-tein, or changing the extremity used for the fusion (N- orC-terminal end). If a BRET signal is observed, the propercellular localization and function of the fusion proteinshave to be verified. If the functional validation step is suc-cessful, the BRET signal can be studied further to checkfor its specificity. The inclusion of a negative control iscrucial to determine the specificity of the interaction. Foreach BRET assay, the most adequate control protein hasto be chosen. Negative control proteins should have asimilar protein topology and subcellular localization tothe protein of interest. Nonspecific interactions shouldlead to marginal or weak BRET signals that increase lin-early in BRET donor saturation experiments as comparedto hyperbolic BRET donor saturation curves observed for
specific interactions. Further proof for the specificity maybe obtained if the interaction is ligand dependent or if theconstitutive interaction is modulated by ligands. Ligandbinding may induce conformational changes or de-crease/increase the amount of interacting BRET part-ners. Co-expression of BRET partners with untagged pro-teins can be used to further validate the specificity ofBRET signals (BRET competition assays). Whereas theuntagged protein of interest is expected to compete withthe BRET partners (decrease of BRET signal), non-rele-vant control proteins expressed in the same subcellularcompartment are expected to be inactive.
After its successful validation, the BRET-based assaycan be used for screening purposes. Different screeningformats are possible: (i) Search for receptor ligands thateither stimulate or inhibit the basal or ligand-inducedBRET signal; (ii) search for protease inhibitors, using aBRET sensor containing the protease targeting peptidebetween the BRET donor and acceptor in a direct fusion-protein; (iii) search for inhibitors of protein-protein in-teractions. For each assay format adequate controls andoptimization steps have to be performed.
Construction of fusion proteins
Preliminary BRET experiments
Validation of fusion proteins- Proper cellular localization
- Functional assay if available
Enzymatic activity
Ligand binding to receptors
Signaling pathway activation
No BRETsignal
Optimization of fusion proteins - Switch between donor and acceptor
- N- or C-ter fusion switch (soluble proteins)
- Linker change (nature / length)
BRET signal
Screening process
Biological material(BRET partners)
Loading on 96-well plate
containing the compounds
BRET Substrate
Immediate BRET reading
Incubation time
Search for protease inhibitors
BR
ET
Protease+ Compounds
Basal
Threshold- +
Protease
**
*
Search for ligands of receptors
BR
ET
Compounds
Basal
Maximum
Threshold
- +
*
*
**
Ligand
Activators/Inhibitors of BRET
Activators/Inhibitors of stimulated BRET
BR
ET
Compounds+ Ligand
Basal
MaximumThreshold
- +
*
Ligand
*
Search for disruptants of interaction
BR
ET
+ Compounds
No interaction
InteractionThreshold
- +
*
Interaction
*
Expected resultsValidated Proteins
Specificity check
BR
ET
Acceptor/Donor
Specific interaction
Non-specific interaction(negative control)
Donor Saturation Assay
BR
ET
Acceptor/Donor
Basal
BRET changeupon
stimulation
+?-?
BR
ET
[untagged partner]
Competition assay
Specific BRET
* *

BiotechnologyJournal Biotechnol. J. 2008, 3, 311–324
318 © 2008 Wiley-VCH Verlag GmbH & Co. KGaA, Weinheim
an intact cellular environment and thus representsa good choice for high throughput drug screeningassays in living cells.
3.2 Advantage of BRET over FRET technologyin screening assays
FRET has been extensively used to study proteininteraction dynamics at the subcellular level butalso in drug screening assays [14–17]. However,FRET-based assays present some disadvantagescompared to BRET-based assays in screeningprocess. The use of an external light source to ex-cite the energy donor can directly induce acceptoremission, cell autofluorescence and photobleach-ing of donor and acceptor. Due to the low light emit-ted by the luciferase, these problems do not exist inBRET-based assays. Furthermore, FRET-based ex-periments require higher protein expression levelsraising concerns about the specificity of the inter-actions. BRET-based methods have been shown tobe ten times more sensitive [100] enabling the useof endogenous receptor expression levels [34, 38].Recent improvement of luciferases and fluorescentproteins [45, 101, 102] and new CCD cameras [23,103–105] have led to encouraging progress in mon-itoring protein-protein interactions in single cells,tissues and whole animals [102, 104, 106, 107].
3.3 Which BRET version to choose?
To choose the appropriate BRET version (Fig. 2),the first step is to carefully define the question re-lated to the protein-protein interaction of interestthat you want to answer using a BRET-based assay(for reviews see [20, 108–110]).The BRET1 versionis generally used when protein expression at phys-iological levels is important. This assay has beensuccessfully applied for screening purposes.BRET2 is theoretically the most appropriatemethod for screening assays (low background andseparation of donor and acceptor emission peaks).However, due to the low signal amplitudes meas-ured in this assay, its robustness in a high through-put setting has still to be demonstrated.The BRET3version does not yet belong to the establishedBRET-based assays. Further improvements arenecessary as detailed above.The recently describedQD-BRET assay is characterized by interestingfeatures that warrant further attention in the futurefor screening applications where in vitro labeling ofproteins is not a disadvantage.
3.4 Specific considerations for the development ofBRET-based compound screening assays
When setting up a validated BRET-based assay forcompound screening, the following issues shouldbe considered: (i) to minimize variability of thedata, the screening experiments should be per-formed on the same batch of biological material(living cells, subcellular fractions or purified mate-rial). The use of stable cell lines expressing accep-tor and donor at an optimal ratio is recommendedto obtain robust and reproducible BRET signals; (ii)the BRET signal must be well calibrated using abackground control (donor expressed alone), anegative control (donor and acceptor without lig-and) and a positive control (donor and acceptor inthe presence of a ligand already known to promotea BRET signal change) for the screening assay; (iii)all molecules that interfere with the absorptionproperties of the BRET-based assay buffer (i.e.,phenol red supplemented medium, fluorescent orcolored compounds) can give rise to false positiveor false negative hits; (iv) molecules binding to theenergy donor or acceptor or to the linker region be-tween the protein of interest and the BRET fusionprotein might modulate the BRET and thus gener-ate false-positive hits; (v) as for most screening as-says, positive hits have to be further characterizedwith other functional methods specific for eachprotein.
3.5 What kind of drug candidate can be identifiedby BRET-based assays?
Different bioactive compounds can be identifiedusing BRET-based screening methods: (i) BRET-based assays can be used to search for ligands ofgiven receptors whose activation can be monitoredby BRET. The BRET partner pair used in these as-says can be receptor homo- or heterodimers. Thiskind of assay, as a maximal BRET signal would beexpected to gain high signal/noise ratio, would bebest suited for use in experimental conditionswhere a saturation of the donor by the acceptor oc-curs (plateau of the hyperbolic curve in the BRETsaturation assay). The same BRET-based assayshould also be used when modulators of the ligand-promoted BRET signals are tested. In this casemeasurements should be performed at donor satu-ration and at a 1/1 ratio to cover the whole spec-trum of possible ligands. (ii) BRET-based assayscan be used to monitor protease activity by placingthe donor and acceptor between a protease target-ing sequence. BRET signals are high in the absenceof protease and low in presence of the protease.Compounds that inhibit the protease activity are

© 2008 Wiley-VCH Verlag GmbH & Co. KGaA, Weinheim 319
then expected to stabilize the BRET signal even inthe presence of the protease. The acceptor/donorratio is 1 for such as biosensor but its concentrationmust be carefully calibrated in comparison to theamount of protease, to obtain an optimal dynamicrange. (iii) BRET-based assays can also be used toidentify PPII. In this case, the acceptor/donor ratiomust be chosen properly. Saturation of the donor byacceptors will lead to no or a weak decrease in theBRET signal as free acceptor would titrate the com-pounds tested. A 1/1 ratio or a ratio close to theplateau, is recommended to obtain a maximalBRET signal that can still be easily inhibited.
4 Examples of BRET-based screening assays
The BRET technology was first devoted to decipherfundamental questions like monitoring protein-protein interactions in living cells, studying recep-tor homo- and heterodimerization, activation andsignaling pathways [106, 111]. The use of pharma-cologically relevant membrane receptors belong-ing to the GPCR and tyrosine kinase receptor fam-ilies in many of these studies triggered the idea ofapplying these assays to drug screening [112]. Thevery first assays were designed to identify receptoragonists or antagonists. Most of them rely on thedetection of the consequences of GPCR activationby monitoring the conformational change of the re-ceptor dimer [21, 38, 110, 113]. Other BRET-basedassays monitor common GPCR-promoted down-stream signaling events. Beta-arrestin recruitmentcan be monitored by its direct interaction with re-ceptors [41, 44, 114–116], its intramolecular confor-mational change upon recruitment to the receptors[28], and its ubiquitinylation [117]. More recentlyCAMYEL (cAMP sensor using YFP-Epac-RLuc), aquantitative cAMP BRET-based sensor assay ableto monitor the modulation of cAMP levels in cells,has also been developed and used to follow Gs ac-tivation by GPCRs [29]. Among these assays, thosebased on the beta-arrestin recruitment (usingBRET1 or 2 version) have been successfully ap-plied to HTS. The feasibility has been tested intransiently transfected cells and stable cell lines toincrease the reproducibility of assay conditions.They have been used either to characterize phar-macological properties of compounds targeting thevasopressin 2 receptor (V2R) [44], or in HTS tosearch for ligands of neuropeptide Y type 2 recep-tors (NPY2-R) and the poorly characterizedTG1019-R [116], or inhibitors of agonist-promotedbeta-arrestin 2 recruitment to C-C chemokine re-ceptor type 5 (CCR5) [41].
Further BRET-based assays monitoring the ac-tivation state of receptors have been developed forinsulin (IR) and IGF1 receptor (IGF1R) homo- andheterodimers [118–121], leptin receptor (OB-R)[34, 122], EGFR [123, 124] and GHR [124]. BRET1-based assays for IR and IGFR have notably permit-ted the study of the pharmacological properties ofligands on homo- and heterodimers of these re-ceptors. The BRET1-based assay monitoring theOB-R activation state has also been successfullyused to screen for compounds that modulate theleptin-promoted BRET signal or that induce a BRETsignal on their own (Cy.C., unpublished data).
In addition, two BRET2-based protease sensorshave been developed to find new HIV-1 proteaseinhibitors [125] and to monitor the processing of atarget peptide of proprotein convertase 1/3 [57].However, these assays have not been used in HTSso far.
A QD-BRET-based assay has been recently de-veloped to monitor MMP2 protease activity [53]and its excellent signal to noise ratio should enableits successful application to HTS.
Although BRET-based assays appear to havegreat potential for the screening of PPII, only fewrecent studies have been published in this field. ABRET-based assay has been developed to detecttoxin-antitoxin interactions in living E. coli thatcould be used for PPII identification in HTS, lead-ing to new potential antimicrobial agents [126]. Inanother study, the potency of each single trans-membrane segment of the seven transmembraneGPCR secretin receptor has been tested for its abil-ity to inhibit receptor dimerization [127].
5 Concluding remarks
Currently, progressive improvements and diversifi-cation of the BRET-based assay place this tech-nology among the most powerful methods for thestudy of protein-protein interactions in vitro and inliving cells. New perspectives of this methodologyinclude the monitoring of interactions at the sub-cellular level and in vivo imaging in living animals.The improvements primarily focused on the in-crease of the quantum yield of the donor, and bet-ter separation of donor and acceptor emissionpeaks. Most of these new methods have alreadybeen applied to screening assays. A number of lu-ciferases from other marine organisms have beencloned and should also be used in BRET-based as-says: the 23.8-kDa Metridia longa secreted lu-ciferase (em: 480 nm) [128], the 19-kDa Oplophorusgracilirostris luciferase (em: 480 nm) [129], and thePleuromamma luciferase. Finally, red-shifted mu-
Biotechnol. J. 2008, 3, 311–324 www.biotechnology-journal.com

BiotechnologyJournal Biotechnol. J. 2008, 3, 311–324
320 © 2008 Wiley-VCH Verlag GmbH & Co. KGaA, Weinheim
tants of Rluc (475 nm to 547 nm) open further per-spectives [130]. Additional diversification of BRETacceptors generated by somatic, random or target-ed mutagenesis of known fluorescent proteins canalso be expected in the future [39, 40, 131–135].
Recent advances have led to the discovery ofPPII and other classes of drug candidates. Usingsingle or combined approaches from genetic- orphage display-based methods [136] to in silicoanalysis [137, 138], various peptides (linear orcyclic) were found to block protein-protein inter-action in a specific manner. In addition to peptides,the list of small molecule protein-protein interac-tion inhibitors (SMPPIIs) is rapidly growing (re-viewed in [3]) and may represent very promisingdrug candidates, such as Nutlins, SMPPIIs of p53-MDM2 interaction [139, 140]. The availability ofhighly diverse libraries of chemical compoundscombined with powerful high throughput methodsto detect protein-protein interactions should en-able the discovery of new promising therapeutics.As discussed in this review, BRET-based methodsshould find successful applications throughout thedrug discovery process, including target identifica-tion and validation, small molecule screening andefficacy studies in animal models.
Members of our laboratories are acknowledged forfruitful discussions. We thank also J. Kerr-Conte, P.Colas and L. Meijer for critical reading of the manu-script, and Berthold France for support. This workwas supported by grants from the “Conseil Régionaldu Nord Pas de Calais”, the “Conseil Régional de Bre-tagne”,“Association pour la Recherche contre le Can-cer” (ARC N°3889 and 3970), the “Fondation pour laRecherche Médicale” (“Equipe FRM”), the Institut deRecherches SERVIER, and the Fédération pour laRecherche sur le Cerveau / FRC Neurodon.
The authors have declared no conflict of interest.
6 References
[1] Bach, S., Knockaert, M., Reinhardt, J., Lozach, O. et al.,Roscovitine targets, protein kinases and pyridoxal kinase. J.Biol. Chem. 2005, 280, 31208–31219.
[2] Baines, I. C., Colas, P., Peptide aptamers as guides for small-molecule drug discovery. Drug Discov. Today 2006, 11,334–341.
[3] Pagliaro, L., Felding, J., Audouze, K., Nielsen, S. J. et al.,Emerging classes of protein-protein interaction inhibitorsand new tools for their development. Curr. Opin. Chem. Biol.2004, 8, 442–449.
[4] Fields, S., Song, O.,A novel genetic system to detect protein-protein interactions. Nature 1989, 340, 245–246.
[5] Eyckerman, S., Verhee, A., der Heyden, J. V., Lemmens, I. etal., Design and application of a cytokine-receptor-based in-teraction trap. Nat. Cell Biol. 2001, 3, 1114–1119.
[6] Lemmens, I., Lievens, S., Eyckerman, S., Tavernier, J., Re-verse MAPPIT detects disruptors of protein-protein inter-actions in human cells. Nat. Protoc. 2006, 1, 92–97.
[7] Eyckerman, S., Lemmens, I., Catteeuw, D., Verhee, A. et al.,Reverse MAPPIT: Screening for protein-protein interactionmodifiers in mammalian cells. Nat. Methods 2005, 2,427–433.
[8] Eyckerman, S., Lemmens, I., Lievens, S., Van der Heyden, J.et al., Design and use of a mammalian protein-protein in-teraction trap (MAPPIT). Sci. STKE 2002, 2002, PL18.
[9] Tavernier, J., Eyckerman, S., Lemmens, I.,Van der Heyden, J.et al., MAPPIT: A cytokine receptor-based two-hybridmethod in mammalian cells. Clin. Exp. Allergy 2002, 32,1397–1404.
[10] Burke, T. J., Loniello, K. R., Beebe, J. A., Ervin, K. M., Devel-opment and application of fluorescence polarization assaysin drug discovery. Comb. Chem. High Throughput Screen.2003, 6, 183–194.
[11] Kakehi, K., Oda, Y., Kinoshita, M., Fluorescence polariza-tion: Analysis of carbohydrate-protein interaction. Anal.Biochem. 2001, 297, 111–116.
[12] Owicki, J. C., Fluorescence polarization and anisotropy inhigh throughput screening: Perspectives and primer. J. Bio-mol. Screen. 2000, 5, 297–306.
[13] Sportsman, J. R., Daijo, J., Gaudet, E. A., Fluorescence polar-ization assays in signal transduction discovery. Comb. Chem.High Throughput Screen. 2003, 6, 195–200.
[14] Ni, Q., Titov, D. V., Zhang, J., Analyzing protein kinase dy-namics in living cells with FRET reporters. Methods 2006,40, 279–286.
[15] Szollosi, J., Damjanovich, S., Matyus, L., Application of fluo-rescence resonance energy transfer in the clinical laborato-ry: Routine and research. Cytometry 1998, 34, 159–179.
[16] Tan, P. K., Wang, J., Littler, P. L., Wong, K. K. et al., Monitor-ing interactions between receptor tyrosine kinases andtheir downstream effector proteins in living cells using Bi-oluminescence Resonance Energy Transfer (BRET). Mol.Pharmacol. 2007.
Cyril Couturier is Assistant Professor at
the medical faculty of the Lille 2 Univer-
sity, Lille, France, since 2006. He re-
ceived his PhD in Cellular and Molecu-
lar Physiopathology from the University
of Paris VI in 2000, on the regulation of
genes expression. From 2000 to 2004
he performed postdoctoral researches
at the Cochin Institute of Paris, France,
in the team of Dr. R. Jockers. He
worked on the development of a newly described technology: the Bio-
luminescence Resonance Energy transfer (BRET) to study the leptin-
receptor activation. Since 2004 he joined the P. Froguel’s lab in Lille,
to focus on deciphering obesity and diabetes molecular mechanisms
and the development of BRET-based assays for drugs discovery in this
field. He has several international publications and two patents in the
field of BRET and obesity. His main areas of expertise are protein-
protein interaction, BRET, drug screening, leptin receptor and obesity.

© 2008 Wiley-VCH Verlag GmbH & Co. KGaA, Weinheim 321
[17] Gonzalez, J. E., Maher, M. P., Cellular fluorescent indicatorsand voltage/ion probe reader (VIPR) tools for ion channeland receptor drug discovery. Receptors channels 2002, 8,283–295.
[18] Xu, Y., Piston, D. W., Johnson, C. H., A bioluminescence res-onance energy transfer (BRET) system: Application to in-teracting circadian clock proteins. Proc. Natl. Acad. Sci. USA1999, 96, 151–156.
[19] Boute, N., Jockers, R., Issad,T.,The use of resonance energytransfer in high-throughput screening: BRET versus FRET.Trends Pharmacol. Sci. 2002, 23, 351–354.
[20] Pfleger, K. D., Eidne, K. A., Illuminating insights into pro-tein-protein interactions using bioluminescence resonanceenergy transfer (BRET). Nat. Methods 2006, 3, 165–174.
[21] Angers, S., Salahpour, A., Joly, E., Hilairet, S. et al., Detectionof beta 2-adrenergic receptor dimerization in living cellsusing bioluminescence resonance energy transfer (BRET).Proc. Natl. Acad. Sci. USA 2000, 97, 3684–3689.
[22] Ramsay, D., Kellett, E., McVey, M., Rees, S., Milligan, G.,Homo- and hetero-oligomeric interactions between G-pro-tein-coupled receptors in living cells monitored by two vari-ants of bioluminescence resonance energy transfer(BRET): Hetero-oligomers between receptor subtypes formmore efficiently than between less closely related se-quences. Biochem. J. 2002, 365, 429–440.
[23] Subramanian, C., Xu, Y., Johnson, C. H., von Arnim, A. G., Invivo detection of protein-protein interaction in plant cellsusing BRET. Methods Mol. Biol. 2004, 284, 271–286.
[24] Gehret, A. U., Bajaj, A., Naider, F., Dumont, M. E., Oligomer-ization of the yeast alpha-factor receptor: Implications fordominant negative effects of mutant receptors. J. Biol. Chem.2006, 281, 20698–20714.
[25] Wu, P., Brand, L., Resonance energy transfer: Methods andapplications. Anal. Biochem. 1994, 218, 1–13.
[26] Haugland, R. P.,Yguerabide, J., Stryer, L., Dependence of thekinetics of singlet-singlet energy transfer on spectral over-lap. Proc. Natl. Acad. Sci. USA 1969, 63, 23–30.
[27] Keller, R. C., Silvius, J. R., De Kruijff, B., Characterization ofthe resonance energy transfer couple coumarin-BODIPYand its possible applications in protein-lipid research.Biochem. Biophys. Res. Commun. 1995, 207, 508–514.
[28] Charest, P. G., Terrillon, S., Bouvier, M., Monitoring agonist-promoted conformational changes of beta-arrestin in livingcells by intramolecular BRET. EMBO Rep. 2005, 6, 334–340.
[29] Jiang, L. I., Collins, J., Davis, R., Lin, K. M. et al., Use of acAMP BRET sensor to characterize a novel regulation ofcAMP by the sphingosine 1-phosphate/G13 pathway. J. Biol.Chem. 2007, 282, 10576–10584.
[30] Kasprzak, A. A., The use of FRET in the analysis of motorprotein structure. Methods Mol. Biol. 2007, 392, 183–197.
[31] Clegg, R. M., Murchie, A. I., Zechel, A., Lilley, D. M., Observ-ing the helical geometry of double-stranded DNA in solu-tion by fluorescence resonance energy transfer. Proc. Natl.Acad. Sci. USA 1993, 90, 2994–2998.
[32] Hamdan, F., Percherancier, Y., Breton, B., Bouvier, M., Mon-itoring protein-protein interactions in living cells by biolu-minescence resonance energy transfer (BRET), CurrentProtocols in Neuroscience, 2006, Suppl. 34 5.23.1–20.
[33] Mercier, J. F., Salahpour, A., Angers, S., Breit, A., Bouvier, M.,Quantitative assessment of beta 1- and beta 2-adrenergicreceptor homo- and heterodimerization by biolumines-cence resonance energy transfer. J. Biol. Chem. 2002, 277,44925–44931.
[34] Couturier, C., Jockers, R.,Activation of the leptin receptor bya ligand-induced conformational change of constitutive re-ceptor dimers. J. Biol. Chem. 2003, 278, 26604–26611.
[35] Ramsay, D., Carr, I. C., Pediani, J., Lopez-Gimenez, J. F. et al.,High-affinity interactions between human alpha1A-adrenoceptor C-terminal splice variants produce homo-and heterodimers but do not generate the alpha1L-adreno-ceptor. Mol. Pharmacol. 2004, 66, 228–239.
[36] Ayoub, M. A., Levoye, A., Delagrange, P., Jockers, R., Prefer-ential formation of MT1/MT2 melatonin receptor het-erodimers with distinct ligand interaction properties com-pared with MT2 homodimers. Mol. Pharmacol. 2004, 66,312–321.
[37] Angers, S., Salahpour, A., Bouvier, M., Biochemical and bio-physical demonstration of GPCR oligomerization in mam-malian cells. Life Sci. 2001, 68, 2243–2250.
[38] Ayoub, M. A., Couturier, C., Lucas-Meunier, E., Angers, S. etal., Monitoring of ligand-independent dimerization and lig-and-induced conformational changes of melatonin recep-tors in living cells by bioluminescence resonance energytransfer. J. Biol. Chem. 2002, 277, 21522–21528.
[39] Griesbeck, O., Baird, G. S., Campbell, R. E., Zacharias, D. A.,Tsien, R. Y., Reducing the environmental sensitivity of yel-low fluorescent protein. Mechanism and applications. J.Biol. Chem. 2001, 276, 29188–29194.
[40] Nagai, T., Ibata, K., Park, E. S., Kubota, M. et al., A variant ofyellow fluorescent protein with fast and efficient matura-tion for cell-biological applications. Nat. Biotechnol. 2002,20, 87–90.
[41] Hamdan, F. F.,Audet, M., Garneau, P., Pelletier, J., Bouvier, M.,High-throughput screening of G protein-coupled receptorantagonists using a bioluminescence resonance energytransfer 1-based beta-arrestin2 recruitment assay. J. Bio-mol. Screen. 2005, 10, 463–475.
[42] Nguyen,A.W., Daugherty, P. S., Evolutionary optimization offluorescent proteins for intracellular FRET. Nat. Biotechnol.2005, 23, 355–360.
[43] You, X., Nguyen, A. W., Jabaiah, A., Sheff, M. A. et al., Intra-cellular protein interaction mapping with FRET hybrids.Proc. Natl. Acad. Sci. USA 2006, 103, 18458–18463.
[44] Bertrand, L., Parent, S., Caron, M., Legault, M. et al., TheBRET2/arrestin assay in stable recombinant cells: A plat-form to screen for compounds that interact with G protein-coupled receptors (GPCRS). J. Recept. Signal Transduct. Res.2002, 22, 533–541.
[45] Loening, A. M., Fenn, T. D., Wu, A. M., Gambhir, S. S., Con-sensus guided mutagenesis of Renilla luciferase yields en-hanced stability and light output. Protein Eng. Des. Sel. 2006,19, 391–400.
[46] Fujii, H., Noda, K.,Asami,Y., Kuroda,A. et al., Increase in bi-oluminescence intensity of firefly luciferase using geneticmodification. Anal. Biochem. 2007, 366, 131–136.
[47] Kricka, L. J., Leach, F. R., In memoriam Dr Marlene DeLuca.1987 O. M. Smith Lecture. Firefly luciferase: Mechanism ofaction, cloning and expression of the active enzyme. J. Bio-lumin. Chemilumin. 1989, 3, 1–5.
[48] DeLuca, M., McElroy, W. D., Two kinetically distinguishableATP sites in firefly luciferase. Biochem. Biophys. Res. Com-mun. 1984, 123, 764–770.
[49] Arai, R., Nakagawa, H., Kitayama, A., Ueda, H., Nagamune,T., Detection of protein-protein interaction by biolumines-cence resonance energy transfer from firefly luciferase tored fluorescent protein. J. Biosci. Bioeng. 2002, 94, 362–364.
Biotechnol. J. 2008, 3, 311–324 www.biotechnology-journal.com

BiotechnologyJournal Biotechnol. J. 2008, 3, 311–324
322 © 2008 Wiley-VCH Verlag GmbH & Co. KGaA, Weinheim
[50] Yamakawa, Y., Ueda, H., Kitayama, A., Nagamune, T., Rapidhomogeneous immunoassay of peptides based on biolumi-nescence resonance energy transfer from firefly luciferase.J. Biosci. Bioeng. 2002, 93, 537–542.
[51] Chan, W. C., Maxwell, D. J., Gao, X., Bailey, R. E. et al., Lumi-nescent quantum dots for multiplexed biological detectionand imaging. Curr. Opin. Biotechnol. 2002, 13, 40–46.
[52] So, M. K., Xu, C., Loening, A. M., Gambhir, S. S., Rao, J., Self-illuminating quantum dot conjugates for in vivo imaging.Nat. Biotechnol. 2006, 24, 339–343.
[53] Yao, H., Zhang,Y., Xiao, F., Xia, Z., Rao, J., Quantum dot/bio-luminescence resonance energy transfer based highly sen-sitive detection of proteases. Angew. Chem. Int. Ed. Engl.2007, 46, 4346–4349.
[54] Tannous, B. A., Kim, D. E., Fernandez, J. L., Weissleder, R.,Breakefield, X. O., Codon-optimized Gaussia luciferasecDNA for mammalian gene expression in culture and invivo. Mol. Ther. 2005, 11, 435–443.
[55] Verhaegent, M., Christopoulos, T. K., Recombinant Gaussialuciferase. Overexpression, purification, and analytical ap-plication of a bioluminescent reporter for DNA hybridiza-tion. Anal. Chem. 2002, 74, 4378–4385.
[56] Remy, I., Michnick, S. W., A highly sensitive protein-proteininteraction assay based on Gaussia luciferase. Nat. Methods2006, 3, 977–979.
[57] Otsuji,T., Okuda-Ashitaka, E., Kojima, S., Akiyama, H. et al.,Monitoring for dynamic biological processing by intramol-ecular bioluminescence resonance energy transfer systemusing secreted luciferase. Anal. Biochem. 2004, 329, 230–237.
[58] Otto-Duessel, M., Khankaldyyan, V., Gonzalez-Gomez, I.,Jensen, M. C. et al., In vivo testing of Renilla luciferase sub-strate analogs in an orthotopic murine model of humanglioblastoma. Mol. Imaging 2006, 5, 57–64.
[59] Pfleger, K. D., Dromey, J. R., Dalrymple, M. B., Lim, E. M. etal., Extended bioluminescence resonance energy transfer(eBRET) for monitoring prolonged protein-protein interac-tions in live cells. Cell. Signal. 2006, 18, 1664–1670.
[60] Minor, L. K., Assays to measure the activation of membranetyrosine kinase receptors: Focus on cellular methods. Curr.Opin. Drug Discov. Dev. 2003, 6, 760–765.
[61] Levoye, A., Jockers, R., Alternative drug discovery ap-proaches for orphan GPCRs. Drug Discov. Today 2008, 13,52–58.
[62] Walters, W. P., Namchuk, M., Designing screens: How tomake your hits a hit. Nat. Rev. Drug Discov. 2003, 2, 259–266.
[63] The state of GPCR research in 2004. Nat. Rev. Drug Discov.2004, 3, 575, 577–626.
[64] Farley, K., Mett, H., McGlynn, E., Murray, B., Lydon, N. B., De-velopment of solid-phase enzyme-linked immunosorbentassays for the determination of epidermal growth factor re-ceptor and pp60c-src tyrosine protein kinase activity. Anal.Biochem. 1992, 203, 151–157.
[65] Sizemore, N., Dudeck, R. C., Barksdale, C. M., Nordblom, G.D. et al., Development and validation of two solid-phase en-zyme immunoassays (ELISA) for quantitation of humanepidermal growth factors (hEGFs). Pharm. Res. 1996, 13,1088–1094.
[66] Yu, J. S., Chang, S. H., Chan, W. H., Chen, H. C., Enzyme-linked immunosorbent assay for the determination of p21-activated kinase activity. J. Biochem. (Tokyo) 2001, 129,243–251.
[67] Fraschini, F., Stankov, B., High affinity melatonin receptorsin the vertebrate brain: Implications for the control of the
endogenous oscillatory systems. Chronobiologia 1994, 21,89–92.
[68] Olsen, R. W., The GABA postsynaptic membrane receptor-ionophore complex. Site of action of convulsant and anti-convulsant drugs. Mol. Cell. Biochem. 1981, 39, 261–279.
[69] Djurup, R., Adrenoceptors: Molecular nature and role inatopic diseases. Allergy 1981, 36, 289–307.
[70] Rousseau, G. G., Baxter, J. D., Glucocorticoid receptors.Monogr. Endocrinol. 1979, 12, 49–77.
[71] Aurbach, G. D., Spiegel, A. M., Gardner, J. D., Beta-adrener-gic receptors, cyclic AMP, and ion transport in the avian ery-throcyte. Adv. Cyclic Nucleotide Res. 1975, 5, 117–132.
[72] Christin-Maitre, S., Vasseur, C., Fauser, B., Bouchard, P.,Bioassays of gonadotropins. Methods 2000, 21, 51–57.
[73] Kotarsky, K., Nilsson, N. E., Olde, B., Owman, C., Progress inmethodology. Improved reporter gene assays used to iden-tify ligands acting on orphan seven-transmembrane recep-tors. Pharmacol. Toxicol. 2003, 93, 249–258.
[74] Silverman, L., Campbell, R., Broach, J. R., New assay tech-nologies for high-throughput screening. Curr. Opin. Chem.Biol. 1998, 2, 397–403.
[75] Roda, A., Pasini, P., Guardigli, M., Baraldini, M. et al., Bio-and chemiluminescence in bioanalysis. Fresenius J. Anal.Chem. 2000, 366, 752–759.
[76] Howard,A. D., McAllister, G., Feighner, S. D., Liu, Q. et al., Or-phan G-protein-coupled receptors and natural ligand dis-covery. Trends Pharmacol. Sci. 2001, 22, 132–140.
[77] Gabriel, D., Vernier, M., Pfeifer, M. J., Dasen, B. et al., Highthroughput screening technologies for direct cyclic AMPmeasurement. Assay Drug Dev. Technol. 2003, 1, 291–303.
[78] Civelli, O., GPCR deorphanizations: The novel, the knownand the unexpected transmitters. Trends Pharmacol. Sci.2005, 26, 15–19.
[79] Jasoni, C. L., Todman, M. G., Strumia, M. M., Herbison, A. E.,Cell type-specific expression of a genetically encoded calci-um indicator reveals intrinsic calcium oscillations in adultgonadotropin-releasing hormone neurons. J. Neurosci.2007, 27, 860–867.
[80] Eglen, R. M., Bosse, R., Reisine, T., Emerging concepts ofguanine nucleotide-binding protein-coupled receptor(GPCR) function and implications for high throughputscreening. Assay Drug Dev. Technol. 2007, 5, 425–451.
[81] Gambari, R., Biospecific interaction analysis:A tool for drugdiscovery and development. Am. J. Pharmacogenomics 2001,1, 119–135.
[82] Cooper, M. A., Label-free screening of bio-molecular inter-actions. Anal. Bioanal. Chem. 2003, 377, 834–842.
[83] Haughey, S. A., Baxter, G. A., Biosensor screening for veteri-nary drug residues in foodstuffs. J. AOAC Int. 2006, 89,862–867.
[84] Lee, H. J.,Yan,Y., Marriott, G., Corn, R. M., Quantitative func-tional analysis of protein complexes on surfaces. J. Physiol.2005, 563, 61–71.
[85] Lievens, S., Van der Heyden, J., Vertenten, E., Plum, J. et al.,Design of a fluorescence-activated cell sorting-based mam-malian protein-protein interaction trap. Methods Mol. Biol.2004, 263, 293–310.
[86] Montoye, T., Piessevaux, J., Lavens, D., Wauman, J. et al.,Analysis of leptin signalling in hematopoietic cells using anadapted MAPPIT strategy. FEBS Lett. 2006, 580, 3301–3307.
[87] Ulrichts, P., Peelman, F., Beyaert, R., Tavernier, J., MAPPITanalysis of TLR adaptor complexes. FEBS Lett. 2007, 581,629–636.

© 2008 Wiley-VCH Verlag GmbH & Co. KGaA, Weinheim 323
[88] Uyttendaele, I., Lemmens, I.,Verhee,A., De Smet,A. S. et al.,Mammalian protein-protein interaction trap (MAPPIT)analysis of STAT5, CIS, and SOCS2 interactions with thegrowth hormone receptor. Mol. Endocrinol. 2007, 21,2821–2831.
[89] Zhou, G., Cummings, R., Hermes, J., Moller, D. E., Use of ho-mogeneous time-resolved fluorescence energy transfer inthe measurement of nuclear receptor activation. Methods2001, 25, 54–61.
[90] Alpha-Bazin, B., Bazin, H., Boissy, L., Mathis, G., Europiumcryptate-tethered ribonucleotide for the labeling of RNAand its detection by time-resolved amplification ofcryptate emission. Anal. Biochem. 2000, 286, 17–25.
[91] Cummings, R. T., McGovern, H. M., Zheng, S., Park, Y. W.,Hermes, J. D., Use of a phosphotyrosine-antibody pair as ageneral detection method in homogeneous time-resolvedfluorescence: Application to human immunodeficiency vi-ral protease. Anal. Biochem. 1999, 269, 79–93.
[92] Park,Y.W., Cummings, R.T.,Wu, L., Zheng, S. et al., Homo-geneous proximity tyrosine kinase assays: Scintillationproximity assay versus homogeneous time-resolved fluo-rescence. Anal. Biochem. 1999, 269, 94–104.
[93] Albizu, L., Teppaz, G., Seyer, R., Bazin, H. et al., Toward ef-ficient drug screening by homogeneous assays based onthe development of new fluorescent vasopressin and oxy-tocin receptor ligands. J. Med. Chem. 2007, 50, 4976–4985.
[94] Enomoto, K., Nagasaki,T.,Yamauchi,A., Onoda, J. et al., De-velopment of high-throughput spermidine synthase activ-ity assay using homogeneous time-resolved fluorescence.Anal. Biochem. 2006, 351, 229–240.
[95] Jia, Y., Quinn, C. M., Gagnon, A. I., Talanian, R., Homoge-neous time-resolved fluorescence and its applications forkinase assays in drug discovery. Anal. Biochem. 2006, 356,273–281.
[96] Kane, S. A., Fleener, C. A., Zhang,Y. S., Davis, L. J. et al., De-velopment of a binding assay for p53/HDM2 by using ho-mogeneous time-resolved fluorescence. Anal. Biochem.2000, 278, 29–38.
[97] Leblanc,V., Delaunay,V., Claude Lelong, J., Gas, F. et al., Ho-mogeneous time-resolved fluorescence assay for identify-ing p53 interactions with its protein partners, directly in acellular extract. Anal. Biochem. 2002, 308, 247–254.
[98] Preaudat, M., Ouled-Diaf, J., Alpha-Bazin, B., Mathis, G. etal., A homogeneous caspase-3 activity assay using HTRFtechnology. J. Biomol. Screen. 2002, 7, 267–274.
[99] Whitfield, J., Harada, K., Bardelle, C., Staddon, J. M., High-throughput methods to detect dimerization of Bcl-2 fami-ly proteins. Anal. Biochem. 2003, 322, 170–178.
[100] Arai, R., Nakagawa, H., Tsumoto, K., Mahoney, W. et al.,Demonstration of a homogeneous noncompetitive im-munoassay based on bioluminescence resonance energytransfer. Anal. Biochem. 2001, 289, 77–81.
[101] Hoshino, H., Nakajima, Y., Ohmiya, Y., Luciferase-YFP fu-sion tag with enhanced emission for single-cell lumines-cence imaging. Nat. Methods 2007, 4, 637–639.
[102] De, A., Loening, A. M., Gambhir, S. S., An improved biolu-minescence resonance energy transfer strategy for imag-ing intracellular events in single cells and living subjects.Cancer Res. 2007, 67, 7175–7183.
[103] De,A., Gambhir, S. S., Noninvasive imaging of protein-pro-tein interactions from live cells and living subjects usingbioluminescence resonance energy transfer. FASEB J.2005, 19, 2017–2019.
[104] Xu, X., Soutto, M., Xie, Q., Servick, S. et al., Imaging proteininteractions with bioluminescence resonance energytransfer (BRET) in plant and mammalian cells and tissues.Proc. Natl. Acad. Sci. USA 2007, 104, 10264–10269.
[105] Coulon,V.,Audet, M., Homburger,V., Bockaert, J. et al., Sub-cellular imaging of dynamic protein interactions by biolu-minescence resonance energy transfer. Biophys. J. 2007.
[106] Massoud,T. F., Paulmurugan, R., De, A., Ray, P., Gambhir, S.S., Reporter gene imaging of protein-protein interactionsin living subjects. Curr. Opin. Biotechnol. 2007, 18, 31–37.
[107] Huang, Q., Acha, V., Yow, R., Schneider, E. et al., Biolumi-nescence measurements in mice using a skin window. J.Biomed. Opt. 2007, 12, 054012.
[108] Milligan, G., Applications of bioluminescence- and fluo-rescence resonance energy transfer to drug discovery at Gprotein-coupled receptors. Eur. J. Pharm. Sci. 2004, 21,397–405.
[109] Pfleger, K. D., Eidne, K.A., Monitoring the formation of dy-namic G-protein-coupled receptor-protein complexes inliving cells. Biochem. J. 2005, 385, 625–637.
[110] Pfleger, K. D., Dalrymple, M. B., Dromey, J. R., Eidne, K. A.,Monitoring interactions between G-protein-coupled re-ceptors and beta-arrestins. Biochem. Soc. Trans. 2007, 35,764–766.
[111] Issad, T., Jockers, R., Bioluminescence resonance energytransfer to monitor protein-protein interactions. MethodsMol. Biol. 2006, 332, 195–209.
[112] Roda,A., Guardigli, M., Pasini, P., Mirasoli, M., Biolumines-cence and chemiluminescence in drug screening. Anal.Bioanal. Chem. 2003, 377, 826–833.
[113] Jensen, A. A., Hansen, J. L., Sheikh, S. P., Brauner-Osborne,H., Probing intermolecular protein-protein interactions inthe calcium-sensing receptor homodimer using biolumi-nescence resonance energy transfer (BRET). Eur. J.Biochem. 2002, 269, 5076–5087.
[114] Heding, A., Use of the BRET 7TM receptor/beta-arrestinassay in drug discovery and screening. Expert Rev. Mol. Di-agn. 2004, 4, 403–411.
[115] Elster, L., Elling, C., Heding, A., Bioluminescence reso-nance energy transfer as a screening assay: Focus on par-tial and inverse agonism. J. Biomol. Screen. 2007, 12, 41–49.
[116] Vrecl, M., Jorgensen, R., Pogacnik,A., Heding,A., Develop-ment of a BRET2 screening assay using beta-arrestin 2mutants. J. Biomol. Screen. 2004, 9, 322–333.
[117] Perroy, J., Pontier, S., Charest, P. G., Aubry, M., Bouvier, M.,Real-time monitoring of ubiquitination in living cells byBRET. Nat. Methods 2004, 1, 203–208.
[118] Boute, N., Pernet, K., Issad, T., Monitoring the activationstate of the insulin receptor using bioluminescence reso-nance energy transfer. Mol. Pharmacol. 2001, 60, 640–645.
[119] Laursen, L. S., Oxvig, C., Real-time measurement in livingcells of insulin-like growth factor activity using biolumi-nescence resonance energy transfer. Biochem. Pharmacol.2005, 69, 1723–1732.
[120] Blanquart, C., Gonzalez-Yanes, C., Issad,T., Monitoring theactivation state of insulin/insulin-like growth factor-1 hy-brid receptors using bioluminescence resonance energytransfer. Mol. Pharmacol. 2006, 70, 1802–1811.
[121] Issad,T., Blanquart, C., Gonzalez-Yanes, C.,The use of bio-luminescence resonance energy transfer for the study oftherapeutic targets: Application to tyrosine kinase recep-tors. Expert Opin. Ther. Targets 2007, 11, 541–556.
Biotechnol. J. 2008, 3, 311–324 www.biotechnology-journal.com

BiotechnologyJournal Biotechnol. J. 2008, 3, 311–324
324 © 2008 Wiley-VCH Verlag GmbH & Co. KGaA, Weinheim
[122] Peelman, F., Couturier, C., Dam, J., Zabeau, L. et al., Tech-niques: New pharmacological perspectives for the leptinreceptor. Trends Pharmacol. Sci. 2006, 27, 218–225.
[123] Schiffer, H. H., Reding, E. C., Fuhs, S. R., Lu, Q. et al., Phar-macology and signaling properties of epidermal growthfactor receptor isoforms studied by bioluminescence reso-nance energy transfer. Mol. Pharmacol. 2007, 71, 508–518.
[124] Brown, R. J.,Adams, J. J., Pelekanos, R.A.,Wan,Y. et al., Mod-el for growth hormone receptor activation based on sub-unit rotation within a receptor dimer. Nat. Struct. Mol. Biol.2005, 12, 814–821.
[125] Hu, K., Clement, J. F., Abrahamyan, L., Strebel, K. et al., Ahuman immunodeficiency virus type 1 protease biosensorassay using bioluminescence resonance energy transfer. J.Virol. Methods 2005, 128, 93–103.
[126] Nieto, C., Pellicer, T., Balsa, D., Christensen, S. K. et al., Thechromosomal relBE2 toxin-antitoxin locus of Streptococ-cus pneumoniae: Characterization and use of a biolumi-nescence resonance energy transfer assay to detect toxin-antitoxin interaction. Mol. Microbiol. 2006, 59, 1280–1296.
[127] Harikumar, K. G., Pinon, D. I., Miller, L. J., Transmembranesegment four contributes a functionally important inter-face for oligomerization of the class II G protein-coupledsecretin receptor. J. Biol. Chem. 2007, 282, 30363–30372.
[128] Markova, S.V., Golz, S., Frank, L.A., Kalthof, B.,Vysotski, E.S., Cloning and expression of cDNA for a luciferase fromthe marine copepod Metridia longa. A novel secreted bio-luminescent reporter enzyme. J. Biol. Chem. 2004, 279,3212–3217.
[129] Inouye, S.,Watanabe, K., Nakamura, H., Shimomura, O., Se-cretional luciferase of the luminous shrimp Oplophorusgracilirostris: cDNA cloning of a novel imidazopyrazinoneluciferase(1). FEBS Lett. 2000, 481, 19–25.
[130] Loening, A. M., Wu, A. M., Gambhir, S. S., Red-shifted Re-nilla reniformis luciferase variants for imaging in livingsubjects. Nat. Methods 2007, 4, 641–643.
[131] Wang, L.,Tsien, R.Y., Evolving proteins in mammalian cellsusing somatic hypermutation. Nat. Protoc. 2006, 1,1346–1350.
[132] Muller-Taubenberger,A.,Anderson, K. I., Recent advancesusing green and red fluorescent protein variants. Appl. Mi-crobiol. Biotechnol. 2007, 77, 1–12.
[133] Wang, L., Jackson, W. C., Steinbach, P. A., Tsien, R. Y., Evo-lution of new nonantibody proteins via iterative somatichypermutation. Proc. Natl. Acad. Sci. USA 2004, 101,16745–16749.
[134] Shaner, N. C., Campbell, R. E., Steinbach, P. A., Giepmans,B. N. et al., Improved monomeric red, orange and yellowfluorescent proteins derived from Discosoma sp. red fluo-rescent protein. Nat. Biotechnol. 2004, 22, 1567–1572.
[135] Shaner, N. C., Steinbach, P.A.,Tsien, R.Y.,A guide to choos-ing fluorescent proteins. Nat. Methods 2005, 2, 905–909.
[136] Pero, S. C., Oligino, L., Daly, R. J., Soden, A. L. et al., Identi-fication of novel non-phosphorylated ligands, which bindselectively to the SH2 domain of Grb7. J. Biol. Chem. 2002,277, 11918–11926.
[137] Meslet-Cladiere, L., Norais, C., Kuhn, J., Briffotaux, J. et al.,A novel proteomic approach identifies new interactionpartners for proliferating cell nuclear antigen. J. Mol. Biol.2007, 372, 1137–1148.
[138] Goncalves, V., Gautier, B., Coric, P., Bouaziz, S. et al., Ratio-nal design, structure, and biological evaluation of cyclicpeptides mimicking the vascular endothelial growth factor.J. Med. Chem. 2007, 50, 5135–5146.
[139] Tovar, C., Rosinski, J., Filipovic, Z., Higgins, B. et al., Small-molecule MDM2 antagonists reveal aberrant p53 signalingin cancer: Implications for therapy. Proc. Natl. Acad. Sci.USA 2006, 103, 1888–1893.
[140] Dey, A., Wong, E. T., Bist, P., Tergaonkar,V., Lane, D. P., Nut-lin-3 inhibits the NFkappaB pathway in a p53-dependentmanner: Implications in lung cancer therapy. Cell Cycle2007, 6, 2178–2185.
Copyright © 2022 FDOKUMEN