screening of gandhaga sarkkarai
105
STANDARDIZATION AND PHARMACOLOGICAL SCREENING OF GANDHAGA SARKKARAI The dissertation Submitted by Dr. G.ARUNKUMAR Under the Guidance of Dr. S.VISWESWARAN, M.D(S)., H.O.D i/c & Guide , Department of Gunapadam, National Institute of Siddha, Ch-47. Dissertation submitted to THE TAMILNADU Dr. M.G.R. MEDICAL UNIVERSITY CHENNAI-600032 In partial fulfillment of the requirements For the award of the degree of DOCTOR OF MEDICINE (SIDDHA) BRANCH-II-GUNAPADAM 2015-2018 NATIONAL INSTITUTE OF SIDDHA (The Ministry of AYUSH- Govt of India) Chennai – 47.
-
Upload
khangminh22 -
Category
Documents
-
view
3 -
download
0
Transcript of screening of gandhaga sarkkarai
STANDARDIZATION AND PHARMACOLOGICAL SCREENING OF GANDHAGA SARKKARAI
The dissertation Submitted by
Dr. G.ARUNKUMAR
Under the Guidance of Dr. S.VISWESWARAN, M.D(S).,
H.O.D i/c & Guide , Department of Gunapadam, National Institute of Siddha, Ch-47.
Dissertation submitted to
THE TAMILNADU Dr. M.G.R. MEDICAL UNIVERSITY
CHENNAI-600032
In partial fulfillment of the requirements For the award of the degree of DOCTOR OF MEDICINE (SIDDHA) BRANCH-II-GUNAPADAM
2015-2018
NATIONAL INSTITUTE OF SIDDHA (The Ministry of AYUSH- Govt of India)
Chennai – 47.
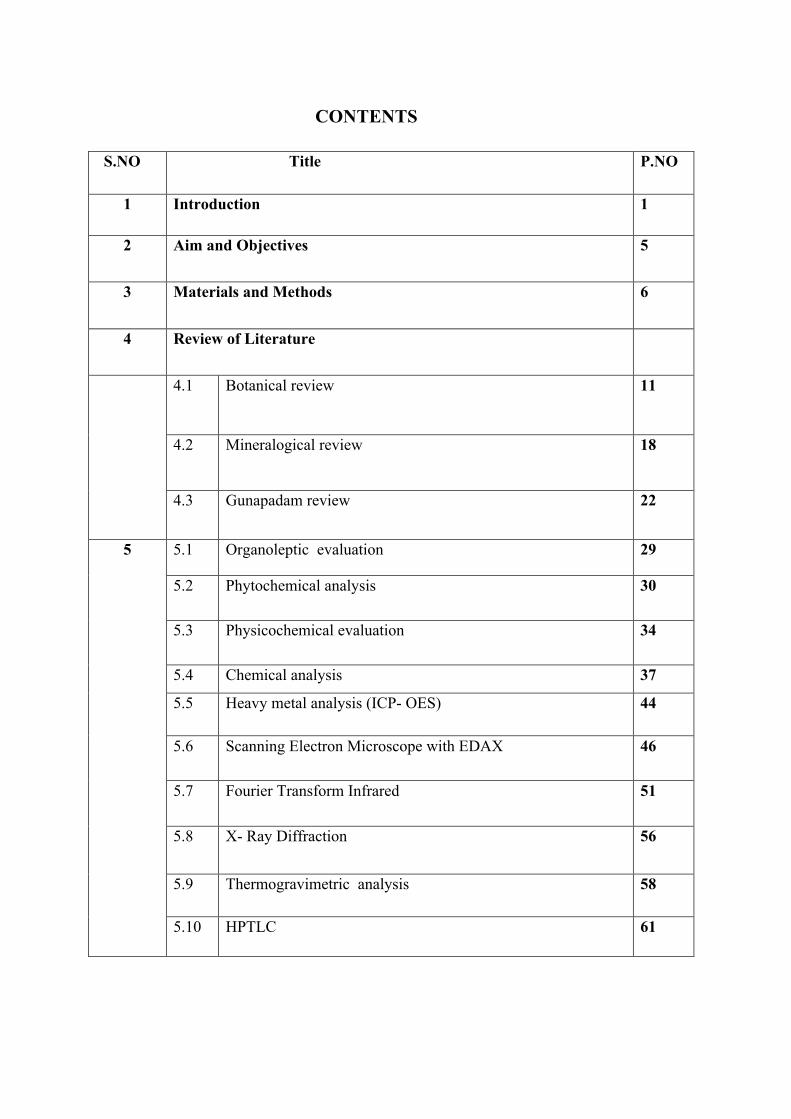
CONTENTS
S.NO Title P.NO
1 Introduction 1
2 Aim and Objectives 5
3 Materials and Methods 6
4 Review of Literature
4.1 Botanical review
11
4.2 Mineralogical review
18
4.3 Gunapadam review 22
5 5.1 Organoleptic evaluation 29
5.2 Phytochemical analysis 30
5.3 Physicochemical evaluation 34
5.4 Chemical analysis 37
5.5 Heavy metal analysis (ICP- OES) 44
5.6 Scanning Electron Microscope with EDAX 46
5.7 Fourier Transform Infrared 51
5.8 X- Ray Diffraction 56
5.9 Thermogravimetric analysis 58
5.10 HPTLC 61
6 Pharmacological studies
6.1 Anti-histamine activity 63
6.2 Anti- inflammatory activity 65
6.3 Analgesic activity 67
7 Results 70
8 Discussion 93
9 Summary 96
10 Conclusion 97
11 Bibiliography 98
12 Annexure
Acknowledgement
v This dissertation is one of the milestones in the journey of my professional carrier as it is
the key program in acquiring my MD(S) degree. Thus I came across this task which kept
on completed with the support and encouragement of numerous people. So I take great
pleasure in thanking all the people who made this dissertation study a valuable and
successful one, which I owe to treasure it.
v I feel enormous wonder and colossal gratitude in my heart of hearts to GOD and
SIDDHARS, Almighty for making this dissertation have its present form.
v I express my sincere thanks to the Vice-Chancellor, The Tamilnadu Dr.M.G.R medical
University, chennai-32 , for granting permission to carried out my dissertation research
project.
v I express my profound sense of gratitude to Prof. Dr.V.Banumathi M.D(s), Director,
National Institute of Siddha, Chennai-47, for granting permission to carried out the
dissertation work and utilizing the available facilities in our Institute .
v I express my sincere thanks and deep regards to my guide to Dr.S.Visweswaran M.D(s),
HOD(i/c), Department of Gunapadam, National Institute of Siddha, Tambaram sanatorium
Chennai-47, for his valuable suggestions ,hopeful support and guidance throughout in this
course of my dissertation work.
v I express my sincere thanks to Dr.S.Sivakkumar M.D(s), Ph.D., Lecturer, Department of
Gunapadam, NIS, chennai-47 for his valuable suggestions, hopeful support and constant
encouragement and guidance in this dissertation.
v I express my sincere thanks to Dr.A.Mariappan M.D(s), Lecturer, Department, of
Gunapadam NIS,Chennai-47, for his suggestions, hopeful support and encouragement of
my whole study.
v I express my sincere thanks to Dr.V.Suba M.Pharm, Ph.D., Assistant Professor in
Pharmacology, NIS, Chennai-47, for her suggestions in the pharmacological study.
v I express my sincere thanks to Dr.N.Gayathri MVSC, Veterinary consultant, Laboratory
Animal House, NIS, Chennai-47, for her guidence in the animal handling & toxicity study.
v I express my sincere thanks to Chairman and Members of Institutional Animal Ethical
Committee (IAEC), National Institute of Siddha, Chennai-47, for their valuable guidance.
v I express my sincere thanks to Dr.D.Aravind M.D(s), M.Sc., Assistant Professor,
Medicinal Botany, NIS, chennai-47, for identification and authentification of herbs .
v I express my sincere thanks to Dr.M.Suresh Gandhi, Department of Geology, University
of Madras, Chennai, for identification and authentification of mineral drug Sulphur.
v I express my sincere thanks to Mr.M.Subramanian M.Sc., (statistics) Senior Research
Officer, National Institute of Siddha, Chennai-47.
v I express my thanks to Dr.V. Muthuvel, MSC., Ph.D., National Institute of Siddha,
Chennai-47, for his guidance and support in Biochemical analysis.
v I express my gratefulness to All My Colleagues, My seniors and My juniors for lending
their helping hands whenever needed during the course of the study.
v I express my thanks to each and every faculties of NIS, Library staffs and Lab staffs.
v Last but not least, I would like to pay high regards to all my family members, my Father
Mr.D.Govindaraj and my Mother Mrs.G.Shanthi for their sincere encouragement and
inspiration throughout my research work and lifting me uphill this phase of life. I owe
everything to them. Besides this, several people have knowingly and unknowingly helped
me in the successful completion of this project.
1
1.Introduction
The basic purpose of any science is to bring solutions to human problems . All
sciences since even the most ancient times as a tradition , have been developed to freeing the
human race from Obstacles. Obstacles such as disease ; discomfort of inhospitable
environments , drastic weather conditions and other conditions .
According to the ancient picture , Science dealt with crucial and fundamental human
problems – the prevention of death , the extension of lifespan , and above all, the spiritual
advancement of humanity.
The Siddha system of medicine, one of the ancient system speaks a numerous
remedies solving basic human problems using everything available in the world for that
purpose – every plant , animal or mineral or metal. The medicinal knowledge remains un-
supposed in the entire world. Based on this vision the compassionate Siddha revealed arts and
sciences of Yoga , medicine , astrology ,occultism , astronomy , vaastu saastra , Alchemy .
The Siddha Tradition , identified with the tamil speaking land , remains a mystery to
practitioners of other native medicinal system of India; not to speak of those involved in the
study of traditional systems of medicine.
The term ‘Siddha’ comes from the word “Chit” meaning ‘consciousness that
illumines’.So the correct way of saying Siddhar is Chittar the one who abides as
consciousness .Any system of tradition is more of an evaluation rather than an overnight
invention.
“That which cures physical ailments is medicine
That which cures physcological ailments is medicine
That which prevents ailments is medicine
That which bestows immortatality is medicine”.
Siddhar Thirumoolar .
The Traditional Tamil Siddha System has existed from time immemorial , even before
written history . It is very difficulty to say exactly when it originated . Evidently, it confines
2
the system to that area only for instance , Siddha traditional system of medicine, we covers
and consider expansive possibilities , several diseases and ailments generated from many
varying climatic condition and changes .
Siddha system of medicine is a science which treats body and mind. Life style
advocacies, selection of functional foods and person oriented treatment regimen are the
uniqueness of Siddha system of medicine.
Siddha system of medicine is an integrated part of Indian system, which is a very
potent and unique system in existence and practiced in India for thousands of years and
above. It is an earliest medical science that stress on positive health, a harmonious blending
of physical, mental, social, moral and spiritual welfare of individuals. The Siddha system has
developed a rich treasure of medicinal knowledge that includes the use of herbs, metals and
minerals. It is a traditional system of medicine which is gradually evolved along with the
Dravidian’s culture and hence this system is also known as Dravidian system of medicine.
Siddha system also deals with the concept of salvation in life. The aim of Siddha medicine is
to make the body perfect, imperishable and to promote longevity.
Siddha system of medicine is considered the oldest documented medicine system of
the world. It evolved in south India and the knowledge of siddha medicine was completely
flourished in the period of Indus Valley Civilization.
The exponents of Siddha system of medicine are called Siddhars. They are the super
human beings with high culture and intellectual abilities. It is considered that Siddha
medicine was created by Lord Siva and he is the first Siddhar. There were 18 important
Siddhars in olden days and they developed this system of medicine. Hence, it is called Siddha
medicine. Siddhars were spiritual adepts who possessed the Ashta siddhis or the eight
supernatural powers. They practiced intense yogic practices, including years of periodic
fasting and meditation and were believed to have achieved supernatural powers and gained
the supreme wisdom and overall immortality. Through this spiritually attained supreme
knowledge, they wrote scriptures on all aspects of life, from arts to science and truth of life to
miracle cure for diseases.
Food habits and daily activities of an individual play a major role in causing disease.
The physical functions of the body is mediated and maintained by three vital forces. They are
3
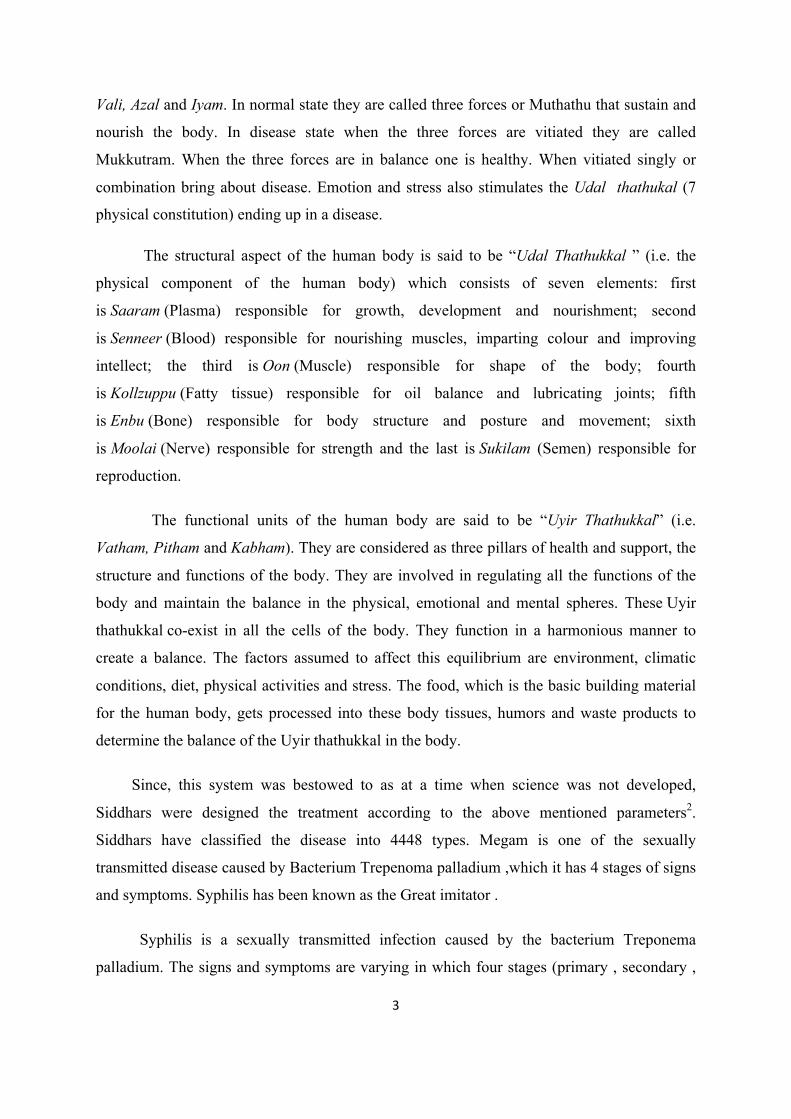
Vali, Azal and Iyam. In normal state they are called three forces or Muthathu that sustain and
nourish the body. In disease state when the three forces are vitiated they are called
Mukkutram. When the three forces are in balance one is healthy. When vitiated singly or
combination bring about disease. Emotion and stress also stimulates the Udal thathukal (7
physical constitution) ending up in a disease.
The structural aspect of the human body is said to be “Udal Thathukkal ” (i.e. the
physical component of the human body) which consists of seven elements: first
is Saaram (Plasma) responsible for growth, development and nourishment; second
is Senneer (Blood) responsible for nourishing muscles, imparting colour and improving
intellect; the third is Oon (Muscle) responsible for shape of the body; fourth
is Kollzuppu (Fatty tissue) responsible for oil balance and lubricating joints; fifth
is Enbu (Bone) responsible for body structure and posture and movement; sixth
is Moolai (Nerve) responsible for strength and the last is Sukilam (Semen) responsible for
reproduction.
The functional units of the human body are said to be “Uyir Thathukkal” (i.e.
Vatham, Pitham and Kabham). They are considered as three pillars of health and support, the
structure and functions of the body. They are involved in regulating all the functions of the
body and maintain the balance in the physical, emotional and mental spheres. These Uyir
thathukkal co-exist in all the cells of the body. They function in a harmonious manner to
create a balance. The factors assumed to affect this equilibrium are environment, climatic
conditions, diet, physical activities and stress. The food, which is the basic building material
for the human body, gets processed into these body tissues, humors and waste products to
determine the balance of the Uyir thathukkal in the body.
Since, this system was bestowed to as at a time when science was not developed,
Siddhars were designed the treatment according to the above mentioned parameters2.
Siddhars have classified the disease into 4448 types. Megam is one of the sexually
transmitted disease caused by Bacterium Trepenoma palladium ,which it has 4 stages of signs
and symptoms. Syphilis has been known as the Great imitator .
Syphilis is a sexually transmitted infection caused by the bacterium Treponema
palladium. The signs and symptoms are varying in which four stages (primary , secondary ,
4
latent , tertiary ).The primary stage with a single chancre. In secondary stage rashes occurs on
hand and soles of the feet.In latent there will be no symptoms. In tertiary syphilis there are
Gummas , neurological ,or heart symptoms.
In 2015 , about 45.4 million people were infected with syphilis , with 6 million new
cases.During 2015 , it caused about 107,000 deaths , down from 202,000 in 1990. After
decreasing dramatically with the availability of penicillin in 1940s, rates of infection have
increased in many countries. In 2015 , Cuba became the first country in the world to
eliminate mother-to-child transmission of Syphilis.
The Siddha system of medicine uses a fascinating combination of herbs, minerals and
metals to promote good health and longevity. Before preparing medicines, Siddhars laid a
great emphasis in purification of raw drugs. More than 80% of the Siddha medicines are
formulated by herbal products, but in certain life threatening disease and in many chronic
diseases, Siddhars enumerated some herbo-metal, herbo-mineral and metalo-mineral
formulations.
Gandhaga Sarkkarai is one of the herbo-mineral formulation mentioned in ancient
Siddha literature text “Anuboga Vaithiya Navaneetham”, part -VI, page no:46,47. preparation
no:793.
When traditional literatures were reviewed, it revealed that Gandhagam has anti-
bacterial and histaminic properties, Karisalai has anti-inflammatory and analgesic properties
and the research articles revealed that the individual ingredients of Gandhaga sarkkari
possess Anti-histamine, Anti-inflammatory and Analgesic activity but as a finished product
no pharmacological activities has been carried out for this formulation.
Many research workers have conducted a number of pharmacological and
toxicological experiments for various Siddha formulations which revealed that the toxicity of
the crude drug is quite different from that of the finished Siddha formulations. Hence the
researcher selected the drug Gandhaga Sarkkarai to standardize and evaluate the
pharmacological activities such as Anti-histamine activity, Anti- inflammatory activity and
Analgesic activity.
5
2. Aim and objectives
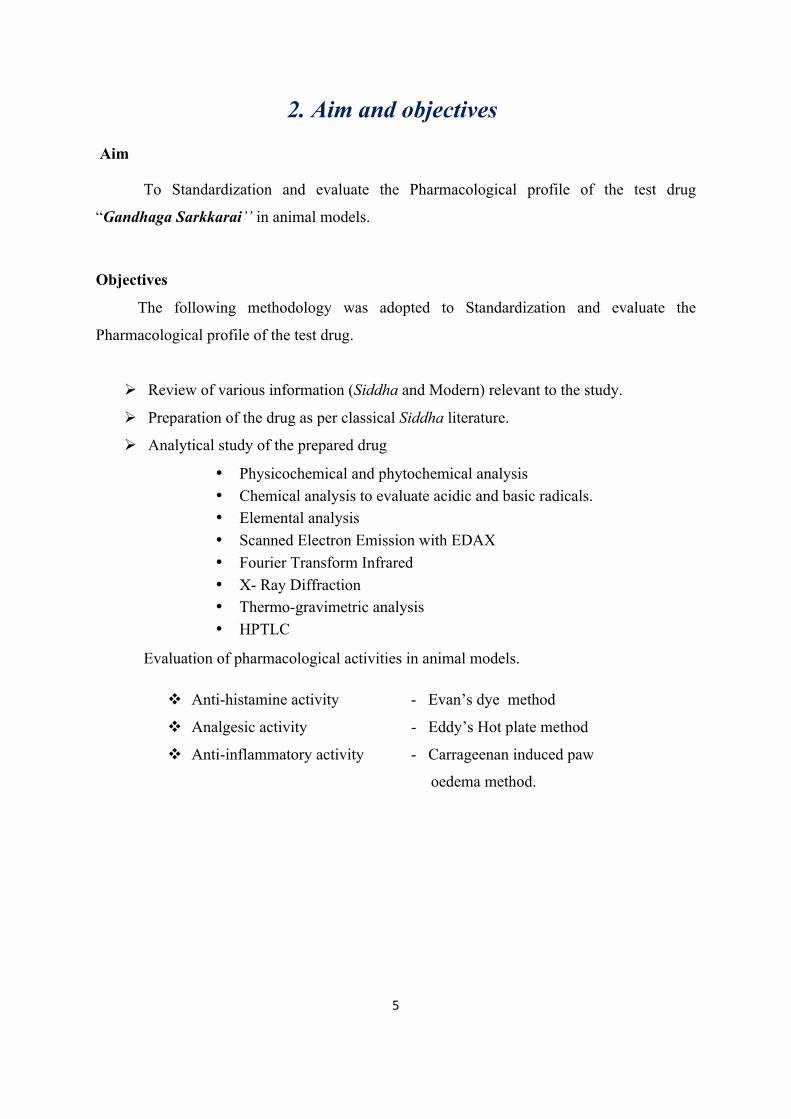
Aim
To Standardization and evaluate the Pharmacological profile of the test drug
“Gandhaga Sarkkarai’’ in animal models.
Objectives
The following methodology was adopted to Standardization and evaluate the
Pharmacological profile of the test drug.
Ø Review of various information (Siddha and Modern) relevant to the study.
Ø Preparation of the drug as per classical Siddha literature.
Ø Analytical study of the prepared drug
• Physicochemical and phytochemical analysis • Chemical analysis to evaluate acidic and basic radicals. • Elemental analysis • Scanned Electron Emission with EDAX • Fourier Transform Infrared • X- Ray Diffraction • Thermo-gravimetric analysis • HPTLC
Evaluation of pharmacological activities in animal models.
v Anti-histamine activity - Evan’s dye method
v Analgesic activity - Eddy’s Hot plate method
v Anti-inflammatory activity - Carrageenan induced paw
oedema method.
6
3. Materials and methods
Standard Operating Procedure of Gandhaga sarkkarai
Drug selection
The drug Gandhaga Sarkkarai, is a Herbo-mineral preparation (Sarkkarai= one of
the 32 types of internal medicine), mentioned in Siddha text “Anuboga Vaithiya
Navaneetham”, (part -VI, page no:46,47. preparation no:793) indicated for Megam (syphilis),
Premegham , Kiranthi , Purai (Whole Abscess) , Kai kaal kudaichal ( Joint pain ).
Ingredients
1. Purified Gandhgam (Sulphur) - 280 gms
2. Karisalai (Eclipta alba) - 250 ml
3. Vellai vengayam (Allium cepa) - 250 ml
Collection of the Plant materials
Gandhagam was purchased from a well reputed country shop in Parrys, Chennai.
Karisalai and Vellai vengayam were freshly collected from Tambaram sanatorium,
Tamilnadu.
Gandhagam was purified and the medicine was prepared in the Gunapadam
laboratory of National Institute of Siddha.
Identification and Authentication of the drug
1. Mineral drug was authenticated by Dr.M.Suresh Gandhi, Department of Geology,
University of Madras, Chennai.
2. The Herbal drugs were identified and authenticated by Dr .D. Aravind M.D(s),
Botanist, National Institute of Siddha, Tambaram Sanatorium, Chennai.
7
Purification process
Karisalai - Eclipta prostrata ,Linn (Whole plant)
Washed it in RO water
Vellai vengayam - Allium cepa , Linn (Tuber)
Washed it in RO water
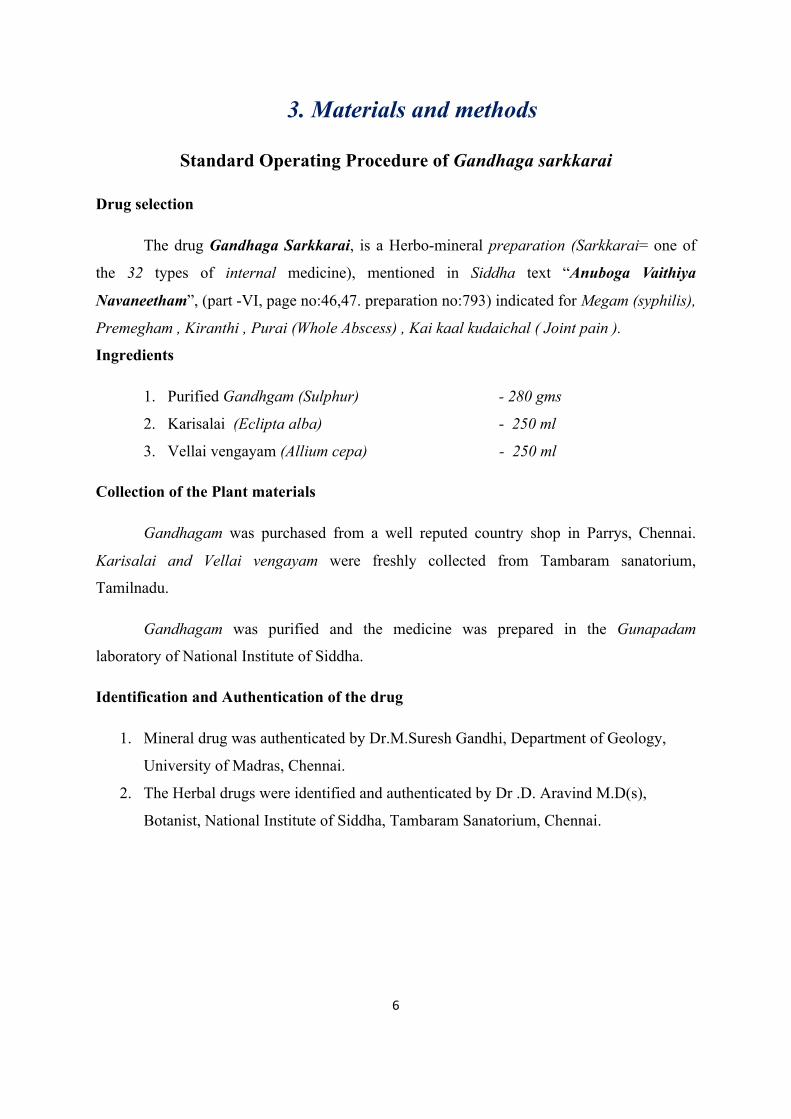
Gandhagam (Sulphur) :
The kalkam of Lowsonia inermis was mixed in cow's
curd and placed in a mud pot. The mouth of the pot was covered with a cloth. Sulphur
was placed over the cloth. The pot was covered with another suitable pot and buried
in the ground. The entire setup was subjected to pudam with five dung cakes. The
sulphur which melts and settles down was collected. This procedure was repeated for
7 times .
Before Pudam on First Day of Purification
Figure no -1
8
Method of Preparation :
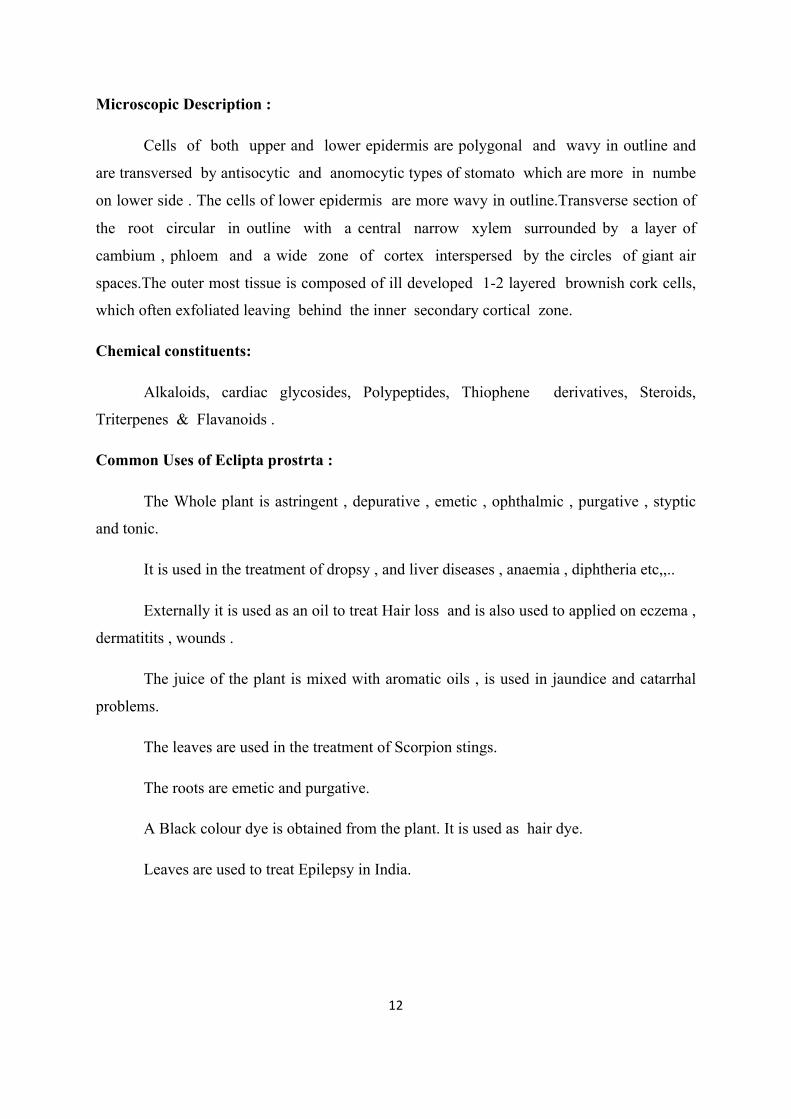
Purified Ganthagam was grounded with juice of Eclipta prostrata (Karisalai) juice
from morning 6 a.m. to 12 noon after that it was dried in sun light. This procedure was
repeated for 3 days. The same procedure was repeated with juice of Allium cepa ( vellai
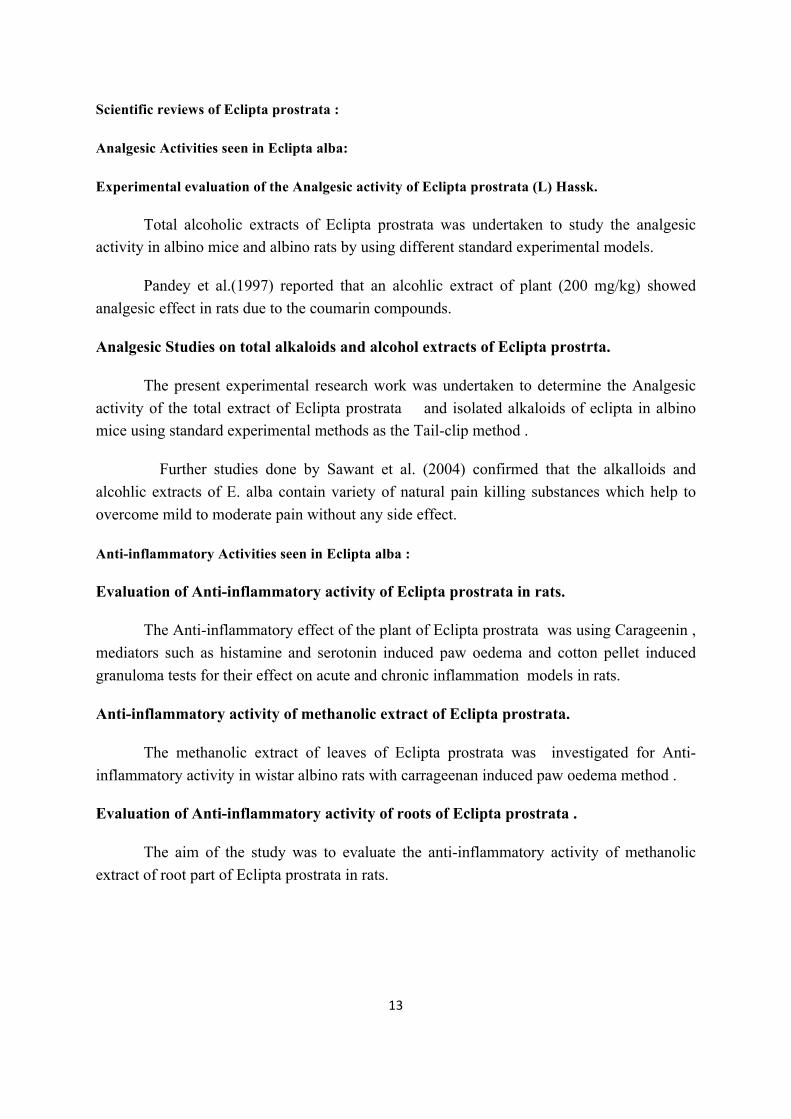
vengayam). Finally the mixture was grounded until it reached the consistency of fine powder.
Drug storage :
The trial drug Gandhaga Sarkkarai was stored in clean, dry wide mouthed glass bottles.
Labelling
Name of the preparation : Gandhaga sarkkarai
Date of preparation : 30/10/2017
Dose : 1varagan (4.2g), bd
Adjuvant/Vehicle : Honey
Indications : Megam , Premegam , Kiranthi , Purai
Date of expiry : 30/10/2018
Colour : Yellowish brown
Reference : Anuboga Vaithiya Navaneetham,
Therapeutic administration of drug
Form of medicine - Chooranam
Route of administration - Oral
Dose - 4.2gm twice daily
Vehicle - Honey
9
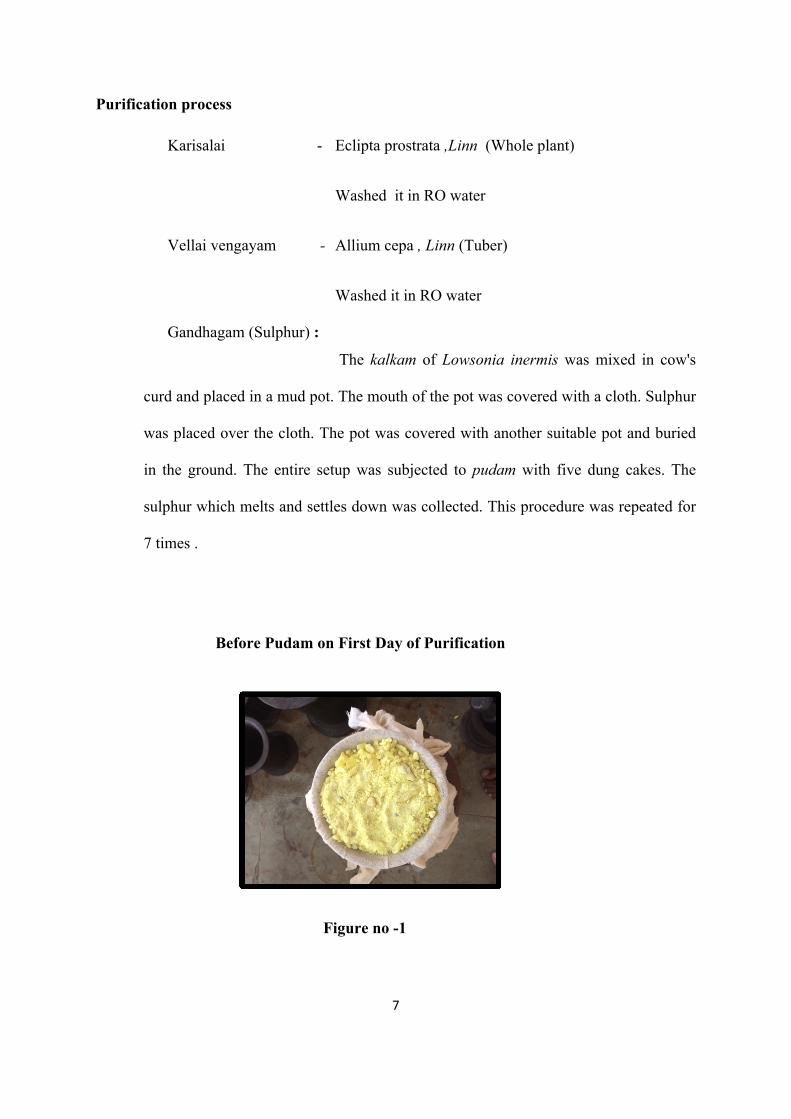
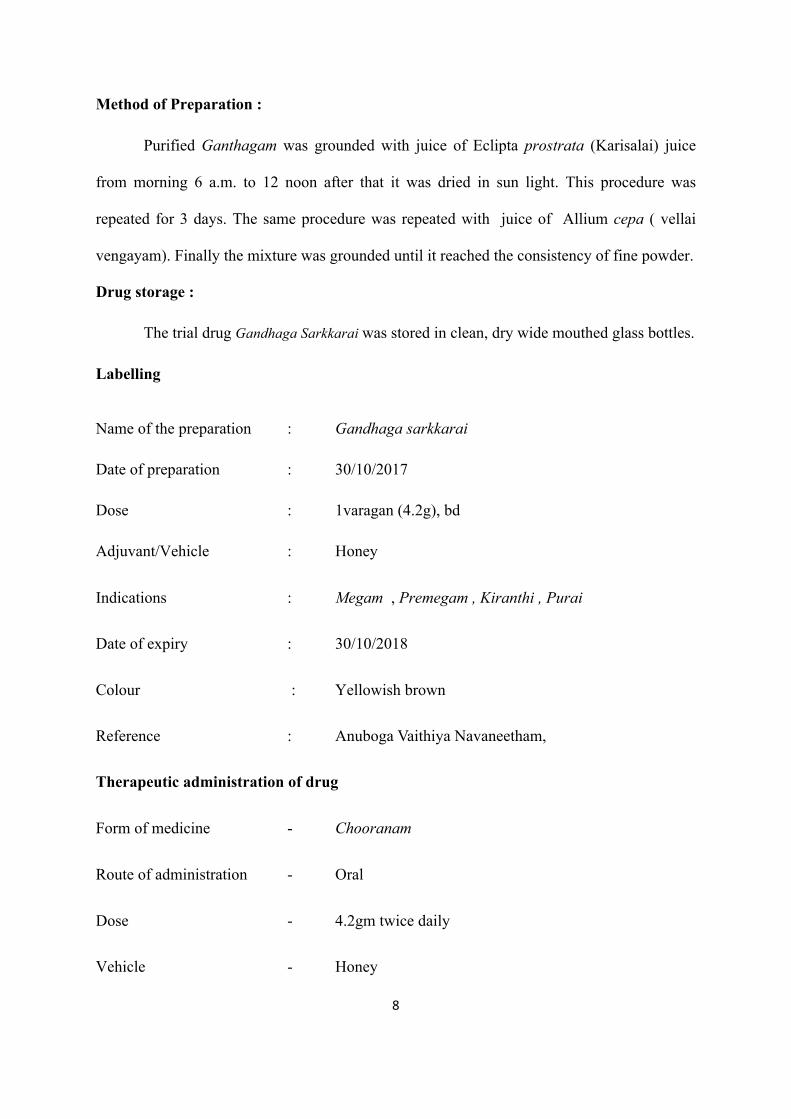
INGREDIENTS OF GANDHAGA SARKKARAI
Gandhagam
Before purification During purification
Figure no – 2 Figure no - 3
After purification
Figure no - 4
10
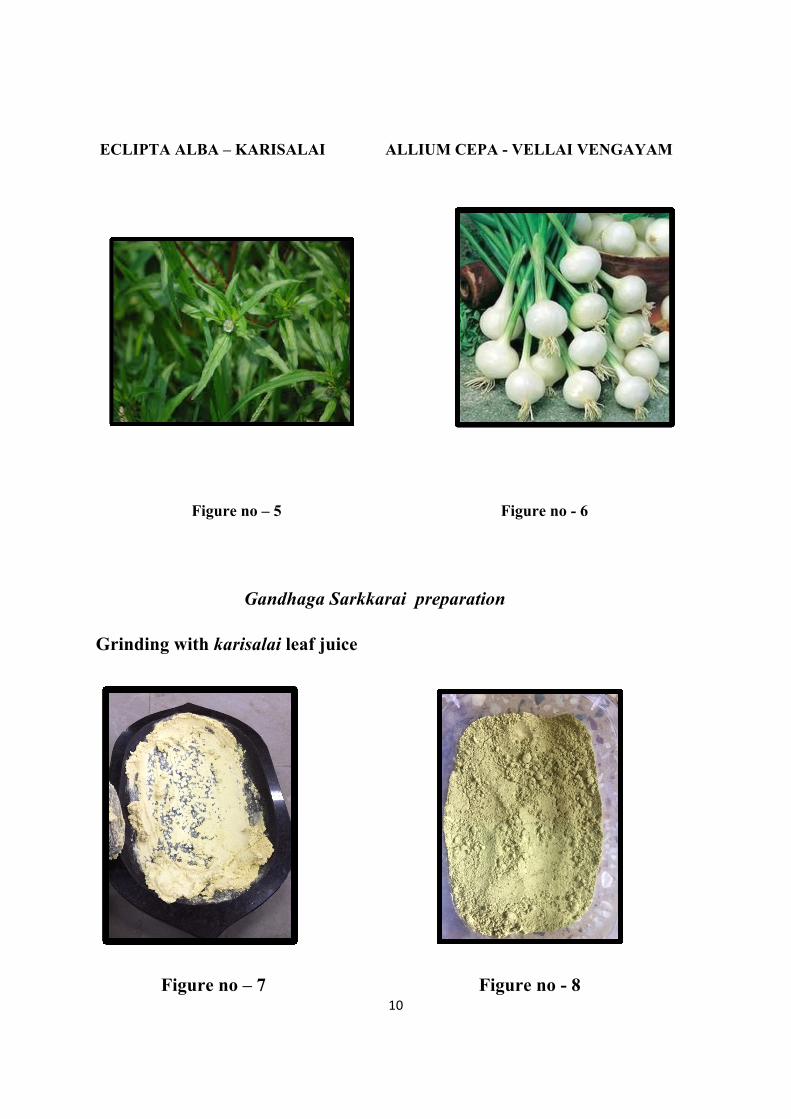
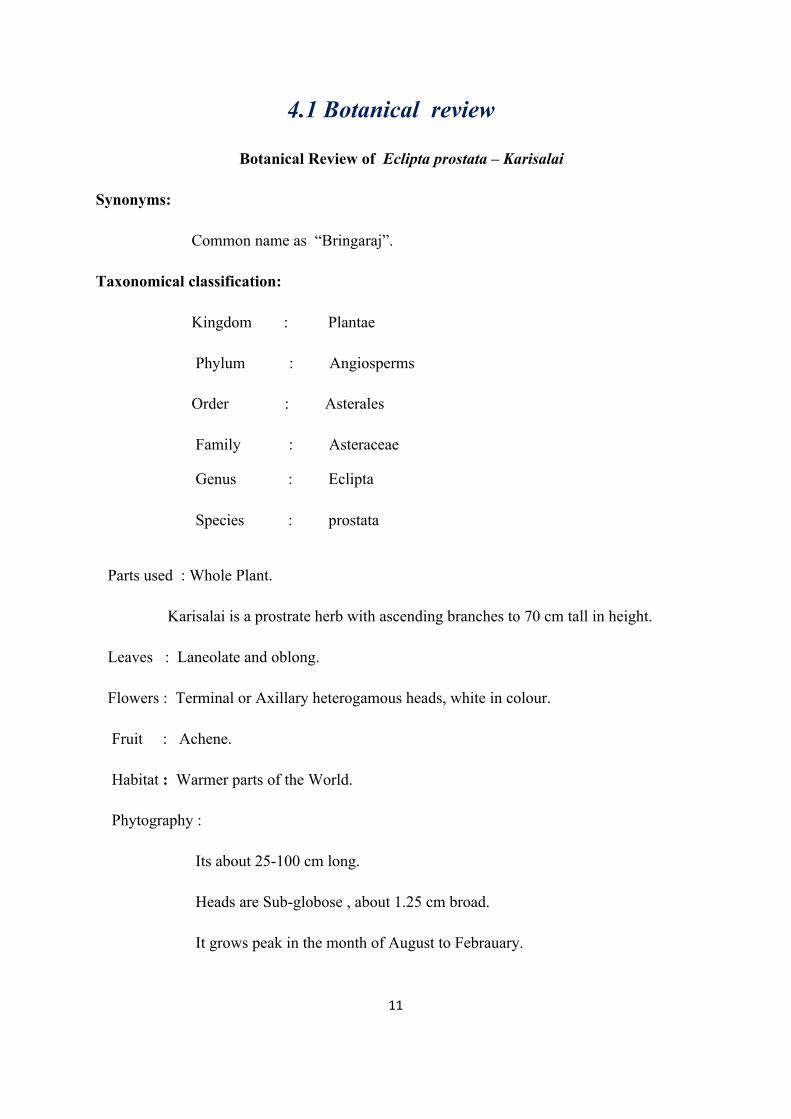
ECLIPTA ALBA – KARISALAI ALLIUM CEPA - VELLAI VENGAYAM
Figure no – 5 Figure no - 6
Gandhaga Sarkkarai preparation
Grinding with karisalai leaf juice
Figure no – 7 Figure no - 8
11
4.1 Botanical review
Botanical Review of Eclipta prostata – Karisalai
Synonyms:
Common name as “Bringaraj”.
Taxonomical classification:
Kingdom : Plantae
Phylum : Angiosperms
Order : Asterales
Family : Asteraceae
Genus : Eclipta
Species : prostata
Parts used : Whole Plant.
Karisalai is a prostrate herb with ascending branches to 70 cm tall in height.
Leaves : Laneolate and oblong.
Flowers : Terminal or Axillary heterogamous heads, white in colour.
Fruit : Achene.
Habitat : Warmer parts of the World.
Phytography :
Its about 25-100 cm long.
Heads are Sub-globose , about 1.25 cm broad.
It grows peak in the month of August to Febrauary.
12
Microscopic Description :
Cells of both upper and lower epidermis are polygonal and wavy in outline and
are transversed by antisocytic and anomocytic types of stomato which are more in numbe
on lower side . The cells of lower epidermis are more wavy in outline.Transverse section of
the root circular in outline with a central narrow xylem surrounded by a layer of
cambium , phloem and a wide zone of cortex interspersed by the circles of giant air
spaces.The outer most tissue is composed of ill developed 1-2 layered brownish cork cells,
which often exfoliated leaving behind the inner secondary cortical zone.
Chemical constituents:
Alkaloids, cardiac glycosides, Polypeptides, Thiophene derivatives, Steroids,
Triterpenes & Flavanoids .
Common Uses of Eclipta prostrta :
The Whole plant is astringent , depurative , emetic , ophthalmic , purgative , styptic
and tonic.
It is used in the treatment of dropsy , and liver diseases , anaemia , diphtheria etc,,..
Externally it is used as an oil to treat Hair loss and is also used to applied on eczema ,
dermatitits , wounds .
The juice of the plant is mixed with aromatic oils , is used in jaundice and catarrhal
problems.
The leaves are used in the treatment of Scorpion stings.
The roots are emetic and purgative.
A Black colour dye is obtained from the plant. It is used as hair dye.
Leaves are used to treat Epilepsy in India.
13
Scientific reviews of Eclipta prostrata :
Analgesic Activities seen in Eclipta alba:
Experimental evaluation of the Analgesic activity of Eclipta prostrata (L) Hassk.
Total alcoholic extracts of Eclipta prostrata was undertaken to study the analgesic activity in albino mice and albino rats by using different standard experimental models.
Pandey et al.(1997) reported that an alcohlic extract of plant (200 mg/kg) showed analgesic effect in rats due to the coumarin compounds.
Analgesic Studies on total alkaloids and alcohol extracts of Eclipta prostrta.
The present experimental research work was undertaken to determine the Analgesic activity of the total extract of Eclipta prostrata and isolated alkaloids of eclipta in albino mice using standard experimental methods as the Tail-clip method .
Further studies done by Sawant et al. (2004) confirmed that the alkalloids and alcohlic extracts of E. alba contain variety of natural pain killing substances which help to overcome mild to moderate pain without any side effect.
Anti-inflammatory Activities seen in Eclipta alba :
Evaluation of Anti-inflammatory activity of Eclipta prostrata in rats.
The Anti-inflammatory effect of the plant of Eclipta prostrata was using Carageenin , mediators such as histamine and serotonin induced paw oedema and cotton pellet induced granuloma tests for their effect on acute and chronic inflammation models in rats.
Anti-inflammatory activity of methanolic extract of Eclipta prostrata.
The methanolic extract of leaves of Eclipta prostrata was investigated for Anti-inflammatory activity in wistar albino rats with carrageenan induced paw oedema method .
Evaluation of Anti-inflammatory activity of roots of Eclipta prostrata .
The aim of the study was to evaluate the anti-inflammatory activity of methanolic extract of root part of Eclipta prostrata in rats.
14
Pharmacognostical,phytochemicalandanalgesicactivityofEcliptaprostrata :
Further Extracts were screened for analgesic activity by using Eddy’s hot plate and heat immersion methods , at a dose level of 50 &100 mg/kg body weight .Ethyl acetate extract showed a dose dependent ans significance (p-.01) analgesic activity in all the tested methods compared to diclofenac treated mice . Methanolic extract also exhibited analgesic activity .
Anti-inflammatory , analgesic , anti-oxidant activity of herb Eclipta prostrata :
The present study was designed to investigate the anti-inflammatory , analgesic , anti-oxidant activity of the methanolic extrtact along with its organic soluble fractions of the herb Eclipta prostrata.
15
Botanical review of Allium cepa – Onion
Taxonomical classification:
Kingdom : Plantae
Phylum : Angiosperms
Class : Monocot
Order : Asparagales
Family : Alliaceae
Genus : Allium
Species : cepa
Habitat :
It is a herbaceous bulbous plant, with a biennial seed production , annual herb
production , annual bulb production , and the bulb being the edible part.
It is developed with ramified and superficial roots.
Tubular waxy leaves , which are dark green on arieal part ,
At the base – Tunic – They are thin , wrap over , protective on the outside , while they
are meaty on the inside.
The floral stalk is rigid , hollow , and waxy and the plant is grown over a metre tall
with an umbrella inflorescence and in spherical in shape .
Flowers are hermaphrodite , white .
Fruit – Occurs in Capsule.
16
Actions :
Diuretic,
Anti inflammatory,
Analgesic,
Antirheumatic,
Antibiotic.
Chemical constituents and uses:
There are more than 100 sulfer compounds in onion that have anti-inflammatory
effects. However, many are known to change readily when heated or are broken down after
cutting. As with garlic, onions also contain the volatile, natural antibiotic oil called
ALLICIN, responcible for its pungent flavour.the tear evoking lachrymatory chemical
released when onion is crushed or cut is thiopropanal S-oxide, turns into sulphuric acid
when it comes into contact with water.
Phytochemicals of Allium cepa:
Onion contains quercetin, aflavonoid (one category of anti oxidant compounds), and
allicin. The flavonoid quercetin, an anti oxidant found in onions, helps eliminate free radicals
in the body, inhibits low density lipoprotein oxidation, protects and regenerates vitamin E,
and helps to circumvent the harmful effects of heavy metal ions. Recent studies at
Wageningen Agricultural University, the Netherlands, showed thwt the absorption of
quercetin from onion is twice that form tea and more than three times that from apples. In
addition, onions are very rich in chromium, a trace mineral that helps cells respond to insulin,
Vitamin C and numerous flavonoids.
Action and Medical Uses :
Onions posses properties allied to those of Garlic, but in a milder degree, and the
absorption in its oils and influence upon the system is somewhat similar to that of the oil of
garlic.
17
A cataplasm of onions pounded with vinegar , applied for anumber of days and
changed 3 times a day, has been found to cure Corns.
Onions are useful in hemorroids, dysentry, flatulence, dyspesia , jaundice,
spleenopathy, vomiting, malarial fever etc.
Scientific reviews of Allium cepa :
Evaluation of analgesic and anti-inflammatory effects of fresh onion juice in experimental animals :
Onion is a well known traditional medicinal plant that has been consumed for its putative nutritionaland health benefits for centuries. This study was carried out to determine the possible analgesic and anti –inflammatory activity in experimental animals .
Analgesic activity studies with a polyherbal formulation containing plant Allium cepa
This study reveals that Analgesic activity ,which activity MEEAC at the dose of 400
mg/kg was higher than aspirin, where MEEAC maybe potential source to obtain pain in rats.
18
4.2 Mineralogical review
MINERALOGICAL ASPECT OF SULPHUR
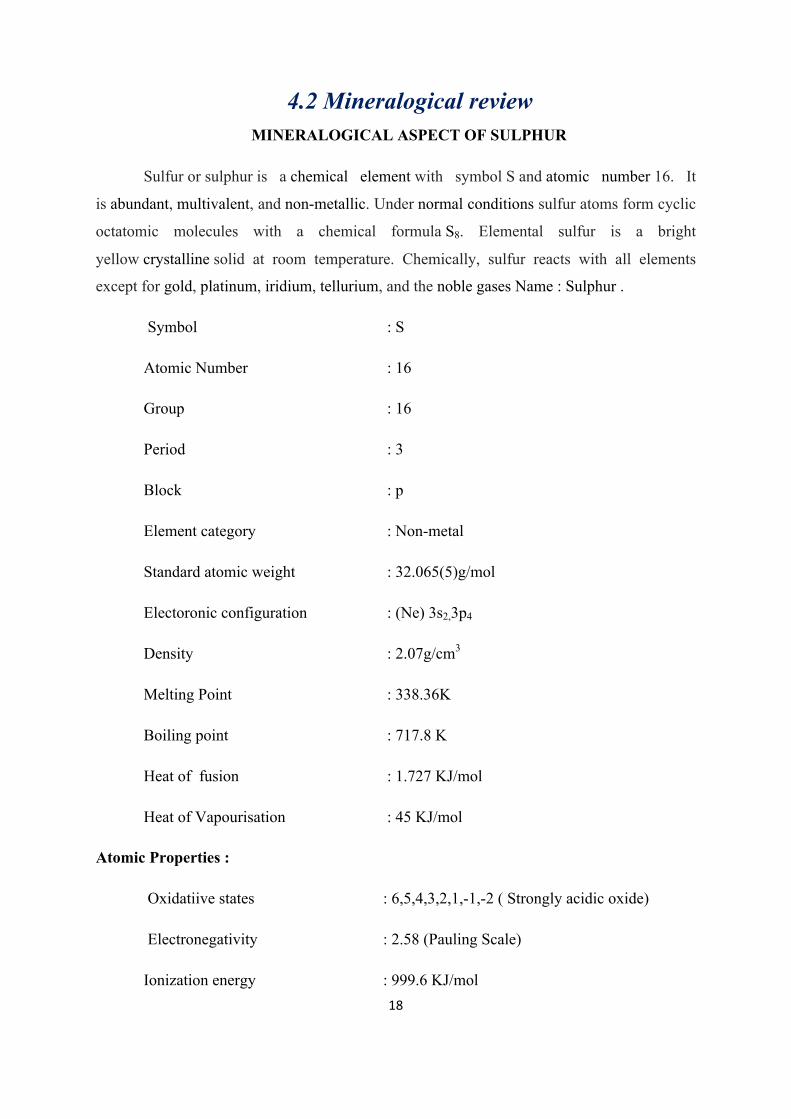
Sulfur or sulphur is a chemical element with symbol S and atomic number 16. It
is abundant, multivalent, and non-metallic. Under normal conditions sulfur atoms form cyclic
octatomic molecules with a chemical formula S8. Elemental sulfur is a bright
yellow crystalline solid at room temperature. Chemically, sulfur reacts with all elements
except for gold, platinum, iridium, tellurium, and the noble gases Name : Sulphur .
Symbol : S
Atomic Number : 16
Group : 16
Period : 3
Block : p
Element category : Non-metal
Standard atomic weight : 32.065(5)g/mol
Electoronic configuration : (Ne) 3s2,3p4
Density : 2.07g/cm3
Melting Point : 338.36K
Boiling point : 717.8 K
Heat of fusion : 1.727 KJ/mol
Heat of Vapourisation : 45 KJ/mol
Atomic Properties :
Oxidatiive states : 6,5,4,3,2,1,-1,-2 ( Strongly acidic oxide)
Electronegativity : 2.58 (Pauling Scale)
Ionization energy : 999.6 KJ/mol
19
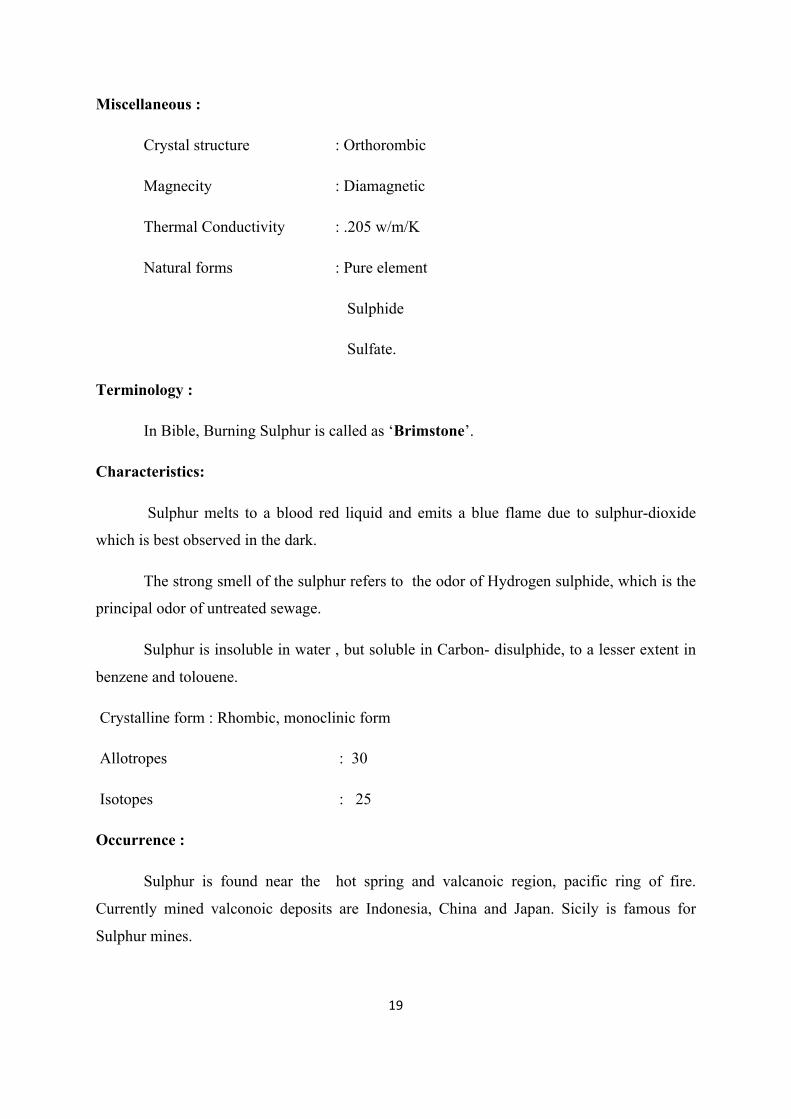
Miscellaneous :
Crystal structure : Orthorombic
Magnecity : Diamagnetic
Thermal Conductivity : .205 w/m/K
Natural forms : Pure element
Sulphide
Sulfate.
Terminology :
In Bible, Burning Sulphur is called as ‘Brimstone’.
Characteristics:
Sulphur melts to a blood red liquid and emits a blue flame due to sulphur-dioxide
which is best observed in the dark.
The strong smell of the sulphur refers to the odor of Hydrogen sulphide, which is the
principal odor of untreated sewage.
Sulphur is insoluble in water , but soluble in Carbon- disulphide, to a lesser extent in
benzene and tolouene.
Crystalline form : Rhombic, monoclinic form
Allotropes : 30
Isotopes : 25
Occurrence :
Sulphur is found near the hot spring and valcanoic region, pacific ring of fire.
Currently mined valconoic deposits are Indonesia, China and Japan. Sicily is famous for
Sulphur mines.
20
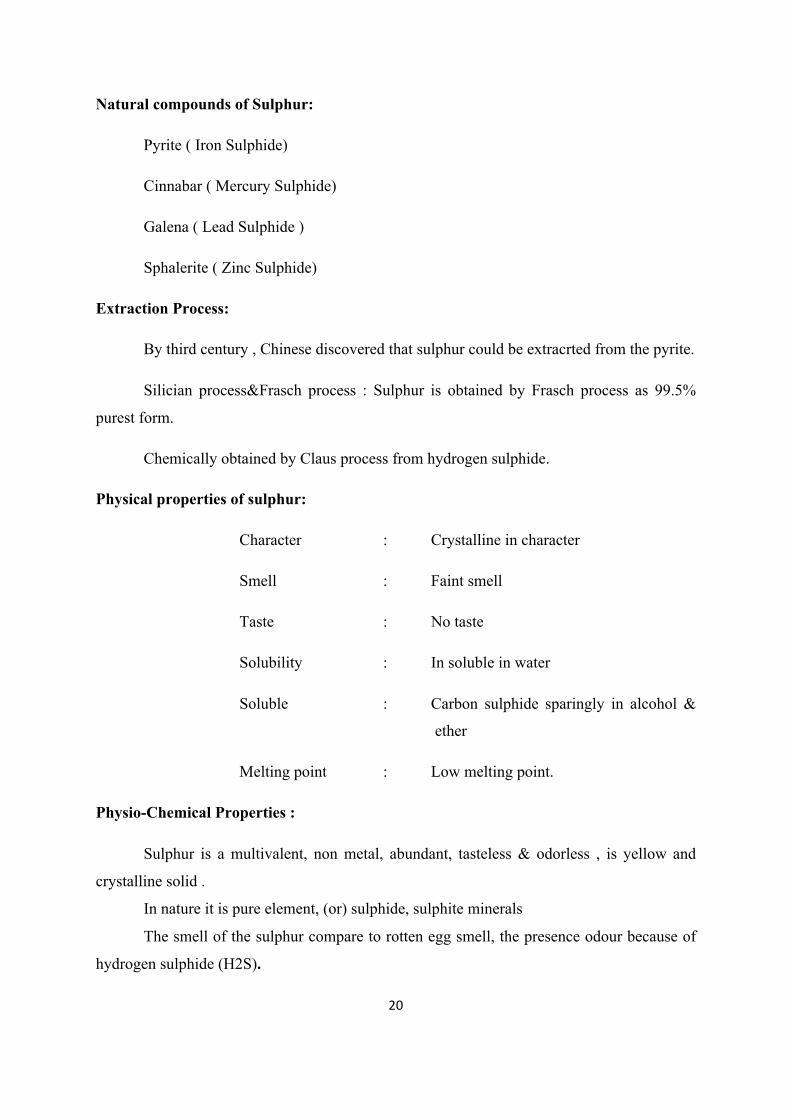
Natural compounds of Sulphur:
Pyrite ( Iron Sulphide)
Cinnabar ( Mercury Sulphide)
Galena ( Lead Sulphide )
Sphalerite ( Zinc Sulphide)
Extraction Process:
By third century , Chinese discovered that sulphur could be extracrted from the pyrite.
Silician process&Frasch process : Sulphur is obtained by Frasch process as 99.5%
purest form.
Chemically obtained by Claus process from hydrogen sulphide.
Physical properties of sulphur:
Character : Crystalline in character
Smell : Faint smell
Taste : No taste
Solubility : In soluble in water
Soluble : Carbon sulphide sparingly in alcohol &
ether
Melting point : Low melting point.
Physio-Chemical Properties :
Sulphur is a multivalent, non metal, abundant, tasteless & odorless , is yellow and
crystalline solid .
In nature it is pure element, (or) sulphide, sulphite minerals
The smell of the sulphur compare to rotten egg smell, the presence odour because of
hydrogen sulphide (H2S).
21
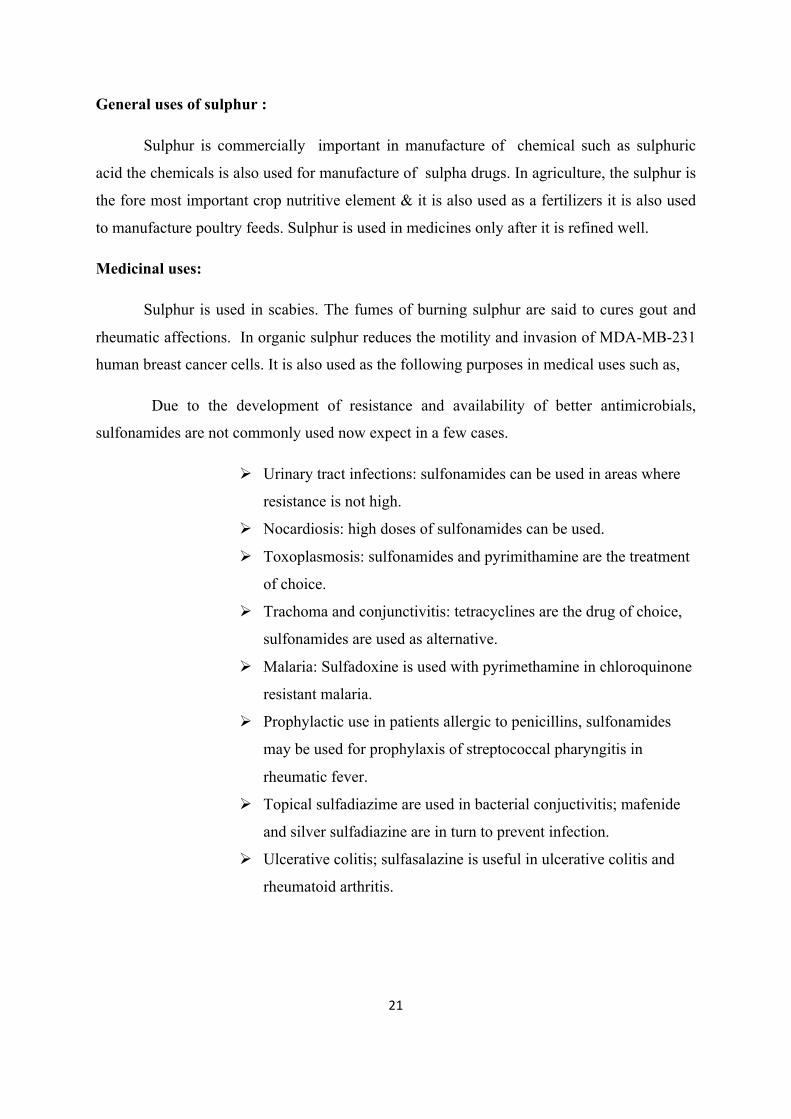
General uses of sulphur :
Sulphur is commercially important in manufacture of chemical such as sulphuric
acid the chemicals is also used for manufacture of sulpha drugs. In agriculture, the sulphur is
the fore most important crop nutritive element & it is also used as a fertilizers it is also used
to manufacture poultry feeds. Sulphur is used in medicines only after it is refined well.
Medicinal uses:
Sulphur is used in scabies. The fumes of burning sulphur are said to cures gout and
rheumatic affections. In organic sulphur reduces the motility and invasion of MDA-MB-231
human breast cancer cells. It is also used as the following purposes in medical uses such as,
Due to the development of resistance and availability of better antimicrobials,
sulfonamides are not commonly used now expect in a few cases.
Ø Urinary tract infections: sulfonamides can be used in areas where
resistance is not high.
Ø Nocardiosis: high doses of sulfonamides can be used.
Ø Toxoplasmosis: sulfonamides and pyrimithamine are the treatment
of choice.
Ø Trachoma and conjunctivitis: tetracyclines are the drug of choice,
sulfonamides are used as alternative.
Ø Malaria: Sulfadoxine is used with pyrimethamine in chloroquinone
resistant malaria.
Ø Prophylactic use in patients allergic to penicillins, sulfonamides
may be used for prophylaxis of streptococcal pharyngitis in
rheumatic fever.
Ø Topical sulfadiazime are used in bacterial conjuctivitis; mafenide
and silver sulfadiazine are in turn to prevent infection.
Ø Ulcerative colitis; sulfasalazine is useful in ulcerative colitis and
rheumatoid arthritis.
22
4.3 Gunapadam review
Sulphur – Gandhagam – fe;jfk;.
There are 64 kinds of Paashaanas which are classified into two types
Natural (32)
Synthetic (32)
Sulphur is one of the natural Paashaanas which is bitter and astringent in taste.
Gandhagam is the element of Theayu (FIRE).
Other Names:
• Natham • Paraiveeriyam • Athitha Prakasam • Beejam • Chendurathathi • Deviuram • Ponvarni.
Types:
Based on the colour the Gandhagam has been divided into four types. They are,
White
Red
Golden Yellow
Black
Action:
• Laxative • Antiseptic • Tonic • It also increases the bile fluids. • It increases various body secretions • When Sulphur is used in high doses it causes diarrhea
23
General characters of Gandhagam:
“ney;ypf;fha;f; fe;jpf;F ePs;gjpndz; Fl;lke;jk;
ty;iy ftpirFd;k thAfz;Nzha; - nghy;yh
tplf;fbtd; NkfNeha; tPWRuk; Ngjp
jplf;fpuR zPfgk;Nghe; NjH.”
This is considered to useful in the treatment of 18 types of skin disease.
Medicinal uses:
The medicinal uses of the Gandhagam (Sulphur) are various.
They are
• Liver Enlargement
• Abdominal distension
• Eye diseases
• Chronic venereal diseases
• Chronic diarrhoea
• Gastric ulcer
• Poisonous bites
• Fever
• Chronic dysentery .
24
Eclipta prostata – Karisalai - fuprhiy
Synonym :
Kaiyanthagarai
Kaiyan
Thegarajam
Bringarajam
Karippan .
Types of Karisalai :
White , Yellow , Red , blue.
Whereas White type of Karisalai will be available in all places for our collection.
Parts Used : Whole plant.
Organoleptic Characters :
Taste : Bitter
Character : Heat
Division : Acrid.
Actions :
Chologauge
Hepato-protective
Tonic
Alterative
Emetic
Purgative .
25
Medicinal Uses :
“Fuw;fk;kw; fhkhiy Fl;lNkhL Nrhig
Auw;ghz;L gd;Ndh nahopa – epuw;nrhd;d
nka;ahe; jfiunahj;j kPsp z;Z ew;Gyj;Jf;
ifahe; jfiunahj;Jf; fhy;”.
(mfj;jpaH Fzthflk;)
• Karisalai is useful in treating Liver Diseases like Jaundice , Hepatitis A&B .
• It is useful in the treatment of throat infections .
• Karisalai chooranam is used to cure Anaemia with the combination of Aya
chenduram.
• 90 drops of juice of Eclipta prostrata (leaves) is mixed with water or butter-milk to
cure Snake-bites.
• Its useful in hair-growth activity.
• Extracts are used to cure Ear-ache as Ear drops.
26
Allium cepa – Vengayam – ntq;fhak;
Synonyms :
Ulli
Gayam
Sukkirantham
Nichhiyam
Palandu .
Parts used :
Vengayapoo
Kizhangu
Thaal
Seeds
Organoleptic properties :
Taste : Bitter
Character : Heat
Division : Acrid .
Actions :
Stimulant
Aphrodisiac
Demulcent
Expectorant
Diuretic , Rubefacient.
27
Medicinal Uses :
“ ntq;fha tpj;J Fd;kk; tPl;Lk;”
• Seeds of Allium cepa will be very useful in curing the disease like Gastric ulcer.
• Seeds of Allium enhances the aphrodisiac activity.
“ntg;g% yq;fpue;jp tPWuj;j gpj;jKld;
nrg;Geh mf;fue;jp uhj;jhfk; - ntg;Gf;
fLg;gWke; jQ;re;ep fhrk;tapw; Wg;gy;
jbg;NgWk; ntq;fhaj;Njhy;”.
(mfj;jpaH Fzthflk;)
• Tubers of onion will cure hemorroids , thirst , oral ulcers , hypertension , eczema
like diseases.
• Mixture of onion with 2-3 seeds of pepper will useful in the treatment of fever.
• Onion juice is use as antidote for the tobacco toxicity .
• Onions posses properties allied to those of Garlic, but in a milder degree, and the
absorption in its oils and influence upon the system is somewhat similar to that of
the oil of garlic.
.
28
5 . Analytical studies
Analytical study of the drug Gandhaga Sarkkarai brings the validation to be used as
a medicine by subjecting the drug to many analysis and determining its quality and
effectiveness. Analytical study includes many studies such as its organoleptic properties,
physicochemical properties and phytochemical properties and also to assess the active
principles and elements present in the drug. Thus analytical study brings the efficacy and
potency of the drug. As per AYUSH protocol for analytical study, the following parameters
were evaluated. Analytical study of the drug includes: 1) Organoleptic characters
Colour, Odour, Texture, Taste
2) Phytochemical analysis
3) Physicochemical analysis
Determination of Ash Values and Physical characterization
4) Chemical analysis
Preliminary Basic and Acidic radical studies
5) Elemental analysis
Inductively Coupled Plasma Optical Emissions Spectrometry (ICP- OES)
6) Analysis of particle size
Scanned Electron Emission (SEM) with Energy Dispersive X-ray analysis
(EDAX)
7) Fourier transform infrared (FTIR)
8) X- ray Diffraction
9) Thermo gravimetric analysis (TGA)
10) HPTLC-Higher performance thin layer chromatography .
29
5.1 Organoleptic characterization
The organoleptic characters of the sample drug Gandhaga sarkkarai were evaluated.
1gm of the test drug was taken and the following characters were seen.
• Colour
• Odour
• Texture
• Taste
Other morphology characters were viewed by naked eye under sunlight. Then the
result were noted.
Colour
The medicine was taken into watch glasses and placed against white back ground in
white tube light. It was observed for its colour by naked eye.
Odour
The medicine was smelled individually. The time interval among two smelling was
kept 2 minutes to nullify the effect of previous smelling.
Taste
Small amount of Gandhaga Sarkkarai was kept over the tip of the tongue.
Results
The results of Organoleptic characters were showed in Table no - 1
30
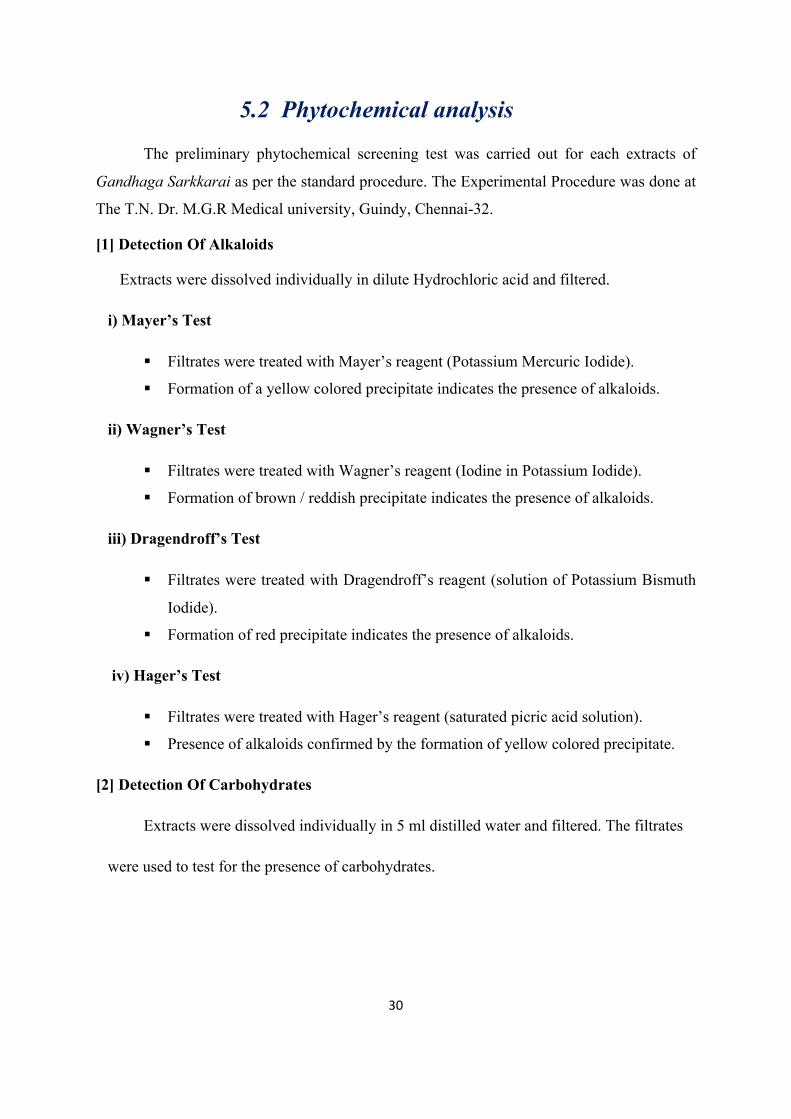
5.2 Phytochemical analysis
The preliminary phytochemical screening test was carried out for each extracts of
Gandhaga Sarkkarai as per the standard procedure. The Experimental Procedure was done at
The T.N. Dr. M.G.R Medical university, Guindy, Chennai-32.
[1] Detection Of Alkaloids
Extracts were dissolved individually in dilute Hydrochloric acid and filtered.
i) Mayer’s Test
§ Filtrates were treated with Mayer’s reagent (Potassium Mercuric Iodide).
§ Formation of a yellow colored precipitate indicates the presence of alkaloids.
ii) Wagner’s Test
§ Filtrates were treated with Wagner’s reagent (Iodine in Potassium Iodide).
§ Formation of brown / reddish precipitate indicates the presence of alkaloids.
iii) Dragendroff’s Test
§ Filtrates were treated with Dragendroff’s reagent (solution of Potassium Bismuth
Iodide).
§ Formation of red precipitate indicates the presence of alkaloids.
iv) Hager’s Test
§ Filtrates were treated with Hager’s reagent (saturated picric acid solution).
§ Presence of alkaloids confirmed by the formation of yellow colored precipitate.
[2] Detection Of Carbohydrates
Extracts were dissolved individually in 5 ml distilled water and filtered. The filtrates
were used to test for the presence of carbohydrates.
31
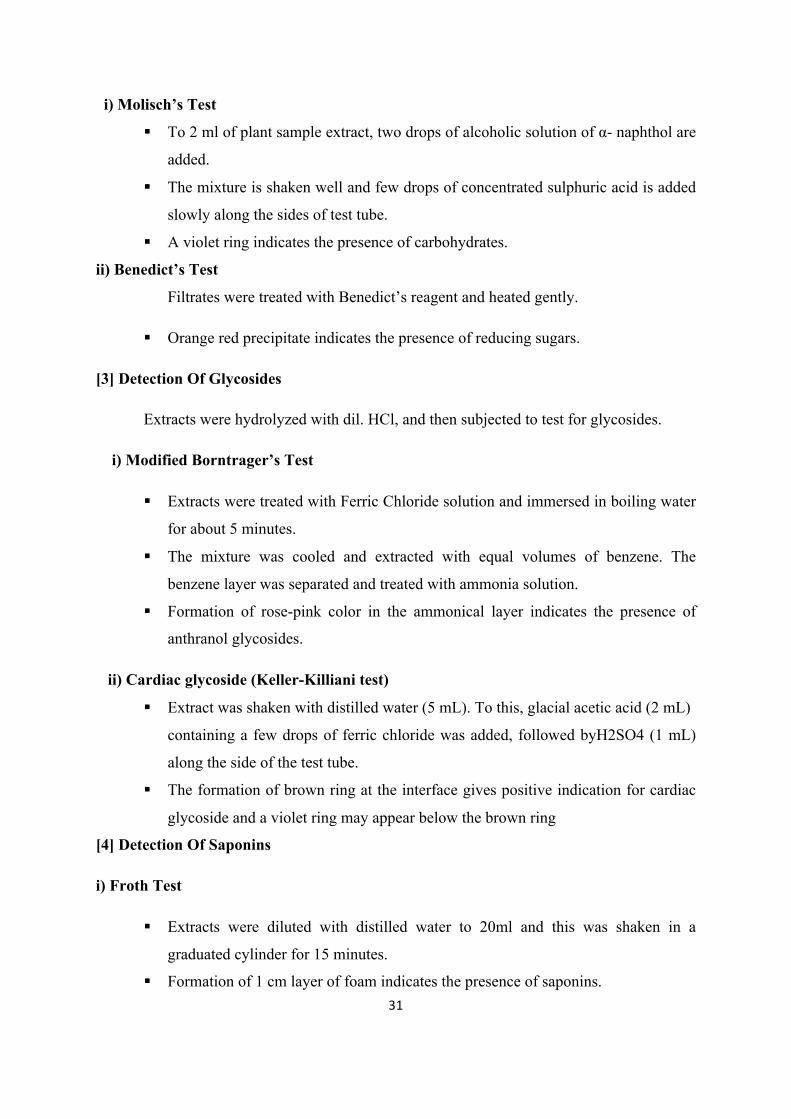
i) Molisch’s Test
§ To 2 ml of plant sample extract, two drops of alcoholic solution of α- naphthol are
added.
§ The mixture is shaken well and few drops of concentrated sulphuric acid is added
slowly along the sides of test tube.
§ A violet ring indicates the presence of carbohydrates.
ii) Benedict’s Test
Filtrates were treated with Benedict’s reagent and heated gently.
§ Orange red precipitate indicates the presence of reducing sugars.
[3] Detection Of Glycosides
Extracts were hydrolyzed with dil. HCl, and then subjected to test for glycosides.
i) Modified Borntrager’s Test
§ Extracts were treated with Ferric Chloride solution and immersed in boiling water
for about 5 minutes.
§ The mixture was cooled and extracted with equal volumes of benzene. The
benzene layer was separated and treated with ammonia solution.
§ Formation of rose-pink color in the ammonical layer indicates the presence of
anthranol glycosides.
ii) Cardiac glycoside (Keller-Killiani test)
§ Extract was shaken with distilled water (5 mL). To this, glacial acetic acid (2 mL)
containing a few drops of ferric chloride was added, followed byH2SO4 (1 mL)
along the side of the test tube.
§ The formation of brown ring at the interface gives positive indication for cardiac
glycoside and a violet ring may appear below the brown ring
[4] Detection Of Saponins
i) Froth Test
§ Extracts were diluted with distilled water to 20ml and this was shaken in a
graduated cylinder for 15 minutes.
§ Formation of 1 cm layer of foam indicates the presence of saponins.

32
ii) Foam Test
§ 0.5 gm of extract was shaken with 2 ml of water.
§ If foam produced persists for ten minutes it indicates the presence of saponins.
[5] Detection Of Phytosterols
Salkowski’s Test
§ Extracts were treated with chloroform and filtered. The filtrates were treated with
few drops of Conc. Sulphuric acid, shaken and allowed to stand.
§ Appearance of golden yellow color indicates the presence of triterpenes.
[6] Detection Of Phenols
Ferric Chloride Test
§ Extracts were treated with 3-4 drops of ferric chloride solution.
§ Formation Of Bluish Black Color Indicates The Presence Of Phenols.
[7] Detection Of Tannins
Gelatin test
§ The extract is dissolved in 5 ml of distilled water and 2 ml of 1% solution of
Gelatin containing 10% NaCl is added to it.
§ White precipitate indicates the presence of phenolic compounds.
[8] Detection Of Flavinoids
i) Alkaline Reagent Test
§ Extracts were treated with few drops of sodium hydroxide solution.
§ Formation of intense yellow color, which becomes colorless on addition of dilute
acid, indicates the presence of flavonoids.
ii) Lead acetate Test
§ Extracts were treated with few drops of lead acetate solution.
§ Formation of yellow color precipitate indicates the presence of flavonoids.
33
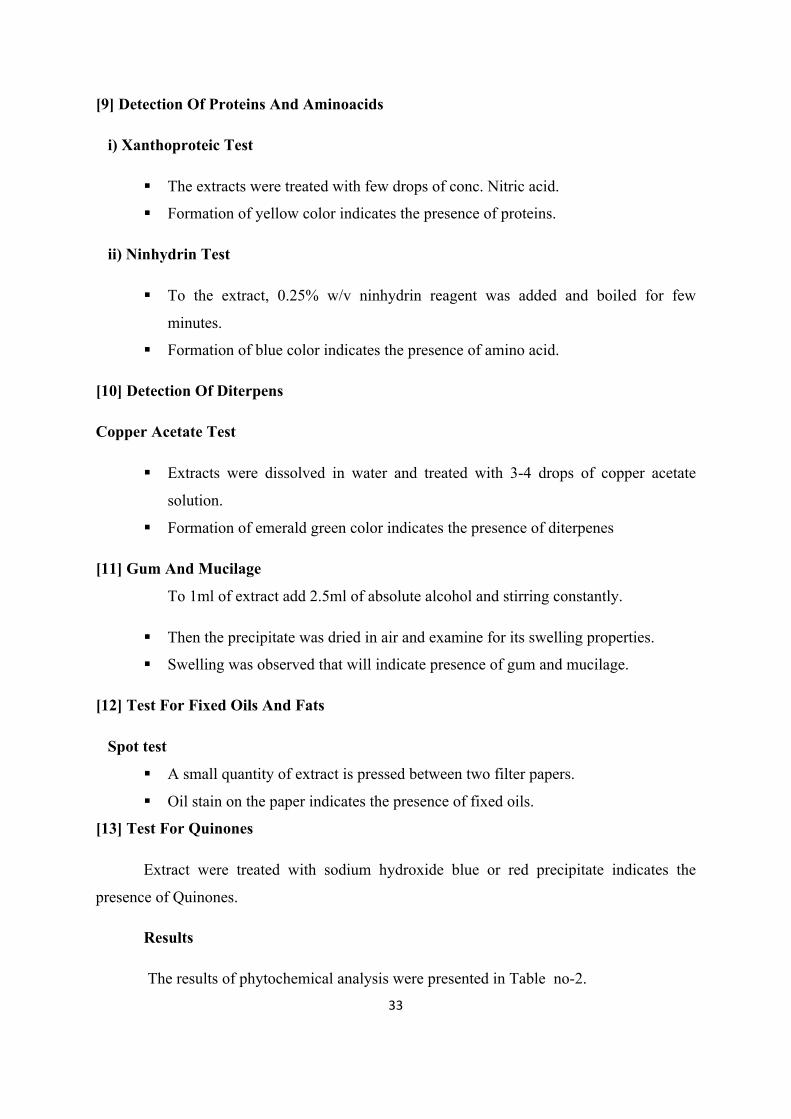
[9] Detection Of Proteins And Aminoacids
i) Xanthoproteic Test
§ The extracts were treated with few drops of conc. Nitric acid.
§ Formation of yellow color indicates the presence of proteins.
ii) Ninhydrin Test
§ To the extract, 0.25% w/v ninhydrin reagent was added and boiled for few
minutes.
§ Formation of blue color indicates the presence of amino acid.
[10] Detection Of Diterpens
Copper Acetate Test
§ Extracts were dissolved in water and treated with 3-4 drops of copper acetate
solution.
§ Formation of emerald green color indicates the presence of diterpenes
[11] Gum And Mucilage
To 1ml of extract add 2.5ml of absolute alcohol and stirring constantly.
§ Then the precipitate was dried in air and examine for its swelling properties.
§ Swelling was observed that will indicate presence of gum and mucilage.
[12] Test For Fixed Oils And Fats
Spot test
§ A small quantity of extract is pressed between two filter papers.
§ Oil stain on the paper indicates the presence of fixed oils.
[13] Test For Quinones
Extract were treated with sodium hydroxide blue or red precipitate indicates the
presence of Quinones.
Results
The results of phytochemical analysis were presented in Table no-2.
34
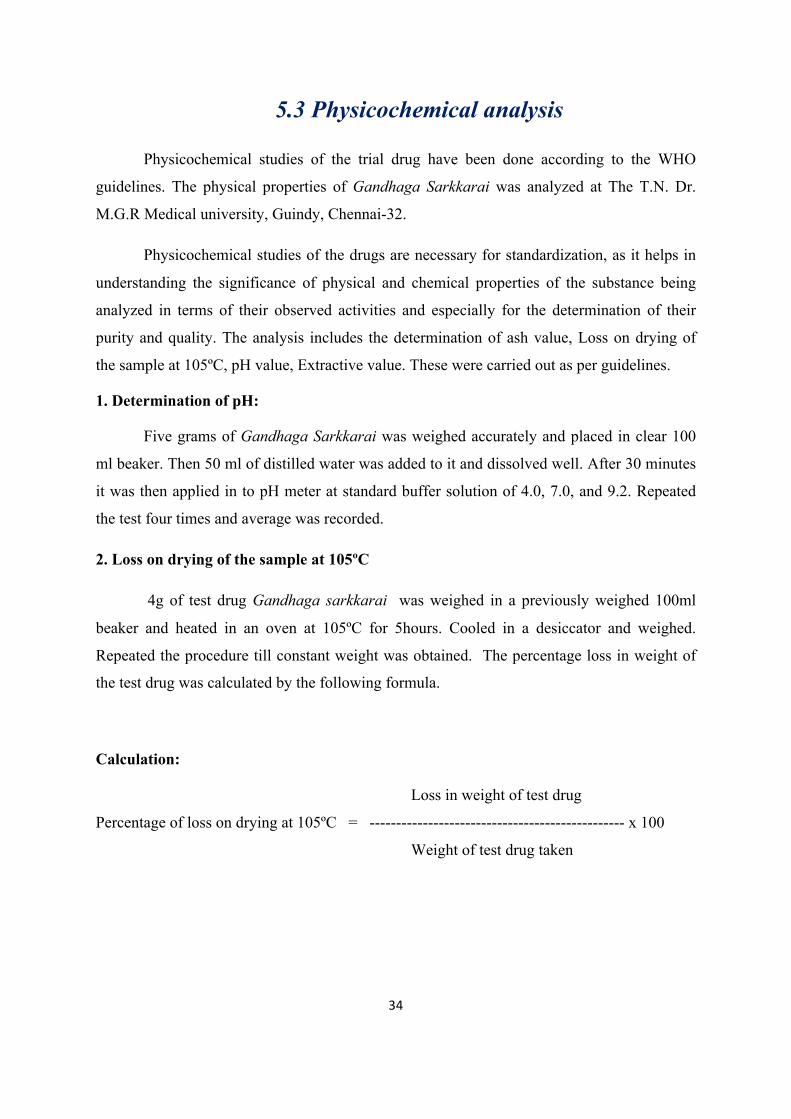
5.3 Physicochemical analysis
Physicochemical studies of the trial drug have been done according to the WHO
guidelines. The physical properties of Gandhaga Sarkkarai was analyzed at The T.N. Dr.
M.G.R Medical university, Guindy, Chennai-32.
Physicochemical studies of the drugs are necessary for standardization, as it helps in
understanding the significance of physical and chemical properties of the substance being
analyzed in terms of their observed activities and especially for the determination of their
purity and quality. The analysis includes the determination of ash value, Loss on drying of
the sample at 105ºC, pH value, Extractive value. These were carried out as per guidelines.
1. Determination of pH:
Five grams of Gandhaga Sarkkarai was weighed accurately and placed in clear 100
ml beaker. Then 50 ml of distilled water was added to it and dissolved well. After 30 minutes
it was then applied in to pH meter at standard buffer solution of 4.0, 7.0, and 9.2. Repeated
the test four times and average was recorded.
2. Loss on drying of the sample at 105ºC
4g of test drug Gandhaga sarkkarai was weighed in a previously weighed 100ml
beaker and heated in an oven at 105ºC for 5hours. Cooled in a desiccator and weighed.
Repeated the procedure till constant weight was obtained. The percentage loss in weight of
the test drug was calculated by the following formula.
Calculation:
Loss in weight of test drug
Percentage of loss on drying at 105ºC = ------------------------------------------------ x 100
Weight of test drug taken
35
3. Ash content
Total ash content
4g of test drug Gandhaga sarkkarai was weighed accurately in a previously ignited
and tared silica dish. The material was evenly spread and ignited in a muffle furnace at
600⁰C until it became white indicating the absence of carbon. The dish was cooled in a
desiccator and weighed. As carbon free ash cannot be obtained in this manner, the dish was
cooled and the residue moistened with 2 sufficient quantity of water. Dried on a water bath
and then ignited in the electric furnace to get the constant weight. Cooled the dish in a
desiccator and then weighed. The percentage of total ash of air-dried materials was calculated
as per the formula given below.
Calculation:
Weight of the ash
Percentage of total ash = --------------------------------- x 100
Weight of test drug taken
4. Acid-insoluble ash
The total ash of the test drug Gandhaga sarkkarai was found out as described above. To
the dish containing the total ash was added 45 ml of 1: 5 hydrochloric acid in three portions
of 13 ml each time. Boiled gently for 5 minutes and filtered. Collected the insoluble matter
on an ashless filter paper (Whatman No.41) and washed with distilled water until the residue
was free from acid. Transfer the filter paper containing the insoluble mater to the original
dish. Dried and ignited to the constant weight. Cooled the dish in a desiccator, and then
weighed. Calculation was made by given formula.
Calculation:
Weight of the acid-insoluble residue
Percentage of acid-insoluble ash = -------------------------------------------- x 100
Weight of test drug taken
36
5. Water soluble ash
Total ash 1g was boiled for 5min with 25ml water and insoluble matter collected on
an ash less filter paper was washed with hot water and ignited for 15 min at a temperature not
exceeding 4500C in a muffle furnace. The amount of soluble ash is determined by drying the
filtrate.
6.Water-soluble extractive of the test drug
4 g of the test drug was weighed accurately in a glass stoppered flask. Added 100 ml
of distilled water and shacked occasionally for 6 hours and then allowed to stand for 18
hours. Filtered rapidly taking care not to lose any solvent and pipetted out 25 ml of the filtrate
in a pre-weighed 100 ml beaker and evaporated to dryness on a water bath. Kept in an air
oven at 105ºC for 6 hours. Cooled in a desiccator and weighed. Repeated the experiment
twice, and taken the average value. The percentage of water soluble extractive was calculated
by the formula given below.
Calculation:
Weight of the extract 100
Percentage of water soluble extract = -------------------------------- x --------- x 100
Weight of sample taken 25
7. Alcohol-soluble extractive of the sample
4 g of the sample was weighed accurately in a glass stoppered flask. Added 100 ml of
distilled alcohol (approximately 95%) and shaken occasionally for 6 hours and then allowed
to stand for 18 hours. Filtered rapidly taking care not to lose any solvent and pipetted out 25
ml of the filtrate in a pre-weighed 100 ml beaker and evaporated to dryness on a water bath.
Kept in an air oven at 105ºC for 6 hours and cooled in a desiccator and weighed. Repeated
the experiment twice, and taken the average value. The percentage of alcohol soluble
extractive was calculated by the formula given below
Weight of the extract 100
Percentage of alcohol soluble extract = ------------------------------- x --------------- x 100
Weight of sample taken 25
The results of physicochemical properties were represented in Table no-3
37
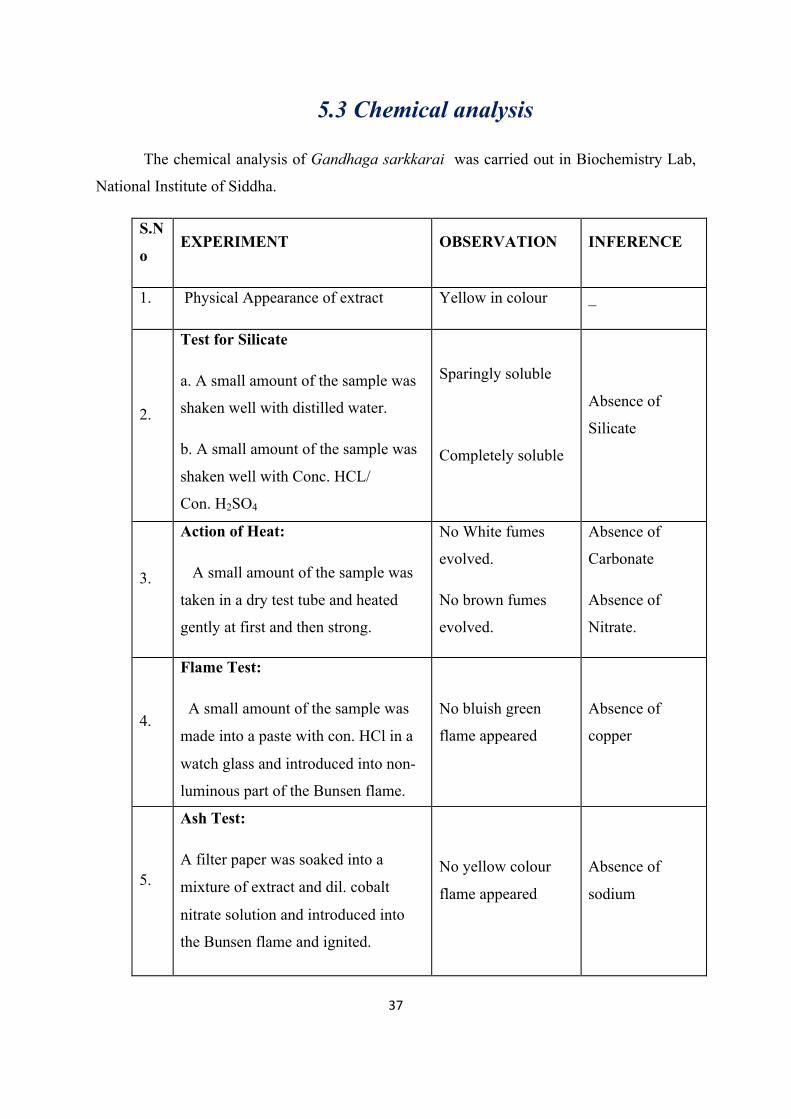
5.3 Chemical analysis
The chemical analysis of Gandhaga sarkkarai was carried out in Biochemistry Lab,
National Institute of Siddha.
S.N
o EXPERIMENT OBSERVATION INFERENCE
1. Physical Appearance of extract Yellow in colour _
2.
Test for Silicate
a. A small amount of the sample was
shaken well with distilled water.
b. A small amount of the sample was
shaken well with Conc. HCL/
Con. H2SO4
Sparingly soluble
Completely soluble
Absence of
Silicate
3.
Action of Heat:
A small amount of the sample was
taken in a dry test tube and heated
gently at first and then strong.
No White fumes
evolved.
No brown fumes
evolved.
Absence of
Carbonate
Absence of
Nitrate.
4.
Flame Test:
A small amount of the sample was
made into a paste with con. HCl in a
watch glass and introduced into non-
luminous part of the Bunsen flame.
No bluish green
flame appeared
Absence of
copper
5.
Ash Test:
A filter paper was soaked into a
mixture of extract and dil. cobalt
nitrate solution and introduced into
the Bunsen flame and ignited.
No yellow colour
flame appeared
Absence of
sodium
38
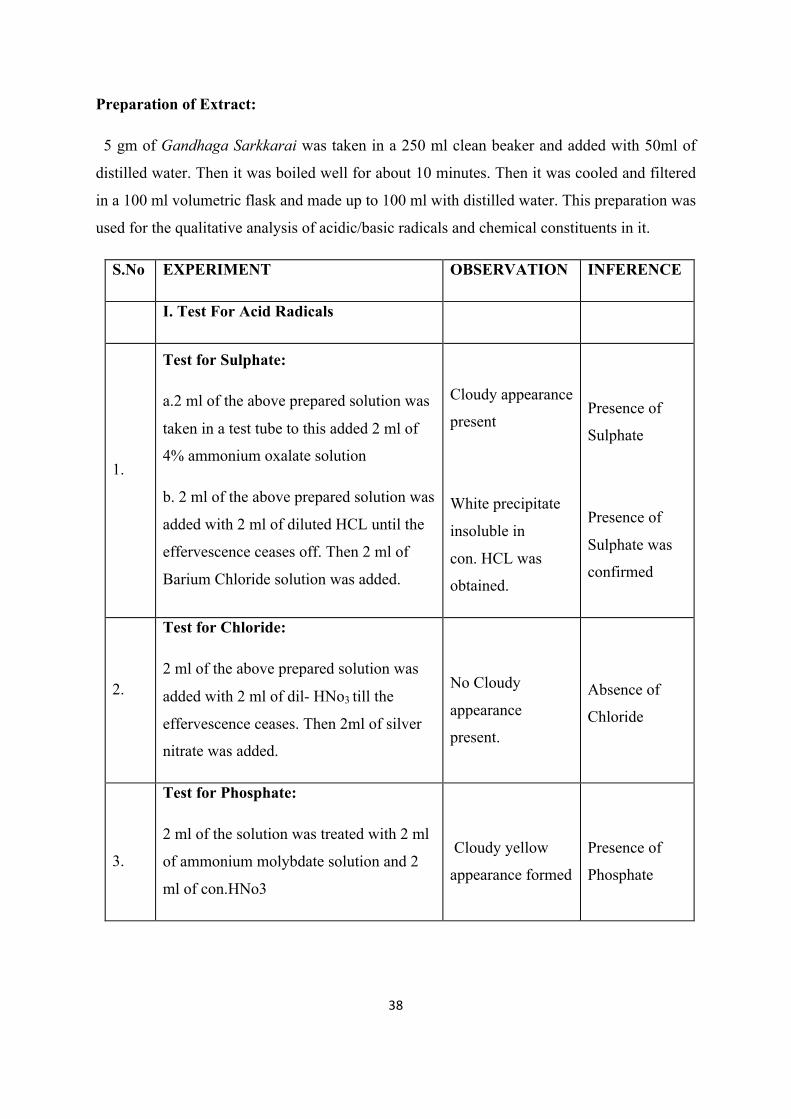
Preparation of Extract:
5 gm of Gandhaga Sarkkarai was taken in a 250 ml clean beaker and added with 50ml of
distilled water. Then it was boiled well for about 10 minutes. Then it was cooled and filtered
in a 100 ml volumetric flask and made up to 100 ml with distilled water. This preparation was
used for the qualitative analysis of acidic/basic radicals and chemical constituents in it.
S.No EXPERIMENT OBSERVATION INFERENCE
I. Test For Acid Radicals
1.
Test for Sulphate:
a.2 ml of the above prepared solution was
taken in a test tube to this added 2 ml of
4% ammonium oxalate solution
b. 2 ml of the above prepared solution was
added with 2 ml of diluted HCL until the
effervescence ceases off. Then 2 ml of
Barium Chloride solution was added.
Cloudy appearance
present
White precipitate
insoluble in
con. HCL was
obtained.
Presence of
Sulphate
Presence of
Sulphate was
confirmed
2.
Test for Chloride:
2 ml of the above prepared solution was
added with 2 ml of dil- HNo3 till the
effervescence ceases. Then 2ml of silver
nitrate was added.
No Cloudy
appearance
present.
Absence of
Chloride
3.
Test for Phosphate:
2 ml of the solution was treated with 2 ml
of ammonium molybdate solution and 2
ml of con.HNo3
Cloudy yellow
appearance formed
Presence of
Phosphate
39
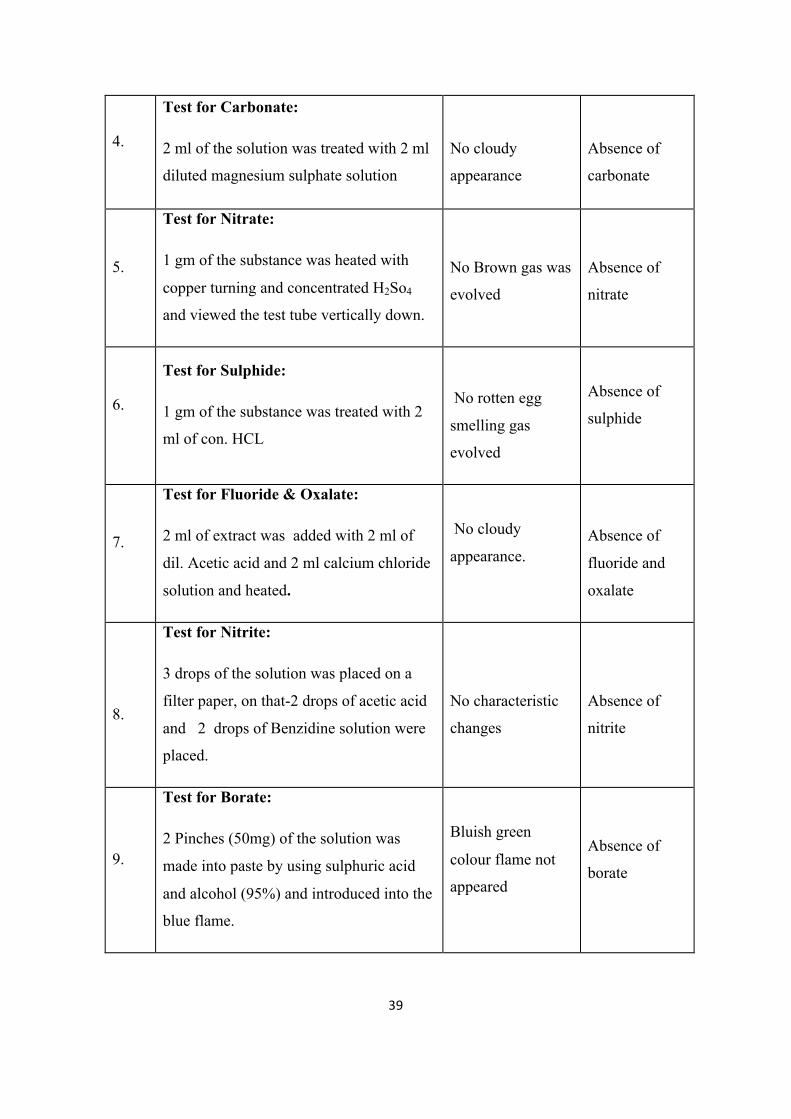
4.
Test for Carbonate:
2 ml of the solution was treated with 2 ml
diluted magnesium sulphate solution
No cloudy
appearance
Absence of
carbonate
5.
Test for Nitrate:
1 gm of the substance was heated with
copper turning and concentrated H2So4
and viewed the test tube vertically down.
No Brown gas was
evolved
Absence of
nitrate
6.
Test for Sulphide:
1 gm of the substance was treated with 2
ml of con. HCL
No rotten egg
smelling gas
evolved
Absence of
sulphide
7.
Test for Fluoride & Oxalate:
2 ml of extract was added with 2 ml of
dil. Acetic acid and 2 ml calcium chloride
solution and heated.
No cloudy
appearance.
Absence of
fluoride and
oxalate
8.
Test for Nitrite:
3 drops of the solution was placed on a
filter paper, on that-2 drops of acetic acid
and 2 drops of Benzidine solution were
placed.
No characteristic
changes
Absence of
nitrite
9.
Test for Borate:
2 Pinches (50mg) of the solution was
made into paste by using sulphuric acid
and alcohol (95%) and introduced into the
blue flame.
Bluish green
colour flame not
appeared
Absence of
borate
40
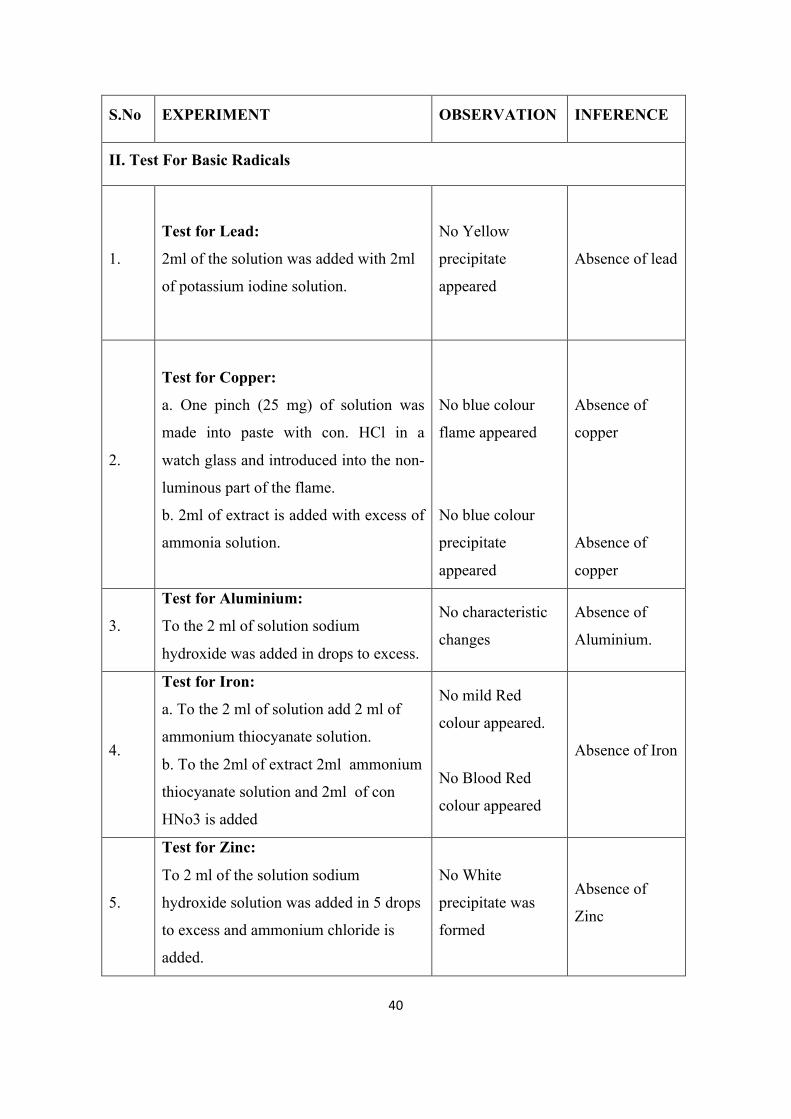
S.No EXPERIMENT OBSERVATION INFERENCE
II. Test For Basic Radicals
1.
Test for Lead:
2ml of the solution was added with 2ml
of potassium iodine solution.
No Yellow
precipitate
appeared
Absence of lead
2.
Test for Copper:
a. One pinch (25 mg) of solution was
made into paste with con. HCl in a
watch glass and introduced into the non-
luminous part of the flame.
b. 2ml of extract is added with excess of
ammonia solution.
No blue colour
flame appeared
No blue colour
precipitate
appeared
Absence of
copper
Absence of
copper
3.
Test for Aluminium:
To the 2 ml of solution sodium
hydroxide was added in drops to excess.
No characteristic
changes
Absence of
Aluminium.
4.
Test for Iron:
a. To the 2 ml of solution add 2 ml of
ammonium thiocyanate solution.
b. To the 2ml of extract 2ml ammonium
thiocyanate solution and 2ml of con
HNo3 is added
No mild Red
colour appeared.
No Blood Red
colour appeared
Absence of Iron
5.
Test for Zinc:
To 2 ml of the solution sodium
hydroxide solution was added in 5 drops
to excess and ammonium chloride is
added.
No White
precipitate was
formed
Absence of
Zinc
41
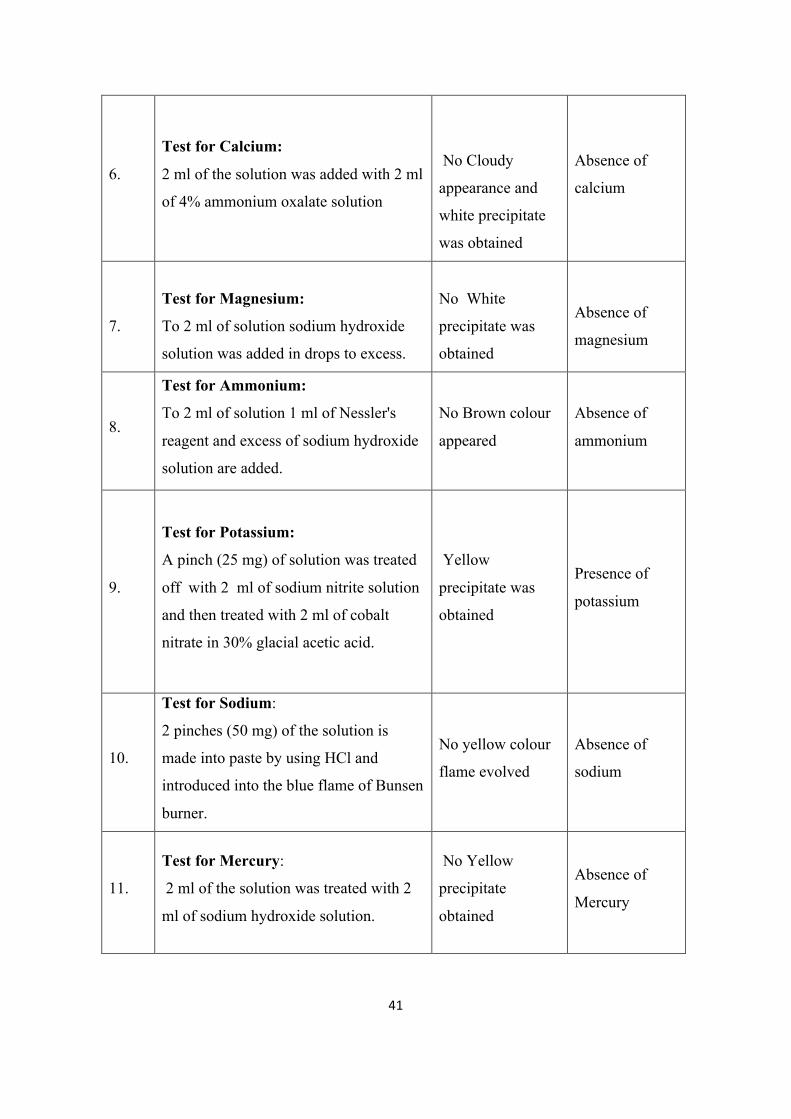
6.
Test for Calcium:
2 ml of the solution was added with 2 ml
of 4% ammonium oxalate solution
No Cloudy
appearance and
white precipitate
was obtained
Absence of
calcium
7.
Test for Magnesium:
To 2 ml of solution sodium hydroxide
solution was added in drops to excess.
No White
precipitate was
obtained
Absence of
magnesium
8.
Test for Ammonium:
To 2 ml of solution 1 ml of Nessler's
reagent and excess of sodium hydroxide
solution are added.
No Brown colour
appeared
Absence of
ammonium
9.
Test for Potassium:
A pinch (25 mg) of solution was treated
off with 2 ml of sodium nitrite solution
and then treated with 2 ml of cobalt
nitrate in 30% glacial acetic acid.
Yellow
precipitate was
obtained
Presence of
potassium
10.
Test for Sodium:
2 pinches (50 mg) of the solution is
made into paste by using HCl and
introduced into the blue flame of Bunsen
burner.
No yellow colour
flame evolved
Absence of
sodium
11.
Test for Mercury:
2 ml of the solution was treated with 2
ml of sodium hydroxide solution.
No Yellow
precipitate
obtained
Absence of
Mercury
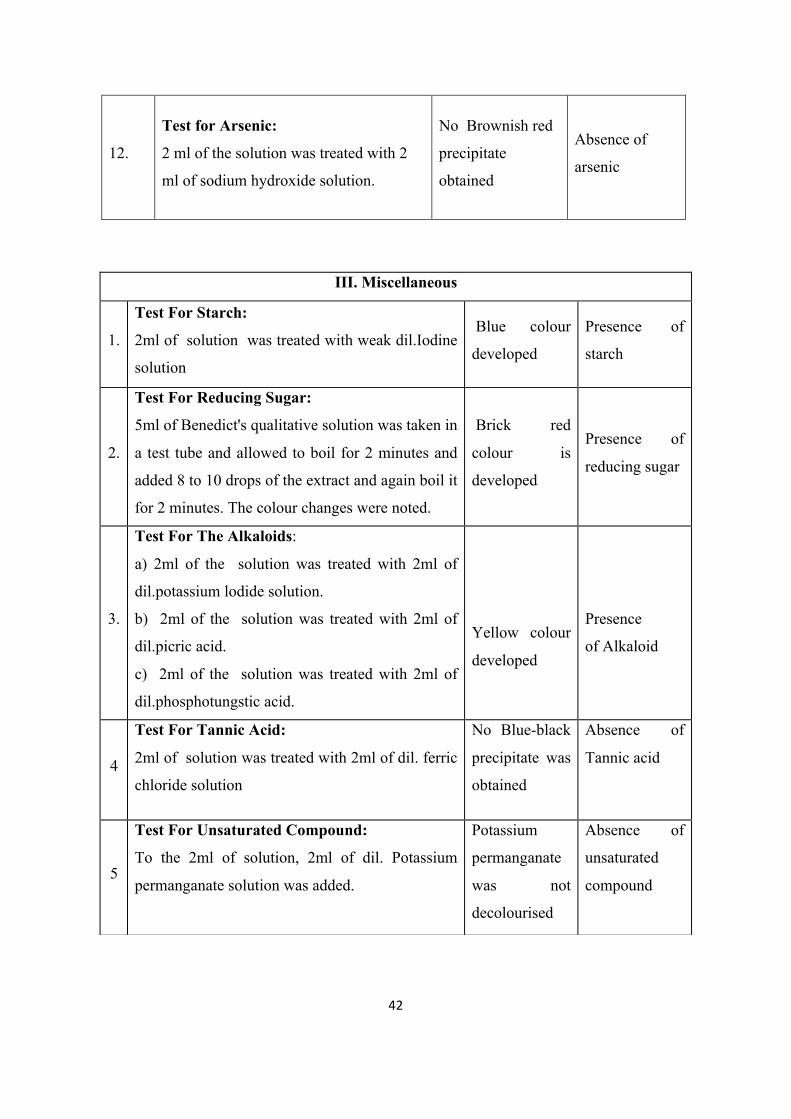
42
12.
Test for Arsenic:
2 ml of the solution was treated with 2
ml of sodium hydroxide solution.
No Brownish red
precipitate
obtained
Absence of
arsenic
III. Miscellaneous
1.
Test For Starch:
2ml of solution was treated with weak dil.Iodine
solution
Blue colour
developed
Presence of
starch
2.
Test For Reducing Sugar:
5ml of Benedict's qualitative solution was taken in
a test tube and allowed to boil for 2 minutes and
added 8 to 10 drops of the extract and again boil it
for 2 minutes. The colour changes were noted.
Brick red
colour is
developed
Presence of
reducing sugar
3.
Test For The Alkaloids:
a) 2ml of the solution was treated with 2ml of
dil.potassium lodide solution.
b) 2ml of the solution was treated with 2ml of
dil.picric acid.
c) 2ml of the solution was treated with 2ml of
dil.phosphotungstic acid.
Yellow colour
developed
Presence
of Alkaloid
4
Test For Tannic Acid:
2ml of solution was treated with 2ml of dil. ferric
chloride solution
No Blue-black
precipitate was
obtained
Absence of
Tannic acid
5
Test For Unsaturated Compound:
To the 2ml of solution, 2ml of dil. Potassium
permanganate solution was added.
Potassium
permanganate
was not
decolourised
Absence of
unsaturated
compound
43
Results
The results of acid and basic radicals were showed in Table no - 4 and Table no - 5.
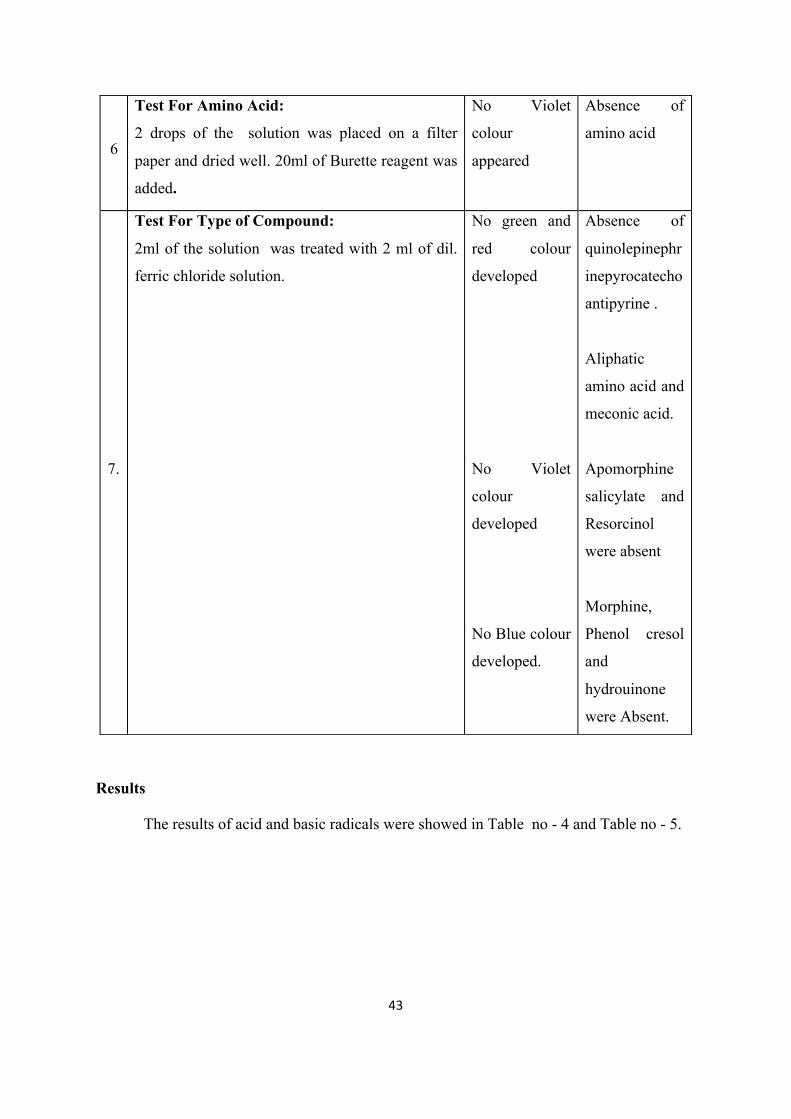
6
Test For Amino Acid:
2 drops of the solution was placed on a filter
paper and dried well. 20ml of Burette reagent was
added.
No Violet
colour
appeared
Absence of
amino acid
7.
Test For Type of Compound:
2ml of the solution was treated with 2 ml of dil.
ferric chloride solution.
No green and
red colour
developed
No Violet
colour
developed
No Blue colour
developed.
Absence of
quinolepinephr
inepyrocatecho
antipyrine .
Aliphatic
amino acid and
meconic acid.
Apomorphine
salicylate and
Resorcinol
were absent
Morphine,
Phenol cresol
and
hydrouinone
were Absent.
44
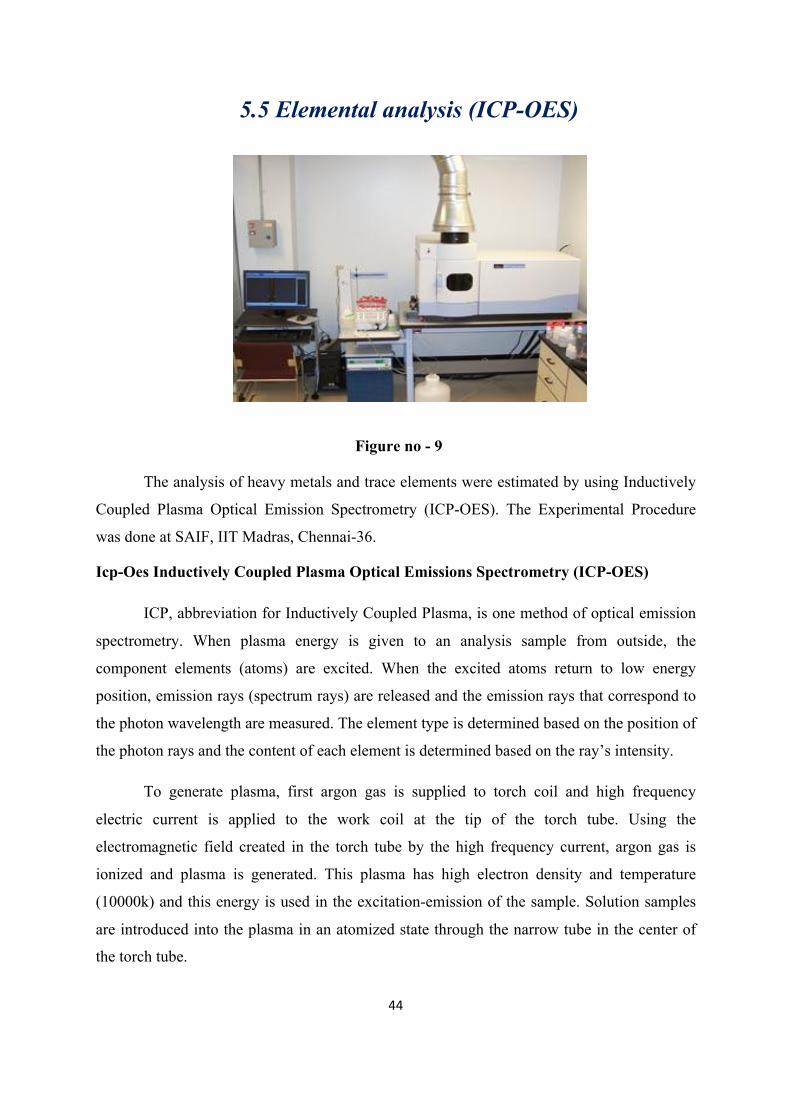
5.5 Elemental analysis (ICP-OES)
Figure no - 9
The analysis of heavy metals and trace elements were estimated by using Inductively
Coupled Plasma Optical Emission Spectrometry (ICP-OES). The Experimental Procedure
was done at SAIF, IIT Madras, Chennai-36.
Icp-Oes Inductively Coupled Plasma Optical Emissions Spectrometry (ICP-OES)
ICP, abbreviation for Inductively Coupled Plasma, is one method of optical emission
spectrometry. When plasma energy is given to an analysis sample from outside, the
component elements (atoms) are excited. When the excited atoms return to low energy
position, emission rays (spectrum rays) are released and the emission rays that correspond to
the photon wavelength are measured. The element type is determined based on the position of
the photon rays and the content of each element is determined based on the ray’s intensity.
To generate plasma, first argon gas is supplied to torch coil and high frequency
electric current is applied to the work coil at the tip of the torch tube. Using the
electromagnetic field created in the torch tube by the high frequency current, argon gas is
ionized and plasma is generated. This plasma has high electron density and temperature
(10000k) and this energy is used in the excitation-emission of the sample. Solution samples
are introduced into the plasma in an atomized state through the narrow tube in the center of
the torch tube.
45
Sample preparation
1. Solids cannot be analyzed directly. Such samples should be made into clear aqueous
medium quantitatively. When acids are used to prepare solutions, care should be
taken. The concentration of the acids in the final provided solution should not be more
than 2 % v/v. Highly acidic and organic solutions cannot be analyzed. As a guide line,
weigh exactly around 200 mg of substance and dissolve it in 5 ml of 5% of water or
aqua regia or whatever acid to make 100 ml of final solution. Make proper dilutions,
if necessary, free HF should not present in the final solution to be aspirated.
2. Ideal concentration is around 100 ppm of the element of interest.
3. Total dissolved solids should be not more than 0.2% w/v in the final solution.
4. Very dilute solution may not give reliable results. Each element has a detection limit.
5. A minimum solution volume of 25 ml is necessary for analysis.
6. In ICP intensity of light emitted when the sample “sprayed or aspirated into an argon
plasma” is measured at different wavelengths. The intensity of light at a given
wavelength will be proportional to a particular elemental ion concentration. The
intensity is calibrated with known standard concentration. For accurate quantitative
results it is necessary to stimulate the sample matrix condition with that of the
standard. Each element generally will have many emission lines and the sensitivity is
different for each of this wave length. When more than one element is present it is
quite common that some emission lines interfere due to overlapping.
7. It is preferable to use plastic containers for sample handling and preserving samples
for ICP-OES analysis. Glass containers can give problems especially when analyzing
certain metal ions at low concentration.
Result
The analytical result of heavy metals and trace elements in Gandhaga Sarkkarai
using ICP-OES were showed in Table no- 6.
46
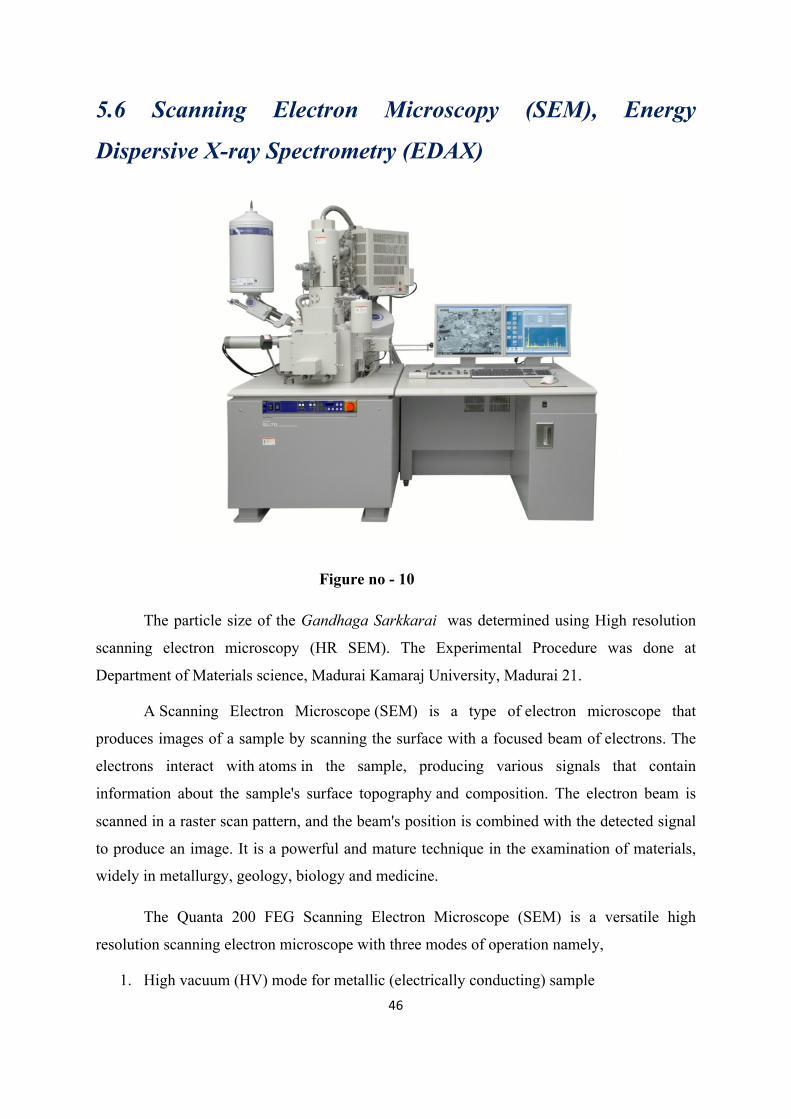
5.6 Scanning Electron Microscopy (SEM), Energy
Dispersive X-ray Spectrometry (EDAX)
Figure no - 10 The particle size of the Gandhaga Sarkkarai was determined using High resolution
scanning electron microscopy (HR SEM). The Experimental Procedure was done at
Department of Materials science, Madurai Kamaraj University, Madurai 21.
A Scanning Electron Microscope (SEM) is a type of electron microscope that
produces images of a sample by scanning the surface with a focused beam of electrons. The
electrons interact with atoms in the sample, producing various signals that contain
information about the sample's surface topography and composition. The electron beam is
scanned in a raster scan pattern, and the beam's position is combined with the detected signal
to produce an image. It is a powerful and mature technique in the examination of materials,
widely in metallurgy, geology, biology and medicine.
The Quanta 200 FEG Scanning Electron Microscope (SEM) is a versatile high
resolution scanning electron microscope with three modes of operation namely,
1. High vacuum (HV) mode for metallic (electrically conducting) sample
47
2. Low vacuum (LV) mode for insulating, ceramic, polymeric (electrically insulating)
3. Environment scanning electron microscope (ESEM) for biological samples
Apart from giving the high resolution surface morphological images, the Quanta 200
FEG also has the analytical capabilities such as detecting the presence of elements down to
boron on any solid conducting materials through the Energy Dispersive X-ray spectrometry
(EDX) providing crystalline information from the few nanometer depth of the material
surface via electron back scattered detection (BSD) system attached with microscope and
advanced technological PBS (WDS) for elemental analysis. EDX analysis is useful in
identifying materials and contaminants, as well as estimating their relative concentrations on
the surface of the specimen. The EDX analysis system works as an integrated feature of a
scanning electron microscope (SEM) and cannot operate on its own without the latter.
Principle
The primary electron beam interacts with the sample in a number of key ways: -
• Primary electrons generate low energy secondary electrons, which tend to emphasize
the topographic nature of the specimen.
• Primary electrons can be backscattered which produces images with a high degree of
atomic number (Z) contrast.
• Ionized atoms can relax by electron shell-to-shell transitions, which lead to either X-
ray emission or Auger electron ejection.
• The X-ray emitted are characteristic of the elements in the top few µm of the sample
and are measured by the EDX detector.
Method : A representative portion of each sample was sprinkled on to a double side carbon
tape and mounted on aluminium stubs, in order to get a higher quality secondary electron
image for SEM examination.
Resolution : 1.2 nm gold particle separation on a carbon substrate
Magnification : From a min of 12 X to greater than 1,00,000 X.
Application : To evaluate grain size, partical size distributions, material homogeneity
and inter metallic distributions.
48
Sample required
§ Any dimension (Height or Diameter) less than 10mm.
§ The ideal shape of a sample was that of a button on a shirt. However, the other sizes
can also be accommodated only after the discussion with the system operator.
§ If the sample was not electrically conducting, it will require silver or gold coating.
§ If the sample was a powder, make a normal button size pellet of the sample.
§ If the sample was insulator (or) polymeric (or) electrically non-conducting it needs to
be coated with carbon.
Sample preparation
§ Sample preparation can be minimal or elaborate for SEM analysis, depending on the
nature of the samples and the data required.
§ Minimal preparation includes acquisition of a sample that will fit into the SEM
chamber and some accommodation to prevent gorge build-up on electrically
insulating samples.
§ Most electrically insulating samples are coated with a thin layer of conducting
material, commonly carbon, gold or some other metal or alloy. The choice of material
for conductive coatings depends on the data to be acquired.
§ Carbon is most desirable if elemental analysis is a priority, while metal coatings are
most effective for high resolution electron imaging applications (57).
Calculation of the particle size:
The horizontal line in the right corner of the micrograph corresponds to micro in
length would be given. A comparison could be made between the length of the particles
visible in the micrograph with this line and the length of the particles was calculated.
Procedure:
An electron beam passing through an evacuated column is focused by electromagnetic
lenses onto the specimen surface. Since an electron is a charged particle, it has a strong
interaction with the specimen (due to coulomb interaction).So when an electron beam images
on a specimen, it is scattered by atomic layers near the surface of the specimen. As a result,
the direction of electron motion changes and its energy is partially lost. Once an incident
electron (primary electron) enters a substance, its direction of motion is influenced by various
obstructions (multiple scattering), and follows a complicated trajectory which is far from a
49
straight line. Also, when electrons with the same energy are incident on the specimen surface,
a portion of electrons is reflected in the opposite direction (back scattered) and the remainder
is absorbed by the specimen (exciting X- rays or other quanta in the process). If the specimen
is sufficiently thin, the electron can pass all the way through the specimen (transmitted
electrons, scattered or non-scattered).
The depth at which various signals are generated due to electron beam – specimen
interaction indicates the diffusion area of the signals in the specimen in addition to the local
chemistry of the specimen. Secondary electrons mainly indicate information about the surface
of a specimen. Since secondary electrons do not diffuse much inside the specimen, they are
most suitable for observing the fine-structures of the specimen surface. That is to say, sharp
scanning images with high resolution can be expected from secondary electrons, because of
the smaller influence on resolution by their diffusion.
As the incident electron energy increases, the probability of incident electrons
Colliding with elemental components of the specimen and releasing secondary electrons also
increases. In other words, as the incident energy increases, the emission of electrons from the
specimen also increases. However, as the energy increases beyond a certain level, the
incident electrons penetrate deeper into the specimen with the result that the specimen
derived electrons use up most of their energy to reach the specimen surface. Consequently,
the electron emission yield decreases. Therefore, the peak secondary electron emission yield
occurs at a specific entry level of the incident electrons.
In order to verify the existence of a substance and recognize its shape, the image
contrast must be well defined. In other words, even if a system boasts extremely high
resolution, if image contrast is poor, it would be extremely difficult to determine the
existence of a substance, let alone recognize its shape. Another important feature of the SEM
is the three-dimensional appearance of the specimen image, which is a direct result of the
large depth of field.
50
Applications:
The SEM is capable of examining objects at very low magnification. This feature is
useful in viewing particle size and shape of any composition at various stages of preparation
in Siddha system as well as other fields.The large depth of field available in the SEM makes
it possible to observe 3-dimensional objects in stereo. Today, a majority of SEM facilities are
equipped with X-ray analytical capabilities. Thus topographic crystallographic and
compositional information can be obtained rapidly, efficiently and simultaneously from the
same area.
The author was chosen this analysis for detecting Particle size of the classical Siddha
herbo-mineral drug Gandhaga sarkkarai .
Advantages of SEM
1. It gives detailed 3D and topographical imaging and the versatile information garnered
from different detectors.
2. This instrument works very fast
3. Modern SEMs allow for the generation o data in digital form
4. Most SEM samples require minimal preparation actions.
Disadvantages of SEM
1. SEMs are expensive and large
2. Special training is required to operate an SEM.
3. The preparation of samples can result in artifacts.
4. SEMs are limited to solid samples.
5. SEMs carry a small risk of radiation exposure associated with the electrons that
scatter from beneath the sample surface.
Results
The results were represented in Table no -7.
51
5.7 Fourier Transform Infrared (FTIR)
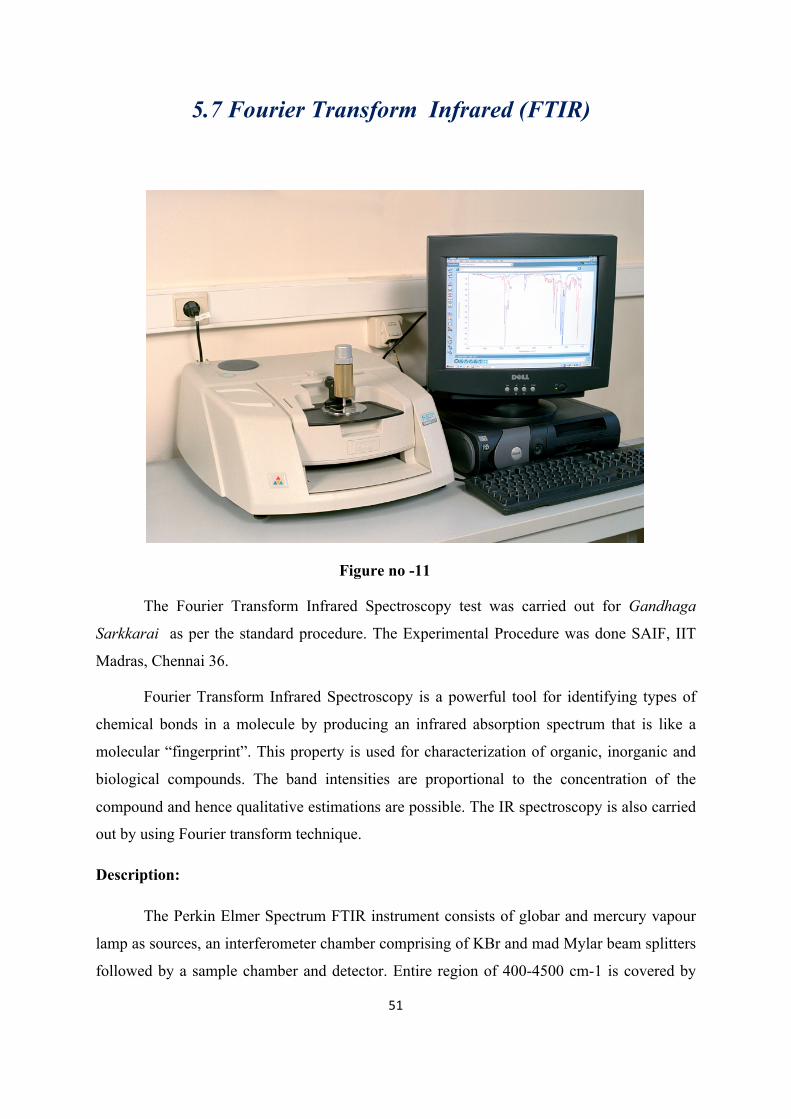
Figure no -11
The Fourier Transform Infrared Spectroscopy test was carried out for Gandhaga
Sarkkarai as per the standard procedure. The Experimental Procedure was done SAIF, IIT
Madras, Chennai 36.
Fourier Transform Infrared Spectroscopy is a powerful tool for identifying types of
chemical bonds in a molecule by producing an infrared absorption spectrum that is like a
molecular “fingerprint”. This property is used for characterization of organic, inorganic and
biological compounds. The band intensities are proportional to the concentration of the
compound and hence qualitative estimations are possible. The IR spectroscopy is also carried
out by using Fourier transform technique.
Description:
The Perkin Elmer Spectrum FTIR instrument consists of globar and mercury vapour
lamp as sources, an interferometer chamber comprising of KBr and mad Mylar beam splitters
followed by a sample chamber and detector. Entire region of 400-4500 cm-1 is covered by
52
this instrument. The spectrometer works under purged conditions. Solid samples are
dispersed in KBr or polyethylene pellets depending on the region of interest. This instrument
has a typical resolution of 1.0 cm -1 cm. Signal averaging, signal enhancement, base line
correction and other spectral manipulations are possible.
The interference pattern obtained from a two beam interferometer as the path
difference between the two beams is altered, when Fourier transformed, gives rise to the
spectrum. The transformation of the interferogram into spectrum is carried out
mathematically with a dedicated on- line computer.
Model : Spectrum 1 FTIR spectrometer
Scan range : MIR 450-4500 cm-1
Resolution : 1.0 cm-1
Sample required : 50 mg solid or liquid.
Sample preparation
Solid : KBr or Nujol mull method
Liquid : Cal / TIBr cells
Gas : Gas cells
KBr method:
The sample was grounded using an agate motor and pestle to give a very fine powder.
The finely powder sample was mixed with about 100 mg dried potassium bromide salt. The
mixture was then pressed under hydraulic press using a die to yield a transparent disc
(measure about 13mm diameter and 0.3 mm in thickness) through which the beam of
spectrometer passed.
53
Applications:
Infrared spectrum is useful in identifying the functional groups like – OH, -CN, -NH2,
etc. Also quantitative estimation is possible in certain cases for chemical, pharmaceuticals,
petroleum products etc. Resins from industries, water and rubber samples can be analysed.
Blood and food materials can also be analysed.
Measurements Techniques:
The procedure for recording the %T or %A is as follows:
1. Air is first scanned for the reference and stored. The sample is then recorded
andfinally the ratio of the sample and reference data is computed to give
required %T or %A at various frequencies.
2. Study of substances with strong absorbance bands and weak absorbance bands
aswell as possible.
3. Small amount of samples are sufficient
4. High resolution is obtained.
Procedure:
Typically,1.5 mg of protein, dissolved in the buffer used for its purification, were
centrifuged in a 30 K Centric on micro concentrator (Amicon) at 3000_g at 4oC until a
volume of approximately 40 Al.
1. Then, 300 Al of 20 mM buffer, prepared in H20 or 2H20, pH or p2H 7.2, were added
and the sample concentrated again. The p2H value corresponds to the pH
2. meter reading + 0.4. The concentration and dilution procedure was repeated several
times in order to completely replace the original buffer with the This buffer.
3. The washings took 24 h, which is the time of contact of the protein with the 2H20
4. medium prior FT-IR analysis. In the last washing, the protein was concentrated to fine
a volume of approximately 40 Al and used for the infrared measurements.
5. The concentrated protein sample was placed in CaF2 windows and a 6 Am tin spacer
or a 25 Am Teflon spacer for the experiments in H20 or 2H20, respectively. FT-IR
spectra were recorded by means of a Perkin-Elmer -Spectrum-1 FT-IR spectrometer
using a deuteratedtriglycinesulfate detector.
6. At least 24 h before, and during data acquisition, the spectrometer were continuously
purged with dry air at a dew point of 40oC. Spectra of buffers and samples were
acquired at 2 cm_1 resolution under the same scanning and temperature conditions. In
54
the thermal denaturation experiments, the temperature was raised in 5oC steps from 20
to 95oC.
7. Before spectrum acquisition, samples were maintained at the desired temperature for
the time necessary for the stabilization of temperature inside the cell (6 min).Spectra
were collected and processed using the SPECTRUM software from Perkin-Elmer.
Correct subtraction of H20 was judged to yield an approximately flat baseline at 1900-
1400 cm_ 1, and subtraction of 2H20 was adjusted to the removal of the2H20 bending
absorption close to 1220 cm_ 1
KBr Method
1. The sample is grounded using an agate mortar and pestle to give a very fine powder.
2. The finely powder sample is then mixed with about 100mg dried KBr salt.
3. The mixture is then pressed under hydraulic press using a die to yield a transparent
disc and measure about 13mm diameter and 0.3mm in thickness.
Nujol Mull Method:
1. The sample is ground using an agate mortar and pestle to give a very fine powder.
2. A small amount is then mixed with nujol oil to give a paste and this paste is
thenapplied between two sodium chloride plates.
3. The plates are then placed in the instrument sample holder ready for scanning.
Liquids:
1. Viscous liquids can be smeared in the cell and directly measured.
2. For dilute solutions, liquid cells and variable path length cells are employed.
Applications:
Infrared spectrum is useful in identifying the functional groups like -OH, -CN, -CO, -
CH, -NH2, etc. Also quantitative estimation is possible in certain cases for chemicals,
pharmaceuticals, petroleum products, etc. Resins from industries, water and rubber samples
can be analyzed.
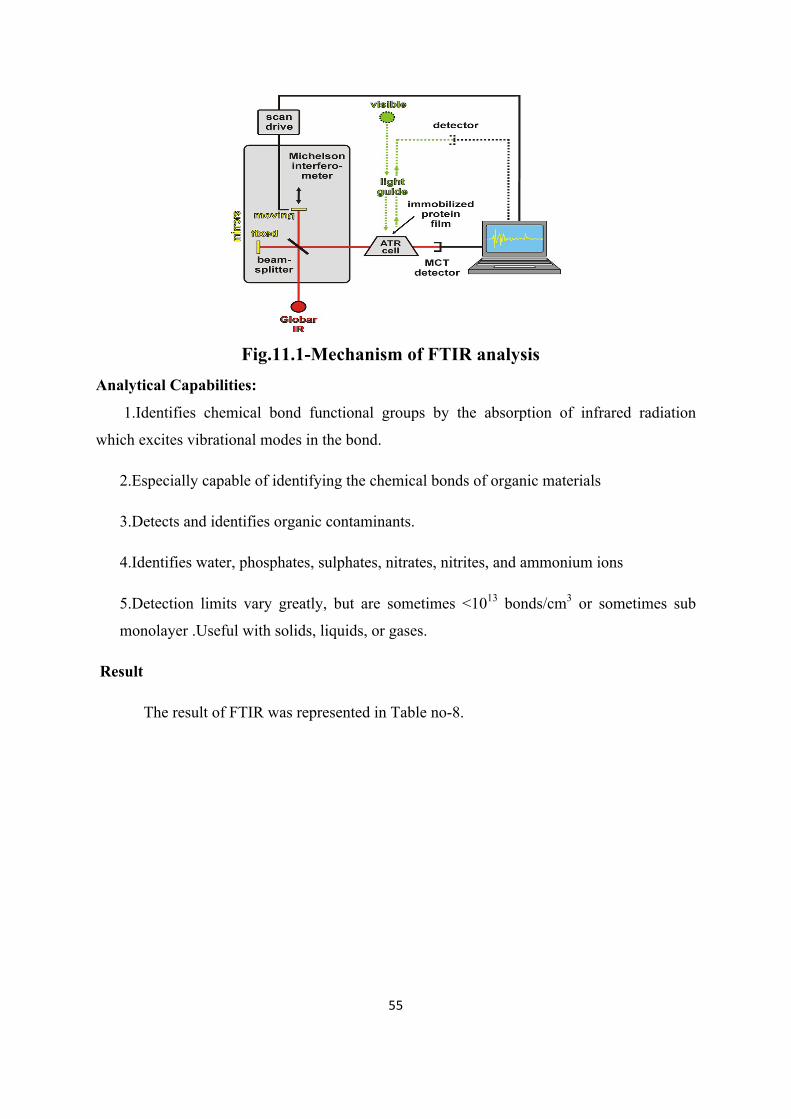
55
Fig.11.1-Mechanism of FTIR analysis
Analytical Capabilities:
1.Identifies chemical bond functional groups by the absorption of infrared radiation
which excites vibrational modes in the bond.
2.Especially capable of identifying the chemical bonds of organic materials
3.Detects and identifies organic contaminants.
4.Identifies water, phosphates, sulphates, nitrates, nitrites, and ammonium ions
5.Detection limits vary greatly, but are sometimes <1013 bonds/cm3 or sometimes sub
monolayer .Useful with solids, liquids, or gases.
Result
The result of FTIR was represented in Table no-8.
56
5.8 X- ray Diffraction
The X-ray powder diffraction test was carried out for Gandhaga Sarkkarai as per the
standard procedure. The Experimental Procedure was done SAIF, IIT Madras, Chennai 36.
X-ray powder diffraction (XRD) is a rapid analytical technique primarily used for
phase identification of a crystalline material and can provide information on unit cell
dimensions. It is a compact advanced instrument. When X-rays falls over a crystal, it diffracts
in a pattern characteristic to its structure. A diffraction pattern plots Intensity against the
angle of detector. Diffraction occurs when light is scattered by a periodic array with the range
of order, producing constructive interference at specific angles. The pattern contains
information about the atomic arrangement in crystal. Amorphous materials like glass do not
have periodic array with long range order, so they do not produce any significant diffraction
pattern.
Sample required:
25 gm to be submitted
Sample preparation
1. Approximately 1gm was kept as a reference, 5gm was taken for sample preparation
and the remainder was used for preparation of decalcified, fractioned 2- 20µ and less
than 2µ samples.
2. Sample was disaggregated in waring blenders with 250ml hot distilled water until no
lumps of sediment is visible.
3. The sample was centrifuged and the wash-water was decanted.
4. Then the sample was allowed to dry and disaggregated manually with a mortar and
pestle.
5. Coarse grained sample was reduced to silt size.
6. Then it was placed in mortar and pestle grinders and heat generated grinding done
under butanol for 2 hours.
7. After grinding, butanol as evaporated under heat lamps.
8. The ground sample was treated with trihexylamine acetate.
9. Then the sample was pressed into sample holder.
57
Benefits
It serves a major role in all stage of drug development, testing and production. It is an
essential part of analytical research and development, quality control of the active
ingredients, excipients and final products. It helps in elucidation of the relevant polymorphic
and pseudo- polymorphic forms in pharmaceutical development.
Advantages
The PXRD analysis of crystalline compounds gives a diffraction pattern consisting of
a well-defined, narrow, sharp and significant peak while amorphous materials do not give
clear peaks rather the pattern has noise signals, smeared peak or it can have some short order
bumps. Powder XRD is used to determine the crystallinity by comparing the integrated
intensity of the background pattern to that of the sharp peaks.
Strengths
v Powerful and rapid (< 20 min) technique for identification of an unknown mineral.
v In most cases, it provides an unambiguous mineral determination.
v XRD units are widely available and minimal sample preparation is required.
v Data interpretation is relatively straight forward.
Limitations
v Homogeneous and single phase material is best for identification of an unknown.
v Must have access to a standard reference file of inorganic compounds (d-
spacings, hkls).
v Requires tenths of a gram of material which must be ground into a powder.
v For unit cell determinations, indexing of patterns for non-isometric crystal systems
is complicated.
v Peak overlay may occur and worsens for high angle 'reflections'.
Result
The result of X-ray diffraction was represented in Figure 4.
58
5.9 Thermo-gravimetric analysis
The TGA test was carried out for Gandhaga Sarkkarai as per the standard procedure.
The Experimental Procedure was done SAIF, IIT Madras, Chennai 36.
It is a method of thermal analysis in which the mass of a sample is measured over
time as the temperature changes. This measurement provides information about physical
phenomena, such as phase transitions, absorption and desorption as well as chemical
phenomena including chemisorption, thermal decomposition and solid- gas reactions.
Principle
The principle of thermo-gravimetry is based on the simple fact that the sample is
weighed continuously as it is being heated to elevated temperatures and changes in the mass
of a sample are studied.
Changes in temperature affect the sample. Not all thermal changes/events bring a
change in mass of sample i.e. melting, crystallization but some thermal events i.e. desorption,
absorption, sublimation, vaporization, oxidation, reduction and decomposition bring a drastic
change in mass of sample. It is used in analysis of volatile products, gaseous products lost
during the reaction in thermoplastics, thermosets, elastomers, composites, films, fibres,
coatings, paints, etc.
Types of Thermo-gravimetry
1.Isothermal/ Static Thermo-gravimetry
In this technique the sample weight is recorded as a function of time at constant
temperature.
2. Quasistatic Thermo-gravimetry
In this technique the sample is heated to constant weight at each of the series of
increasing temperature.
59
3. Dynamic Thermo-gravimetry
In this technique a sample is heated in an environment whose temperature is changing
in predetermine manner generally at linear rate. Most of the studies are generally carried out
with dynamic thermogravimetry. Therefore, it is generally referred to as thermogravimetry
Sample preparation
1. Sample preparation has a significant effect in obtaining good data.
2. It is suggested that maximizing the surface area of the sample in a TGA pan improves
resolution and reproducibility of weight loss measurements.
3. Typically, 10-20mg of sample is preferred in most applications.
4. Whereas, if the sample has volatile 50-100mg of sample is considered adequate.
5. It is to be noted that most TGA instruments have baseline drift of ±0.025mg which is
±0.25% of a 10mg sample.
6. In heating rate method, Samples are heated at a rate of 10 or 20◦c/min in most cases.
Lowering the heating rates is known to improve the resolution of overlapping weight
losses.
7. In pure gas method, nitrogen is the most common gas used to purge samples in TGA
due to its inert nature. Whereas, helium provides the best baseline.
Factors affecting TGA curve
1. Instrumental factors
a. Heating rate
b. Effect of furnace atmosphere
c. Sample holder
2. Sample characteristics
a. Weight of the sample
b. Sample particle size
c. Heat of reaction
d. Compactness of the sample
e. Previous history of the sample
60
Applications of TGA
1. From TGA, we can determine the purity and thermal stability of both primary and
secondary standards.
2. Determination of the composition of complex mixture and decomposition of complex.
3. For studying the sublimation behavior of various substances.
4. TGA is used to study the kinetics of the reaction rate constant.
5. Used in the study of catalyst: The change in the chemical states of the catalyst may be
studied by TGA techniques. Zinc- Zinc chromate is used as the catalyst in the
synthesis of methanol.
Result
The result of Thermogravimetric analysis was represented in Figure 5.
61
5.10 Hptlc-Higher Perfomance Thin layer Chromotagraphy
High-perfomance thin layer chromatography (HPTLC) is an enhanced form of thin
layer chromatography (TLC) .A number of enhancements can be made tp the basic method of
thin-layer chromatography to automate the different steps , to increase the resolution
achieved and to allow more accurate quantitative mesurements.
Automation is useful to overcome the uncertainly in droplet size and position when
the sample is applied to the TLC plate by hand .One recent approach to automation has been
the use of piezoelectric device and inkjet printers for applying the sample drugs .
The spot capacity can be increased by developing the plate with two different
solvents, using two dimensional chromatography .The procedure begins with development of
sample loaded plate with first solvent. After removing it , the plate is rotated 90 degree and
developed with second solvent.
Thin layer chromatography (TLC) is a chromatographic technique used to separate
the components of a mixture using a thin stationary phase supported by an inert backing. It
may be performed on the analytical scale as a means of monitoring the progress of a reaction,
or on the preparative scale to purify small amounts of a compound.
TLC/HPTLC is an analytical tool widely used because of its simplicity, relative low
cost, high sensitivity, and speed of separation. TLC/HPTLC functions on the same principle
as all chromatography: a compound will have different affinities for the mobile and stationary
phases, and this affects the speed at which it migrates. The goal of TLC/HPTLC is to obtain
well defined, well separated spots.
Retention Factor
After a separation is complete, individual compounds appear as spots separated
vertically. Each spot has a retention factor (Rf) which is equal to the distance migrated over
the total distance covered by the solvent.
Distance travelled by sample
Rf = ---------------------------------------------------
Distance travelled by solvent
62
The Rf value can be used to identify compounds due to their uniqueness to each
compound. When comparing two different compounds under the same conditions.
The compound with the larger Rf value is less polar because it does not stick to the
stationary phase as long as the polar compound, which would have a lower Rf value.
Result
The result of HPTLC was represented in Figure no -17.
63
6.1 Anti-histamine activity
Anti-histamine activity of Gandhaga Sarkkarai on Wistar albino rats
Aim: To evaluate the Anti-histamine activity of Gandhaga Sarkkarai in Wistar albino rats
by Evans dye method.
Materials and methods:
Test Substance : Gandhaga Sarkkarai.
Animal Source : The Tamilnadu Veterinary and Animal Sciences
University, Madhavaram.
Animals : Wistar albino rats (Male -12, Female -12)
Age : 8-10 weeks.
Body Weight : 250-250gm.
Acclimatization : 14 days prior to dosing.
Veterinary examination : Prior and at the end of the acclimatization period.
Identification of animals : By cage number, animal number and individual
marking by using Picric acid.
Diet : Pellet feed
Water : Aqua guard portable water in polypropylene bottles.
Housing & Environment : The animals were housed in Polypropylene cages
provided with bedding of husk.
Housing temperature : 24-28°C
Relative humidity : between 30% and 70%,
Air changes : 10 to 15 per hour
Dark and light cycle : 12:12 hours.
64
Selection of animals:
Healthy Wistar albino rats (150-200gm) of both sex were used for this study with the
approval of the Institutional Animal Ethics Committee and obtained from the animal
laboratory. IAEC approved no: IAEC/LI/24/CLBMCP/2017
The animals were kept in plastic cages and maintained at 24-28°C. All the rats were
housed individually with free access to food, water and libitum. They were feed with standard
diet and kept in well ventilated animal house they also maintained with alternative dark-light
cycle of 12hrs throughout the studies. Rats were allowed an acclimatization period of 14 days
before actual experiments. The rats were closely observed for any infection and if they show
signs of infection they were excluded from the study. The animal experiment was performed
with accordance legislation on welfare.
Experimental Design for Evan’s dye method
The animals were divided into 4 groups. Each group has contains 6 animals .
Group 1 : Vehicle control (Honey)
Group II : Standard drug- Citrizine (20mg/kg)
Group III : Received test drug Gandhaga Sarkkarai (100mg/kg)
Group IV : Received test drug Gandhaga sarkkarai (200mg/kg)
Procedure : Vascular permeability test in rats :
Immediately after an i.v. injection of 1 ml of 1 % Evans blue in physiological saline,
two sites on one side of the shaved back of animals were injected intradermally with 0.1 ml
of physiological saline containing 0.1 µg histamine, Contralateral sites were injected
intradermally with an equal volume of physiological saline (the control skin areas).
Gandhaga Sarkkarai is given orally 30 min before to the injection of phlogistic agents. Thirty
minutes later, the animals were sacrificed by overdose of anesthesia, and the skin was
removed. Exudation of dye was calculated by subtracting the amount determined in the
control skin area and expressed as the mean of two values obtained in each animal.
Result : The results of anti-histamine activity were showed in Table – 9 and Chart 3.
65
6.2 Anti- inflammatory activity
Anti-inflammatory activity of Gandhaga sarkkarai on Wistar albino rats
Aim
To evaluate the anti - inflammatory activity of Gandhaga Sarkkarai in Wistar albino
rats by Carrageenan induced paw oedema method.
Materials and methods
Test Substance : Gandhaga Sarkkarai.
Animal Source : The Tamilnadu Veterinary and Animal Sciences
University, Madhavaram.
Animals : Wistar albino rats (Male -12, female -12)
Age : 6-8 weeks
Body Weight : 150-200gm.
Acclimatization : 14 days prior to dosing.
Veterinary examination : Prior and at the end of the acclimatization period.
Identification of animals : By cage number, animal number and individual
marking by using Picric acid.
Diet : Pellet feed
Water : Aqua guard portable water in polypropylene bottles.
Housing & Environment : The animals were housed in Polypropylene cages
provided with bedding of husk.
Housing temperature : 24-28°C
Relative humidity : between 30% and 70%,
Air changes : 10 to 15 per hour
Dark and light cycle : 12:12 hours.
66
Selection of animals:
Healthy Wistar albino rats (150-200gm) of both sex were used for this study with the
approval of the Institutional Animal Ethics Committee and obtained from the animal
laboratory. IAEC approved no: NIS/IAEC-III/02/29092016
The animals were kept in plastic cages and maintained at 24-28°C. All the rats were
housed individually with free access to food, water and libitum. They were feed with standard
diet and kept in well ventilated animal house they also maintained with alternative dark-light
cycle of 12hrs throughout the studies. Rats were allowed an acclimatization period of 14 days
before actual experiments. The rats were closely observed for any infection and if they show
signs of infection they were excluded from the study. The animal experiment was performed
with accordance legislation on welfare.
Experimental Design for Carrageenan induced paw oedema method
The animals were divided into 4 groups. Each group has contain 6 animals .
Group 1 : Vehicle control (Honey)
Group II : Standard drug- Indomethacin (10mg/kg)
Group III : Received test drug Gandhaga Sarkkarai (100mg/kg)
Group IV : Received test drug Gandhaga sarkkarai (200mg/kg)
One hour after the administration of drugs, acute inflammation is produced by sub
plantar injection of 0.1 ml of 1% suspension of carrageenan with normal saline in the right
hind paw of the rats. Then the paw oedema is measured plethysomometrically at 0, 1, 2 and 3
hours after the carrageenan injection.
Result
The results of anti- inflammatory activity were showed in Table – 10 and Chart 4.
67
6 .3 Analgesic activity
Analgesic activity of Gandhaga sarkkarai on Swiss albino mice.
Aim:
To evaluate the Analgesic activity of Gandhga sarkkarai in Swiss albino mice by
Eddy’s Hot plate method.
Materials and methods:
Test Substance : Gandhaga Sarkkarai.
Animal Source : The Tamilnadu Veterinary and Animal Sciences
University, Madhavaram
Animals : Swiss albino mice (Male -12, female -12)
Age : 6-8 weeks
Body Weight : 20-25gm.
Acclimatization : 14 days prior to dosing.
Veterinary examination : Prior and at the end of the acclimatization period.
Identification of animals : By cage number, animal number and individual
marking by using Picric acid.
Diet : Pellet feed
Water : Aqua guard portable water in polypropylene bottles.
Housing & Environment : The animals were housed in Polypropylene cages
provided with bedding of husk.
Housing temperature : 24-28°C
Relative humidity : between 30% and 70%,
Air changes : 10 to 15 per hour
Dark and light cycle : 12:12 hours.
68
Selection of Experimental animals:
The experimental protocol was submitted and approved by institutional Ethical
Committee, (IAEC approved no: NIS/IAEC-III/02/29092016). Swiss albino mice (20-25
gm) of approximate same age were employed in this investigation.
The animals were kept in plastic cages and maintained at 24-28°C. All the mice were
housed individually with free access to food, water and libitum. They were feed with standard
diet and kept in well ventilated animal house they also maintained with alternative dark-light
cycle of 12hrs throughout the studies. Mice were allowed an acclimatization period of 14
days before actual experiments. The mice were closely observed for any infection and if they
show signs of infection they were excluded from the study. The animal experiment was
performed with accordance legislation on welfare.
Evaluation of Analgesic activity
Pain is the part of a defensive reaction against dysfunction of an organ or imbalance
in its functions against potentially dangerous stimulus. The ascending pathway of pain
includes the contralateral spinothalamic tract, lateral pons, mid brain to thalamus and
ultimately through the somatosensory cortex of the brain that determines the locations,
intensity and depth of pain
Eddy’s Hot plate method:
Principle: Painful reactions can be produced in experimental animals by applying noxious
stimuli such as thermal – using radiant heat as a source of pain, chemical – using irritants
such as acetic acid and bradykinin and physical pressure – using tail compression.
The hot plate test was a test of the pain response in animals. It was used in basic pain
research and in testing the effectiveness of analgesics by observing the reaction to pain
caused by heat.
They used a behavioral model of nociception where behaviors such as jumping and
hind paw-licking are elicited following a noxious thermal stimulus. Licking was a rapid
response to painful thermal stimuli that was a direct indicator of nociceptive threshold.
Jumping represents a more elaborated response, with a latency and encompasses an
emotional component of escaping.
69
Animals
Mice 20-25 g were grouped in four groups, six animals in each group.
Grouping
Group I : Vehicle control
Group II : Standard drug - Pentazocine (10mg/kg/i.p)
Group III : Gandhaga Sarkkarai (100mg/kg)
Group IV : Gandhaga Sarkkarai (400mg/kg)
Equipment:
Eddy’s Hot plate
Procedure:
Animals were weighed and placed on the hot plate. Temperature of the hot plate was
maintained at 55 ± 1ͦ C. Jumping response was seen. The time period (latency period), from
when the animals were placed and until the responses occurred, were recorded using a
stopwatch. To avoid tissue damage of the animals, 10 seconds was kept as a cut off time.
The time obtained was considered the basal / normal reaction time in all the untreated groups
of animals. Increase in the basal reaction time was the index of analgesia. All the animals
were screened initially at least three times in this way and the animals showing a large range
of variation in the basal reaction time were excluded from the study. A final reading of the
basal reaction time was recorded for the included animals. After selecting the animals, the
drugs were administered to all the groups at the stipulated doses. The reaction times of the
animals were then noted at 0, 30, 60, 120 and 180 mins interval after drug administration.
Result
The results of analgesic activity were showed in Table – 11 and Chart 5.
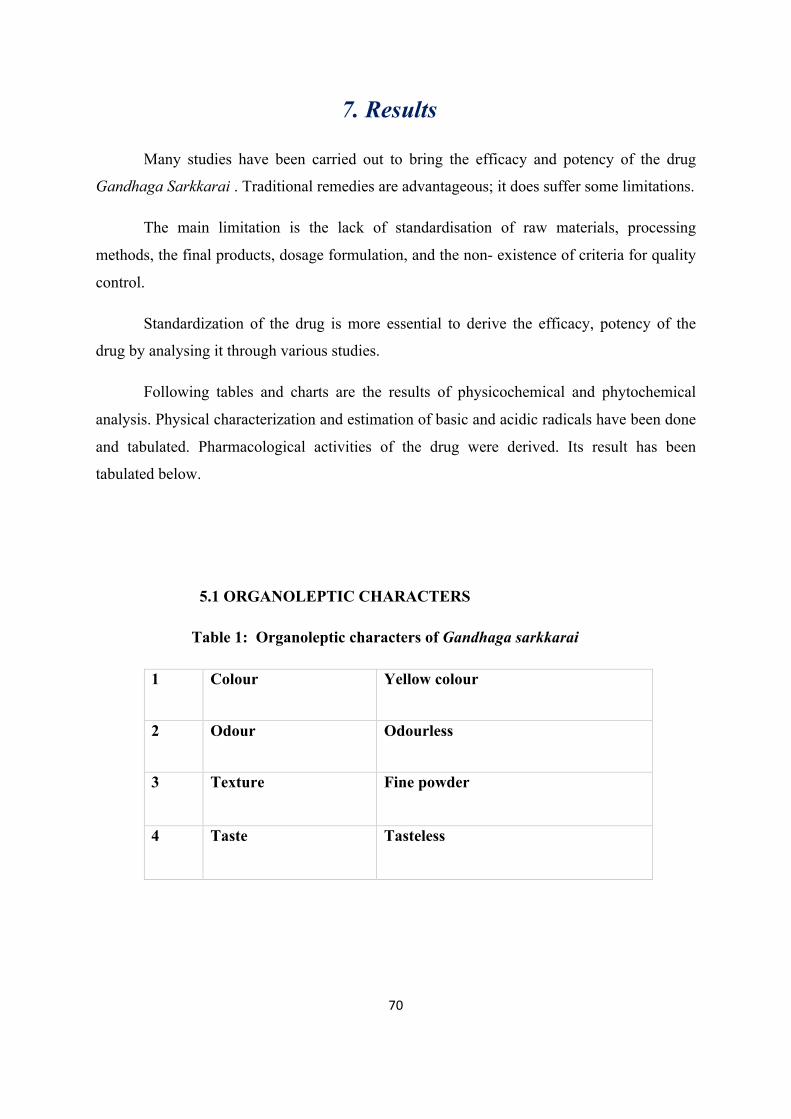
70
7. Results
Many studies have been carried out to bring the efficacy and potency of the drug
Gandhaga Sarkkarai . Traditional remedies are advantageous; it does suffer some limitations.
The main limitation is the lack of standardisation of raw materials, processing
methods, the final products, dosage formulation, and the non- existence of criteria for quality
control.
Standardization of the drug is more essential to derive the efficacy, potency of the
drug by analysing it through various studies.
Following tables and charts are the results of physicochemical and phytochemical
analysis. Physical characterization and estimation of basic and acidic radicals have been done
and tabulated. Pharmacological activities of the drug were derived. Its result has been
tabulated below.
5.1 ORGANOLEPTIC CHARACTERS
Table 1: Organoleptic characters of Gandhaga sarkkarai
1 Colour Yellow colour
2 Odour Odourless
3 Texture Fine powder
4 Taste Tasteless
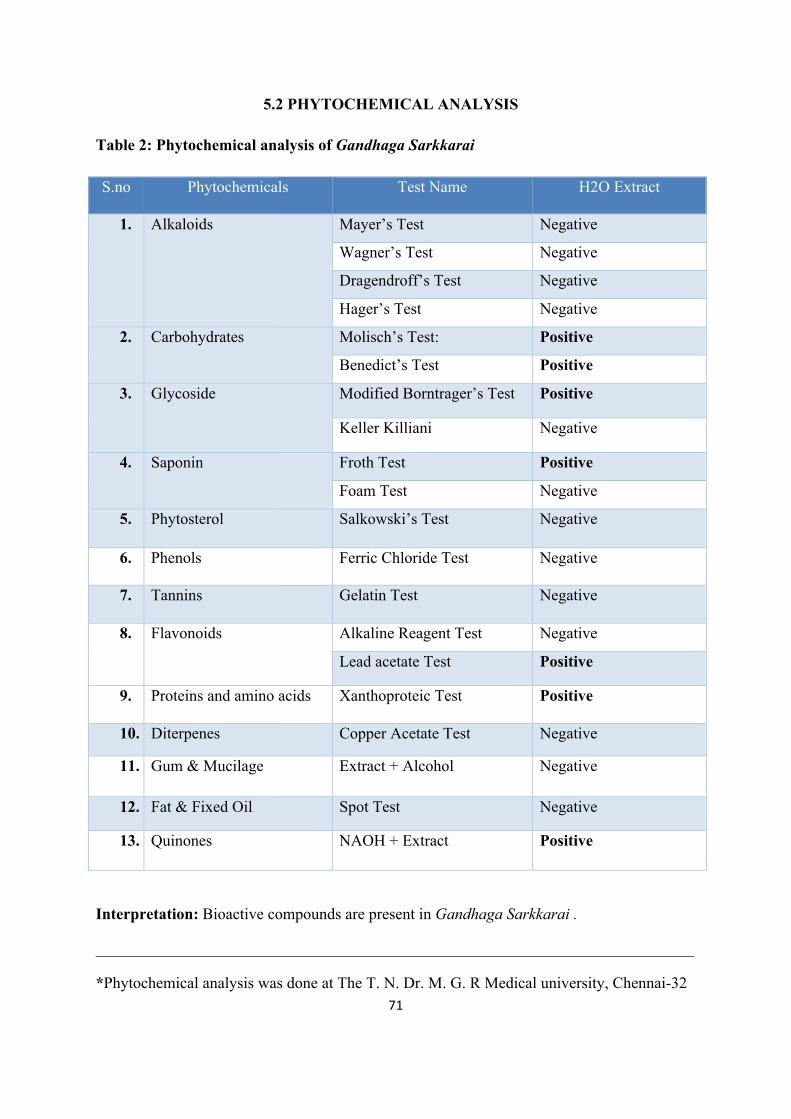
71
5.2 PHYTOCHEMICAL ANALYSIS
Table 2: Phytochemical analysis of Gandhaga Sarkkarai
S.no Phytochemicals Test Name H2O Extract
1. Alkaloids Mayer’s Test Negative
Wagner’s Test Negative
Dragendroff’s Test Negative
Hager’s Test Negative
2. Carbohydrates Molisch’s Test: Positive
Benedict’s Test Positive
3. Glycoside Modified Borntrager’s Test Positive
Keller Killiani Negative
4. Saponin Froth Test Positive
Foam Test Negative
5. Phytosterol Salkowski’s Test Negative
6. Phenols Ferric Chloride Test Negative
7. Tannins Gelatin Test Negative
8. Flavonoids Alkaline Reagent Test Negative
Lead acetate Test Positive
9. Proteins and amino acids Xanthoproteic Test Positive
10. Diterpenes Copper Acetate Test Negative
11. Gum & Mucilage Extract + Alcohol Negative
12. Fat & Fixed Oil Spot Test Negative
13. Quinones NAOH + Extract Positive
Interpretation: Bioactive compounds are present in Gandhaga Sarkkarai .
___________________________________________________________________________
*Phytochemical analysis was done at The T. N. Dr. M. G. R Medical university, Chennai-32
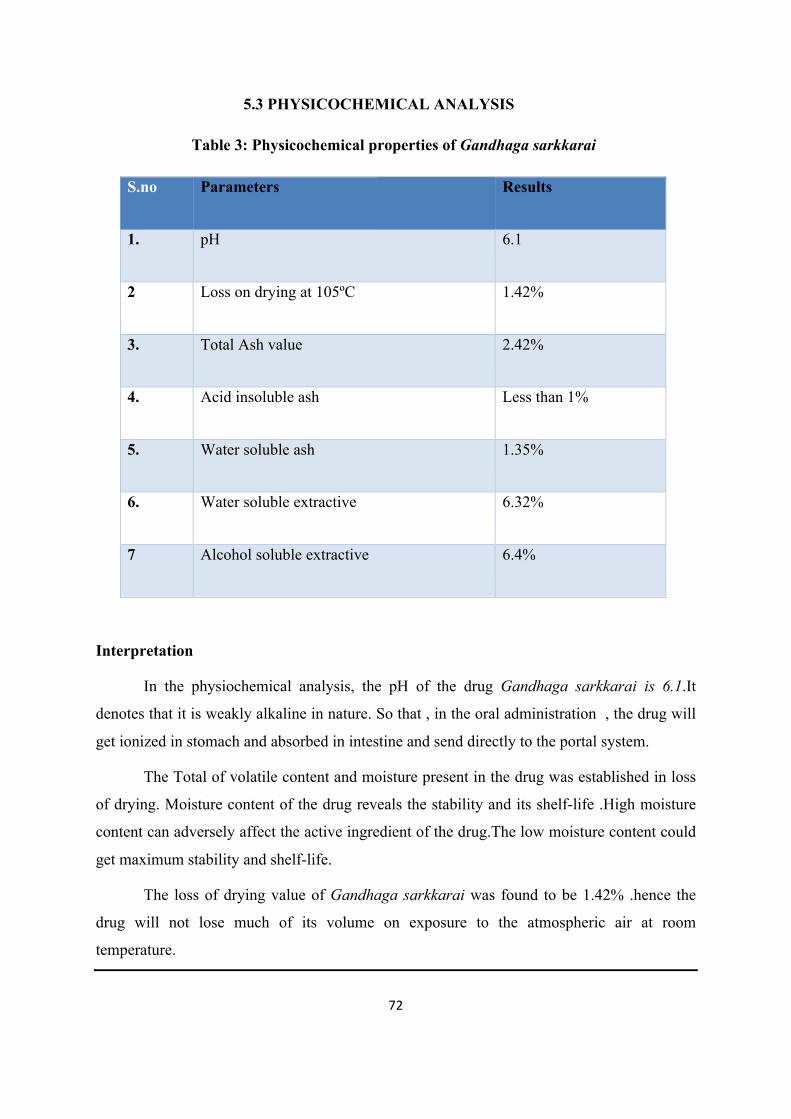
72
5.3 PHYSICOCHEMICAL ANALYSIS
Table 3: Physicochemical properties of Gandhaga sarkkarai
S.no Parameters Results
1. pH 6.1
2 Loss on drying at 105ºC 1.42%
3. Total Ash value 2.42%
4. Acid insoluble ash Less than 1%
5. Water soluble ash 1.35%
6. Water soluble extractive 6.32%
7 Alcohol soluble extractive 6.4%
Interpretation
In the physiochemical analysis, the pH of the drug Gandhaga sarkkarai is 6.1.It
denotes that it is weakly alkaline in nature. So that , in the oral administration , the drug will
get ionized in stomach and absorbed in intestine and send directly to the portal system.
The Total of volatile content and moisture present in the drug was established in loss
of drying. Moisture content of the drug reveals the stability and its shelf-life .High moisture
content can adversely affect the active ingredient of the drug.The low moisture content could
get maximum stability and shelf-life.
The loss of drying value of Gandhaga sarkkarai was found to be 1.42% .hence the
drug will not lose much of its volume on exposure to the atmospheric air at room
temperature.
73
Ash constitutes the inorganic residues obtained after complete combustion of a drug.
Thus Ash value is a validity parameter describe and to assess the degree of purity of a given
drug.
Total ash value indicates the amount of minerals and earthy materials present in the
plant material. The total inorganic content (potassium, sulphur etc.,) present in the drug is
measured through the Total ash value and it is of 2.42 % for Gandhaga Sarkkarai ..
The acid insoluble ash value of the drug denotes the amount of siliceous matter
present in the plant. The quality of the drug is better if the acid insoluble value is low. It is
less than 1% for Gandhaga sarkkarai.
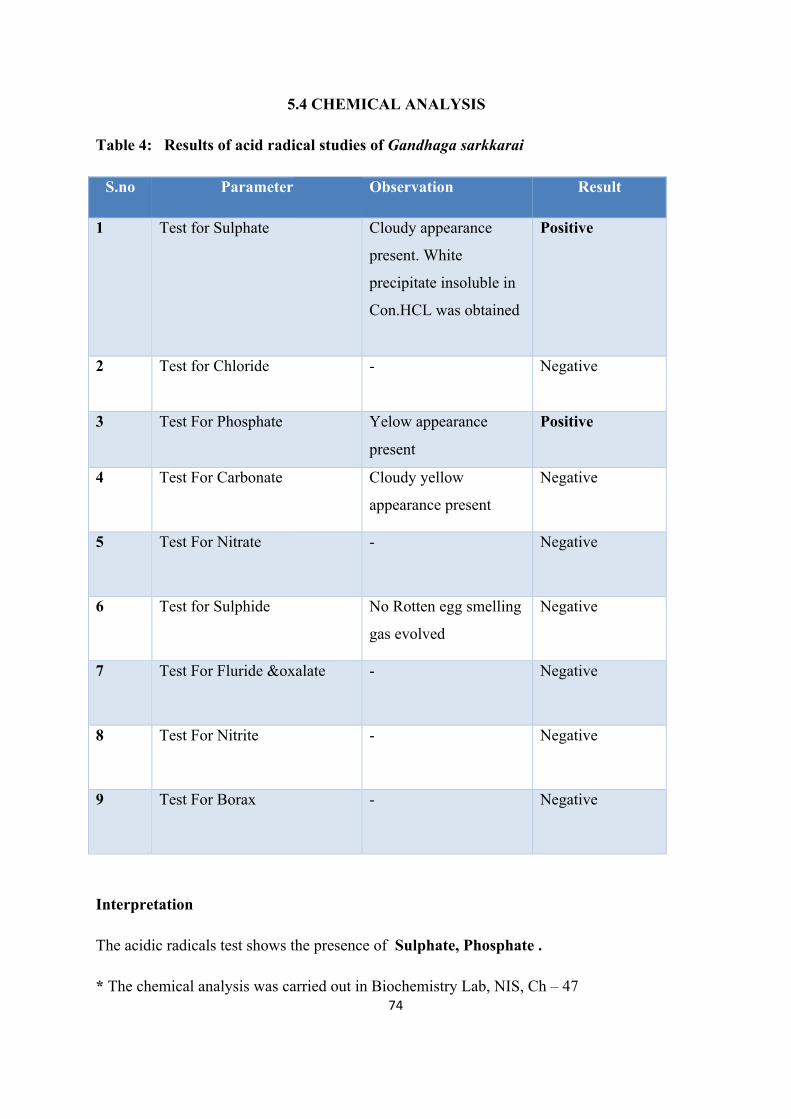
74
5.4 CHEMICAL ANALYSIS
Table 4: Results of acid radical studies of Gandhaga sarkkarai
S.no Parameter Observation Result
1 Test for Sulphate Cloudy appearance
present. White
precipitate insoluble in
Con.HCL was obtained
Positive
2 Test for Chloride
- Negative
3 Test For Phosphate Yelow appearance
present
Positive
4 Test For Carbonate Cloudy yellow
appearance present
Negative
5 Test For Nitrate - Negative
6 Test for Sulphide No Rotten egg smelling
gas evolved
Negative
7 Test For Fluride &oxalate - Negative
8 Test For Nitrite - Negative
9 Test For Borax - Negative
Interpretation
The acidic radicals test shows the presence of Sulphate, Phosphate .
* The chemical analysis was carried out in Biochemistry Lab, NIS, Ch – 47
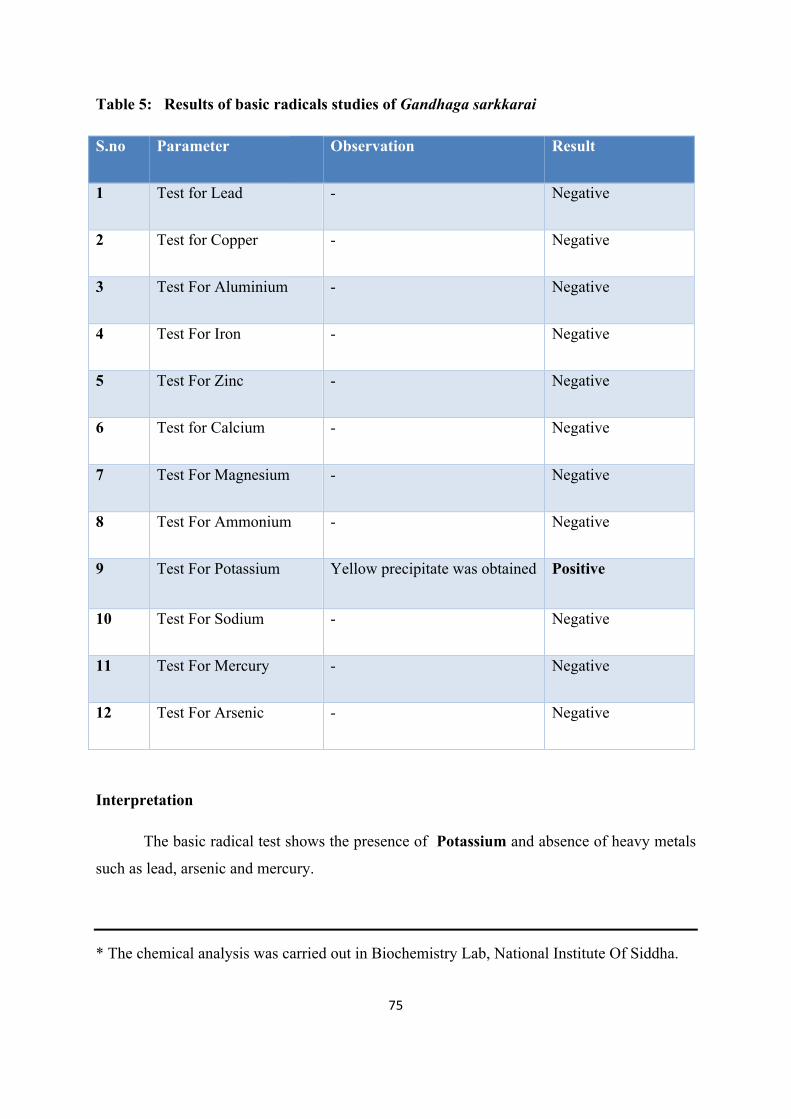
75
Table 5: Results of basic radicals studies of Gandhaga sarkkarai
S.no Parameter Observation Result
1 Test for Lead - Negative
2 Test for Copper - Negative
3 Test For Aluminium - Negative
4 Test For Iron - Negative
5 Test For Zinc - Negative
6 Test for Calcium - Negative
7 Test For Magnesium - Negative
8 Test For Ammonium - Negative
9 Test For Potassium Yellow precipitate was obtained Positive
10 Test For Sodium - Negative
11 Test For Mercury - Negative
12 Test For Arsenic - Negative
Interpretation
The basic radical test shows the presence of Potassium and absence of heavy metals
such as lead, arsenic and mercury.
* The chemical analysis was carried out in Biochemistry Lab, National Institute Of Siddha.
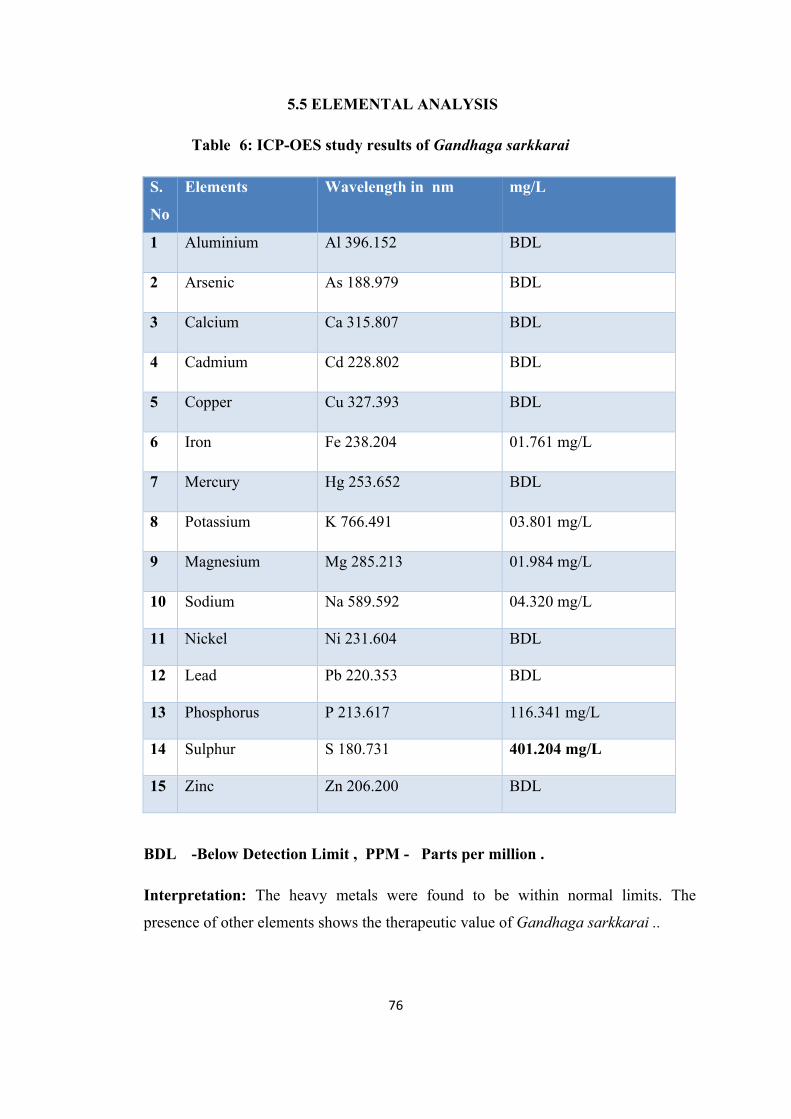
76
5.5 ELEMENTAL ANALYSIS
Table 6: ICP-OES study results of Gandhaga sarkkarai
S.
No
Elements Wavelength in nm mg/L
1 Aluminium Al 396.152 BDL
2 Arsenic As 188.979 BDL
3 Calcium Ca 315.807 BDL
4 Cadmium Cd 228.802 BDL
5 Copper Cu 327.393 BDL
6 Iron Fe 238.204 01.761 mg/L
7 Mercury Hg 253.652 BDL
8 Potassium K 766.491 03.801 mg/L
9 Magnesium Mg 285.213 01.984 mg/L
10 Sodium Na 589.592 04.320 mg/L
11 Nickel Ni 231.604 BDL
12 Lead Pb 220.353 BDL
13 Phosphorus P 213.617 116.341 mg/L
14 Sulphur S 180.731 401.204 mg/L
15 Zinc Zn 206.200 BDL
BDL -Below Detection Limit , PPM - Parts per million .
Interpretation: The heavy metals were found to be within normal limits. The
presence of other elements shows the therapeutic value of Gandhaga sarkkarai ..
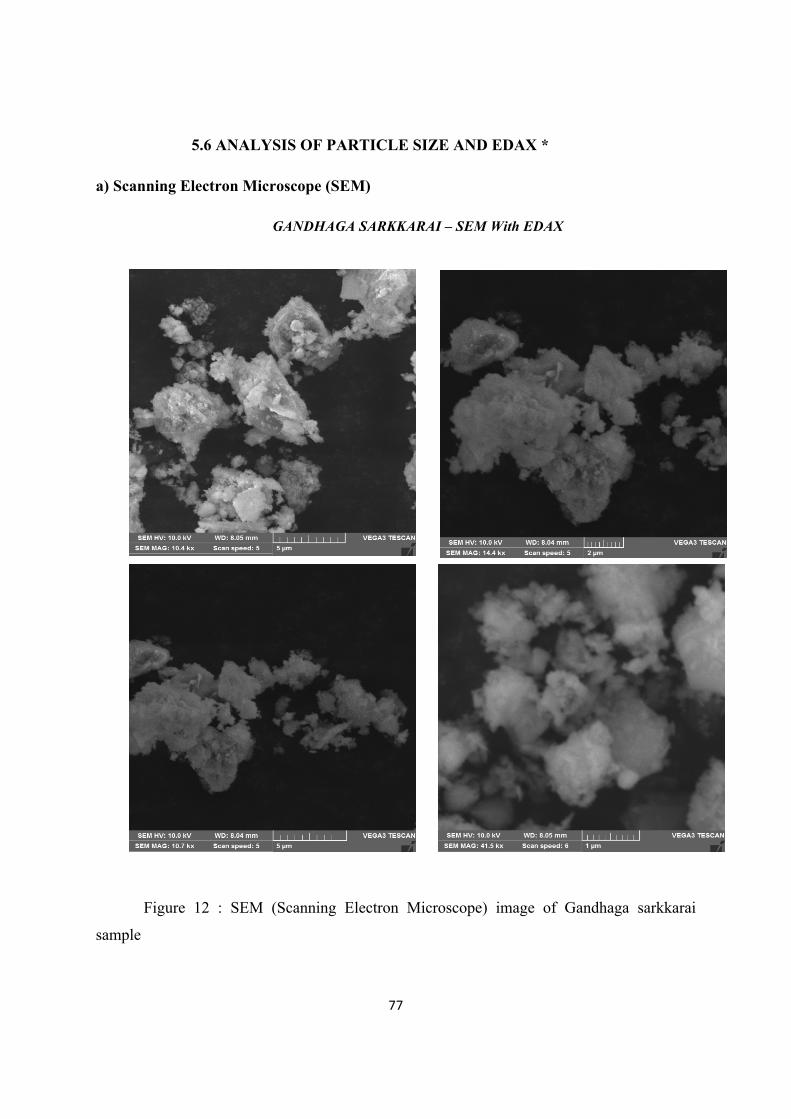
77
5.6 ANALYSIS OF PARTICLE SIZE AND EDAX *
a) Scanning Electron Microscope (SEM)
GANDHAGA SARKKARAI – SEM With EDAX
Figure 12 : SEM (Scanning Electron Microscope) image of Gandhaga sarkkarai
sample
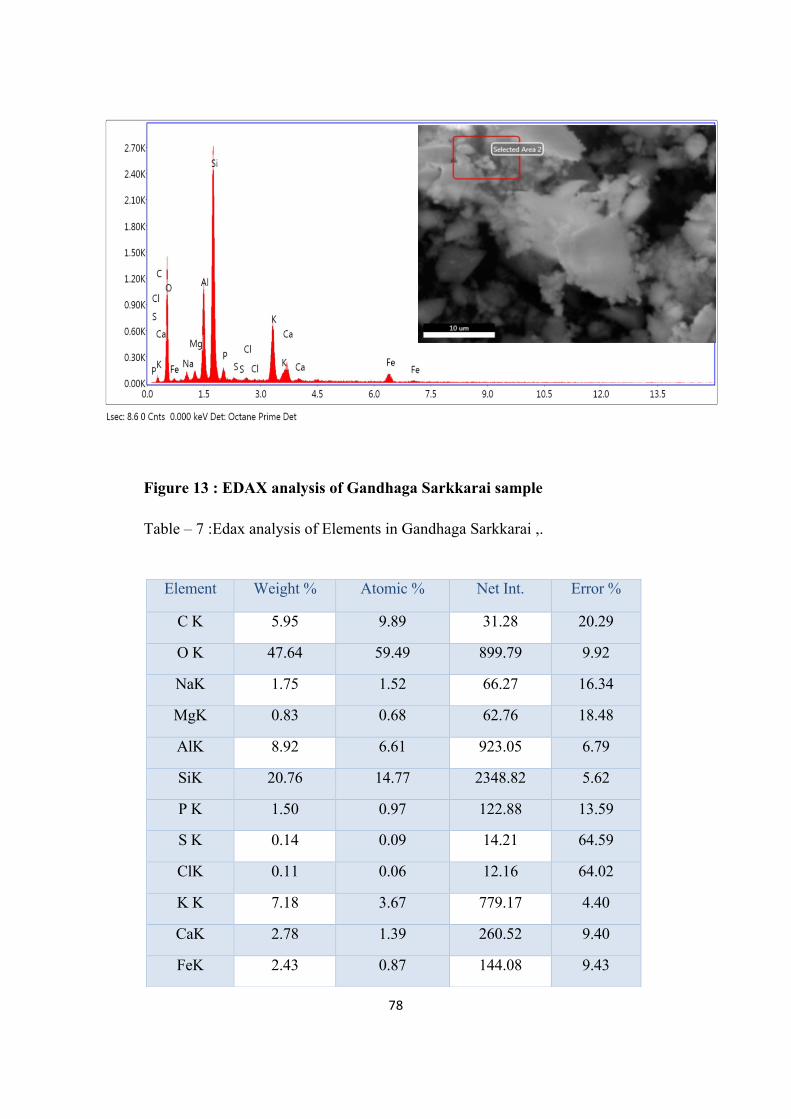
78
Figure 13 : EDAX analysis of Gandhaga Sarkkarai sample
Table – 7 :Edax analysis of Elements in Gandhaga Sarkkarai ,.
Element Weight % Atomic % Net Int. Error %
C K 5.95 9.89 31.28 20.29
O K 47.64 59.49 899.79 9.92
NaK 1.75 1.52 66.27 16.34
MgK 0.83 0.68 62.76 18.48
AlK 8.92 6.61 923.05 6.79
SiK 20.76 14.77 2348.82 5.62
P K 1.50 0.97 122.88 13.59
S K 0.14 0.09 14.21 64.59
ClK 0.11 0.06 12.16 64.02
K K 7.18 3.67 779.17 4.40
CaK 2.78 1.39 260.52 9.40
FeK
2.43 0.87 144.08 9.43
79
Description:
The VEGA TESCAN 3 instrument is used with tungsten filament to image the
samples. The SEM imaging of the Gandhaga Sarkkarai sample shows that the particles are
small and in the range of less than 100 nm as shown in Fig. 1. The particles are aggregate and
individual particles are seen on the top of the clusters. The particle size is low because of the
grounding for more than 6 hours for 4 days.
EDAX analysis shows the elements present in the sample as shown in Fig. 2. The
table represents the weight and atomic percentage of sample. The presence of silicon Si ,
aluminum Aland Iron Fe is 23% is due to the usage of Kaiyanthangari charu and
Venniramana Vengaya charu. The presence Calcium, Potassium, sodium and chlorine is
minimum and may be from Nellikai Gandhagam juice. The carbon and oxygen is presence
due to the calcination process.
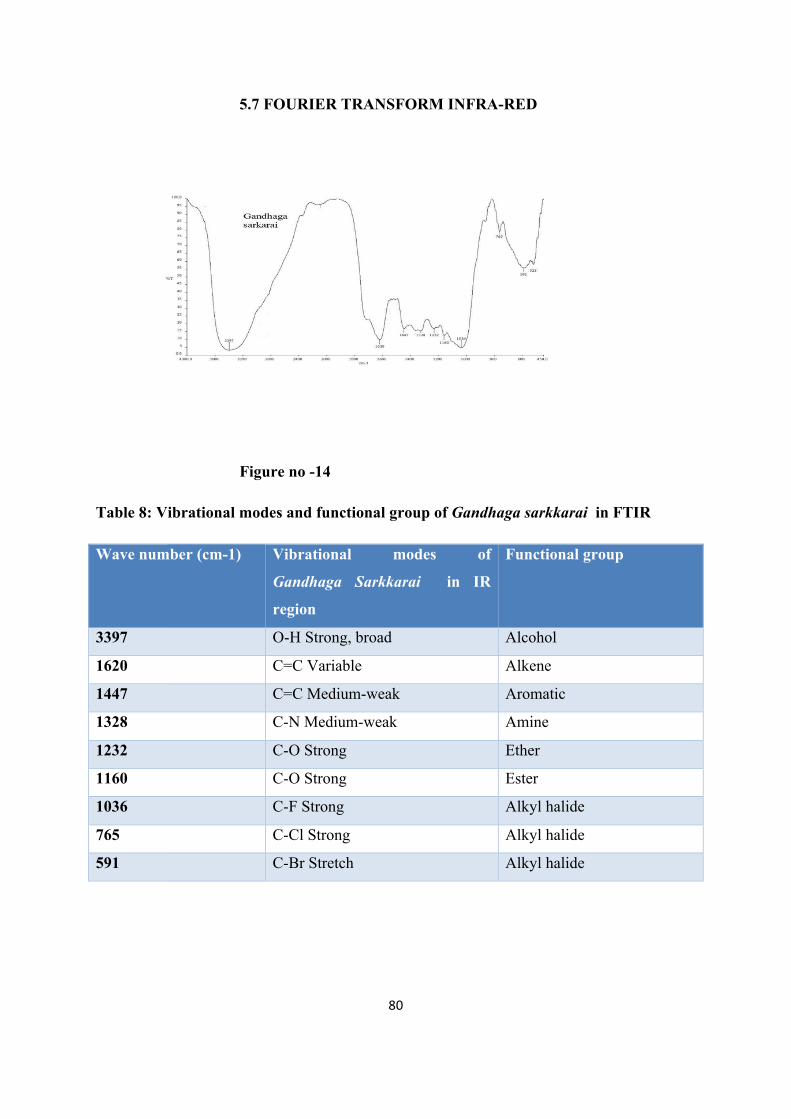
80
5.7 FOURIER TRANSFORM INFRA-RED
Figure no -14
Table 8: Vibrational modes and functional group of Gandhaga sarkkarai in FTIR
Wave number (cm-1) Vibrational modes of
Gandhaga Sarkkarai in IR
region
Functional group
3397 O-H Strong, broad Alcohol
1620 C=C Variable Alkene
1447 C=C Medium-weak Aromatic
1328 C-N Medium-weak Amine
1232 C-O Strong Ether
1160 C-O Strong Ester
1036 C-F Strong Alkyl halide
765 C-Cl Strong Alkyl halide
591 C-Br Stretch Alkyl halide
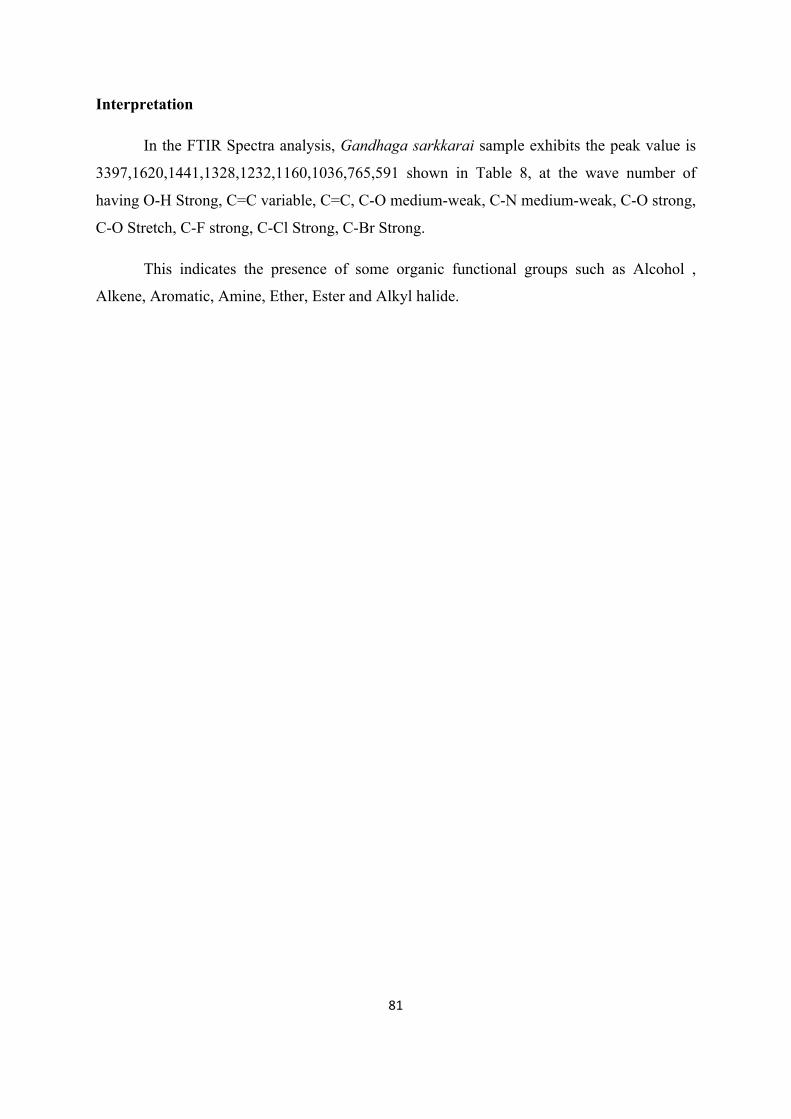
81
Interpretation
In the FTIR Spectra analysis, Gandhaga sarkkarai sample exhibits the peak value is
3397,1620,1441,1328,1232,1160,1036,765,591 shown in Table 8, at the wave number of
having O-H Strong, C=C variable, C=C, C-O medium-weak, C-N medium-weak, C-O strong,
C-O Stretch, C-F strong, C-Cl Strong, C-Br Strong.
This indicates the presence of some organic functional groups such as Alcohol ,
Alkene, Aromatic, Amine, Ether, Ester and Alkyl halide.
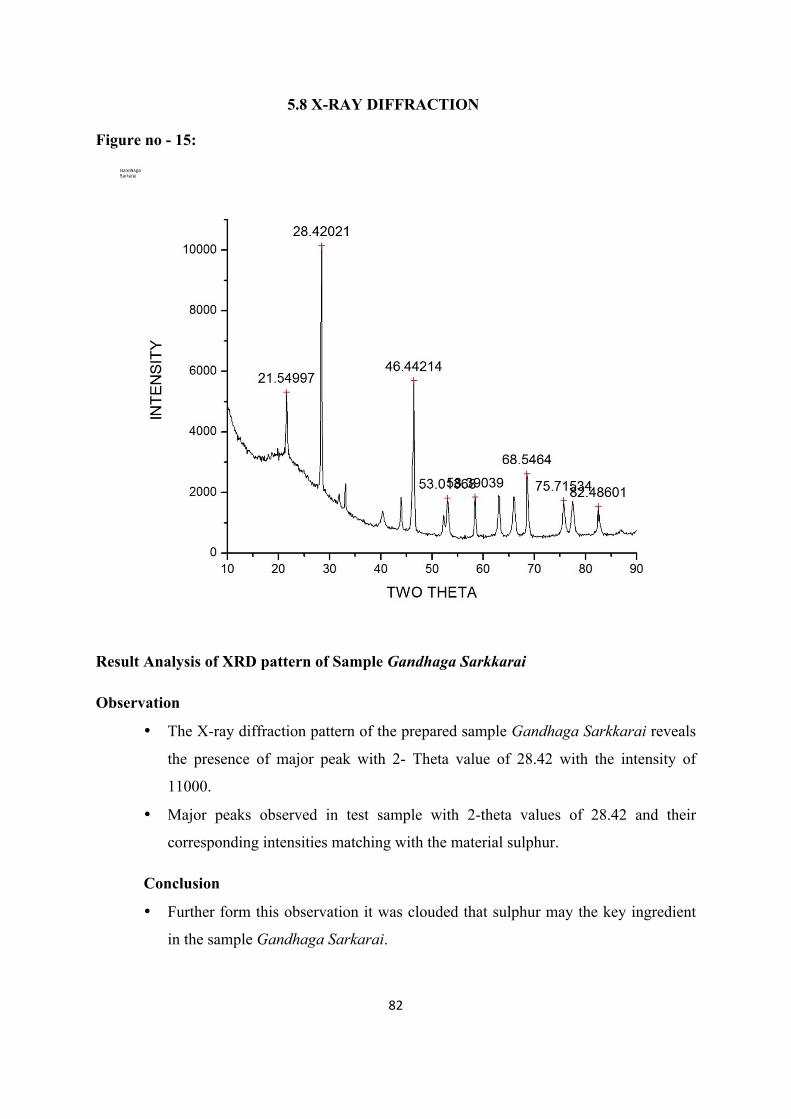
82
5.8 X-RAY DIFFRACTION
Figure no - 15:
Result Analysis of XRD pattern of Sample Gandhaga Sarkkarai
Observation
• The X-ray diffraction pattern of the prepared sample Gandhaga Sarkkarai reveals
the presence of major peak with 2- Theta value of 28.42 with the intensity of
11000.
• Major peaks observed in test sample with 2-theta values of 28.42 and their
corresponding intensities matching with the material sulphur.
Conclusion
• Further form this observation it was clouded that sulphur may the key ingredient
in the sample Gandhaga Sarkarai.
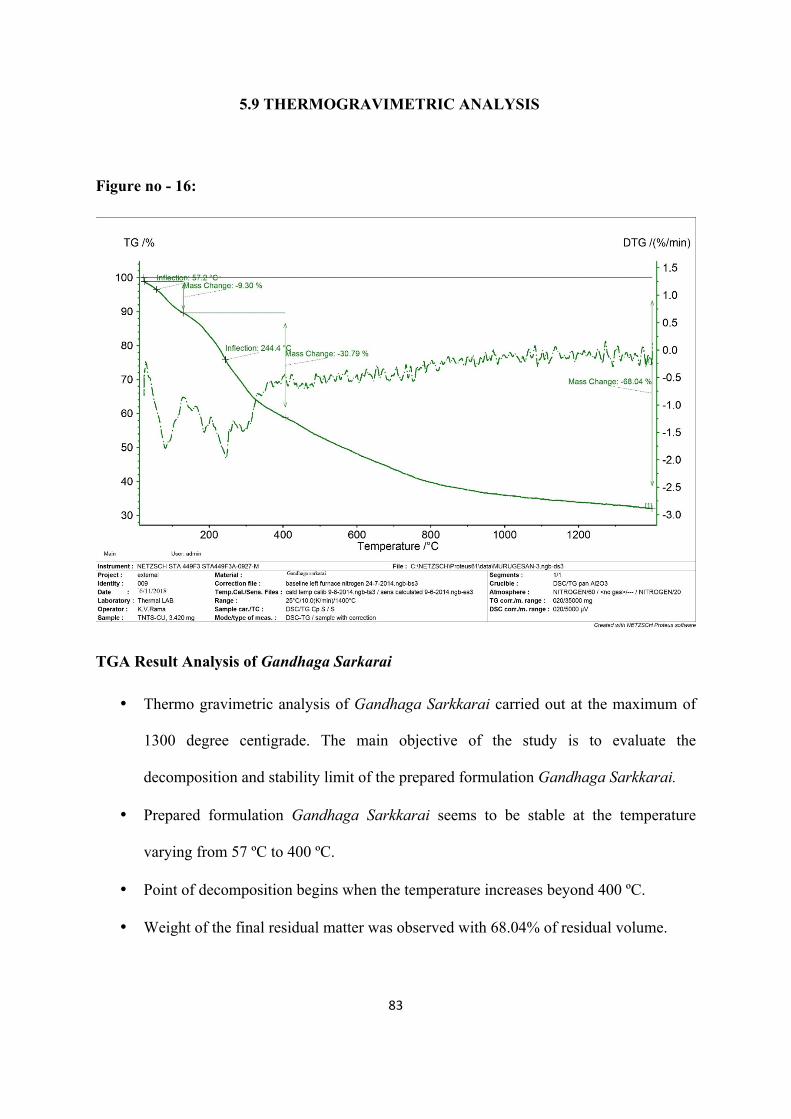
83
5.9 THERMOGRAVIMETRIC ANALYSIS
Figure no - 16:
TGA Result Analysis of Gandhaga Sarkarai
• Thermo gravimetric analysis of Gandhaga Sarkkarai carried out at the maximum of
1300 degree centigrade. The main objective of the study is to evaluate the
decomposition and stability limit of the prepared formulation Gandhaga Sarkkarai.
• Prepared formulation Gandhaga Sarkkarai seems to be stable at the temperature
varying from 57 ºC to 400 ºC.
• Point of decomposition begins when the temperature increases beyond 400 ºC.
• Weight of the final residual matter was observed with 68.04% of residual volume.
84
Conclusion
From the result of the present investigation it was concluded that the
formulation Gandhaga Sarkkarai seems to be stable at varying temperature ranges
from 50 to 400 ºC.
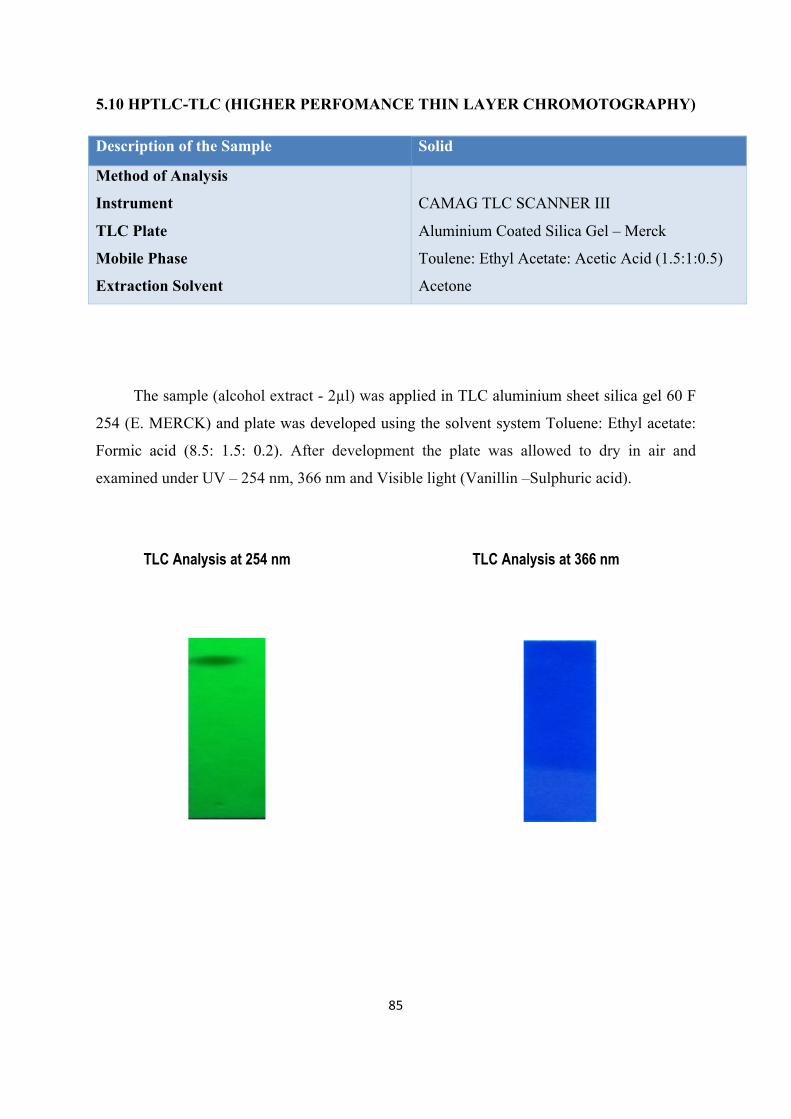
85
5.10 HPTLC-TLC (HIGHER PERFOMANCE THIN LAYER CHROMOTOGRAPHY)
Description of the Sample Solid
Method of Analysis
Instrument
TLC Plate
Mobile Phase
Extraction Solvent
CAMAG TLC SCANNER III
Aluminium Coated Silica Gel – Merck
Toulene: Ethyl Acetate: Acetic Acid (1.5:1:0.5)
Acetone
The sample (alcohol extract - 2µl) was applied in TLC aluminium sheet silica gel 60 F
254 (E. MERCK) and plate was developed using the solvent system Toluene: Ethyl acetate:
Formic acid (8.5: 1.5: 0.2). After development the plate was allowed to dry in air and
examined under UV – 254 nm, 366 nm and Visible light (Vanillin –Sulphuric acid).
TLC Analysis at 254 nm TLC Analysis at 366 nm
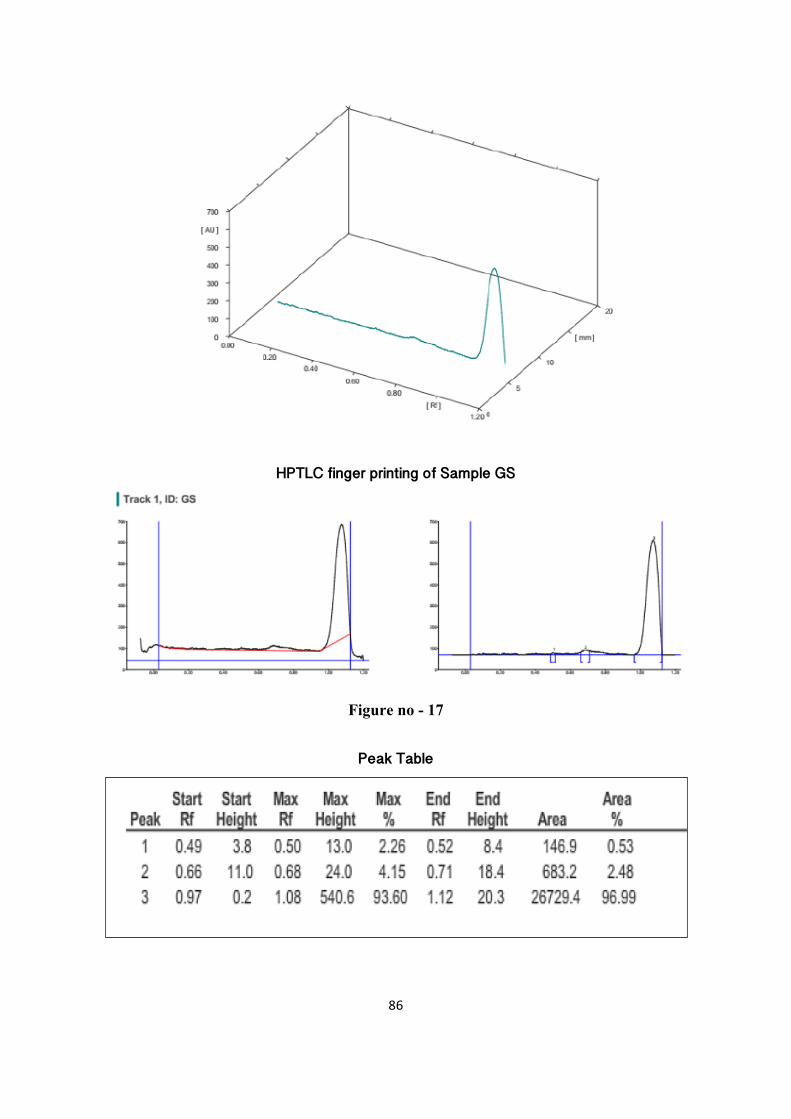
86
HPTLC finger printing of Sample GS
Figure no - 17
Peak Table
87
REPORT
HPTLC finger printing analysis of the sample Gandhaga Sarkkarai reveals the
presence of three prominent peaks corresponds to presence of three versatile phyto-
components present with in it. Rf value of the peaks ranges from 0.49 to 0.97. Further the
peak 3 occupies the major percentage of area of 96.99 % which denotes the abundant
existence of such compound. Followed by this peak 2 and 3 occupies the percentage area of
2.48 and 0.53 % .

88
6.1 ANTI-HISTAMINE ACTIVITY
Table 9: Anti-histamine activity of Gandhaga sarkkarai by Evan’s dye method
S.no Grouping Area of protection from exudation of Dye in mm
1 Control 435.12±0.22
2 Cetirizine(STD) 10mg 126.43±0.07
3 Gandhaga Sarkkarai 100mg 298.14±0.14
4 Gandhaga Sarkkarai 200mg 188.12±0.15
A n ti h is ta m in e e ffe c t o f G a n d h a g a S a r k k a ra i
G ro u p s
Are
a o
f p
rote
cti
on
C o n trol
C e tr iz in
e
GS 1 0 0m
g
GS 2
0 0 mg /k
g0
1 0 0
2 0 0
3 0 0
4 0 0
5 0 0C o n tro l
C e tr iz in e
G S 1 0 0 m g
G S 2 0 0 m g /k g
N= 6, Values are expressed as mean ± SD, analysis was done by using ANOVA followed by
Dunnett’s Test. Test for significance is *P < 0.05, **P < 0.01, ***P < 0.001.
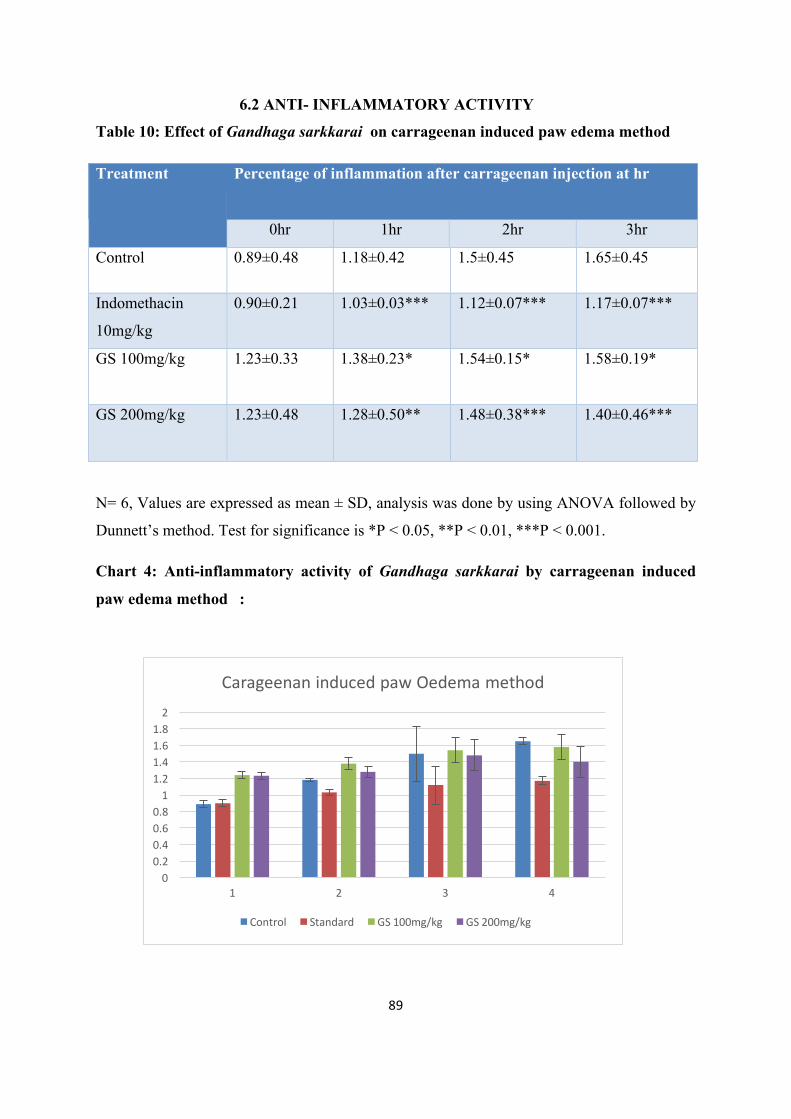
89
6.2 ANTI- INFLAMMATORY ACTIVITY
Table 10: Effect of Gandhaga sarkkarai on carrageenan induced paw edema method
Treatment Percentage of inflammation after carrageenan injection at hr
0hr 1hr 2hr 3hr
Control 0.89±0.48 1.18±0.42 1.5±0.45 1.65±0.45
Indomethacin
10mg/kg
0.90±0.21 1.03±0.03*** 1.12±0.07*** 1.17±0.07***
GS 100mg/kg 1.23±0.33 1.38±0.23* 1.54±0.15* 1.58±0.19*
GS 200mg/kg 1.23±0.48 1.28±0.50** 1.48±0.38*** 1.40±0.46***
N= 6, Values are expressed as mean ± SD, analysis was done by using ANOVA followed by
Dunnett’s method. Test for significance is *P < 0.05, **P < 0.01, ***P < 0.001.
Chart 4: Anti-inflammatory activity of Gandhaga sarkkarai by carrageenan induced
paw edema method :
00.20.40.60.81
1.21.41.61.82
1 2 3 4
CarageenaninducedpawOedemamethod
Control Standard GS100mg/kg GS200mg/kg
90
Result of Anti-inflammatory activity :
Gandhaga sarkkarai at 100 mg/kg dose showed significant anti-inflammatory activity
(P < 0.05) at 1st hour when compared to control rats. At 200 mg/kg the drug showed
significant (P<0.01) at 1st hour and (P < 0.001) at 2rd hour. Among the two doses of
Gandhaga sarkkarai, 200 mg/kg have shown better anti- inflammatory activity (P < 0.001)
when compared with control rats.
Conclusion
Thus it was concluded that administration of Gandhaga sarkkarai at the dose of
360 mg/kg exhibited significant (p<0.001) anti-inflammatory activity in Wistar albino rats
when compared with control.

91
6.3 ANALGESIC ACTIVITY
Table 11: Analgesic activity of Gandhaga sarkkarai in Swiss albino mice
Groups Treatment Reaction time in sec
0min 30min 60min 120min 180min
I Control 2.66±0.2
7
2.97±.16 2.8±0.16 2.95±0.17 3.01±0.37
II Pentazocine
(10mg/kg)
2.83±0.9
8
5.67±0.60
***
5.7±0.66*** 5.6±0.62*** 5.5±0.6***
III
Low dose
GS
(100mg/kg)
2.24±0.3
5*
2.32±0.34
*
3.42±0.25* 4.36±0.79* 4.11±0.47**
IV High dose
GS
(400mg/kg)
2.34±0.3
7*
2.53±0.42
*
2.81±0.55** 5.18±0.19*** 4.81±0.24***
N= 6, Values are expressed as mean ± SD, analysis was done by using ANOVA followed by
Dunnett’s method. Test for significance is *P < 0.05, **P < 0.01, ***P < 0.001.
Chart 5: Analgesic activity of Gandhaga sarkkarai by Eddy’s hot plate method
0
1
2
3
4
5
6
7
8
0min 30min 60min 120min 180min
Eddy'sHotplatemethod
control Pentazocine GS(100mg) GS(400mg)
92
Result of Analgesic activity of Gandhaga sarkkarai :
Analgesic activity was carried out by Eddy’s Hot plate method. Gandhaga sarkkarai
at doses 100 mg/kg showed analgesic activity with the statistical significance of (P<0.05) at
60 min and (P<0.01) at 180 min when compared to control mice. At 26 mg/kg, the drug
showed analgesic activity with significance (P<0.01) at 60 min and (P < 0.001) at 90 mins.
Among the two doses of Gandhaga sarkkarai , 400 mg/kg dose have shown better analgesic
activity (P<0.01) and (P < 0.001) when compared with control mice.
Conclusion
Thus it was concluded that administration of Gandhaga sarkkarai at the dose
of 400 mg/kg exhibited significant (p<0.001) analgesic activity in Swiss albino mice when
compared with control.
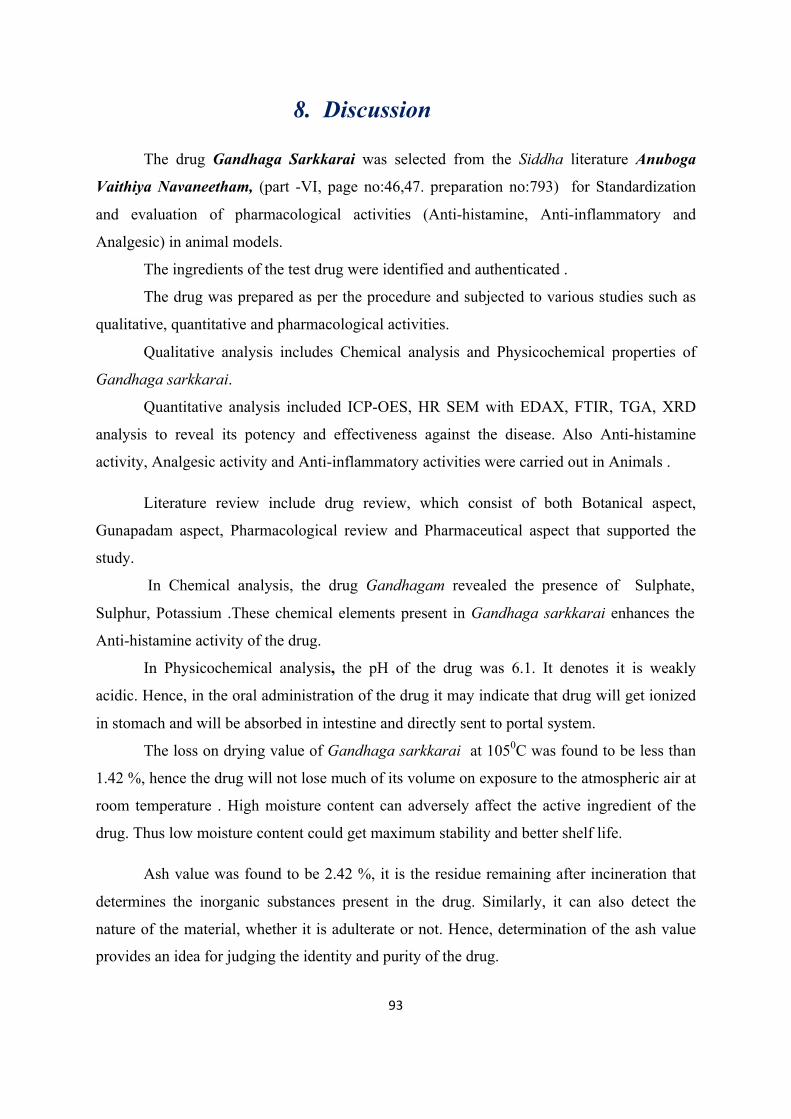
93
8. Discussion
The drug Gandhaga Sarkkarai was selected from the Siddha literature Anuboga
Vaithiya Navaneetham, (part -VI, page no:46,47. preparation no:793) for Standardization
and evaluation of pharmacological activities (Anti-histamine, Anti-inflammatory and
Analgesic) in animal models.
The ingredients of the test drug were identified and authenticated .
The drug was prepared as per the procedure and subjected to various studies such as
qualitative, quantitative and pharmacological activities.
Qualitative analysis includes Chemical analysis and Physicochemical properties of
Gandhaga sarkkarai.
Quantitative analysis included ICP-OES, HR SEM with EDAX, FTIR, TGA, XRD
analysis to reveal its potency and effectiveness against the disease. Also Anti-histamine
activity, Analgesic activity and Anti-inflammatory activities were carried out in Animals .
Literature review include drug review, which consist of both Botanical aspect,
Gunapadam aspect, Pharmacological review and Pharmaceutical aspect that supported the
study.
In Chemical analysis, the drug Gandhagam revealed the presence of Sulphate,
Sulphur, Potassium .These chemical elements present in Gandhaga sarkkarai enhances the
Anti-histamine activity of the drug.
In Physicochemical analysis, the pH of the drug was 6.1. It denotes it is weakly
acidic. Hence, in the oral administration of the drug it may indicate that drug will get ionized
in stomach and will be absorbed in intestine and directly sent to portal system.
The loss on drying value of Gandhaga sarkkarai at 1050C was found to be less than
1.42 %, hence the drug will not lose much of its volume on exposure to the atmospheric air at
room temperature . High moisture content can adversely affect the active ingredient of the
drug. Thus low moisture content could get maximum stability and better shelf life.
Ash value was found to be 2.42 %, it is the residue remaining after incineration that
determines the inorganic substances present in the drug. Similarly, it can also detect the
nature of the material, whether it is adulterate or not. Hence, determination of the ash value
provides an idea for judging the identity and purity of the drug.
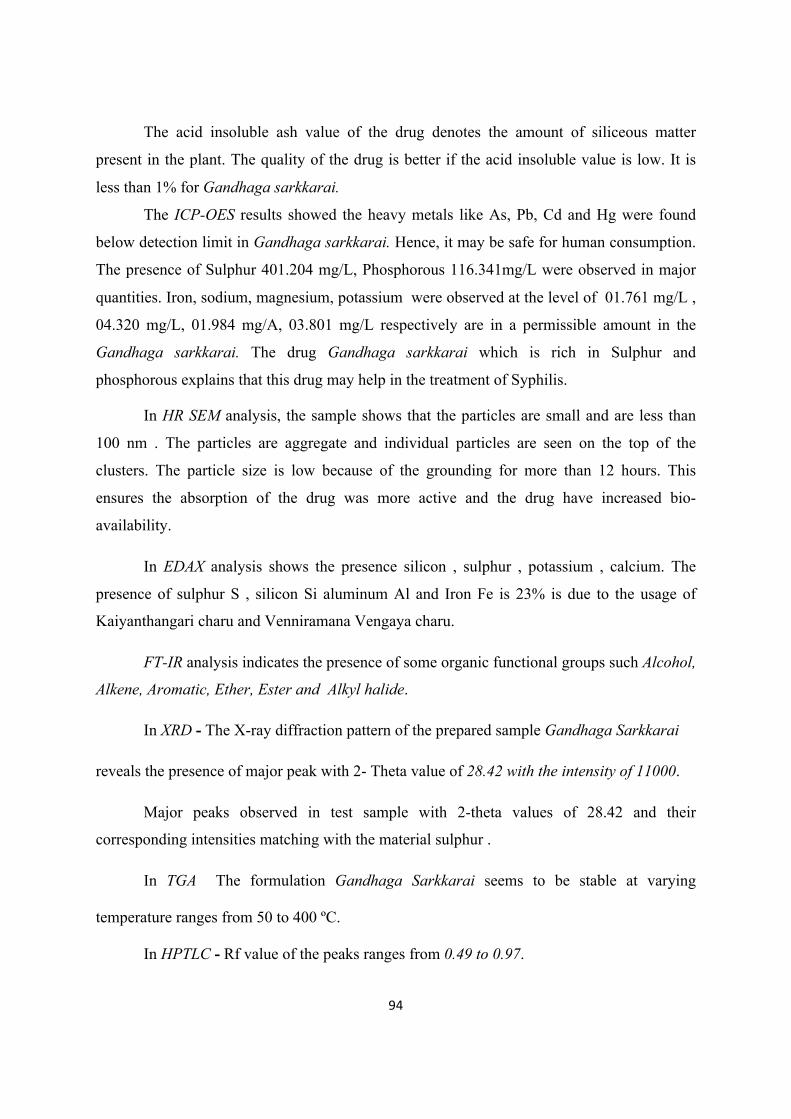
94
The acid insoluble ash value of the drug denotes the amount of siliceous matter
present in the plant. The quality of the drug is better if the acid insoluble value is low. It is
less than 1% for Gandhaga sarkkarai.
The ICP-OES results showed the heavy metals like As, Pb, Cd and Hg were found
below detection limit in Gandhaga sarkkarai. Hence, it may be safe for human consumption.
The presence of Sulphur 401.204 mg/L, Phosphorous 116.341mg/L were observed in major
quantities. Iron, sodium, magnesium, potassium were observed at the level of 01.761 mg/L ,
04.320 mg/L, 01.984 mg/A, 03.801 mg/L respectively are in a permissible amount in the
Gandhaga sarkkarai. The drug Gandhaga sarkkarai which is rich in Sulphur and
phosphorous explains that this drug may help in the treatment of Syphilis.
In HR SEM analysis, the sample shows that the particles are small and are less than
100 nm . The particles are aggregate and individual particles are seen on the top of the
clusters. The particle size is low because of the grounding for more than 12 hours. This
ensures the absorption of the drug was more active and the drug have increased bio-
availability.
In EDAX analysis shows the presence silicon , sulphur , potassium , calcium. The
presence of sulphur S , silicon Si aluminum Al and Iron Fe is 23% is due to the usage of
Kaiyanthangari charu and Venniramana Vengaya charu.
FT-IR analysis indicates the presence of some organic functional groups such Alcohol,
Alkene, Aromatic, Ether, Ester and Alkyl halide.
In XRD - The X-ray diffraction pattern of the prepared sample Gandhaga Sarkkarai
reveals the presence of major peak with 2- Theta value of 28.42 with the intensity of 11000.
Major peaks observed in test sample with 2-theta values of 28.42 and their
corresponding intensities matching with the material sulphur .
In TGA The formulation Gandhaga Sarkkarai seems to be stable at varying
temperature ranges from 50 to 400 ºC.
In HPTLC - Rf value of the peaks ranges from 0.49 to 0.97.
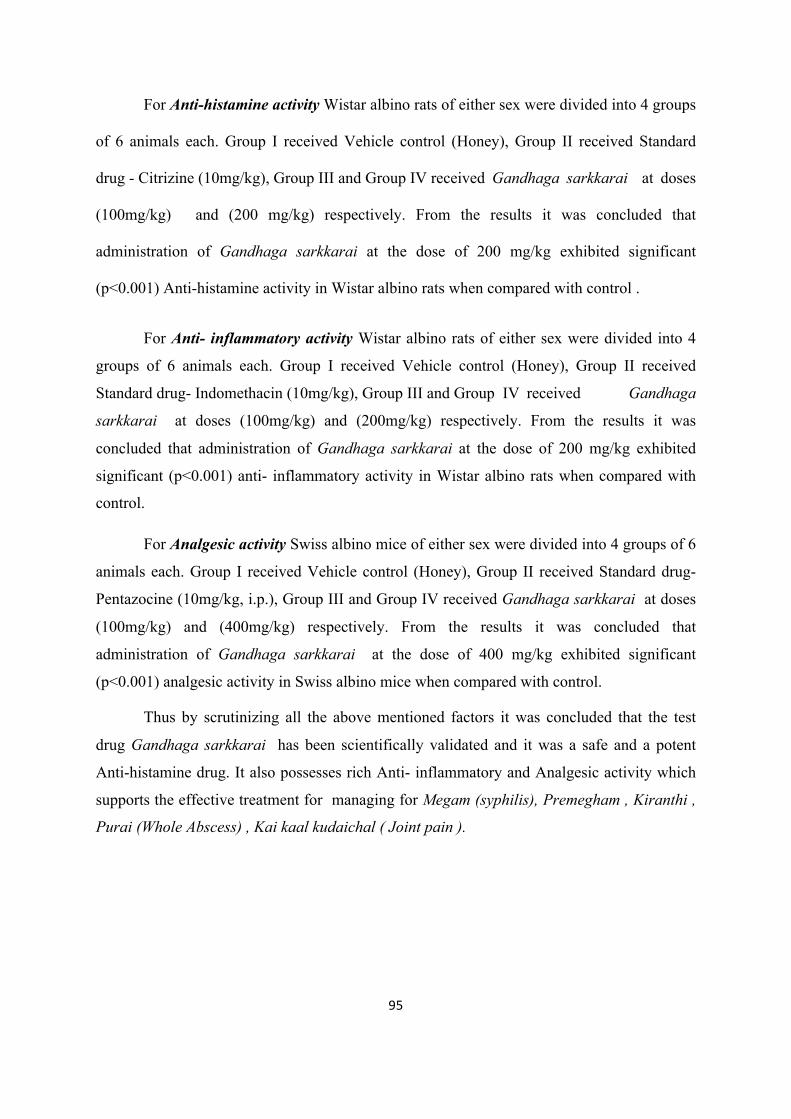
95
For Anti-histamine activity Wistar albino rats of either sex were divided into 4 groups
of 6 animals each. Group I received Vehicle control (Honey), Group II received Standard
drug - Citrizine (10mg/kg), Group III and Group IV received Gandhaga sarkkarai at doses
(100mg/kg) and (200 mg/kg) respectively. From the results it was concluded that
administration of Gandhaga sarkkarai at the dose of 200 mg/kg exhibited significant
(p<0.001) Anti-histamine activity in Wistar albino rats when compared with control .
For Anti- inflammatory activity Wistar albino rats of either sex were divided into 4
groups of 6 animals each. Group I received Vehicle control (Honey), Group II received
Standard drug- Indomethacin (10mg/kg), Group III and Group IV received Gandhaga
sarkkarai at doses (100mg/kg) and (200mg/kg) respectively. From the results it was
concluded that administration of Gandhaga sarkkarai at the dose of 200 mg/kg exhibited
significant (p<0.001) anti- inflammatory activity in Wistar albino rats when compared with
control.
For Analgesic activity Swiss albino mice of either sex were divided into 4 groups of 6
animals each. Group I received Vehicle control (Honey), Group II received Standard drug-
Pentazocine (10mg/kg, i.p.), Group III and Group IV received Gandhaga sarkkarai at doses
(100mg/kg) and (400mg/kg) respectively. From the results it was concluded that
administration of Gandhaga sarkkarai at the dose of 400 mg/kg exhibited significant
(p<0.001) analgesic activity in Swiss albino mice when compared with control.
Thus by scrutinizing all the above mentioned factors it was concluded that the test
drug Gandhaga sarkkarai has been scientifically validated and it was a safe and a potent
Anti-histamine drug. It also possesses rich Anti- inflammatory and Analgesic activity which
supports the effective treatment for managing for Megam (syphilis), Premegham , Kiranthi ,
Purai (Whole Abscess) , Kai kaal kudaichal ( Joint pain ).
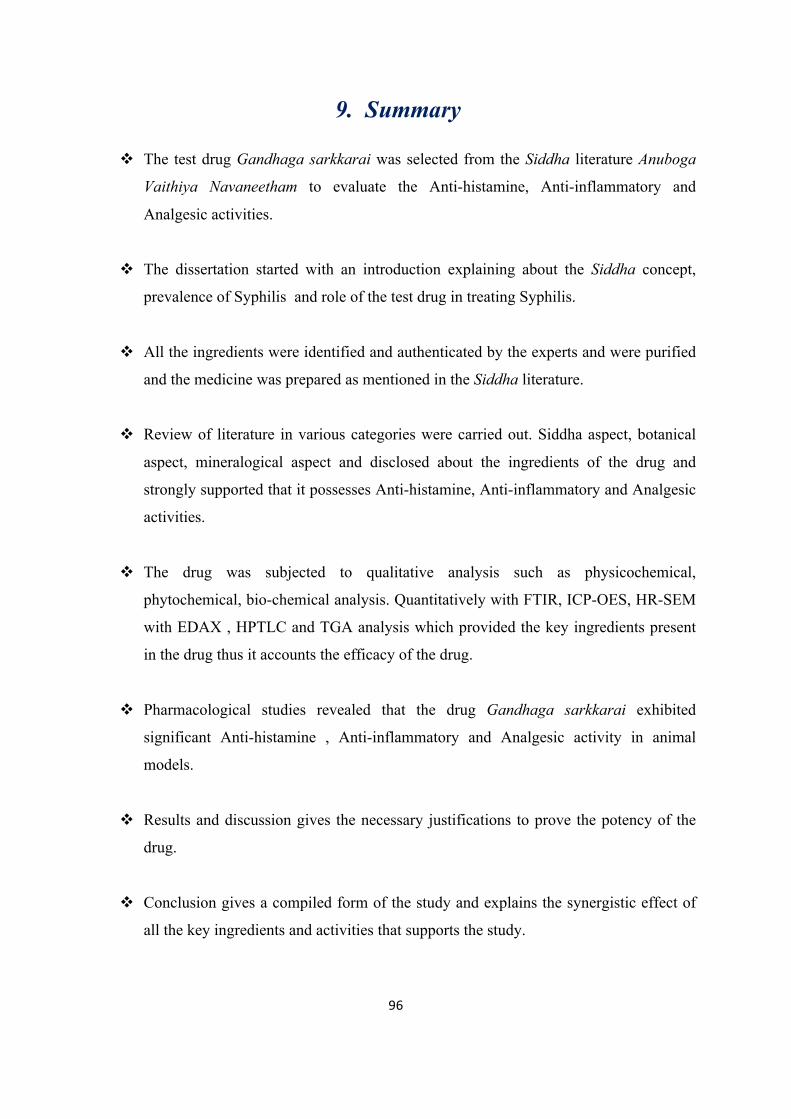
96
9. Summary
v The test drug Gandhaga sarkkarai was selected from the Siddha literature Anuboga
Vaithiya Navaneetham to evaluate the Anti-histamine, Anti-inflammatory and
Analgesic activities.
v The dissertation started with an introduction explaining about the Siddha concept,
prevalence of Syphilis and role of the test drug in treating Syphilis.
v All the ingredients were identified and authenticated by the experts and were purified
and the medicine was prepared as mentioned in the Siddha literature.
v Review of literature in various categories were carried out. Siddha aspect, botanical
aspect, mineralogical aspect and disclosed about the ingredients of the drug and
strongly supported that it possesses Anti-histamine, Anti-inflammatory and Analgesic
activities.
v The drug was subjected to qualitative analysis such as physicochemical,
phytochemical, bio-chemical analysis. Quantitatively with FTIR, ICP-OES, HR-SEM
with EDAX , HPTLC and TGA analysis which provided the key ingredients present
in the drug thus it accounts the efficacy of the drug.
v Pharmacological studies revealed that the drug Gandhaga sarkkarai exhibited
significant Anti-histamine , Anti-inflammatory and Analgesic activity in animal
models.
v Results and discussion gives the necessary justifications to prove the potency of the
drug.
v Conclusion gives a compiled form of the study and explains the synergistic effect of
all the key ingredients and activities that supports the study.
97
10. Conclusion
From the above analytical studies (i.e qualitative and quantitative analysis)
and the pharmacological activities (i.e Anti-histamine, Anti- inflammatory and
Analgesic activities),this study is concluded that the study drug Gandhaga sarkkarai
possesses a good Anti-histamine, Anti- inflammatory and Analgesic activities.Finally
concluded that the study drug Gandhaga sarkkarai can be used for effective
treatment of managing diseases like Megam (Syphilis) , Kiranthi , Purai (Whole
abscess).
98
11. Bibliography
Siddha Literature for references :
• Yogi Munivar,Yoogi Vaithiya Chinthamani, 2nd Edition:2005,P.No: 145, 155,156.
• Dr.C.S.Uthamarayan, A Compendium of Siddha Doctrine, First edition,2005.
• T.V.Sambasivam pillai, Introduction to Siddha Medicine,Second edition, 1993.
• Siddhas –Master of the Basics ., Pal Pandian , I ed ., 2006
• N.Kanthaswamy pillai, History of Siddha Medicine, Second edition,1998.
• K.S.Murugesa muthaliyar, Siddha Meteria Medica, medicinal plants ,Seventh edition,
2003.
• Dr.M.Shanmugavelu, Noi Naadal Noi Muthal Naadal Thirattu, part 1, Thired
edition,2003.
• Dr.G.Durairasan, Siddha Principles of Social and Preventive Medicine, Thired
edition,1993.
• P.M.Venugopal, Siddhar Udal Thathuvam, Thired edition, 1993.
• K.S.Murugesa muthaliyar , Siddha toxicology, First edition, 1999.
• Dr.R.Thiagarajan, Materia Medica (Mineral & Animal kingdom), First edition, 2008.
• Dr.M.Sowrirajan, Machamuni naayanaar – 800, Second edition , 2005.
• Irupaalai chettiyaar, Pathartha soodamani, First edition, 2005.
• R.C.Mohan, Agathiyar vallathi – 600, First edition, April 2001.
• Dr.R.Thiagarajan, Gunapadam Thathu Seeva vaguppu, “Purification of Kanthagam”,
Second Edition – Reprint 2006 ; Page no. 305.
• Agathiyar – 1200, First edition, may 1997.
• Agathiyar Kanma Kaandam, First edition, June 1995.
• Agathiyar Aayulvetham, First edition, October 1999.
• Agathiyar pallu - 200, First edition, April 2000.
• Agathiyar Pancha Kaaviya Nigandu, First edition, July 1997.
• Thearaiyar vaagadam, First edition, October 2000.
• Hackim pa mu Apdulla saayabu ,Anupoga vaithiya navaneetham,part – 6, Second
edition, May 2001
99
• “Safty & toxicological study on Ganthaga sarkkarai”, dissertation no : D 142, National
Institute Of Siddha, Chennai.
• Dr.Kuppusamy Mudhaliyar , Ka.Na.,.H.P.I.M., Siddha Vaithiya thirattu , I ed ., 1998,
Indian system of medicine and Homeopathy ., Ch-106 .
• Pandit. Murugesa mudhaliyar Ka.Sa..,Gunapadam , Part I, Porutpanbu nool , Mooligai,
VI ed, 2002 ,Indian system of medicine and Homeopaty, Ch-106 .
• Ka.Su.Uthamarayan,., H.B.I.M,. Siddha Maruthuvanga Surukkam , III ed ,2003, Ch-
24
• T.V.Sambasivam Pillai ., Tamil-Aangila Agarathi , II ed , 1998 , Indian system of
Medicine and Homeopathy , Ch-106 .
• Encyclopedia of world Medicinal Plants – Vol I , T.Pulliah .., 2006 .
• Encyclopedia of world Medicinal Plants – Vol II , T.Pulliah .., 2006.
• Wealth of India ,Vol III
• Bogar Nigandu 1200, Thamarai nooloagam , Chennai.
Scientific Literature references :
• Experimental evaluation of the Analgesic activity of Eclipta prostrata (L) Hassk,
Ancient science of life, 27th July 1997 , P.S.Pandey ,K.K.O.P.Upadhyay, D.N.Pandey.
• Analgesic Studies on total alkaloids and alcohol extracts of Eclipta prostrta,
Phytotheraphy Research , 05th March 2004 , Mahesh Sawant , Jolly.C.Isaac, Shridar
Narayanan .
• Evaluation of Anti-inflammatory activity of Eclipta prostrata in rats, Ancient science of
life , 15th December 2004 , S.Suresh kumar, T. Siva kumar , M.J.N .Chandrasekari ,
B.Suresh.
• Anti-inflammatory activity of methanolic extract of Eclipta prostrate,African Journal of
Pharmacy and Pharmacology , 17th Febrauary 2009 ,G.Arunachalam , N.Subramanian ,
G.P.Pazhani , V.Ravichandran.
• Evaluation of Anti-inflammatory activity of roots of Eclipta prostrata , Journal of
Pharmacy research , 01th July 2011 , Ambika Sharma , Arun mittal , Sushma Aggarawal
, Anil K Gupta , Satish.
• Pharmacological, phytochemical and analgesicactivity of Eclipta prostrata,
Journey of Global trends in Pharmaceutical Sciences , 3rd September 2012,
100
Saritha Kodithala, M.Kiranmai, N.Dorababu, Mohammed Ibrahim.
• Anti-inflammatory , analgesic , anti-oxidant activity of herb Eclipta prostrata,Journal of
Pharmacology and toxicology , October 2011, M.B.Alam , N.S.Chowdry , M.M.Islam ,
R. Zahaq.
• Analgesic activity studies with a polyherbal formulation containing plant Allium cepa,
European Journal of Pharmaceutical and medical research , 25th December 2017,
Akmal Hosain Nipu, Sahara Akter , Mohammed Rahmatullah .
• Evaluation of analgesic and anti-inflammatory effects of
fresh onion juice in experimental animals, African Journal of Pharmacy and
Pharmacology, 16th May 2012, Mahdieh Anoush , Narges Khatami .