Validation of selected iPhone Optometric screening ...
121
1 Validation of selected iPhone Optometric screening applications in vision screening Therisha Moodley (214523678) 1 Discipline of Optometry. University of KwaZulu-Natal, South Africa. Supervisor: Prof R Hansraj Co-Supervisor: Ms P Govender-Poonsamy Submitted in fulfillment of the requirements for the degree of Masters of Optometry (Research) in the School of Health Sciences, University of KwaZulu-Natal. Submission date: 04 December 2020
-
Upload
khangminh22 -
Category
Documents
-
view
4 -
download
0
Transcript of Validation of selected iPhone Optometric screening ...

1
Validation of selected iPhone Optometric screening applications in vision
screening
Therisha Moodley (214523678)
1Discipline of Optometry. University of KwaZulu-Natal, South Africa.
Supervisor: Prof R Hansraj
Co-Supervisor: Ms P Govender-Poonsamy
Submitted in fulfillment of the requirements for the degree of Masters of Optometry (Research) in the School
of Health Sciences, University of KwaZulu-Natal.
Submission date: 04 December 2020

2
DECLARATION
I, Miss Therisha Moodley, declare as follows:
1. That the work described in this thesis has not been submitted to UKZN or any other tertiary institution
for purposes of obtaining an academic qualification, whether by myself or any other party.
2. This dissertation is my own, unaided work and was supervised by Dr. R. Hansraj and Mrs. P. Govender.
3. My contribution to the research was as follows:
• Concept, Design and Definition of intellectual content,
• Literature search,
• Clinical study,
• Data collection, Data analysis and Statistical analysis,
• Manuscript preparation,
• Manuscript editing and review
Signature Date: 04 December 2020
As the candidates’ supervisors we agree to the submission of this thesis:
Prof R Hansraj Date: 2 December 2020
Ms P Govender-Poonsamy Date: 2 December 2020

3
DEDICATION
I would like to dedicate my thesis to my parents for their never-ending support, encouragement and belief
that I can achieve anything with hard work and dedication.
I am additionally grateful and would like to express my sincere appreciation to my lecturer/ supervisor and
role model Prof. R Hansraj, for her valuable time, advice and continuous support throughout my degree.

4
ACKNOWLEDGEMENTS
• Prof R Hansraj and Mrs. P. Govender-Poonsamy for supervising the research study.
• Daniel Sevenster for granting permission to conduct the data collection at his optometry practice.

5
Table of Contents
DEDICATION ................................................................................................................................................... 3
ACKNOWLEDGEMENTS ............................................................................................................................... 4
ABSTRACT .................................................................................................................................................... 10
INTRODUCTION ........................................................................................................................................... 11
• 1.1 INTRODUCTION....................................................................................................................... 11
• 1.2 CONCLUSION ........................................................................................................................... 14
LITERATURE REVIEW ................................................................................................................................ 15
• 2.1 INTRODUCTION....................................................................................................................... 15
• 2.2 SUMMARY OF EXISTING LITERATURE ON VISUAL ACUITY AND CONTRAST
SENSITIVITY USING SMART TECHNOLOGY .......................................................................... 15
• 2.3 SMARTPHONE APPS FOR THE ASSESSMENT OF VISUAL ACUITY ............................. 17
• 2.4 SMART TECHNOLOGY (IPAD) FOR THE ASSESSMENT OF CONTRAST SENSITIVITY
........................................................................................................................................................... 19
• 2.5 FACTORS FOR CONSIDERATION ......................................................................................... 21
• 2.6 CONCLUSION ........................................................................................................................... 22
METHODOLOGY .......................................................................................................................................... 23
• 3.1 INTRODUCTION....................................................................................................................... 23
• 3.2 STUDY SETTING ...................................................................................................................... 23
• 3.3 STUDY DESIGN ........................................................................................................................ 23
• 3.4 STUDY POPULATION ............................................................................................................. 23
• 3.5 STUDY SAMPLE ....................................................................................................................... 24
• 3.6 DATA COLLECTION INSTRUMENTS ................................................................................... 24
• 3.7. DATA COLLECTION PROCEDURE ...................................................................................... 27
• 3.8 PRODUCT OF RESEARCH ...................................................................................................... 30
• 3.9 PILOT STUDY ........................................................................................................................... 30
• 3.10 VALIDITY AND RELIABILITY ............................................................................................ 30
• 3.11 DATA ANALYSIS ................................................................................................................... 31
• 3.12 DATA MANAGEMENT .......................................................................................................... 32
• 3.13. ETHICAL CONSIDERATIONS AND CONFIDENTIALITY............................................... 32
• This study adhered to the tenets of the Declaration of Helsinki. ...................................................... 32
• 3.14 CONCLUSION ......................................................................................................................... 32
RESULTS ........................................................................................................................................................ 33

6
• 4.1 INTRODUCTION....................................................................................................................... 33
• 4.2 DEMOGRAPHICS ..................................................................................................................... 33
• 4.3 REFRACTIVE STATUS ............................................................................................................ 34
• 4.4 DISTANCE VISUAL ACUITY ................................................................................................. 35
• 4.5 CONTRAST SENSITIVITY ...................................................................................................... 39
• 4.6 ASTIGMATISM ......................................................................................................................... 41
• 4.7 QUESTIONNAIRE..................................................................................................................... 44
• 4.8 CONCLUSION ........................................................................................................................... 52
DISCUSSION .................................................................................................................................................. 54
• 5.1 INTRODUCTION....................................................................................................................... 54
• 5.2 DEMOGRAPHICS ..................................................................................................................... 54
• 5.3 REFRACTIVE STATUS ............................................................................................................ 55
• 5.4 DISTANCE VISUAL ACUITY ASSESSMENT ....................................................................... 56
• 5.5 CONTRAST SENSITIVITY ...................................................................................................... 58
• 5.6 ASTIGMATISM ......................................................................................................................... 60
• 5.7 PERFORMANCE OF FREE APP VERSUS PAID APP ........................................................... 61
• 5.8 PERFORMANCE ON SMARTPHONE APPLICATIONS ACCORDING TO GENDER ....... 62
• 5.9 QUESTIONNAIRE..................................................................................................................... 63
• 5.10 CONCLUSION ......................................................................................................................... 64
CONCLUSIONS, LIMITATIONS AND RECOMMENDATIONS ............................................................... 66
• 6.1 INTRODUCTION....................................................................................................................... 66
• 6.2 CONCLUSIONS ......................................................................................................................... 66
• 6.3 LIMITATIONS ........................................................................................................................... 66
• 6.4 RECOMMENDATIONS ............................................................................................................ 68
• 6.5 CONCLUSION ........................................................................................................................... 69
REFERENCES ................................................................................................................................................ 71
APPENDIX ...................................................................................................................................................... 78
• APPENDIX 1: ................................................................................................................................... 78
Information Document ...................................................................................................................... 78
• APPENDIX 2: ................................................................................................................................... 81
Questionnaire .................................................................................................................................... 81
• APPENDIX 3: ................................................................................................................................... 84
Data Recording sheet ........................................................................................................................ 84

7
• APPENDIX 4: ................................................................................................................................... 85
Ethical Clearance certificate ............................................................................................................. 85
• APPENDIX 5: ................................................................................................................................... 86
Study site permission form................................................................................................................ 86
• APPENDIX 6: ................................................................................................................................... 87
Manuscript 1-Submitted to Telemedicine and e-Health Journal. ...................................................... 87
• Appendix 7: ..................................................................................................................................... 101
Manuscript 2- Submitted to Journal of Ophthalmic Epidemiology ................................................ 101
• Appendix 8: ..................................................................................................................................... 110
Manuscript 3- Submitted to Indian Journal of Ophthalmology ...................................................... 110

8
List of Tables
Table 2.1:A summary of visual acuity and contrast sensitivity smart-technology app studied ...................... 16
Table 3.2: Conversion from Log CS to Contrast percentagee (The Mars Perceptrix., 2003-2010) ................ 25
Table 4.1: Frequency of computer use according to gender ........................................................................... 34
Table 4.2: Classification of refractive status for the right and left eye of participants………………………..34
Table 4.3: Median DVA with interquartile range (IQR) in decimal notation obtained with the Snellen chart,
free App (Pocket Eye Exam®) and paid App (Kay iSight Test Professional®) ........................... 35
Table 4.4: Showing the Median and IQR for distance VA in decimal notation according to gender. ............ 36
Table 4.5: Showing the frequency of pass and fail categorisation of distance visual acuity obtained with the
Snellen chart, free and paid app. ................................................................................................. 37
Table 4.6: Showing the Sensitivity and Specificity of the Free App for Distance Visual Acuity for the right
and left eyes in relation to the Snellen chart ............................................................................... 38
Table 4.7: Showing the Sensitivity and Specificity of the Paid App for Distance Visual Acuity for the right
and left eyes in relation to the Snellen chart. ................................................................................. 38
Table 4.8: Showing percentage of pass and fail categorisation of contrast sensitivity determined with the Pelli-
Robson chart, free and paid app. .................................................................................................... 39
Table 4.9: Showing the percentage of pass and fail categorisation for contrast sensitivity determined with the
Pelli-Robson chart, free and paid app according to gender. .......................................................... 40
Table 4.10: Showing the sensitivity and specificity of the Free App for contrast sensitivity for the right and
left eyes in relation to the Pelli-Robson chart ............................................................................. 40
Table 4.11: Showing the sensitivity and specificity of the paid app for contrast sensitivity for the right and left
eye in relation to the Pelli-Robson chart ..................................................................................... 41
Table 4.12: Showing the frequency of participants with astigmatism and no astigmatism as determined with
the JCC test, Free and Paid apps. ................................................................................................ 42
Table 4.13: Showing the frequency of participants with astigmatism and no astigmatism as determined with
the JCC test, Free App and Paid App classified according to gender ......................................... 43
Table 4.14: Showing the sensitivity and specificity of the Free App for the detection of astigmatism for the
right and left eye in comparison to the JCC test .......................................................................... 43
Table 4.15: Showing the sensitivity and specificity of the Paid App for the detection of astigmatism for the
right and left eye in comparison to the JCC test .......................................................................... 44
Table 4.16: Occupational categories compared to Q1 and Q4 ........................................................................ 48
9
List of Figures
Figure 4.1: Number of participants according to race and gender .................................................................. 33
Figure 4.2: Showing reasons for selecting the standard test as preferred testing option stratified according to
gender .......................................................................................................................................... 45
Figure 4.3: Distribution of preference according to age group ....................................................................... 46
Figure 4.4: Reasons for testing format preference according to age groups ................................................... 47
Figure 4.5: Preference of future testing method according to age groups. ..................................................... 49
Figure 4.6: Reasons for preference of future testing method .......................................................................... 49
Figure 4.7: Ease of use and understandability of Smartphone tests ................................................................ 50
Figure 4.8: Participants’ perceptions of the different Smartphone applications for assessment of vision ...... 51
Figure 4.9: Participants’ perceptions of accuracy of results from Smartphone application testing ................ 51
Figure 4.10: Participants’ comfort with relying on these Smartphone applications to determine their visual
status ............................................................................................................................................ 52

10
ABSTRACT
Introduction
There has been an unprecedent increase in the use of mobile technology to provide health care services.
The eye care industry has also adopted the use of these innovative smart-technology devices to provide
rapid, convenient and less time-consuming eye screenings through the use of applications (apps) however,
the accuracy and reliability of these tests have not been fully established.
Aim
To determine if the selected smartphone apps have comparable results to their equivalent standard clinical
optometric tests.
Method
The study employed a comparative research design that compared the results of two each, smartphone
distance visual acuity (DVA), contrast sensitivity and astigmatism apps to the results provided by the
standard Snellen DVA chart, Pelli-Robson chart and JCC test, respectively. A total of 113 participants
were recruited using convenience sampling. The results were analyzed and the Wilcoxon Signed ranked
test was used to assess for any comparisons.
Results
The median DVA as determined by the Snellen test and both VA apps were found to be exactly the same
(0.63) for both the right and left eyes. More participants passed the CS test with the smartphone apps as
compared to the standard Pelli-Robson test. Statistically significant (p<0.001) lower percentages of
participants were detected as having astigmatism by both smartphone apps when compared to standard
clinical testing.
Conclusion
The Kay iSight professional (paid) and Pocket Eye Exam (free) VA app testing, overall, showed promising
results as they produced results similar to the standard Snellen test. Both the CS smartphone apps
overestimated the results and both astigmatism apps significantly underestimated the number of
participants with astigmatism. These apps therefore failed in providing accurate screenings results and
need to be further modified before it can be used as a screening device. However, due to the lack of
literature more studies need to be done before these devices can be used for home screenings or clinical
use.

11
CHAPTER ONE
INTRODUCTION
1.1 INTRODUCTION
Rapidly advancing technology enabled the healthcare landscape to undergo dramatic changes over the past
few decades. The use of technology to deliver health care services from a distance, often referred to as
telemedicine (Alexander et al., 2011) is one such initiative, which has demonstrated to be an efficient way of
delivering health care despite challenges in underdeveloped areas (Scott., 2016). With telemedicine, healthcare
providers can assess, diagnose and treat certain medical conditions without the patient being physically in front
of them often with the use of a range of technological devices such as computers, smartphones, videos and
software applications (apps) (Smith, 2018).
The eye care industry, including both ophthalmology and optometry has, to an extent, adopted this approach
to offer their services to a larger consumer base. Teleophthalmology has been used to successfully screen
diabetic patients, as well as, to manage and monitor patients with glaucoma and age-related macular
degeneration using apps such as the “ZEISS Diabetic Retinopathy Screening Reading App” (Microsoft, 2015) and
the “Amsler grid app” (All about vision.com., 2018). In addition to digital technology being used for clinical
assessments linked to ocular pathology, there are currently numerous vision screening apps on the market that
can be used to assess visual acuity (VA), contrast sensitivity (CS), astigmatism, stereopsis, colour perception
as well as macular integrity, amongst others. These apps can be used for both clinical and self-assessments. In
the eye care industry, this gives rise to a fairly new but rapidly advancing area of optometry known as
Smartphone app screenings. These apps can be easily downloaded off the Google play and Apple app store as
long as the smart device meets the specified requirements.
Smartphones have become very prevalent in today’s developed world (Tofigh et al., 2015), with its various
apps allowing multifunctional utility (smart vision labs., 2017). The term “mobile health care” is often used to
describe delivery of health care with the use of these smart-tech devices, and this terminology will apply here
onwards. The market for mobile health care has been growing steadily over the past few years and continues
to do so (Medium., 2017). In 2016 there were approximately 259 000 health apps available on all major app
stores and by the end of 2017 mobile health app revenue was expected to reach $26 billion (Medium., 2017).
Furthermore, there are over 43,700 medical apps available in the Apple app store alone for physician and
patient use (Vinay et al., 2015) and according to Jackson & Coker. (2011) approximately four out of five
physicians were already using smart devices in their practices daily, with emergency room physicians (two

12
out of five) and cardiologists (one out of three) in particular, also frequently using digital technology in their
medical practices.
Smartphones therefore currently, not only serve the purpose of communication but have advanced multiple
functionalities with the ability to run advanced apps (Khanna., 2017). Moreover, in today’s society individuals
prefer to take care of their needs at their convenience resulting in the self-service industry growing significantly
in the last few years (Castro et al., 2010). Statistics reveal that, across all industries, 81% of consumers prefer
self-service platforms to service their needs (Malik., 2016). In the airline industry, 70% of flights have been
known to be booked online and around 95% of tickets are issued digitally as e-tickets (GOV.UK., 2014). The
British have also been known to make 18.6 million banking transactions every week using their smartphones
and with the subsequent automation of certain services this has resulted in a cost saving of 20% and improving
customer satisfaction (GOV.UK., 2014). People today lead busy lives hence, there preference for smartphone
visual screenings appeal to them because of its convenience and accessibility. In the field of optometry,
smartphone and mobile apps give these individuals the opportunity to perform vision screening tests on
themselves and provide them with instant feedback regarding their visual status including the possibility of
requiring a full comprehensive eye examination with a registered optometrist.
The uptake and usage of smartphones have, not surprisingly, been unprecedented. In terms of eye and vision
care, there are more people each day using these devices to perform visual screenings hence, the rapid
popularisation of these devices. If these devices are accurate they could possibly be used to negate the lack of
ophthalmic resources in remote areas (Khanna., 2017). This has been linked to the need for ophthalmic care
and devices that are beneficial but also cost-effective. It is envisaged that in the long-term, smart technology
may actually prove useful in reducing the global visual impairment rate which currently stands at 405 million
by providing wider access to ophthalmic care (Bourne et al., 2017).
A variety of smart technology is available to screen both visual functions, as well as ocular health. Eye care
practitioners use the app “Peek Retina®” to screen for retinal pathologies. The “My Scotoma®” app is based
on the Amsler grid test and is used to assess macular integrity, while the “colour blind eye exam®” app screens
for colour vision deficiencies. The afore-mentioned apps can be very useful as tools for the early detection and
monitoring of ocular pathology resulting in improved analysis of ophthalmological findings as well as
improved time efficacy (Tofigh et al., 2015).
In the field of optometry, smartphone apps allow for vision screening and include tests for the assessment of
VA, CS and astigmatism. The “Kay iSight pro®”, “Eye test®” and “Pocket Eye Exam®” are apps used to
provide distance VA measurement. Apps for the assessment of CS include the “Smart Optometry®”, “Variable

13
Contrast Sensitivity test®” and “Vision Scan®” app. Astigmatism may be detected by the “Eye Meter®”,
“Eye Test®” and “EyeXam®” Smartphone apps.
Despite the vast utilisation of these apps in both the optometry and ophthalmology arenas there has been
minimal investigation into the accuracy of these screening apps resulting in the reliability of these apps being
questioned. To the best of the researcher’s knowledge, there has been minimal investigation into the accuracy
and reliability of apps for visual function optometric testing. Inaccuracy of test results would impact the apps
usability as a screening tool. Vinay et al. (2015) asserted that even with the rapid expansion in smartphone
app testing, only approximately 54% of medical apps available on iTunes are reliable healthcare apps.
Moreover, only a small portion of optometric smartphone apps have had high quality research to test the
credibility of the apps bringing its validity into question.
The optometry industry has always been subject to intense regulations to ensure that patients receive the best
possible care with accurate diagnosis and treatment. Smartphone-based optometry testing should be no
different, yet there are limited published studies on the accuracy and reliability of these apps (O’Niell et al.,
2016). Factors such as lighting, target distance and target size need to be controlled and properly calibrated in
order to yield comparatively accurate results. Furthermore, minimal investigation has been done on the results
produced by the visual function apps in comparison to those obtained with standard clinical tests. There are
no known studies on astigmatism app screening and only one study by Habtamu et al. (2019) was focused on
Smartphone CS testing. Therefore, while these apps serve as convenient and accessible vision screeners, their
usage in the eye health sector has, in many instances, not been fully validated.
Therefore, the aim of this study is to determine if the results produced by a selection of iPhone apps for vision
screening are comparable to that produced by the equivalent standard optometric tests.
The objectives more specifically are to:
i. determine the accuracy of the Eye test® and Vision Scan® iPhone applications for assessing distance visual
acuity by comparing the results obtained to that produced by standard optometric distance vision assessment
with a Snellen chart.
ii. compare the results produced by Smart optometry® and Vision Scan® iPhone applications for the
assessment of contrast sensitivity to that obtained with a Pelli-Robson chart.
iii. compare the results obtained in the screening for astigmatism with the Eye test® and Test your eyes:
Eyesight® iPhone applications to that obtained following a subjective refraction.
iv. report on the usefulness of smartphone applications for vision screening.

14
v. determine the subjects’ views of smartphone application screening versus standard clinical testing.
vi. recommend ways in which this technology can be improved for optimal use, if so indicated.
The null hypothesis to be tested in this study is that the results produced by iPhone applications for vision
screening are not comparable to that produced by the equivalent standard optometric tests.
1.2 CONCLUSION
Rapid advancements in the use of mobile technology to deliver health care is unprecedented. The use of
smartphone apps can be used as an effective way of reducing certain health care barriers particularly in outlying
rural settlements where access to ophthalmic care is limited.
Today, more than ever, people are also relying on their smartphones to take care of all their needs with
individuals increasingly taking an active interest in personalised health care particularly motivated by
convenience, affordability and accessibility. There are numerous smartphone apps available on the iStore and
Google play store, however, considering the literature that was reviewed and the limited published literature
on smartphone app screening, it is apparent that more research is required on the accuracy of smartphone vision
testing before it can be used optimally for either screenings and/or clinical use.

15
CHAPTER TWO
LITERATURE REVIEW
2.1 INTRODUCTION
This chapter gives us a summary of the published and grey literature that was found with respect to mobile
and smartphone technology as it relates to eye and vision care. A literature search was conducted using two
main databases i.e., PubMed and Research Gate for peer review studies pertaining to smart technology
optometry visual testing apps. A combination of keywords, such as smartphone technology, iPhone,
applications, visual acuity, astigmatism, contrast sensitivity and vision screening, in the form of title words or
optometry subject headings, were used in the search. Reference lists of all identified articles were cross
checked to identify other relevant studies. Studies dealing with smartphone/smart technology VA, CS as well
as astigmatism testing were included in the compilation of this chapter. A total of 17 articles published from
2013 up to 2019 were found and reviewed.
2.2 SUMMARY OF EXISTING LITERATURE ON VISUAL ACUITY AND CONTRAST
SENSITIVITY USING SMART TECHNOLOGY
Even though there has been an accelerated utilisation of smart technology for visual screenings, there is a
paucity of published studies on the validation of these smart-tech apps. It is extremely important that when an
individual has a vision screening done the results that are produced are accurate and reliable to facilitate the
most appropriate and effective treatment and management being administered for that particular case. The
current study has focused on the screening of distance VA, CS and astigmatism using smart-tech apps.
According to Nangia et al. (2018) VA measurement is one of the main parameters for assessing the quality
and quantity of vision, and subsequently standard of life. Kamiya et al. (2014) asserted that CS testing can be
useful in detecting subtle changes in subjective visual performance. It is known that astigmatism is a type of
refractive error that leads to distorted and blurred vision resulting in difficulty perceiving fine details, as well
as impacting on visual comfort (Mediline plus, 2016). Hence, these visual aspects (VA, CS and astigmatism)
if assessed adequately can provide useful information in the initial assessment of a person’s vision which has
a ripple effect on their overall functioning in life. Table 2.1 is a summary of the 17 articles identified to provide
pertinent information about the accuracy, reliability, validity as well as, the development of the different Smart-
technology apps. No study was found that reported on the assessment of astigmatism with smart technology
hence the limited discussion of this aspect in this chapter.

16
Table 2.1:A summary of visual acuity and contrast sensitivity smart-technology apps researched

17
2.3 SMARTPHONE APPS FOR THE ASSESSMENT OF VISUAL ACUITY
The most well-known test, often regarded as a pertinent indicator of visual function is the Visual acuity test.
(Brady et al., 2015). Both patients and physicians in all spheres of health care are generally familiar with the
concept of “20/20” vision. VA can be assessed quickly and inexpensively with charts that are available
commercially, online for printing and recently with smart devices (Brady et al., 2015). There are numerous
VA apps available today on the Google play and Apple app store ready to be downloaded in seconds.
The most common VA charts available on these apps are the Snellen (letter and tumbling E optotypes) and the
Sloan design VA chart. The apps provide an explanation to the user of what the test is assessing for and how
to perform the test, but to an extent. The apps also generally inform the user of the specified distance the device
should be held for optimum testing, however, apps such as the Variable Contrast Sensitivity test® and the Kay
iSight Pro® test only provide information about the correct testing distance with no explanation as to what the
app is testing for. After conducting the test, the app shows a result and recommends if the user should have a
full eye examination or not.
The most widely researched VA app appears to be the “Peek acuity®” app. A few studies (Brady et al., 2015;
Rono et al., 2015; Bastawrous et al., 2015) have found the Peek acuity® app to be the most popular, as well
as the most accurate and reliable when compared to VAs measured using the standard “5-letter-per-line” retro-
illuminated logMAR charts. To the contrary, De Venecia et al. (2018) found that the “Peek acuity®” app

18
tended to overestimate the VA in scholars aged 6-16 years resulting in a false positive result and recommended
that this app could be made more accurate if the sensitivity (found to be 48%) could be improved.
Smartphone VA app testing that proved to have accurate results was also noted with the “Paxos Checkup®”
app (Pathipati et al., 2016). This app was used to determine the VA of patients in a hospital emergency
department (ED). During the first phase of the study the staff of the emergency department measured the
patients’ VAs using the standard 20 feet Snellen chart and in phase 2, measured patients near VAs using the
“Paxos Checkup®” app. The test results from both phases were compared to VAs taken by ophthalmologists
using the Rosenbaum near chart, which was treated as the benchmark. It was concluded that the best corrected
visual acuity (BCVA) with the app was more accurate than when measured with a standard Snellen chart
(Pathipati et al., 2016). O’Niell et al. (2016) also assessed the validity of a VA test using smart technology
devices in a primary care setting. 60 participants distance VA was assessed with a Snellen wall chart and on
two smart- tech devices (iPhone and iPad). The results of both mobile apps compared very closely to the
standard Snellen chart. The study (O’Niell et al., 2016) postulated that this new type of testing method can
result in more frequent VA testing and hence, potentially identifying ocular or other pathology at an earlier
stage resulting in timely, referrals. Similarly, Han et al. (2019) also assessed distance and near VA using
another mobile app, the V@home® mobile app, the results compared to that achieved with the standard
(ETDRS) chart, as there were minimal discrepancies between the VA measurements across all groups (0.010
to −0.100 logMAR). The study concluded this new app was able to accurately and reliably assess both distance
and near VA. Furthermore, using a survey the participants were asked about their views of the V@home®
Smartphone testing app, with 82.3 % reporting that they were satisfied or extremely satisfied, in addition to
72.5% indicating that they were in favour of repeated use of the system again. This indicates that users of these
apps are fairly receptive to trying new methods for assessing their vision.
While promising results were reported by the aforementioned studies, Pereira et al. (2015), Tofigh et al. (2015)
and Zeri et al. (2018) found other smartphone VA tests to be unreliable or inaccurate. All three studies were
conducted on different smartphone apps. Pereira et al. (2015) evaluated the results obtained with a smartphone-
based VA chart (Dr. Bloggs Ltd® running on an Apple iPhone 4) against that obtained with a Snellen 6m VA
chart at a university teaching hospital in Melbourne, Australia. A two Snellen line mean difference was noted
between charts (0.276 logMAR). Those patients that had a VA poorer than 6/18 a larger mean difference in
results was noted. Another VA app (Eye chart pro® app) only showed reliable results when the patients VA
was better than 6/60. This study by Zhang et al. (2013) also tested the accuracy of a mobile app (Eye Chart
Pro®) that was used on an iPad for testing VA. A total of one hundred and twenty participants underwent VA
testing with the Eye Chart Pro app and these findings were compared against the conventional light-box chart.
The results found by the iPad were greatly better than that of the standard chart (p < 0.001) (Zhang et al.,
19
2013). Similarly, Rhiu et al. (2016) found that when distance VA was assessed using an iPad, the logMAR
VA was undoubtedly better than the iPad Tumbling E chart (p < 0.01) or iPad Landolt C chart (p < 0.01). It
appears therefore that the apps may not be able to reliably determine reduced distance VA in users who actually
have significantly reduced distance VA i.e. poor sensitivity.
Smartphone apps also exist for the assessment of near VA. Near VA measurement using the “Eye handbook®”
iPhone app was compared to the conventional method of using a standard near VA chart (Tofigh et al., 2015).
The study concluded that the “Eye hand Book®” tend to overestimates the near VA by 0.11 LogMAR
compared to the standard near VA. The reason provided for this discrepancy was that the Apple iPhone 5
(1151:1) had a higher contrast ratio than the near card (33:1). The study further recommended that even though
there has been an increase in the use of high-definition screens health care professionals need to be aware of
the differences in VA results between the different types of testing methods.
Livingstone et al. (2016) postulated that optotype contrast and test luminance of devices could result in
variation in VA measurements. This could affect the VA measurements and therefore any devices measuring
VA for clinical purposes should have standardised charts and calibrations as standard test charts do. It has been
recommended that chart luminance be 80 cd/m2 or 120 cd/m2, depending on the standard chart used
(Livingstone et al., 2016). Moreover, Tofigh et al. (2015) asserted that the contrast ratio of a printed Snellen
or ETDRS VA chart is below 33:1, whereas an iPhone screen has a higher contrast ratio of 1151:1. Therefore,
he postulated that the possible mechanism causing a difference between results of the ETDRS VA chart and
the Smartphone app was the higher contrast ratio of the iPhone vs the standard near chart. The study suggested
that similar findings may also occur between other smart-tech platforms as well as standard test charts. It is
therefore necessary to ensure that future smart-tech devices developed have comparable contrast and
luminance to standard testing charts, as variations in these measurements can lead to possible discrepancies in
VA results if standard testing charts are considered the gold standard for these measurements.
2.4 SMART TECHNOLOGY (IPAD) FOR THE ASSESSMENT OF CONTRAST SENSITIVITY
Measurements of CS better characterise visual performance than high contrast VA alone and subsequently can
be used efficiently to detect visual compromise in conditions such as diabetes, glaucoma and AMD (Di Leo et
al., 1992; Keane et al., 2010). Despite its potential benefits, CS testing in a clinical setting is infrequently
performed due to long chair time and expensive equipment required. Smartphone app technology has however,
ventured into this area. While there have been a few studies (Kollbaum et al., 2014; Zeri et al., 2018; Dorr et
al., 2013; Rodriguez et al., 2014; Kingsnorth et al., 2016) in the last decade that have conducted CS testing on
other smart technology devices such as on an iPad and LCD computers, only one study was found that
investigated CS on a smartphone device (Habtamu et al., 2019). This study used the same methodology as the

20
Peek VA® testing to develop and validate a Smartphone Peek Contrast Sensitivity (PeekCS®) test. The
PeekCS® app test was compared to the standard tumbling-E Pelli-Robson CS test (PRCS). The PeekCS® test
showed strong repeatability which was comparable with the PRCS. A faster testing time of (44.6 seconds) was
achieved by the PeekCS® (44.6 seconds) when compared to the PRCS (48.6 seconds). The study concluded
this app produced rapid and repeatable results which compared closely to the PRCS test.
A study by Kollbaum et al. (2014) aimed at determining the accuracy of a PRCS using an iPad. The study
found that the iPad test showed good repeatability when compared to the standard Pelli-Robson test, and
therefore concluded that this testing option could be a faster and timely alternative to existing clinical testing
methods. In contrast, inaccurate CS test results using smart technology, more specifically a liquid crystal
display (LCD) Pelli-Robson chart (electronic version), was reported by Zeri et al. (2018). The LCD chart
results were compared to that of a standard Pelli–Robson chart to assess the performance of a LCD test.
Two consecutive repeated readings at 1 m and at 3 m were conducted. The results revealed that the CS
measured with the LCD resulted in significantly better results than the printed Pelli-Robson at both
distances (p < 0.01). The study suggested that clinicians should be aware that CS results with the Pelli–
Robson computer-generated version is not interchangeable with that obtained with the printed version.
Researchers are trying to develop new and cost-efficient ways for CS testing as many consider contrast
sensitivity function (CSF) as a superior indicator of visual function than high contrast VA and can better
monitor the slow progress of eye blinding diseases (Dorr et al., 2013 and Rodriguez et al., 2014). The study
by Dorr et al. (2013) developed and validated an iPad CS test which was found to be efficient and user-friendly.
The results demonstrated that the iPad test proved reliable at estimating sensitivities at specific spatial
frequencies however, no specific spatial frequency value was mentioned in the article. The authors did
however, state that the maximum sensitivities, which were repeatedly <1%, were observed at low spatial
frequencies. This test also consistently found differences in contrast due to different luminance levels and it
was concluded that CS testing on an iPad was indifferent from that of standard specialised testing.
A similar study to that of Dorr et al. (2013) was conducted by Rodriguez et al. (2014) who also designed a
new CSF test (ClinicCSF) to be used on an iPad. Two versions of the ClinicCSF® were tested i.e. v1 and v2.
Agreement was found between the functional acuity contrast test (FACT) and ClinicCSF® version2 for all
spatial frequencies.
Kingsnorth et al. (2016) aimed to validate the accuracy and repeatability of a near and distance mobile app,
the Aston contrast sensitivity test®. This study determined that smartphone apps found better CS than printed
tests (p = 0.005). Furthermore, the Aston® near and distance apps proved to be valid, repeatable and a time-
efficient method of assessing CS at multiple spatial frequencies. Moreover, Kingsnorth et al. (2016) asserted

21
that paper-based charts are often limited in the number of stimuli they can present and require the examiner to
manually implement and respond to feedback from the patient. Hence, CSF can only be tested in broad discrete
steps of spatial frequencies and contrast. Whereas, computer generated CSF testing cannot test multiple stimuli
of various frequencies and contrasts making their use multifunctional and less time-consuming.
The most distinguishable observation between an iPad/ LCD computer and an iPhone, is the device size which
plays a crucial role in how an app is presented on the intended screen. The screen of an iPad is much longer
and wider when compared to that of an iPhone. The iPhone 6 plus has a 16:9 aspect ratio whereas the iPad has
a 4:3 aspect ratio. A larger screen size usually results in a higher resolution which makes it difficult to resize
some apps. The combination of the resolution and the aspect ratio means that running iPhone apps on the iPad
can result in a stretched-out display or a black border surrounding the app display (Stone., 2019). This means
that not all iPhone apps can be run on an iPad and vice versa, as this will result in inaccurate results due to the
screen sizes and resolution being incorrect. In reference to the assertion by Livingstone et al. (2016) the
discrepancies in contrast ratio, optotype, contrast and test luminance of devices can be possible reasons for the
variation in CS measurements when using a smartphone device compared to standard clinical tests and the
results obtained by the CS studies on an iPad or LCD device cannot apply to smartphone apps. Cox et al.
(1999) also proposed another reason for the difference in contrast values between a standard printed chart and
a smart device being the luminance of surrounding light. The authors (Cox et al., 1999) thus asserted that
practitioners utilising standard letter CS charts do not need to make any further efforts to illuminate the
standard test surrounding. However, practitioners measuring CS using computerized sinewave gratings, may
have their measurements affected by inadequately lit surrounding light.
2.5 FACTORS FOR CONSIDERATION
Within each aspect of vision function screened for, there has been variability among the different apps such as
optotype size, contrast and testing distance. A list of testing variability between the different apps are outlined
below:
i. The brightness and contrast of smartphone screens differ making it difficult to compare the results
produced by different apps (Khanna, 2017).
ii. The size and design of the optotypes used are different between apps, as well as in comparison to
standard clinical tests.
iii. Smartphone optometric tests usually are not dimensionally the same as standard clinical tests, so the
accuracy of the test results may differ if proper calibration is not implemented.

22
iv. Different smartphones have different screen sizes. All tests should be calibrated to the size of the
smartphone screen and if this is not possible then the app should specify which smartphone is
compatible with the app.
v. The instructions provided by the app are not always easy to understand hence, impacting the correct
usage of the app and interpretation of results produced.
Thus, as is noted from previous studies, it is critical to assess smartphone devices to ensure the testing apps
optotype size, luminance and optotype contrast are dimensionally correct and the test results are equally
comparable to conventional tests as studies have shown that electronic versions of vision testing charts may
not always produce the same results as standard tests do.
2.6 CONCLUSION
Studies show that the uptake and usage of Smartphones is unprecedented. There are numerous smartphone
apps available on the iStore and Google play store, however, considering the literature that was studied, there
are very limited studies on the accuracy of these smartphone apps, hence, questioning the accuracy and
reliability of these apps and resulting in the reluctance of eye care professionals to use these apps in a clinical
setting. These findings of this study will, therefore, help guide the usage of these smartphone screening apps
by individuals as well as optometrists. Furthermore, the findings of this assessment can be useful in guiding
the future development of these apps so that their use can be optimized for the delivery of a component of eye
care, and subsequently health management.

23
CHAPTER THREE
METHODOLOGY
3.1 INTRODUCTION
This chapter highlights the methodology utilised in answering the null hypothesis of this study. The study
setting, population and sampling is described initially, followed by a detailed description of the data collection
instruments and procedures. Information on how issues on validity and reliability of the method employed
were ensured are provided. Thereafter, details on how the data was managed and analyzed is described. The
chapter concludes with a summary of the ethical considerations for this study.
3.2 STUDY SETTING
This study was conducted at a private optometry practice (Spec-Savers) in the St. Georges Mall (Western
cape), South Africa, during the period of August 2018 to May 2020.
3.3 STUDY DESIGN
This study was performed in two phases. Phase one employed a cross-sectional, comparative research design
to compare the results of selected smartphone vision screening apps to their equivalent standard optometric
test. Phase two utilised a quantitative, descriptive research design to determine the subjects’ perceptions of
the use of smartphone vision testing apps using a structured questionnaire.
3.4 STUDY POPULATION
The study population comprised of all patients between the ages of 18 to 55 years consulting at the Spec-
Savers St George’s Mall practice, during the period of August 2018 to July 2019. The demographic profile of
the patients seen at the practice included the African, Caucasian, Indian and Mixed-Race groups. The majority
of patients are of medium socio-economic standing and their occupations centered mostly in the
business/computer field.

24
3.5 STUDY SAMPLE
Convenience sampling was used to select 100 subjects who satisfied the criteria outlined in Table 3.1. The
sample size was determined using the G-power calculation which indicated a required sample size of 100 to
achieve a 90% power with significance level of 0.05 to detect a minimum difference of 0.17 LogMAR.
Table 3.1: The inclusion and exclusion criteria of the study
Inclusion criteria Exclusion criteria
Ages 18 to 35 years Subjects not willing to sign consent form
Both genders Unfamiliar with the English language
All race groups
Any refractive error
3.6 DATA COLLECTION INSTRUMENTS
3.6.1 A standard six meter Snellen VA chart was used to determine the participants’ VA at distance. The
Snellen chart uses the Snellen notation to display the VA results. The Snellen VA chart was chosen as
this chart is the most widely available chart and allows easier display on projector systems. The VA
measurements were taken monocularly and the eye that was measured first was randomised for the
participants. The results were thereafter captured onto the data recording sheet in 6m Snellen notation
for easy comparison.
3.6.2 The Pelli-Robson chart was used to determine the participants’ CS at distance. The Pelli Robson chart
is the most widely used chart to test CS. The Pelli-Robson chart is a wall mounted chart and is viewed
from a distance of one meter. The chart uses ten Sloan letters with constant size. The chart consists of
capital letters arranged horizontally which decrease in contrast with each subsequent line. The results
were recorded in log contrast sensitivity (LogCS) and then converted into percentage notation using
the Table 3.2.

25
Table 3.2: Conversion from Log CS to Contrast percentage (The Mars Perceptrix, 2003-2010).
3.6.3 A phoropter was used to perform a comprehensive refraction on each participant. The battery of tests
for refraction comprised of retinoscopy, best sphere, duochrome test, Jackson cross-cylinder, as well
as the Humphriss immediate contrast (HIC) test. These results were used to determine if the participant
had some degree of confirmed astigmatism (≥ 0.50 DC).
3.6.4 An Apple (64 GB), iPhone 6 plus using IOS 9 was used as the smartphone device wherein all apps
were downloaded. All apps were projected from this device on full brightness level and the
necessary calibrations taken into consideration. The screen luminance of the iPhone 6 plus is
approximately 150 cd/m2.
3.6.5 A measuring tape was used to ensure the cellphone was placed at the appropriate distance specified
by each app test which ensured that the test distance for each test was constant for all participants.
Measurements of the test distance were taken with the tape measure starting at the outer canthus of
the participant’s eye and ending at the cellphone screen. This also ensured accuracy of results in this
study.
3.6.6 Six different smartphone apps were chosen i.e. two apps each for VA, CS and astigmatism testing. For
each parameter, one app was downloadable for free while the other required payment before it could
be downloaded. The six apps are described below.
a. Pocket Eye Exam® (Visual acuity – free app): This app was selected as it is free to download off
the Apple app store for testing distance VA and the chart design used was a Snellen chart. The app
provides instructions about the correct testing distance (6 ft) that the phone should be held at but no
information was given as to what the app is testing for. The VA test results are displayed in 20/20
Snellen notation which was thereafter converted by the researcher into 6m Snellen notation for easy
comparison between the different apps and the standard test.

26
b. Smart Optometry® (Contrast sensitivity – free app): The chart used on this app is a Pelli-Robson
test design consisting of eight rows of letters and six capital letters per line. The app provides
instructions on how to perform the test, as well as explanations of what the test is testing for and the
correct testing distance the phone should be held. The test results are displayed in an easy to understand
percentage notation. These results were thereafter converted into LogCS for easy comparison to the
standard Pelli-Robson test.
c. Eye Meter® (Astigmatism – free app): This app employs a fan chart astigmatism wheel. The chart
has a white background with a dark blue astigmatism wheel. The app provides instructions on how to
perform the test, as well as explanations of what the test is testing for and the correct testing distance
the phone should be held. The test results are displayed in an easy to understand ‘Pass/ Fail’ criteria
and a referral as to whether you should have an eye examination is suggested.
d. Kay iSight Professional® (Visual acuity – paid app): This app was purchased from the Apple app
store for R 69.99. This app tests both distance and near VA using Kay letters. The results can be
displayed in LogMAR, Snellen and decimal notation. Only testing distance information was given by
this app.
e. Variable Contrast Sensitivity test® (Contrast sensitivity – paid app): This app was purchased for R
199.99 from the Apple app store. This app tests both distance (2m and 3m) and near (40cm) CS. This
app tests CS from 1.25% to 100%. The chart used was a Pelli-Robson chart design presenting five
letters of high contrast first and then decreasing in contrast with each subsequent row of letters. The
results are displayed in an easy to understand a percentage notation which was thereafter converted
into LogCS. The app does not give instructions on how to perform the test or what the test is testing
for.
f. Eye test® (Astigmatism – paid app): This iPhone optometric app costs R 14.99 to purchase off the
Apple app store. This test contains a high contrast black astigmatism fan and block astigmatism wheel
against a white background. This app provides clear test instructions, as well as correct testing distance
the Smartphone should be held. The results are displayed is an easy to understand ‘Pass/ Fail’ criteria.
The results from all of the above app tests, as well as the standard tests were recorded onto the data recording
sheet (Appendix 1). The data recording sheet was used to capture each participant’s test results. The table was
in a 3x4 format. There were three separate tables, each table displayed the results of a single optometric test
namely, VA, CS or astigmatism.

27
For the VA table, the dependent variable consisted of the three types of VA tests used, namely, a Snellen 6-
meter VA chart, Free App: Pocket Eye exam® and the Paid App: Kay iSight Professional®. The independent
variables were the results of the right and left eyes.
For the CS table, the dependent variable consisted of the three CS tests used viz. The standard Pelli-Robson
test, Free app: Smart Optometry® and the Paid app: Variable Contrast Sensitivity® test. The independent
variables were the results of the right and left eyes.
For the Astigmatism table: The tables dependent variable was the three astigmatism tests performed that will
include the standard JCC test, the Free app: Eye Meter® and the Paid app: Eye test®. The independent variables
were the results of the right and left eye.
3.6.7 A structured questionnaire (Appendix 2) was used to collect information about the participants. There
were three main sections in the questionnaire. Section One captured the demographic profile of the
participants including age, gender, race and occupation. Section Two contained questions that compared
the standard optometric test to the smartphone apps. Questions in Section Three were closed-ended
questions relating to the three types of apps used (VA, CS and Astigmatism). The questions revolved
around the ease of use of the apps, instructions by the apps as well as the participant’s subjective opinion
of each of the tests. The questionnaire was based on a previously published questionnaire in this field
of research and was validated in the pilot study. The data from the pilot study was used in the main
study. The questionnaire took approximately 5 minutes to complete 11 questions. It was available only
in English.
3.7. DATA COLLECTION PROCEDURE
Data collection commenced once relevant ethical clearance had been obtained (BE703/18) (Appendix 4). The
participants recruited for this research were patients coming in for eye tests at the Spec-Savers St. George’s
Mall optometric practice. Before they had begun their optometric examination, the principal researcher
informed the respondent of the nature of the study and invited them to participate. If the participant was keen
on being a part of the study, informed consent was obtained before proceeding with the research (Appendix
4).
3.7.1 Part A
Optometric testing commenced in the conventional sequence. Standard testing for VA, CS and astigmatism
were completed first. After the full eye examination was completed, participants were presented with the six
smartphone apps to assess VA, CS and astigmatism, the presentations of which were randomized. The results
28
were captured onto the data recording sheet. All tests were performed on both the right and left eyes. Room
lighting and test distance was controlled and standardised for each test.
Standard optometric tests
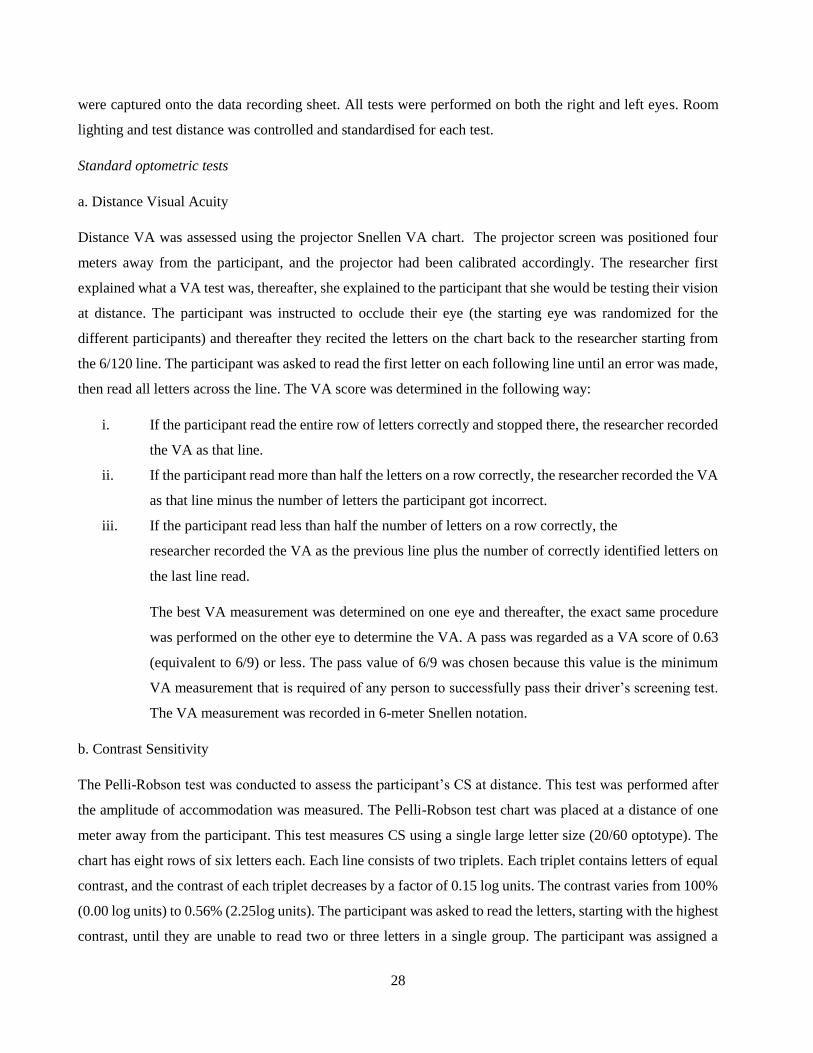
a. Distance Visual Acuity
Distance VA was assessed using the projector Snellen VA chart. The projector screen was positioned four
meters away from the participant, and the projector had been calibrated accordingly. The researcher first
explained what a VA test was, thereafter, she explained to the participant that she would be testing their vision
at distance. The participant was instructed to occlude their eye (the starting eye was randomized for the
different participants) and thereafter they recited the letters on the chart back to the researcher starting from
the 6/120 line. The participant was asked to read the first letter on each following line until an error was made,
then read all letters across the line. The VA score was determined in the following way:
i. If the participant read the entire row of letters correctly and stopped there, the researcher recorded
the VA as that line.
ii. If the participant read more than half the letters on a row correctly, the researcher recorded the VA
as that line minus the number of letters the participant got incorrect.
iii. If the participant read less than half the number of letters on a row correctly, the
researcher recorded the VA as the previous line plus the number of correctly identified letters on
the last line read.
The best VA measurement was determined on one eye and thereafter, the exact same procedure
was performed on the other eye to determine the VA. A pass was regarded as a VA score of 0.63
(equivalent to 6/9) or less. The pass value of 6/9 was chosen because this value is the minimum
VA measurement that is required of any person to successfully pass their driver’s screening test.
The VA measurement was recorded in 6-meter Snellen notation.
b. Contrast Sensitivity
The Pelli-Robson test was conducted to assess the participant’s CS at distance. This test was performed after
the amplitude of accommodation was measured. The Pelli-Robson test chart was placed at a distance of one
meter away from the participant. This test measures CS using a single large letter size (20/60 optotype). The
chart has eight rows of six letters each. Each line consists of two triplets. Each triplet contains letters of equal
contrast, and the contrast of each triplet decreases by a factor of 0.15 log units. The contrast varies from 100%
(0.00 log units) to 0.56% (2.25log units). The participant was asked to read the letters, starting with the highest
contrast, until they are unable to read two or three letters in a single group. The participant was assigned a
29
score (Log CS) based on the contrast of the last group in which two or three letters were correctly read. The
score was recorded in Log CS and then converted into percentage notation (using Table 3.2). A pass was
regarded as a contrast score of 1.65 or better (Aziz, 2014). Any value less than this was regarded as a fail. The
final score was recorded on the data recording sheet. This procedure was performed on both the right and left
eyes.
c. Determination of Astigmatism
The presence of astigmatism was assessed during the subjective refraction, in particular during the Jackson
Cross-Cylinder (JCC) test. Once the best sphere was determined, the participant was asked to focus on a letter
“O” and the axis of astigmatism (minus cylinder form) was determined using the recommended procedure
when doing the JCC test. Once the axis was determined, the power of astigmatism was determined. An
astigmatism value of -0.50D or higher, was regarded as being clinically significant and taken to indicate that
the participant had astigmatism. The results were then captured onto the data recording sheet by the researcher.
This procedure was performed on both the right and left eyes.
Smartphone app tests
a. Distance Visual Acuity
Distance VA was assessed using two apps viz. the Kay iSight Test Professional® and Pocket Eye Exam®
apps. The participants were not given any instructions on how the test is performed or what each test was
testing for. He/she had to read the instructions given by the app and perform the test accordingly. The only
instruction that was given to the participant was that he/she must read the letters aloud and if the app has
multiple chart designs, he/she was instructed to ONLY perform the Snellen VA test. The VA measurement for
each eye was recorded on the data recoding sheet accordingly.
b. Contrast Sensitivity
The Smart Optometry® and Variable Contrast Sensitivity® apps were used to assess CS of the participant. As
with the previous tests the participant was not given any verbal instructions from the researcher and he/she had
to read and follow the instructions of the app. Once the participant had read and performed the test on each
eye the researcher recorded the results in a percentage notation onto the data recording sheet.
c. Astigmatism
An assessment of the presence of astigmatism was determined using the Eye Meter® and Eye test®
Smartphone apps. Here again, the participant was not given any instructions how the test was performed or
what each test was testing. He/she had to read the instructions given by the app and perform the test
30
accordingly. The test was conducted on both the RE and LE. The astigmatism result was recorded on the data
recording sheet.
3.7.2 Part B
After performing all standard optometric tests, as well as the smartphone optometric screening tests, the
participants were asked to complete a questionnaire consisting of 11 questions with a multiple-choice design
pertaining to both the standard tests, as well as the apps. All questions were closed-ended. There were three
main sections to this questionnaire. Questions in Section One captured the demographic profile of the
participants including age, gender, race and occupation. Section Two contained questions that compared the
standard optometric tests to the smartphone app tests. The questions related to the participants’ preferred
testing procedure, which method had the easier testing instructions, as well as their preferred testing method
for future. Questions in Section Three revolved around the usability, the ease of use, instructions by the apps,
as well as the participant’s subjective opinion of each of the three smartphone apps (VA, CS and astigmatism).
The researcher was within proximity to attend to any queries that the participants could have had regarding
the questionnaire.
3.8 PRODUCT OF RESEARCH
The findings of this study will be disseminated using publications in relevant peer-reviewed journals and
conference presentations. Thus far two manuscripts (Appendices 7 and 8) have been submitted for
consideration to the journals Ophthalmic Epidemiology and Indian Ophthalmology respectively
3.9 PILOT STUDY
A pilot study was conducted on ten participants who met the inclusion criteria. The pilot study results, and
feedback was used to modify the proposed study procedure and questionnaire, if required, before
commencement of data collection.
3.10 VALIDITY AND RELIABILITY
3.10.1 All standard optometric tests, included in the study, are established tests for determining VA, CS and
astigmatism. Various studies (Boslaugh et al., 2018; Levy et al., 1974; Elliot et al., 1990; Priors et al., 1986
and Persson et al., 1973) have been used accordingly to assess the same aspects of vision.
3.10.2 All optometric tests conducted are within the scope of practice of the researcher.
3.10.3 All tests were conducted by the researcher ensuring standardisation of instructions, procedures and
recording.

31
3.10.4 The same iPhone was used for all apps and on all participants.
3.10.5 The smartphone apps chosen are registered on the Apple app store.
3.10.6 Before the commencement of data collection a pilot study was conducted to validate the data collection
instruments, procedures and recording.
3.10.7 All standard optometric tests were conducted as per published procedure in reference texts (Kolker.,
2015).
3.10.8 All smartphone app testing was conducted according to the manufacturer’s recommendations.
3.10.9 Both standard optometric tests and iPhone apps were conducted under normal lighting conditions (1300
lux)- wozniak et al. 1999.
3.10.10 The researcher was available to provide clarification, if required, during the completion of the
questionnaire.
3.10.11 Each app optometric test was analysed to ensure that each test’s optotype size is calibrated to be used
at their specific distance.
3.10.12 To ensure reliability the questionnaire was piloted before the study. The questionnaire was self-
administered; however, the researcher provided clarification if it was required.
3.11 DATA ANALYSIS
Statistical data analysis was conducted using the Statistical Package for Social Sciences (SPSS) v25 in
conjunction with a statistician. Descriptive statistics including frequencies, means, medians and Inter Quartile
Ranges were used to report the results. Because the data was not normally distributed, the Wilcoxon signed
ranked test was used to compare two paired groups to essentially calculate the difference in means and to
assess for statistically significant differences at a 95% confidence level (p<0.05). Cross-tabulations and the
Chi-squared test were used to investigate any associations between categorical variables. The results are
illustrated using tables and figures.

32
3.12 DATA MANAGEMENT
Data was captured by the researcher only. The electronic data will be stored in a password protected electronic
device. The researcher will be the only person who will have access to this storage facility. The raw data will
be retained for a 5 year period, following which it shall be shredded and discarded of accordingly.
3.13. ETHICAL CONSIDERATIONS AND CONFIDENTIALITY
This study adhered to the tenets of the Declaration of Helsinki.
3.13.1. Permission was obtained from the proprietor of St. Georges Mall Spec-Savers to conduct the research
on their premises and use the available equipment (Appendix 5).
3.13.2. Ethical clearance was obtained from the Biomedical Research Ethics Committee of the University of
KwaZulu-Natal prior to data collection (Appendix 4).
3.13.3. Informed consent was obtained from the participants.
3.13.4. The identity of the subject will remain anonymous.
3.13.5. Participant’s personal information was kept confidential and they were only be identified by their
participation number.
3.13.6. None of the tests were invasive and therefore posed no risk to the participant.
3.13.7. Password protected electronic devices were used to store the data.
3.13.8. Raw data will be archived in a secure cabinet.
3.14 CONCLUSION
Data was collected during the period of January 2019 to July 2019. A total of 113 participants were enrolled
in the study. The pilot study was effective in modifying the data collection procedure, as well as the data
collection tool. With the help of a statistician and SPSS the data was skillfully analysed. The study utilised
convenience sampling which thus involved the use of a sample of the population which was close at hand.
Standardised procedures and settings were utilised during the data collection. The analysis of the data collected
will be presented in Chapter Four.

33
CHAPTER FOUR
RESULTS
4.1 INTRODUCTION
This chapter is a concise presentation of the research findings. The results are presented by means of figures,
graphs and tables. Comparisons of the results from the standard and smartphone tests were made to determine
if these app tests provide accurate and reliable results. The responses from the participants are also analysed
in this section to determine the users’ perspectives on smartphone testing compared to standard clinical testing.
4.2 DEMOGRAPHICS
There was a total of 113 participants in this study, however as one participant was monocular, results were
obtained for 113 right eyes but only 112 left eyes. Almost two-thirds of the participants were female (61.1%,
n = 69) and the majority of the participants were Black African (Figure 4.1). The ages of the participants ranged
from 18 to 35 years with a mean age of 27.56 ± 4.30 years. The median age was 27 years.
Figure 4.1: Number of participants according to race and gender
The participants’ occupations were classified into three main categories according to their frequency of
computer use and included minimal computer use, moderate computer use, and high computer use. The high
computer use category included office workers (16.8%), call centre agents (12.4%) and students (11.5%).
More than half of the participants (53.1%) fell in the high computer use category. Moderate computer use
30
2018
1
20
15
63
50
35
24
4
0
10
20
30
40
50
60
Black Coloured White Indian
Nu
mb
er o
f p
arti
cip
ants
Female (n=69) Male (n=44) Total (n=113)
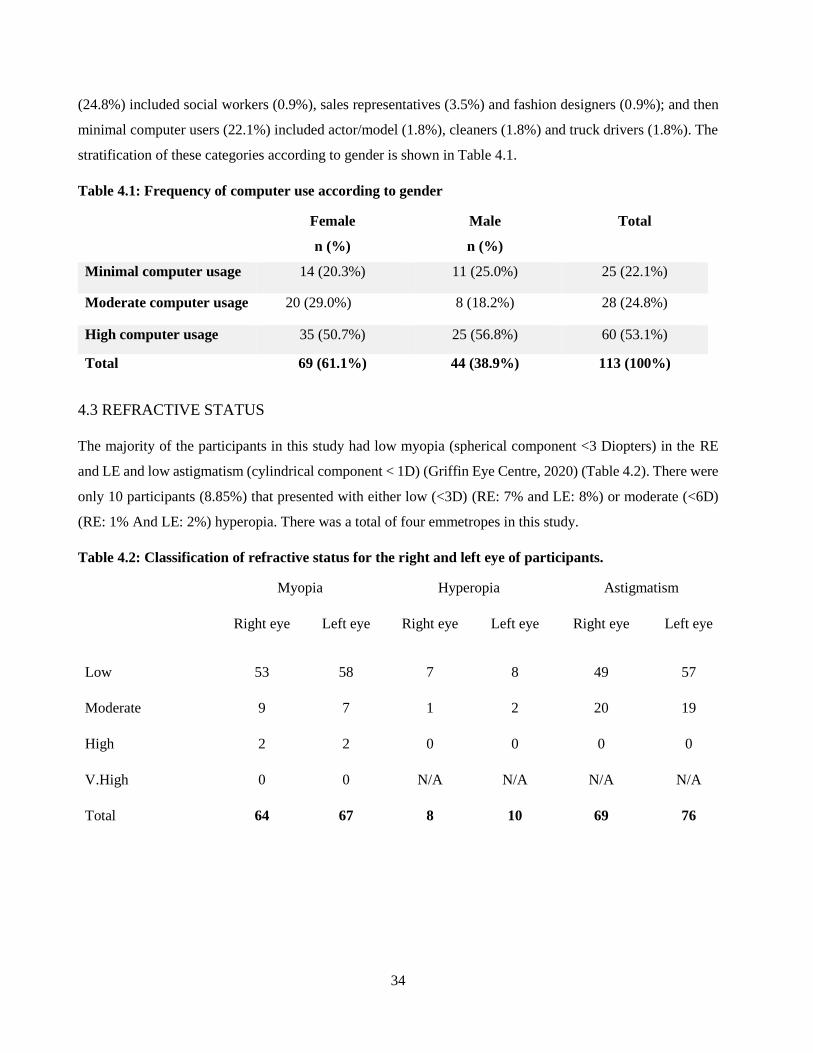
34
(24.8%) included social workers (0.9%), sales representatives (3.5%) and fashion designers (0.9%); and then
minimal computer users (22.1%) included actor/model (1.8%), cleaners (1.8%) and truck drivers (1.8%). The
stratification of these categories according to gender is shown in Table 4.1.
Table 4.1: Frequency of computer use according to gender
Female
n (%)
Male
n (%)
Total
Minimal computer usage 14 (20.3%) 11 (25.0%) 25 (22.1%)
Moderate computer usage 20 (29.0%) 8 (18.2%) 28 (24.8%)
High computer usage 35 (50.7%) 25 (56.8%) 60 (53.1%)
Total 69 (61.1%) 44 (38.9%) 113 (100%)
4.3 REFRACTIVE STATUS
The majority of the participants in this study had low myopia (spherical component <3 Diopters) in the RE
and LE and low astigmatism (cylindrical component < 1D) (Griffin Eye Centre, 2020) (Table 4.2). There were
only 10 participants (8.85%) that presented with either low (<3D) (RE: 7% and LE: 8%) or moderate (<6D)
(RE: 1% And LE: 2%) hyperopia. There was a total of four emmetropes in this study.
Table 4.2: Classification of refractive status for the right and left eye of participants.
Myopia Hyperopia Astigmatism
Right eye Left eye Right eye Left eye Right eye Left eye
Low 53 58 7 8 49 57
Moderate 9 7 1 2 20 19
High 2 2 0 0 0 0
V.High 0 0 N/A N/A N/A N/A
Total 64 67 8 10 69 76

35
4.4 DISTANCE VISUAL ACUITY
The accuracy of the Pocket Eye Exam® (in this section referred to as the Free App) and the Kay iSight Test
Professional® iPhone app (in this section referred to as the Paid App), for measuring distance VA (DVA) was
assessed by comparing the results obtained with the apps to that produced by standard optometric distance
vision measurement with a Snellen chart.
4.4.1 Median Distance Visual Acuity
A total of 225 distance VA measurements from 113 participants were obtained using the standard 6m Snellen
VA chart, as well as on the free and paid smartphone apps. The results of the right eyes (n = 113) are separated
from that of the left eyes (n = 112). All measurements were converted into decimal notation for comparison
(Table 4.3). As the data was not normally distributed, the medians and not the means are presented.
Table 4.3: Median DVA with interquartile range (IQR) in decimal notation obtained with the Snellen
chart, free App (Pocket Eye Exam®) and paid App (Kay iSight Test Professional®)
The median for both VA apps and the Snellen test were exactly the same (0.63) for both the right and left eyes.
Even though the median was consistently 0.63 for all tests, the lower IQR for the free app (RE and LE) and
paid app (LE) scores were slightly higher than the lower IQR for the Snellen test.
As the data was not normally distributed the Wilcoxon signed ranked test was used to test for statistical
significance. When comparing the DVAs of the right eyes obtained with either apps to that of the Snellen
chart, the differences were statistically significant (p values <0.01). Similarly, statistically significant
differences were also obtained for the left eyes when comparing the standard test to the Free and Paid apps.
However, when the difference in IQR between the right eye measurements obtained with the Snellen chart
compared to the Free and Paid app values, the IQR difference was always less than 0.1 decimal notation which
would have indicated not more than a one-line difference in DVA. This was the same for the left eyes as well.
This indicates no clinically significant differences in DVAs between the standard test and either apps.
RIGHT EYES LEFT EYES
Median (IQR) Median (IQR)
Snellen Chart 0.63 (0.20; 1.00) 0.63 (0.20; 1.00)
Free App 0.63 (0.25; 1.00) 0.63 (0.32; 1.00)
Paid App 0.63 (0.20; 1.00) 0.63 (0.25; 1.00)
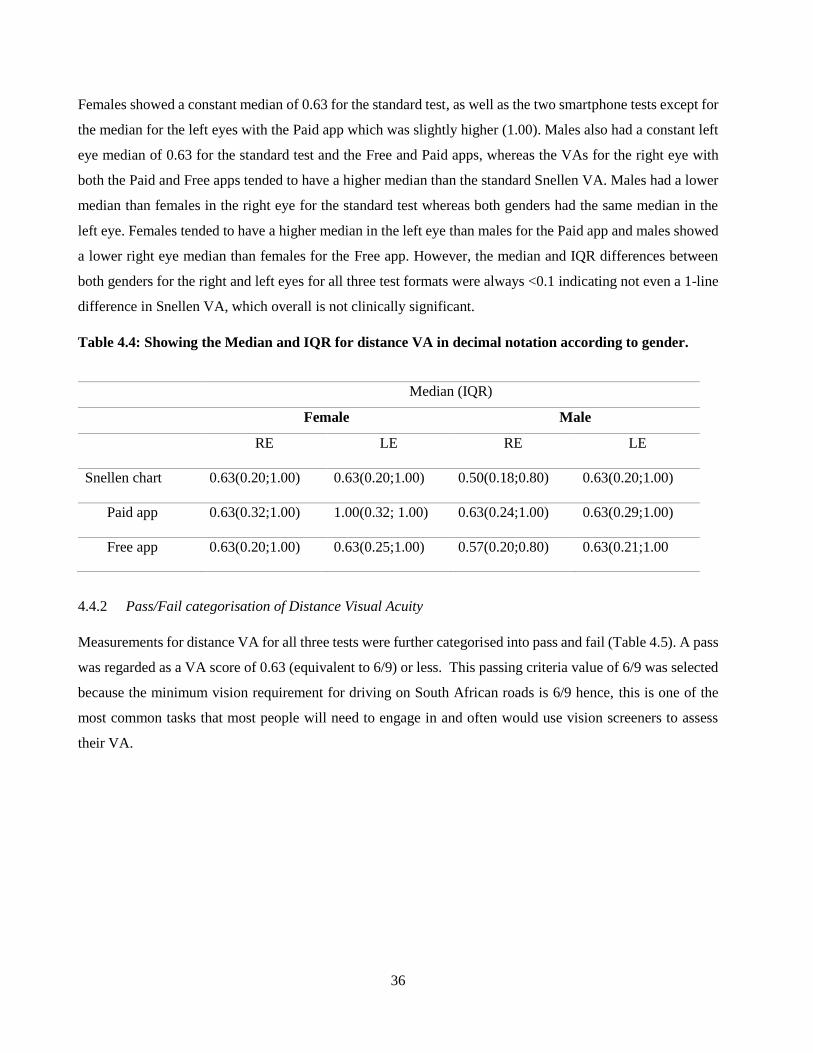
36
Females showed a constant median of 0.63 for the standard test, as well as the two smartphone tests except for
the median for the left eyes with the Paid app which was slightly higher (1.00). Males also had a constant left
eye median of 0.63 for the standard test and the Free and Paid apps, whereas the VAs for the right eye with
both the Paid and Free apps tended to have a higher median than the standard Snellen VA. Males had a lower
median than females in the right eye for the standard test whereas both genders had the same median in the
left eye. Females tended to have a higher median in the left eye than males for the Paid app and males showed
a lower right eye median than females for the Free app. However, the median and IQR differences between
both genders for the right and left eyes for all three test formats were always <0.1 indicating not even a 1-line
difference in Snellen VA, which overall is not clinically significant.
Table 4.4: Showing the Median and IQR for distance VA in decimal notation according to gender.
Median (IQR)
Female Male
RE LE RE LE
Snellen chart 0.63(0.20;1.00) 0.63(0.20;1.00) 0.50(0.18;0.80) 0.63(0.20;1.00)
Paid app 0.63(0.32;1.00) 1.00(0.32; 1.00) 0.63(0.24;1.00) 0.63(0.29;1.00)
Free app 0.63(0.20;1.00) 0.63(0.25;1.00) 0.57(0.20;0.80) 0.63(0.21;1.00
4.4.2 Pass/Fail categorisation of Distance Visual Acuity
Measurements for distance VA for all three tests were further categorised into pass and fail (Table 4.5). A pass
was regarded as a VA score of 0.63 (equivalent to 6/9) or less. This passing criteria value of 6/9 was selected
because the minimum vision requirement for driving on South African roads is 6/9 hence, this is one of the
most common tasks that most people will need to engage in and often would use vision screeners to assess
their VA.

37
Table 4.5: Showing the frequency of pass and fail categorisation of distance visual acuity obtained with
the Snellen chart, Free and Paid Apps.
RIGHT EYES LEFT EYES
PASS
(n) (%)
FAIL
(n) (%)
PASS
(n) (%)
FAIL
(n) (%)
Snellen
Chart
58
(51.3%)
55
(48.7%)
67
(59.3%)
45
(39.8%)
Free
App
69
(61.1%)
44
(38.9%)
70
(61.9%)
42
(37.2%)
Paid
App
63
(55.8%)
50
(44.2%)
67
(59.3%)
45
(39.8%)
A higher percentage of participants, when considering both right and left eyes, were able to pass the distance
VA test with the Free app when compared to the Snellen chart and the Paid app, resulting in a relatively higher
overestimation rate by the Free app. The Paid app also tended to overestimate the distance VA when compared
to the Snellen chart however, the overestimation was not as high as with the Free app.
4.4.3 Sensitivity and specificity of visual acuity tests
Sensitivity refers to the ability of a test to correctly identify those individuals that have a disease, while
specificity is the ability of a test to correctly identify those individuals who do not have the disease. In this
context, “disease” was taken to be distance visual acuity of less than 6/9 (0.63). The specificity and sensitivity
was calculated using the z-test and the exact binomial distribution.

38
Table 4.6: Showing the Sensitivity and Specificity of the Free App for Distance Visual Acuity for the
right and left eyes in relation to the Snellen chart
Snellen VA (Gold Std)
True Pass True Fail
RE LE RE LE
Free App - Pass 42 39 2 3
Fail App – Fail 13 6 56 64
Total 55 45 58 67
Sensitivity Specificity
76 87% 97% 96%
The Free App showed higher sensitivity for the left eyes compared to the right eyes, while the specificity of
the right and left eyes was found to be almost the same (Table 4.6). Slightly higher values of sensitivity and
specificity were found for the Paid App for the right and left eye (Table 4.7).
Table 4.7: Showing the Sensitivity and Specificity of the Paid App for Distance Visual Acuity for the
right and left eyes in relation to the Snellen chart.
Snellen VA (Gold Std)
True Pass True Fail
RE LE RE LE
Paid App - Pass 49 43 1 2
Paid App – Fail 6 2 57 65
Total 55 45 58 67
Sensitivity Specificity
89% 96% 98% 97%
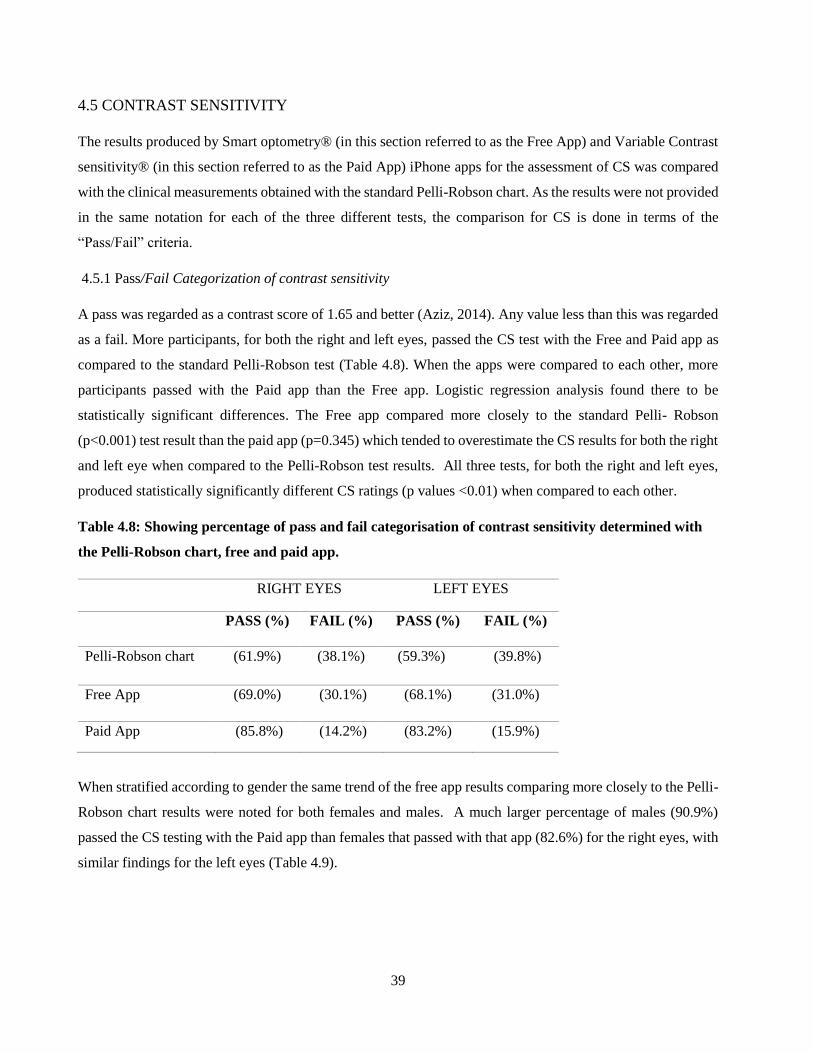
39
4.5 CONTRAST SENSITIVITY
The results produced by Smart optometry® (in this section referred to as the Free App) and Variable Contrast
sensitivity® (in this section referred to as the Paid App) iPhone apps for the assessment of CS was compared
with the clinical measurements obtained with the standard Pelli-Robson chart. As the results were not provided
in the same notation for each of the three different tests, the comparison for CS is done in terms of the
“Pass/Fail” criteria.
4.5.1 Pass/Fail Categorization of contrast sensitivity
A pass was regarded as a contrast score of 1.65 and better (Aziz, 2014). Any value less than this was regarded
as a fail. More participants, for both the right and left eyes, passed the CS test with the Free and Paid app as
compared to the standard Pelli-Robson test (Table 4.8). When the apps were compared to each other, more
participants passed with the Paid app than the Free app. Logistic regression analysis found there to be
statistically significant differences. The Free app compared more closely to the standard Pelli- Robson
(p<0.001) test result than the paid app (p=0.345) which tended to overestimate the CS results for both the right
and left eye when compared to the Pelli-Robson test results. All three tests, for both the right and left eyes,
produced statistically significantly different CS ratings (p values <0.01) when compared to each other.
Table 4.8: Showing percentage of pass and fail categorisation of contrast sensitivity determined with
the Pelli-Robson chart, free and paid app.
RIGHT EYES LEFT EYES
PASS (%) FAIL (%) PASS (%) FAIL (%)
Pelli-Robson chart (61.9%) (38.1%) (59.3%) (39.8%)
Free App (69.0%) (30.1%) (68.1%) (31.0%)
Paid App (85.8%) (14.2%) (83.2%) (15.9%)
When stratified according to gender the same trend of the free app results comparing more closely to the Pelli-
Robson chart results were noted for both females and males. A much larger percentage of males (90.9%)
passed the CS testing with the Paid app than females that passed with that app (82.6%) for the right eyes, with
similar findings for the left eyes (Table 4.9).

40
Table 4.9: Showing the percentage of pass and fail categorisation for contrast sensitivity determined
with the Pelli-Robson chart, Free and Paid app according to gender.
PASS (%) FAIL (%)
Female Male Female Male
RE LE RE LE RE LE RE LE
Pelli -
Robson 60.9% 59.4% 63.6% 59.1% 39.1% 40.6% 36.4% 38.6%
Paid app 69.6% 66.7% 70.5% 70.5% 30.4% 33.3% 29.5% 27.3%
Free app 82.6% 79.7% 90.9% 88.6% 17.4% 20.3% 9.1% 9.1%
When comparing the contrast sensitivity results of the Pelli-Robson chart to the free app for both males and
females, similar trends were noted for both the right and left eyes where the Free app was found to pass more
participants than the standard test.
4.5.2 Sensitivity and specificity of the contrast sensitivity tests
The Free app showed much higher specificity than sensitivity when screening for CS, in relation to the Pelli-
Robson chart, for both the RE and LE (Table 4.10).
Table 4.10: Showing sensitivity and specificity of the Free App for CS for the RE and LE in relation to
the Pelli-Robson chart
Pelli-Robson (Gold Std)
True Pass True Fail
RE LE RE LE
Free App - Pass 68 66 11 11
Free App – Fail 2 1 32 34
Total 70 67 43 45
Sensitivity Specificity
74% 76% 97% 99%

41
The sensitivity of the Paid app for both the right and left eyes (Table 4.11), in relation to the Pelli-Robson chart
was much lower than its specificity as well as, lower than the sensitivity of the Free app (Table 4.10). However,
the Paid app had very high specificity values for both the RE and LE.
Table 4.11: Showing sensitivity and specificity of the Paid app for CS for the RE and LE in relation to
the Pelli-Robson chart.
Pelli-Robson (Gold Std)
True Pass True Fail
RE LE RE LE
Paid App - Pass 69 65 28 29
Paid App – Fail 1 2 15 16
Total 70 67 43 45
Sensitivity Specificity
35% 36% 99% 97%
4.6 ASTIGMATISM
4.6.1 Detection of astigmatism
The results obtained for the assessment of astigmatism by the Eye test® (in this section referred to as the Paid
App) and Eye Meter® iPhone app (in this section referred to as the Free App) were compared to the JCC
values after a subjective refraction was performed.
More than half of the participants had at least 0.50D of astigmatism in the RE (59.3%) and LE (61.1%) as
determined with the standard JCC test. Statistically significant (p<0.001) lower percentages of participants,
as determined by the chi squared test were detected as having astigmatism by both the Free and the Paid apps
(Table 4.12).

42
Table 4.12: Showing the frequency of participants with astigmatism and no astigmatism as determined
with the JCC test, Free and Paid apps.
RIGHT EYES LEFT EYES
No
Astigmatism
(%)
Astigmatism
(%)
No
Astigmatism
(%)
Astigmatism
(%)
JCC test 46 (40.7%) 67 (59.3%) 43 (38.1%) 69 (61.1%)
Free App 83 (73.5%) 30 (26.5%) 84 (74.3%) 28 (24.8%)
Paid App 65 (57.5%) 48 (42.5%) 68 (60.2%) 44 (38.9%)
While both the Free and the Paid apps underestimated the number of participants having astigmatism when
compared to the JCC test, for both the right and left eyes, the Free App appeared to miss more of the
astigmatism than the Paid App.
When the results were further stratified according to gender, similar results were noted. In comparison to the
JCC test, both apps underestimated the number of females and males that presented with astigmatism (Table
4.13). Again, the results provided by the Paid App was a little closer to that of the JCC test in both genders,
compared to the Free App.

43
Table 4.13: Showing the frequency of participants with astigmatism and no astigmatism as determined
with the JCC test, Free App and Paid App classified according to gender
No Astigmatism (%) Astigmatism (%)
Female Male Female Male
RE LE RE LE RE LE RE LE
JCC
test
30
(43.5%)
30
(43.5%)
16
(36.4%)
13
(29.5%)
39
(56.5%)
39
(56.5%)
28
(63.6%)
30
(68.2%)
Paid
app
53
(76.8%)
52
(75.4%)
30
(68.2%)
32
(72.7%)
16
(23.2%)
17
(24.6%)
14
(31.8%)
11
(25.0%)
Free
app
44
(63.8%)
44
(63.8%)
21
(47.7%)
24
(54.5%)
25
(36.2%)
25
(36.2%)
23
(52.3%)
19
(43.2%)
4.6.2 Sensitivity and specificity for the detection of astigmatism
The specificity of the Free App in the right eye was 45% and the sensitivity of the right eye was undefined due
to the false positive value being 0. The left eye had an 88% sensitivity and the specificity was undefined. A
45% specificity of the right eye indicated this test was not good at identifying those participants with no
astigmatism.
Table 4.14: Showing the sensitivity and specificity of the Free App for the identifying of astigmatism for
the RE and LE in comparison to the JCC test
JCC test
True Pass True Fail
RE LE RE LE
Free App - Pass 30 28 0 0
Free App – Fail 37 41 39 43
Total 67 69 39 43
Sensitivity Specificity
undefined 88% 45% undefined

44
The sensitivity and specificity for the right eye was determined as 98% and 70%, respectively and the
sensitivity of the left eye was 36% and the specificity was undefined (Table 4.15). The left eyes had very low
sensitivity (36%) indicating this test is not adequate in identifying individuals with astigmatism.
Table 4.15: Showing the sensitivity and specificity of the Paid App for the identifying of astigmatism for
the RE and LE in comparison to the JCC test
JCC test
True Pass True Fail
RE LE RE LE
Paid App - Pass 45 25 20 43
Paid App – Fail 1 44 47 0
Total 46 69 67 43
Sensitivity Specificity
98% 36% 70% Undefined
4.7 QUESTIONNAIRE
The questionnaire was used to determine the participants’ views of smartphone app screening versus
standard testing. All participants (N = 113) completed a questionnaire consisting of 11 questions after the
standard and app testing was performed.
4.7.1 Preference of testing format according to gender
When participants were asked which testing procedure they preferred, 74.3% chose the standard testing
method, 23.0% the smartphone app and 2.7% indicated no specific preference. The majority of males (75%)
and females (74%) preferred the standard test. Approximately equal percentages of females (23.2%) and males
(22.7%) choose the smartphone test. Of those that preferred the standard testing option (Figure 4.2), 40.7%
chose this option because they felt it was more reliable, 27.4% because it was familiar to them, 16.8% found
it to be more interactive and 9.7% chose this option because it was easier to understand. It was found that more
males (47.7%) than females (36.2%) chose the standard test as being more reliable and more females (30.4%)
than males (22.7%) chose familiarity as the reason for selecting the standard test as their preferred testing
option

45
Figure 4.2: Showing reasons for selecting the standard test as preferred testing option stratified
according to gender
Even though the majority of participants (74.3%) preferred the standard test, when asked which testing method
had “easier to understand” instructions, 63.7% of participants said both the standard and app tests were equally
easy to understand.
4.7.2 Preference of testing format according to age
Figure 4.3 shows that the majority of all age groups (85% of 30 to 35 year olds, 76% of 25 to 29 year olds and
59% of the 18 to 24 year olds) preferred the standard testing. It was further noted that of those that preferred
the smartphone testing, the greatest proportion (34%) were from the youngest age group (18 to 24 year olds).
It is clear from these findings that the older population would prefer the normal standard testing procedure and
the younger age range would choose the smartphone testing.
1,4%
1,4%
0%
1,4%
1,4%
30,4%
0%
0%
36,2%
17.4%
10.1%
2.3%
22,7%
47.7%
15.9%
9,1%
0.9%
0.9%
0,9%
0,9%
1,8%
27,4%
0%
0%
40.7%
16,8%
9.7%
0 10 20 30 40 50 60
Easier to understand, interactive, reliable
Easier to understand, interactive
Interactive, less time consuming
easier to understand,less time consuming
easier to understand, reliable
Familiar
I don’t know
Less time consuming
More reliable
More interactive
Easier to understand
Total Male Females

46
Figure 4.3: Distribution of preference according to age group
Figure 4.4 shows the age stratification for the different reasons chosen for preference of testing method. The
most popular reason for preference of a particular testing method varied among the age groups. Familiarity
with a test appeared more important to the older subjects (30-35 years), reliability of the test for the middle
age group (25-29 years), and being interactive for the younger age group.
0
15%
85%
2%
22%
76%
7%
34%
59%
0 10 20 30 40 50 60 70 80 90
both
smartphone
standard
age range
% o
f p
arti
cip
ants
18-24 25-29 30-35
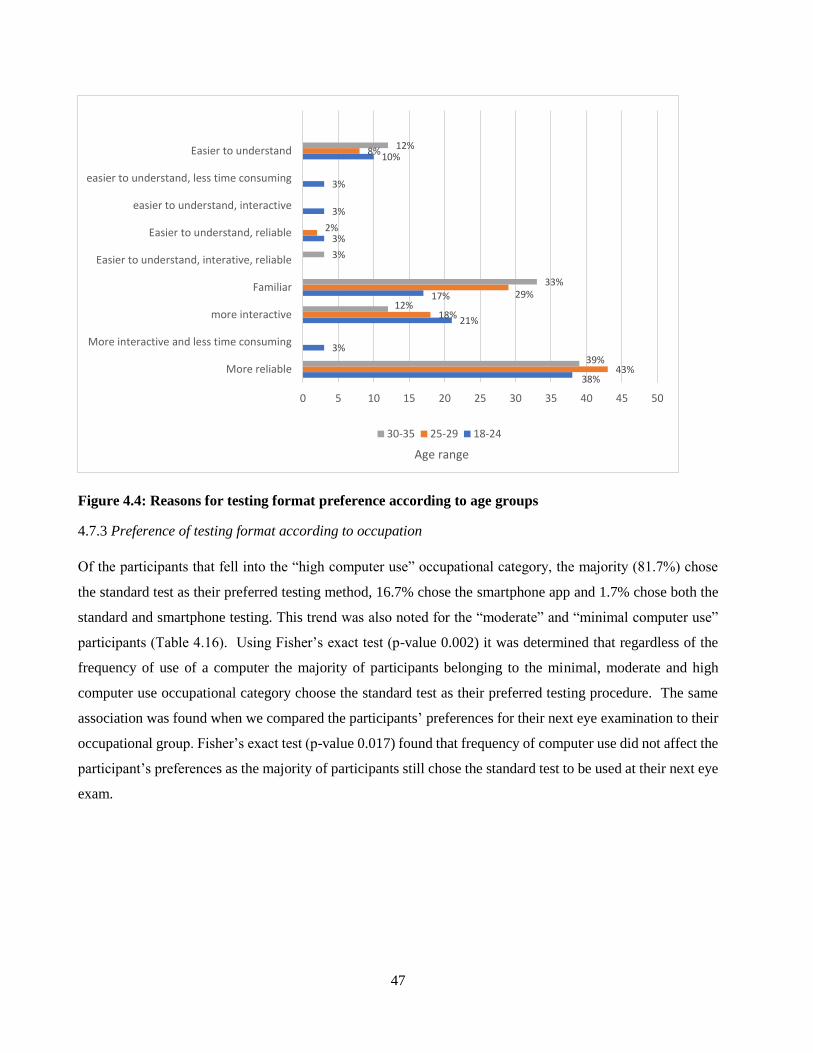
47
Figure 4.4: Reasons for testing format preference according to age groups
4.7.3 Preference of testing format according to occupation
Of the participants that fell into the “high computer use” occupational category, the majority (81.7%) chose
the standard test as their preferred testing method, 16.7% chose the smartphone app and 1.7% chose both the
standard and smartphone testing. This trend was also noted for the “moderate” and “minimal computer use”
participants (Table 4.16). Using Fisher’s exact test (p-value 0.002) it was determined that regardless of the
frequency of use of a computer the majority of participants belonging to the minimal, moderate and high
computer use occupational category choose the standard test as their preferred testing procedure. The same
association was found when we compared the participants’ preferences for their next eye examination to their
occupational group. Fisher’s exact test (p-value 0.017) found that frequency of computer use did not affect the
participant’s preferences as the majority of participants still chose the standard test to be used at their next eye
exam.
38%
3%
21%
17%
3%
3%
3%
10%
43%
18%
29%
2%
8%
39%
12%
33%
3%
12%
0 5 10 15 20 25 30 35 40 45 50
More reliable
More interactive and less time consuming
more interactive
Familiar
Easier to understand, interative, reliable
Easier to understand, reliable
easier to understand, interactive
easier to understand, less time consuming
Easier to understand
Age range
30-35 25-29 18-24
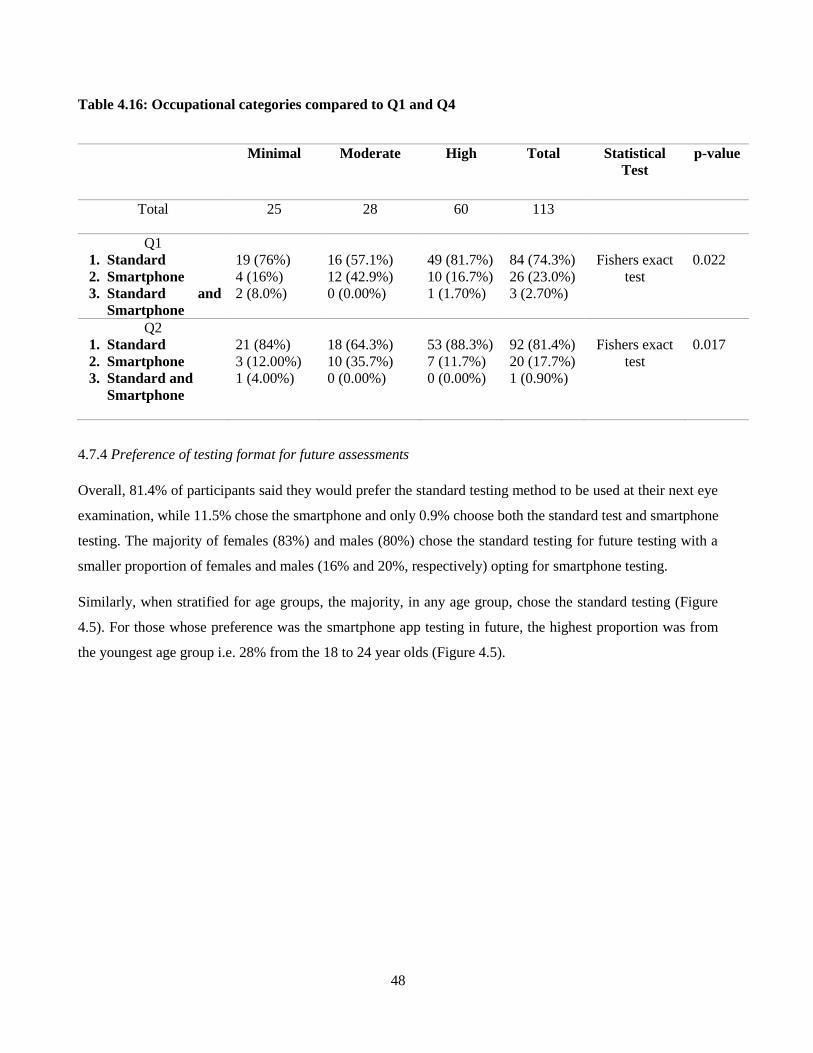
48
Table 4.16: Occupational categories compared to Q1 and Q4
Minimal Moderate High Total Statistical
Test
p-value
Total 25 28 60 113
Q1
1. Standard
2. Smartphone
3. Standard and
Smartphone
19 (76%)
4 (16%)
2 (8.0%)
16 (57.1%)
12 (42.9%)
0 (0.00%)
49 (81.7%)
10 (16.7%)
1 (1.70%)
84 (74.3%)
26 (23.0%)
3 (2.70%)
Fishers exact
test
0.022
Q2
1. Standard
2. Smartphone
3. Standard and
Smartphone
21 (84%)
3 (12.00%)
1 (4.00%)
18 (64.3%)
10 (35.7%)
0 (0.00%)
53 (88.3%)
7 (11.7%)
0 (0.00%)
92 (81.4%)
20 (17.7%)
1 (0.90%)
Fishers exact
test
0.017
4.7.4 Preference of testing format for future assessments
Overall, 81.4% of participants said they would prefer the standard testing method to be used at their next eye
examination, while 11.5% chose the smartphone and only 0.9% choose both the standard test and smartphone
testing. The majority of females (83%) and males (80%) chose the standard testing for future testing with a
smaller proportion of females and males (16% and 20%, respectively) opting for smartphone testing.
Similarly, when stratified for age groups, the majority, in any age group, chose the standard testing (Figure
4.5). For those whose preference was the smartphone app testing in future, the highest proportion was from
the youngest age group i.e. 28% from the 18 to 24 year olds (Figure 4.5).

49
Figure 4.5: Preference of future testing method according to age groups.
For those that chose the standard test as their preferred method, the reason for choosing this option was the
majority of participants felt that this testing method was more reliable (38.1%) and familiar (27.4%) to them.
Those that chose the smartphone testing chose this option as their preferred testing method because it was
more interactive (15.0%).
Figure 4.6: Reasons for preference of future testing method
0
28%
72%
0
18%
82%
3%
9%
88%
0 10 20 30 40 50 60 70 80 90 100
Both
Smartphone
Standard
Age range
% o
f p
arti
cip
ants
30-35 25-29 18-24

50
4.7.5 Smartphone application tests
The last segment of the questionnaire centered around the participants’ perceptions of the smartphone apps
only, with the responses illustrated in Figure 4.7.
The majority of participants (63.7%) found the astigmatism app test to be the easiest to use and understand,
followed by CS testing (25.7%) and then VA (8%). A small number (2.7%) reported that all three tests were
equally easy to use and understand.
Figure 4.7: Ease of use and understandability of Smartphone tests
The reason for selecting the astigmatism test as being the easiest to use and understand could be because the
majority (87.6%) of participants found the astigmatism test to be the most interactive and displayed the most
interactive visuals. The astigmatism app tests also proved to be the app most of the participants (71.7%) found
to have the easiest instructions to follow, while only 23% and 5.3% chose CS and the VA test respectively to
have the easiest instructions (Figure 4.8).
In terms of duration of testing, VA testing was reported by the majority of participants (83.2%) with the
remaining 16.8% finding CS testing to have taken the longest. Almost all of the participants (99.1%) indicated
that they were able to understand and interpret the astigmatism test results with a very small percentage (0.9%)
claiming to have understood CS results. No participant could understand the VA test results.
8%
25,7%
63,7%
2,7%0
10
20
30
40
50
60
70
VA CS Astigmatism All 3
% o
f p
arti
cip
ants

51
Figure 4.8: Participants’ perceptions of the different smartphone applications for assessment of vision
Participants perceived the Smartphone app tests to be accurate as is seen in Figure 4.9, as the majority believed
that the results were either extremely accurate or fairly accurate (9.7% and 87.6%, respectively). This was the
case for 99% of females and 96% of males.
Figure 4.9: Participants’ perceptions of accuracy of results from Smartphone application testing
8%
83,2%
5,3%0 0
25,7%16,8%
23.0%
8,8%0,9%
63.7%
0
71,1%
87,6%99,1%
0
20
40
60
80
100
120
WhichSmartphone app
test was theeasiest to use
and understand?
Which app tookthe most time tocomplete all the
tests?
Which app hadthe most clear
and easy tounderstand
instructions?
Which app wasthe most
interactive andhad the best
visuals
Which app hadthe clearest and
easiest tounderstand
results
% o
f p
arti
cip
ants
VA CS Astigmatism
9,70%
87,60%
0,90%1,80% 0
Extremely accurate Fairly accurate
Neutral Probably not accurate
Not accurate

52
As the majority of participants found these apps to have fairly accurate results, most participants (88.5%) are
fairly comfortable to rely on these results to determine their visual status, while 8% are extremely comfortable
and only 2.70% are not comfortable to rely on these app test results (Figure 4.10). Out of the 88.5% that were
fairly comfortable, 88% were females and 89 % were males. Those that chose extremely comfortable, 9% were
female and 7% were males.
Figure 4.10: Participants’ comfort with relying on these Smartphone applications to determine their
visual status
4.8 CONCLUSION
The majority of the participants in this study where female (61.1%) from the Black/African (44.2%) race group
with an approximate age of 27 ± 56 years. Many participants were also frequent computer users (53.1%).
After analyzing the standard and smartphone apps for testing distance VA, the standard test appeared to have
results most similar to the Paid app (Kay iSight test professional®). However, when comparing all three tests
results the mean difference was always less than 0.1 hence, showing no clinically significant difference
between the three tests.
The Smart Optometry® (Free app) was found to overestimate the CS results however, the results compared
most similar to the Standard Pelli-Robson test for testing CS, while the Paid app (Variable contrast
sensitivity®) was found to significantly overestimate the CS results.
8%
88,50%
0,90% 2,70%
Extremely comfortable Fairly comfortable
Neutral Not comfortable

53
Both the free (Eye Meter®) and paid (Eye test®) astigmatism Smartphone apps were found to underestimate
the number of participants having astigmatism when compared to the standard JCC test.
Overall, a large portion of the respondents in this study preferred the standard testing procedure over the
smartphone apps. Participants occupation or gender did not influence this decision.
The astigmatism app test overall, outperformed the VA and CS testing in ease of use, clear instructions, most
interactive and easiest understanding results. Overall, participants reported the smartphone test to have fairly
accurate results and were fairly comfortable to rely on these results to determine their visual status.

54
CHAPTER FIVE
DISCUSSION
5.1 INTRODUCTION
This chapter critically analyzes the findings of the current study in relation to the research question and
previous studies in related fields. The first section discusses the demographics of the participants and compares
it to regional and national demographic statistics thereby providing a description profile. Thereafter, the results
obtained for the comparison of the three visual parameters assessed in this study i.e. VA, CS and astigmatism
with smartphone apps to standard clinical testing is critically analyzed. Wherever possible the main study
results are compared to similar past studies. The chapter concludes with the discussion of the participants’
perceptions of smartphone vision testing to clinical testing based on the results of the questionnaire.
5.2 DEMOGRAPHICS
Overall, the demographics of the participants was reflective of South Africa in terms of gender, age and race.
The gender profile of the participants in the current study was in keeping with that of South Africa in general
(StatsSA, 2017) with a greater proportion of females (61.1%) than males (38.9%), however it differed slightly
from that of the Western Cape, where the study was carried out, which is closer to that of the total world
population having almost equal numbers of females (51%) and males (49%) (The World Bank., 2019). A
possible reason for this bias could be because of the use of convenience sampling strategy which involved
using a sample of the population which was close at hand and not necessarily an accurate representation of the
actual population. As gender bias could possibly lead to distortion of results and the sample not being
representative of the study population (WHO, 2004), it is always preferable to use random sampling where
samples are chosen strictly by chance (Foley., 2018).
The Google Mobile App Report of 2017 (https://www.ipsos.com/sites/default/files/2017-08/Google-mobile-
apps-report-2017.pdf) reported interesting trends based on the gender of mobile users. In general, the survey
found an equitable distribution of female and male users (50% each). Therefore, one would not expect a
significant difference in the use of apps for health testing between the genders. However, when considering
the content of the smartphone apps, a greater number of males using apps for sports compared to females (75
% versus 25%, respectively) was noted in the report. On the other hand, women, of all ages, are the major app
users as compared to males and whether it be to register on new apps, online purchases or subscriptions there
is a greater percentage of women engaging in these apps. The same source confirms that almost 9 out of 10
female smartphone users engage in apps. These trends may explain the greater proportion of females in the

55
current study sample as this gender may have agreed to participate in the current study more readily as the
focus of the study is an area quite familiar to them.
The median age of the participants in the current study was 27 years which is very similar to the predicted
median age of the South African population for 2020 being 27.6 years (Plecher, 2019) making the study largely
applicable to the South African population. However, considering the average age of app users is reported to
be approximately 36 years (Google Mobile App Report., 2017) the sample in the current study may represent
a slightly younger generation. The age range selected for the current study (18 to 35 years) was, however,
deliberate particularly as millennials (ages 18-34 years) are more willing to pay for mobile apps, with one third
of them purchasing more than one app per month (MindSea, 2019). Furthermore, it was recorded in 2017 that
36% of millennials purchased five or more apps, while just 3% of users aged 55+ users did the same (MindSea,
2019). The age range of the current study therefore is reflective of mobile app users.
The latest population statistics in South Africa (StatsSA, 2019) report that the Black African race group makes
up the largest population group (80.8%), followed by Mixed Race (8.8%), Caucasians (8.0%) and then
Indians/Asians (2.5%). This distribution was fairly consistent with the demographic profile of participants in
the current study with the exception of a slightly higher number of Mixed Race participants and Caucasians
(31.0% vs 21.2%, respectively) which is more reflective of the study area (Western Cape) where the
demographic profile includes approximately 42.4% Mixed Race and 15.7% Caucasians (Cape Town
population., 2020).
Based on occupations, the majority of participants in the current study were classified as engaging in “high
computer use” making the sample fairly appropriate for the assessment of smartphone vision screening as this
group of individuals have been identified in the literature as the most likely to use such apps. Generally, these
frequent computer users belong to a group of people that are well educated and earn a comfortable salary. A
study by Smith (2015) stated that people who are graduates or have relatively higher education levels and earn
a higher salary are the individuals who are most likely to use these smartphone apps as their health is a priority
to them and secondly because they have the skill and confidence to operate health apps on their smartphones.
Carroll (2017) also confirms that health app users are younger, more educated, willing to take care of their
own health and have a higher income, and therefore more likely to use health apps.
5.3 REFRACTIVE STATUS
The majority of the participants were found to have low myopia (near-sightedness) with low astigmatism.
Furthermore, the majority of the participants that took part in this study were high computer users which links
up to the suggestions that near-sightedness could be attributed to the high amounts of accommodation of
56
prolonged near work (Po-Wen et al., 2019). In today’s working society the majority of office workers are
compelled to spending long hours in front of a digital screen which has resulted in patients even emmetropes
or patients with low prescriptions (<0.50 DS or DC) complaining of sore, tired and strained eyes, these patients
often benefit from an accommodative support lens or a single vision near lens to alleviate those symptoms.
5.4 DISTANCE VISUAL ACUITY ASSESSMENT
The main indicator of visual impairment due to vision loss can be identified using Visual acuity (National
Research Council, 2002). Visual acuity (VA) and the concept of 20/20 vision is well known among most
individuals when it comes to testing their vision and hence, if one had to experience blurry or distorted vision
the VA test will be the ‘go-to’ test to be performed. Because this is the main test used to screen their vision, it
is important for any testing apps to able to do this with a fair amount of accuracy as often people may rely on
the findings to make decisions on the need to seek further eye care or not.
The accuracy of the Pocket Eye Exam® (in this section referred to as the Free App) and the Kay iSight Test
Professional® app (in this section referred to as the Paid App), for assessing distance VA (DVA) was assessed
by comparing the results obtained with the apps to that produced by a standard optometric distance vision
assessment with a Snellen chart. The smartphone apps were found to provide very similar measurements for
DVA to the standard clinical method when considering the median DVAs recorded. When considering the
pass/fail criteria for DVAs, however, significantly more participants failed the distance vision assessment, for
either eye, with the Snellen chart compared to both the free and paid Apps. As a lower decimal notation value
implies poorer DVA the implication is that both apps overestimated the DVA. A possible reason for the
overestimation in the instance of the Free App was the Snellen letters were presented at larger scale increments.
There were only seven rows of VA measurements ranging from 6/60 to 6/6, missing out on some important
VA values and hence, possibly overestimating the VA measurements. The Paid App had smaller increments
of VA values and had a total of 16 rows of letters ranging from 6/150 to 6/3.8 which could give a more accurate
VA result. The developers of the Free App could improve the accuracy of the app by increasing the number
of rows for DVA measurements.
Similar findings were reported by De Venecia et al. (2018) who found Peek Acuity® (a smartphone VA app)
to overestimate the subject’s VA thereby giving the patient a measurement that did not warrant a follow-up
eye examination. Tofigh et al. (2015) attributes the overestimation of VA with smartphone apps to the contrast
ratio of the iPhone when equated against the standard test. Furthermore, the Early Treatment Diabetic
Retinopathy Study (ETDRS) reported the contrast ratio of a clean printed Snellen or VA chart/card to be below
33:1, whereas an iPhone 5 has a contrast ratio of 1151:1 and was given as the reason for the discrepancy in
near VA readings between a smartphone and a near vision card (Tofigh et al., 2015). It is known that VA

57
measurements can be enhanced by increasing the contrast of the testing chart or screen (Sheddy et al., 1984).
While the actual contrast differences between the Snellen chart and the Free and Paid Apps, used in the current
study were not measured, visibly there was a difference. Moreover, while the contrast of the smartphone on
which the apps were used can be varied, that of the Snellen chart was fixed. The reliability and validity of VA
measurements with smartphone apps thus can be enhanced by specification of the contrast level to be used
with the app.
When assessing clinical measurements, it is important to consider clinically significant differences in addition
to statistically significant differences. In terms of DVA, even a one-line difference in VA can be considered
to be clinically significant when considering certain visual tasks. For example, in order for a monocular patient
to obtain a code 8 (EB) driver’s license in South Africa a minimum of 6/9 (0.6 in decimal notation as it would
appear on a VA chart) Snellen VA in the functional eye is required in addition to other visual field requirements
(Vision Optometrist, 2018). One line poorer than this would be the 6/12 (0.5 in decimal notation) which is a
difference of 0.1. Thus a 0.1 difference in overestimation of VA produced by a screening app would have
passed the individual as having the legal VA for driving preventing them from having a further vision
assessment, when in actuality the individual may need spectacles in order to drive on the roads safely. It is for
this reason that a difference of DVA of 0.1 in decimal notation was considered clinically significant. It must
be noted though that, in the current study, the difference in DVAs obtained by the different methods were
consistently less than 0.1 as indicated in the median values, thus being both clinically and statistically
insignificant making the DVA measurements produced by the apps acceptable for the assessment of DVA.
Sensitivity and specificity are statistical measures of the performance of a test. The test’s sensitivity, which is
theoretically the true positive rate (TPR), is an indicator of the ability of a test to detect those individuals that
actually do have a disease or condition (Stephanie, 2014). The importance of a test that is highly sensitive
can be advantageous for ruling out a disease as it correctly picks up patients who have the disease. The
specificity of a test, on the other hand, is theoretically the true negative rate, correctly identifying those people
without the disease or condition (Stephanie, 2014). Specificity is equally important as a highly specific test
can be beneficial for eliminating patients who do not have the disease. Stephanie. (2014) has suggested that
sensitivity and, or specificities of between 70-80% are generally acceptable, however other studies (Budere et
al., Malhotra et al., 2010) have cautioned that the sample size and prevalence of the condition being
investigated must also be taken into account when determining what the acceptable sensitivity or specificity
for a test is. If the sample size is too small it may produce skewed estimates and a wastage of resources. The
study sample was as determined under the guidance of a statistician and thus assumed to produce fairly
accurate sensitivity and specificity values.

58
The sensitivity of both the Free App and Paid App in the current study was greater than 75% irrespective of
which eye was considered implying the ability to provide accurate measurements in those patients with reduced
DVA. In addition, in the current study, the specificity of both the Free and Paid Apps for DVA measurements
was over 95% irrespective of which eye was considered, implying the test could accurately identify participants
with good vision. These findings thus indicate that these apps are able to pick up visual impairment and
therefore, are useful at minimum for purposes of vision screening for VA. As no other study was found that
reported the sensitivity and specificity of smartphone apps for the assessment of distance VA, no further
comparisons can be made.
5.5 CONTRAST SENSITIVITY
Contrast sensitivity is the ability to identify minute discrepancies in shading and patterns and plays a major
role in detecting objects without clear outlines and differentiating objects/details from their background (Alia
et al., 2012). Contrast sensitivity testing often is not performed routinely in an eye exam (all about vision,
2019) yet it is of great clinical value. Cataracts are the leading cause of preventable blindness worldwide (Lee
et al., 2016). Unfortunately, patients with cataracts only present when they encounter a reduction in their VA,
which they able to detect even in their homes, impacting their functional performance. However, in these
patients, a decrease in CS may be experienced even before a reduction in VA (Arden, 1978). In addition, CS
is an accurate measure of visual defect such as glaucoma which is one of the leading causes of irreversible
blindness globally (WHO, 2004) and is able to differentiate the different grades of diabetic retinopathy and
cataracts (Habtamu et al., 2019).
Other than for the detection of ocular disease, research has shown that reduced CS may also impact on visual
comfort during daily tasks like reading or watching television (Heiting, 2019). Furthermore, it can affect the
ability to drive safely at night as it leads to difficulty in seeing pedestrians walking alongside poorly lit streets
(Heiting, 2019). In the elderly, poor CS also can increase your risk of a fall if you fail to see that you need to
step down from an unmarked kerb and steps (Katz et al., 2019). Access therefore, to a simple and fast app that
can screen for this aspect would be very valuable. In addition, it is important that these screening devices
provide accurate results as there is a risk of potential misdiagnosis of sight threating eye conditions.
The measurement of CS moreover, better characterises functional vision than high contrast VA alone and
subsequently has been used effectively as a tool to identify deteriorating visual function early on in conditions
such as diabetes, glaucoma and macular degeneration (Di Leo et al., 1992; Keane et al., 2010). It is those
patients who have 6/6 VA but still complain of “misty” or “flat” vision that CS testing is most useful in (Arden.,
1978). Despite the benefits of CSF testing, it is seldom performed in a clinical setting because of the time and
specialist equipment needed.

59
The assessment of CS by Smart optometry® (in this section referred to as the Free App) and Variable Contrast
sensitivity® (in this section referred to as the Paid App) iPhone app was compared to that obtained with the
standard Pelli-Robson chart. It must be noted though that while the standard Pelli-Robson chart provided an
actual score for CS, the free and paid apps only provided a percentage CS with no indication of whether it is a
pass or fail. A table with the exact conversion of the Pelli-Robson score to percentage could not be located,
however, the normal values as outlined in the Pelli-Robson manual was used to grade the results of all tests
(Pelli-Robson and apps) in terms of fail and pass criteria. According to the manual while a score of 2.0
indicates normal contrast sensitivity of 100 percent, a score of 1.5 is consistent with visual impairment thus a
score of less than 1.65 was regarded as a fail for CS (Aziz.,2014).
More participants, for both the right and left eyes passed the CS testing with the free and paid apps as compared
to the standard Pelli-Robson test indicating a high overestimation rate by the apps. This implies that some
participants who had reduced CS were missed by the apps. The overestimation of results by the apps could
have been attributed to the difference in chart generation i.e. one being printed and the other two computers
generated, rather than the design of the chart being the issue. The standard Pelli-Robson chart was a printed
chart that was held at one meter from the participant. The chart was used in normal room illumination (1300
lux) (wozniak et al., 1999). The chart was positioned perfectly parallel to the patients face and the room
lighting illuminated the chart evenly to ensure there was no unnecessary reflections off the chart. In contrast,
while the free and paid apps used the same Pelli-Robson design, the Free App consisted of eight rows of six
capital letters each. The top letters of the chart were seen in high contrast with the contrast gradually reducing
towards the bottom of the chart. The user was asked to tap and call out the faintest letter that was visible. The
Free App letters were randomised so when the participants were selecting the last visible letter there could not
have been a chance of memorisation. The Paid App had five constant letters reducing in contrast from 100%
to 1.25% so there is a chance the participant could have memorised the letters and recalled the same letters for
finer contrast levels even though the letters may not have been visible to them which could have resulted in
this app overestimating the number of users passing this test. A possible suggestion to the developer of this
app is to randomize the presentation of letters at each contrast level to prevent memorization, a second alternate
is to start with 0% contrast and increase the contrast level until the participant is able to recite the letters
correctly. This may ensure more accurate results from the Paid App.
A similar trend was noted by Zeri et al. (2018) who found that a computer LCD Pelli- Robson test
overestimated the CS significantly, irrespective of the eye tested, when compared to a printed Pelli–Robson
clinical chart used at both one and at three meters (p < 0.01). They therefore concluded that computer-
generated versions of the Pelli–Robson chart did not provide accurate results when compared to printed version
of the Pelli–Robson printed chart.

60
The Free App, for both the right and left eyes, demonstrated relatively higher specificity than sensitivity values.
This suggests that the Free App was better at detecting individuals with normal CS than those with reduced
CS. The Paid App on the other hand, while demonstrating good specificity showed very low sensitivity of less
than 50% implying that this app was not useful in identifying users with poor CS often passing these
individuals. These findings of sensitivity and specificity however have to be considered in relation to the
sample size and in this case have to be interpreted with caution particularly as the study did not include subjects
with ocular pathology in whom this test is more relevant.
5.6 ASTIGMATISM
Astigmatism is a type of condition whereby the eye does not focus light rays on the retina due to an irregular
cornea resulting in distorted and blurred vision, additionally other symptoms of astigmatism include eye strain,
headaches, squinting and eye irritation (Heiting, 2018). The ability of Eye test® (in this section referred to as
the Paid App) and Eye Meter® iPhone apps (in this section referred to as the Free App) to detect the presence
of at least 0.50D of astigmatism was assessed in relation to the results obtained from the JCC test in the
subjective refraction.
While more than half of the participants were found to have at least 0.50D of astigmatism in either eye with
clinical JCC testing, a significant percentage of participants having astigmatism were missed by both the Free
and the Paid App indicating a high underestimation rate. Both apps were thus found to be ineffective in
detecting astigmatism.
The JCC test involves a detailed procedure in determining the amount of astigmatism. It comprises of several
steps to determine firstly the axis of the astigmatism and the associated cylindrical power. These steps ensure
that the final cylinder power is an accurate representation of the astigmatism the patient has. Both the Free and
Paid apps astigmatism tests utilised a ‘Fan and Block' astigmatism wheel which merely screens for the presence
of astigmatism. The fan-and-block technique is less utilised in practice nowadays because it is less sensitive
at determining small cylinders and a person with a head tilt will not give accurate results (Optician, 2014).
Because this test is found to not be sensitive for detecting small cylinders both apps often were unable to detect
small degrees of astigmatism in the participants.
The detection and correction of even small amounts of astigmatism is important as it is a condition in which
the eye does not focus images appropriately, however it may not always result in a significant decrease in
vision unlike in the case of spherical refractive errors. For this reason, it may prevent a person from considering
or seeking an eye test. Yet, in addition to blurred vision, other debilitating symptoms such as eye stress or
strain, squinting, poor night vision, eye irritation, headaches, fatigue and difficulty focusing while reading may

61
occur with astigmatism (Campbell., 2019). Furthermore, astigmatism is reported as having a major effect on
the common daily task of night driving with problems like glare from the headlights of oncoming cars or halos
around streetlights being attributed, to some degree, to uncorrected astigmatism (Larson, 2020). The
implication of this can be on the confidence of individuals when engaging in night driving and subsequently
on road safety impacting themselves and other road users. Hence, while it is not necessary that screening apps
be able to quantify accurately the amount of astigmatism, it is valuable for these screening tests to be able to
at minimum, detect the presence of astigmatism so that further testing may be sought.
The sensitivity and specificity of the Paid App for results in the right eye could be determined, and was found
to indicate good sensitivity but fair specificity implying that it may have been able to correctly detect those
that had astigmatism but was not as good in correctly identifying those that did not have astigmatism. The left
eye for the Free App showed a high sensitivity result indicating this test maybe useful in identifying
astigmatism. As no other study was found that assessed the screening for astigmatism using smartphone or
other apps, no further comparisons can be made.
5.7 PERFORMANCE OF FREE APP VERSUS PAID APP
Further analysis of the results was performed to see how the paid apps performed relative to the free apps in
trying to determine whether payment for an app means it probably has undergone more intense development.
The DVA measurements produced by the Paid App (Kay iSight Test Professional® Chart) was more
comparable to the Snellen chart measurements than the Free App, with the Free App consistently
overestimating DVA. The sensitivity of the Free App for DVA measurements was lower than that obtained
with the Paid App.
For the assessment of CS while both apps tended to overestimate the CS as compared to the standard test, the
Free App results were more comparable to the standard test. In addition, while the specificity of both the Free
App and Paid App were similar, there was a large difference in their sensitivities with that of the Paid App
being much lower. These results must be interpreted with caution though due to the sample size. The
presentation of letters in the Free App were randomised making it difficult for any user to recall the same letter
twice hence, giving a more accurate result of the users CS due to the inability to memorize the letters. With
the Paid App, because the letters presented for each contrast level was the same, this could have resulted in
many participants calling out the letters based on memorisation and not by actually seeing those letters clearly,
resulting in a high overestimation of participants passing that test.
Furthermore, it must be noted that the cost of the Paid App was R299.00 and it was a relatively expensive CS
app to purchase. It may therefore be assumed that it was more developed in terms of superior quality software,
imagery and contrast control and therefore able to provide more accurate results than the Free App. However,

62
this was not the case as the Paid App considerably overestimated the CS in the participants, which again may
have been related to the presentation of the test targets as explained above.
While both the Free and the Paid App underestimated the number of participants having astigmatism when
compared to the JCC test, for both the right and left eyes, the Free App appeared to miss more of the
astigmatism than the Paid App. This could be of concern as the app will be passing those participants who
have astigmatism and who ideally may need to have a full eye examination. On closer inspection, the Free
App astigmatism chart is a combination of a dark blue background and light blue wheel lines. This unusual
low contrast presentation of the astigmatism wheel could the reason why participants did not recognise any of
the lines (axis) being darker than the others and, hence passed the test. The Paid App, however, has a high
contrast white background with a black astigmatism wheel. This presentation of the chart was most likely
easier for the participants to recognize which lines were darker which resulted in the Paid App producing
relatively similar results to the standard JCC test.
A survey of the number of free mobile apps downloaded in comparison to the number of paid mobile apps
downloaded worldwide in the period 2011 to 2017 show a significantly greater preference for free mobile apps
(Blair, 2020). This difference can most likely be attributed to cost. Anecdotal evidence suggests that one may
expect a paid app to be more sophisticated in its design and development hence the cost and therefore would
have more accurate results when compared to a free app which may not be as well developed. The current
study has found that both the Free and Paid Apps were accurate enough for DVA assessment but inadequate
for the assessment of CS and astigmatism. The cost of an app therefore seems to be determined arbitrarily and
at this stage is not an indication of accuracy.
5.8 PERFORMANCE ON SMARTPHONE APPLICATIONS ACCORDING TO GENDER
When looking at the smartphone VA testing, overall, females were found to have more comparable median
VAs than males when compared to the standard VA test. This testing procedure was also chosen as the
smartphone app test that took the longest time to complete as noted in the questionnaire. A report by Response
Source (2011) stated that males tend to be more impatient than females. This could possibly be a reason why
females had better VAs because they took more time to think and give the VA answers. The test that took the
lesser time to complete was the astigmatism and CS tests. For these tests, participants were merely stating if
any lines on the astigmatism wheel looked darker and for the CS test calling out the last visible letter. Because
these tests possibly took less time to complete males were also found to perform equally well and hence,
possibly showing patience level affects responses by different genders. From the above results however, there
does seem to be a relationship between patience levels of different genders to giving response for the app
testing and this ultimately could affect the results of different tests.

63
5.9 QUESTIONNAIRE
The participants’ perceptions of using the smartphone apps compared to standard clinical testing was
determined using the questionnaire which all participants completed after undergoing both the standard clinical
routine and app testing.
5.9.1 Preference of testing format
The questionnaire uncovered that the majority of the participants preferred the standard testing procedure over
the smartphone testing and the main reasons for choosing the standard testing option was they found it to be
the most reliable and familiar option to them. These findings are in keeping with the assertion by Wicklund
(2018) that despite national trends of healthcare systems launching consumer telehealth programs, people still
prefer the personal touch of an office visit with a doctor as they consider in-person exams to be more beneficial.
This may explain why the majority of participants in the current study preferred the standard test over the apps
as they were probably more comfortable with direct optometric eye examinations rather than testing with the
smartphone apps. It was clearly not because of lack of understanding as the majority of participants indicated
that both platforms (standard clinical test and the smartphone apps) were easy to understand.
This preference of a standard clinical test is given credence by numerous studies (Perera et al., 2015; Tofigh
et al., 2015; De Venecia et al., 2018) that have found standard tests to produce more accurate results than the
app tests researched. It was therefore not surprising that the majority of participants choose the standard test
as their preferred testing option for their next eye appointment again citing reliability and familiarity for this
choice. These findings, however, may also have been influenced by other factors including participants
wanting to “please” the researcher who was also the testing optometrist, by showing preference to standard
clinical testing; as well as not being as familiar with smartphone testing as they were with an in-person eye
testing. Future studies should thus consider including participants who use smartphone testing regularly.
For the minority (23%) of participants that chose the smartphone as their preferred testing option, the main
reason for this preference was that it was more interactive than the standard clinical test. Wicklund (2018)
reported additional reasons for wanting a virtual platform including convenience (26%) as they liked the option
of skipping trips to and from the doctor’s office, access healthcare in the comfort of their home (25%), quick
access (20%) and short waiting times (16%).
While no significant difference in choice of future testing was noted between females and males, or when
considering the amount of “computer usage” as determined by occupation, when preference was further
stratified according to age it was found that the older age group (30-35 years) was more likely to choose the
standard test and the younger group (18-25 years) to choose the smartphone app tests, even though the “older”

64
group in the current study was still relatively young. Kruse et al. (2017) reported that the elderly are hesitant
to change and consider familiarity as the main reason for choosing the standard test which is in alignment with
the assertion by Ward. (2013) that attraction to the familiar is a common and pervasive pattern in all of us.
This motivator, familiarity, may also explain why the younger participants were relatively more likely to
choose the smartphone apps for future testing. The younger generation spends more time using mobile apps
than people who are older and millennials are three times more likely to be excited about new mobile apps and
features than older users (Mindsea, 2019).
5.9.2 Preference of smartphone application test
Overall, the apps for assessing astigmatism proved to be the easiest to use and understand, easiest instructions
to follow, displayed the most interactive visuals and took the least time to complete. After closer inspection
of the astigmatism app wheel, it clearly showed a more interesting graphic presentation than the VA and CS
charts in the other apps. The reduced time duration to complete the astigmatism test could also be a possible
reason why the majority of the participants (63.7%) choose the astigmatism test as the easiest app to use. The
astigmatism app had the most concise and understandable instructions and the results were given in an easy to
understand pass and fail criteria. All of these factors could have contributed to this finding of the astigmatism
app being perceived as the best.
It was surprising to note that almost all participants (99.1%) could understand and interpret only the
astigmatism test results, while many had difficulty with understanding and interpreting the results of the DVA
and CS apps. Considering these smartphone apps are intended to be used as home screening devices, no
participant could understand the VA test result because the result is given in 6m Snellen notation. Also, a very
small percentage of participants (0.9%) were able to understand the CS result because the result is given in
percentage notation which does not mean much to the user as to what is normal and what is not. These results
are meant to guide users on whether they require an eye examination or not and if the user is not able to
understand the results this could result in major misinterpretation and possible under referral of patients. This
aspect of smartphone apps must therefore receive careful consideration and revision particularly with a feature
to indicate to the user whether further detailed testing is required or not.
Even though 40.7% of participants preferred the standard test over the smartphone testing, 87.6% of
participants believed these apps to provide fairly accurate results with most of them (88.5%) indicating being
fairly comfortable to rely on these results to determine their visual status. However, multiple studies (Pereira
et al., 2015, Tofigh et al., 2015 and Zeri et al., 2018) have reported smartphone VA and CS tests to be
unreliable and inaccurate.
5.10 CONCLUSION

65
Mobile apps play a central role in people’s daily routines. According to Blair. (2019), 91% of smartphone
owners use apps therefore this feature should be explored as a means of increasing access to vision assessment,
with at minimum being used for vision screening.
Visual acuity testing is an important indicator of vision and more especially visual impairment and any test
used for this purpose should provide accurate results. The Kay iSight professional® (Paid) and Pocket Eye
Exam® (free) VA app testing overall showed promising results and with some adjustments could be used for
future VA screenings.
The CS and Astigmatism app testing however, were not as promising with the CS apps overestimating the
results and the astigmatism app testing significantly underestimating the number of participants with
astigmatism. If all four smartphone apps are to be used for screenings, developers are required to relook at the
tests with respect to proper calibration, contrast, design and sizing.
Even though smartphone testing has become widely popularized, the participants in this study seem to still
prefer the standard testing option. Even though this was indicated as their preferred testing platform they still
find smartphone app testing to be accurate and are comfortable to rely on these app findings as indications of
their visual status.
It can be concluded that smartphone eye testing has become widely popularised with their multiple screening
apps however, both optometrists and developers need to ensure correct contrast ratio, brightness, optotype size
and proper instructions by the app are provided by all screening apps to ensure the results are accurate and
reliable. There definitely needs to be more studies done and should focus on validation of these apps before
they can be used safely to screen individuals for visual deficiencies.

66
CHAPTER 6
CONCLUSIONS, LIMITATIONS AND RECOMMENDATIONS
6.1 INTRODUCTION
This chapter concludes with a synopsis of the main findings of the current study, in addition to highlighting
the limitations identified following a critical analysis of the results produced. It also outlines recommendations
for future studies particularly in the area of e-Health as it relates to eye care.
6.2 CONCLUSIONS
i. The Kay iSight Test professional (Paid) VA app results compared closely to that produced by the
standard Snellen test. The Pocket Eye Exam (free) VA app slightly over estimated the VA results but
the difference was not clinically significant. Overall, both apps showed promising results and with
some adjustments could be used for future distance VA screenings.
ii. The Variable Contrast Sensitivity (Paid) app and Smart Optometry (Free) apps significantly over
estimated the CS results when compared to the standard Pelli-Robson test. Further modifications and
thereafter validation of both apps is required before it can be used for CS screenings. However, it
provides an important tool considering the value of CS testing in the early detection of vision disorders.
iii. The Eye test (Paid) app and the Eye Meter (Free) apps tend to underestimate the number of participants
with the presence of astigmatism when compared to the standard JCC test. These tests need further
modification before they can be used in screening for the presence of astigmatism.
iv. Overall, the participants in this study chose the standard test over the smartphone test as their preferred
method of visual testing for two main reasons viz. reliability and familiarity. Even though they chose
the standard test, the participants perceive these apps as producing fairly accurate results and are
comfortable to rely on these results to determine their visual status.
6.3 LIMITATIONS
i. This study utilised convenience sampling, which involved the use of participants which were close
at hand and therefore is not necessarily an accurate representation of the general population. This
type of sampling method creates various biases including a gender bias towards females as in the
current study, which could possibly lead to findings which cannot be generalized to the population

67
at large. None of the participants in the current study had any significant ocular pathology and the
performance of these apps in this category of user would have been useful.
ii. The findings from this study only hold true for the six apps tested on the iPhone 6 plus and may
not be generalised to all iPhone screens because the uniformity of colorimetric and photometric
properties of all iPhone devices differ.
iii. Different smartphone apps displayed their results in different notations which could have differed
from the standard clinical test making direct comparison and interpretation thereof, difficult. This
resulted in the researcher having to find methods to convert the results into one notation that was
the easiest to interpret and draw comparisons.
iv. Optotype sizes, contrast and testing distances were not consistent between all the apps, and
although it can be assumed the apps are properly calibrated, this could potentially affect the results.
v. Participants were asked to complete a total of six app tests during one clinical visit. While the
durations of the apps were short, this could have been strenuous on the participants, in some cases,
due to visual fatigue, which could have compromised the results.
vi. The iPhone used was always set to maximum brightness and this might produce a glare effect in
some participants and a possible after-image which could contaminate results hence, it is
imperative the app states the optimum brightness for performing the test.
vii. Smartphone optometric app testing is a fairly new area of vision screening. For the majority of
participants in this study this was their first encounter with vision screening apps which could
have resulted in them being anxious, second guessing their answers and wanting to provide
“correct” answers to satisfy the examiner which could have potentially affected the results.
viii. Dishonesty of participants when completing visual tests on the apps, as well as on the standard
clinical tests.
ix. Dishonesty of participants when completing the questionnaire impact the reliability of the results.

68
6.4 RECOMMENDATIONS
i. Future studies should consider using random sampling to select their study sample. This would
facilitate representation of the general population and limit certain biases. The study population should
include both people that use apps for vision testing currently, as well as those that do not thereby
allowing for group comparisons.
ii. This study only used an apple iPhone 6 plus as the device to administer the various apps. It is possible
that using these apps on other brands of smartphones, iPads or other LCD devices which differ in
luminance properties, contrast ratios, screen sizes and retina display, may produce different results. It
is therefore recommended that developers determine and indicate which devices are most compatible
and suitable in ensuring optimal use of the optometric apps.
iii. Phone brightness can certainly affect the contrast and clarity of an image on the screen. In this study
the brightness was set to maximum since none of the apps stated a specific brightness level. To ensure
the most reliable results, apps need to detail the correct settings like brightness levels for the different
devices in order for the test to perform optimally.
iv. All testing apps should be user friendly i.e. the testing instructions should be easy to understand and
the test results should be self-explanatory to ensure it is easily understood. There must be a code set
in that advises the user on the need for a comprehensive vision examination or not, at the end of the
programme.
v. As all tests are performed on both the right and left eyes, as well as binocularly, apps should randomise
the presentation of the letters to prevent any chance of memorisation which will affect the accuracy of
the app testing.
vi. Developers should consider using these apps to assess other aspects of vision such as stereopsis, colour
vision, macular integrity and visual field defects as these tests can be useful for patients to manage
conditions like glaucoma and age-related macular degeneration.
vii. The study in question was performed on participants with no known ocular pathology hence, the results
are only valid for “healthy” eyes. Other studies should include participants with known ocular
pathology to see if the results produced are reliable.

69
viii. Interdisciplinary studies involving both information technology and health care professionals should
be conducted to assess the validity as well as the reliability of all smartphones-based apps. Proper
calibration of optotype design, size, testing distance and contrast needs to be agreed upon by both
optometrists and IT developers to ensure the most accurate and reliable testing apps are developed. In
this way app testing can become a vital tool in facilitating the delivery of eye care.
ix. For future studies it would be recommended that all participants refractive error be classified according
to their different grades and thereafter, compare the grades to the usefulness of the apps.
x. The age range of the participants in the current study was off a youthful age (18-35 years). Future
studies are recommended to wider the age range to determine how effective the apps are for different
age groups.
6.5 CONCLUSION
The use of mobile devices for the delivery of health care has expanded rapidly in the last decade. Today, more
than ever, people are relying on their smartphones to take care of all their needs with individuals increasingly
taking an active interest in personalised health care particularly motivated by convenience and affordability.
There are numerous smartphone apps available on the iStore and Google play store, however, considering the
literature that was studied, there are very limited studies on the accuracy of these smartphone apps.
Smart-Technology visual testing can radically improve the way individuals take an active role in personalised
vision care by utilising these devices for home self-vision screenings. They not only can be used for vision
screenings but also can be used for monitoring visual changes especially in people with pathological conditions
such as glaucoma and AMD. These devices will also be of tremendous use in rural and remote areas where
access to ophthalmic care is limited. Certain vision tests such as contrast sensitivity are not routinely performed
due to high expense of the specialised charts used. In these instances, the smartphone apps would serve as an
appropriate alternative as a screening measure for clinical use.
The optometry industry has always been subject to intense regulations to ensure that patients receive the best
possible care with accurate diagnosis and treatment. Smartphone-based optometry testing should be no
different yet, currently, there are limited published studies on the accuracy and reliability of these applications.
Factors such as lighting, target distance and target size need to be controlled in order for these tests to produce
accurate results. This type of testing medium can revolutionise the optometry industry enabling the provision
of eye care services to many more people, at a faster rate and be more cost effective, however these smartphone
tests need to be validated first before their use can be optimised.

70

71
REFERENCES
1. Alexander, V.O., Brooks, G.B., Farr, G.B. and Raimer, B.G. (2011). University of Texas Medical
Branch telemedicine disaster response and recovery: lessons learned from hurricane Ike. Telemedicine
Journal and e-Health. 2010;16:627–33.
2. Alghwiri, A.A. and Whitney, S.L. (2012). Balance and fall. Geriatric Physical Therapy. 18(3): pp.
331-353. https://doi.org/10.1016/B978-0-323-02948-3.00027-4.
3. All about Vision.com. 2018. Eye-Related Apps. (Online). Available:
https://www.allaboutvision.com/apps/ (Accessed 17 September 2018).
4. Arden G. B. (1978). The importance of measuring contrast sensitivity in cases of visual disturbance.
The British Journal of Ophthalmology, 62(4), pp. 198–209. https://doi.org/10.1136/bjo.62.4.198.
5. Aziz, M.A.B. (2014). Contrast sensitivity, Clinical assessment of intra-ocular light scatter, dark
adaptation, recovery from glare (macular photo stress test). Health and medicine, pp. 1-37. (Online).
Available: https://www.slideshare.net/schizophrenicSabbir/contrast-sensitivity-clinical-assessment-
of-intraocular-light-scatter-recovery-from-glare-macular-photo-stress-test (Accessed 03 April 2020).
6. Bastawrous, A., Rono, H.K., Livingstone, I.A.T., et al. (2015). Development and Validation of a
Smartphone-Based Visual Acuity Test (Peek Acuity) for Clinical Practice and Community-Based
Fieldwork. JAMA Ophthalmology, 133(8): pp. 930–937. doi:10.1001/jamaophthalmol.2015.1468.
7. Boslaugh, E. (2018). Snellen chart OPTOMETRY. Encyclopedia Britannica. (Online). Available:
http://www.britannica.com/science/Snellen-chart (Accessed 23 September 2018).
8. Bourne, R.R.A. et al. (2017). Magnitude, temporal trends, and projections of the global prevalence of
blindness and distance and near vision impairment: a systematic review and meta-analysis. Lancet
Global Health, 5(9): pp. 888-897.
9. Blair, I. (2020). Mobile App Download and Usage Statistics (2020). BuildFire. (Online). Available:
https://buildfire.com/app-statistics/ (Accessed 04 March 2020).
10. Brady, C.J., Eghrari, A.O. and Labrique, A.B. (2015). Smartphone-Based Visual Acuity
Measurements for screening and clinical Assessment. JAMA, 314(24): pp. 2682-2683.
11. Buderer, N.M. (1996). Statistical methodology: I Incorporating the prevalence of disease into the
sample size calculation for sensitivity and specificity. Academic Emergency Medicine, (3): pp. 895–
900.
12. Campbell, S. (2019). Effect of Astigmatism on Vision. Chron. (Online). Available:
https://livehealthy.chron.com/effect-astigmatism-vision-7676.html (Accessed 03 April 2020).
72
13. Cape Town Population. (2020). (Online) Available: http://worldpopulationreview.com/world-
cities/cape-town/ (Accessed 04 April 2020).
14. Carroll, J. K., Moorhead, A., Bond, R., LeBlanc, W. G., Petrella, R. J., & Miscella, K. (2017). Who
Uses Mobile Phone Health Apps and Does Use Matter? A Secondary Data Analytics Approach.
Journal of Medical Internet Research, 19(4): e125. https://doi.org/10.2196/jmi.5604/.
15. Castro, D., Atkinson, R. and Ezell, S. (2010). Embracing the Self-Service Economy. The information
Technology & Innovation foundation. (online). Available: https://www.itif.org/files/2010-self-
service-economy.pdf (Accessed 04 April 2020).
16. Cox, M.J., Norman, J.H. and Norman, P. (1999). The effect of surround luminance on measurements
of contrast sensitivity. Ophthalmic and Physiological Optics, 19(5): pp .401–414. doi:10.1046/j.1475-
1313.1999.00457.x.
17. De Venecia, B., Bradfield, Y., Trane, R.M., Bareiro, A. and Scalamogna, M. (2018). Validation of
Peek Acuity application in Pediatric screening programs in Paraguay. International Journal of
Ophthalmology, 11(8): pp. 1384-1389. Doi: 10.18240/ijo.2018.08.21. eCollection 2018.
18. Di Leo, M. A. S., Caputo, S., Falsini, B., Porciatti, V., Minnella, A., Greco, A. V., and Ghirlanda, G.
(1992). Nonselective loss of contrast sensitivity in visual system testing in early type I diabetes.
Diabetes Care, 15(5): pp. 620-625.
19. Dorr, M., Lesmes, L. A., Lu, Z. L. and Bex, P. J. (2013). Rapid and reliable assessment of the contrast
sensitivity function on an iPad. Investigative Ophthalmology & Visual Science, 54(12): pp. 7266–
7273. Doi:10.1167/iovs.13-11743.
20. Elliot, D.B., Sanderson, K., Conkey, A. (1990). The reliability of the Pelli‐Robson contrast sensitivity
chart. Ophthalmic and Physiological Optics, 10(1): pp. 21-24.
21. Foley, B. (2018). How to Avoid Sampling Bias in Research. Surveygizmo. (Online). Available:
https://www.surveygizmo.com/resources/blog/how-to-avoid-sampling-bias-in-research/ (Accessed 05 April
2020)
22. GOV.UK. (2014). Personalised health and care 2020: a framework for action. (Online) Available:
https://www.gov.uk/government/publications/personalised-health-and-care-2020/using-data-and-
technology-to-transform-outcomes-for-patients-and-citizens. (Accessed 21 Apr 2015).
23. Griffin Eye Centre. (2020). Types of vision problems. (Online) Available:
https://griffineyecenter.com/vision-problems/ (Accessed 27 November 20202).
24. Habtamu, E. et al. (2019). Development and Validation of a Smartphone-based Contrast Sensitivity
Test. Translational Vision Science & Technology, 13;8(5): pp.13. doi: 10.1167/tvst.8.5.13.
25. Heiting. G. (2018). What is astigmatism?. All about vision. (Online) Available:
.https://www.allaboutvision.com/conditions/astigmatism.htm. (Accessed on 07 April 2020).

73
26. Han, X., Scheetz, J., Keel, S., et al. (2019). Development and Validation of a Smartphone-Based
Visual Acuity Test (Vision at Home). Translational Vision Science & Technology, 8(4): pp. 27.
doi:10.1167/tvst.8.4.27.
27. Jackson & Coker Research Associates Special Report: App, Doctors, and Digital Devices. (2011).
Jackson & Coker Industry Report, 4(7).
28. Kamiya, K., Shimizu, K., Iijima, A. and Kobashi, H. (2014). Factors Influencing Contrast Sensitivity
Function in Myopic Eyes, 9(11). https://doi.org/10.1371/journal.pone.0113562.
29. Katz, E.Z and Bothwell, R. (2019). Working with elders that have visual impairment. Occupational
therapy with elders. Science direct, 15(4): pp. 217-233
30. Keane, P. A., Patel, P. J., Ouyang, Y., Chen, F. K., Ikeji, F., Walsh, A. C. and Sadda, S. R. (2010).
Effects of retinal morphology on contrast sensitivity and reading ability in neovascular age-related
macular degeneration. Investigative ophthalmology & visual science, 51(11): pp. 5431–5437.
Doi:10.1167/iovs.09-4846.
31. Khanna, S.G. (2017). Techniques and Automation in Eye Care and Vision Testing Using Smartphone.
International Journal of Ophthalmology & Visual Science, 2(4), pp. 88-92. Doi:
10.11648/j.ijovs.20170204.12.
32. Kingsnorth, A., Drew, T., Grewal, B. and Wolffsohn, J. (2016). Clinical & Experimental Optometry,
99(4). DOI: 10.1111/cxo.12362.
33. Kolker R.J. (2015). Subjective Refraction and Prescribing Glasses: Guide to Practical Techniques
and Principles. (Online). Available:
file:///C:/Users/therisha/Downloads/Subjective_Refraction_Prescribing_Glasses_JCAHPO%20(1).p
df (Accessed on 07 April 2020)
34. Kollbaum, P.S., Jansen, M.E., Kollbaum, E.J. and Bullimore, M.A. (2014). Validation of an iPad test
of letter contrast sensitivity. Optometry and Vision science, 91(3): pp. 291-296.
35. Kruse et al. (2017). Telehealth and patient satisfaction: A systematic review and narrative analysis.
BMJ Open, (7). e016242. 10.1136/bmjopen-2017-01624.
36. Ku, P.W., Steptoe A, Lai, Y.J, Hu, H.Y, Chu, D. Yen, Y.F., Liao, Y. and Chen, L.J. (2019). The
Associations between Near Visual Activity and Incident Myopia in Children: A Nationwide 4-Year
Follow-up Study. Ophthalmology, 126(2): pp. 214-220. doi: 10.1016/j.ophtha.2018.05.010. Epub
2018 Jun 20. PMID: 29934268.
37. Larson, J. (2020). How Does Astigmatism Affect Your Night Vision. Healthline. (Online). Available:
https://www.healthline.com/health/astigmatism-lights (Accessed 03 April 2020).
38. Lee, C. and Afshari, N. (2016). The global state of cataract blindness. Current Opinion in
Ophthalmology. (28). 10.1097/ICU.0000000000000340.

74
39. Levy, N.S. and Glick, E.B. (1974). Stereoscopic Perception and Snellen Visual Acuity. American
Journal of Ophthalmology, 78(4): pp. 722-724.
40. Livingstone, I., Tarbert, C., Giardini, M. E., Bastawrous, A., Duncan, G.M. and Ruth, H. (2016).
Photometric Compliance of Tablet Screens and Retro-Illuminated Acuity Charts as Visual Acuity
Measurement Devices. PLOS ONE. 11. E0150676. 10.1371/journal.pone.0150676.
41. Malhotra R.K. (2010). Indrayan A. A simple nomogram for sample size for estimating sensitivity and
specificity of medical tests. Indian Journal of Ophthalmology, 58(6): pp. 519–522. doi:10.4103/0301-
4738.71699.
42. Malik, D. (2016). What is self-service support and why is it so important in 2017?. (Online). Available:
https://lab.getapp.com/self-service-support-important-2017/ (Accessed on 14 October).
43. Mediline plus. (2016). Astigmatism, (online) Available:
https://medlineplus.gov/ency/article/001015.htm (Accessed 23 September 2018).
44. Medium. (2017). Healthcare Mobile App Development and mHealth Apps in 2017. (Online) Available:
https://medium.com/@Adoriasoft/healthcare-mobile-app-development-and-mhealth-apps-in-2017-
eb307d4cad36 (Accessed 14 October 2018).
45. Microsoft. (2015). Diabetic Retinopathy Screening Reading App Carl Zeiss. (Online). Available:
https://www.microsoft.com/en-us/p/diabetic-retinopathy-screening- reading-
app/9nblggh5xn9k#activetab=pivot:overviewtab (Accessed 17 September 2018).
46. MindSea Team. (2020). 28 Mobile App Statistics To Know In 2020. MindSea. (Online). Available:
https://mindsea.com/app-stats/ (Accessed 18 February 2020).
47. Nangia, V., Jonas, J.B., Sinha, A., Gupta, R. and Agarwal, S. (2011). Visual Acuity and Associated
Factors. The Central India Eye and Medical Study, 6 (7).
https://doi.org/10.1371/journal.pone.0022756 (Accessed 23 September 2018).
48. Lennie, P., Van Hemel, S.B. (2002). National Research Council (US) Committee on Disability
Determination for Individuals with Visual Impairments. Visual Impairments: Determining Eligibility
for Social Security Benefits. Washington (DC): National Academies Press (US), (2), TESTS OF
VISUAL FUNCTIONS. (0nline). Available: https://www.ncbi.nlm.nih.gov/books/NBK207559/
(Accessed 23 September 2018).
49. O'Neill, S., and McAndrew, D.J. (2016). The validity of visual acuity assessment using mobile
technology devices in the primary care setting. Australian Family Physician, 45(4): pp. 212–215.
50. Optician. (2014). C36211: Elements of refraction - part 4. (online). Available:
https://www.opticianonline.net/cet-archive/13 (Accessed on 07 April 2020).
51. Pathipati, A.S., Wood, E.H., Lam, C.K., Sales, C.S. (2016). Visual acuity measured with a
smartphone app is more accurate than Snellen testing by emergency department providers. Graefe's

75
archive for clinical and experimental ophthalmology, 254(6): pp. 1175–1180. Available:
https://doi.org/10.1007/s00417-016-3291-4.
52. Perera, C., Chakrabarti, R., Islam, F.M. and Crowston, J. (2015). The Eye Phone Study: reliability and
accuracy of assessing Snellen visual acuity using smartphone technology. Eye (Lond), 29(7): pp. 888-
94. doi: 10.1038/eye.2015.60. Epub 2015 May 1. PMID: 25931170; PMCID: PMC4506341.
53. Persson, S.B. (1973). Refractor with a synchronized cylinder lens axis and cross cylinder lens axis.
Cambridge Instrument Co Inc. (Online). Available: http://www.freepatentsonline.com/3860330.html
(Accessed 23 September 2018).
54. Plecher, H. (2020). South Africa: Average age of the population from 1950 to 2050. Statista. (Online).
Available: https://www.statista.com/statistics/578976/average-age-of-the-population-in-south-africa/
(Accessed 03 March 2020).
55. Priors, D. and Lucian, V. (1986). The Jackson Cross Cylinder. Ophthalmology, 93(11): pp. 1461-
1465.
56. ResponseSource. (2011). Women are more patient than men, but both only last an average two-and-
a-half minutes. (Online). Available: https://pressreleases.responsesource.com/news/66034/women-
are-more-patient-than-men-but-both-only-last/ (Accessed 03 March 2020).
57. Rhiu, S., Lee, J.H., Goo, Y.S., Cho, K. and Kim, J.H. (2016). Visual Acuity Testing Using a
Random Method Visual Acuity Application. Telemedicine and e-Health, 22(3).
http://doi.org/10.1089/tmj.2015.0073.
58. Rodríguez-Vallejo, M., Remón, L., Monsoriu, J. A. and Furlan, W. D. (2014). Designing a new test
for contrast sensitivity function measurement with iPad. Journal of Optometry, 8(2), pp. 101-108.
59. Rono, K., Bastawrous, A., Macleod, D., Wanjala, E., Di Tanna, G.L., Weiss, H.A. and Matthew, J.B.
(2018). Smartphone-based screening for visual impairment in Kenyan school children: a cluster 75
randomized controlled trial. The Lancet, 6(8), pp. 924-932.
60. Scott K.C., Karem, P., Shifflett, K., Vegi, L., Ravi, K., and Brooks, M. (2018). Evaluating barriers to
adopting telemedicine worldwide: A systematic review. Journal of Telemedicine and Telecare, 24 (1),
pp. 4–12. https://doi.org/10.1177/1357633X16674087.
61. Sheedy, J., Bailey, I. and Raasch, T. (1984). Visual Acuity and Chart Luminance. American journal
of optometry and physiological optics. 61. 595-600. 10.1097/00006324-198409000-00010.
62. Smart vision labs. (2017). Telemedicine is not the future: it’s the present, (Online). Available:
https://www.smartvisionlabs.com/blog/telemedicine-is-not-the-future-its-the-present/ (Accessed 17
September 2018).

76
63. Smith, A. (2015). U.S. Smartphone Use in 2015. Pew Research Center. (Online). Available:
https://www.pewresearch.org/internet/2015/04/01/us-smartphone-use-in-2015/ (Accessed 06 April
2020).
64. Smith, Y. (2018). Types of telemedicine, News medical life sciences. (Online). Available:
https://www.news-medical.net/health/Types-of-Telemedicine.aspx (Accessed 17 September 2018).
65. StatsSA. (2017). Demographic Profile of Adolescents in South Africa. (Online). Available:
http://www.statssa.gov.za/publications/Report%2003-00-10/Report%2003-00-102016.pdf (Accessed
on 05 April 2020).
66. Stephanie. (2014). Sensitivity vs Specificity and Predictive Value. Statistics How to. (Online).
Available: https://www.statisticshowto.com/sensitivity-vs-specificity-statistics/ (Accessed 09 April
2019).
67. Stone, D. What Is the Difference Between an iPhone & an iPad? Small Business – Chron.com,
(Online). Available: http://smallbusiness.chron.com/difference-between-iphone-ipad-72690.html
(Accessed 09 April 2019).
68. The Mars Perceptrix. (2003-2010). The Mars Letter Contrast Sensitivity Test USER MANUAL.
69. The world bank. (2019). Population, total. (Online). Available:
https://data.worldbank.org/indicator/SL.TLF.TOTL.IN (Accessed on 05 April 2020).
70. Tofigh, S., Shortridge, E., Elkeeb, A. and Godley, B. F. (2015). Effectiveness of a smartphone
application for testing near visual acuity. Eye, 29(11): pp. 1464–1468.
71. Vinay, A., Shah, M.D., Hemang, K. and Pandya, M.D. (2015). Smartphones Visual Function testing.
Retinal physician, (Online). Available: https://www.retinalphysician.com/issues/2015/may-
2015/smartphones-for-visual-function-testing (Accessed on 07 February 2019).
72. Vision Optometrist. (2018). Driver’s license screening at Vision. (online). Available:
https://www.thevisioncompany.co.za/drivers-licence-screening-at-vision-2/ (Accessed 06 April 2020)
73. Ward, D. (2013). The Familiarity Principle of Attraction. Psychology Today, (Online). Available:
https://www.psychologytoday.com/za/blog/sense-and-sensitivity/201302/the-familiarity-principle-
attraction (Accessed on 28 February 2019).
74. WHO. (2004). Glaucoma is second leading cause of blindness globally. (Online). Available:
https://www.who.int/bulletin/volumes/82/11/feature1104/en/ (Accessed 07 April 2020).
75. Wicklund, E. (2018). Consumers Like Telehealth, But Still Prefer Face-to-Face Healthcare. MHealth
Intelligence. (Online). Available: https://mhealthintelligence.com/news/consumers-like-telehealth-
but-still-prefer-face-to-face-healthcare (Accessed 07 April 2020).

77
76. Wozniak, et al. (1999) The effect of room illumination on visual acuity measurement.
Australian Orthoptic Journal, (34): pp. 3-8.
77. Zeri, F., Calcatelli, P., Funaro, E., Martelli, M. and Naroo, S.A. (2018). How accurate is an LCD
screen version of the Pelli–Robson test?. International Ophthalmology, 38(4): pp. 1473-1484.
78. Zhang, Z.T., Zhang, S.C., Huang, X.G. and Liang, L.Y. (2013). A pilot trial of the iPad tablet
computer as a portable device for visual acuity testing. Journal of Telemedicine and Telecare, 9(1):
pp.55-9. Doi: 10.1177/1357633X12474964.

78
APPENDICES
APPENDIX 1:
Information Document
Date: ____________
Greetings
I am a qualified Optometrist, currently pursuing my Master’s degree at Westville campus at the University of
KwaZulu-Natal. My research is entitled “Comparability of selected iPhone optometric screening
applications to equivalent standard optometric tests”. This study aims to determine if smartphone
applications for vision assessment are comparable to results produced by the equivalent standard optometric
tests.
Research is just the process to learn the answer to a question. This research is not intended to treat or cure any
medical condition or disease.
You are being invited to consider participating in this study that comprises of two parts.
Part 1: Involves the researcher performing standard optometric tests on you as well as using smartphone
applications to conduct multiple optometric tests.
Part 2: Will involve you completing a questionnaire that contains questions relating to the standard optometric
tests, as well as, the use of the smartphone optometric tests. It should take about 5 minutes for you to answer
the questions
The study is expected to enroll a minimum of 100 people. I am not being paid to do this study. It is a
requirement as per the Postgraduate Masters optometry education at the University of KwaZulu Natal.
Participation in this study involves the completion of the standard optometric tests, smartphone application
tests as well as the study questionnaire. The study will not provide any direct benefits to you, the participant
other than the visual assessment, but it will help me gain more knowledge on the accuracy and reliability of
smartphone optometric testing. Participation in this study will not compromise your level of health care
received at this institution.
Participation in this research is voluntary and you may withdraw participation at any point of the study. In the
event of refusal/withdrawal of participation you will not incur penalty or loss of treatment or other benefits to
which you are normally entitled.

79
We will not pay or give you anything if you participate.
This study does not record your name or address – just a study number. We will protect confidentiality of
personal/clinical information always.
This study has been ethically reviewed and approved by the University of KwaZulu-Natal (approval
number_____).
In the event of any problems or concerns/questions you may contact the researcher at Therisha Moodley (083
708 7052), or the UKZN Biomedical Research Ethics Committee, contact details as follows:
BIOMEDICAL RESEARCH ETHICS ADMINISTRATION
Research Office, Westville Campus
Govan Mbeki Building Private Bag X 54001 Durban 4000 KwaZulu-Natal, SOUTH AFRICA Tel: 27 31
2604769 - Fax: 27 31 2604609 Email: [email protected]
Supervisor Contact Details:
1. Dr. R. Hansraj
Email: [email protected]
2. Ms. P Govender
Email: [email protected]
Consent to participate in Research
I, ____________________________ have been informed about the study entitled” Comparability of selected
iPhone optometric screening applications to equivalent standard optometric tests” by Therisha Moodley.
I understand the purpose and procedures of the study.
I have been given an opportunity to ask questions about the study and have had answers to my satisfaction.
I declare that my participation in this study is entirely voluntary and that I may withdraw at any time without
affecting any treatment or care that I would usually be entitled to.
If I have any further questions/concerns or queries related to the study I understand that I may contact the
researcher; Therisha Moodley (083 708 7052).
If I have any questions or concerns about my rights as a study participant, or if I am concerned about an aspect
of the study or the researcher then I may contact:
80
BIOMEDICAL RESEARCH ETHICS ADMINISTRATION
Research Office, Westville Campus
Govan Mbeki Building Private Bag X 54001 Durban 4000 KwaZulu-Natal, SOUTH AFRICA Tel: 27 31
2604769 - Fax: 27 31 2604609 Email: [email protected]
____________________ ____________________ Signature of Participant Date:
____________________ _____________________ Signature of Witness Date: (Where applicable)
____________________ _____________________ Signature of Translator Date: (Where applicable)

81
APPENDIX 2:
Questionnaire
Instructions to answer the questionnaire:
• This questionnaire is to determine your perception of Smartphone application
tests to standard Optometric tests.
• The questionnaire consists of 13 questions (please answer all honestly) and
should take you approximately 5 minutes to complete.
• Use a tick (√) to choose your option, and for some questions you may tick (√)
more than one option.
Age:
Gender:
Race:
Occupation:
Standard Optometric testing vs Application testing:
1. Which testing
procedure did you
prefer?
Standard
Optometric
testing
Smartphone
Application
2. Why did you
prefer the above?
Easier to
understand
More
interactive
More
reliable
Less time
consuming
I don’t know
3. Which testing
instructions were
easier to follow
Standard
Optometric
testing
Smartphone
Application
Male Female
Black Coloured Indian White

82
4. Which testing
method would you
prefer to be used at
your next
optometric eye test
Standard
Optometric
testing
Smartphone
Application
Smartphone application tests
5. Which
Smartphone app
test was the easiest
to use and
understand?
Eye Test Smart
Optometry
Vision scan Test your
eyes
6. Which app took
the most time to
download onto
your smartphone?
Eye Test Smart
Optometry
Vision scan Test your
eyes
7. Which app took
the least time to
download onto
your smartphone?
Eye Test Smart
Optometry
Vision scan Test your
eyes
8. Which app took
the most time to
complete all the
tests?
Eye Test Smart
Optometry
Vision scan Test your
eyes
9. Which app had the
most clear and
easy to understand
instructions?
Eye Test Smart
Optometry
Vision scan Test your
eyes
10. Which app was the
most interactive
and had the best
visuals
Eye Test Smart
Optometry
Vision scan Test your
eyes
11. Which app had the
clearest and easiest
to understand
results
Eye Test Smart
Optometry
Vision scan Test your
eyes

83
12. How accurate do
you think the
application test
results are?
Extremely
accurate
Fairly
accurate
Neutral Probably
Not accurate
Not accurate
13. How comfortable
are you to rely on
the results of these
apps to determine
your visual status.
Extremely
comfortable
Fairly
comfortable
Neutral Not
comfortable
THANK YOU

84
APPENDIX 3:
Data Recording sheet

85
APPENDIX 4:
Ethical Clearance certificate

86
APPENDIX 5:
Study site permission form

87
APPENDIX 6:
Manuscript 1-Submitted to Telemedicine and e-Health Journal.
A review of Smart-Technology Optometric Visual Testing Applications for assessing
Visual Acuity and Contrast Sensitivity
Moodley, T1, Hansraj, R1 and Govender, P1.
1Discipline of Optometry. University of Kwa-Zulu Natal, South Africa.
.
Abstract
Background
The unprecedented use of mobile technologies, as well as advancements in their applications to
address health and visual priorities, have evolved tremendously in the past decade. This innovative
use of smart technology is being explored as a means to provide visual self-screenings as society
today has displayed a keen preference to taking care of their needs at their convenience. This gives
rise to a fairly new and rapidly advancing area of optometry which is smart-technology visual testing.
Method
A literature search was conducted using two main databases i.e. PubMed and Research Gate for peer
review studies pertaining to smart technology optometry visual testing applications. Studies dealing
with smartphone/ smart technology visual acuity, contrast sensitivity and astigmatism testing were
included. A total of 17 articles published from 2013 up to 2019 were found and reviewed.
Results
Studies report the uptake and usage of smartphones as unprecedented. iPhone visual acuity screening
applications have yielded accurate and reliable results especially the Peek acuity® test which also
appears to be the most popular test. Studies on contrast sensitivity testing have mostly been noted on
iPad devices with the majority reporting this form of contrast sensitivity assessment to be reasonably
accurate.
Conclusion
Even though there has been rapid expansion in the use of smart-technology for visual screening,
there is limited published studies on the validation of these smart-tech applications hence,
questioning their accuracy and reliability leading to the reluctance of eye care professionals to use
these apps in a clinical setting.

88
Introduction
Society today individuals prefer to take care of their needs at their own convenience hence resulting
in the self-service industry growing by 81% in the last few years1 with an important expansion into
the health care arena including optometry. With the unprecedented spread of mobile technologies, as
well as advancements in their innovative applications (apps), people are now able to perform vision
screening tests on themselves at their own convenience. Moreover, these apps provide results to the
patient about their visual status and feedback as to whether a full comprehensive eye examination
with a registered optometrist is recommended. However, if these apps are to be adopted by eye care
professionals, they must yield accurate and reliable results. If not, a misdiagnosis could lead to
devastating visual outcomes which can ultimately impact on an individual’s life.
Smartphone apps have been increasing in popularity with the number of consumer apps downloaded
over the past two years increased from 300 million in 2009 to a staggering five billion in 20102. There
are 43,700 medical apps available in the Apple Store alone for physician and patient use with the
caution that patients should be aware that not all medical apps are accurate with only approximately
54% of medical apps available on iTunes considered to be accurate3.
The optometric industry has always been subject to intense regulations to ensure that patients receive
the best possible care with accurate diagnosis and treatment, as it rightfully should be. Smartphone-
based optometry testing therefore should be no different yet there are limited published studies on the
accuracy and reliability of available apps. According to the Health Professions Council of South
Africa (HPCSA), vision screening is an investigative procedure with the goal being to identify
individuals in need of referral for a comprehensive examination. Similar rules pertaining to standard
visual screening, should also apply to smartphone vision screening, as both entities aim to detect
visual difficulties in individuals. Therefore, smartphone apps should not only be able to provide
accurate and reliable results but also provide feedback as to whether the user needs a full
comprehensive eye examination and possibly where this could be obtained.
There have been several studies4,5,6,7conducted to determine the accuracy of smart technology
application testing however, the results vary significantly, with some
studies4,6,8,9,10,11,12,13,14,15,16,17,concluding these applications produce accurate results while
others5,18,19,20,21 report the opposite. These varied findings may be related to the use of different types
of smart technology devices providing variations in contrast an lighting, as well as apps varying in
terms of different types of test charts used. Since visual acuity testing is considered the standard
psychophysical test of visual function used in many clinical settings there were relatively more studies
in this area, however the findings were not always consistent. Paucity of studies in other clinical areas
like contrast sensitivity may be due to this area not being frequently investigated in usual clinical
settings hence unfamiliarity with this visual function, as well as that interpretation is complicated
relative to visual acuity testing. Due to this unprecedented popularity of smartphone vision testing,
more insight is required into the reliability of these tests which have the potential for increasing access
to vision screening and subsequently seeking eye care timeously, for many.
89
Method
A literature search was performed using two electronic data bases i.e. PubMed and Research Gate. A
combination of keywords, such as smartphone technology, iPhone, applications, visual acuity,
astigmatism, contrast sensitivity and vision screening, in the form of title words or optometry subject
headings, were used in the search. A final search was conducted on the 30th March 2020.
Articles dealing with the accuracy and reliability of both visual acuity and contrast sensitivity
smartphone testing were of high importance. Studies dealing with the development and validation of
new smart-technology applications were also among the top studies reviewed. Reference lists of all
identified articles were cross checked to identify other relevant studies. This strategy was used to
adopt other relevant articles used in previous reviews.
INCLUSION AND EXCLUSION CRITERIA
Studies that were conducted in the last 10 years and those that met the criteria for optometry
application testing on smartphone or other technological devices were considered in addition to
studies:
1. published in the English language.
2. including all age ranges, races and geographical locations.
3. with a participation rate of at least 70% of the total study sample.
4. clearly defining the term and use of Telemedicine and Smart-technology.
5. clearly outlining the benefits of telemedicine and how telemedicine has evolved over the
years.
6. reporting the significant use of smartphone technology to manage patients’ needs.
7. providing reliable statistics on smart- technology, number of available health applications
and the number of users throughout the world.
8. outlining the benefits of smart-technology applications in the optometry and ophthalmology
field.
9. comparing the use of smartphone visual acuity tests versus standard visual acuity testing.
Different types of optometric apps were researched.
10. comparing the use of smartphone contrast sensitivity test versus standard contrast sensitivity
testing. Different types of contrast sensitivity apps were researched.
11. comparing the use of smartphone astigmatism test versus standard astigmatism tests.
12. which found smartphone optometry testing to not be reliable or accurate.
13. developing and validating new smart-technology applications for visual acuity and contrast
sensitivity testing.
Studies were excluded if:
1. they did not include visual acuity, contrast sensitivity or astigmatism testing.
2. there was no indication of informed consent being obtained from participants.
3. they were not relevant to optometry smartphone application testing.
90
4. they were published in languages other than English.
DATA EXTRACTION
The data extracted from each of the selected studies are illustrated in Table 1. The main data extracted
were: region(s) in which the study was conducted, age group of participants, sample size and
participation rate of each study, year in which the study was conducted, aim of the study, author(s)
details, type of electronic device used for testing, name(s) of the specific apps tested, type of test chart
used by each app, the notation in which the results were displayed, the main conclusion from the
studies, with any recommendations made. Studies were grouped according to the visual parameter
being investigated. This made analyzing and interrupting the data easier and less time consuming.
Results
After an extensive literature search, there was a total of 17 studies that met the inclusion criteria and
were selected to be part of this review paper. The results are presented according to the focus areas
of the studies.
ACCURATE SMARTPHONE VISUAL ACUITY TEST RESULTS
The Peek acuity® smartphone visual acuity test was found to be the most popular, and accurate and
reliable for the assessment of visual acuity4,8,9. The Paxos Checkup® app was investigated by the
Stanford Hospital Emergency Department (ED) and reported to be as accurate in determining
emergency room patient’s visual acuity when compared to readings obtained by the ophthalmologists
which were regarded as the gold standard. The results interestingly revealed best corrected visual
acuity (BCVA) measured by non-ophthalmic ED staff with an app to be more accurate than with a
standard Snellen chart12. O’Niell., et al (2016)11 assessed the validity of a visual acuity test using
mobile technology devices in the primary care setting. This study, which assessed the VA of
participants with a Snellen wall chart and two mobile technology devices (iPhone and iPad), reported
a high level of general agreement between the Snellen chart and the testing modalities on the two
devices. The study suggested that this newfound convenience should increase the frequency of visual
acuity assessments, potentially identifying ocular or neurological pathology at an earlier stage and
thus enabling timely and appropriate referral. Similar findings were reported by Han et al., (2019)10
who compared the assessment of distance and near VA measurements using the V@home® mobile
app with that obtained with the standard (ETDRS) chart, as minimal discrepancies between the two
methods across all groups (0.010 to −0.100 logMAR). Therefore, the study concluded the V@home®
app could accurately and reliably measure both distance and near VA. Moreover, the study also
revealed 82.3 % of participants to be satisfied or extremely satisfied with the app with 72.5%
indicating that they were likely or extremely likely to use the system again, further validating the app.
INACCURATE SMARTPHONE VISUAL ACUITY TEST RESULTS
Some studies by5,18,19,20 have found smartphone visual acuity tests to be unreliable and inaccurate.
All five studies were conducted on five different smartphone applications.

91
Even though there were many studies4,8,9 confirming the accuracy of Peek acuity® test, the study by
De Venecia et al., (2018)5 found contradictory results. This study found that the Peek acuity® app
tended to overestimate the VA of pediatric school children aged 6-16-years consequently reducing
the possibility of them being referred for a full examination. This study concluded that this app could
be made more accurate if the sensitivity (48%) would be improved.
Inaccuracies of VA measurements by apps were also reported by Pereira et al., (2015)18 following an
evaluation of the results obtained with a smartphone-based VA chart (Dr. Bloggs Ltd® running on
an Apple iPhone 4) against that obtained with a standard 6 m Snellen VA chart at a university teaching
hospital in Melbourne, Australia. The results showed a mean difference of two Snellen VA lines
between the charts (0.276 logMAR). Of particular concern was the larger mean difference in
logMAR acuity between the two methods in the subgroup of patients with Snellen VA worse than
6/18 (n=5). It was thus concluded that further validation of iPhone apps is required for the assessment
of VA in patients particularly those with severe visual impairment. Another VA app (Eye chart pro
app) proved to only be reliable for VA testing when the Snellen VA is better than 0.1 (20/200). This
study 20 evaluated the accuracy of an app for the iPad (Eye Chart Pro®) as a portable method of VA
testing. A total of 120 consecutive patients (240 eyes) underwent VA testing with an iPad 2 and with
a conventional light-box chart. The logMAR VA results from the iPad reflected better VAs than those
from the light-box (P < 0.001) hence overestimating the distance VA20. A similar overestimation of
distance VA when using an iPad was found13 when compared with the Early Treatment Diabetic
Retinopathy Study (ETDRS) Tumbling E (p < 0.01) or Landolt C chart (p < 0.01).
Near VA measurement using the Eye hand book® smartphone application was compared to the
conventional method of using a near VA chart19 at the University of Texas medical branch eye clinic
on 100 subjects. The study concluded that the Eye hand Book®, running on iPhone 5, overestimates
the near VA by an average of 0.11 LogMAR units when compared to conventional near VA card.
The recommendations made by the study was that eye care providers using portable high definition
screens taking VA measurements should be mindful of potential disparity in VA measurements
between different platforms.
ACCURATE CONTRAST SENSITIVITY RESULTS ON SMART-TECHNOLOGY DEVICES
Many researchers are trying to develop new and cost-efficient ways for testing contrast sensitivity as
the general feeling is that contrast sensitivity function (CSF) is a better predictor of visual
performance than high contrast VA alone and therefore, can better monitor the slow progress of eye
blinding diseases15,16. Only one study was found that investigated contrast sensitivity on a smartphone
device6. This study used the same technology as the Peek VA testing to develop and validate a
smartphone Peek CS (PeekCS®) test. The PeekCS® test was compared to the reference standard which
was a Tumbling-E Pelli-Robson CS test (PRCS). PeekCS® showed strong repeatability which was
comparable with PRCS. It also had a faster testing time (44.6 seconds) than PRCS (48.6 seconds).
The study therefore concluded that this smartphone-based PeekCS® is a repeatable and rapid test,
providing results that are highly comparable with the commonly used PRCS test.

92
Other studies found in this area involved an assessment of contrast sensitivity testing on other smart
technology devices such as on an iPad and LCD computers. A study14 aimed at determining the
accuracy of an iPad Pelli-Robson contrast sensitivity test (ridgevue.com®). The study found that the
iPad test showed good repeatability when compared to the standard Pelli-Robson test, therefore, it
was concluded that this testing option could be a rapid and convenient alternative to some existing
measures. Dorr et al., (2013)16 developed and validated an iPad contrast sensitivity test which was
found to be an efficient and ‘easy-to-use’ assessment of CS testing. The results demonstrated that
the iPad test proved reliable at estimating sensitivities at specific spatial frequencies which were
however not identified in the paper. The authors did however indicate that the maximal sensitivities,
which were consistently less than 1% were observed at low spatial frequencies. This test also reliably
identified changes in contrast due to different luminance levels and it was concluded that CS testing
on an iPad was indistinguishable from that obtained with specialized laboratory equipment. The
ClinicCSF®, a contrast sensitivity function (CSF) test to be used on an iPad was designed by
Rodriguez et al. (2014)15. Two versions of the ClinicCSF® were tested i.e. v1 and v2 with the best
agreement between the standard functional acuity contrast test (FACT) and ClinicCSF® found for
version2 in all spatial frequencies.
Another study17 aimed to validate the accuracy and inter-test repeatability of a near and distance
mobile (iPad) app, the Aston contrast sensitivity® test. This study determined that the mobile apps
(near more than distance, p = 0.005) recorded higher contrast sensitivity than the printed tests.
Furthermore, the Aston near and distance apps proved to be valid, repeatable and a time-efficient
method of assessing contrast sensitivity at multiple spatial frequencies. This study17 asserted that
paper-based charts are often limited in the number of stimuli they can present and require the
examiner to manually implement and respond to feedback from the patient. Hence, clinical
measurements of psychophysical contrast thresholds can only be assessed in broad discrete steps of
spatial frequencies and contrast. Meanwhile computerized CSF testing equipment can render a
multitude of grating stimuli of various frequencies and contrast and adopt complicated testing
methods making their use multifunctional and less time consuming.
The most noticeable difference between an iPad/ LCD computer and an iPhone is the size, this
however, plays a crucial role in how an application is presented on the intended screen. The screen
in an iPad is much longer and wider when compared to an iPhone. The iPhone 6 plus has a 16:9
aspect ratio whereas the iPad has a 4:3 aspect ratio. The larger screen usually, but not always, means
that the iPad has a higher resolution than the iPhone, which makes it difficult to resize some apps.
The combination of the resolution and the aspect ratio means that running iPhone apps on the iPad
can result in a stretched-out display or a black border surrounding the app display21. This means that
not all iPhone apps can be run on an iPad and vice versa, as this will result in inaccurate results due
to the screen sizes and resolution being incorrect. In reference to the assertion by Livingstone et al.,
(2016)22 the discrepancies in contrast ratio, optotype, contrast and test luminance of devices can be a
possible reason for the variation in CS measurements when using a smartphone device compared to
standard clinical test and further that the results obtained by the CS studies on an iPad or LCD device
cannot apply to smartphone apps. A similar study23 also stated a possible reason for the difference
in contrast values between a standard printed chart and a smart device could due to the luminance of

93
surrounding light. He asserted that ophthalmic practitioners using contrast sensitivity measurements
with letter charts probably need not make special efforts to illuminate the standard test surround
appropriately. However, practitioners using sinewave gratings, especially computer-generated
sinewave gratings, to measure contrast sensitivity, may have their measurements affected by
inappropriately lit task surrounds.
INACCURATE CONTRAST SENSITIVITY RESULTS ON SMART-TECHNOLOGY DEVICES
Only one study was found that reported an electronic contrast sensitivity testing to be inaccurate. The
study7 found that an LCD Pelli-Robson chart (electronic version) chart did not produce accurate
results. The study aimed to evaluate the accuracy and repeatability of a computer-generated Pelli–
Robson test displayed on a liquid crystal display (LCD) system compared to a standard Pelli–
Robson chart. Two repeated measurements were taken with the printed Pelli–Robson test and with
the LCD test at 1 and 3 m. The results revealed that the contrast sensitivity measured with the LCD
resulted in significantly higher results than the printed Pelli-Robson both at 1 and 3m (p < 0.01).
The study concluded that computer generated versions of the Pelli–Robson test, displayed on LCD
systems, do not provide accurate results compared to the standard printed version. The study
suggested clinicians should consider that Pelli–Robson computer-generated versions are not
interchangeable with the printed version.
CHALLENGES WITH SMARTPHONE/ SMART-TECHNOLOGY DEVICES.
All smartphone applications are expected to give accurate and reliable results but there appears to
be scope for improvement. Furthermore, despite the rapid expansion in Smartphone application
testing, only approximately 54% of medical apps available on iTunes are judged to be genuine
healthcare apps3. Even more worryingly only a small portion of optometric smartphone apps are
currently affiliated with an academic institution or association and hence the reliability of the test
results of these apps are questionable. In addition, the use of smartphones in the eye health sector
has several challenges related to the regulations and standardization of performed tests24.
Other limitations envisaged with the use of these smartphone devices are as follows:
vi. Brightness and contrast of smartphone screens differ, in order for these devices to produce
equally correct results these factors need to be standardized24.
vii. Target optotype size has to be perfectly calibrated in order to produce results that can be
equated with its standard clinical test.
viii. Smartphone optometric tests usually are not dimensionally the same as standard tests, so the
accuracy of the test results may differ if proper calibration is not implemented.
ix. Different smartphones have different screen sizes. All tests should be calibrated to the size
of the smartphone screen, and if this is not possible, the app should state which smartphone
is not compatible with the app.

94
x. Instructions given by the apps need to be accurate and easy to understand to ensure the user
performs each test correctly.
xi. Using mobile devices to transfer data should be done securely using message encryptions to
ensure patient confidentiality.
Discussion
My analysis of the literature that was researched, does confirm that the use of telemedicine and
smartphone technology has not only been revolutionizing the optometry and ophthalmology sector
but many of the other health care fields as well. There has been a rapid increase in the number of
smartphone users in the last decade with a large proportion of these individuals using many health
apps including those for vision testing, as many individuals are taking keen interest in personalized
health care. Even though there are numerous apps available, studies have shown that not all apps
are accurate hence the reliability of these apps are questioned. Many of the studies that have been
researched suggest that further validations of these apps are required before they can be used as a
screening tool or even an equivalent testing option to the standard clinical tests.
Smartphone applications used for visual testing has numerous visual tests on them such as visual
acuity, contrast sensitivity and astigmatism tests. After analyzing all the data, I have found that that
for visual acuity and contrast sensitivity testing there have been varied findings. No studies have
been found for the validation of apps for the detection of astigmatism.
VISUAL ACUITY
Overall, it was very difficult to conclude if smartphone visual acuity testing produced accurate or
inaccurate results as the findings of the studies varied. Some studies4,8,9,10,11,12,13 confirm smartphone
apps to produce accurate results while others5,18,19,20 report to the contrary. However, after analyzing
the studies that focused on app testing for visual acuity, it has been confirmed the Peek acuity® by
far is the most popular and accurate smartphone visual acuity test available. It was very difficult to
find multiple studies for each app however, the Peek acuity® smartphone test was the only one on
which multiple studies had been conducted, with all except one5 reporting the app to be highly
accurate and reliable for visual acuity measurements. A brief overview of a number of visual apps
was also done and considerable variation in the content, instructions given, optotype size and
appearance, graphics and imaging, design of visual acuity test (Snellen test, logMAR test) and
notation for recording measurement was noted. As the current database of studies on smartphone
visual acuity testing is limited, more research is required particularly in determining if the
applications are safe and accurate to use for visual screenings.
CONTRAST SENSITIVITY
Despite there being limited published literature on smartphone CS testing, there were a few studies
on smart-technology CS testing. Therefore, there is a need to assess how comparable the results of
smartphone applications are to conventional tests as studies have shown that electronic versions of
95
contrast sensitivity testing may not produce the same results as printed charts do. From the literature
that was analyzed a general consensus was noted that electronic contrast sensitivity testing does
produce reliable and accurate results. Many studies6,14,15,16,17 all confirm accurate results using
electronic versions of CS charts. When each app was visually inspected it was noted that different
applications use different designs of contrast sensitivity charts including the Pelli-Robson chart and
the FACT. Moreover, the notation of results, instructions and appearance of each test also varied.
Similar to the smartphone visual acuity studies, the database of contrast sensitivity studies is limited
particularly those on smartphone contrast sensitivity apps. This means that even though there are
numerous contrast testing apps available on the iStore none of them have been validated, thus more
research done on smartphone contrast sensitivity testing is required before these apps can be used by
people for visual screening.
ASTIGMATISM
After extensive research there were no published articles on smartphone astigmatism testing. This
area of study seems to be very new to the optometry smartphone industry. The “Fan and Block” chart
seemed to be the most widely used method to test for astigmatism on a smartphone device. The results
of the test are non-specific with the results simply displayed as a pass or fail. There is no validation
of current apps for the detection of astigmatism and again if these devices are to be used for
determination of the presence of astigmatism in a screening capacity, research studies are required in
this specific area.
LIMITATIONS OF THE REVIEW
The following are limitations of the review:
1. Smartphone visual testing is new area in the optometry industry hence, there were insufficient
published studies on smartphone apps for visual acuity and contrast sensitivity, with no study
on the use of apps for the detection of astigmatism studies on all databases researched.
2. For each smartphone app there was only a single study with the exception for the Peek acuity
test.
3. Each study used a different method of testing and with different testing charts so it was
difficult to make direct comparisons.
4. There was insufficient statistics available on the accuracy or inaccuracies of smartphone
visual testing.
96
Conclusion
Today, more than ever, people are relying on their smartphones to take care of all their needs with
individuals increasingly taking an active interest in personalized health care particularly motivated
by convenience and affordability. There is numerous smartphone app available on the iStore and
Google play store, however, considering the literature that was studied, there are very limited studies
on the accuracy of these smartphone apps. The optometry industry has always been subject to intense
regulations to ensure that patients receive the best possible care with accurate diagnosis and treatment.
Smartphone-based optometry testing should be no different yet there are limited currently published
studies on the accuracy and reliability of these applications. Factors such as lighting, target distance
and target size need to be controlled in order for these tests to produce accurate results. This type of
testing medium can revolutionize the optometry industry enabling the provision of eye care services
to many more people, at a faster rate and be more cost effective, however these smartphone tests need
to be validated first before their use can be optimized.
Disclosure Statement
No competing financial interests exist.
REFERENCES:
1. Malik, D. What is self-service support and why is it so important in 2017?. 2016. (Online).
Available: https://lab.getapp.com/self-service-support-important-2017/ (Accessed on 14
October).
2. Boulos MN, Wheeler S, Tavares C, et al. How smartphones are changing the face of
mobile and participatory healthcare: an overview, with example from eCAALYX.
BioMed Eng Online 2011;10:24. doi:10.1186/1475-925X-10-24.
3. Vinay A, Shah MD, Hemang K, et al. Smartphones Visual Function testing. Retinal
physician 2015;12:37-71.
4. Bastawrous A, Rono HK, Livingstone IAT, et al. Development and Validation of a
Smartphone-Based Visual Acuity Test (Peek Acuity) for Clinical Practice and
Community-Based Fieldwork. JAMA Ophthalmol 2015;133(8):930–937.
doi:10.1001/jamaophthalmol.2015.1468.
5. De Venecia B, Bradfield Y, Trane RM, et al. Validation of Peek Acuity application in
Pediatric screening programs in Paraguay. Int J Ophthalmol 2018;11(8):1384-1389. doi:
10.18240/ijo.2018.08.21. eCollection 2018.

97
6. Habtamu E, Bastawrous A, Bolster NM, et al. Development and Validation of a
Smartphone-based Contrast Sensitivity Test. Transl Vis Sci Technol 2019;8(5):13.
doi:10.1167/tvst.8.5.13.
7. Zeri F, Calcatelli P, Funaro E, et al. How accurate is an LCD screen version of the
Pelli–Robson test?. Int Ophthalmol 2018;38(4):1473-1484. doi.org/10.1007/s10792-
017-0609-0.
8. Rono K, Bastawrous A, Macleod D, et al. Smartphone-based screening for visual impairment in
Kenyan school children: a cluster randomised controlled trial. The Lancet 2018;(8):924-932.
9. Brady CJ, Eghrari AO, Labrique AB. Smartphone-Based Visual Acuity Measurement
for Screening and Clinical Assessment. JAMA 2015;314(24):2682–2683.
doi:10.1001/jama.2015.15855.
10. Han X, Scheetz J, Keel S, et al. Development and Validation of a Smartphone-Based
Visual Acuity Test (Vision at Home). Transl Vis Sci Technol 2019;8(4):27.
doi:10.1167/tvst.8.4.27.
11. O'Neill S, McAndrew DJ. The validity of visual acuity assessment using mobile
technology devices in the primary care setting. Aust Fam Physician 2016;45(4):212–
215.
12. Pathipati AS, Wood EH, Lam CK, et al. Visual acuity measured with a smartphone app
is more accurate than Snellen testing by emergency department providers. Graefes Arch
Clin Exp Ophthalmol 2016;254(6):1175-1180. doi.org/10.1007/s00417-016-3291-4.
13. Rhiu S, Lee JH, Goo YS, et al. Visual Acuity Testing Using a Random Method
Visual Acuity Application. Telemed J E Health 2016;22(3):232-237.
doi.org/10.1089/tmj.2015.0073.
14. Kollbaum PS, Jansen ME, Kollbaum, EJ, et al. Validation of an ipad test of letter
contrast sensitivity. Optom Vis Sci 2014;91(3):291-296.
doi:10.1097/OPX.0000000000000158.
15. Rodríguez-Vallejo M, Remón L, Monsoriu JA, et al. Designing a new test for contrast sensitivity
function measurement with iPad. J Optom 2015;8(2):101-108. doi:10.1016/j.optom.2014.06.003.

98
16. Dorr M, Lesmes LA, Lu ZL, et al. Rapid and reliable assessment of the contrast sensitivity
function on an iPad. Invest Ophthalmol Vis Sci 2013;54(12):7266–7273. doi:10.1167/iovs.13-
11743.
17. Kingsnorth A, Drew T, Grewal B, et al. Mobile app Aston contrast sensitivity test. Clin
Exp Optom 2016;99(4):350–355. doi:10.1111/cxo.12362.
18. Perera C, Chakrabarti R, Islam FM, et al. The Eye Phone Study: reliability and accuracy
of assessing Snellen visual acuity using smartphone technology. Eye (Lond)
2015;29(7):888–894. doi:10.1038/eye.2015.60.
19. Tofigh S, Shortridge E, Elkeeb A, et al. Effectiveness of a smartphone application for
testing near visual acuity. Eye (Lond) 2015;29(11):1464–1468.
doi:10.1038/eye.2015.138.
20. Wozniak, et al. The effect of room illumination on visual acuity measurement.
Australian Orthoptic Journal, 1999;(34):3-8.
21. Zhang ZT, Zhang SC, Huang XG, et al. A pilot trial of the iPad tablet computer as a
portable device for visual acuity testing. J Telemed Telecare 2013;19(1):55-59. doi:
10.1177/1357633X12474964.
22. Stone D. What Is the Difference Between an iPhone & an iPad? Small Business -
Chron.com, (Online). Available: http://smallbusiness.chron.com/difference-between-
iphone-ipad-72690.html (Accessed 09 April 2019).
23. Livingstone IA, Tarbert CM, Giardini ME, et al. Photometric Compliance of Tablet
Screens and Retro-Illuminated Acuity Charts As Visual Acuity Measurement Devices.
PLoS One 2016;11(3):e0150676. doi:10.1371/journal.pone.0150676.
24. Cox MJ, Norman JH, Norman P. The effect of surround luminance on measurements of
contrast sensitivity. Ophthalmic Physiol Opt 1999;19(5):401–414. doi:10.1046/j.1475-
1313.1999.00457.x.
25. Khanna SG. Techniques and Automation in Eye Care and Vision Testing Using
Smartphone. International Journal of Ophthalmology & Visual Science 2017;2(4):88-
92. doi: 10.11648/j.ijovs.20170204.12.

99

100
Address correspondence to:
Therisha Moodley
Department of Optometry
Faculty of Health Sciences
University of Kwa-zulu Natal
South Africa
E-mail: [email protected]

101
Appendix 7:
Manuscript 2- Submitted to Journal of Ophthalmic Epidemiology
Comparability of selected iPhone optometric screening applications to equivalent
standard optometric tests for the assessment of visual acuity
Moodley, T1, Hansraj, R1 and Govender, P1
1Discipline of Optometry, University of KwaZulu-Natal, South Africa.
Address correspondence to:
Therisha Moodley
Shop 15, Richmond Corner. CNR Tygerberg valley and Plattekloff Road.
Milnerton
7441
E-mail: [email protected]
ABSTRACT
Introduction
Smart technology visual testing has become popular, especially smartphone visual acuity (VA) testing. This
innovative use of smart technology is being explored as a means to provide visual self-screenings as society
today has displayed a keen preference for taking care of their needs at their convenience. However, the
accuracy and reliability of these tests have not been fully established.
Aim
To determine if the Kay iSight Test Professional and the Pocket Eye Exam for the assessment of distance VA
are comparable to results produced by the standard Snellen VA test.
Method
A total of 113 participants were recruited using convenience sampling. The study employed a comparative
research design that compared the results of two smartphone apps, a paid and free app, to the Snellen chart.
The paid app was chosen with the assumption this test would be superior to a free app test. The standard VA
was taken first with the Snellen chart followed by the two smartphone apps, the presentation of which were
randomized. The results of all three tests were captured in 6m Snellen notation and the Wilcoxon Signed
ranked test was used to assess for any comparisons.
Results
The median DVA as determined by the Snellen test and both VA apps as being the same (0.63) for both the
right and left eyes. The higher the decimal value the better the DVA. The pass/ fail criteria showed a higher
overestimation rate by the free and paid apps when compared to the Standard Snellen chart. The Median and
IQR differences between both genders for the right and left eyes for all three tests were always <0.1 indicating

102
not even a 1-line difference in VA. Equally high sensitivity and specificity values were found for both the free
and paid apps.
Conclusion
The Kay iSight professional (paid) and Pocket Eye Exam (free) VA app testing, overall, showed promising
results as they produced results similar to the standard Snellen test and thus, with some modifications, could
be used for future VA screenings. However, due to the lack of literature more studies need to be done before
these devices can be used for home screenings or clinical use.
INTRODUCTION
Rapidly advancing technology has led to the healthcare landscapes of many nations undergoing a dramatic
change over the past few decades. The use of technology to deliver health care from a distance, more correctly
referred to as telemedicine (Alexander et al., 2011) has been demonstrated as an effective way of overcoming
certain barriers to the delivery of health care particularly in rural and remote areas (Scott et al., 2016).
Telemedicine for vision care has been growing and establishing itself as a changing entity in the eye care
industry. Both the optometric and ophthalmology fields have, to some extent, adopted the use of telemedicine
to offer their services to a larger consumer base. Closely linked to telemedicine, in the field of optometry,
smartphones and mobile applications (apps) allow individuals to perform vision screening tests on themselves
to determine if there is a need for further visual examination.
Visual acuity testing is the most commonly performed test in ophthalmic clinical practice and is by far the
most well-known screening app available on the Apple App store and Google Play store. Visual acuity refers
to the ability of the visual system to discern fine distinctions in the environment and is measured with printed
or projected visual stimuli. The presence of excellent VA tells the examiner that, most likely, the ocular media
are clear, the image is clearly focused on the retina, the afferent visual pathway is functioning, and the visual
cortex has appropriately interpreted signals received (Levenson et al., 1990). Therefore, the accurate
assessment of VA is important as it guides clinicians as to whether further investigations are required and can
quantify changes to vision over time (Han et al., 2019).
Visual acuity can be measured rapidly and inexpensively, with low-cost charts such as the Snellen VA chart,
Tumbling E chart and Early Treatment Diabetic Retinopathy Study (ETDRS) chart which are available
commercially, online for printing and increasingly in apps for mobile devices (Brady et al., 2015). Some of
the VA apps available are the Peek Acuity, Vision@home and Eye Chart Pro VA. These VA apps are mostly
screening tests and do not have diagnostic value. Smartphone visual testing allows individuals to perform
vision screening tests on themselves and provide feedback as to their visual status based on their VA and
whether further testing is required.
Reports from previous studies on smartphone VA testing appear divided as to whether it is accurate or not.
There are many studies (Bastawrous et al., 2015, Rono et al., 2018 and Han et al.,2019) that confirm this new
technology to produce accurate results which are comparable to the standard clinical VA tests but other studies
(Tofigh et al., 2015, Zhang et al.,2016 and De Venecia et al., 2018) assert that further validation is required
before these tests can be used for clinical purposes. In particular, there are certain areas of app testing such as
contrast ratio, optotype size, design, screen brightness and testing distance that needs to be further validated to
ensure these tests produce accurate and reliable results.

103
The medical community should not allow convenience and an affinity for new technology to trump the
responsibility to collect accurate clinical data. There could be adverse consequences of inaccurate app
performance, such as generating unreliable clinical data or displaying inappropriate information to patients
which could have dire consequences on patients’ visual well-being. The optometry industry has always been
subject to intense regulations to ensure that patients receive the best possible care with accurate diagnosis and
treatment. Smartphone-based optometry testing should be no different yet currently, there are limited published
studies on the accuracy and reliability of these apps. Thus, before smartphone apps can be used for home
screenings or clinical purposes they need to be validated for accuracy. This study therefore set out to determine
if the Kay iSight Test Professional, which is a paid app, and the Pocket Eye Exam, which is a free app for VA
screenings are producing results comparable to that produced by the standard Snellen VA test.
METHODOLOGY
A comparative research design was used to compare the VA measurements produced by the Kay iSight
professional app and the Pocket Eye Exam app to that recorded with the standard Snellen VA test. This study
was conducted at a private optometric practice. Convenience sampling was used to select 100 subjects aged
18 to 35 years, of any gender or race.
Data collection only commenced once relevant ethical clearance had been obtained from Biomedical Research
Ethics Committee of the University of KwaZulu-Natal (BE703/18) and consent was obtained by each
participant. The study adhered to the tenets of the Declaration of Helsinki. The distance VA of subjects was
first determined using a standard Snellen chart projected on a screen 3 meters (m) away from the subject. The
Snellen VA chart was chosen as this chart is the most widely available and allows easier display on projector
systems. The VA measurements were taken monocularly first and then binocularly on each subject. The results
were thereafter captured in 6m Snellen notation onto the data recording sheet.
After the full eye examination was completed, subjects were presented with the two smartphone apps to assess
VA. An Apple 64 GB, iPhone 6 Plus using IOS 9 was used as the smartphone device wherein both apps were
displayed. The Kay iSight Test Professional is an app that needs to be paid for before use and will hereon be
referred to as the paid app. The Pocket Eye Exam was available at no charge to the user and will hereon be
referred to as the free app. Both apps had a Snellen chart design but only the paid app results were in 6 m
Snellen notation. The free app results were in feet notation and had to be converted into Snellen notation. The
subject was not given any instructions on how the test is performed or what each test is testing. He/she had to
read the instructions given by the app and perform the test accordingly. The only instruction that was given to
the subject is that he/she must read the letters aloud. Once completed, the results were captured in 6 m Snellen
notation for easy comparison to the standard Snellen test. Both app tests were performed on the right eye and
the left eyes and then binocularly. Room lighting, screen brightness and test distance were controlled and
standardized for each test.
RESULTS
A total of 225 distance VA measurements (right eyes (n = 113)); left eyes (n = 112)) from 113 participants
were obtained using the standard 6m Snellen VA chart and smartphone apps. As the data was not normally
distributed it was more accurate to review the medians as the measure of central tendency when making group
comparisons.
Table 1 shows the median DVA in decimal notation as determined by the Snellen test and both VA apps as
being the same (0.63) for both the right and left eyes. The higher the decimal value the better the DVA. Even
104
though the median was consistently 0.63 with all tests, the IQR for the free app (RE: 0.25; 1.00; and LE: 0.32;
1.00) and paid app (LE: 0.25; 1.00)) were slightly higher than the Snellen lower IQR.
As the data was not normally distributed the Wilcoxon signed ranked test was used to test for statistical
significance for the differences in the DVAs obtained with the Snellen chart compared to both apps. It was
found that the differences between the Snellen test and either app, irrespective of the eye, were statistically
significant (p values <0.01). However, when the difference in IQR between the right eye measurements
obtained with the Snellen chart compared to the free and paid app values, the IQR difference was always less
than 0.1 decimal notation which would have indicated not more than a one-line difference in DVA. This was
the same for the left eyes as well. This indicates no clinically significant differences in DVAs between the
standard test and either app.
Table 2 showed females showed a constant median of 0.63 for the standard test as well as the two smartphone
tests except for the median of the Left eye paid app which was slightly higher (1.00). Males also had a constant
left eye median of 0.63 for the standard test and the free and paid apps, whereas the right eye paid and free app
tends to have a higher median than the standard Snellen VA. Males had a lower median than females in the
right eye for the standard test whereas both genders had the same median in the left eye. Females tend to have
a higher median in the left eye than males for the paid app and males showed a lower right eye median than
females for the free app. However, the median and IQR differences between both genders for the right and left
eyes for all three test formats were always <0.1 indicating not even a 1-line difference in Snellen VA, which
overall is not clinically significant.
Measurements for distance VA for all three tests were further categorized into a pass and fail (Table 3). A pass
was regarded as a VA score of 0.63 (equivalent to 6/9) or less. This passing criteria value of 6/9 was selected
because the minimum vision requirement for driving on South African roads is 6/9 hence, this is one of the
most common tasks that most people will need to engage in and often would use vision screeners to assess
their VA.
A higher percentage of subjects, when considering both right and left eyes, were able to pass the distance VA
test with the free app when compared to the Snellen chart and the paid app, resulting in a relatively higher
overestimation rate by the free app. The paid app was found to overestimate the number of participants, based
on the right eye readings, that passed the DVA testing compared to the Snellen chart however, the
overestimation was not as high as with the free app.
The free app showed higher sensitivity for the left eyes compared to the right eyes, while the specificity of the
right and left eyes was found to be almost the same. Slightly higher values of sensitivity and specificity were
found for the Paid App for the right and left eye (Table 4 a/b).
DISCUSSION
Visual acuity has traditionally been used as the primary indicator of the magnitude of functional impairment
due to vision loss (National Research Council., 2002). Visual acuity and the concept of 20/20 vision is well
known among most individuals when it comes to testing their vision and hence, if one had to experience blurry
or distorted vision the VA test will be the go-to test to be performed. Because this is the main test used to
screen their vision, it is important for any testing app to able to do this with a fair amount of accuracy as often
people may rely on the findings to make decisions on the need to seek further eye care or not.

105
The smartphone apps were found to provide very similar measurements for distance VA to the standard clinical
method when considering the median DVAs recorded. Furthermore, the sensitivity of both the free App and
paid App in the current study was greater than 75% irrespective of which eye was considered implying good
capability of the apps to provide accurate measurements in those patients with reduced DVA. The specificity
of both the free and paid Apps for DVA measurements was over 95% irrespective of which eye was considered,
implying the test could also accurately identify participants with good vision. These findings thus indicate that
these apps are able to detect visual impairment and therefore, are useful at the least for purposes of vision
screening for visual acuity. As no other study was found that reported the sensitivity and specificity of
smartphone applications for the assessment of distance visual acuity, no further comparisons could be made.
When considering the pass/fail criteria for DVAs however, the values obtained for either eye with the Snellen
chart was consistently lower than that measured by both the free and paid Apps, with the difference found to
be statistically significant. As a lower decimal notation value implies poorer DVA the implication is that both
apps overestimated DVA. A possible reason for the overestimation by the free app was the Snellen letters were
presented at larger scale increments. There were only 7 rows of VA measurements ranging from 6/60 to 6/6,
missing out on some important VA values and hence, possibly overestimating the VA measurements. The paid
app had smaller increments of VA values and had a total of 16 rows of letters ranging from 6/150 to 6/3.8
which could give a more accurate VA result. The developers of the free app could improve the accuracy of the
app by increasing the number of VA measurements.
Similar findings were reported by De Venecia et al. (2018) who found the Peek Acuity app (a smartphone VA
app) to overestimate the subject’s VA thereby giving the patient a measurement that did not warrant a follow-
up eye examination. Tofigh et al. (2015) attribute the overestimation of VA with smartphone apps to the
contrast ratio of the iPhone when compared to the standard test. Furthermore, the ETDRS reported the contrast
ratio of a clean printed Snellen or VA chart/card to be below 33:1, whereas an iPhone 5 has a contrast ratio of
1151:1 and was given as the reason for the discrepancy in near VA readings between a smartphone and a near
vision card (Tofigh et al., 2015). It is known that VA measurements can be enhanced by increasing the contrast
of the testing chart or screen (Sheddy et al., 1984). While the actual contrast differences between the Snellen
chart and the free and paid Apps, used in the current study were not measured, visibly there was a difference.
Moreover, while the contrast of the smartphone on which the apps were used can be varied, that of the Snellen
chart was fixed. The reliability and validity of VA measurements with smartphone apps thus can be enhanced
by the specification of the contrast and brightness level to be used with the app.
When assessing clinical measurements, it is important to consider clinically significant differences in addition
to statistically significant differences. In terms of DVA, even a one-line difference in VA can be considered
as clinically significant when considering certain visual tasks. For example, for a monocular patient to obtain
a code 8 driver’s license in South Africa a minimum of 6/9 (0.6 in decimal notation as it would appear on a
VA chart) Snellen VA in the functional eye is required in addition to other visual field requirements
(VisionOptometrist., 2018). One line poorer than this would be the 6/12 (0.5 in decimal notation) which is a
difference of 0.1. Thus a 0.1 difference in overestimation of VA produced by a screening app would have
passed the individual as having satisfied the legal VA for driving preventing them from having a further vision
assessment, when in actuality the individual may need glasses to safely drive on the roads. It must be noted
though that, in the current study, the difference was consistently less than 0.1, making the DVA measurements
produced by the apps not clinically significantly different than that obtained with the Snellen chart and thus
acceptable for the assessment of DVA.

106
There were a few aspects of this study that prevent widespread generalization of the findings. Convenience
sampling used to select participants in this study creates various biases including a gender bias towards females
in the current study. As the testing was done on an iPhone 6 plus the findings may not apply to all iPhones.
Different smartphone apps displayed their results in different notations which resulted in the researcher having
to find methods to convert the results into one notation that was the easiest to interpret and draw comparisons.
Furthermore, optotype sizes, contrast and testing distances were not consistent between all the apps. The
iPhone used was always set to maximum brightness and this might produce a glare effect in some participants
and a possible after-image. For the majority of participants in this study, this was their first encounter with
vision screening apps which could have resulted in them being anxious, second-guessing their answers and
wanting to provide “correct” answers to satisfy the examiner which could have potentially affected the results.
However, this study does provide useful information in an area in which research is currently limited.
CONCLUSION
Rapid advancements in the use of mobile technology to deliver health care is unprecedented. The use of
Smartphone apps can be used as an effective way of overcoming certain barriers to health care particularly in
rural and remote areas where access to Ophthalmic care is limited. Today, more than ever, people are also
relying on their smartphones to take care of all their needs with individuals increasingly taking an active
interest in personalized health care particularly motivated by convenience, affordability and accessibility.
There are numerous smartphone apps available on the iStore and Google play store, however, considering the
literature that was studied and the final results of this study, it is clear there need to be more studies done on
the accuracy of smartphone VA testing before it can be used optimally for either screening and/or clinical use.
DISCLOSURE STATEMENT
No competing financial interests exist.
REFERENCES
1. Alexander, V.O, Brooks, G.B., Farr, G.B., et al. Benefits of Telemedicine in Remote Communities
& Use of Mobile and Wireless Platforms in Healthcare. (2011) Researchgate, pp. 4-7. Available at:
https://www.researchgate.net/publication/265012703_Benefits_of_Telemedicine_in_Remote_Comm
unities_Use_of_Mobile_and_Wireless_Platforms_in_Healthcare/link/5539033c0cf2239f4e7b3584/d
ownload. Accessed online: 12 November 2018.
2. Bastawrous, A., Rono, H.K., Livingstone, I.A.T., et al. Development and Validation of a
Smartphone-Based Visual Acuity Test (Peek Acuity) for Clinical Practice and Community-Based
Fieldwork. (2015) JAMA Ophthalmol, 133(8): pp. 930–937.
doi:10.1001/jamaophthalmol.2015.1468.
3. Brady, C.J., Eghrari, A.O., Labrique, A.B. Smartphone-Based Visual Acuity Measurement for
Screening and Clinical Assessment. (2015) JAMA, 314(24): pp. 2682–2683.
doi:10.1001/jama.2015.15855.

107
4. De Venecia, B., Bradfield, Y., Trane, R.M., et al. Validation of Peek Acuity application in Pediatric
screening programs in Paraguay. (2018) Int J Ophthalmol, 11(8): pp. 1384-1389. doi:
10.18240/ijo.2018.08.21. eCollection 2018.
5. Han, X., Scheetz, J., Keel, S., et al. Development and Validation of a Smartphone-Based Visual
Acuity Test (Vision at Home). (2019) Transl Vis Sci Technol, 8(4): pp. 27. doi:10.1167/tvst.8.4.27.
6. Levenson, J.H., Kozarsky, A. Visual Acuity. In: Walker HK, Hall WD, Hurst JW, editors. Clinical
Methods: The History, Physical, and Laboratory Examinations. 3rd edition. (1990) Boston:
Butterworths; 1990. Chapter 115 pp. 563-564.
7. National Research Council (US) Committee on Disability Determination for Individuals with Visual
Impairments; Lennie P, Van Hemel SB, editors. Visual Impairments: Determining Eligibility for
Social Security Benefits. Washington (DC): National Academies Press (US); 2002. 2, TESTS OF
VISUAL FUNCTIONS. Available at: https://www.ncbi.nlm.nih.gov/books/NBK207559/.
(Accessed: 05 May 2020).
8. Rono, K., Bastawrous, A., Macleod, D., et al. Smartphone-based screening for visual impairment in
Kenyan school children: a cluster randomised controlled trial. (2018) The Lancet, 6(8): pp. 924-932.
doi.org/10.1016/S2214-109X(18)30244-4.
9. Scott, K.C., Karem, P., Shifflett, K., et al. Evaluating barriers to adopting telemedicine worldwide: A
systematic review. (2018) Journal of Telemedicine and Telecare, 24(1): pp. 4–12.
doi.org/10.1177/1357633X16674087.
10. Sheedy, J., Bailey, I.L., Raasch, T.W. Visual Acuity and Chart Luminance. (1984) American
Journal of Optometry and Physiological Optics, 61(9): pp. 595-600. Doi. 1097/00006324-
198409000-00010.
11. Tofigh, S., Shortridge, E., Elkeeb, A., et al. Effectiveness of a smartphone application for testing
near visual acuity. (2015) Eye (Lond), 29(11): pp. 1464–1468. doi:10.1038/eye.2015.138.
12. Vision Optometrists. Driver’s license screening at VISION. (2018) Available:
https://www.thevisioncompany.co.za/drivers-licence-screening-at-vision-2/. (Accessed: 06 April
2020).
13. Zhang, Z.T., Zhang, S.C., Huang, X.G., et al. A pilot trial of the iPad tablet computer as a portable
device for visual acuity testing. (2013) J Telemed Telecare, 19(1): pp. 55-59. doi:
10.1177/1357633X12474964.

108
Table and figures
Table 1. Showing the Median DVA with interquartile range (IQR) in decimal notation obtained with the
Snellen chart, free App (Pocket Eye Exam) and paid App (Kay iSight Test Professional)
Table 2: Showing the Median and IQR for distance VA in decimal notation according to gender.
Median (IQR)
Female Male
RE LE RE LE
Snellen
chart 0.63(0.20;1.00) 0.63(0.20;1.00) 0.50(0.18;0.80) 0.63(0.20;1.00)
Paid
app 0.63(0.32;1.00) 1.00(0.32; 1.00) 0.63(0.24;1.00) 0.63(0.29;1.00)
Free
app 0.63(0.20;1.00) 0.63(0.25;1.00) 0.57(0.20;0.80) 0.63(0.21;1.00
RIGHT EYES LEFT EYES
Median (IQR) Median (IQR)
Snellen Chart 0.63 (0.20; 1.00) 0.63 (0.20; 1.00)
Free App 0.63 (0.25; 1.00) 0.63 (0.32; 1.00)
Paid App 0.63 (0.20; 1.00) 0.63 (0.25; 1.00)

109
Table 3: Showing the frequency of pass and fail categorization of distance visual acuity obtained with the
Snellen chart, free and paid app.
RIGHT EYES LEFT EYES
PASS (n) (%) FAIL (n) (%) PASS (n) (%) FAIL (n) (%)
Snellen Chart 58 (51.3%) 55 (48.7%) 67 (59.3%) 45 (39.8%)
Free App 69 (61.1%) 44 (38.9%) 70 (61.9%) 42 (37.2%)
Paid App 63 (55.8%) 50 (44.2%) 67 (59.3%) 45 (39.8%)
Table 4a. Sensitivity and specificity of the Free
App in comparison to standard VA test.
Table 4b. Sensitivity and specificity of the
Paid App in comparison to standard VA test.
Snellen VA (Gold Std) Snellen VA (Gold Std)
True Pass True Fail True Pass True Fail
RE LE RE LE RE LE RE LE
Fre
e A
pp
Pass 42 39 2 3
Paid
Ap
p Pass 49 43 1 2
Fail 13 6 56 64 Fail 6 2 57 65
Total 55 45 58 67 Total 55 45 58 67
Sensitivity Specificity Sensitivity Specificity
76% 87% 97% 96% 89% 96% 98% 97%

110
Appendix 8:
Manuscript 3- Submitted to Indian Journal of Ophthalmology
Comparability of selected iPhone optometric screening applications to equivalent
standard optometric tests for the assessment of contrast sensitivity and astigmatism
ABSTRACT
Introduction
There has been an unprecedented spread in the use of mobile technology in the last decade including
the provision of health care services. The eye care industry has also adopted the use of these
innovative smart-technology devices to provide rapid, convenient and less time-consuming eye
screenings through the use of applications (apps). These apps allow you to assess a number of visual
function tests including CS and astigmatism. However, the accuracy and reliability of these tests have
not been fully established.
Aim
To determine if the Variable Contrast Sensitivity smartphone application (app) and the Smart
Optometry iPhone app produces results comparable to the standard Pelli-Robson test for the
assessment of contrast sensitivity. This study also aims to determine if the Eye Test (Paid) app and
Eye Meter (Free) app for the screening of the presence of astigmatism provides results that are
comparable to a standard clinical test.
Method
The study employed a comparative research design that compared the results of two smartphone CS
apps and two astigmatism apps to the standard Pelli-Robson and JCC tests, respectively. A total of
113 participants were recruited using convenience sampling. The results were analyzed using
frequencies, logistic regression and the Wilcoxon Signed ranked test.
Results
More participants passed the CS test with the smartphone apps as compared to the standard Pelli-
Robson test. Statistically significantly (p<0.001) lower percentages of participants were detected as
having astigmatism by both smartphone apps when compared to standard clinical testing.
Conclusion
Both the smartphone apps overestimated the results and both astigmatism apps significantly
underestimated the number of participants with astigmatism. These apps therefore did not provide
comparatively accurate results to the standard clinical tests therefore further development and
investigation is necessary before these apps can be used as screening and/or diagnostic tools.

111
INTRODUCTION
With the unprecedented widespread use of mobile technologies, as well as advancements in their
innovative applications (apps), people are now able to use smartphones, Liquid Crystal Display
(LCD) computers, iPads and other digital devices to perform health screenings on themselves. In
today’s society individuals prefer to take care of their needs at their own convenience hence resulting
in the self-service industry, aided by the aforementioned devices, growing by 81% in the last few
years1 with an expansion into the health care arena including optometry. In the field of optometry,
smartphones and mobile apps give individuals the opportunity to perform vision screening tests on
themselves. Moreover, these apps provide results to the patient about their visual status, as well as
feedback as to whether a full comprehensive eye examination with a registered optometrist is
recommended.
Contrast sensitivity (CS) is one area of visual function testing that is available on smartphone apps.
Contrast sensitivity is the ability to detect subtle differences in shading and patterns and is important
in detecting objects without clear outlines and discriminating objects or details from their
background2. In clinical practice CS testing can be performed using the Functional Acuity Contrast
Test (FACT), Lea Symbols, MARS letter CS, low-contrast ETDRS chart and most commonly with
the Pelli-Robson chart. With smartphone app testing the Pelli-Robson chart design is most frequently
used.
Contrast sensitivity testing often is not performed routinely in an optometric examination because of
the time required to perform the test and specialist equipment required3 yet it is of great clinical value.
Cataracts are the leading cause of preventable blindness worldwide4. Unfortunately, patients only
present when they encounter a reduction in their visual acuity (VA). However, in these patients, a
decrease in CS may be experienced even before a reduction in VA5. Moreover, CS is a sensitive
measure of visual defects in glaucoma which is one of the leading causes of blindness globally6 and
is able to discriminate the severity of diabetic retinopathy and cataracts7 Other than for the detection
of ocular disease, research has shown that reduced CS may also impact on visual comfort during daily
tasks like reading, watching television or night driving8. In the elderly, poor CS also can increase
your risk of a fall if you fail to see that you need to step down from an unmarked curb and steps9.
Access therefore, to a simple and fast app that can screen for this aspect of vision would be very
valuable particularly in directing individuals to seek professional care before irreversible damage
occurs. However, despite the usefulness of these CS tests using smart technology, it is important that
these screening devices provide accurate results as there is a risk of potential misdiagnosis of sight
threating eye conditions. The literature that was reviewed revealed positive results for the accuracy
of smart-technology CS testing as the majority of the studies10,11,12,13 reported this form of CS testing
to produce accurate and reliable results which were equally comparable to standard CS tests. However
only one of these studies by7 were conducted on a smartphone app.
Another visual aspect that has been the focus of smart-technology apps is astigmatism. Astigmatism
is a type of refractive error caused by the variations in the curvature of the ocular media thus the
principal focal lines do not produce a point focus of light from an object on the retina thereby leading
to blurred or distorted vision. This reduction in vision though may not be easily detected during visual

112
tasks but may present with other symptoms such as eye strain, headaches, squinting and eye irritation8
which impact on visual comfort rather. In routine eye examinations astigmatism is determined using
the Jackson cross cylinder (JCC) test when performing a subjective refraction. Smartphone
astigmatism screening apps have been observed to generally employ a fan and block chart. After an
extensive search of the literature it was noted that there are currently no published studies on
smartphone astigmatism testing.
Paucity of studies in areas of both CS and astigmatism may be due to this area not being frequently
investigated as most smart-technology studies are usually done on visual acuity (VA) testing. If these
apps are to be used for visual screenings it is imperative that this technology be fully investigated and
validated before it can be used for home screenings or clinical use.
This study therefore set out to determine if the Variable Contrast Sensitivity app and Smart Optometry
iPhone app for CS testing produced results comparable to those of the standard Pelli-Robson test
when assessing CS. Furthermore, the results produced by the Eye Test and Eye Meter app for
astigmatism screening were compared to that obtained with the standard JCC test. This study will
also report on the usefulness of smartphone apps for vision screening and recommend ways in which
this technology can be improved for optimal use.
METHODOLOGY
Ethical clearance for this study was obtained prior to data collection and the study adhered to the
tenets of the Declaration of Helsinki. Data was collected at a private optometric practice on a total
of 100 subjects. Healthy individuals aged 18 to 35 years, of any gender and any ethnic group were
selected using convenience sampling.
Contrast sensitivity assessment was achieved by the smartphone app “Variable CS test” which can
only be downloaded once paid for, therefore it is hereon referred to as the Paid CS App while the
Smart Optometry which was available at no cost, is hereon referred to as the Free CS App. The paid
app was chosen with the assumption this test would be superior to a free app test. Both these apps
were compared to the results obtained with the standard Pelli-Robson clinical test.
For the detection of astigmatism, the Eye Test app which had to be paid for and is thus hereon referred
to the Paid Astig App was used, as well as the Eye Meter which was freely available and therefore
hereon referred to as the Free Astig App. Again, the paid app was chosen with the assumption this
test would be superior to a free app test. The results of these two apps were compared to the clinical
measurement obtained with the standard JCC test.
All participants initially underwent a complete optometric examination including the assessment of
CS with the Pelli Robson test and astigmatism with the JCC test. The Pelli-Robson test was used to
assess CS at distance. The chart was placed approximately 1m from the participant. The chart consists
of capital letters arranged horizontally which decrease in contrast with each subsequent line. The
participant was assigned a score (the participant’s Log CS) based on the contrast of the last group in
which two or three letters were read correctly. The LogCS score was then matched using Table i
below to get a corresponding contrast value. The contrast value was than multiplied by 100 to get a

113
percentage. It was necessary to convert the Pelli-Robson LogCS score to percentage because both the
paid and free app tests results were given as a percentage contrast.
A LogCS score of 2.0 indicates normal CS of 100 percent, a score of 1.5 is consistent with visual
impairment thus a score of less than 1.65 was regarded as a fail14,15. As both smartphone apps tests
were used as a screening device, it was decided to represent the results as a pass/fail criteria.
The JCC test was performed using a fused cross cylinder and a standard procedure. An astigmatism
value of 0.50D, was regarded as being clinically significant and confirming the presence of
astigmatism. Both tests were done monocularly and readings obtained for both the right and left eyes
of each subject.
After the full eye examination was completed, subjects were presented with the four smartphone apps
to assess CS and astigmatism. An Apple 64 GB, iPhone 6 plus using IOS 9 was used as the
smartphone device wherein both apps were displayed. The subject was not given any instructions on
how the test is performed or what each test is testing. He/she had to read the instructions given by the
app and perform the test accordingly. The only instruction that were given to the subject is that he/she
must read the letters aloud. The app tests were performed on the right eye and the left eyes and then
binocularly. Room lighting, screen brightness and test distance were controlled and standardized for
each test.
Both the Paid CS and Free CS app used a Pelli-Robson test design, however the results were displayed
in a percentage notation and had to be converted into LogCS using Table 1. Both astigmatism apps
had a fan and block chart design and the results were displayed as either pass or fail.
RESULTS
CONTRAST SENSITIVITY
More participants, for both the right and left eyes, passed the CS test with the Free and Paid CS Apps
as compared to the standard Pelli-Robson clinical test (Table ii). A pass in this study was regarded
as a contrast score of 1.65 and better15. Any value less than this was regarded as a fail. When the apps
were compared to each other, more participants passed with the Paid CS App than the Free CS App.
Logistic regression analysis found there to be statistically significant differences. The Free CS App
compared more closely to the standard Pelli- Robson (p<0.001) test result than the Paid CS App
(p=0.345) which tended to overestimate the CS results for both the right and left eye when compared
to the Pelli-Robson chart results. All three tests, for both the right and left eyes, produced statistically
significantly different CS ratings (p values <0.01) as per the logistic regression analysis.
When stratified according to gender the same trend of the Free CS App results comparing more
closely to the Pelli-Robson clinical test results was noted for both females and males. When
considering the results for the right eyes, a much larger percentage of males (90.9%) passed CS testing
with the Paid CS App than females (82.6%), with similar findings for the left eyes (Table iii).
The free app showed much higher specificity than sensitivity when screening for contrast sensitivity,
in relation to the Pelli-Robson chart, for both the right and left eyes (Table iva).

114
The sensitivity of the Paid App for both the right and left eyes (Table ivb), in relation to the Pelli-
Robson chart was much lower than its specificity as well as, lower than the sensitivity of the Free
App. However, the Paid App had very high specificity values for both the right and left eye.
ASTIGMATISM
More than half of the participants had at least 0.50D of astigmatism in the right (59.3%) and left
(61.1%) eyes as determined with the standard JCC test. Statistically significantly (p<0.001) lower
percentages of participants, as determined by the chi squared test, were detected as having
astigmatism by both the Free and the Paid Apps for astigmatism (Table V).
While both the Free and the Paid Astig Apps underestimated the number of participants having
astigmatism when compared to the JCC test, for both the right and left eyes, the Free Astig App
appeared to miss more of the astigmatism than the Paid Astig App.
When the results were further stratified according to gender, similar results were noted. In
comparison to the JCC test, both apps underestimated the number of females and males that presented
with astigmatism (Table VI). Again, the results provided by the Paid Astig App was a little closer to
that of the JCC test in both genders, compared to the Free Astig App.
The specificity of the Free App in the right eye was low (45%) (Table VIIa) however, the left eye had
a high sensitivity. A 45% specificity of the right eye indicated this test was not good at identifying
those participants with no astigmatism.
With the Paid App, the right eye had an equally high sensitivity and specificity (Table VIIb). The left
eye had a very low sensitivity (36%) indicating this test is not adequate in identifying individuals
with astigmatism.
DISCUSSION
The assessment of CS better characterizes functional vision than high contrast VA alone and
subsequently has been used effectively as a tool to identify aspects of visual function in conditions
such as diabetes, glaucoma and macular degeneration 16,17. Despite its usefulness, CSF testing in a
clinical setting is rarely done due to the time and specialist equipment required. Astigmatism is also
another refractive condition with severe visual implications like blurred, distorted vision and eye
strain. If left untreated if can have severe impact on visual comfort and ultimately daily functioning
of an individual. Smartphone technology offers the potential for decreased CS and the presence of
astigmatism to be easily screened for by the individual themselves, and thereafter seek further care if
required.
More participants, for both the right and left eyes passed the CS testing with the Free and Paid CS
Apps as compared to the standard Pelli-Robson clinical test indicating a high overestimation rate by
the apps. This ties in with both the paid and free apps having low sensitivity values implying that
some subjects who had reduced CS were missed by the apps. Logistic regression analysis found there
to be statistically significant differences between the clinical test and the smartphone apps and the
differences may be related to the difference in chart generation i.e. one being printed and the other
two, computer generated. The Free and Paid CS Apps both used the same Pelli-Robson design as the

115
standard clinical test, however, the Free CS App consisted of eight rows of letters and six capital
letters per line. The most noticeable difference between the standard Pelli-Robson test and the Free
App was the lack of spacing between the couplets. The white LCD background was also quite bright
for some participants which could have possibly affected the results. The top letters of the chart where
of high contrast letters and they reduced in contrast towards the bottom. The user was asked to tap
and call out the faintest letter that was visible. The letters in the Free CS App were randomized so
when the participants were selecting the last visible letter there could not have been a chance of
memorization. On the other hand, the Paid CS App had five constant letters reducing in contrast from
100% to 1.25% so there was a chance the participant could have memorized the letters and recalled
the same letters for finer contrast even though the letters may not have been visible to them. This
could have resulted in the Paid CS App passing more participants and overestimating the number of
users passing this test. A possible suggestion therefore to the developers of this app is to randomize
the presentation of letters at each contrast level to prevent memorization, with an alternative being to
start with 0% contrast and increase the contrast level until px is able to identify the letters correctly.
This may produce more accurate results from the Paid CS App.
A similar trend was noted by18 who found that a computer LCD Pelli- Robson test overestimated the
CS significantly, irrespective of eye used, when compared to a printed Pelli–Robson clinical chart
used at both 1 and at 3 m (p < 0.01). They therefore concluded that computer-generated versions of
the Pelli–Robson chart did not provide accurate results when compared to printed version of the Pelli–
Robson printed chart.
The Free CS App, for both the right and left eyes, demonstrated relatively higher specificity than
sensitivity values. This suggests that the Free CS App was better at detecting individuals with normal
CS than with reduced CS. The Paid CS App on the other hand, while demonstrating good specificity
showed very low sensitivity of less than 50% implying that this app was not useful in identifying
users with poor CS often passing these individuals. These findings of sensitivity and specificity
however, have to be considered in relation to the sample size and in this case have to be interpreted
with caution.
While more than half of the participants were found to have at least 0.50D of astigmatism in either
eye with clinical JCC testing, a significant percentage of participants having astigmatism were missed
by both the Free and the Paid Astig Apps indicating a high underestimation rate with the apps. Both
apps were therefore appeared to be ineffective in detecting astigmatism.
The JCC test involves a detailed procedure in determining the amount of astigmatism. It comprises
of several steps to determine firstly the axis of the astigmatism, as well as the cylindrical power.
These steps ensure that the final cylinder power is an accurate representation of the astigmatism the
patient has. Both the Free and Paid Astig Apps utilized a ‘Fan and Block’ astigmatism wheel which
merely screens for the presence of astigmatism. The fan-and-block technique is less utilized in
practice nowadays19 because it is less sensitive at determining small cylinders and a person with a
head tilt will not give accurate results. Thus, this test was found to not be sensitive for detecting small
cylinders with both apps have been passing those users as not having any astigmatism when there
was a possibility of them having small degree of astigmatism.

116
The detection and correction of even small amounts of astigmatism is important as it is a condition
in which the eye does not focus images appropriately, however it may not always result in a
significant decrease in vision unlike in the case of spherical refractive errors. For this reason, it may
prevent a person from considering or seeking an eye test. Yet, in addition to blurred vision, other
debilitating symptoms such as eye stress or strain, squinting, poor night vision, eye irritation,
headaches, fatigue and difficulty focusing while reading may occur with astigmatism20. Furthermore,
astigmatism is reported as having a major effect on the common daily task of night driving with
problems like glare from the headlights of oncoming cars or halos around streetlights being attributed
to some degree of uncorrected astigmatism21. The implication of this can be on the confidence of
individuals when engaging in night driving and subsequently on road safety impacting themselves
and other road users. Hence, while it is not necessary that screening apps be able to quantify
accurately the amount of astigmatism, it is valuable for these screening tests to be able to at minimum,
detect the presence of astigmatism so that necessary interventions are made.
For the right eyes, the Paid Astig App showed good sensitivity (98%) but fair specificity (70%)
implying that while it may have been able to correctly detect those that had astigmatism, it was not
as good in correctly identifying those that did not have astigmatism. In the left eyes, the Free Astig
App showed a high sensitivity result indicating this test maybe useful in identifying astigmatism. As
no other study was found that assessed the screening for astigmatism using smartphone apps or any
other method other than clinical testing, no further comparisons can be made.
In the study there were certain limitations that could have potentially affected the outcome of the
results of the study. Convenience sampling was used to select the 313 participants in this study. This
sampling method creates various biases including a gender bias towards females in the current study.
The findings from this study only hold true for the two apps tested on the iPhone 6 plus and may not
be generalized to all iPhone. Different smartphone apps displayed their results in different notations
which thus required the researcher to find methods to convert the results into one notation that was
the easiest to interpret and draw comparisons. The Optotype sizes, contrast and testing distances
were not consistent between all the apps which could have potentially affected the outcome of the
results. The iPhone used was always set to maximum brightness and this might produce a glare effect
in some participants and a possible after-image. For the majority of participants in this study this was
their first encounter with vision screening apps which could have resulted in them being anxious and
second guessing their answers on the app. Dishonesty of participants when completing the standard
test or smartphone app could also be considered a limitation.
CONCLUSION
Due to the unprecedented popularity of smartphone vision testing and the potential it has to possibly
aid in reducing visual impairment it is essential that all apps utilized are fully investigated. However,
from this study finds the need for further development and modification in the selected apps for both
the CS and Astigmatism. Both the free and paid CS apps overestimated the results and the
astigmatism app testing significantly underestimating the number of participants with astigmatism.
Therefore, as a start, in order for all four smartphone apps to be considered for use in vision
screenings, developers are required to relook at the tests where proper calibration on contrast,

117
brightness, design and sizing needs to be further investigated. Even though the use of this technology
has become popularized, more insight is required into the reliability of these tests which have the
potential for increasing access to vision screening and subsequently seeking eye care timeously, for
many.
DISCLOSURE STATEMENT
No competing financial interests exist.
REFERENCES
1. Malik, D. What is self-service support and why is it so important in 2017?. 2016. (Online).
Available: https://lab.getapp.com/self-service-support-important-2017/ (Accessed on 14
October).
2. Alia A, Alghwiri PT, Susan L et al. 2012. Balance and fall. Geriatric Physical Therapy.
Science Direct, 18(3): pp. 331-353. https://doi.org/10.1016/B978-0-323-02948-3.00027-
4.
3. All about Vision.com. 2018. Eye-Related Apps. (Online). Available:
https://www.allaboutvision.com/apps/ (Accessed 17 September 2018).
4. Lee C and Afshari N. 2016. The global state of cataract blindness. Current opinion in
ophthalmology. 28. 10.1097/ICU.0000000000000340.
5. Arden GB. (1978). The importance of measuring contrast sensitivity in cases of visual
disturbance. The British journal of ophthalmology, 62(4): pp. 198–209.
https://doi.org/10.1136/bjo.62.4.198.
6. WHO. 2004. Glaucoma is second leading cause of blindness globally. Accessed on 07
April 2020. Online: https://www.who.int/bulletin/volumes/82/11/feature1104/en/.
7. Habtamu E, Bastawrous A, Bolster NM, et al. 2019. Development and Validation of a
Smartphone-based Contrast Sensitivity Test. Transl Vis Sci Technol, 8(5): pp. 13.
doi:10.1167/tvst.8.5.13.
8. Heiting. G. 2018. What is astigmatism?. All about vision. Accessed on 07 April 2020.
Online: https://www.allaboutvision.com/conditions/astigmatism.htm.
9. Katz EZ, Bothwell R. 2019. Working with elders that have visual impairment.
Occupational therapy with elders. Science direct, 4(15): pp. 217-233.

118
10. Kollbaum PS, Jansen ME, Kollbaum, EJ, et al. 2014. Validation of an ipad test of letter
contrast sensitivity. Optom Vis Sci, 91(3): pp. 291-296.
doi:10.1097/OPX.0000000000000158.
11. Rodríguez-Vallejo M, Remón L, Monsoriu JA, et al. 2015. Designing a new test for
contrast sensitivity function measurement with iPad. J Optom, 8(2): pp. 101-108.
doi:10.1016/j.optom.2014.06.003.
12. Dorr M, Lesmes LA, Lu ZL, et al. 2013. Rapid and reliable assessment of the contrast
sensitivity function on an iPad. Invest Ophthalmol Vis Sci, 54(12): pp. 7266–7273.
doi:10.1167/iovs.13-11743.
13. Kingsnorth A, Drew T, Grewal B, et al. 2016. Mobile app Aston contrast sensitivity test.
Clin Exp Optom, 99(4): pp. 350–355. doi:10.1111/cxo.12362.
14. Parede TR, Torricelli AA, Mukai A, et al. 2013. Quality of vision in refractive and
cataract surgery, indirect measurers: review article. Arq Bras Oftalmol, 76(6): pp. 386-
90. doi: 10.1590/s0004-27492013000600016. PMID: 24510091.
15. Aziz MAB. 2014. Contrast sensitivity, Clinical assessment of intra-ocular light scatter,
dark adaptation, recovery from glare (macular photo stress test). Health and medicine,
pp. 1-37. Accessed online: 03 April 2020.
16. Di Leo MAS, Caputo S, Falsini B et al. 1992. loss of contrast sensitivity in visual system
testing in early type I diabetes. Diabetes Care, 15(5): pp. 620-625.
17. Keane PA, Patel PJ, Ouyang Y. et al. 2010. Effects of retinal morphology on contrast
sensitivity and reading ability in neovascular age-related macular degeneration.
Investigative ophthalmology & visual science, 51(11): pp. 5431–5437.
doi:10.1167/iovs.09-4846.
18. Zeri F, Calcatelli P, Funaro E, et al. 2018. How accurate is an LCD screen version of
the Pelli–Robson test?. Int Ophthalmol, 38(4): pp. 1473-1484. doi.org/10.1007/s10792-
017-0609-0
19. Optician. 2014. C36211: Elements of refraction - part 4. Accessed on 07 April 2020,
online: https://www.opticianonline.net/cet-archive/13.
20. Campbell S. 2019. Effect of Astigmatism on Vision. Chron. Accessed online: 03 April
2020. Available: https://livehealthy.chron.com/effect-astigmatism-vision-7676.html.

119
21. Larson J. 2020. How Does Astigmatism Affect Your Night Vision. Healthline. Accessed
online: 03 April 2020. Available: https://www.healthline.com/health/astigmatism-lights.
TABLE AND FIGURES
Table i: Conversion from Log CS to Contrast percentage (The Mars Letter Contrast Sensitivity Test
user manual., 2003-2010)
Table ii: Showing the frequency of pass and fail categorization of contrast sensitivity determined with
the Pelli-Robson clinical test, Free CS App and Paid CS App.
Table iii: Showing the frequency of pass categorization for CS determined with the Pelli-Robson
clinical test, Free CS App and Paid CS App according to gender
PASS (%)
Female Male
RE LE RE LE
Pelli-Robson 60.9% 59.4% 63.6% 59.1%
Paid app 69.6% 66.7% 70.5% 70.5%
Free app 82.6% 79.7% 90.9% 88.6%
RIGHT EYES LEFT EYES
PASS (%) FAIL (%) PASS (%) FAIL (%)
Pelli-Robson test 61.9% 38.1% 59.3% 39.8%
Free CS app 69.0% 30.1% 68.1% 31.0%
Paid CS app 85.8% 14.2% 83.2% 15.9%

120
Table iva. Sensitivity and specificity of the
Free App in comparison to standard Pelli-
Robson test.
Table ivb. Sensitivity and specificity of
the Paid App in comparison to standard
Pelli-Robson test.
Pelli-Robson (Gold Std) Pelli-Robson (Gold Std)
True Pass True Fail True Pass True Fail
RE LE RE LE RE LE RE LE
Fre
e A
pp
Pass 68 66 11 11
Paid
Ap
p Pass 69 65 28 29
Fail 2 1 32 34 Fail 1 2 15 16
Total 70 67 43 45 Total 70 67 43 45
Sensitivity Specificity Sensitivity Specificity
74% 76% 97% 99% 35% 36% 99% 97%
Table V: Showing the frequency of participants with astigmatism and no astigmatism as determined
with the JCC test, Free Astig App and Paid Astig App
RIGHT EYES LEFT EYES
No Astigmatism
(%)
Astigmatism
(%)
No Astigmatism
(%)
Astigmatism
(%)
JCC test 46 (40.7%) 67 (59.3%) 43 (38.1%) 69 (61.1%)
Free Astig App 83 (73.5%) 30 (26.5%) 84 (74.3%) 28 (24.8%)
Paid Astig App 65 (57.5%) 48 (42.5%) 68 (60.2%) 44 (38.9%)
Table VI: Showing the frequency of participants with astigmatism and no astigmatism as determined
with the JCC test, Free Astig App and Paid Astig App classified according to gender
NO ASTIGMATISM (%) ASTIGMATISM (%)
Female Male Female Male
RE LE RE LE RE LE RE LE
JCC
TEST
43.5% 43.5% 36.4% 29.5% 56.5% 56.5% 63.6% 68.2%
PAID
ASTIG
76.8% 75.4% 68.2% 72.7% 23.2% 24.6% 31.8% 25.0%

121
Table VIIa. Sensitivity and specificity of
the Free App in comparison to standard JCC
test.
Table VIIb. Sensitivity and specificity of
the Paid App in comparison to standard
JCC test.
JCC test JCC test
True Pass True Fail True Pass True Fail
RE LE RE LE RE LE RE LE
Fre
e A
pp
Pass 30 28 0 0
Paid
Ap
p Pass 45 25 20 43
Fail 37 41 39 43 Fail 1 44 47 0
Total 67 69 39 43 Total 46 69 67 43
Sensitivity Specificity Sensitivity Specificity
unde
fined
88% 45% unde
fined
98% 36% 70% unde
fine
d
APP
FREE
ASTIG
APP
63.8% 63.8% 47.7% 54.5% 36.2% 36.2% 52.3% 43.2%