Isotope tracing enhancement of chemiluminescence assays for nitric oxide research
25
Biol Chem. 2009; 390(2): 181-9 Published online 2007 March 8. Doi: http://dx.doi.org/10.1515/BC.2009.017 BiologicalChemistry’JustAccepted’Papers Biological Chemistry ’Just Accepted’ Papers are papers published online, in advance of appearing in the print journal. They have been peer-reviewed, accepted and are online published in manuscript form, but have not been copy edited, typeset, or proofread. Copy editing may lead to small differences between the Just Accepted version and the final version. There may also be differences in the quality of the graphics. When papers do appear in print, they will be removed from this feature and grouped with other papers in an issue. Biol Chem ’Just Accepted’ Papers are citable; the online publication date is indicated on the Table of Contents page, and the article's Digital Object Identifier (DOI), a unique identifier for intellectual property in the digital environment (e.g., 10.1515/BC.2007.052), is shown at the top margin of the title page. Once an article is published as Biol Chem ’Just Accepted’ Paper (and before it is published in its final form), it should be cited in other articles as follows: Kusuhara, K., Madsen, K., Jensen, L., Hellsten, Y. and Pilegaard, H., Calcium signaling in regulating PGC-1�, PDK4 and HKII mRNA expression. Biol Chem, electronic publication on March 8, 2007, DOI 10.1515/BC.2007.052. After a paper is published in Biol Chem ’Just Accepted’ Paper form, it proceeds through the normal production process, which includes copy editing, typesetting and proofreading. The edit ed paper is then published in its final form in a regular print and online issue of Biol Chem. At this time, the Biol Chem ’Just Accepted’ Paper version is replaced on the journal Web site by the final version of the paper with the same DOI as the Biol Chem ’Just Accepted’ Paper version. Disclaimer Biol Chem ’Just Accepted’ Papers have undergone the complete peer-review process. However, none of the additional editorial preparation, which includes copy editing, typesetting and proofreading, has been performed. Therefore, there may be errors in articles published as Biol Chem ’Just Accepted’ Papers that will be corrected in the final print and online version of the Journal. Any use of these articles is subject to the explicit understanding that the papers have not yet gone through the full quality control process prior to advanced publication.
Transcript of Isotope tracing enhancement of chemiluminescence assays for nitric oxide research

Isotope tracting for NO chemiluminescence assays
Biol Chem. 2009; 390(2): 181-9
Published online 2007 March 8. Doi: http://dx.doi.org/10.1515/BC.2009.017
Biological Chemistry ’Just Accepted’ Papers
Biological Chemistry ’Just Accepted’ Papers are papers published online, in
advance of appearing in the print journal. They have been peer-reviewed, accepted
and are online published in manuscript form, but have not been copy edited, typeset,
or proofread. Copy editing may lead to small differences between the Just Accepted version and the final version. There may also be differences in the quality of the
graphics. When papers do appear in print, they will be removed from this feature and
grouped with other papers in an issue.
Biol Chem ’Just Accepted’ Papers are citable; the online publication date is
indicated on the Table of Contents page, and the article's Digital Object Identifier
(DOI), a unique identifier for intellectual property in the digital environment (e.g.,
10.1515/BC.2007.052), is shown at the top margin of the title page. Once an article is
published as Biol Chem ’Just Accepted’ Paper (and before it is published in its final
form), it should be cited in other articles as follows:
Kusuhara, K., Madsen, K., Jensen, L., Hellsten, Y. and Pilegaard,
H., Calcium signaling in regulating PGC-1�, PDK4 and HKII mRNA expression. Biol Chem, electronic publication on March
8, 2007, DOI 10.1515/BC.2007.052.
After a paper is published in Biol Chem ’Just Accepted’ Paper form, it proceeds
through the normal production process, which includes copy editing, typesetting and
proofreading. The edited paper is then published in its final form in a regular print and
online issue of Biol Chem. At this time, the Biol Chem ’Just Accepted’ Paper version is replaced on the journal Web site by the final version of the paper with the
same DOI as the Biol Chem ’Just Accepted’ Paper version.
Disclaimer
Biol Chem ’Just Accepted’ Papers have undergone the complete peer-review
process. However, none of the additional editorial preparation, which includes copy
editing, typesetting and proofreading, has been performed. Therefore, there may be
errors in articles published as Biol Chem ’Just Accepted’ Papers that will be
corrected in the final print and online version of the Journal. Any use of these articles
is subject to the explicit understanding that the papers have not yet gone through the
full quality control process prior to advanced publication.

Isotope tracting for NO chemiluminescence assays
Biological Chemistry ʻJust Accepted’ paper = ISSN (online) 1437-4315
D O I: 10.1515/BC.2009.017
Isotope tracing enhancement of chemiluminescence assays for nitric oxide
research
Julia Cornelius1,a, Tuan Tran1,a, Nicole Turner1,a, Abigail Piazza1,a, Lauren Mills1,a, Ryan
Slack1,a, Sean Hauser1, J. Steven Alexander2, Matthew B. Grisham2, Martin Feelisch3 and Juan
Rodriguez1,2,*
1Centenary College of Louisiana, Department of Physics, Shreveport, LA 71134, USA
2Louisiana State University Health Sciences Center, Department of Molecular and Cellular
Physiology, Shreveport, LA 71130, USA
3Clinical Sciences Research Institute, Warwick Medical School, University of Warwick,
Coventry CV4 7AL, UK
*Corresponding author
e-mail: [email protected]
aThese authors contributed equally to this work.
Isotope tracting for NO chemiluminescence assays
2
2
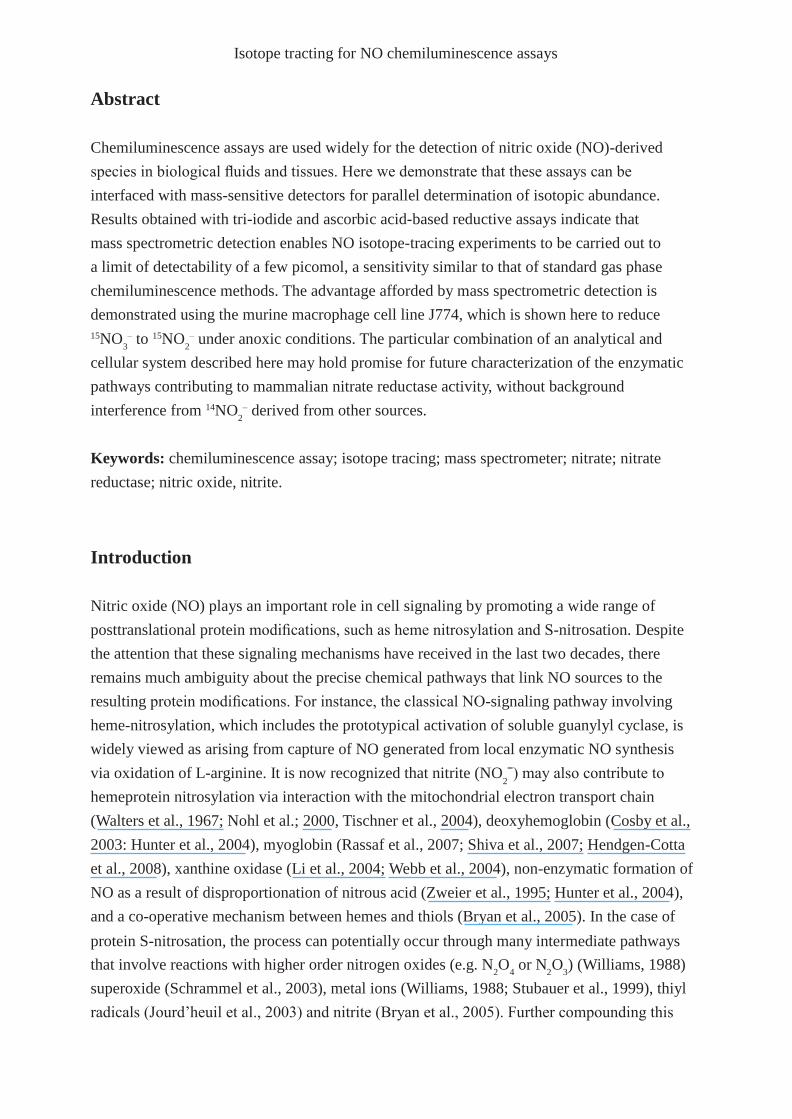
Abstract Chemiluminescence assays are used widely for the detection of nitric oxide (NO)-derived
species in biological fluids and tissues. Here we demonstrate that these assays can be
interfaced with mass-sensitive detectors for parallel determination of isotopic abundance.
Results obtained with tri-iodide and ascorbic acid-based reductive assays indicate that
mass spectrometric detection enables NO isotope-tracing experiments to be carried out to
a limit of detectability of a few picomol, a sensitivity similar to that of standard gas phase
chemiluminescence methods. The advantage afforded by mass spectrometric detection is
demonstrated using the murine macrophage cell line J774, which is shown here to reduce
15NO – to 15NO – under anoxic conditions. The particular combination of an analytical and 3 2
cellular system described here may hold promise for future characterization of the enzymatic
pathways contributing to mammalian nitrate reductase activity, without background
interference from 14NO – derived from other sources.
Keywords: chemiluminescence assay; isotope tracing; mass spectrometer; nitrate; nitrate
reductase; nitric oxide, nitrite.
Introduction Nitric oxide (NO) plays an important role in cell signaling by promoting a wide range of
posttranslational protein modifications, such as heme nitrosylation and S-nitrosation. Despite
the attention that these signaling mechanisms have received in the last two decades, there
remains much ambiguity about the precise chemical pathways that link NO sources to the
resulting protein modifications. For instance, the classical NO-signaling pathway involving
heme-nitrosylation, which includes the prototypical activation of soluble guanylyl cyclase, is
widely viewed as arising from capture of NO generated from local enzymatic NO synthesis
via oxidation of L-arginine. It is now recognized that nitrite (NO ˉ) may also contribute to
hemeprotein nitrosylation via interaction with the mitochondrial electron transport chain
(Walters et al., 1967; Nohl et al.; 2000, Tischner et al., 2004), deoxyhemoglobin (Cosby et al.,
2003: Hunter et al., 2004), myoglobin (Rassaf et al., 2007; Shiva et al., 2007; Hendgen-Cotta
et al., 2008), xanthine oxidase (Li et al., 2004; Webb et al., 2004), non-enzymatic formation of
NO as a result of disproportionation of nitrous acid (Zweier et al., 1995; Hunter et al., 2004),
and a co-operative mechanism between hemes and thiols (Bryan et al., 2005). In the case of
protein S-nitrosation, the process can potentially occur through many intermediate pathways
that involve reactions with higher order nitrogen oxides (e.g. N O or N O ) (Williams, 1988) 2 4 2 3
superoxide (Schrammel et al., 2003), metal ions (Williams, 1988; Stubauer et al., 1999), thiyl
radicals (Jourd’heuil et al., 2003) and nitrite (Bryan et al., 2005). Further compounding this

Isotope tracting for NO chemiluminescence assays
complexity, the chemical pathways connecting NO sources to potential protein modifications
are critically dependent on intracellular conditions (e.g. oxygen tension, pH, redox state), on
the presence of hydrophobic regions in proximity to NO sources (Liu et al., 1998), and on the
nature of the protein microenvironment around the thiol group (Stamler et al., 1997; Ascenzi
et al., 2000). The multiplicity of potential pathways is thus leading to a growing realization
that much work remains to be done before the role NO plays in cellular function can be fully
characterized. Attaining this level of understanding will require a combination of analytical
tools that not only are capable of detecting biologically relevant levels of NO-related products,
but also able to trace their chemical origin through isotopic differentiation.
A common approach for the detection of biologically generated NO species is the NO
chemiluminescence assay. This approach relies on the extraction of NO from selective species,
either chemically or optically, and their subsequent detection with an NO chemiluminescence
detector where trace levels of NO are detected in the gas phase through its chemiluminescent
reaction with ozone (Fontijn, 1970). When coupled to the gas efflux from purge vessels
containing reducing/oxidizing solutions or from UV irradiated capillaries, this detector can
quantify NO products, including nitrite and nitrate (Walters et al., 1978; Cox and Frank,
1982; Dunham et al., 1995; Yang et al., 1997; Trushina et al., 1997), nitroso products
(Massey et al., 1984; Stamler et al., 1992; Samouilov and Zweier, 1998; Ewing and Janero,
1998; Gladwin et al., 2000; Rassaf et al., 2002; Jourd’heuil et al., 2005; Wang et al., 2005;
Zhang et al., 2005), nitrosyl-hemes (Gladwin et al., 2000; Feelisch et al., 2002) and total
NO (Sonoda et al., 1997). The wide use of NO chemiluminescence detectors in life science
laboratories can be attributed to several factors, including sensitivity, selectivity, quick
response, ease of use, and the relatively moderate pricing and space requirements that are
comparable to other commonly used laboratory instruments. Here we describe an enhancement
to NO chemiluminescence assays that retains their original advantages while providing
isotopic differentiation capabilities. Following earlier work by Russow (1999) on mass
spectrometric detection of NO from aqueous nitrite and nitrate using a chemical vessel, this
work demonstrates that a mass spectrometer detector can either replace, or operate in parallel
with, NO chemiluminescence detectors without altering assay conditions and sacrificing
convenience. The approach incorporates a detector that is commonly used in GC/MS systems,
which is also sold as a stand-alone system with supporting data acquisition software. Our
results indicate that mass spectrometric detection used in this way allows NO isotopic-tracing
experiments to be carried out to a limit of detectability of a few picomoles. The advantage
afforded by mass spectrometric detection is illustrated by providing evidence that the murine
macrophage J774 displays nitrate reductase capabilities, as demonstrated by the emergence of
15NO – immediately following the addition of 15NO – to cell lysates. 2 3

Isotope tracting for NO chemiluminescence assays
Results Apparatus
The apparatus described here for the isotopic detection of NO products is shown schematically
in Figure 1. The setup is based on those designed previously for the use of NO-ozone
chemiluminescence detection (CLD), with a few modifications to accommodate the added
mass-sensitive detector (MSD) and to control the relative flow toward both instruments. The
CLD in our lab is a Dasibi 2108 (Dasibi Environmental Corp., Glendale, USA), modified to
process the output from the photomultiplier tube (PMT) directly into a DAT-710 A/D converter
(DataQ Instruments, Akron, OH, USA) using a sampling rate of 1 Hz. The nominal intake flow
rate for this instrument is 100 ml/min and the NO sensitivity under direct PMT monitoring is
approx. 10 ppb. The MSD used here (5975B XL; Agilent Technologies, CA, USA) employs
electron impact ionization and a high-volume turbopump (ca. 260 l/min). The flow to the MSD
is restricted by a 0.25mm ID fused silica gas chromatography (GC) column measuring 7.5 m
in length, resulting in an intake flow rate of 4 ml/min for an input pressure of 2 atmospheres.
The column is maintained at all times at a temperature of 100°C inside an oven (1321F; VWR,
West Chester, PA, USA) to prevent accumulation of adsorbed gases that may occur primarily
when the apparatus is not in use. A hole two inches in diameter was bored through the side of
the oven to accommodate the MSD inlet in order to prevent condensation of volatile species at
that point. The MSD is operated in selected ion monitoring (SIM) mode, scanning for masses
m/z = 29, 30, and 31. Integration times were set to either 100 ms for scanning conditions
using MSD auto-tuning parameters or 400 ms when operating under manually adjusted MSD
parameters (see below). Samples containing NO related products are injected into a 40 ml Sievers purge vessel (GE
Analytical Instruments, Boulder, CO, USA), containing a suitable reactive solution that strips
the NO off its binding site and releases it into the gas phase. The vessel is continuously purged
with ultrahigh-purity helium (UHP He) with an inlet gauge pressure of typically 20-40 psi
(135-270 kPa) that rapidly extracts dissolved NO from the solution and transports it at rates of
50-100 ml/min towards the detectors for quantification. Water vapor transported by the carrier
gas is partially recondensed by the jacketed condenser that is built into the Sievers purge
vessel, maintained here near 0°C. The remaining gas is filtered through a 10 ml Sievers purge
vessel containing a 1 M solution of NaOH to trap corrosive gases and higher order nitrogen
oxides. Finally, the water vapor of the gas en route to the detectors is reduced by the condenser
built into the second purge vessel, which is also maintained near 0°C.
The gas sample emerging from the chemical vessels is split by a Swagelok T connector
between the two detectors. The majority of the flow (>90%) is directed toward the CLD since
the MSD flow is limited to 4 ml. To help maintain the intake pressure near 1 atm for the CLD,

Isotope tracting for NO chemiluminescence assays
2 2
O 2
the line leading to it is opened to the atmosphere with the aid of a T connector that is uncapped
at one end. This open point also acts as a constant pressure point that helps to regulate upstream
where the flow splits toward the MSD. Exposure to atmospheric NO contributes minimally to
our signals since our lab is located in a wooded campus within a relatively small metropolitan
area. In areas where NO levels are higher and variable, the same pressure regulation could be
achieved with the aid of a balloon attached to the open end, which is filled periodically with
He. Finally, a needle valve between the two T’s adjusts the flow through that line in order to
control the balance of flow between the MS and CL detectors.
Even with non-detectable levels of atmospheric NO, air contamination in the gas stream
can produce small contributions to the signals at m/z = 30 as demonstrated in Figure 3. The
contribution at m/z=30 is likely due to the partial fragmentation of O and N in the ion source,
followed by recombination into NO. The signal observed at m/z=31 always tracks the levels of
at m/z=32 and is likely due to crosstalk between the two mass channels. Control of air leaks
into the gas lines is therefore critical for proper quantification of NO with minimal interference.
Since molecular oxygen can diffuse with ease through plastics, care is taken to avoid using
these materials in the gas lines. Our apparatus makes use of 1/8 inch (3.2 mm) stainless steel
(SS) tubing, except for a portion leading to the chromatography (GC) column which used
1/16 inch (1.8 mm) tubing. All tubing is joined with SS Swagelok connectors. Coupling of the
GC column to the 1/16 inch tubing is achieved with a Valco 1/16 inch stainless steel internal
union with a fused silica adapter ferrule on the column side. In addition to air tight tubing and
junctions, our apparatus makes use of injection septa designed for GC injectors. Another factor
that affects these levels is contamination of the lines leading to the MSD, which is particularly
evident when they are opened and exposed to atmospheric gases. For this reason we typically
isolate those lines at the end of the day by shutting the switch-valve and the Teflon valve at
the exit of the second condenser and keeping the MSD running continuously. In addition to
leaks, one must contend with dissolved air that may be present in solution. For samples that
can be studied under anoxic conditions, the air contamination can be eliminated simply by
purging with pure argon for 30 seconds prior to injection into the reaction vessel. Whenever
experiments require extended periods of purging, e.g. biological samples that must be
maintained anoxic for several minutes, it is recommended that the gas be scrubbed with NaOH
to trap NOx contaminants that may result in the creation of artifactual NO-related products.
When normoxic or hypoxic conditions are required, we resort to an analytical procedure that
uses information obtained from m/z = 29 to subtract the contributions due to contamination at
m/z = 30 and 31. This procedure is discussed below in the section.
As illustrated in Figures 1-5, signals obtained with MS detection are very similar in lineshape
to those obtained with chemiluminescence (Feelisch et al., 2002). They are best described
by exponentially modified gaussian functions, resulting from the convolution of gaussian

Isotope tracting for NO chemiluminescence assays
2
2
2
2
processes such as diffusion of gases, and exponentially decaying processes such as reaction
kinetics in the purge vessel, extraction of the analytes from the reducing solution, and detector
response. Our analysis software (Peakfit, Systat Software, CA, USA) allows for incorporation
of this profile information to determine the best peak fit, underlying background, and area
under the peak. Figure 2 shows a representative curve fit obtained with a 100 pmol injection of
nitrite into a tri-iodide assay.
Performance under autotuned MSD operation and with minimal signal processing In this
section we describe the performance of MSD based NO detection under two experimental
conditions that facilitate MSD operation and minimize signal processing: autotuning MSD
operation and use of He under high pressure/flow settings. Autotuning offers a hands-free
approach to maintaining instrument sensitivity and selectivity. It allows a mass spectrometer to
determine its own voltage and current settings that ionize and guide molecules towards their
detectors. The performance is optimized for selectivity and sensitivity over a wide range of
molecular masses, but not necessarily for smaller mass ranges such as the one targeted in this
study. The second aforementioned experimental condition is the adoption of pressure settings
that in our experience minimizes baseline fluctuations and thus facilitates subsequent signal
analysis. Those were found to occur at a supply and split flow gauge pressures of 40 and 32
psi, respectively. In the next section we describe other conditions that require additional
optimization and signal processing but provide greater sensitivity. Both approaches are
presented separately here in the interest of those who may wish to duplicate
our system for the following reasons. The first approach is easier to implement and may be
sufficiently sensitive to quantify NO products in e.g. translational studies using biological
fluids such as plasma and urine. Furthermore, it offers a valuable benchmark to meet before
attempting to implement the more advanced changes that provide greater sensitivity.
Typical MSD tracings extracted for the signals at m/z = 29, 20, and 31 are shown in Figure 3.
The curves illustrate the performance of the system obtained with 1 nmol injections of 14NO –,
15NO –, and of an equimolar mixture of 14NO – and 15NO –, all in Ar-purged PBS. The fourth 2 2 2
injection illustrates the signals generated by dissolved air in fully aerated buffered solutions.
Large amplitude signals are seen with every injection, with ionic masses in accordance to
the substances injected and to their proportions. The large peak arises from 14N15N (natural
abundance of 0.73%). Smaller artifactual signals are also seen in adjacent mass channels.
The smaller signal registered at m/z=31 during the first injection of 14NO – arises in part from
the isotopic contribution from 15N16O and 14N17O (total natural abundance of 0.4%) with the
remaining contribution (approx. 0.6%) arising from cross-talk with the m/z=30 signal. The next
injection of 15NO – also displays a small signal at m/z=30 corresponding to a 2% fraction of the
1 nmol injection of 15NO –. This fraction is consistent with the 2% 14NO – impurity level quoted 2 2
by the 15NO – supplier. Lastly, the small signals at m/z = 30 and 31 seen with injections of a

Isotope tracting for NO chemiluminescence assays
2
2
3
2
2
2
fully aerated PBS sample arise from 14N16O formed by partial fragmentation of O and N in the
ion source, and from crosstalk between the larger signal at m/z=32 (16O16O) and m/z=31. To test the linearity of our MSD approach and its correlation with chemiluminescence
detection, 100 µl solutions of 15NO – with concentrations of 100 nM, 300 nM, 1 µM, 3 µM
and 10 µM, where injected in triplicate into an I–/I –/HCl reductive assay (see Figure 4). The
top panel of Figure 4 shows a realtime scan extraction for m/z = 31 corresponding to the
expected mass for 15NO. The peak areas for those injections are shown in the middle panel of
Figure 4 as a function of 15NO – injected. The linearity of the response is evaluated through
a power law fit y = axb and resulted in a near-unity power dependence with b=0.9733. The
lower panel compares the same integrated signals with those obtained simultaneously with a
chemiluminescence detector. The near-linear relationship between the two confirms that the
MSD signals observed are due to the detection of NO. Similar MSD limearity and correlation
with chemiluminescence detection were obtained with injections of 14NO – and monitoring of
m/z 30 (data not shown). Similar experiments were conducted with the nitrite specific reactive mixture containing
ascorbic acid and HCl. Compared to the tri-iodide assay, the ascorbic acid based assay
produces broader temporal signals with consequently lower limits of detection (approx. 30
pmol, see Figure 5, top panel).
Extended performance using reduced purge flow, manual tuning, and background
subtraction
Additional hardware adjustments and signal processing have enabled us to achieve extended
performance in terms of sensitivity and in the ability of handling aerated samples. To attain
higher signals we lowered the flow rate to the chemiluminescence relative to that into the MS
detector. Best results were achieved at a He supply and split-flow gauge pressures of 20 psi
and 17 psi, respectively. Under these operating conditions we observe that the duration of the
NO signals is increased from 0.2 to more than 0.8 minutes. Further gain in signal to noise
ratio were attained with adjustments to parameters that control the performance of the MSD
analyzer. One simple adjustment takes advantage of the fourfold increase in duration of the NO
signals registered under lower flow conditions. This enabled us to decrease the sampling rate
fourfold by increasing the integration time from 100 to 400 ms per ion. A four-fold increase
in integration time resulted in a twofold increase in signal to noise ratio. Additional sensitivity
was obtained with manual adjustments to default and autotuned parameters that control the
MSD analyzer. Using an electron ionization current of 60.6 µA, and voltages for ion focusing,
the repeller, entrance lens, and entrance lens offset of 90.2V, 30.12V, 40.0V, and 15.31V,
respectively, we were able to increase the integrated signal another fourfold without significant
changes in background noise.
Isotope tracting for NO chemiluminescence assays
A drawback from lower pressure operation is the emergence of ripples in the baseline with a
period also on the order of a minute, as illustrated in middle panel of Figure 5. The nature of
the ripple is unclear at this time since it manifests itself at only at selected m/z ions including
all the ones monitored here. However, since the ripples at m/z = 30 and 31 are consistently
in phase with the one at m/z=29, we followed a simple procedure that uses the data from the
latter to correct for the ripple in the former ions. To null the ripple at m/z=30, for instance, the
data from m/z=29 was first scaled down by a constant factor and then subtracted from the data
at m/z=30. The factor selected corresponded to one that minimized the standard deviation for
a portion of the subtracted curve that should normally be flat, i.e. a portion before or after the
signal. The minimization of the standard deviation can be accomplished manually by trial and
error or using an automatic routine such as the Solver option available in Microsoft Excel.
The effectiveness of this background subtraction procedure is illustrated in the lower panel of
Figure 5.
The background subtraction procedure outlined above proved effective for samples purged of
air. For un-purged samples, where dissolved air produces artifacts as illustrated in Figure 3, we
developed an additional procedure that subtracts the air artifacts from the signals. The relative
contributions of air to the signals at m/z=29, 30 and 31 were first determined using fully
aerated buffer injections and Peakfit analysis. Once these contributions were standardized, the
m/z=29 trace in the samples was inspected for air signals which were analyzed with Peakfit for
amplitude and shape. This information together with the scaling factors obtained with aerated
standards allowed us to estimate the anticipated amplitude and shape of air contributions at
m/z=30 and 31. Once those contributions were subtracted from the data in all three traces the
ripple subtraction and signal analysis proceeded as outlined above.
Together, the adjustments made to the flow through the purge vessels and to the MSD
analyzer increased our overall signal to noise ratio by nearly one order of magnitude. Figure 7
demonstrates the increased sensitivity achieved when all enhancements described above were
implemented. The results show that signals as low as 3 picomoles could be quantified using
the ascorbic acid assay. Similar performance (data not shown) was achieved using the tri-
iodide based assay. Although the adjusted values quoted here are largely specific for the mass
spectrometer model we use, it suggests that similar adjustments when implemented with other
models could likely result in significantly enhanced performance.
Isotopic detection in J774 cells
There is currently much interest surrounding the biological activity and therapeutic uses of
nitrite, an oxidative product of NO synthesis that until recently was regarded as biologically
inert (Gladwin et al., 2005). The interest in this anion has been intensified further with recent
evidence that mammalian tissues can reduce nitrate to nitrite through the action of xanthine
oxidase (Jansson et al., 2008), an enzyme that plays a significant role in the immune system.
Isotope tracting for NO chemiluminescence assays
3
3
2
3
2
2
Since macrophages are part of that system and constitutively express this enzyme, we sought to
explore whether these cells are able to reduce 15NO – (nitrate) to 15NO – (nitrite) using our mass 3 2
selective technique.
A representative set of data from our mass selective experiments is shown in the top panel of
Figure 7. The hatched gray zone around the horizontal axis represents our limit of detectability,
i.e. the area where measurements essentially correspond to baseline fluctuations. Following
J774.2 cell homogenization, samples were kept aerated at 37°C as 100 µl volumes were drawn
periodically and injected into an ascorbic acid based nitrite assay. Each column in the Figure
represents the average of three injections performed over a period of 20 minutes following 10
minutes of Ar purging, for a total of 30 minutes. The gray and white columns in the top panel
of Figure 7 show the levels of 14NO – and 15NO –, respectively, before and after addition of 100 2 2
µM 15NO – to the lysate at the 90 minute mark. The data shows the emergence of 15NO – only 3 2
after addition of 15NO –, consistent with the notion that J774.2 cells should exhibit nitrate
reductase activity. Similar experiments performed with control culture flasks incubated without
J744.2 cells, confirm that the 15NO – reduction is obtained only in the presence of cells. The
lower panel of Figure 7 compares results obtained for 15NO – before and after addition of 100
µM 15NO – to lysates, for Ar-purged and un-purged samples. These results demonstrate that the
nitrate reductase activity of J774 cells is potently inhibited by oxygen.
In addition to the signals obtained for 15NO –, the upper panel of Figure 7 illustrates the
artifactual progressive increase in the 14NO – signal usually seen when a biological sample or
culture media is purged with an industrial grade gas that has not been scrubbed with NaOH.
The increase was not observed in our standards or PBS alone. This phenomenon is attributed
to hydrolysis of NOx species present in the purge gas, which interestingly seems to be
potentiated by the presence of biological material in the sample. The ability of our system to
discern isotopically nitrate-to-nitrite reduction from other reactions that produce nitrite only
demonstrates the advantage of using isotopic tracing methods to characterize sources of NO
signaling.

Isotope tracting for NO chemiluminescence assays
Discussion The current work demonstrates that mass spectrometric detection can be successfully
incorporated into NO chemiluminescence assays with relative ease to provide isotopic
tracing capabilities. The system described here places an MS detector in parallel with an NO
chemiluminescence detector mainly to validate our findings, but the MS detector could have
easily been used as the sole detector in the system if desired. The limit of detection for both
14NO and 15NO is on the order of a few pmol using the MSD option, rendering it nearly as
sensitive as chemiluminescence detection. Tests with cell homogenates indicate that these
detection limits are also attainable in with biological samples.
The present technique offers advantages and imposes limitations that should be considered
carefully before adopting it. The main advantage of our MS based technique is its direct
compatibility with chemiluminescence based NO assays, which not only allows it to use
extensively validated chemical assays but also facilitates cross-referencing of results obtained
by either technique. The benchtop space requirements and the detector costs are also
essentially similar for either technique. Another advantage associated with MS detectors
is that their technology has matured to the point of providing turn-key operation and easy
servicing steps. Consumable items such as electron impact filaments, detector horns, capillary
columns, are widely available through a variety of vendors at competitive pricing. Compared
to costlier and more labor-intense GC/ Negative Ion Chemical Ionization MS techniques that
rely on derivatization of NO-related products (Tsikas, 2000), the current technique offers the
advantage that biological samples can be assessed for nitrite, nitroso, and nitrosyl-heme species
within a few minutes and with minimal sample preparation. Finally, unlike laser IR techniques
reported to date which enable sensitive detection of 14NO or 15NO, but not both simultaneously
(Gabler and Lehmann, 2005; Yi et al., 2006; Fritsch et al., 2008), our MS approach is able
to cycle between those two detection channels in only a few milliseconds therefore allowing
simultaneous detection of 14NO and 15NO with equal sensitivity. Laser-based techniques are
also significantly costlier than the technique described here.
In terms of disadvantages and limitations, the lowest concentration of NO-related products
that can be quantified currently with our technique is on the order of tens of nM assuming
that sampling is performed in 100 µl volumes. This level of sensitivity most likely precludes
its use for studies of basal nitrosation and heme nitrosylation in small animals (Bryan et al.,
2004). Such products may be best studied using GC/MS (Tsikas, 2000) or one of the IR laser
spectroscopic methods (Fritsch et al., 2008) alluded to above. Nevertheless the sensitivity
of our technique should still be sufficient to trace isotopically other products such as nitrite
and nitrate in fluids and tissues of small animals. Another disadvantage is the inconvenience
imposed by the additional data processing steps required to subtract the contributions of
Isotope tracting for NO chemiluminescence assays
2
2
2
dissolved air from the NO signals. In the future, this inconvenience may be minimized through
programmed steps using software developed in-house.
Finally, we demonstrated the applicability of the present technique with experiments focused
on the detection of nitrate-to-nitrite reduction in anoxic J774.2 cell lysates. When lysates were
spiked with 15N-labeled nitrate, we observed very clearly its reduction to 15N-nitrite, even as
the levels of 14NO – changed due to other processes. Our analytical system also enabled us to
determine that the reduction of nitrate to nitrite was distinctly suppressed in aerated samples.
These results suggest that this cellular model combined with our analytical system may hold
promise for future characterization of the enzymatic pathways contributing to mammalian
nitrate reductase activity.
Materials and methods
Standard solutions of 14NO – and 15NO – were prepared from Na14NO and Na15NO (Sigma- 2 2 2 2
Aldrich, St. Louis, MO, USA) in 40 mM HEPES or phosphate-buffered saline (PBS) solutions.
All samples were bubbled with argon (Ar) for 30 seconds prior to injection to remove dissolved
air, which produces some interference at m/z = 30 and 31. They were then injected in 100µL
volumes into a 40 mL Sievers reaction vessel containing either tri-iodide (Feelisch et al.,
2002) or ascorbic acid based solutions (Nagababu and Rifkind, 2007), in which 1 M HCl was
substituted for acetic acid to avoid background interference from the molecular fragments
CH OH at m/z = 31(NIST). The tri-iodide solution consisted of 1M HCl at room temperature,
to which 10 mg of I and 300 mg of KI were added. The ascorbic acid solution was prepared
from a mixture of 32 ml of 1 M HCl and 4 ml of 0.5 M ascorbic acid maintained at 37°C. The
nitrite specificity of the ascorbic acid/HCl mixture was validated with side by side injections of
nitrite, nitrate, and S-nitrosoglutathione (Sigma-Aldrich). The NO formed from the reduction
of nitrite was purged out of the reaction vessel with ultrahigh-purity helium (UHP He) and
scrubbed through a 1 M NaOH solution, and quantified with our combined CLD/MS detection
system described in the following section.
J774.2 cells (Sigma-Aldrich) were grown to near confluence (5-7 days) in T75 flasks with
DMEM in the presence of 10% fetal bovine serum (Sigma-Aldrich), penicillin (200 U/ml),
and streptomycin (200 µg/ml). On the day of the experiment, the cell culture supernatant
was aspirated and the adherent cells were washed 2-3 times with sterile PBS. Cells were then
collected by scraping using a rubber policeman into 1-2 ml of PBS and lysed using an Ar-
pressurized Parr Bomb. The resulting cell lysate was used immediately in experiments. Control
flasks were incubated under identical conditions for the same period of time without cells and
processed identically to those containing cells. In addition, the media from each of the control
flasks were centrifuged in 15 ml tubes, at 1000 g for 60 minutes. The remaining pellet was re-

Isotope tracting for NO chemiluminescence assays
suspended in 1 ml of PBS and tested immediately.
Acknowledgments His work was supported through grants from the Louisiana Biomedical Research Network
(National Institutes of Health Award No. 2 P20 RR016456) and the National Science
Foundation (Award No. 0641516).
References
Ascenzi, P., Colasanti, M., Persichini, T., Muolo, M., Polticelli, F., Venturini, G., Bordo, D. and
Bolognesi, M. (2000). Re-evaluation of amino acid sequence and structural consensus
rules for cysteine-nitric oxide reactivity. Biol. Chem. 381, 623-627.
Bryan, N. S., Fernandez, B. O., Bauer, S. M., Garcia-Saura, M. F., Milson, A. B., Rassaf,
T., Maloney, R. E., Bharti, A., Rodriguez, J. R. and Feelisch, M. (2005). Nitrite is a
signaling molecule and a regulator of gene expression in mammalian tissues. Nat.
Chem. Biol. 1, 290-297.
Bryan, N. S., Rassaf, T., Maloney, R. E., Rodriguez, C. M., Saijo, F., Rodriguez, J. R. and
Feelisch, M. (2004). Cellular targets and mechanisms of nitros(yl)ation: an insight into
their nature and kinetics in vivo. Proc. Natl. Acad. Sci. USA 101, 4308-4313.
Cosby, K., Partovi, K. S., Crawford, J. H., Patel, R. K., Reiter, C. D., Martyr, S., Yang, B. K.,
Waclawiw, M. A., Zalos, G., Xu, X., et al. (2003). Nitrite reduction to nitric oxide by
deoxyhemoglobin vasodilates the human circulation. Nat. Med. 9, 1498-1505.
Cox, R. D. and Frank, C. W. (1982). Determination of nitrate and nitrite in blood and urine by
chemiluminescence. J. Anal. Toxicol. 6, 148-152.
Dunham, A. J., Barkley, R. M. and Sievers, R. E. (1995). Aqueous nitrite ion determination
by selective reduction and gas phase nitric oxide chemiluminescence. Anal. Chem. 67,
220-224.
Ewing, J. F. and Janero, D. R. (1998). Specific S-nitrosothiol (thionitrite) quantification as
solution nitrite after vanadium(III) reduction and ozone-chemiluminescent detection.
Free Radic. Biol. Med. 25, 621-628.
Feelisch, M., Rassaf, T., Mnaimneh, S., Singh, N., Bryan, N. S., Jourd’Heuil, D. and Kelm, M.
(2002). Concomitant S-, N-, and heme-nitros(yl)ation in biological tissues and fluids:
implications for the fate of NO in vivo. FASEB J. 16, 1775-1785.
Fontijn, A., Sabadell, A. J., and Ronco, R. J. (1970). Homogeneous chemiluminescent
measurement of nitric oxide with ozone. Anal. Chem. 42, 575-579.
Fritsch, T., Brouzos, P., Heinrich, K., Kelm, M., Rassaf, T., Hering, P., Kleinbongard, P. and
Isotope tracting for NO chemiluminescence assays
2
Murtz, M. (2008). NO detection in biological samples: differentiation of 14NO and 15NO
using infrared laser spectroscopy. Nitric Oxide 19, 50-56.
Gabler, R. and Lehmann, J. (2005). Sensitive and isotope selective (14NO/15NO) online
detection of nitric oxide by faraday-laser magnetic resonance spectroscopy. Methods
Enzymol. 396, 54-60.
Gladwin, M. T., Ognibene, F. P., Pannell, L. K., Nichols, J. S., Pease-Fye, M. E., Shelhamer, J.
H. and Schechter, A. N. (2000). Relative role of heme nitrosylation and β-cysteine 93
nitrosation in the transport and metabolism of nitric oxide by hemoglobin in the human
circulation. Proc. Natl. Acad. Sci. USA 97, 9943-9948.
Gladwin, M. T., Schechter, A. N., Kim-Shapiro, D. B., Patel, R. P., Hogg, N., Shiva, S.,
Cannon, R. O., 3rd, Kelm, M., Wink, D. A., Espey, M. G., et al. (2005). The emerging
biology of the nitrite anion. Nat. Chem. Biol. 1, 308-314.
Hendgen-Cotta, U. B., Merx, M. W., Shiva, S., Schmitz, J., Becher, S., Klare, J. P., Steinhoff,
H. J., Goedecke, A., Schrader, J., Gladwin, M. T., et al. (2008). Nitrite reductase activity
of myoglobin regulates respiration and cellular viability in myocardial ischemia-
reperfusion injury. Proc. Natl. Acad. Sci. USA 105, 10256-10261.
Hunter, C. J., Dejam, A., Blood, A. B., Shields, H., Kim-Shapiro, D. B., Machado, R.,
Tarekegn, S., Mulla, N., Hopper, A. O., Schechter, A. N., et al. (2004). Inhaled
nebulized nitrite is a hypoxia-sensitive NO-dependent selective pulmonary vasodilator.
Nat. Med. 10, 1122-1127.
Jansson, E. A., Huang, L., Malkey, R., Govoni, M., Nihlen, C., Olsson, A., Stensdotter, M.,
Petersson, J., Holm, L., Weitzberg, E. and Lundberg, J. O. (2008). A mammalian
functional nitrate reductase that regulates nitrite and nitric oxide homeostasis. Nat.
Chem. Biol. 4, 411-417.
Jourd’heuil, D., Jourd’heuil, F. L. and Feelisch, M. (2003). Oxidation and nitrosation of thiols
at low micromolar exposure to nitric oxide. Evidence for a free radical mechanism. J.
Biol. Chem. 278, 15720-15726.
Jourd’heuil, D., Jourd’heuil, F. L., Lowery, A. M., Hughes, J. and Grisham, M. B. (2005).
Detection of nitrosothiols and other nitroso species in vitro and in cells. Methods
Enzymol. 396, 118-131.
Li, H., Samouilov, A., Liu, X. and Zweier, J. L. (2004). Characterization of the effects of
oxygen on xanthine oxidase-mediated nitric oxide formation. J. Biol. Chem. 279,
16939-16946.
Liu, X., Miller, M. J., Joshi, M. S., Thomas, D. D. and Lancaster, J. R., Jr. (1998). Accelerated
reaction of nitric oxide with O within the hydrophobic interior of biological
membranes. Proc. Natl. Acad. Sci. USA 95, 2175-2179.
Massey, R. C., Key, P. E., McWeeny, D. J. and Knowles, M. E. (1984). The application of a
chemical denitrosation and chemiluminescence detection procedure for estimation of
the apparent concentration of total N-nitroso compounds in foods and beverages. Food

Isotope tracting for NO chemiluminescence assays
2
Addit. Contam. 1, 11-16.
Nagababu, E. and Rifkind, J. M. (2007). Measurement of plasma nitrite by chemiluminescence
without interference of S-, N-nitroso and nitrated species. Free Radic. Biol. Med. 42,
1146-1154.
NIST Standard Reference Database 69, NIST Chemistry WebBook.
Nohl, H., Staniek, K., Sobhian, B., Bahrami, S., Redl, H. and Kozlov, A. V. (2000).
Mitochondria recycle nitrite back to the bioregulator nitric monoxide. Acta Biochim.
Pol. 47, 913-921.
Rassaf, T., Bryan, N. S., Kelm, M. and Feelisch, M. (2002). Concomitant presence of N-
nitroso and S-nitroso proteins in human plasma. Free Radic. Biol. Med. 33, 1590-1596.
Rassaf, T., Flogel, U., Drexhage, C., Hendgen-Cotta, U., Kelm, M. and Schrader, J. (2007).
Nitrite reductase function of deoxymyoglobin: oxygen sensor and regulator of cardiac
energetics and function. Circ. Res. 100, 1749-1754.
Russow, R. (1999). Determination of 15N in 15N-enriched nitrite and nitrate in aqueous samples
by reaction continuous flow quadrupole mass spectrometry. Rapid Commun. Mass
Spectrom. 13, 1334-1338.
Samouilov, A. and Zweier, J. L. (1998). Development of chemiluminescence-based methods
for specific quantitation of nitrosylated thiols. Anal. Biochem. 258, 322-330.
Schrammel, A., Gorren, A. C., Schmidt, K., Pfeiffer, S. and Mayer, B. (2003). S-nitrosation of
glutathione by nitric oxide, peroxynitrite, and *NO/O *–. Free Radic. Biol. Med. 34,
1078-1088.
Shiva, S., Huang, Z., Grubina, R., Sun, J., Ringwood, L. A., MacArthur, P. H., Xu, X.,
Murphy, E., Darley-Usmar, V. M. and Gladwin, M. T. (2007). Deoxymyoglobin is a
nitrite reductase that generates nitric oxide and regulates mitochondrial respiration.
Circ. Res. 100, 654-661.
Sonoda, M., Kobayashi, J., Takezawa, M., Miyazaki, T., Nakajima, T., Shimomura, H., Koike,
K., Satomi, A., Ogino, H., Omoto, R. and Komoda, T. (1997). An assay method for
nitric oxide-related compounds in whole blood. Anal. Biochem. 247, 417-427.
Stamler, J. S., Jaraki, O., Osborne, J., Simon, D. I., Keaney, J., Vita, J., Singel, D., Valeri, C. R.
and Loscalzo, J. (1992). Nitric oxide circulates in mammalian plasma primarily as an
S-nitroso adduct of serum albumin. Proc. Natl. Acad. Sci. USA 89, 7674-7677.
Stamler, J. S., Toone, E. J., Lipton, S. A. and Sucher, N. J. (1997). (S)NO signals:
translocation, regulation, and a consensus motif. Neuron 18, 691-696.
Stubauer, G., Giuffre, A. and Sarti, P. (1999). Mechanism of S-nitrosothiol formation and
degradation mediated by copper ions. J. Biol. Chem. 274, 28128-28133.
Tischner, R., Planchet, E. and Kaiser, W. M. (2004). Mitochondrial electron transport as a
source for nitric oxide in the unicellular green algae Chlorella sorokiniana. FEBS Lett.
576, 151-155.
Trushina, E. V., Oda, R. P., Landers, J. P. and McMurray, C. T. (1997). Determination of nitrite

Isotope tracting for NO chemiluminescence assays
and nitrate reduction by capillary ion electrophoresis. Electrophoresis 18, 1890-1898.
Tsikas, D. (2000). Simultaneous derivatization and quantification of the nitric oxide metabolites
nitrite and nitrate in biological fluids by gas chromatography/mass spectrometry. Anal.
Chem. 72, 4064-4072.
Walters, C. L., Casselden, R. J. and Taylor, A. M. (1967). Nitrite metabolism by skeletal muscle
mitochondria in relation to haem pigments. Biochim. Biophys. Acta 143, 310-318.
Walters, C. L., Downes, M. J., Hart, R. J., Perse, S. and Smith, P. L. (1978). Determination of
nitrite at low level without prior extraction. Z. Lebensm. Unters. Forsch. 167, 229-232.
Wang, J., Chan, W. G., Haut, S. A., Krauss, M. R., Izac, R. R. and Hempfling, W. P. (2005).
Determination of total N-nitroso compounds by chemical denitrosation using CuCl. J.
Agric. Food Chem. 53, 4686-4691.
Webb, A., Bond, R., McLean, P., Uppal, R., Benjamin, N. and Ahluwalia, A. (2004). Reduction
of nitrite to nitric oxide during ischemia protects against myocardial ischemia-
reperfusion damage. Proc. Natl. Acad. Sci. USA 101, 13683-13688.
Williams, D. L., ed. (1988). Nitrosation (Cambridge, UK: Cambridge University Press).
Yang, F., Troncy, E., Francoeur, M., Vinet, B., Vinay, P., Czaika, G. and Blaise, G. (1997).
Effects of reducing reagents and temperature on conversion of nitrite and nitrate to
nitric oxide and detection of NO by chemiluminescence. Clin. Chem. 43, 657-662.
Yi, J., Namjou, K., Zahran, Z. N., McCann, P. J. and Richter-Addo, G. B. (2006). Specific
detection of gaseous NO and 15NO in the headspace from liquid-phase reactions
involving NO-generating organic, inorganic, and biochemical samples using a mid-
infrared laser. Nitric Oxide 15, 154-162.
Zhang, Y., Keszler, A., Broniowska, K. A. and Hogg, N. (2005). Characterization and
application of the biotin-switch assay for the identification of S-nitrosated proteins. Free
Radic. Biol. Med. 38, 874-881.
Zweier, J. L., Wang, P., Samouilov, A. and Kuppusamy, P. (1995). Enzyme-independent
formation of nitric oxide in biological tissues. Nat. Med. 1, 804-809.
Isotope tracting for NO chemiluminescence assays
2
2
2
2
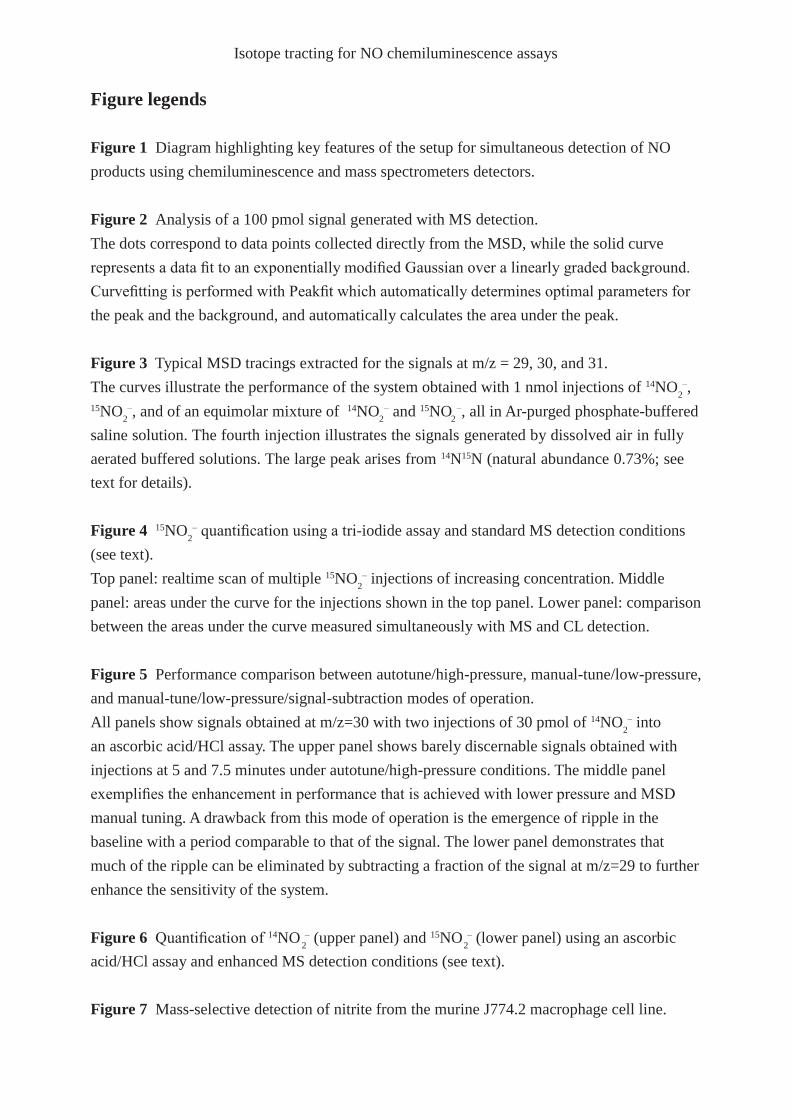
Figure legends Figure 1 Diagram highlighting key features of the setup for simultaneous detection of NO
products using chemiluminescence and mass spectrometers detectors. Figure 2 Analysis of a 100 pmol signal generated with MS detection.
The dots correspond to data points collected directly from the MSD, while the solid curve
represents a data fit to an exponentially modified Gaussian over a linearly graded background.
Curvefitting is performed with Peakfit which automatically determines optimal parameters for
the peak and the background, and automatically calculates the area under the peak.
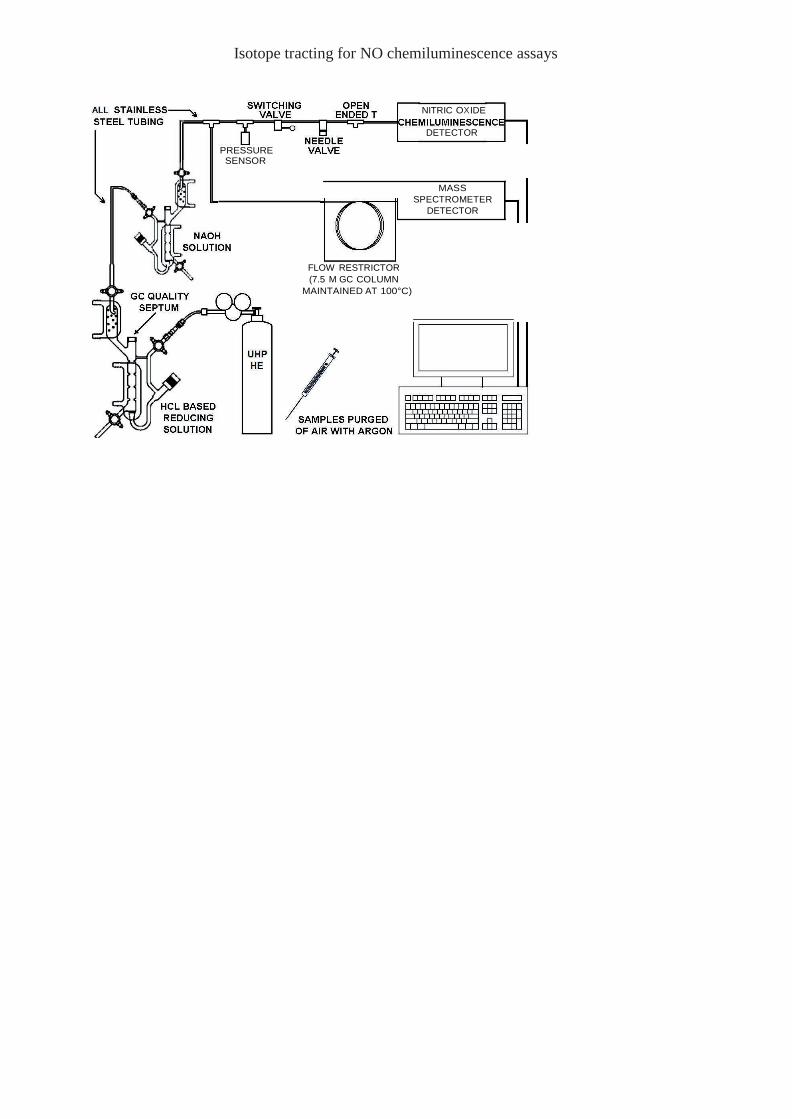
Figure 3 Typical MSD tracings extracted for the signals at m/z = 29, 30, and 31.
The curves illustrate the performance of the system obtained with 1 nmol injections of 14NO –,
15NO –, and of an equimolar mixture of 14NO – and 15NO –, all in Ar-purged phosphate-buffered 2 2 2
saline solution. The fourth injection illustrates the signals generated by dissolved air in fully
aerated buffered solutions. The large peak arises from 14N15N (natural abundance 0.73%; see
text for details).
Figure 4 15NO – quantification using a tri-iodide assay and standard MS detection conditions
(see text).
Top panel: realtime scan of multiple 15NO – injections of increasing concentration. Middle
panel: areas under the curve for the injections shown in the top panel. Lower panel: comparison
between the areas under the curve measured simultaneously with MS and CL detection.
Figure 5 Performance comparison between autotune/high-pressure, manual-tune/low-pressure,
and manual-tune/low-pressure/signal-subtraction modes of operation.
All panels show signals obtained at m/z=30 with two injections of 30 pmol of 14NO – into
an ascorbic acid/HCl assay. The upper panel shows barely discernable signals obtained with
injections at 5 and 7.5 minutes under autotune/high-pressure conditions. The middle panel
exemplifies the enhancement in performance that is achieved with lower pressure and MSD
manual tuning. A drawback from this mode of operation is the emergence of ripple in the
baseline with a period comparable to that of the signal. The lower panel demonstrates that
much of the ripple can be eliminated by subtracting a fraction of the signal at m/z=29 to further
enhance the sensitivity of the system.
Figure 6 Quantification of 14NO – (upper panel) and 15NO – (lower panel) using an ascorbic 2 2
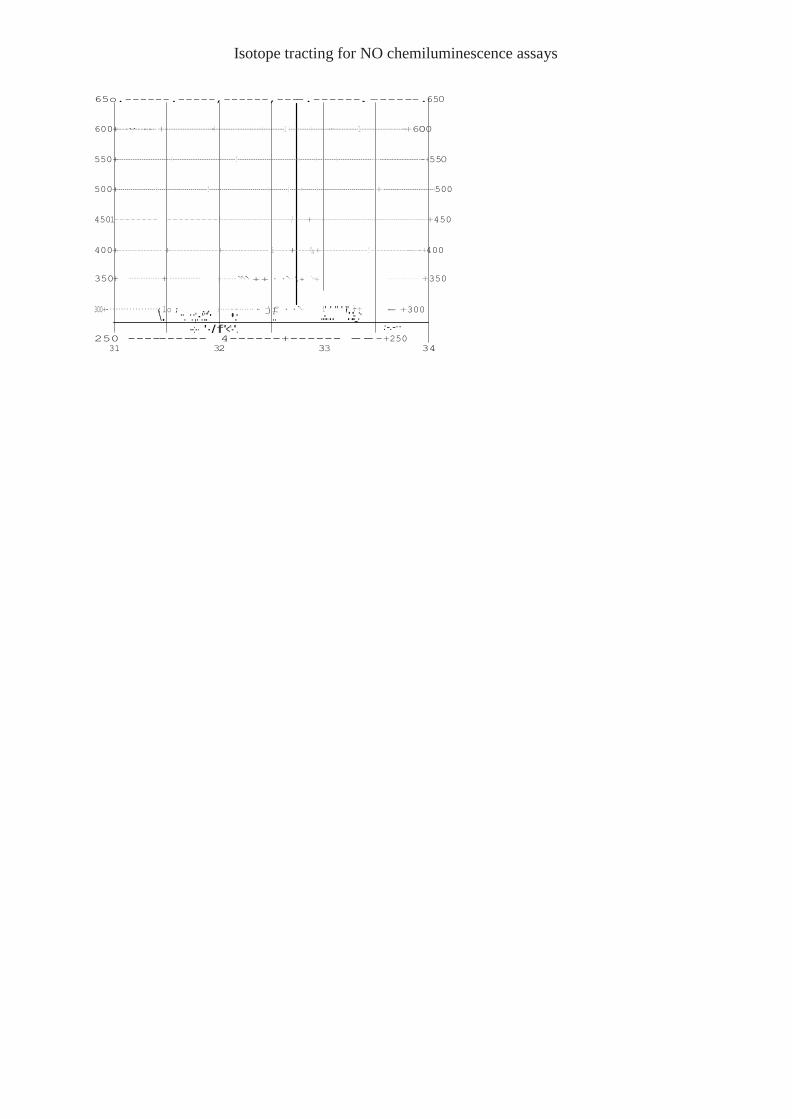
acid/HCl assay and enhanced MS detection conditions (see text). Figure 7 Mass-selective detection of nitrite from the murine J774.2 macrophage cell line.

Isotope tracting for NO chemiluminescence assays
3
3 2
'l11e gray and white columns in the top panel show the levels of 141\0 2
and 151\0 2
, respectively,
before and after addition of lOOf!m of 151\0 to the lysate at the 90 minute mark The gray
hatched zone around the horizontal axis represents our limit of dctcctability, i,c, the area where
measurements are essentially indistinguishable ±!·om baseline fluctuations The lower panel
compares results obtained tor 15N0 prim·to and after addition of 100 f!m of 151\0 to lysates,
for i\r-purged samples (white columns) or un-purged (hatched columns),
Isotope tracting for NO chemiluminescence assays
NITRIC OXIDE
PRESSURE SENSOR
DETECTOR
MASS
SPECTROMETER
DETECTOR
FLOW RESTRICTOR
(7.5 M GC COLUMN
MAINTAINED AT 100°C)
Isotope tracting for NO chemiluminescence assays
65o.------.-----,------,----.------.------.650
600+---·--·------------+---------------------------·--!----------------------------+------------1 +-----------+----------·--·----------------1---------------------------·--+600
550+------------------------+----------------------------!---------------------------+-------+--+-----+---------------+--------------------------+550
500+------------------+------------------------!----------------------------+---------/-----+-------+---------------------------+---------------------------+500
4501-------- ---------!-----------------------------+---------/------+-----+---------------------------+----------------------------+450
400+--------------+---------------+--------------- i-----+-----\-\-,+---------------!-------------------+400
350+ ·················· +··················· i····················++······\+ ·······+ ··················· +350
300+-·················
\;.lo ;
··. ·.·;.-.:·::,·
·i·····•··.············ jf
:. ······
--:-· '·/ f"<'-". .i.'.-...'.."'"
'::·.-;-·--_···+
:· ·-·-·-·-·-·· +300
:-.-··
250 ---------- 4------+------ ---+250 31 32 33 34

Isotope tracting for NO chemiluminescence assays
2
.5 nmoi 14No2·
1 nmoi 14
No2· .5 nmoi 15No ·
--.:!._..!:o--
mlz = 29
[1 nmoi 15N02 --r-r- --.:!. ..!::- Aerated PBS
m/z = 30
m/z = 31 •
0 5 10 15 Time (min)

Isotope tracting for NO chemiluminescence assays
:
c.
.e
100
·
Q)
()
s::::
8000
1000 pmol
(II 6000 "C
s:::: ::I
(II
<n
4000
2000
10 pmol 30 pmol 100 pmol
300 pmol
.._ \.
6 10 16 20 26 30 36 40
Time (min)
1000 ------------ ---- --f--------
y = 1.1073x0 9733
R2
= 0.9957
II)
Q,)
"
.C
s
.0s1
c
100
10
• 15N nitrite
-Power fit
1
10 100
pmol injected
1000
II) 1000-,-----------,-,----,----,---,----- ca e! ca
ca Q,)
c. Q,) (.)
c Q,) (.) II)
Q,)
E .2
E Q,)
..c
y = 1.2978x0 9654
R2
= 0.9967
• 15N nitrite
-Power fit
u 10+--------- ---- --
10 100
MS peak areas
1000

Isotope tracting for NO chemiluminescence assays
3.9 4.9 5.9 6.9 7.9 8.9
Manual tune
10 12 14
Manual Tune with
background subtraction
10
Time (min)
12 14

Isotope tracting for NO chemiluminescence assays
-
Q)
Q)
- ...
1000
y = 1.2936xo.9633
R2
= 0.9961
Ul .Ill: I'll
a. "C
$ 100 !:!! Cl Q)
s:::::
10
• 14N nitrite
-Power fit
1 10 100
pmol injected
1000
Ul .Ill: I'll
a. "C
1000
y = 0.9661x1.o3o3
R2
= 0.9963
$ 100 I'll
Cl Q)
s:::::
10
• 15N nitrite
-Power fit
1 10 100
pmol injected
1000
Isotope tracting for NO chemiluminescence assays
c "No;
c '"No;
25
300
c:
a. 200
Cl
E
0 100 E a.