Tracing Pupils in Kenya's Primary Schools - GOV.UK
69
Tracing Pupils in Kenya’s Primary Schools: A Case Study of the Impact of the 2003 Free Primary Education Policy in Eight Schools in Kisii and Kajiado Districts. Moses Oketch October 2008 WORK IN PROGRESS CREATE research teams are producing a range of interim research products. These include fieldwork reports, pilot studies, background reviews, research instruments, and draft papers. These vary in focus, depth, and quality and have not been peer reviewed. Some will become CREATE publications after quality assurance, and others will remain as project documents. The Work in Progress products are collected together in one area of the website (http://www.create-rpc.org/publications/index.shtml ). They are also linked to other website pockets as appropriate. Author details are provided with this document for any follow up correspondence. Consortium for Research on Educational Access, Transitions and Equity
-
Upload
khangminh22 -
Category
Documents
-
view
3 -
download
0
Transcript of Tracing Pupils in Kenya's Primary Schools - GOV.UK
Tracing Pupils in Kenya’s Primary Schools:A Case Study of the Impact of the 2003 Free
Primary Education Policy in Eight Schools in Kisiiand Kajiado Districts.
Moses Oketch
October 2008
WORK IN PROGRESSCREATE research teams are producing a range of interim research products. Theseinclude fieldwork reports, pilot studies, background reviews, research instruments, anddraft papers. These vary in focus, depth, and quality and have not been peer reviewed.Some will become CREATE publications after quality assurance, and others will remainas project documents.
The Work in Progress products are collected together in one area of the website(http://www.create-rpc.org/publications/index.shtml). They are also linked to otherwebsite pockets as appropriate. Author details are provided with this document for anyfollow up correspondence.
Consortium for Research onEducational Access,Transitions and Equity
The Consortium for Educational Access, Transitions and Equity (CREATE) is a Research Programme Consortium supported by the UK Department for International Development (DFID). Its purpose is to undertake research designed to improve access to basic education in developing countries. It seeks to achieve this through generating new knowledge and encouraging its application through effective communication and dissemination to national and international development agencies, national governments, education and development professionals, non-government organisations and other interested stakeholders. Access to basic education lies at the heart of development. Lack of educational access, and securely acquired knowledge and skill, is both a part of the definition of poverty, and a means for its diminution. Sustained access to meaningful learning that has value is critical to long term improvements in productivity, the reduction of inter-generational cycles of poverty, demographic transition, preventive health care, the empowerment of women, and reductions in inequality.
The CREATE partners CREATE is developing its research collaboratively with partners in Sub-Saharan Africa and South Asia. The lead partner of CREATE is the Centre for International Education at the University of Sussex. The partners are:
The Centre for International Education, University of Sussex: Professor Keith M Lewin (Director) The Institute of Education and Development, BRAC University, Dhaka, Bangladesh: Dr Manzoor Ahmed The National University of Educational Planning and Administration, Delhi, India: Professor R Govinda
The Education Policy Unit, University of the Witwatersrand, South Africa: Dr Shireen Motala The Universities of Education at Winneba and Cape Coast, Ghana: Professor Jerome Djangmah
The Institute of Education, University of London: Professor Angela W Little
Disclaimer
The research on which this paper is based was commissioned by the Consortium for Research on Educational Access, Transitions and Equity (CREATE http://www.create-rpc.org). CREATE is funded by the UK Department for International Development (DFID) for the benefit of developing countries and is coordinated from the Centre for International Education, University of Sussex. The views expressed are those of the author(s) and not necessarily those of DFID, the Institute of Education, or the CREATE Team.
Copyright © CREATE 2008
Address for correspondence: CREATE, Centre for International Education, Sussex School of Education, University of Sussex, Falmer, Brighton BN1 9QQ, United Kingdom Tel: + 44 (0) 1273 678464 Fax: + 44 (0) 1273 877534 Author Email : [email protected] Website: http://www.create-rpc.org Email: [email protected]
2
Contents
1. The Impact of Free Primary Education (FPE) on Cohort Intake and ProgressionPatterns at the School Level................................................................................................ 4
1.1 Introduction .............................................................................................................. 41.2 Kisii district ............................................................................................................. 5
1.2.1 Background...................................................................................................... 51.2.2 Ndovu Primary School .................................................................................... 6
1.2.2.2 The impact of FPE on cohort progression pattern .................................... 81.2.3 Nyati Primary School ....................................................................................... 9
1.2.3.1 The impact of FPE on standard 1 cohort intake ..................................... 101.2.3.2 The impact of FPE on cohort progression pattern .................................. 11
1.2.4 Simba primary school..................................................................................... 131.2.4.1 The Impact of FPE in standard 1 cohort intake ...................................... 131.2.4.2 The impact of FPE on cohort progression pattern .................................. 14
1.2.5 Sungura Primary School................................................................................ 161.2.5.1 The impact of FPE on standard 1 cohort intake ..................................... 171.2.5.2 The impact of FPE on cohort progression pattern .................................. 17
1.3 Kajiado district ....................................................................................................... 211.3.1 Background.................................................................................................... 211.3.2 Pembe Primary School ................................................................................... 21
1.3.2.1 The impact of FPE on standard 1 cohort intake ..................................... 221.3.2.2 The impact of FPE on cohort progression pattern .................................. 23
1.3.3 Mukia Primary School................................................................................... 241.3.3.1 The impact of FPE on Standard 1 intake ................................................ 251.3.3.2 The impact of FPE on progression ......................................................... 26
1.3.4 Macho Primary School .................................................................................. 271.3.4.1 The impact of FPE on standard 1 intake................................................. 281.3.4.2 Impact of FPE on cohort progression pattern ......................................... 28
1.3.5 Tumbo Academy ............................................................................................ 291.3.5.1 Impact of FPE on standard 1 intake........................................................ 301.3.5.2 Impact of FPE on cohort progression pattern ......................................... 31
1.4 Conclusion.............................................................................................................. 322. The Impact of FPE on Cohort Repetition, Transfers, and Age Patterns- and anassessment Pupils Household Characteristics................................................................... 34
2.1. Introduction ........................................................................................................... 342.2 Repetition in Kisii district ...................................................................................... 36
2.2.1 Ndovu primary school ................................................................................... 372.2.2 Nyati Primary School ..................................................................................... 372.2.3 Simba Primary School.................................................................................... 382.2.4 Sungura primary school.................................................................................. 382.2.5 Conclusion...................................................................................................... 39
2.3 Repetition in Kajiado district ................................................................................ 392.3.1 Pembe primary school .................................................................................... 392.3.2 Mukia primary school..................................................................................... 392.3.3 Macho primary school.................................................................................... 40
3
2.3.4 Tumbo Academy ............................................................................................ 402.3.5 Conclusion...................................................................................................... 41
2.4 Repetition: Further Analysis in Kisii district ......................................................... 432.4.1 Ndovu primary school .................................................................................... 432.4.2 Nyati primary school ...................................................................................... 432.4.3 Simba primary school..................................................................................... 432.4.4 Sungura primary school.................................................................................. 44
2.5 Repetition: Further Analysis in Kajiado district .................................................... 442.5.1 Pembe primary school .................................................................................... 442.5.2 Mukia primary school..................................................................................... 452.5.3 Macho primary school.................................................................................... 452.5.4 Tumbo Academy ............................................................................................ 45
2.6 Transfers in Kisii district........................................................................................ 462.6.1 Ndovu primary school .................................................................................... 462.6.2 Nyati primary school ...................................................................................... 472.6.3 Simba primary school..................................................................................... 482.6.4 Sungura primary school.................................................................................. 49
2.7 Transfers in Kajiado district................................................................................... 502.7.1 Pembe primary school .................................................................................... 502.7.2 Mukia primary school..................................................................................... 512.7.3 Macho primary school.................................................................................... 522.7.4 Tumbo Academy ............................................................................................ 53
2.8 Age profiles in Kisii district .................................................................................. 562.8.1 Ndovu primary school .................................................................................... 562.8.2 Nyati primary school ...................................................................................... 562.8.3 Simba primary school..................................................................................... 572.8.4 Sungura primary school.................................................................................. 57
2.9 Age profiles in Kajiado district ............................................................................. 572.9.1 Pembe primary school .................................................................................... 582.9.2 Mukia primary school..................................................................................... 582.9.3 Macho primary school.................................................................................... 582.9.4 Tumbo Academy ............................................................................................ 58
2.10 Family background in Kisii district...................................................................... 602.11 Conclusion............................................................................................................ 66
References......................................................................................................................... 68

4
1. The Impact of Free Primary Education (FPE) on Cohort Intake andProgression Patterns at the School Level
1.1 Introduction
Kenya re-introduced Free Primary Education (FPE) policy in 2003 with the aim ofestablishing ‘universal primary education’ and to meet the EFA and MDG target ofuniversal access by 2015 (Oketch and Rolleston, 2007). It is not the first time that Kenyahas made an attempt to ‘universalise’ access to primary education. Similar attempts weremade in 1974 and 1979 but were subsequently unsustained. It is with this view that recentimplementation of FPE has been subjected to greater scrutiny by those who havequestioned whether it can be sustained and what it would take to sustain it (see e.g.,Oketch and Rolleston, 2007a; 2007b; Muthwii, 2004; Mukudi, 2004; Vos et al. 2004;King, 2005). This is more so the case because previous FPE related policies were mostlyanalysed in terms of inclusion rather than a combination of inclusion and exclusionpatterns.
CREATE’s aim is to ensure that there is a better understanding of the various educationalzones of exclusion (see Lewin, 2007) as this may lead to early intervention for those whoare vulnerable and advance sustainable ‘universal access’ to primary education. Toadvance this cause, this paper is a follow up to previous two papers (see Oketch andRolleston 2007; and Somerset, 2007) on the subject of access to primary and secondaryeducation in Kenya published by CREATE.
Somerset (2007) provides a comprehensive analysis of primary school enrolment trends,looking at cohort intake and progression patterns over four decades in Kenya at thenational level. To complement the national analysis of enrolment and progression trendsit is important to know how different schools have experienced FPE as this may provideevidence on succeeding schools and failing schools beyond that which is provided byaggregate national enrollment and progression trends.
In this report, the primary focus is to assess the impact of FPE on cohort intake andprogression patterns as well as the pattern that emerge of factors that lead to exclusionsuch as repetition, transfers, age profile, and household characteristics at the school level.The report is based on evidence gathered during field research undertaken in two districtsin Kenya during the months of July and August 2007 and a subsequent follow up in themonths of July and September 2008. It was motivated in part by a review of the literatureon policies on free primary education in East Africa (Oketch and Rolleston, 2007) and ofearlier studies which reported that increased enrollment following the implementation ofFPE in Kenya in 2003 was immediately followed by high drop-out rate which in turnadversely affected the flow of pupils in the second year of the policy in 2004. Forinstance, some of the early studies reported that districts which had registered a 20 percent increase in enrolment in 2003, the year FPE was introduced, hardly recorded morethan 5 per cent increase in 2004, one year after the introduction of the FPE policy(Muthwii, 2004; OWN and Associates, 2004).

5
In order to assess the impact of FPE on cohort intake and progression patterns at theschool level, the intake and progression patterns of the FPE cohort and those of the pre-FPE cohorts are compared. The intake and progression is traced based on schoolenrolment registers, showing the total enrolment in each grade. For example, if a cohortstarted standard one in 1997, we take the enrolment at the start of the year and call it1997 cohort intake. In 1998, this cohort will be in standard two. The total enrolment instandard two in 1998 will include those who have progressed from standard one (i.e.those who were in standard one in 1997), those who have repeated standard two (i.e.those who were in standard two in 1997 but did not progress to standard three in 1998due to repetition), and new entrants whom we call in-transfers from other schools. In-transfers include those repeating the same grade as well as those progressing to the nextgrade without repeating but simply changing schools.
A total of 8 schools were selected for the study, 4 in Kisii district and another 4 inKajiado district. A similar study was concurrently undertaken in Nyeri and Nairobidistricts by Tony Somerset (see Somerset, 2008). The districts were selected to representKenya’s major urban settlement (Nairobi district), high population density and highagricultural productivity (Kisii and Nyeri districts), and sparsely populated and semi-arid/arid low agricultural potential district (Kajiado district). The selection criterion foreach school in Kisii and Kajiado districts, the two districts on which this report is basedwas school location- such that a school in each of the following category was included:One township school, one urban school located within or nearby an informal (slum)settlement, one peri-urban-rural (semi-urban) school, and one remote rural school locatedin the interior of the district. The names used for schools in this paper are not the actualnames of the schools visited in the two districts. The names were changed to protect theidentities of the schools.
The report is organised into 2 parts. Part 1 focuses on intake and progression patterns atthe school level in Kisii and Kajiado district following the implementation of FPE. Underthis part, section 1 assesses the impact of FPE on cohort intake and progression patternsin Kisii district. Section 2 assesses cohort intake and progression patterns in Kajiadodistrict. Section 3 provides the conclusion. Part 2 focuses on cohort repetition, transfers,age profiles and household characteristics patterns of the pre-FPE and FPE cohorts ineach of the schools selected in the two districts.
1.2 Kisii district
1.2.1 Background
With the help of research assistants and contacts at the Ministry of Education, thefollowing public/government schools were selected for the study in Kisii district.
Ndovu Primary School. An ex-high cost public school, located in Kisii town anddrawing most of its pupils from the town’s residence.Nyati Primary School. A public school located on the peripheries of a major low-income informal housing (slum) area within Kisii township drawing most of its pupilsfrom that area.

6
Simba Primary School. A public school in a remote rural location of reasonablyhigh agricultural potential.Sungura Primary School. A public school near a small rural market centre, on themain road/highway between Kisii and Kisumu towns.
1.2.2 Ndovu Primary School
Ndovu Primary School is the oldest and the largest government school in Kisii district. Itdraws most of its pupils from Kisii town. It was established before Kenya attainedindependence and only enrolled Asian and European pupils. It remained a purely Asianand Europeans only school with majority of the pupils being Asians until 1970s when thefirst few African pupils were allowed to enroll in the school.
District Education Board (DEB) took over the school in the early part of 1970s whichfacilitated the enrollment of more African pupils at the school. However, the Africanpupils who were enrolled during this period were those of wealthy families who couldafford the high fees charged by the school. It was the most expensive public school in thetown. However, in spite of being open to all populations in Kenya, it still remainedmostly an Asian school until the end of the 1970s when African pupil numbers began toincrease. By the 1980s, it had become mainly African school, and today, there are hardlyany non African pupils enrolled in the school.
Before the implementation of Free Primary Education Policy (FPE) in 2003, enrollmentwas restricted by means of admission fees and other tuition and indirect costs. In additionto costs, the Headmaster of Ndovu primary school informed us that pupils could bedenied entry if ‘other’ school requirements such as full school uniform was not met by apupil who was seeking to join the school. This positioned the school as one that servedthe town’s ‘middle’ class and out of reach by the towns ‘poor’ and ‘poorer’ groups. FPEchanged all this as no child could now be denied entry into any school for lack of moneyor any other requirements. It meant that any child could be admitted to the school in anygrade. Even when they didn’t have school uniform, they could not be denied entry or sentaway, but instead the parents would be encouraged by the school to buy their child schooluniform as soon as it was possible.1 The Headmaster whom we found at the school duringout visit to the school in the month of July 2007 had been at the school as its Headmastersince 2004.
In 1997 total enrollment at Ndovu primary was 837 pupils, and in 2002 it was 713. In2003, the year FPE policy was introduced it went up to 802 pupils. Three years later in2007 it had increased to 909 pupils, but the headmaster lamented that facilities remainedthe same in spite of the increased enrollment. Table 1 shows the annual cohort intakebetween 1997 and 2007. The resulting impact is congestion that is visible, especially inlower classes (Standard 1 to Standard 5). Although there is FPE grant given to the schoolby the Kenya Government, it has only been sufficient to renovate and maintain theexisting buildings leaving limited resources to erect new buildings to cope with increasedenrollment since FPE.
1 This information is based on my interview with the Head-Master of the school.

7
All classrooms are permanent but some of the buildings date back to mid 1900 when theschool was first established and would require constant maintenance or replacement.Because of its urban location, the school gets new entrants everyday since FPE policywas introduced; and the frequency of enquiries by those seeking to join the school hasalso increased since FPE was introduced.
It was revealed to us that there is some form of ‘voluntary’ payments/donations made byparents to the school. These are said to help with some aspects of the running costs of theschool since FPE grants is not enough. For instance, there is a feeding programme at theschool that was started 3 months prior to our visit in July 2007 and which is solely runthrough voluntary donations by parents and teachers at the school. The feedingprogramme is restricted to all standard 8 pupils who prepare for Kenya Certificate ofPrimary Education (KCPE), the examination that marks the end of primary cycle andwhich is used for selection into secondary schools; and to orphan pupils whom we wereinformed had mostly lost their parents to HIV/AIDS.2 The standard 8 are included in theprogramme so as to minimise time that might be wasted by them traveling back to theirhomes for the lunch and to guarantee that all of them have had lunch so that they canconcentrate on their studies and be able to stay for after-school tutorials, if asked to inorder to prepare for the highly competitive KCPE examinations which they would sit fortowards the end of the year, around the month of November. The feeding programme wassaid to be an attraction to pupils from low socio economic background to the school.Based on our own observation, we found the school buildings to be in reasonablecondition although constant maintenance appeared necessary. The school had electricityand water. Class size seemed reasonable at 35 per class although there are numerousstreams for the lower classes, leading to timetabling problems. All pupils had a desk atwhich to sit even if it was shared by about three to four pupils. Most pupils looked neatin their school uniforms and nearly all of them wore shoes, with some wearing stockings.Most pupils were tidy with well kept hair and showed happy faces. Each classroom hadblack wall for teaching, and there was school library. On the whole this school seemed tohave what can be categorized as acceptable level of facilities for effective teaching andlearning. My impression was that Ndovu primary school is not a school that draws itspupils from very poor families. This was confirmed by the head teacher who informedme that most of the pupils were from the town’s successful businessmen/women. Most ofthese businessmen and women had less education but were not poor either.
Although FPE means that education is now free there are still some cost barriers, such asexamination fees and the idea of voluntary donations might yet be another ‘imposed’ feesthat parents feel the pressure to pay. Before FPE was announced pupils who wanted tojoin the school had to pay admission fees of Ksh.1500 (approx. US$23) in addition tomandatory full school uniform. The admission fees and other mandatory requirements inthe pre-FPE period excluded pupils from poor families from Ndovu Primary School.Since the introduction of FPE, many poorer children have sought admission and mosthave been accepted in the school. Poorer parents have been surprised that their childrencan now be accepted at the school which previously was perceived to be one for those
2 Based on interview with the Head-Master and the Deputy Head-Master of Ndovu primary school.

8
who were not poor. FPE has also meant that older pupils have been attracted to theschool.3
Table 1: Standard 1 intake at Ndovu Primary School (1997-2007)
Year Number ofEntrants(intake)
1997 901998 991999 922000 782001 702002 652003 (FPE Year) 962004 1102005 1202006 1072007 122
Source: Compiled by the author from school records asprovided by the school.
Intake in the pre-FPE period (1997-2002) had been varied with the lowest intake of 65pupils in 2002 and the highest intake of 99 pupils in 1998. The lowest intake in the FPEand post-FPE period was 96 pupils in 2003 and the highest was 122 pupils in 2007 (Table1). The annual intake appears to increase each year in the FPE and post-FPE period butwas declining most of the years in the pre-FPE years. The average annual intake in thepre-FPE year was 82.3 pupils and in the FPE and post-FPE period it was 111 pupils.There was 34.8% increase in average annual standard 1 intake in the FPE/Post-FPEperiod.
1.2.2.2 The impact of FPE on cohort progression pattern
The cohort progression curves (Figure 1) shows that FPE had impact on the shape of thecurves. For instance, the 1997 standard one intake was 90 pupils. This rose in subsequentyears, peaking at 119 pupils in 2000 due to in-transfers and repeaters. It then started adownward trend, declining to 95 pupils by the time the cohort reached standard 8 due torepetition and out-transfers.
3 Based on interview with the Head –Master of Ndovu primary.

9
Figure 1: Ndovu Primary School Cohort Intake and Progression Curves 1997-2007
0
20
40
60
80
100
120
140
160
Y1997 Y1998 Y1999 Y2000 Y2001 Y2002 Y2003 Y2004 Y2005 Y2006 Y2007
Year
En
roll
men
t
Std1 1997
Std1 1998
Std1 1999
Std1 2000
Std1 2001
Std1 2002
Std1 2003
Std1 2004
Std1 2005
Std1 2006
Std1 2007
FPE
A similar trend is exhibited by the 1998 cohort who started with 99 pupils and grew to121 by 2002. Again, this growth is attributed to in-transfers and repeaters. The immediatepre-FPE (2002) cohort intake was 65 pupils and in 2007, it had increased to 112 pupils.This indicates that retention for the 2002 cohort was good, and that there were new pupilsjoining the cohort along the way following the announcement of FPE. The 2003 (FPEcohort) maintained a similar pattern such that in 2007 they were up to 110 pupils from 96pupils who had started. The 2004 cohort shows similar trend as the 2003 cohort. Theintake was 110 pupils and by 2007, it had increased to 139 pupils. Overall, the shape ofFigure 1 shows that FPE had a positive impact on cohort progression pattern at NdovuPrimary School. Far more pupils were being retained and many more joined the cohortsafter FPE than before FPE.
1.2.3 Nyati Primary School
Nyati Primary school is located on the periphery of the main Kisii town centre. It isdraws most of its pupils from the informal housing (slum) settlement where it is located.The school was established in early part of the 1970s. The buildings are permanentalthough some of the classes had floors which are not cemented (mud floor).
Most pupils wore school uniform but we also spotted several pupils who didn’t wearschool uniform. There was also indication that pupils at Nyati Primary School couldcome to school wearing any type of foot-wear. We only saw few pupils whom we couldsay were wearing proper shoes. Majority of the pupils were wearing slippers and plasticshoes. In one of the classes we visited to administer questionnaires, there was a heap ofall types of footwear outside by the door, and when we asked why they were left outside,

10
we were told that pupils were required to leave their footwear outside to keep thecemented floors clean. All pupils in the classroom were therefore bare-foot4.
According to the head-teacher the school was happy to be receiving FPE grant from thegovernment. They had revamped their school library because of FPE. There was alsoevidence that some improvement of the buildings was being undertaken. There was landfor expansion and the headmaster sounded optimistic about the future of the school inspite of the large number entrants it was attracting. All pupils sat on a desk even thoughthey shared in groups of 4-5 pupils per desk. The classrooms looked a bit crowded andthe space at the desk was barely sufficient to allow comfortable writing space for eachpupil. The school didn’t have electricity and there wasn’t water either.
1.2.3.1 The impact of FPE on standard 1 cohort intake
Table 2: Standard 1 intake atNyati Primary School (1997-2007)
Year Number ofEntrants(intake)
1997 1161998 1691999 1152000 1122001 *2002 1582003 (FPE Year) 1392004 1552005 1442006 1622007 160
*Record not availableSource: Compiled by the author from records provided by the school.
Unlike Ndovu Primary School, FPE didn’t have immediate impact on standard 1 intake atNyati Primary School. As can be seen in Table 2, the intake in 2003 (FPE year) was 139pupils, lower than intake in 1998 and 2002. However Table 1 reveals that the impact ofFPE was gradual rather that a ‘big bang’ at Nyati Primary School. By 2004, the intakewas still lower than that of 2002. However, intake in the FPE and post-FPE periodcontinued to rise while that of the Pre-FPE period was mixed, with a high of 169 pupils in1998 and a low of 112 pupils in 2000. In contrast, that of the FPE and post FPE periodhad a low of 139 pupils in 2003 and a high of 162 pupils in 2006 (Table 2). The averageannual intake in the Pre-FPE period was 134 pupils while that of the FPE/Post-FPE
4 Based on authors observation and conversation with pupils.

11
period was 152 pupils. This is an increment of 13% in annual standard 1 intake followingFPE policy. Compared to Ndovu Primary School’s 34.8% increase in annual averagestandard 1 cohort intake in the FPE period, FPE period had a lower average annual intakein standard 1 intake at Nyati Primary School. This was confirmed by the headmaster to beso due to less intake restrictions/barriers at Nyati even before FPE was introduced.According to the headmaster, Nyati’s enrollment as remained more or less the samefollowing FPE because the number of pupils who leave the school is almost equal to thenumber of new admissions. Our assessment of intake patterns indicates that there werefewer barriers to enter Nyati Primary before FPE compared to Ndovu Primary School.
Nyati Primary School is also a high enrolling school, even before FPE as can be seen bythe 1998 intake which was the highest in both Pre-FPE and Post-FPE period. Givenenrollment of 158 pupils in 2002 standard 1 intake and subsequent intake following FPE,we concluded together with the headmaster of Nyati that FPE did have impact at Nyatibut the impact was not a massive as might have been expected. For instance in 2003,Ndovu had enrolled 124 pupils from 99 in the previous year compared to Nyati whichhad enrolled 139 pupils in 2003 compared to 158 pupils in the previous year. However,while Nyati continued to have an improved intake, Ndovu only improved modestlybefore declining to 77 pupils in 2007 compared to Nyati’s intake of 160 pupils in 2007.The decline in Ndovu was attributed to parents returning their children to private schoolswhere they had been taken from following the announcement of FPE. Most parents whohad taken their children to Ndovu following FPE begun to transfer them back to privateacademies once they were in doubt of the quality of education, following media reportsthat FPE had led to congestion in schools- an indication of ‘shifting’ phenomenon(movement of pupils between state and non state schools)
Ndovu is desirable to parents with children at Nyati but due to ‘hidden’ cost barriers anddistance, many have opted to stay at Nyati. This group of parents, unlike those at Ndovucannot afford private academies, and this explains the continued rise at Nyati whereas inNdovu the intake was declining in subsequent years after FPE was implemented.
1.2.3.2 The impact of FPE on cohort progression pattern
The patterns of the curves in Figure 2 indicate that Nyati Primary School had seriouscohort retention/progression problem. For instance in the Pre-FPE period, the highestintake was in 1998 at 169 pupils. A year later this number had declined to 112 pupils. Itstayed relatively stable between 2000 and 2003. It dramatically rose in 2004 to 141 pupilsimplying there were transfers and re-entries one year after FPE had kicked in. However,by standard 8, the number was only 70 pupils. This implies that in spite of the gains madeas a result of FPE, only 41% of the cohort were able to reach standard 8, the final year ofKenya’s primary school cycle.

12
Figure 2: Nyati Primary School Cohort Intake and Progression Curves
1997-2007
0
20
40
60
80
100
120
140
160
180
Y1997 Y1998 Y1999 Y2000 Y2002 Y2003 Y2004 Y2005 Y2006 Y2007
Year
En
roll
men
t
Std1 1997
Std1 1998
Std1 1999
Std1 2000
Std1 2002
Std1 2003
Std1 2004
Std1 2005
Std1 2006
Std1 2007
FPE
The 1998 cohort however had a better retention and progression compared to 1997cohort, taking into account those who joined and/or left the cohort a long the way, with63% of the pupils of the 116 pupils who started the cohort and those who joined along theway reaching standard 8.
The 2000 cohort however exhibit a rather different pattern from the 1998 cohort. Itpeaked at 164 pupils in 2004 from 112 pupils in 2000, attributable to FPE. It then starteda downward trend reaching only 87 pupils by standard 8, the final year of Kenya’sprimary cycle. The 2002 cohort, a year before FPE kicked in also exhibit retention andprogression problem as it dropped to 149 pupils in 2003 from 158 pupils the year before,and continued to decline to 124 pupils in 2004. This is in spite of FPE having kicked in.However, there was an apparent influx in 2005 when the 2004 cohort number suddenlyshot up to 165 pupils but by 2007, the number had declined to 123 pupils. Thus, in thePre-FPE period, the pattern that is given by Figure 2 indicates Nyati is a school that haddifficulties with retention and progression, a point confirmed to us when the school wasrevisited in 2008.
This situation didn’t improve with announcement of FPE. The 2003 cohort has a patternsimilar to the 2000 cohort and the 2004 cohort shows a pattern similar to the 2002 cohort.We concluded that FPE did not improve retention and progression at Nyati. Theheadmaster was rather blunt by saying FPE had not increased enrolment at Nyati. Theprogression pattern indicates that unlike Ndovu which had an improved progressionpattern in the FPE period indicating better retention/survival Nyati is a school that is botheasy to enter and leave. The cohort progression pattern at Nyati indicates that attendance

13
is poor. This was confirmed to us during 2008 visit to the school when it was said that theschool serves pupils who come and go rather frequently. There are street children andorphans who are enrolled at the school, and the school has got no capacity to meet theneeds of these vulnerable pupils. Since the school is located nearer a market centre,during market days pupils simply don’t show up at school as they go about selling itemsat the market, some do it frequently and eventually simply dropout. If FPE was meant toimprove the situation, the pattern of cohort curves suggests that it didn’t, partly because itis not fees alone that mattered to this category of pupils. To them, there is opportunity-cost to schooling which FPE hasn’t been able to alleviate.
1.2.4 Simba primary school
Simba Primary School is an isolated rural school, situated in the interior of Kisii districtand away from the main Kisii-Kisumu Towns tarmac road. It was established in early1970s. The school looked well kept and the buildings seem to have been recently builtwith the use of Constituency Development Fund (CDF) by the Kenyan Government.There was a large compound with flowers beautifully planted around the block ofclassrooms. The school didn’t have water and electricity.
The pupils had desks to sit on even if they shared them in groups of 3-4. Most pupilswore uniform. Our visit was a surprise to the school which claimed that they are not usedto visitors leave alone those coming as far as the Institute of Education, University ofLondon. They were pleased that their school had been selected as one of the cases for thestudy.
1.2.4.1 The Impact of FPE in standard 1 cohort intake
Enrollment in the school was generally stable because the pupils were mainly nativeswith only a handful orphans who had relocated to the village from elsewhere to be lookedafter by their relatives. This is in contrast with frequent influx of new-comers and exit inurban settlements where Ndovu and Nyati Primary Schools are both located.
14
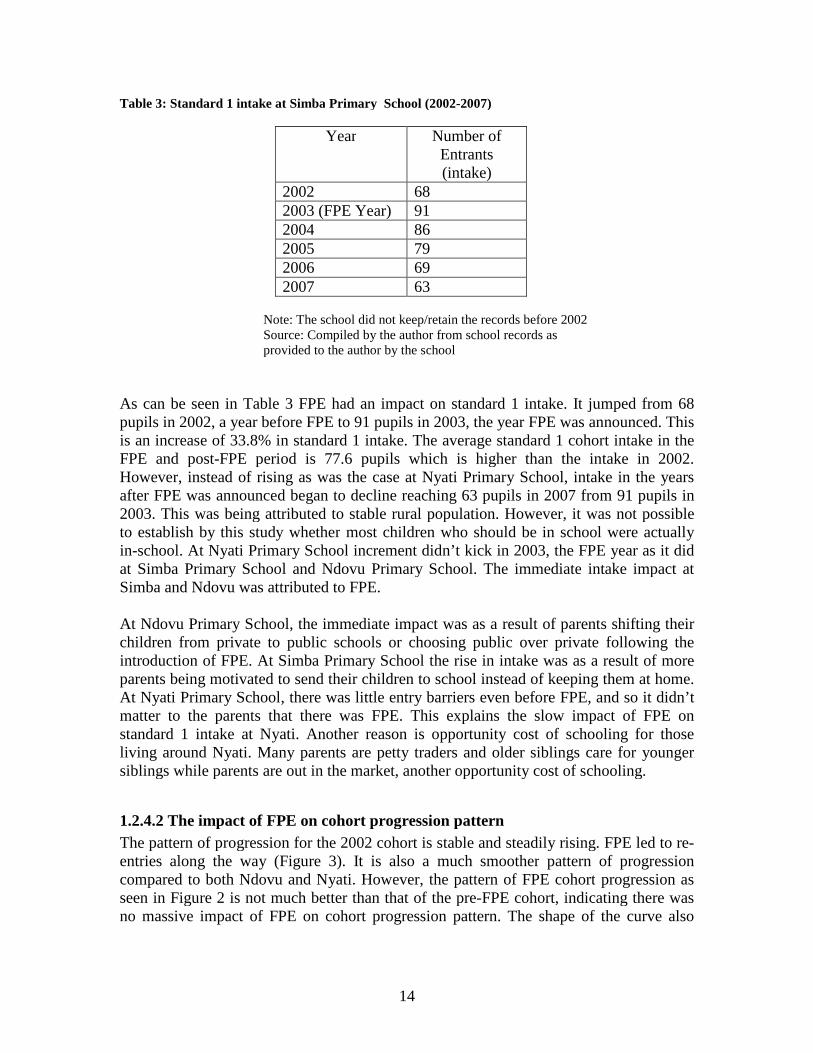
Table 3: Standard 1 intake at Simba Primary School (2002-2007)
Year Number ofEntrants(intake)
2002 682003 (FPE Year) 912004 862005 792006 692007 63
Note: The school did not keep/retain the records before 2002Source: Compiled by the author from school records asprovided to the author by the school
As can be seen in Table 3 FPE had an impact on standard 1 intake. It jumped from 68pupils in 2002, a year before FPE to 91 pupils in 2003, the year FPE was announced. Thisis an increase of 33.8% in standard 1 intake. The average standard 1 cohort intake in theFPE and post-FPE period is 77.6 pupils which is higher than the intake in 2002.However, instead of rising as was the case at Nyati Primary School, intake in the yearsafter FPE was announced began to decline reaching 63 pupils in 2007 from 91 pupils in2003. This was being attributed to stable rural population. However, it was not possibleto establish by this study whether most children who should be in school were actuallyin-school. At Nyati Primary School increment didn’t kick in 2003, the FPE year as it didat Simba Primary School and Ndovu Primary School. The immediate intake impact atSimba and Ndovu was attributed to FPE.
At Ndovu Primary School, the immediate impact was as a result of parents shifting theirchildren from private to public schools or choosing public over private following theintroduction of FPE. At Simba Primary School the rise in intake was as a result of moreparents being motivated to send their children to school instead of keeping them at home.At Nyati Primary School, there was little entry barriers even before FPE, and so it didn’tmatter to the parents that there was FPE. This explains the slow impact of FPE onstandard 1 intake at Nyati. Another reason is opportunity cost of schooling for thoseliving around Nyati. Many parents are petty traders and older siblings care for youngersiblings while parents are out in the market, another opportunity cost of schooling.
1.2.4.2 The impact of FPE on cohort progression pattern
The pattern of progression for the 2002 cohort is stable and steadily rising. FPE led to re-entries along the way (Figure 3). It is also a much smoother pattern of progressioncompared to both Ndovu and Nyati. However, the pattern of FPE cohort progression asseen in Figure 2 is not much better than that of the pre-FPE cohort, indicating there wasno massive impact of FPE on cohort progression pattern. The shape of the curve also

15
indicates there were no significant re-entries and transfers as cohorts progressed. Beingremotely located school, this pattern is not surprising.
Figure 3: Simba Primary School Cohort Intake and Progression
Curves 2002-2007
0
20
40
60
80
100
120
Y2002 Y2003 Y2004 Y2005 Y2006 Y2007
Year
En
roll
me
nt
Std1 2002
Std1 2003
Std1 2004
Std1 2005
Std1 2006
Std1 2007
FPE
Overall, the initial impact of FPE on cohort intake had faded in further post-FPE period.We concluded that FPE had a modest impact at Simba Primary School compared toNdovu Primary School and Nyati Primary School in terms of entry. Transfers andreentries appear to have occurred for the 2002 cohort but there is no evidence for thesehappening in the FPE and post-FPE period.
It is also interesting that retention and progression is positive at Ndovu and Simbacompared to Nyati which had a major problem with retention and progression. Forinstance, the 2002 cohort maintained a steady rise from 68 pupils in 2002 to 75 pupils in2003, the FPE year. This is because several pupils joined standard 2 during the FPE year.Some of these are those pupils who had dropped out before FPE was introduced andothers were in-transfers. The 2002 cohort number continued to rise steadily in subsequentyears reaching 97 pupils in 2007. The 2003 cohort, however, experienced some decline,from 91 pupils in 2003 to 88 pupils in 2005; and there were 86 pupils compared to the2002 cohort who were 89 pupils. The 2004 standard 1 intake retention and progression isvery similar to that of 2003 cohort, as can be seen in Figure 3. The 2005 cohort alsoexhibit similar trend, with enrolment starting low at 75 pupils, rising to 86 pupils in 2006but declining to 75 pupils in 2007. It is also evident that enrollment was up in the FPEyear but was lower than the FPE year in subsequent years.
16
WE concluded, based on Figure 3, that the impact of FPE at Simba, a rural school wasnot dramatic as compared to Ndovu and Nyati. However, although Simba is school inremote location it had better retention and progression. The head teacher attributed this tobetter academic performance at the school level by most pupils following theimplementation of FPE. According to the headmaster, since the introduction of FPE, theschool was able to meet its academic needs. Enrollment had stabilized below the FPEyear but it is yet to be known how it will be in subsequent years. We concluded that whilethere was some improvement in standard 1 intake following FPE policy in 2002,subsequent years didn’t show this increase. It is also clear that the rise in enrollment wasnot as dramatic as that experienced by Ndovu or even similar to that of Nyati. Retentionand progression appeared stable, much of which is explained by native and stable ruralpopulation. Furthermore attendance was better at Simba compared to Nyati because mostteachers knew the pupils and class size was smaller. It was easy to notice when a childwas absent and if this was frequent, enquiry would be made with the pupil’s parents orguardian.
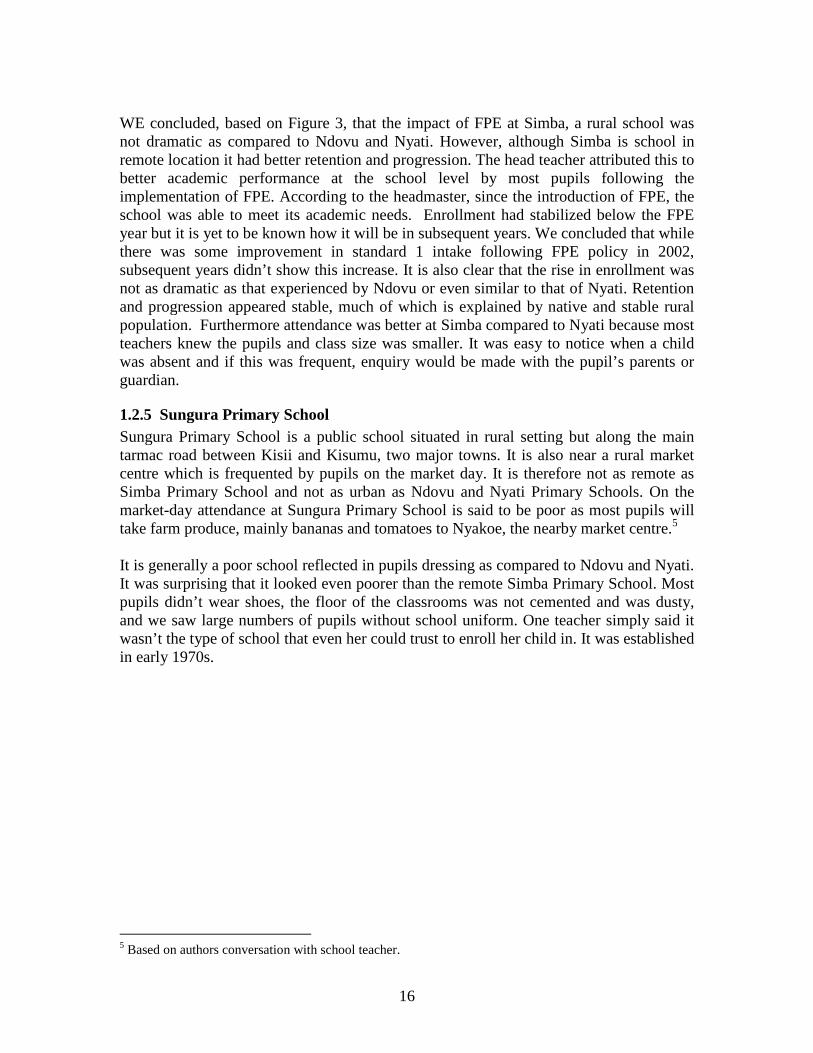
1.2.5 Sungura Primary School
Sungura Primary School is a public school situated in rural setting but along the maintarmac road between Kisii and Kisumu, two major towns. It is also near a rural marketcentre which is frequented by pupils on the market day. It is therefore not as remote asSimba Primary School and not as urban as Ndovu and Nyati Primary Schools. On themarket-day attendance at Sungura Primary School is said to be poor as most pupils willtake farm produce, mainly bananas and tomatoes to Nyakoe, the nearby market centre.5
It is generally a poor school reflected in pupils dressing as compared to Ndovu and Nyati.It was surprising that it looked even poorer than the remote Simba Primary School. Mostpupils didn’t wear shoes, the floor of the classrooms was not cemented and was dusty,and we saw large numbers of pupils without school uniform. One teacher simply said itwasn’t the type of school that even her could trust to enroll her child in. It was establishedin early 1970s.
5 Based on authors conversation with school teacher.

17
1.2.5.1 The impact of FPE on standard 1 cohort intake
Table 4: Standard 1 intake at SunguraPrimary School (1999-2007)
Year Number of Entrants(intake)
1999 872000 1042001 1112002 992003 (FPE Year) 1242004 1302005 1002006 862007 77
NB: School did not keep/retain records before 1999Source: Compiled by the author from school records asprovided to the author by the school
There was an immediate impact of FPE on standard 1 intake as can be seen in Table 4. Inthis regard, it is similar to Ndovu and Simba but different from Nyati. In 2002, the intakewas 99 pupils and in 2003, the year FPE kicked in it went up to 124 pupils. That is anincrease of 25% in standard 1 intake following announcement of FPE.
The average intake in the pre-FPE period was 100.25 pupils while that of the FPE andpost-FPE was 103.4 pupils. This is only slight improvement compared to that of the otherthree schools. However, some years saw very dramatic rise in standard 1 cohort intake.For instance, in 2004, the intake was 130 pupils, the highest in the FPE/Post FPE period,far above the 1999 intake which was only 87 pupils (Table 4). However, by 2007, intakehad declined to 77 pupils, a trend similar to that witnessed at Simba and which isattributed to a rather stable rural settlement. Overall, we concluded based on Table 4 andfollowing a subsequent visit to the school that FPE had made some impact on standard 1intake in the first two years (2003 and 2004) but in subsequent years, intake had declined.It is hard to tell what has happened, it is either because parents have already startedgiving up on the idea of FPE and not sending their children to school or that there arenow no more pupils staying at home and therefore FPE has been such a success.
1.2.5.2 The impact of FPE on cohort progression pattern
Figure 4 indicates cohort progression did not improve in the FPE and Post FPE period.This was attributed to lack of transfers and re-entries into the school caused by FPE aswas seen at Nyati, Ndovu and to some extent at Simba. For instance, the 1999 cohortprogression pattern show a decline from 101 pupils in 2002, staying the same in 2003(FPE year), and only slightly improving to 107 pupils in 2004. It then takes a steep

18
downward shape with only 60 pupils enrolled in 2007 from 107 pupils in 2004. Thisimplies cohort survival of 56% in spite of FPE. The pattern conforms to the rampantrepetition at the school, as well as high dropout. The 2000 cohort exhibit a trend similarto that of the 1999 cohort. It started with 104 pupils which declined to 86 pupils one yearlater before rising to 115 pupils in 2002. In 2003, it was 116 pupils, indicating that FPEdid not have impact on this cohort. A downward trend then kicks in from 2004 withenrollment in 2007 of 60 pupils.
The 2002 cohort shows a different pattern, and one that demonstrate significant impact ofFPE. For instance, it started with 99 pupils. This rose to 123 pupils in the FPE year. Itdemonstrates that FPE kicked in the rise. However, there is an immediate downwardtrend in subsequent years with enrollment reaching 89 pupils in 2007. This is a drop of27.6% from the peak of 123 pupils in 2003.
Figure 4: Sungura Primary School Cohort Intake and Progression
Curves 1999-2007
0
20
40
60
80
100
120
140
Y1999 Y2000 Y2001 Y2002 Y2003 Y2004 Y2005 Y2006 Y2007
Year
En
roll
men
t
Std1 1999
Std1 2000
Std1 2001
Std1 2002
Std1 2003
Std1 2004
Std1 2005
Std1 2006
Std1 2007
FPE
We concluded based on Table 4 and Figure 4 and our interviews with the head teacherduring a subsequent visit that there was some FPE impact on intake and progression atSungura primary school. This was attributed mostly re-entries and a few transfers.However, two years after FPE had been in operation, that is 2005 onwards, the impact ofFPE in influencing cohort progression pattern had disappeared.
While 2003 showed the steepest upward intake curve, it also exhibits immediate decline,because the excited about FPE among parents had been replaced by concerns over thequality of education under FPE leading to parents withdrawing their children from theschool one year into FPE. For instance the intake was 124 pupils in 2003; it remained

19
nearly the same at 125 pupils in 2004 before declining to 95 pupils in 2005. By 2007, the2003 cohort was 94 pupils from 123 pupils. This is a decline of 24%. Intake was highestin 2004, but intake in subsequent years was much lower. The 2005 cohort showprogression pattern similar to that of the 1999 cohort. Even the 2006 cohort progressionpattern doesn’t appear much different from the 1999 cohort pattern of progressionpattern.
Compared with the other three schools in Kisii district, the cohort progression pattern ofSungura primary school is similar to that seen at Nyati primary school and much differentfrom that of Simba and Ndovu Primary Schools. There was impact on cohort intake butthere was equally progression problem at Sungura. Like Nyati primary school, Sungura isa school that was easy to enter and easy to exit (similar entry and exit patterns as Nyati).It was also affected by its proximity to a market which meant that during market days,many pupils simply missed going to school. Frequent absenteeism eventually leadsdropout. Sungura is another case of a school where opportunity-cost of schooling was notalleviated by the introduction of FPE.
Overall, ours study shows that retention was better at Ndovu than the other three schoolsin the District. It is Simba, the remote school that has the second best cohort retention.Cohort progression patterns at Ndovu indicated enrollments of over 100% in some yearsattributed to in-transfers. For Nyati, Sungura and to some extent Simba Primary schoolsintake was high but the higher classes saw dramatic decline, due to ‘forced’ repetitionand/or massive dropout by those who did not see a realistic chance of making transitionto secondary school. Although none of the head teacher could admit to it, we believedthere were still ‘hidden’ costs associated with higher grades which made themunaffordable to poorer pupils. Such ‘hidden’ costs may include mock-examination fees,extra tuition costs and examination fees as pupils approach standard 8.
In summary, FPE had positive impact on intake in all the four schools studied in Kisiidistrict. However, the impact varied by the type and location of the school. At Ndovu, theimpact on standard 1 intake was immediate and continued in the post-FPE years. This isbecause there were barriers to access which were removed by FPE. At Nyati the impactwas not immediate and on average annual intake was lower than that experienced atNdovu primary School. We concluded that FPE didn’t remove the opportunity cost-barrier which was the main inhibiting factor at Nyati. Moreover, even before FPE, entrybarriers were not strictly enforced at Nyati and might have been the case at Ndovu. It hasto be noted that Nyati is located in the slum settlement and serves slum residents. Theteachers are aware of this and even before FPE and were more willing to accept pupilswithout many ‘hidden’ and indirect costs compared to Ndovu. For instance, they didn’tinsist on full school uniform, shoes requirement. Admission fess was also much lowercompared to Ndovu’s US$23.
Once FPE was announced, parents at Nyati didn’t rush their children to the schoolwhereas at Ndovu, FPE was an opportunity to join a school that was previously seen asbeing out of reach for the poor. Poor parents who could not sent their children to Ndovubefore FPE were now keen to send their children there following the implementation of

20
FPE policy. In any case, the removal of the high admission fees is one factor that wouldaccount for the sudden impact of FPE on standard 1 intake at Ndovu. The other twoschools, Simba and Sungura also witnessed immediate impact following FPE. However,in all cases, there is no evidence of a major ‘big bang’ rise in intake caused by FPE withnumbers rising to more than 50%.
On cohort progression, Ndovu remained stable and even improved. It was able to take onmore pupils along the way indicating there were several new entrants due to in transfersto the school and re-entries. At Nyati, FPE didn’t help to improve progression. There waseasy entry and easy exit with and without FPE. At Simba, there was stable patternindicating that the situation was not terribly bad before FPE. At Sungura, there was nomuch improvement. It showed similar cohort progression pattern as that of Nyati.Overall, it is only Ndovu that saw increased cohort progression numbers following FPE.This was attributed to in-transfers to the school along with regular attendancerequirement which account for greater survival/retention. Our assessment indicates that aschool with characteristics of Nyati (i.e. urban informal settlement location) may needmore than FPE to improve access and access related issues such as retention, progressionand transition. It also does suggest that remote and rural schools may in fact be betterthan urban slum schools in terms of retention and progression. Put differently, thisassessment has revealed that FPE had positive impact in rural schools than in schoolslocated in urban informal settlements in Kisii District.

21
1.3 Kajiado district
1.3.1 Background
Kajiado district is different from Kisii district in many ways. Much of it is semi/arid withnomadic communities of mainly Masaai group. It is also highly sparsely populatedcompared to Kisii which is a high agricultural area and one of the most densely populateddistrict in Kenya. Kajiado is not very far from Nairobi; in fact it borders Nairobi whileKisii is approximately 700 KM from Nairobi. It is also a much larger district than Kisii.We therefore expected the impact of FPE here to be different from that of Kisii; and itsdifference from Kisii was one of the reasons it was selected for comparison in this study.
With the help of Kajiado district education officials we identified the following schoolsfor the study.
1. Pembe Primary School. The oldest public school in Kajiado district, located inKajiado town and drawing most of its pupils from the town and its nearbyresidential areas.
2. Mukia Primary School. A public school that takes its name from a nearbymining and quarry plant and from where it draws most of its pupils.
3. Macho Primary School. A public school located in Ngong’ town which is one ofthe fertile regions of Kajiado districts with a large number of settler communities,also not located very far from Nairobi.
4. Tumbo Academy Primary School. A private academy located in Ngong’ andowned by family and operated as a business venture.
1.3.2 Pembe Primary School
Pembe Primary School is the oldest school in Kajiado district, associated with prominentmembers of Masaai community. It was established by colonial government in 1944. It isboth day and boarding schooling. It is located not too far way from Kajiado District townalthough it is in the outskirts of the town centre. It is regarded as a local school thatmainly serves the Masaai and those residing in Kajiado town. The school is wellequipped, with its own computer for administrative purposes. The school also operates afeeding programme sponsored by World Food Programme. There are two streams forstandards 4 to 8 and 1 stream each for standards 1-3. However, because of operating onlyone stream, classes in standards 1-3 are large and congested, with average enrollment of80 pupils per class. Repetition is a perennial problem mainly because of the pastoralistlifestyle of the Masaai. About one half of those who start complete their primary schoolcycle at the school. Transfers are regular and this is because Masaai are pastoralistsmoving depending on season and in search of grass for their cattle. There has been areduction in dropout since FPE. Most of the pupils looked neat in their school uniforms.Since FPE, all those who want to join the school have to be accepted. The school has

22
electricity. Staffing is a problem as many teachers would not want to come and teach inthe semi arid area due to its hardships. The school performs well and was in the secondposition in the District mock examinations in 2007. All pupils wear shoes and the schoolprovides some help to poorer pupils through a school committee to buy items such asuniform.
50 pupils enrolled at the school are those who have been rescued from interior parts ofthe district from early marriage or those who have run off to avoid being married off at anearly age. Traditionally the Masaai maintained their strong cultural identity and shunnedschooling but have increasingly turned towards schooling. The Masaai men prefer largeherds of cattle as this is considered a symbol of wealth and pride than being educated.
1.3.2.1 The impact of FPE on standard 1 cohort intake
Table 5: Standard 1 intake at Pembe PrimarySchool (1997-2007)
Year Number ofEntrants(intake)
1997 1011998 1101999 712000 742001 622002 532003 (FPE Year) 682004 802005 732006 932007 92
Source: Compiled by the author from school records asprovided to the author by the school
At Pembe Primary School the highest standard 1 intake was not during the FPE periodbut instead in the pre-FPE period. In 1998, standard 1 intake was 110 pupils compared to68 pupils in 2003, the FPE year (Table 5). It is, however, clear that intake in the pre-FPEperiod had been declining significantly such that in 2002, a year before FPE wasannounced, intake was lowest at 53 pupils, having been 101 pupils in 1997 and highest at110 pupils in 1998. Intake during the FPE year was 68 pupils, a rise of 28% from theprevious year. Post FPE period saw increased annual standard 1 intake as seen in Table 5,contrary to what happed in the pre-FPE period. With these patterns we concluded thatFPE had positive impact on standard 1 intake at Pembe, confirming that costs at Pembehad been a barrier before FPE was announced.

23
The average annual standard 1 intake at Pembe in the pre-FPE period was 78.5 pupilswhile that of the FPE and post FPE period was 81.2 pupils. In percentage terms, FPE sawan increase in average annual standard 1 intake of 3.4%. This is much lower compared tothat of Ndovu Primary school, a school with similar colonial history and status as Pemba.In some years, the impact was massive at Pembe. For instance in 2002 intake was 53pupils while that of 2006 was 93 pupils. This is a rise of 75% in intake. It has to beemphasized, however, that the highest intake was in 1998 which is a pre-FPE period.
1.3.2.2 The impact of FPE on cohort progression pattern
The cohort progression curves of Pembe confirm that progression was improved in theFPE and post FPE period. For instance the 1997 cohort started with 110 pupils but thishad declined to 71 pupils two years later in 1999. The 2002 cohort who were theimmediate pre-FPE cohort started with 53 pupils. This shot up to 96 in 2003, the yearFPE was introduced confirming that there was impact associated with re-entries andtransfers. But it again declined to 59 by 2004 when this cohort was in standard 8 which isthe final year of the primary cycle. This indicates that there was no sustained progressionimpact in spite of FPE.
Figure 5: Pembe Primary School Cohort Intake and Progressiopn Curves 1997-2007
0
20
40
60
80
100
120
140
160
Y1997 Y1998 Y1999 Y2000 Y2001 Y2002 Y2003 Y2004 Y2005 Y2006 Y2007
Enrollment
Year
Std1 1997
Std1 1998
Std1 1999
Std1 2000
Std1 2001
Std1 2002
Std1 2003
Std1 2004
Std1 2005
Std1 2006
Std1 2007
FPE
A number of the pupils dropped out and also transferred to other schools. It was notpossible to establish where the pupils went to but the likely explanation shared with theschool was dropout for those who my have not envisioned a realistic chance oftransitioning to secondary school after completing standard 8. The 1998 cohort

24
enrollment in 2004 does not indicate that there was a sudden rise in enrollment because anumber of the 1997 pupils were held back by repetition.
Progression appears to have been steady in the FPE years. However, there was adeliberate repetition for the 2002 cohort. For instance, the standard 1 intake in 2002 was53 pupils. It progressed steadily rising in number to a high of 131 in 2007, indicatingmassive impact of FPE due to transfers and/or re-entries. 2005 saw a large rise from 66pupils in the previous year. 2007 also saw a dramatic rise from 106 pupils in 2006 to 131in 2007. A number of pupils transferred to the school in 2004, 2005 and 2007. This wasdue to FPE policy but we didn’t establish if these in- transfers were those who haddropped out (re-entries) or if they are those who were coming to Pembe from otherschools, including private schools. We concluded that they were both re-entries andtransfers because Pembe is required by FPE not to turn away any pupil who seeksadmission.
The pattern of the 2003 cohort is slightly different from that of the year before it. Forinstance in 2003, the standard 1 intake was 68 pupils. This rose to 75 pupils, and then to81 pupils in subsequent year. The highest rise occurred in 2006 when it rose to 112 pupilsfrom 81 in the previous year. It however, declined to 102 pupils in 2007, and given adramatic rise in enrollment of the 2004 cohort from 98 pupils in 2006 to 139 pupils in2007, it was confirmed that some of the 2003 cohort were those repeating the grade. Thecohort curve of the 2004 cohort indicates that FPE attracted pupils to join Pembe andthose who had enrolled were retained.
Based on Figure 5, we concluded that FPE had impact at Pembe Primary school althoughit wasn’t a massive impact. Initial intake was slow but it picked up from 2004 whenenrollment in all grades was improved. It can also be seen in Figure 5 that Pembe hadsteady retention and progression. Pembe exhibits retention pattern similar to that seen atNdovu Primary School in Kisii district.
1.3.3 Mukia Primary School
As noted earlier, this is a school that draws its name from a nearby mining and quarry. Itdraws its pupils mainly from those families working for the quarry and the shanty townthat has emerged as a result of the quarry. It is located in a very remote part of Kajiadoand the roads leading to the school are mainly those accessible by the large lorries thattransport the quarry and stones. However, the school appeared well built and clean,although very sandy and dusty, not surprising for the semi arid nature of Kajiado.
The school was established in 1973 and had a total enrollment of 641 pupils in 2007. Thelower classes of standards 1-4 had 2 streams each while the upper classes of standards 5-8 had 1 stream each. The number of pupils in the lower streams was 60 pupils perclassroom while the number of pupils in the upper classes was 40 pupils per classroom.Majority of pupils in the school are poor, and most are from the local vicinities,particularly the shanty town around the mine and quarry. Attendance is sometimes aproblem as older boys stay away harvesting sand and making charcoal. School uniform isa requirement, explaining why most looked neat but the head teacher explained that he is

25
flexible in cases where a pupil cannot immediately afford the school uniform. Althoughresources are available, including being given extra support by the government underhardship school scheme, teachers are hardly attracted to the school and even those whomanage to join the school, retaining them in the school is a problem. This has affected thequality of teaching according to the head teacher.6
Like Pembe Primary School, it also has a group of rescued pupils (these are mainly girlswho have been rescued from marriage at early age or those who have run away from theirhomes to avoid being married off when still very young). Like Pembe, Mukia has afeeding programme, lunch and a boarding facility for rescued pupils.
1.3.3.1 The impact of FPE on Standard 1 intake
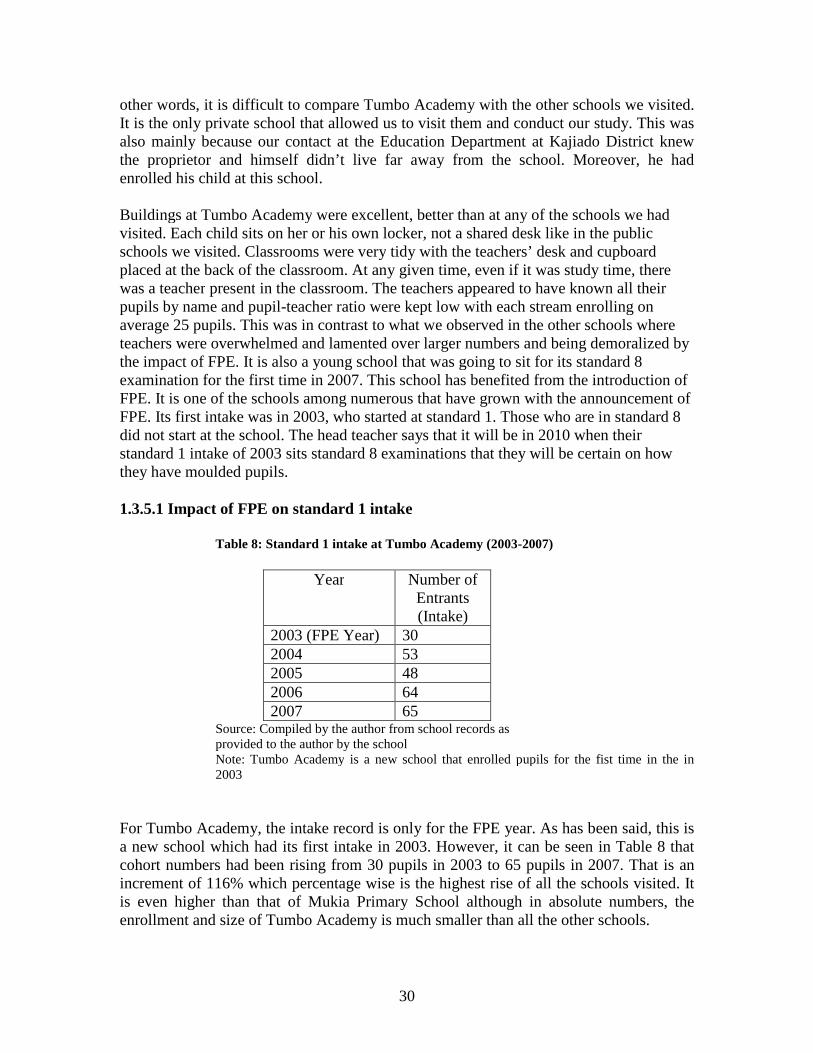
Table 6: Standard 1 intake at Mukia Primary School(1997-2007)
Year Number ofEntrants(intake)
2000 552001 582002 802003 (FPE Year) 1242004 1662005 1352006 1262007 115NB: The school did not keep/retain records before 2000.Source: Compiled by the author from school records asprovided to the author by the school.
There was massive impact of FPE on standard 1 intake at Mukia as can be seen in Table6. The impact is much greater than that experienced by Pembe, a nearby school. Forinstance the highest intake in the Pre-FPE period reviewed was 80 pupils whereas that ofthe FPE and post/FPE period is 166 pupils. The lowest intake in the pre-FPE period was55 pupils whereas that of the FPE and Post-FPE period was 115 pupils (Table 6). Theaverage annual standard 1 intake in the Pre-FPE period was 64.3 pupils whereas that ofthe FPE and post-FPE period was 133.2 pupils. This implies annual standard 1 averageintake rise of 107% in the FPE post-FPE period. We concluded based on Table 1 thatMukia experienced the greatest FPE impact of standard 1 intake than both Pembe andNgon’g Township, another school in this study. It was also greater than the impact felt inKisii schools. It can be interpreted that at Mukia FPE removed the greatest barrier toentry or that Mukia catchment area may have had the greatest challenge in enrollingpupils in the pre-FPE period due to cost barriers. Once FPE was announced and the directcost barrier removed, many parents sent their children to school. It can also be interpreted
6 Based on author’s interview with the headmaster.

26
that Mukia did not have major ‘hidden’ costs in the FPE and post-FPE period whichwould hinder parents from enrolling their child in the school.
1.3.3.2 The impact of FPE on progression
For the pre-FPE cohort of 2000, FPE had some impact on its pattern of progression. Thecurve in Figure 6 shows that there was improvement in 2003 which is the year when FPEwas announced from 65 pupils in 2002 to 84 pupils in 2003. However, subsequent yearssaw this number decline such that by 2007 there were only 35 pupils of the 2000 cohortstill enrolled, and this includes those who joined along the way as a result of FPE fromother schools as well as repeaters.
FPE did not affect the progression pattern of the 2001 cohort. In 2002, this cohort was 56pupils and it stayed 56 in 2003. There was increased enrollment in the cohort in 2004 to68 pupils but then a downward trend kicked in subsequently such that by 2007, therewere only 51 pupils enrolled.
Figure 6: Mukia Primary School Cohort Intake and Progression Curves 2000-2007
0
20
40
60
80
100
120
140
160
180
Y2000 Y2001 Y2002 Y2003 Y2004 Y2005 Y2006 Y2007
Year
En
rollm
en
t
Std1 2000
Std1 2001
Std1 2002
Std1 2003
Std1 2004
Std1 2005
Std1 2006
Std1 2007
FPE
The 2002 cohort who is the cohort before FPE kicked in shows a declining curve trendthroughout. This is in contrast to the 2002 cohort at Pembe Primary (Figure 5) whichwitnessed the greatest cohort progression impact associated with FPE.
While there was massive intake in 2003 at 124 pupils at Mukia, progression was poor,indicating problems with retention. Of the 124 pupils who started, only 75 pupils wereenrolled in 2005, and this number includes those who joined along the way. In 2007, the2003 (FPE cohort) had only 64 pupils. This means that from the starting cohort, 48.4%had dropped from the school by 2007. A similar trend is witnessed in the 2004 cohort,one year after FPE kicked in. The cohort started with 166 pupils, which is the highestintake in the school under the period of the study. It then declined steeply such that by2007, only 103 pupils were still enrolled, and this number include net gain- in other

27
words those who left and those who joined along the way. In total, between intake in2003 and 2007 when the record was taken, 38% had left the cohort.
Based on Figure 6, it was confirmed that unlike Pembe, Mukia had little re-entries and in-transfers into the school. The declining trend of cohort progression continued for the2005 and 2006 intake. WE concluded from the curves in Figure 6 is that Mukia had aserious retention problem, especially in the post-FPE period, compared to the pre-FPEperiod. It does suggest that FPE exacerbated retention problem rather than helping toimprove it, as would have been expected (i.e. FPE had a negative impact on retention atMukia). The trend is similar to that observed at Nyati Primary School in Kisii district.
1.3.4 Macho Primary School
Ngong is rather a very different part of Kajiado District. It is not semi arid; instead it isfertile, with significant dairy farming. It has a larger settler population of farmers, mainlyKikuyu tribe alongside the Masaai communities. It also has become a suburb of Nairobias it is not very far away from Nairobi, with a growing cosmopolitan population ofvarious Kenyan tribes. Because of this, it has a mixture of wealthy group leaving side byside with poor and Masaai pastoralists. There are also several private academies aroundthe thriving township, mostly serving the wealthy. Macho Primary school however,mostly serves pupils from poor background, including orphans. The school operates threestreams for each class from standard 1 to standard 8. Approximately 60 pupils enrolled atthe school are orphans who have lost both parents, most likely due to HIV/AIDS.Majority of pupils are from single parent families, mainly women. Its catchment areasinclude Mathare informal settlement (slum) and Gachagi informal settlement (slum) inNgong town. Uniform is required, sometime a major problem for the poorest pupils. Thehead teacher said enrollment has gone up since FPE and the workload for teachers is veryhigh. He lamented over lack of enough staff. The school operates a feeding programmewhich includes lunch sponsored by World Food Programme, although parents contributeto pay for the salaries of those who prepare the food (cooks). The head teacher said thatsince FPE was announced and introduced in 2003, parents attitude is that everythingregarding schooling is now free, and they have become more relaxed about the costsassociated with the education of their children. Facilities are not enough and theclassrooms are very crowded. One stream has on average 70 pupils. Feeding programmeis expensive and yet very useful. The head teacher said that most pupils only managed tohave a hot meal at school and for some that would be their only major meal.
Due to a high number of private academies in Ngong area, most professionals did nothave their children enrolled at Macho Primary School. This was therefore a school for thepoor, much more so than Pembe Primary School. The school had water and electricity.Windows had window paints and grill. The classroom floor was cemented. Overall, theschool appeared to have reasonable basic facilities.

28
1.3.4.1 The impact of FPE on standard 1 intake
Table 7: Standard 1 intake at Macho Primary School (2000-2007)
Year Number ofEntrants(intake)
2000 1522001 1652002 1592003 (FPE Year) 1782004 1892005 1952006 2012007 194
Source: Compiled by the author from school records asprovided to the author by the school
NB: The school did not keep/retain records for the years before 2000.
Table 7 indicates that there was immediate impact of FPE on standard 1 intake jumpingfrom 159 pupils in 2002 to 178 in 2003. The highest intake in the pre-FPE period was165 pupils and the lowest was 152 pupils. The highest intake in the FPE and post-FPEperiod was 201 pupils in 2006 and 178 pupils in 2003. Table 7 indicates that there wereaccess problems in the pre-FPE period that was improved by FPE. The average intake inthe Pre-FPE year was 158.6 pupils and that of FPE and post-FPE period was 191.4pupils. This is an annual average intake rise of 20.6% attributable to FPE. Still, theimpact was not as significant compared to that experienced at Pembe and at Mukia. Thismay indicate that Macho Primary School had access characteristic as those seen at NyatiPrimary School in Kisii district. It didn’t have major access barriers in the pre-FPE periodwhereas Pembe appear similar to Ndovu as a school with major access barriers in the pre-FPE period.
1.3.4.2 Impact of FPE on cohort progression pattern
Macho Primary School has a better cohort progression pattern than Mukia PrimarySchool, because it had a better retention. For instance, the 2000 pre-FPE cohort showonly modest decline. It started with 152 pupils and by 2007 they were 125, which is anoverall retention of 82.2%. Based on Figure 7, it was confirmed that there were very fewre-entries or in- transfers, if any, as the number in 2002 for the 2000 cohort was 124pupils and that of 2003, FPE year was only a slight increment to 128 pupils. The 2001cohort however, witnessed some changes in cohort pattern following FPE. It had 139pupils in 2002 which shot up to 145 pupils in 2003 which is the year FPE was introducedand then went up further to 156 pupils in 2004. But considering that it had started with165 pupils, there was no net gain. By 2007, there were 153 pupils still enrolled in this

29
cohort. The 2002 cohort also didn’t witness major FPE impact. This is similar to the samecohort at Mukia but different from the same cohort at Pembe. There were 152 pupilsstarting in 2002 and in 2003, the FPE year, it had slightly increased to 160 pupils.
The 2003 cohort exhibit a pattern different from the rest of the patterns of the othercohorts. It has steep curves indicating sudden entry and sudden exit. It started with 178pupils which two years later in 2005, had declined to 156 pupils. It rose suddenly in 2006to 184 pupils and was 183 pupils in 2007.
Figure 7: Macho Primary School Cohort Intake and Progression Curves
2000-2007
0
50
100
150
200
250
Y2000 Y2001 Y2002 Y2003 Y2004 Y2005 Y2006 Y2007
Year
En
roll
men
t
Std1 2000
Std1 2001
Std1 2002
Std1 2003
Std1 2004
Std1 2005
Std1 2006
Std1 2007
FPE
Based on Figure 7, it was confirmed that Macho Primary School experienced someimprovement in cohort progression following FPE, but this was to a lesser magnitudecompared to the experience at Pembe Primary School. Figure 7 however does not fullyconfirm that FPE made impact on retention at the school, given the shape of the pre-FPEand post-FPE cohort curves.
1.3.5 Tumbo Academy
Tumbo Academy is a different type of school from all the other schools we visited inKajaido and Kisii districts. It is located in Ngong Division, not far from Ngong town butit is a private school. It is run by a family of educators who operate it like a business.There are several similar schools in the area. It has very good buildings; the pupils lookvery different from the pupils we saw in other schools in terms of their dressing andconfidence. As would be expected it obviously serves children from professional familybackground and with reasonably high income. The school is small, class sizes are keptsmall, and it has several school buses, electricity and water. It is very neatly kept and thelearning environment was very different from what we had observed in other schools. In
30
other words, it is difficult to compare Tumbo Academy with the other schools we visited.It is the only private school that allowed us to visit them and conduct our study. This wasalso mainly because our contact at the Education Department at Kajiado District knewthe proprietor and himself didn’t live far away from the school. Moreover, he hadenrolled his child at this school.
Buildings at Tumbo Academy were excellent, better than at any of the schools we hadvisited. Each child sits on her or his own locker, not a shared desk like in the publicschools we visited. Classrooms were very tidy with the teachers’ desk and cupboardplaced at the back of the classroom. At any given time, even if it was study time, therewas a teacher present in the classroom. The teachers appeared to have known all theirpupils by name and pupil-teacher ratio were kept low with each stream enrolling onaverage 25 pupils. This was in contrast to what we observed in the other schools whereteachers were overwhelmed and lamented over larger numbers and being demoralized bythe impact of FPE. It is also a young school that was going to sit for its standard 8examination for the first time in 2007. This school has benefited from the introduction ofFPE. It is one of the schools among numerous that have grown with the announcement ofFPE. Its first intake was in 2003, who started at standard 1. Those who are in standard 8did not start at the school. The head teacher says that it will be in 2010 when theirstandard 1 intake of 2003 sits standard 8 examinations that they will be certain on howthey have moulded pupils.
1.3.5.1 Impact of FPE on standard 1 intake
Table 8: Standard 1 intake at Tumbo Academy (2003-2007)
Year Number ofEntrants(Intake)
2003 (FPE Year) 302004 532005 482006 642007 65
Source: Compiled by the author from school records asprovided to the author by the schoolNote: Tumbo Academy is a new school that enrolled pupils for the fist time in the in2003
For Tumbo Academy, the intake record is only for the FPE year. As has been said, this isa new school which had its first intake in 2003. However, it can be seen in Table 8 thatcohort numbers had been rising from 30 pupils in 2003 to 65 pupils in 2007. That is anincrement of 116% which percentage wise is the highest rise of all the schools visited. Itis even higher than that of Mukia Primary School although in absolute numbers, theenrollment and size of Tumbo Academy is much smaller than all the other schools.

31
The aim of FPE was to remove cost barriers and make education in government schoolsfree of tuition and other related costs such as those of text books and maintenance fees.Parents would be expected to withdraw their children from fees paying schools and enrollthem in the free government schools. It would be expected that when education is free,fee charging schools like Tumbo Academy would struggle to recruit pupils. However, theexperience of Tumbo Academy shows this was not the case. If anything, theestablishment of Tumbo Academy was in part motivated by the announcement of FPE.As can be seen in Table 8, finding pupils to enroll was not Tumbo’s problem. It showsthat FPE didn’t eliminate differentiated demand or put differently encourageddifferentiated demand by parents who may have felt that the education of their childrencould not be better achieved in the public system. This is mainly because there areparents who felt that quality at the public school was affected by FPE. It is a classic casewhere government policy can stimulate differentiated demand by enacting a policy thatmakes public schooling undesirable to some parents.
1.3.5.2 Impact of FPE on cohort progression pattern
There was steady cohort progression at Tumbo Academy (Figure 8), associated with lowexit/dropout and high retention rate. Figure 8 also indicate that there were in-transfers toTumbo Academy along the way. For instance, the 2003 cohort started with 30 pupils. Ayear later, they had expanded to 54 pupils and in 2007, they were 64 pupils. That is anincrease of 116% from the initial intake.
Figure 8: Tumbo Primary School Cohort Intake and Progression Curves 2003-2007
0
10
20
30
40
50
60
70
80
Y2003 Y2004 Y2005 Y2006 Y2007
Year
En
rollm
en
t Std1 2003
Std1 2004
Std1 2005
Std1 2006
Std1 2007
FPE
32
It is only at Tumbo Academy that all cohorts experienced continuous expansion and nodecline. Based on Figure 8 it can be said that Tumbo Academy had steady retention andprogression and expanded cohort caused by transfers to the school. It is a case where FPEwas benefitting private fee-paying institution rather than creating challenges ofrecruitment as would have been thought.
1.4 Conclusion
From the cohort curves of the 8 schools in the two quite different districts, we concludedthat FPE has had varying impact depending on the location of the school. For NdovuPrimary school in Kisii District which has similar historical characteristics as PembePrimary school in Kajiado District, FPE has led to significant rise in enrollment. It meansthat there were significant barriers to access that have been eliminated or reduced byFPE. The two schools have also experienced greater in- transfers and some re-entries.This is because they were both selective schools in the pre-FPE period but FPE hasreduced their selective leverage which has subsequently allowed pupils from poorfamilies to join these schools. For Nyati primary school in Kisii District and MachoPrimary school in Kajiado District, FPE has not made a big difference compared toNdovu and Pembe. This is because they had lesser entry barriers in the pre-FPE periodcompared to Ndovu and Pembe. Mukia primary school in Kajiado District has witnessedthe greatest rise in intake but also the greatest exit in the post- FPE period. This isbecause FPE motivated/inspired parents to send their children to the school but it alsomotivated them to withdraw them from the school once they felt the quality of educationoffered under FPE was poor and to send them to other schools, which is what explainsthe sudden exit.
For the rural school like Simba primary school in Kisii District and Sungura primaryschool, the impact has not been dramatic in both intake and progression. However, eventhough it is a remote school, Simba primary school had a better progression pattern thanboth Sungura and Nyati primary schools. This indicates that pupils in remote ruralschools may in fact have better attendance and motivation to stay in school than pupils inurban slum schools.
It would have been expected that FPE would discourage attendance to fees payingschools but the case of Tumbo Academy proves this to have not been the case. Ifanything FPE motivated the establishment of Tumbo Academy. Tumbo Academybenefited from FPE as differentiated demand kicked in due to perceptions of decliningquality in free public school which parents are said to have blamed on large class sizes.
From this study we conclude that schools that had least barriers for access in the pre-FPEperiod did not experience the greatest impact while those that had greater barriersexperienced the greatest impact. In the former category are Ndovu and Pembe primaryschools and in the later category are Nyati and Macho Primary Schools. The latter servemainly informal settlement dwellers while the former can be classified as serving ‘middleincome’ groups. The fact that a school is remote may not mean that it has greater accessand progression problem. The case of Simba Primary school indicates that a remote

33
school may sometimes have stable enrollment and experience less movement in terms ofentries and exit. While FPE has improved overall chances of attending a school in Kenyaas the case of these 8 schools demonstrate, it has also emerged that the hardest to reachchildren may not be benefiting from FPE, and they seem to be found largely in schoolslocated in urban informal settlements (slums).

34
2. The Impact of FPE on Cohort Repetition, Transfers, and AgePatterns- and an assessment Pupils Household Characteristics
2.1. Introduction
The purpose of Part 2 is to present an analysis of the impact of FPE, a supply sideeducation policy on inclusion and exclusion in the CREATE Zones 1-3 in two districts inKenya. CREATE’s Zone 1 focuses on those denied access. The analysis provided in thispaper provides a description as to whether and how FPE changed access in the selectedeight schools. CREATE’s Zone 2 focuses on those children who are excluded afterinitial entry, often a result of dropping out or temporary withdrawal. The descriptiveanalysis provided in this section focuses on Zone 3 which pays attention to those inschools but at the risk of dropping-out. Repetition and low achievement are interrelatedand are pre-cursors to dropping-out.
These factors associated with exclusion in Zones 1-3 were studied based on a randomsample of all standard 5 and standard 8 pupils in 4 Schools in Kisii and 4 schools inKajiado districts in Kenya in 2007. The purpose of this sample was to assess the impactof FPE on pre-FPE cohorts (represented by standard 8 in 2007) and the FPE cohort(represented by standard 5 pupils in 2007). The random sample is one third of eachstandard in each of the schools visited during this study. The random sample wasachieved by selecting the third or the pupils who would represent a third of the entirestandard enrollment. Where there were three streams as most were, one third wasrandomly selected from each stream. The selection was gender sensitive. First all girlswere separated from boys and one third selected from each of the sexes.
Once the sample was selected, they were separated to a different room and aquestionnaire administered to them. Where it was necessary, they were assisted tounderstand what the question asked of them by translating the questions verbally inKiswahili. The questionnaire covered fixed variables such as gender, age, but alsorandom variables such as year they started school, whether they have repeated a class,how many times they had repeated, whether they had transferred from one school toanother, and how many time they had transferred, and when they transferred. It alsocovered family background information such as number of siblings, educationalattainment of parents, occupation of parents, land ownership, and who worked thefarm/land. The family background questions were aimed at establishing albeit crudely orto act as proxy for household poverty.
To corroborate what was said in the questionnaire, students were asked to write an openended essay about their life, things that made them happy at home and those that madethem sad, and those things that made them happy and sad at school.
In this part, I present the response to the questions and a descriptive analysis. Thedescriptive analysis is mainly aimed at demonstrating the impact of FPE by comparing

35
the pre-FPE cohort profiles with the FPE cohort profiles, noting differences andsimilarities and assessing on what accounts for the differences.
In part I of this report the focus was on analysing the impact of FPE on standard 1 cohortintake and progression in the 8 schools visited. While it provided snap shot picture of the8 schools and how CREATE Zones 1-4 were affected by FPE policy, the information wasmainly on intake and did not include such inhibiting factors of progression such asrepetition and household poverty. By focusing on these specific factors, this partcomplements the analysis on intake and progression done earlier in part I. In part 1 weconcluded that there has been varied impact of FPE on cohort intake and progressiondepending on the location of the school. It was however noted that there wasn’t a ‘bigbang’ immediate impact in most of the schools. Even where there had been increasedenrollment in the FPE period, progression was a problem. It was concluded that whileinitial entry had been improved as a result of FPE, Zone 2 of CREATE where a greatmajority of pupils withdraw after initial entry kicked in quickly in the post- FPE years. Italso meant that Zones 3 and 4 of CREATE was a problem as these pupils were likely tobe repeaters and low-achievers and consequently excluded from lower secondary as aresult of being unable to successfully complete primary. One of the key factors thatwould account for problems in Zones 1-4 include drop out. Among the pre-cursor to dropout as noted on CREATE webpage is repetition and household poverty. Repetition is dueto low-achievement.
The description of the schools visited was provided in part I.As has been noted, the sample was fairly gender representative. Figure 1 shows that therewas a near balance of selection resembling the gender parity in the classes we visited. Insome schools boys were slightly more than boys and in others girls were slightly morethan boys.
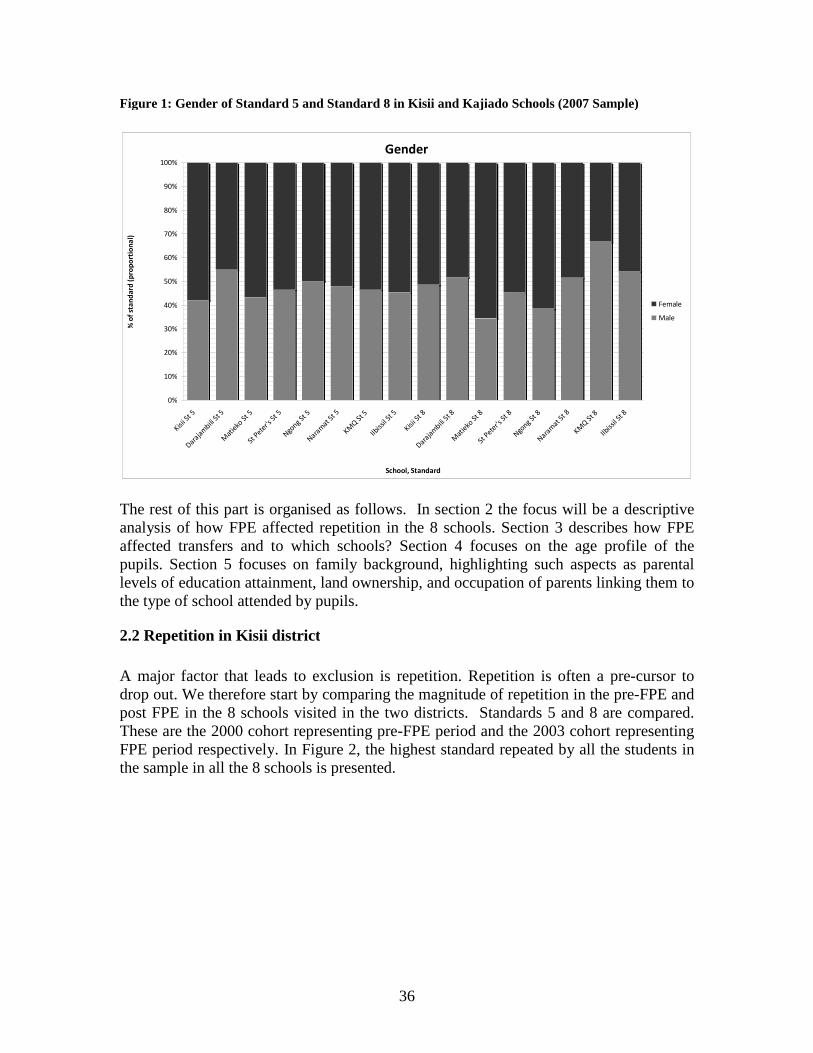
36
Figure 1: Gender of Standard 5 and Standard 8 in Kisii and Kajiado Schools (2007 Sample)
Gender
0%
10%
20%
30%
40%
50%
60%
70%
80%
90%
100%
Kisii S
t 5
Daraja
mbili
St 5
Mat
ieko
St5
StPete
r'sSt
5
Ngong St
5
Naram
at St5
KMQ
St 5
Ilbiss
il St 5
Kisii S
t 8
Daraja
mbili
St 8
Mat
ieko
St8
StPete
r'sSt
8
Ngong St
8
Naram
at St8
KMQ
St 8
Ilbiss
il St 8
School, Standard
%o
fst
an
dar
d(p
rop
ort
ion
al)
Female
Male
The rest of this part is organised as follows. In section 2 the focus will be a descriptiveanalysis of how FPE affected repetition in the 8 schools. Section 3 describes how FPEaffected transfers and to which schools? Section 4 focuses on the age profile of thepupils. Section 5 focuses on family background, highlighting such aspects as parentallevels of education attainment, land ownership, and occupation of parents linking them tothe type of school attended by pupils.
2.2 Repetition in Kisii district
A major factor that leads to exclusion is repetition. Repetition is often a pre-cursor todrop out. We therefore start by comparing the magnitude of repetition in the pre-FPE andpost FPE in the 8 schools visited in the two districts. Standards 5 and 8 are compared.These are the 2000 cohort representing pre-FPE period and the 2003 cohort representingFPE period respectively. In Figure 2, the highest standard repeated by all the students inthe sample in all the 8 schools is presented.

37
Figure 2: Grade Repetition and non Repetition by Standard 5 and Standard 8 pupils in Kisii andKajiado District (2007 Sample)
Highest Standard repeated (Total response)
0%
20%
40%
60%
80%
100%
Ndovu
St5
Nyati
St5
Sim
baSt
5
Sung
uraSt
5
Mac
hoSt
5
Tum
boSt
5
Muki
aSt
5
Pem
beSt
5
Ndovu
St8
Nyati
St8
Sim
baSt
8
Sung
uraSt
8
Mac
hoSt
8
Tum
boSt
8
Muki
aSt
8
Pem
beSt
8
School, Standard
%ofst
andar
d(p
roport
ion)
8
7
6
5
4
3
2
1
0
2.2.1 Ndovu primary school
As can be seen in Figure 2, more than half the pupils in standard 5 (the FPE cohort) atNdovu primary school had repeated a class. The classes frequently repeated werestandard 4 and 5. The 0 (zero) represent non repeaters and is included here to demonstratethe level of repetition relative to the class enrollment. It appears there was little repetitionin standards 1 and 2 as might have been thought. Figure 2 shows that there was higherrepetition the higher the class got. Pupils were three times more likely to repeat standard4 and 5 compared to standards 1 and 3.
For standard 8 pupils (the pre-FPE cohort) only 34% compared to 46% of the FPE cohorthad repeated, and standard 6 was the one most frequently repeated. This was followed bystandard 7. This is because it is at these higher grades that hidden costs are greater andpreparations for standard 8 final examination begins. Some pupils were held back by theirschools so as to improve the school’s overall standing at standard 8 examination results.
2.2.2 Nyati Primary School
In contrast to Ndovu, Nyati primary school had a very high repetition in standard 1 andless repetition in standard 3 and 4. Our sample did not show repeaters in standard 2. Theexplanation was that pupils came to school unprepared at Nyati compared to Ndovu. Italso implies that they easily progressed through standard 2 to 4. It is in standard 5 that weover sudden start to see a rise in repetition similar to that seen at Ndovu. This is becauseteachers began to hold pupils back to weed out those who were too weak to continuetowards standard 8.

38
Standard 8 at Nyati presents a different pattern compared to that seen at Kisii. Repetitionappears to be evenly distributed across all standards although standard 1 shows higherrepetition than at Ndovu. While repetition is greater the higher up the class at Ndovu, thereverse is observed at Nyati where it is highest in lower classes. It means that pupils wereless held back at Nyati compared to Ndovu. It also means that at Nyati, most weak pupilshad long dropped out given its poor cohort retention and progression pattern (see level 1analysis Figure 2).
Comparing Ndovu and Nyati (Figure 2), it can be said that FPE did not have majorimpact in reducing repetition at Ndovu whereas it did at Nyati. For instance, standard 1was repeated less frequently by both FPE and pre-FPE cohorts at Ndovu whereas at Nyatithere was higher frequency of repetition in standard 1 in the FPE cohort compared to thatamong the pre-FPE cohort. Similar trend is seen for standards 4 and 5 at Nyati. AtNdovu, however, the FPE cohort experienced frequent repetition in standards 4 and 5compared to the pre-FPE cohort which had a much less frequent repetition of theseclasses.
2.2.3 Simba Primary School
The sample of standard 5 at Simba Primary School reported no repeaters. This was oddgiven the remote and rural location of the school. However, this was the case becausedemand for places was lower at Simba due to stable rural population and the school wastherefore not under any undue pressure from those transferring into the school. Becauseof this, it was’ easy’ to move up the classes even where a pupil was a low achievercompared to Kisii where low achievers found it difficult to survive through the system.Another explanation for lack of repeaters is that Simba being a rural school, most pupilscame to school with nearly similar levels of academic preparedness. There would be littleheterogeneity in terms of household advantage among the pupils who enrolled at Simbaas compared to both Ndovu and Nyati which due to their urban location had much biggerpupils’ household heterogeneity. These are reasons why no pupil reported havingrepeated at Simba.
For the Pre-FPE cohort, those in standard 8, repetition was not a huge problem at Simbacompared to Nyati. More than 60% had not repeated a class, but more than 30% hadrepeated. The classes frequently repeated were standard 2 and 7 followed by standard 6and standard 4. On this, Simba faired better than Nyati.
2.2.4 Sungura primary school
Sungura is a rural school located a long a major highway making it less remote comparedto Simba primary school. As can be seen in Figure 2, 40% of the FPE cohort hadrepeated. The most frequently repeated classes were standards 1, 2 and 5. However,repetition was a big problem at Sungura compared to Ndovu and Simba. It was onlybetter than at Nyati. For the Pre-FPE cohort about 62% had not repeated. The classesfrequently repeated by the cohort were standards 2 and 6. On this cohort, Sungura’s againfaired better than Nyati.
39
2.2.5 Conclusion
In conclusion, it was Nyati primary school that had the worst repetition problem of the 4schools visited in Kisii District. As was described in Part I of this report, Nyati is locatedin the informal settlement (slum) near Kisii town. However, it is also at Nyati primaryschool where FPE seem to have had positive impact in reducing repetition. This isdemonstrated by the larger number of those who had not repeated in the FPE cohortcompared to the pre-FPE cohort. At Ndovu Primary School, FPE appear to haveincreased instead of reducing repetition. At Simba Primary School, FPE also reducedrepetition as no pupil in the FPE cohort reported having repeated a class.
In all the four schools visited in Kisii district, it appears school location determined theimpact of FPE on repetition. This is explained by transfers, a factor that we shall turn tolater in the paper. Ndovu primary school attracted larger transfers, leading to repetition.Simba primary school did not attract transfers due to its rural location, hence the lessrepetition. Nyati primary school attracted new entrants into standard one who otherwisewould not be in school, hence the large repetition in standard 1. Based on our analysisand subsequent visit to the schools, it was confirmed that repetition was being driven byin-transfer for some schools (notably Ndovu primary School) and increased access bythose who would otherwise be out of school were it not for FPE (notably Nyati primaryschool). In the next section, I focus on Kajiado district to assess whether patterns seen atKisii were there too.
2.3 Repetition in Kajiado district
2.3.1 Pembe primary school
The class most frequently repeated by the FPE cohort was standard 1 and standard 4. Forthe pre-FPE cohort, it was standards 5, 7 and 6 that were frequently repeated. It appearsthat in the pre-FPE period, repetition was not there in lower classes, an indication that theschool was selective. Repetition comes in the higher classes, an indication that pupilswere being held back by the school in preparation for better performance in standard 8. Itis in higher classes where they start to sit for Mock examination and a pupil’sperformance in this examination could have been used to hold them back.
In the FPE cohort, selection had been removed as FPE improved access. However, thismeans that weaker pupils were admitted to the school and teachers may have started toweed the weak ones much earlier at standard 1 (although the school could not admit tothis as it i8s against the FPE policy). It was confirmed that repetitions in the FPE cohortwere due to in-transfers who were joining the school from other schools and given thereputation of the school, some of the in-transfers entered at the same grade where theyhad left their previous school. We shall turn to this when we assess the level of transferinto the school in later sections of the paper.
2.3.2 Mukia primary school
52% had repeated at Mukia primary school among the FPE cohort sample. The classesmost frequently repeated were standard 4 and 5, similar to what was observed at Ndovu
40
primary school. There was also frequent repetition in standards 1 and 3 (Figure 2). Therewas higher repetition in the FPE period than in the pre-FPE period. For instance, about82% of the pre-FPE cohort reported that they had not repeated a class compared to FPEcohort of 48%. For the Pre-FPE cohort, it is standard 4, 7 and 8 that had been repeatedmore frequently. It is surprising that repetition was even in all these three classesindicating that most pupils were being held back. Lack of repetition in lower classessuggests that the school was selective and/or that it didn’t pay attention to the level ofpupils’ performance in lower classes. It could also suggest that weaker students droppedout much earlier. Looking at repetition frequency in standard 4 for both FPE and pre-FPEcohorts, it can be seen that there was slightly more frequent repetition in the FPE yearthan in the pre-FPE year.
2.3.3 Macho primary school
About 88% of pupils in the FPE cohort had not repeated. Standard 4 was the mostfrequently repeated class (Figure 2). Of all the four schools studied in Kajiado District,Macho primary school had the least repetition among the FPE cohort. This was said to bedue to low levels of in-transfers into the school and an improved access to the schoolfollowing FPE. It means that FPE removed barriers to those who would otherwise be atthe risk of dropping out.
For the pre-FPE cohort, repetition was more common compared to the FPE cohort. Only30% of the pre-FPE cohort reported that they had repeated. Put differently, 70% hadrepeated compared to FPE’s 12%. The classes most frequently repeated were standard 7and 6. Frequent repetition in standard 6 and 7 signal that the school held pupils back inorder to improve their standing in standard 8 examinations; however when interviewedthe head teacher was not ready to admit to this. Based on Figure 1, it is evident that FPEhad massive impact in reducing repetition at Macho primary school. It might be the casethat FPE improved access and once enrolled, pupils were not held back even if they werelow achievers. It may also mean that teachers were no longer concerned about the qualityof education in the FPE period as they did in the pre-FPE period, a point that some of theteachers we talked to admitted. Given the massive impact in terms of enrollmentfollowing FPE, the numbers that would have been held back might have been too highsuch that there would be no space to accommodate new entrants. Macho might be aclassic case where repetition was reduced due to FPE but at the expense of quality.
Higher repetition in the pre-FPE cohort could be explained by transfer and lowachievement. Given the frequency of repeaters in higher classes, it can be argued thatMacho was a school that had achievement problem in the pre-FPE period. The problemmay have persisted in the FPE period but now teachers were less inclined to hold pupilsback as FPE required that all children be enrolled in school.
2.3.4 Tumbo Academy
Given the small class size, we did not sample at Tumbo. Instead, the whole class instandard 5 and standard 8 were asked to complete the questionnaire. As can be seen in

41
Figure 2, there was low repetition at Tumbo among both FPE and pre-FPE cohorts.About 86% of the standard 5 pupils had not repeated and about 88% of the standard 8cohort had not repeated.
Overall, Pembe and Mukia had reasonably low repetition in the pre-FPE cohort and it isonly at Macho where repetition was high in the pre-FPE period. This might be the casesince Macho’s location means that it accepted pupils who came from poor householdsand may have been unprepared to lean when they joined the school. Many wouldtherefore be held back to improve the schoolings academic standing. In the FPE, therewas no holding them back. At Pembe and Tumbo, those who joined in the FPE werethose who would have otherwise not been allowed to these schools, one of the reasonswhich serve to explain increased repetition in the FPE period.
2.3.5 Conclusion
We concluded that while FPE helped to reduce repetition at Macho primary whererepetition had been a huge problem in the pre-FPE period, it increased repetition in theother schools. This is explained by the fact that FPE requires that no school should beselective based on any criteria. It is only at Tumbo where the background of the pre-FPEand FPE cohorts were similar; which might explain why there was no difference inrepetition between the FPE and pre-FPE cohorts.
Like in Kisii district, it appears that school location matters when it comes to the impactof FPE. Where transfer was high for those who had been excluded due to school barriers,transfers may explain increased repetition in the pre-FPE cohort and new entrants whoare under-prepared may explain increased repetition in the FPE period. The pattern atTumbo Academy provides the basis that this may be a true reason for the differencebetween FPE repetition and pre-FPE repetition.
In the next section, we move further with repetition to look at the number of repetitions.This can be assessed by looking at how many times a pupil repeated or by looking atwhen they started school. In Figure 2, the focus was only on non repetition in relation torepetition and the classes frequently repeated. Figure 3 and Figure 4 enable furtheranalysis on repetition. As can be seen in Figure 3 the majority of those who reported thatthey had repeated had only repeated once. As already noted from Figure 2, repetitionwas high at Nyati and at Macho, two schools that have comparable settlement catchmentareas. Both schools serve pupils from urban informal settlement (slums) and it appears inthese schools, repetition is a problem. Of interest is also that fact that Ndovu and Pembe,again two similar schools, had pupils who had repeated two and three times. This may beexplained by in-transfers to these schools following FPE. It is only at Mukia that therewere pupils who had repeated 4 times.

42
Figure 3: Number of Repetition by Standard 5 and Standard 8 pupils in Kisii and Kajiado Schools(2007 Sample)
Number of repeats (total response)
0%
20%
40%
60%
80%
100%
NdovuSt 5
Nyati
St 5
Simba
St5
Sungu
raSt
5
Mac
hoSt
5
Tumbo
St5
Mukia
St5
Pembe
St 5
NdovuSt 8
Nyati
St 8
Simba
St8
Sungura
St 8
Mach
oSt
8
Tumbo
St8
Mukia
St8
Pembe
St 8
School, Standard
%o
fst
an
da
rd(p
rop
ort
ion
)
4
3
2
1
0
Figure 4: The year Standard 5 and Standard 8 pupils in Kisii and Kajiado Schools started school(2007 Sample)
Year started school
0%
10%
20%
30%
40%
50%
60%
70%
80%
90%
100%
NdovuSt
5
Mac
hoSt 5
Tumbo
St5
Mukia
St5
Simba
St5
Sungura
St5
Nyati
St5
Pembe
St 5
NdovuSt
8
Mac
hoSt 8
Tumbo
St8
Mukia
St8
Simba
St8
Sungura
St8
Nyati
St8
Pembe
St 8
School, Standard
%o
fst
an
da
rd(p
rop
ort
ion
al) 2006
2005
2004
2003
2002
2001
2000
1999
1998
1997

43
2.4 Repetition: Further Analysis in Kisii district
2.4.1 Ndovu primary school
Our two cohorts ought to have started school in 2000 and 2003 to be in standard 8 andstandard 5 respectively without repeating by 2007. 73% of our random sample ofstandard 8 reported that they had started school in 2000. That means they had notrepeated any class since they started school. 18% had repeated once and 9% had repeatedtwice. For the FPE cohort, only 55% had started school in 2003 and stayed on withoutrepeating a class. 35% had repeated once and 10% had repeated twice. FPE appears tohave led to a rise in repetition.
2.4.2 Nyati primary school
Only 32% of our sample of those in standard 8 in 2007 had started school in 2000 (i.e.had not repeated a class since they started school). That compares poorly to Ndovu’s73%. 55% of our sample had repeated once compared to Ndovu’s 18%. 10% hadrepeated twice and 3% had repeated thrice. At Ndovu there were no pupils in our samplewho had repeated more than twice. In this regard, it is clear that there was seriousprogression problem at Nyati with most pupils repeating classes. For the FPE cohort,only 39% were in the correct class (i.e. had started school in 2003) and had not repeatedany class. This still compares poorly to Ndovu’s 55%. 45% of those in the FPE year atNyati had repeated once while 6% had repeated twice. Compared to Ndovu where 45%of the FPE had repeated, at Nyati 61% of the FPE cohort had repeated a grade. It can beconfirmed hat repetition was a major problem at Nayti both during the FPE and pre-FPEperiods (Figure 3 and 4).
2.4.3 Simba primary school
Simba, the remote rural school in Kisii district, 55% of those in standard 8 at the time ofour visit in 2007 had started school in 2000 and therefore had not repeated any class,compared to Ndovu 73% and Nyati’s 32%. It appears therefore that although a remoterural school, Simba did much better than Nyati. 34 % had repeated once, 7% had repeatedtwice and 3% had repeated thrice. Overall, only 45% had repeated a class at Simbacompared to Nyati’s 68%. At Ndovu, only 27% had repeated a class.
For the FPE group who started school in 2003, 97% had started school in 2003 and werein standard 5. This means they had not repeated. But 3% had repeated thrice. Here Simbadid much better than Ndovu where only 55% were in the correct grade and Nyati whereonly 39% were in the correct grade. This is unusual for a remote rural school, but it doesimply that there were few re-entries and transfers into the school and those pupils werenot held back. The 3% are likely to have been re-entries since that may have been out ofschool and were therefore those who came back to school following FPE. It can beconcluded that Simba had less repetition problem for the FPE cohort compared to bothNdovu and Nyati, both of which are urban schools (Figures 3 and 4).

44
2.4.4 Sungura primary school
Sungura, the fourth school visited in Kisii, 61% of standard 8 pupils in our sample hadstarted school in 2000 and therefore had not repeated. 26% had repeated once, 6% hadrepeated twice and another 6% had repeated thrice. On this it is second to Ndovu whichhad 73% in the correct grade. It did better than Simba which had 55% and much betterthan Nyati which had 32%. In other words, only 39% had repeated at Sungura comparedto Nyati’s 68% and Simba’s 45%.
For the FPE cohort who started school in 2003 and were therefore in standard 5 in 2003,61% had started in 2003 compared to Ndovu’s 55%, Nyati’s 39%. On this Sungura didbetter than both Ndovu and Nyati but worse that Simba which had 97%. At Sungura 25%of our sample had repeated once, 11% had repeated twice and 4% had repeated thrice(Figures 3 and 4).
Overall, it appears that for the FPE cohort, the rural schools in Kisii performed bettercompared to the urban schools. However, it has to be noted that in-transfers account forrepetition in some of the schools. Repetitions at Ndovu were due mainly to in-transfer tothe school and that the rural schools had less in-transfers due to their location. At Nyati,the repetition was explained less by in-transfers but more by re-entries, those who werecoming back to school once FPE was announced. It would imply that there was higherdropout at Nyati’s catchment area than at Ndovu and at Simba’s and Sungura. Putdifferently, pupils at Nyati were more likely to have dropped out and re-entered followingFPE compared to the other three schools. This issue will be revisited later in the reportwhen I turn to transfers.
2.5 Repetition: Further Analysis in Kajiado district
2.5.1 Pembe primary school
At Pembe 46% of the standard 8 pupils had started school in 2000 and had not repeatedany class. That means that 54% had repeated (more than half of the class). 32% hadrepeated once, 8% had repeated twice and 11% had repeated thrice. Repetition is likely tohave been due to those transferring to the school following FPE. I shall turn to this whenI look at the number of transfers and the year of transfers.
Even more interesting are those who skipped classes. 3% of our sample had joined theschool in 2004 and started at class 5. This means they had skipped 4 classes. This issomething that was not experienced in Kisii District schools.
For the pupils in standard 5 who had started school in 2003 (the FPE cohort), our sampleshowed that 39% had started in the right year and had not repeated a class. 45% hadrepeated once, and 8% had repeated twice. There were 6% who had skipped one classsince they started in 2004 and 3% who had skipped two classes as they started in 2005(Figure 3 and 4).

45
2.5.2 Mukia primary school
73% had started school in 2000 compared to Pembe’s 46%. 15% had started in 1999 andhad therefore repeated once. 6% had repeated twice and another 6% had repeated thrice.For the FPE cohort, 43% started in 2003 and were therefore in the correct class. Another43% started in 2002 and had therefore repeated once. 4% had repeated twice and another4% had repeated thrice. There was 4% who had skipped three classes as they started in2006 and were in standard 5 by 2007. In other words, they skipped class 1-3. Here tooMukia performed better than Pembe.
2.5.3 Macho primary school
Only 31% had started school in 2000 and had not repeated a class compared to Pembe’s46%, and Mukia’s 73%. It shows that Macho had the worst repetition compared to theother two schools. 58% had repeated once and 12% had repeated twice. For the FPEgroup who started in 2003, 81% had started school in 2003 compared to Pembe’s 39%,and Mukia’s 43%. Here Macho performed better than the two other schools. Only 13%had repeated once at Macho. Like Pembe, there were those who had skipped classes. 3%had skipped one class and another 3% had skipped two classes (Figures 3 and 4).
2.5.4 Tumbo Academy
At Tumbo Academy, the only private school in the study of the standard 8, 89% had notrepeated any class. 8% had repeated once. There was 3% who had skipped one class.Tumbo had the highest number of pupils who had not repeated any class, followed byMukia. For the standard 5, 87% had not repeated any class and 13% had repeated once,compared to Pembe’s 39%, Mukia’s 43%, and Macho’s 81%. It is at Tumbo where pupilshad repeated least of all the schools visited in Kajiado.
Based on Figures 2, 3 and 4, FPE appears to have impacted on schools differently. Insome, it increased repetition while in others it reduced repetition. Various factors alsoaccount for repetition based on school location. In some it was transfers that account forrepetition while in others it was improved access and re-entries that account for increasedrepetition. It also appears that the household background or the catchment area of aschool determined the different patterns of repetition in the FPE and pre-FPE cohorts. Itsuggests that schools located in urban informal settlements face the biggest challenge. Inthe pre-FPE period, they had very high repetition as majority of their pupils were lowachievers and might have been held back. In the FPE period, repetition is reduced butquality of education is likely to have become worse. Pupils might therefore progressthrough the system but learning very little. For some of the stable urban schools (e.g.Ndovu), FPE meant they were now accessible to those who were previously excluded dueto cost barriers. With FPE lifting these barriers, low achievers joined and since theschools wanted to maintain their quality, some pupils are held back. Another explanationis that pupils were transferred to these schools but starting at the same grade as the schoolthey had been to before transfers- so that they could cope with the academic level at theirnew school. This may explain the pattern at Ndovu and at Pembe. In such cases, FPEincreased rather than reduced repetition.
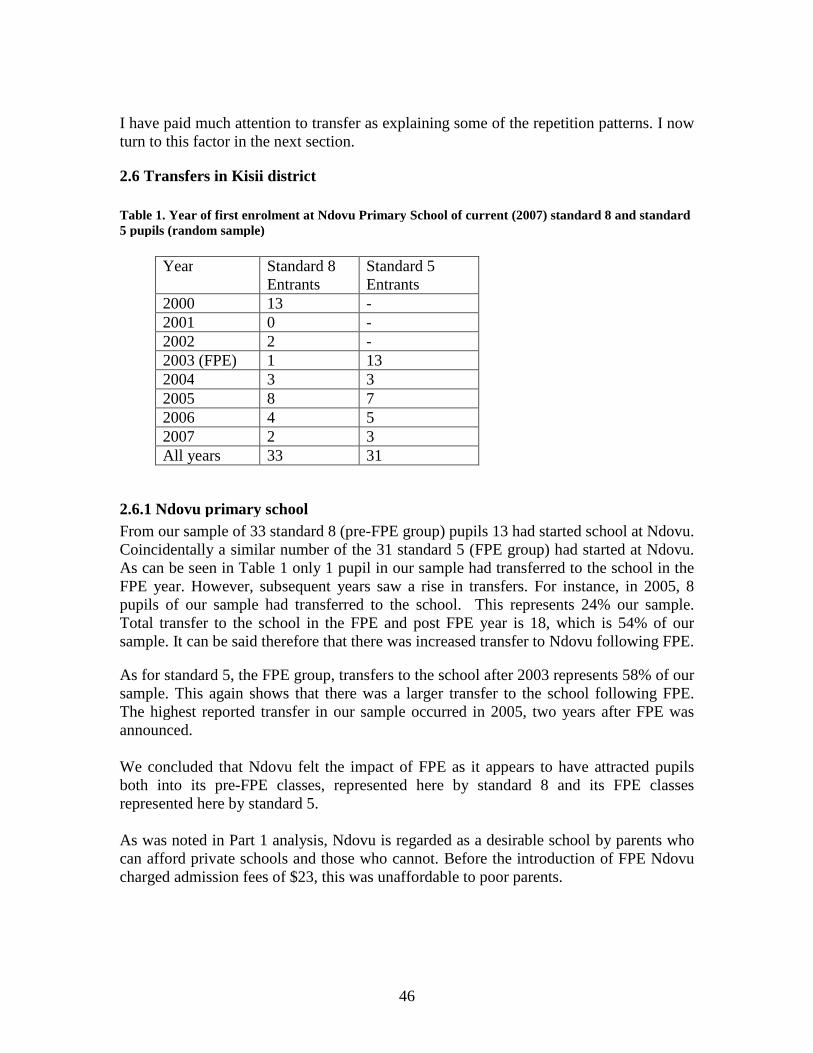
46
I have paid much attention to transfer as explaining some of the repetition patterns. I nowturn to this factor in the next section.
2.6 Transfers in Kisii district
Table 1. Year of first enrolment at Ndovu Primary School of current (2007) standard 8 and standard5 pupils (random sample)
Year Standard 8Entrants
Standard 5Entrants
2000 13 -2001 0 -2002 2 -2003 (FPE) 1 132004 3 32005 8 72006 4 52007 2 3All years 33 31
2.6.1 Ndovu primary school
From our sample of 33 standard 8 (pre-FPE group) pupils 13 had started school at Ndovu.Coincidentally a similar number of the 31 standard 5 (FPE group) had started at Ndovu.As can be seen in Table 1 only 1 pupil in our sample had transferred to the school in theFPE year. However, subsequent years saw a rise in transfers. For instance, in 2005, 8pupils of our sample had transferred to the school. This represents 24% our sample.Total transfer to the school in the FPE and post FPE year is 18, which is 54% of oursample. It can be said therefore that there was increased transfer to Ndovu following FPE.
As for standard 5, the FPE group, transfers to the school after 2003 represents 58% of oursample. This again shows that there was a larger transfer to the school following FPE.The highest reported transfer in our sample occurred in 2005, two years after FPE wasannounced.
We concluded that Ndovu felt the impact of FPE as it appears to have attracted pupilsboth into its pre-FPE classes, represented here by standard 8 and its FPE classesrepresented here by standard 5.
As was noted in Part 1 analysis, Ndovu is regarded as a desirable school by parents whocan afford private schools and those who cannot. Before the introduction of FPE Ndovucharged admission fees of $23, this was unaffordable to poor parents.
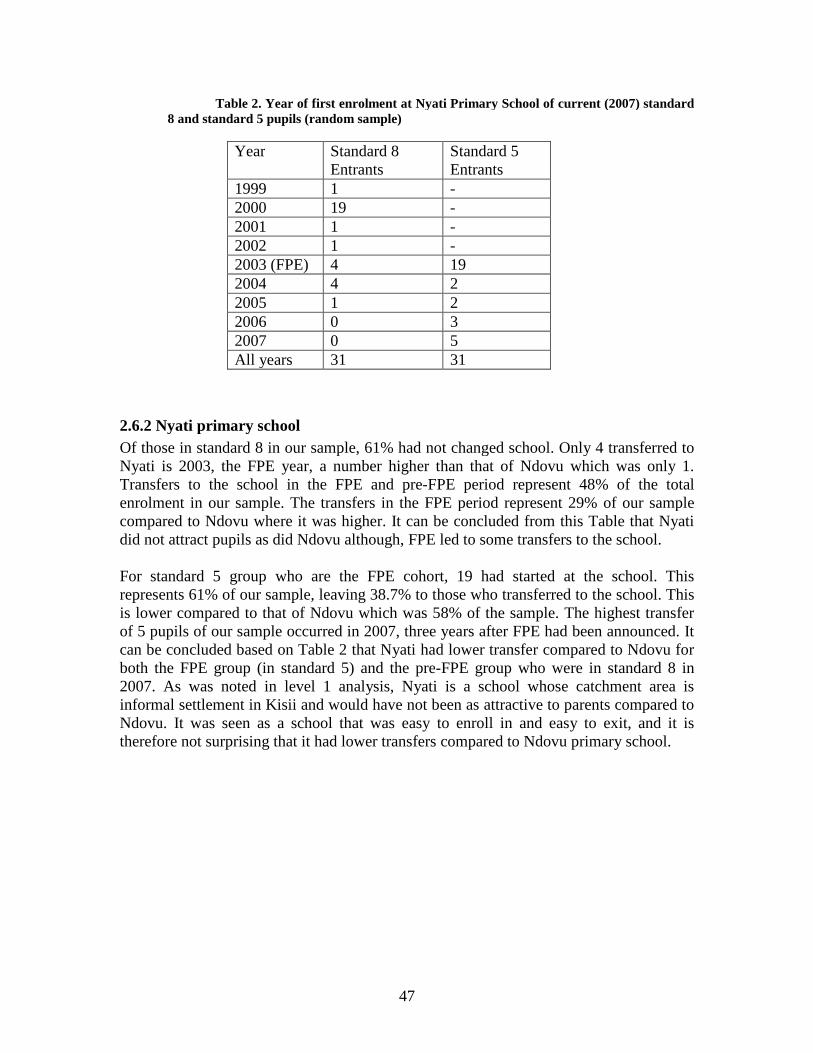
47
Table 2. Year of first enrolment at Nyati Primary School of current (2007) standard8 and standard 5 pupils (random sample)
Year Standard 8Entrants
Standard 5Entrants
1999 1 -2000 19 -2001 1 -2002 1 -2003 (FPE) 4 192004 4 22005 1 22006 0 32007 0 5All years 31 31
2.6.2 Nyati primary school
Of those in standard 8 in our sample, 61% had not changed school. Only 4 transferred toNyati is 2003, the FPE year, a number higher than that of Ndovu which was only 1.Transfers to the school in the FPE and pre-FPE period represent 48% of the totalenrolment in our sample. The transfers in the FPE period represent 29% of our samplecompared to Ndovu where it was higher. It can be concluded from this Table that Nyatidid not attract pupils as did Ndovu although, FPE led to some transfers to the school.
For standard 5 group who are the FPE cohort, 19 had started at the school. Thisrepresents 61% of our sample, leaving 38.7% to those who transferred to the school. Thisis lower compared to that of Ndovu which was 58% of the sample. The highest transferof 5 pupils of our sample occurred in 2007, three years after FPE had been announced. Itcan be concluded based on Table 2 that Nyati had lower transfer compared to Ndovu forboth the FPE group (in standard 5) and the pre-FPE group who were in standard 8 in2007. As was noted in level 1 analysis, Nyati is a school whose catchment area isinformal settlement in Kisii and would have not been as attractive to parents compared toNdovu. It was seen as a school that was easy to enroll in and easy to exit, and it istherefore not surprising that it had lower transfers compared to Ndovu primary school.

48
Table 3. Year of first enrolment at Simba Primary School ofcurrent (2007) standard 8 and standard 5 pupils(random sample)
Year Standard 8Entrants
Standard 5Entrants
2000 13 -2002 1 -2003 (FPE) 2 272004 3 12005 1 02006 6 12007 3 1All years 29 31
2.6.3 Simba primary school
From our sample of 29 pupils in standard 8 at Simba 13 had started school therecompared to 27 of the standard 5 pupils. Only 3 of the pupils in our sample reported tohave transferred from other schools to Simba among the pre-FPE cohort. However,subsequent years saw a rise in transfers. For instance, in 2006, 6 pupils in our sample hadtransferred to the school. This represents 20% of our sample. Total transfer to the schoolin the FPE and post FPE year is 15, which is 51% of our sample for the pre-FPE cohort.
For the FPE cohort who were in standard 5 at the time of our visit in 2007, 27 had startedat Simba; transfers to the school in the subsequent years after FPE was 3, accounting foronly 9.6% of the total sample compared to the Pre-FPE cohort where it accounted for amuch higher proportion of the sample. This indicates that there was no serious impact ofFPE in terms of transfers to Simba for the FPE cohort. As was noted in Part 1 analysis,Simba is a remote rural school and it is not surprising that there were no large number ofpupils transferring there. However, the large in-transfer in the pre-FPE group particularlyin 2006 was those coming in from other schools where they may have been deniedprogression into standard 7 and 8.

49
Table 4. Year of first enrolment at Sungura Primary School ofcurrent (2007) standard 8 and standard 5 pupils(random sample)
Year Standard 8Entrants
Standard 5Entrants
2000 19 -2001 0 -2002 0 -2003 (FPE) 2 222004 1 12005 0 02006 5 02007 4 5All years 31 28
2.6.4 Sungura primary school
19 pupils in our sample had started school there. This represents 61% of the sample.None reported to have transferred to the school in the years before FPE. In the FPE year,only two pupils transferred to the school. The highest transfer occurred in 2006 at 5 and2007 at 4. The total transfers in the FPE period and after account for 38.7% of oursample. This is lower compared to Ndovu.
For the FPE cohort, 22 had started school at Sungura. This represents 78.6% of thesample. In this regards, Sungura is similar to Simba. Transfers to the school of 5 pupilsoccurred in 2007. Total transfers to the school after FPE represents 21.4% of our sample.This is much lower than that of the Pre-FPE cohort which was 38.7%. It is lowercompared to the other three schools in the district.
Based on Tables 1, 2, 3 and 4 Ndovu experienced the highest in-transfers of pupilsseeking enrolment at the school following FPE. This as was earlier noted is becauseNdovu is a school said to be desirable to both poor and well off parents.

50
2.7 Transfers in Kajiado district
Table 5. Year of first enrolment at Pembe Primary School ofcurrent (2007) standard 8 and standard 5 pupils(random sample)
Year Standard 8Entrants
Standard 5Entrants
2000 20 -2002 2 -2003 (FPE) 3 132004 4 42005 7 42006 0 72007 1 5All years 37 33
2.7.1 Pembe primary school
20 pupils in our sample had started school at Pembe. This represents 54% of the sample.Only 2 pupils had transferred to the school in 2002, the immediate year before FPE wasannounced, representing only 5% of our sample. In the FPE year 3 pupils transferred tothe school which is one more than 2002, the pre-FPE year. The highest transfer occurredin 2005 at 7 which accounts for 19% of our sample. 15 pupils in our sample transferred tothe school in the FPE and post FPE years. This accounts for 40% of our sample, implyingthat FPE induced transfers to the school.
For the FPE cohort, 13 pupils in our sample had started their schooling at Pembe. Thisrepresents 39% of the total sample, and lower compared to the Pre-FPE cohort. However,as can be seen in Table 5, there was constant transfer in the years after FPE wasimplemented. The highest transfer occurred in 2006 at 7 pupils, representing 21% of thesample. Total transfer to the school after the FPE year is 20, which is larger than 13 thenumber that started school at Pembe primary school following the implementation ofFPE. Percentage wise, those who transferred to the school after FPE was 60.6% of oursample. This is much higher than the pre-FPE transfer, indicating that transfer to the pre-FPE cohort in our sample may have been restricted by the school. It does indicate thatPembe was a desirable school where most parents wanted to send their children afterFPE. It also suggests that Pembe had access barriers before FPE and that FPE led to arush to join the school. Given the pattern revealed by Table 5, it can be concluded thatFPE is associated with a rise of transfers to the school.

51
Table 6. Year of first enrolment at Mukia Primary School ofcurrent (2007) standard 8 and standard 5 pupils(random sample)
Year Standard 8Entrants
Standard 5Entrants
1999 1 -
2000 26 -
2003 (FPE) 0 272005 0 02006 1 02007 4 1All years 33 28
2.7.2 Mukia primary school
Mukia had fewer in-transfers in the pre-FPE cohort than Pembe. The number of pupilsfor whom Pembe was their first school was 26, representing 78.8%, a figure higher thanPembe’s 54%. It was surprising that in our sample, no pupil reported having joined theschool in 2003, the FPE year among the pre-FPE cohort. However, like Pembe there wasonly very little transfer in the pre-FPE period represented by 1 pupil in our sample. Thehighest transfer to the school occurred in 2007, which would be standard 8. It is unusualfor pupils to transfer to a school in their final year of the primary cycle, which is also anexamination year. But a number of factors can lead to this. For instance, they may bethose refused to register for KCPE in their previous schools due to low academicstanding. It can also be those coming to the school having been out of school or thosemaking second attempt at KCPE.
From Table 5, only 6 pupils joined the school for the first time in the post FPE period.This represents 18% of our sample, which is much lower than 40% at Pembe.
For the FPE cohort, 27 pupils had started school at Mukia and only 1 pupil reportedhaving transferred to the school. This implies that Mukia was not affected by FPE interms of transfers. It would suggest that it wasn’t a school that was desirable for parentsto transfer their children to. Those who joined the school for the first time in the post –FPE period was 1 compared to Pembe’s 20. In other words, in-transfers at Mukia accountfor only 3.6% of our sample compared to Pembe’s 60.6%.

52
Table 7. Year of first enrolment at Macho Primary School ofcurrent (2007) standard 8 and standard 5 pupils(random sample)
Year Standard 8Entrants
Standard 5Entrants
2000 13 -
2001 1 -
2003 (FPE) 5 142004 0 12005 2 42006 5 52007 0 8
All years 26 32
2.7.3 Macho primary school
The number of pupils reporting having started at Macho in our sample is 13 whichrepresent 50% of the total sample. The other 50% first enrolled at the school followingFPE. 5 pupils in our sample reported having enrolled at the school in 2003, the FPE year.This is 19% of our sample. Enrollment in the FPE year was higher compared to Pembewhich had 3 while Mukia had none. This may imply that a lot more children in Macho’scatchment area had dropped out of school. It could also represent those joining the schoolfrom private schools. What can be concluded from Table 6 is that Macho had the highestfirst enrollment at the school following FPE compared to Pembe and Mukia.
For the FPE cohort, 14 out of 32 pupils in our sample had started school at Macho. Thisrepresents 43.8% of our sample. Those who came to the school following FPE represents56.2% of our sample, compared to 60.0% of Pembe and only 3.6% at Mukia. It impliesthat at Macho, more pupils came to the school following FPE than at Mukia. In otherwords, FPE appear to have had a major impact on access at Macho. This may be becausemore pupils were out of school in Macho catchment area compared to that at Mukia. Aswe described both schools in Part 1 analysis, cost barriers prior to the implementation ofFPE meant that pupils were out of school. The same can be said of Pembe, and it is likelythe case that enrollment was more restricted at Pembe than at Macho. The case of Mukiasuggests that FPE didn’t have impact implying that it had less restrictive access prior toFPE and/or that it wasn’t the school that many parents wanted to send their children to goto.

53
Table 8. Year of first enrolment at Tumbo Academy ofcurrent (2007) standard 8 and standard 5 pupils(random sample)
Year Standard 8Entrants
Standard 5Entrants
2000 - -
2001 - -
2003 (FPE) 11 82004 13 52005 4 52006 4 12007 2 4
All years 35 23
2.7.4 Tumbo Academy
Tumbo Academy is a private school that opened its doors to pupils in 2003. In their firstintake, 11 pupils were enrolled in 2003. This represents 31% of their standard 8enrollment. However, as can be seen in Table 8 enrollment went up rapidly in subsequentyears. For instance, in 2004, one year after FPE had been announced, the school took in13 pupils. This was a school that was benefiting from FPE rather than experiencingdifficulties as might have been anticipated. It is a school which was started in FPE periodand has enjoyed high enrollment in subsequent years. 69% of the pupils joined the schoolin the post FPE period.
For the FPE cohort, a similar trend as the pre-FPE cohort can be noted in Table 8.Eight pupils started at the school, which represents 34.8%. Another 15 pupils,representing 63.2% reported joining the school in the post- FPE period. While it mayhave been expected that FPE would affect recruitment in private schools such as TumboAcademy, the evidence in Table 8 indicate that FPE in fact encouraged intake.

54
Figure 5: Transfers by Standard 5 and Standard 8 pupils in Kisii and Kajiado Schools (2007Sample)
Highest St transferred into (exc nil response)
0%
10%
20%
30%
40%
50%
60%
70%
80%
90%
100%
NdovuSt
5
Nyati S
t 5
Simba
St5
Sungura
St5
Mac
hoSt
5
Tumbo
St 5
Mukia
St5
Pembe
St 5
NdovuSt
8
Nyati S
t 8
Simba
St8
Sungura
St8
Mac
hoSt
8
Tumbo
St 8
Mukia
St8
Pembe
St 8
School, Standard
%o
fst
an
da
rd(p
rop
ort
ion
al)
8
7
6
5
4
3
2
1
Figure 5 further indicates that transfers were common in all the schools. As can be seenMukia, Simba, and Sungura had the lowest transfers. This might explain why FPE hadreduced repetition in these schools. Nyati had about one half of pupils transferring fromother schools. In the pre-FPE cohort, Ndovu, Macho, Tumbo and Pembe all had veryhigh in-transfers from other schools. As seen in Figure 5, more than half of their pupilshad reported transferring to these schools. This shows that these schools had barriersbefore FPE making it difficult to join them. Once FPE removed the barriers, many pupilssought to join the schools. It also indicates that these schools were desirable to majority.Location also matters. Since they are urban schools, they served pupils from varyinghousehold backgrounds compared to the schools that had low transfers. Most transfersoccurred in standard 4, 5, 6, 7 and 8. There were fewer transfers in standard 1 andstandard 2 and 3. It is only at Ndovu and Nyati that transfers were reported in standard 1.
Most pupils had transferred once (Figure 6) but there were also those who had transferredfive times. This was the case at Simba and Nyati and the likely explanation could be thatthese were low achievers who kept moving from school to school. There were severalpupils who had transferred twice and thrice in majority of the schools. All pupils atTumbo had transferred because it was a newly established school which did start atstandard one, bur with all the 8 grades. Among the FPE cohort, Simba and Mukia had thelowest transfers, and among the pre-FPE cohort it was Mukia that had the lowest in-transfers followed by Nyati. It can therefore be said that in-transfers might account formost of repetition among the Pre-FPE cohorts in most of the schools. What is also clear is

55
that pupils move quite a bit between schools and this was happening among the FPE andPre-FPE cohort.
Figure 6: Number of Transfers by Standard 5 and Standard 8 pupils in Kisii and Kajiado Schools(2007 Sample)
Number of transfers (total response)
0%
20%
40%
60%
80%
100%
NdovuSt 5
Nyati S
t 5
Simba
St5
Sungura
St5
Mach
oSt
5
Tumbo
St5
Mukia
St5
Pembe
St 5
NdovuSt 8
Nyati S
t 8
Simba
St8
Sungura
St8
Mach
oSt
8
Tumbo
St8
Mukia
St8
Pembe
St 8
School, Standard
%o
fst
an
da
rd(p
rop
ort
ion
al)
0 1
2 3
4 5

56
Figure 7: Ages of Standard 5 and Standard 8 pupils in Kisii and Kajiado Schools (2007 Sample)
Age of respondant
0%
20%
40%
60%
80%
100%
NdovuSt
5
Nyati
St5
Simba
St5
Sungu
raSt
5
Mach
oSt
5
Tumbo
St5
Mukia
St5
Pembe
St5
NdovuSt
8
Nyati
St8
Simba
St8
Sungu
raSt
8
Mac
hoSt
8
Tumbo
St8
Mukia
St8
Pembe
St8
School, Standard
%o
fst
an
da
rd(p
rop
ort
ion
al)
20
19
18
17
16
15
14
13
12
11
10
9
8
2.8 Age profiles in Kisii district
Figure 7 contains the age profile of the sample. In Kenya, most pupils start standard 1 atage 7 (which is the correct age). In our sample, those in standard 5 should be 11 years andthose in standard 8 should be 14 years. Those who are older would be overage pupils.
2.8.1 Ndovu primary school
64% of our sample in standard 5 was 11 years and below, meaning they were in the rightclass at the correct age. 36% were overage. The youngest pupils were 8 years old and theoldest pupils were 13 years old. For standard 8 cohort (pre-FPE group), 58% were 14years and below, meaning they were in the right class at the right age. 42% were overage.The youngest pupils were 12 years and the oldest were 16 years.It can be concluded therefore that Ndovu had overage problem. The problem was moreserious among the pre-FPE cohort than the FPE cohort. However, over 50% of pupils inboth cohorts were in the right class for their ages.
2.8.2 Nyati primary school
45% of standard 5 pupils were 11 years and below, meaning they were in the correctclass for their age. That implies that more than half the pupils in the class were overage.The oldest pupils were 14 years and the youngest were 10 years.For the standard 8 cohort, 74% were 14 years and below, meaning they were in thecorrect class for their age. The youngest pupils were 13 years and the oldest were 17

57
years. It seems Nyati did better that Ndovu among the pre-FPE cohort by having 74% inthe correct class compared to Ndovu’s 58%. Also unlike Ndovu where overage was aproblem in the pre-FPE cohort, at Nyati it was a major problem among the FPE cohort.More than half the pupils in the FPE cohort were overage. This was due to re-entries andentries following FPE announcement. The fact that majority of pupils in standard 8 wereof the right age for their class might mean low achievers would have dropped out andtransfers did not bring in older pupils. The school might have been strict in enrollingolder pupils. Overage pupils tend to be as a result of starting school late (lack of access)or re-entry (temporary withdrawal) or repeaters (low achievers).
2.8.3 Simba primary school
Only 26% of pupils in our sample were 11 years and below in standard 5. None wasyounger than 11 years. This implies that 74% were overage (12-16 years). The oldestpupils were 16 years. Compared to Ndovu and Nyati, Simba had a serious overageproblem. This may be explained by lack of strict age to enter schools. Being a remoterural school, parents may have not even been aware of the age when their children shouldstart school. Also, their growth might have been stunted hence older pupils lookingyounger compared to urban pupils.
For the pre-FPE cohort, 44% were aged 14 years and below. The youngest pupils were 12years and the oldest were 17 years. Again, it can be said that less than half were in thecorrect class compared to Nyati where 74% were in the correct class. Simba show seriousoverage problem.
2.8.4 Sungura primary school
Only 13% of the pupils in our sample were 11 years and below in standard 5. This wasthe worst case of the four schools we visited in Kisii District. This school has anextremely serious overage problem. The youngest pupils were 10 years and the oldestwere 16 years.
For the pre-FPE cohort, 46% were 14 years and below, meaning they were in the correctclass. While this is still less than half the sample it was much better than the FPE cohort.The youngest pupils were 12 years and the oldest pupils were 17 years. The problem heremust have been pupils coming to school at an age of their choice. It is possible that mostpupils in the catchment area start school generally older than the expected age of 7 years.Overall, overage is a major problem in all the schools. It is worse at Sungura followed bySimba. It can be concluded that the rural schools had a major overage problem comparedto urban schools.
2.9 Age profiles in Kajiado district
As was noted in Part I analysis, Kajiado district is very different from Kisii district. It is amuch larger and semi arid/arid district which is sparsely populated compared to Kisiiwhich is of high agricultural potential and densely populated. There are nearly no climatevariations in Kisii whereas some parts of Kajiado such as Ngong division is of highagricultural productivity and has a metropolitan population while other parts are

58
inhabited by Masaai nomadic communities. These differences are likely to come intoplay in determining pupils’ enrollment age.
2.9.1 Pembe primary school
This is a school that has similar history to Ndovu in Kisii district and comparable locationcharacteristic. However, unlike Ndovu only 18% of the pupils in our sample were aged11 years and below in standard 5. This means that 82% of the pupils in our sample wereoverage. The youngest pupils were 10 years and the oldest 18 years. These results are notsurprising given the pastoralist lifestyle of the Masaai community.
For the pre-FPE cohort, only 37 % were 14 years and below compared to Ndovu’s 58 %.The youngest pupils were 13 years and the oldest pupils were 20 years. Majority of thepupils were aged 15 and 16 years (Figure 7). From Figure 7, it can be concluded thatPembe had a major overage problem, than any of the schools in Kissi district in the FPEcohort. Even the pre-FPE cohort didn’t fair much better as only 37% were in the rightclass for their age.
2.9.2 Mukia primary school
19 % of the pupils in our sample were 11 years and below, meaning they were in the rightclass for their age. The youngest pupils were 10 years and the oldest were 16 years. It canbe said that Mukia was no worse or better than Pembeon overage problem.
For the pre-FPE cohort only 12% were 14 years and below. This was the worst case ofoverage of all the schools in this study. This means that 88 % of pupils in standard 8 wereoverage. This was worse that Pembe’s overage of 63%. The youngest pupils were 13years and the oldest 20 years. Majority of the pupils were aged 15 years (Figure 7). Aswas noted in Part I analysis, Mukia has similar characteristics are Nyati and yet it had afar worse overage problem compared to Nyati.
2.9.3 Macho primary school
50% of pupils in our sample were 11 years and below and in standard 5. This means thathalf the sample was in the correct grade. The youngest pupils were 9 years and the oldestwere 11 years. This is much better than both Pembe and Mukia and yet Macho servespupils from informal settlements in Ngong town. It is a poorer school compared to Pembeand yet it has much less overage problem compared to Pembe.
For the Pre-FPE cohort, 34% were 14 years and below. The youngest pupils were 13years and the oldest pupils were 16 years. Majority of the pupils in the sample were 15years old. It appears there was a serious overage problem among standard 8 compared tostandard 5 cohorts.
2.9.4 Tumbo Academy
This is a school that was different from the other schools in the sample because it is aprivate academy. It is a middle level type of private school (i.e. not informal private and

59
not high cost private). It is the type of school that is affordable to middle income earnersin Kenya (most professionals with university level education).
It is therefore not surprising that 86% of the pupils were 11 years and below in standard5, the best of all the schools in the sample. These pupils come from households withhighly educated parents and who are middle class. The youngest pupils were 8 years andthe oldest 13 years. Majority of pupils were 10 years, a year younger than the nationalage.
For the Pre-FPE cohort, the pattern is similar to the FPE group. 90% were aged 14 yearsand below, again the best of all the schools. The youngest pupils were 12 years and theoldest 16 years. Again majority of the pupils were 13 years, one year younger than thenational age. It can be concluded that Tumbo Academy had very little overage problemof all the schools in the study. This can be attributed to the household type that the pupilsat Tumbo came from. It would be the case in similar schools across the country wherebyprivate academies enroll pupils in class of their right age while majority of public schoolshave overage problems.
In conclusion, it can be said based on Figure 7 that overage is a major problem in theschools visited, and likely to be so in Kenya in general. It is a much serious problem inrural schools than in urban schools in Kisii district whereas in Kajiado district, beingurban school does not make a different. Pembe is an urban school while Mukia is aremote school and yet they had similar overage problem.
The next section focuses on household factors to assess how this link and might explainthe different patterns in the 8 schools studied. Since we do not have data on householdpoverty which is one of the factors known to lead to exclusion, we shall use crudemeasures of poverty (proxy factors) such as parental level of education, occupation andland ownership to assess where each of the schools fall.
The expectation is that Ndovu primary school will have pupils from fairly educatedparents with secondary level. Nyati primary school will have majority of its pupils withparents who mostly have primary level education. Simba primary school will havemajority who never completed primary and the same would apply for Sungura. Weexpect Pembe primary school to have similarities with Ndovu; Mukia with Nyati; andMacho with Nyati; and Tumbo to be in a league of its own with both parents havinguniversity level education. The family size will also correspond to the education level ofthe parents. The less educated parents will have larger families compared to the moreeducated. Rural schools will have larger families compared to urban families.

60
2.10 Family background in Kisii district
Figure 9: Family Size of Standard 5 and Standard 8 pupils in Kisii and Kajiado Schools (2007Sample)
Family Size
0%
10%
20%
30%
40%
50%
60%
70%
80%
90%
100%
NdovuSt
5
NdovuSt
8
Mac
hoSt 5
Mach
oSt
8
Tumbo
St5
Tumbo
St 8
Mukia
St5
Mukia
St8
Simba
St 5
Simba
St8
Sungura
St5
Sungu
raSt
8
Nyati
St5
Nyati
St8
Pembe
St 5
Pembe
St 8
School, Standard
%o
fst
and
ard
(pro
po
rtio
na
l)
9+
7-8
5-6
3-4
1-2
As can be seen in Figure 8 very few households had only one or two children (i.e. therespondent alone or respondent and one sibling). Of the 8 schools in our sample, Tumbohad the highest number of pupils who came from households where there was only onechild or a maximum of two children. Even at Tumbo, majority reported coming fromhousehold with 3-4 children (including the respondent). Mukia had the highest number ofpupils who came from household were there were 5-6 children. This is by Kenyanstandard a large family. 3-4 would be common but not the case in most families. Lookingacross Figure 8 it can be concluded that majority of the pupils came from householdswhich had 3-4 children as well as 5-6 children. In this category is Ndovu, Macho, Simba,Nyati. Sungura show pupils from big families. This may explain the overage problem inthis school as older children would be kept longer at home looking after their youngersiblings, a practice that is common in rural Kenya among larger families.Overall, apart from Tumbo, the pupils in our sample came from families that would beconsidered large. Some were as large as 7-8 and others reported coming from householdwith 9 children, itself not unique in Kenya where population growth has been high overthe past few years.

61
Figure 10: Father’s Education of Standard 5 and Standard 8 pupils in Kisii and Kajiado Schools(2007 Sample)
Father's Education
0%
10%
20%
30%
40%
50%
60%
70%
80%
90%
100%
NdovuSt 5
NdovuSt
8
Mac
hoSt
5
Mac
hoSt
8
Tumbo
St5
Tumbo
St 8
Mukia
St5
Mukia
St8
Simba
St5
Simba
St8
Sungu
raSt
5
Sungura
St8
Nyati
St5
Nyati S
t 8
Pembe
St5
Pembe
St8
School, Standard
%o
fst
an
da
rd(p
rop
ort
ion
al)
None Few years Primary Completed Primary Secondary or Teacher's college University DK how long at school DK if Parent went to school
Figure 10 shows that it is Tumbo that had majority of fathers with university degree inboth FPE and pre-FPE cohort. Pembe had the highest number of fathers with no formalschooling. This is not surprising given that until recently, education was not consideredthe means of productivity among Masaai men. Owning large herds of cattle is higher inthe community order of things most valued than being highly educated.
Overall, educational attainment of fathers at Pembe was low. Ndovu had majority offathers with secondary or teachers college education. None had university degree. Thiswould be expected given that most men in Kisii town are middle income business menand not professionals. Most highly educated professionals we were informed enroll theirchildren in the private academies in Kisii. Macho also had fathers with low educationalattainment with most children reporting they didn’t know. We were informed that mostchildren at Macho were from single parents (mostly mother) and they don’t knowresponse to the education level of the father may be confirmation of this. It is surprisingthat some pupils reported that their father had university level education.Figure 10 shows that majority of the pupils had fathers with primary and secondaryeducation. This was the case in both rural and urban schools, except Tumbo which had alarge number of fathers with university education.

62
Figure 11: Mother’s Education of Standard 5 and Standard 8 pupils in Kisii and Kajiado Schools(2007 Sample)
Mother's Education
0%
10%
20%
30%
40%
50%
60%
70%
80%
90%
100%
NdovuSt
5
NdovuSt
8
Mach
oSt 5
Mach
oSt
8
Tumbo
St5
Tumbo
St 8
Mukia
St5
Mukia
St8
Simba
St5
Simba
St 8
Sungura
St5
Sungura
St8
Nyati
St5
Nyati
St8
Pembe
St 5
Pembe
St 8
School, Standard
%o
fst
an
dar
d(p
rop
ort
ion
al)
None Few years Primary Completed Primary Secondary or Teacher's college University DK how long at school DK if Parent went to school
Figure 11 show that Pembe had the highest number of mothers without any formaleducation. Similar reason as in the case of fathers applies to mothers among the Masaaiwhere women are married off early. Simba, the remote rural school had the highestnumber of mothers who had only completed a few years of primary education. This is notsurprising given the rural location of the school. Most mothers who live in remote rurallocations would only have had few years of education, if any. They engage mostly insubsistence agriculture. Tumbo Academy had the highest number of mothers withuniversity degree and majority had at least secondary education. A large number ofmothers at Ndovu had secondary education and unlike fathers, some had universitydegree. This is not unusual where some men may marry and educate their wives touniversity or instances where businessmen with secondary education would marrywomen with university education. Overall, mothers had higher educational attainment atNdovu than fathers.
Like Pembe, Mukia had one of the highest proportion of mothers without formalschooling. Majority had completed primary among standard 5 pupils but none reportedsecondary level. Overall, Figure 10 indicates mothers had fewer years of schooling, withmost having completed primary while most fathers had secondary education.

63
Figure 12: Land ownership by the Family of Standard 5 and Standard 8 pupils in Kisii and KajiadoSchools (2007 Sample)
Land
0%
10%
20%
30%
40%
50%
60%
70%
80%
90%
100%
NdovuSt
5
NdovuSt
8
Mac
hoSt
5
Mach
oSt
8
Tumbo
St5
Tumbo
St 8
Mukia
St5
Mukia
St8
Simba
St 5
Simba
St8
Sungura
St5
Sungura
St8
Nyati
St5
Nyati
St8
Pembe
St5
Pembe
St8
School, Standard
%o
fst
an
da
rd(p
rop
ort
ion
al)
Not Stated
Building land
Farming land
No Land
As can be seen in Figure 12, most pupils in our sample came from families with farmingland. It is at Simba where a large number had no farming land, but this can be explainedby the high population density in the area. Macho pupils came second to Simba for nothaving farming land, and this can be explained by the fact that they were mostly fromNgong town informal settlement. Only few pupils in Ndovu did not have farming landcompared to those who had. The pattern is the same in the other schools. Only a fewpupils came from households with developed plots (building land).
Overall, most of the pupils came from families that were not landless.
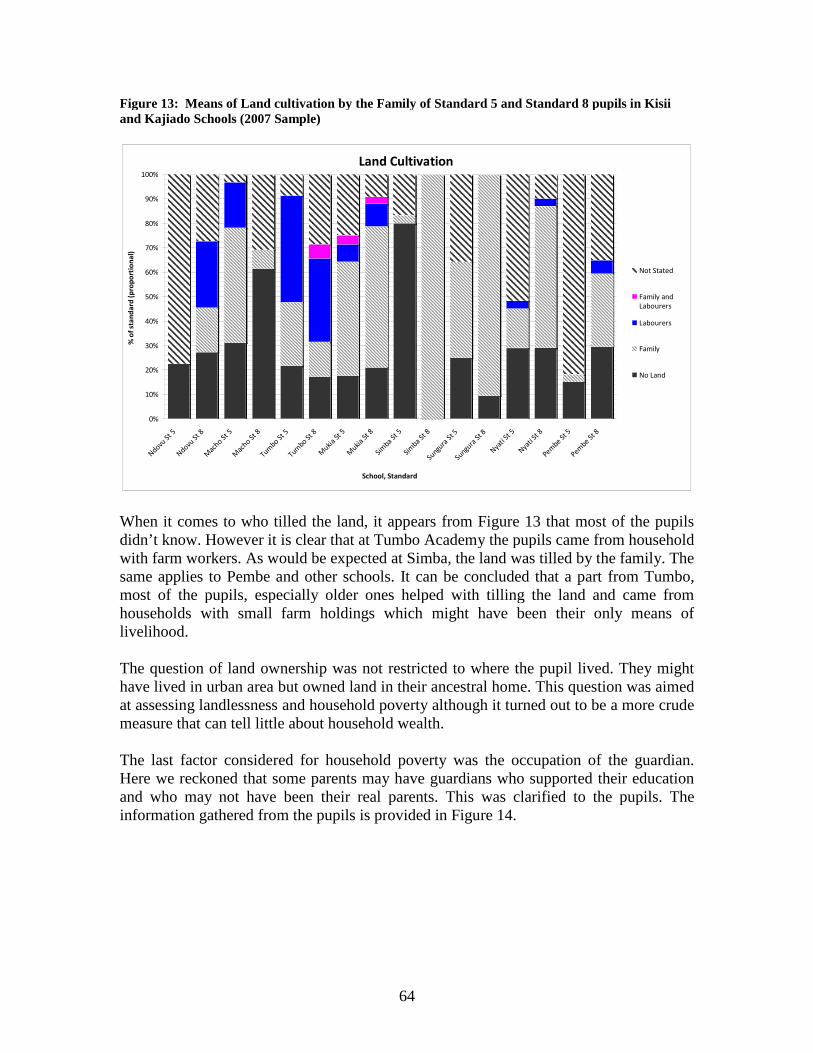
64
Figure 13: Means of Land cultivation by the Family of Standard 5 and Standard 8 pupils in Kisiiand Kajiado Schools (2007 Sample)
Land Cultivation
0%
10%
20%
30%
40%
50%
60%
70%
80%
90%
100%
NdovuSt
5
NdovuSt
8
Mac
hoSt 5
Mac
hoSt
8
Tumbo
St5
Tumbo
St8
Mukia
St5
Mukia
St8
Simba
St5
Simba
St8
Sungu
raSt 5
Sungura
St8
Nyati
St 5
Nyati
St8
Pembe
St5
Pembe
St8
School, Standard
%o
fst
an
da
rd(p
rop
ort
ion
al)
Not Stated
Family andLabourers
Labourers
Family
No Land
When it comes to who tilled the land, it appears from Figure 13 that most of the pupilsdidn’t know. However it is clear that at Tumbo Academy the pupils came from householdwith farm workers. As would be expected at Simba, the land was tilled by the family. Thesame applies to Pembe and other schools. It can be concluded that a part from Tumbo,most of the pupils, especially older ones helped with tilling the land and came fromhouseholds with small farm holdings which might have been their only means oflivelihood.
The question of land ownership was not restricted to where the pupil lived. They mighthave lived in urban area but owned land in their ancestral home. This question was aimedat assessing landlessness and household poverty although it turned out to be a more crudemeasure that can tell little about household wealth.
The last factor considered for household poverty was the occupation of the guardian.Here we reckoned that some parents may have guardians who supported their educationand who may not have been their real parents. This was clarified to the pupils. Theinformation gathered from the pupils is provided in Figure 14.
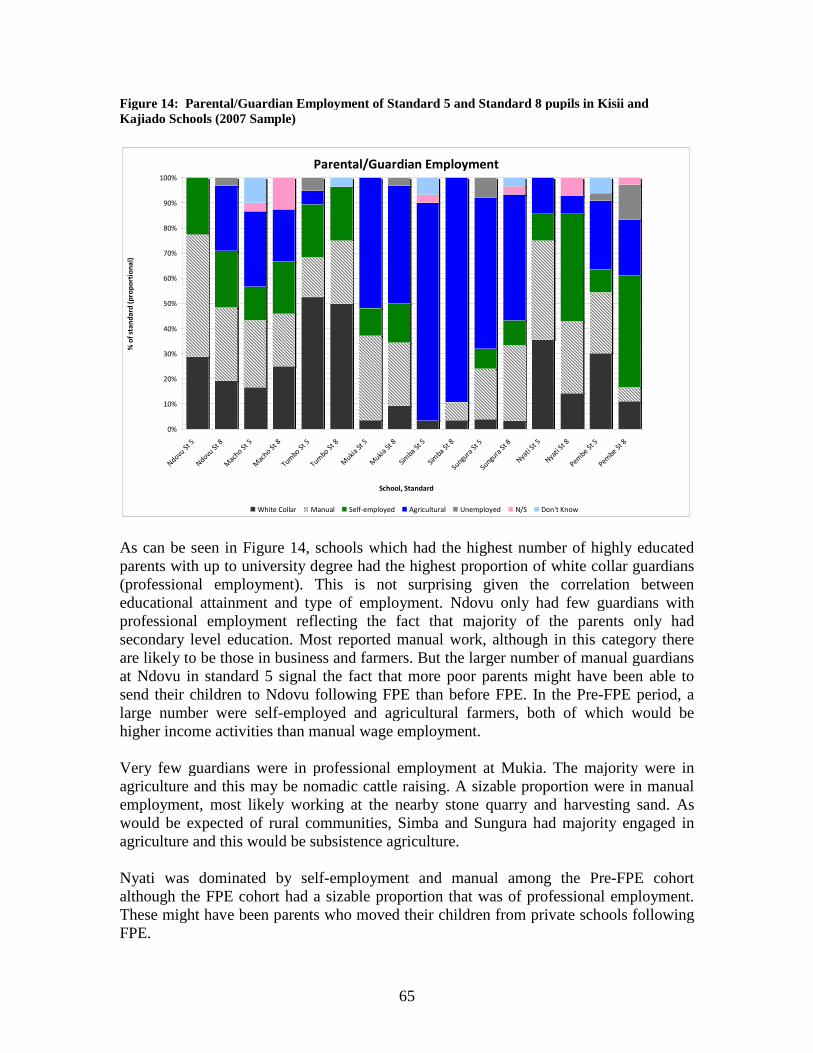
65
Figure 14: Parental/Guardian Employment of Standard 5 and Standard 8 pupils in Kisii andKajiado Schools (2007 Sample)
Parental/Guardian Employment
0%
10%
20%
30%
40%
50%
60%
70%
80%
90%
100%
NdovuSt
5
NdovuSt
8
Mac
hoSt
5
Mac
hoSt
8
Tumbo
St5
Tumbo
St8
Mukia
St5
Mukia
St8
Simba
St5
Simba
St8
Sungu
raSt
5
Sungu
raSt
8
Nyati
St5
Nyati S
t 8
Pembe
St5
Pembe
St8
School, Standard
%o
fst
and
ard
(pro
po
rtio
na
l)
White Collar Manual Self-employed Agricultural Unemployed N/S Don't Know
As can be seen in Figure 14, schools which had the highest number of highly educatedparents with up to university degree had the highest proportion of white collar guardians(professional employment). This is not surprising given the correlation betweeneducational attainment and type of employment. Ndovu only had few guardians withprofessional employment reflecting the fact that majority of the parents only hadsecondary level education. Most reported manual work, although in this category thereare likely to be those in business and farmers. But the larger number of manual guardiansat Ndovu in standard 5 signal the fact that more poor parents might have been able tosend their children to Ndovu following FPE than before FPE. In the Pre-FPE period, alarge number were self-employed and agricultural farmers, both of which would behigher income activities than manual wage employment.
Very few guardians were in professional employment at Mukia. The majority were inagriculture and this may be nomadic cattle raising. A sizable proportion were in manualemployment, most likely working at the nearby stone quarry and harvesting sand. Aswould be expected of rural communities, Simba and Sungura had majority engaged inagriculture and this would be subsistence agriculture.
Nyati was dominated by self-employment and manual among the Pre-FPE cohortalthough the FPE cohort had a sizable proportion that was of professional employment.These might have been parents who moved their children from private schools followingFPE.

66
2.11 Conclusion
The analysis provided in this report has shown that different schools were impacteddifferently by FPE depending on their location and school type. For instance, at Ndovuprimary school, FPE increased repetition mostly because of increased in-transfers into theschool. Ndovu also had very high in-transfers in the FPE period with about half of thepupils being those who started elsewhere. This does signal that there were barriers atNdovu that were removed by FPE, the main one being costs. However, while access hasbeen improved, other forms of exclusion have increased, a notable one being repetition atNdovu primary school.
At Nyati primary school, FPE improved access but there too repetition increases thehigher up the class gets. Quality is said to have been affected in both schools. Similartrends are witnessed at Pembe and in Macho primary schools, but less so at Mukia inKajiado district.
It can also be said that rural schools have not seen serious changes in their enrollmentpatterns compared to urban schools. One factor that accounts for this is that rural schoolshave stable native population groups and in-transfers are fewer compared to mobile urbanpopulations. Heterogeneity in pupils’ household background explains some of thechallenges in urban schools compared to rural schools where pupils tend to have similarprofiles; nearly as similar as private academies such as Tumbo in terms of consistency.In-transfers are common in urban schools, but appear to be a major occurrence in oursample. Pupils move quite a bit between schools, with majority stating that they have atleast changed school once. Some have transferred between schools several times. Someschools have easy entry and easy exit and this has increased following FPE.
Overage students was a major problem in all schools except Tumbo Academy. It wasworse in Kajiado district compared to Kisii district. It is likely that being overage willlead to exclusion from secondary school and/or dropout, especially among girls. This isan exclusionary factor FPE has not helped solve.
It is also evident that household characteristics such as educational attainment of parents,household poverty/wealth, family size, influence exclusion and/or inclusion. At TumboAcademy, exclusionary factors were less prevalent. However Tumbo Academy hadpupils whose parents had university degrees and high education attainment levels. Whatis apparent is that FPE has helped to ease initial exclusion to access (first enrollment) butother forms of exclusion, notably repetition is increasing in and may be a serious cause ofexclusion in the future. This may lead to declining enrollment. It also emerged that inslum contexts, such as Nyati primary school, the opportunity cost to schooling has beensolved by FPE. On the balance, transfers and repetition will need to be monitored closelyto assess the sustainability of FPE. Otherwise, by solving with one form of exclusionanother may be exacerbated.
Clearly each school experienced FPE differently. It is necessary that these differences aremonitored on a regular basis so that schools which don’t appear to benefit from FPE can
67
be targeted. It is apparent based on the analysis presented here that there is need to starttargeting schools in slums or informal settlements, mostly serving the urban poor.

68
References
King, K. (2005) Balancing basic and post-basic education: Quantity, quality andinequality; Service provision and productive capacity in securing poverty reduction andgrowth in Kenya. Centre of African Studies, University of Edinburgh.
Lewin, K. M. (2007) Improving Access, Equity and Transitions in Education: Creating aResearch Agenda. CREATE Pathways to Access Research Monograph No. 1. Universityof Sussex, Brighton.
Mukudi, E. (2004) Education for All: A framework for addressing the persisting illusionfor Kenyan Context. International Journal of Educational Development, 24 (3), pp. 231-240.
Muthwii, M. (2004) Free primary education: The Kenyan journey since independence.Retrieved November 16, 2006, fromhttp://nesis.intoweb.co.za/en/index.php?module=documents&JAS_DocumentManager_op=downloadFile&JAS_File_id=41
Oketch, M. and Rolleston C. (2007). Policies on Free Primary and Secondary Educationin East Africa: A Review of the Literature. CREATE Pathways to Access ResearchMonograph No 10. University of Sussex, Brighton / Institute of Education, London.
OWN and Associates (2004) Monitoring of the free primary education and establishingthe unit cost of primary education in Kenya. Report submitted to Elimu Yetu Coalition/Action Aid Kenya.
Somerset, A. (2006, June 27) A Preliminary Note on Kenya Primary School EnrolmentTrends Over Four Decades. Paper Presented at CREATE Conference, University ofSussex.
Somerset, A. (2007). A Preliminary Note of Kenya Primary School Enrolment Trendsover Four Decades. CREATE Pathways to Access Research Monograph No. 9.University of Sussex, Brighton.
Somerset, A. (2008). Acess to Primary Education in Kenya: A Case Study of the Impactof 2003 FPE Initiative at Nine Schools in Nairobi City and Nyeri District. CREATEWork in Progress. University of Sussex, Brighton.
Vos, R. Bedi, R. Kimalu, P. Manda, D.K., Nafula, N.N. (2004) Achieving universalprimary education: Can Kenya afford it? Working paper, Department of Economics,University of Connecticut.