factors affecting pupils' performance in public primary - UoN ...
84
FACTORS AFFECTING PUPILS’ PERFORMANCE IN PUBLIC PRIMARY SCHOOLS AT KENYA CERTIFICATE OF PRIMARY EDUCATION EXAMINATION (KCPE) IN EMGWEN DIVISION, NANDI DISTRICT, KENYA BY RICHARD RONO A Research Project Submitted in Partial Fulfillment of Requirements for the Award of the Degree of Master of Education in Educational Foundations of the University of Nairobi. 2013
-
Upload
khangminh22 -
Category
Documents
-
view
3 -
download
0
Transcript of factors affecting pupils' performance in public primary - UoN ...

FACTORS AFFECTING PUPILS’ PERFORMANCE IN PUBLIC PRIMARY
SCHOOLS AT KENYA CERTIFICATE OF PRIMARY EDUCATION
EXAMINATION (KCPE) IN EMGWEN DIVISION, NANDI DISTRICT, KENYA
BY
RICHARD RONO
A Research Project Submitted in Partial Fulfillment of Requirements for the Award
of the Degree of Master of Education in Educational Foundations of the University
of Nairobi.
2013

ii
DECLARATION
This research project is my original work and has not been presented for any
degree in any other University.
_________________________________ __________________________
Richard K. Rono Date
Reg No. E56/62500/2010
This research project has been submitted to the University with my approval as
University supervisor.
________________________ ____________________
Dr. Lewis Ngesu Date
Senior Lecturer
Department of Educational Foundations
University of Nairobi.

iii
DEDICATION
This project is dedicated with a lot of respect and appreciation to my late mother,
Mary Jesang’ Ng’isirei whose prayers, inspiration, encouragement, determination and
vision made me go through my education despite the cracking hardships we went
through right from childhood.

iv
ABSTRACT
The purpose of this study was to investigate factors affecting pupil’s performance in
public primary schools at Kenya Certificate of Primary Education (KCPE) in
Emgwen Division, Nandi District. Specifically, the study sought to establish the
effects of teaching and learning resources on pupils’ performance at KCPE, the extent
to which the teaching and learning process and social cultural factors affect the
performance at K.C.P.E. Strong school cultures have better motivated teachers, highly
motivated Teachers have greater success in terms of student performance and student
Outcomes. School teachers seeking to improve pupils’ performance should focus on
improving the school’s culture by getting the relationships right among themselves,
pupils’ and parents. This study adopted descriptive survey design. The target
population of the study comprised of 67 public primary schools in Emgwen Division.
The sample size was 312 pupils, 44 class eight teachers and 26 head teachers. Data
was collected using questionnaires. The study established that, inadequate facilities
such as science equipment, classes, dormitories and other teaching and learning
resources influenced learners’ performance in public schools at KCPE level. The
researcher recommends that, hours within the week be increased as a way of
recovering missed lessons which occur due to unavoidable circumstances such as
national public holidays, sports completion and drama festivals among others. The
Ministry of Education should ensure that all schools are provided with the necessary
text books and other relevant resources to enrich learning environment. The
government should also revise the primary school syllabus to make it more relevant
and market driven.

v
ACKNOWLEDGEMENTS
I wish to acknowledge with heartfelt appreciation the assistance given to me by my
supervisor Dr. Lewis Ngesu. His constant and effective guidance, encouragement and
concern led to the success of writing this project. I owe him great gratitude. Further
appreciation goes to my lecturers who taught me from the department of Educational
Foundations of University of Nairobi.
My sincere thanks go to my fellow members of staff of Kapsisiywa Secondary School
for their assistance and co-operation. Special thanks to Mr. Kennedy Kemei, Mr. Levi
Kipchoge and the school principal, Mr. Asbel Makau for close co-operation and help
they offered to me up the production of this document.
My heartfelt thanks go to my children, Faith Jerotich of the University of Nairobi,
Keffa Kipng’etich of the University of Eastern and Central Africa, Baraton, Mercy
Jepkoech, Valerie Jebet, Oprah Jepkemboi and Emmanuel Kiptoo of St. Matthews
Preparatory School-Septonok for their patience, moral support, understanding and
their effort to be always in touch with me during my year of study. I am also grateful
to the school bursar, Mr. David Melly for spending much of his precious time typing
and producing this document.
To them all I say, God bless you abundantly!

`
vi
TABLE OF CONTENTS
Title ................................................................................................................................ i
Declaration.................................................................................................................... ii
Dedication.................................................................................................................... iii
Abstract ........................................................................................................................ iv
Acknowledgements........................................................................................................v
Table of contents.......................................................................................................... vi
List of Tables ............................................................................................................... ix
List of Figures .............................................................................................................. xi
Acronyms and Abbreviations ..................................................................................... xii
CHAPTER ONE:INTRODUCTION ...............................................................1
1.1 Background of the study......................................................................................1
1.2 Statement of the problem ....................................................................................7
1.3 Purpose of the study ............................................................................................7
1.4 Objectives of the study........................................................................................8
1.5 Research questions ..............................................................................................8
1.6 Significance of the study .....................................................................................9
1.7 Limitations of the study.......................................................................................9
1.8 Delimitations of the study ...................................................................................9
1.9 Research assumptions........................................................................................10
1.10 Definition of operational terms .........................................................................10
CHAPTER TWO:LITERATURE REVIEW ...............................................11
2.0 Introduction.......................................................................................................11
2.1 An overview of pupils’ performance. ................................................................11
2.2 Effect of teaching and learning resources on KCPE performance ....................12
2.3 Effects of social factors on pupils performance.................................................14
2.4 Effects of cultural factors on pupils performance..............................................17
2.5 Theoretical framework.......................................................................................19
2.6 Conceptual framework.......................................................................................21
2.7 Summary of literature review ...........................................................................22

`
vii
CHAPTER THREE: RESEARCH METHODOLOGY ..............................23
3.0 Introduction........................................................................................................23
3.1 Study design ......................................................................................................23
3.2 Target population ..............................................................................................23
3.3 Sample size and sampling procedure ................................................................24
3.4.1 Questionnaires..........................................................................................25
3.4.2 Document analysis ...................................................................................26
3.5 Pilot study .........................................................................................................26
3.5.1 Instrument reliability...........................................................................................27
3.5.2 Instrument validity..............................................................................................28
3.6 Data collection procedure..................................................................................28
3.7 Data analysis technique.....................................................................................28
3.8 Ethical consideration .........................................................................................29
CHAPTER FOUR:DATA ANALYSIS, INTERPRETATIO N,
PRESENTATION AND DISCUSSION.........................................................30
4.0 Introduction.......................................................................................................30
4.1 Questionnaire return rate ...................................................................................30
4.2 Demographic information .................................................................................31
4.3 Effects of teaching and learning resources on performance in K.C.P.E. ..........36
4.5 Effects of social factors on pupils’ KCPE performance....................................44
4.6 Strategies for improving performance in K.C.P.E. ...........................................49
CHAPTER FIVE: SUMMARY, CONCLUSIONS AND
RECOMMENDATIONS...............................................................................52
5.1 Summary of the study........................................................................................52
5.2 Summary of the major findings.........................................................................52
5.3 Conclusion.........................................................................................................54
5.4 Recommendations .............................................................................................55
5.5 Suggestions for further study ............................................................................56
`
viii
REFERENCES...........................................................................................................57
APPENDICES............................................................................................................60
Appendix A:Head Teacher’s Questionnaire ................................................................60
Appendix B:Teacher’s Questionnaire..........................................................................63
Appendix C: Pupils Questionnaire...............................................................................67
Appendix D:Sampled Schools in Emgwen Division...................................................70
Appendix E. Research authorization............................................................................71
Appendix F:Research permit .......................................................................................72

`
ix
LIST OF TABLES
1.1: Nandi District divisional merit list (2010 KCPE) results ........................................6
1.2: Emgwen Division KCPE Merit List ........................................................................7
2.1 : Target supply of instructional materials (IM):lower primary (STD 1 – 4 ............13
2.2 : Target supply of instructional materials (IM): upper primary ( STD 5 – 8).........14
3.2: Summary of the zones in Emgwen Division sampling of schools ........................24
4.1: Questionnaire return rate .......................................................................................30
4.2 : Head teachers’ response on gender.......................................................................31
4.3: Head teachers’ age.................................................................................................32
4.4 Teachers’ response on gender.................................................................................33
4.5: Teachers’ age distribution......................................................................................33
4.6: Pupils’ gender distribution.....................................................................................34
4.7: Age of the pupils....................................................................................................34
4.8: Pupils score at end of class seven .........................................................................35
4.9: Repeaters score ......................................................................................................36
4.10: Whether the school has the following items........................................................37
4.11: How often the head teacher sends pupils home to collect boarding/lunch fees ..39
4.12: Teachers' response on major factors affecting performance................................40

`
x
4.13: Teachers' opinion on the school textbook ratio ....................................................40
4.14: Whether teachers are given incentives in the school to motivate them in their
work .....................................................................................................................41
4.15: Whether there is any organized dialogue among the staff and pupils .................41
4.16: How often the pupils do evaluation tests.............................................................42
4.17: Pupils' response on factors that affect their academic performance ....................43
4.19: Head teachers' response on commitment of teachers to school culture...............44
4.20: Head teachers' response on attitude of pupils to school rules...............................45
4.21: Head teachers' response on a sense of community towards their school.............46
4.22: Pupils’ commitment to school traditions: head teachers’ response .....................46
4.23: Teachers' response on the pupils’ attitude of learning of Sciences .....................47
4.24: Teachers' response on the pupils’ attitude to the learning of Arts and
Languages. ...........................................................................................................48
4.25: Teachers' response on the pupils’ attitude to participation in games...................48
4.26: Ways of improving school performance..............................................................49
4.27: Pupils' response on the measures that must be put in place to curb factors
affecting performance .........................................................................................50

`
xi
LIST OF FIGURES
Figure 2.1: The conceptual framework showing the influence of teaching and learning
resources and social and cultural factors on pupils’ performance. ...................21
`
xii
ACRONYMS AND ABBREVIATIONS
C.P.E : Certificate of Primary Education K.C.P.E : Kenya Certificate of Primary Education KNEC: Kenya National Examination Council
SMC: School Management Committee

`
1
CHAPTER ONE:INTRODUCTION
1.1 Background of the study
Primary Education is a major foundation for social-economic and political
development of a nation (UNESCO, 2005). Therefore, if the quality of education is
undermined, the schools may not give adequate knowledge, skills, and attitudes to
pupils that a country needs in its citizens in order to guarantee the role of education in
development (World Bank 2002). The development of the skills and knowledge of the
people of a nation through the education process constitutes one of the prerequisites
of national development.
From the human resource perspective, education is seen as the determinant of
character and pace of social and economic development (Republic of Kenya, 1976).
UNESCO (2006) states that most of the pupils that go through primary education in
developing countries fail to master the basic cognitive skills as shown by the poor
performance in primary school examination. The results are unsatisfactory levels of
socio-economic development due to inadequate and inappropriate human capital
resource. This situation is worse in countries that give and use public examination as
the basis of important decision making about the educational and vocational future of
pupils.
The main feature of an education system is academic performance. Kellaghan and
Greaney (1995) assert that KCPE performance not only determines access to
secondary and subsequently higher education but also affects the way

`
2
individuals view themselves and are viewed by the society. The Word Bank (2006)
observes that public examinations in Kenya serve the following purposes: selection of
candidates for educational opportunities and employment, certificate of achievement
of candidates, control of curriculum and its delivery in school, motivation of school
teachers and pupils, and monitoring education standards and reporting on school
effectiveness including instructional resources among others. Duignan (1986)
observes that there are many factors which affect pupils’ achievement directly or
indirectly. Some of these factors are part of the intricate web of affect that operates
within the school itself. These affecting factors are: Leadership and decision making,
school culture and climate, teacher behavior, pupil behavior, parental support and
involvement, socio-economic background of the pupils and poor management of
finances and school facilities.
Lezotte (2001) in his studies came up with seven correlates of effective schools-strong
instructional leadership, clear and focused mission, safe and orderly schools, climate
of high expectations for success, frequent monitoring of pupils progress, positive
home-school relations and opportunity to learn time on tasks. Academic achievement
is simply a matter of what happens in schools. Although schools do make a significant
difference, he also identified numerous factors which affect pupils’ success. These
include the school, the family and the individual, social incentives and socio-
economic conditions. In his research he identified those youngsters from lower socio-
economic strata as less likely to succeed in school. This does not mean that poor or
disadvantaged children cannot learn. However, social class and economic conditions

`
3
are important factors related to success and cannot be ignored (UNESCO, 2004).
According to Western Australian Child Health Survey (2006) an estimated fifty eight
percent of aboriginal pupils aged 4 to16 years were rated by their teachers as having
poor academic performance. This compares with nineteen percent of non- Aboriginal
pupils who had poor academic performance. The poor academic performance
registered by the Aboriginal pupils is attributed to socio-cultural factors such as poor
home background, lack of interest in education by both parents and pupils and lack of
materials for learning among others. The disparity in academic performance between
Aboriginal and non- Aboriginal pupils is evident from year one onwards and is
maintained through until the mid-high school years. Studies have shown that unless
pre-school learning and early primary school assistance are provided,
underperforming pupils are rarely able to catch up. The rise in performance in years
11 and 12 years merely reflects the fact that many of poor performing pupils have by
then left schools. In United States of America (USA), over the first decade of the
twenty first century, concerns about bullying and its role in school violence,
depression, health concerns and poor academic performance have grown in the
elementary schools. Twenty two percent of the children surveyed were involved in
bullying either as a victim, bully or both. Victims and bully victims were more likely
to have poor achievement than bystanders (Johnson, 2000). With this kind of situation
prevailing in schools, poor academic achievement is the expected learning outcome.

`
4
In Wales (Great Britain), poor academic achievement is attributed to where one is
born in, poverty, family type and friends one associates with and the community one
lives in.
All these have a profound effect on academic performance. Taking the importance of
good academic performance of national examinations globally, many governments in
developing countries have been allocating much of their resources to education since
independence (UNESCO, 2005). This has resulted to a considerable growth of
educational activities world over that has led education sector to be one of the largest
in most countries (UNESCO, 2005). Kenya has not been left behind in this trend of
increasing allocation of resources towards education. For instance, since 2002, heavy
investments by the government and other stakeholders have been made in education
sector.
In Africa education has been the traditional way of attaining self- sufficiency. As the
gap between the skilled professionals and the working class continues to grow, the
need for education is apparent. Though majority of the African countries borrow a lot
of money from the developed world to better their education systems, much of that
money goes misappropriated due to inadequate management guidelines. The money is
misappropriated and projects started for the purpose of improving education are
abandoned hence becoming “white elephant” and a paradox to education
achievements. A case in point is the 8-4-4 system of education in Kenya that started in
1985 which focused on a practical oriented curriculum that offered technical and
vocational skills meant to prepare pupils graduating at every level with specific and
`
5
practical knowledge that could either be used for self -employment, wage
employment or further training (Republic of Kenya, 1984). This has not been
achieved and most pupils graduate at standard eight without the pre-requisite skills to
fit the labour market.
Research by Kathuri (1984) on factors that affect performance in KCPE found out
that the quality of teachers, efficient use of teaching methods, a good administrative
set up and pupil’s previous background or abilities were the major factors contributing
to KCPE performance. In addition the commission of enquiry chaired by Koech,
(1994) found that poor performance at examinations was blamed on poor teaching,
absenteeism among teachers and pupils, irrelevance of curriculum and inadequacy of
examination system. This study therefore sought to investigate factors affecting
pupils’ academic performance in Kenya Certificate of Primary Education in Emgwen
Division in Nandi District. The Division has continued to register poor KCPE
performance compared to other divisions in Nandi District as shown in Table 1.1
below.

`
6
Table 1.1: Nandi District divisional merit list (2010 KCPE) results
S/N DIVISION ENTRY ENG KISW MATHS SCI SST/RE 2010 2009 2008 MEAN
1. Tinderet 1448 50.63 51.98 55.21 56.66 58.48 273.05 277.65 280.14 276.95
2. Kaptumo 898 54.14 50.49 57.92 56.81 52.77 272.13 272.70 277.86 274.23
3. Kabiyet 1373 51.56 53.40 54.86 59.50 59.41 270.82 275.81 271.64 272.76
4. Ol’lessos 831 51.59 52.86 55.95 58.24 56.74 275.38 272.82 268.18 272.13
5. Kapsabet 1919 53.15 55.12 55.27 55.52 54.32 273.39 271.64 267.43 270.82
6. KosiraI 869 54.10 53.02 49.43 51.58 60.90 269.03 268.21 267.65 268.30
7. Kilibwoni 926 49.38 52.43 56.12 55.79 54.15 267.88 264.92 262.11 264.97
8. Kobujoi 875 48.77 50.81 54.08 52.96 51.80 260.15 260.05 268.43 262.88
9. Kipkaren 1451 53.19 54.52 57.46 50.43 42.70 268.31 263.43 256.45 262.73
10. Kemeloi 1286 49.71 49.82 53.81 54.96 44.56 250.86 260.34 262.42 257.83
11. Emgwen 1849 48.48 51.87 53.44 53.56 51.58 258.92 256.29 251.18 255.46
Total 11871 51.66 53.58 54.55 60.32 55.49 270.14 270.52 266.65 268.07
Source: Nandi District Education Office (2011)
Despite the division posting average KCPE results in general, public schools were at
the bottom of the merit list. Table 1.2 shows Emgwen KCPE merit list per subject.

`
7
Table 1.2: Emgwen Division KCPE Merit List
S/No Zone Entry Eng Kisw Mat Sci SST/ 2011 2010 2009 2008 Dev.
1 Kapsisiywa 121 52.37 51.95 56.76 58.05 57.54 276.57 276.08 272.52 270.31 0.479
2 Kaptel 309 49.03 56.38 52.66 56.04 55.91 270.02 264.79 262.75 250.15 5.303
3 Kapkangai 823 50.56 53.42 49.87 49.89 46.56 250.60 262.41 260.03 255.03 11.71
4 Kamoiywo 359 48.93 45.20 52.84 53.38 51.54 251.89 254.27 244.80 242.70 2.408
5 Chepkumia 320 44.50 54.94 52.42 53.16 47.93 253.05 237.06 241.44 237.63 15.99
Mean Score 1932 49.068 52.392 52.925 54.104 51.900 258.443 258.926 256.299 251.184 1.517
Source: Nandi Central District Education Office (2011)
1.2 Statement of the problem
Student’s performance at KCPE level is a major concern for all stakeholders in
education. This is because good performance is associated with social, economic
development of a nation and in Kenya; this is a major drive towards realization of
Vision 2030. Despite the importance of education, Emgwen Division has continued to
register unimpressive KCPE results for the last 4 years. This is a major problem to
parents, teachers and other stakeholders in education. This study therefore attempts to
investigate factors affecting pupils’ performance in primary schools in Emgwen
Division, Nandi District.
1.3 Purpose of the study
The purpose of this study was to investigate factors affecting pupil’s performance in
public primary schools at Kenya Certificate of Primary Education (KCPE)
examinations in Emgwen Division, Nandi District.

`
8
1.4 Objectives of the study
The objectives of the study were:
i. To establish the effects of availability of teaching and learning resources on
pupils performance at KCPE.
ii. To establish the extent to which social factors affects KCPE performance in
public primary school.
iii. To establish the extent to which cultural factors affect performance in public
primary schools.
iv. To identify the strategies for improving KCPE performance in public primary
school in Emgwen Division.
1.5 Research questions
The following research questions guided the study:
i. To what extent does availability of teaching and learning resources affect
pupils’ performance at KCPE in Emgwen Division?
ii. How does social background factors affect KCPE performance in public
primary schools in Emgwen Division?
iii. How does cultural background factors affect KCPE performance in public
primary schools in Emgwen Division?

`
9
iv. What strategies can be employed to improve KCPE performance in public
primary schools in Emgwen Division?
1.6 Significance of the study
The findings of the study are likely to provide information to the stakeholders on the
importance of carrying out research in other districts on social-cultural factors
especially in those areas that are densely populated. The study should also be
extended to private institutions within Emgwen Division and the entire Nandi District
with a view of comparing the outcome from the two settings so as to uplift the low
academic performance experienced in Emgwen Division.
1.7 Limitations of the study
According Best and Khan (1998) limitations are conditions beyond the control of the
researcher that may place restriction on the conclusion of the study and their
application to other situations. The limitations that were encountered by the researcher
included lack of cooperation on the part of the respondents on suspicion that the
information sought may be used to victimize them.
Another limitation related to the area of study is that, the area is not large enough to
capture the findings that would be generalized to cover the whole country.
1.8 Delimitations of the study
The study targeted only three categories of respondents namely head teachers,
teachers and pupils. Other stakeholders including parents and district education
offices were not included in the sample. Factors considered for this study were

`
10
limited to teaching and learning resources, teaching and learning process and socio-
cultural factors. Any other factor affecting pupils’ performance was not investigated
by the study.
1.9 Research assumptions
The study makes the following assumptions:
i. That the respondent shall co-operate and give honest and accurate information.
ii. That the findings shall reflect the true picture of academic performance at
KCPE level in the area of the study.
1.10 Definition of operational terms
The following terms have been operationalized in this study.
Performance: In this research, performance refers to pupils’ score at KCPE.
Teaching and Learning Resources: This refers to books, classroom, desks, chairs,
charts among others.
School management: In this study, school management refers to the precision in
planning and executing by the school heads, the duties and responsibility bestowed on
school administration.
`
11
CHAPTER TWO:LITERATURE REVIEW
2.0 Introduction
This chapter consists of six sections. These include an overview of pupils’
performance, effects of teaching and learning resources on pupils’ performance at
KCPE, effect of socio-cultural factors on pupils’ performance at KCPE and
theoretical framework which was based on structural functionalism theory.
2.1 An overview of pupils’ performance.
Hansell (1981) suggests that a child’s self- image, self -concept or expectations are
critical for academic development because they forecast on the self and even
determine the child’s experience. If the child thinks that he will do poorly, he opts to
hang back and avoid doing the very things that will help him to learn. Low
expectations are infections and persons who hold low expectations for themselves
encourage others to hold low expectation also. A good curriculum or syllabus is its
relevance to the individual needs and capacities of the learners to their lives. There is
need to identify what motivates learners so that they attend educational programmes.
If pupils are bored and fail to see the connection between their personal life and what
they are taught in schools, they become candidates of ‘academic failure’ and
eventually this leads to poor performance in examination (UNESCO, 1998).
As level of poverty rises, child labour becomes crucial for family survival. More
children are increasingly employed in domestic activities and petty trade in rural-
urban Kenya in order to subsidize the family income. This has greatly affected

`
12
the girl-child as most girls are removed from schools and taken to do odd jobs like
house helps and barmaids to supplement the family income. Most parents affect their
children in this manner and this leads to poor performance.
2.2 Effect of teaching and learning resources on KCPE performance
Eshiwani (1981) observes that lack of school materials impact on performance in both
primary and secondary schools. Furthermore, in 1997 he found that the school based
factors that affect the performance in pupils is lack of teaching and learning materials.
The primary Material Infrastructure Programme (PMIP) has documented that poor
primary education in Kenya. Tum (1986), in support of Eshiwani says that lack of
facilities is a major contributing factor to poor performance. He observes that a human
element must be in agreement with performance. In this context, it is clear that
shortage of teaching books and other facilities result in poor continuous performance.
With the inception of the Free Primary Education (FPE), the government came up
with target supply of instructional resources for both lower and upper primary levels.
Since then the following targets of industrial materials (target supply of instructional
materials) have not been realized as shown in Table 2.1 due to delayed disbursement
and misappropriate of funds by some head teachers.

`
13
Table 2.1 : Target supply of instructional materials (IM):lower primary (STD 1 – 4)
Item Required
Basic pack of school stationery 1
Chalk 8
Teacher preparing book 2
Enrolment and attendance registers 1
6 core text books 1
Supply reading English 1
Supplementary Kiswahili 1
Science kit 2
Source: MOE(2012)

`
14
Table 2.2 : Target supply of instructional materials (IM): upper primary ( STD 5 – 8)
Item Required
Basic pack of school stationery 1
Chalk 10
Teacher preparing book 3
Attendance registers 1
6 core text books 1
8 core teachers guide 1
Science kit 2
Wall maps 3
Atlas 1 per 3
Source: MOE (2012)
Table 2.2 shows that text books are salient in the ultimate performance of the learners.
World Bank Report (1995), on tools and technology as performance input, identifies
instructional materials as the entire range of teaching tools from chalk to computer.
According to report, the availability of teaching tools at all levels in poor and middle
level income countries is limited, particularly at primary level of education and these
impacts negatively on academic performance.
2.3 Effects of social factors on pupils performance
Pupils' academic performance is influenced by social factors. These factors include
romantic relationships, student cults, membership in clubs and organizations,

`
15
and sports. Some studies disagree over how best to measure social factors, most
studies indicate that children from low social factors families do not perform as well
as they potentially could at school compared to children from high social factors
families (graetz, 1995). Most studies, however, compare Students from across all
social factors backgrounds to reach the conclusion that low social factors adversely
affects a range of educational outcomes. Another important dimension, however, is
the factors that may influence educational outcomes within particular social factors
Bands. The educational performance of children from financially disadvantaged
backgrounds and examines its variation as affected by Traditional measures of social
factors as well as by a range of other family, individual and Contextual factors.
Parents or family socio-economic status is determined by an individual.
Achievements in: education; employment and occupational status; and income and
Wealth. Several comprehensive reviews of the relationship between social factors and
Educational outcomes exist (Ainley et al., 1995). These studies and reviews make it
clear those children from low families are more likely to exhibit the following
patterns in terms of educational Outcomes compared to children from high social
factors: it is argued that families where the parents are advantaged socially,
educationally and economically, foster a higher level of achievement in their children.
They also may provide higher levels of psychological support for their children
through environments that encourage the development of skills necessary for success
at school (Williams et al., 1993). Socio-economic status may therefore also be linked
to family structure. As sole parent families on average have lower levels of income,

`
16
are headed by parents with lower educational attainment and are less likely to be in
the labour force, children from these families are likely to have lower educational
performance (Rich, 2000).
Also related to poor educational performance is the level of truancy or unexplained
absence among students. Truancy can be modeled both as an educational outcome and
as a causal factor in explaining educational performance. Truancy tends to be higher
among students from low SES backgrounds. Truancy, even occasional, is associated
with poorer academic performance at school (Sparkes, 1999). Having high levels of
unexplained absence at school has also been found to be associated with poorer early
adult outcomes in the labour market for instance higher probability of being
unemployed and poorer adult health relative to non-truants (Sparkes, 1999).
Educational performance at school has also been found to vary according to the
student sex (Horne, 2000). In particular, reviews of the evidence suggest that boys
suffer an educational disadvantage relative to girls, especially in terms of performance
in literacy (Buckingham, 1999; 2000b). There are several explanations for this
increasing gender gap which include: biological differences; gender biases (such as
reading being seen as not masculine.); teaching, curricula and assessment (for
instance less structured approaches to teaching grammar may have weakened boys.
literacy performance); and socioeconomic factors (Buckingham, 1999).
Geographical location affects pupils’ performance as pupils’ from rural areas are
more likely to have lower educational outcomes in terms of academic

`
17
performance and retention rates than students from urban area. Despite an adequate
number of educational facilities in rural and remote Kenya, school children from these
areas remain disadvantaged by other factors. Issues affecting access to education in
regional areas include: costs, the availability of transport and levels of family income
supports (Cheers, 1990; HREOC, 2000).
According to Sparkes, 1999 Lower educational attainment has also been found to be
associated with children living in public housing compared to those in private
housing. This may be due to the effects of overcrowding, poor access to resources and
a lack of social networks, and in this sense, housing type may also be a measure of
neighborhoods influence.
2.4 Effects of cultural factors on pupils performance
Organizational theorists have long reported that paying attention to culture is the most
important action that a people can perform. Educational theorists have likewise
reported that the teachers’ impact on learning is mediated through the climate and
culture of the school and is not a direct effect (hallinger and heck 1998). Watson
(2001) warned us that if the culture is not hospitable to learning then pupils’
achievement can suffer. Fink and Resnick (2001) reminded us that school teachers are
responsible for establishing a pervasive culture of teaching and learning in each
school. A closer look at the relationship of specific aspects of school culture to pupils’
learning is needed, however. Categories of schools are then compared on the 10
dimensions of school Climate as measured by the organizational health inventory
(leithwood et al. 2001).

`
18
Other cultural factors that impact negatively on education are practices such as
circumcision rites of which when boys undergo they feel they are grown-ups and they
cannot be controlled and contained by both parents and teachers leading to poor
performance due to rebellion against authority. Some even end up dropping from
school and engage themselves in illicit activities such as drug taking and consumption
of local alcohol. Early marriages for both boys and girls too affect pupils’ education
performance from pursuing further education. As witnessed today most of the pupils
who entered into early marriages are experiencing marriage breakages and some
going back to school (Mlama, 2001).
Child labour, however, is perhaps the most virulent force preventing pupil’s from
pursuing education. While child labour is an obstacle to both boys and girls, girls are
affected at much higher rates, particularly because much of the child labor that girls
do may not be Bank Economic and Sector researchers found that pupils’ start work at
an earlier age, work longer hours and oftentimes work as many hours as adults
(Canagarajah, S and H Coulombe, 1997). A full-time work schedule paired with
primary education for a ten-year old pupil cannot be sustainable, nor can it be
adequate preparation for successful passage of examinations and transition to
secondary school. The brunt of labour placed on pupils must be defrayed to enable
pupil’s to pursue an unhindered course of primary and secondary education. This
scenario is a common practice in Emgwen Division.

`
19
According to Ogbu (1992) Conflicts between home and school may occur over how
pupils have been taught to view the world, the qualities of interpersonal relationships,
standards of behavior, and the goals and objectives of education. Home, community,
and school/center environments may value some of the same competencies, but
differences in expression may obscure their common root. Pupils socialized in
communities that value physical aggression and "macho" behavior may have
considerable difficulty learning to suppress such behavior in school, just as pupils
more conservatively socialized may feel deeply threatened by open aggression in the
school ground. Both the pupils who tolerate high levels of aggressive behavior and
those who do not acquired their characteristics through the normal developmental
process of identification with the values and behavior of family and friends. The point
is not that high or low levels of aggression are desirable, but that their acquisition is a
normal accomplishment in some communities. Schools, by valuing low-aggression
pupils’ set the stage for cultural conflict for those who do not believe that physical
docility can reflect competence and effectiveness.
2.5 Theoretical framework
The study is based on the structural functionalism theory. Structural functionalism
theory is defined as ‘a theoretical orientation which proposes that a human society is
like an organism made up of structures called social institutions’. These social
institutions are made in such a manner that they perform different functions on behalf
of the society. In its role, the structural functionalism theory endeavors to give an
explanation on how a human society is organized and what each of the various social

`
20
institutions for stability of the society. (Merton R.K.1957).
The structural functionalism theory started to take roots and gain popularity in the
nineteen century. It was developed and shaped by the organists in order to understand
the human societies. They began to compare a society to an organism for example a
cow, a dog among others. In such organisms, there are structures called organs for
instance the heart, liver, skin and others that carry out the functions of the whole
organism. This thinking, therefore, seemed to form a sound model that could help in
understanding how the human society is structured, maintained and sustained by the
organs in it known as the social institutions. In any human society, education is a
complex institution and full of many factors. It is an integral and recognized social
institution that is structured to carry out a specialized function that is the education of
the members of the society. Also, the role, contribution and the use of education
towards the maintenance and development of the society can be understood and
explained through this theory. The rationale for using this theory is that it explains
why certain structures such as, teaching and learning activities, effective curriculum
supervision, impact of socio cultural factors on education among others key in
promoting academic performance at K.C.P.E level.

`
21
2.6 Conceptual framework
Figure 2.1The conceptual framework showing the influence of teaching and learning
resources and social and cultural factors on pupils’ performance.
INPUT OUTPUT
(Independent variable)
Teaching & Learning resources
• Books, • Desks • Classroom • Wall charts • chalks
Social factors • family structure • Gender • Geographical
Location • romantic
relationships • membership in
clubs • neighborhoods
Performance at KCPE • High mean grade • Access to
secondary school Cultural factors • Circumcision • Family and
school socialization
• Child labour • Early marriages

`
22
Figure 2.1 shows that pupils’ performance at KCPE level is influenced by several
factors that interact with one another. These are teaching and learning resources and
social cultural factors. Schools with adequate teaching and learning resources such as
books, desks and classrooms among other facilities tend to perform well at KCPE
examinations. Cultural factors for example parental level of education and tradition
are likely to influence learners’ academic performance. Social factors influencing
pupils’ performance include romantic relationships, student cults, membership in
clubs and organizations, and sports.
2.7 Summary of literature review
Literature reviewed shows that there are various factors which influence students’
academic performance. Some of these factors are unavailability of instructional
materials, social and cultural factors among others. It is clear that whenever there is
poor performance, a number of factors either independently or in conjunction with
others contribute to it. The study investigated some selected factors influencing
pupil’s academic performance at KCPE level in Emgwen. These were availability of
teaching and learning resources, social and cultural factors. The three factors although
ignored by most scholars are equally important in understanding the underlying
factors influencing pupils performance at KCPE level.
`
23
CHAPTER THREE: RESEARCH METHODOLOGY
3.0 Introduction
This section focuses on the study design, target population, sample size and sampling
procedures, research instruments, pilot study, data collection procedures, data analysis
and ethical consideration.
3.1 Study design
A research design according to Orodho (2004), is the scheme, outline or plan that is
used to generate answers to research problems. This study adopted descriptive survey
design to establish the factors that contribute to poor performance in primary schools
in Emgwen Division. The rationale for using descriptions survey design is that they
are used in preliminary and exploratory studies to allow the researcher to gather the
information, summarize, present and interpret for the purpose of clarification. The
choice of descriptive survey design is made on the fact that in this study, the
researcher was interested in the state of affairs already prevalent in the field and no
variable is to be manipulated. Descriptive survey was therefore appropriate because it
enabled the researcher to gather information concerning KCPE in Emgwen Division.
3.2 Target population
Mugenda and Mugenda (1999) defines target population as a population to which a
researcher wants to generalize the results of a study. It consists of sample frame from
which a sample is selected (White, 2005). The target population was 1,932 class 8

`
24
pupils, 67 Head teachers and 708 teachers. The head teachers and class 8 teachers
were chosen because they were in a good position to give information on the
availability of the resources and as managers of schools and were in constant touch
with pupils in their classes.
3.3 Sample size and sampling procedure
In descriptive research, a researcher can only use ten percent of the accessible
population (Fraenkel &Wallen, 2000). Ten percent of the total numbers of schools
were seven schools. But to make the study manageable and representative, the
formulae that was adopted to decide the sample size was 40%. Therefore 26% of the
schools were sampled to participate in the study. The following was the procedures
followed in sampling the schools.
Table 3.1: Summary of the zones in Emgwen Division sampling of schools
Zones Target population of schools per zone Sampled schools (40%)
Kapkangani 20 8
Kamoiywo 13 5
Kapsisiywo 6 2
Kaptel 15 6
Chepkumia 13 5
TOTAL 67 26
Source: (Author 2013)

`
25
A formula of 40% was used to sample pupils. The number of class eight pupils in the
26 sampled schools was 772 pupils. Therefore 40% of 772 pupils gave 309.From the
sample of 309 pupils, 12 participants were selected from each school. Therefore the
sample size was 12 class 8 pupils in each school yielding to a total of 312 pupils. 44
class eight teachers and 26 head teachers were sampled purposively. The 44 class 8
teachers were arrived at because some schools are 2, 3 and 4 streamed as each class is
handled by its own class teacher as shown in Appendix D.
3.4 Research instrument
The main tools for collecting data in this research were questionnaires and document
analysis.
3.4.1 Questionnaires
These are carefully designed written instruments for the collection of items to which
respondents are expected to react usually in writing. It is a research instrument that
gathers data over a large sample and saves time. It involves use of open ended and
closed-ended questionnaires (Orodho and Kombo, 2002). In open ended
questionnaires the respondents gave their explanation or their own opinion and in
closed ended questionnaire the respondents gave either ‘Yes’ or ‘No’ response .The
purpose of the questionnaires was to collect a lot of information over a very short
period of time. Each item in the questionnaire was developed to address a specific
objective of the study (Mugenda and Mugenda, 1999). The questionnaires were
administered to head teachers, standard eight class teachers and class eight pupils.

`
26
Questionnaires may lead to honest responses as no identification is needed hence
respondents can give answers without fear of victimization. The method gives
respondents enough time to reflect on questions before answering them. This method
apart from saving time and cost also assists in reducing bias in responding to
questions. It also helps to obtain personal information easily. The questionnaires were
self-administered.
3.4.2 Document analysis
Document analysis involves critical analysis of private and public recorded
information that relates to factors under investigation. The professional documents
required in a school such as past examination results were analyzed to establish the
academic achievements of the schools being examined.
3.5 Pilot study
To ensure that the instruments measured what they are intended to do, 10% of
primary schools of the target population of 26 schools in Emgwen Division were
randomly selected and used to pretest the instrument. This translated into three
schools. Questionnaires were given to respondents to fill in the presence of the
researcher in order to find out if any obstacle was experienced by the respondents in
interpreting the items. Mulusa (1990) observes that pilot tests help to review and
adjust ambiguous items. Mugenda and Mugenda (1999) argue that pretesting is
important as vague items are revealed, comments and suggestions incorporated,
deficiencies revealed and determines if the method of analysis is appropriate.

`
27
3.5.1 Instrument reliability
This is a measure of degree to which a research instrument yields consistent results or
data after repeated trials (Mugenda and Mugenda, 1999). According to Kerlinger
(1993) reliability refers to the consistency that an instrument demonstrates when
applied repeatedly under similar conditions. Reliability focuses on the degree to
which empirical indicators are consistent across two or more attempts to measure the
theoretical concept (Orodho, 2004). It is usually affected by random error. This is the
deviation from a true measurement due to factors that have been dealt with, for
example inaccurate coding and ambiguous instructions to the subjects (Mugenda &
Mugenda, 2003). In this study, reliability was determined after the pilot study in three
schools in Emgwen division, which have the same characteristics with the actual
sampled schools. This aim was to determine whether the instruments could yield the
data needed, identify problems that might be encountered by the respondents and
establish the clarity of the instruments. Questionnaires were given to three groups of
respondents namely, the head teachers, the teachers and pupils of the three schools.
A test re-tests method or co-efficient stability method was used to estimate the degree
to which the same results could be obtained with repeated measure of accuracy of the
same concept in order to determine the reliability of the instrument. A correlation co-
efficient of 0.8 was useful in assisting to revise the questionnaire to make sure that it
covered the objectives of the study. If this level of reliability was not achieved more
items could have been added to the instrument and the process repeated until this
threshold of reliability is attained.

`
28
3.5.2 Instrument validity
This is the degree to which an instrument measures what it purports to measure
(Mugenda & Mugenda, 2008). It is taken to be valid when it can measure what is
supposed to measure (Mulusa, 1990). Essentially, validity is concerned with
establishing whether the questionnaire content is measuring what it is supposed to
measure. To determine validity the researcher did pretesting of the research
instruments. The study was carried out in the three public primary schools out of the
total 67 schools. Content validity was used to validate the content employed in the
questionnaire.
3.6 Data collection procedure
Data collection refers to the gathering of information to serve or prove some facts,
(Kombo and Tromp, 2006). It is anything actual, assumed, used as a basis for
recording. Before going to the field for the collection of data, the researcher obtained
a permit from the National Council of Science and Technology. He also obtained
permission from the District Education Officer, and finally from the Head teachers of
the sampled schools. The researcher visited each school of the sample schools to
administer the questionnaires. The researcher arranged to collect the completed
questionnaires at a date agreed upon with the respondents.
3.7 Data analysis technique
Data analysis is a practice in which raw data is ordered and organized so that useful
information can be extracted from it. This involves editing or organizing, interpreting

`
29
and presentation of collected data. Analysis reduces the field of information to a
usable size.
Upon completion of data collection, the questionnaire was scored and data edited,
coded and entered into the computer for analysis. Primary data collected was
qualitative and analyzed using descriptive statistics (the statistical package for social
science (SPSS) and presented in descriptive form). The purpose of the descriptive
statistics was to enable the researcher to meaningfully describe the pattern and trends
of data related to performance in KCPE examination. This entailed presentations of
findings in the form of proportions and percentage, mean, mode and frequencies that
became useful.
3.8 Ethical consideration
The researcher assured the respondents of the confidentiality of the information
provided and were assured that the information will be used for the purpose of
research only.

`
30
CHAPTER FOUR:DATA ANALYSIS, INTERPRETATION ,PRESENT ATION
AND DISCUSSION
4.0 Introduction
This chapter presents data analysis, interpretation and presentations based on stated
research objectives and research questions stated earlier.
4.1 Questionnaire return rate
As indicated in Table 4:1 (92.3%) of the head teachers, (90.9%) of teachers, (100%)
of the pupils filled in and returned the questionnaires.
Table 4.1: Questionnaire return rate
Target respondents Sample size Responses Return rate (%)
Head teachers 26 24 92.3
Teachers 44 40 90.9
Pupils 312 312 100.0
Source: Field Data (2012)
Overall, the questionnaire return rate was absolutely good for all targeted respondents
since it was over 80 percent for all. According Mugenda & Mugenda (1999), a
questionnaire return rate of 80 percent and above is absolutely satisfactory, while 60-
80 percent return rate is quite satisfactory. A return rate below 60 percent is ‘barely
acceptable’. A satisfactory questionnaire return rate is imperative to minimize
assumptions in the study as well as diminish any bias, which could probably be

`
31
brought out by a lower questionnaire return rate. This level of return was affected by
several factors, among which were the length of questions and the mood of the
recipients.
4.2 Demographic information
Table 4.2 : Head teachers’ response on gender
Gender Frequency Percentage
Male 23 88.5
Female 3 11.5
Total 26 100
Source: Field Data (2012)
According to Table 4.2 it was found that majority of the Head teachers (23) were
males constituting 88.5%, while female head teachers were only 3 constituting 11.5%.

`
32
Table 4.3: Head teachers’ age
Age Frequency Percent
50yrs. and above 8 30.8
40 - 49yrs. 15 57.7
30 – 39yrs. 3 11.5
Total 26 100
Source: Field Data (2012)
According to Table 4.3, majority of the Head teachers (57.7%) ranged from 40- 49
years, while those that fell at 50 years and above were (30.8%) and those under 40
years were 11.5%.This shows that most of the head teachers are at middle age and
hence energetic and innovative which could lead to better results in K.C.P.E.
examination.

`
33
Table: 4.4 Teachers’ response on gender
Gender Frequency Percent
Male 21 52.5
Female 19 47.5
Total 40 100
Source: Field Data (2012)
Table 4.4 shows that male teachers were 52.5%, while female teachers were 47.5%.
This clearly shows that there is gender parity in staffing in Emgwen Division.
Table 4.5: Teachers’ age distribution
Age Frequency Percent
50years and above 2 5
40 – 49 years 6 15
30 – 39 years 29 72.5
20 – 29 years 3 7.5
Total 40 100
Source: Field Data (2012)

`
34
According to Table 4.5 on teachers age distribution, majority of teachers (72.5%) fall
under age 30-39 years, followed by those aged between 40-49 years(15%), then 20-29
years (7.5%) and finally those aged 50 years and above (5%). This is a clear
manifestation that most of them are young and vibrant and this could lead to better
results in K.C.P.E. performance if it were not for other external factors beyond their
scope.
Table 4.6: Pupils’ gender distribution.
Gender Frequency Percent
Male 142 45.5
Female 170 54.5
Total 312 100
Source: Field Data (2012)
Table 4.6 shows that, majority of pupils in school (54.5%) are females while 45.5%
are males. This indicates that, the girl child awareness on the importance of education
is higher than that of the boys.
Table 4.7: Age of the pupils
Age Frequency Percent
Below 10 years 32 10.3
10-14 years 264 84.6
Over 15 years 16 5.1
Total 312 100.0
Source: Field Data (2012)

`
35
As Table 4.7 indicates, majority (84.6%) of the pupils ranged from 10-14 years,
(10.3% ) were below 10 years while the remaining ( 5.1%) were aged over 15 years.
This implies that, majority of the pupils were able to understand the questionnaires
and fill in the necessary information.
Table 4.8: Pupils score at end of class seven
Scores Frequency Percent
Between 200-249 102 32.7
Between 250-299 135 43.3
300 and above 75 24
Total 312 100
Source: Field Data (2012)
According to Table 4.8 it shows that majority (43.3%) of the pupil performed
averagely, followed by (32.7%) who performed below average and only (24%) scored
above 300 marks at the end of class 7. This shows that the overall performance is
weak.

`
36
Table 4.9: Repeaters score
Scores Frequency Percent
Below 200 17 16.7
Between 200 – 249 30 29.4
Between 250-299 41 40.2
Above 300 14 13.7
Total 102 100
Source: Field Data (2012)
According to Table 4.9 majority (40.2%) performed averagely as repeaters, and
29.4% performed below average. 16.7% performed quite below average, and only
13.7% had scores above average. This is a clear indication of poor performance in the
division.
4.3 Effects of teaching and learning resources on performance in K.C.P.E.
The section presents the effects of availability of teaching and learning resources on
performance at K.C.P.E. It was based on whether the school has adequate classrooms,
learning equipment and library.

`
37
Table 4.10: Whether the school has the following items
Frequency Item
yes no
Total Percent
Adequate classrooms 18 6 24 100
Adequate play ground 12 12 24 100
Adequate learning equipment 6 18 24 100
Adequate library 6 18 24 100
Adequate teaching and learning resources 25 15 40 100
Adequate teaching and learning facilities 232 80 312 100
Adequate fields for co-curricular activities 15 25 40 100
Adequate administration block 12 12 24 100
Source: Field Data (2012)
As Table 4.10 shows, majority (75 percent) of all head teachers reported that there
were adequate classrooms in their respective schools with the remaining 25 percent
saying there were no adequate classrooms. This implies that most schools had
adequate classrooms which are necessary for safety and comfort of students for better
learning outcomes.
The table above shows that, 50 percent of the head teachers had adequate play ground
with equal number disagreeing. This implies that, half of the sampled schools lacked
Playground, a critical factor for intellectual psycho motive development of pupils.
Lack of adequate playing ground is likely to affect performance at KCPE level.

`
38
It shows that majority (75%) of the head teachers had adequate learning equipment
with (25%) citing inadequate learning equipment. This implies that majority of public
primary schools do not have adequate learning equipment. This is likely to influence
academic performance.
Majority (75%) of the head teachers agreed that they had adequate library facilities in
their schools with (25%) disagreeing. Maundu, (1987) says that good performance
demands that every school should be equipped with the relevant text books in the
library. Therefore the availability and use of teaching aids/resources could boost level
of quality education provided to pupils.
The researcher was also interested to know whether schools had adequate teaching
and learning resources where majority (62.5 %) of teachers agreed that they had
adequate teaching and learning resources with (37.5%) disagreeing.
Majority (74.4%) of the head teachers reported that they had adequate teaching and
learning facilities with (25.6%) disagreeing. Lack of adequate facilities such as
science equipment, classes, playground and other teaching and learning resources is
likely to affect teaching and in most cases can stir up rebellion which is likely to lead
to poor performance. Douglas (1964) notes that effective teachers keep in mind both
what they teach and what they teach with. Learning would therefore be passive and
boring if learning resources are not incorporated in the learning process. It is proper
organization of learning resources and the use of appropriate teaching and learning
strategies which is likely to enhance the acquisition of the subject matter and content.

`
39
Concerning whether there are enough playing field for co–curricular activities,
majority (62.5 %) of all the teachers said yes with (37.5%) disagreeing as indicated in
Table 4.10.(50%) of teachers reported that they had adequate administration block
with an equal number disagreeing. Spacious and adequate administration block is
important for teachers/learners interaction outside the classroom as well as for
consultation after class.
Table 4.11: How often the head teacher sends pupils home to collect boarding/lunch
fees
Number of times Frequency Percent
Once a term 6 25.0
Twice a term 18 75.0
Total 24 100.0
Source: Field Data (2012)
According to Table 4.11,majority (75 percent) of the head teachers send pupils twice
a term to collect fees while 25 percent sent them home once a term. This scenario
explains the situation on the ground whereby the government disbursement of funds is
sometimes delayed forcing head teachers to send students home for school fees. This
may have ripple effects on pupils who sometimes miss classes and exams while at
home.

`
40
Table 4.12: Teachers' response on major factors affecting performance
Factors influencing performance Frequency Percent
Inadequate learning material 10 25.0
Inadequate teachers in school 10 25.0
Lack of motivation 10 25.0
Environmental factors 5 12.5
Poverty 5 12.5
Total 40 100.0
Source: Field Data (2012)
The study on teachers’ response on major factors affecting performance in Emgwen
indicated that, inadequate learning materials, inadequate teachers in school and lack
of motivation rated at 25 percent each while environmental factors and poverty rated
12.5 percent each. This implies that there are several factors affecting pupils
academic performance. This is shown in Table 4.12.
Table 4.13: Teachers' opinion on the school textbook ratio
Teachers' opinion on the school textbook ratio Frequency Percent
1.2 10 25.0
1.3 15 37.5
1.4 15 37.5
Total 40 100.0
Source: Field Data (2012)

`
41
According to Table 4.13, (37.5% ) of teachers reported that the school text book ratio
is 1:4, with the same percentage rating it at 1: 3 while the remaining 25 percent
reporting the ratio of 1:2.
Table 4.14: Whether teachers are given incentives in the school to motivate them in
their work
Incentives to motivate teachers Frequency Percent
Yes 10 25.0
No 30 75.0
Total 40 100.0
Source: Field Data (2012)
Findings on whether teachers are given incentives in the school to motivate them,
majority (75 percent) of all teachers reported that they were not given any incentives
in their respective schools with 25 percent agreeing. Incentives are necessary because
they motivate teachers to work harder. Table 4.14 shows the results.
Table 4.15: Whether there is any organized dialogue among the staff and pupils
Dialogue among staff and pupils Frequency Percent
Yes 35 87.5
No 5 12.5
Total 40 100.0
Source: Field Data (2012)

`
42
According to Table 4.15, majority (87.5 percent) of teachers reported that there was
consultation between them and their pupils with 12.5 percent disagreeing. This
implies they normally hold discussions on how to improve academic performance.
Table 4.16: How often the pupils do evaluation tests
Pupils’ evaluation tests Frequency Percent
Frequently 223 71.8
End term 25 7.7
Rarely 56 17.9
Midterm tests 8 2.6
Total 312 100.0
Source: Field Data (2012)
On how often the pupils do evaluation tests, majority (71.8 percent) reported
frequently while 17.9 percent reported rarely, 7.7 percent at the end of the term and
2.6 percent midterm tests. Evaluation tests help teachers identify the strength and
weak point of the pupil which enables them (teachers) to lay proper strategies for
performance improvement. Table 4.16 presents the results.

`
43
Table 4.17: Pupils' response on factors that affect their academic performance
Factors affecting academic standard Frequency Percent
Lack of school fees 168 53.8
Inadequate learning facilities e.g.(books, chalk) etc. 80 25.6
Environmental factors e.g. (noise, heat) etc. 13 33.3
Lack of basic needs e.g. ( shelter, food) etc. 41 12.8
Indiscipline 79 25.6
Negative attitude 128 41.0
Poor time management 24 7.7
Source: Field Data (2012)
Table 4.17 shows that, majority (53.8 percent) of the pupils lack school fees. 41
percent felt that negative attitude was a factor that affected performance while 33.3
percent reported environmental factors. Inadequate learning facilities and indiscipline
reported 25.6 percent each. (12.8 percent) reported lack of basic needs with 7.7
percent reporting poor time management.
According to Sifuna (1988) lack of communication, poor relationship between the
head teacher and the pupils, inefficient instructional policies and practices and leaving
parents out of school activities are significant in affecting poor performance.
Rumberger (1987) strongly emphasizes that poor performance is viewed to serious
administrative problems.

`
44
Table 4.18: Whether the pupil participate in election of school prefects
Pupil participation in election of school prefects Frequency Percent
Yes 224 71.8
No 88 28.2
Total 312 100.0
Source: Field Data (2012)
Majority (71.8 percent) of the pupils agreed that they participated in election of school
prefects with 28.2 percent disagreeing as shown in Table 4.18.
4.5 Effects of social factors on pupils’ KCPE performance
This section represents head teachers, teachers and pupils’ response on the
commitment of teachers to school culture, attitude of pupils to school rules and
regulations, a sense of community towards their school, commitment of pupils to
school tradition and the pupils’ attitude of learning of sciences.
Table 4.19: Head teachers' response on commitment of teachers to school culture
Commitment of teachers to school culture Frequency Percent
Very positive 12 50.0
Positive 9 35.7
Negative 3 14.3
Total 24 100.0
Source: Field Data (2012)

`
45
According to Table 4.19, half of the head teachers stated that they were very positive
towards the commitment of teachers to their school. 35.7% were positive while 14.3%
were negative. This implies that most of the teachers in Emgwen Division are
committed to their schools and this is a strong indicator of good working relationship
in the school and community at large.
Table 4.20: Head teachers' response on attitude of pupils to school rules
Attitude of pupils to school rules Frequency Percent
Very positive 5 21.4
Positive 14 57.1
Neutral 3 14.3
Negative 2 7.1
Total 24 100.0
Source: Field Data (2012)
Table 4.20 shows that, 78.5% of the pupils were positive about school rules and
regulations, while 14.3% were neutral.7.1 were negative. This indicates that majority
of pupils in Emgwen Division are positive towards school rules

`
46
Table 4.21: Head teachers' response on a sense of community towards their school
A sense of community Frequency Percent
Very positive 5 21.4
Positive 13 50.0
Neutral 3 14.3
Negative 3 14.3
Total 24 100.0
Source: Field Data (2012)
According to Table 4.21, head teachers (71.4%) agreed that the community was
positive towards their respective schools while 14.3% were neutral and negative
respectively. The school community is very important in ensuring that the school
culture is upheld as well as it forms the larger community and holds the future of the
community.
Table 4.22: Pupils’ commitment to school traditions: head teachers’ response
Commitment of pupils Frequency Percent
Very positive 2 7.1
Positive 20 85.7
Negative 2 7.1
Total 14 100.0
Source: Field Data (2012)

`
47
Head teachers’ response on the commitment of pupils to school tradition indicated
that overwhelming majority (over eighty percent) of the head teachers were positive
of pupils’ commitment to schools’ tradition. Pupils’ commitment to school tradition is
a sign of loyalty and is likely to create a warm working environment. Table 4.22
shows the results.
Table 4.23: Teachers' response on the pupils’ attitude of learning of Sciences
Teachers' response Frequency Percent
Very positive 3 6.4
Positive 16 42.6
Neutral 8 19.1
Negative 13 31.9
Total 40 100.0
Source: Field Data (2012)
According to Table 4.23, majority of teachers (49 percent) reported pupils’ attitude to
Science related discipline were positive with about thirty percent reporting negative.
The extent to which the pupil culture values academic success or willingly complies
with the school rules, will affect their achievement since pupil peer culture affects
pupil performance. School staff members must know whether the dominant peer
culture adds or detracts from the school’s mission (Patterson, Purkey and Parker,
1986).

`
48
Table 4.24: Teachers' response on the pupils’ attitude to the learning of Arts and
Languages.
Pupils’ attitude to the learning of Arts and Languages Frequency Percent
Very positive 6 17.0
Positive 26 61.7
Neutral 7 19.1
Negative 1 2.1
Total 40 100.0
Source: Field Data (2012)
Concerning teachers’ response on the pupils’ attitude to learning Arts and Languages,
over 50 percent were positive. Few of the teachers cited that pupils’ had negative
attitude towards learning of Arts and Languages. This indicates that, pupils perform
well in Arts and Languages. The information is shown in Table 4.24.
Table 4.25: Teachers' response on the pupils’ attitude to participation in games Pupils’ attitude to participation in games Frequency Percent
Very positive 12 29.8
Positive 21 51.1
Neutral 5 14.9
Negative 2 4.3
Total 40 100.0
Source: Field Data (2012)

`
49
According to Table 4.25, over 50 percent of the teachers agreed that pupils had
positive attitude on pupils’ participation in games. This would mean pupils value a
school culture that embraces extra-curricular activities. This could promote their
abilities and talents and hence translate to the liking of their school thus enhancing
good academic performance.
Strong school culture, as indicated by commitment of teachers, attitude of pupils to
school rules and regulations, a sense of community towards their school, commitment
of pupils to school tradition and the pupils’ attitude of learning of sciences, was found
to be affecting Kenya Certificate of Primary Education positively. As indicated by
Cheng (1993) the effect of strong culture when teachers, pupils and community are
committed to a certain school norm, that norm translates to performance in KCPE.
4.6 Strategies for improving performance in K.C.P.E.
Table 4.26: Ways of improving school performance
Ways to curb factors Frequency Percent
Provision of adequate learning materials 10 50.0
Employing more teachers 12 62.5
Encouraging children by parents 5 25.0
Motivating pupils 5 25.0
Punishing indisciplined pupils 8 37.5
Source: Field Data (2012)

`
50
Table 4.26 shows that, majority (62.5 percent,) of the teachers said employing more
teachers and providing more learning materials will help with 37.5 percent felt that
indiscipline pupils should be punished. Both parents’ encouragement and motivation
of pupils had 25 percent each. The indicated strategies are crucial for
teaching/learning environment to be conducive for learners. This eventually affects
academic outcome.
Table 4.27: Pupils' response on the measures that must be put in place to curb factors
affecting performance
Measures Frequency Percent
Provision of learning materials 88 28.2
Teamwork 40 12.8
Introduction of remedial classes 8 2.6
Parents should encourage their children 16 5.1
Guidance and counseling 95 30.8
Motivating pupils 25 7.7
Employing more teachers in school 40 12.8
Total 312 100.0
Source: Field Data (2012)
According to Table 4.27, 30.8 percent of the pupils reported guidance and counseling.
28.2 percent provision of learning materials while 12.8 percent reported employing
more teachers in the schools and introduction of remedial classes. Few 7.7

`
51
percent of the pupils indicated that motivation of the pupils was a measure that could
curb factors affecting performance in their respective schools and while the rest 5.1
percent agreed that the parents should encourage their children. Both the pupils and
teachers agreed that remedial work was necessary and encouragement of pupils to
learn was of paramount importance.
Okumu (1981) notes that lack of adequate supervision of schools by Ministry of
Education officials is a factor that may create laxity in the individuals involved in the
education programme. This if not well checked might adversely affect the school
performance in the national examinations.

`
52
CHAPTER FIVE: SUMMARY, CONCLUSIONS AND RECOMMENDATI ONS
This chapter presents summary, conclusions and recommendations of the study. The
study also gives suggestions for further study.
5.1 Summary of the study
The purpose of this study was to investigate factors affecting pupil’s performance in
public primary schools at Kenya Certificate of Primary Education (KCPE)
examinations. Specifically, the study sought to establish the effect of teaching and
learning resources on pupils performance at KCPE; determine the extent to which the
teaching and learning process affect the KCPE performance; investigate the extent to
which social and cultural affect KCPE performance in public primary school and
identifying the strategies for improving KCPE performance in public primary school.
This study adopted descriptive survey design. The sample size was 12 class 8 pupils
from 26 schools yielding to a total of 312 pupils. 44 class eight teachers and 26 head
teachers were chosen purposively. The main tools for collecting data in this research
were questionnaires and document analysis. The questionnaires were self-
administered, where the respondents were asked to fill them by themselves. Data was
analyzed using Statistical Package for Social Science (SPSS) software programme.
5.2 Summary of the major findings
The study established that most schools completed syllabus on time and school text
books were distributed fairly well in the schools sampled. Majority (50 percent) of the

`
53
teachers agreed that they had below 50 candidates’ while 37.5 percent was between
71-90 candidates.
On social factors, the study established that pupils' academic performance is
influenced by social factors such as family structure, absence among students, gender,
geographical location, neighborhoods, romantic relationships, student cults,
membership in clubs and organizations, and sports. The study concluded that all these
social factors adversely affect a range of educational outcomes and performance.
On cultural factors the study established that Strong school cultures have better
motivated teachers, and highly motivated teachers have greater success in terms of
student performance and student outcomes. The findings further revealed that School
teachers seeking to improve pupils’ performance should focus on improving the
school’s culture by getting the relationships right among themselves, pupils’ and
parents.
On strategies for improving K.C.P.E the study highlighted the following: That there is
need to provide adequate materials for learning, employ more teachers for effective
learning, parents to motivate and encourage their children to learn and correct the
wayward pupils by giving them appropriate punishment so as to uplift academic
performance in the division.
Concerning the number of all pupils in teachers’ respective school, majority (50
percent) of teachers’ response was that they had 100-250 pupils while both 251-400
and over 400 pupils had 25 percent each. Findings on teachers’ response on the
`
54
discipline condition in the school indicated that, majority (62.5 percent) agreed that
they were satisfied with the discipline condition in their respective schools. Regarding
whether the schools have adequate teaching and learning facilities, majority (74.4
percent) of the pupils said yes while 25.6 percent accepted that there were no
adequate teaching and learning resources. Majority (75 percent) of the head teachers
agreed that there was adequate library in their schools while only 25 percent
disagreed.
Regarding head teachers’ response on the school textbook ratio, majority (75 percent)
responded that the textbook ratio in their respective schools was 1:2 while 25 percent
of the head teachers had their ratio as 1:3. On whether there has been any transfer of
the school heads and teachers in the last 3 years, equal percent of head teachers (50
percent) of head teachers said there was transfer of school heads and teachers.
5.3 Conclusion
The study has revealed that, Public primary schools with adequate teaching and
learning facilities as well as adequate staffing are well placed to perform better at
KCPE level than those with inadequate facilities. Most schools which are not well
equipped with the relevant text books may explain the wide variations in academic
performance among pupils enrolled in the division as compared to other divisions in
the district. Therefore the availability and use of teaching materials, effective
administration and proper management of learning resources could control certain
level of quality education provided to pupils.

`
55
5.4 Recommendations
The government through the Ministry of Education should consider allocating more
time. At the same time the Ministry should ensure that all schools are provided with
the necessary and relevant text books which would assist in boosting the KCPE
performance.
Primary school syllabus should be reviewed to make it more relevant. In this context,
head teachers should ensure that, coverage of syllabus by second term of the final
year is realized so that pupils would have enough time for revision of KCPE.
The government through MOE should employ and post more teachers into the area
experiencing shortages to facilitate. At the same time, qualification of teacher should
be considered before posting is done. This would ensure that pupils are taught by
people with pre-requisite academic qualifications.
Teachers should develop a variety of activities and methods to enable pupils of
different ages and backgrounds to acquire proper knowledge, skills, behaviour and
attitudes. The child needs to be mentally and physically stimulated and helped to mix
and live with others, as well as learning how to control his/her emotions.

`
56
5.5 Suggestions for further study
The researcher recommends further studies to be carried out in the following indicated
areas:
i. Other than Emgwen Division, Nandi District, social and cultural factors
affecting performance of KCPE in public primary schools should be
researched on in other districts especially those that are less densely populated.
ii. A study should be extended to the private institutions within Emgwen
Division, Nandi District with a view of comparing the outcome from both
settings.

`
57
REFERENCES
Ayot, H.O. (1984). Language for learning, Nairobi: Macmillan Publishers. Best, J.W. & Khan J.V. (1993). Research in education.Boston Allyn and Bacon. Broadfoot, H. (1990).Changing educational achievement: Interpersonal perspective
and trend, London: Rutledge. Chapman, I.T. (1994). Dissin' the dialectic on discourse surface differences.
Composition Chronicle, 7(7). Duignan, R. (1986). Research on effective schooling: Some implications for improvement. Journal of education administration 24 (I). Egan, R. (2009). Pisa tests survey, Wales: Great Britain. Eshiwani, G. (1981). Educational research and evaluation in Kenya: Directions paper presented to education research seminar workshop. University of Botswana and Swaziland Gaborone. Eshiwani, G. (1983). Factors affecting performance among primary schools and
secondary schools pupils in Western province. A policy study bureau of education research, Nairobi: Kenyatta University.
Eshiwani, G. (1997). Education since independence. Nairobi: Jomo Kenyatta
Foundation. Fraenkel, J.R. & Warren, N.E. (2000). How to design and evaluate research in
education (4th edition). New York: McGraw-Hill Publishing Co. Harbinson, R.W. and Hanushek E.A. (1992). Educational performance of the poor:
Lessons from rural North-East Brazil. Oxford University Press, Oxford. Johnson, (2000). “The peer effect on academic achievement among public elementary
school pupils. A Report on the Heritage Centre for Data Analysis.CDA 00-06. J. A. & Ashioya, L. A. (2009). Poverty alleviation: The educational planning
perspective. Department of Educational Planning and Management, Masinde Muliro University of Science and Technology.
Kathuri, N.J. (1994). Some factors which affect performance of pupils in certificate of
primary education. University Of Nairobi. I D S Working Paper.

`
58
Kellaghan, C.D. & Greaney, S.P. (1995). Supervision and instructional leadership: A development approach (5th Ed). Needham Heights: M.A. Allyen and Bacon.
Kelly, J.G. (1979). Adolescent boys in high school: A psychological study of copying
and adaptation. New Jersey: Hillsdale. Kerlinger, F.N. (1973). Foundation of behavioral research. New York: Holt, Rinhart
and Winton incorporated. Kibui, G.P. (1995). A comparative study of factors that affect examination
performance of public and private schools in Nairobi. Kenyatta University. KNEC (2010). The ‘Curse’ of free primary education, standard media.co.ke Kombo, D.K. and Tomp, D.L.A. (2006). Proposal and thesis writing, An
introduction.Nairobi: Pauline Publication. Published. Kothari, C.R. (1990). Research methodology, methods and techniques (2nd Ed). New
Dheli: WishwaPrakashan. Kothari, C.R. (2004). Research methodology, methods and techniques. New Age
International, New Dheli. Lezotte, L. (2001). Correlates of effective schools. The first and second generation.
Okemos M.I Effective School Products Ltd. Mehren, W.A. (1973). Combining evaluation data from multiple sources. In j.
Millman & l. Darling-Hammond (Ed.) The New Hand Book Of Teacher Evaluation. Newbury Park: Sage.
Mlama, P (May 2001). When girls go missing from the classroom, partnership for
strategic resource planning for girls’ education in Africa, FAWE Mugenda, O. & Mugenda, (1999). Research methods, quantitative and qualitative
approach. Nairobi: Acts Press. Mulusa, T. (1990). Evaluation research for beginners. A practical study guide. Bonn. Ng’ethe, J.M. (2004). Investigation into challenges the primary school head teachers
are facing with the implementation of free primary education. A Case Study of Ruiru Division of Thika District, unpublished med theses: Kenyatta University.
Olembo, J. O. (1989). Practical primary school administration for pupils, teachers and
head teachers. London: Edward Arnold Ltd.

`
59
Orodho, A. J. (2004). Techniques of writing research proposal and report in education and social research. Nairobi: Masola Printers.
Republic Of Kenya, (1964). The Ominde Report, Government Printer, Nairobi. Republic of Kenya, (2001). Education for All (EFA): A National Handbook on EFA
2000 and Beyond. Government Printer, Nairobi. Republic of Kenya, (2004). National action Plan on Educational For All. Government
printer. Republic of Kenya, (2005). A Policy Framework for Education, training and research:
meeting the challenges of education in Kenya in 21st Century. Nairobi, Kenya: Government Printer.
Reyes, P. (1990). Teachers and their work place: Commitment, performance and
productivity. London: Sage Publications. Rosernberg, K.M. (1993). Foundation of behavioural research. Forthwort,
Philadelphia: Harcourt Publisher. Tum, P.C. (1996). Education trends in Kenya. A vocation perspective. Nairobi: Jomo
Kenyatta Foundation. UNESCO (1990). World conference on Education For All (WCEFA) Final Report:
Meeting Basic Learning Needs (UNESCO; Paris). UNESCO (2004). Free Primary Education Policy in Kenya. UNESCO (2005). EFA Global Monitoring Report: The Role of the Organization and
Social Context of Schools: hhp://Portal.Org/education; UNESCO Nairobi Office (2006). Fact book on education for all (EFA). Nairobi:
UNESCO. Wiersma, W. (1985). Research methods in education. An introduction, (3rd Edition),
Allyn and Bacon Inc. Massachusetts, Newton. World Bank (2002).The role of education in development.

`
60
APPENDICES
APPENDIX A:HEAD TEACHER’S QUESTIONNAIRE
Dear respondent
I am carrying out a research on factors affecting pupils’ performance in public
primary schools at Kenya Certificate of Primary Education (KCPE) in National
Examination in Emgwen Division, Nandi District, Kenya.
Kindly answer the questions below as honestly and accurately as possible. The study
is for academic purpose only. If you have any optional comments you feel like
making, you may write at the back of this questionnaire.
Thank you in advance for your co-operation.
Kindly tick ( � ) the correct response in the boxes and spaces provided.
1. What is your gender?
a) Male b) Female
2. What is your age? ________________________________
3. What is the name of your school? __________________________________
4. Does the school have adequate facilities?
a) Classroom Yes ( ) No ( )
b) Playing field Yes ( ) No ( )

`
61
c) Library Yes ( ) No ( )
d) Administration Block Yes ( ) No ( )
5. How often do you send pupils home to collect boarding/ lunch fees?
..................................................................................................................
6. Is there any organized dialogue among your staffs and pupils?
Yes No
7. From your own experience do you find teachers committed to school
culture?…………………………………………………………………………………
…………………………………………………………………………………………
……....
8. Do you find student compliant to school rules? ………………………………….
..................................................................................................................................
9. How does the community respond to issues affecting the school?
……………………………………………………………………………………..
10. How are the pupils committed to school
tradition?.......................................................

`
62
11. Are there enough and standard playing fields for co-curricular activities in your
school?
Yes No
12. In the last three years have you had cases of indiscipline in your school?
Yes No
13. If yes, what was the major cause(s) of indiscipline?
________________________________________________________________
14. In your own opinion what are;
a) School-based social factors affecting pupils performance in public primary
schools and what kind of measures must be put in place to curb the
situation...............................................................................................................
.............................................................................................................................
b) Cultural factors affecting pupils performance in public primary schools and
what kind of measures must be put in place to curb the
situation………………………………………………………………………
…….

`
63
APPENDIX B:TEACHER’S QUESTIONNAIRE
Dear respondent
I am carrying out research on factors affecting pupils’ performance in public primary
schools at Kenya Certificate of Primary Education (KCPE) in National Examination
in Emgwen Division, Nandi District, Kenya.
Kindly answer the questions below as honestly and accurately as possible. The study
is for academic purpose only. If you have any optional comments you feel like
making, you may write at the back of this questionnaire.
Thank you in advance for your co-operation.
Section A
Kindly tick (� ) the appropriate responses in the spaces provided.
1. What is your gender?
Male (__) Female (__)
2. What is your age? _______________________
3. How often are classes tested and evaluated?
Daily (__) Weekly (__) Monthly (__) Termly (__)

`
64
Section B:
This section consists of tabulated series of statements concerning factors affecting
academic performance.
4. Does your school have adequate teaching and learning resources?
Adequate ( )
Inadequate ( )
Not at all ( )
5. What is the school textbook ratio?
1:1 ( )
1:2 ( )
1:3 ( )
1:4 ( )
None of the above ( )
6. Does the school have testing Policy? Yes ( ) No ( )
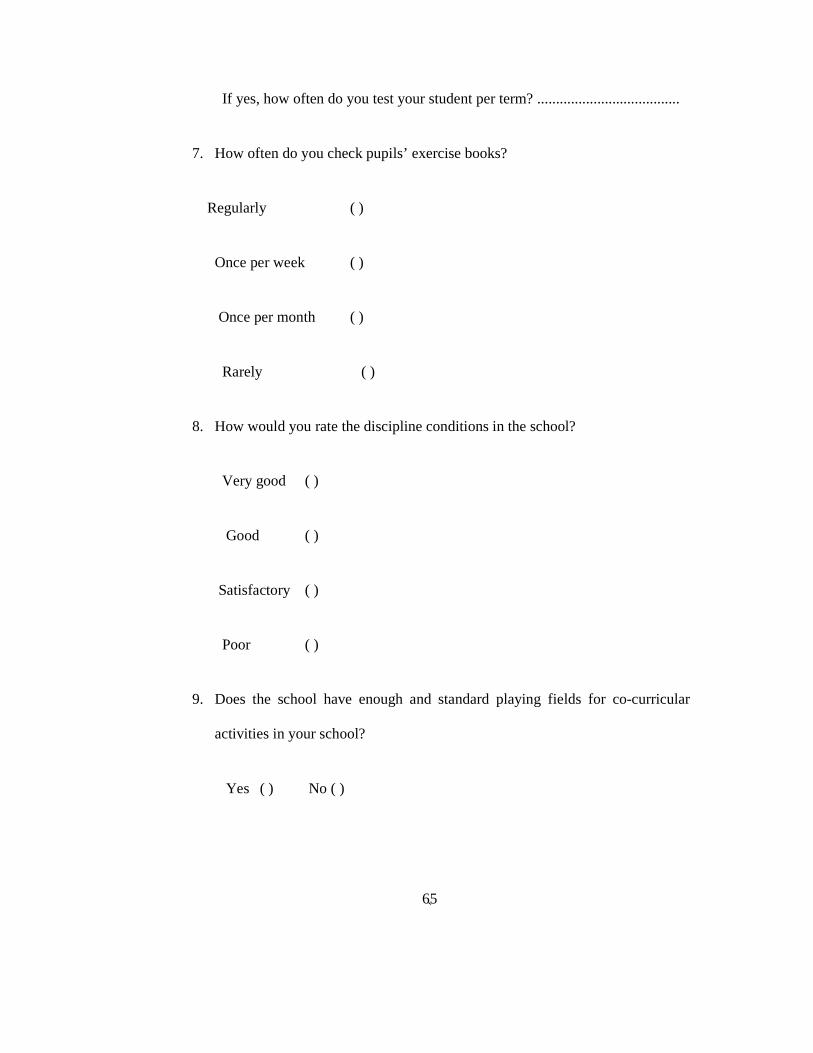
`
65
If yes, how often do you test your student per term? ......................................
7. How often do you check pupils’ exercise books?
Regularly ( )
Once per week ( )
Once per month ( )
Rarely ( )
8. How would you rate the discipline conditions in the school?
Very good ( )
Good ( )
Satisfactory ( )
Poor ( )
9. Does the school have enough and standard playing fields for co-curricular
activities in your school?
Yes ( ) No ( )

`
66
10. Are you given any incentives in this school to motivate you work harder?
Yes ( ) No ( )
11. Is there any organized dialogue among your staff and pupils?
Yes ( ) No ( )
12. Is there any organized dialogue among your staffs and pupils?
Yes No
13. What do you think is the most effective strategies for improving K.C.P.E.
performance in Emgwen Division, Nandi District? (Tick as appropriate)
Strategy ( �)
Providing of adequate learning materials
Employing more teachers
Parents encouraging their children
Motivating pupils
Punishing in disciplined pupils

`
67
APPENDIX C: PUPILS QUESTIONNAIRE
Dear respondent
I am carrying out a research on factors affecting pupils’ performance in public
primary schools at Kenya Certificate of Primary Education (KCPE) in National
Examination in Emgwen Division, Nandi District, Kenya.
Kindly answer the questions below as honestly and accurately as possible. The study
is for academic purpose only. If you have any optional comments you feel like
making, you may write at the back of this questionnaire.
Thank you in advance for your co-operation.
Kindly tick ( �) the correct response in boxes or spaces provided.
1. What is your gender?
Male (__) Female (__)
2. What is your age?_________________________
3. What was your total subjects score at the end of class seven year? Below 200 (__)
Between 200 and 250(__) Between 250 and 300(__) Above 300 (__)
4. If you are a class eight repeater, how many marks did you score in your previous
KCPE examination?
a) Below 200 (__) b) Between 200 and 250 (__)

`
68
C) Between 250 and 300 (__) d) Above 300 (__)
5. Do you take part in games activities?
____________________________________________________________________
6. How often do you do evaluation test?
_____________________________________________________________________
7. Do you participate in election of school prefect?
_____________________________________________________________________
8. Does your school have adequate teaching and learning facilities?
_____________________________________________________________________
9. In your opinion what are the school based factors that affect pupils academic
standard in Nandi district?
_________________________________________________________________
10. What measures should be put in place to improve K.C.P.E. performance? (Tick as
appropriate)

`
69
Measures ( �)
Provision of learning materials
Teamwork
Introduction of remedial classes
Parents should encourage their children
Guidance and counseling
Motivating pupils
Employing more teachers in school
Total

`
70
APPENDIX D:SAMPLED SCHOOLS IN EMGWEN DIVISION
S/No School Teachers Pupils Class eight teachers Head teachers
1. Fr. Toror 6 126 1 1
2. Birei SDA 7 204 1 1
3. Kapkuto 13 356 1 1
4. Chepkober 8 259 1 1
5. Kapchepkok 10 385 1 1
6. Kiborgok 10 252 1 1
7. Kaptoroi 15 701 3 1
8. Kimweru 8 307 1 1
9. Ng’atatia 5 106 1 1
10. Chomisia 9 506 2 1
11. Chepsonoi 20 781 3 1
12. Tangaton 8 258 1 1
13. Bishop A. Muge 10 204 1 1
14. I.P.A.Kaimosi 9 350 1 1
15. Koibem 16 627 2 1
16. Kechire 20 861 3 1
17. Kiutany 9 201 1 1
18. Bishop Birech 9 260 1 1
19. SirwaYala 13 720 3 1
20. Emsos 7 187 1 1
21. Kombe 7 290 1 1
22. Kapkangani 14 1006 4 1
23. Kimondi 12 507 2 1
24. Kamno 8 408 2 1
25. Kalyet 14 530 2 1
26 Cheptigok 16 713 3 1
total 283 11.103 44 26
Source: Nandi District Eduction office

`
71
APPEDIX E. RESEARCH AUTHORIZATION

`
72
APPENDIX F:RESEARCH PERMIT