Two cell line models to study multiorganic metastasis and ...
11
RESEARCH ARTICLE Two cell line models to study multiorganic metastasis and immunotherapy in lung squamous cell carcinoma Karmele Valencia 1,2,3,4, *, Cristina Sainz 1,3 , Cristina Be ́ rtolo 1,3 , Gabriel de Biurrun 5 , Jackeline Agorreta 1,6 , Arantza Azpilikueta 7 , Marta Larrayoz 1,2,5,8 , Graziella Bosco 9 , Carolina Zandueta 1,2 , Miriam Redrado 1,3 , Esther Redı ́ n 1,2,3,8 , Francisco Exposito 1,8,2,3 , Diego Serrano 1,8,3 , Mirari Echepare 1,3,8 , Daniel Ajona 1,2,3,4 , Ignacio Melero 2,3,9,10 , Ruben Pio 1,2,3,4 , Roman Thomas 9,11,12 , Alfonso Calvo 1,2,3,8 and Luis M. Montuenga 1,2,3,8, * ABSTRACT There is a paucity of adequate mouse models and cell lines available to study lung squamous cell carcinoma (LUSC). We have generated and characterized two models of phenotypically different transplantable LUSC cell lines, i.e. UN-SCC679 and UN-SCC680, derived from A/J mice that had been chemically induced with N- nitroso-tris-chloroethylurea (NTCU). Furthermore, we genetically characterized and compared both LUSC cell lines by performing whole-exome and RNA sequencing. These experiments revealed similar genetic and transcriptomic patterns that may correspond to the classic LUSC human subtype. In addition, we compared the immune landscape generated by both tumor cells lines in vivo and assessed their response to immune checkpoint inhibition. The differences between the two cell lines are a good model for the remarkable heterogeneity of human squamous cell carcinoma. Study of the metastatic potential of these models revealed that both cell lines represent the organotropism of LUSC in humans, i.e. affinity to the brain, bones, liver and adrenal glands. In summary, we have generated valuable cell line tools for LUSC research, which recapitulates the complexity of the human disease. KEY WORDS: Lung cancer, Squamous, NTCU-mouse model, Syngeneic cell lines, RNASeq, Immunotherapy INTRODUCTION Lung cancer is the leading cause of cancer-related death worldwide (Ferlay et al., 2019). The incidence and mortality associated with lung cancer is a major public health challenge in advanced societies (Siegel et al., 2020). It is expected that, by 2035, less-developed regions will face an increase of new cancer cases by 144%, compared to 54% in more-developed regions (Pilleron et al., 2019). Lung cancer represents ∼12-13% of all new diagnosed cases and presents the highest overall mortality. Of all lung cancers ∼20-30% are classified as lung squamous cell carcinoma (LUSC; also known as SCC or SqCC of the lung, or epidermoid carcinoma). There are two types of lung cancer, i.e. small lung cell cancer (SCLC) and non-small cell lung cancer (NSCLC), and LUSC is more strongly associated with tobacco smoking than any other subtype of NSCLC. Age, exposure to second-hand smoke, asbestos, mineral and metal dust, and radon constitute other risk factors for LUSC. Basal stratified squamous lung epithelial cells are the most likely origin for LUSC (Ferone et al., 2020). Within LUSC, different histological subtypes ranging from the most-differentiated keratinized subtype to a mainly undifferentiated subtype without apparent signs of keratinization can be distinguished. For an accurate pathological diagnosis, the use of immunohistochemical markers is mandatory. LUSC is characterized for being positive for cytokeratins 5 and 6 (CKs5/6; officially known as KRT5 and KRT6, respectively) as well as for tumor protein p63 (officially known as TP63) and its isoform p40, and for being negative for thyroid transcription factor-1 (TTF1, officially known as TITF1), the pathognomonic immunohistochemical marker of the NSCLC subtype lung adenocarcinoma (LUAD) (Goldstraw et al., 2016). More frequently, LUSC occurs in the central airways or in higher order bronchi but, as well as to lung-related lymph nodes, it can spread to multiple organs, including brain, bones, adrenal glands and liver (Milovanovic et al., 2017). LUSC is a less-studied NSCLC subtype than LUAD. Different factors have contributed this fact. First LUSC biology is more challenging than that of LUAD and, on average, human LUSCs have more mutations per megabase than LUAD (Bailey et al., 2018). Thus, LUSC may have higher genetic and phenotypic heterogeneity might be increased in LUSC. The lack of evident oncogenic driver mutations within LUSC is also a hurdle; instead, it seems to be driven by copy number change and/or mutations of tumor suppressors. In fact, although there have been some attempts to target recurrent genetic alterations, targeted therapies were demonstrated to be poorly effective options for LUSC up to now (Rekhtman et al., 2012). Second, the scarcity of preclinical models Handling Editor: Elaine R. Mardis Received 27 May 2021; Accepted 29 November 2021 1 Program in Solid Tumors, CIMA-University of Navarra, 31008 Pamplona, Spain. 2 Consorcio de Investigació n Biomé dica en Red de Cá ncer (CIBERONC), 28029 Madrid, Spain. 3 Navarra Health Research Institute (IDISNA), 31008 Pamplona, Spain. 4 Department of Biochemistry and Genetics, School of Sciences, University of Navarra, 31009 Pamplona, Spain. 5 Department of Environmental Biology School of Sciences, University of Navarra, 31009 Pamplona, Spain. 6 Department of Health Sciences, Biochemistry Area, Public University of Navarra, 31008 Pamplona, Spain. 7 Program of Immunology and Immunotherapy, CIMA-University of Navarra, 31008 Pamplona, Spain. 8 Department of Pathology, Anatomy and Physiology, School of Medicine, University of Navarra, 31009 Pamplona, Spain. 9 Department of Translational Genomics, Medical Faculty, University of Cologne, 50931 Cologne, Germany. 10 Department of Oncology, Clı ́ nica Universidad de Navarra, 31008 Pamplona, Spain. 11 Department of Pathology, University Hospital Cologne, 50937 Cologne, Germany. 12 German Cancer Research Center, German Cancer Consortium (DKTK), 69120 Heidelberg, Germany. *Authors for correspondence ([email protected], [email protected]) K.V., 0000-0002-2882-7427; F.E., 0000-0002-5406-0768; L.M.M., 0000-0002- 8739-1387 This is an Open Access article distributed under the terms of the Creative Commons Attribution License (https://creativecommons.org/licenses/by/4.0), which permits unrestricted use, distribution and reproduction in any medium provided that the original work is properly attributed. 1 © 2022. Published by The Company of Biologists Ltd | Disease Models & Mechanisms (2022) 15, dmm049137. doi:10.1242/dmm.049137 Disease Models & Mechanisms
-
Upload
khangminh22 -
Category
Documents
-
view
3 -
download
0
Transcript of Two cell line models to study multiorganic metastasis and ...
RESEARCH ARTICLE
Two cell line models to study multiorganic metastasis andimmunotherapy in lung squamous cell carcinomaKarmele Valencia1,2,3,4,*, Cristina Sainz1,3, Cristina Bertolo1,3, Gabriel de Biurrun5, Jackeline Agorreta1,6,Arantza Azpilikueta7, Marta Larrayoz1,2,5,8, Graziella Bosco9, Carolina Zandueta1,2, Miriam Redrado1,3,Esther Redın1,2,3,8, Francisco Exposito1,8,2,3, Diego Serrano1,8,3, Mirari Echepare1,3,8, Daniel Ajona1,2,3,4,Ignacio Melero2,3,9,10, Ruben Pio1,2,3,4, Roman Thomas9,11,12, Alfonso Calvo1,2,3,8 andLuis M. Montuenga1,2,3,8,*
ABSTRACTThere is a paucity of adequate mouse models and cell lines availableto study lung squamous cell carcinoma (LUSC). We have generatedand characterized two models of phenotypically differenttransplantable LUSC cell lines, i.e. UN-SCC679 and UN-SCC680,derived from A/J mice that had been chemically induced with N-nitroso-tris-chloroethylurea (NTCU). Furthermore, we geneticallycharacterized and compared both LUSC cell lines by performingwhole-exome and RNA sequencing. These experiments revealedsimilar genetic and transcriptomic patterns that may correspond to theclassic LUSC human subtype. In addition, we compared the immunelandscape generated by both tumor cells lines in vivo and assessedtheir response to immune checkpoint inhibition. The differencesbetween the two cell lines are a good model for the remarkableheterogeneity of human squamous cell carcinoma. Study of themetastatic potential of these models revealed that both cell linesrepresent the organotropism of LUSC in humans, i.e. affinity to thebrain, bones, liver and adrenal glands. In summary, we havegenerated valuable cell line tools for LUSC research, whichrecapitulates the complexity of the human disease.
KEY WORDS: Lung cancer, Squamous, NTCU-mouse model,Syngeneic cell lines, RNASeq, Immunotherapy
INTRODUCTIONLung cancer is the leading cause of cancer-related death worldwide(Ferlay et al., 2019). The incidence and mortality associated withlung cancer is a major public health challenge in advanced societies(Siegel et al., 2020). It is expected that, by 2035, less-developedregions will face an increase of new cancer cases by 144%,compared to 54% in more-developed regions (Pilleron et al., 2019).Lung cancer represents ∼12-13% of all new diagnosed cases andpresents the highest overall mortality.
Of all lung cancers ∼20-30% are classified as lung squamous cellcarcinoma (LUSC; also known as SCC or SqCC of the lung, orepidermoid carcinoma). There are two types of lung cancer, i.e.small lung cell cancer (SCLC) and non-small cell lung cancer(NSCLC), and LUSC is more strongly associated with tobaccosmoking than any other subtype of NSCLC. Age, exposure tosecond-hand smoke, asbestos, mineral and metal dust, and radonconstitute other risk factors for LUSC.
Basal stratified squamous lung epithelial cells are the most likelyorigin for LUSC (Ferone et al., 2020). Within LUSC, differenthistological subtypes ranging from the most-differentiatedkeratinized subtype to a mainly undifferentiated subtype withoutapparent signs of keratinization can be distinguished. For anaccurate pathological diagnosis, the use of immunohistochemicalmarkers is mandatory. LUSC is characterized for being positive forcytokeratins 5 and 6 (CKs5/6; officially known as KRT5 and KRT6,respectively) as well as for tumor protein p63 (officially known asTP63) and its isoform p40, and for being negative for thyroidtranscription factor-1 (TTF1, officially known as TITF1), thepathognomonic immunohistochemical marker of the NSCLCsubtype lung adenocarcinoma (LUAD) (Goldstraw et al., 2016).More frequently, LUSC occurs in the central airways or in higherorder bronchi but, as well as to lung-related lymph nodes, it canspread to multiple organs, including brain, bones, adrenal glandsand liver (Milovanovic et al., 2017).
LUSC is a less-studied NSCLC subtype than LUAD. Differentfactors have contributed this fact. First LUSC biology is morechallenging than that of LUAD and, on average, human LUSCshave more mutations per megabase than LUAD (Bailey et al.,2018). Thus, LUSC may have higher genetic and phenotypicheterogeneity might be increased in LUSC. The lack of evidentoncogenic driver mutations within LUSC is also a hurdle; instead, itseems to be driven by copy number change and/or mutations oftumor suppressors. In fact, although there have been some attemptsto target recurrent genetic alterations, targeted therapies weredemonstrated to be poorly effective options for LUSC up to now(Rekhtman et al., 2012). Second, the scarcity of preclinical models
Handling Editor: Elaine R. MardisReceived 27 May 2021; Accepted 29 November 2021
1Program in Solid Tumors, CIMA-University of Navarra, 31008 Pamplona, Spain.2Consorcio de Investigacion Biomedica en Red de Cancer (CIBERONC), 28029Madrid, Spain. 3Navarra Health Research Institute (IDISNA), 31008 Pamplona,Spain. 4Department of Biochemistry and Genetics, School of Sciences, Universityof Navarra, 31009 Pamplona, Spain. 5Department of Environmental Biology Schoolof Sciences, University of Navarra, 31009 Pamplona, Spain. 6Department of HealthSciences, Biochemistry Area, Public University of Navarra, 31008 Pamplona, Spain.7Program of Immunology and Immunotherapy, CIMA-University of Navarra, 31008Pamplona, Spain. 8Department of Pathology, Anatomy and Physiology, School ofMedicine, University of Navarra, 31009 Pamplona, Spain. 9Department ofTranslational Genomics, Medical Faculty, University of Cologne, 50931 Cologne,Germany. 10Department of Oncology, Clınica Universidad de Navarra, 31008Pamplona, Spain. 11Department of Pathology, University Hospital Cologne, 50937Cologne, Germany. 12German Cancer Research Center, German CancerConsortium (DKTK), 69120 Heidelberg, Germany.
*Authors for correspondence ([email protected], [email protected])
K.V., 0000-0002-2882-7427; F.E., 0000-0002-5406-0768; L.M.M., 0000-0002-8739-1387
This is an Open Access article distributed under the terms of the Creative Commons AttributionLicense (https://creativecommons.org/licenses/by/4.0), which permits unrestricted use,distribution and reproduction in any medium provided that the original work is properly attributed.
1
© 2022. Published by The Company of Biologists Ltd | Disease Models & Mechanisms (2022) 15, dmm049137. doi:10.1242/dmm.049137
Disea
seModels&Mechan
isms
makes disease analysis and research more challenging. Thus, LUSCanimal models to date have mostly been developed in mice afterintratracheal instillation of chemicals, such as benzo-[a]-pyrene(BaP) or 3-methylholanthrene (3-MCA) (Whitmire et al., 1981;Yoshimoto et al., 1977), or after topical application of N-nitroso-methyl-bis-chloromethyl urea or N-nitroso-tris-chloroethylurea(NTCU) (Wang et al., 2004). To our knowledge only one cell linehas – >40 years ago – been derived from one of these mousemodels; it was used for a number of experiments over the years,although its full genomic and phenotypic characteristics have notyet been described (Kaneko and LePage TKS, 1980). There are alsoa limited number of genetically engineered mouse models(GEMMs) (Ferone et al., 2020). In the era of immunotherapy, theuse of well-characterized murine LUSC cell lines that can betransplanted in syngeneic mice is highly convenient to test noveltherapies. Such approach is more-complex in chemically inducedand GEMMs because of their late tumor onset and slower tumorgrowth.In this present work, we performed exhaustive molecular and
functional characterization, and comparison of two novel LUSCresearch cell line models. These models consist of two A/J mouse-derived syngeneic cell lines obtained by using NTCU-inducedLUSCs. These cell lines might become robust tools for the study ofsquamous cell lung cancer in a reliable and reproducible manner,and when testing novel antimetastatic and immunotherapy agents.
In fact, one of the two cell lines (UN-SCC680) has successfullybeen used by our group to evaluate a strategy of combinedimmunotherapy (Azpilikueta et al., 2016). Here, we provideessential and comparative information that will allow the use ofthese models in molecularly defined experimental settings
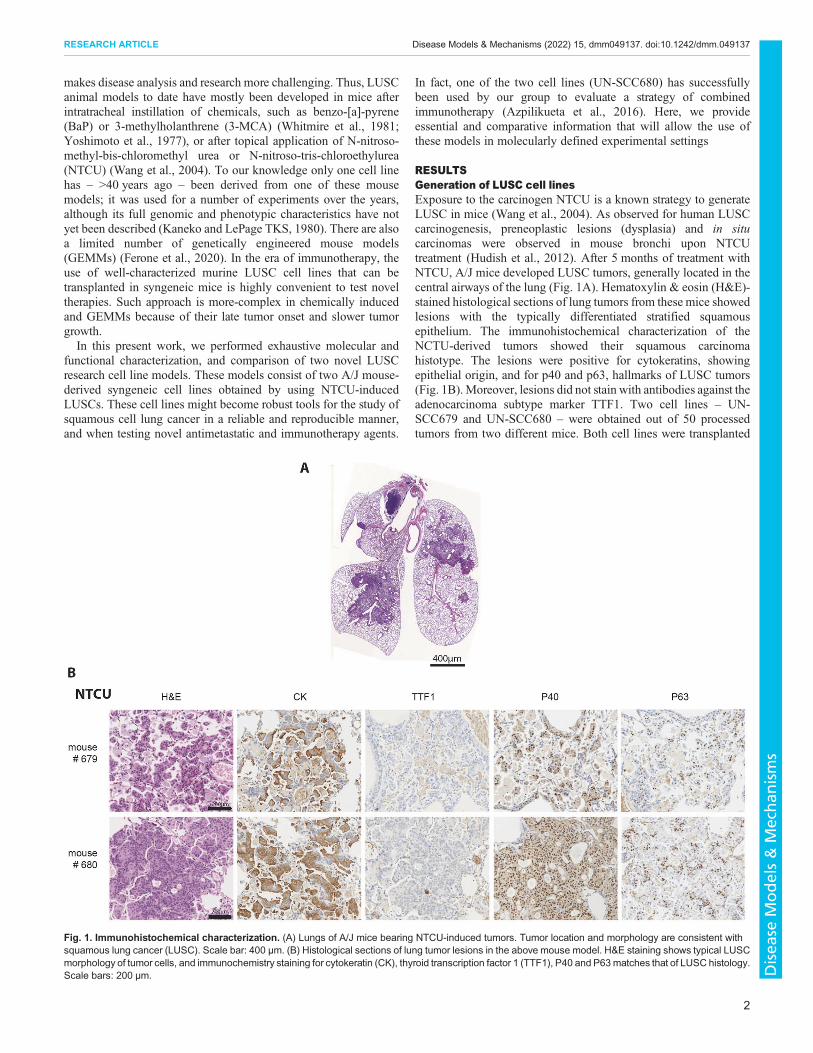
RESULTSGeneration of LUSC cell linesExposure to the carcinogen NTCU is a known strategy to generateLUSC in mice (Wang et al., 2004). As observed for human LUSCcarcinogenesis, preneoplastic lesions (dysplasia) and in situcarcinomas were observed in mouse bronchi upon NTCUtreatment (Hudish et al., 2012). After 5 months of treatment withNTCU, A/J mice developed LUSC tumors, generally located in thecentral airways of the lung (Fig. 1A). Hematoxylin & eosin (H&E)-stained histological sections of lung tumors from these mice showedlesions with the typically differentiated stratified squamousepithelium. The immunohistochemical characterization of theNCTU-derived tumors showed their squamous carcinomahistotype. The lesions were positive for cytokeratins, showingepithelial origin, and for p40 and p63, hallmarks of LUSC tumors(Fig. 1B).Moreover, lesions did not stain with antibodies against theadenocarcinoma subtype marker TTF1. Two cell lines – UN-SCC679 and UN-SCC680 – were obtained out of 50 processedtumors from two different mice. Both cell lines were transplanted
Fig. 1. Immunohistochemical characterization. (A) Lungs of A/J mice bearing NTCU-induced tumors. Tumor location and morphology are consistent withsquamous lung cancer (LUSC). Scale bar: 400 µm. (B) Histological sections of lung tumor lesions in the above mouse model. H&E staining shows typical LUSCmorphology of tumor cells, and immunochemistry staining for cytokeratin (CK), thyroid transcription factor 1 (TTF1), P40 and P63matches that of LUSC histology.Scale bars: 200 µm.
2
RESEARCH ARTICLE Disease Models & Mechanisms (2022) 15, dmm049137. doi:10.1242/dmm.049137
Disea
seModels&Mechan
isms

into the flank of immunosuppressed Rag−/− IL2Rg−/− mice,generating an allograft model. Subsequently, a syngeneic modelwas developed in A/J mice from which the two final working celllines were established. Both UN-SCC679 and UN-SCC680 werefusiform, adherent cells with similar and fast in vitro proliferationrates (Fig. S1B and C). Progressive de-differentiation of the typicalsquamous phenotype was observed with increasing passages, aspreviously reported for human lung LUSC cancer cell lines(Hazawa et al., 2017; Chen et al., 2018a).
Whole-exome and RNA sequencingTo characterize and compare the genomic alterations present inthese two syngeneic LUSC cell lines, whole-exome sequencing wasperformed. The type and frequency of mutations for both cell linesare shown in Table 1. Being in the range of non-synonymousmutations consistent with human NSCLC data (Rizvi et al., 2015;Hammerman et al., 2012), UN-SCC679 cells showed a lessermutational burden when compared to UN-SCC680 cells. Despitecoming from the same mouse model and belonging to the samehistological subtype, UN-SCC679 and UN-SCC680 cells presenteddifferent mutational profiles (Fig. 2A). In fact, they just sharedalterations in seven widespread genes, i.e. Aplnr, Fbn1, Dnah6,Cdh23, Trhde, Csmd3 and Csf2rb. UN-SCC679 cells showed amutation in Tp53 and UN-SCC680 cells in Rb1, both tumorsuppressor genes characteristic of LUSC in patients (Bhateja et al.,2019). In addition, other oncogenes or tumor suppressor genes thatare present in human tumors according to Bailey et al. (Bailey et al.,2018), were found (Fig. 2A). A complete list of mutated genes isshown in Tables S1 and S2.
Comparative transcriptomicsWe also studied the comparative gene expression profile of UN-SCC679 and UN-SCC680 cells by using RNA sequencing, usingmouse lung non-malignant epithelial basal cells tissue as reference.Differentially expressed genes with an adjusted restrictive P-value<5×10⁻⁵ are represented in Fig. 2B, and listed in Tables S3 and S4(Tables S3 and S4). We compared the differentially expressed genesidentified in UN-SCC679 with those in UN-SCC680 cells. Weobserved that∼80% of the differentially expressed genes are presentin both cell lines. This indicated that, despite their differences inmutational patterns, UN-SCC679 and UN-SCC680 cells sharemany molecular similarities that reflect their identical squamousorigin. Shared and non-shared differentially expressed genes arelisted in Table S5. Compared to normal lung tissue, we found thatboth cell lines are enriched in p63 (compared to whole lung murinetissue; GSE118246) and that expression of genes related to theclassic subtype described for human LUSC genomic subtypes, suchasGsto1, Aldh3a1, Bcl6, Atp5g3,Dld,Odc1, Trp63,Gsta4,Ndufb5,Ephx1 or Cox5b (data not shown) is increased (Cancer Genome
Atlas Research Network, 2012). Another characteristic of the classicsubtype is the alteration of PI3K and KEAP1 pathways. We foundthat, compared to basal epithelial cells, Keap1 and Pik3ca areenriched in both cell lines (Fig. S1E). Finally, both cell linesoverexpress Arnt2, which has been previously associated to lungcancer (Yang et al., 2015).
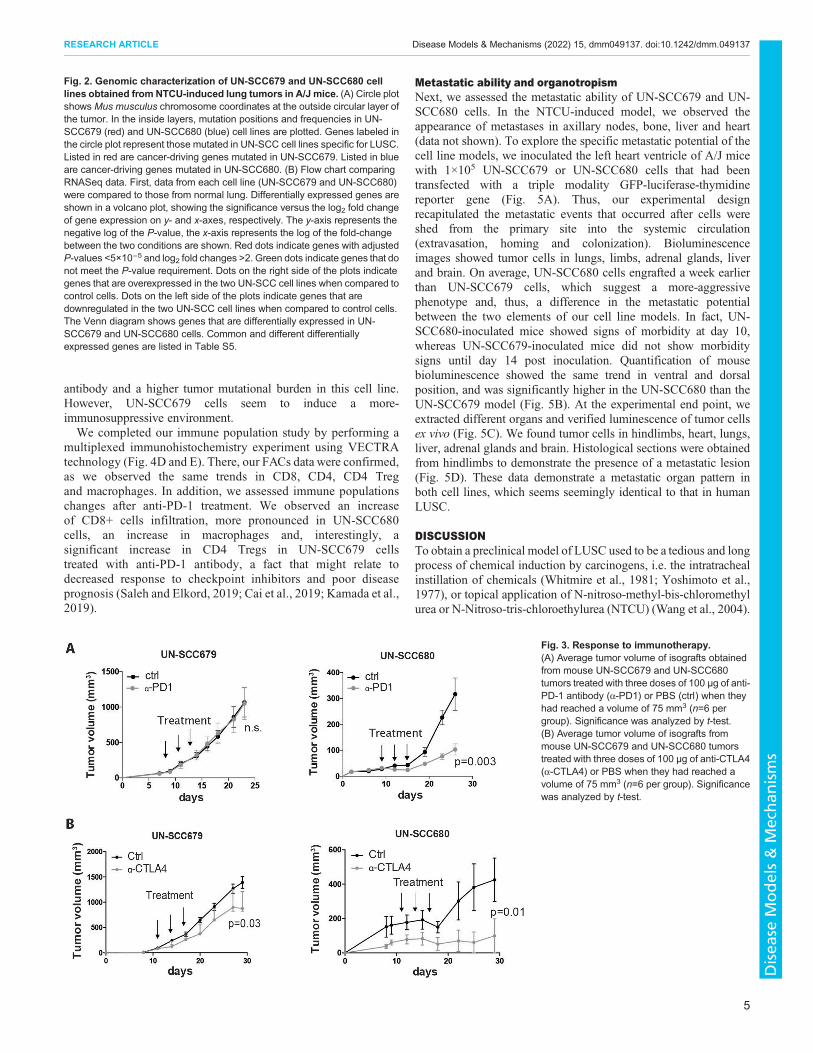
Immunotherapy responseIt has previously been reported that increased tumor mutationburden is associated with clinical efficacy of inhibition ofprogrammed cell death 1 (PDCD1, also known as PD-1), i.e. anti-PD-1 therapy (Rizvi et al., 2015). Taking in consideration themutational differences found between tumors of UN-SCC679 andUN-SCC680 cells, we wanted to assess and compare the effect ofanti-PD-1 therapy and therapy against cytotoxic T lymphocyte-associated antigen (CTLA4), i.e. anti-CTLA4 therapy, in bothLUSC models. Although proliferation rates of UN-SCC679 andUN-SCC680 cells was similar in vitro and in vivo in immune-deficient mice (Fig. S1C and D), UN-SCC679 cells showed anadvantageous in vivo tumor growth in immune-competent micecompared to that of UN-SCC680 cells (Fig. 3A,B), suggesting thatUN-SCC680 cells provoke an increased immune responsecompared with UN-SCC679 cells. In fact, 10-20% of miceinoculated with UN-SCC680 cells showed spontaneous regressionof their tumors. Moreover, anti-PD-1 therapy significantly reducedUN-SCC680 tumor growth, whereas UN-SCC679 tumors showedcomplete resistance (Fig. 3A). These results are consistent with thelower mutational burden of UN-SCC679 cells compared to thatof UN-SCC680 cells. However, although both UN-SCC679and UN-SCC680 tumors tended to partially respond to anti-CTLA4 therapy (Fig. 3B), the response of UN-SCC680 tumorsseemed more robust than that of UN-SCC679 tumors. Interestingly,the UN-SCC679 and UN-SCC680 models resemble the clinicalreality of 15:85 patients who are responsive or resistant toimmunotherapy.
Immune landscape characterizationThe success of checkpoint blockade in NSCLC, both squamous cellcarcinoma and adenocarcinoma, is strongly influenced by the natureof the immune infiltrate present in the tumor (Cristescu et al., 2018).To better understand and compare the types of immune responseagainst our cell line models of squamous tumors, we analyzed theimmune infiltrates of these LUSC models by flow cytometry. Wechose day 13 post inoculation because, at that point, UN-SCC679and UN-SCC680 tumors were similar in size and, thus, stillcomparable. UN-SCC679 tumors had a higher percentage ofimmune cell infiltration (Fig. 4A). This was dominated by myeloidcells (Fig. 4B) and, in particular, by tumor-associated macrophages(Fig. 4B). In contrast, UN-SCC680 tumors were infiltrated bysignificantly fewer myeloid cells and showed bigger proportions ofanti-tumor immune cell populations [CD8T cells, non-regulatory T(non-Treg) CD4T cells and NK cells] infiltrating the tumormicroenvironment. Although the percentage of PD-1 positiveCD8T cells did not differ between the two tumor models, themean fluorescence intensity of both PD-1 and GITR on CD8T cellswas slightly lower in the CD8T cells infiltrating UN-SCC680tumors, suggesting a less-exhausted phenotype in CD8T cells(Fig. 4C). Overall, these data indicate that, within our models, thetwo cell lines generated two different microenvironmentallandscapes. In UN-SCC680-derived tumors the immune infiltrateis characterized by a stronger anti-tumor immune response, which isconsistent with a greater response to treatment with anti-PD-1
Table 1. Mutation burden in UN-SCC679 and UN-SCC680 cells
Mutation typeFrequency per cell line
UN-SCC679 UN-SCC680
Frame shift deletion 5 4Frame shift insertion 3 1Missense mutation 161 188Nonsense mutation 17 15Silent mutation 71 76Splice site mutation 11 12Nonstop mutation 2Total 270 296
3
RESEARCH ARTICLE Disease Models & Mechanisms (2022) 15, dmm049137. doi:10.1242/dmm.049137
Disea
seModels&Mechan
isms

Fig. 2. See next page for legend.
4
RESEARCH ARTICLE Disease Models & Mechanisms (2022) 15, dmm049137. doi:10.1242/dmm.049137
Disea
seModels&Mechan
isms
antibody and a higher tumor mutational burden in this cell line.However, UN-SCC679 cells seem to induce a more-immunosuppressive environment.We completed our immune population study by performing a
multiplexed immunohistochemistry experiment using VECTRAtechnology (Fig. 4D and E). There, our FACs data were confirmed,as we observed the same trends in CD8, CD4, CD4 Tregand macrophages. In addition, we assessed immune populationschanges after anti-PD-1 treatment. We observed an increaseof CD8+ cells infiltration, more pronounced in UN-SCC680cells, an increase in macrophages and, interestingly, asignificant increase in CD4 Tregs in UN-SCC679 cellstreated with anti-PD-1 antibody, a fact that might relate todecreased response to checkpoint inhibitors and poor diseaseprognosis (Saleh and Elkord, 2019; Cai et al., 2019; Kamada et al.,2019).
Metastatic ability and organotropismNext, we assessed the metastatic ability of UN-SCC679 and UN-SCC680 cells. In the NTCU-induced model, we observed theappearance of metastases in axillary nodes, bone, liver and heart(data not shown). To explore the specific metastatic potential of thecell line models, we inoculated the left heart ventricle of A/J micewith 1×10⁵ UN-SCC679 or UN-SCC680 cells that had beentransfected with a triple modality GFP-luciferase-thymidinereporter gene (Fig. 5A). Thus, our experimental designrecapitulated the metastatic events that occurred after cells wereshed from the primary site into the systemic circulation(extravasation, homing and colonization). Bioluminescenceimages showed tumor cells in lungs, limbs, adrenal glands, liverand brain. On average, UN-SCC680 cells engrafted a week earlierthan UN-SCC679 cells, which suggest a more-aggressivephenotype and, thus, a difference in the metastatic potentialbetween the two elements of our cell line models. In fact, UN-SCC680-inoculated mice showed signs of morbidity at day 10,whereas UN-SCC679-inoculated mice did not show morbiditysigns until day 14 post inoculation. Quantification of mousebioluminescence showed the same trend in ventral and dorsalposition, and was significantly higher in the UN-SCC680 than theUN-SCC679 model (Fig. 5B). At the experimental end point, weextracted different organs and verified luminescence of tumor cellsex vivo (Fig. 5C). We found tumor cells in hindlimbs, heart, lungs,liver, adrenal glands and brain. Histological sections were obtainedfrom hindlimbs to demonstrate the presence of a metastatic lesion(Fig. 5D). These data demonstrate a metastatic organ pattern inboth cell lines, which seems seemingly identical to that in humanLUSC.
DISCUSSIONTo obtain a preclinical model of LUSC used to be a tedious and longprocess of chemical induction by carcinogens, i.e. the intratrachealinstillation of chemicals (Whitmire et al., 1981; Yoshimoto et al.,1977), or topical application of N-nitroso-methyl-bis-chloromethylurea or N-Nitroso-tris-chloroethylurea (NTCU) (Wang et al., 2004).
Fig. 2. Genomic characterization of UN-SCC679 and UN-SCC680 celllines obtained fromNTCU-induced lung tumors in A/J mice. (A) Circle plotshows Mus musculus chromosome coordinates at the outside circular layer ofthe tumor. In the inside layers, mutation positions and frequencies in UN-SCC679 (red) and UN-SCC680 (blue) cell lines are plotted. Genes labeled inthe circle plot represent those mutated in UN-SCC cell lines specific for LUSC.Listed in red are cancer-driving genes mutated in UN-SCC679. Listed in blueare cancer-driving genes mutated in UN-SCC680. (B) Flow chart comparingRNASeq data. First, data from each cell line (UN-SCC679 and UN-SCC680)were compared to those from normal lung. Differentially expressed genes areshown in a volcano plot, showing the significance versus the log2 fold changeof gene expression on y- and x-axes, respectively. The y-axis represents thenegative log of the P-value, the x-axis represents the log of the fold-changebetween the two conditions are shown. Red dots indicate genes with adjustedP-values <5×10⁻⁵ and log2 fold changes >2. Green dots indicate genes that donot meet the P-value requirement. Dots on the right side of the plots indicategenes that are overexpressed in the two UN-SCC cell lines when compared tocontrol cells. Dots on the left side of the plots indicate genes that aredownregulated in the two UN-SCC cell lines when compared to control cells.The Venn diagram shows genes that are differentially expressed in UN-SCC679 and UN-SCC680 cells. Common and different differentiallyexpressed genes are listed in Table S5.
Fig. 3. Response to immunotherapy.(A) Average tumor volume of isografts obtainedfrom mouse UN-SCC679 and UN-SCC680tumors treated with three doses of 100 µg of anti-PD-1 antibody (α-PD1) or PBS (ctrl) when theyhad reached a volume of 75 mm3 (n=6 pergroup). Significance was analyzed by t-test.(B) Average tumor volume of isografts frommouse UN-SCC679 and UN-SCC680 tumorstreated with three doses of 100 µg of anti-CTLA4(α-CTLA4) or PBS when they had reached avolume of 75 mm3 (n=6 per group). Significancewas analyzed by t-test.
5
RESEARCH ARTICLE Disease Models & Mechanisms (2022) 15, dmm049137. doi:10.1242/dmm.049137
Disea
seModels&Mechan
isms

Fig. 4. See next page for legend.
6
RESEARCH ARTICLE Disease Models & Mechanisms (2022) 15, dmm049137. doi:10.1242/dmm.049137
Disea
seModels&Mechan
isms

More recently, the generation of different GEMMs, accomplishedby targeting single or combined driver mutations to distinct cells oforigin, provided less-cumbersome tools for cancer researchers(Ferone et al., 2020). However, chemically induced lung cancermodels present several advantages over GEMMs, as the spectrum ofmutations achieved in these models is wider and moreheterogeneous, thereby mimicking human pathologies. This isespecially true in tobacco-associated subtypes, such as LUSC.The number of cell lines derived from LUSC animal models is
still very limited (Kaneko and LePage TKS, 1980). Besides,thorough molecular and functional characterization of these celllines is crucial, so they can be used by the scientific community witha broad knowledge of their more-relevant traits. This is key for anycell model that aims to be a quality tool providing relevant results.Lung cancer research has been one of the pioneer fields in valuingthis characterization for cell line models (Mulshine et al., 2020).Functional aspects, such as level of proliferation, immunogenicity,metastatic capacity and organotropism, are particularly relevantwhen selecting a cancer cell line model.Despite coming from the same murine carcinogenesis model,
having been generated in the same experimental setting and sharingthe same immunohistochemical traits for LUSC cells, the two celllines derived from the tumors that comprise our two cell linesmodels – namely UN-SCC679 and UN-SCC680 cells – presentdifferent genotypic and phenotypic characteristics. This offers theopportunity to use two alternative models for different comparativeanalytical purposes.Amongst the relevant differences we found in these two cell
line models, the disparity of mutated genes as well as the differentgene expression profiles were relatively unexpected. Still, althoughthe number of mutated genes that are shared is not high, i.e. onlypresent in seven genes, all mutated genes are relevant in human lungcancer. For example, expression of the G protein-coupled receptorfamily member apelin receptor (APLNR) has been shown topromote proliferation and cell autophagy via ERK1/2 signaling inhuman lung cancer cells (Yang et al., 2014). Dynein axonemalheavy chain 6 (DNAH6) belongs to the dynein family, whosemembers encode large proteins that constitute the microtubule-associated motor protein complex; it has recently been related tosmoking-associated lung cancer (Chen et al., 2018b). Besides,analysis of lung cancer patient data indicated that cadherin related23 (CDH23) – a member of the cadherin superfamily, whose genesencode calcium-dependent cell-cell adhesion glycoproteins – isdownregulated in lung cancer, working as a suppressor of cellmigration (Sannigrahi et al., 2019). Several groups have proposedCUB and sushi multiple domains 3 (CSMD3) to be a frequentlymutated gene in human LUSC, resulting in an increasedproliferation of airway epithelial cells (Cancer Genome Atlas
Research Network, 2012; Liu et al., 2012; Li et al., 2015). Fibrillin-1 (FBN1), encoding an extracellular matrix glycoprotein that servesas a structural component of calcium-binding microfibrils, seems toplay an important role in tumor-related immune infiltration and hasbeen proposed as a prognostic and predictive biomarker for immunetherapy against pancreatic ductal adenocarcinoma (PDAC) (Luanet al., 2020). Finally, colony stimulating factor 2 receptor subunitbeta (CSF2RB) has been shown to regulate epithelial-mesenchymaltransition (EMT) in human lung cancer cells (Wu et al., 2020;Rudisch et al., 2015). Our study also shows mutations in genes thatare involved in mechanisms relevant in cell-cell adhesion,microtubule activity or extracellular matrix conformation, therebyindicating the presence of commonly altered functions in LUSCtumorigenesis.
Relevant LUSC studies coincide in emphasizing the molecularheterogeneity of this tumor type, which makes the development oftargeted therapies very difficult (Hammerman et al., 2012). Thus,we analyzed to which of the described genetic human LUSCsubtypes our two mice LUSC cell lines could be assimilated,according to their gene expression profiles. Comparing ourRNASeq data to what has been published about human LUSCgenomic subtypes (Cancer Genome Atlas Research Network,2012), both cell line models are enriched in the expression ofgenes related to the human ‘classic’ LUSC subtype.
The National Comprehensive Cancer Network guidelines forLUSC treatment (Ettinger et al., 2019) do not recommend anyspecific molecular testing for LUSC. This seems to be aconsequence of the above-mentioned lack of common geneticalterations in LUSC and the lack of actionable mutations. However,immunotherapy has been an emerging and promising treatment forLUSC patients. The approval of the anti-PD-1 antibodypembrolizumab as a first-line treatment in selected patients hasmade PD-L1 immunohistochemistry mandatory for all patients withadvanced NSCLC that lacks sensitizing mutations regardingtargeted therapies.
It is well stablished how specific mutations drive immune evasionin cancer. Specifically, mutations in KRAS and P53 are partlyresponsible for the resistance of lung tumors to immunotherapy(Spranger and Gajewski, 2018; Ischenko et al., 2021). UN-SCC679cells showed mutated p53 (the most common alteration in humanLUSC), which could be involved in its resistance to anti-PD-1treatment. However, UN-SCC680 cells, which responded toimmunotherapy to some extent, contained mutated Kras.Nevertheless, the specific Kras mutation found in UN-SCC680cells was a rare alteration of the gene, which differed to the classicG12V/Dmutation that characterizes lung cancer. This detail must betaken into account, since Kras is not a gene characteristicallymutated in LUSC and because the mutation we found in our cell linemight have other functional and biological implications regardingthe tumoral context, which are different to those expected with theclassic G12V/D mutation.
In the context of sensitivity to immunotherapy and based on thetumor immune landscape, six immune subtypes (ISs) have beenidentified in SCC. The most common for LUSC – comprising∼41%of cases – is IS1, followed by IS5 (25%) and IS3 (14%). Both IS1and IS3 are ‘immune-cold’, characterized by a low lymphocyteinfiltration rate, a high immunosuppressive microenvironmentand a poor prognosis. IS3 has the worst outcome among allsubtypes (Li et al., 2019). According to this classification, theimmune infiltrate we describe in our present study for UN-SCC679tumors could be assimilated to the features of the IS3 subtype, witha rich immunosuppressive microenvironment characterized by
Fig. 4. Immune landscape characterization. (A) Relative quantification ofCD45+ and lymphoid cells infiltrating UN-SCC679 and UN-SCC680 tumors.(B) Relative quantification of myeloid cells infiltrating UN-SCC679 and UN-SCC680 tumors. (C) Relative quantification of immune exhaustion markersCD8+ cells infiltrating UN-SCC679 and UN-SCC680 tumors. Plotted is theMedian Fluorescence Intensity (MFI). Analyses were made at day 13 postinoculation (n=6 per group). Significance was analyzed by t-test. (D) VECTRAimages showing the main immune cell populations infiltrating UN-SCC679 andUN-SCC680 tumors that had been control treated or treated with anti-PD-1antibody (α-PD1). (E) Relative quantification of CD8, CD4, CD4 Treg(defined as CD4+, FOXP3+) cells and macrophages (F4/80+) infiltratingUN-SCC679 and UN-SCC680 tumors that had been control treated or treatedwith anti-PD-1 antibody represented as target cells/total cells in percent.n.s., not significant.
7
RESEARCH ARTICLE Disease Models & Mechanisms (2022) 15, dmm049137. doi:10.1242/dmm.049137
Disea
seModels&Mechan
isms
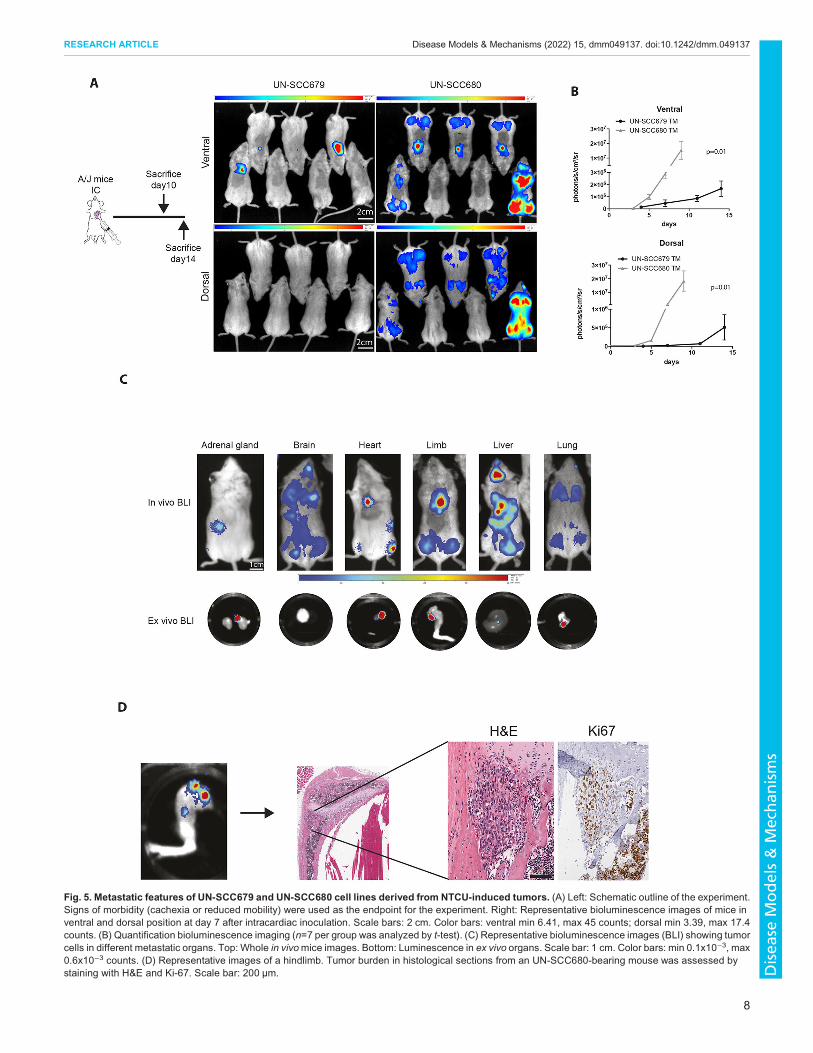
Fig. 5. Metastatic features of UN-SCC679 and UN-SCC680 cell lines derived from NTCU-induced tumors. (A) Left: Schematic outline of the experiment.Signs of morbidity (cachexia or reduced mobility) were used as the endpoint for the experiment. Right: Representative bioluminescence images of mice inventral and dorsal position at day 7 after intracardiac inoculation. Scale bars: 2 cm. Color bars: ventral min 6.41, max 45 counts; dorsal min 3.39, max 17.4counts. (B) Quantification bioluminescence imaging (n=7 per group was analyzed by t-test). (C) Representative bioluminescence images (BLI) showing tumorcells in different metastatic organs. Top: Whole in vivomice images. Bottom: Luminescence in ex vivo organs. Scale bar: 1 cm. Color bars: min 0.1x10⁻³, max0.6x10−3 counts. (D) Representative images of a hindlimb. Tumor burden in histological sections from an UN-SCC680-bearing mouse was assessed bystaining with H&E and Ki-67. Scale bar: 200 µm.
8
RESEARCH ARTICLE Disease Models & Mechanisms (2022) 15, dmm049137. doi:10.1242/dmm.049137
Disea
seModels&Mechan
isms

myeloid-derived immune suppressor cells. However, UN-SCC680tumors were infiltrated by significantly fewer myeloid cells andhad bigger anti-tumor immune cell populations, comparable to IS1.Thus, our cell line models can be used to experimentally comparetwo different immune landscapes found in human LUSC.The immune landscape and mutational burden have been shown
to predict the response of LUSC to immunotherapy. In general, atumor with a high lymphocytic infiltrate and an elevated mutationalburden will have a greater response to immunotherapy treatments(Rizvi et al., 2015). UN-SCC679 and UN-SCC680 cell linesgenerate tumors with different immune profiles that responddifferently to classical immunotherapies, UN-SCC680 beingsignificantly more sensitive than UN-SCC679. Thus, this pair ofcell lines represents a highly valuable system to study newimmunotherapy agents or new combined treatments.A well-known feature of human lung tumors is their selective
metastatic tropism. Lung cancer most commonly spreads throughbloodstream to the liver (34.3%) and adrenal glands (32.6%),followed by bones (14.9%) and other organs, such as the centralnervous system (CNS) (12%), kidney (10.9%), myocardium (9.1%),pancreas (5.1%), spleen (4%), small or large intestines (3.4%),stomach (2.3%), thyroid gland (1.7%) and ovary (0.6%)(Milovanovic et al., 2017). The two cell lines described hereshowed a metastatic potential that is new in the field. In our models,we observed a clear tropism for bone (mainly high limbs), brain and,less frequently, liver and adrenal glands. We are currently developingmetastatic cell lines derived from UN-SCC679 and UN-SCC680cells with enriched tropism for the above-mentioned organs. Finally,UN-SCC680 cells showed a more-aggressive phenotype compared tothat of UN-SCC679 cells, which is consistent with greaterimmunogenicity and increased mutational burden.In conclusion, we have generated and thoroughly characterized
two mouse LUSC cell models, i.e. cell lines UN-SCC679 and UN-SCC680 derived from the NTCU-induced mouse model in A/J mice.UN-SCC679 and UN-SCC680 cells carried different somaticmutations and gene expression profiles, with tumor mutationburdens comparable to those of LUSC patients. UN-SCC680 cellsresponded partially to treatment with anti-PD-1 antibody, whereasUN-SCC679 cells were refractory to the treatment. The immunelandscape study revealed a cold IS of both cell lines, with a more-immunosuppressive tumor microenvironment in UN-SCC679tumors. Finally, both cell lines demonstrated metastatic potentialwith the ability to grow metastatic lesions in the brain, bones, liverand adrenal glands of different degree of aggressiveness. In summary,we believe we have generated a very valuable tool for further LUSCresearch, comprising two cell lines with complementary traits thatrecapitulate the complexity of LUSC in humans.
MATERIALS AND METHODSMiceSeven-week-old A/JOlaHsd mice (hereafter referred to as A/J mice) wereobtained from Harlan Laboratories (Harlan-Winkelmann). All animalexperiments were conducted in accordance with the standards set by theDeclaration of Helsinki. The protocols were approved by the institutionalanimal care committee of our institution (approvals 049-18 and 035c-20),following the legal and ethical requirements demanded by the EuropeanCommunities Council Directive 2010/63/UE and according to theregulations of the Spanish Royal Decree 53/2003, which were drawn upto ensure that pain and suffering would be limited to the lowest level.
Carcinogenesis and cell line generationLUSC tumors were induced by N-nitroso-tris-chloroethylurea (NTCU;Toronto Research Chemicals) treatment applying 0.04M NTCU by skin
painting twice a week for 20 weeks to 8-week-old A/J mice. Lungs ofeuthanized mice were excised, and tumor cell lines UN-SCC679 and UN-SCC680 were derived and cultured for 25 passes to ensure they wereimmortalized. Cells were then subcutaneously injected into the flanks of 6-week-old female Rag2−/−IL2Rg−/− immunodeficient mice and engraftedinto syngeneic 8-week-old A/J mice as previously described (Azpilikuetaet al., 2016) (Fig. S1A). Both cell lines were cultured in RPMI 1640supplemented with 10% Fetalclone serum (Thermo Fisher Scientific) and100 U/ml penicillin-100 µg/ml streptomycin (Thermo Fisher Scientific). Allcells were grown in a humidified incubator under 5%CO2 at 37°C. Cell lineswere routinely tested for mycoplasma.
Immunohistochemical stainingDissected tumors were fixed in 4% paraformaldehyde and embeddedin paraffin. Three-micrometer-thick sections were used for tumorimmunohistochemical characterization. Briefly, sections were deparaffinized,hydrated through a graded series of ethanol, and endogenous peroxidaseactivity was quenched with 3% hydrogen peroxide. Antigen retrieval andprimary antibody conditions were as follows: CK cocktail (BioGenex),catalog no.: AM071-10M, 1:50, TE pH 9.0, 20 min at 95°C; TTF1 (Dako)catalog no.: M357529-2, 1:40, TE pH 9.0, 6 min at 98°C; P40 (BiocareMedical) catalog no.: 3066, 1:200, TE pH 9.0, 20 min at 95°C; P63(Abcam) cataloge no.: ab735, 1:100, EDTA pH 8.0, 20 min at 95°C. Allprimary antibody incubations were carried out overnight at 4°C. Afterdetection of primary antibodies was performed with EnVision System(Dako), slides were counterstained with hematoxylin, dehydrated, andcovered with DPX mounting medium.
Exome sequencingWhole-exome sequencing was performed on extracted DNA from thetumor-derived cell lines. Enrichment for sequencing was performed usingthe SureSelectXT Mouse All Exon kit (Agilent) following themanufacturer’s protocol. Exon-enriched libraries were subjected to paired-end sequencing, 2×100 base pairs read length and 60× minimum coverage.
Raw sequencing reads were aligned to the respective mouse referencegenome (NCBI37/mm9). Alignment was performed with the BWA aligner.Concordant read-pairs were identified as potential PCR duplicates andsubsequently masked in the alignment file. Somatic mutations and copynumber alterations were determined using our in-house analysis pipeline(Peifer et al., 2012; Fernandez-Cuesta et al., 2014). Data are available on theUniversity of Cologne Scientific Dataset public repository website at https://uni-koeln.sciebo.de/s/JJdOLcanGNN7U92.
RNA sequencing analysisSamples were prepared with the Illumina TruSeq Stranded mRNA kitfollowing the manufacturer’s instructions and sequenced as reverse paired-end (50 bp) runs on the Nextseq sequencer. For RNA sequencing analysis,raw fastq files were trimmed with Trimmomatic/0.36. Pseudoalignment wascarried out to the mm10 reference genome and gene level counts weredetermined with Kallisto (Bray et al., 2016). Differential gene expressionanalysis was conducted with R/4.0.3. Samples were imported, normalizedand analyzed with the DESeq2 package. To compare UN-SCC cell tonormal lung basal cells, transcriptomic information from GSE83991,entitled “Transcriptome analysis of mouse lung epithelial cells”, was used.Data are available on GEO website under accession number GSE185054.
Tumor growth measurements using in vitro cellproliferation assayCell proliferation in 2D was assessed using the CellTiter 96 AQueous Non-Radioactive Cell Proliferation Assay, MTS (Promega). Experiments werecarried out on the days indicated, according to the manufacturer’s instructionsand normalized to day 1 post seeding. For in vivo tumor growth studies, 2×10⁶
UN-SCC679 or UN-SCC680 cells were subcutaneously inoculated in bothflanks of 8-week-old female Rag−/− IL2Rg−/− mice (Harlan-Winkelmann).Tumor volume (weight2×length×0.52) was measured with a digital calipertwice a week until sacrifice.
9
RESEARCH ARTICLE Disease Models & Mechanisms (2022) 15, dmm049137. doi:10.1242/dmm.049137
Disea
seModels&Mechan
isms

Tumor immunotherapy2×106 UN-SCC679 or UN-SCC680 cells were subcutaneously inoculatedin one flank of 8-week-old female A/J mice (Harlan-Winkelmann). Whentumors reached a volume of 75 mm3, micewere randomized (n=6 per group)and treated intraperitoneally with three doses of 100 µg of the followingantibodies: anti-PD-1 (RMP1-14, BioXCell), anti-CTLA4 (9D9, BioXCell)or PBS every 3 days from day 7 post inoculation. Tumor volume(weight2×length×0.52) was measured with a digital caliper twice a weekuntil euthanasia.
Tumor immune landscape analysis2×106 UN-SCC679 or UN-SCC680 cells were subcutaneously inoculatedin one flank of 6-8-week-old female A/J mice (Harlan-Winkelmann).Thirteen days after cell inoculation, tumors were collected and processed forflow cytometry analysis as previously described (Azpilikueta et al., 2016).Single-cell suspensions were treated with Fc block (2.4G2; BDPharmingen) to avoid unspecific staining and then stained with thefollowing fluorochrome-conjugated antibodies, as previously reported(Ajona et al., 2020). Data acquired in a FACSCanto II flow cytometerwere analyzed using FlowJo software (Tree Star, Inc., Ashland, Oregon).The gating strategy used to analyze the data is shown in Fig. S2.
Multiplexed immunohistochemistryFormalin-fixed paraffin-embedded tissues from UN-SCC679 and UN-SCC680 subcutaneous tumors were used for multispectral immunodetectionof CD4, CD8, FOXP3, F4/80 and DAPI (for nuclear staining) by using themurine-specific kit (NEL840001KT) from Akoya Biosciences(Marlborough, MA, USA) following the manufacturer’s instructions.Extra Alexa Fluor tyramides Opal 540 (FP1494001KT), 620(FP1495001KT) and 650 (FP1496001KT) from Akoya Biosciences wereused as well. Citrate buffer pH6 was used for all antigen retrievals andremoval of primary-secondary complexes formed with previous antibodies.Primary antibodies and its corresponding Opal reagents were as follows:FOXP3 (CST, 12653) at 1:600 dilution and combined with Opal 540fluorophore; CD4 (Abcam ab183685), 1:400 dilution, Opal 520; CD8 (CST,98941), 1:500 dilution, Opal 620; and F4/80 (CST, 70076), 1:400 dilution,Opal 650. Acquisition of multispectral images and unmixing wereconducted with the Vectra Polaris Automated Quantitative PathologyImaging System, using the Phenochart and InForm softwares (all AkoyaBiosciences).
Multispectral analysis was performed using QuPath 0.3.0 software(Bankhead et al., 2017). Tumor regions were segmented manually. Then,cell limits were determined based on the DAPI staining (1.5% threshold and5 μmnucleus expansion) and indexed as independent objects. QuPath objectclassifier algorithm was trained for the detection of the immune landscapeand finally applied to the entire set of multispectral images. Densitypercentages were calculated using the number of positive cells for a specificimmune population and divided by the total number of cells in the tumor.
Mouse metastasis in vivo modelCells had previously been transfected with a triple modality constructexpressing GFP, luciferase and thymidine kinase (Ponomarev et al., 2004).Eight-week-old female mice (7 mice/group) were inoculated in the leftcardiac ventricle with 1×10⁵ cells as detailed by Valencia et al. (2013). Forbioluminescence (BLI), mice were anesthetized with a solution of ketamine(Imalgene, Merial) and xylazine (Rompun, Bayer AG), and intraorbitallyinjected in the eye with 50 μl D-luciferin 150 mg/ml (30 mg/kg bodyweightdissolved in PBS; Promega Benelux). Images were acquired immediatelyusing a real-time in vivo system (PhotonImager, Biospace laboratory). Forimaging analysis, M3 Vision software (v 1.1) was used. Photon flux wascalculated for each mouse by using a circular region of interest for the wholebody and extracted as photons/s/cm2/sr. All in vivo experiments werenormalized to the luciferase signal at day 0.
StatisticsSample size was chosen based on similar experiments previously publishedby the authors. For comparison of two groups, sample normality and
variance were explored (Shapiro–Wilk test and Levene test, respectively).Groups with normal distribution followed a two-tailed t-test. Non-normalsamples were analyzed using the Mann–Whitney test (equal variances) orthe Median test (unequal variances).
AcknowledgementsWe thank the bioinformatics, morphology, imaging and animal facility cores from theCenter for Applied Medical Research (CIMA) of the University of Navarra.
Competing interestsR.K. is founder of PearlRiver Bio (now part of Centessa Pharmaceuticals), founder ofNEO New Oncology (now part of Siemens Healthcare), and received consultinghonoraria from PearlRiver Bio and NEO NewOncology. L.M.M. received a researchgrant from Astra-Zeneca and BMS, and is a licensed patent co-holder onComplement in LC early detection in AMADIX.
Author contributionsK.V. and L.M.M. conceived the experiments and supervised thework. C.S., G. de B.,M.L., A.A. and J.A. developed the NTCU model and isolated cell lines. M.R.performed immunohistochemistry experiments. K.V., C.S., C.B., E.R., F.E., C.Z.,M.R., D.S., D.A. and M.E. carried out in vitro and/or in vivo experiments. G. deB. performed exome sequencing and analysis. K.V., I.M., R.P., R.T., A.C. andL.M.M. designed experiments and analyzed their results. K.V. performed statisticalanalysis. All authors critically reviewed the manuscript.
FundingThis work was supported by FIMA, Centro de Investigacion Biomedica en Red deCancer (CIBERONC) (grant number: CB16/12/00443), Fundacion CientıficaAsociacion Espan ola Contra el Cancer (grant number: GCB14-2170), FundacionRamon Areces, Instituto de Salud Carlos III and the European RegionalDevelopment Fund (ERDF, “A way to make Europe”) (grant numbers: PI19/00098;PI19/00230; PI20/00419), Fundacion Roberto Arnal Planelles and an IASLCFellowship funding (K.V.); D.S. was supported by the Juan de la Cierva-Incorporacion program, Spanish Ministry of Science and Innovation (grant number:IJCI-2016-27595); E.R. was supported by a FPU, Spanish Ministry of Education(grant number: FPU17/01168); M.E. was supported by PFIS, Spanish Ministry ofHealth, M.L. was supported by a Junior Investigator grant from AECC.
Data availabilityExome data are available on the University of Cologne Scientific Dataset publicrepository website under https://uni-koeln.sciebo.de/s/JJdOLcanGNN7U92; datarelated to RNASeq can be accessed at the GEO website under accession numberGSE185054.
ReferencesAjona, D., Ortiz-Espinosa, S., Lozano, T., Exposito, F., Calvo, A., Valencia, K.,
Redrado, M., RemaRez, A., Lecanda, F., Alignani, D. et al. (2020). Short-termstarvation reduces IGF-1 levels to sensitize lung tumors to PD-1 immunecheckpoint blockade. Nat. Cancer 1, 75-85. doi:10.1038/s43018-019-0007-9
Azpilikueta, A., Agorreta, J., Labiano, S., Perez-Gracia, J. L., Sanchez-Paulete, A. R., Aznar, M. A., Ajona, D., Gil-Bazo, I., Larrayoz, M., Teijeira, A.et al. (2016). Successful immunotherapy against a transplantable mousesquamous lung carcinoma with anti-PD-1 and anti-CD137 monoclonalantibodies. J. Thorac. Oncol. 11, 524-536. doi:10.1016/j.jtho.2016.01.013
Bankhead, P., Loughrey, M. B., Fernandez, J. A., Dombrowski, Y., Mcart, D. G.,Dunne, P. D., Mcquaid, S., Gray, R. T., Murray, L. J., Coleman, H. G. et al.(2017). QuPath: Open source software for digital pathology image analysis. Sci.Rep. 7, 16878. doi:10.1038/s41598-017-17204-5
Bailey, M. H., Tokheim, C., Porta-Pardo, E., Sengupta, S., Bertrand, D.,Weerasinghe, A., Colaprico, A., Wendl, M. C., Kim, J., Reardon, B. et al.(2018). Comprehensive characterization of cancer driver genes and mutations.Cell 173, 371-385.e18. doi:10.1016/j.cell.2018.02.060
Bhateja, P., Chiu, M., Wildey, G., Lipka, M. B., Fu, P., Yang, M. C. L., Ardeshir-Larijani, F., Sharma, N. and Dowlati, A. (2019). Retinoblastoma mutationpredicts poor outcomes in advanced non small cell lung cancer. Cancer Med. 8,1459-1466. doi:10.1002/cam4.2023
Bray, N. L., Pimentel, H., Melsted, P. and Pachter, L. (2016). Near-optimalprobabilistic RNA-seq quantification. Nat. Biotechnol. 34, 525-527. doi:10.1038/nbt.3519
Cai, J., Wang, D., Zhang, G. and Guo, X. (2019). The role Of PD-1/PD-L1 axis intreg development and function: implications for cancer immunotherapy. Onco.Targets Ther. 12, 8437-8445. doi:10.2147/OTT.S221340
Cancer Genome Atlas Research Network (2012). Comprehensive genomiccharacterization of squamous cell lung cancers. Nature 489, 519-525.doi:10.1038/nature11404
10
RESEARCH ARTICLE Disease Models & Mechanisms (2022) 15, dmm049137. doi:10.1242/dmm.049137
Disea
seModels&Mechan
isms
Chen, S., Giannakou, A., Wyman, S., Gruzas, J., Golas, J., Zhong, W.,Loreth, C., Sridharan, L., Yamin, T.-T., Damelin, M. et al. (2018a). Cancer-associated fibroblasts suppress SOX2-induced dysplasia in a lung squamouscancer coculture. Proc. Natl. Acad. Sci. USA 115, E11671-E11680. doi:10.1073/pnas.1803718115
Chen, Y., Pan, Y., Ji, Y., Sheng, L. and Du, X. (2018b). Network analysis ofdifferentially expressed smoking-associated mRNAs, lncRNAs and miRNAsreveals key regulators in smoking-associated lung cancer. Exp. Ther. Med. 16,4991-5002.
Cristescu, R., Mogg, R., Ayers, M., Albright, A., Murphy, E., Yearley, J., Sher, X.,Liu, X. Q., Lu, H., Nebozhyn, M. et al. (2018). Pan-tumor genomic biomarkers forPD-1 checkpoint blockade–based immunotherapy. Science (80-) 362, eaar3593.doi:10.1126/science.aar3593
Ettinger, D. S., Wood, D. E., Aggarwal, C., Aisner, D. L., Akerley, W.,Bauman, J. R., Bharat, A., Bruno, D. S., Chang, J. Y., Chirieac, L. R. et al.(2019). Non-small cell lung cancer, version 1.2020: Featured updates to theNCCN guidelines. JNCCN J Natl. Compr. Cancer Netw. 17, 1464-1472.doi:10.6004/jnccn.2019.0059
Ferlay, J., Colombet, M., Soerjomataram, I., Mathers, C., Parkin, D. M.,Pineros, M., Znaor, A. and Bray, F. (2019). Estimating the global cancerincidence andmortality in 2018: GLOBOCANsources andmethods. Int. J. Cancer144, 1941-1953. doi:10.1002/ijc.31937
Fernandez-Cuesta, L., Peifer, M., Lu, X., Sun, R., Ozretic, L., Seidal, D.,Zander, T., Leenders, F., George, J., MüLler, C. et al. (2014). Frequentmutations in chromatin-remodelling genes in pulmonary carcinoids. Nat.Commun. 5, 3518. doi:10.1038/ncomms4518
Ferone, G., Lee, M. C., Sage, J. and Berns, A. (2020). Cells of origin of lungcancers: Lessons from mouse studies. Genes Dev. 34, 1017-1032. doi:10.1101/gad.338228.120
Goldstraw, P., Chansky, K., Crowley, J., Rami-Porta, R., Asamura, H.,Eberhardt, W. E. E., Nicholson, A. G., Groome, P., Mitchell, A., Bolejack, V.et al. (2016). The IASLC lung cancer staging project: proposals for Revision of theTNM stage groupings in the forthcoming (Eighth) edition of the TNM classificationfor lung cancer. J. Thorac. Oncol. 11, 39-51. doi:10.1016/j.jtho.2015.09.009
Hammerman, P. S., Voet, D., Lawrence, M. S., Voet, D., Jing, R. andCibulskis, K. (2012). Comprehensive genomic characterization of squamouscell lung cancers. Nature 489, 519-525.
Hazawa, M., Lin, D. C., Handral, H., Xu, L., Chen, Y., Jiang, Y. Y., Mayakonda, A.,Ding, L.-W., Meng, X., Sharma, A. et al. (2017). ZNF750 is a lineage-specifictumour suppressor in squamous cell carcinoma. Oncogene 36, 2243-2254.doi:10.1038/onc.2016.377
Hudish, T. M., Opincariu, L. I., Mozer, A. B., Johnson, M. S., Cleaver, T. G.,Malkoski, S. P., Merrick, D. T. and Keith, R. L. (2012). N-nitroso-tris-chloroethylurea Induces Premalignant Squamous Dysplasia in Mice. CancerPrev Res 5, 283-289. doi:10.1158/1940-6207.CAPR-11-0257
Ischenko, I., D’amico, S., Rao, M., Li, J., Hayman, M. J., Powers, S., Petrenko, O.and Reich, N. C. (2021). KRAS drives immune evasion in a genetic model ofpancreatic cancer. Nat. Commun. 12, 1-15. doi:10.1038/s41467-021-21736-w
Kamada, T., Togashi, Y., Tay, C., Ha, D., Sasaki, A., Nakamura, Y., Sato, E.,Fukuoka, S., Tada, Y., Tanaka, A. et al. (2019). PD-1+ regulatory T cellsamplified by PD-1 blockade promote hyperprogression of cancer. Proc. Natl.Acad. Sci. USA 116, 9999-10008. doi:10.1073/pnas.1822001116
Kaneko, T. and Lepage TKS, G. A. and Shnitka, T. K. (1980). KLN205–a murinelung carcinoma cell line. In Vitro 16, 884-892. doi:10.1007/BF02619426
Li, C., Gao, Z., Li, F., Li, X., Sun, Y., Wang, M., Li, D., Wang, R., Li, F., Fang, R.,et al. (2015). Whole exome sequencing identifies frequent somatic mutations incell-cell adhesion genes in Chinese patients with lung squamous cell carcinoma.Sci. Rep. 5, 1-11. doi:10.1038/srep14237
Li, B., Cui, Y., Nambiar, D. K., Sunwoo, J. B. and Li, R. (2019). The immunesubtypes and landscape of squamous cell carcinoma. Clin. Cancer Res. 25,3528-3537.
Liu, P., Morrison, C., Wang, L., Xiong, D., Vedell, P., Cui, P., Hua, X., Ding, F.,Lu, Y., James, M. et al. (2012). Identification of somatic mutations in non-smallcell lung carcinomas using whole-exome sequencing. Carcinogenesis 33,1270-1276. doi:10.1093/carcin/bgs148
Luan, H., Zhang, C., Zhang, T., He, Y., Su, Y. and Zhou, L. (2020). Identification ofKey prognostic biomarker and its correlation with immune infiltrates in pancreaticductal adenocarcinoma. Dis. Markers 2020, 8825997. doi:10.1155/2020/8825997
Milovanovic, I., Stjepanovic, M. and Mitrovic, D. (2017). Distribution patterns ofthe metastases of the lung carcinoma in relation to histological type of the primarytumor: an autopsystudy.Ann ThoracMed 12, 191. doi:10.4103/atm.ATM_276_16
Mulshine, J. L., Ujhazy, P., Antman, M., Burgess, C. M., Kuzmin, I., Bunn, P. A.,Johnson, B. E., Roth, J. A., Pass, H. I., Ross, S. M. et al. (2020). From clinicalspecimens to human cancer preclinical models—a journey the NCI-cell linedatabase—25 years later. J. Cell. Biochem. 121, 3986-3999. doi:10.1002/jcb.29564
Peifer, M., Fernandez-Cuesta, L., Sos, M. L., George, J., Seidel, D.,Kasper, L. H., Plenker, D., Leenders, F., Sun, R., Zander, T. et al. (2012).Integrative genome analyses identify key somatic driver mutations of small-celllung cancer. Nat. Genet. 44, 1104-1110. doi:10.1038/ng.2396
Pilleron, S., Sarfati, D., Janssen-Heijnen, M., Vignat, J., Ferlay, J., Bray, F. andSoerjomataram, I. (2019). Global cancer incidence in older adults, 2012 and2035: a population-based study. Int. J. Cancer 144, 49-58. doi:10.1002/ijc.31664
Ponomarev, V., Doubrovin, M., Serganova, I., Vider, J., Shavrin, A.,Beresten, T., Ivanova, A., Ageyeva, L., Tourkova, V., Balatoni, J. et al.(2004). A novel triple-modality reporter gene for whole-body fluorescent,bioluminescent, and nuclear noninvasive imaging. Eur. J. Nucl. Med. Mol.Imaging 31, 740-751. doi:10.1007/s00259-003-1441-5
Rekhtman, N., Paik, P. K., Arcila, M. E., Tafe, L. J., Oxnard, G. R., Moreira, A. L.,Travis,W. D., Zakowski, M. F., Kris, M. G. and Ladanyi, M. (2012). Clarifying thespectrum of driver oncogene mutations in biomarker-verified squamouscarcinoma of lung: lack of EGFR/KRAS and presence of PIK3CA/AKT1mutations. Clin. Cancer Res. 18, 1167-1176. doi:10.1158/1078-0432.CCR-11-2109
Rizvi, N. A., Hellmann, M. D., Snyder, A., Kvistborg, P., Makarov, V., Havel, J. J.,Lee, W., Yuan, J., Wong, P., Ho, T. S. et al. (2015). Mutational landscapedetermines sensitivity to PD-1 blockade in non-small cell lung cancer. Science(80-) 348, 124-128. doi:10.1126/science.aaa1348
Rudisch, A., Dewhurst, M. R., Horga, L. G., Kramer, N., Harrer, N., Dong, M.,kuip, H., Wernitznig, A., Bernthaler, A., Dolznig, H. et al. (2015). High EMTsignature score of invasive non-small cell lung cancer (NSCLC) Cells correlateswith NFκB driven colony-stimulating factor 2 (CSF2/GM-CSF) secretion byneighboring stromal fibroblasts. PLoS One 10, e0124283. doi:10.1371/journal.pone.0124283
Saleh, R. and Elkord, E. (2019). Treg-mediated acquired resistance to immunecheckpoint inhibitors. Cancer Lett. 457, 168-179. doi:10.1016/j.canlet.2019.05.003
Sannigrahi, M. K., Srinivas, C. S., Deokate, N. and Rakshit, S. (2019). The strongpropensity of Cadherin-23 for aggregation inhibits cell migration. Mol Oncol 13,1092-1109. doi:10.1002/1878-0261.12469
Siegel, R. L., Miller, K. D. and Jemal, A. (2020). Cancer statistics, 2020.CACancerJ. Clin. 70, 7-30. doi:10.3322/caac.21590
Spranger, S. andGajewski, T. F. (2018). Impact of oncogenic pathways on evasionof antitumour immune responses.Nat. Rev. Cancer 18, 139-147. doi:10.1038/nrc.2017.117
Valencia, K., Martın-Fernandez, M., Zandueta, C., Ormazabal, C., Martınez-Canarias, S., Bandres, E., De La Piedra, C. and Lecanda, F. (2013). miR-326associates with biochemical markers of bone turnover in lung cancer bonemetastasis. Bone 52, 532-539. doi:10.1016/j.bone.2012.10.033
Wang, Y., Zhang, Z., Yan, Y., Lemon, W. J., Laregina, M., Morrison, C., Lubet, R.and You, M. (2004). A chemically induced model for squamous cell carcinoma ofthe lung in mice: histopathology and strain susceptibility. Cancer Res. 64,1647-1654. doi:10.1158/0008-5472.CAN-03-3273
Whitmire, C. E., Kouri, R. E., Dansie, D. R. and Lopez, A. (1981). Lung cancermodel system using 3-methylcholanthrene in inbred strains of mice. Cancer Res.41, 5027-5032.
Wu, T. H., Chang, S. Y., Shih, Y. L., Chian, C. F., Chang, H. and Lin, Y. W. (2020).Epigenetic silencing of lmx1a contributes to cancer progression in lung cancercells. Int. J. Mol. Sci. 21, 1-19. doi:10.3390/ijms21155425
Yang, L., Su, T., Lv, D., Xie, F., Liu, W., Cao, J., Sheikh, I. A., Qin, X., Li, L. andChen, L. (2014). ERK1/2 mediates lung adenocarcinoma cell proliferation andautophagy induced by apelin-13. Acta. Biochim. Biophys. Sin. (Shanghai) 46,100-111. doi:10.1093/abbs/gmt140
Yang, B., Yang, E., Liao, H., Wang, Z., Den, Z. and Ren, H. (2015). ARNT2 isdownregulated and serves as a potential tumor suppressor gene in non-small celllung cancer. Tumor Biol. 36, 2111-2119. doi:10.1007/s13277-014-2820-1
Yoshimoto, T., Hirao, F., Sakatani, M., Nishikawa, H. and Ogura, T. (1977).Induction of squamous cell carcinoma in the lung of C57BL/6mice by intratrachealinstillation of benzo[a]pyrene with charcoal powder. Gan 68, 343-352.
11
RESEARCH ARTICLE Disease Models & Mechanisms (2022) 15, dmm049137. doi:10.1242/dmm.049137
Disea
seModels&Mechan
isms