Trace element mineral analysis in high pressure metamorphic ...
97
Trace element mineral analysis in high pressure metamorphic rocks from Trescolmen, Central Alps Dissertation zur Erlangung des Doktorgrades der Mathematisch-Naturwissenschaftlichen Fakultäten der Georg-August-Universität zu Göttingen vorgelegt von Thomas Zack aus Bremen Göttingen 1999
-
Upload
khangminh22 -
Category
Documents
-
view
0 -
download
0
Transcript of Trace element mineral analysis in high pressure metamorphic ...
Trace element mineral analysis in high pressure
metamorphic rocks from Trescolmen,
Central Alps
Dissertation
zur Erlangung des Doktorgrades
der Mathematisch-Naturwissenschaftlichen Fakultäten
der Georg-August-Universität zu Göttingen
vorgelegt von
Thomas Zack
aus Bremen
Göttingen 1999

D7
Referent: Priv. Doz. Dr. Stephen F. Foley
Korreferent: Prof. Toby Rivers
Tag der mündlichen Prüfung: 27. Januar 2000
Table of content 1
Summary 3
Zusammenfassung 5
Chapter 1. Introduction 8
1.1 Geology of the study area 8
1.2 Structure of thesis 11
Chapter 2. Fluid infiltration at 2.0 GPa in eclogites from Trescolmen: Constraints from
Cs-Rb-Ba systematics in phengite and amphibole 12
2.1 Introduction 12
2.2 Evidence for fluid infiltration under eclogite facies conditions 13
2.3 Analytical techniques 15
2.4 Results 19
2.5 Discussion 21
2.5.1 Protolith constraints from LIL element concentrations 21
2.5.2 Fluid exchange between eclogites and metapelites 24
2.5.3 Implications for subduction zone environments 26
2.6 Conclusions 28
2.7 Appendix to Chapter 2 29
Chapter 3. Trace element abundance in eclogitic rutile 30
3.1 Introduction 30
3.2 Analytical procedures 31
3.2.1 Electron microprobe 31
3.2.2 Laser ablation microprobe 34
3.3 Evaluation of results 35
3.3.1 Mass balance calculation for eclogite sample 50-13 37
3.3.2 Element ratios for eclogite 50-13 40
3.3.3 Comparison of element ratios between rutile und whole rock 41
3.4 Applications 42
3.4.1 Provenance constraints by single grain analyses of detrital rutiles 42
3.4.2 Role of rutile in subduction zones 44

Table of content 2
Chapter 4. Evaluating hydrous eclogites from Trescolmen for their use of deriving trace
element partitioning values for subduction zone modelling 47
4.1 Introduction 47
4.2 Analytical methods 48
4.3 Whole rock geochemistry 50
4.4 Mineral chemistry 54
4.4.1 Clinopyroxene 56
4.4.2 Garnet 61
4.4.3 Zoisite, clinozoisite and allanite 62
4.4.4 Other hydrous phases (amphibole, phengite, paragonite, talc, apatite) 63
4.5 Mass balance calculations 64
4.6 Mineral/mineral partitioning systematics 67
4.6.1 Evaluating the use of samples for trace element equilibration studies 67
4.6.2 Trace elements buffered by single phases 73
4.6.3 Amphibole/clinopyroxene partitioning 74
4.6.4 Zoisite/clinopyroxene partitioning 77
4.6.5 Mineral/clinopyroxene partitioning of other hydrous phases 78
4.7 Mechanisms of trace element equilibration 80
4.7.1 Equilibration processes 80
4.7.2 Reasons for lack of trace element equilibration 80
4.8 Concluding remarks 82
Chapter 5. References 84
Acknowledgments 94
Lebenslauf 95

Summary 3
Summary
This study focuses on the trace element behaviour in high pressure metamorphic rocks. The eclogite locality
Trescolmen in the Adula Nappe was found to be an ideal natural laboratory that preserves a wealth of information
about former conditions under high pressure. The specific question was to derive key parameters for the trace
element behaviour during dehydration reactions operating in subducting oceanic crust (residence sites of various
trace elements, partition coefficients between high pressure phases, processes influencing trace element mobility).
Of broader interest is the question how the advent of an analytical technique (here laser ablation ICP-MS) opens up
new applications in different fields of the geosciences.
Representative eclogites and surrounding metapelites from Trescolmen were investigated by optical microscopy
(phase determination, textural information, selection of phases for trace element analysis), XRF, solution-ICP-MS
and whole rock laser ablation-ICP-MS (all three methods for whole rock analysis), electron microprobe (high
contrast backscattering imaging, major and trace element quantitative analysis, thin section element mapping) and
laser ablation ICP-MS (cleaning procedures for thin section analysis, defocussed laser beam for chalcophile and
siderophile elements, He as carrier gas for light element analysis). Special attention was taken to test and optimize
analytical procedures for the measurement of a range of trace elements (Li, Be, B, Rb, Sr, Y, Zr, Nb, Mo, Sn, Sb,
Cs, Ba, Ce, Nd, Sm, Hf, Ta, W, Pb, Th, U) in different metamorphic phases (clinopyroxene, garnet, amphibole,
phengite, paragonite, zoisite, clinozoisite, talc, apatite, rutile).
It was found that eclogites from Trescolmen have major and trace element whole rock signatures comparable to mid
ocean ridge basalts (MORB) and even span the whole range of chemical variety observed in these rock types, from
Mg-rich gabbroic protoliths to Fe and Ti-rich basalts. Therefore these samples can be used as direct analogues of the
uppermost basaltic layer of subducting oceanic crust. Furthermore phengites in the eclogites preserve Cs-Rb-Ba
pattern possibly imprinted on the protoliths by a low temperature sea floor alteration. A geological scenario for the
Adula Nappe in an advanced continental rifting environment has been developed where the geochemical findings of
this study are combined with the close association of eclogites with continental metasediments and the lack of
ultramafic rocks in the northern and middle Adula Nappe.
Petrographic observation and backscattered imaging reveal a rich inventory of textural relationships indicating the
infiltration of H2O-rich fluids during the early stages of uplift, still under eclogite-facies conditions. Here, fluids lead
to the formation of hydrous phases like paragonite replacing kyanite and amphibole overgrowing an older
generation of eclogite-facies minerals. Additionally, the formation of large, homogeneous omphacite is best
explained by mass transfer processes which are characteristic for a free fluid. Healed cracks in garnet cores with a
chemical composition identical to eclogite-facies garnet rims are also strong evidence for the existence of a free
fluid that caused hydrofracturing in garnets.
Summary 4
A number of trace elements exhibit a strong preference for certain phases in eclogites so that only one minor or
accessory phase can dominate the budget of various trace elements in a whole rock. The most extreme examples
where more than 70% of the whole rock budget is accommodated in one phase are found to be Cs, Rb and Ba in
phengite, Ti, Nb, Sb, Ta and W in rutile, Zr and Hf in zircon, Y and heavy rare earth elements (HREE) in garnet as
well as Sr, light rare earth elements (LREE), Pb, Th and U in zoisite (or allanite, if present).
A subsuite of four eclogite samples was discovered to show a close approach towards equilibrium both for major as
well as trace elements, demonstrated by large, homogeneous crystals and consistent trace element partition
coefficients between all high pressure phases. For the interpretation of trace element distribution in high pressure
rocks it is an important finding that all four samples are foliated eclogites that have a chemical signature of basalts
whereas samples with the clearest signs of trace element disequilibrium are recorded in massive metagabbroic
eclogites. Therefore a fine-grained or even glassy protolith and a thorough deformation are the most important
prerequisites for the approach of trace element equilibrium in metamorphic rocks. A free fluid during metamorphism
is probably also an important parameter, but without deformation not a sufficient criterion.
All results in this study are evaluated in the light of their implications for the understanding of subduction zone
processes. It is now possible to realistically model the trace element composition of fluids liberated from
dehydrating subducting slabs. In earlier attempts only the fluid composition in equilibrium with major phases in
eclogite parageneses have been calculated. Since this study shows the importance of minor and accessory phases for
the trace element balance in eclogites (e.g. Ba in phengite, Sb in rutile, Pb in zoisite), the earlier models must be
extended by including these phases. It can be reached in taking trace element partition coefficients from eclogites
demonstrating equilibrium parageneses as found in the four samples of this study. If and how fluids can be
transferred from the subducting oceanic crust into the overlying mantle wedge is an ongoing controversy. Eclogite
samples from Trescolmen show clear evidence for the existence of a free moving fluid under high pressure
conditions, therefore ruling out the possibility of fluid immobility in eclogites as assumed from oxygen isotope
studies. The favoured process promoting fluid mobility and enhancing trace element equilibration is the operation of
continuous or discontinuous deformation, which can be assumed to exist between the subducting oceanic crust and
the overlying mantle.
The results of this study allow conclusions beyond the field of high pressure metamorphic rocks. It is demonstrated
that the highly fluid-mobile elements Cs, Rb and Ba have concentrations in high pressure phases that can be best
explained by very low amounts of fluid-rock interactions. This is significant with respect to the fact that highly
sensitive Cs-Rb-Ba systematics can be used to detect episodes of low amounts of fluid throughflux in rocks that did
not show any recordable evidence when analyzed with the less sensitive oxygen isotope method. Applications in the
area of ore deposit exploration are therefore possible where low amounts of fluid throughflux need to be detected.
Furthermore it was found that trace element concentrations in rutile of eclogites and metapelites have significant
differences. Under sedimentary conditions, rutile is known to be a very stable mineral, but was not seen to be very
characteristic. The analysis of trace elements in rutile of heavy mineral concentrates has now the prospect that
specific source areas of sediments can be worked out on this basis, which is an important question in the area of
petroleum geology.

Zusammenfassung 5
Zusammenfassung
Diese Studie befaßt sich mit der Spurenelementverteilung in metamorphen Hochdruckgesteinen. Die Eklogitlokalität
Trescolmen (Adula Decke) ist ein ideales natürliches Laboratorium, das eine Vielzahl an Informationen über ihre
zurückliegenden Hochdruckbedingungen konserviert hat. Im engeren Sinne war das Ziel dieser Arbeit,
Schlüsselfragen über das Spurenelementverhalten bei Dehydrierungsreaktionen in subduzierenden Ozeanplatten zu
beantworten (z.B. die Aufenthaltsorte verschiedener Spurenelemente in verschiedenen Mineralphasen, die
Verteilungskoeffizienten zwischen Hochdruckphasen, welche Prozesse beeinflussen die Spurenelementmobilität).
Im weiteren Sinne war die Frage von Interesse, wo die Einführung einer Analysenmethodik, in diesem Fall die
Laser Ablations ICP-MS, neue Anwendungen in den verschiedenen Bereichen der Geowissenschaften eröffnet.
Repräsentative Proben von Eklogiten und den umgebenden Metapeliten aus dem Gebiet von Trescolmen wurden
untersucht mittels: optischer Mikroskopie (Phasenbestimmung, Texturinformation, Auswahl der Phasen für die
Spurenelementuntersuchung), RFA, Lösungs-ICP-MS, Gesamtgesteins-Laser Ablation-ICP-MS (die letzten drei
Methoden dienen der Gesamtgesteinsanalyse), Elektronen Mikrosonde (hochauflösende Rückstreuelektronenbilder,
quantitative Analayse von Haupt- und Spurenelementen, Elementverteilung in kompletten Dünnschliffen) und Laser
Ablation-ICP-MS (unter Beachtung besonderer Reinigungsschritte für Analysen an Dünnschliffen, Benutzung eines
defokussierten Laserstrahls für siderophiler und chalkophiler Elemente, Einsatz von He als Trägergas bei der
Analyse leichter Elemente). Besondere Aufmerksamkeit galt dabei dem Testen und Optimieren von analytischen
Methoden, die der Messung einer Vielzahl von Spurenelementen (Li, Be, B, Rb, Sr, Y, Zr, Nb, Mo, Sn, Sb, Cs, Ba,
Ce, Nd, Sm, Hf, Ta, W, Pb, Th, U) in verschiedenen metamorphen Phasen dienen (Klinopyroxen, Granat,
Amphibol, Phengit, Paragonit, Zoisit, Klinozoisit, Talk, Apatit, Rutil).
Es stellte sich heraus, daß Eklogite aus Trescolmen Haupt- und Spurenelementkonzentrationen aufweisen, die
vergleichbar sind mit Mittelozeanischen Rückenbasalten (MORB) und die somit die gesamte chemische Variation
dieser Gesteine nachzeichnen, von Mg-reichen gabbroischen Protolithen bis hin zu Fe- und Ti-reichen Basalten.
Daher können diese Proben als direkte Analoge der obersten basaltischen Schicht einer subduzierenden Ozeankruste
angesehen werden. Weiterhin hat sich gezeigt, daß Phengite in den Eklogiten Cs-Rb-Ba Muster aufweisen, die
möglicherweise den Protolithen während einer Niedrigtemperatur-Ozeanboden-Metamorphose aufgeprägt wurden.
Für die nördliche und mittlere Adula-Decke ist es zum einen bemerkenswert, daß ultramafische Gesteine nahezu
vollständig fehlen, und zum anderen, daß Eklogite in enger Beziehung zu kontinentalen Metasedimenten
vorkommen. Diese Phänomene wurden in Einklang gebracht mit den geochemischen Resultaten dieser Studie und
daraus ein geologisches Szenario der Adula-Decke in einem fortgeschrittenen kontinentalen Dehnungsbereich
entwickelt.
Petrographische Beobachtungen und Rückstreuelektronenbilder erschließen ein reichhaltiges Inventar von
strukturellen Beziehungen, welche eine Infiltrierung der Eklogite durch H2O-reicher Fluide während eines frühen
Hebungsstadiums der Adula-Decke, noch unter Hochdruckbedingungen, dokumentiert. Hierbei führen diese Fluide
zur Bildung wasserhaltiger Phasen wie Paragonit, der Disthen ersetzt, und Amphibol, der eine ältere Generation von
eklogitfaziellen Mineralen überwächst. Weiterhin wird die Bildung großer, homogener Omphazite am besten durch

Zusammenfassung 6
Massentransferprozesse erklärt, die charakteristisch sind für ein freies Fluid. Geheilte Risse in Granatkernen mit
einer identischen chemischen Zusammensetzung wie eklogitfazielle Granatränder sind auch ein deutlicher Hinweis
auf die Existenz eines freien Fluides.
Eine Anzahl von Spurenelementen zeigt eine starke Präferenz für bestimmte Phasen in Eklogiten, so daß nur ein
akzessorisches Mineral das Budget verschiedener Spurenelemente dominieren kann. Die extremsten Beispiele, bei
denen mehr als 70% des Gesamtgesteinsbudgets in einer Phase angereichert sind, stellen Cs, Rb und Ba in Phengit,
Ti, Nb, Sb, Ta und W in Rutil, Zr und Hf in Zirkon, Y und schwere Selten Erden Elemente (HREE) in Granat sowie
Sr, leichte Selten Erden Elemente (LREE) Pb, Th und U in Zoisit (oder Allanit, sofern vorhanden) dar.
Eine Gruppe von vier Eklogitproben wurde gefunden, die eine große Annäherung an Gleichgewichtsbedingungen
sowohl auf Haupt- als auch auf Spurenelementniveau aufzeigen, dokumentiert durch große, homogene Kristalle und
konsistenter Spurenelementverteilungen zwischen allen Hochdruckphasen. Für die Interpretation von
Spurenelementverteilungen in Hochdruckgesteinen ist es eine wichtige Entdeckung, daß alle vier Proben foliierte
Eklogite sind, die chemische Signaturen von Basalten aufweisen, während die deutlichsten Hinweise auf
Ungleichgewichtsbedingungen in massiven, metagabbroischen Eklogiten nachgewiesen werden konnten. Daher sind
die wichtigsten Voraussetzungen für die Einstellung von Gleichgewicht in metamorphen Gesteinen ein feinkörniger
oder sogar glasiger Protolith und eine durchgehende Deformation. Ein freibewegliches Fluid während der
Metamorphose ist wahrscheinlich auch ein wichtiger Parameter, jedoch ohne gleichzeitig stattfindender
Deformation kein hinreichendes Kriterium.
Alle Ergebnisse dieser Studie sind ausgewertet worden im Hinblick auf Auswirkungen für das Verständnis von
Subduktionszonenprozessen. Es ist jetzt möglich, realistische Modelle der Spurenelementzusammensetzung von
Fluiden zu modellieren, die in dehydrierenden subduzierenden Platten freigesetzt werden. In früheren Ansätzen
konnte nur die Fluidzusammensetzung, die im Gleichgewicht mit den Hauptphasen von Eklogitparagenesen steht,
berechnet werden. Da diese Studie die Bedeutung akzessorischer Phasen für die Spurenelementbilanz in Eklogiten
unterstreicht (z.B.: Ba in Phengit, Sb in Rutil, Pb in Zoisit), müssen frühere Modelle durch die Hinzunahme dieser
Phasen erweitert werden. Dies kann erreicht werden durch die Benutzung von Spurenelementverteilungs-
koeffizienten zwischen Haupt- und akzessorischen Phasen, die sich aus den vier Gleichgewichtsproben dieser Studie
ableiten lassen. Ausgangspunkt für eine noch andauernde Kontroverse sind die Fragen, ob und wie Fluide von der
abtauchenden Ozeanplatte in den darüberliegenden Mantelkeil überführt werden. Eklogitproben von Trescolmen
zeigen deutliche Hinweise auf die Existenz eines frei beweglichenden Fluids während der Hochdruckphase und
schließen daher die Möglichkeit von Fluidimmobilität in Eklogiten aus, wie durch Isotopenstudien bisher vermutet
wurde. Der favorisierte Prozess, der die Fluidmobilität begünstigt und darüberhinaus die Einstellung von
Spurenelementgleichgewichten beschleunigt, ist das Auftreten von kontinuierlicher oder diskontinuierlicher
Deformation, was an der Grenzfläche zwischen abtauchender Ozeanplatte und überliegendem Mantel als
wahrscheinlich angesehen werden kann.
Aus den Ergebnissen dieser Arbeit lassen sich Rückschlüsse ziehen auf Bereiche, die über das Gebiet der
Metamorphose von Hochdruckgesteinen hinausreichen. So konnte gezeigt werden, daß die hoch fluidmobilen
Elemente Cs, Rb und Ba Verteilungsmuster in Mineralphasen aufweisen, die am besten dadurch erkärt werden
können, daß sehr niedrige Fluid-Gesteins-Interaktionen stattgefunden haben. Dieses ist in sofern bedeutsam, als das

Zusammenfassung 7
sich mit Cs-Rb-Ba-Systematiken Reaktionen von durchströmenden Fluiden im Gestein nachweisen lassen, für die
die klassische Sauerstoffisotopenanalyse nicht sensitiv genug ist. Anwendungen zum Aufspüren von niedrigen
Fluiddurchflüssen z.B. im Bereich der Lagerstättenexploration sind daher denkbar. Weiterhin stellte sich heraus, daß
Spurenelementkonzentrationen in Rutilen von Eklogiten und Metapeliten signifikante Unterschiede aufweisen.
Unter Sedimentationsbedingungen stellt Rutil ein sehr stabiles Mineral dar, jedoch wurde es bisher als wenig
charakteristisch angesehen. Es gibt durch die Analyse der Spurenelemente in Rutilen von Schwermineralfraktionen
aus Sedimenten nun die Möglichkeit, unterschiedliche Herkunftsgebiete dieser Sedimente herauszuarbeiten, welche
auf dem Gebiet der Erdölgeologie eine wichtige Fragestellung darstellt.

1. Introduction 8
Chapter 1. Introduction
1.1 Geology of the study area
Trescolmen is situated 10 km southwest of the San Bernardino Pass, Switzerland, and is between 2000 and 2500 m
in elevation. Being a part of the Adula nappe, it belongs to the basement and overlying sediments of the Penninic
Unit (the former passive margin of Europe) in common with several other eclogite-bearing units (Tauern Window,
Dora Maira, Monte Rosa, Gran Paradiso; Froitzheim et al., 1996).
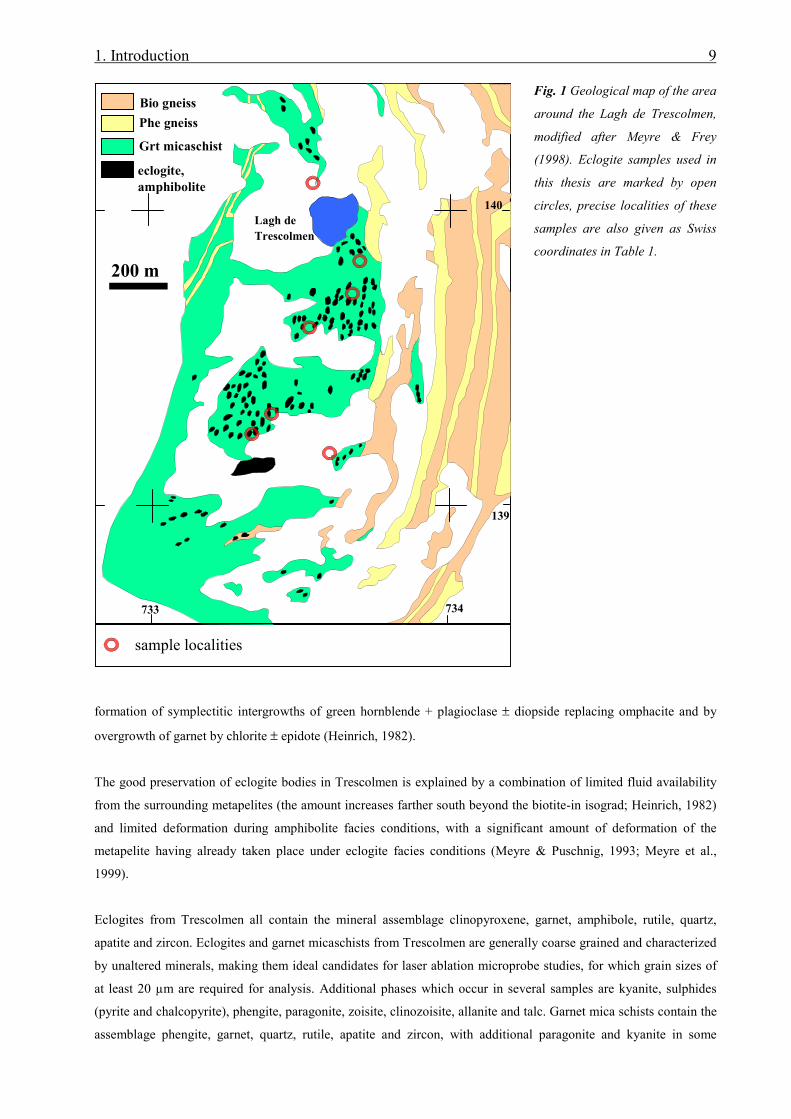
In Trescolmen, numerous metre-sized eclogite boudins occur within garnet mica schist over an area of about one
square kilometre (Fig. 1). The tholeiitic composition of the eclogites is compatible with a MORB-like protolith
(Santini, 1992), permitting at least two different tectonic scenarios. On the one hand, slices of true oceanic crust
could have been imbricated and tectonically disrupted during the Alpine collision, forming exotic blocks surrounded
by pelitic material of continental affinity (Santini, 1992). Alternatively, tholeiitic magmas could have been emplaced
into/onto the thinned passive continental margin during the rifting stage as dikes, tuffs and/or lava flows. The latter
possibility has been proposed for the Tauern eclogites on the basis of detailed lithostratigraphy (Kurz et al., 1998)
and fits better with the almost complete lack of ultramafic assemblages in the Middle Adula nappe. These two
scenarios will be further explored in Chapter 4. In any case, the Trescolmen eclogites are similar in composition to
modern oceanic crust and must have undergone a similar PT-history to oceanic crust that is subducted underneath
modern volcanic arcs.
The PT history for Trescolmen has been studied in great detail (Heinrich, 1986; Meyre et al., 1997, 1999). An early
(pre-eclogitic) epidote-amphibolite facies metamorphic stage can be inferred from the presence of calcic amphibole
and epidote inclusions in grossular-rich cores of large garnets in the eclogites (Heinrich, 1986). The eclogite facies
conditions themselves can be subdivided into at least two different stages. Peak pressure conditions (ca. 2.4 GPa,
600°C) are recorded in metapelites by the rare subassemblage Mg-glaucophane + kyanite (Meyre et al., 1999) and
by an early foliation in the eclogites (Meyre et al., 1997). The second stage of eclogite facies metamorphism,
indicated by various signs of water influx described in detail in Chapter 2, is estimated to have taken place under
slightly lower pressure conditions (ca. 1.8 to 2.0 GPa, 650°C, Meyre et al., 1997, corresponding to the Trescolmen
stage of Meyre & Puschnig, 1993). Numerous irregular quartz-bearing veins crosscutting eclogite bodies are
ascribed to this stage. Formation under eclogite-facies conditions is confirmed by the presence of euhedral
omphacite needles in these veins (Heinrich, 1986). Other vein-filling minerals include kyanite, apatite, phengite and
rutile. The high pressure event was followed by rapid exhumation and accompanied by regional metamorphism
under amphibolite to greenschist facies conditions (Zapport and Leis metamorphic stages respectively; Meyre &
Puschnig, 1993). Compared to other localities in the Adula nappe, eclogite bodies at Trescolmen are much less
affected by amphibolite facies overprinting. Amphibolite rinds are restricted to the outermost margin of eclogite
boudins, in some cases being only a few millimetres thick. Amphibolite overprinting of eclogites is characterised by
1. Introduction 9
Fig. 1 Geological map of the area
around the Lagh de Trescolmen,
modified after Meyre & Frey
(1998). Eclogite samples used in
this thesis are marked by open
circles, precise localities of these
samples are also given as Swiss
coordinates in Table 1.
formation of symplectitic intergrowths of green hornblende + plagioclase ± diopside replacing omphacite and by
overgrowth of garnet by chlorite ± epidote (Heinrich, 1982).
The good preservation of eclogite bodies in Trescolmen is explained by a combination of limited fluid availability
from the surrounding metapelites (the amount increases farther south beyond the biotite-in isograd; Heinrich, 1982)
and limited deformation during amphibolite facies conditions, with a significant amount of deformation of the
metapelite having already taken place under eclogite facies conditions (Meyre & Puschnig, 1993; Meyre et al.,
1999).
Eclogites from Trescolmen all contain the mineral assemblage clinopyroxene, garnet, amphibole, rutile, quartz,
apatite and zircon. Eclogites and garnet micaschists from Trescolmen are generally coarse grained and characterized
by unaltered minerals, making them ideal candidates for laser ablation microprobe studies, for which grain sizes of
at least 20 µm are required for analysis. Additional phases which occur in several samples are kyanite, sulphides
(pyrite and chalcopyrite), phengite, paragonite, zoisite, clinozoisite, allanite and talc. Garnet mica schists contain the
assemblage phengite, garnet, quartz, rutile, apatite and zircon, with additional paragonite and kyanite in some
Grt micaschist
Phe gneiss
Bio gneiss
eclogite,amphibolite
733 734
200 m
139
140Lagh deTrescolmen
sample localities
1. Introduction 10
samples. Amphibolite facies overprinting in the metapelites produced phengites with lower celadonite content,
biotite and staurolite (Meyre et al., 1998). We relate rutile in the garnet mica schists to the eclogite-facies
assemblage and ilmenite to the amphibolite-facies overprint, based on the observation that ilmenite replacing rutile
is most abundant in those parts of garnet mica schists rich in biotite formed by amphibolite-facies overprinting.
The samples were collected from the area surrounding Lagh de Trescolmen, with localities indicated by Swiss
coordinates in Table 1. Only a few samples were taken directly from outcrops (Ad25, 59-1, 59-5). The other samples
are from angular blocks, the largest up to one metre in size (52-1, 77-5), all originating from the immediate
surrounding. Samples 59-1 and 59-5 are from the same outcrop, where talc inclusions in amphibole can be observed
in some parts (59-5) of a one metre large boudin. Of these, only a sample from a talc-free area (59-1) was chosen for
LAM analyses. CHM30a and CHM30b are from the same block (CHM30), representing phengite-rich and zoisite-
rich domains, respectively. These samples are separated by a maximum distance of about 40 cm (original size of the
block). Ad25 and CHM30a are from rock chips of already published eclogite samples (Ad25-9-3: Heinrich, 1986;
CHM30: Meyre et al., 1997).
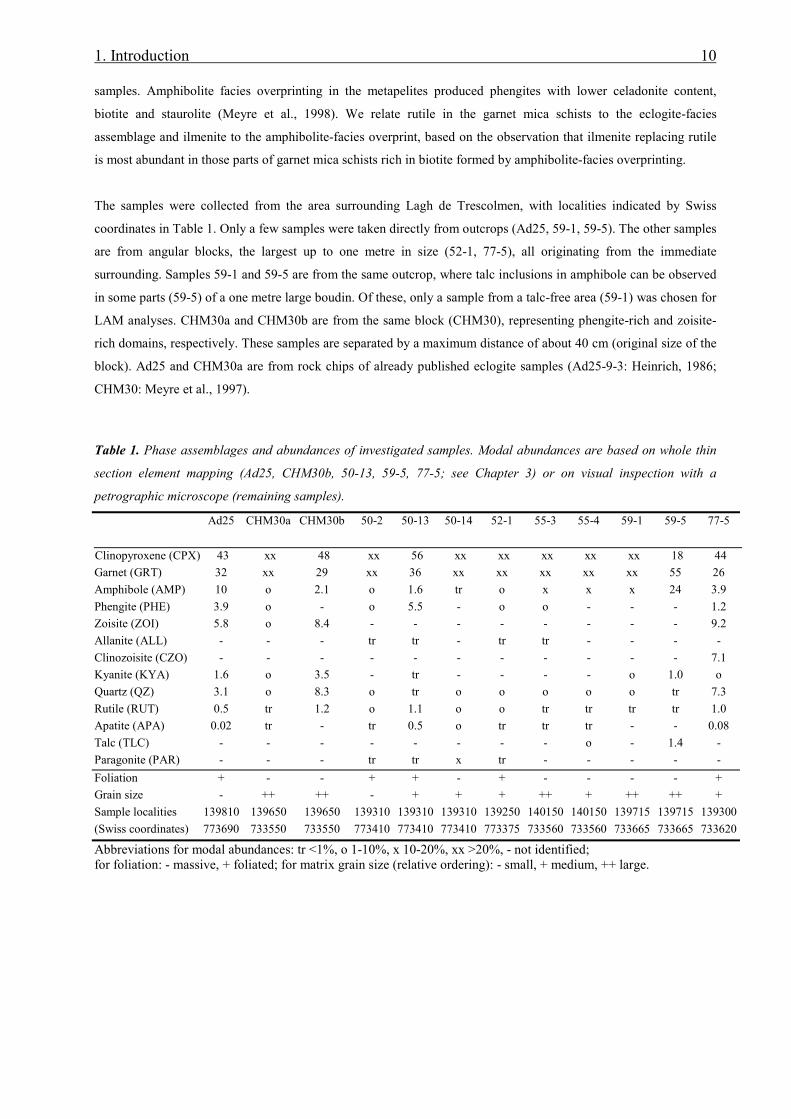
Table 1. Phase assemblages and abundances of investigated samples. Modal abundances are based on whole thin
section element mapping (Ad25, CHM30b, 50-13, 59-5, 77-5; see Chapter 3) or on visual inspection with a
petrographic microscope (remaining samples).
Ad25 CHM30a CHM30b 50-2 50-13 50-14 52-1 55-3 55-4 59-1 59-5 77-5
Clinopyroxene (CPX) 43 xx 48 xx 56 xx xx xx xx xx 18 44
Garnet (GRT) 32 xx 29 xx 36 xx xx xx xx xx 55 26
Amphibole (AMP) 10 o 2.1 o 1.6 tr o x x x 24 3.9
Phengite (PHE) 3.9 o - o 5.5 - o o - - - 1.2
Zoisite (ZOI) 5.8 o 8.4 - - - - - - - - 9.2
Allanite (ALL) - - - tr tr - tr tr - - - -
Clinozoisite (CZO) - - - - - - - - - - - 7.1
Kyanite (KYA) 1.6 o 3.5 - tr - - - - o 1.0 o
Quartz (QZ) 3.1 o 8.3 o tr o o o o o tr 7.3
Rutile (RUT) 0.5 tr 1.2 o 1.1 o o tr tr tr tr 1.0
Apatite (APA) 0.02 tr - tr 0.5 o tr tr tr - - 0.08
Talc (TLC) - - - - - - - - o - 1.4 -
Paragonite (PAR) - - - tr tr x tr - - - - -
Foliation + - - + + - + - - - - +
Grain size - ++ ++ - + + + ++ + ++ ++ +
Sample localities 139810 139650 139650 139310 139310 139310 139250 140150 140150 139715 139715 139300
(Swiss coordinates) 773690 733550 733550 773410 773410 773410 773375 733560 733560 733665 733665 733620
Abbreviations for modal abundances: tr <1%, o 1-10%, x 10-20%, xx >20%, - not identified;for foliation: - massive, + foliated; for matrix grain size (relative ordering): - small, + medium, ++ large.
1. Introduction 11
1.2 Structure of thesis
The subjects of the following three chapters are centered around detailed in-situ trace element measurements of
eclogites and garnet mica schists from the eclogite locality Trescolmen. One important result of this thesis is the
finding that certain minor and accessory phases dominate the whole rock budget of various trace elements. This is
the basis of interpreting the data accumulated in this study in a structured way.
Chapter 2 concentrates on Cs-Rb-Ba systematics in phengites, which dominates the whole rock budget of these fluid
mobile trace elements. It is demonstrated that the in-situ analysis of these elements can be used to find evidence of a
pre-metamorphic low-T alteration event in the eclogites and to detect very low fluid-rock interactions under
eclogite-facies conditions. Additionally, this part also documents various petrographic signs of fluid infiltration into
the eclogites.
Chapter 3 describes for the first time the importance of rutile for the trace element budget of a number of
chalcophile and siderophile trace elements like Sb, Sn, Mo and W. Rutile is also an important phase for Nb and Cr,
and this is discussed in respect to the use of trace element signatures in detrital rutiles for provenance studies. In this
contribution, the instrumental capacities of a modern electron microprobe is used extensively, so that detailed
information is given in the fields of trace element analysis, modal abundance calculations and textural studies.
In Chapter 4, textural, major and trace element information is evaluated for the specific purpose of calculating
equilibrium partition coefficients between high pressure phases to derive a comprehensive data set for modelling
subduction zone processes. For the analysis of ppb-concentrations in thin section samples special cleaning
procedures and optimizations of the laser ablation microprobe are described. The role of the former protolith and the
deformation history of the eclogites is emphasized for the attainment of a close approach to equilibrium in
metamorphic rocks.
2. Cs-Rb-Ba systematics in phengite and amphibole 12
Chapter 2. Fluid infiltration at 2.0 GPa in eclogites fromTrescolmen: Constraints from Cs-Rb-Ba systematics inphengite and amphibole
2.1 Introduction
There is a growing body of evidence that points to the subducting slab as the source for H2O and a wide range of
elements and isotopes in subduction zones (Cs, Rb, Ba and U, McCulloch & Gamble, 1991; 10Be, Tera et al., 1986;
Sb and As, Noll et al., 1994; Pb, Li and B isotopes, Moriguti & Nakamura, 1998). This implies that the subducting
slab stores these elements at least to the depth at which partial melting in the mantle wedge occurs beneath volcanic
arcs. Depending on the magnitude of a possible lateral component of material transport into the melting zone
(Davies & Stevenson, 1992), this corresponds to a slab depth of 60 to 130 km (2.0-4.0 GPa). One complex of
questions centres around the problem which minerals host these elements in the slab (Peacock, 1993; Poli &
Schmidt, 1998), and whether their subsequent release takes place through dehydration and/or partial melting
reactions (Ringwood, 1974).
In the case of H2O-rich fluids as the transport agent, equally important questions arise as to how these fluids migrate
out of the slab into the overlying mantle wedge. The scale and nature of fluid movement under high pressure
conditions is not well constrained. Several recent studies of eclogites have concluded, on the basis of observed
heterogeneities in fluid inclusions and oxygen isotopes, that fluid flow is restricted under high pressure conditions
to the decimetre scale (e.g. Philippot & Selverstone, 1991; Nadeau et al., 1993; Getty & Selverstone, 1994). Where
fluids have clearly been mobilised in high pressure veins, they have similar major element and oxygen isotope
signatures to their immediate surroundings (Cartwright & Barnicoat, 1999).
In regional metamorphic systems, oxygen isotopes have been used extensively to derive quantitative parameters
concerning fluid flow on a regional scale i.e. fluid-rock ratio, integrated fluid flux, direction of fluid flow (Taylor,
1977; Bickle & McKenzie, 1987; Baumgartner & Rumble, 1988; Ferry & Gerdes, 1998). With this technique,
evidence for large scale fluid flow has been found in several different tectonic environments, e.g. in ancient
accretionary wedges (Catalina Schist terrane: Bebout & Barton, 1989; Bebout, 1991), hydrothermally altered
oceanic crust (Muehlenbachs, 1986), contact aureoles around crystallising magma bodies and localised fractures as
well as shear zones (Oliver, 1996). In contrast, areas of limited fluid circulation are probably more common, but are
rarely suited to the calculation of fluid fluxes by the oxygen isotope technique (for an exception, see Matthews et al.,
1996), since oxygen is a major element in both the fluid and the surrounding rock. As a result, at low fluid-rock
ratios the oxygen isotopes of the infiltrating fluid are buffered by the surrounding rock body, and large quantities of
fluid are required to buffer the oxygen isotopic composition of the infiltrated rock body.
More sensitive techniques must be developed in order to test if calculated low fluid fluxes in many high pressure
rocks mean that only small amounts of fluid penetrated the system, or that fluid was incapable of leaving the system.
Trace elements that are highly enriched in fluids compared to their source rock are well suited for the detection and

2. Cs-Rb-Ba systematics in phengite and amphibole 13
quantification of low fluid-rock ratios. As emphasised by Banner & Hanson (1990), the lower the fluid-rock ratio
the more appropriate are the elements with low partition coefficients (DMin/Fluid). Such elements should be fluid-
mobile and typical of incompatible element enrichments in island arc source regions.
Investigations of fluid-rock interactions among fluid-mobile elements are hampered by their susceptibility to late
stage alteration effects, by analytical problems due to their low concentrations, and by a scarcity of experimentally
determined DMin/Fluid values. The first problem can be overcome by analysing carefully-chosen single mineral grains
in-situ with a microprobe method (e.g. ion microprobe or LAM-ICP-MS) rather than analysing whole rocks (for an
example, see Foley et al., 1996). The latter two problems can be minimised by choosing the LIL elements Cs, Rb
and Ba as examples of fluid-mobile elements ( for Ba, see Nabelek & Labotka, 1993) since they are relatively easy
to analyse and an increasing number of experimental studies of their partitioning behaviour are emerging (Beswick,
1973; Volfinger, 1976; Brenan et al., 1995; Melzer et al., 1998; Melzer & Wunder, 1999).
Samples from Trescolmen were found to be suitable samples for exploring the application of the in-situ trace
element technique to questions about fluid-rock interaction in eclogitic parageneses. These rocks show a pronounced
re-equilibration stage under high pressure conditions (Meyre et al., 1997) that seems to imply fluid infiltration at
high pressure, similar to the paragonite-bearing coesite eclogites from Dabie Shan (Okay, 1995). In this chapter the
evidence for fluid infiltration under high pressure conditions is first documented and the importance of phengite in
controlling the Cs, Rb and Ba contents in high pressure rocks is shown. Construction of a Cs-Rb-Ba discrimination
diagram allows constraints to be placed on a likely protolith of the Trescolmen eclogites and estimation of the
magnitude of fluid-rock interaction under high pressure conditions.
2.2 Evidence for fluid infiltration under eclogite facies conditions
Eclogite from Trescolmen is characterised by the abundant and varied occurrence of high pressure hydrous phases
(Table 1). Phengite is present in most of the analysed samples and forms part of the equilibrium parageneses. It
displays a preferential alignment parallel to the early omphacite foliation (Fig. 2a), suggesting that it was stable
under peak pressure conditions. In contrast, there is evidence for recrystallization of phengite in other samples (e.g.
CHM30), where it occurs in local quartz segregations. Zoisite is generally less abundant than phengite and is also
mostly aligned in the omphacite foliation. Talc was found only in the most Mg-rich eclogites. In a 3 m wide eclogite
body (locality of samples 59-1 and 59-5), talc is concentrated near the eclogite-pelite contact but is rare inside the
eclogite body, where it is restricted to small aggregates that may represent former veins (59-5). Paragonite is
commonly closely associated with phengite. However, paragonite also occurs as a replacement product of kyanite
(Fig. 2b). All stages of replacement can be observed in a single thin section (e.g. 50-14), from fresh kyanite without
paragonite, through kyanite with a thin rim of paragonite and paragonite enclosing corroded relics of kyanite, to
clusters of inclusion-free paragonite. Barroisitic and tremolitic amphiboles are found in a range of textural
relationships with respect to the other eclogitic phases. Barroisitic amphibole generally forms large anhedral
porphyroblasts that are either aligned with the foliation or grow irregularly over it (Heinrich, 1986; Meyre et al.,
1997), and contain inclusions of all other high pressure phases. At the outcrop scale it appears that barroisitic

2. Cs-Rb-Ba systematics in phengite and amphibole 15
amphibole poikiloblasts are more concentrated near the rims of some eclogite bodies, but these bodies are not large
enough to exhibit an unambiguous trend, and the cores of the eclogite bodies are never devoid of amphibole. Of
special interest is the partial replacement of talc by tremolitic amphibole (Fig. 2c) in the vein-like areas described
above. In general, it is easy to chemically and texturally distinguish the large, pale green, high-pressure barroisitic
and tremolitic amphiboles from the later, dark green amphibolite-facies hornblendes, occurring with other low-
pressure phases in a fine-grained symplectitic intergrowth.
From these observations, it is inferred that hydrous fluid influx under high pressure conditions is required to explain
the following water-consuming reactions:
jadeite (in clinopyroxene) + kyanite + H2O = paragonite (1)
omphacite + garnet + quartz + H2O = barroisitic amphibole (2)
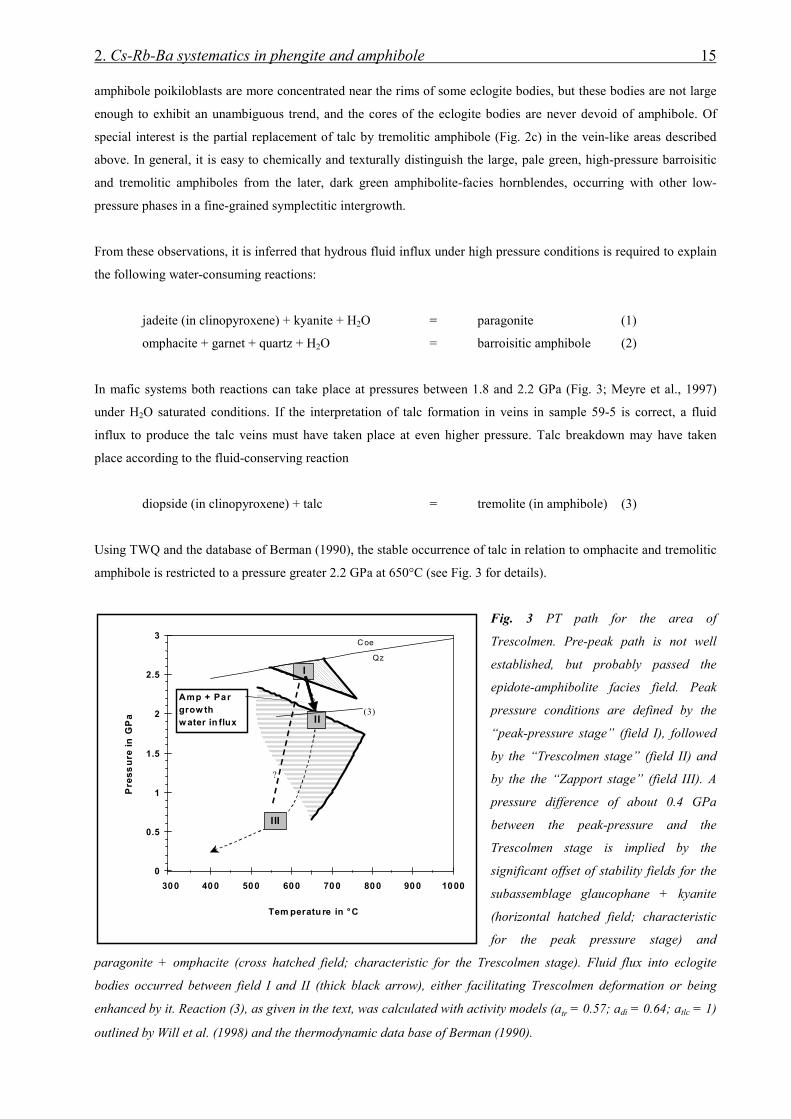
In mafic systems both reactions can take place at pressures between 1.8 and 2.2 GPa (Fig. 3; Meyre et al., 1997)
under H2O saturated conditions. If the interpretation of talc formation in veins in sample 59-5 is correct, a fluid
influx to produce the talc veins must have taken place at even higher pressure. Talc breakdown may have taken
place according to the fluid-conserving reaction
diopside (in clinopyroxene) + talc = tremolite (in amphibole) (3)
Using TWQ and the database of Berman (1990), the stable occurrence of talc in relation to omphacite and tremolitic
amphibole is restricted to a pressure greater 2.2 GPa at 650°C (see Fig. 3 for details).
Fig. 3 PT path for the area of
Trescolmen. Pre-peak path is not well
established, but probably passed the
epidote-amphibolite facies field. Peak
pressure conditions are defined by the
“peak-pressure stage” (field I), followed
by the “Trescolmen stage” (field II) and
by the the “Zapport stage” (field III). A
pressure difference of about 0.4 GPa
between the peak-pressure and the
Trescolmen stage is implied by the
significant offset of stability fields for the
subassemblage glaucophane + kyanite
(horizontal hatched field; characteristic
for the peak pressure stage) and
paragonite + omphacite (cross hatched field; characteristic for the Trescolmen stage). Fluid flux into eclogite
bodies occurred between field I and II (thick black arrow), either facilitating Trescolmen deformation or being
enhanced by it. Reaction (3), as given in the text, was calculated with activity models (atr = 0.57; adi = 0.64; atlc = 1)
outlined by Will et al. (1998) and the thermodynamic data base of Berman (1990).
��������������������������������������������������������������������������������������������������������������������������������������������������������������������������������������������������������������������������������������������������������������������������������������������������������������������������������������������������������������������������������������������������������������������������������������������������������������������������������������������������������������������������������������������������������������������������������������������������������������������������������������������������������������������������������������������������������������������������������������������������������������������������������������������������������������������������������������������������������������������������������������������������������������������������������������������������������������������������������������������������������������������������������������������������������������������������������������������������������������������������������������������������������������������������������������������������������������������������������������������������������������������������������������������������������������������������������������������������������������������������������������������������������������������������������������������������������������������������������������������������������������������������������������������������������������������������������������������������������������������������������������������������������������������������������������������������������������������������������������������������������������������������������������������������������������������������������������������������������������������������������������������������������������������������������������������������������������������������������������������������������������������������������������������������������������������������������������������������������������������������������������������������������������������������������������������������������������������������������������������������������������������������������������������������������������������������������������������������������������������������������������������������������������������������������������������������������������������������������������������������������������������������������������������������������������������������������������������������������������������������������������������������������������������������������������������������������������������������������������������������������������������������������������������������������������������������������������������������������������������������������������������������������������������������������������������������������������������������������������������������������������������������������������������������������������������������������������������������������������������������������������������������������������������������������������������������������������������������������������������������������������������������������������������������������������������������������������������������������������������������������������������������������������������������������������������������������������������������������������������������������������������������������������������������������������������������������������������������������������������������������������������������������������������������������������������������������������������������������������������������������������������������������������������������������������������������������������������������������������������������������������������������������������������������������������������������������������������������������������������������������������������������������������������������������������������������������������������������������������������������������������������������������������������������������������������������������������������������������������������������������������������������������������������������������������������������������������������������������������������������������������������������������������������������������������������������������������������������������������������������������������������������������������������������������������������������������������������������������������������������������������������������������������������������������������������������������������������������������������������������������������������������������������������������������������������������������������������������������������������������������������������������������������������������������������������������������������������������������������������������������������������������������������������������������������������������������������������������������������������������������������������������������������������������������������������������������������������������������������������������������������������������������������������������������������������������������������������������������������������������������������������������������������������������������������������������������������������������������������������������������������������������������������������������������������������������������������������������������������������������������������������������������������������������������������������������������������������������������������������������������������������������������������������������������������������������������������������������������������������������������������������������������������������������������������������������������������������������������������������������������������������������������������������������������������������������������������������������������������������������������������������������������������������������������������������������������������������������������������������������������������������������������������������������������������������������������������������������������������������������������������������������������������������������������������������������������������������������������������������������������������������������������������������������������������������������������������������������������������������������������������������������������������������������������������������������������������������������������������������������������������������������������������������������������������������������������������������������������������������������������������������������������������������������������������������������������������������������������������������������������������������������������������������������������������������������������������������������������������������������������������������������������������������������������������������������������������������������������������������������������������������������������������������������������������������������������������������������������������������������������������������������������������������������������������������������������������������������������������������������������������������������������������������������������������������������������������������������������������������������������������������������������������������������������������������������������������������������������������������������������������������������������������������������������������������������������������������������������������������������������������������������������������������������������������������������������������������������������������������������������������������������������������������������������������������������������������������������������������������������������������������������������������������������������������������������������������������������������������������������������������������������������������������������������������������������������������������������������������������������������������������������������������������������������������������������������������������������������������������������������������������������������������������������������������������������������������������������������������������������������������������������������������������������������������������������������������������������������������������������������������������������������������������������������������������������������������������������������������������������������������������������������������������������������������������������������������������������������������������������������������������������������������������������������������������������������������������������������������������������������������������������������������������������������������������������������������������������������������������������������������������������������������������������������������������������������������������������������������������������������������������������������������������������������������������������������������������������������������������������������������������������������������������������������������������������������������������������������������������������������������������������������������������������������������������������������������������������������������������������������������������������������������������������������������������������������������������������������������������������������������������������������������������������������������������������������������������������������������������������������������������������������������������������������������������������������������������������������������������������������������������������������������������������������������������������������������������������������������������������������������������������������������������������������������������������������������������������������������������������������������������������������������������������������������������������������������������������������������������������������������������������������������������������������������������������������������������������������������������������������������������������������������������������������������������������������������������������������������������������������������������������������������������������������������������������������������������������������������������������������������������������������������������������������������������������������������������������������������������������������������������������������������������������������������������������������������������������������������������������������������������������������������������������������������������������������������������������������������������������������������������������������������������������������������������������������������������������������������������������������������������������������
������������������������������������������������������������������������������������������������������������������������������������������������������������������������������������������������������������������������������������������������������������������������������������������������������������������������������������������������������������������������������������������������������������������������������������������������������������������������������������������������������������������������������������������������������������������������������������������������������������������������������������������������������������������������������������������������������������������������������������������������������������������������������������������������������������������������������������������������������������������������������������������������������������������������������������������������������������������������������������������������������������������������������������������������������������������������������������������������������������������������������������������������������������������������������������������������������������������������������������������������������������������������������������������������������������������������������������������������������������������������������������������������������������������������������������������������������������������������������������������������������������������������������������������������������������������������������������������������������������������������������������������������������������������������������������������������������������������������������������������������������������������������������������������������������������������������������������������������������������������������������������������������������������������������������������������������������������������������������������������������������������������������������������������������������������������������������������������������������������������������������������������������������������������������������������������������������������������������������������������������������������������������������������������������������������������������������������������������������������������������������������������������������������������������������������������������������������������������������������������������������������������������������������������������������������������������������������������������������������������������������������������������������������������������������������������������������������������������������������������������������������������������������������������������������������������������������������������������������������������������������������������������������������������������������������������������������������������������������������������������������������������������������������������������������������������������������������������������������������������������������������������������������������������������������������������������������������������������������������������������������������������������������������������������������������������������������������������������������������������������������������������������������������������������������������������������������������������������������������������������������������������������������������������������������������������������������������������������������������������������������������������������������������������������������������������������������������������������������������������������������������������������������������������������������������������������������������������������������������������������������������������������������������������������������������������������������������������������������������������������������������������������������������������������������������������������������������������������������������������������������������������������������������������������������������������������������������������������������������������������������������������������������������������������������������������������������������������������������������������������������������������������������������������������������������������������������������������������������������������������������������������������������������������������������������������������������������������������������������������������������������������������������������������������������������������������������������������������������������������������������������������������������������������������������������������������������������������������������������������������������������������������������������������������������������������������������������������������������������������������������������������������������������������������������������������������������������������������������������������������������������������������������������������������������������������������������������������������������������������������������������������������������������������������������������������������������������������������������������������������������������������������������������������������������������������������������������������������������������������������������������������������������������������������������������������������������������������������������������������������������������������������������������������������������������������������������������������������������������������������������������������������������������������������
����������������������������������������������������������������������������������������������������������������������������������������������������������������������������������������������������������������������������������������������������������������������������������������������������������������������������������������������������������������������������������������������������������������������������������������������������������������������������������������������������������������������������������������������������������������������������������������������������������������������������������������������������������������������������������������������������������������������������������������������������������������������������������������������������������������������������������������������������������������������������������������������������������������������������������������������������������������������������������������������������������������������������������������������������������������������������������������������������������������������������������������������������������������������������������������������������������������������������������������������������������������������������������������������������������������������������������������������������������������������������������������������������������������������������������������������������������������������������������������������������������������������������������������������������������������������������������������������������������������������������������������������������������������������������������������������������������������������������������������������������������������������������������������������������������������������������������������������������������������������������������������������������������������������������������������������������������������������������������������������������������������������������������������������������������������������������������������������������������������������������������������������������������������������������������������������������������������������������������������������������������������������������������������������������������������������������������������������������������������������������������������������������������������������������������������������������������������������������������������������������������������������������������������������������������������������������������������������������������������������������������������������������������������������������������������������������������������������������������������������������������������������
��������������������������������������������������������������������������������������������������������������������������������������������������������������������������������
��������������������������������������������������������������������������������������������������������������������������������������������������������������������������������������������������������������������������������������������������������������������������������������������������������������������������������������������������������������������������������������������������������������������������������������������������������������������������������������������������������������������������������������������������������������������������������������������������������������������������������������������������������������������������������������������������������������������������������������������������������������������������������������������������������������������������������������������������������������������������������������������������������������������������������������������������������������������������������������������������������������������������������������������������������������������������������������������������������������������������������������������������������������������������������������������������������������������������������������������������������������������������������������������������������������������������������������������������������������������������������������������������������������������������������������������������������������������������������������������������������������������������������������������������������������������������������������������������������������������������������������������������������������������������������������������������������������������������������������������������������������������������������������������������������������������������������������������������������������������������������������������������������������������������������
���������������������������������������������������������������������������������������������������������������������������������������������������������������������������������������������������������������������������������������������������������������������������������������������������������������������������������������������������������������������������������������������������������������������������������������������������������������������������������������������������������������������������������������������������������������������������������������������������������������������������������������������������������������������������������������������������������������������������������������������������������������������������������������������������������������������������������������������������������������������������������������������������������������������������������������������������������������������������������������������������������������������������������������������������������������������������������������������������������������������������������������������������������������������������������������������������������������������������������������������������������������������������������������������������������������������������������������������������������������������������������������������������������������������������������������������������������������������������������������������������������������������������������������������������������������������������������������������������������������������������������������������������������������������������������������������������������������������������������������������������������������������
0
0.5
1
1.5
2
2.5
3
300 400 500 600 700 800 900 1000
C oe
Qz
Amp + Par grow thw ater in flux II
III
I
(3)
Pre
ss
ure
in
GP
a
Tem peratu re in °C
?
2. Cs-Rb-Ba systematics in phengite and amphibole 16
2.3 Analytical techniques
Major and minor element analysis were performed on a Cameca SX51 electron microprobe in Heidelberg and a
JEOL 8900 RL electron microprobe in Göttingen, both equipped with 5 WDS spectrometers. The operating
conditions for amphibole and phengite analyses were 15 kV acceleration voltage, 12 nA beam current on the
Faraday cup and a 5 µm beam diameter. The matrix correction methods for the raw counts were PAP for the
Heidelberg and phi-rho-zet for the Göttingen microprobe. Counting times on the peak were 15 seconds for the major
elements and 30-120 seconds for Ba and Sr. This translates into detection limits (DL) of as low as 100 ppm for the
longest counting times. The potential problem of overlapping of the Ti Kα on Ba Lα peaks was evaluated by
analysing synthetic rutile. It was found to yield 0.6 wt. % apparent BaO for 100% of TiO2, and could therefore be
neglected for the Ti-poor phases analysed in this study. Calculation of amphibole mineral formulae (Table 2) was
done following the procedure of Schumacher (1997), using the average of possible minimum and maximum Fe3+
values.
Cs, Rb, Ba, and Sr were measured by laser ablation microprobe-ICP-MS (LAM) at Memorial University of
Newfoundland. Details about the current laser source, mass spectrometer and data reduction can be found in Horn et
al. (1997 and references therein). For this study, operating conditions were optimised by using laser pulse energies
from 0.2-0.7 mJ for phengite and from 0.3-1.4 mJ (always at 10 Hz) for amphibole. The best performance was
achieved with a defocused laser beam, having the focus some 100-400 µm above the sample surface. This reduces
fractionation significantly, and in this study Ca/Si ratios did not change during a 1 minute ablation period. As a
result, Si could be used as an internal standard for phengite and Ca for amphibole analyses without introducing a
systematic error. Another advantage of the defocused beam is a more regular distribution of energy on the mineral
surface, which leads to smooth ablation behaviour even for the large pulse energies applied to ablate some
amphibole crystals.
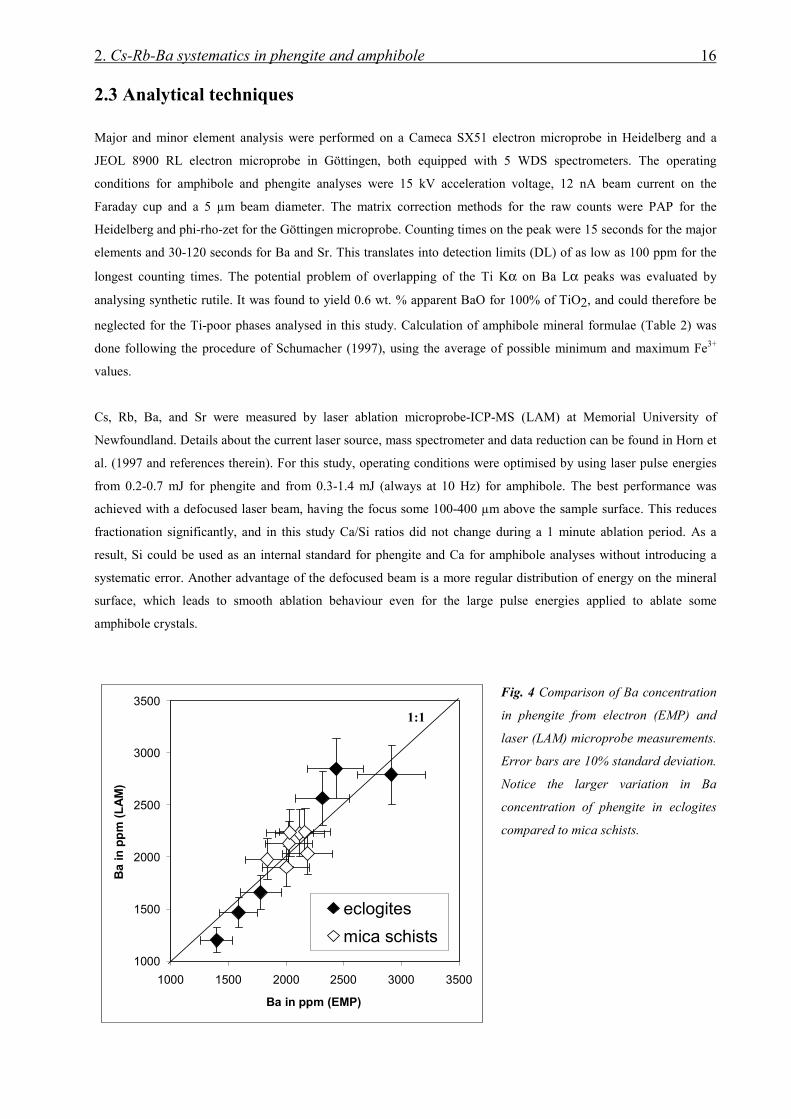
Fig. 4 Comparison of Ba concentration
in phengite from electron (EMP) and
laser (LAM) microprobe measurements.
Error bars are 10% standard deviation.
Notice the larger variation in Ba
concentration of phengite in eclogites
compared to mica schists.
1000
1500
2000
2500
3000
3500
1000 1500 2000 2500 3000 3500
Ba in ppm (EMP)
Ba
in
pp
m (
LA
M)
eclogites
mica schists
1:1

2. Cs-Rb-Ba systematics in phengite and amphibole 17
Table 2. Amphibole compositions of Trescolmen eclogites. All major element concentrations measured by electron
microprobe (in wt%), trace elements with * by LAM (in ppm). Mineral formulae calculated after the method of
Schumacher (1997).
Ad25 CHM30 50-2 50-13 50-14 52-1 55-3 55-4 59-1 59-5
SiO2 50.76 52.98 50.53 49.81 48.60 47.29 54.06 55.28 53.02 55.12
TiO2 0.25 0.12 0.28 0.26 0.28 0.39 0.14 0.055 0.14 0.091
Al2O3 12.15 8.16 13.67 13.35 14.21 14.47 8.64 4.83 9.52 6.06
Cr2O3 0.048 0.16 0.037 0.11 0.056 0.054 0.082 0.11 0.085 0.017
FeO 5.47 4.60 7.24 5.57 8.32 8.78 6.36 4.58 3.29 2.69MnO 0.02 0.03 0.03 0.03 0.02 0.03 0.13 0.05 0.04 0.03MgO 16.27 18.55 14.00 15.30 13.27 13.27 16.76 20.05 18.71 20.66CaO 8.62 9.39 5.94 7.97 6.96 8.23 6.93 9.69 9.81 9.88Na2O 3.63 2.86 5.48 4.46 5.42 4.38 3.83 2.32 2.87 2.00
K2O 0.33 0.29 0.34 0.40 0.060 0.47 0.26 0.44 0.059 0.048
Total 97.55 97.14 97.54 97.25 97.19 97.37 97.18 97.39 97.53 96.595
Si 7.037 7.336 7.032 6.955 6.864 6.718 7.464 7.618 7.272 7.577Al(IV) 0.963 0.664 0.968 1.045 1.136 1.282 0.536 0.382 0.728 0.423
Al(VI) 1.023 0.667 1.274 1.152 1.229 1.141 0.870 0.403 0.810 0.559Ti 0.026 0.013 0.029 0.027 0.030 0.042 0.015 0.006 0.014 0.009Fe3+ 0.185 0.223 0.206 0.104 0.153 0.162 0.323 0.254 0.143 0.157Cr 0.005 0.018 0.004 0.012 0.006 0.006 0.009 0.012 0.009 0.002Mg 3.362 3.829 2.905 3.185 2.793 2.809 3.449 4.118 3.824 4.234Fe2+ 0.399 0.250 0.582 0.520 0.788 0.839 0.334 0.207 0.199 0.039
Fe2+ 0.049 0.060 0.055 0.026 0.041 0.042 0.076 0.066 0.036 0.113Mn 0.003 0.003 0.004 0.003 0.002 0.004 0.016 0.006 0.004 0.003Ca 1.280 1.393 0.885 1.192 1.053 1.252 1.025 1.430 1.441 1.455Na 0.668 0.544 1.057 0.779 0.904 0.702 0.883 0.498 0.519 0.428
Na 0.309 0.224 0.422 0.430 0.580 0.505 0.142 0.121 0.245 0.105K 0.058 0.051 0.060 0.071 0.011 0.085 0.045 0.077 0.010 0.008
Cs * 0.011 <0.01 0.004 0.005 n.a. <0.04 <0.01 <0.003 0.014 n.a.Rb * 1.7 2.1 2.0 1.5 n.a. 3.1 1.1 1.4 2.9 n.a.Ba * 2.1 4.5 5.5 3.7 n.a. 7.5 0.9 1.8 3.8 n.a.Sr * 15 33 175 82 n.a. 173 42 63 85 n.a.
2. Cs-Rb-Ba systematics in phengite and amphibole 18
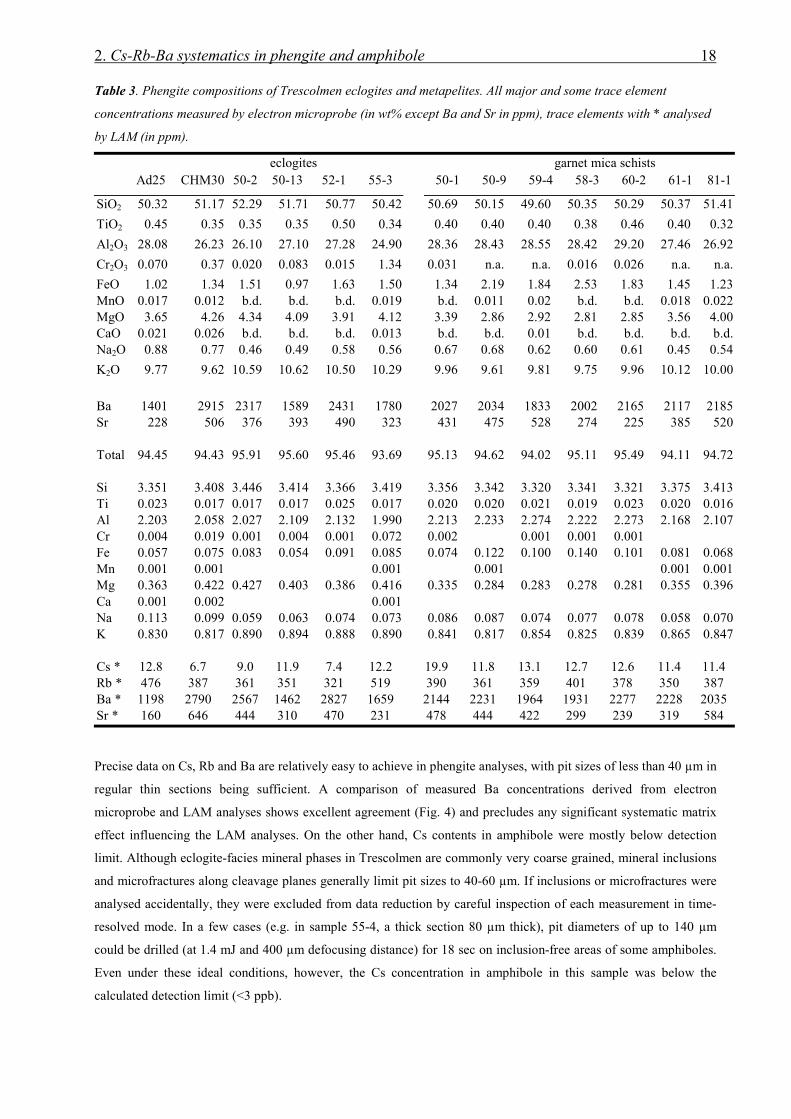
Table 3. Phengite compositions of Trescolmen eclogites and metapelites. All major and some trace element
concentrations measured by electron microprobe (in wt% except Ba and Sr in ppm), trace elements with * analysed
by LAM (in ppm).
eclogites garnet mica schistsAd25 CHM30 50-2 50-13 52-1 55-3 50-1 50-9 59-4 58-3 60-2 61-1 81-1
SiO2 50.32 51.17 52.29 51.71 50.77 50.42 50.69 50.15 49.60 50.35 50.29 50.37 51.41
TiO2 0.45 0.35 0.35 0.35 0.50 0.34 0.40 0.40 0.40 0.38 0.46 0.40 0.32
Al2O3 28.08 26.23 26.10 27.10 27.28 24.90 28.36 28.43 28.55 28.42 29.20 27.46 26.92
Cr2O3 0.070 0.37 0.020 0.083 0.015 1.34 0.031 n.a. n.a. 0.016 0.026 n.a. n.a.
FeO 1.02 1.34 1.51 0.97 1.63 1.50 1.34 2.19 1.84 2.53 1.83 1.45 1.23MnO 0.017 0.012 b.d. b.d. b.d. 0.019 b.d. 0.011 0.02 b.d. b.d. 0.018 0.022MgO 3.65 4.26 4.34 4.09 3.91 4.12 3.39 2.86 2.92 2.81 2.85 3.56 4.00CaO 0.021 0.026 b.d. b.d. b.d. 0.013 b.d. b.d. 0.01 b.d. b.d. b.d. b.d.Na2O 0.88 0.77 0.46 0.49 0.58 0.56 0.67 0.68 0.62 0.60 0.61 0.45 0.54
K2O 9.77 9.62 10.59 10.62 10.50 10.29 9.96 9.61 9.81 9.75 9.96 10.12 10.00
Ba 1401 2915 2317 1589 2431 1780 2027 2034 1833 2002 2165 2117 2185Sr 228 506 376 393 490 323 431 475 528 274 225 385 520
Total 94.45 94.43 95.91 95.60 95.46 93.69 95.13 94.62 94.02 95.11 95.49 94.11 94.72
Si 3.351 3.408 3.446 3.414 3.366 3.419 3.356 3.342 3.320 3.341 3.321 3.375 3.413Ti 0.023 0.017 0.017 0.017 0.025 0.017 0.020 0.020 0.021 0.019 0.023 0.020 0.016Al 2.203 2.058 2.027 2.109 2.132 1.990 2.213 2.233 2.274 2.222 2.273 2.168 2.107Cr 0.004 0.019 0.001 0.004 0.001 0.072 0.002 0.001 0.001 0.001Fe 0.057 0.075 0.083 0.054 0.091 0.085 0.074 0.122 0.100 0.140 0.101 0.081 0.068Mn 0.001 0.001 0.001 0.001 0.001 0.001Mg 0.363 0.422 0.427 0.403 0.386 0.416 0.335 0.284 0.283 0.278 0.281 0.355 0.396Ca 0.001 0.002 0.001Na 0.113 0.099 0.059 0.063 0.074 0.073 0.086 0.087 0.074 0.077 0.078 0.058 0.070K 0.830 0.817 0.890 0.894 0.888 0.890 0.841 0.817 0.854 0.825 0.839 0.865 0.847
Cs * 12.8 6.7 9.0 11.9 7.4 12.2 19.9 11.8 13.1 12.7 12.6 11.4 11.4Rb * 476 387 361 351 321 519 390 361 359 401 378 350 387Ba * 1198 2790 2567 1462 2827 1659 2144 2231 1964 1931 2277 2228 2035Sr * 160 646 444 310 470 231 478 444 422 299 239 319 584
Precise data on Cs, Rb and Ba are relatively easy to achieve in phengite analyses, with pit sizes of less than 40 µm in
regular thin sections being sufficient. A comparison of measured Ba concentrations derived from electron
microprobe and LAM analyses shows excellent agreement (Fig. 4) and precludes any significant systematic matrix
effect influencing the LAM analyses. On the other hand, Cs contents in amphibole were mostly below detection
limit. Although eclogite-facies mineral phases in Trescolmen are commonly very coarse grained, mineral inclusions
and microfractures along cleavage planes generally limit pit sizes to 40-60 µm. If inclusions or microfractures were
analysed accidentally, they were excluded from data reduction by careful inspection of each measurement in time-
resolved mode. In a few cases (e.g. in sample 55-4, a thick section 80 µm thick), pit diameters of up to 140 µm
could be drilled (at 1.4 mJ and 400 µm defocusing distance) for 18 sec on inclusion-free areas of some amphiboles.
Even under these ideal conditions, however, the Cs concentration in amphibole in this sample was below the
calculated detection limit (<3 ppb).
2. Cs-Rb-Ba systematics in phengite and amphibole 19
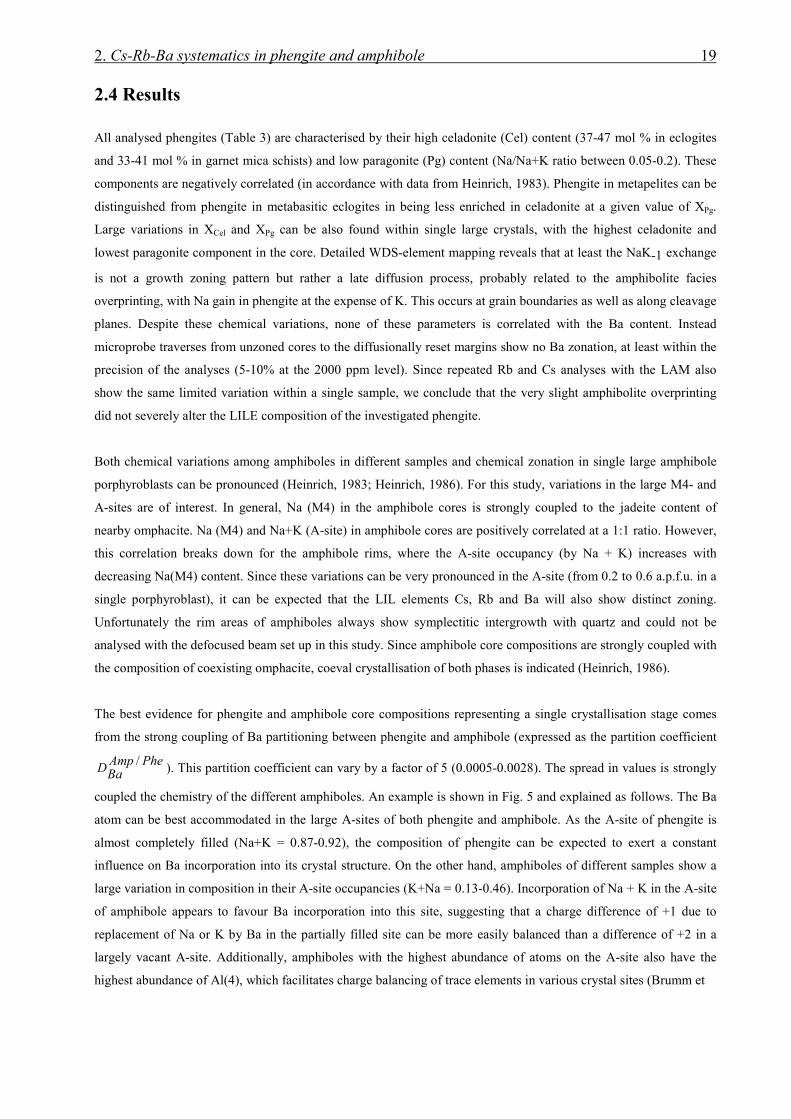
2.4 Results
All analysed phengites (Table 3) are characterised by their high celadonite (Cel) content (37-47 mol % in eclogites
and 33-41 mol % in garnet mica schists) and low paragonite (Pg) content (Na/Na+K ratio between 0.05-0.2). These
components are negatively correlated (in accordance with data from Heinrich, 1983). Phengite in metapelites can be
distinguished from phengite in metabasitic eclogites in being less enriched in celadonite at a given value of XPg.
Large variations in XCel and XPg can be also found within single large crystals, with the highest celadonite and
lowest paragonite component in the core. Detailed WDS-element mapping reveals that at least the NaK-1 exchange
is not a growth zoning pattern but rather a late diffusion process, probably related to the amphibolite facies
overprinting, with Na gain in phengite at the expense of K. This occurs at grain boundaries as well as along cleavage
planes. Despite these chemical variations, none of these parameters is correlated with the Ba content. Instead
microprobe traverses from unzoned cores to the diffusionally reset margins show no Ba zonation, at least within the
precision of the analyses (5-10% at the 2000 ppm level). Since repeated Rb and Cs analyses with the LAM also
show the same limited variation within a single sample, we conclude that the very slight amphibolite overprinting
did not severely alter the LILE composition of the investigated phengite.
Both chemical variations among amphiboles in different samples and chemical zonation in single large amphibole
porphyroblasts can be pronounced (Heinrich, 1983; Heinrich, 1986). For this study, variations in the large M4- and
A-sites are of interest. In general, Na (M4) in the amphibole cores is strongly coupled to the jadeite content of
nearby omphacite. Na (M4) and Na+K (A-site) in amphibole cores are positively correlated at a 1:1 ratio. However,
this correlation breaks down for the amphibole rims, where the A-site occupancy (by Na + K) increases with
decreasing Na(M4) content. Since these variations can be very pronounced in the A-site (from 0.2 to 0.6 a.p.f.u. in a
single porphyroblast), it can be expected that the LIL elements Cs, Rb and Ba will also show distinct zoning.
Unfortunately the rim areas of amphiboles always show symplectitic intergrowth with quartz and could not be
analysed with the defocused beam set up in this study. Since amphibole core compositions are strongly coupled with
the composition of coexisting omphacite, coeval crystallisation of both phases is indicated (Heinrich, 1986).
The best evidence for phengite and amphibole core compositions representing a single crystallisation stage comes
from the strong coupling of Ba partitioning between phengite and amphibole (expressed as the partition coefficient
PheAmpBaD / ). This partition coefficient can vary by a factor of 5 (0.0005-0.0028). The spread in values is strongly
coupled the chemistry of the different amphiboles. An example is shown in Fig. 5 and explained as follows. The Ba
atom can be best accommodated in the large A-sites of both phengite and amphibole. As the A-site of phengite is
almost completely filled (Na+K = 0.87-0.92), the composition of phengite can be expected to exert a constant
influence on Ba incorporation into its crystal structure. On the other hand, amphiboles of different samples show a
large variation in composition in their A-site occupancies (K+Na = 0.13-0.46). Incorporation of Na + K in the A-site
of amphibole appears to favour Ba incorporation into this site, suggesting that a charge difference of +1 due to
replacement of Na or K by Ba in the partially filled site can be more easily balanced than a difference of +2 in a
largely vacant A-site. Additionally, amphiboles with the highest abundance of atoms on the A-site also have the
highest abundance of Al(4), which facilitates charge balancing of trace elements in various crystal sites (Brumm et

2. Cs-Rb-Ba systematics in phengite and amphibole 20
Fig. 5 Influence of amphibole crystal
structure (here A-site occupancy) on the
partitioning behaviour of Ba between
amphibole and phengite ( PheAmpBaD / ).
Black diamonds: phengite-amphibole pairs
from different eclogite samples; gray
squares: phengite-amphibole partitioning
between amphiboles of phengite-free
samples (59-1 and 55-4) and an average
phengite from surrounding metapelite.
al., in prep.). Therefore, the observed positive correlation between PheAmpBaD / and A-site occupancy in amphibole
is to be expected and is interpreted as evidence for attainment of equilibrium between phengite and amphibole.
Analyses of garnet, clinopyroxene, zoisite and apatite in several samples show that these phases do not incorporate
Cs and Rb in significant amounts (always below detection limit; at least <0.2 ppm). Cs and Rb were detected in
amphibole (0.004-0.03 ppm and 1.1-3.1 ppm respectively), paragonite (0.05-0.6 ppm and 3-22 ppm respectively)
and phengite (6.7-13 ppm and 320-520 ppm respectively). For the phases in Trescolmen eclogites, Ba
concentrations increase in the order: garnet (0.007-0.08 ppm) < apatite (ca. 0.07 ppm) ≤ clinopyroxene, zoisite
(0.04-0.15 ppm) < amphibole (0.9-7.5 ppm) < paragonite (180-370 ppm) < phengite (1200-2800 ppm). These data,
combined with estimates of the modal abundances, reveal that in phengite-bearing samples more than 99% of Cs,
Rb and Ba are concentrated in phengite (Fig. 6). Therefore phengite has to be considered the principal carrier of Cs,
Rb and Ba in eclogites as well as in high pressure metapelites (see also Domanik et al., 1993; Sorensen et al., 1997),
even if phengites are generally low in modal abundance. In phengite-free rocks, paragonite (sample 50-14) or
amphibole (samples 55-4 and 59-1) are the principal carriers for Cs, Rb and Ba, but total LIL element concentrations
are much lower in these rocks.
Strong selective partitioning of trace elements in high pressure metamorphic rocks has been reported previously
(e.g. Hickmott, 1992). On the basis of the results of this study, this conclusion can be extended to phengite, in which
the large ion lithophile elements Cs, Rb and Ba are highly concentrated in phengite compared to all other mineral
phases. As another example, Sr abundance in sample 50-13 is controlled by the accessory mineral apatite. However,
although the dominance of apatite in controlling the Sr budget is not as extreme as phengite for the Cs, Rb and Ba
budget (Fig. 6), as amphibole, clinopyroxene and phengite can all accommodate significant amounts of Sr.
0.000
0.001
0.002
0.003
0.0 0.2 0.4 0.6 0.8
K+Na cations on A-site (Amp)
DA
mp
/Ph
e (B
a) 59-1
55-4

2. Cs-Rb-Ba systematics in phengite and amphibole 21
Fig. 6 Mass balance of LIL elements in
eclogites exemplified for one sample (50-
13). All mineral trace element compositions
measured by LAM-ICP-MS, mineral modes
are estimated by element mapping of one
whole thin section (288,000 points,
recalculated to wt% and normalized to
100%): garnet 38, clinopyroxene 58,
amphibole 2, phengite 1.5, apatite 0.5.
Other phases not considered include rutile,
quartz and kyanite (together <5%).
LIL element concentrations (measured by LAM) of all phases in eclogites have been integrated with measured
modal abundances to yield estimates of LIL concentrations in the rocks as a whole. These estimates can be
compared to whole rock LILE data (measured by solution-ICP-MS) in order to establish a reliable mass balance for
eclogitic rocks. For Ba, a complete mass balance with all primary mineral phases cannot always be achieved. In
samples lacking phengite, the Ba concentrations in the whole rock are higher than the concentrations and mineral
proportions measured for the Ba-richest phase (i.e. paragonite or amphibole). Solution-ICP-MS analysis of the Ba
concentration for the whole rock sample 59-1 yielded a concentration of 1.72 ppm, whereas the reconstructed
composition with 20 modal % amphibole (3.8 ppm Ba) as the only significant Ba phase results in a calculated
concentration of 0.76 ppm Ba. Although care was taken to select rock chips with no visible sign of alteration, it can
clearly be seen from this result that significant proportions of Ba (>50% in the case of 59-1) can be introduced by
late stage products such as the amphibolite-facies symplectites.
2.5 Discussion
2.5.1 Protolith constraints from LIL element concentrations
We have plotted data for basalts that have undergone low and high temperature alteration, fresh volcanic rocks,
pelagic sediments and 'average' composition continental crust in a Rb/Cs vs. Ba/Rb diagram (Fig. 7). This diagram
was chosen because it is suitable to: (1) delimit specific fields for a range of protoliths that cannot be differentiated
otherwise (e.g. fresh against altered MORB); (2) compare the eclogite data with their possible protoliths; and (3)
investigate how fluid processes during metamorphism can be traced by changing LIL element ratios. The field of
fresh MORB and OIB is restricted to mantle values of about 0.0126 for Cs/Rb and 11.3 for Ba/Rb (Hofmann &
White, 1982; McDonough & Sun, 1995). In contrast, low-T (< ca. 300°C) altered MORB spans a large field away
from fresh MORB towards higher Cs/Rb (up to 0.08) and lower Ba/Rb ratios (down to 0.3), indicating enrichments
in the order Cs>Rb>Ba (Staudigel & Hart, 1983; Staudigel et al., 1996). High-T (> ca. 300°C) altered gabbros from
ODP 149 (Seifert et al., 1997) partially overlap with low-T altered MORB, but show a cluster of significantly lower
0%
20%
40%
60%
80%
100%
rela
tiv
e p
rop
ort
ion
s o
f L
ILE
's in
min
era
ls
Cs Rb Ba Sr
Amp
Amp
Cpx
Phe
Phe Phe Phe
Apa
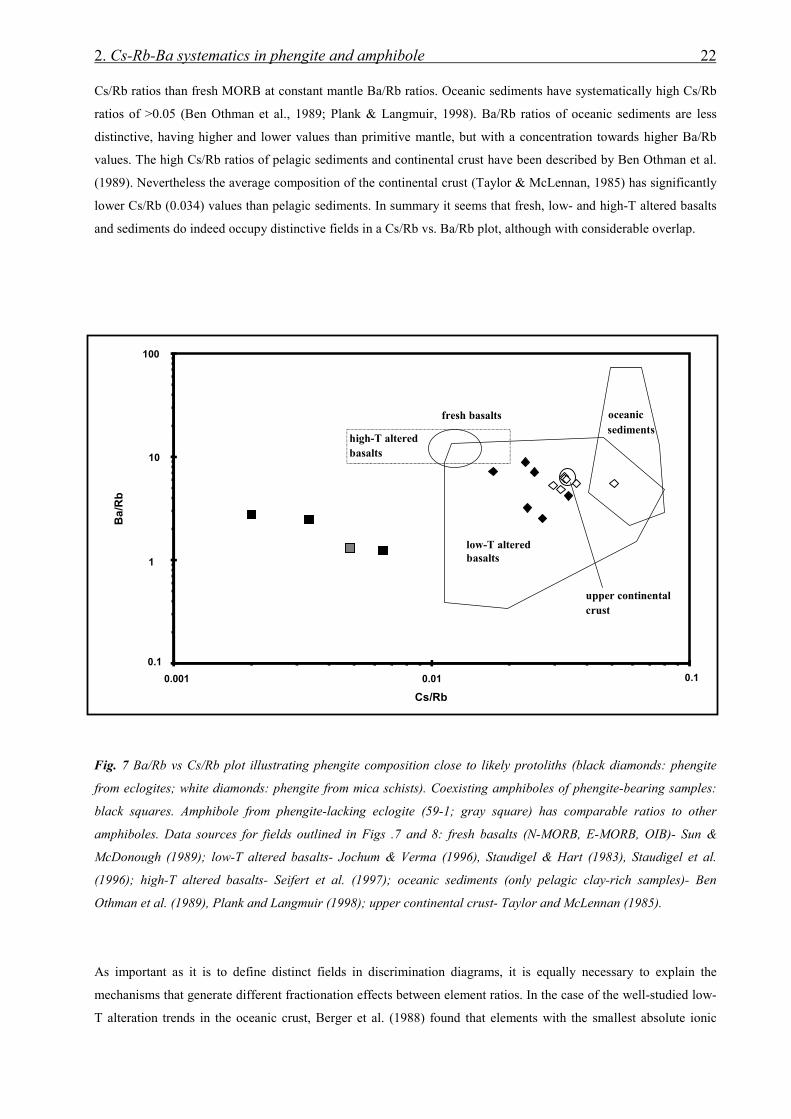
2. Cs-Rb-Ba systematics in phengite and amphibole 22
0.1
1
10
100
0.001 0.01 0.1
Cs/Rb
Ba
/Rb
fresh basalts
low-T altered basalts
oceanic sediments
upper continental crust
high-T altered basalts
Cs/Rb ratios than fresh MORB at constant mantle Ba/Rb ratios. Oceanic sediments have systematically high Cs/Rb
ratios of >0.05 (Ben Othman et al., 1989; Plank & Langmuir, 1998). Ba/Rb ratios of oceanic sediments are less
distinctive, having higher and lower values than primitive mantle, but with a concentration towards higher Ba/Rb
values. The high Cs/Rb ratios of pelagic sediments and continental crust have been described by Ben Othman et al.
(1989). Nevertheless the average composition of the continental crust (Taylor & McLennan, 1985) has significantly
lower Cs/Rb (0.034) values than pelagic sediments. In summary it seems that fresh, low- and high-T altered basalts
and sediments do indeed occupy distinctive fields in a Cs/Rb vs. Ba/Rb plot, although with considerable overlap.
Fig. 7 Ba/Rb vs Cs/Rb plot illustrating phengite composition close to likely protoliths (black diamonds: phengite
from eclogites; white diamonds: phengite from mica schists). Coexisting amphiboles of phengite-bearing samples:
black squares. Amphibole from phengite-lacking eclogite (59-1; gray square) has comparable ratios to other
amphiboles. Data sources for fields outlined in Figs .7 and 8: fresh basalts (N-MORB, E-MORB, OIB)- Sun &
McDonough (1989); low-T altered basalts- Jochum & Verma (1996), Staudigel & Hart (1983), Staudigel et al.
(1996); high-T altered basalts- Seifert et al. (1997); oceanic sediments (only pelagic clay-rich samples)- Ben
Othman et al. (1989), Plank and Langmuir (1998); upper continental crust- Taylor and McLennan (1985).
As important as it is to define distinct fields in discrimination diagrams, it is equally necessary to explain the
mechanisms that generate different fractionation effects between element ratios. In the case of the well-studied low-
T alteration trends in the oceanic crust, Berger et al. (1988) found that elements with the smallest absolute ionic

2. Cs-Rb-Ba systematics in phengite and amphibole 23
hydration energy have the highest affinity towards minerals when in contact with circulating fluids. It is likely that
adsorption of trace elements on the mineral surface is the dominant mechanism, so that in terms of effective
partition coefficients, DMin/Fluid
are in the order Cs>Rb>Ba (in accordance with increasing absolute ionic hydration
energies). It can be speculated that the same mechanism may explain the distinctively higher Cs/Rb values of
pelagic sediments in relation to the continental crust. Thus, even though Plank & Langmuir (1998) proposed that the
trace element contents of pelagic sediments may be a good approximation to the average continental crust due to
homogenisation of different sources, sediments from continental sources might preferentially adsorb Cs from
oceanic seawater. This would lead to a higher Cs/Rb ratio of pelagic sediments compared to continental crust
sources, as implied by the available data sources.
In marked contrast, high-T alteration trends seem to be controlled by the size of the crystallographic sites occupied
by the LIL elements in the reacting minerals and valence of the elements (Blundy & Wood, 1994; Beattie, 1994). In
the only experimental study of mineral/fluid partitioning behaviour of Rb and Cs, Volfinger (1976) showed that
DMin/Fluid values at 400-800°C are in the order Cs<Rb for all minerals analysed (sanidine, muscovite and biotite).
This is identical with results from melting studies of biotite, muscovite (Icenhower and London 1995), phlogopite
(LaTourrette et al., 1995; Foley et al., 1996; Melzer & Wunder, 1999) and amphibole (Zack et al., 1997). They all
showed that DMin/L was in the order Cs<Rb≅Ba, with the largest atom (Cs) always being the least suitable element to
accommodate in these crystal structures. Nevertheless more DMin/Fluid studies for Cs, Rb, Ba as well as high quality
geochemical data for high-T altered oceanic layer 3 sections like ODP 149 and ophiolite sections are needed. The
relative paucity of these data has to be taken into account when applying discrimination diagrams of LIL elements.
With these caveats in mind, plotting our phengite data in the Cs/Rb vs. Ba/Rb diagram (Fig. 7) offers some new
insights into the protolith history of hydrous eclogites as well as their subsequent metamorphic history. All
phengites from eclogite samples plot inside the low-T altered MORB field, whereas 6 out of 7 phengites from the
surrounding metapelite plot very close to the values of the upper continental crust (Taylor & McLennan, 1985).
Phengites mirror Rb/Cs and Ba/Rb ratios of their host rock (being >90% of the whole rock budget for these
elements). Therefore it seems that these element ratios in the metamorphic rocks of Trescolmen still preserve the
compositions of their likely protoliths. We can conclude that at least all 6 of the analysed, phengite-bearing eclogites
record the LILE pattern of the original MORB-type protoliths affected by low-T alteration, e.g. at a shallow crustal
level. This is in accordance with the conclusions of Miller et al. (1988) who interpreted elevated δ18O values in most
eclogites from Koralpe and Saualpe as evidence for a low-T ocean floor alteration effect. Similarly, Putlitz et al.
(1997) proposed that the upper sections of the oceanic crust are preferentially incorporated in orogenic belts, based
on oxygen isotope studies of metabasalts in the Cyclades.
Sample 50-1, a mica schist with a Cs/Rb ratio higher than the upper continental crust value, is the only sample taken
from the contact with an eclogite boudin. In this sample, the grain sizes of phengite and garnet in the mica schist are
larger than further away from eclogite bodies (Heinrich, 1982). The large grain sizes and the presence of quartz
segregations in close association point to recrystallisation in the presence of a fluid, e.g. in the pressure shadow of
the eclogite boudins. According to the discussion above concerning partition coefficients of Cs and Rb, a high-T
fluid should be enriched in Cs over Rb in relation to coexisting minerals. The high Cs/Rb ratio of 50-1 can therefore
be explained by phengite crystallising from or in equilibrium with a high-T fluid. Here, the fluid could have been
used up during phengite growth so that the high Cs/Rb ratio was imprinted on the phengite.

2. Cs-Rb-Ba systematics in phengite and amphibole 24
Since phengite in eclogites and metapelites both record the LIL element signature of their likely protoliths, phengite
or another K-rich phase such as biotite with large stability fields must have been stable during the whole
metamorphic cycle. For instance, biotite forms under amphibolite conditions in both pelitic and basaltic systems and
has an upper stability limit of about 1.5-2.0 GPa (Stüwe & Powell, 1995; Schmidt, 1993). Phengite is stable under
blueschist and eclogite facies conditions and breaks down only by partial melting (Schmidt, 1996). Following the
assumed prograde PT path for Trescolmen, amphibolite facies biotite would have transformed to phengite with
increasing pressure by a complex range of continuous reactions. Interestingly, H2O is consumed by this process
(Heinrich, 1982; Schmidt, 1993), so that LILE would not be mobilised into any fluid during these reactions. If a K-
rich phase were not always present in eclogites during the metamorphic cycle, the LIL elements would not have
been fixed, but would instead show the ratios of the surrounding metapelites (see below). Nevertheless, some
mobilisation of potassium is indicated by the presence of phengite in kyanite-quartz veins and in the coarse-grained
mica schists in contact with eclogite boudins. However, the effect is qualitatively minor; for example, randomly
oriented phengites in quartz segregations of one eclogite sample (CHM30) have a Cs/Rb ratio strongly differing
from that of metapelite (Fig. 7) and may represent very local recrystallisation.
2.5.2 Fluid exchange between eclogites and metapelites
In contrast to the phengite-bearing eclogites, the samples lacking phengite and containing amphibole as the
dominant LILE phase have Cs/Rb ratios lower than any likely protolith at the given Ba/Rb ratio (Fig. 7). It becomes
apparent that there must have been a modification of the original LILE pattern of these samples if we take into
consideration the reconstructed whole rock content. Assuming a modal abundance of 20% for amphibole and 3% for
phengite where present, we have plotted reconstructed Ba contents vs. Ba/Rb ratio in Fig. 8. In accordance with their
LILE ratios, the Ba contents of the phengite-bearing samples plot in the field of altered basalts. On the other hand,
the three analysed samples without phengite (55-4, 59-1 and 50-14) have Ba contents about an order of magnitude
lower than any likely protolith. In these samples, some Ba (along with Rb and Cs) depletion is therefore inferred to
have occurred.
Another important observation is that amphibole from the samples lacking phengite has very similar LIL element
contents to the amphibole coexisting with phengite. If we preclude a mere coincidence, the implication is that all
amphibole is in equilibrium with phengite, the phase dominating the LILE budget in eclogites and metapelites.
Sample 59-1 was taken from the centre of an eclogite body about 2 m in diameter. No phengite was observed
anywhere in the whole body. We therefore conclude that the LILE contents of the amphibole were controlled by a
fluid buffered by phengite in the adjacent metapelite, suggesting at least a metre scale fluid mobility. The absolute
water influx may have been very low. Given a weight abundance of amphibole between 10 to 30% with the
amphibole having 2 wt% H2O, the H2O influx required for the amphibole growth need not have exceeded 0.2 to 0.6
wt% H2O. Nevertheless, the total fluid required to develop similar LIL element patterns in all eclogitic amphiboles
must have been higher in order to permit amphibole growth from a fluid with constant composition that did not
become depleted by the takeup of LIL elements into the amphibole structure (as suggested for phengite in sample
50-1). To quantify this process, an approach similar to the widespread modeling of stable isotope interactions can be
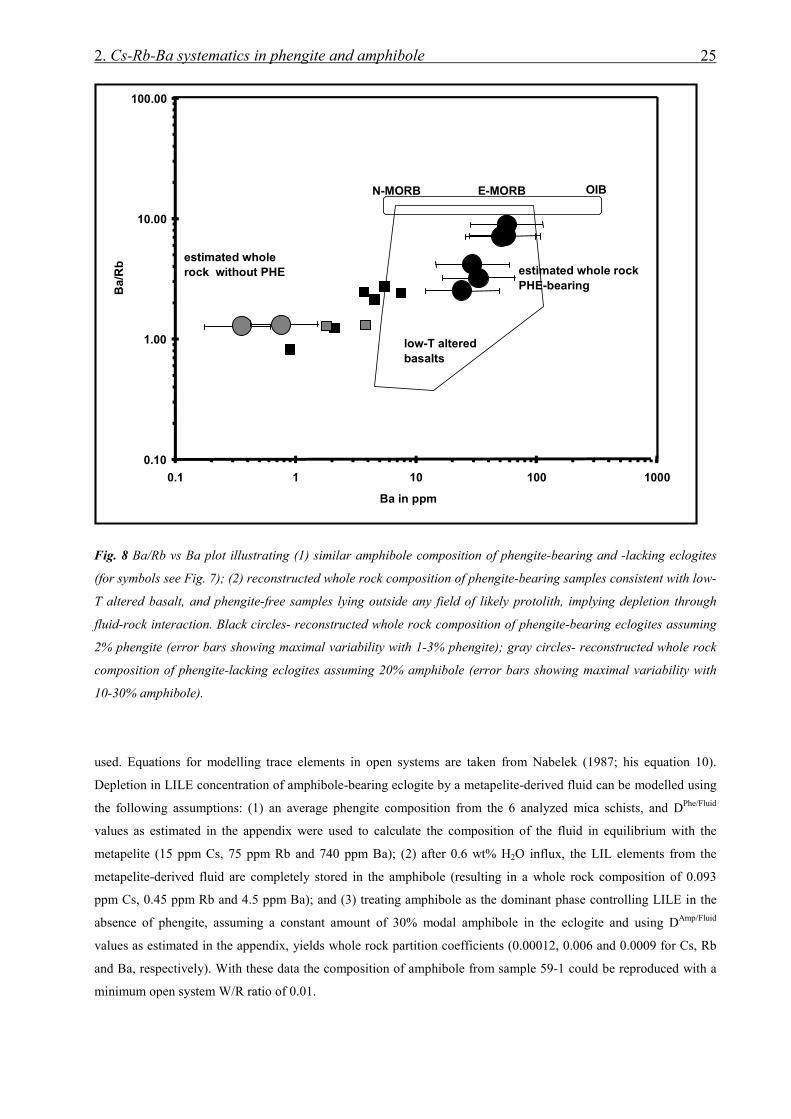
2. Cs-Rb-Ba systematics in phengite and amphibole 25
Fig. 8 Ba/Rb vs Ba plot illustrating (1) similar amphibole composition of phengite-bearing and -lacking eclogites
(for symbols see Fig. 7); (2) reconstructed whole rock composition of phengite-bearing samples consistent with low-
T altered basalt, and phengite-free samples lying outside any field of likely protolith, implying depletion through
fluid-rock interaction. Black circles- reconstructed whole rock composition of phengite-bearing eclogites assuming
2% phengite (error bars showing maximal variability with 1-3% phengite); gray circles- reconstructed whole rock
composition of phengite-lacking eclogites assuming 20% amphibole (error bars showing maximal variability with
10-30% amphibole).
used. Equations for modelling trace elements in open systems are taken from Nabelek (1987; his equation 10).
Depletion in LILE concentration of amphibole-bearing eclogite by a metapelite-derived fluid can be modelled using
the following assumptions: (1) an average phengite composition from the 6 analyzed mica schists, and DPhe/Fluid
values as estimated in the appendix were used to calculate the composition of the fluid in equilibrium with the
metapelite (15 ppm Cs, 75 ppm Rb and 740 ppm Ba); (2) after 0.6 wt% H2O influx, the LIL elements from the
metapelite-derived fluid are completely stored in the amphibole (resulting in a whole rock composition of 0.093
ppm Cs, 0.45 ppm Rb and 4.5 ppm Ba); and (3) treating amphibole as the dominant phase controlling LILE in the
absence of phengite, assuming a constant amount of 30% modal amphibole in the eclogite and using DAmp/Fluid
values as estimated in the appendix, yields whole rock partition coefficients (0.00012, 0.006 and 0.0009 for Cs, Rb
and Ba, respectively). With these data the composition of amphibole from sample 59-1 could be reproduced with a
minimum open system W/R ratio of 0.01.
0.10
1.00
10.00
100.00
0.1 1 10 100 1000
Ba in ppm
Ba/
Rb estimated whole rock
PHE-bearing
estimated whole rock without PHE
N-MORB E-MORB OIB
low-T altered basalts
2. Cs-Rb-Ba systematics in phengite and amphibole 26
The minimum calculated W/R ratio of about 0.01 is based on the assumption that all LIL elements were transported
into the eclogite from the surrounding metapelite. This model would be in accordance with the petrographic
observation that amphibole growth was triggered by fluid influx (reaction 2). A higher W/R ratio would be needed if
the current LILE contents of amphibole were attained by leaching by a throughflowing fluid at high pressure from
amphibole previously containing the higher LILE of the protolith. To quantify this kind of fluid/rock interaction, the
same assumptions as above were made except that the starting composition of the eclogite was a moderately low-T
altered basalt (0.34 ppm Cs, 17.7 ppm Rb, 10.2 ppm Ba). In this scenario, the amphibole composition of sample 59-
1 could be reproduced at open system W/R ratios of at least 0.03. More extreme parameters such as more strongly
altered basalt or a higher modal amount of amphibole would result in higher W/R ratios.
An upper W/R ratio can be derived from the LILE systematics of eclogitic and metapelitic phengite. Even though
metapelitic and eclogitic phengites do not occupy distinct fields in Fig. 7, both rock types can be clearly
distinguished by their spread of Cs, Rb and Ba concentrations (Fig. 4). Phengite in 6 metapelite samples, taken
representatively from the whole area of Trescolmen, show an extremely homogeneous composition (11.2, 370 and
2110 ppm for Cs, Rb and Ba, with standard deviations of 5-7 %). In contrast, phengite in eclogites shows a much
wider range of Cs, Rb and Ba concentrations (6.7-12.8, 320-520 and 1200-2800 ppm for Cs, Rb and Ba, standard
deviation of 6 samples 22-34 %). The heterogeneous composition of different eclogites can only be preserved if
element exchange between metapelites and eclogites was restricted. This restricted exchange can be modelled in
terms of W/R interaction between a phengite-bearing eclogite and a metapelite-derived fluid, giving an upper limit
for a W/R ratio. For the following we assume that: (1) the eclogite with the phengite composition furthest away from
metapelitic phengite was taken (CHM30) with a calculated whole rock composition (1 modal % of phengite) of
0.067 ppm Cs, 3.9 ppm Rb and 27.8 ppm Ba; (2) the metapelite-derived fluid is used in the same way as for the
amphibole calculations; (3) phengite is the only phase controlling LILE, resulting in whole rock partition
coefficients of 0.008, 0.05 and 0.023 for Cs, Rb and Ba using DPhe/Fluid values as estimated in the appendix. Under
such conditions a W/R ratio of greater than 0.1 would have obliterated LILE ratios of any likely low-T altered basalt
protolith and produced phengite compositions identical to the phengites in the mica schist samples.
2.5.3 Implications for subduction zone environments
The geochemical pattern of the hydrous eclogites from Trescolmen permits their use as a case study for the
behaviour of low-T altered basalts undergoing subduction. We have shown evidence for fluid migration under high
pressure conditions (>1.8 GPa). The total amount of fluid could have been very low. Nevertheless one scenario can
be excluded: If fluid from the surrounding metapelites was just enough to form amphibole, the resulting Cs/Rb ratio
(ca. 0.2) would be almost two orders of magnitude higher than observed (0.004 for sample 59-1). The most efficient
mechanism to explain the observed LILE pattern of the eclogitic amphiboles is pervasive fluid circulation equivalent
to open system behaviour. The fluid in equilibrium with the surrounding metapelites infiltrates the eclogite bodies,
in case of 59-1 at least on a metre scale. The calculated W/R ratio is extremely low (from 0.01 to 0.1).
2. Cs-Rb-Ba systematics in phengite and amphibole 27
W/R ratios of as low as 0.01 are in accordance with observed oxygen isotope heterogeneities on a decimetre scale in
eclogites from the Tauern Window in a structurally similar setting (Getty & Selverstone, 1994), since oxygen
isotope changes would be too small to be measurable. Fluid-rock ratios of 0.01 will cause only minor changes in
δ18O values even for interaction between two extremely different compositions (e.g. fluids in equilibrium with
carbonate sediments interacting with mantle-derived basalts would shift δ18O by 0.2 ‰). Fluid interaction between
less extreme compositions such as oceanic pelites and low-T altered basalts (Trescolmen case) would result in
almost undetectable changes in the δ18O values, even for W/R ratios of 0.1. Experimental results of Watson &
Lupulescu (1993) indicate non-wetting behaviour of aqueous fluids in clinopyroxene-rich systems which seems to
be in contrast with our findings. Nevertheless, the strong anisotropy induced in rocks undergoing plastic
deformation may facilitate fluid influx, as discussed for mylonitised marbles by Holness (1997). This effect is likely
to dominate in most eclogites from Trescolmen, where a penetrative foliation is locally defined by partly aligned
amphiboles.
Since fluids are able to infiltrate eclogitic rocks under high pressure, it is concluded that fluids can also leave this
system. The ability of very small volumes of fluid to penetrate eclogitic systems is a prerequisite of many models
addressing the large-scale behaviour of subduction zones, although the migration mechanisms and potential
problems with fluid migration are seldom considered. The existence of volcanoes above subducting slabs of variable
depths (from ca. 120 km to >400 km), together with systematic geochemical changes in these volcanic rocks, has
been explained by a steady, though decreasing amount of fluid flux from the subducting slab wedge into the
underlying mantle (Woodhead & Johnson, 1993; Ishikawa & Nakamura, 1994; Ryan et al., 1995; Ishikawa & Tera,
1997; Shibata & Nakamura, 1997; Moriguti & Nakamura, 1998). Most of this fluid component (as high as 99% in
the case of the Izu arc) is thought to originate from the upper part of the altered oceanic crust, based on Li-B-Pb
isotope systematics (Moriguti & Nakamura, 1998). The amount of fluid available from continuous and
discontinuous dehydration reactions has been modelled by Poli & Schmidt (1995) and Schmidt & Poli (1998). In
cold subduction zones, only about 0.1 wt% of H2O is produced per 50 km depth, mostly from the continuous
reactions lawsonite + diopside + garnet1 -> garnet2 + coesite/stishovite + H2O, and phengite -> K-rich
clinopyroxene + enstatite + coesite + H2O (Schmidt & Poli, 1998). These small amounts of fluids must be able to
leave their eclogitic source rocks in a more or less continuous manner to ultimately produce the observed across-arc
variations in many arc systems (Kuriles, Izu-Bonin, New Britain, NE Japan, etc.). Our results support such a
scenario in which small amounts of H2O can leave their production site, probably facilitated by ductile deformation,
and subsequently becoming collected in an anastomosing vein system (Widmer, 1996).

2. Cs-Rb-Ba systematics in phengite and amphibole 28
2.6 Conclusions
1. Eclogites from Trescolmen show petrographic evidence for fluid migration under high pressure conditions.
Kyanite is partly replaced by paragonite, barroisitic amphibole overgrows older omphacite and high pressure
(>2.0 GPa) talc veins infiltrate a Mg-rich eclogite body.
2. LAM-ICP-MS measurements on all high pressure mineral phases reveal that phengite is the dominant phase for
Cs, Rb and Ba in eclogitic rocks, accommodating >90% of the whole rock budget in phengite-bearing samples.
Other phases such as paragonite and amphibole have only a very limited capacity to incorporate these elements.
3. Comparison of whole rock and in-situ mineral data shows that secondary phases, even in the freshest rock
samples, can severely alter the composition of whole rock samples for fluid-mobile elements such as Ba. This
clearly demonstrates the advantage of in-situ geochemical methods over whole rock analysis in extracting
petrogenetic information in complex metamorphic assemblages.
4. Cs/Rb and Ba/Rb ratios of eclogites and garnet micaschists retain the patterns of their likely protoliths, i.e. low-
T altered basalt and upper continental crust, respectively. LILE pattern of amphibole in phengite-lacking
samples plot outside any likely protolith, but are identical to patterns in amphiboles in phengite-bearing
samples. The observed data can be explained by flow of fluid derived from metapelite through the eclogite
bodies, leading to amphibole homogenisation. Nevertheless the amount was small enough to leave original
phengite patterns intact.
5. Modelling of open system fluid-rock interaction give a range of possible W/R ratios of 0.01-0.1. This result is
consistent with the observation of oxygen isotope heterogeneities in other alpine eclogite bodies, showing that
in-situ LILE analysis are more suitable for regions of low W/R interaction.

2. Cs-Rb-Ba systematics in phengite and amphibole 29
2.7 Appendix to Chapter 2
First order estimates about DMin/Fluid can be made for the minerals of interest on the basis of very sparse experimental
and our own data. A number of simplifications have to be made. Here, we do not differentiate between biotite and
phlogopite, nor muscovite and phengite, pressure (0.02-2 GPa) and temperature (600-800°C) effects are not taken
into account. Plank & Johnson (1997) measured bulk rock / fluid partition coefficients of Rb and Ba (1.5 and 0.7) in
an experiment at 600°C/2.0 GPa with a red clay as starting material. Since typical red clays contains between 5-7%
K2O and muscovite and biotite were the only significant K-bearing phases we can estimate a modal abundance of
about 30% of these two minerals. With this modal abundance and a similar partitioning behaviour of biotite and
muscovite (Icenhower & London 1995), DPhe/Fluid can be calculated as 5 and 2.3 for Rb and Ba. It is encouraging to
notice that Beswick (1973) and Melzer & Wunder (1999) derived similar DPhe/Fluid values for Rb (4.4 and 2,
respectively). Volfinger (1976) determined a Rb-Cs KD between muscovite and water. Using his experiments, a
(Rb/Cs)Fluid/(Rb/Cs)Phe value of 0.17 translates into a DPhe/Fluid for Cs of 0.8. From our natural DAmp/Phe ratios (0.0005,
0.004 and 0.001 for Cs, Rb and Ba respectively), DAmp/Fluid for Cs, Rb and Ba can then be estimated (0.0004, 0.02
and 0.003 respectively). Compared to DAmp//L values from experimental studies, our estimates are best matched by
amphiboles with richteritic compositions (DAmp/L for Cs, Rb and Ba are 0.0008, 0.06 and 0.008; Brumm et al., 1998).
DPhe / Fluid DAmp/Phe DAmp/Fluid
Cs 0.8 0.0005 0.0004
Rb 5 0.004 0.02
Ba 2.3 0.001 0.003
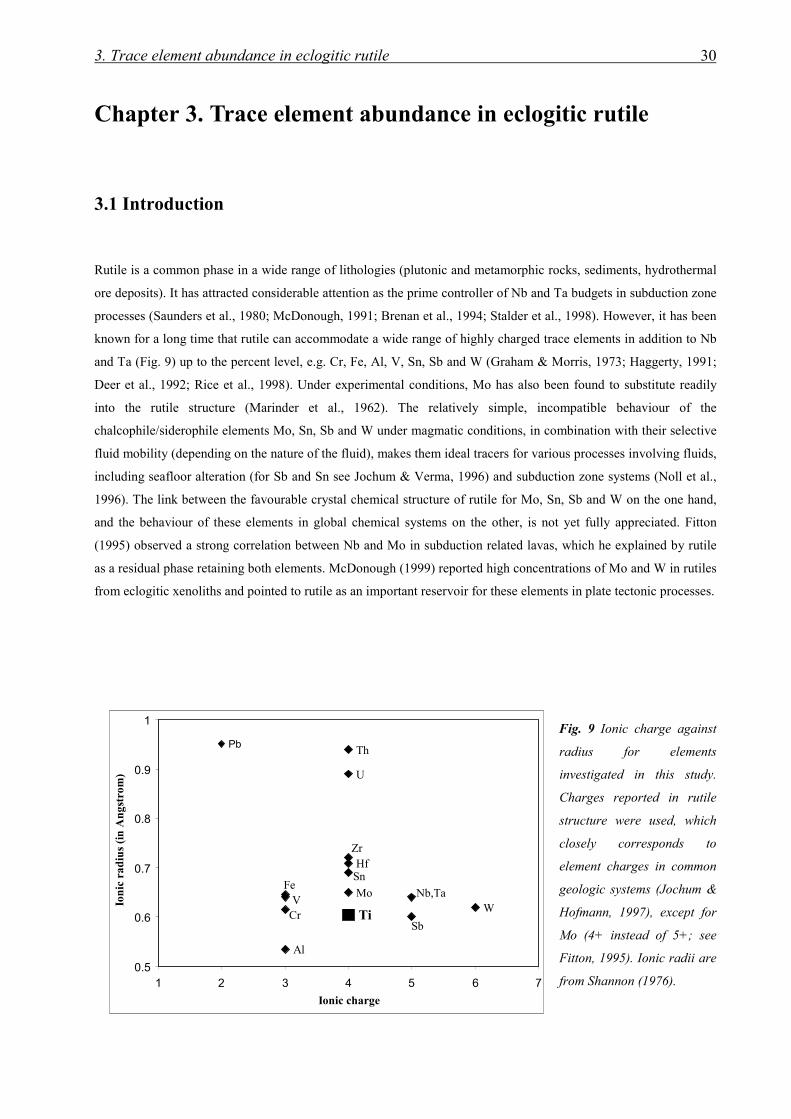
3. Trace element abundance in eclogitic rutile 30
Chapter 3. Trace element abundance in eclogitic rutile
3.1 Introduction
Rutile is a common phase in a wide range of lithologies (plutonic and metamorphic rocks, sediments, hydrothermal
ore deposits). It has attracted considerable attention as the prime controller of Nb and Ta budgets in subduction zone
processes (Saunders et al., 1980; McDonough, 1991; Brenan et al., 1994; Stalder et al., 1998). However, it has been
known for a long time that rutile can accommodate a wide range of highly charged trace elements in addition to Nb
and Ta (Fig. 9) up to the percent level, e.g. Cr, Fe, Al, V, Sn, Sb and W (Graham & Morris, 1973; Haggerty, 1991;
Deer et al., 1992; Rice et al., 1998). Under experimental conditions, Mo has also been found to substitute readily
into the rutile structure (Marinder et al., 1962). The relatively simple, incompatible behaviour of the
chalcophile/siderophile elements Mo, Sn, Sb and W under magmatic conditions, in combination with their selective
fluid mobility (depending on the nature of the fluid), makes them ideal tracers for various processes involving fluids,
including seafloor alteration (for Sb and Sn see Jochum & Verma, 1996) and subduction zone systems (Noll et al.,
1996). The link between the favourable crystal chemical structure of rutile for Mo, Sn, Sb and W on the one hand,
and the behaviour of these elements in global chemical systems on the other, is not yet fully appreciated. Fitton
(1995) observed a strong correlation between Nb and Mo in subduction related lavas, which he explained by rutile
as a residual phase retaining both elements. McDonough (1999) reported high concentrations of Mo and W in rutiles
from eclogitic xenoliths and pointed to rutile as an important reservoir for these elements in plate tectonic processes.
Fig. 9 Ionic charge against
radius for elements
investigated in this study.
Charges reported in rutile
structure were used, which
closely corresponds to
element charges in common
geologic systems (Jochum &
Hofmann, 1997), except for
Mo (4+ instead of 5+; see
Fitton, 1995). Ionic radii are
from Shannon (1976).
VFe
Cr
Al
Ti
Mo
SnHf
Zr
U
Th
Sb
Nb,TaW
Pb
0.5
0.6
0.7
0.8
0.9
1
1 2 3 4 5 6 7
Ionic charge
Ion
ic r
adiu
s (i
n A
ngs
trom
)
3. Trace element abundance in eclogitic rutile 31
The intention in this chapter is to evaluate the behaviour of a range of highly charged elements in hydrous eclogites
and accompanying garnet mica schists, because both lithologies are potential sources for subduction zone-related
fluids. Rutiles were analysed with electron microprobe (EMP) and laser ablation microprobe-ICP-MS (LAM). The
EMP offers the advantage of higher spatial resolution whereas the LAM allows the study of the majority of naturally
occurring trace elements. Of these elements, Mo, Sn, Sb and W are not routinely measured with LAM, making it
necessary to pay special attention to potential analytical difficulties. Mass balance calculations of trace elements in a
single whole rock are a powerful tool to evaluate the importance of different phases for different elements (Sorensen
& Grossmann, 1989; Tribuzio et al., 1996). For one sample, all analysable phases with LAM have therefore been
measured and their modal abundance as well as the whole rock trace element concentration has been determined.
This study provides strong evidence for the importance of rutile as a principal carrier for Cr, Nb, Ta, Mo, Sn, Sb and
W in metamorphic rocks. The implications are far-reaching and are discussed for two different applications,
sedimentary provenance studies and modelling of subduction zone processes.
3.2 Analytical procedures
3.2.1 Electron microprobe
Microprobe analyses of rutile were performed with a JEOL JXA 8900RL instrument in Göttingen. For high
precision, low background measurements, 20 kV acceleration voltage, 80 nA beam current on the Faraday cup, 5
µm beam diameter and long counting times (between 60-180 sec on the peak for Si, Cr, Fe, Ca, Al and 360 sec for
Nb, Sb and W) were chosen. An EDS detector was used for simultaneous Ti determination. Selected samples (Ad25,
50-13, 52-1, 77-5, Disentis, Laora) were analysed with 30 kV acceleration voltage to increase sensitivities, which
was especially effective for W. Here, the measurement conditions were 80 nA beam current on the Faraday cup, 8
µm beam diameter and counting times on the peak were 16s for Ti, Fe, 120s for Mg, Al, Si, Ca, V, Cr, 300s for Mn,
Zr, Nb and 600s for W. The matrix correction method for the raw counts is phi-rho-zet (Armstrong, 1991). We used
an additional off-line correction especially designed for trace element analysis of rutile. The off-line correction was
necessary since background corrected count rates on a pure synthetic rutile (Earth Jewelry Co. Japan) otherwise give
negative values for certain elements (Al, Zr, Nb, W), with apparent negative concentrations of as large as 80 ppm
(for W). Errors as large as this cannot be attributed to asymmetrically curved bremsstrahlung adjacent to element
peaks (Fialin et al., 1999). It can be observed from Fig. 10 that bremsstrahlung adjacent to the Nb peak is highly
linear inside the brackets given by spectrometer position where the backgrounds are measured. Similar linear
relationships have also been obtained for W and Zr. We therefore interpret apparent negative concentrations as
resulting from sample drift during the long counting times and high beam currents. Nevertheless, negative
concentrations in the synthetic rutile are highly systematic and were corrected for by repeatingly measuring the
synthetic rutile standards to obtain "true" zero-concentration count rates on the peaks. Each 5 analyses of rutiles
from Trescolmen samples were followed by 2 analyses of the synthetic rutile standard. V Kα overlap by Ti Kβ was
corrected online by the JEOL software after the method of Fialin et al. (1997). The analytical procedure allowed
measurement of Nb concentrations at the 100 ppm level with a standard deviation of 5-10% (from counting

3. Trace element abundance in eclogitic rutile 32
statistics). Calculated detection limits for measurements at 30 kV are 20-35 ppm for Mg, Al, Si, Ca, Cr, 40 ppm for
Mn, Fe, 45 ppm for Nb, W and 80 ppm for Zr; calculated from repeated measurements (n=26, student’s T-test) with
a 95% confidence level which gives 2.05 times the standard deviation of peak count rates in the rutile standard. Mg
and Mn concentrations are always, and Sb mostly, below detection limits, so that we do not include them in Table 4.
However, for the most Sb-enriched rutile (sample 77-5), concentrations for Sb measured by electron microprobe are
75±25 ppm and by LAM 81±16 ppm), demonstrating an acceptable agreement between both methods for Sb
measurements.
Fig. 10 X-ray spectrum of the area around the Nb Lα peak are plotted from a synthetic rutile and a rutile from
sample 50-13. The lack of an observable Nb peak in the spectra of the synthetic rutile validates the use of this
sample as a "zero-concentration" standard. A significantly curved bremsstrahlung between the brackets of the Nb
background positions can be ruled out as a source for error in the measurement of Nb trace element concentrations.
Analytical conditions were 29 kV acceleration voltage, 80 nA beam current on the Faraday cup, 120 seconds per
step and a step width of 50 µm of the PET spectrometer. Typical error is ±10 cps per step.
23
26
29
32
35
38
41
180 181 182 183 184 185 186
Spectrometer position in mm (PET)
Cou
nt
rate
(cp
s)
Nb Lαααα peak
X-ray spectrum of rutile fromsample 50-13 (700 ppm Nb)
X-ray spectrum of synthetic rutile(nominal no Nb)
Difference betweenpolynomal curve fitting andlinear interpolation frombackground positions:<10 ppm Nb
Nb backgroundNb background
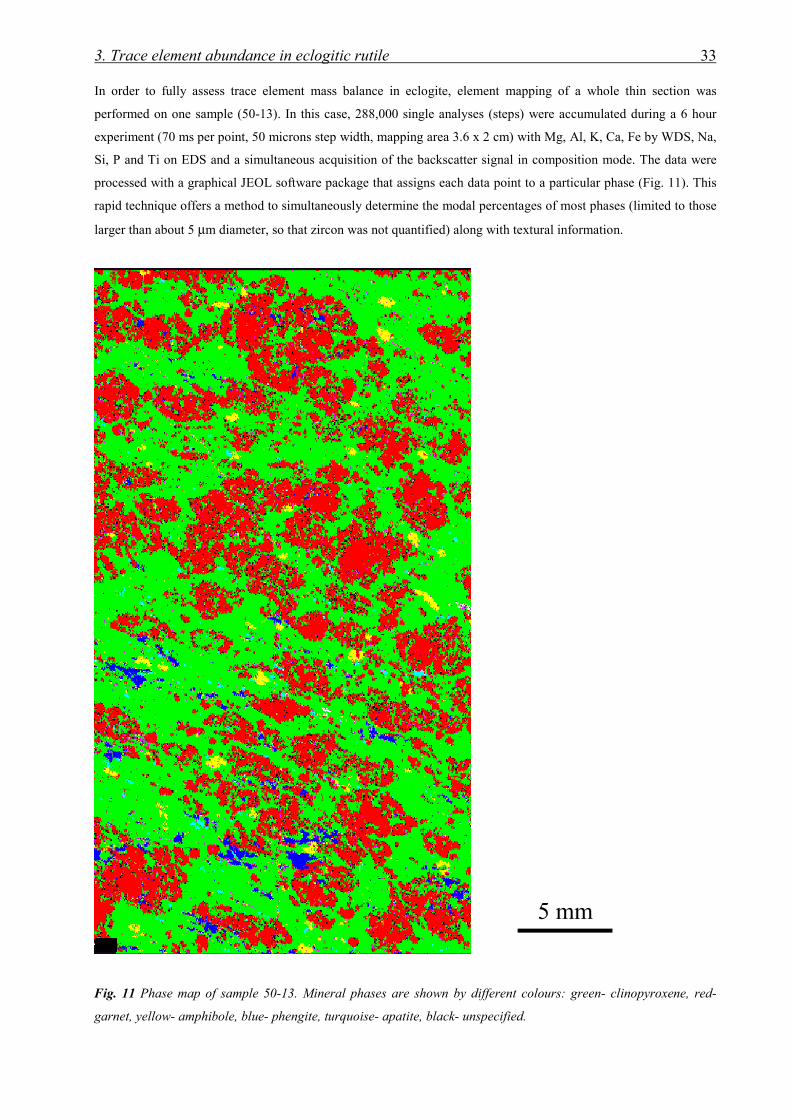
3. Trace element abundance in eclogitic rutile 33
In order to fully assess trace element mass balance in eclogite, element mapping of a whole thin section was
performed on one sample (50-13). In this case, 288,000 single analyses (steps) were accumulated during a 6 hour
experiment (70 ms per point, 50 microns step width, mapping area 3.6 x 2 cm) with Mg, Al, K, Ca, Fe by WDS, Na,
Si, P and Ti on EDS and a simultaneous acquisition of the backscatter signal in composition mode. The data were
processed with a graphical JEOL software package that assigns each data point to a particular phase (Fig. 11). This
rapid technique offers a method to simultaneously determine the modal percentages of most phases (limited to those
larger than about 5 µm diameter, so that zircon was not quantified) along with textural information.
5 mm
Fig. 11 Phase map of sample 50-13. Mineral phases are shown by different colours: green- clinopyroxene, red-
garnet, yellow- amphibole, blue- phengite, turquoise- apatite, black- unspecified.

3. Trace element abundance in eclogitic rutile 34
3.2.2 Laser ablation microprobe
Optimum laser tunings for the ablation of rutile in regular thin sections were reached with a defocused beam, with
the focal point varying from 100 µm above the mineral surface at 0.05 mJ for smallest ablation pits (20 µm in
diameter) to 300 µm above the surface at 0.4 mJ for largest ablation pits (100 µm in diameter). NIST glass standards
SRM 610 and 612 were used for calibration, with recommended values taken from Pearce et al. (1997). Chalcophile
and siderophile elements generally show different ablation behaviour compared to lithophile elements, leading to
fractionation effects among the different element groups (Longerich et al., 1996). However, under the conditions
described above, fractionation effects were minimised; even for antimony, the most difficult element, after one
minute of rutile ablation Sb/Nb ratios deviated less than 20% from the starting value for both rutile and glass (Fig.
12). In some runs designed to achieve lower detection limits, Ti was taken out of the element menu to avoid tripping
of the detector during rutile ablation. Here, Nb measured by electron microprobe was taken as the internal standard
for both rutile and the glass standards. The use of Nb as an internal standard for rutile analyses is justified by the
excellent agreement between Nb concentrations measured in several samples with both techniques (Fig. 13).
Fig. 12 Typical ablation signal of rutile in
LAM analysis. In this example, Nb from
EMP measurements has been taken as the
internal standard.
Fig. 13 Comparison of Nb concentrations
in rutiles analyzed by electron microprobe
(EMP) and LAM-ICP-MS (LAM). Black
diamonds are rutiles from eclogites, grey
squares represent rutiles from garnet
micaschists and white circles rutiles from
Disentis and Laora. Solid line represents
a perfect 1:1 correlation, dotted lines are
upper and lower range of a 20% deviation
from the 1:1 line.
100
1000
10000
100000
1000000
0 20 40 60 80 100 120 140
Time (sec)
Sig
na
l in
ten
sity
(cp
s)
Nb (120 ppm)
Sb (85 ppm)
Sn (30 ppm)
W (20 ppm)
Mo (4 ppm)
0
500
1000
1500
2000
0 500 1000 1500 2000
Nb (EMP) in ppm
Nb
(LA
M)
in p
pm

3. Trace element abundance in eclogitic rutile 35
Given the combined uncertainties on Nb measurement of both techniques (15-20% for LAM, 1-10% for EMP) on
Nb, all data are identical within error and no systematic offset can be detected for concentrations from 100 ppm to
almost 2000 ppm. This statement can be extended to measurements of the elements Zr, V and W, where data have
also been obtained by both methods in several samples. For W, concentrations down to 60 ppm measured by LAM
(samples Ad25, 52-1) can be reproduced by EMP, whereas the extremely low concentration of 17 ppm (sample 77-
5) was correctly predicted as being below the detection limit of the EMP (≤45 ppm). A comparison of EMP and
LAM measurements for several trace elements stresses the validity of using completely different materials with
contrasting ablation behaviour for LAM standardisation (oxide minerals vs. glass standard) and shows that all
interferences relevant for the analysis of rutiles have been considered. On the other hand, it shows that trace element
abundances down to 60 ppm can be accurately measured with the EMP if a "zero-concentration correction" can be
applied.
For LAM analysis of Mn-rich phases, it was found that molybdenum has to be measured on the 98Mo isotope. 0.5%
MnO in garnet produces an overlap of 55Mn40Ar on 95Mo that results in an apparent molybdenum concentration of
about 1 ppm. For all other analysed phases this effect is not significant since Mn concentrations are always below
0.03%. 55Mn40Ar interferences have been reported previously (Becker et al., 1996) to form during plasma formation
at a relative MnAr/Mn ratio of about 3.5 * 10-5, which is about one order of magnitude less than measured during
our runs. The formation of titanium argides may be significant for the analysis of Sr and Y in rutiles due to 48Ti40Ar
and 49Ti39Ar producing an apparent Sr concentration of about 10 ppm and 49Ti40Ar an apparent Y concentration of
about 1 ppm.
One other interference that might be significant in the analysis of elements measured in this study is 41K2O+ on 98Mo
(May & Wiedmeyer, 1998). We found the concentration of molybdenum in phengite (containing about 10% K2O) to
be 6 times higher if 98Mo was analysed instead of 95Mo, and therefore used 95Mo for the analyses of phengites (less
than 0.01% MnO) and 98Mo for the remaining phases. A comparison of different isotopes of the same element (118Sn
and 120Sn, 121Sb and 123Sb, 182W and 184W) gives excellent agreement in the phases rutile, clinopyroxene, garnet and
phengite, therefore precluding any significant interferences for these elements. As a result of these considerations,
the following isotopes were used in this study: 49Ti, 51V, 90Zr, 93Nb, 95Mo, 98Mo, 120Sn, 121Sb, 177Hf, 181Ta, 184W,
208Pb, 232Th, 238U. Zircon and sulphide grains (chalcopyrite and pyrite) were always too small (<20 µm) for the
acquisition of precise data. However, mixed analyses of these minerals with their surroundings were gathered, but
only qualitatively processed to identify approximate abundances of investigated trace elements.
3.3 Evaluation of results
From the elements analysed in this study, most highly charged elements (≥ 4+) in rutile give good signal intensities
with LAM-ICP-MS (Fig. 12). The only exception, where count rates were mostly below the detection limit, is Th,
which is also the largest cation analysed (Fig. 9). Trace elements show different behaviour in terms of total
variability (Table 4), with a large spread (more than a factor of 10) among all samples for Cr (140-16000 ppm), Nb
(100-4400 ppm), Sb (4-80 ppm), W (17-235 ppm), Pb (<0.1-10 ppm), U (0.01-10 ppm) and a smaller spread for V

3. Trace element abundance in eclogitic rutile 36
(1100-2000 ppm), Zr (80-250 ppm), Mo (2.3-7.0 ppm) and Sn (30-130 ppm). From this general observation one
might suspect that the former elements will be potentially more interesting for characterising rutile populations.
Investigations of the homogeneity of Nb and Cr in rutiles showed that within an area of about 1 cm2 in each sample,
variations in measured Nb and Cr concentrations (both core to rim variations and variations between different
grains) are generally less than statistical scattering of the EMP. The only exception is sample 55-3, a coarse grained
Cr-rich metagabbro that did not thoroughly recrystallise under eclogite facies conditions (Chapter 4), where
different rutile grains show wide compositional variations. Domains of former chromites contain Cr-enriched phases
such as omphacite, phengite and rutile, with Cr concentrations in rutile up to 2.4% Cr2O3 (compared to 2500 ppm Cr
outside the Cr-rich domains).
Table 4. Trace element compositions (in ppm) of rutiles from Trescolmen eclogites and garnet micaschists,
measured by electron microprobe (EMP) and laser ablation microprobe-ICP-MS (LAM). Whole rock content of
eclogites were determined by XRF, except for values marked with * which were analyzed by LAM on glass pellets
(Reid 1998).
EclogitesAd25 CHM30b 50-2 52-1 50-13 50-14 55-3 55-4 59-5 77-5
low-Cr high-CrEMPCa 880 366 459 70 434 272 1201 52Al 293 79 116 143 221 216Cr 1155 3157 142 682 1798 667 2532 16421 3965 670Fe 2923 2513 2435 2489 2739 3222 5604 1671 1341 2088Si 391 128 b.d. 147 112 388 318 125 b.d.Nb 104 554 285 273 693 161 4446 1293 107 77Zr 124 162 156 178V 735 1495 1371 1160W 65 61 290 b.d.LAMV 1507 1927 1293 2008Zr 84 118 142 126 149 93 151 156 245Nb 304 267 786 196 684 109Mo 2.3 3.6 5.4 7.0 4.6 4.9 4.0Sn 28 28 41 39 42 87 27Sb 9.6 28 6.4 8.8 5.5 9.6 81W 60 88 95 68 235 109 17Pb 1.8 0.96 3.4 0.75 1.2 0.31 <0.12 3.4Th <0.03 0.017 <0.02 <0.01 <0.02 0.0043 <0.04 <0.01U 0.11 0.23 2.6 0.90 0.92 1.4 0.22 4.1 0.011Hf 3.0 6.1 5.7 5.2 5.5 3.7 6.7 6.5 11Ta 7.57 34.8 21.6 15.3 48.2 11.8 41.0 6.57 3.06Nb/Ta 13.6 15.9 14.1 17.4 16.3 16.6 16.7 16.6 31.7Whole rockTiO2 0.9 2.34 2.95 1.19 2.42 0.67 1.13 0.84 1.58Cr 1045 287 90 612 244 1030 664 803 355Nb 8.4 11.2 12.8 12.9 4.04* 5.91* 7.98* 0.79* 3.00Ta 0.24* 0.35* 0.51* <0.1*
Nb/Ta 16.8 16.9 15.6 >7.9

3. Trace element abundance in eclogitic rutile 37
Table 4 (continued).
Garnet micaschists Other rutiles50-1 50-9 59-4 60-2 61-1 Disentis Laora
EMPCa 56 88 32 45 45 b.d. b.d.Al 134 200 139 275 108 100 76Cr 703 352 473 267 408 1138 775Fe 3323 5003 3800 10651 2347 3370 3671Si 187 319 245 b.d. b.d.Nb 1215 1460 1626 1438 984 147 809Zr 150 110V 782 1569W b.d. 103LAMV 1115 1102 1820Zr 97 105 167 141 84Nb 1839 1672 1012 162 899Mo 5.2 4.3 4.0 0.74 0.23Sn 128 99 65 15 33Sb 5.1 4.2 4.6 0.29 1.9W 123 86.8 145 62 135Pb 4.9 9.8 1.5Th 0.21 <0.03 <0.08U 7.4 9.7 7.2Hf 4.1 4.3 6.3 6.6 4.8Ta 114 101 54 10 34Nb/Ta 16.2 16.6 18.9Whole rockTiO2CrNbTaNb/Ta
Large rutile grains from two other localities (Disentis, Switzerland, grown in postorogenic hydrothermal quartz veins; Laora, Minas Gerais, Brazil) were also analysedduring the course of this study with the general aim of searching for homogeneouscrystals suitable as standards for in-situ methods.
3.3.1 Mass balance calculation for eclogite sample 50-13
Mass balance calculations have been used in metamorphic rocks to evaluate the importance of each phase as a host
for certain trace elements (Sorensen & Grossman, 1989; Tribuzio et al., 1996; Nagasaki & Enami, 1998; Chapter 2;
Chapter 4). This approach requires knowledge of a number of parameters, the most important being the
concentration of the trace elements of interest in all coexisting phases, the modal abundance of these phases and
ideally the whole rock major and trace element concentrations as independent quality controls for the calculations.
We have performed a mass balance calculation on sample 50-13, since this eclogite is ideal for such an analysis in
terms of freshness, coarse grain size and homogeneous mineral composition (Chapter 4). Additionally it can be seen

3. Trace element abundance in eclogitic rutile 38
in Fig. 11 that the texture of this sample reveals a preferred orientation of omphacite, garnet, phengite and
amphibole, indicating that these phases formed syntectonically under eclogite facies conditions. Microscopic
observation confirms that rutile also recrystallized under these conditions, since rutile is commonly aligned as
strings of grains parallel to the same foliation and shows no signs of corrosion or mineral overgrowth (e.g. by
ilmenite).
The modal abundance estimates of omphacite, garnet and amphibole are entirely based on element mapping,
whereas the modal abundance of accessory phases were estimated from XRF data (Ti for rutile, K for phengite and
Zr for zircon; see Table 5 for details). These phase abundances cannot be precisely calculated by element mapping
due to mixed analyses from small grain sizes of these accessory phases. Here, rutile abundance was adjusted from
2% given by element mapping to 1.1% calculated from TiO2 content by XRF analysis, and phengite was adjusted
from 1.8% to 5.8% as calculated from K2O content. The lower value for phengite given by the element mapping is
probably not only a result of its small grain size, but also a function of its platy shape inasmuch as a section
perpendicular to the mica cleavage (as in this thin section, cut perpendicular to the main foliation) results in a
minimum of areal coverage. However, the mass balance calculation is quite robust and small changes in modal
abundances (e.g. for phengite) do not alter the following conclusions.
Table 5. Mass balance for eclogite sample 50-13. Numbers under mineral abbreviations give modal abundance
measured by phase mapping, except numbers in bold that were calculated from XRF whole rock data. Trace element
data for phases is measured by LAM, except K2O content by EMP and Zr content in zircon given by stoechiometry.
50-13CPX GRT AMP PHE RUT ZRC recon. whole mantle MORB55 36 2.0 5.8 1.1 0.018 rock element ratios composition
TiO2 0.074 0.045 0.26 0.35 100 * 1.2a 0.7-3.2K2O 0.4 9.8 * 0.57a 0.03-0.19Nb 0.0095 0.046 0.093 0.58 786 9 13a 0.7-21W 0.029 0.006 0.018 1.7 235 2.7 0.007-0.17Sb <0.02 <0.02 5.5 0.061 0.03-0.05Mo 0.12 0.11 0.08 0.12 4.6 0.20 0.18-0.69Sn 0.79 0.17 1.2 2.0 42 1.1 0.6-2.6Zr 2.0 3.6 5.9 0.3 149 491000 * 93a 40-230Cr 654 359 742 1883 522 612a 70-410Th 0.82b 0.02-0.91Ba 104b 1.4-105Pr 2.9b 1.0-2.9Sm 3.6b 1.6-7.9Sb/Pr 0.021 0.020c
Sn/Sm 0.30 0.32d
Mo/Pr 0.069 0.23e
W/Th 3.3 0.20f
W/Ba 0.026 0.0016e
* - Reconstructed whole rock content for these elements is forced to coincide with XRF data. a- XRF data, b-Solution-ICP-MS data. c- Jochum & Hofmann (1997); d- Jochum et al. (1993); e- Newson et al. (1986); f- Newsomet al. (1996). Additional MORB data (only from samples where Sb, Sn, Mo and W data exist): Peuchelt &Emmermann (1983), Melson et al. (1977).
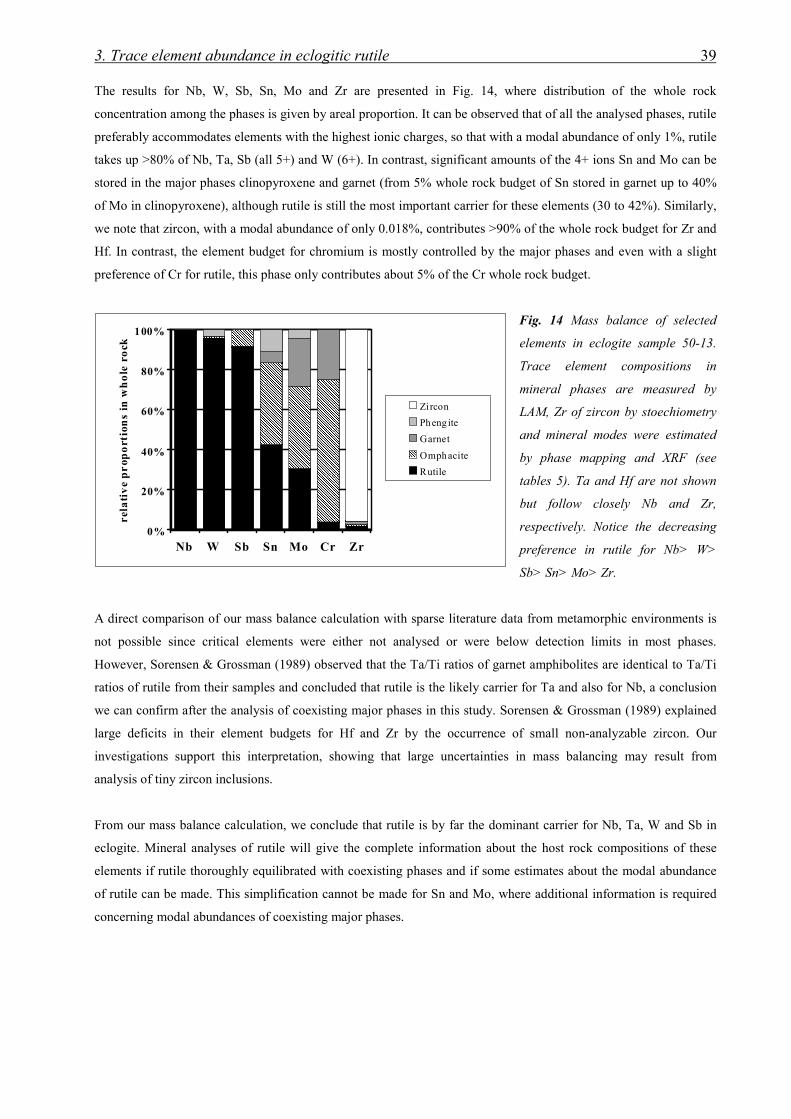
3. Trace element abundance in eclogitic rutile 39
The results for Nb, W, Sb, Sn, Mo and Zr are presented in Fig. 14, where distribution of the whole rock
concentration among the phases is given by areal proportion. It can be observed that of all the analysed phases, rutile
preferably accommodates elements with the highest ionic charges, so that with a modal abundance of only 1%, rutile
takes up >80% of Nb, Ta, Sb (all 5+) and W (6+). In contrast, significant amounts of the 4+ ions Sn and Mo can be
stored in the major phases clinopyroxene and garnet (from 5% whole rock budget of Sn stored in garnet up to 40%
of Mo in clinopyroxene), although rutile is still the most important carrier for these elements (30 to 42%). Similarly,
we note that zircon, with a modal abundance of only 0.018%, contributes >90% of the whole rock budget for Zr and
Hf. In contrast, the element budget for chromium is mostly controlled by the major phases and even with a slight
preference of Cr for rutile, this phase only contributes about 5% of the Cr whole rock budget.
Fig. 14 Mass balance of selected
elements in eclogite sample 50-13.
Trace element compositions in
mineral phases are measured by
LAM, Zr of zircon by stoechiometry
and mineral modes were estimated
by phase mapping and XRF (see
tables 5). Ta and Hf are not shown
but follow closely Nb and Zr,
respectively. Notice the decreasing
preference in rutile for Nb> W>
Sb> Sn> Mo> Zr.
A direct comparison of our mass balance calculation with sparse literature data from metamorphic environments is
not possible since critical elements were either not analysed or were below detection limits in most phases.
However, Sorensen & Grossman (1989) observed that the Ta/Ti ratios of garnet amphibolites are identical to Ta/Ti
ratios of rutile from their samples and concluded that rutile is the likely carrier for Ta and also for Nb, a conclusion
we can confirm after the analysis of coexisting major phases in this study. Sorensen & Grossman (1989) explained
large deficits in their element budgets for Hf and Zr by the occurrence of small non-analyzable zircon. Our
investigations support this interpretation, showing that large uncertainties in mass balancing may result from
analysis of tiny zircon inclusions.
From our mass balance calculation, we conclude that rutile is by far the dominant carrier for Nb, Ta, W and Sb in
eclogite. Mineral analyses of rutile will give the complete information about the host rock compositions of these
elements if rutile thoroughly equilibrated with coexisting phases and if some estimates about the modal abundance
of rutile can be made. This simplification cannot be made for Sn and Mo, where additional information is required
concerning modal abundances of coexisting major phases.
Nb W Sb Sn Mo Cr Zr
������������������������
������������������������
������������������������������������������������������������������
������������������������������������������������������������
���������������������������������������������������������������������������������������������������������������
0%
20%
40%
60%
80%
100%
rela
tiv
e p
rop
ort
ion
s in
wh
ole
ro
ck
Zircon
Pheng ite
Garnet���Omphacite
Rutile

3. Trace element abundance in eclogitic rutile 40
3.3.2 Element ratios for eclogite 50-13
We have shown that whole rock compositions for a large range of HFS elements can be calculated by means of
simple mass balance. Even though analytical problems with LAM and EMP data for these elements can be largely
circumvented, it is essential to evaluate the data in a petrotectonic context. Elements with similar partition
coefficients during melting and fractionation processes must have similar ratios from different suites of magmatic
rocks, assuming that their mantle source is not heterogeneous (Hofmann & White 1983). Solely based on careful
analysis of natural rocks, Sb-Pr, Sn-Sm, Mo-Pr and W-Th (or W-Ba) element pairs were found to show similar
partitioning behaviour in most magmatic systems (Newsom et al., 1986, 1996; Jochum et al., 1993; Jochum &
Hofmann, 1997).
We can therefore compare reconstructed whole rock concentrations of Sb, Sn, Mo and W with elements that can be
analysed with conventional techniques. Pr, Sm, Th and Ba concentrations were measured by solution-ICP-MS on
the whole rock sample 50-13 (Table 5). As can be seen, the Sb/Pr ratio of 0.021 and Sn/Sm ratio of 0.34 are in
excellent agreement with ratios established for mantle-derived rocks (0.020 for Sb/Pr, Jochum & Hofmann 1997;
0.32 for Sn/Sm, Jochum et al. 1993). Our value of 0.056 for Mo/Pr is substantially lower than the ratio of 0.23
determined by Newsom et al. (1986). However, our value lies only slightly outside their range of measured Mo/Pr
ratios (0.10-0.30).
For tungsten we see a discrepancy between values for 50-13 and mantle-derived samples that cannot be resolved
with the available data set. The ratios W/Th and W/Ba are both higher, by a factor of 16, than our eclogite sample
(0.026 and 3.3 instead of 0.0016 and 0.2; Newsom et al., 1986, 1996). Newsom et al. (1996) gave a range from 0.14
to 0.26 for W/Th ratios, significantly lower than our value of 3.3. Th and Ba have both been found to be mobile
during alteration and high grade metamorphism, but this does not seem to explain the differences. In Chapter 4 it is
shown that eclogites from Trescolmen have incompatible trace element patterns similar to MOR basalts. Comparing
literature data for MORB with our reconstructed whole rock concentrations, it can be seen that all elements of
interest fall in the same range, the only exception being tungsten (2.7 ppm instead of 0.002-0.16 ppm, Table 5).
Therefore 50-13 seems to be unusually enriched in W and not depleted in Th or Ba. Analytical problems for the
determination of the W content in rutiles from 50-13 can be ruled out. The common problem of contamination, e.g.
through a tungsten carbide mill, can not arise since we use in-situ techniques and clean mineral surfaces are subject
to considerable attention (Chapter 4). Additionally the high W content in the rutiles of 50-13 has been confirmed by
two different techniques (see analytical section).
We can only speculate that if the eclogite protolith was a rift-related basalt as proposed in Chapter 4, the excess
tungsten might have originated by contamination by continental crust during ascent of the source magma. Such a
process is feasible given the enriched W/Th ratio of the continental crust and its high absolute abundance of W
compared to mantle-derived magmas (Newsom et al., 1996). To our knowledge, W data for continental rift-related
basalts have not been reported and a direct comparison is therefore not possible.
From our mass balance calculation and from element ratio considerations, we are confident that zircon and/or
sulphides (chalcopyrite, pyrite), although identified in 50-13, cannot be important phases for the element budgets of
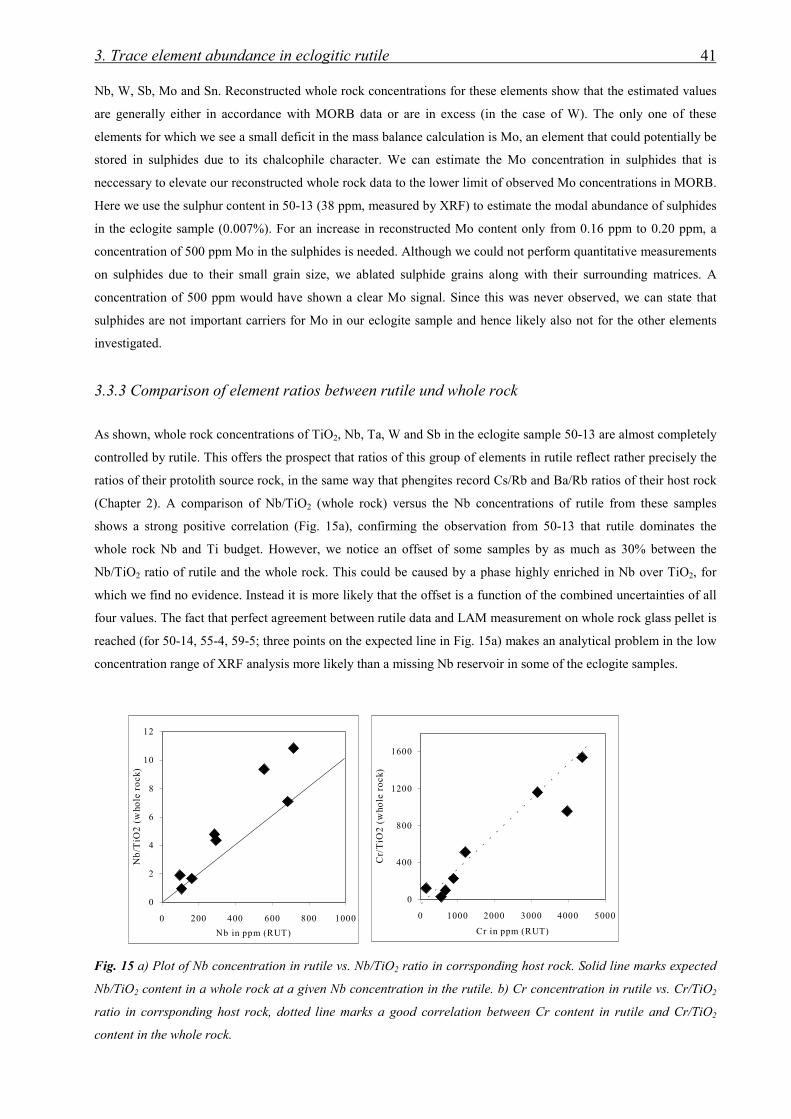
3. Trace element abundance in eclogitic rutile 41
Nb, W, Sb, Mo and Sn. Reconstructed whole rock concentrations for these elements show that the estimated values
are generally either in accordance with MORB data or are in excess (in the case of W). The only one of these
elements for which we see a small deficit in the mass balance calculation is Mo, an element that could potentially be
stored in sulphides due to its chalcophile character. We can estimate the Mo concentration in sulphides that is
neccessary to elevate our reconstructed whole rock data to the lower limit of observed Mo concentrations in MORB.
Here we use the sulphur content in 50-13 (38 ppm, measured by XRF) to estimate the modal abundance of sulphides
in the eclogite sample (0.007%). For an increase in reconstructed Mo content only from 0.16 ppm to 0.20 ppm, a
concentration of 500 ppm Mo in the sulphides is needed. Although we could not perform quantitative measurements
on sulphides due to their small grain size, we ablated sulphide grains along with their surrounding matrices. A
concentration of 500 ppm would have shown a clear Mo signal. Since this was never observed, we can state that
sulphides are not important carriers for Mo in our eclogite sample and hence likely also not for the other elements
investigated.
3.3.3 Comparison of element ratios between rutile und whole rock
As shown, whole rock concentrations of TiO2, Nb, Ta, W and Sb in the eclogite sample 50-13 are almost completely
controlled by rutile. This offers the prospect that ratios of this group of elements in rutile reflect rather precisely the
ratios of their protolith source rock, in the same way that phengites record Cs/Rb and Ba/Rb ratios of their host rock
(Chapter 2). A comparison of Nb/TiO2 (whole rock) versus the Nb concentrations of rutile from these samples
shows a strong positive correlation (Fig. 15a), confirming the observation from 50-13 that rutile dominates the
whole rock Nb and Ti budget. However, we notice an offset of some samples by as much as 30% between the
Nb/TiO2 ratio of rutile and the whole rock. This could be caused by a phase highly enriched in Nb over TiO2, for
which we find no evidence. Instead it is more likely that the offset is a function of the combined uncertainties of all
four values. The fact that perfect agreement between rutile data and LAM measurement on whole rock glass pellet is
reached (for 50-14, 55-4, 59-5; three points on the expected line in Fig. 15a) makes an analytical problem in the low
concentration range of XRF analysis more likely than a missing Nb reservoir in some of the eclogite samples.
Fig. 15 a) Plot of Nb concentration in rutile vs. Nb/TiO2 ratio in corrsponding host rock. Solid line marks expected
Nb/TiO2 content in a whole rock at a given Nb concentration in the rutile. b) Cr concentration in rutile vs. Cr/TiO2
ratio in corrsponding host rock, dotted line marks a good correlation between Cr content in rutile and Cr/TiO2
content in the whole rock.
0
2
4
6
8
10
12
0 200 400 600 800 1000
Nb in ppm (RUT)
Nb
/TiO
2 (
who
le r
ock
)
0
400
800
1200
1600
0 1000 2000 3000 4000 5000
Cr in ppm (RUT)
Cr/
TiO
2 (w
hole
roc
k)

3. Trace element abundance in eclogitic rutile 42
Chromium is another geochemically important element for which we have collected both rutile and whole rock data.
Although rutile is the phase with the highest Cr content, it enriches Cr only slightly in relation to coexisting phases
(Table 5) and is therefore, as an accessory phase, not very significant for the whole rock budget for Cr. Nevertheless
Cr contents in rutile are highly correlated with the Cr/TiO2 ratio of corresponding whole rocks (Fig. 15b). This is
surprising since the modal abundance and mineral parageneses in our investigated eclogite samples vary
significantly (Chapter 4). Our preferred explanation is that Cr does not show a strong preference for any eclogite
facies mineral (Table 5), so that the whole rock Cr budget is evenly distributed (although with a slight preference
towards rutile) in the major phases and variations in Cr whole rock concentrations are reflected in the Cr content of
rutile. This simple relationship will only occur as long as no other phase with a strong preference for Cr is part of a
mineral paragenesis. One such phase is Cr-spinel, occurring as an inclusion in clinopyroxene in eclogite sample 55-
3. Spinel is only a relict phase in 55-3 and is therefore not a stable eclogite facies phase (Chapter 4).
3.4 Applications
3.4.1 Provenance constraints by single grain analyses of detrital rutiles
We have shown that Nb and Cr contents in rutile enable close estimates of the Nb/TiO2 and Cr/TiO2 ratios of its host
rock. Both trace elements are important tracers for magmatic processes, with low Nb contents corresponding to a
large degree of melting and low Cr contents corresponding to large degrees of fractionation. Therefore it is not
surprising that concentrations of Nb and Cr in rutile are clearly separated in our metapelitic and eclogitic samples
(Fig. 16), both having experienced completely different petrogenetic histories. In the following this finding will be
discussed in relation to its potential application to provenance studies.
The review by Force (1980) showed that rutile is an important accessory phase in medium- to high-grade
metamorphic rocks, but rare to nonexistent in most volcanic and magmatic rocks. Exceptions are alkaline rocks
(mostly kimberlites), mafic-ultramafic layered complexes and secondary rutile in porphyry copper and hydrothermal
gold deposits. Where rutile growth is related to formation of mineral deposits, rutile can be expected to contain >1%
of V, Nb, Sn, Sb and/or W as major components (see Rice et al. 1998). Rutiles from kimberlitic sources are also
diagnostic, being highly enriched in Nb and/or Cr (always >1%, up to 21% Nb2O5 and 7% Cr2O3; Haggerty 1991).
Hydrothermal quartz veins are a potential, though minor, source for trace element poor rutile. Brenan et al. (1994)
measured one rutile from a high pressure quartz vein that contains only 50 ppm Nb and explained this low
concentrations by a low capacity of fluids for transporting high field strength elements. Our investigated rutile from
Disentis also originated in a hydrothermal quartz vein and supports the observation of Brenan et al. that rutiles from
hydrothermal quartz veins are low in Nb (ca. 150 ppm).
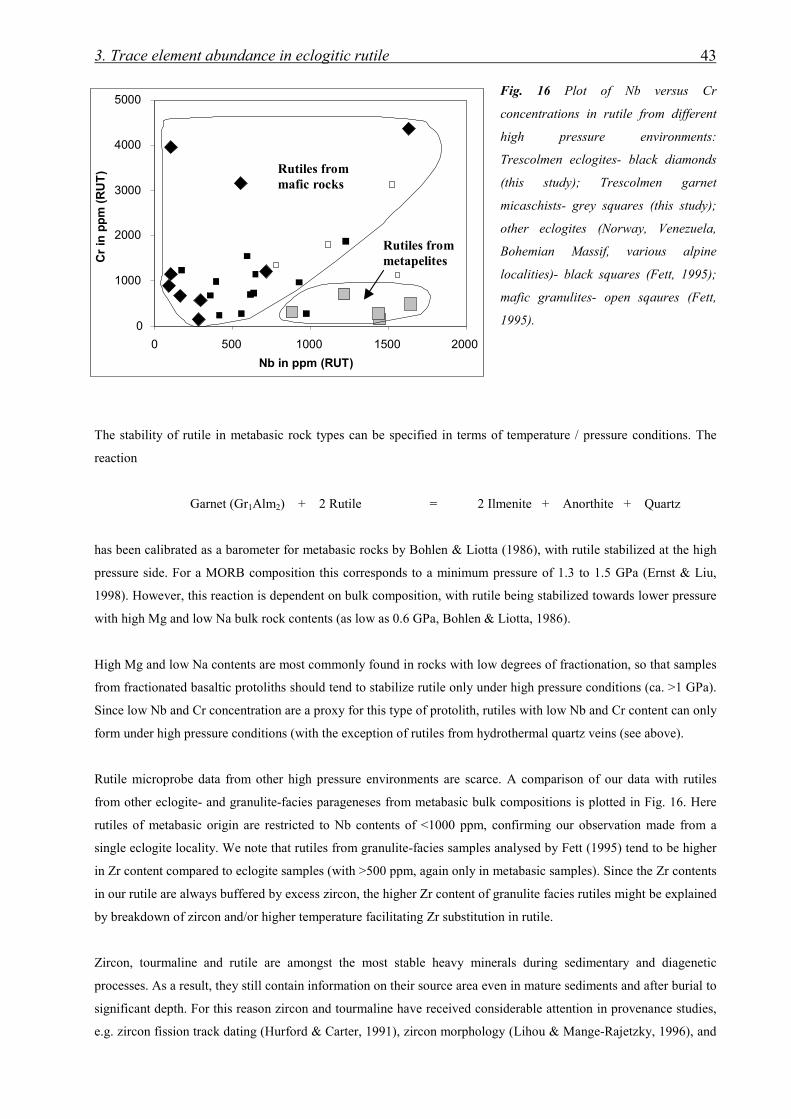
3. Trace element abundance in eclogitic rutile 43
Fig. 16 Plot of Nb versus Cr
concentrations in rutile from different
high pressure environments:
Trescolmen eclogites- black diamonds
(this study); Trescolmen garnet
micaschists- grey squares (this study);
other eclogites (Norway, Venezuela,
Bohemian Massif, various alpine
localities)- black squares (Fett, 1995);
mafic granulites- open sqaures (Fett,
1995).
The stability of rutile in metabasic rock types can be specified in terms of temperature / pressure conditions. The
reaction
Garnet (Gr1Alm2) + 2 Rutile = 2 Ilmenite + Anorthite + Quartz
has been calibrated as a barometer for metabasic rocks by Bohlen & Liotta (1986), with rutile stabilized at the high
pressure side. For a MORB composition this corresponds to a minimum pressure of 1.3 to 1.5 GPa (Ernst & Liu,
1998). However, this reaction is dependent on bulk composition, with rutile being stabilized towards lower pressure
with high Mg and low Na bulk rock contents (as low as 0.6 GPa, Bohlen & Liotta, 1986).
High Mg and low Na contents are most commonly found in rocks with low degrees of fractionation, so that samples
from fractionated basaltic protoliths should tend to stabilize rutile only under high pressure conditions (ca. >1 GPa).
Since low Nb and Cr concentration are a proxy for this type of protolith, rutiles with low Nb and Cr content can only
form under high pressure conditions (with the exception of rutiles from hydrothermal quartz veins (see above).
Rutile microprobe data from other high pressure environments are scarce. A comparison of our data with rutiles
from other eclogite- and granulite-facies parageneses from metabasic bulk compositions is plotted in Fig. 16. Here
rutiles of metabasic origin are restricted to Nb contents of <1000 ppm, confirming our observation made from a
single eclogite locality. We note that rutiles from granulite-facies samples analysed by Fett (1995) tend to be higher
in Zr content compared to eclogite samples (with >500 ppm, again only in metabasic samples). Since the Zr contents
in our rutile are always buffered by excess zircon, the higher Zr content of granulite facies rutiles might be explained
by breakdown of zircon and/or higher temperature facilitating Zr substitution in rutile.
Zircon, tourmaline and rutile are amongst the most stable heavy minerals during sedimentary and diagenetic
processes. As a result, they still contain information on their source area even in mature sediments and after burial to
significant depth. For this reason zircon and tourmaline have received considerable attention in provenance studies,
e.g. zircon fission track dating (Hurford & Carter, 1991), zircon morphology (Lihou & Mange-Rajetzky, 1996), and
0
1000
2000
3000
4000
5000
0 500 1000 1500 2000
Nb in ppm (RUT)
Cr
in p
pm
(R
UT
) Rutiles frommafic rocks
Rutiles frommetapelites
3. Trace element abundance in eclogitic rutile 44
tourmaline chemistry (see Morton, 1991). Although it is well known that major and trace element compositions of
single heavy minerals may contain crucial information on their former source rock (Morton, 1991), to our
knowledge studies of chemical variations among detrital rutile grains have only been performed in one study by
Preston et al. (1998). Here, detrital rutile fractions with high Nb content have been used to correlate oil-bearing
sandstone layers in fossil-barren red-bed sequences.
We predict that trace element contents in detrital rutile will yield valuable provenance information since we have
shown that chemical variations in rutile are large and can be highly diagnostic for its source rock. The chemical
analysis of detrital rutile may offer several advantages. First, although rutile may be resistant during diagenesis and
even during very low grade metamorphism, it has not been observed in low to medium grade metamorphic rocks,
e.g. in pelites from the biotite zone up to the staurolite zone (Force, 1980). This distinguishes rutile from zircon, core
compositions of which can survive several metamorphic cycles. Despite this, rutile chemistry always records its last
metamorphic signature (closure temperature for the U/Pb system ≤400oC, Mezger et al., 1989). Second, several key
elements in rutile are relatively easily and rapidly analysed with a modern electron microprobe. For example, to find
populations of low Nb-Cr-rutile, 60 different grains can be measured per hour (to detect 1000 ppm of Nb, peak
counting times of only 20 sec. are required at 20 kV). And finally, sufficient amounts of U in rutile allow single
grain dating of representative samples from different populations with the SHRIMP technique (Sircombe, 1996),
greatly enhancing the specifics in localizing source areas.
3.4.2 Role of rutile in subduction zones
Rutile may play a key role in subduction zone processes in retaining high field strength elements (HFSE) during
dehydration reactions, thereby explaining the omnipresent negative Nb-anomalies in island arc volcanoes (Nicholls
& Ringwood, 1973; Saunders et al., 1980). For this reason intensive studies have focussed on the partitioning
behaviour of a number of trace elements (Nb, Ta, Zr, Hf, U, Th) between rutile and fluid (Brenan et al., 1994;
Stalder et al., 1998) as well as between rutile and melt (Jenner et al., 1993) These experimental results are
essentially consistent with earlier models showing that Nb and Ta behave as highly compatible elements in the
presence of rutile.
Zr and Hf are not considered in the following discussion since they are expected to be controlled by zircon and not
by rutile (Fig. 14). However, we point out that subduction zone dehydration models for Zr and Hf based on
rutile/fluid partition coefficients must, therefore, yield erroneous results. The incorporation of zircon in dehydration
models might lead to an explanation of why island arc magmas almost always show negative Nb-Ta anomalies, but
sometimes lack negative Zr-Hf anomalies (Briqueu et al., 1984).
Nb/Ta ratios have recently received considerable attention following the finding that these elements maybe
significantly fractionated from each other by Ti-rich phases (Green & Pearson, 1987; Brenan et al., 1994).
Subduction-related rocks have Nb/Ta ratios spanning a range from subchondritic to superchondritic (8-33; Stolz et
al., 1996; Münker, 1998) and seem to follow at least two different trends (Münker, 1998). The interpretation,
however, is controversial. Green (1995) and Münker (1998) referred to the difference of DNb/DTa partition
3. Trace element abundance in eclogitic rutile 45
coefficients between rutile/fluid and rutile/melt, where the presence of rutile produced melts with elevated Nb/Ta
and fluids with lowered Nb/Ta ratios. Stolz et al. (1996) also favoured the argument that elevated Nb/Ta ratios in
high-K lavas were produced by a melt component from the subducted slab, and in addition they questioned the
capacity of fluids to change significantly the Nb/Ta ratio in the source area of more common low-K and calc-
alkaline lavas. Low Nb/Ta ratios can be explained by re-melting of already depleted mantle (Eggins et al., 1997),
where a difference in DNb/DTa between clinopyroxene and melt (Jenner et al., 1993) causes a lowering of the Nb/Ta
ratio in the residuum. The key difference between the two models is that fluid loss from subducting oceanic crust
will either produce a superchondritic Nb/Ta ratio in the eclogitic residuum in the former case, but will leave no
impact in the latter case. Our data seem to support the latter model. Starting from a low-temperature hydrothermally
altered basalt (Chapter 2), we infer that eclogites from Trescolmen have lost between 2-4% H2O by dehydration
(Schmidt & Poli, 1998), similar to subducted oceanic crust underneath volcanic arcs. Rutiles from this locality have
largely chondritic or slightly subchondritic Nb/Ta ratios, with an average of 17.4 (Table 4). One sample (77-5) has a
significantly higher Nb/Ta ratio of 31.7 and excluding this sample we obtain an average value of only 15.9, with a
range of 9 eclogitic rutiles from 13.6 to 17.4. This value is identical to Nb/Ta ratios from rutiles in similar
continental settings (16.0; Rudnick, 1998). However, superchondritic rutiles (with a median Nb/Ta ratio of 33)
supporting the first model have been found in eclogitic xenoliths (Rudnick, 1998) so the debate remains open.
As pointed out by Fitton (1995) and McDonough (1999), Nb and Ta systematics tell only part of the rutile story
since rutile can also be important for other HFSE. We have shown that besides Nb and Ta, rutile is an important
phase for Sb, W, Mo and Sn in metabasitic and -pelitic systems at conditions relevant for subducting slabs
underneath volcanic arcs (Schmidt & Poli 1998). From the elastic strain model of Blundy & Wood (1994) and
Beattie (1994), it should be expected that in terms of rutile-fluid partitioning, Nb, Ta, Sb (and W?) behave as one
group and Mo and Sn as another group in subduction zone environments, taking into consideration ionic radius and
charge (Fig. 9). This would be consistent with the trace element systematics of sample 50-13, as described earlier
(Fig. 14). Nevertheless, this applies only as long as the crystal structure dominates the trace element partitioning e.g.
in rock samples with several solid phases.
We can now investigate the behaviour of the extended HFSE group in subduction zones with respect to the role of
rutile. Fitton (1995) showed that subduction-related lavas from the western US are strongly depleted in Nb and Mo
compared to similarly incompatible elements (La, Nd), as well as being highly correlated with each other, and
concluded that rutile retains both Nb and Mo in the downgoing slab during dehydration. No clear trend can be found
for Sn and W in subduction-related lavas, showing neither pronounced enrichment nor depletion in terms of Sn/Sm
and W/Th ratios (Jochum et al., 1993; Noll et al., 1996). Instead Sb is one of the most enriched elements in volcanic
arc rocks in terms of its ratio with Pr and follows similar enrichment trends to B, As, Tl and Pb (Ryan et al., 1995;
Noll et al., 1996; Jochum & Hofmann, 1997).
Trace elements enriched in volcanic arc rocks are inferred to be carried by a fluid from the dehydrating slab.
Assuming that light REE (LREE, La-Sm) as well as Th are moderately mobilized in these fluids (Brenan et al.,
1995, Stalder et al., 1998), it can be said that Nb, Ta and Mo are less enriched in the fluid, Sn and W similarly, and
Sb highly enriched compared to corresponding LREE (and Th). Sb is highly enriched in pelagic sediment and
altered oceanic crust (Jochum & Verma, 1996), both likely source rocks for fluids in dehydrating slabs. Nevertheless
high Sb concentration in the fluid caused only by an anomalously enriched source can be ruled out for the following

3. Trace element abundance in eclogitic rutile 46
reason. If Sb were as mobile or even less mobile than LREE in dehydrating fluids, Sb/LREE ratios would be
expected to be higher than in MORB, but should stay constant (or slightly increase) in across-arc traverses, as
normally observed for Nb/La ratios. However, the contrary is observed in across-arc studies, where Ryan et al.
(1995) and Noll et al. (1996) showed for the Japan and Kurile arc transects that Sb/Ce ratios continuously decrease
in volcanic arc rocks with increasing depths to the subducting slab.
Combining the observations of subduction zone studies with our own results, we can conclude that neither an
enriched source area nor the mineral assemblage of the downgoing slab (dominated by rutile) can be solely
responsible for the extreme enrichments of Sb in subduction-related magmas. An alternative might be found in the
behaviour of the aqueous fluid itself, with the ability to fractionate Sb from Nb, which otherwise show similar
partitioning behaviour in eclogite assemblages and are not fractionated from each other in magmatic systems.
Experimental studies on rutile/fluid partitioning of the extended HFSE group are required to test such a statement
and should give some highly desired insight on fluid behaviour under upper mantle conditions. Rutile/fluid
experiments would have the advantage of forming a relatively simple system stable under a wide range of PT-
conditions. One of the most challenging questions concerns whether complexing systematics in low pressure
environments can be applied to upper mantle conditions. Noll et al. (1996) discussed the complexing properties of
Mo, Sn, W and Sb, and concluded that subduction zone systematics could be explained by preferentially
transporting Sb in a H2S-rich and Cl-poor, reducing and acidic hydrothermal fluid. This is problematic with respect
to the observation of Cl-enrichment in island arc volcanics in relation to MORB (Ito et al., 1983) and calculations of
Manning (1998) that showed that high pressure fluids in equilibrium with blueschists/eclogites have rather basic
properties. Nevertheless, this discussion shows the prospect of characterizing fluid properties coming from
dehydrating oceanic crust and better evaluating the role of rutile in fractionating element ratios on a global scale.

4. Trace element partitioning values for subduction zone modelling 47
Chapter 4. Evaluating hydrous eclogites from Trescolmenfor their use of deriving trace element partitioningvalues for subduction zone modelling
4.1 Introduction
Experimentally determined trace element partition coefficients between mineral and fluid (DMin/Fluid) have been used
extensively to characterize the trace element composition of fluids emanating from subducting oceanic crust
undergoing prograde dehydration reactions (e.g. Brenan et al., 1995a, 1998; Ayers et al., 1997; Stalder et al., 1998).
Although estimates of DMin/Fluid for a range of minerals and trace elements exist, there are no data for phases relevant
for subducting oceanic crust other than clinopyroxene, garnet, amphibole, apatite and rutile (Ayers & Watson, 1993;
Brenan et al., 1994, 1995a, b, 1998; Ayers et al., 1997; Stalder et al. 1998; Melzer et al., 1998; Najorka et al., 1999).
Additionally, experimental data for phengite/fluid partitioning for Cs and Rb have also been obtained (Beswick,
1973; Volfinger, 1976; Melzer & Wunder, 1999).
However, phase relations in metabasaltic assemblages (only one component of the oceanic crust) are considerably
more complex. In a review of their experimental results, Schmidt & Poli (1998) listed, in addition to amphibole and
phengite, also chlorite, lawsonite, zoisite, paragonite, chloritoid and talc as relevant hydrous phases in mafic systems
undergoing subduction. For the latter phases, there are currently no estimates for mineral/fluid partitioning
behaviour and neglecting these phases in subduction zone models can severely affect any calculation regarding the
fluid composition from dehydrating slabs.
A potentially powerful tool to overcome the lack of experimental mineral/fluid values is to combine experimentally
determined DMin1/Fluid (e.g. clinopyroxene as Min1) with measured DMin1/Min2 (Min2 being a phase for which no
partitioning data are currently available) in natural systems that are appropriate for subduction zone environments,
such as blueschist- and eclogite-facies assemblages (Zack & Foley, 1997; Brenan et al., 1998). Although time scales
in natural metamorphic systems are several orders of magnitude longer than in any experiment, the major drawbacks
to deriving meaningful partition coefficients between different phases are nevertheless sluggish reaction rates. For
instance, convincing examples of disequilibrium processes were found in trace element zoning studies of garnet
(Hickmott & Shimizu, 1990). They inferred that trace-element-enriched surface layers were trapped in the crystal
structure in certain metamorphic environments, leading to a disequilibrium pattern (see also Watson, 1996).
Additionally, Getty & Selverstone (1994) used trace element partition coefficients calculated from coexisting phases
to argue against attainment of equilibrium in Tauern eclogites. However, an increasing number of studies have
demonstrated that a close approach to equilibrium was reached in other cases for a range of trace elements in
different assemblages (Messiga et al., 1995; Yang et al., 1999; Kretz et al., 1999).
4. Trace element partitioning values for subduction zone modelling 48
In this chapter, data is presented from a suite of eclogite-facies samples where strong evidence exists for a close
approach to equilibrium at the trace element level. The eclogite locality at Trescolmen was chosen because of its
extensive record of previous investigation (Heinrich 1982, 1986; Santini, 1992; Meyre & Puschnig, 1993; Meyre et
al., 1997, 1999; Meyre & Frey, 1998; Chapter 2) and because of the widespread occurrence of well crystallized
hydrous high pressure phases such as amphibole, phengite, paragonite, zoisite, talc and apatite.
The aim is to present a reliable set of Min/clinopyroxene values (where Min= amphibole, phengite, zoisite,
paragonite and apatite) that can be combined with experimental DClinopyroxene/Fluid values for application to subduction
zone modelling, since clinopyroxene is the phase most intensively studied in terms of mineral/fluid partition
coefficients (Brenan et al., 1995a, b, 1998; Ayers et al., 1997; Stalder et al. 1998). LAM analyses are therefore
limited to trace elements that have attracted most attention in subduction zone studies and for which DClinopyroxene/Fluid
values are already available (i.e. Li, Be, B, Sr, Y, Zr, Nb, Ba, Ce, Nd, Sm, Pb, Th, U). A discussion of other
subduction-relevant trace elements from the same sample suite has been presented in Chapter 2 concerning phengite
systematics (Cs, Rb; Chapter 2) and in Chapter 3 concerning rutile systematics (Sb, W, Sn, Mo; Chapter 3).
A wide range of techniques was applied including careful petrographic observation, high resolution back scattered
imaging, thin section mapping, whole rock XRF and solution-ICP-MS analysis, and quantitative electron
microprobe and laser ablation microprobe-ICP-MS (LAM) analysis of major and trace element composition of
selected phases. This integrated approach allows it to develop textural and chemical criteria for the recognition of
equilibrium in metamorphic samples. Finally attention is drawn to the fact that once the equilibrium partition
coefficients are known, partitioning data can yield information about the crystallization history of assemblages that
have not attained full trace element equilibration.
4.2 Analytical methods
Major and minor elements in the different phases were measured with a Cameca SX51 electron microprobe in
Heidelberg and a JEOL JXA 8900 RL electron microprobe in Göttingen, both equipped with five WDS
spectrometers and synthetic mineral standards. Specific details about measurement conditions for amphibole and
phengite can be found in Chapter 2. For routine analysis and small scale variation measurements, operating
conditions were 15 kV acceleration voltage, 12 nA beam current on the Faraday cup, 1-5 µm beam diameter and 15-
30 seconds counting time on the peak of all measured elements. A PAP correction for the Heidelberg microprobe
and a phi-rho-zeta correction for the Göttingen microprobe was applied to process the raw counts. For a subset of
clinopyroxene and garnet analyses, operating conditions were optimized for minor elements (Mn, Cr, Ti).
Acceleration voltage was increased to 20 kV, beam current to 80 nA, beam diameter to 10 µm and counting times
on the peak were 15 s for Na, Ca, K, Fe, 30 s for Al, Si, Mg, Mn and 60 s for Cr, Ti. Even at these high energies, no
loss of Na in clinopyroxene was observed compared to normal operating conditions. Under the conditions described,
Ti in clinopyroxene and garnet were measured with a precision of better than 5% for concentrations above 300 ppm.
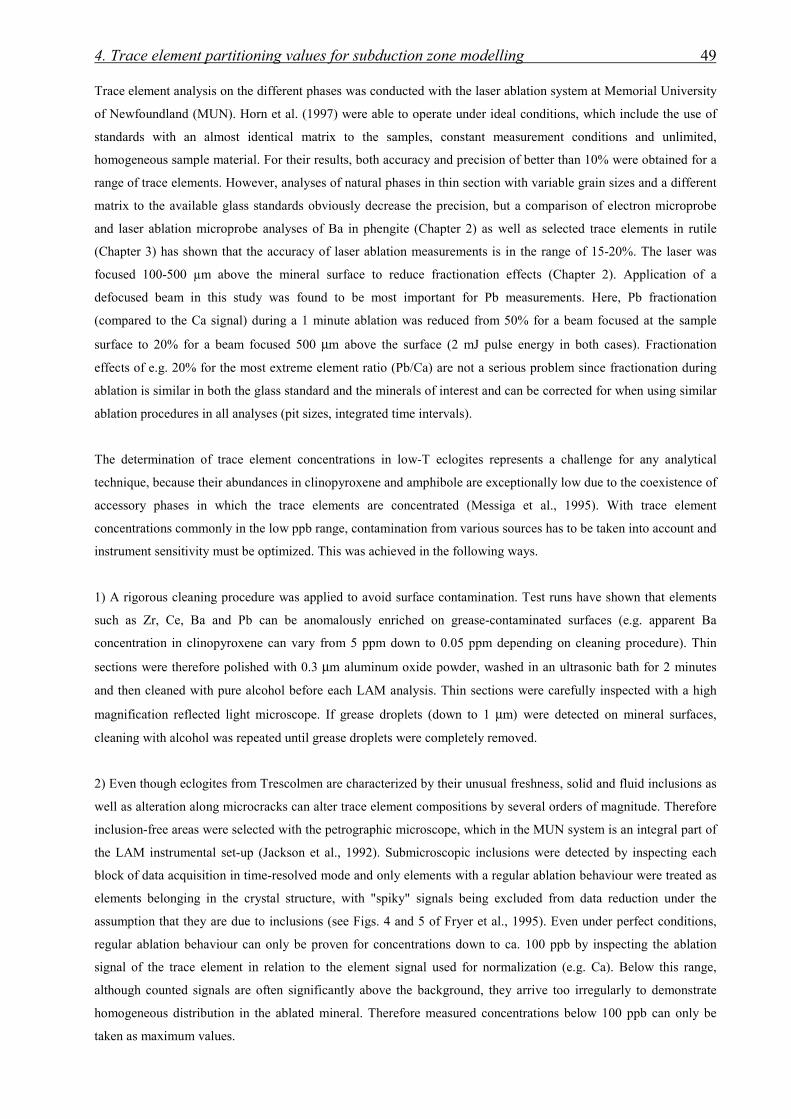
4. Trace element partitioning values for subduction zone modelling 49
Trace element analysis on the different phases was conducted with the laser ablation system at Memorial University
of Newfoundland (MUN). Horn et al. (1997) were able to operate under ideal conditions, which include the use of
standards with an almost identical matrix to the samples, constant measurement conditions and unlimited,
homogeneous sample material. For their results, both accuracy and precision of better than 10% were obtained for a
range of trace elements. However, analyses of natural phases in thin section with variable grain sizes and a different
matrix to the available glass standards obviously decrease the precision, but a comparison of electron microprobe
and laser ablation microprobe analyses of Ba in phengite (Chapter 2) as well as selected trace elements in rutile
(Chapter 3) has shown that the accuracy of laser ablation measurements is in the range of 15-20%. The laser was
focused 100-500 µm above the mineral surface to reduce fractionation effects (Chapter 2). Application of a
defocused beam in this study was found to be most important for Pb measurements. Here, Pb fractionation
(compared to the Ca signal) during a 1 minute ablation was reduced from 50% for a beam focused at the sample
surface to 20% for a beam focused 500 µm above the surface (2 mJ pulse energy in both cases). Fractionation
effects of e.g. 20% for the most extreme element ratio (Pb/Ca) are not a serious problem since fractionation during
ablation is similar in both the glass standard and the minerals of interest and can be corrected for when using similar
ablation procedures in all analyses (pit sizes, integrated time intervals).
The determination of trace element concentrations in low-T eclogites represents a challenge for any analytical
technique, because their abundances in clinopyroxene and amphibole are exceptionally low due to the coexistence of
accessory phases in which the trace elements are concentrated (Messiga et al., 1995). With trace element
concentrations commonly in the low ppb range, contamination from various sources has to be taken into account and
instrument sensitivity must be optimized. This was achieved in the following ways.
1) A rigorous cleaning procedure was applied to avoid surface contamination. Test runs have shown that elements
such as Zr, Ce, Ba and Pb can be anomalously enriched on grease-contaminated surfaces (e.g. apparent Ba
concentration in clinopyroxene can vary from 5 ppm down to 0.05 ppm depending on cleaning procedure). Thin
sections were therefore polished with 0.3 µm aluminum oxide powder, washed in an ultrasonic bath for 2 minutes
and then cleaned with pure alcohol before each LAM analysis. Thin sections were carefully inspected with a high
magnification reflected light microscope. If grease droplets (down to 1 µm) were detected on mineral surfaces,
cleaning with alcohol was repeated until grease droplets were completely removed.
2) Even though eclogites from Trescolmen are characterized by their unusual freshness, solid and fluid inclusions as
well as alteration along microcracks can alter trace element compositions by several orders of magnitude. Therefore
inclusion-free areas were selected with the petrographic microscope, which in the MUN system is an integral part of
the LAM instrumental set-up (Jackson et al., 1992). Submicroscopic inclusions were detected by inspecting each
block of data acquisition in time-resolved mode and only elements with a regular ablation behaviour were treated as
elements belonging in the crystal structure, with "spiky" signals being excluded from data reduction under the
assumption that they are due to inclusions (see Figs. 4 and 5 of Fryer et al., 1995). Even under perfect conditions,
regular ablation behaviour can only be proven for concentrations down to ca. 100 ppb by inspecting the ablation
signal of the trace element in relation to the element signal used for normalization (e.g. Ca). Below this range,
although counted signals are often significantly above the background, they arrive too irregularly to demonstrate
homogeneous distribution in the ablated mineral. Therefore measured concentrations below 100 ppb can only be
taken as maximum values.
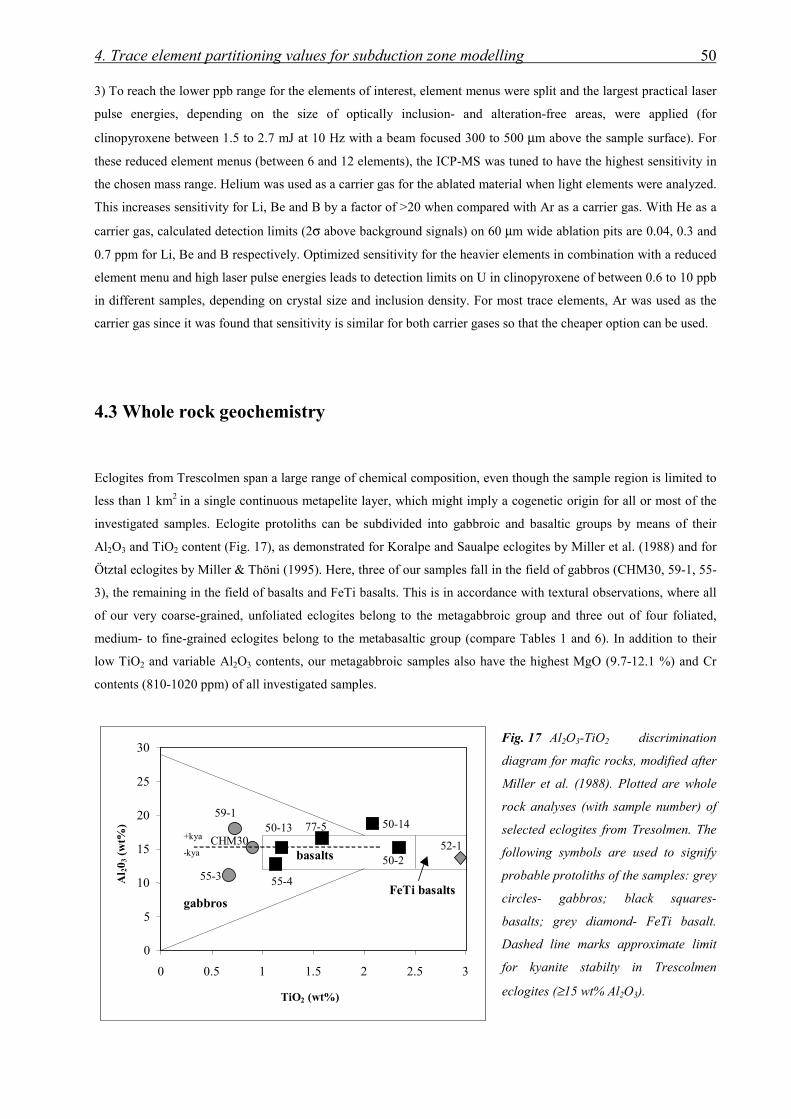
4. Trace element partitioning values for subduction zone modelling 50
3) To reach the lower ppb range for the elements of interest, element menus were split and the largest practical laser
pulse energies, depending on the size of optically inclusion- and alteration-free areas, were applied (for
clinopyroxene between 1.5 to 2.7 mJ at 10 Hz with a beam focused 300 to 500 µm above the sample surface). For
these reduced element menus (between 6 and 12 elements), the ICP-MS was tuned to have the highest sensitivity in
the chosen mass range. Helium was used as a carrier gas for the ablated material when light elements were analyzed.
This increases sensitivity for Li, Be and B by a factor of >20 when compared with Ar as a carrier gas. With He as a
carrier gas, calculated detection limits (2σ above background signals) on 60 µm wide ablation pits are 0.04, 0.3 and
0.7 ppm for Li, Be and B respectively. Optimized sensitivity for the heavier elements in combination with a reduced
element menu and high laser pulse energies leads to detection limits on U in clinopyroxene of between 0.6 to 10 ppb
in different samples, depending on crystal size and inclusion density. For most trace elements, Ar was used as the
carrier gas since it was found that sensitivity is similar for both carrier gases so that the cheaper option can be used.
4.3 Whole rock geochemistry
Eclogites from Trescolmen span a large range of chemical composition, even though the sample region is limited to
less than 1 km2 in a single continuous metapelite layer, which might imply a cogenetic origin for all or most of the
investigated samples. Eclogite protoliths can be subdivided into gabbroic and basaltic groups by means of their
Al2O3 and TiO2 content (Fig. 17), as demonstrated for Koralpe and Saualpe eclogites by Miller et al. (1988) and for
Ötztal eclogites by Miller & Thöni (1995). Here, three of our samples fall in the field of gabbros (CHM30, 59-1, 55-
3), the remaining in the field of basalts and FeTi basalts. This is in accordance with textural observations, where all
of our very coarse-grained, unfoliated eclogites belong to the metagabbroic group and three out of four foliated,
medium- to fine-grained eclogites belong to the metabasaltic group (compare Tables 1 and 6). In addition to their
low TiO2 and variable Al2O3 contents, our metagabbroic samples also have the highest MgO (9.7-12.1 %) and Cr
contents (810-1020 ppm) of all investigated samples.
Fig. 17 Al2O3-TiO2 discrimination
diagram for mafic rocks, modified after
Miller et al. (1988). Plotted are whole
rock analyses (with sample number) of
selected eclogites from Tresolmen. The
following symbols are used to signify
probable protoliths of the samples: grey
circles- gabbros; black squares-
basalts; grey diamond- FeTi basalt.
Dashed line marks approximate limit
for kyanite stabilty in Trescolmen
eclogites (≥15 wt% Al2O3).
59-1
55-3 55-4
50-13CHM30
77-5 50-14
50-252-1
0
5
10
15
20
25
30
0 0.5 1 1.5 2 2.5 3
TiO2 (wt%)
Al 2
0 3 (
wt%
)
basalts
gabbrosFeTi basalts
+kya
-kya

4. Trace element partitioning values for subduction zone modelling 51
Table 6. Whole rock geochemical data of selected eclogite samples. Samples are ordered by increasing TiO2
content, for the classification see Fig. 17.
metagabbros metabasalts FeTimetabasalt
55-3 59-1 CHM30 55-4 50-13 77-5 50-14 50-2 52-1
SiO2 (XRF) 53.15 47.75 49.22 52.20 48.87 46.42 46.20 47.92 48.86
TiO2 0.67 0.73 0.90 1.13 1.19 1.58 2.08 2.34 2.95
Al2O3 11.15 18.14 15.29 12.88 15.25 16.64 18.85 15.26 13.66
FeO(total) 7.70 8.11 7.86 8.74 7.72 9.59 11.56 12.38 14.18MnO 0.20 0.15 0.15 0.24 0.14 0.16 0.20 0.21 0.27MgO 12.09 11.31 9.69 9.51 8.63 6.77 5.40 7.33 5.68CaO 9.31 10.31 12.22 12.33 10.61 13.63 9.00 7.98 10.20Na2O 3.35 2.64 2.66 2.34 4.00 2.64 4.50 3.70 2.25
K2O 0.43 0.01 0.02 0.05 0.57 0.16 0.04 0.04 0.01
P2O5 0.11 0.075 0.1 0.13 0.18 0.08 1.27 0.19 0.23
Zr 71 34 53 55 93 93 111 182 403Cr 1021 813 815 664 460 276 244 221 109
Li (ICP) 41.0 13.4 13.2 16.9 18.7 18.2 21.4 16.5 7.1Sr 68 71 383 99 111 243 267 136 279Y 15.9 16.0 14.6 17.3 19.2 28.4 41.0 41.2 51.6Ba 47.5 2.13 1.61 3.92 65.1 15.9 3.59 7.30 0.25Ce 30.0 6.40 12.1 11.9 21.8 10.1 17.6 16.5 4.95Nd 15.8 5.68 7.87 6.97 13.4 10.4 17.4 13.0 5.02Sm 3.44 1.74 2.05 1.77 3.60 3.81 7.03 4.27 2.77Pb 3.05 3.08 15.7 4.45 3.98 2.57 3.81 4.28 6.39Th 3.45 0.16 0.46 0.60 0.82 0.18 0.67 0.65 0.25U 0.86 0.34 0.17 0.070 0.39 0.61 0.34 0.29 0.044
CaO/Na2O 5.3 2.7 5.2 2.0 2.2 4.5
Ti/Zr 122 76 102 112 77 44
In the following, the close chemical similarity between Trescolmen metabasaltic eclogites and mid ocean ridge
(MOR)-type basalts is demonstrated. Note that we use the term "mid ocean ridge" to describe the tectonic setting
(e.g., as opposed to continental rifting) and the term "MOR-type basalts" in a chemical classification sense (e.g., as
opposed to OIB). To classify eclogites on a chemical basis, the assumption is made that all metamorphic processes
occurred largely isochemically, at least for major and immobile trace elements. On the basis of Na2O-CaO
relationships, our basaltic samples may have been affected by weak spilitization, with two samples (50-2 and 50-14)
having CaO/Na2O ratios below 2.5 (see Table 6), an arbitrary limit set for spilites by Graham (1976). Ti, Zr, Y and
Sr are most widely used to discriminate the tectonomagmatic setting of basaltic rocks and their metamorphic
equivalents (Pearce & Cann, 1973). According to Pearce & Cann (1973), only basalts with 12% < MgO + CaO <
20% should be used. However, two of our samples (77-5 and 55-4) have slightly higher concentrations (20.4 and
21.8% respectively). These samples are marked separately in the following figures to demonstrate consistency of
chemical behaviour with the other samples. To screen highly fractionated basalts from more primitive ones,
Winchester & Floyd (1977) used Ti-Zr relationships, with a Ti/Zr cut-off ratio below 50. Only one of our
metabasalts (sample 52-1), has a lower Ti/Zr ratio (43), with all other samples having ratios between 76 and 122.
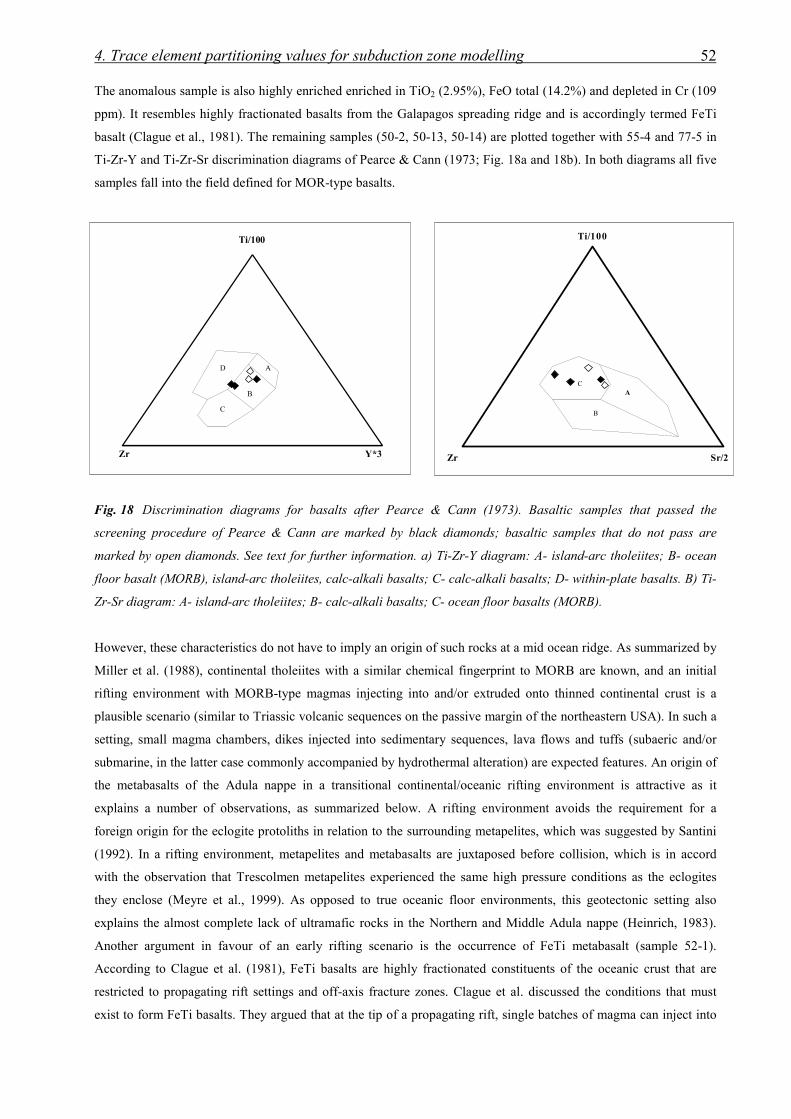
4. Trace element partitioning values for subduction zone modelling 52
The anomalous sample is also highly enriched enriched in TiO2 (2.95%), FeO total (14.2%) and depleted in Cr (109
ppm). It resembles highly fractionated basalts from the Galapagos spreading ridge and is accordingly termed FeTi
basalt (Clague et al., 1981). The remaining samples (50-2, 50-13, 50-14) are plotted together with 55-4 and 77-5 in
Ti-Zr-Y and Ti-Zr-Sr discrimination diagrams of Pearce & Cann (1973; Fig. 18a and 18b). In both diagrams all five
samples fall into the field defined for MOR-type basalts.
Fig. 18 Discrimination diagrams for basalts after Pearce & Cann (1973). Basaltic samples that passed the
screening procedure of Pearce & Cann are marked by black diamonds; basaltic samples that do not pass are
marked by open diamonds. See text for further information. a) Ti-Zr-Y diagram: A- island-arc tholeiites; B- ocean
floor basalt (MORB), island-arc tholeiites, calc-alkali basalts; C- calc-alkali basalts; D- within-plate basalts. B) Ti-
Zr-Sr diagram: A- island-arc tholeiites; B- calc-alkali basalts; C- ocean floor basalts (MORB).
However, these characteristics do not have to imply an origin of such rocks at a mid ocean ridge. As summarized by
Miller et al. (1988), continental tholeiites with a similar chemical fingerprint to MORB are known, and an initial
rifting environment with MORB-type magmas injecting into and/or extruded onto thinned continental crust is a
plausible scenario (similar to Triassic volcanic sequences on the passive margin of the northeastern USA). In such a
setting, small magma chambers, dikes injected into sedimentary sequences, lava flows and tuffs (subaeric and/or
submarine, in the latter case commonly accompanied by hydrothermal alteration) are expected features. An origin of
the metabasalts of the Adula nappe in a transitional continental/oceanic rifting environment is attractive as it
explains a number of observations, as summarized below. A rifting environment avoids the requirement for a
foreign origin for the eclogite protoliths in relation to the surrounding metapelites, which was suggested by Santini
(1992). In a rifting environment, metapelites and metabasalts are juxtaposed before collision, which is in accord
with the observation that Trescolmen metapelites experienced the same high pressure conditions as the eclogites
they enclose (Meyre et al., 1999). As opposed to true oceanic floor environments, this geotectonic setting also
explains the almost complete lack of ultramafic rocks in the Northern and Middle Adula nappe (Heinrich, 1983).
Another argument in favour of an early rifting scenario is the occurrence of FeTi metabasalt (sample 52-1).
According to Clague et al. (1981), FeTi basalts are highly fractionated constituents of the oceanic crust that are
restricted to propagating rift settings and off-axis fracture zones. Clague et al. discussed the conditions that must
exist to form FeTi basalts. They argued that at the tip of a propagating rift, single batches of magma can inject into
0
10
20
30
40
50
60
70
80
90
100
0 20 40 60 80 100
Ti/100
Y*3Zr
A
B
C
D
0
10
20
30
40
50
60
70
80
90
100
0 20 40 60 80 100
Ti/100
Zr Sr/2
A
B
C
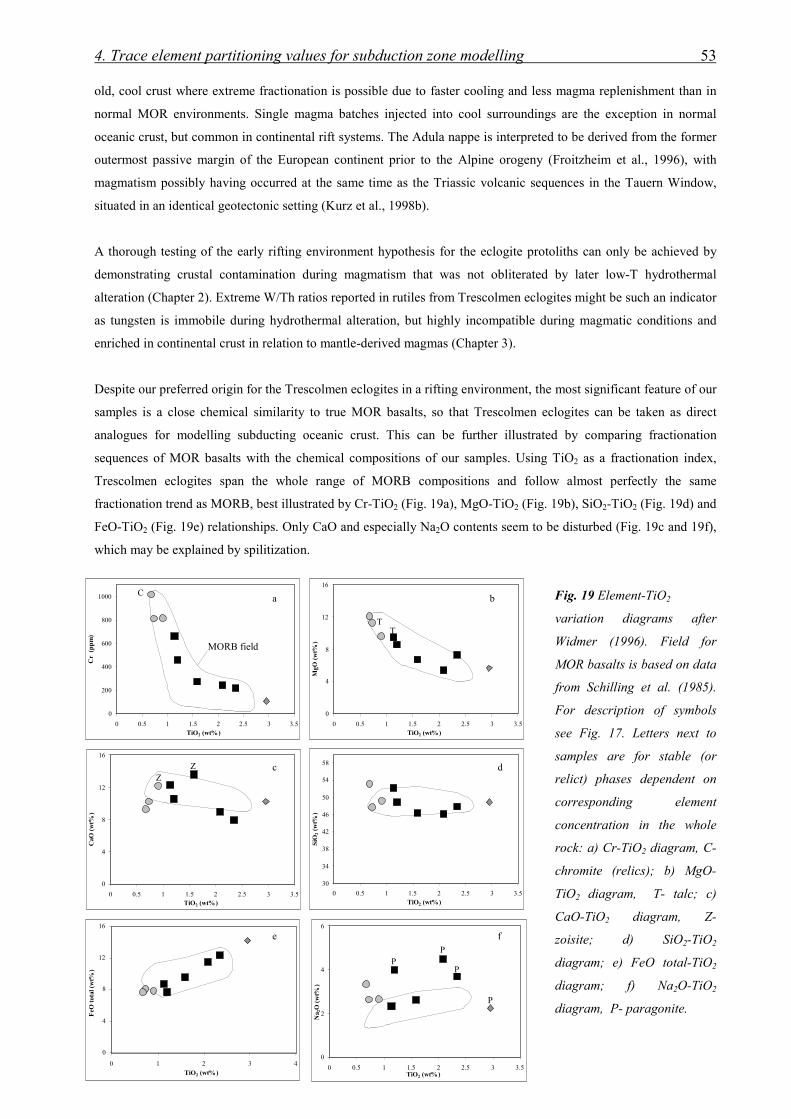
4. Trace element partitioning values for subduction zone modelling 53
old, cool crust where extreme fractionation is possible due to faster cooling and less magma replenishment than in
normal MOR environments. Single magma batches injected into cool surroundings are the exception in normal
oceanic crust, but common in continental rift systems. The Adula nappe is interpreted to be derived from the former
outermost passive margin of the European continent prior to the Alpine orogeny (Froitzheim et al., 1996), with
magmatism possibly having occurred at the same time as the Triassic volcanic sequences in the Tauern Window,
situated in an identical geotectonic setting (Kurz et al., 1998b).
A thorough testing of the early rifting environment hypothesis for the eclogite protoliths can only be achieved by
demonstrating crustal contamination during magmatism that was not obliterated by later low-T hydrothermal
alteration (Chapter 2). Extreme W/Th ratios reported in rutiles from Trescolmen eclogites might be such an indicator
as tungsten is immobile during hydrothermal alteration, but highly incompatible during magmatic conditions and
enriched in continental crust in relation to mantle-derived magmas (Chapter 3).
Despite our preferred origin for the Trescolmen eclogites in a rifting environment, the most significant feature of our
samples is a close chemical similarity to true MOR basalts, so that Trescolmen eclogites can be taken as direct
analogues for modelling subducting oceanic crust. This can be further illustrated by comparing fractionation
sequences of MOR basalts with the chemical compositions of our samples. Using TiO2 as a fractionation index,
Trescolmen eclogites span the whole range of MORB compositions and follow almost perfectly the same
fractionation trend as MORB, best illustrated by Cr-TiO2 (Fig. 19a), MgO-TiO2 (Fig. 19b), SiO2-TiO2 (Fig. 19d) and
FeO-TiO2 (Fig. 19e) relationships. Only CaO and especially Na2O contents seem to be disturbed (Fig. 19c and 19f),
which may be explained by spilitization.
Fig. 19 Element-TiO2
variation diagrams after
Widmer (1996). Field for
MOR basalts is based on data
from Schilling et al. (1985).
For description of symbols
see Fig. 17. Letters next to
samples are for stable (or
relict) phases dependent on
corresponding element
concentration in the whole
rock: a) Cr-TiO2 diagram, C-
chromite (relics); b) MgO-
TiO2 diagram, T- talc; c)
CaO-TiO2 diagram, Z-
zoisite; d) SiO2-TiO2
diagram; e) FeO total-TiO2
diagram; f) Na2O-TiO2
diagram, P- paragonite.
0
200
400
600
800
1000
0 0.5 1 1.5 2 2.5 3 3.5TiO2 (wt%)
Cr
(p
pm
)
30
34
38
42
46
50
54
58
0 0.5 1 1.5 2 2.5 3 3.5TiO2 (wt%)
SiO
2 (w
t%)
0
4
8
12
16
0 0.5 1 1.5 2 2.5 3 3.5TiO2 (wt%)
CaO
(w
t%)
0
4
8
12
16
0 0.5 1 1.5 2 2.5 3 3.5TiO2 (wt%)
MgO
(w
t%)
0
2
4
6
0 0.5 1 1.5 2 2.5 3 3.5TiO2 (wt%)
Na 2
O (
wt%
)
0
4
8
12
16
0 1 2 3 4
TiO2 (wt%)
FeO
tot
al (
wt%
)
MORB field
C
TT
ZZ
PP
P
P
a b
c d
e f
4. Trace element partitioning values for subduction zone modelling 54
The close chemical relationship with MORB makes Trescolmen eclogites ideal for evaluating the importance of
several hydrous phases in subducting oceanic crust, at least under the PT conditions reached at Trescolmen (ca.
650oC, 2.0 GPa; Meyre et al. 1997). This can aid in the determination of the relative importance of different OH-
bearing phases in various mafic assemblages (gabbros vs. basalts, hydrothermally altered vs. unaltered, etc.). For our
suite of samples, there are good correlations between major element compositions and occurrences of corresponding
phases. For instance, zoisite occurs in eclogites with ≥12 wt% CaO (Fig. 19c), talc in two of the three MgO-rich
eclogites (Fig. 19b) and three out of four paragonite-bearing eclogites are the most Na2O-enriched samples (≥3.7
wt% Na2O, Fig. 19f). Amphibole occurs in all investigated eclogites and there is a weak positive correlation
between the modal abundance of amphibole and the Mg#. 50-14 has the lowest modal amount of amphibole (<1%;
see Table 1) with a low Mg# (45.4; see Table 2) whereas 59-5 has the highest amount of amphibole (21%) with a
high Mg# (71.3). The modal abundance of the hydrous phases phengite and apatite is directly proportional to the
K2O and P2O5 contents in the whole rocks since they are the only significant potassium- and phosphorous-bearing
phases in Trescolmen eclogites (for potassium see Chapter 2). In addition to the hydrous phases, the existence of
kyanite and chromite relics can also be correlated with the whole rock composition. The occurrence of kyanite is
restricted in Trescolmen eclogites to samples with ≥15 wt% Al2O3 (indicated in Fig. 17) and the only chromite relics
(see below) were found in the most Cr-rich sample (Fig. 19a). Since parageneses are closely linked to whole rock
chemistry in each sample, and all samples in turn lie directly on the fractionation line of MOR basalts, it can be
concluded that abundances of hydrous phases were not controlled by H2O availability or other elemental mass
transfer processes during metamorphism.
All correlations between whole rock chemistry and phase abundances in Trescolmen eclogites can only be first order
approximations. Phase relationships are inevitably more complex and depend on many variables. A more precise
knowledge of the occurrence of phases in complex systems involves the application of rigorous thermodynamic
methods, such as the Gibbs free energy minimization (Meyre et al., 1997) or solution of simultaneous non-linear
equations (THERMOCALC; Powell et al., 1998).
4.4 Mineral chemistry
Mineral chemical heterogeneities and zonations have been studied qualitatively by high resolution back scattered
electron imaging and quantitatively by spot analyses with the electron microprobe in order to define areas in each
phase that are part of the Trescolmen stage equilibrium parageneses. These areas were then analyzed by LAM for
trace element contents. All relevant phases are described below and selected electron microprobe data for
clinopyroxene, garnet, zoisite and clinozoisite are given in Tables 7 to 9.

4. Trace element partitioning values for subduction zone modelling 55
Table 7 Electron microprobe data for clinopyroxene (in wt%). Average compositions are marked by *,
remaining data are representative analyses.
Ad25 CHM30a CHM30b 50-2 50-13 50-14 52-1 55-3* * * * *
SiO2 55.84 55.57 55.63 56.72 56.47 56.95 56.39 55.60TiO2 0.086 0.061 0.062 0.080 0.075 0.098 0.079 0.068Al2O3 10.36 8.36 9.01 12.78 12.03 13.15 11.61 9.60Cr2O3 0.025 0.119 0.148 0.026 0.095 0.052 0.045 1.91FeO 2.30 3.33 3.21 3.50 2.52 3.33 3.82 3.07MnO 0.020 0.047 0.019 0.022 0.019 0.038 0.024 0.024MgO 10.22 10.97 10.69 7.56 8.68 7.05 8.18 9.18CaO 15.34 16.29 15.72 11.21 13.08 11.11 12.50 13.59Na2O 5.70 4.98 5.24 7.91 6.83 8.27 7.16 6.79K2O 0.004 0.014 0.003 0.009 0.003 0.001 0.002Total 99.89 99.74 99.73 99.81 99.80 100.05 99.80 99.83
55-4 59-1 77-5* *
SiO2 55.36 56.64 55.80TiO2 0.066 0.065 0.086Al2O3 7.04 9.85 11.16Cr2O3 0.17 0.2 0.046FeO 4.53 1.53 4.45MnO 0.029 0.016 0.020MgO 11.26 10.89 8.49CaO 16.9 16.03 13.25Na2O 4.65 5.58 6.73K2O 0.008 0.005Total 100.01 100.81 100.02
Table 8 Electron microprobe data for garnet (in wt%). Rim compositions
in contact with clinopyroxene.
50-13 50-2 52-1 CHM30b 77-5
SiO2 39.34 38.52 39.12 40.41 39.70TiO2 0.036 0.065 0.024 0.016 0.091Al2O3 22.53 21.83 21.46 23.21 22.39Cr2O3 0.042 0.010 0.051 0.079 0.096FeO 21.21 24.92 25.01 17.74 22.85MnO 0.41 0.55 0.56 0.39 0.67MgO 10.61 8.43 7.50 12.03 7.61CaO 6.27 5.64 6.72 7.38 8.36Na2O 0.011 0.008 0.026 0.016Total 100.45 99.97 100.47 101.26 101.78

4. Trace element partitioning values for subduction zone modelling 56
Table 9 Electron microprobe data for amphibole, paragonite, apatite, zoisite, clinozoisite and talc (in wt%).
Only microprobe data for amphibole from sample 77-5 are included here, other data are given in Chapter 2.
AMP PAR APA ZOI CZO TLC77-5 50-13 50-14 52-1 50-13 50-14 Ad25 CHM30b 77-5 77-5 55-4
SiO2 47.58 45.99 45.75 46.31 39.21 39.09 39.38 38.90 62.90TiO2 0.36 0.16 0.093 0.20 0.03 0.03 0.05 0.12 0.02Al2O3 14.12 38.26 38.94 38.09 0.01 32.13 31.55 31.84 28.92 0.45Cr2O3 0.062 0.12 0.046 0.059 0.02 0.13 0.02FeO 8.96 0.35 0.34 0.63 0.04 1.15 1.72 2.49 5.85 2.67MnO 0.05 0.01 0.01 0.01 0.01 0.03 0.02 0.03 0.01 0.01 0.05MgO 13.74 0.31 0.21 0.31 0.01 0.07 0.07 0.07 0.29 29.86CaO 7.91 0.41 0.23 0.32 54.5 54.03 24.67 24.08 24.05 23.46 0.03Na2O 4.59 6.92 7.43 6.92 0.14K2O 0.56 1.24 0.46 1.44 0.01 0.01P2O5 41.73 40.78F 4.25 5.37Cl 0.02 0.05Total 97.94 93.78 93.51 94.27 100.97 100.68 97.28 96.57 97.91 97.68 96.14
4.4.1 Clinopyroxene
Clinopyroxene shows a wide spread in jadeite content (from 27-57 mol%) and Mg# (from 76-95, see Figs. 20a and
20b). Most clinopyroxenes are omphacites having Jd contents exceeding 30%, but some analyses from three
samples have lower Jd-contents and are thus not true omphacites (Morimoto et al., 1988). Clinopyroxenes from
most individual samples form distinct clusters in a Mg# vs Jd plot (samples 50-2, 50-13, 55-4, CHM30a and
CHM30b, see Fig. 20a). Large heterogeneities in clinopyroxene composition are confined to a few samples (Fig.
20b) and can be correlated with textural features and/or whole rock geochemistry. For instance, 55-3 and 59-1 are
Fig. 20 Jd-Mg# diagram for clinopyroxene compositions. a) Samples with relatively homogeneous clinopyroxenes.
Small diamonds are core compositions of small clinopyroxenes from sample 52-1, arrow marks zoning trend in
these clinopyroxenes. b) Samples with strongly heterogeneous clinopyroxenes.
20
25
30
35
40
45
50
55
60
75 80 85 90 95 100
Mg#
Jd (
in m
ol%
)
50-2
50-13
52-1
77-5 CHM30b
55-4
CHM30a
20
25
30
35
40
45
50
55
60
75 80 85 90 95 100
Mg#
Jd (
in m
ol%
)
55-3
50-14
Ad25
59-1
59-5

4. Trace element partitioning values for subduction zone modelling 57
metagabbroic samples, characterized by very coarse grain sizes and a lack of penetrative foliation. 55-3 provides a
spectacular example of disequilibrium at a thin section scale. In addition to pronounced variation in Jd content and
Mg#, this sample contains millimetre wide mineral aggregates, with a striking green colour in thin section,
consisting of phases with high Cr-contents (e.g. clinopyroxene with up to 1.9% Cr2O3, phengite with up to 2%
Cr2O3, compared to concentrations of 0.2% Cr2O3 outside the aggregates). Chromite inclusions that occur in such
Cr-rich clinopyroxenes are interpreted as relict magmatic grains (see Messiga et al., 1999). Cr mobility during
eclogite facies metamorphism was therefore limited in this sample to the size of the Cr-rich clusters (about 1 mm).
Back scattered imaging of clinopyroxenes from Ad25 reveals light and dark domains (Fig. 21a) that are chemically
distinct in terms of jadeite content. However, quantitative electron microprobe analyses do not result in distinct
clusters in a Mg# vs Jd plot (Fig. 20b) and the spread might be explained by mixing of analyses of two different
clinopyroxene compositions, which could imply a miscibility gap between jadeite-rich (Jd50) and jadeite-poor
(Jd35) clinopyroxenes in this sample. Unfortunately, this cannot be assessed with current thermodynamic models
since different models give widely varying results for clinopyroxene solutions at 600°C/2.0 GPa, ranging from a
miscibility gap between Jd08-Jd43 in one model to complete miscibility in another model (Meyre et al., 1997).
Large, idiomorphic and inclusion-poor clinopyroxenes (commonly aligned in the foliation) were found to be the
most homogeneous type of clinopyroxene in our samples. It can be seen in Fig. 21b that fine-grained
clinopyroxenes, as in 52-1, are mostly zoned (with a core to rim decrease in Jd-content from 54 to 47 and in Mg#
from 83 to 79; see Fig. 20a), whereas large clinopyroxenes are unzoned and have a Jd-content and Mg# identical to
rim compositions of fine-grained clinopyroxenes. We therefore infer that the large clinopyroxenes are younger than
cores of small clinopyroxenes and suggest that this may be an indication of annealing and Ostwald ripening of
suitably oriented grains. Overgrowth of strained fine-grained clinopyroxenes, as observed in Trescolmen eclogites,
can be explained by a dominance of mass transfer processes over dislocation creep (Godard & van Roermund 1995).
We correlate the influx of fluids under the eclogite facies conditions during the Trescolmen stage (Chapter 2) with
the net transfer hydration reactions in the Trescolmen area. Fluids as a mass transfer medium have also been
advocated by Philippot & van Roermund (1992) to explain local annealing of clinopyroxene in a former mylonitic
fabric. The trend of decreasing Jd-content and Mg# in sample 52-1 can be correlated with concomitant growth of
paragonite (as a sink for sodium) and amphibole (which has a higher Mg# than clinopyroxene) during fluid influx.
The sequence of clinoyroxene compositions in 52-1 is opposite to that in Tauern eclogites, where small
clinopyroxenes (Jd49) formed by dynamic recrystallization from large clinopyroxenes (Jd35) in which subgrain
boundaries and undulose extinction are common (Kurz et al., 1998a). The latter type of grain-size reduction has
been attributed to an increase in finite strain, with rotation of subgrains in large porphyroclastic clinopyroxenes
producing polycrystalline aggregates (Lardeaux et al. 1986, Buatier et al. 1991). We correlate such dynamically
recrystallized clinopyroxenes with the early fine-grained clinopyroxenes in Trescolmen eclogites.


4. Trace element partitioning values for subduction zone modelling 61
4.4.2 Garnet
In general, all samples show garnet zonation typical for growth under prograde conditions, characterized by
increasing Mg# and decreasing MnO contents. There is also a decrease of CaO content from core to rim (Fig. 22).
The cores of some garnets still preserve pre-eclogitic inclusions consisting of epidote, tschermakitic amphibole and
rare plagioclase (Heinrich 1986). Towards their rims, garnets are clear and are virtually free of inclusions, except for
minor quartz and omphacite (59-5). The rim compositions are interpreted as being part of the eclogite facies
assemblage, as indicated by omphacite inclusions and direct grain contact with unaltered matrix omphacite. A
common feature in Trescolmen eclogites, observable in back scattered images, is a patchy zoning in garnet cores,
where old core areas (light grey in Fig. 21c) are replaced along irregular annealed cracks and fractures by
recrystallized garnet (darker grey). A second type of annealed fracture is visible in the most altered samples (55-3,
77-5) and clearly postdates eclogite facies garnet rims. In backscattered electron images, straight and anastomosing
bright fractures can be seen to penetrate garnet rims, propagating from the rim radially into the garnet interior (Fig.
21c). Spot analyses reveal that the older generation of cracks approach the compositions of rims and can therefore
be related to the eclogite-facies stage. Erambert & Austrheim (1993) described similar annealed cracks, formed
under eclogite-facies conditions, and interpreted them as fluid pathways, indicating that volume diffusion was
insignificant in comparison to the role of fluids in controlling the element mobility and degree of re-equilibration in
garnet. Likewise we infer that fluid infiltration during the Trescolmen stage was the source for the patchy zoning of
the garnet cores. Atoll garnets in some samples (50-2, 52-1, 55-3) formed by a partial or complete replacement of
the garnet cores by quartz, phengite, small euhedral garnets (5-10 µm, identical in composition with rims of atoll
garnets) and rare euhedral omphacite, indicating eclogite facies conditions. The formation of atoll garnets probably
also occurred during fluid influx, but, in contrast to the formation of the annealed garnet cracks, may represent a
more evolved stage of reaction under open system conditions. The second generation fractures can be chemically
distinguished from eclogite-facies fractures as they are displaced from the normal garnet zoning trend (mostly Ca-
Mg exchange, Fig. 22) towards higher Fe and Mn contents at a given Ca content. A similar trend can also be seen at
Fig. 22 Ca-Mg-Fe triangle for garnet
compositions. Schematic zonation
patterns of large garnets from selected
samples are indicated by arrows. Black
diamonds are compositions of late
annealed cracks in garnets from sample
55-3 (GRT3 in Fig. 21c).
Ca
Mg Fe
CHM30b
Ad25
50-1452-155-3

4. Trace element partitioning values for subduction zone modelling 62
the outermost rim of some garnets from Trescolmen (e.g. sample 50-12 in Meyre et al., 1999). Both the late
annealed fractures and the outermost rim zonation can be ascribed to amphibolite facies overprinting and may be
similar to the annealed garnet fractures described by Kurz et al. (1998a). The small scale relationships of several
generations of garnet in a single grain can in principle be resolved with the LAM technique if highly enriched trace
elements are analyzed and the diameter of the laser beam is reduced (≤20 µm scale). However, a major obstacle to
applying this set-up in our study is that concentrations of most trace elements of interest are below 100 ppb in
garnet, so that the beam size was always chosen to be at least 60 µm. Therefore, we do not present trace element
ratios of coexisting garnet/mineral pairs, since the measured garnet concentrations are always mixed analyses of
different garnet compositions. The data set for garnet trace elements is however used in the section on mass balance
calculations.
4.4.3 Zoisite, clinozoisite and allanite
Zoisite was only found in three of our investigated samples (Ad25, CHM30b, 77-5) and coexists with clinozoisite in
only one sample (77-5). In this sample, distinct crystals of zoisite and clinozoisite in mutual grain contact, show
limited variations within one sample (XFe from 0.037-0.058 in zoisite and 0.098-0.132 in clinozoisite). In
backscattered electron images, we did not observe systematic zonation patterns. An inferred miscibility gap between
zoisite and clinozoisite (Franz & Selverstone, 1992), can only be compared with other eclogite localities in the
absence of experimentally calibrated relationships as a function of P and T. Paragonite eclogites from Dabie Shan,
which are inferred to have equilibrated under similar PT conditions to the Trescolmen eclogites (ca. 1.9 GPa, 700°C;
Okay, 1995), have zoisite-clinozoisite assemblages that have almost identical chemical compositions to those in
sample 77-5 (average compositions are XFe = 0.049 for zoisite and 0.135 for clinozoisite; Okay, 1995).
Zoisites from Ad25 and CHM30b also show some variation in terms of the Fe3+ content, XFe ranging from 0.021 to
0.042 in Ad25 and from 0.037 to 0.055 in CHM30b. The XFe composition of these zoisites is lower than those from
77-5, which might reflect a lower Fe3+ bulk rock concentration of the former samples and is consistent with the
observation that no clinozoisite has been observed in these samples. Zoisites in both samples show pronounced
zonation patterns in backscattered images (Fig. 21d and 21e). Brightness differences are not a function of variation
in major element composition, as XFe variations are limited, but can be correlated with changes in Sr concentration.
Bright areas of zoisites in CHM30b (Fig. 21d) have Sr enrichments of up to 21000 ppm (ZOI3), whereas dark areas
are distinctively lower in Sr concentration (3500 ppm; ZOI2).
Zonation patterns in zoisite in CHM30b (ZOI1 to ZOI3 in Fig. 21d) can be best explained by growth zoning and late
resorption processes. Zoisite cores with high Sr concentrations (ZOI1) formed under eclogite-facies conditions,
indicated by numerous omphacite inclusions (Fig. 21d). Due to the strong preference of Sr for zoisite, Sr is
concentrated in the zoisite cores and depleted in the surrounding matrix. Subsequent zoisite growth (ZOI2) is
characterised by lower Sr concentrations, similar to more common garnet growth zoning patterns. ZOI2 growth still
continued under eclogite-facies conditions, as documented by rare omphacite inclusions and common mutual grain
boundaries with matrix omphacite. Extreme enrichments of Sr, of up to 21000 ppm, occur only in the outermost rim
of zoisites (ZOI3). These zones are unevenly distributed around zoisite and mostly less than 30 µm thick. This

4. Trace element partitioning values for subduction zone modelling 63
pattern, combined with the high Sr concentrations, points to zoisite resorption which released Sr that was
redistributed in the surface layers of the remaining zoisite. Since amphibolite-facies overprinting occurs on grain
boundaries, we correlate the origin of the high Sr rims with begining of zoisite breakdown under amphibolite-facies
conditions.
Zonation patterns of zoisite from eclogite sample Ad25 (Fig. 21e) are very complex. Cores (ZOI4) are low in Sr (ca.
2800 ppm) and show small-scale heterogeneities in back scattered electron images. They are surrounded by at least
two narrow zones of Sr enrichment (up to 10000 ppm; ZOI5). At the margins of zoisite grains, Sr concentrations
drops to about 1000 ppm (ZOI6). The origin of the two or more zones of high Sr content might point to episodic
fluid infiltration into the eclogite bodies, with Sr transported by the fluid. The growth of zoisite in AD25 with
respect to the P-T path cannot be worked out and choices of areas in zoisite suitable for equilibrium considerations
with coexisiting phases are subject to uncertainty. However, all zoisite areas grew under eclogite-facies conditions,
indicated by omphacite inclusions in ZOI4 and ZOI6.
Allanite occurs as an accessory phase in several samples (50-2, 50-13, 52-1, 55-3), mostly as irregular grains less
than 40 µm in length. An exception are allanites in 50-13, where several large grains are up to 400 µm and
numerous omphacite inclusions show a preferred orientation parallel to the eclogite-facies foliation. This strongly
suggests that allanite, at least in sample 50-13, is part of the eclogite-facies assemblage.
4.4.4 Other hydrous phases (amphibole, phengite, paragonite, talc, apatite)
Chemical compositions of amphibole and phengite, as well as textural relationships of all hydrous phases, are
presented in Chapter 2 and a summary of the most important chemical characteristics is given below. Amphibole
occurs in varying amounts in every sample and shows a wide range of composition, ranging from tremolitic to
tschermakitic with a significant glaucophane component. Following the classification scheme of Leake et al. (1997),
amphiboles from most samples can be termed barroisites. A strong correlation between Na on the M4 site of
amphibole cores and the jadeite content of associated omphacite is evidence for the growth of amphibole under
eclogite-facies conditions, as already observed by Heinrich (1986). An increase of Na(M4) is coupled with an
increase of Na+K(A-site), as long as amphibole core compositions are considered. However, core-rim zonation
trends are characterised by the opposite trend, with a decrease of Na(M4) and increase of Na+K(A-site) towards the
rim. Amphibole rim compositions are not correlated with associated omphacites and we therefore treat amphibole
cores as belonging to the eclogite-facies parageneses (Trescolmen stage), whereas amphibole rims must have grown
after the Trescolmen stage, either during uplift under waning eclogite-facies conditions or during the amphibolite-
facies overprint.
Phengites have high celadonite contents (37-47 mol%) and low paragonite contents (Na/Na+K ratio 0.05-0.20), with
a negative correlation between these two parameters from sample to sample. Zonation trends of paragonite and
celadonite components inside phengite grains can be explained by late diffusion processes, which are limited to
grain boundaries and cleavage planes (Chapter 2). Laser ablation measurements have therefore been limited to the
cores of fresh phengites with no observable cleavage planes.

4. Trace element partitioning values for subduction zone modelling 64
Other hydrous phases do not have pronounced chemical variations. Paragonites show limited celadonite and
muscovite substitution (up to 1.4 wt% K2O; Table 9). Talc also occurs as an almost pure end member, with 0.45
wt% Al2O3 and 2.7 wt% FeO as minor components (Table 9). Apatites from Trescolmen can be classified as F-
apatites (4.3 to 5.4 wt% F), characterised by low Cl concentrations (200-500 ppm Cl).
4.5 Mass balance calculations
Following the method of Sorensen & Grossman (1989), bulk rock data and modal abundances of high pressure
phases have been combined with results from LAM data of in-situ mineral analyses to perform mass balance
calculations for the investigated trace elements. The purpose of these calculations is twofold. On the one hand,
differences between measured and calculated whole rock concentrations allow an evaluation of the importance of
possible non-analyzed accessory phases. On the other hand, the combination of trace element concentration and
modal abundance of each phase gives a clear impression of the dominant carriers for each trace element in eclogites.
Calculations are reported for two samples, chosen to represent phengite-rich eclogites (50-13) and zoisite-rich
eclogites (CHM30). For these two samples, the most complete data set is available, but similar results are also
obtained for the other investigated eclogites.
The results for sample 50-13 are plotted in Fig. 23a. The trace element budget of sample 50-13 has been modelled
for Cs, Rb, Ba (Chapter 2) and for Nb, Zr, Sb, Sn, Mo, W (Chapter 3). It has been demonstrated that phengite
dominates the Ba budget of the whole rock, rutile dominates Nb and zircon dominates Zr. Therefore Ba, Nb and Zr
are not plotted in Figs. 23a and 23b, but the conclusions of the former studies are generally confirmed by the larger
data set of this study. For the remaining elements, the differences between calculated and measured whole rock
concentrations of Li, Sr, Pb and Y are generally less than 20% (slightly >20% in the case of Li). These are treated as
balanced calculations (Sorensen & Grossman, 1989). For Be and B, no whole rock data exist and the calculated
whole rock is normalized to 100%. The difference from the 100% level of the calculated whole rock in Fig. 23a is
due to not plotting amphibole, which makes up 3% of the Be and 6% of the B budget. For all other elements, the
contribution of amphibole is less than 1% in eclogite sample 50-13. Large deficits between calculated and measured
whole rock concentrations exist for Ce, Nd, Sm, Th and U. The deficits for REE are most likely explained by the
existence of non-analyzed allanite in 50-13 (confirmed by qualitative EDS analyses). Allanite is characterized by
extreme LREE (light REE, here Ce) enrichments and a strong decrease towards HREE (heavy REE, here Y is
treated as a HREE). In the absence of quantitative data, it is possible to balance measured and calculated whole rock
REE concentrations using the average composition of allanites from garnet amphibolites (38200 ppm Ce, 17150
ppm Nd; Sorensen & Grossman, 1989) and assuming a modal abundance of allanite of 0.04%. With these
assumptions, concentrations of 1400 ppm Th and 600 ppm U in allanite are neccessary in order to balance the deficit
of these trace elements entirely from allanite. Th and U can also be highly enriched in zircon. Since the modal
abundance of zircon can be calculated by the Zr content in the whole rock (0.018%; Chapter 2), a concentration of
4300 ppm Th and 2000 ppm U in zircon are required to balance the deficit in the Th and U budget entirely by
zircon.

4. Trace element partitioning values for subduction zone modelling 65
Fig. 23 Mass balance
calculation for a) a phengite-
rich eclogite (sample 50-13) and
b) a zoisite-rich eclogite (sample
CHM30). Bar length
corresponds to percentage of
trace element in each phase
relative to whole rock
concentration. The result for
each trace element is considered
to be well balanced if the
concentration calculated from
modal proportion and LAM
analyses is between 80-120%
(stippled line) of measured
whole rock concentrations (solid
line). In other cases, the
presence of the element in an
unanalyzed phase (e.g., allanite)
is suspected.
A mass balance for sample CHM30 is adequately achieved for all trace elements except Y and Th (Fig. 23b). The
deficit in Y may be explained by the neglect of garnet cores in the mass balance (due to a high inclusion density in
garnet cores), since garnets of Trescolmen are always zoned in Y, a feature commonly observed in prograde growth
zoning of garnets (e.g. Hickmott & Shimizu, 1990). The deficit in Th cannot be explained satisfactorily. Zircon is
unlikely to contain the missing Th, since no zircons have been reported with extreme enrichments in Th over U.
Given the large compositional differences in a single zoisite (Fig. 21d), with Th/U ratios between 0.4 and 5.1, the
data from one grain probably fail to represent the average composition of zoisites in the whole rock. Nevertheless,
this illustrates the complexities of trace element distribution in natural eclogite-facies rocks, especially for Th and U
systematics. In the following, results from the mass balance calculations are summarized element by element and
compared with findings from other studies.
Li, Be, B. Mass balances in both samples reveal the dominant role of clinopyroxene for the Li and Be budgets. All
other phases incorporate <10% of the whole rock content. B is more evenly distributed among different phases, so
that in sample 50-13 paragonite, phengite, garnet and clinopyroxene all contribute >10% of B to the whole rock
budget. Although phengite is the most important residence site for B in this sample, phengite is neither a dominant
����������������������������������������������������
������������������������������������
������������������������������������������������������������
0
20
40
60
80
100
120
Li Be B Sr Pb Ce Nd Sm Y Th U
rela
tive
pro
por
tion
s in
wh
ole
rock
apatite
paragonite�������������� phengite
garnet
clinopyroxene
50-13
allanite? allanite?
0
20
40
60
80
100
120
Li Be B Sr Pb Ce Nd Sm Y Th U
rela
tive
pro
port
ion
s in
who
le r
ock
zoisite
apatite
amphibole
garnet
clinopyroxene
CHM30

4. Trace element partitioning values for subduction zone modelling 66
phase nor is it the phase with the highest B concentration, since paragonite contains four times as much B as
phengite. These findings are in accord with data from the eclogite-facies rocks analyzed by Domanik et al. (1993),
who reported high B concentrations in phengite (60-100 ppm) and significant amounts in omphacite (ca. 5 ppm). In
contrast, Be concentrations are similar in both phengite and clinopyroxene in our samples. However, taking mass
balance calculations into consideration, the conclusion of Domanik et al. that phengite is the primary host of B and
Be cannot be confirmed, at least not for our metabasaltic samples where clinopyroxene is a major phase. To our
knowledge, no other Li data for minerals in eclogite-facies rocks exist. Although the occurrence of Li-rich micas in
pegmatites might imply that micas are likely to be important carriers for Li, the review by Guidotti & Sassi (1998)
has shown that Li is commonly present in regional metamorphic metapelitic micas only at trace element levels
(<100 ppm), a conclusion which we can extend for eclogite-facies phengites in our study.
Sr and Pb. The elements Sr and Pb can be discussed together since they show some similar partitioning behaviour in
both samples. In CHM30b, zoisite dominates the Sr and Pb budget by incorporating >80% of the whole rock
content. The only other significant phase for the Sr budget in CHM30b is clinopyroxene. In sample 50-13,which
lacks zoisite, important phases for Sr and Pb are apatite, paragonite, phengite and clinopyroxene. In detail,
clinopyroxene is the most important carrier for Sr (40%; 20% for Pb), whereas phengite is most important for the Pb
budget (50%; 20% for Sr). Interestingly, allanite does not seem to be a significant carrier for Sr and Pb, which show
almost perfect agreement between calculated and measured whole rock concentrations. However, this does not
exclude high total concentrations of these elements in allanite. Due to the calculated low modal abundances in
sample 50-13, concentrations of as high as 5000 ppm Sr and 200 ppm Pb in allanite would incorporate less than 3%
of the measured whole rock content. The importance of zoisite (or the epidote-group in general) as a carrier for Sr
and Pb has been stressed in several previous studies, both in terms of absolute concentrations (Hickmott et al., 1992;
Domanik et al., 1993) and dominance in mass balance calculations (Sorensen & Grossman, 1989; Nagasaki &
Enami, 1998). It has been proposed from these findings that upon dehydration of zoisite, large quantities of Sr and
Pb are released into the fluid (Hickmott et al., 1992; Nagasaki & Enami, 1998). However, this study shows that in
the absence of zoisite, Sr and Pb can also be incorporated in significant quantities in clinopyroxene, which is stable
well beyond the upper stabilty of zoisite (Schmidt & Poli, 1998). A strong zoisite signature in the released fluid will
therefore not inevitably develop upon zoisite breakdown, but instead this depends on a more complex interplay of
partition coefficients between zoisite, clinopyroxene and fluid.
REE and Y. Even though REE concentrations and modal abundance of allanite (in 50-13) and zoisite (in CHM30)
are very different, combining these two factors shows that the importance of both phases for the REE inventory is
remarkably similar. LREE (Ce) are almost completely (>90%) accommodated in allanite and zoisite, whereas the
dominance of these two minerals decreases steadily towards the HREE, with the relative proportions in allanite and
zoisite Ce>Nd>Sm>Y. For the HREE (here proxied by Y), zoisite and allanite are not significant carriers and
instead garnet dominates the element budget (in 50-13 >80%). No other phase is a major carrier for REE in the
investigated samples, even though absolute concentrations in the case of apatite can be significant. However, apatite
has lower absolute concentrations of REE in relation to zoisite as well as allanite and occurs in lower modal
proportions than zoisite in zoisite-bearing eclogites. Again, these results are in good agreement with previous studies
where mass balance calculations have been performed. In eclogites from Liguria (Tribuzio et al., 1996), allanite is
the dominant phase for LREE, whereas garnet dominates the HREE budget. In the case of zoisite-bearing rocks,
4. Trace element partitioning values for subduction zone modelling 67
Sorensen & Grossman (1989) described garnet amphibolites where the LREE budget is dominated by zoisite and the
HREE budget by garnet.
Th and U. Due to the lack of data for allanite and zircon in this study, large uncertainties remain concerning the
element budgets for Th and U. Calculations for CHM30 indicate that zoisite seems to control the element budget for
U and probably also for Th, given the large variation in Th (and U) in a single zoisite grain. As a result, zoisite with
higher than measured Th concentration is a more likely phase to balance the Th budget than zircon. The whole rock
Th/U ratio of 2.7 in sample CHM30 can also be better explained with zoisite as the dominant carrier, since measured
Th/U ratios in zoisite (from 0.4 to 5.1) enclose this value, whereas zircons in eclogites have ratios that are too low
(<0.02; Creaser et al., 1997) to match the whole rock ratio in sample CHM30. Considering the similar trace element
contents of allanite and zoisite, as well as the ability of allanite to store large Th concentrations (up to 6000 ppm;
Sorensen & Grossman, 1989), allanite is the likely carrier for Th and U in sample 50-13, which lacks zoisite.
However, the role of zircon and allanite for Th and U budgets in eclogites requires further study, especially in
systems that are not dominated by zoisite. In any case, this study clearly demonstrates that the major phases garnet
and clinopyroxene are insignificant for the Th and U budget in eclogites (both phases together incorporate always
<5% of the measured whole rock content of Th and U).
4.6 Mineral/mineral partitioning systematics
4.6.1 Evaluating samples for trace element equilibration studies
The mineral chemistry and textural information gained from high resolution back scattered images has allowed us to
confidently isolate appropriate assemblages which thoroughly equilibrated under eclogite facies conditions and can
therefore be used for trace element partitioning studies of eclogite-facies processes in other areas. In general, the
inner rim areas of zoisite and garnet, the core areas of amphibole, phengite (Chapter 2), paragonite and apatite as
well as the large clinopyroxene grains are all part of the re-equilibrated eclogite stage (Trescolmen stage; Fig. 3).
However, the approach towards equilibrium proceeded to different degrees in the investigated samples. We use the
variability of clinopyroxene chemistry within individual samples as one criterion for evaluating equilibrium.
Clinopyroxenes from samples Ad25, 50-14, 55-3 and 59-1 show the greatest scatter and are clearly heterogeneous
(Fig. 19b). In the case of Ad25, the variation occurs on a ca. 20 µm scale (Fig. 20a) and cannot be resolved with the
LAM set-up used in this study. For 50-14, 55-3 and 59-1, we were unable to correlate the chemical variation with
textural observations and detailed element mapping is required. All other samples have restricted clinopyroxene
compositions on an electron microprobe scale (<5µm, Fig. 19a) and are therefore well suited for trace element
analysis with LAM (>40µm).
We obtained another criterion for equilibrium from the textural relationships between the different phases. From all
samples with restricted clinopyroxene composition, only 50-2, 50-13, 52-1 and 77-5 are well foliated eclogites
4. Trace element partitioning values for subduction zone modelling 68
(Table 1). In these samples, hydrous phases define the main foliation with clinopyroxene, implying that they
dynamically recrystallized together. Deformation significantly enhances material transport (Messiga et al., 1995),
whereas solid state diffusion must have been too slow during the short-lived high temperature history of the
Trescolmen eclogites to produce equilibrium compositions among different phases (Watson, 1996). Eclogite facies
phases in CHM30b, CHM30a and 55-4 are also in apparent major element equilibrium, but we cannot judge the
likelihood of trace element equilibration in the absence of signs of dynamic recrystallization.
In summary, we can order our samples in terms of the probability of showing equilibrium trace element partitioning
behaviour. The most ideal samples are 50-2, 50-13, 52-1 and 77-5, which were therefore also the most thoroughly
analyzed. They are taken as reference samples in the following discussion and are marked separately in the
following figures. CHM30a, CHM30b and 55-4 comprise the second group, which have homogeneous
clinopyroxene compositions, but the lack of dynamic recrystallization textures suggests the need to apply caution.
The samples Ad25, 50-14, 55-3 and 59-1 belong to the third group in which major element inhomogeneities were
observed in clinopyroxene and can therefore also be expected for trace elements.
For low-T undeformed eclogites from Liguria, Messiga et al. (1995) have shown that chemical equilibrium of the
REE commonly occurs in microdomains. We have therefore limited our trace element analyses to only one sub-area
per thin section. The smallest possible sub-area was about 1 cm2, which was necessary in order to find enough large
inclusion-free grains of each mineral for trace element analysis. This size is larger than the sub-areas analyzed by
Messiga et al. (1995), but the higher temperatures (650oC instead of 450oC) in combination with dynamic
recrystallization in some of the Trescolmen eclogites make larger equilibrium domains more likely.
Different chemical properties (diffusion rates, affinities to different phases, etc.) of many trace elements make it
likely that the approach towards equilibrium is a function of both trace element and phase in question. Therefore it
would be ideal if a homogeneity test as applied to major components in clinopyroxene could be performed for every
trace element distribution in each analyzed phase. However, at this stage we can only give some estimates of the
degree of homogeneity in our samples. Despite the large number of LAM analyses (>400 single spot analyses)
accumulated for this study, many data points (i.e., for the concentration of one trace element in one phase in a
particular sample) are based on only one or two analyses. Where three or more data points exist, we can use the
standard deviation as a homogeneity test (Kretz et al., 1999). We use a threshold of 25% standard deviation as an
upper limit for analytical scattering and a lower limit of 35% standard deviation as a strong indication for trace
element heterogeneity on a 40-100 µm scale. Data points with an average concentration below 0.1 ppm were not
evaluated for heterogeneity due to possible undetectable contamination and can therefore only be treated as
maximum values (see analytical section). The results of this homogeneity test are shown in Tables 10 to 13, where
homogeneous data points are marked in bold and inhomogeneous data points are marked by italics. Other data
points are either below 0.1 ppm or based on less than 3 analyses. The threshold value of 25% is larger than the
estimated precision of 10% for regular LAM analyses of standard glasses under constant conditions (Horn et al.,
1997) and was chosen to compare data from different analytical set-ups and from different spot sizes. It should be
noted that, in detail, we do not follow the procedure described by Kretz et al. (1999), in which threshold values were
solely based on precision that was calculated from repeated analyses of standard glasses under constant conditions.
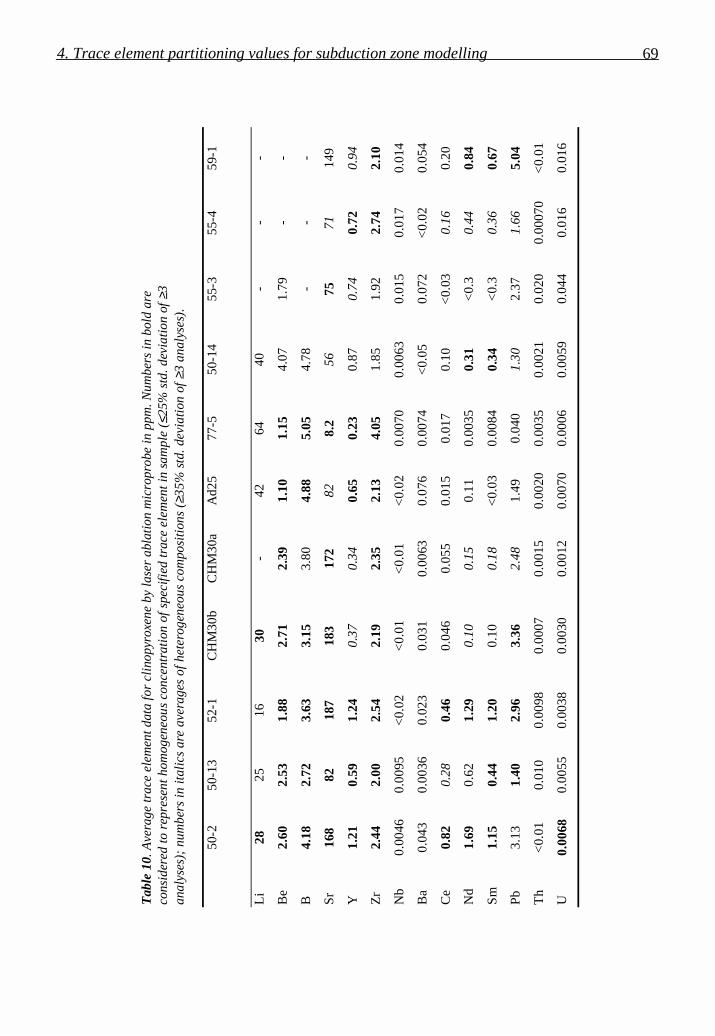
4. Trace element partitioning values for subduction zone modelling 69
Tab
le 1
0 . A
vera
ge tr
ace
elem
ent d
ata
for
clin
opyr
oxen
e by
lase
r ab
lati
on m
icro
prob
e in
ppm
. Num
bers
in b
old
are
cons
ider
ed to
rep
rese
nt h
omog
eneo
us c
once
ntra
tion
of
spec
ifie
d tr
ace
elem
ent i
n sa
mpl
e ( ≤
25%
std
. dev
iati
on o
f ≥3
anal
yses
); n
umbe
rs in
ital
ics
are
aver
ages
of
hete
roge
neou
s co
mpo
siti
ons
( ≥35
% s
td. d
evia
tion
of ≥
3 an
alys
es).
50-2
50-1
352
-1C
HM
30b
CH
M30
aA
d25
77-5
50-1
455
-355
-459
-1
Li
2825
1630
-42
6440
--
-
Be
2.60
2.53
1.88
2.71
2.39
1.10
1.15
4.07
1.79
--
B4.
182.
723.
633.
153.
804.
885.
054.
78-
--
Sr
168
8218
718
317
282
8.2
5675
7114
9
Y1.
210.
591.
240.
370.
340.
650.
230.
870.
740.
720.
94
Zr
2.44
2.00
2.54
2.19
2.35
2.13
4.05
1.85
1.92
2.74
2.10
Nb
0.00
460.
0095
<0.
02<
0.01
<0.
01<
0.02
0.00
700.
0063
0.01
50.
017
0.01
4
Ba
0.04
30.
0036
0.02
30.
031
0.00
630.
076
0.00
74<
0.05
0.07
2<
0.02
0.05
4
Ce
0.82
0.28
0.46
0.04
60.
055
0.01
50.
017
0.10
<0.
030.
160.
20
Nd
1.69
0.62
1.29
0.10
0.15
0.11
0.00
350.
31<
0.3
0.44
0.84
Sm
1.15
0.44
1.20
0.10
0.18
<0.
030.
0084
0.34
<0.
30.
360.
67
Pb
3.13
1.40
2.96
3.36
2.48
1.49
0.04
01.
302.
371.
665.
04
Th
<0.
010.
010
0.00
980.
0007
0.00
150.
0020
0.00
350.
0021
0.02
00.
0007
0<
0.01
U0.
0068
0.00
550.
0038
0.00
300.
0012
0.00
700.
0006
0.00
590.
044
0.01
60.
016

4. Trace element partitioning values for subduction zone modelling 70
Tab
le 1
1 . A
vera
ge tr
ace
elem
ent d
ata
for
amph
ibol
e by
lase
r ab
lati
on m
icro
prob
e in
ppm
. For
exp
lana
tion
of b
old
and
ital
ic n
umbe
rs s
ee T
able
10.
50-2
50-1
352
-1C
HM
30b
CH
M30
aA
d25
77-5
55-3
55-4
59-1
Li
2.47
0.98
1.50
1.14
6.7
1.40
18
Be
5.83
3.18
3.48
2.22
1.26
1.05
1.57
2.22
B11
.89.
329.
028.
025.
5810
.311
.64.
30
Sr
171
9918
031
3812
.214
.446
7482
Y4.
22.
324.
031.
301.
231.
960.
925.
430.
802.
35
Zr
6.03
5.51
6.10
2.96
2.69
3.45
7.63
2.82
1.77
3.29
Nb
0.04
80.
110.
058
0.02
60.
031
<0.
020.
030.
032
0.01
70.
015
Ba
4.80
3.67
5.25
5.74
4.09
1.66
5.58
1.02
2.07
4.41
Ce
0.23
0.14
0.18
0.00
820.
037
0.02
80.
320.
790.
270.
14
Nd
1.14
0.26
0.78
<0.
040.
10<
0.03
0.02
22.
250.
560.
85
Sm
1.77
0.51
1.60
0.01
90.
180.
017
0.00
541.
270.
381.
03
Pb
6.94
5.63
9.02
1.01
2.44
0.66
0.13
2.28
3.49
7.38
Th
0.00
28<
0.02
<0.
01<
0.01
0.00
06<
0.01
0.00
080.
0026
0.00
290.
0025
U<
0.01
0.00
670.
0067
0.00
210.
0094
0.00
370.
0015
0.00
650.
0013
<0.
01
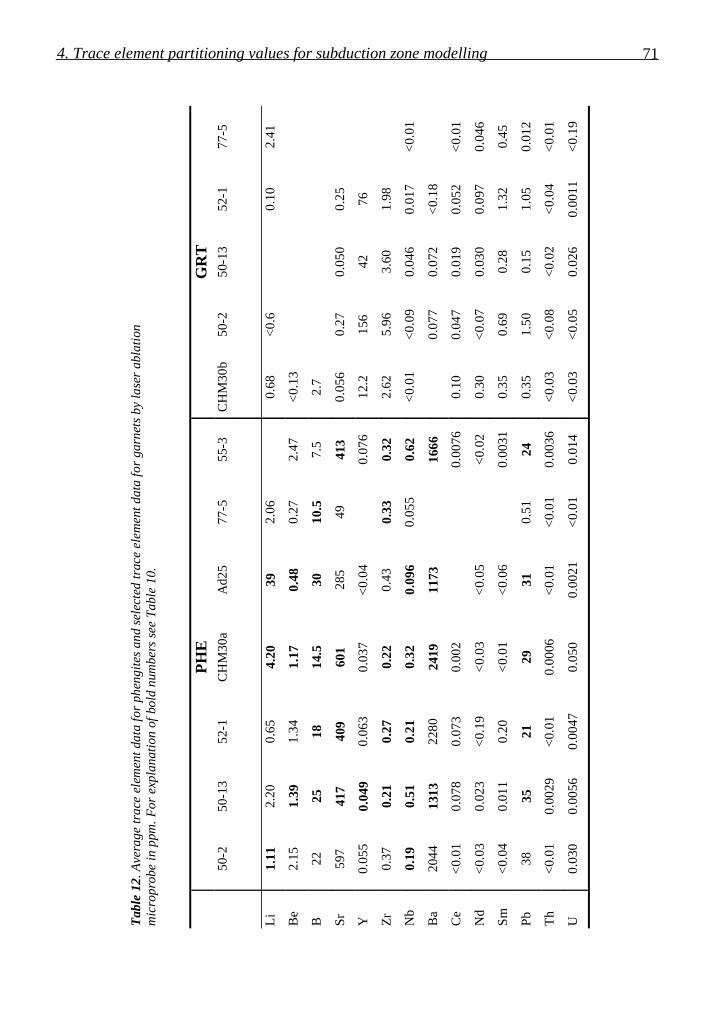
4. Trace element partitioning values for subduction zone modelling 71
Tab
le 1
2. A
vera
ge tr
ace
elem
ent d
ata
for
phen
gite
s an
d se
lect
ed tr
ace
elem
ent d
ata
for
garn
ets
by la
ser
abla
tion
mic
ropr
obe
in p
pm. F
or e
xpla
nati
on o
f bo
ld n
umbe
rs s
ee T
able
10.
PH
EG
RT
50-2
50-1
352
-1C
HM
30a
Ad2
577
-555
-3C
HM
30b
50-2
50-1
352
-177
-5
Li
1.11
2.20
0.65
4.20
392.
060.
68<
0.6
0.10
2.41
Be
2.15
1.39
1.34
1.17
0.48
0.27
2.47
<0.
13
B22
2518
14.5
3010
.57.
52.
7
Sr
597
417
409
601
285
4941
30.
056
0.27
0.05
00.
25
Y0.
055
0.04
90.
063
0.03
7<
0.04
0.07
612
.215
642
76
Zr
0.37
0.21
0.27
0.22
0.43
0.33
0.32
2.62
5.96
3.60
1.98
Nb
0.19
0.51
0.21
0.32
0.09
60.
055
0.62
<0.
01<
0.09
0.04
60.
017
<0.
01
Ba
2044
1313
2280
2419
1173
1666
0.07
70.
072
<0.
18
Ce
<0.
010.
078
0.07
30.
002
0.00
760.
100.
047
0.01
90.
052
<0.
01
Nd
<0.
030.
023
<0.
19<
0.03
<0.
05<
0.02
0.30
<0.
070.
030
0.09
70.
046
Sm
<0.
040.
011
0.20
<0.
01<
0.06
0.00
310.
350.
690.
281.
320.
45
Pb
3835
2129
310.
5124
0.35
1.50
0.15
1.05
0.01
2
Th
<0.
010.
0029
<0.
010.
0006
<0.
01<
0.01
0.00
36<
0.03
<0.
08<
0.02
<0.
04<
0.01
U0.
030
0.00
560.
0047
0.05
00.
0021
<0.
010.
014
<0.
03<
0.05
0.02
60.
0011
<0.
19
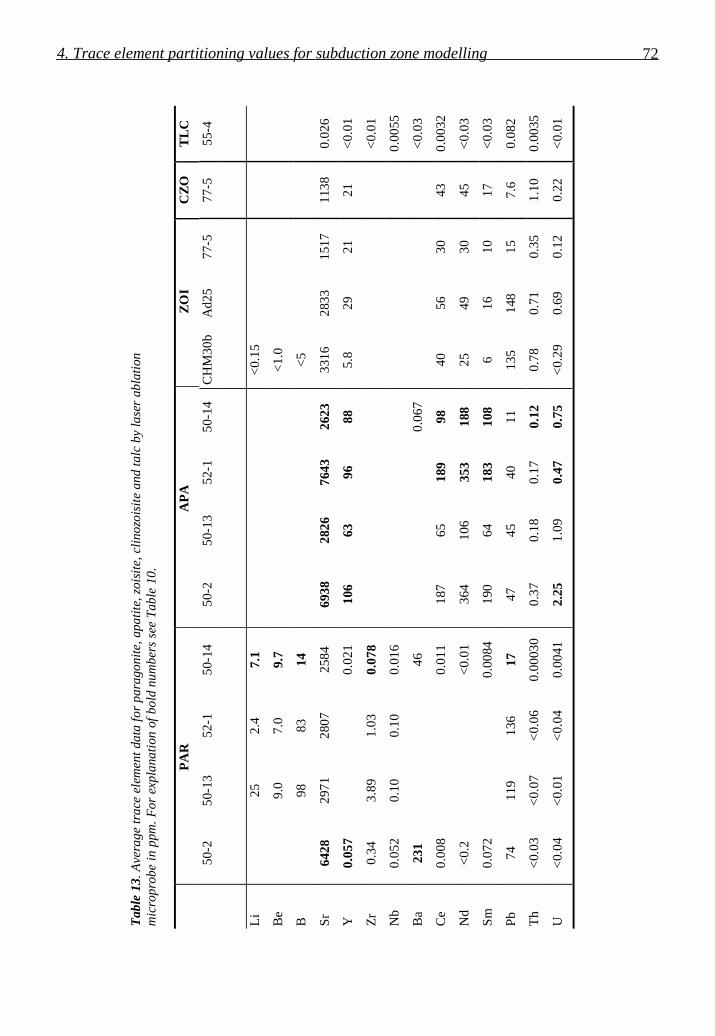
4. Trace element partitioning values for subduction zone modelling 72
Tab
le 1
3 . A
vera
ge tr
ace
elem
ent d
ata
for
para
goni
te, a
pati
te, z
oisi
te, c
lino
zois
ite
and
talc
by
lase
r ab
lati
onm
icro
prob
e in
ppm
. For
exp
lana
tion
of
bold
num
bers
see
Tab
le 1
0.
PA
RA
PA
ZO
IC
ZO
TL
C
50-2
50-1
352
-150
-14
50-2
50-1
352
-150
-14
CH
M30
bA
d25
77-5
77-5
55-4
Li
252.
47.
1<
0.15
Be
9.0
7.0
9.7
<1.
0
B98
8314
<5
Sr
6428
2971
2807
2584
6938
2826
7643
2623
3316
2833
1517
1138
0.02
6
Y0.
057
0.02
110
663
9688
5.8
2921
21<
0.01
Zr
0.34
3.89
1.03
0.07
8<
0.01
Nb
0.05
20.
100.
100.
016
0.00
55
Ba
231
460.
067
<0.
03
Ce
0.00
80.
011
187
6518
998
4056
3043
0.00
32
Nd
<0.
2<
0.01
364
106
353
188
2549
3045
<0.
03
Sm
0.07
20.
0084
190
6418
310
86
1610
17<
0.03
Pb
7411
913
617
4745
4011
135
148
157.
60.
082
Th
<0.
03<
0.07
<0.
060.
0003
00.
370.
180.
170.
120.
780.
710.
351.
100.
0035
U<
0.04
<0.
01<
0.04
0.00
412.
251.
090.
470.
75<
0.29
0.69
0.12
0.22
<0.
01
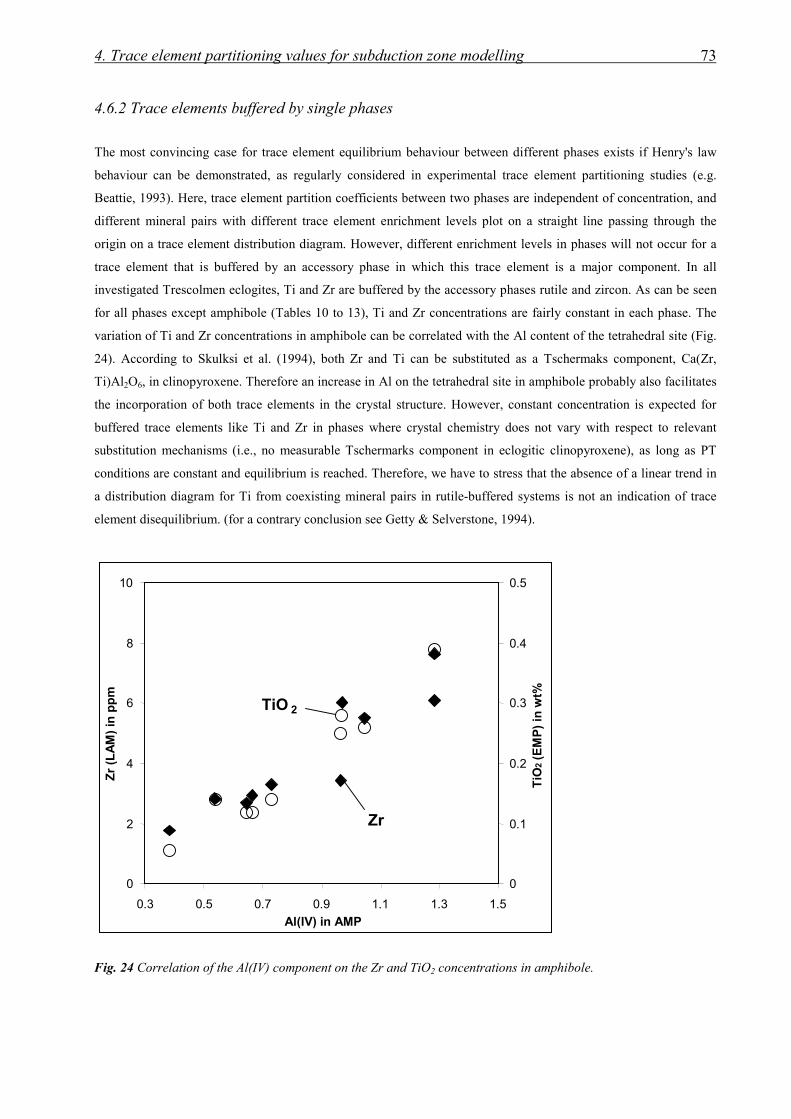
4. Trace element partitioning values for subduction zone modelling 73
4.6.2 Trace elements buffered by single phases
The most convincing case for trace element equilibrium behaviour between different phases exists if Henry's law
behaviour can be demonstrated, as regularly considered in experimental trace element partitioning studies (e.g.
Beattie, 1993). Here, trace element partition coefficients between two phases are independent of concentration, and
different mineral pairs with different trace element enrichment levels plot on a straight line passing through the
origin on a trace element distribution diagram. However, different enrichment levels in phases will not occur for a
trace element that is buffered by an accessory phase in which this trace element is a major component. In all
investigated Trescolmen eclogites, Ti and Zr are buffered by the accessory phases rutile and zircon. As can be seen
for all phases except amphibole (Tables 10 to 13), Ti and Zr concentrations are fairly constant in each phase. The
variation of Ti and Zr concentrations in amphibole can be correlated with the Al content of the tetrahedral site (Fig.
24). According to Skulksi et al. (1994), both Zr and Ti can be substituted as a Tschermaks component, Ca(Zr,
Ti)Al2O6, in clinopyroxene. Therefore an increase in Al on the tetrahedral site in amphibole probably also facilitates
the incorporation of both trace elements in the crystal structure. However, constant concentration is expected for
buffered trace elements like Ti and Zr in phases where crystal chemistry does not vary with respect to relevant
substitution mechanisms (i.e., no measurable Tschermarks component in eclogitic clinopyroxene), as long as PT
conditions are constant and equilibrium is reached. Therefore, we have to stress that the absence of a linear trend in
a distribution diagram for Ti from coexisting mineral pairs in rutile-buffered systems is not an indication of trace
element disequilibrium. (for a contrary conclusion see Getty & Selverstone, 1994).
Fig. 24 Correlation of the Al(IV) component on the Zr and TiO2 concentrations in amphibole.
0
2
4
6
8
10
0.3 0.5 0.7 0.9 1.1 1.3 1.5
Al(IV) in AMP
Zr
(LA
M)
in p
pm
0
0.1
0.2
0.3
0.4
0.5
TiO
2(E
MP
) in
wt%
Zr
TiO 2

4. Trace element partitioning values for subduction zone modelling 74
4.6.3 Amphibole/clinopyroxene partitioning
Among the analyzed elements, REE (Ce, Nd, Sm), Y, Sr and Pb show the largest variation in clinopyroxenes and in
amphiboles from different samples (Tables 10 and 11). Since for many analyzed samples there are sufficient good
data (standard deviation <25%) for both phases, amphibole/clinopyroxene ratios for these elements are ideal to
evaluate the approach towards equilibrium in our samples. We observe an excellent correlation for Sm
concentrations between coexisting mineral pairs, plotted against each other in Fig. 25a. Over a concentration range
of three orders of magnitude, different samples lie on a straight line passing through the origin, demonstrating
similar DAMP/CPX partition coefficients (of ~1) for Sm in all samples. A characteristic of all zoisite-bearing samples
(Ad25, CHM30b, 77-5) is their low Sm contents. As shown in a previous section, zoisite has a strong preference for
Fig. 25 Distribution diagrams for trace elements
partitioned between clinopyroxene and amphibole. Quality
of mineral pairs is indicated as follows: large black
squares- preferred samples (foliated eclogites,
homogeneous clinopyroxene major element composition),
open small diamonds- remaining samples; black symbols-
possible homogeneous composition of both clinopyroxene
and amphibole for the trace element under consideration,
open symbols- probable heterogeneous composition of at
least one phase or uncertain quality of analysis. Solid lines
mark average DAmphibole/Clinopyroxene values of our preferred
samples, extrapolation of the lines to the origin
demonstrate Henry's Law behaviour. Arrow in Sm(AMP)
versus Sm(CPX) diagram indicates that concentration of
Sm in clinopyroxene is below detection limit.
77-5
CHM30
CHM30b
59-1
55-450-13
50-2
52-1
0.001
0.01
0.1
1
10
0.001 0.01 0.1 1 10Sm (CPX) in ppm
Sm (
AM
P)
in p
pm
Ad25
55-3
a
52-1
50-2
50-13
55-4
55-3
59-1
CHM30b
CHM30Ad25
77-5
0
1
2
3
4
5
6
0 0.5 1 1.5Y (CPX) in ppm
Y (
AM
P)
in p
pm
b
77-5 Ad25
CHM30
CHM30b
59-1
55-3
55-4
50-13
50-2
52-1
0
50
100
150
200
0 50 100 150 200Sr (CPX) in ppm
Sr (
AM
P)
in p
pm
c

4. Trace element partitioning values for subduction zone modelling 75
this element, so that under equilibrium conditions, samples with similar bulk trace element concentrations will have
coexisting phases with different Sm concentrations depending on modal zoisite abundance. Sample 77-5 with the
highest zoisite and clinozoisite abundance (together 15 modal %, Table 1), has lower Sm concentrations in both
clinopyroxene and amphibole than Ad25 and CHM30b (both between 6-8 modal % zoisite). These two samples in
turn have much lower Sm concentrations in clinopyroxene and amphibole than zoisite-absent samples. Since all
samples have a variation in Sm whole rock concentration of only a factor of about two (1.8-4.3 ppm), we can
conclude that zoisite controls the Sm concentration of both clinopyroxene and amphibole, which independently
supports the observation that all three phases crystallized under eclogite-facies conditions. However, in detail
CHM30b and Ad25 have disturbed partitioning behaviour for Nd and Sm. While other phases have D-values for Nd
of about 0.8 and for Sm of about 1.1, both samples have DAMP/CPX values for Nd <0.4 and CHM30b has a D-value
for Sm of 0.2 (Table 14).
With two exceptions, DAMP/CPX partition coefficients for yttrium are also very uniform, with a factor of ~4 (Fig. 25b).
Only mineral pairs from 55-3 and 55-4 do not plot on the line defined by the average of the remaining partition
coefficients. Although yttrium compositions of 55-4 in both clinopyroxene and amphibole passed our homogeneity
test, DAMP/CPX is a factor of 3 lower than the average value. In contrast, Sm values for both phases in 55-4 are
probably inhomogeneous (Fig. 25a), but element ratios are indistinguishable in comparison to the remaining
samples. We therefore conclude that the low standard deviation of repeated measurements on a 40-100 µm scale is
not a good indicator of an approach towards equilibrium, and that textural considerations and electron microprobe
data on a 5 µm scale are better criteria.
DAMP/CPX partitioning systematics for Sr show evidence for disequilibrium processes in some of the investigated
samples. Again, our preferred samples (50-2, 50-13, 52-1, 77-5) plot close to a straight line (D~1) passing through
the origin, implying a good approach towards equilibrium. All other samples, except 55-4, have lower DAMP/CPX
ratios. Here, the zoisite-bearing samples Ad25 and CHM30b are most extreme. The partitioning behaviour of Pb
follows closely that of Sr, as shown in Fig. 26. As Sr is one of the most reliable elements in LAM analyses, this
correlation independently confirms the reliability of Pb data, which are prone to fractionation effects during ablation
Fig. 26 Illustration of similar partitioning
behaviour of Sr and Pb between coexisting
amphibole/clinopyroxene pairs. Black squares-
preferred samples; open diamonds- remaining
samples; stippled lines- preferred
DAmphibole/Clinopyroxene values (1.2 for Sr, 3.1 for
Pb).
0.0
1.0
2.0
3.0
4.0
5.0
0.0 0.5 1.0 1.5 2.0
D(AMP/CPX) for Sr
D(A
MP
/CP
X)
for
Pb

4. Trace element partitioning values for subduction zone modelling 76
(Longerich et al., 1996). For the disequilibrium distributions for DAMP/CPX of Sr, Pb, Nd and Sm, we envisage a
process whereby zoisite crystallizes with amphibole, but clinopyroxene fails to re-equilibrate with these phases. This
is explored in a later section.
Crystal chemical variations can have a profound influence in trace element partitioning behaviour. We have
previously shown for Trescolmen eclogites that changes in the A-site occupancy of amphibole have a strong
influence on DPHE/AMP for Ba (Chapter 2). However, the large spread in DAMP/CPX for Sr cannot be explained by
crystal chemical variations. Since Sr has a similar ionic radius to Ca, it is generally assumed to be accommodated in
the M2 site of clinopyroxene (Blundy & Wood, 1994) and the M4 site of amphibole (LaTourrette et al., 1994).
Although there is a weak positive correlation of DAMP/CPX for Ca and Sr, this is statistically insignificant and a wide
range of amphibole/clinopyroxene ratios for Ca can be found in our preferred samples (0.53-0.66), which otherwise
have almost identical DAMP/CPX for Sr. A possible explanation for the reduced role of crystal chemical variation in
trace element partitioning behaviour between amphibole and clinopyroxene in this study is the strong correlation of
the major element chemistry of both phases, as shown by correlations among jadeite versus edenite content and Mg#
(Heinrich, 1986).
An interesting feature in the DAMP/CPX data is the similar trace element partitioning behaviour in samples CHM30a
and CHM30b (Table 10 and 11, Fig. 25b and 25c). They comprise phengite- and zoisite-rich domains, respectively,
from the same block <40 cm apart. Even if we assume strong Sr disequilibrium behaviour related to zoisite
formation, the process must have been similar on a dm scale, which is additional evidence for the presence of an
interconnecting fluid phase during eclogite facies re-equilibration. Nevertheless, in detail amphibole is more
strongly depleted in Ce, Sm and Nd in the zoisite-rich domain (CHM30b).
Other trace elements show only a limited variation between different samples in a given phase, so that constant
partition coefficients cannot be demonstrated by concomitant increases in trace element concentrations in mineral
pairs from different samples. However, consistency in partition coefficients of the remaining analyzed trace
elements can be evaluated from Table 14. Of the 14 trace elements chosen for this study, 9 elements have standard
errors for average DAMP/CPX values between 9 and 23%. A high degree of confidence exists for the partition
coefficients for Li, Be, B, Y, Nd and Sm, which are always based on at least 5 mineral pairs. It is encouraging to
note that partition coefficients derived from the whole data set (total average) are very similar to the values derived
from the subset of our preferred samples (preferred average). The range of partition coefficients for Zr, Sr and Pb
has already been discussed, so that the spread of DAMP/CPX for Zr is mostly a function of the crystal chemistry of
amphibole (tetrahedral Al varies strongly in amphibole, but is almost non-existent in all clinopyroxenes), whereas
for Sr and Pb the bias between total average values and preferred values is attributed to the incorporation of
disequilibrium samples in the former value.
Partition coefficients for Nb, Ba, Ce, Th and U are more uncertain since concentrations are extremely low (mostly
<100 ppb) in either one (e.g. Ba in clinopyroxene) or both phases. In these cases standard deviations for single
analyses are very high and contamination cannot be totally excluded. Our preferred samples are subject to the same
problems, so we recommend the use of the total averages of the partition coefficients since they represent a larger
data set with better absolute counting statistics. These values are the best estimate until future studies can
incorporate data with standard deviations <25% at the 1-100 ppb concentration level.
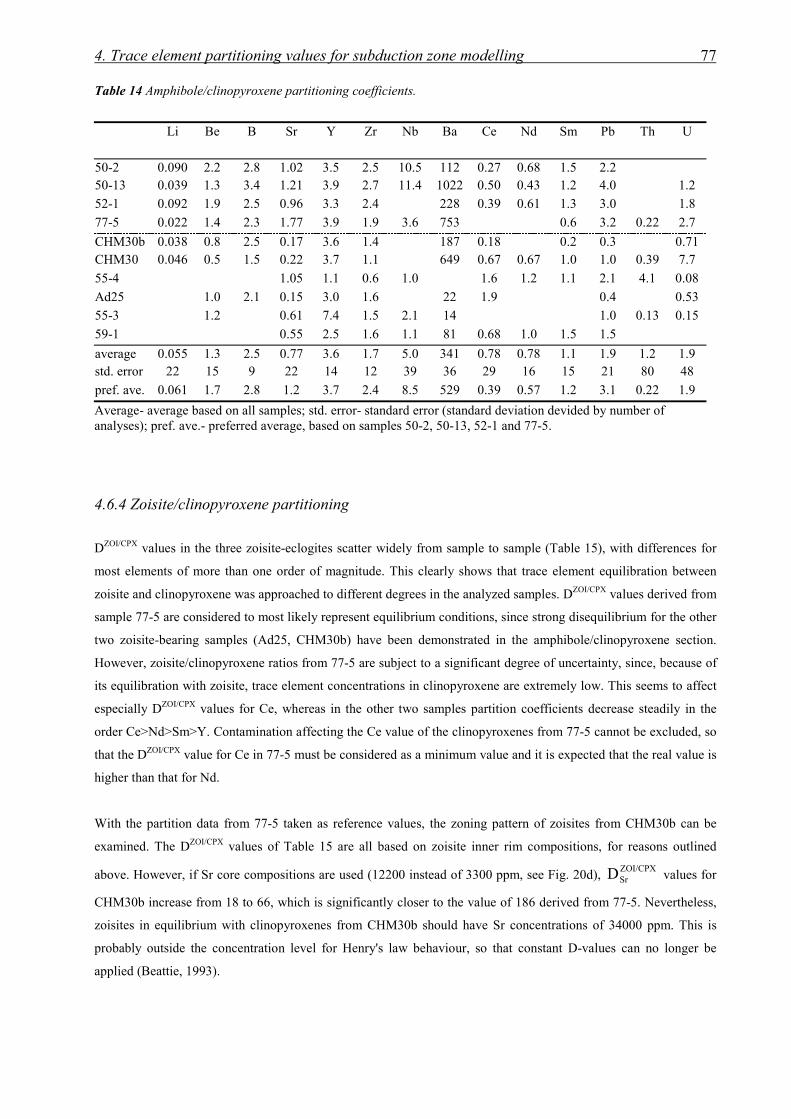
4. Trace element partitioning values for subduction zone modelling 77
Table 14 Amphibole/clinopyroxene partitioning coefficients.
Li Be B Sr Y Zr Nb Ba Ce Nd Sm Pb Th U
50-2 0.090 2.2 2.8 1.02 3.5 2.5 10.5 112 0.27 0.68 1.5 2.250-13 0.039 1.3 3.4 1.21 3.9 2.7 11.4 1022 0.50 0.43 1.2 4.0 1.2
52-1 0.092 1.9 2.5 0.96 3.3 2.4 228 0.39 0.61 1.3 3.0 1.8
77-5 0.022 1.4 2.3 1.77 3.9 1.9 3.6 753 0.6 3.2 0.22 2.7
CHM30b 0.038 0.8 2.5 0.17 3.6 1.4 187 0.18 0.2 0.3 0.71CHM30 0.046 0.5 1.5 0.22 3.7 1.1 649 0.67 0.67 1.0 1.0 0.39 7.7
55-4 1.05 1.1 0.6 1.0 1.6 1.2 1.1 2.1 4.1 0.08
Ad25 1.0 2.1 0.15 3.0 1.6 22 1.9 0.4 0.53
55-3 1.2 0.61 7.4 1.5 2.1 14 1.0 0.13 0.15
59-1 0.55 2.5 1.6 1.1 81 0.68 1.0 1.5 1.5
average 0.055 1.3 2.5 0.77 3.6 1.7 5.0 341 0.78 0.78 1.1 1.9 1.2 1.9std. error 22 15 9 22 14 12 39 36 29 16 15 21 80 48
pref. ave. 0.061 1.7 2.8 1.2 3.7 2.4 8.5 529 0.39 0.57 1.2 3.1 0.22 1.9
Average- average based on all samples; std. error- standard error (standard deviation devided by number ofanalyses); pref. ave.- preferred average, based on samples 50-2, 50-13, 52-1 and 77-5.
4.6.4 Zoisite/clinopyroxene partitioning
DZOI/CPX values in the three zoisite-eclogites scatter widely from sample to sample (Table 15), with differences for
most elements of more than one order of magnitude. This clearly shows that trace element equilibration between
zoisite and clinopyroxene was approached to different degrees in the analyzed samples. DZOI/CPX values derived from
sample 77-5 are considered to most likely represent equilibrium conditions, since strong disequilibrium for the other
two zoisite-bearing samples (Ad25, CHM30b) have been demonstrated in the amphibole/clinopyroxene section.
However, zoisite/clinopyroxene ratios from 77-5 are subject to a significant degree of uncertainty, since, because of
its equilibration with zoisite, trace element concentrations in clinopyroxene are extremely low. This seems to affect
especially DZOI/CPX values for Ce, whereas in the other two samples partition coefficients decrease steadily in the
order Ce>Nd>Sm>Y. Contamination affecting the Ce value of the clinopyroxenes from 77-5 cannot be excluded, so
that the DZOI/CPX value for Ce in 77-5 must be considered as a minimum value and it is expected that the real value is
higher than that for Nd.
With the partition data from 77-5 taken as reference values, the zoning pattern of zoisites from CHM30b can be
examined. The DZOI/CPX values of Table 15 are all based on zoisite inner rim compositions, for reasons outlined
above. However, if Sr core compositions are used (12200 instead of 3300 ppm, see Fig. 20d), ZOI/CPXSrD values for
CHM30b increase from 18 to 66, which is significantly closer to the value of 186 derived from 77-5. Nevertheless,
zoisites in equilibrium with clinopyroxenes from CHM30b should have Sr concentrations of 34000 ppm. This is
probably outside the concentration level for Henry's law behaviour, so that constant D-values can no longer be
applied (Beattie, 1993).
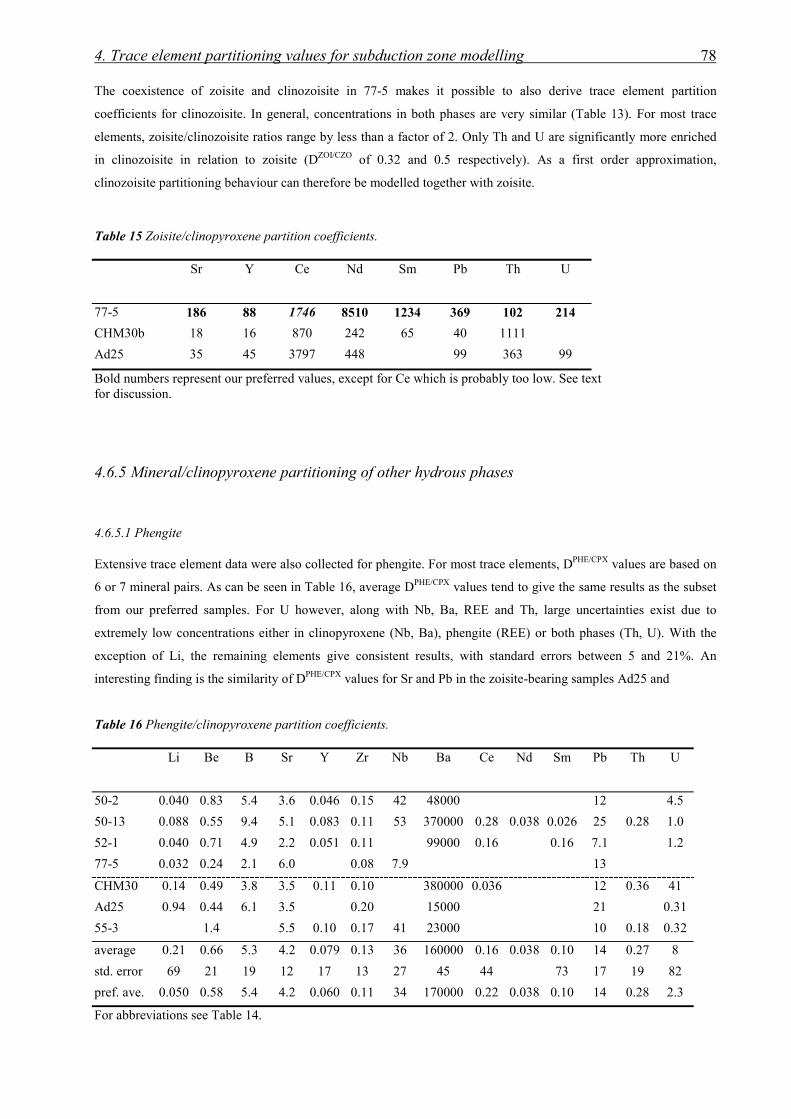
4. Trace element partitioning values for subduction zone modelling 78
The coexistence of zoisite and clinozoisite in 77-5 makes it possible to also derive trace element partition
coefficients for clinozoisite. In general, concentrations in both phases are very similar (Table 13). For most trace
elements, zoisite/clinozoisite ratios range by less than a factor of 2. Only Th and U are significantly more enriched
in clinozoisite in relation to zoisite (DZOI/CZO of 0.32 and 0.5 respectively). As a first order approximation,
clinozoisite partitioning behaviour can therefore be modelled together with zoisite.
Table 15 Zoisite/clinopyroxene partition coefficients.
Sr Y Ce Nd Sm Pb Th U
77-5 186 88 1746 8510 1234 369 102 214
CHM30b 18 16 870 242 65 40 1111
Ad25 35 45 3797 448 99 363 99
Bold numbers represent our preferred values, except for Ce which is probably too low. See textfor discussion.
4.6.5 Mineral/clinopyroxene partitioning of other hydrous phases
4.6.5.1 Phengite
Extensive trace element data were also collected for phengite. For most trace elements, DPHE/CPX values are based on
6 or 7 mineral pairs. As can be seen in Table 16, average DPHE/CPX values tend to give the same results as the subset
from our preferred samples. For U however, along with Nb, Ba, REE and Th, large uncertainties exist due to
extremely low concentrations either in clinopyroxene (Nb, Ba), phengite (REE) or both phases (Th, U). With the
exception of Li, the remaining elements give consistent results, with standard errors between 5 and 21%. An
interesting finding is the similarity of DPHE/CPX values for Sr and Pb in the zoisite-bearing samples Ad25 and
Table 16 Phengite/clinopyroxene partition coefficients.
Li Be B Sr Y Zr Nb Ba Ce Nd Sm Pb Th U
50-2 0.040 0.83 5.4 3.6 0.046 0.15 42 48000 12 4.5
50-13 0.088 0.55 9.4 5.1 0.083 0.11 53 370000 0.28 0.038 0.026 25 0.28 1.0
52-1 0.040 0.71 4.9 2.2 0.051 0.11 99000 0.16 0.16 7.1 1.2
77-5 0.032 0.24 2.1 6.0 0.08 7.9 13
CHM30 0.14 0.49 3.8 3.5 0.11 0.10 380000 0.036 12 0.36 41
Ad25 0.94 0.44 6.1 3.5 0.20 15000 21 0.31
55-3 1.4 5.5 0.10 0.17 41 23000 10 0.18 0.32
average 0.21 0.66 5.3 4.2 0.079 0.13 36 160000 0.16 0.038 0.10 14 0.27 8
std. error 69 21 19 12 17 13 27 45 44 73 17 19 82
pref. ave. 0.050 0.58 5.4 4.2 0.060 0.11 34 170000 0.22 0.038 0.10 14 0.28 2.3
For abbreviations see Table 14.

4. Trace element partitioning values for subduction zone modelling 79
CHM30a compared with the values from our preferred samples. For Ad25 and CHM30a, this implies a close
approach towards equilibrium between phengite and clinopyroxene, which in turn has the consequence that phengite
cannot be in equilibrium with zoisite and amphibole, as these phases have been shown to be in disequilibrium with
clinopyroxene.
4.6.5.2 Paragonite and apatite
LAM measurements of paragonite and apatite were performed in four samples for a limited range of trace elements
(Tables 17 and 18). In our preferred samples (50-2, 50-13, 52-1), trace element partitioning between paragonite and
clinopyroxene as well as between apatite and clinopyroxene suggests a close approach to equilibrium, as indicated
by similar paragonite/clinopyroxene and apatite/clinopyroxene values, respectively, between the different samples.
Large discrepancies occur only for Li partitioning between paragonite and clinopyroxene. However, partition
coefficients in the second choice sample, 50-14, are significantly different for DPAR/CPX for B and DAPA/CPX for REE
(Ce, Sm, Nd) with respect to our preferred samples. Nonetheless, trends in REE partitioning behaviour can be
observed in all samples, with a systematic decrease in DAPA/CPX in the order Ce>Nd>Sm>Y. At this stage we cannot
evaluate if discrepancies in sample 50-14 compared to our preferred values are caused by disequilibrium processes
or by the unusually high jadeite content in clinopyroxene. The latter could militate against the incorporation of REE
on the M2 site and therefore increase DAPA/CPX for REE, whereas disequilibrium is indicated by the presence of
kyanite relics in paragonite, which indicate that the paragonite grew after the main eclogite-facies mineralogy
(Chapter 2).
Table 17 Paragonite/clinopyroxene partition coefficients.
Li Be B Sr Y Zr Nb Ba Ce Sm Pb Th U
50-2 38 0.047 0.14 11 5419 0.010 0.063 24
50-13 1.0 3.6 36 36 1.9 10 85
52-1 0.15 3.7 23 15 0.41 46
50-14 0.18 2.4 2.8 46 0.024 0.042 2.5 0.12 0.024 26 0.14 0.69
average 0.44 3.2 21 34 0.036 0.63 8.1 5419 0.064 0.044 45 0.14 0.69
std. error 63 13 47 20 33 70 35 85 44 32
For abbreviations see Table 14.
Table 18 Apatite/clinopyroxene partition coefficients.
Sr Y Ce Nd Sm Pb Th U
50-2 41 88 227 215 164 15 332
50-13 35 107 230 173 145 32 17 200
52-1 41 77 412 274 152 13 18 125
50-14 47 101 1031 608 313 16 57 127
average 41 93 475 318 194 19 31 196std. error 6 7 40 31 21 23 43 25
For abbreviations see Table 14.

4. Trace element partitioning values for subduction zone modelling 80
4.6.5.3 Talc
Trace element concentrations of talc have been analyzed in one sample (55-4, Table 13). For all measured elements,
concentrations were extremely low (<100 ppb) and commonly below the calculated detection limits. Partition
coefficients between talc and clinopyroxene have not been tabulated since partition coefficients between amphibole
and clinopyroxene in 55-4 commonly deviate from our preferred values (see above). However, DTLC/CPX values from
sample 55-4 suggest talc canot incorporate a large range of incompatible elements.
4.7 Mechanisms of trace element equilibration
4.7.1 Equilibration processes
A subset of our sample suite (50-2, 50-13, 52-1 and 77-5), carefully chosen through a combination of textural
criteria, high resolution backscattered observation and electron microprobe major element measurements, gives
consistent trace element partitioning values for a range of elements at different concentration levels that we interpret
as a strong argument for close attainment of equilibrium. The most important characteristic of these samples is a
preferred orientation of all eclogite-facies phases. We can therefore support the observation of Messiga et al. (1995)
that synmetamorphic plastic deformation enhances trace element equilibration processes. Messiga et al. favoured a
process of higher surface reaction exchange rates due to the continuous production of crystal defects and
dislocations during plastic deformation.
The presence of a free fluid phase along grain boundaries is expected to be a prerequisite for attaining equilibration
(Jamtveit et al., 1990; Dipple & Ferry, 1992), but from our studies we can infer that it does not enhance equilibration
processes as efficiently as plastic deformation. We have shown in a companion study that Cs-Rb-Ba systematics in
phengite and amphibole from Trescolmen eclogites indicate at least metre-scale fluid mobility during eclogite-facies
conditions (Chapter 2). These patterns are observed in both deformed and undeformed eclogites, e.g. also in 59-1.
Since a free fluid phase was present in both foliated and unfoliated eclogites, but attainment of equilibrium was
more pronounced in the deformed ones, the controlling process was more likely the deformation rate rather than the
presence of a free fluid. However, the interaction between deformation and fluid infiltration is very complex and
examples of both fluid induced deformation (Boundy et al., 1992; Erambert & Austrheim, 1993; Pennacchioni,
1996) as well as deformation enhancing fluid infiltration (Holness & Graham, 1995; Holness, 1997) have been
reported.
4.7.2 Reasons for lack of trace element equilibration
The gabbroic samples CHM30a and CHM30b afford insight into processes operating under eclogite facies
conditions that lead to disequilibrium features. In both samples, Sr has partition coefficients between some phases
significantly different to those in well equilibrated eclogites, specifically for amphibole/clinopyroxene partitioning
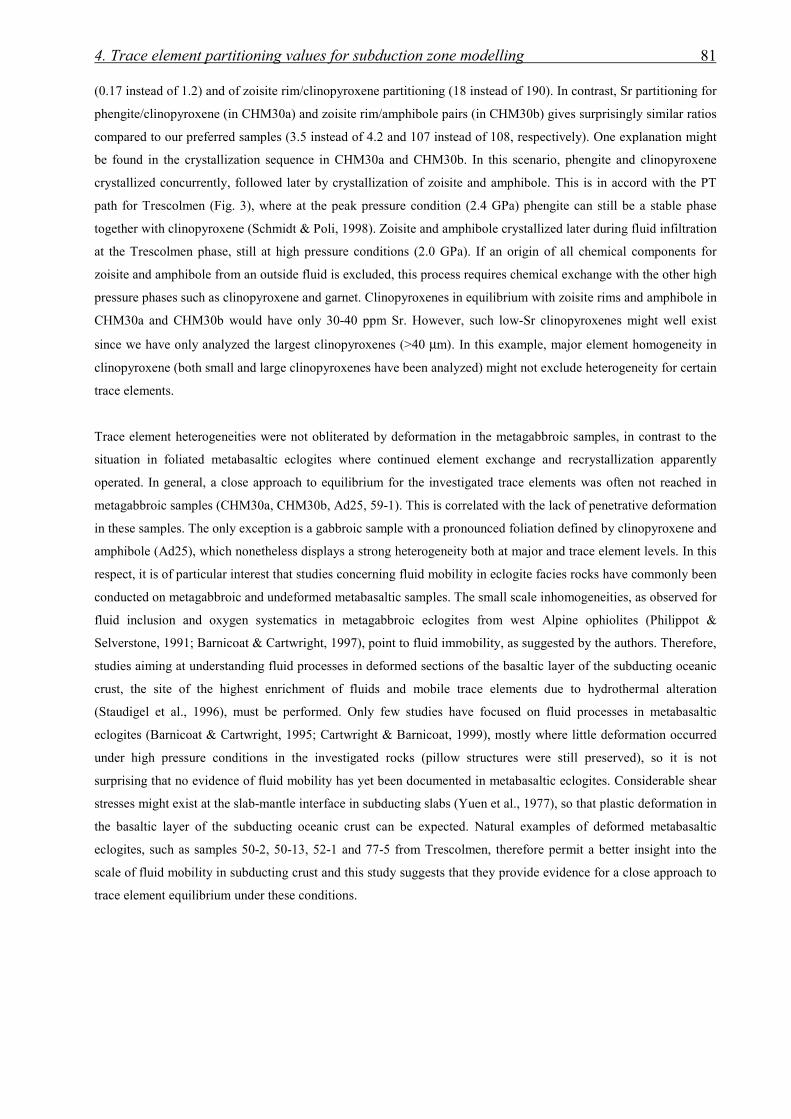
4. Trace element partitioning values for subduction zone modelling 81
(0.17 instead of 1.2) and of zoisite rim/clinopyroxene partitioning (18 instead of 190). In contrast, Sr partitioning for
phengite/clinopyroxene (in CHM30a) and zoisite rim/amphibole pairs (in CHM30b) gives surprisingly similar ratios
compared to our preferred samples (3.5 instead of 4.2 and 107 instead of 108, respectively). One explanation might
be found in the crystallization sequence in CHM30a and CHM30b. In this scenario, phengite and clinopyroxene
crystallized concurrently, followed later by crystallization of zoisite and amphibole. This is in accord with the PT
path for Trescolmen (Fig. 3), where at the peak pressure condition (2.4 GPa) phengite can still be a stable phase
together with clinopyroxene (Schmidt & Poli, 1998). Zoisite and amphibole crystallized later during fluid infiltration
at the Trescolmen phase, still at high pressure conditions (2.0 GPa). If an origin of all chemical components for
zoisite and amphibole from an outside fluid is excluded, this process requires chemical exchange with the other high
pressure phases such as clinopyroxene and garnet. Clinopyroxenes in equilibrium with zoisite rims and amphibole in
CHM30a and CHM30b would have only 30-40 ppm Sr. However, such low-Sr clinopyroxenes might well exist
since we have only analyzed the largest clinopyroxenes (>40 µm). In this example, major element homogeneity in
clinopyroxene (both small and large clinopyroxenes have been analyzed) might not exclude heterogeneity for certain
trace elements.
Trace element heterogeneities were not obliterated by deformation in the metagabbroic samples, in contrast to the
situation in foliated metabasaltic eclogites where continued element exchange and recrystallization apparently
operated. In general, a close approach to equilibrium for the investigated trace elements was often not reached in
metagabbroic samples (CHM30a, CHM30b, Ad25, 59-1). This is correlated with the lack of penetrative deformation
in these samples. The only exception is a gabbroic sample with a pronounced foliation defined by clinopyroxene and
amphibole (Ad25), which nonetheless displays a strong heterogeneity both at major and trace element levels. In this
respect, it is of particular interest that studies concerning fluid mobility in eclogite facies rocks have commonly been
conducted on metagabbroic and undeformed metabasaltic samples. The small scale inhomogeneities, as observed for
fluid inclusion and oxygen systematics in metagabbroic eclogites from west Alpine ophiolites (Philippot &
Selverstone, 1991; Barnicoat & Cartwright, 1997), point to fluid immobility, as suggested by the authors. Therefore,
studies aiming at understanding fluid processes in deformed sections of the basaltic layer of the subducting oceanic
crust, the site of the highest enrichment of fluids and mobile trace elements due to hydrothermal alteration
(Staudigel et al., 1996), must be performed. Only few studies have focused on fluid processes in metabasaltic
eclogites (Barnicoat & Cartwright, 1995; Cartwright & Barnicoat, 1999), mostly where little deformation occurred
under high pressure conditions in the investigated rocks (pillow structures were still preserved), so it is not
surprising that no evidence of fluid mobility has yet been documented in metabasaltic eclogites. Considerable shear
stresses might exist at the slab-mantle interface in subducting slabs (Yuen et al., 1977), so that plastic deformation in
the basaltic layer of the subducting oceanic crust can be expected. Natural examples of deformed metabasaltic
eclogites, such as samples 50-2, 50-13, 52-1 and 77-5 from Trescolmen, therefore permit a better insight into the
scale of fluid mobility in subducting crust and this study suggests that they provide evidence for a close approach to
trace element equilibrium under these conditions.
4. Trace element partitioning values for subduction zone modelling 82
4.8 Concluding remarks
The partition coefficients from this study between eclogite facies hydrous phases (amphibole, zoisite/ clinozoisite,
phengite, paragonite, apatite) and clinopyroxene for a large suite of trace elements are intended to form a framework
for further modelling of the trace element composition of fluids liberated from dehydrating slabs. Despite the
problems that arise in the trace element analysis of metamorphic phases, we have demonstrated that reliable data can
be extracted with a careful selection of assemblages (dynamically recrystallized metabasalts) and detailed pre-
investigation with the electron microprobe (back scattered electron imaging, quantitative major element analysis).
The results of our study imply a dominant role of penetrative plastic deformation for the attainment of trace element
equilibration between the eclogite facies phases, reinforcing the suggestion that dynamic recrystallization enhances
reaction rates, bith at the surface and within crystals. Deformation is either facilitated by fluid infiltration or has
promoted fluid mobility; in both cases a free fluid phase is required as an agent to transfer the trace element between
the phases. Back scattered electron imaging has revealed a rich microtextural inventory in the investigated samples,
e.g. several generations of clinopyroxene, annealed cracks in garnet, complex zoning pattern in zoisite. These
examples clearly show that attempts to derive partition coefficients between coexisting phases by measuring rim-rim
compositions adjacent to apparently fresh grain boundaries cannot be considered reliable data unless microtextural
information is included.
Mass balance calculations reveal that zoisite, allanite, phengite and paragonite are important carriers for trace
elements in eclogite facies systems. From these phases, zoisite and phengite are of special importance since they are
probably widespread minor phases in subducting oceanic crust underneath volcanic arcs (Schmidt & Poli, 1998). In
the presence of zoisite, the element budget of Sr, Pb, LREE, Th and U is dominated by this phase, whereas phengite
is the most important carrier for Ba (and Rb, Cs; Chapter 2) and an important carrier for B, Sr and Pb. Therefore it is
essential to include DZoisite/Fluid and DPhengite/Fluid values for modelling concentrations of these trace elements in fluids
liberated from dehydrating oceanic crust. Caution regarding the lack of partition coefficients for many hydrous
phases has already been raised by Brenan et al. (1995a) in their models including only clinopyroxene, garnet and
amphibole partition coefficients. Our mass balance calculations have shown that amphibole, clinopyroxene and
garnet are insignificant carriers for LREE, Ba, Th and U in eclogite-facies metabasalts (<5% of the trace element
mass budget). In contrast, dehydration modelling based only on DClinopyroxene/Fluid and DGarnet/Fluid values (Brenan et al.,
1998) for the elements Li and Be correctly incorporate the most important phases in our eclogite samples (>80% of
the trace element mass budget) and are also a good approximation for B.
A major obstacle in combining our DMin/Clinopyroxene values with experimental DClinopyroxene/Fluid values are the different
chemical compositions of clinopyroxenes and PT conditions from the different data sets. Our samples are jadeite-
rich (25-55 mol% Jd) and have re-equilibrated at ca. 650°C/2.0 GPa whereas experimental clinopyroxenes are
diopside-rich (<10 mol% Jd) and crystallized at ≥900°C/≥2.0 GPa (Brenan et al., 1995a, 1995b, 1998; Stalder et al.,
1998). We can expect that extrapolation from experiments (diopsidic clinopyroxene, 900°C/2.0 GPa) to our
Trescolmen samples (omphacitic clinopyroxenes, 650°C/2.0 GPa) will require adjustment of experimentally
determined DClinopyroxene/Fluid values by applying correction factors of up to more than several orders of magnitude (for
variations in D-values due to T effects, e.g. see Brenan et al., 1994)

4. Trace element partitioning values for subduction zone modelling 83
Conditions as experienced by Trescolmen eclogites are similar, but not identical to typical subducting oceanic crust
underneath volcanic arcs. The largest difference to subducting slabs underneath the volcanic front are lower P at
about the same T conditions that result in some important differences in mineral parageneses. While phengite,
clinopyroxene and garnet are still stable phases under increased pressure conditions, paragonite and amphibole are
no longer stable and zoisite is replaced by lawsonite (Schmidt & Poli, 1998). Trace element partitioning data from
lawsonite-bearing assemblages are almost completely missing. In order to complement the partition coefficient data
set from this study and to enable calculation of complete dehydration models of subducting oceanic crust, further
studies on the trace element incorporation of allanite, zircon and lawsonite in eclogite and blueschist facies rocks are
highly desirable.

5. References 84
Chapter 5. References
Armstrong,. J. T., 1991. Quantitative elemental analysis of individual microparticles with electron beam
instruments. In: Heinrich, K. F. J., Newbury, D. E. (Eds.), Electron probe quantification. Plenum Press, New
York, pp. 261-315.
Ayers, J. C., Watson, E. B., 1993. Apatite/fluid partitioning of rare-earth elements and strontium: Experimental
results at 1.0 GPa and 1000°C and application to models of fluid-rock interaction. Chem. Geol. 110, 299-
314.
Ayers, J. C., Dittmer, S. K., Layne, G. D., 1997. Partitioning of elements between peridotite and H2O at 2.0-3.0 GPa
and 900-1100°C, and application to models of subduction zone processes. Earth Planet. Sci. Lett. 150, 381-
398.
Banner, J. L., Hanson G. N. (1990) Calculation of simultaneous isotopic and trace element variations during water-
rock interaction with applications to carbonate diagenesis. Geochim. Cosmochim. Acta 54, 3123-3137.
Barnicoat, A. C., Cartwright, I., 1995. Focused fluid flow during subduction: Oxygen isotope data from high-
pressure ophiolites of the Western Alps. Earth Planet. Sci. Lett. 132, 53-61.
Barnicoat, A. C., Cartwright, I., 1997. The gabbro-eclogite transformation: An oxygen isotope and petrographic
study of west Alpine ophiolites. J. Metamorphic Geol. 15, 93-104.
Baumgartner, L. P., Rumble, D. (1988) Transport of stable isotopes. I. Development of a kinetic continuum theory
for stable isotope transport. Contrib. Mineral. Petrol. 98, 417-430.
Beattie, P., 1993. On the occurrence of apparent non-Henry's Law behaviour in experimental partitioning studies.
Geochim. Cosmochim. Acta 57, 47-55.
Beattie, P., 1994. Systematics and energetics of trace-element partitioning between olivine and silicate melts:
Implications for the nature of mineral/melt partitioning. Chem. Geol. 117, 57-71.
Bebout, G. E. (1991) Field-based evidence for devolatilization in subduction zones: Implications for arc magmatism.
Science 251, 413-416.
Bebout, G. E., Barton, M. D. (1989) Fluid flow and metasomatism in a subduction zone hydrothermal system:
Catalina Schist terrane, California. Geology 17, 976-980.
Becker, J. S., Seifert, G., Saprykin, A., Dietze, H.-J., 1996. Mass spectrometric and theoretical investigations into
the formation of argon molecular ions in plasma mass spectrometry. J. Anal. Atom. Spectrom. 11, 643-648.
Ben Othman, D., White, W. M., Patchett J. (1989) The geochemistry of marine sediments, island arc magma
genesis, and crust-mantle recycling. Earth Planet. Sci. Lett. 94, 1-21.
Berger, G., Schott, J., Guy, C. (1988) Behaviour of Li, Rb and Cs during basalt glass and olivine dissolution and
chlorite, smectite and zeolite precipitation from seawater: Experimental investigations and modelization
between 50° and 300°. Chem. Geol. 71, 297-312.
Berman, R. G. (1990) Mixing properties of Ca-Mg-Fe garnets. Am. Mineral. 75, 328-344.
Beswick, A. E., 1973. An experimental study of alkali metal distributions in feldspars and micas. Geochim.
Cosmochim. Acta 37, 183-208.
Bickle, M. J., McKenzie, D. (1987) The transport of heat and matter by fluids during metamorphism. Contrib.
Mineral. Petrol. 95, 384-392.
Blundy, J., Wood, B., 1994. Prediction of crystal-melt partition coefficients from elastic moduli. Nature 372, 452-
454.

5. References 85
Bohlen, S. R., Liotta, J. J., 1986. A barometer for garnet amphibolites and garnet granulites. J. Petrol. 27, 1025-
1034.
Boundy, T. M., Fountain, D. M., Austrheim, H., 1992. Structural development and petrofabrics of eclogite facies
shear zones, Bergen Arcs, western Norway: Implications for deep crustal deformational processes. J.
Metamorphic Geol. 10, 127-146.
Brenan, J. M., Ryerson, F. J., Shaw, H. F., 1998. The role of aqueous fluids in the slab-to-mantle transfer of boron,
beryllium, and lithium during subduction: Experiments and models. Geochim. Cosmochim. Acta 62, 3337-
3347.
Brenan, J. M., Shaw, H. F., Phinney, D. L., Ryerson, F. J., 1994. Rutile-aqueous fluid partitioning of Nb, Ta, H, Zr,
U and Th: Implications for high field strength element depletions in island-arc basalts. Earth Planet. Sci. Lett.
128, 327-339.
Brenan, J. M., Shaw, H. F., Ryerson, F. J., Phinney, D. L., 1995a. Mineral-aqueous fluid partitioning of trace
elements at 900°C and 2.0 GPa: Constraints on the trace element chemistry of mantle and deep crustal
fluids. Geochim. Cosmochim. Acta 59, 3331-3350.
Brenan, J. M., Shaw, H. F., Ryerson, F. J., 1995b. Experimental evidence for the origin of lead enrichment in
convergent-margin magmas. Nature 389, 54-56.
Briqueu, L., Bougault, H. and Joron, J. L., 1984. Quantification of Nb, Ta, Ti and V anomalies in magmas
associated with subduction zones: Petrogenetic implications. Earth Planet. Sci. Lett. 68, 297-308.
Brumm, R. C., Foley, S. F., Tiepolo, M., Vannucci, R. (1998) Trace element distribution between richteritic
amphiboles and silicate melts, and contrasts to their behaviour in calcic amphiboles. Mineral. Mag. 62A,
250-251.
Buatier, M., Roermund, H. L. M. v., Drury, M. R., Lardeaux, J. M., 1991. Deformation and recrystallization
mechanism in naturally deformed omphacites from the Sesia-Lanzo zone; geophysical consequences.
Tectonophysics 195, 11-27.
Cartwright, I., Barnicoat, A. C., 1999. Stable isotope geochemistry of Alpine ophiolites: A window to ocean-floor
hydrothermal alteration and constraints on fluid-rock interaction during high-pressure metamorphism. Int. J.
Earth Sci. 88, 219-235.
Clague, D. A., Frey, F. A., Thompson, G., Rindge, S., 1981. Minor and trace element geochemistry of volcanic
rocks dredged from the Galapagos spreading center: Role of crystal fractionation and mantle heterogeneity.
J. Geophys. Res. 86, 9469-9482.
Creaser, R. A., Heaman, L. M.,, Erdmer, P., 1997. Timing of high-pressure metamorphism in the Yukon-Tanana
terrane, Canadian Cordillera: Constraints from U-Pb zircon dating of eclogite from the Teslin tectonic zone.
Can. J. Earth Sci. 34, 709-715.
Davies, J. H., Stevenson, D. J. (1992) Physical model of source region of subduction zone volcanics. J. Geophys.
Res. 97, 2037-2070.
Deer, W. A., Howie, R. A., Zussmann, J., 1992. An introduction to rock-forming minerals. Longmans Scientific &
Technical. 696 pp.
Dipple, G. M., Ferry, J. M., 1992. Metasomatism and fluid flow in ductile fault zones. Contrib. Mineral. Petrol. 112,
149-164.
Domanik, K. J., Hervig, R. L., Peacock, S. M., 1993. Beryllium and boron in subduction zone minerals: An ion
microprobe study. Geochim. Cosmochim. Acta 57, 4997-5010.

5. References 86
Eggins, S. M., Woodhead, J. D., Kinsley, L. P. J., Mortimer, G. E., Sylvester, P., McCulloch, M. T., Hergt, J. M.,
Handler, M. R., 1997. A simple method for precise determination of ≥40 trace elements in geological samples
by ICPMS using enriched isotope internal standardisation. Chem. Geol. 134, 311-326.
Erambert, M., Austrheim, H., 1993. The effect of fluid and deformation on zoning and inclusion patterns in ploy-
metamorphic garnets. Contrib. Mineral. Petrol. 115, 204-214.
Ernst, W. G., Liu, J., 1998. Experimental phase-equilibrium study of Al- and Ti-contents of calcic amphibole in
MORB- A semiquantitative thermobarometer. Am. Mineral. 83, 952-969.
Ferry, J. M., Gerdes, M. L. (1998) Chemically reactive fluid flow during metamorphism. Ann. Rev. Earth Planet.
Sci. 26, 255-287.
Fett, A., 1995. Elementverteilung zwischen Granat, Klinopyroxen und Rutil in Eklogiten- Experiment und Natur.
Ph.D. dissertation, Universität Mainz.
Fialin, M., Outrequin, M., Staub, P.-F., 1997. A new tool to treat overlaps in electron-probe microanalysis of rare-
earth elements L-series X-rays. Eur. J. Mineral. 9, 965-968.
Fialin, M., Remy, H., Richard, C., Wagner, C., 1999. Trace element analysis with the electron microprobe: New
data and perspectives. Am. Mineral. 84, 70-77.
Fitton, J. G., 1995. Coupled molybdenum and niobium depletion in continental basalts. Earth Planet. Sci. Lett. 136,
715-721.
Foley, S. F., Jackson, S. E., Fryer, B. J., Greenough, J. D., Jenner, G. A. (1996) Trace element partition coefficients
for clinopyroxene and phlogopite in an alkaline lamprophyre from Newfoundland by LAM-ICP-MS.
Geochim. Cosmochim. Acta 60, 629-638.
Force, E. R., 1980. The provenance of rutile. J. Sediment. Petrol. 50, 485-488.
Franz, G., Selverstone, J., 1992. An empirical phase diagram for the clinozoisite-zoisite transformation in the system
Ca2Al3Si3O12(OH)-Ca2Al2Fe3+Si3O12(OH). Am. Mineral. 77, 631-642.
Froitzheim, N., Schmid, S. M., Frey, M., 1996. Mesozoic paleogeography and the timing of eclogite-facies
metamorphism in the alps: A working hypothesis. Eclogae geol. Helv. 89, 81-110.
Fryer, B. J., Jackson, S. E., Longerich, H. P., 1995. The design, operation and role of laser ablation microprobe
coupled with an inductively coupled plasma-mass spectrometer (LAM-ICP-MS) in the Earth sciences. Can.
Mineral. 33, 303-312.
Getty, S. R., Selverstone, J., 1994. Stable isotopic and trace element evidence for restricted fluid migration in 2 GPa
eclogites. J. Metamorphic Geol. 12, 747-760.
Godard, G., Roermund, H. L. M. v., 1995. Deformation-induced clinopyroxene fabrics from eclogites. J. Struc.
Geol. 17, 1425-1443.
Graham, C. M., 1976. Petrochemistry and tectonic significance of Dalradian metabasaltic rocks of the SW Scottish
Highlands. J. Geol. Soc., London 132, 61-84.
Green, T. H., 1995. Significance of Nb/Ta as an indicator of geochemical processes in the crust-mantle system.
Chem. Geol. 120, 347-359.
Green, T. H., Pearson, N. J., 1987. An experimental study of Nb and Ta partitioning between Ti-rich minerals and
silicate melts at high pressure and temperature. Geochim. Cosmochim. Act 51, 55-62.
Guidotti, C. V., Sassi, F. P., 1998. Miscellaneous isomorphous substitutions in Na-K white micas: A review, with
special emphasis to metamorphic micas. Rend. Lin., Sci. Fis. Nat. 9, 57-78.
Haggerty, S. E., 1991. Oxide mineralogy of the upper mantle. In: Lindsley, D.H. (Ed), Oxide minerals: Petrological
and and magnetic significance. Reviews in Mineralogy 25, 355-416.
5. References 87
Heinrich, C. A., 1982. Kyanite-eclogite to amphibolite facies evolution of hydrous mafic and pelitic rocks, Adula
nappe, Central Alps. Contrib. Mineral. Petrol. 81, 30-38.
Heinrich, C. A. (1983) Die regionale Hochdruckmetamorphose der Aduladecke, Zentralalpen, Schweiz. Ph.D., ETH
Zürich.
Heinrich, C. A., 1986. Eclogite facies regional metamorphism of hydrous mafic rocks in the Central Alpine Adula
Nappe. J. Petrol. 27, 123-154.
Hickmott, D. D., Shimizu, N., 1990. Trace element zoning in garnet from the Kwoiek Area, British Columbia:
Disequilibrium partitioning during garnet growth. Contrib. Mineral. Petrol. 104, 619-630.
Hickmott, D. D., Sorensen, S. S. & Rogers, P. S. Z., 1992. Metasomatism in a subduction complex: Constraints
from microanalysis of trace elements in minerals from garnet amphibolite from the Catalina Schist. Geology
20, 347-350.
Hofmann, A. W., White, W. M., 1983. Ba, Rb and Cs in the earth's mantle. Z. Naturforsch. 38a, 256-266.
Holness, M. B., 1997. Fluid flow paths and mechanisms of fluid infiltration in carbonates during contact
metamorphism: The Beinn an Dubhaich aureole, Skye. J. Metamorphic Geol. 15, 59-70.
Holness, M. B., Graham, C. M., 1995. P-T-X effects on equilibrium carbonate-H2O-CO2-NaCl dihedral angles:
Constraints on carbonate permeability and the role of deformation during fluid infiltration. Contrib. Mineral.
Petrol. 119, 301-313.
Horn, I., Hinton, R. W., Jackson, S. E., Longerich, H. P., 1997. Ultra-trace element analysis of NIST SRM 616
using laser ablation microprobe-inductively coupled plasma-mass spectrometry (LAM-ICP-MS): A
comparison with secondary ion mass spectrometry (SIMS). Geostand. Newsl. 21, 191-203.
Hurford, A. J., Carter, A., 1991. The role of fission track dating in discrimination of provenance. In: Morton, A. C.,
Todd, S. P., Haughton, P. D. W. (Eds.), Developments in sedimentary provenance studies. Geological Society
Special Publication 57, 67-78.
Icenhower, J., London, D. (1995) An experimental study of element partitioning among biotite, muscovite, and
coexisting peraluminous silicic melt at 200 MPa (H2O). Am. Mineral. 80, 1229-1251.
Ishikawa, T., Nakamura, E. (1994) Origin of the slab component in arc lavas from across-arc variation of B and Pb
isotopes. Nature 370, 205-208.
Ishikawa, T., Tera, F. (1997) Source, composition and distribution of the fluid in the Kurile mantle wedge:
Constraints from across-arc variations of B/Nb and B isotopes. Earth Planet. Sci. Lett. 152, 123-138
Ito, E., Harris, H., Anderson, A. T., 1983. Alteration of oceanic crust and geologic cycling of chlorine and water.
Geochim. Cosmochim. Act 47, 1613-1624.
Jackson, S. E., Longerich, H. P., Dunning, G. R., Fryer, B. J., 1992. The application of laser ablation microprobe
inductively coupled plasma-mass spectrometry to in situ trace element determinations in minerals. Can.
Mineral. 30, 1049-1064.
Jamtveit, B., Bucher-Nurminen, K., Austrheim, H., 1990. Fluid controlled eclogitization of granulites in deep crustal
shear zones, Bergen arcs, Western Norway. Contrib. Mineral. Petrol. 104, 184-193.
Jenner, G. A., Foley, S. F., Jackson, S. E., Green, T. H., Fryer, B. J., 1993. Determination of partition coefficients
for trace elements in high pressure-temperature experimental run products by laser ablation microprobe-
inductively coupled plasma-mass spectrometry (LAM-ICP-MS). Geochim. Cosmochim. Act 58, 5099-5103.
Jochum, K. P., Hofmann, A. W., 1997. Constraints on earth evolution from antimony in mantle-derived rocks.
Chem. Geol. 139, 39-49.

5. References 88
Jochum, K. P., Hofmann, A. W., Seufert, H. M., 1993. Tin in mantle-derived rocks: Constraints on Earth evolution.
Geochim. Cosmochim. Acta. 57, 3585-3595.
Jochum, K. P., Verma, S. P., 1996. Extreme enrichment of Sb, Tl and other trace elements in altered MORB. Chem.
Geol. 130, 289-299.
Kretz, R., Campbell, J. L., Hoffman, E. L., Hartree, R., Teesdale, W. J., 1999. Approaches to equilibrium in the
distribution of trace elements among the principal minerals in a high-grade metamorphic terrane. J.
Metamorphic Geol. 17, 41-59.
Kurz, W., Neubauer, F., Dachs, E., 1998a. Eclogite meso- and microfabrics: Implications for the burial and
exhumation history of eclogites in the Tauern Window (eastern Alps) from P-T-d paths. Tectonophysics
285, 183-209.
Kurz, W., Neubauer, F., Genser, J., Dachs, E., 1998b. Alpine geodynamic evolution of passive and active
continental margin sequences in the Tauern Window (eastern Alps, Austria, Italy): A review. Geologische
Rundschau 87, 225-242.
Lardeaux, J. M., Caron, J.-M., Nisio, P., Péquignot, G., Boudeulle, M., 1986. Microstructural criteria for reliable
thermometry in low temperature eclogites. Lithos 19, 187-203.
LaTourrette, T., Hervig, R. L., Holloway, J. R., 1995. Trace element partitioning between amphibole, phlogopite,
and basanite melt. Earth Planet. Sci. Lett. 135, 13-30.
Leake, B. E., Wooley, A. R., Arps, C. E. S., Birch, W. D., Gilbert, M. C., Grice, J. D., Hawthorne, F. C., Kato, A.,
Kisch, H. J., Krivovichev, V. G., Linthout, K., Laird, J., Mandarino, J. A., Maresch, W. V., Nickel, E. H.,
Rock, N. M. S., Schumacher, J. C., Smith, D. C., Stephenson, N. C. N., Ungaretti, L., Whittaker, E. J. W.,
Youzhi, G., 1997. Nomenclature of Amphiboles: Report of the subcommittee on amphibole of the
International Mineralogical Association, Commission on New Minerals and Mineral Names. Can. Mineral.
35, 219-246.
Lihou, J. C., Mange-Rajetzky, M. A., 1996. Provenance of the Sardona Flysch, eastern Swiss Alps: Example of
high-resolution heavy mineral analysis applied to an ultrastable assemblage. Sediment. Geol. 105, 141-157.
Longerich, H. P., Guenther, D., Jackson, S. E., 1996. Elemental fractionation in laser ablation inductively coupled
plasma mass spectrometry. Fresenius J. Anal. Chem. 355, 538-542.
Manning, C. E., 1998. Fluid composition at the blueschist-eclogite transition in the model system Na2O-MgO-
Al2O3-SiO2-H2O-HCl. Schweiz. Mineral. Petrogr. Mitt. 78, 225-242.
Matthews, A., Liati, A., Mposkos, E., Skarpelis, N. (1996) Oxygen isotope geochemistry of the Rhodope
polymetamorphic terrain in northern Greece: Evidence for preservation of pre-metamorphic isotopic
compositions. Eur. J. Mineral. 8, 1139-1152.
May, T. W., Wiedmeyer, R. H., 1998. A table of polyatomic interferences in ICP-MS. Atomic Spectroscopy 19,
150-155.
McCulloch, M. T., Gamble, JA (1991) Geochemical and geodynamical constraints on subduction zone magmatism.
Earth. Planet. Sci. Lett. 102, 358-374.
McDonough, W. F., 1991. Partial melting of subducted oceanic crust and isolation of its residual eclogitic lithology.
Phil. Trans. R. Soc. Lond. A 335, 407-418.
McDonough, W. F., 1999. How well do we know the siderophile element signature of the silicate earth?. EOS 80,
250.
McDonough, W. F., Sun S. (1995) The composition of the Earth. Chem. Geol. 120, 223-253.

5. References 89
Melson, W. G., Byerly, G. R., Nelen, J. A., O'Hearn, T., Wright, T. L., Vallier, T., 1977. A catalog of the major
element chemistry of abyssal glasses. Smithsonian Contrib. Earth Sci. 19, 31-60.
Melzer, S., Gottschalk, M., Heinrich, W., 1998. Experimentally determined partitioning of Rb between richterites
and aqueous (Na, K)-chloride solutions. Contrib. Mineral. Petrol. 133, 315-328.
Melzer, S., Wunder, B., 1999. Experimentally determined K-Rb-Cs exchange coefficients between micas,
amphiboles and aqueous chloride solutions between 0.2 and 4 GPa. EOS 80, 361.
Messiga, B., Kienast, J. R., Rebay, G., Riccardi, M. P., Tribuzio, R., 1999. Cr-rich magnesiochloritoid eclogites
from the Monviso ophiolites (Western Alps, Italy). J. Metamorphic Geol. 17, 287-299.
Messiga, B., Tribuzio, R., Bottazzi, P., Ottolini, L., 1995. An ion microprobe study on trace element composition of
clinopyroxenes from blueschist and eclogitized Fe-Ti-gabbros, Ligurian Alps, northwestern Italy: Some
petrologic considerations. Geochim. Cosmochim. Acta 59, 59-75.
Meyre, C., de Capitani, C., Partzsch, J. H., 1997. A ternary solid solution model for omphacite and its application to
geothermobarometry of eclogites from the Middle Adula nappe (Central Alps, Switzerland). J. Metamorphic
Geol. 15, 687-700.
Meyre, C., de Capitani, C., Zack, T., Frey, M., 1999. Petrology of high-pressure metapelites from the Adula nappe
(Central Alps, Switzerland). J. Petrol. 40, 199-213.
Meyre, C., Frey, M., 1998. Eclogite facies metamorphism and deformation of the middle Adula nappe (Central
Alps, Switzerland): Excursion to Trescolmen. Schweiz. Mineral. Petrogr. Mitt. 78, 355-362.
Meyre, C., Puschnig, A. R., 1993. High-pressure metamorphism and deformation at Trescolmen, Adula nappe,
Central Alps. Schweiz. Mineral. Petrogr. Mitt. 73, 277-283.
Mezger, K., Hanson, G. N., Bohlen, S. R., 1989. High-precision U-Pb ages of metamorphic rutile: Application to
cooling history of high-grade terranes. Earth Planet. Sci. Lett. 96, 106-118.
Miller, C., Stosch, H.-G., Hoernes, S., 1988. Geochemistry and origin of eclogites from the type locality Koralpe
and Saualpe, Eastern Alps, Austria. Chem. Geol. 67, 103-118.
Miller, C., Thöni, M., 1995. Origin of eclogites from the Austroalpine Ötztal basement (Tirol, Austria):
Geochemistry and Sm-Nd vs. Rb-Sr isotope systematics. Chem. Geol. 122, 199-225.
Moriguti, T., Nakamura, E. (1998) Across-arc variation of Li isotopes in lavas and implications for crust/mantle
recycling at subduction zones. Earth Planet. Sci. Lett. 163, 167-174.
Morimoto, N., Fabries, J., Ferguson, A.K., Ginzburg, I.V., Ross, M., Seifert, F.A, Zussman, J., 1988. Nomenclature
of pyroxene. Am. Mineral. 73, 1123-1133.
Morton, A. C., 1991. Geochemical studies of detrital heavy minerals and their application to provenance analysis.
In: Morton, A. C., Todd, S. P., Haughton, P. D. W. (Eds.), Developments in sedimentary provenance studies.
Geological Society Special Publication 57, 31-45.
Muehlenbachs, K. (1986) Alteration of the oceanic crust and the δ18O history of seawater. In: Valley, J. W., Taylor,
H. P. Jr., O’Neill, J. R. (eds) Stable isotopes in high temperature geological processes. Rev. Mineral. 16,
425-444.
Münker, C., 1998. Nb/Ta fractionation in a Cambrian arc/back arc system, New Zealand: Source constraints and
application of refined ICPMS techniques. Chem. Geol. 144, 23-45.
Nabelek, P. I. (1987) General equations for modeling fluid/rock interaction using trace elements and isotopes.
Geochim. Cosmochim. Acta 51, 1765-1769.
Nabelek, P. I., Labotka, T. C. (1993) Implications of geochemical fronts in the Notch Peak contact-metamorphic
aureole, Utah, USA. Earth Planet. Sci. Lett. 119, 539-559.

5. References 90
Nadeau, S., Philippot, P., Pineau, F. (1993) Fluid inclusion and mineral isotopic compositions (H-C-O) in eclogitic
rocks as tracers of local fluid migration during high-pressure metamorphism. Earth Planet. Sci. Lett. 114,
431-448.
Nagasaki, A., Enami, M., 1998. Sr-bearing zoisite and epidote in ultra-high pressure (UHP) metamorphic rocks from
the Su-Lu province, eastern China: An important Sr reservoir under UHP conditions. Am. Mineral. 83, 240-
247.
Najorka, J., Gottschalk, M., Franz, G., Heinrich, W., 1999. Ca-Sr distribution among amphibole, clinopyroxene, and
chloride-bearing solutions. Am. Mineral. 84, 596-606.
Newsom, H. E., White, W. M., Jochum, K. P., Hofmann, A. W., 1986. Siderophile and chalcophile element
abundances in oceanic basalts, Pb isotope evolution and growth of the Earth's core. Earth. Planet. Sci. Lett. 80,
299-313.
Newsom, H. E., Sims, K. W. W., Noll, P. D., Jaeger, W. L., Maehr, S. A., Beserra, T. B., 1996. The depletion of
tungsten in the bulk silicate earth: Constraints on core formation. Geochim. Cosmochim. Act 60, 1155-1169.
Nicholls, I. A., Ringwood, A. E., 1973. Effect of water on olivine stability in tholeiites and the products of silica-
saturated magmas in the island-arc environment. J. Geol. 81, 285-300.
Noll, P. D., Newsom, H. E., Leeman, W. P., Ryan, J. G., 1996. The role of hydrothermal fluids in the production of
subduction zone magmas: Evidence from siderophile and chalcophile trace elements and boron. Geochim.
Cosmochim. Act 60, 587-611.
Okay, A.I., 1995. Paragonite eclogites from Dabie Shan, China: Re-equilibration during exhumation? J.
Metamorphic Geol. 13, 449-460.
Oliver, N. H. S. (1996) Review and classification of structural controls on fluid flow during regional metamorphism.
J. Metam. Geol. 14, 477-492.
Peacock, S. M. (1993) The importance of blueschist -> eclogite dehydration reactions in subducting oceanic crust.
Geol. Soc. Am. Bull. 105, 684-694.
Pearce, J. A., Cann, J. R., 1973. Tectonic setting of basic volcanic rocks determined using trace element analyses.
Earth Planet. Sci. Lett. 19, 290-300.
Pearce, N. J. G., Perkins, W. T., Westgate, J. A., Gorton, M. P., Jackson, S. E., Neal, C. R., Chenery, S. P., 1997. A
compilation of new and published major and trace element data for NIST SRM 610 and NIST SRM 612 glass
reference materials. Geostand. Newsl. 21, 115-144.
Pennacchioni, G., 1996. Progressive eclogitization under fluid-present conditions of pre-Alpine mafic granulites in
the Austroalpine Mt Emilius Klippe (Italian Western Alps). J. Struc. Geol. 18, 549-561.
Philippot, P., Roermund, H. L. M. v., 1992. Deformation processes in eclogitic rocks: Evidence for the rheological
delamination of the oceanic crust in deeper levels of subduction zones. J. Struc. Geol. 14, 1059-1077.
Philippot, P., Selverstone, J., 1991. Trace-element-rich brines in eclogitic veins: Implications for fluid composition
and transport during subduction. Contrib. Mineral. Petrol. 106, 417-430.
Plank, T., Johnson, M. (1997) Experimental study of trace-element partitioning in fluids and melts generated during
sediment subduction. 7.th Annual V.M. Goldschmidt Conference, 164
Plank, T., Langmuir, C. H. (1998) The chemical composition of subducting sediment and its consequence for the
crust and mantle. Chem. Geol. 145, 325-394.
Poli, S., Schmidt, M. W. (1995) H2O transport and release in subduction zones: Experimental constraints on basaltic
and andesitic systems. J. Geophys. Res. 100B, 22299-22314.
5. References 91
Powell, R., Holland, T., Worley, B., 1998. Calculating phase diagrams involving solid solutions via non-linear
equations, with examples using THERMOCALC. J. Metamorphic Geol. 16, 577-588.
Preston, J., Hartley, A., Hole, M., Buck, S., Bond, J., Mange, M., Still, J., 1998. Integrated whole-rock trace element
geochemistry and heavy mineral chemistry studies: Aids to the correlation of continental red-bed reservoir in
the Beryl Field, UK North Sea. Petroleum Geoscience 4, 7-16.
Puchelt, H., Emmermann, R., 1983. Petrogenetic implications of tholeiitic basalt glasses from the East Pacific Rise
and the Galapagos Spreading Center. Chem. Geol. 38, 39-56.
Putlitz, B., Matthews, A., Valley, J., Katzir, Y. (1997) Laser probe oxygen isotope studies of metagabbros
(Cyclades, Greece): Implications for subduction processes. Terra Nova Abstr. suppl. 9, 27.
Reid, J. E., 1998. The development and geological application of a whole-rock-LA-ICP-MS technique for the
determination of high field strength elements. M.S. thesis, Memorial University of Newfoundland.
Rice, C. M., Darke, K. E., Still, J. W., 1998. Tungsten-bearing rutile from the Kori Kollo gold mine, Bolivia.
Mineral. Mag. 62, 421-429.
Ringwood, A. E. (1974) Petrological evolution of island arc systems. J. Geol. Soc. London 130, 183-204.
Rudnick, R. L., 1998. Rutiles in eclogites; a missing Earth reservoir found?. Abstr. with programs- Geol. Soc. Am.
30 (7), 207.
Ryan, J. G., Morris, J., Tera, F., Leeman, W. P., Tsetkov, A., 1995. Cross-arc geochemical variations in the Kurile
arc as a function of slab depth. Science.270, 625-627.
Santini, L., 1992. Geochemistry and geochronology of the basic rocks of the Penninic Nappes of East-Central Alps
(Switzerland). Ph.D. thesis, Universitè de Lausanne.
Saunders, A. D., Tarney, J., Weaver, S. D., 1980. Transverse geochemical variations across the Antartic Peninsula:
Implications for the genesis of calc-alkaline magmas. Earth Planet. Sci. Lett. 46, 344-360.
Schilling, J. G., Zajac, M., Evans, R., Johnston, T., White, W., Devine, J. D., Kingsley, R., 1985. Petrologic and
geochemical variations along the Mid-Atlantic Ridge from 29° N to 73° N. Am. J. Sci. 283, 510-586.
Schmidt, M. W. (1993) Phase relations and compositions in tonalite as a function of pressure: An experimental
study at 650° C. Am. J. Sci. 293, 1011-1060.
Schmidt, M. W. (1996) Experimental constraints on recycling of potassium from subducted oceanic crust. Science
272, 1927-1930
Schmidt, M. W., Poli, S., 1998. Experimental based water budgets for dehdrating slabs and consequences for arc
magma generation. Earth Planet. Sci. Lett. 163, 361-379.
Schumacher, J. C. (1997) Appendix 2: The estimation of the proportion of ferric iron in the electron-microprobe
analysis of amphiboles. Can. Mineral. 35, 238-246.
Seifert, K. E., Chang, C.-W., Brunotte, D. A. (1997) Evidence from ocean drilling program Leg 149 mafic igneous
rocks for oceanic crust in the Iberia abyssal plain ocean-continent transition zone. J. Geophys. Res. 102,
7915-7928.
Shannon, R. D., 1976. Revised effective ionic radii and systematic studies of interatomic distances in halides and
chalcogenides. Acta Cryst. A 32, 751-767.
Shibata, T., Nakamura, E. (1997) Across-arc variations of isotope and trace element compositions from Quaternary
basaltic volcanic rocks in northeastern Japan: Implications for interaction between subducted oceanic slab
and mantle wedge. J. Geophys. Res. 102, 8051-8064.
Sircombe, K. N, 1996. Provenance of heavy detritical minerals in coastal sands and sedimentary rocks of Eastern
Australia using the SHRIMP ion probe. Abstr. with programs- Geol. Soc. Am. 28(7), 279.
5. References 92
Skulski, T., Minarik, W., Watson, E.B., 1994. High-pressure experimental trace-element partitioning between
clinopyroxene and absaltic melts. Chem. Geol. 117, 127-147.
Sorensen, S. S., Grossman, J. N., 1989. Enrichment of trace elements in garnet amphibolites from a paleo-
subduction zone: Catalina Schist, California. Geochim. Cosmochim. Acta 53, 3155-3177.
Sorensen, S. S., Grossman, J. N., Perfit, M. R. (1997) Phengite-hosted LILE enrichment in eclogite and related
rocks: Implications for fluid-mediated mass transfer in subduction zones and arc magma genesis. J. Petrol.
38, 3-34.
Stalder, R., Foley, S. F., Brey, G. P., Horn, I., 1998. Mineral-aqueous fluid partitioning of trace elements at 900°C-
1200°C and 3.0 GPa to 5.7 GPa: New experimental data set for garnet, clinopyroxene and rutile and
implications for mantle metasomatism. Geochim. Cosmochim. Acta 62, 1781-1801.
Staudigel, H., Hart, S. R. (1983) Alteration of basaltic glass: Mechanisms and significance of oceanic crust-seawater
budget. Geochim. Cosmochim. Acta 47, 337-350.
Staudigel, H., Plank, T., White, B., Schmincke, H.-U., 1996. Geochemical fluxes during seafloor alteration of the
basaltic upper oceanic crust: DSDP sites 417 and 418. In: Subduction: Top to Bottom, Geophysical
Monograph 96, 19-38.
Stolz, A. J., Jochum, K. P., Spettel, B., Hofmann, A. W., 1996. Fluid- and melt-related enrichment in the subarc
mantle: Evidence from Nb/Ta variations in island-arc basalts. Geology 24, 587-590.
Stüwe, K., Powell, R. (1995) PT paths from modal proportions: Application to the Koralm Complex, Eastern Alps.
Contrib. Mineral. Petrol. 119, 83-93.
Sun, S., McDonough, W. F. (1989) Chemical and isotopic systematics of oceanic basalts: Implications for mantle
composition and processes. In: Saunders A. D., Norry M. J. (ed) Magmatism in the Ocean Basins. Geol.
Soc. Spec. Publ. 42, 313-345.
Taylor, R. P., Jackson, S. E., Longerich, H. P., Webster, J. D. (1997) In situ trace-element analysis of individual
silicate melt inclusions by laser ablation inductively coupled plasma-mass spectrometry (LAM-ICP-MS).
Geochim. Cosmochim. Acta 61, 2559-2567.
Taylor, S. R., McLennan, S. M. (1985) The Continental Crust: Its composition and composition. Blackwell
Tera, F., Brown, L., Morris, J., Sacks, I. S. (1986) Sediment incorporation in island-arc magmas: Inferences from10Be. Geochim. Cosmochim. Acta 50, 535-550.
Tribuzio, R., Messiga, B., Vannucci, R., Bottazzi, P., 1996. Rare earth element redistribution during high-pressure
low-temperature metamorphism in ophiolitic Fe-gabbros (Liguria, northwestern Italy): Implications for light
REE mobility in subduction zones. Geology 24, 711-714.
Volfinger, M., 1976. Effet de la température sur les distributions de Na, Rb et Cs entre la sanidine, la muscovite, la
phlogopite et une solution hydrothermale sous une pression de 1 kbar. Geochim. Cosmochim. Acta 40, 267-
282.
Watson, E. B., 1996. Surface enrichment and trace-element uptake during crystal growth. Geochim. Cosmochim.
Acta 60, 5013-5020.
Watson, E. B., Lupulescu, A. (1993) Aqueous fluid connectivity and chemical transport in clinopyroxene-rich rocks.
Earth Planet. Sci. Lett. 117, 279-294.
Widmer, T.W., 1996. Entwässerung ozeanisch alterierter Basalte in Subduktionszonen (Zone von Zermatt- Saas
Fee). Ph.D., ETH Zürich.

5. References 93
Will, T., Okrusch, M., Schmädicke, E. (1998) Phase relations in the greenschist-blueschist-amphibolite-eclogite
facies in the system Na2O-CaO-FeO-MgO-Al2O3-SiO2-H2O (NCFMASH), with application to
metamorphic rocks from Samos, Greece. Contrib. Mineral. Petrol. 132, 85-102.
Winchester, J.A., Floyd, P.A., 1977. Geochemical discrimination of different magma series and their differentiation
products using immobile elements. Chem. Geol. 20, 325-343.
Woodhead, J. D., Johnson R. W. (1993) Isotopic and trace-element profiles across the New Britain island arc, Papua
New Guinea. Contrib. Mineral. Petrol. 113, 479-491.
Yang, P., Rivers, T., Jackson, S., 1999. Crystal-chemical and thermal controls on trace-element partitioning between
co-existing garnet and biotite in metamorphic rocks from Western Labrador. Can. Mineral. 37, 443-468.
Yuen, D. A., Fleitout, L., Schubert, G., Froideveaux, C., 1977. Shear deformation zones along major transform
faults and subducting slabs. Geophys. J. Roy. Astron. Soc. 54, 93-119.
Zack, T., Foley, S. F., 1997. First laser ablation microprobe measurements of trace-element partitioning between
hydrous phases in high-pressure metamorphic rocks. In: 7th An. V.M. Goldschmidt Conf., LPI Contrib. No.
921, Lunar and Planetary Institute, Houston, p. 226.
Zack, T., Foley, S. F., Jenner, G. A. (1997) A consistent partition coefficient set for clinopyroxene, amphibole and
garnet from laser ablation microprobe analysis of garnet pyroxenites from Kakanui, New Zealand. N. Jb.
Miner. Abh. 172, 23-41.
Acknowledgments 94
Acknowledgments
I like to thank my advisers, Stephen Foley and Toby Rivers, for their continuous support and spirit of lively
discussion. This work could not have been realized in this form without the freedom in research they always allowed
me.
C.A. Heinrich and Christian Meyre are thanked for patient discussions about Adula geology with a "fishhead" like
me and for donating samples. Christian Meyre is also thanked for the effective co-operation and for spending a good
time with Stephen Foley and me in the field.
I. Horn, S.E. Jackson, P. Sylvester and M. Tubrett are thanked for invaluable help and innumerable advice
concerning the marvellous laser ablation ICP-MS facility at Memorial University.
Furthermore I would like give a special thanks to H.-P. Meyer (Heidelberg) and A. Kronz (Göttingen) for their help
with the perfectly maintained electron microprobes in their labs.
P. King and G. Hartmann (XRF), L. Hewa (solution-ICP-MS) and J. Reid (whole rock- laser ablation-ICP-MS) are
thanked for conducting some of the measurements used in this study.
This work was shaped in a significant way through discussions and criticism from my colleagues and friends in the
geo-community. Of course, I have to acknowledge first the veterans and active members of Foley's Pub, which are,
to name only a few, M. Barth, R. Brumm, S. Buhre, D. Jacob, S. Melzer, F. Schäfer, B. Schmickler, R. Stalder and
E. Zinngrebe. But I am also grateful for the time and spirit I received from members of the Geochemisches Institut
(Göttingen), most of all P. Cartigny, F. Dorendorf and K. Simon and from members of the Earth Science
Department of the Memorial University, which are besides others R.A. Cox, G. Dobosi, C. Petibon and P. Yang.
Help, advice, and discussions are also greatly appreciated from G.E. Bebout, F. Brenker, K. Domanik, M. Frey, D.
Günther, J. Hoefs, A. Indares, G.A. Jenner, J. Mosenfelder, C. Münker, P. O'Brien, J. Partzsch, M. Pfiffner, S. Poli,
S. Sorensen, V. Trommsdorff and G. Wörner.
I would also like to thank J. Halfar, M. Halfar-Formentes, J. Lezaun, M. Sachse and A. Wanke and last, but never
least, my parents for the time they shared with me in the beautiful Trescolmen area.
This work was supported by the DFG (Fo 181/10-1) and NSERC.

Lebenslauf 95
Lebenslauf
Am 19.3.1968 wurde ich als Sohn von Käthe Zack, geborene Schnackenberg, und Dieter Zack in Bremen geboren.
Von 1974 bis 1975 besuchte ich die Grundschule in Bremen, von 1975 bis 1980 die Grund- und Orientierungsschule
in Ottersberg und von 1980 bis 1988 das Gymnasium in Achim. Das Abitur erlangte ich im Mai 1988. Anschließend
studierte ich von 1988 bis 1990 an der Universität Heidelberg Mineralogie und Geologie und absolvierte 1990 das
Vordiplom in Geologie. Danach verbrachte ich von 1990 bis 1991 ein Jahr als Austauschstudent an der University
of Pennsylvania, Philadelphia, USA. Seit 1991 bin ich an der Universität Göttingen in den Fächern Mineralogie und
Geologie eingeschrieben. Nach Annahme meiner Diplomarbeit mit dem Titel "Petrologische und geochemische
Untersuchungen an Granatpyroxeniten aus Kakanui (Neuseeland)" erlangte ich mein Diplom in Mineralogie im
April 1995. Seit 1995 beschäftige ich mich am Mineralogisch-Petrologischen Institut der Universität Göttingen und
am Earth Science Department der Memorial University of Newfoundland, St. John's, Kanada unter Betreuung von
Priv. Doz. Dr. Stephen F. Foley und Prof. Toby Rivers mit der hier vorliegenden Arbeit.