Machine Learning for Metamorphic Testing - DiVA Portal
51
IN DEGREE PROJECT ELECTRICAL ENGINEERING, SECOND CYCLE, 30 CREDITS , STOCKHOLM SWEDEN 2018 Machine Learning for Metamorphic Testing ZHEYU ZHANG KTH ROYAL INSTITUTE OF TECHNOLOGY SCHOOL OF ELECTRICAL ENGINEERING AND COMPUTER SCIENCE
-
Upload
khangminh22 -
Category
Documents
-
view
0 -
download
0
Transcript of Machine Learning for Metamorphic Testing - DiVA Portal

IN DEGREE PROJECT ELECTRICAL ENGINEERING,SECOND CYCLE, 30 CREDITS
, STOCKHOLM SWEDEN 2018
Machine Learning for Metamorphic Testing
ZHEYU ZHANG
KTH ROYAL INSTITUTE OF TECHNOLOGYSCHOOL OF ELECTRICAL ENGINEERING AND COMPUTER SCIENCE

TRITA TRITA-EECS-EX-2018:561
ISSN 1653-5146
www.kth.se

1
Abstract
Test oracle is a mechanism used to validate all the functionalities ofsoftware under test. However, the lack of test oracle makes the pro-cess of software testing difficult. Metamorphic testing is a state of artapproach for automated software testing without test oracles basedon metamorphic relations. Metamorphic relations are a set of proper-ties between inputs and outputs that a software could have. However,it is usually difficult to identify metamorphic relations for unknownprograms. This thesis aims for automatic generation of metamorphicrelations by utilizing machine learning algorithms with the methodrandom walk kernel using input from control flow graphs. By apply-ing Kanawala et al. [1] previous work in our targeted system environ-ment, we encountered a series of difficulties, which we also describein this thesis. It is important to introduce an alternative solution forour test suite that is working. The performance of our model is evalu-ated by different measures including area under the receiver operatingcharacteristic curve and mean squared error. The results show promis-ing applications of automatically predicting metamorphic relations forunknown programs. The study was conducted on software system inthe telecommunicaiton domain.

2
Sammanfattning
Testorakel är en mekanik som används till att avgöra om ett programär korrekt för all funktionalitet i program som testas. Metamorfisk test-ning är en toppmodärn metod för automatiserad programtesting vidsaknad testorakel, kan använda metamofiska relationer istället. Tyvärrär det under normala förhållanden svårt att identifiera metamorfiskarelationer för okända program. Denna avhandling ämnar därför attautomatiskt generera metamorfiska relationer genom att använda ma-skininlärningalgoritmer med kärnmetoden slumpmässig gång och in-data från kontrollflödesgrafer. Metamorfiska relationer är en mängdegenskaper mellan indata och utdata som finns i alla program. Genomatt replikera och applicera en tidigare studie av Kanewala et al. [1] i våregen systemmålmiljö, har vi mött en del svårigheter som vi också be-skriver i denna avhandling. Det är viktigt att introducera alternativalösningar för vår test svit som fungerar. Prestandan i vår modell ut-värderas av olika mätningar inkluderad AUC och MSE. Våra resultatverkar lovande att använda på automatisk predicerade metamorfiskarelationer för okända program. Studien genomfördes på programsy-stem inom telekommunikationsområdet.

3
Acknowledgement
First of all, I’d like to express my sincere gratitude to everyone that hashelped me with this project. Ms. Sigrid Eldh from Ericsson AB and Mr.Karl Meinke from KTH, who act as my supervisors and provided mewith the opportunity to carry out my master thesis at Ericsson AB. Itis a privilege for me to work with them, and I cannot finish my the-sis work without their guidance and encouragements. Thanks for thecontinuous supports and advice from Mr. Per-Olof Gatter from Erics-son AB and Mr. Aravind Ashok Nair from KTH. Also, I would like tothank Ms. Ulrika Nordlund from Ericsson AB for her kind help.
Secondly, I would like to thank Mr. Ming Xiao at the department ofinformation science and engineering at KTH, who acts as my thesisexaminer.
Finally, thanks for the firm and constant support from my family, with-out them, I would never have the chance to study in Sweden.

Contents
1 Introduction 101.1 Motivation . . . . . . . . . . . . . . . . . . . . . . . . . . . 101.2 Problem Formulation and Method . . . . . . . . . . . . . 111.3 Previous Work . . . . . . . . . . . . . . . . . . . . . . . . . 121.4 Thesis Outline . . . . . . . . . . . . . . . . . . . . . . . . . 12
2 Background 142.1 Software Testing . . . . . . . . . . . . . . . . . . . . . . . . 14
2.1.1 The Overview of Software Testing . . . . . . . . . 142.1.2 Source of Software Systems Defects . . . . . . . . 142.1.3 The Benefits of Software Testing . . . . . . . . . . 15
2.2 Software System Under Test . . . . . . . . . . . . . . . . . 162.2.1 Fifth Generation Mobile Systems . . . . . . . . . . 162.2.2 Utilization of Metamorphic Testing . . . . . . . . 16
3 Software Testing with Metamorphic Testing 183.1 Test Oracle Problem . . . . . . . . . . . . . . . . . . . . . . 183.2 Metamorphic Testing . . . . . . . . . . . . . . . . . . . . . 193.3 Metamorphic Relations . . . . . . . . . . . . . . . . . . . . 20
4 Approach 234.1 Method Overview . . . . . . . . . . . . . . . . . . . . . . . 23
4.1.1 The Difficulties of Replicating Previous Works . . 244.2 Control Flow Graphs . . . . . . . . . . . . . . . . . . . . . 254.3 Graph Kernels . . . . . . . . . . . . . . . . . . . . . . . . . 26
4.3.1 Kernel Methods . . . . . . . . . . . . . . . . . . . . 264.3.2 Graph Kernels . . . . . . . . . . . . . . . . . . . . . 274.3.3 Random Walk Kernel . . . . . . . . . . . . . . . . . 27
4.4 Machine Learning . . . . . . . . . . . . . . . . . . . . . . . 304.4.1 Support Vector Machines . . . . . . . . . . . . . . 31
4

CONTENTS 5
4.4.2 Kernel Ridge Regression . . . . . . . . . . . . . . . 31
5 Replication of the Previous Experiment 325.1 Data Set . . . . . . . . . . . . . . . . . . . . . . . . . . . . . 325.2 Metamorphic Relations . . . . . . . . . . . . . . . . . . . . 345.3 Evaluation Measures . . . . . . . . . . . . . . . . . . . . . 35
5.3.1 Stratified k-fold Cross-Validation . . . . . . . . . . 355.3.2 Area Under the Receiver Operating Characteris-
tic Curve . . . . . . . . . . . . . . . . . . . . . . . . 355.3.3 Mean Squared Error . . . . . . . . . . . . . . . . . 37
5.4 Results . . . . . . . . . . . . . . . . . . . . . . . . . . . . . 375.4.1 AUC Performance for Support Vector Machine . . 375.4.2 MSE Performance for Kernel Ridge Regression . . 405.4.3 Analysis of Random Walk Kernel . . . . . . . . . . 405.4.4 Test for Existing Telecom Software . . . . . . . . . 42
6 Conclusion and Future Work 436.1 Conclusion . . . . . . . . . . . . . . . . . . . . . . . . . . . 436.2 Future Work . . . . . . . . . . . . . . . . . . . . . . . . . . 45
Bibliography 47

Acronyms
5G Fifth generation mobile systems.
AUC Area under the receiver operating characteristic curve.
CFG Control flow graph.
CFGs Control flow graphs.
KRR Kernel ridge regression.
MR Metamorphic relation.
MRs Metamorphic relations.
MSE Mean squared error.
MT Metamorphic testing.
ROC Receiver operating characteristic curve.
SVM Support vector machine.
SVMs Support vector machines.
6

List of Figures
2.1 A survey of application areas of metamorphic testing . . 17
3.1 The test oracle problem . . . . . . . . . . . . . . . . . . . . 193.2 The overview of the metamorphic testing process . . . . 203.3 Example of permutative metamorphic relation . . . . . . . 21
4.1 The overview of the proposed approach . . . . . . . . . . 244.2 An example of CFG . . . . . . . . . . . . . . . . . . . . . . 254.3 Kernel methods . . . . . . . . . . . . . . . . . . . . . . . . 264.4 An example of the direct product graph . . . . . . . . . . 29
5.1 An example of labeling the nodes by their operation . . . 335.2 An example of the functions (bubble sort) in my data set
and its corresponding control flow graph. The combi-nation of number and notation "%" in each node standsfor an automatically generated fake name which can beused to distinguish each node. . . . . . . . . . . . . . . . . 34
5.3 Stratified k-fold cross-validation. Both classes (red andgreen) have approximately the same distribution in eachfold. . . . . . . . . . . . . . . . . . . . . . . . . . . . . . . . 36
5.4 ROC analysis of classifier for predicting the permutativemetamorphic relation . . . . . . . . . . . . . . . . . . . . . 38
5.5 ROC analysis of classifier for predicting the additive meta-morphic relation . . . . . . . . . . . . . . . . . . . . . . . . 38
5.6 ROC analysis of classifier for predicting the inclusivemetamorphic relation . . . . . . . . . . . . . . . . . . . . . 39
5.7 The comparison of performance among all classifiers . . 395.8 The comparison of performance among all regression
models . . . . . . . . . . . . . . . . . . . . . . . . . . . . . 405.9 Variation of AUC with different value of λ . . . . . . . . . 41
7

8 LIST OF FIGURES
5.10 Variation of MSE with different value of λ . . . . . . . . . 42

List of Tables
5.1 Number of positive and negative examples for each MR . 355.2 Confusion matrix . . . . . . . . . . . . . . . . . . . . . . . 36
9

Chapter 1
Introduction
This degree project aims to automatically predict metamorphic relations(MRs) of metamorphic testing (MT) by utilizing graph kernels and ma-chine learning algorithms. This thesis is carried out at Ericsson AB,which is a world-leading Swedish telecom company.
1.1 Motivation
In software testing, it is usually difficult to detect bugs in some typesof software (e.g. scientific software) because of the test oracle problem.As discussed by Weyuker [2], oracle is a mechanism which can checkthe correctness of the outputs to indicate whether the program undertesting is working correctly. However, it is often difficult to detect sub-tle faults, one-off errors or defects in many scientific software systems,because of the lacking of reliable test oracles to indicate what is thecorrect outputs for arbitrary inputs. As a consequence of this problem,many scientific software systems become "non-testable programs" [2].
Metamorphic testing is a property-based testing technique proposedby Chen et al. to alleviate the oracle problem [3]. Instead of check-ing the correctness of outputs for arbitrary inputs, metamorphic test-ing operates by checking the program being tested against the relationbetween inputs and corresponding outputs, which is known as themetamorphic relations. The MRs specify how a particular change tothe inputs should change the outputs. If the MRs do not hold for theprogram being tested, then it is a sure sign that there are some defectsexisting in the program.
10

CHAPTER 1. INTRODUCTION 11
However, the identification of MRs usually requires the knowledgeof the particular domain, so it is a labor intensive task for domain ex-perts and programmers. Thus, in this thesis, we aim to automaticallypredict the MRs for previously unseen functions by modeling this taskas a supervised machine learning problem.
1.2 Problem Formulation and Method
This thesis aims to study metamorphic testing and metamorphic re-lations, and use machine learning methods together with graph ker-nels to automatically predict MRs of testing programs. We design ourmethod and experiment by adjusting the ideas from previous litera-ture, further to evaluate the performance based on area under the re-ceiver operating characteristic curve (AUC) and mean squared error (MSE).
The objectives of this thesis are:
• Study metamorphic testing and metamorphic relation in litera-ture study, further to identify MRs for real mathematical func-tions implemented by C programming language.
• Study the idea of using machine learning methods for automaticMRs prediction in literature study, then modify it to fit our caseby identifying the limitations of previously successful experi-ence.
• Study graph kernels algorithms in the literature study, further toimplement random walk kernel algorithm to calculate the simi-larity score matrix or the gram matrix for training machine learn-ing models.
• Build two different types of machine learning models by usingthe kernel trick, which takes precomputed similarity score matrixfrom graph kernel for training.
• Evaluate the accuracy of the machine learning model by calcu-lating AUC or MSE value together with stratified k-fold cross-validation method, and analyze the effectiveness of graph kernelmethod.

12 CHAPTER 1. INTRODUCTION
1.3 Previous Work
The first attempt at automatically predicting metamorphic relationswas performed by Kanewala et al. in 2013 [4]. In this work, they triedto predict MRs of Java testing programs which take arrays as inputs.They used two kinds of machine learning algorithms (support vectormachines and decision trees) to train binary classifiers based on nodesand edges features extracted from programs’ control flow graphs (CFGs).
Kanewala et al. then further developed their approach in 2015. Inthis work, they started to use kernel-based machine learning methodscombined with graph kernel methods, which are a set of algorithmscan effectively compute the similarity between two graphs. They alsocompared the performance by using different graph kernel functions,and different graphs, which are CFGs and data dependency informa-tion.
In 2018 [5], Kanewala et al. transferred their approach to Java testingprograms, which take matrices as inputs to validate that their methodscan be used for a wider range of testing cases.
Besides the machine learning methods for automatically predictingmetamorphic relations, Zhang et al. [6] developed a dynamic approachby executing the testing programs with some certain inputs to iden-tify MRs. This approach could be a complementary technique for themethod developed by Kanewala et al. [4][1][5], which leverages staticproperties of a program [1].
In this thesis, our approach is developed based on the ideas proposedby Kanewala et al. in 2013 [4] and [1]. We modified their methods toadapt to our special testing cases.
1.4 Thesis Outline
This thesis report is organized as follows.
• In chapter 2, we briefly introduce the background informationabout software testing and the software system, which is neededto be tested by metamorphic testing technique.

CHAPTER 1. INTRODUCTION 13
• In Chapter 3, we introduce detailed definitions of the state of artsoftware testing technique, metamorphic testing and metamor-phic relations, including its basic ideas and applications, thenclaim the challenges in identifying metamorphic relations.
• In Chapter 4, we introduce the machine learning approach forautomatically predicting metamorphic relations in this thesis work,including the method overview, the graph representation of pro-grams, the idea of graph kernels, and the machine learning algo-rithms which are used here.
• In Chapter 5, we introduce the details of our experiment, includ-ing the composition of our data set, the metamorphic relationswe chose to predict, the evaluation measures for different ma-chine learning methods, the corresponding results of differentevaluation methods, and the analysis of graph kernel method.
• In Chapter 6, we summarize the objective of this thesis and re-view the methods we used to implement our approach and eval-uate the performance, and conclude the results we have got sofar. Then discuss the future work of different aspects.

Chapter 2
Background
In this chapter, we first introduce the background of software testing,including the source of software defects and the benefits of using soft-ware testing techniques. And then we illustrate the target system un-der test and the reason for using the metamorphic testing techniquecombined with machine learning methods.
2.1 Software Testing
2.1.1 The Overview of Software Testing
Software testing is an evaluation process conducted to investigate theinformation about the quality of software systems. Software testingtechniques operate by checking the behavior of software product againstthe test oracle, which is a mechanism to tell whether the software be-haves correctly. The basic idea of software testing is to verify correct-ness by finding bugs or defects through the execution of the softwaresystem under test. By doing this evaluation process, objective and in-dependent information about the quality and risks of failure can beprovided to relative stakeholders.
2.1.2 Source of Software Systems Defects
Software bugs or defects can be caused by several reasons. For in-stance, one of the most common reason is coding errors. Some of thesebugs or defects can be detected and corrected through reviewing byprogrammers, other coding mistakes can still be caused by initially in-
14

CHAPTER 2. BACKGROUND 15
correct coding ideas which the programmers do not realize. Anothercommon reason is requirements gaps, for example, the incorrect omis-sion of needed information by programmers because of the lack of fullrecognition and implication of a specific requirement [7]. In addition,defects can also be created by the change in certain environments, suchas input data and hardware platforms.
2.1.3 The Benefits of Software Testing
The defects mentioned above are usually impossible to be detectedand corrected through reviewing by programmers. Furthermore, thesedefects can result in unexpected failure of software systems which willlead to huge economic losses. For example, NIST conducted a studyin 2002 shown that $59.5 billion economic losses are caused by soft-ware bugs in the USA every year, and more than one-third of theselosses could be avoided by taking feasible and effective software test-ing strategies [8]. This number has for sure increased many folds be-cause most of the businesses are developed on software-based systemsnow.
Today, software systems failure results in serious worldwide economiclosses annually, and it can affect many aspects of society like entertain-ment, government, finance, and transportation, etc. In fact, most ofthese unexpected software systems failure can be avoided by propertesting technique, whereas a large amount of software are just simplypushed forward to production without proper evaluation or testingprocedure.
Since software testing technique can be used to avoid the unneces-sary economic loss and bring more profits in the meantime, there isprofessional software testing department nearly in every technologycompanies to ensure the higher correctness lower risks of failure oftheir software productions.
16 CHAPTER 2. BACKGROUND
2.2 Software System Under Test
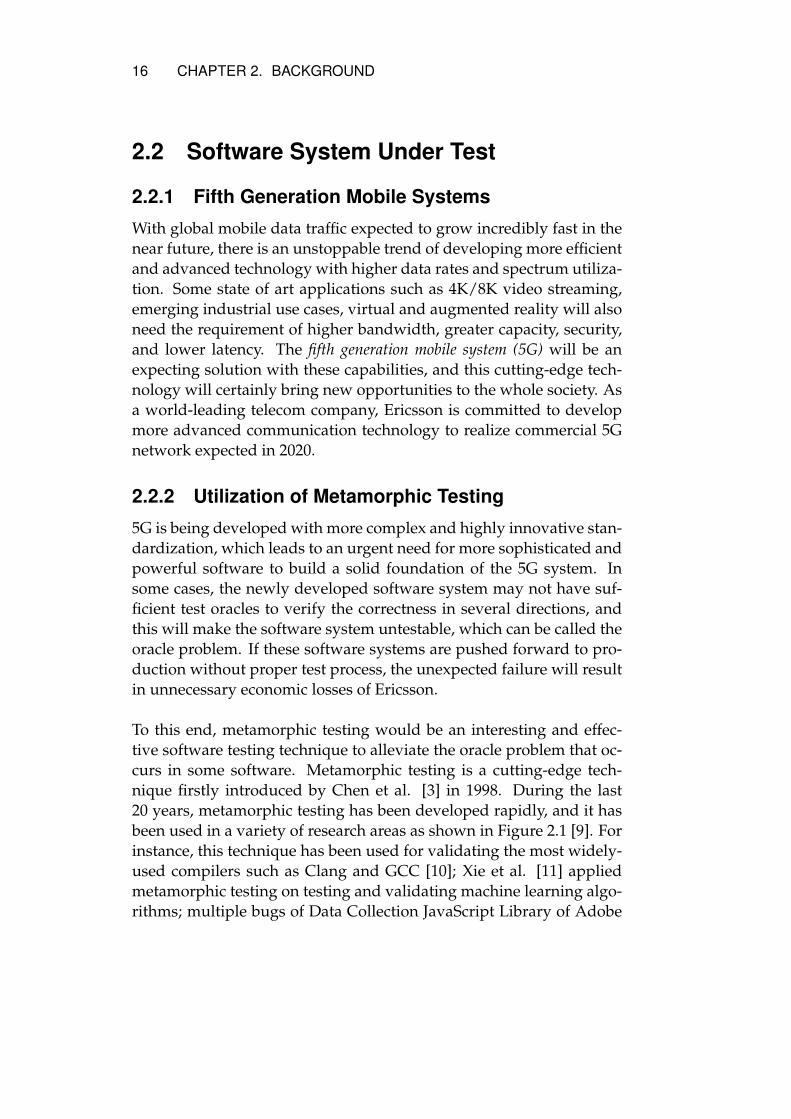
2.2.1 Fifth Generation Mobile Systems
With global mobile data traffic expected to grow incredibly fast in thenear future, there is an unstoppable trend of developing more efficientand advanced technology with higher data rates and spectrum utiliza-tion. Some state of art applications such as 4K/8K video streaming,emerging industrial use cases, virtual and augmented reality will alsoneed the requirement of higher bandwidth, greater capacity, security,and lower latency. The fifth generation mobile system (5G) will be anexpecting solution with these capabilities, and this cutting-edge tech-nology will certainly bring new opportunities to the whole society. Asa world-leading telecom company, Ericsson is committed to developmore advanced communication technology to realize commercial 5Gnetwork expected in 2020.
2.2.2 Utilization of Metamorphic Testing
5G is being developed with more complex and highly innovative stan-dardization, which leads to an urgent need for more sophisticated andpowerful software to build a solid foundation of the 5G system. Insome cases, the newly developed software system may not have suf-ficient test oracles to verify the correctness in several directions, andthis will make the software system untestable, which can be called theoracle problem. If these software systems are pushed forward to pro-duction without proper test process, the unexpected failure will resultin unnecessary economic losses of Ericsson.
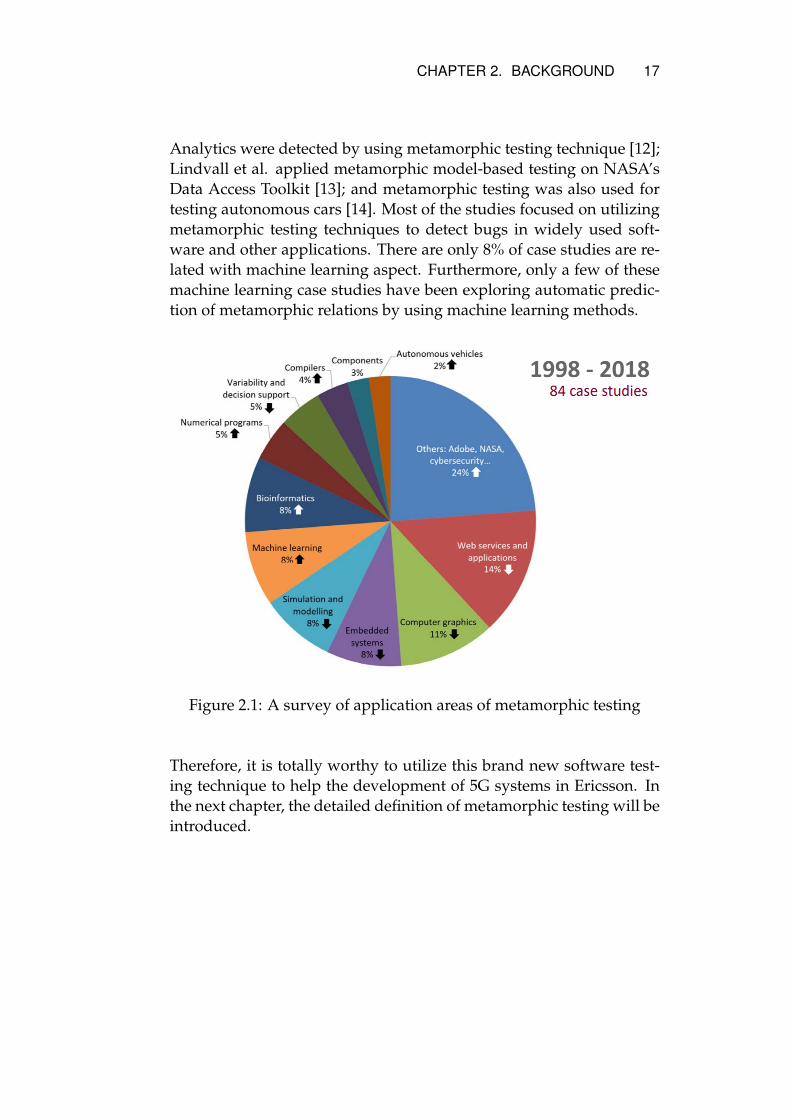
To this end, metamorphic testing would be an interesting and effec-tive software testing technique to alleviate the oracle problem that oc-curs in some software. Metamorphic testing is a cutting-edge tech-nique firstly introduced by Chen et al. [3] in 1998. During the last20 years, metamorphic testing has been developed rapidly, and it hasbeen used in a variety of research areas as shown in Figure 2.1 [9]. Forinstance, this technique has been used for validating the most widely-used compilers such as Clang and GCC [10]; Xie et al. [11] appliedmetamorphic testing on testing and validating machine learning algo-rithms; multiple bugs of Data Collection JavaScript Library of Adobe
CHAPTER 2. BACKGROUND 17
Analytics were detected by using metamorphic testing technique [12];Lindvall et al. applied metamorphic model-based testing on NASA’sData Access Toolkit [13]; and metamorphic testing was also used fortesting autonomous cars [14]. Most of the studies focused on utilizingmetamorphic testing techniques to detect bugs in widely used soft-ware and other applications. There are only 8% of case studies are re-lated with machine learning aspect. Furthermore, only a few of thesemachine learning case studies have been exploring automatic predic-tion of metamorphic relations by using machine learning methods.
Figure 2.1: A survey of application areas of metamorphic testing
Therefore, it is totally worthy to utilize this brand new software test-ing technique to help the development of 5G systems in Ericsson. Inthe next chapter, the detailed definition of metamorphic testing will beintroduced.

Chapter 3
Software Testing with Metamor-phic Testing
In this chapter, the details about the metamorphic testing are intro-duced. We first describe the test oracle problem and then explain howthe metamorphic testing works by operating against the metamorphicrelations. Next, further to state the challenges within this techniqueand the motivation of using machine learning methods.
3.1 Test Oracle Problem
In order to automate the software testing, and make the testing processeasier and reliable, the test oracle is needed. Test oracle is a mechanismto determine whether an execution of a software is correct or incorrect.The test oracle check the correctness of software under test by identi-fying whether there is expected output regarding its correspondingoutput.
In some types of software testing (e.g. scientific software), it is difficultto tell whether a test is passed or failed because there is no availabletest oracle. Lacking available test oracle or having difficulties in im-plementing such test oracle will arise the test oracle problem (Figure3.1), which is one of the biggest challenges in software testing.
The test oracle problem can lead to the difficulties in detecting subtlefaults and one-off errors, which can seriously affect the correctness andstability of programs or software. When dealing with such problems,
18

CHAPTER 3. SOFTWARE TESTING WITH METAMORPHIC TESTING19
usually domain experts or scientists need to specify some particulartest oracles in an inefficient and unsystematic way. Therefore, an au-tomated testing technique is surely welcomed to test software withouttest oracles.
Figure 3.1: The test oracle problem
3.2 Metamorphic Testing
Metamorphic testing is a software testing technique proposed by Chenet al. [3], which aims to alleviate the test oracle problem. This tech-nique is a property-based testing method which operates by checkingwhether the program under testing satisfies some previously identi-fied properties which are called metamorphic relations. The metamor-phic relations can tell how a specific change to arbitrary input shouldaffect the output of a program. If the arbitrary inputs and correspond-ing outputs of the program under testing violate these expected rela-tions, it means that some faults are existing in the program.
Generally, metamorphic testing can be implemented through the fol-lowing steps (Figure 3.2):
1. Identify a set of metamorphic relations between the inputs andoutputs of the target program.
2. Generate new source test cases or select existing source test cases.
3. Generate follow-up test cases by applying the previously identi-fied MRs to the initial source test cases.
4. Execute the follow-up test cases using the target program, andthen check whether there are violations of MRs.

20 CHAPTER 3. SOFTWARE TESTING WITH METAMORPHICTESTING
Figure 3.2: The overview of the metamorphic testing process
The overall objective of metamorphic testing is to use newly gener-ated follow-up test cases according to metamorphic relations to detectfaults which may e contained in the programs without test oracles.
The most intuitive example of MT is when considering an implemen-tation of a SINE function y = sin(x). For any input angle x, basedon the well-known property, the output will remain the same if theinput angle is added by 2π, which is y = sin(x) = sin(x + 2π). Thisproperty can be regarded as a metamorphic relation: if x′ = x + 2π,then sin(x′) = sin(x). By using this metamorphic relation, this imple-mented SINE function can be examined twice by the original test case(x, sin(x)) and the follow-up test case (x′, sin(x′)). If the violation ofthe metamorphic relation between input angle and output value oc-curs, x′ = x + 2π and sin(x′) 6= sin(x), then it is a sure sign that thisimplementation of SINE function is a failure.
3.3 Metamorphic Relations
As mentioned before, metamorphic relations are some expected rela-tions between arbitrary inputs and corresponding outputs of a pro-gram. Consider a simple example in Figure 3.3, applying metamorphictesting to a mathematical function which can calculate the sum of anarray. Some particular changes to the input array would be expectedto not change the output result. For instance, randomly permuting the

CHAPTER 3. SOFTWARE TESTING WITH METAMORPHIC TESTING21
input array will not affect the sum of the input array. This kind of re-lation between input and output held by a program can be referred toa permutative metamorphic relation.
Figure 3.3: Example of permutative metamorphic relation
Apart from the Permutative metamorphic relation, there are some otherrelations between inputs and outputs that a program can hold. Ac-cording to the previous work by Murphy et al.[15], six metamorphicrelations that can be applied to mathematical functions which take anarray as input are described as follows:
• Permutative: Randomly permute the elements of the input array,the corresponding output will remain constant.
• Additive: Add a positive constant to the input, the correspondingoutput will increase or remain constant.
• Multiplicative: Multiply the input by a positive constant, the out-put will increase or remain constant.
• Invertive: Take the inverse of each element, the output will de-crease or remain constant.

22 CHAPTER 3. SOFTWARE TESTING WITH METAMORPHICTESTING
• Inclusive: Add a new element to the input array, the output willincrease or remain constant.
• Exclusive: Remove an element to the input array, the output willdecrease or remain constant.
If the change in the output of a program corresponds to the predictionafter altering the input, then this function can be said to satisfy the cor-responding metamorphic relation.
To apply metamorphic testing to software testing, it is crucial to cor-rectly identify the metamorphic relations that the program under test-ing should have. However, this is usually difficult for ordinary testersto accomplish, since usually, they do not have enough prior domainknowledge of the programs. Besides, identifying metamorphic re-lations often needs to be done manually, which means it is a labor-intensive task and really time-consuming. In the next chapter, an effi-cient and systematic machine learning approach will be introduced todeal with this problem.

Chapter 4
Approach
In this chapter, the difficulties of replicating previous studies are stated.Then, we introduce our alternative approach including the generationof control flow graphs and machine learning methods combined withgraph kernels.
4.1 Method Overview
The proposed method leverages kernel-based machine learning algo-rithms to train a classification model and predict the metamorphicrelations for previously unseen programs. The overview of this ap-proach is shown in Figure 4.1. During the training phase, we firstlygenerate control flow graphs from the functions written by C pro-gramming language, and each function is labeled by its correspondingmetamorphic relations; then use graph kernels to calculate the similar-ity score between each pair of control flow graphs and final output ofgraph kernel function is a similarity score matrix or gram matrix; nexttrain a classification model by using kernel-based supervised machinelearning algorithms. During the testing phase, firstly extract the con-trol flow graph from a previously unseen function as similar as theprocess in the training phase; after that, compute the similarity scoresbetween the previously unseen control flow graph and each graphfor training by using the same graph kernel function; finally use thetrained classification model to predict the metamorphic relations thatthis function should have.
23

24 CHAPTER 4. APPROACH
Figure 4.1: The overview of the proposed approach
4.1.1 The Difficulties of Replicating Previous Works
In previous work by Kanewala et al. [1], the method they used togenerate CFGs is based on a tool called Soot, which can provide inter-mediate representations for analyzing and transforming source codes.However, there is a limitation of this method, the Soot tool can beonly used for Java. In Ericsson, most of the programs are written inC programming language, which means that the previously success-ful method cannot be simply replicated.
Therefore, we had to choose an alternative method. Most of the opensource tools (e.g. CoFlo) that can be found through the Internet can-not be used for various reasons. Eventually, We found the way ofusing LLVM framework and compiler Clang to generate CFGs for Cprograms.
In addition, the data set they used to train machine learning modelsconsists of Java functions, so we had to create our own data set by im-plementing similar mathematical functions written in C programminglanguage, and we also needed to investigate the properties of these

CHAPTER 4. APPROACH 25
functions to label them by their corresponding metamorphic relations.These works were time-consuming and took more than 6 weeks.
4.2 Control Flow Graphs
According to previous work by Kanewala et al. [1], similar structuresof control flow graphs would result in similar metamorphic relations,so it is reasonable to use this feature of a program for training andtesting. A CFG of a program is a directed graph which models the se-quence of operations which can be represented byG = (V,E), where Vand E represent nodes and edges respectively. Each node vx ∈ V rep-resents a basic block, which is a straight-line piece of code sequencewith no branches in except to the entry and no branches out exceptat the exit. Directed edge e = (vx, vy) is used to represent jumps orcontrol flow between node vx and vy, i.e. statement y can be executedimmediately after statement x is executed.
Figure 4.2: An example of CFG
Figure 4.2 shows a simple example of what a CFG looks like. As can beseen, each straight-line piece of codes sequence is contained in a basicblock (node), and each related pair of basic blocks is connected by adirected edge.
26 CHAPTER 4. APPROACH
4.3 Graph Kernels
As introduced in previous sections, the proposed approach leverageskernel-based supervised machine learning algorithms, in what followssome relevant background on kernel method, graph kernel, and ma-chine learning methods are provided.
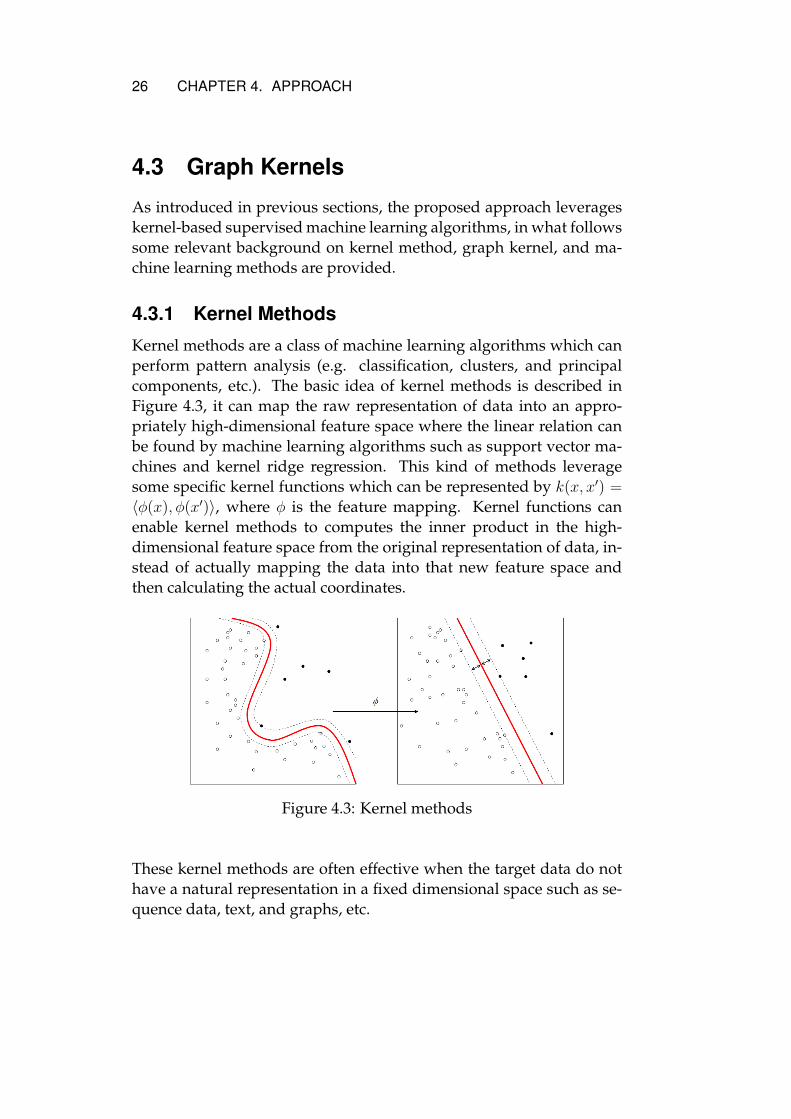
4.3.1 Kernel Methods
Kernel methods are a class of machine learning algorithms which canperform pattern analysis (e.g. classification, clusters, and principalcomponents, etc.). The basic idea of kernel methods is described inFigure 4.3, it can map the raw representation of data into an appro-priately high-dimensional feature space where the linear relation canbe found by machine learning algorithms such as support vector ma-chines and kernel ridge regression. This kind of methods leveragesome specific kernel functions which can be represented by k(x, x′) =
〈φ(x), φ(x′)〉, where φ is the feature mapping. Kernel functions canenable kernel methods to computes the inner product in the high-dimensional feature space from the original representation of data, in-stead of actually mapping the data into that new feature space andthen calculating the actual coordinates.
Figure 4.3: Kernel methods
These kernel methods are often effective when the target data do nothave a natural representation in a fixed dimensional space such as se-quence data, text, and graphs, etc.

CHAPTER 4. APPROACH 27
4.3.2 Graph Kernels
Graph kernel is a kernel based graph comparison and classificationalgorithm which has become a popular approach in many domainswhere the target data is not represented in a fixed dimensional space,such as biology [16], chemistry [17], and social network analysis [18].These areas usually focus on structured objects, and graphs are themost common and natural representation to model these types of tar-get data. When dealing with graph comparison problems, the simi-larity of two graphs is often produced by comparing the structure oftwo graphs. Graph kernels, firstly proposed by Gärtner et al. in 2003[19], are a group of functions which can compute the similarity scorefor a pair of graphs by comparing the structure of two graphs in cer-tain ways, then some kernel-based machine learning algorithms canuse the precomputed similarity scores to perform the classification andprediction tasks.
4.3.3 Random Walk Kernel
According to previous work by Kanewaka et al. [1], random walk ker-nel, proposed by Gärtner et al. [19], usually performs better on thisspecific task, therefore this graph kernel function is used in this thesis,in what follows are the details about this specific kernel function.
Firstly, give the definition of adjacency matrix of a graph G = (V,E):for a directed graph, adjacency matrix A is a n × n matrix with is itselement Aij = 1 if vertices vi and vj are neighbors, otherwise Aij = 0,and Aij 6= Aji; for an undirected graph, adjacency matrix A is a n × nmatrix with is its element Aij = 1 if vertices vi and vj are neighbors,otherwise Aij = 0, and Aij = Aji which also means it is symmetric ma-trix. For both two types of graphs, the elements on the diagonal linealways equal to zero. Since the operations in a program are always in acertain order which means its corresponding CFG is always a directedgraph, in this case, only the directed graph is considered in this thesis.
The random walk kernel is based on the idea of counting the num-ber of matching walks in two graphs. A random walk on a graphG = (V,E) is a sequence of vertices v1, v2, ..., vk of length k, and thereshould be a directed edge between vk and vk−1 which can also be re-ferred as Ak−1,k = 1. Then random walk kernel operates by perform-

28 CHAPTER 4. APPROACH
ing random walks with each length of sequences of vertices on bothgraphs, and then count how many similar walks that are existing inboth graphs. However, this task usually is difficult to accomplish dueto the high diversity of the two graphs. Therefore, instead of gener-ating sequences of vertices with different length from both graphs, arandom walk is usually performed on direct product graph [20] calcu-lated from the two graphs.
Let G = (V,E) and G′ = (V ′, E ′) be two directed graphs, the directproduct graph of these two graphs is defined as Gx = (Vx, Ex), whereVx and Ex are the vertex set and edge set described as below:
Vx = {(vi, v′m) ∈ V × V ′} (4.1)
Ex = {((vi, v′m), (vj, v′n)) ∈ Vx × Vx | (vi, vj) ∈ E, (v′m, v′n) ∈ E ′} (4.2)
The vertices of direct product graph are from all the vertices from bothG and G′, two vertices in Gx are connected by an directed edge if andonly if there are directed edges between the corresponding vertices inG1 and G2.
As can be seen in Figure 4.4, each node or vertex in direct productgraph Gx is a combination of two vertices from direct graph G andG′, two vertices in direct product graph Gx are neighbors if and only ifthe correspondingly original vertices from directed graphG andG′ areneighbors. For instance, vertices a′a and b′b in direct product graph Gx
have the property of adjacency, because vertices a and b are adjacentin graph G, and vertices a′ and b′ are connected by a directed edge ingraph G′; vertex a′c in direct product graph Gx is not adjacent to anyother vertices since there is not another combination of vertices fromoriginal graphs are connected to a′ and c simultaneously.
Let A and A′ denote the adjacency matrices of two directed graphs Gand G′ respectively, then the adjacency matrix of direct product graphGx can be denoted as Ax = A ⊗ A′, where the notation ⊗ means theKronecker product which is defined as:
Ax = An×n ⊗ A′m×m =
A11A′ · · · A1nA
′
... . . . ...An1A
′ · · · AnnA′
mn×mn
(4.3)

CHAPTER 4. APPROACH 29
Figure 4.4: An example of the direct product graph
Then, based on the direct product graph, Gärtner et al. defined therandom walk kernel as [19]:
k(G,G′) =Vx∑
i,j=1
[∞∑k=0
λkAkx]ij (4.4)

30 CHAPTER 4. APPROACH
Where 0 ≤ λ < 1 is a weighting parameter, k is the maximum lengthof a random walk. Usually, for the purpose of better classification per-formance, the adjacency matrices are needed to be normalized as:
A = A ·D−1 (4.5)
D is a diagonal matrix which is defined as:
D =
∑A∗1
. . . ∑A∗n
n×n
(4.6)
Where A∗j is the jth column of adjacency matrix A. After performingthis normalization operation on adjacency matrix, the sum of each col-umn equals to one. Then, the final function of random walk kernelis:
k(G,G′) =Vx∑
i,j=1
[∞∑k=0
λkAkx]ij (4.7)
Where Ax = A⊗ A′ denotes the normalized adjacency matrix of directproduct graph Gx.
4.4 Machine Learning
As mentioned in the previous section, the prediction of MRs is re-garded as a machine learning problem. As we know, machine learn-ing algorithms are effectively and efficiently well-known approach fordiscovering linear relations. Basically, machine learning algorithmscan be divided into two subsets: supervised learning and unsupervisedlearning, where supervised learning aims to learn a function which canmap input data to corresponding output labels based on previous ex-perience of the relations between inputs and outputs; unsupervisedlearning focuses on finding the structure of unlabeled data. In thisthesis, only supervised learning is considered.
There are many widely used algorithms for supervised learning, twokernel-based algorithms, Support vector machines and Kernel RidgeRegression, are used in this thesis.

CHAPTER 4. APPROACH 31
4.4.1 Support Vector Machines
SVMs [21] are a group of machine learning algorithms which are usedfor classification or regression issues in many real-world applications.The basic idea of SVMs is to perform linear classification by creating ahyperplane in the high dimensional space which can distinguish dif-ferent examples in the training sets based on the knowledge of theircorresponding class labels. This operation usually depends on the"kernel trick" which has been introduced in the previous section. Thereare many popular kernel functions which can perform the "kernel trick"by mapping the original low dimensional datasets into a higher di-mensional space, such as linear kernel, polynomial kernel, Gaussian kernel,and sigmoid kernel. In the specific case of this thesis, the kernel functionis the self-defined graph kernel function.
4.4.2 Kernel Ridge Regression
KRR [22] is an algorithm which combines the kernel methods andridge regression. Ridge regression, which can be also referred as Tikhonovregularization, aims to build a regression model to minimize the leastsquare cost functions with l2-norm regularization. KRR can learn alinear or non-linear function in the space mapped by the respectivekernel function and the data in original space. All the kernel functionthat can be used for SVM can also be used for KRR. In the specificcase of this thesis, the kernel function is the self-defined graph kernelfunction.

Chapter 5
Replication of the Previous Ex-periment
In previous work, Kanewala et al. used the tool Soot to generate CFGsof their target programs which are written in Java programming lan-guage. And this open source tool is specifically designed only for Java.This thesis work aims to use this state of art technique for programswritten in C programming language, which is most often used in Er-icsson. Therefore, it is impossible to directly replicate the successfulexperience from previous work. In this case, our experiment is specif-ically designed to validate that whether this technique can have theproperty of generality so that it can be used more widely for differenttypes of programs. In what follows in this chapter illustrate the detailsabout the data set, metamorphic relations, evaluation measures usedin this experiment and the results so far.
5.1 Data Set
There is no existing data set of C codes, which are labeled by their cor-responding metamorphic relations. Therefore, in order to evaluate theeffectiveness of this proposed method, we created our own data set byimplementing the mathematical functions written by C programminglanguages, which take arrays as inputs, our data set is as similar asKanewala et al. used for their machine learning model, their data setwas written by Java [4].
The proposed method leverages graph kernel method which is able
32

CHAPTER 5. REPLICATION OF THE PREVIOUS EXPERIMENT 33
to calculate the similarity score between a pair of graphs, so here weneed to generate the corresponding CFGs for these functions. SinceSoot was not available, the combination of framework LLVM and com-plier Clang under Linux OS was chosen to generate the CFGs. Thereis a difference between these two methods, Soot can generate a typedthree-address representation for each operation in Java code, then eachnode in the eventually generated CFG has a label to specify its corre-sponding operation in the code. Different from Soot, the combinationof LLVM and Clang can only generate the CFG without specifyingthe operation of each node. Let us see an example in Figure 5.1, forthe CFG on the left side, its nodes are labeled by their correspond-ing mathematical operation in the code. When using graph kernelmethods, Kanawala et al. [1] also computed the similarity betweenthe labeled nodes from two graphs, and the similarity score betweena pair of nodes will eventually contribute to the comparison of twographs. For the CFG on the right side, each node can only have anumerical number to distinguish from each other, when using graphkernel methods, we can only compare the similarity between graphi-cal structures of two graphs.
Figure 5.1: An example of labeling the nodes by their operation
This is always a difference between these two methods of generatingCFGs. The consequence of this is that we cannot compare the similar-ity between two nodes in two graphs as Kanawala et al. did [1]. Anexample of the functions in my data set and its corresponding CFG isshown in Figure 5.2. The generated CFGs are saved as dot files whichcan be directed read by some Python libraries later.

34 CHAPTER 5. REPLICATION OF THE PREVIOUS EXPERIMENT
Figure 5.2: An example of the functions (bubble sort) in my data setand its corresponding control flow graph. The combination of numberand notation "%" in each node stands for an automatically generatedfake name which can be used to distinguish each node.
5.2 Metamorphic Relations
For simplicity, there are three metamorphic relations are used in thiscase.
Permutative MR: Randomly permute the elements of the input array,the corresponding output will remain constant.
Additive MR: Add a positive constant to the input, the correspond-ing output will increase or remain constant.
Inclusive MR: Add a new element to the input array, the output willincrease or remain constant.
Based on the proposed method, each metamorphic relation is used aslabels of CFGs to train a machine learning model, if a graph holdsa metamorphic relation, then its label is 1, otherwise is 0. Table 5.1shows the number of total examples, positive examples, and negativeexamples for each MR.

CHAPTER 5. REPLICATION OF THE PREVIOUS EXPERIMENT 35
MR Total examples Positive examples Negative examplesPermutative 45 19 26Additive 39 25 14Inclusive 30 19 11
Table 5.1: Number of positive and negative examples for each MR
5.3 Evaluation Measures
As mentioned in the previous chapter, two kernel-based machine learn-ing algorithms, SVM and KRR are used in this toy example since theproposed method is based on graph kernels. Both of these two al-gorithms can be conveniently used by calling certain functions fromScikit-Learn, which is a machine learning library for Python.
In the training phase, we feed the training set split from the data set toa random walk kernel to calculate the similarity matrix which will bethen used for training a machine learning model.
5.3.1 Stratified k -fold Cross-Validation
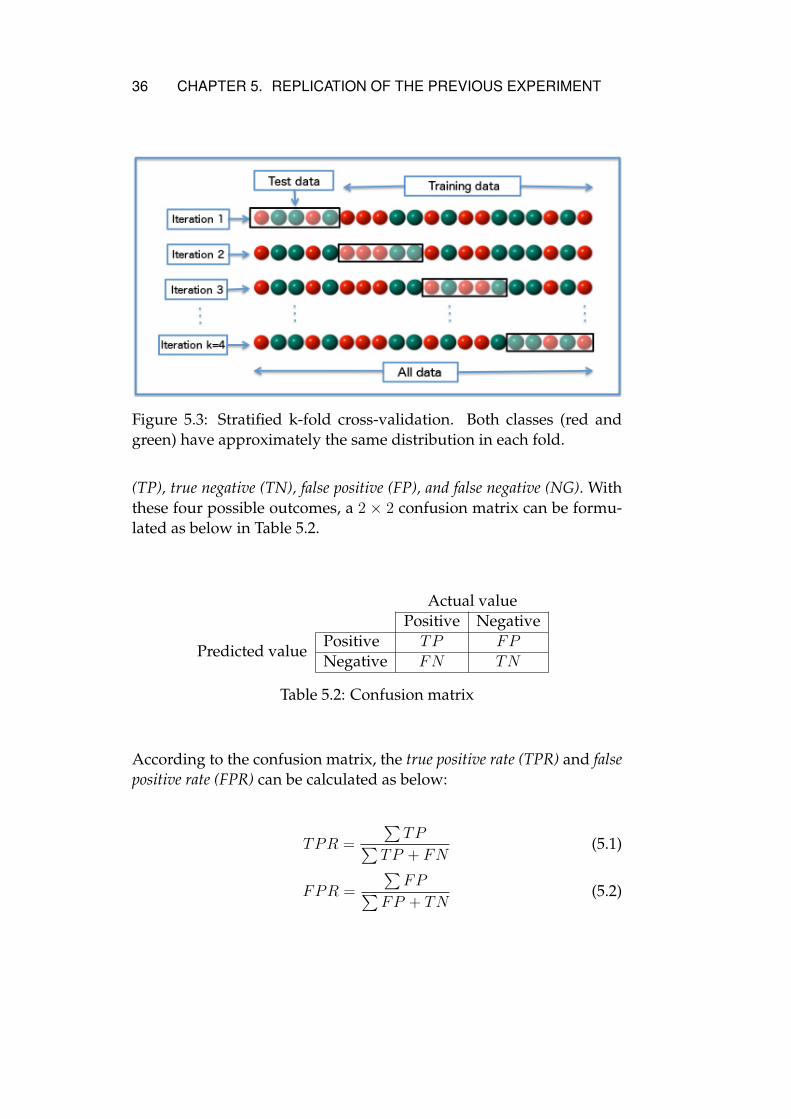
Stratified k-fold cross validation (Figure 5.3) method is used for cross-validation in this thesis. This method can randomly partition the orig-inal data set into k subsets or folds, 1 fold is used for testing while theother k − 1 folds are used for training the predictive model, then it-erate until every fold has been used for testing once. In addition, thestratified k-fold method can split data set according to the label of eachsample in order to approximately keep each class has the same propor-tion in each fold. The final result is averaged from the cross-validation.
5.3.2 Area Under the Receiver Operating Character-istic Curve
For support vector machines, we use the area under the receiver op-erating characteristic curve to evaluate the performance, since it is aneffective analysis tool for binary classifier in machine learning. In bi-nary classification, the outputs are either positive or negative, there-fore, there are four possible outcomes in total, which are: true positive
36 CHAPTER 5. REPLICATION OF THE PREVIOUS EXPERIMENT
Figure 5.3: Stratified k-fold cross-validation. Both classes (red andgreen) have approximately the same distribution in each fold.
(TP), true negative (TN), false positive (FP), and false negative (NG). Withthese four possible outcomes, a 2 × 2 confusion matrix can be formu-lated as below in Table 5.2.
Actual valuePositive Negative
Predicted valuePositive TP FP
Negative FN TN
Table 5.2: Confusion matrix
According to the confusion matrix, the true positive rate (TPR) and falsepositive rate (FPR) can be calculated as below:
TPR =
∑TP∑
TP + FN(5.1)
FPR =
∑FP∑
FP + TN(5.2)

CHAPTER 5. REPLICATION OF THE PREVIOUS EXPERIMENT 37
A receiver operating characteristic curve (i.e. ROC curve) is a graphi-cal plot, which its x and y axes are defined by TPR and FPR respec-tively. Usually, the larger the AUC is, the better the model performs.AUC = 1 means that the model under analysis is ideal, there is no falsepositive and false negative decision made by the classifier, AUC = 0.5
tells that the classifier can only make a random guess. Typically, arough guide for a good binary classifier is that when its AUC ≥ 0.8.
5.3.3 Mean Squared Error
For kernel ridge regression, since its predicted value is continuousrather than binary, was chosen to measure the quality of the regres-sion model instead of using AUC. The definition of MSE is describedas below:
MSE =1
n
n∑i=1
(yi − yi)2 (5.3)
where n is the total size of data, yi and yi represent original labels andpredictions respectively. The value of MSE is always non-negative,usually, the smaller the MSE is, the better the estimator performs. Typ-ically, a rough guide for a good binary regression model is that whenits MSE ≤ 0.2.
5.4 Results
The result of our experiment is presented in this section. We conductedthe grid search together with stratified 3-fold cross-validation to findthe best hyperparameters (regularization parameters alpha and C forKRR and SVM respectively) for different metamorphic relations. Bymaking the longest walk k in random walk kernel equal to 9, the besthyperparametersC for support vector machine and λ for random walkkernel equal to 10 and 0.8 respectively. For kernel ridge regression, thebest results for all three MRs are performed by alpha = 1 and λ = 0.6.
5.4.1 AUC Performance for Support Vector Machine
Figure 5.4, 5.5, and 5.6 depict the ROC curve of each fold and also theaverage ROC curve for prediction models regarding permutative MR,additive MR, and inclusive MR. It can be seen that each fold does not

38 CHAPTER 5. REPLICATION OF THE PREVIOUS EXPERIMENT
differ too much from the other folds, which means the variance is rel-atively small for all three models, and also the AUC values stand thefact that the prediction results are much better than a random guess.
Figure 5.4: ROC analysis of classifier for predicting the permutativemetamorphic relation
Figure 5.5: ROC analysis of classifier for predicting the additive meta-morphic relation

CHAPTER 5. REPLICATION OF THE PREVIOUS EXPERIMENT 39
Figure 5.6: ROC analysis of classifier for predicting the inclusive meta-morphic relation
Form the comparison of AUC values of three models depicted in Fig-ure 5.7, we can conclude that all three models perform well based onthe common acknowledgment that AUC ≥ 0.8 stands for a good clas-sifier. In addition, the prediction of inclusive MR is relatively moreaccurate than the other two MRs.
Figure 5.7: The comparison of performance among all classifiers

40 CHAPTER 5. REPLICATION OF THE PREVIOUS EXPERIMENT
5.4.2 MSE Performance for Kernel Ridge Regression
Figure 5.8 shows the comparison of MSE results for three regressionmodels, we can see that all the MSE values are around 0.2 or evensmaller, which also means the models are acceptable. Additionally, theregression model for prediction inclusive MR is also relatively moreaccurate than the other two MRs.
Figure 5.8: The comparison of performance among all regression mod-els
5.4.3 Analysis of Random Walk Kernel
To evaluate the random walk kernel when using SVM and KRR, wecomputed the AUC results with different values of λ from 0.1 to 0.9,since λ is a parameter in random walk kernel which should be smallthan 1.
Figure 5.9 shows the result when using SVM. For permutative MR, theAUC slightly increases when λ goes larger; and higher value of λ re-sults in better performance of AUC for additive MR. This phenomenonindicates that the prediction of permutative and additive MRs focusmore on the comparing longer walks in two graphs. This can be ex-plained by Equation 4.7 in the previous section, all the random walkswith different lengths in the direct product graph are weighted by λk,

CHAPTER 5. REPLICATION OF THE PREVIOUS EXPERIMENT 41
the longer walks which have larger value of k can give more contribu-tion when λ is higher. For inclusive MR, the AUC slightly goes downwith higher value of λ, this shows that the prediction of inclusive MRcares more about the similarity between shorter walks of two graphs.
Figure 5.9: Variation of AUC with different value of λ
Figure 5.10 shows the result when using KRR. For permutative andadditive MRs, the MSE does not vary too much when the value ofλ changes. The prediction of inclusive MR becomes more accuratewith larger value of λ. This phenomenon shows that different ma-chine learning algorithms can also affect the effectiveness of randomwalk kernel with different value of λ.

42 CHAPTER 5. REPLICATION OF THE PREVIOUS EXPERIMENT
Figure 5.10: Variation of MSE with different value of λ
5.4.4 Test for Existing Telecom Software
We also tried to use the machine learning models, trained on our dataset, to predict MRs for existing telecom software in Ericsson. The pre-dicted MRs were not applicable for the programs under test.
This result can be explained for several reasons. Firstly, the functionswe used for training are at the unit level or function level, the code weused to test is more complex and at the system level or program level.The properties that can be revealed in functions may not be possibleto detect in complex programs. Second, the data set we used consistsof mathematical functions take an array as inputs, whereas the tele-com programs are not purely mathematical and the inputs could havedifferent types of inputs. Additionally, there are not standard meta-morphic relations in the metamorphic testing community which canbe applied for all kinds of programs and software systems, thereforethe MRs in our model may not be feasible for the telecom programs.

Chapter 6
Conclusion and Future Work
This thesis aims to achieve automatic prediction of metamorphic rela-tions by utilizing machine learning algorithms combined with graphkernel methods. In this chapter, the overall conclusion drawn fromthis thesis and the future work are presented.
6.1 Conclusion
Metamorphic testing [3] is an effective software testing technique fortesting programs which are lacking test oracles. This approach is basedon a mechanism of checking a set of properties between inputs andoutputs, which is called metamorphic relations. The violation of cer-tain MRs of a program can indicate that there are certainly some errorsin this testing program. However, it is often difficult for testers to iden-tify MRs of a program. In this case, this thesis aims to investigate thatwhether machine learning algorithms together with graph kernel tech-niques could help to predict MRs for testing programs.
In previous work by Kanewala et al. [1][5], they successfully imple-mented machine learning methods on predicting MRs by using graphkernels trick. Their results show that the control flow graph is aneffective feature of a testing program for training a machine learn-ing model, and kernel-based machine learning methods together withgraph kernels also work well in predicting MRs. Although their ex-periment was successful in this special task, simple replication of theirwork cannot be conducted for the common programs in Ericsson. Thereare two reasons for this problem. Firstly, the code corpus of their ex-
43

44 CHAPTER 6. CONCLUSION AND FUTURE WORK
periment is written in Java, while C programming language is most of-ten used in Ericsson. There are some subtle differences between thesetwo programming languages, which could cause different structuresof control flow graphs for training a machine learning model. Sec-ondly, the tool they used for generating control flow graphs is calledSoot, which a specifically designed library only for Java programs.This means that their method is strictly limited by a third party toolso that their approach cannot be simply transferred to other program-ming languages.
In order to validate that their idea can be used for wider areas, wefirstly investigated the way of generating control flow graphs for Ccodes. Finally, we decided to use the combination of framework LLVMtogether with compiler Clang to generate unlabeled control flow graphsfor C programs. Then we built our own code corpus by implementing45 mathematical functions as similar as Kanewala et al. did in theirprevious work [4], and generated CFGs of all the functions in our codecorpus by using the method as mentioned before. After that, we imple-mented the function of random walk kernel to calculate the similarityscore matrix or gram matrix, each entry of this matrix stands for thesimilarity score between two CFGs of their corresponding programsin our code corpus. Next, we trained two kinds of machine learningmodels for each metamorphic relation by using support vector ma-chine and kernel ridge regression algorithms. We measured our mod-els by using the area under the receiver operating characteristic curveor mean squared error together with stratified k-fold cross-validation.
The result of our experiments shows that the AUC values for all meta-morphic relations are larger than 0.8, and the MSE values for all MRsare around or smaller than 0.2. According to a common acknowledge-ment, AUC ≥ 0.8 and MSE ≤ 0.2 can indicate that the trained modelperforms well. In addition, both of these two machine learning algo-rithms, SVM and KRR, performed better on predicting inclusive MRof a program than permutative MR and additive MR. Additionally, weanalyzed the effectiveness of random walk kernel with the variationof parameter λ. The result shows that machine learning algorithmstogether with graph kernels methods can be effective for predictingmetamorphic relations for previously unseen C program.

CHAPTER 6. CONCLUSION AND FUTURE WORK 45
6.2 Future Work
The model in this thesis work is the first step of this specific approach,and it can be extended in several directions.
Firstly, we used the code corpus consists of 45 mathematical functionswhich is a relatively small data set could threat the external validity, toavoid this problem we can build a larger data set with more functions,which can lead to better accuracy and a smaller threat to external va-lidity.
Secondly, the prediction of metamorphic relations in our model is atthe function level or unit level, however, in real applications, pro-grams are often more complex by calling multiple functions. If themodel is trained based on codes at the program level, sometimes themetamorphic relations at function level cannot be predicted, this couldcause the problem that some subtle errors at function level cannot berevealed by checking the metamorphic relations which are predictedat the program level [23]. In this case, we need to investigate the re-lationship between functions and programs and then develop moregeneral and complex algorithms that can predict metamorphic rela-tions at function level and program level simultaneously.
Thirdly, the model in this thesis aims to the prediction of single meta-morphic relation, which also means that the binary classifier is trainedin our work. However, most of the programs could have more thanone metamorphic relations at the same time. In this case, we can use asoftmax function which can predict the possibilities of multiple classesin a single output vector.
Besides, the functions in our code corpus take arrays as inputs. Inreal applications, functions could have different types of forms of in-puts like matrices, volumes, and graphs, etc. Regarding this situation,we could train specific machine learning models for different kinds ofprograms, or train a more general model based on a data set with alarger variety.
In addition, our method is still limited by the third party tools. Theway we used for generating control flow graphs only aims for C or

46 CHAPTER 6. CONCLUSION AND FUTURE WORK
C++ programming languages, so our approach cannot be simply trans-ferred to programs written by other programming languages. Thereshould be a general tool which can generate labeled or unlabeled con-trol flow graphs for different kinds of codes. However, this task maybe more feasible for the professional tool developers in this area.
Finally, at the age of fast development of artificial intelligence, wecould build a graph kernel based deep neural network to predict thepossible metamorphic relations that a testing program could have [24].
Bibliography
[1] Upulee Kanewala, James M Bieman, and Asa Ben-Hur. “Predict-ing metamorphic relations for testing scientific software: a ma-chine learning approach using graph kernels”. In: Software test-ing, verification and reliability 26.3 (2016), pp. 245–269.
[2] Elaine J Weyuker. “On testing non-testable programs”. In: TheComputer Journal 25.4 (1982), pp. 465–470.
[3] Tsong Y Chen, Shing C Cheung, and Siu Ming Yiu. Metamorphictesting: a new approach for generating next test cases. Tech. rep. Tech-nical Report HKUST-CS98-01, Department of Computer Science,Hong Kong University of Science and Technology, Hong Kong,1998.
[4] Upulee Kanewala and James M. Bieman. “Using machine learn-ing techniques to detect metamorphic relations for programs with-out test oracles”. eng. In: IEEE, Nov. 2013, pp. 1–10. ISBN: 9781479923663.
[5] Karishma Rahman and Upulee Kanewala. “Predicting Metamor-phic Relation for Matrix Calculation Programs”. In: arXiv preprintarXiv:1802.06863 (2018).
[6] Jie Zhang et al. “Search-based inference of polynomial metamor-phic relations”. In: Proceedings of the 29th ACM/IEEE internationalconference on Automated software engineering. ACM. 2014, pp. 701–712.
[7] Dorota Huizinga and Adam Kolawa. Automated defect prevention:best practices in software management. John Wiley & Sons, 2007.
[8] Strategic Planning. “The economic impacts of inadequate infras-tructure for software testing”. In: National Institute of Standardsand Technology (2002).
[9] Sergio Segura et al. “A survey on metamorphic testing”. In: IEEETransactions on software engineering 42.9 (2016), pp. 805–824.
47
48 BIBLIOGRAPHY
[10] Vu Le, Mehrdad Afshari, and Zhendong Su. “Compiler valida-tion via equivalence modulo inputs”. In: ACM SIGPLAN Notices.Vol. 49. 6. ACM. 2014, pp. 216–226.
[11] Xiaoyuan Xie et al. “Testing and validating machine learningclassifiers by metamorphic testing”. In: Journal of Systems andSoftware 84.4 (2011), pp. 544–558.
[12] Zhenyu Wang et al. “Metamorphic Testing for Adobe AnalyticsData Collection JavaScript Library”. In: ().
[13] Mikael Lindvall et al. “Metamorphic Model-Based Testing Ap-plied on NASA DAT–An Experience Report”. In: Software Engi-neering (ICSE), 2015 IEEE/ACM 37th IEEE International Conferenceon. Vol. 2. IEEE. 2015, pp. 129–138.
[14] Yuchi Tian et al. “DeepTest: Automated testing of deep-neural-network-driven autonomous cars”. In: arXiv preprint arXiv:1708.08559(2017).
[15] Christian Murphy et al. “Properties of Machine Learning Appli-cations for Use in Metamorphic Testing.” In: SEKE. Vol. 8. 2008,pp. 867–872.
[16] Roded Sharan and Trey Ideker. “Modeling cellular machinerythrough biological network comparison”. In: Nature biotechnol-ogy 24.4 (2006), p. 427.
[17] Danail Bonchev. Chemical graph theory: introduction and fundamen-tals. Vol. 1. CRC Press, 1991.
[18] Ravi Kumar, Jasmine Novak, and Andrew Tomkins. “Structureand evolution of online social networks”. In: Link mining: models,algorithms, and applications. Springer, 2010, pp. 337–357.
[19] Thomas Gärtner, Peter Flach, and Stefan Wrobel. “On graph ker-nels: Hardness results and efficient alternatives”. In: IN: CON-FERENCE ON LEARNING THEORY. 2003, pp. 129–143.
[20] Svn Vishwanathan et al. “Graph Kernels”. English. In: JournalOf Machine Learning Research 11 (Apr. 2010), pp. 1201–1242. ISSN:1532-4435.
[21] Corinna Cortes and Vladimir Vapnik. “Support-vector networks”.In: Machine learning 20.3 (1995), pp. 273–297.
[22] Christian Robert. Machine learning, a probabilistic perspective. 2014.

BIBLIOGRAPHY 49
[23] Christian Murphy. Metamorphic testing techniques to detect defectsin applications without test oracles. Citeseer, 2010.
[24] Giannis Nikolentzos et al. “Kernel Graph Convolutional NeuralNetworks”. In: arXiv preprint arXiv:1710.10689 (2017).