south africa's mineral industry
275
-
Upload
khangminh22 -
Category
Documents
-
view
0 -
download
0
Transcript of south africa's mineral industry
DEPARTMENT: MINERAL RESOURCES
REPUBLIC OF SOUTH AFRICA
Directorate: Mineral Economics
SOUTH AFRICA’S MINERAL INDUSTRY
2016/2017
The cover picture represents South Africa’s Minerals Mining Industry.
Issued free by and obtainable from the
Director: Mineral Economics, Trevenna Campus,
70 Meintjies Street, Pretoria 0002, Private Bag X59, Arcadia 0007
Telephone +27 (0) 12 444 3531, Telefax +27 (0) 12 341 4134
www.dmr.gov.za
Editors:
TR Masetlana; M Ikaneng; R Motsie; L Malebo; M. Machaka; P Mwape
Statistics: M Galane & M Mahote
Co-ordinator: TR Masetlana
First Published August 1984
This, the 34th edition, published March 2018
Whereas the greatest care has been taken in the compilation of the contents
of this publication, the Mineral Economics Directorate does not hold itself
responsible for any errors or omissions.
Copyright Reserved
ISBN: 978-0-621-46269-2
i
FOREWORD
South Africa's mineral wealth has been built on the country's enormous resources and the mining sector continues to play an economic and socio-economic role in the country’s development. South Africa accounts for 94 percent of known global reserves of the platinum group metals (PGMs), 73.7 percent of chrome, 29 percent of manganese, 18.4 percent of vanadium and 10.5 percent of gold reserves. As a leading producer and supplier of a range of minerals, the country offers a highly competitive investment location, ensuring that it can meet specific trade and investment requirements of prospective investors and business people, whilst also meeting the development needs of its populace. The country has the potential to supply a large share of the global demand for many commodities, but its rich endowment of natural resources and high mineral potential can only be developed and extended through a vibrant exploration sector. Despite improved commodity prices in 2016, both major and junior exploration companies reduced their exploration expenditure. The year 2016 is the fourth consecutive year of declining exploration expenditure with the total of US$6.89 billion from 1580 companies, the lowest since 2009 and 21 percent lower than US$8.77 billion in 2015 from 1798 companies. South Africa’s total exploration budget also fell significantly by 17.9 percent in 2016, from $117.1 million in 2015 to $96.1 million representing one percent global share. Platinum group metals (PGMs) and diamonds were the leading explored targets with the total amount of $29.5 million and $25.6 million respectively and the large part of the country’s total exploration budget was spent on late stage and feasibility at $43.9 million followed by mine site at $35.4 million and then grassroots at $16.8 million.
After a number of years of sustainable growth, dating back from 1992, the country’s economy became a casualty of economic recession of the year 2009. Following, a good sign at the end of the recession, the downward trend in commodity prices, started again in 2011, continuing well into 2015. Weaker demand and excess supply internationally, have underpinned the adverse price trends in most instances, with a stronger US dollar aggravating the situation. The 2016 financial year marked another challenging period for South Africa’s mining industry with a continuing downswing in commodity prices and a slower than expected economic growth. However, South Africa’s total primary minerals sales value increased by 6.8 percent from R397.4 billion in 2015 to R424.4 billion in 2016 helped by a weaker rand. In 2016, mining contributed R306.2 billion or 7.9 percent to gross domestic product from R286.5 billion in 2015 an increase of R19.7 billion. In 2016, mining contributed R306.2 billion or 7.9 percent to gross domestic product from R286.5 billion in 2015 an increase of R19.7 billion. The increase in value added by mining can be attributed to weakening of the rand against the dollar which depreciated to R14.70 in 2016 from R12.76 in 2015. However, due to the depreciation of the rand from R12.76 in 2015 to R14.70 in 2016 mining contribution to the economy in US dollar decrease from $22.45 billion to $20.83 billion over the same period. In 2016, Mining and quarrying contribution to Gross Fixed Capital Formation (GFCF) increase to 11 percent from 10.8 percent in 2015. SA’s total mining employment declined by 4.7 percent from 480 209 in 2015 to 457 688 in 2016. This is due to the fact that the mining companies were under pressure from rising operating costs and, capital investment declined, making it difficult to create new jobs. During the same period, remuneration in the mining sector increased by 5.6 percent from R 114.1 billion in 2015 to R 120.5 billion in 2016 due annual increaments and bonuses paid to employees SA’s total mining employment figure declined by 4.7 percent from 480 209 in 2015 to 457 688 in 2016. Mining companies were under pressure from rising operating costs and capital investment has been in decline making it difficult to create new jobs. During the same period remuneration in the mining sector increased by 5.6 percent from R 114.1 billion in 2015 to R 120.5 billion in 2016 due to an increase in bonuses paid to employees.
ii
As a result of its vast mineral resources, South Africa is, to a large degree self-sufficient with respect to the supply of minerals. However, there are some minerals and mineral products, which need to be imported due to lack of local resources. The total value of imports increased by 14.9 percent from R24.1 billion in 2015 to R27.7 billion in 2016. Beneficiation remains a key initiative ii
For government, as it seeks to leverage the country’s comparative advantage in mineral resource endowment to create a competitive advantage for domestic mineral beneficiating entities, thus playing a contributory role towards setting the country’s growth trajectory on a production led growth path.
South Africa’s minerals industry is open to investment, in exploration, mining and value addition activities. Thus, addressing challenges facing the mining industry would significantly improve the outlook of the sector, making it viable and resilient. To this end, the Honorable Minister Gwede Mantashe has committed to finalise the Mining Charter as well as the MPRD Amendment Bill by end of June 2018. This paves the way for investment into the country, despite a myriad of challenges that the sector faces. It is against this background that there is hope that the country will grow stronger among the favorite investment destinations.
I wish to on behalf of Mineral Economics team thank the staff of the Mineral Policy and Promotion for their continued sterling performance in contributing to the compilation of this flagship publication, as well as the industry for its support and cooperation. Special appreciation is extended to the interns Ms. Nancy Rabuma, Mr. Tshepo Rakhudu and Ms. Mmapoo Maredi who contributed to the edition. I wish to join the Mineral Economics and the Department at Large in bidding farewell to Mr. Paul Mwape and Mr. Peaga Gad Kwata both of whom served the department with conviction and commitment for a combined total of more than 30 years. They will both be missed for unselfishly imparting knowledge to both the young and older talents in the department. Their work in the department will remain notable as we radically transform our country towards becoming a truly “democratic, united, non-racial, non-sexist, equal and prosperous” nation.
MR RAY MASETLANA
ii
CONTENTS
Page
FOREWORD i
LIST OF FIGURES vi
LIST OF TABLES ix
ABBREVIATIONS AND SYMBOLS xiv
EXPLANATORY NOTES xvi
PART ONE: SOUTH AFRICA’S MINERAL INDUSTRY 1
GENERAL REVIEW P MWAPE, M MAHOTE, E MOKWENA, E MALEMATJA,
V MADZUHE, S MALIE, G KWATA; K MENOE 1
INFRASTRUCTURE DEVELOPMENTS 1
MINERAL INDUSTRY STRENGTH 4
PRODUCTION OVERVIEW OF SELECTED MAJOR MINERALS 6
EXPLORATION EXPENDITURE BY REGION, 2016 6
THE ROLE OF MINING IN THE NATIONAL ECONOMY 8
PRIMARY MINERAL SALES IN 2016 11
SELECTED PROCESSED MINERAL SALES 14
SOUTH AFRICA’S IMPORTS OF SELECTED PRIMARY AND PROCESSED MINERAL
PRODUCTS, 2016 16
TOTAL EMPLOYMENT IN 2016 18
SMALL-SCALE MINING SECTOR IN SOUTH AFRICA 20
MINERALS AND METALS PRICES 2016 21
iii
PART TWO: REVIEW OF SELECTED COMMODITIES 25
OVERVIEW L MALEBO 25
DIAMONDS O MOUMAKWA 28
GOLD P PEROLD 32
PLATINUM-GROUP METALS (PGMs) O MOUMAKWA 41
SILVER P PEROLD 49
ENERGY COMMODITIES 55
OVERVIEW KL REVOMBO 55
COAL KL REVOMBO 60
HYDROCARBON FUELS KL REVOMBO 73
URANIUM K TSHETLANYANE 80
NONFERROUS METALS AND MINERALS 85
OVERVIEW L RAMANE 85
ALUMINIUM K TSHETLANYANE 89
ANTIMONY Y MUNYU & L RAMANE 94
COBALT L RAMANE 97
COPPER S MNYAMENI 102
LEAD S MNYAMENI 109
NICKEL N RABUMA & L RAMANE 114
TITANIUM K TSHETLANYANE 120
ZINC S MNYAMENI 126
ZIRCON Y MUNYU & M IKANENG 132
iv
FERROUS METALS AND MINERALS 137
OVERVIEW L MALEBO 137
CHROMIUM M KHAILE 140
IRON ORE R RAVHUGONI 147
MANGANESE ORE R RAVHUGONI 152
SILICON R RAVHUGONI 158
VANADIUM M KHAILE 162
INDUSTRIAL MINERALS 167
OVERVIEW R MOTSIE 167
AGGREGATE AND SAND R MOTSIE 174
ALUMINO-SILICATES M MODISELLE 178
DIMENSION STONE R MOTSIE & O RADIPABE 185
FLUORSPAR M MODISELLE 190
LIMESTONE AND DOLOMITE P KONANANI & R MOTSIE 195
PHOSPHATE ROCK M MURAVHA & O RADIPABE 201
SPECIAL CLAYS M MURAVHA 206
SULPHUR M MODISELLE & P KONANANI 214
VERMICULITE M MURAVHA 219
STATISTICS FOR OTHER INDUSTRIAL MINERALS R MOTSIE & M MAREDI 224
v
PART THREE: GENERAL INFORMATION 235
USEFUL ADDRESSES 235
DEPARTMENT OF MINERAL RESOURCES HEAD OFFICE 235
MINERAL REGULATION REGIONAL DIRECTORATES 235
ASSOCIATED GOVERNMENT DEPARTMENTS 239
STATE OWNED ENTERPRISES 241
OTHER MINERAL-RELATED ORGANISATIONS 245
RECENT PUBLICATIONS 248
vi
LIST OF FIGURES
Page
FIGURE 1: DISTRIBUTION OF EXPLORATION EXPENDITURE BY REGION, 2016 ................................................. 7
FIGURE 2: PERCENTAGE CONTRIBUTION OF MINING AND QUARRYING TO GROSS DOMESTIC PRODUCT AND TOTAL FIXED CAPITAL FORMATION OF SOUTH AFRICA, 2007-2016 (CURRENT RENT PRICES) .............. 8
FIGURE 3: CONTRIBUTION OF PRIMARY MINERAL COMMODITIES TO TOTAL SALES REVENUE 2016 ......... 11
FIGURE 4: CONTRIBUTION OF PRIMARY MINERALS TO SOUTH AFRICA’S EXPORTS’# 2007-2016 ................ 13
FIGURE 5: MINING INDUSTRY’S EMPLOYMENT BY SECTOR, 2016 .................................................................... 20
FIGURE 6: MINING INDUSTRY’S REMUNERATION BY SECTOR, 2016 ................................................................ 20
FIGURE 6: GLOBAL GOLD MINE SUPPLY, 2016. .................................................................................................... 32
FIGURE 7: SHARE OF GLOBAL PRODUCTION BY COUNTRY, 2016. .................................................................... 33
FIGURE 8: SOUTH AFRICA’S PRIMARY GOLD PRODUCTION SPLIT BY PROVINCE, 2016. ............................... 34
FIGURE 9: SOUTH AFRICA’S PRIMARY GOLDFIELD PRODUCTION, 2016. ......................................................... 34
FIGURE 10: WORLD GOLD DEMAND MARKETS*, 2016. ........................................................................................ 35
FIGURE 11: AVERAGE GOLD PRICE MOVEMENTS IN RANDS AND DOLLARS, 2016. ....................................... 37
FIGURE 12: GLOBAL PGMs SUPPLY, 2016. ............................................................................................................ 41
FIGURE 13: SA PGMs PRODUCTION, 2016. ............................................................................................................ 44
FIGURE 14: DAILY PGMs PRICES, 2016. ................................................................................................................. 45
FIGURE 15: GLOBAL SILVER PRODUCTION BY SOURCE, 2016........................................................................... 49
FIGURE 16: S.A SILVER PRODUCTION BY SOURCE-2015-2016. .......................................................................... 50
FIGURE 17: WORLD SILVER CONSUMPTION (Moz) BY SECTOR, 2016. .............................................................. 52
FIGURE 18: MONTHLY AVERAGE SILVER PRICES, 2016. ..................................................................................... 53
FIGURE 19: SOUTH AFRICA’S EXPORT PERCENTAGE BY REGIONAL DESTINATION, 2016 ............................ 64
FIGURE 20: TOP 10 IMPORTERS (Mt) OF SOUTH AFRICA’S COAL, 2016 ............................................................ 64
FIGURE 21: LOCAL COAL CONSUMPTION BY SECTOR (PERCENTAGE), 2016 .................................................. 65
FIGURE 22: MAJOR COAL EXPORTERS (Mt), 2016 ................................................................................................ 66
FIGURE 23: MAJOR COAL IMPORTERS (Mt), 2016 ................................................................................................. 66
FIGURE 24: RBCT MONTHLY COAL PRICES, JANUARY 2015 – DECEMBER 2016 .............................................. 67
FIGURE 25: SOURCES OF CRUDE OIL IMPORTS, 2016 ........................................................................................ 76
FIGURE 26: MONTHLY AVERAGE BRENT CRUDE PRICES, JANUARY 2015 – DECEMBER 2016 ...................... 77
FIGURE 27: AVERAGE MONTHLY SPOT URANIUM PRICES, 2015-2017. ............................................................. 83
vii
FIGURE 28: WORLD PRIMARY ALUMINIUM PRODUCTION BY REGION, 2016. ................................................... 90
FIGURE 29: INDUSTRIAL DEMAND FOR HIGH GRADE PRIMARY ALUMINIUM, 2016. ........................................ 91
FIGURE 30: LONDON METAL EXCAHNGE CASH SETTLEMETS PRICES FOR 2014 AND 2016. ......................... 91
FIGURE 31: ANTIMONY, METAL BULLETIN FREE MARKET PRICES, 2016-2017. ................................................ 95
FIGURE 32: COBALT CONSUMPTION BY END USE, 2016 ................................................................................... 100
FIGURE 33: COBALT PRICE, 2015 – 2017 ............................................................................................................. 100
FIGURE 34: GLOBAL REFINED COPPER PRODUCTION AND DEMAND, 2008 – 2016. ...................................... 104
FIGURE 35: MAJOR END USE OF REFINED COPPER BY SECTOR 2016. .......................................................... 105
FIGURE 36: LME CASH SETLEMENT COPPER PRICES (MONTHLY AVERAGE), 2016-2017. ........................... 106
FIGURE 37: LEAD CASH SETTLEMENT PRICES (MONTHLY AVERAGE) IN 2016 - 2017 ................................... 111
FIGURE 38. THE PRIMARY END-USES FOR NICKEL. .......................................................................................... 116
FIGURE 39: MONTHLY AVERAGE NICKEL PRICE. ............................................................................................... 117
FIGURE 40: TITANIUM PIGMENT END USE APPLICATIONS, 2016. ..................................................................... 122
FIGURE 41: METAL BULLETIN PRICES FOR RUTILE AND ILMENITE, 2015 – 2017. .......................................... 122
FIGURE 42: LME ZINC CASH SETTLEMENT PRICE (MONTHLY AVERAGES), 2016-2017. ................................ 128
FIGURE 43: WORLD CONSUMPTION OF ZIRCON BY SECTOR, 2016. ............................................................... 133
FIGURE 44: PRICES FOR FOUNDRY GRADE ZIRCON, FREE ON BOARD, 2016-2017 ...................................... 134
FIGURE 45: WORLD’S LEADING STAINLESS STEEL PRODUCERS, 2016. ......................................................... 143
FIGURE 46: CHROME ORE AND FERROCHROME PRICES, 2016 ....................................................................... 145
FIGURE 47: IRON ORE PRICES (62% Fe, CFR China), 2015 – Q2 2017. .............................................................. 149
FIGURE 48: MANGANESE ORE AND MANGANESE HIGH CARBONFERROMANGANESE PRICES. ................. 155
FIGURE 49: GLOBAL SILICON PRODUCTION PERCENTAGE BY COUNTRY 2016 ............................................ 158
FIGURE 50: WORLD VANADIUM RESERVES, 2016 .............................................................................................. 162
FIGURE 51: WORLD VANADIUM PRODUCTION, 2016 ......................................................................................... 163
FIGURE 52: MONTHLY FERROVANADIUM AND VANADIUM PENTOXIDE PRICES, 2013 - 2016 ...................... 165
FIGURE 53: INDUSTRIAL MINERAL SALES, 2012 – 2016 ..................................................................................... 168
FIGURE 54: LOCAL SALES VALUE OF INDUSTRIAL MINERALS, 2016 ............................................................... 168
FIGURE 55: EXPORT SALES OF INDUSTRIAL MINERALS, 2016 ......................................................................... 169
FIGURE 56: IMPORTS AND EXPORTS OF PRIMARY AND MANUFACTURED INDUSTRIAL MINERALS, 2012 – 2016 .......................................................................................................................................................................... 170
FIGURE 57: EMPLOYMENT IN THE INDUSTRIAL MINERALS SECTOR, 2012 – 2016 ......................................... 170
FIGURE 58: WORLD PRODUCTION OF ALUMINO-SILICATES BY COUNTRY, 2016 .......................................... 178
viii
FIGURE 59: WORLD REFRACTORIES MARKET BY END-USERS, 2017 .............................................................. 179
FIGURE 60: WORLD ALUMINO SILICATES PRICES 2007-2016. .......................................................................... 181
FIGURE 61: WORLD CONSUMPTION OF DIMENSION STONE BY SECTOR ...................................................... 186
FIGURE 62: WORLD DEMAND OF NATURAL STONE BY COUNTRY .................................................................. 187
FIGURE 63: WORLD FLUORSPAR PRODUCTION, 2016. ..................................................................................... 190
FIGURE 64: DEMAND FOR LIMESTONE BY SECTORS, 2016 .............................................................................. 196
FIGURE 65: SOUTH AFRICA`S IMPORTS OF CEMENT PRODUCTS, 2014 – 2016. ............................................ 197
FIGURE 66: PHOSPHATE ROCK PRODUCTION BY COUNTRY, 2016. ................................................................ 201
FIGURE 67: WORLD PHOSPHATE ROCK DEMAND ............................................................................................. 202
FIGURE 68: GLOBAL KAOLIN DEMAND BY SECTOR ........................................................................................... 206
FIGURE 69: GLOBAL SPECIAL CLAYS PRODUCTION: 2011-2016 ...................................................................... 207
FIGURE 70: WORLD PRODUCTION OF SULPHUR BY COUNTRY, 2016 ............................................................. 214
FIGURE 71: WORLD PRODUCTION OF VERMICULITE BY COUNTRY, 2016 ...................................................... 219
FIGURE 72: VERMICULITE CONSUMPTION BY SECTOR, 2016 .......................................................................... 220
FIGURE 73: VERMICULITE PRICES, 2007-2016 .................................................................................................... 222
ix
LIST OF TABLES
Page
TABLE 1: SOUTH AFRICA’S ROLE IN WORLD MINERAL RESERVES, PRODUCTION AND EXPORTS, 2016....... 5
TABLE 2: SOUTH AFRICA’S PRODUCTION OF SELECTED MAJOR MINERALS, 2012 – 2016 .............................. 6
TABLE 3: CONTRIBUTION OF MINING AND QUARRYING TO GROSS DOMESTIC PRODUCT, FIXED CAPITAL FORMATION AND TOTAL NATIONAL EXPORTS OF GOODS, 2007 – 2016 (at current prices)................................ 9
TABLE 4: CONTRIBUTIONS OF MINING AND QUARRYING TO STATE REVENUE, 2008–2016 (in R' million) .... 10
TABLE 5: MINERAL PRODUCTION AND SALES 2016 ............................................................................................. 12
TABLE 6: SOUTH AFRICA’S PRIMARY MINERAL SALES BY PROVINCE, 2016 ................................................... 13
TABLE 7: SOUTH AFRICA’S PRODUCTION, LOCAL AND EXPORT SALES OF SELECTED ................................ 14
PROCESSED MINERAL PRODUCTS, 2016 .............................................................................................................. 14
TABLE 8: SOUTH AFRICA’S LOCAL AND EXPORT SALES OF SELECTED PROCESSED MINERAL PRODUCTS BY PROVINCE, 2016 .................................................................................................................................................. 15
TABLE 9: SOUTH AFRICA’S IMPORTS OF SELECTED PRIMARY AND PROCESSED MINERAL PRODUCTS, 2016 ............................................................................................................................................................................ 17
TABLE 10: EMPLOYMENT AND WAGES IN SOUTH AFRICA’S MINING INDUSTRY, 2007–2016 ......................... 18
TABLE 11: EMPLOYMENT AND REMUNERATION BY PROVINCE, 2016 .............................................................. 19
TABLE 12: METALS/MINERALS PRICES (2012- 2016) ............................................................................................ 23
TABLE 13: SOUTH AFRICA'S PRODUCTION AND SALES OF PRECIOUS METALS, 2014. ................................. 25
TABLE 14: EMPLOYMENT AND REMUNERATION IN SOUTH AFRICA'S PRECIOUS METALS AND MINERALS MINES, 2009 - 2013. ................................................................................................................................................... 26
TABLE 15: WORLD ROUGH DIAMOND PRODUCTION, 2016. ................................................................................ 28
TABLE 16: SOUTH AFRICA’S ROUGH DIAMOND PRODUCTION AND SALES, 2016. ........................................... 29
TABLE 17: EMPLOYMENT AND REMUNERATION IN SA'S DIAMOND MINING INDUSTRY, 2012-2016. .............. 31
TABLE 18: SOUTH AFRICA’S PRODUCTION AND SALES OF GOLD, 2007-2016. ................................................. 36
TABLE 19: SOUTH AFRICA’S GOLD MINES EMPLOYMENT AND REMUNERATION, 2012–2016. ....................... 39
TABLE 20: GLOBAL PGMs DEMAND, 2016. ............................................................................................................. 42
TABLE 21: SA PGMs MINE PRODUCTION AND SALES, 2015-2016. ...................................................................... 43
TABLE 22: US BASE PRICES OF PGMs, 2016. ........................................................................................................ 45
TABLE 23: EMPLOYMENT (INCLUDING CONTRACTORS) AND REMUNERATION IN SOUTH AFRICA'S PGMs MINES, 2012-2016. ..................................................................................................................................................... 47
TABLE 24: SOUTH AFRICA’S PRODUCTION AND SALES OF SILVER, 2006-2016. .............................................. 51
x
TABLE 25: SOUTH AFRICA’S PRODUCTION AND SALES OF ENERGY COMMODITIES, 2016 ........................... 56
TABLE 26: EMPLOYMENT AND GROSS REMUNERATION ON MINES AND PLANTS IN THE SOUTH AFRICAN ENERGY INDUSTRY, 2007 – 2016. ........................................................................................................................... 58
TABLE 27: WORLD COAL RESERVES, PRODUCTION AND EXPORTS, 2016 ...................................................... 60
TABLE 28: SOUTH AFRICA’S PRODUCTION AND SALES OF SALEABLE COAL, 2007 - 2016 ............................ 61
TABLE 29: SOUTH AFRICA’S PRODUCTION AND SALES OF ANTHRACITE, 2007 – 2016 ................................. 62
TABLE 30: SOUTH AFRICA’S BITUMINOUS COAL PRODUCTION AND SALES, 2007 – 2016 ............................. 63
TABLE 31: MAJOR COAL PROJECTS CURRENTLY UNDER CONSTRUCTION .................................................... 70
TABLE 32: EMPLOYMENT IN THE COAL SECTOR, 2007 – 2016............................................................................ 71
TABLE 33 – WORLD RESERVES AND PRODUCTION OF OIL AND NATURAL GAS, 2016 ................................... 73
TABLE34: WORLD URANIUM RESOURCES AND PRODUCTION, 2016 ................................................................. 80
TABLE 35: WORLD NUCLEAR POWER REACTORS AND URANIUM REQUIREMENTS, 2015-2016 .................... 82
TABLE 36: SOUTH AFRICAN PRODUCTION AND SALES OF NON-FERROUS METALS AND MINERALS, 2015 AND 2016 ................................................................................................................................................................... 86
TABLE 37: SOUTH AFRICA’S NON-FERROUS METALS AND MINERALS: EMPLOYMENT AND GROSS REMUNERATION, 2012-2016. ................................................................................................................................... 87
TABLE38: WORLD ALUMINIUM SMELTER CAPACITY AND PRODUCTION, 2016. ............................................... 89
TABLE 39: ALUMINIUM SECTOR’S EMPLOYMENT AND REMUNERATION, 2016. ............................................... 92
TABLE 40: WORLD RESERVES AND PRODUCTION OF ANTIMONY CONCENTRATE, 2016............................... 94
TABLE 41: EMPLOYMENT AND REMUNERATION IN THE ANTIMONY SECTOR IN 2016. ................................... 96
TABLE 42: WORLD RESERVES AND MINE PRODUCTION OF COBALT, 2016 ..................................................... 97
TABLE 43: SOUTH AFRICA’S LOCAL AND EXPORT SALES OF COBALT, 2007-2016 .......................................... 98
TABLE 44: REFINED COBALT PRODUCTION BY COUNTRY, 2015 AND 2016 ...................................................... 99
TABLE 45: WORLD RESERVES AND MINE PRODUCTION IN 2016 ..................................................................... 102
TABLE 46: SOUTH AFRICA’S PRODUCTION, LOCAL AND EXPORT SALES OF COPPER 2007 – 2016 ............ 103
TABLE 47: EMPLOYMENT AND REMUNERATION IN SOUTH AFRICA’S COPPER MINES IN 2016. .................. 107
TABLE 48: WORLD RESERVES AND MINE PRODUCTION OF LEAD, 2016. ....................................................... 109
TABLE 49: SOUTH AFRICA’S PRODUCTION, LOCAL SALES AND EXPORTS OF LEAD 2007 – 2016. ............. 110
TABLE 50: EMPLOYMENT AND REMUNERATION IN SOUTH AFRICA’S LEAD MINES IN 2016. ........................ 112
TABLE 51 WORLD NICKEL RESERVE AND MINE PRODUCTION, 2016. ............................................................. 114
TABLE 52: SOUTH AFRICA’S PRODUCTION AND SALES OF NICKEL, 2007-2016. ............................................ 115
TABLE 53: WORLD REFINED NICKEL PRODUCTION, 2016. ................................................................................ 115
TABLE 54: EMPLOYMENT IN THE PRIMARY NICKEL SECTOR ........................................................................... 117
xi
TABLE 55: WORLD RESERVES AND PRODUCTION OF TITANIUM CONCENTRATE, 2016............................... 120
TABLE 56: SOUTH AFRICA’S TITANIUM PRODUCTION AND SALES, 2006-2015. .............................................. 121
TABLE 57: EMPLOYMENT AND REMUNERATION IN THE TITANIUM SECTOR IN 2016 .................................... 123
TABLE 58: WORLD RESERVES AND MINE PRODUCTION OF ZINC, 2016. ........................................................ 126
TABLE 59: SOUTH AFRICA’S PRODUCTION AND SALE OF ZINC METAL IN CONCETRATE 2007 – 2016. ...... 127
TABLE 60: EMPLOYMENT AND REMUNERATION IN SOUTH AFRICA’S ZINC MINES IN 2016. ......................... 129
TABLE 61: WORLD RESERVES AND MINE PRODUCTION OF ZIRCON CONCENTRATES, 2016. .................... 132
TABLE 62: SOUTH AFRICA’S ZIRCON CONCENTRATES PRODUCTION AND SALES, 2006-2016. ................... 133
TABLE 63: SOUTH AFRICA’S ZIRCON SECTOR EMPLOYMENT, 2015-2016. ..................................................... 135
TABLE 64: SOUTH AFRICA’S PRODUCTION AND SALES OF FERROUS MINERALS, 2015 AND 2016 ............ 137
TABLE 65: SOUTH AFRICA’S PRODUCTION AND SALES OF FERROALLOYS, 2014 AND 2015 ...................... 138
TABLE 66: SOUTH AFRICA’S FERROUS MINE EMPLOYMENT AND GROSS REMUNERATION ...................... 139
TABLE 67: WORLD CHROME ORE RESERVES, PRODUCTION AND EXPORTS, 2016. ..................................... 140
TABLE 68: SOUTH AFRICA’S CHROME ORE PRODUCTION AND SALES, 2006 – 2016. .................................. 141
TABLE 69: WORLD FERROCHROME PRODUCTION AND SALES, 2016. ........................................................... 142
TABLE 70: SOUTH AFRICA’S FERROCHROME PRODUCTION AND SALES, 2005 – 2015. ............................... 144
TABLE 71: EMPLOYMENT IN SOUTH AFRICA’S CHROME INDUSTRY, 2016 .................................................... 145
TABLE 72: WORLD IRON ORE RESERVES, PRODUCTION AND EXPORTS, 2016. ............................................ 147
TABLE 73: SOUTH AFRICA’S PRODUCTION AND SALES OF IRON ORE. .......................................................... 148
TABLE 74: SOUTH AFRICA’S IRON ORE INDUSTRY’S EMPLOYMENT AND REMUNERATION ........................ 150
TABLE 75: GLOBAL MANGANESE ORE RESERVES, PRODUCTION AND EXPORTS: 2015-2016. .................... 152
TABLE 76: SOUTH AFRICA’S MANGANESE ORE PRODUCTION AND SALES, 2006 – 2017. ............................ 153
TABLE 77: MANGANESE ALLOYS PRODUCTION AND SALES: 2006-2015 ......................................................... 154
TABLE 78: SOUTH AFRICA’S MANGANESE ORE INDUSTRY’S EMPLOYMENT, 2010 – 2016. .......................... 156
TABLE 79: SOUTH AFRICA’S PRODUCTION AND SALES OF SILICON METAL, 2007 – 2016 ........................... 159
TABLE 80: SOUTH AFRICA’S PRODUCTION AND SALES OF FERROSILICON, 2007 - 2016. ........................... 160
TABLE 81: SOUTH AFRICA’S PRODUCTION AND SALES OF VANADIUM, 2007 – 2016 .................................... 164
TABLE 82: EMPLOYEMENT IN SOUTH AFRICA’S VANADIUM INDUSTRY, 2010-2016 ....................................... 165
TABLE 83: SOUTH AFRICA’S PRIMARY INDUSTRIAL MINERAL PRODUCTION AND SALES, 2015 .................. 172
TABLE 84: SOUTH AFRICA’S SALES OF SAND AND AGGREGATE BY MASS, 2007 – 2016. ............................. 174
TABLE 85: SOUTH AFRICA’S AGGREGATE AND SAND QUARRIES EMPLOYMENT AND REMUNERATIONS. 176
xii
TABLE 86: SOUTH AFRICA’S PRODUCTION, LOCAL SALES AND EXPORTS OF ANDALUSITE, 2007–2016 ... 180
TABLE 87: SOUTH AFRICA’S ALUMINO-SILICATE MINES: EMPLOYMENT, 2007–2016 .................................... 182
TABLE 88: SOUTH AFRICA’S LOCAL SALES AND EXPORTS OF DIMENSION STONE 2007 – 2016 ................. 185
TABLE 89: SOUTH AFRICA’S DIMENSION STONE EMPLOYMENT, 2012 – 2016................................................ 188
TABLE 90: SOUTH AFRICA’S PRODUCTION AND SALES OF FLUORSPAR, 2007 – 2016. ................................ 191
TABLE 91: SOUTH AFRICA’S FLUORSPAR QUARRIES: EMPLOYMENT AND REMUNERATION, 2007-2016 ... 192
TABLE 92: SOUTH AFRICA`S PRODUCTION AND LOCAL SALES OF LIMESTONE AND DOLOMITE FOR NON - AGGREGATE USE, 2007 – 2016. ............................................................................................................................ 195
TABLE 93: SOUTH AFRICA`S LOCAL SALES OF LIMESTONE AND DOLOMITE BY APPLICATION, 2007 – 2016. .................................................................................................................................................................................. 196
TABLE 94: SOUTH AFRICA`S LOCAL SALES OF LIME, 2015 – 2016. .................................................................. 198
TABLE 95: SOUTH AFRICA`S LIMESTONE AND DOLOMITE QUARRIES: EMPLOYMENT AND REMUNERATION, 2007 – 2016. ............................................................................................................................................................. 199
TABLE 96: SOUTH AFRICA’S PRODUCTION AND SALES OF PHOSPHATE ROCK, 2007-2016 ........................ 203
TABLE 97: SOUTH AFRICA’S PHOSPHATE SECTOR EMPLOYMENT, 2014- 2016 ............................................. 204
TABLE 98: SOUTH AFRICA’S PRODUCTION, LOCAL SALES OF KAOLIN, 2007-2016 ........................................ 208
TABLE 99: SOUTH AFRICA’S PRODUCTION, LOCAL SALES AND EXPORTS OF ATTAPULGITE, 2007-2016 .. 209
TABLE 100: SOUTH AFRICA’S PRODUCTION, LOCAL SALES AND EXPORTS OF BENTONITE, 2007-2016 .... 210
TABLE 101: GLOBAL PRICES OF KAOLIN AND BENTONITE, 2015-2016. ........................................................... 211
TABLE 102: SOUTH AFRICA’S SPECIAL CLAYS EMPLOYMENT, 2011-2016 ...................................................... 212
TABLE 103: SOUTH AFRICA’S PRODUCTION OF SULPHUR IN ALL FORMS, 2015-2016 .................................. 215
TABLE 104: SOUTH AFRICA’S PRODUCTION AND SALES OF SULPHUR IN ALL FORMS, 2007-2016 ............. 216
TABLE 105: SOUTH AFRICA’S IMPORTS OF SULPHUR, 2007 – 2016 ................................................................. 217
TABLE 106: SOUTH AFRICA’S PRODUCTION, LOCAL SALES AND EXPORTS OF VERMICULITE, 2005 - 2016 .................................................................................................................................................................................. 221
TABLE 107: SOUTH AFRICA’S IMPORTS OF NATURAL ABRASIVES, 2006–2016 .............................................. 224
TABLE 108.1: SOUTH AFRICA’S PRODUCTION AND LOCAL SALES OF BARYTES, 2006–2016 ....................... 224
TABLE 108.2: SOUTH AFRICA’S IMPORTS OF BARYTES, 2006–2016 ................................................................ 225
TABLE 109: SOUTH AFRICA’S IMPORTS OF DIATOMACEOUS EARTH, 2006–2016 .......................................... 225
TABLE 110: SOUTH AFRICA’S PRODUCTION, LOCAL SALES AND EXPORTS OF FELDSPAR, 2006–2016 ... 226
TABLE 111: SOUTH AFRICA’S IMPORTS OF NATURAL GRAPHITE, 2006–2016 ................................................ 226
TABLE 112.1: SOUTH AFRICA’S PRODUCTION, LOCAL SALES, AND CONSUMPTION OF NATURAL GYPSUM, 2006–2016 ................................................................................................................................................................ 227
TABLE 112.2: SOUTH AFRICA’S IMPORTS OF GYPSUM AND GYPSUM PLASTERS, 2006–2015 ..................... 227
xiii
TABLE 113.1: SOUTH AFRICA’S PRODUCTION AND LOCAL SALES OF MAGNESITE AND DERIVED PRODUCTS, 2006–2016 .......................................................................................................................................... 228
TABLE 113.2: SOUTH AFRICA’S IMPORTS OF MAGNESITE AND MAGNESIA, 2007–2016 ............................... 228
TABLE 114.1: SOUTH AFRICA’S PRODUCTION, LOCAL SALES AND EXPORTS OF SCRAP AND FLAKE MICA; 2006-2016 ................................................................................................................................................................. 229
TABLE 114.2: SOUTH AFRICA’S IMPORTS OF MICA, 2006–2016 ........................................................................ 229
TABLE 115: SOUTH AFRICA’S PRODUCTION AND SALES OF MINERAL PIGMENTS, 2006–2016 .................... 230
TABLE 116: SOUTH AFRICA’S IMPORTS OF POTASH, 2007–2016 ..................................................................... 230
TABLE 117: SOUTH AFRICA’S PRODUCTION, LOCAL SALES AND EXPORTS OF PYROPHYLLITE, 2007 - 2016 .................................................................................................................................................................................. 231
TABLE 118: SOUTH AFRICA’S PRODUCTION, LOCAL SALES AND EXPORTS OF SALT, 2007–2016 .............. 232
TABLE 119: SOUTH AFRICA’S PRODUCTION, LOCAL SALES AND EXPORTS OF SILICA, 2007–2016 ............ 233
TABLE 120.1: SOUTH AFRICA’S PRODUCTION AND SALES OF TALC, 2007–2016 ........................................... 234
TABLE 120.2: SOUTH AFRICA’S IMPORTS OF TALC, 2006–2016 ........................................................................ 234
xiv
ABBREVIATIONS AND SYMBOLS
A$ Australian dollar LME London Metal Exchange
bbl barrel m metre
bbl/d barrels per day m3 cubic metre
BGS British Geological Survey Ma million years
billion thousand million mic metal-in-concentrate
CIF cost, insurance, freight Mct million carats
CIS Commonwealth of Independent States. Part Mozt million ounces troy
of the former Union of Soviet Socialist Mozt/a million ounces troy per annum
Republics (USSR) Mt megaton (million tons)
China People’s Republic of China Mt/a million tons per annum
CPI Consumer price index MVA megavolt ampere
conc concentrate ct carat
MWh megawatt hour
ct carat na not available
DM Deutsche Mark nar not as received
DMR Department of Mineral Resources ns not specified
DRC Democratic Republic of Congo NW North West Europe
DRI Direct reduced iron ozt troy ounce
e estimate pa per annum
EAF Electric-arc furnace PGMs platinum-group metals
EU European Economic Union ppm parts per million
FOB free on board R rand (South African currency)
xv
FOR free on rail SA South Africa
FSU Former Union of Soviet Socialist Republics S.ton Short ton
(USSR) t metric ton
g gram t/a tons per annum
Ga giga year TCF trillion cubic feet
g/t gram per ton UAE United Arab Emirates
GAR gross as received US United States of America
GWe net gigawatts electric USBM United States Bureau of Mines
ILZSG International Lead and Zinc Study Group USGS United States Geological Survey
INSG International Nickel Study Group w withheld
kcal kilocalorie WBMS World Bureau of Metal Statistics
kg kilogram y year
kg/t kilogram per metric ton y-o-y year-on-year
km kilometre $ US dollar, unless stated otherwise
kt kiloton C$ Canadian dollar
kt/a kiloton per annum £ British pound sterling
lb pound avoirdupois % percent
xvi
EXPLANATORY NOTES
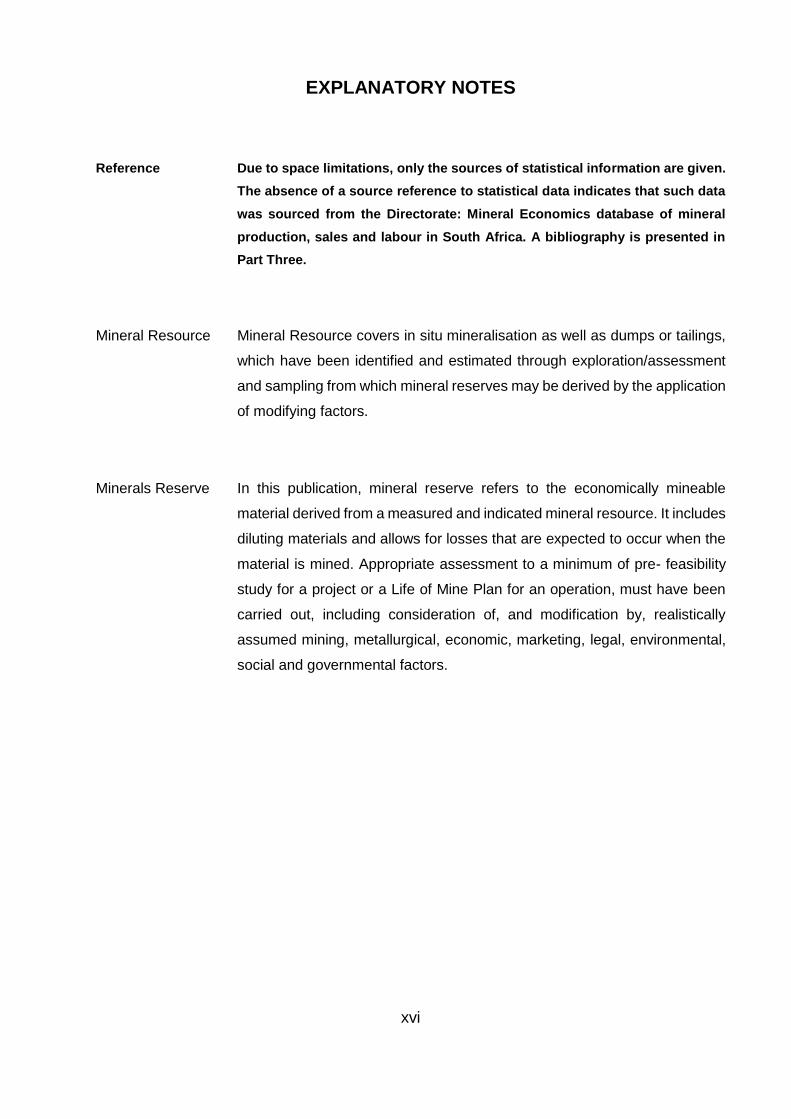
Reference Due to space limitations, only the sources of statistical information are given.
The absence of a source reference to statistical data indicates that such data
was sourced from the Directorate: Mineral Economics database of mineral
production, sales and labour in South Africa. A bibliography is presented in
Part Three.
Mineral Resource Mineral Resource covers in situ mineralisation as well as dumps or tailings,
which have been identified and estimated through exploration/assessment
and sampling from which mineral reserves may be derived by the application
of modifying factors.
Minerals Reserve In this publication, mineral reserve refers to the economically mineable
material derived from a measured and indicated mineral resource. It includes
diluting materials and allows for losses that are expected to occur when the
material is mined. Appropriate assessment to a minimum of pre- feasibility
study for a project or a Life of Mine Plan for an operation, must have been
carried out, including consideration of, and modification by, realistically
assumed mining, metallurgical, economic, marketing, legal, environmental,
social and governmental factors.
1
PART ONE: SOUTH AFRICA’S MINERAL INDUSTRY
GENERAL REVIEW
P Mwape, E Mokwena, E Malematja, V Madzuhe, S Malie, G Kwata and
K Menoe
INFRASTRUCTURE DEVELOPMENTS
Infrastructure development is at the core of every country’s economic growth and development. It plays a major role in economic growth and poverty reduction, conversely the lack of infrastructure affects productivity and could lead to high production costs, which hinders growth by reducing competitiveness of business and ability of government to pursue economic development. According to PWC’s Capital and Infrastructure report (2014), South Africa’s overall transport infrastructure scores as well as India’s and better than Indonesia and China. The country’s need of a well-developed economic infrastructure has given increase to a commercial and vibrant investment environment with many global competitive advantages and opportunities.
South Africa’s banking system is well-developed, offering a mature market with a good regulatory and legal framework. The South African Reserve Bank (SARB) oversees the local banking services industry. The non-banking financial services industry such as insurance and lending institution is governed by the Financial Service Board (FSB). First National Bank, Nedbank, Standard bank and Absa are four major South African banks which account for 80 percent of the market and are well capitalised and managed, using sophisticated risk-management systems in conducting the business of banking. Mechanisms such as capital adequacy and prudential requirements imposed by the central bank are in place to ensure a sound banking regulatory compliance.
Transnet
South Africa (SA) boasts the most modern and extensive infrastructure in Africa, with a highly developed transport infrastructure consisting of an extensive road and rail networks. Transnet is a public company wholly owned by the government and is a leading player in the Southern African transport sector, supporting the country’s freight logistics network. Its activities extend beyond the borders of South Africa into Africa and the rest of the world. The company has five operating divisions that drive business value creation, namely; Transnet Freight Rail (TFR), Transnet Engineering (TE), Transnet National Ports Authority (TNPA), Transnet Port Terminals (TPT) and Transnet Pipelines (TP).
Transnet remains a major investor in the South African economy and has committed to expansion and capital expenditure of between R340 and R380 billion on capital projects, over a seven-year period from 2017 to 2023/24, which would create approximately 588 000 direct jobs. Transnet
2
adopted the Market Demand Strategy (MDS) in 2012; of which successful execution will result in an increase in rail, port and pipeline capacity. The strategy aims at advancing South Africa’s developmental objectives which include Broad-Based Black Economic Empowerment, supplier and enterprise development and skills development. An amount of R29.6 billion was invested in the expansion of infrastructure and equipment in 2016 and a further R229.2 billion will be invested over the next seven years to 2023/24 of which R20 billion is earmarked for mergers and acquisitions to diversify revenue streams through geographic expansion.
Transnet Freight Rail (TFR) is the largest division within Transnet, representing the group’s rail freight transport interests. The company maintains extensive rail network which provide strategic links between ports and production hubs and connect with the railways of the SADC region. The Rail network unit manages Freight Rail’s infrastructure and focuses on the maintenance, modernisation and expansion of the approximately 20 500 route kilometre (31 000 track km) rail network. About 1 500 km comprises heavy–haul lines for coal and iron ore export. There are dedicated railway lines for iron ore from Sishen, in the Northern Cape to Saldanha Bay on the West Coast, and for transporting coal from the coal fields of Mpumalanga to the Richards Bay Coal Terminal (RBCT) on the East Coast. The company transported 84 Mt of General Freight Business (GFB) volumes during the year 2016 despite service execution challenges, wagon shortages and locomotives failures. The New Multi-Product Pipeline (NMPP) connecting Durban with Johannesburg has been fully commissioned and operational having transported 15 billion litres of diesel from Durban to the inland region. R23.9 billion has been invested in the NMPP project since its inception in January 2012.
Portnet, a subsidiary of PSA Corporation Limited, was formed in 2000 with the aim of helping the port and shipping to increase productivity and save costs through the greater use of information technology and the internet. Portnet is the largest port authority in Southern Africa, with the best-equipped and most efficient network of ports in Africa. The network connects the ports of South Africa and the rail networks of the Sub-Saharan region. Most of South Africa’s minerals are exported through five major ports, the largest of which is Richards Bay Coal Terminal (RBCT) which has grown into an advanced 24-hour operation with a design capacity of 91 Mt per annum. The terminal is bulk handling facility of coal exports from South Africa making SA a preferred source of coal for international markets. South Africa's coal exports are mostly sent to India, China, and Europe. Demand drivers include growth in demand for seaborne thermal coal and other minerals to be exported to China and India that would sustain the major expansion in global trade.
The coal line is the main channel for coal exports, which starts with the mines in Mpumalanga and ends at the port of Richards Bay Coal Terminal (RBCT). An amount of R145 million was invested in the coal line expansion to 81 Mt per annum, including the upgrade of yards, lines and electricity equipment. The company also invested R28 million in the Waterberg upgrade stage II to grow rail capacity through incremental upgrades of the existing rail networks, electrical upgrades and improved train control systems. The total expansion and sustaining capital investment for the coal and mineral system programme is estimated at R40, 7 billion over the next seven-year period of the Market Demand Strategy (MDS).
The iron ore line is the main export channel for iron ore from the mines in the Northern Cape to the Port of Saldanha. The National Ports Authority (TNPA) plans to invest R1.8 billion during 2018 financial year and R34.9 billion over seven years in capacity creation, infrastructure renewal and modernisation projects. Various operation Phakisa initiatives were undertaken in 2016 which includes the commissioning of a new 90-ton boat Hoist and slipway at the port of Port Elizabeth
3
and the upgrade of the old general maintenance quay to a fully-fledge offshore supply base berth at the port of Saldanha Bay.
Eskom
Eskom was established in South Africa in 1923 as the Electricity Supply Commission. In July 2002, it was converted into a public, limited liability company, wholly owned by government. Eskom is a vertically integrated operation that generates, transmits and distributes electricity to industrial, mining, commercial, agricultural, residential customers and redistributors. According to South Africa's Department of Energy (DOE), Eskom supplies roughly 95 percent of South Africa's electricity and the remainder comes from Independent Power Producers (IPPs) and imports. Eskom buys and sells electricity with countries in the SADC region, supplying approximately 45 percent of the electricity used in Africa and ranked among the top ten utilities in the world in terms of generation capacity. South Africa plans to diversify its electricity generation mix. Currently, about 85 percent of South Africa's generation capacity is from coal-fired power stations, about 5 percent from one nuclear power plant, and 2 percent from hydroelectric plants, with a small amount from a wind station.
South Africa's renewable energy industry is relatively small, but the country plans to expand renewable electricity capacity to 18, 200 MW by 2030. Renewable energy sources include wind, solar power, biomass, landfill gas and small hydro technologies. The Department of Energy’s Renewable Energy- Independent Power Producers (RE-IPP) programme connected 2145 MW in 2016 and called for 3725 MW to be in commercial operations by the end of 2018. Eskom’s 2017 annual report highlighted that the company remains committed to environment sustainability and reducing carbon footprint with purchases of renewable from IPPs, coupled with their own investment in renewables. South Africa has one nuclear power plant, Koeberg, with installed capacity of 1,940 MW. The country plans to expand nuclear power generation by 9,600 MW by 2030.
Eskom started the capacity expansion programme in 2005 to build new power stations and high-voltage transmission power lines in order to meet South Africa’s rising demand for electricity and also to diversify the energy mix. The programme is still on course and is expected to be completed by 2022, increasing generation capacity by 17 384 MW, transmission lines by 9 756 km and substation capacity by 42 470 MVA. Since its inception to March 2017, the capacity expansion programme has resulted in additional generation capacity of 8 363 MW, with 6 747 km of transmission lines and 34 390 MVA of substation capacity. The programme has cost R335.7 billion to date. All four units at Ingula hydro power station, with total installed capacity of 1 332MW are now in commercial operation. Medupi unit 5 with installed capacity of 794 MW achieved commercial operation in April 2017. Kusile unit 1 which was synchronized in December 2016 achieved full load in March 2017 however testing is still to continue.
South Africa has a sizeable labour pool. The 2016 Human Development Index (HDI) survey, conducted by the United Nations in about 188 countries, places South Africa at number 119 as a medium human development country. As a major mining country, South Africa’s strengths include a high level of technical expertise as we as comprehensive research and development activities The Government, through the Amended Skills Development Act of 2003 tightened regulations to ensure continuous improvement in the skill development strategies across all sectors. The Mining Qualifications Authority (MQA) is responsible for the provision and administration of skills development projects for the mining and minerals sector. Stakeholders in the mining and minerals
4
sector, including the MQA, the Department of Minerals Resources and labour organisations provide Occupational Health and Safety (OHS) training to reduce the prevalence of mining related fatalities and health issues related to mining. In 2016 a total of 6 125 employees completed the training programme against the set target of 6 000. Furthermore, a total of 2 115 learners were registered on various artisan programmes in 2016.
MINERAL INDUSTRY STRENGTH
South Africa's mineral wealth has been built on the country's enormous resources most of which are usually found in the following distinctive geological structures and settings:
• The Witwatersrand Basin (through Mpumalanga, North West and Gauteng Province) yields much of South Africa’s gold output and contains considerable resources of uranium, silver, pyrite and osmiridium;
• The Bushveld Complex which is found in North west and Limpopo Province hosts platinum group metals (with associated copper, nickel and cobalt mineralisation), chromium and vanadium bearing titanium iron ore formations as well as large deposits of the industrial minerals, including fluorspar and andalusite;
• The Transvaal Supergroup (Northern Cape and Limpopo Province) contains enormous resources of manganese and iron ore;
• The Karoo Basin extends through Mpumalanga, KwaZulu-Natal, Free State as well as Limpopo Province hosting considerable bituminous coal and anthracite resources and shale gas discoveries;
• The Palaborwa Igneous Complex in Limpopo Province hosts extensive deposits of copper, phosphate, titanium, vermiculite, feldspar and zirconium ores;
• Kimberlite pipes through North West and Northern Cape Province host diamonds that also occur in alluvial, fluvial and marine settings;
• Heavy mineral sands contain ilmenite, rutile and zircon;
• Significant deposits of lead-zinc ores associated with copper and silver are found in the Northern Cape near Aggeneys.
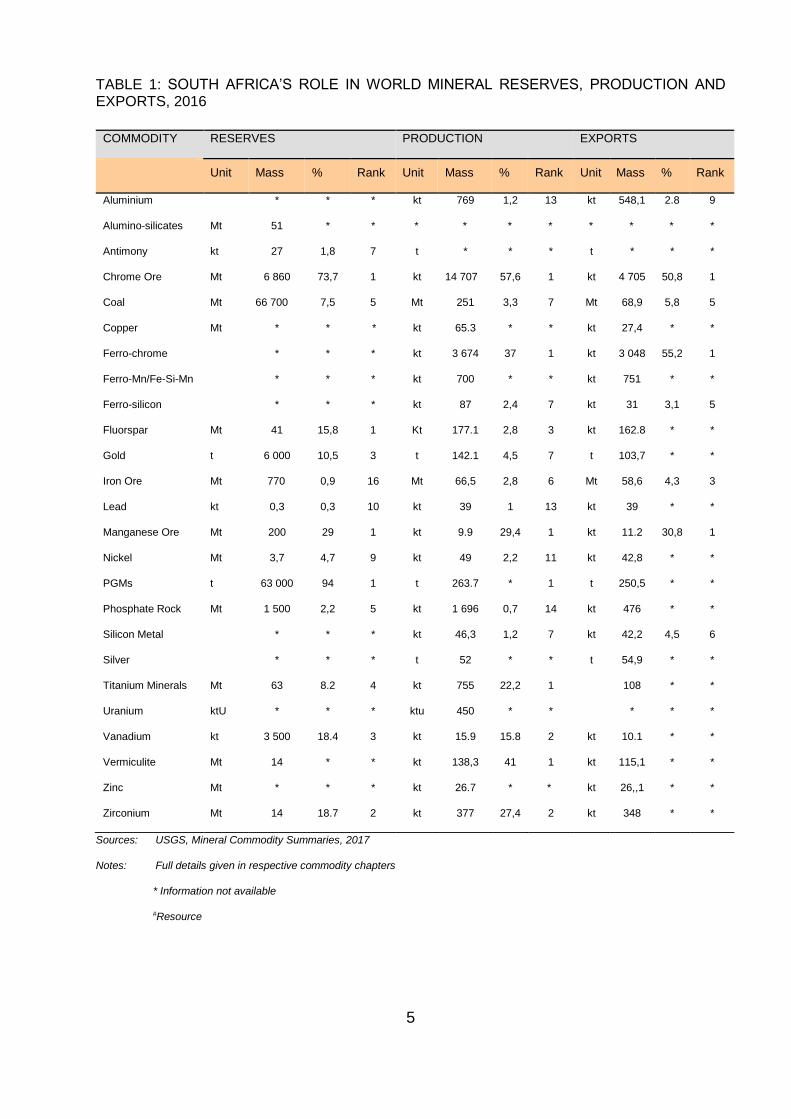
South Africa accounts for 94 percent of known global reserves of the platinum group metals (PGMs), 73.7 percent of chrome, 29 percent of manganese, 18.4 percent of vanadium and 10.5 percent of gold reserves (Table 1). Since most of the identified mineral resources and reserves were discovered by means of obsolete exploration methods, there is still significant potential for the discovery of other world-class deposits in areas not yet thoroughly explored using modern exploration technologies.
5
TABLE 1: SOUTH AFRICA’S ROLE IN WORLD MINERAL RESERVES, PRODUCTION AND EXPORTS, 2016
Sources: USGS, Mineral Commodity Summaries, 2017
Notes: Full details given in respective commodity chapters
* Information not available
#Resource
COMMODITY RESERVES PRODUCTION EXPORTS
Unit Mass % Rank Unit Mass % Rank Unit Mass % Rank
Aluminium * * * kt 769 1,2 13 kt 548,1 2.8 9
Alumino-silicates Mt 51 * * * * * * * * * *
Antimony kt 27 1,8 7 t * * * t * * *
Chrome Ore Mt 6 860 73,7 1 kt 14 707 57,6 1 kt 4 705 50,8 1
Coal Mt 66 700 7,5 5 Mt 251 3,3 7 Mt 68,9 5,8 5
Copper Mt * * * kt 65.3 * * kt 27,4 * *
Ferro-chrome * * * kt 3 674 37 1 kt 3 048 55,2 1
Ferro-Mn/Fe-Si-Mn * * * kt 700 * * kt 751 * *
Ferro-silicon * * * kt 87 2,4 7 kt 31 3,1 5
Fluorspar Mt 41 15,8 1 Kt 177.1 2,8 3 kt 162.8 * *
Gold t 6 000 10,5 3 t 142.1 4,5 7 t 103,7 * *
Iron Ore Mt 770 0,9 16 Mt 66,5 2,8 6 Mt 58,6 4,3 3
Lead kt 0,3 0,3 10 kt 39 1 13 kt 39 * *
Manganese Ore Mt 200 29 1 kt 9.9 29,4 1 kt 11.2 30,8 1
Nickel Mt 3,7 4,7 9 kt 49 2,2 11 kt 42,8 * *
PGMs t 63 000 94 1 t 263.7 * 1 t 250,5 * *
Phosphate Rock Mt 1 500 2,2 5 kt 1 696 0,7 14 kt 476 * *
Silicon Metal * * * kt 46,3 1,2 7 kt 42,2 4,5 6
Silver * * * t 52 * * t 54,9 * *
Titanium Minerals Mt 63 8.2 4 kt 755 22,2 1 108 * *
Uranium ktU * * * ktu 450 * * * * *
Vanadium kt 3 500 18.4 3 kt 15.9 15.8 2 kt 10.1 * *
Vermiculite Mt 14 * * kt 138,3 41 1 kt 115,1 * *
Zinc Mt * * * kt 26.7 * * kt 26,,1 * *
Zirconium Mt 14 18.7 2 kt 377 27,4 2 kt 348 * *
6
PRODUCTION OVERVIEW OF SELECTED MAJOR MINERALS
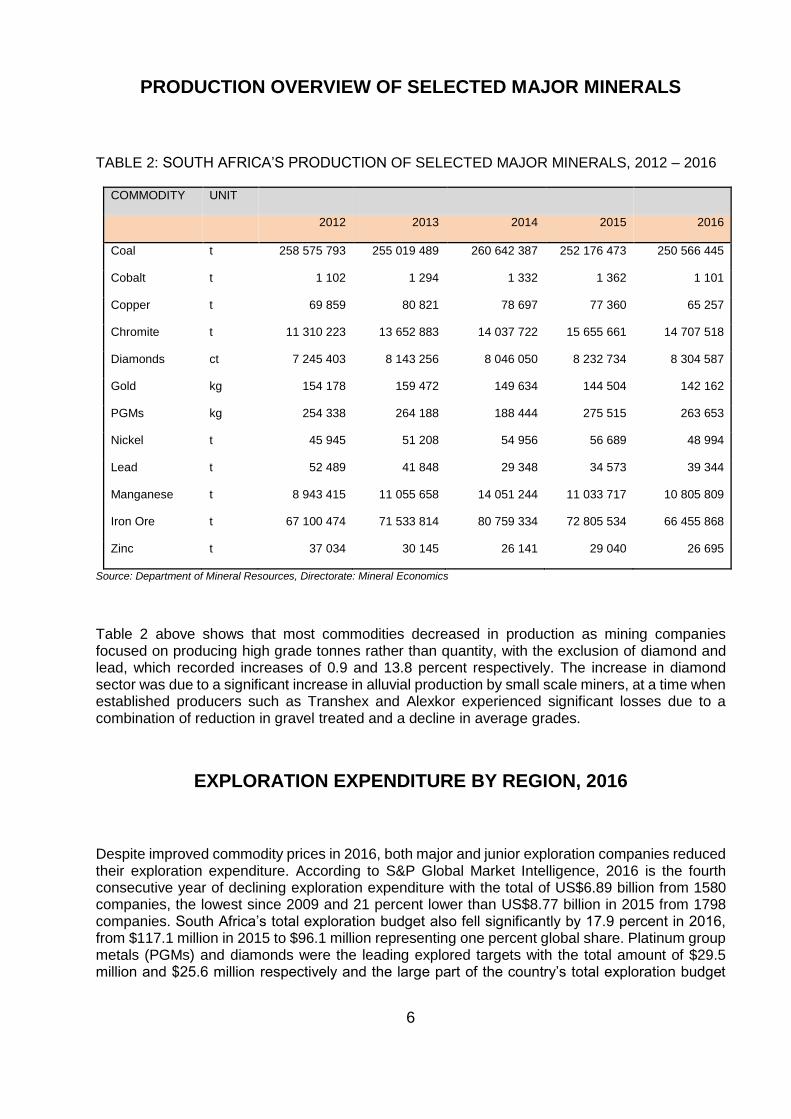
TABLE 2: SOUTH AFRICA’S PRODUCTION OF SELECTED MAJOR MINERALS, 2012 – 2016
COMMODITY UNIT
2012 2013 2014 2015 2016
Coal t 258 575 793 255 019 489 260 642 387 252 176 473 250 566 445
Cobalt t 1 102 1 294 1 332 1 362 1 101
Copper t 69 859 80 821 78 697 77 360 65 257
Chromite t 11 310 223 13 652 883 14 037 722 15 655 661 14 707 518
Diamonds ct 7 245 403 8 143 256 8 046 050 8 232 734 8 304 587
Gold kg 154 178 159 472 149 634 144 504 142 162
PGMs kg 254 338 264 188 188 444 275 515 263 653
Nickel t 45 945 51 208 54 956 56 689 48 994
Lead t 52 489 41 848 29 348 34 573 39 344
Manganese t 8 943 415 11 055 658 14 051 244 11 033 717 10 805 809
Iron Ore t 67 100 474 71 533 814 80 759 334 72 805 534 66 455 868
Zinc t 37 034 30 145 26 141 29 040 26 695
Source: Department of Mineral Resources, Directorate: Mineral Economics
Table 2 above shows that most commodities decreased in production as mining companies focused on producing high grade tonnes rather than quantity, with the exclusion of diamond and lead, which recorded increases of 0.9 and 13.8 percent respectively. The increase in diamond sector was due to a significant increase in alluvial production by small scale miners, at a time when established producers such as Transhex and Alexkor experienced significant losses due to a combination of reduction in gravel treated and a decline in average grades.
EXPLORATION EXPENDITURE BY REGION, 2016
Despite improved commodity prices in 2016, both major and junior exploration companies reduced their exploration expenditure. According to S&P Global Market Intelligence, 2016 is the fourth consecutive year of declining exploration expenditure with the total of US$6.89 billion from 1580 companies, the lowest since 2009 and 21 percent lower than US$8.77 billion in 2015 from 1798 companies. South Africa’s total exploration budget also fell significantly by 17.9 percent in 2016, from $117.1 million in 2015 to $96.1 million representing one percent global share. Platinum group metals (PGMs) and diamonds were the leading explored targets with the total amount of $29.5 million and $25.6 million respectively and the large part of the country’s total exploration budget
7
was spent on late stage and feasibility at $43.9 million followed by minesite at $35.4 million and then grassroots at $16.8 million.
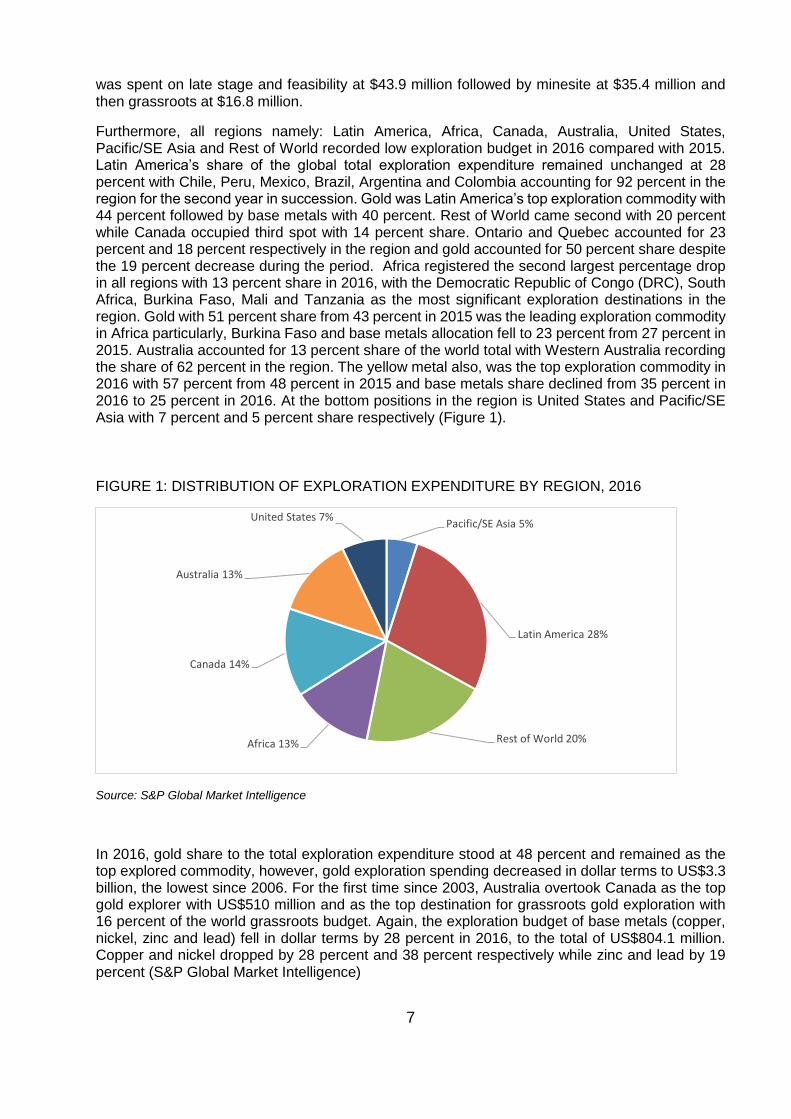
Furthermore, all regions namely: Latin America, Africa, Canada, Australia, United States, Pacific/SE Asia and Rest of World recorded low exploration budget in 2016 compared with 2015. Latin America’s share of the global total exploration expenditure remained unchanged at 28 percent with Chile, Peru, Mexico, Brazil, Argentina and Colombia accounting for 92 percent in the region for the second year in succession. Gold was Latin America’s top exploration commodity with 44 percent followed by base metals with 40 percent. Rest of World came second with 20 percent while Canada occupied third spot with 14 percent share. Ontario and Quebec accounted for 23 percent and 18 percent respectively in the region and gold accounted for 50 percent share despite the 19 percent decrease during the period. Africa registered the second largest percentage drop in all regions with 13 percent share in 2016, with the Democratic Republic of Congo (DRC), South Africa, Burkina Faso, Mali and Tanzania as the most significant exploration destinations in the region. Gold with 51 percent share from 43 percent in 2015 was the leading exploration commodity in Africa particularly, Burkina Faso and base metals allocation fell to 23 percent from 27 percent in 2015. Australia accounted for 13 percent share of the world total with Western Australia recording the share of 62 percent in the region. The yellow metal also, was the top exploration commodity in 2016 with 57 percent from 48 percent in 2015 and base metals share declined from 35 percent in 2016 to 25 percent in 2016. At the bottom positions in the region is United States and Pacific/SE Asia with 7 percent and 5 percent share respectively (Figure 1).
FIGURE 1: DISTRIBUTION OF EXPLORATION EXPENDITURE BY REGION, 2016
Source: S&P Global Market Intelligence
In 2016, gold share to the total exploration expenditure stood at 48 percent and remained as the top explored commodity, however, gold exploration spending decreased in dollar terms to US$3.3 billion, the lowest since 2006. For the first time since 2003, Australia overtook Canada as the top gold explorer with US$510 million and as the top destination for grassroots gold exploration with 16 percent of the world grassroots budget. Again, the exploration budget of base metals (copper, nickel, zinc and lead) fell in dollar terms by 28 percent in 2016, to the total of US$804.1 million. Copper and nickel dropped by 28 percent and 38 percent respectively while zinc and lead by 19 percent (S&P Global Market Intelligence)
Pacific/SE Asia 5%
Latin America 28%
Rest of World 20%Africa 13%
Canada 14%
Australia 13%
United States 7%
8
THE ROLE OF MINING IN THE NATIONAL ECONOMY
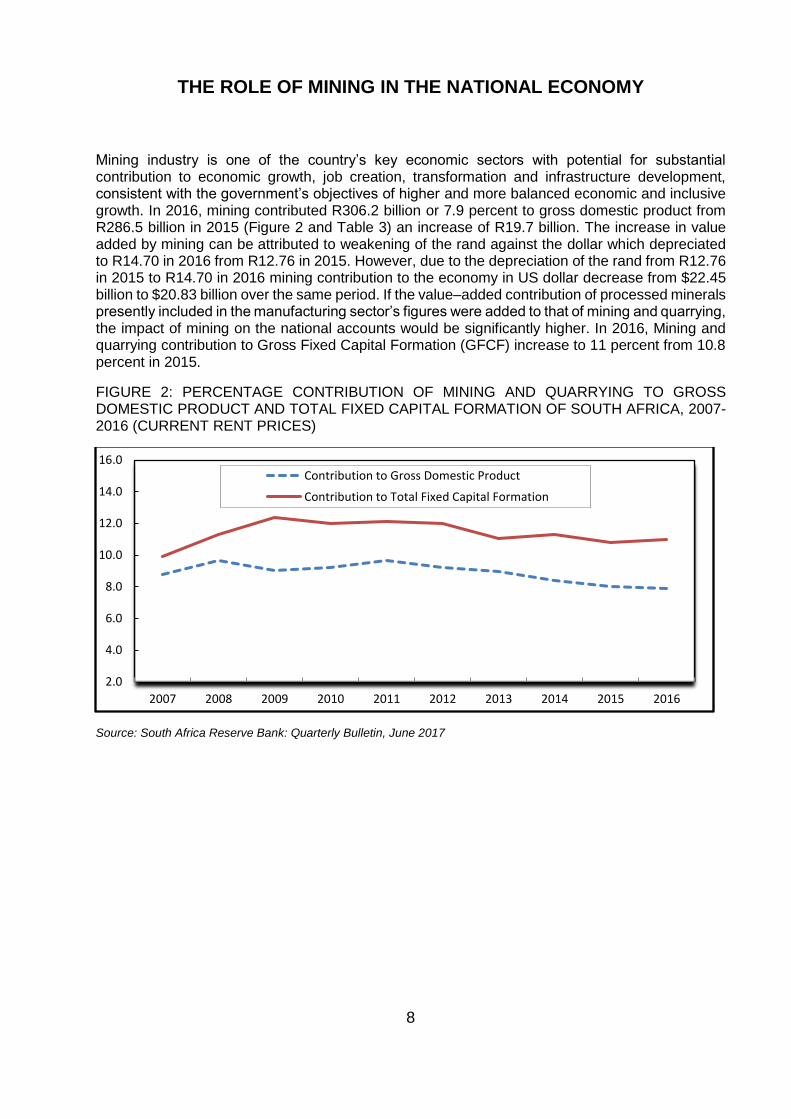
Mining industry is one of the country’s key economic sectors with potential for substantial contribution to economic growth, job creation, transformation and infrastructure development, consistent with the government’s objectives of higher and more balanced economic and inclusive growth. In 2016, mining contributed R306.2 billion or 7.9 percent to gross domestic product from R286.5 billion in 2015 (Figure 2 and Table 3) an increase of R19.7 billion. The increase in value added by mining can be attributed to weakening of the rand against the dollar which depreciated to R14.70 in 2016 from R12.76 in 2015. However, due to the depreciation of the rand from R12.76 in 2015 to R14.70 in 2016 mining contribution to the economy in US dollar decrease from $22.45 billion to $20.83 billion over the same period. If the value–added contribution of processed minerals presently included in the manufacturing sector’s figures were added to that of mining and quarrying, the impact of mining on the national accounts would be significantly higher. In 2016, Mining and quarrying contribution to Gross Fixed Capital Formation (GFCF) increase to 11 percent from 10.8 percent in 2015.
FIGURE 2: PERCENTAGE CONTRIBUTION OF MINING AND QUARRYING TO GROSS DOMESTIC PRODUCT AND TOTAL FIXED CAPITAL FORMATION OF SOUTH AFRICA, 2007-2016 (CURRENT RENT PRICES)
Source: South Africa Reserve Bank: Quarterly Bulletin, June 2017
2.0
4.0
6.0
8.0
10.0
12.0
14.0
16.0
2007 2008 2009 2010 2011 2012 2013 2014 2015 2016
Contribution to Gross Domestic Product
Contribution to Total Fixed Capital Formation
9
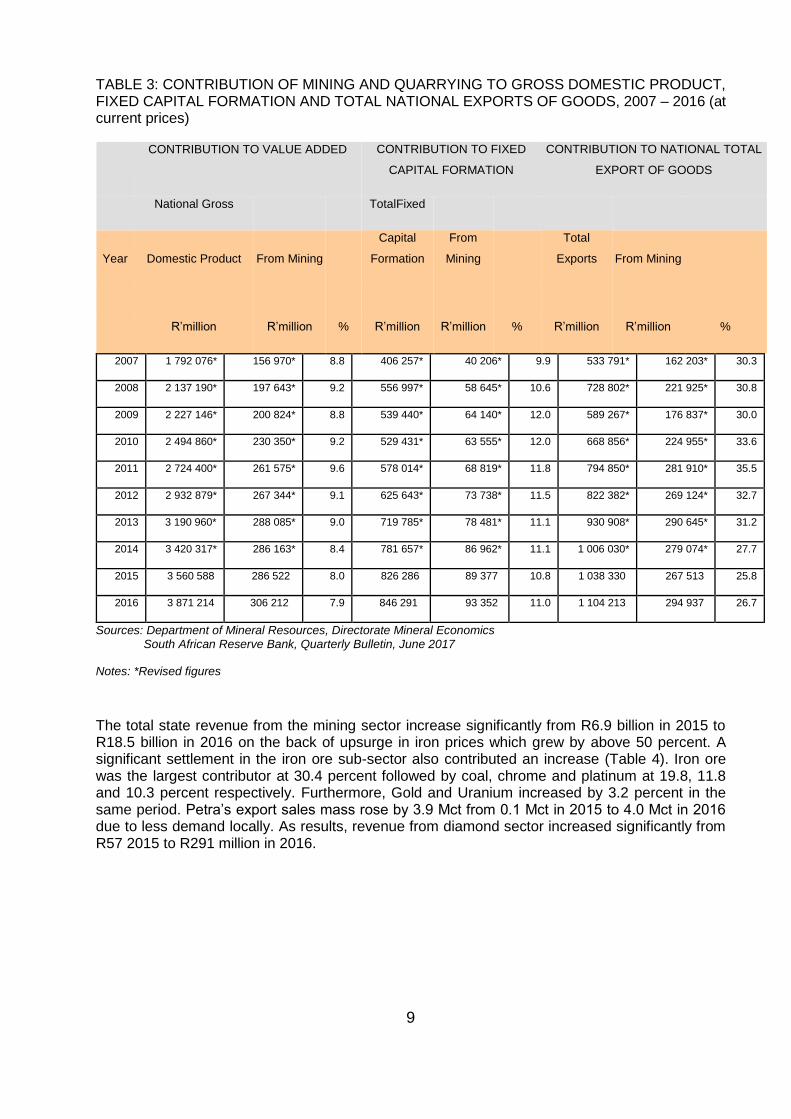
TABLE 3: CONTRIBUTION OF MINING AND QUARRYING TO GROSS DOMESTIC PRODUCT, FIXED CAPITAL FORMATION AND TOTAL NATIONAL EXPORTS OF GOODS, 2007 – 2016 (at current prices)
CONTRIBUTION TO VALUE ADDED CONTRIBUTION TO FIXED
CAPITAL FORMATION
CONTRIBUTION TO NATIONAL TOTAL
EXPORT OF GOODS
National Gross TotalFixed
Year Domestic Product From Mining
Capital
Formation
From
Mining
Total
Exports From Mining
R’million R’million % R’million R’million % R’million R’million %
2007 1 792 076* 156 970* 8.8 406 257* 40 206* 9.9 533 791* 162 203* 30.3
2008 2 137 190* 197 643* 9.2 556 997* 58 645* 10.6 728 802* 221 925* 30.8
2009 2 227 146* 200 824* 8.8 539 440* 64 140* 12.0 589 267* 176 837* 30.0
2010 2 494 860* 230 350* 9.2 529 431* 63 555* 12.0 668 856* 224 955* 33.6
2011 2 724 400* 261 575* 9.6 578 014* 68 819* 11.8 794 850* 281 910* 35.5
2012 2 932 879* 267 344* 9.1 625 643* 73 738* 11.5 822 382* 269 124* 32.7
2013 3 190 960* 288 085* 9.0 719 785* 78 481* 11.1 930 908* 290 645* 31.2
2014 3 420 317* 286 163* 8.4 781 657* 86 962* 11.1 1 006 030* 279 074* 27.7
2015 3 560 588 286 522 8.0 826 286 89 377 10.8 1 038 330 267 513 25.8
2016 3 871 214 306 212 7.9 846 291 93 352 11.0 1 104 213 294 937 26.7
Sources: Department of Mineral Resources, Directorate Mineral Economics South African Reserve Bank, Quarterly Bulletin, June 2017
Notes: *Revised figures
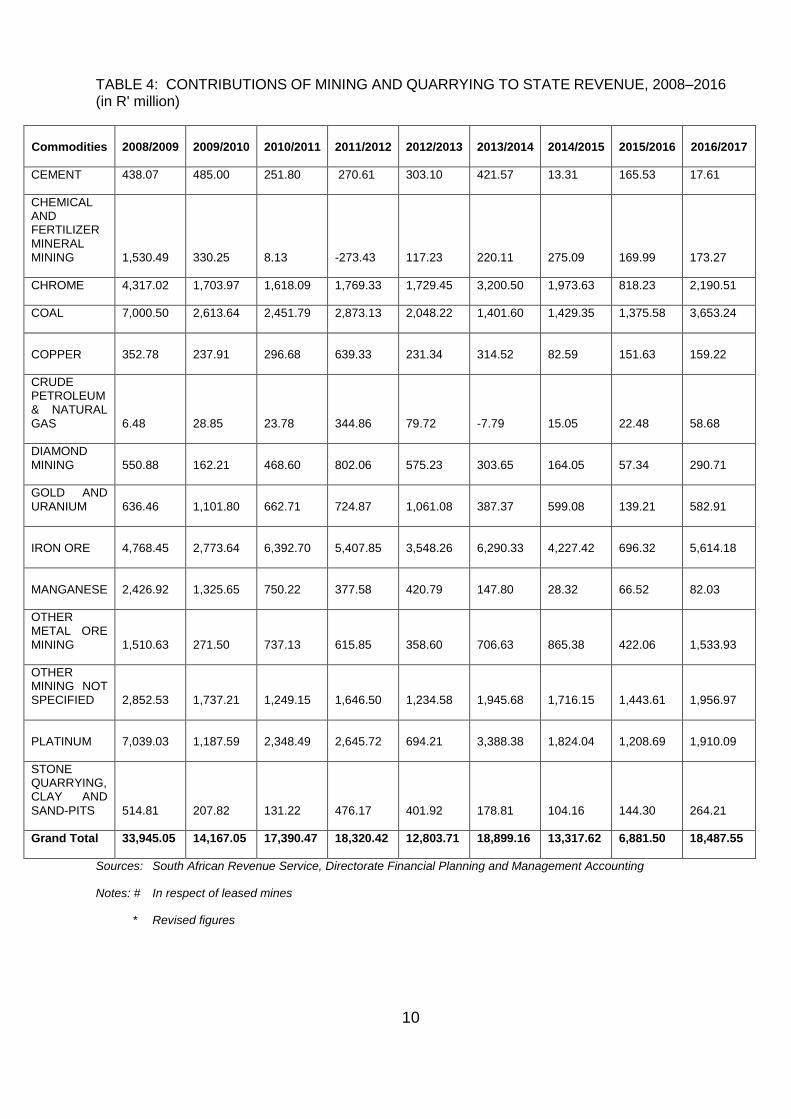
The total state revenue from the mining sector increase significantly from R6.9 billion in 2015 to R18.5 billion in 2016 on the back of upsurge in iron prices which grew by above 50 percent. A significant settlement in the iron ore sub-sector also contributed an increase (Table 4). Iron ore was the largest contributor at 30.4 percent followed by coal, chrome and platinum at 19.8, 11.8 and 10.3 percent respectively. Furthermore, Gold and Uranium increased by 3.2 percent in the same period. Petra’s export sales mass rose by 3.9 Mct from 0.1 Mct in 2015 to 4.0 Mct in 2016 due to less demand locally. As results, revenue from diamond sector increased significantly from R57 2015 to R291 million in 2016.
10
TABLE 4: CONTRIBUTIONS OF MINING AND QUARRYING TO STATE REVENUE, 2008–2016 (in R' million)
Commodities
2008/2009
2009/2010
2010/2011
2011/2012
2012/2013
2013/2014
2014/2015
2015/2016
2016/2017
CEMENT 438.07 485.00 251.80 270.61 303.10 421.57 13.31 165.53 17.61
CHEMICAL AND FERTILIZER MINERAL MINING 1,530.49 330.25 8.13 -273.43 117.23 220.11 275.09 169.99 173.27
CHROME 4,317.02 1,703.97 1,618.09 1,769.33 1,729.45 3,200.50 1,973.63 818.23 2,190.51
COAL 7,000.50 2,613.64 2,451.79 2,873.13 2,048.22 1,401.60 1,429.35 1,375.58 3,653.24
COPPER 352.78
237.91
296.68
639.33
231.34
314.52
82.59
151.63
159.22
CRUDE PETROLEUM & NATURAL GAS 6.48 28.85 23.78 344.86 79.72 -7.79 15.05 22.48 58.68
DIAMOND MINING
550.88
162.21
468.60
802.06
575.23
303.65
164.05
57.34
290.71
GOLD AND URANIUM
636.46
1,101.80
662.71
724.87
1,061.08
387.37
599.08
139.21
582.91
IRON ORE
4,768.45
2,773.64
6,392.70
5,407.85
3,548.26
6,290.33
4,227.42
696.32
5,614.18
MANGANESE
2,426.92
1,325.65
750.22
377.58
420.79
147.80
28.32
66.52
82.03
OTHER METAL ORE MINING
1,510.63
271.50
737.13
615.85
358.60
706.63
865.38
422.06
1,533.93
OTHER MINING NOT SPECIFIED
2,852.53
1,737.21
1,249.15
1,646.50
1,234.58
1,945.68
1,716.15
1,443.61
1,956.97
PLATINUM 7,039.03
1,187.59
2,348.49
2,645.72
694.21
3,388.38
1,824.04
1,208.69
1,910.09
STONE QUARRYING, CLAY AND
SAND-PITS
514.81
207.82
131.22
476.17
401.92
178.81
104.16
144.30
264.21
Grand Total 33,945.05 14,167.05 17,390.47 18,320.42 12,803.71 18,899.16 13,317.62 6,881.50 18,487.55
Sources: South African Revenue Service, Directorate Financial Planning and Management Accounting
Notes: # In respect of leased mines
* Revised figures
11
PRIMARY MINERAL SALES IN 2016
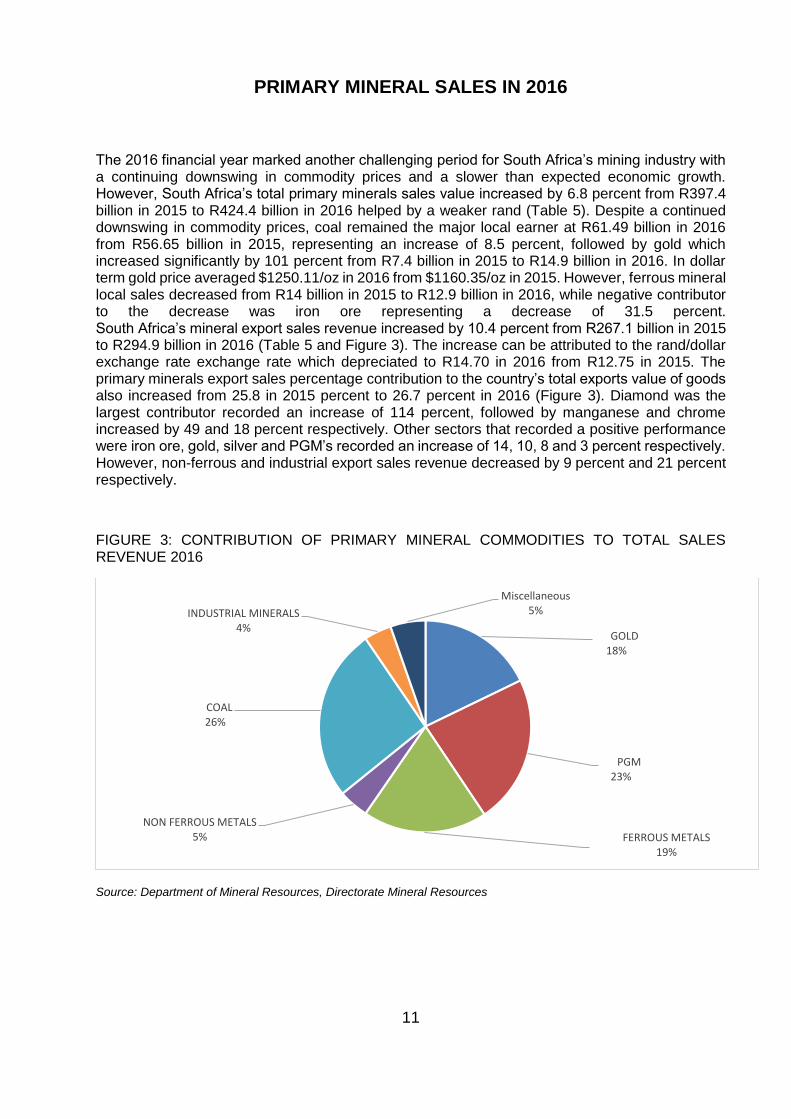
The 2016 financial year marked another challenging period for South Africa’s mining industry with a continuing downswing in commodity prices and a slower than expected economic growth. However, South Africa’s total primary minerals sales value increased by 6.8 percent from R397.4 billion in 2015 to R424.4 billion in 2016 helped by a weaker rand (Table 5). Despite a continued downswing in commodity prices, coal remained the major local earner at R61.49 billion in 2016 from R56.65 billion in 2015, representing an increase of 8.5 percent, followed by gold which increased significantly by 101 percent from R7.4 billion in 2015 to R14.9 billion in 2016. In dollar term gold price averaged $1250.11/oz in 2016 from $1160.35/oz in 2015. However, ferrous mineral local sales decreased from R14 billion in 2015 to R12.9 billion in 2016, while negative contributor to the decrease was iron ore representing a decrease of 31.5 percent. South Africa’s mineral export sales revenue increased by 10.4 percent from R267.1 billion in 2015 to R294.9 billion in 2016 (Table 5 and Figure 3). The increase can be attributed to the rand/dollar exchange rate exchange rate which depreciated to R14.70 in 2016 from R12.75 in 2015. The primary minerals export sales percentage contribution to the country’s total exports value of goods also increased from 25.8 in 2015 percent to 26.7 percent in 2016 (Figure 3). Diamond was the largest contributor recorded an increase of 114 percent, followed by manganese and chrome increased by 49 and 18 percent respectively. Other sectors that recorded a positive performance were iron ore, gold, silver and PGM’s recorded an increase of 14, 10, 8 and 3 percent respectively. However, non-ferrous and industrial export sales revenue decreased by 9 percent and 21 percent respectively.
FIGURE 3: CONTRIBUTION OF PRIMARY MINERAL COMMODITIES TO TOTAL SALES REVENUE 2016
Source: Department of Mineral Resources, Directorate Mineral Resources
GOLD 18%
PGM 23%
FERROUS METALS 19%
NON FERROUS METALS 5%
COAL 26%
INDUSTRIAL MINERALS 4%
Miscellaneous 5%
12
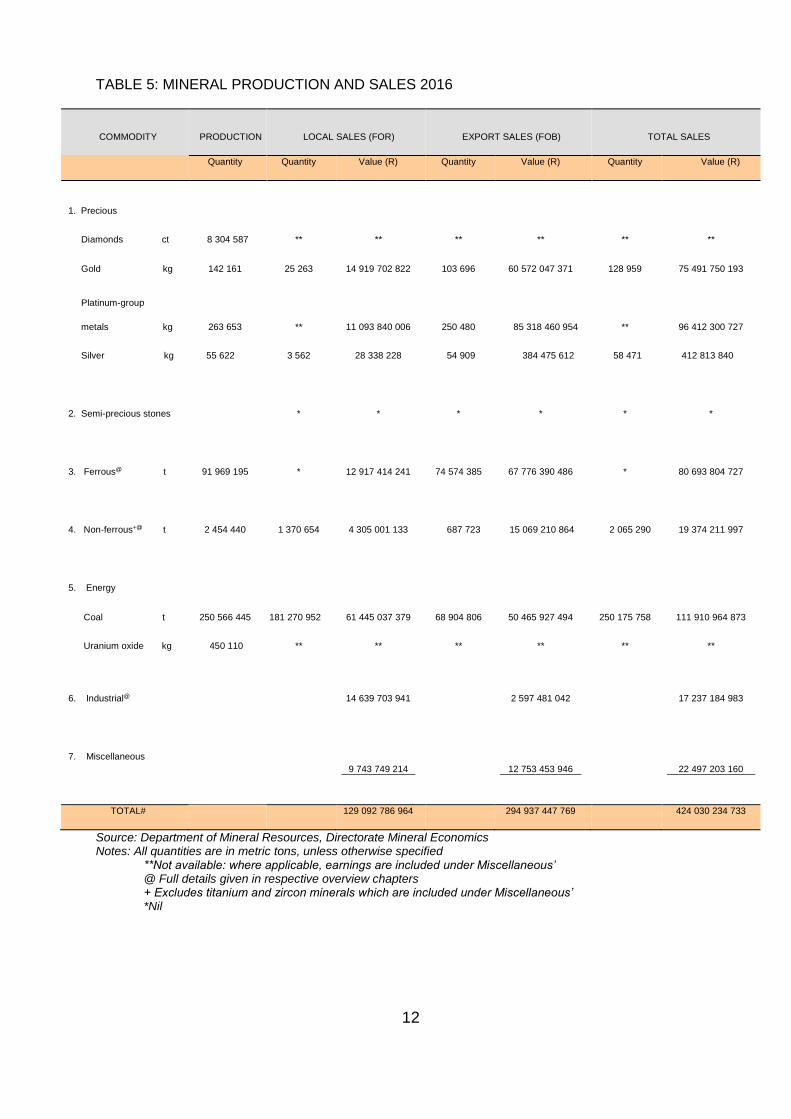
TABLE 5: MINERAL PRODUCTION AND SALES 2016
COMMODITY PRODUCTION LOCAL SALES (FOR) EXPORT SALES (FOB) TOTAL SALES
Quantity Quantity Value (R) Quantity Value (R) Quantity Value (R)
1. Precious
Diamonds ct 8 304 587 ** ** ** ** ** **
Gold kg 142 161 25 263 14 919 702 822 103 696 60 572 047 371 128 959 75 491 750 193
Platinum-group
metals kg 263 653 ** 11 093 840 006 250 480 85 318 460 954 ** 96 412 300 727
Silver kg 55 622 3 562 28 338 228 54 909 384 475 612 58 471 412 813 840
2. Semi-precious stones * * * * * *
3. Ferrous@ t 91 969 195 * 12 917 414 241 74 574 385 67 776 390 486 * 80 693 804 727
4. Non-ferrous+@ t 2 454 440 1 370 654 4 305 001 133 687 723 15 069 210 864 2 065 290 19 374 211 997
5. Energy
Coal t 250 566 445 181 270 952 61 445 037 379 68 904 806 50 465 927 494 250 175 758 111 910 964 873
Uranium oxide kg 450 110 ** ** ** ** ** **
6. Industrial@ 14 639 703 941 2 597 481 042 17 237 184 983
7. Miscellaneous
9 743 749 214
12 753 453 946
22 497 203 160
TOTAL# 129 092 786 964 294 937 447 769 424 030 234 733
Source: Department of Mineral Resources, Directorate Mineral Economics Notes: All quantities are in metric tons, unless otherwise specified **Not available: where applicable, earnings are included under Miscellaneous’ @ Full details given in respective overview chapters + Excludes titanium and zircon minerals which are included under Miscellaneous’ *Nil
13
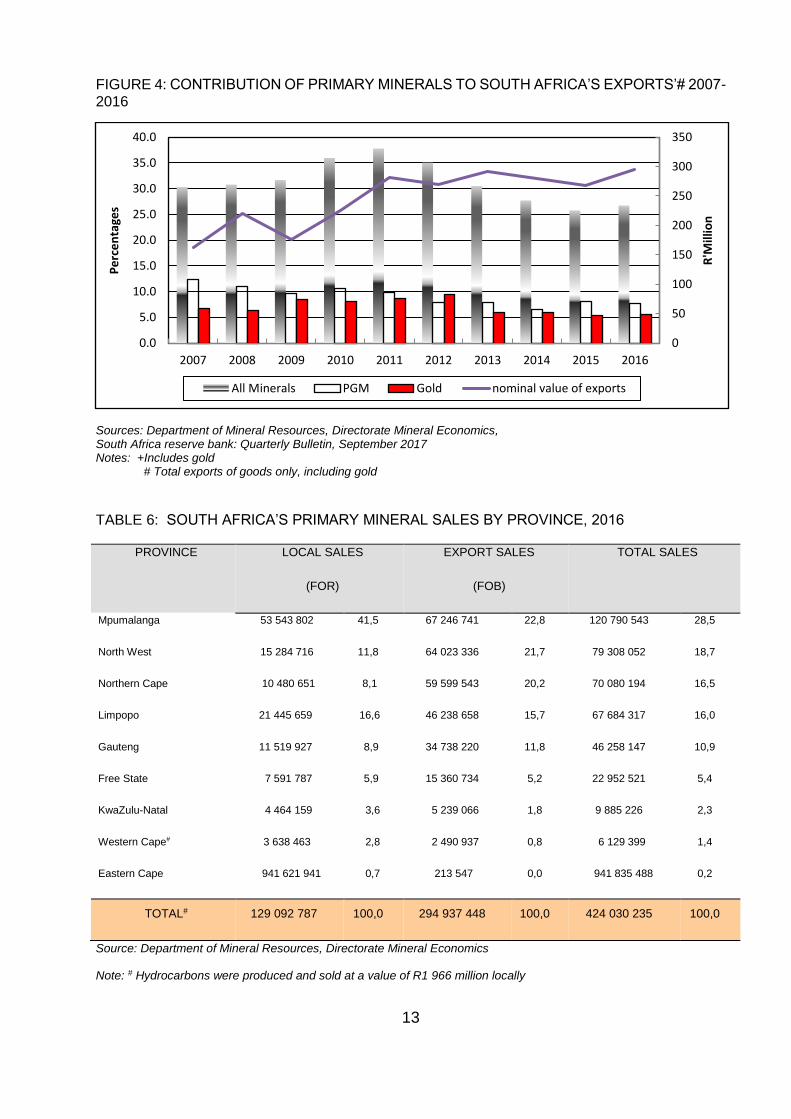
FIGURE 4: CONTRIBUTION OF PRIMARY MINERALS TO SOUTH AFRICA’S EXPORTS’# 2007-2016
Sources: Department of Mineral Resources, Directorate Mineral Economics, South Africa reserve bank: Quarterly Bulletin, September 2017 Notes: +Includes gold
# Total exports of goods only, including gold
TABLE 6: SOUTH AFRICA’S PRIMARY MINERAL SALES BY PROVINCE, 2016
PROVINCE LOCAL SALES
(FOR)
EXPORT SALES
(FOB)
TOTAL SALES
Mpumalanga 53 543 802 41,5 67 246 741 22,8 120 790 543 28,5
North West 15 284 716 11,8 64 023 336 21,7 79 308 052 18,7
Northern Cape 10 480 651 8,1 59 599 543 20,2 70 080 194 16,5
Limpopo 21 445 659 16,6 46 238 658 15,7 67 684 317 16,0
Gauteng 11 519 927 8,9 34 738 220 11,8 46 258 147 10,9
Free State 7 591 787 5,9 15 360 734 5,2 22 952 521 5,4
KwaZulu-Natal 4 464 159 3,6 5 239 066 1,8 9 885 226 2,3
Western Cape# 3 638 463 2,8 2 490 937 0,8 6 129 399 1,4
Eastern Cape 941 621 941 0,7 213 547 0,0 941 835 488 0,2
TOTAL# 129 092 787 100,0 294 937 448 100,0 424 030 235 100,0
Source: Department of Mineral Resources, Directorate Mineral Economics
Note: # Hydrocarbons were produced and sold at a value of R1 966 million locally
0
50
100
150
200
250
300
350
0.0
5.0
10.0
15.0
20.0
25.0
30.0
35.0
40.0
2007 2008 2009 2010 2011 2012 2013 2014 2015 2016
R'M
illio
n
Pe
rce
nta
ges
All Minerals PGM Gold nominal value of exports
14
During the period under review, the bulk of the total mineral revenues were generated from Mpumalanga, North West, Northern Cape, Limpopo and Gauteng provinces collectively accounting for 89.7 percent of the total primary mineral sales revenue (Table 6). Mpumalanga has been the leading contributor to both local and export sales revenue with 41, 5 percent and 22.8 percent respectively. Followed by Limpopo at 16, 6 percent and 15, 7 percent, respectively. Mpumalanga is mainly dependent on coal as a major contributor towards minerals revenue, North West depends on PGMs, Northern Cape on diamonds, Gauteng on gold and Limpopo on PGMs, diamonds, copper as well as coal.
SELECTED PROCESSED MINERAL SALES
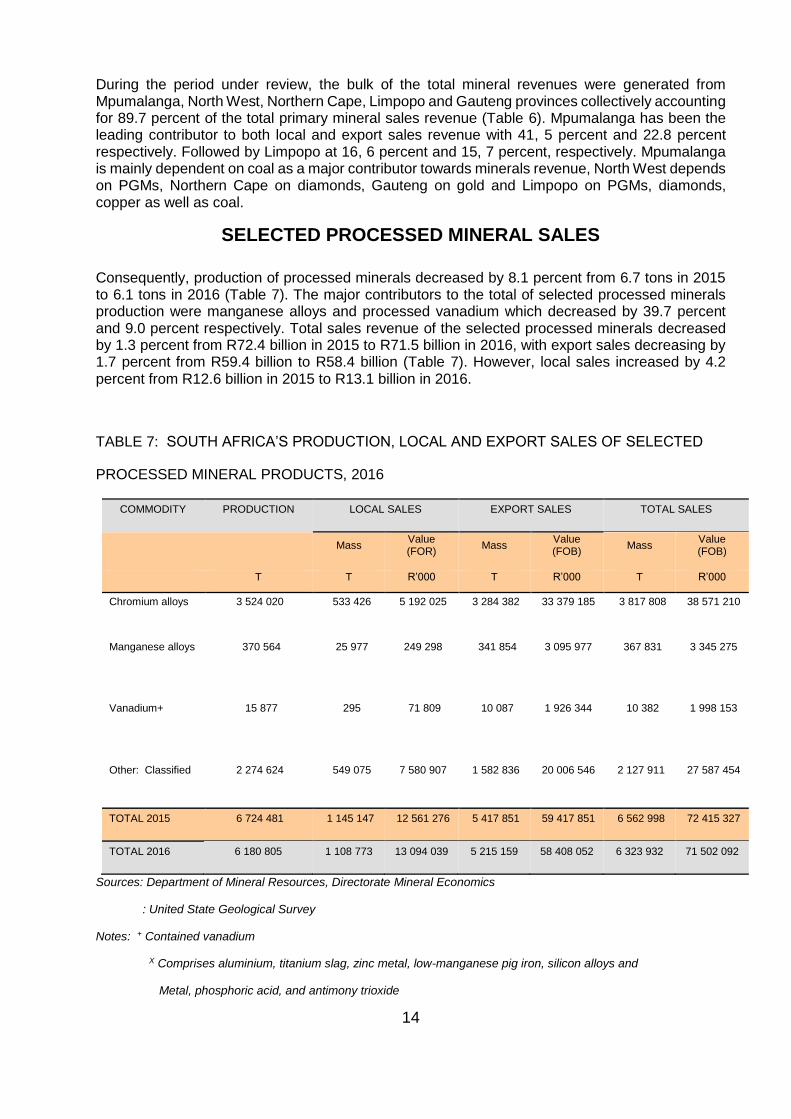
Consequently, production of processed minerals decreased by 8.1 percent from 6.7 tons in 2015 to 6.1 tons in 2016 (Table 7). The major contributors to the total of selected processed minerals production were manganese alloys and processed vanadium which decreased by 39.7 percent and 9.0 percent respectively. Total sales revenue of the selected processed minerals decreased by 1.3 percent from R72.4 billion in 2015 to R71.5 billion in 2016, with export sales decreasing by 1.7 percent from R59.4 billion to R58.4 billion (Table 7). However, local sales increased by 4.2 percent from R12.6 billion in 2015 to R13.1 billion in 2016.
TABLE 7: SOUTH AFRICA’S PRODUCTION, LOCAL AND EXPORT SALES OF SELECTED
PROCESSED MINERAL PRODUCTS, 2016
COMMODITY PRODUCTION LOCAL SALES EXPORT SALES TOTAL SALES
Mass Value (FOR)
Mass Value (FOB)
Mass Value (FOB)
T T R’000 T R’000 T R’000
Chromium alloys 3 524 020 533 426 5 192 025 3 284 382 33 379 185 3 817 808 38 571 210
Manganese alloys 370 564 25 977 249 298 341 854 3 095 977 367 831 3 345 275
Vanadium+ 15 877 295 71 809 10 087 1 926 344 10 382 1 998 153
Other: Classified 2 274 624 549 075 7 580 907 1 582 836 20 006 546 2 127 911 27 587 454
TOTAL 2015 6 724 481 1 145 147 12 561 276 5 417 851 59 417 851 6 562 998 72 415 327
TOTAL 2016 6 180 805 1 108 773 13 094 039 5 215 159 58 408 052 6 323 932 71 502 092
Sources: Department of Mineral Resources, Directorate Mineral Economics
: United State Geological Survey
Notes: + Contained vanadium
X Comprises aluminium, titanium slag, zinc metal, low-manganese pig iron, silicon alloys and
Metal, phosphoric acid, and antimony trioxide
15
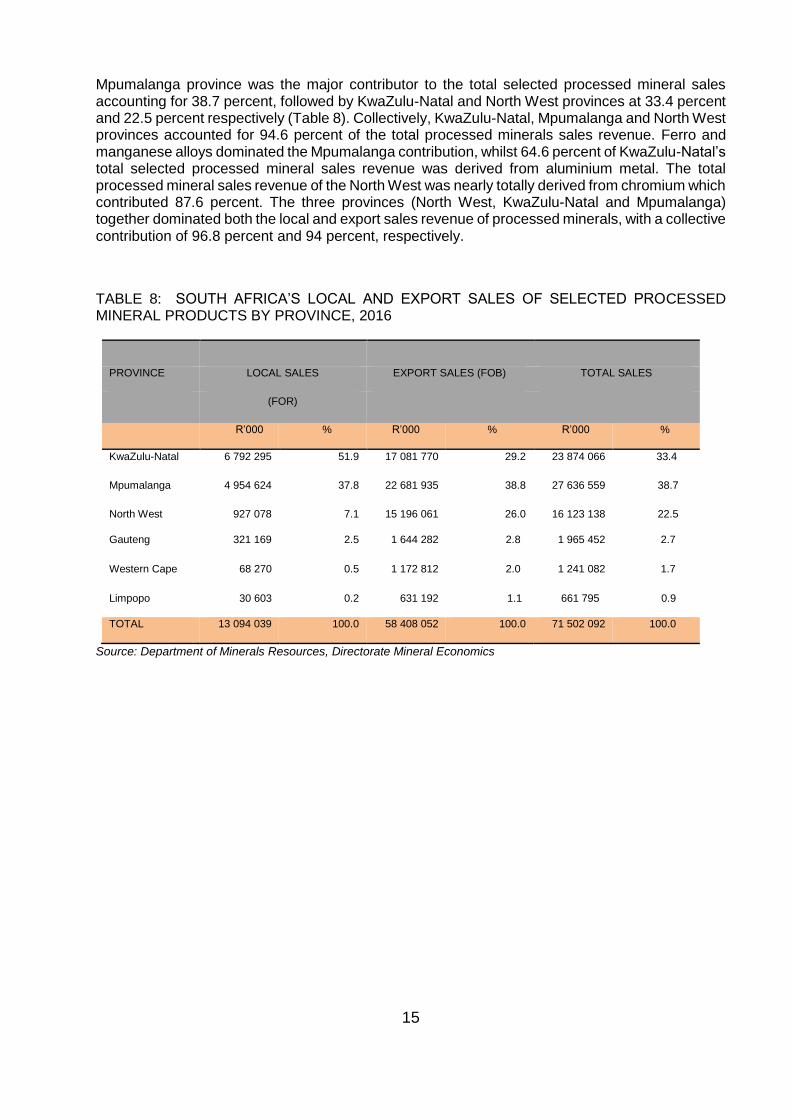
Mpumalanga province was the major contributor to the total selected processed mineral sales accounting for 38.7 percent, followed by KwaZulu-Natal and North West provinces at 33.4 percent and 22.5 percent respectively (Table 8). Collectively, KwaZulu-Natal, Mpumalanga and North West provinces accounted for 94.6 percent of the total processed minerals sales revenue. Ferro and manganese alloys dominated the Mpumalanga contribution, whilst 64.6 percent of KwaZulu-Natal’s total selected processed mineral sales revenue was derived from aluminium metal. The total processed mineral sales revenue of the North West was nearly totally derived from chromium which contributed 87.6 percent. The three provinces (North West, KwaZulu-Natal and Mpumalanga) together dominated both the local and export sales revenue of processed minerals, with a collective contribution of 96.8 percent and 94 percent, respectively.
TABLE 8: SOUTH AFRICA’S LOCAL AND EXPORT SALES OF SELECTED PROCESSED MINERAL PRODUCTS BY PROVINCE, 2016
PROVINCE LOCAL SALES EXPORT SALES (FOB) TOTAL SALES
(FOR)
R’000 % R’000 % R’000 %
KwaZulu-Natal 6 792 295 51.9 17 081 770 29.2 23 874 066 33.4
Mpumalanga 4 954 624 37.8 22 681 935 38.8 27 636 559 38.7
North West 927 078 7.1 15 196 061 26.0 16 123 138 22.5
Gauteng 321 169 2.5 1 644 282 2.8 1 965 452 2.7
Western Cape 68 270 0.5 1 172 812 2.0 1 241 082 1.7
Limpopo 30 603 0.2 631 192 1.1 661 795 0.9
TOTAL 13 094 039 100.0 58 408 052 100.0 71 502 092 100.0
Source: Department of Minerals Resources, Directorate Mineral Economics
16
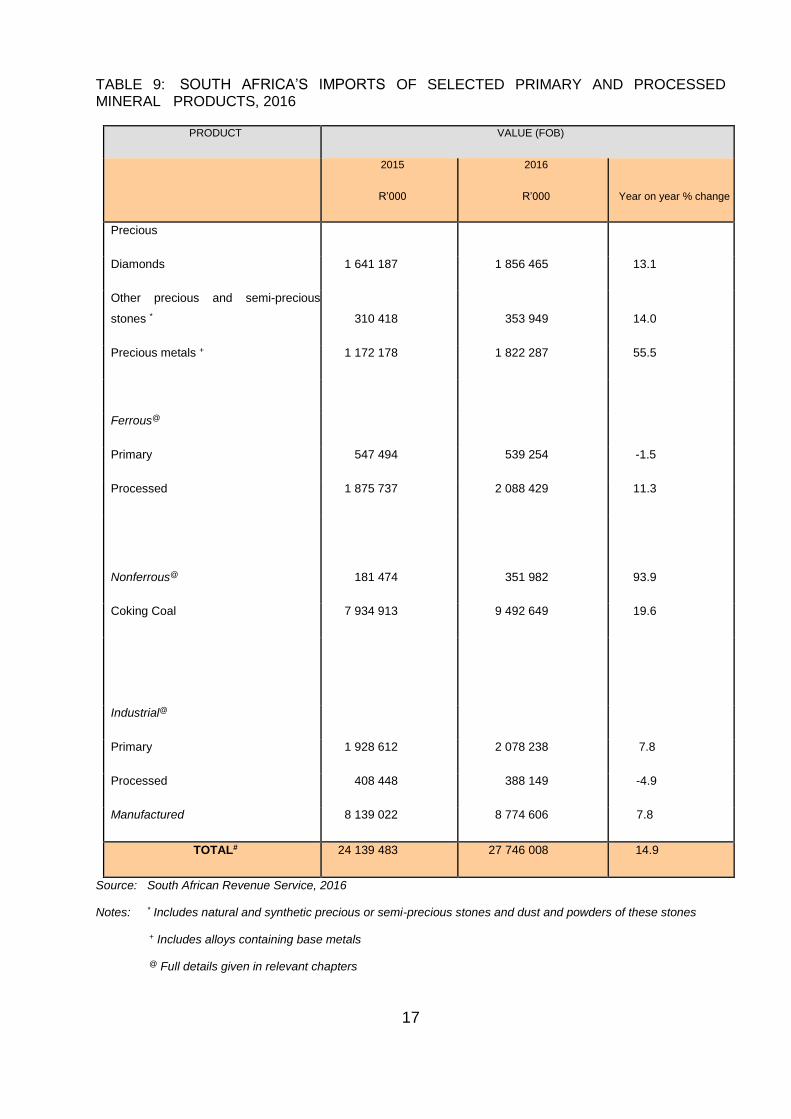
SOUTH AFRICA’S IMPORTS OF SELECTED PRIMARY AND
PROCESSED MINERAL PRODUCTS, 2016
South Africa is well able to supply for most of its minerals demand, however, there are some minerals and mineral products, which still need to be imported due to lack of local resources. The total value of imports increased by 14.9 percent from R24.1 billion in 2015 to R27.7 billion in 2016 (Table 9). South Africa will need to strengthen beneficiation and develop projects that will produce products locally and substitute imported goods, in order to reduce the imports demand. The value of imports of precious metals increased by 55.5 percent, with diamonds increasing by 13.1 percent from R1.6 billion in 2015 to R1.8 billion in 2016. During the same period coking coal increased by 19.6 percent from R7.9 billion in 2015 to R9.5 billion in 2016 due to cheaper imports from China. However, processed industrial minerals and primary ferrous minerals sales value decreased by 4.9 percent and 1.5 percent respectively.
17
TABLE 9: SOUTH AFRICA’S IMPORTS OF SELECTED PRIMARY AND PROCESSED MINERAL PRODUCTS, 2016
PRODUCT VALUE (FOB)
2015
R’000
2016
R’000 Year on year % change
Precious
Diamonds 1 641 187 1 856 465 13.1
Other precious and semi-precious
stones * 310 418 353 949 14.0
Precious metals + 1 172 178 1 822 287 55.5
Ferrous@
Primary 547 494 539 254 -1.5
Processed 1 875 737 2 088 429 11.3
Nonferrous@ 181 474 351 982
93.9
Coking Coal 7 934 913 9 492 649 19.6
Industrial@
Primary 1 928 612 2 078 238 7.8
Processed 408 448 388 149 -4.9
Manufactured 8 139 022 8 774 606 7.8
TOTAL# 24 139 483 27 746 008 14.9
Source: South African Revenue Service, 2016
Notes: * Includes natural and synthetic precious or semi-precious stones and dust and powders of these stones
+ Includes alloys containing base metals
@ Full details given in relevant chapters
18
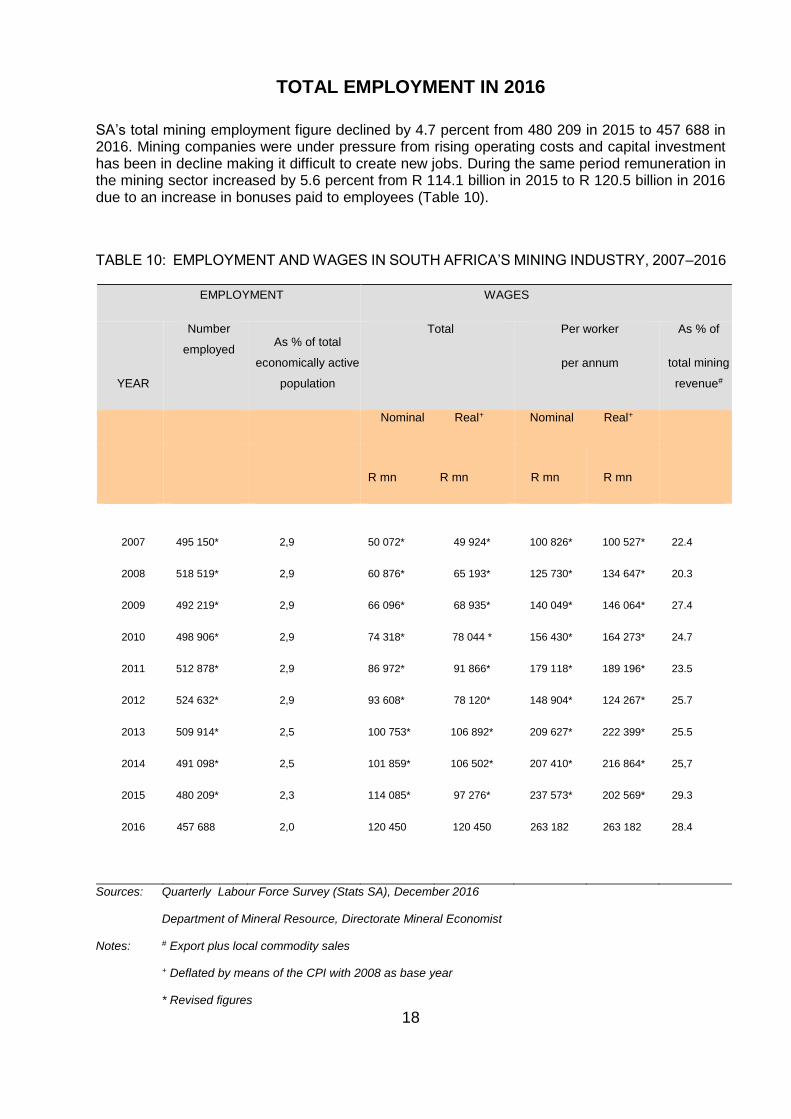
TOTAL EMPLOYMENT IN 2016
SA’s total mining employment figure declined by 4.7 percent from 480 209 in 2015 to 457 688 in 2016. Mining companies were under pressure from rising operating costs and capital investment has been in decline making it difficult to create new jobs. During the same period remuneration in the mining sector increased by 5.6 percent from R 114.1 billion in 2015 to R 120.5 billion in 2016 due to an increase in bonuses paid to employees (Table 10).
TABLE 10: EMPLOYMENT AND WAGES IN SOUTH AFRICA’S MINING INDUSTRY, 2007–2016
EMPLOYMENT WAGES
YEAR
Number
employed As % of total
economically active
population
Total Per worker
per annum
As % of
total mining
revenue#
Nominal Real+ Nominal Real+
R mn R mn R mn R mn
2007 495 150* 2,9 50 072* 49 924* 100 826* 100 527* 22.4
2008 518 519* 2,9 60 876* 65 193* 125 730* 134 647* 20.3
2009 492 219* 2,9 66 096* 68 935* 140 049* 146 064* 27.4
2010 498 906* 2,9 74 318* 78 044 * 156 430* 164 273* 24.7
2011 512 878* 2,9 86 972* 91 866* 179 118* 189 196* 23.5
2012 524 632* 2,9 93 608* 78 120* 148 904* 124 267* 25.7
2013 509 914* 2,5 100 753* 106 892* 209 627* 222 399* 25.5
2014 491 098* 2,5 101 859* 106 502* 207 410* 216 864* 25,7
2015 480 209* 2,3 114 085* 97 276* 237 573* 202 569* 29.3
2016 457 688 2,0 120 450 120 450 263 182 263 182 28.4
Sources: Quarterly Labour Force Survey (Stats SA), December 2016
Department of Mineral Resource, Directorate Mineral Economist
Notes: # Export plus local commodity sales
+ Deflated by means of the CPI with 2008 as base year
* Revised figures
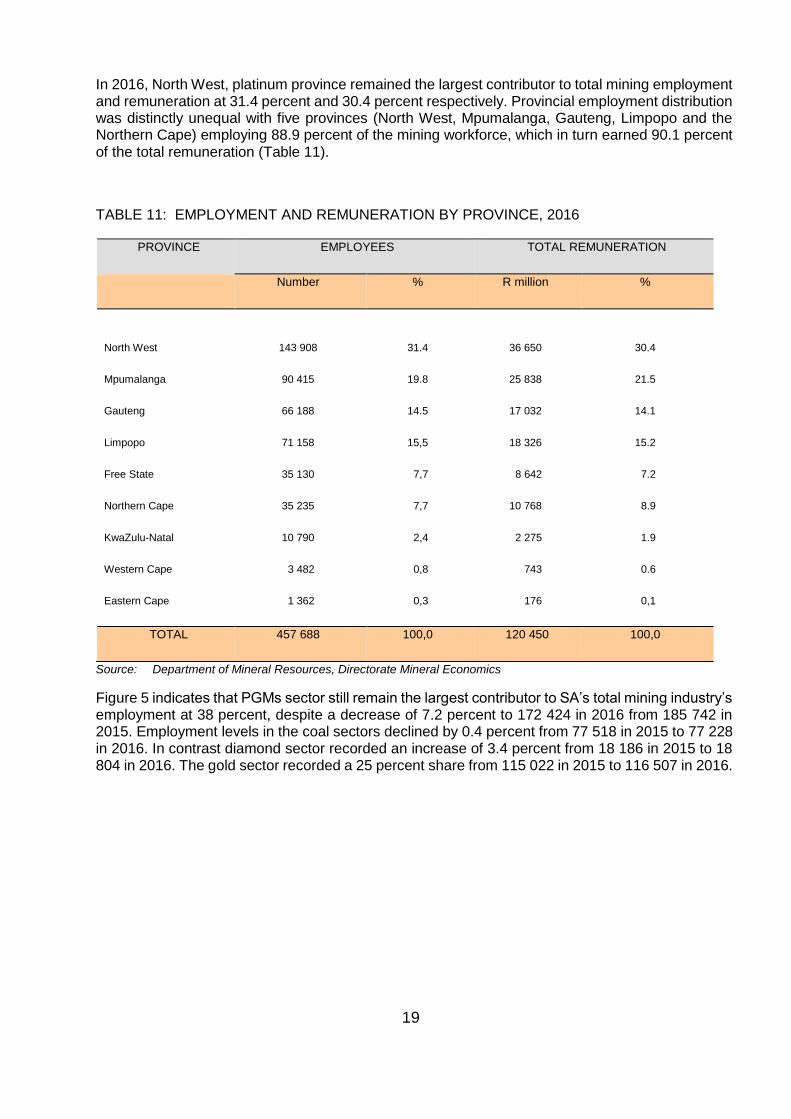
19
In 2016, North West, platinum province remained the largest contributor to total mining employment and remuneration at 31.4 percent and 30.4 percent respectively. Provincial employment distribution was distinctly unequal with five provinces (North West, Mpumalanga, Gauteng, Limpopo and the Northern Cape) employing 88.9 percent of the mining workforce, which in turn earned 90.1 percent of the total remuneration (Table 11).
TABLE 11: EMPLOYMENT AND REMUNERATION BY PROVINCE, 2016
PROVINCE EMPLOYEES TOTAL REMUNERATION
Number % R million %
North West
143 908
31.4
36 650
30.4
Mpumalanga 90 415 19.8 25 838 21.5
Gauteng 66 188 14.5 17 032 14.1
Limpopo 71 158 15,5 18 326 15.2
Free State 35 130 7,7 8 642 7.2
Northern Cape 35 235 7,7 10 768 8.9
KwaZulu-Natal 10 790 2,4 2 275 1.9
Western Cape 3 482 0,8 743 0.6
Eastern Cape 1 362 0,3 176 0,1
TOTAL 457 688 100,0 120 450 100,0
Source: Department of Mineral Resources, Directorate Mineral Economics
Figure 5 indicates that PGMs sector still remain the largest contributor to SA’s total mining industry’s employment at 38 percent, despite a decrease of 7.2 percent to 172 424 in 2016 from 185 742 in 2015. Employment levels in the coal sectors declined by 0.4 percent from 77 518 in 2015 to 77 228 in 2016. In contrast diamond sector recorded an increase of 3.4 percent from 18 186 in 2015 to 18 804 in 2016. The gold sector recorded a 25 percent share from 115 022 in 2015 to 116 507 in 2016.
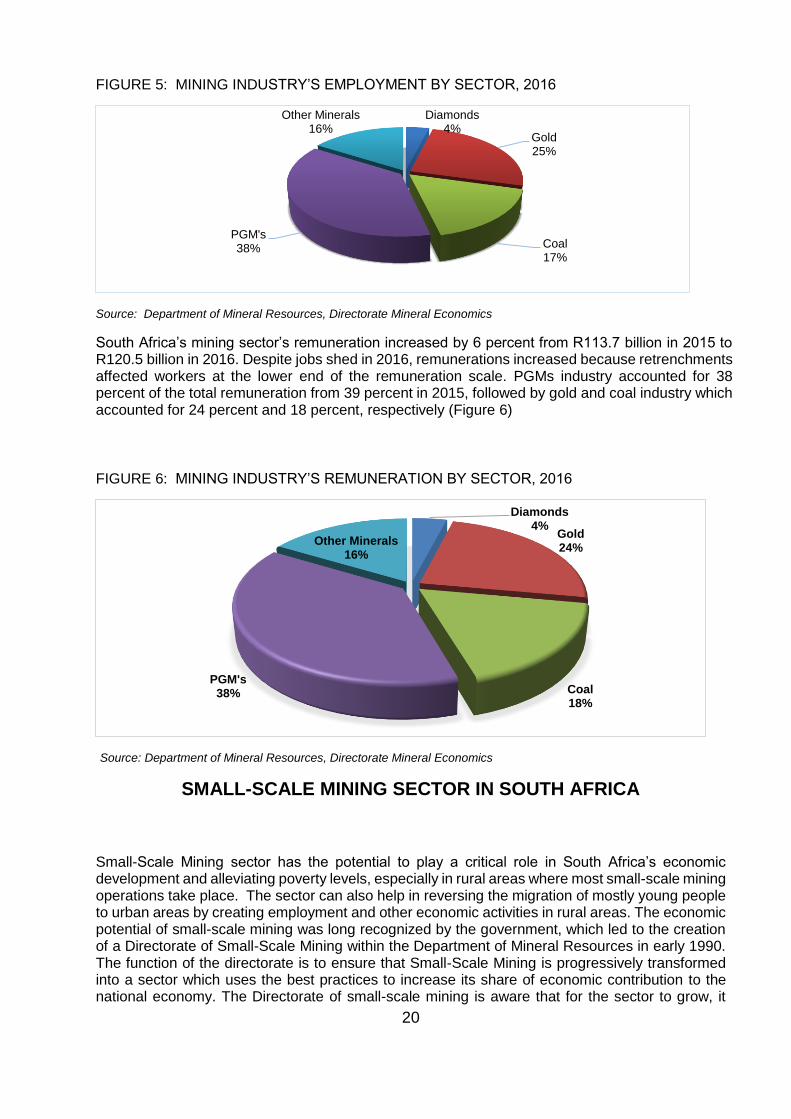
20
FIGURE 5: MINING INDUSTRY’S EMPLOYMENT BY SECTOR, 2016
Source: Department of Mineral Resources, Directorate Mineral Economics
South Africa’s mining sector’s remuneration increased by 6 percent from R113.7 billion in 2015 to R120.5 billion in 2016. Despite jobs shed in 2016, remunerations increased because retrenchments affected workers at the lower end of the remuneration scale. PGMs industry accounted for 38 percent of the total remuneration from 39 percent in 2015, followed by gold and coal industry which accounted for 24 percent and 18 percent, respectively (Figure 6)
FIGURE 6: MINING INDUSTRY’S REMUNERATION BY SECTOR, 2016
Source: Department of Mineral Resources, Directorate Mineral Economics
SMALL-SCALE MINING SECTOR IN SOUTH AFRICA
Small-Scale Mining sector has the potential to play a critical role in South Africa’s economic development and alleviating poverty levels, especially in rural areas where most small-scale mining operations take place. The sector can also help in reversing the migration of mostly young people to urban areas by creating employment and other economic activities in rural areas. The economic potential of small-scale mining was long recognized by the government, which led to the creation of a Directorate of Small-Scale Mining within the Department of Mineral Resources in early 1990. The function of the directorate is to ensure that Small-Scale Mining is progressively transformed into a sector which uses the best practices to increase its share of economic contribution to the national economy. The Directorate of small-scale mining is aware that for the sector to grow, it
Diamonds4%
Gold25%
Coal17%
PGM's38%
Other Minerals16%
Diamonds4%
Gold24%
Coal18%
PGM's38%
Other Minerals16%
21
must have access to modern mining, beneficiation, mine health and safety technologies, adequate financing and marketing.
The first main objective is to legalize illegal Small-Scale Miners in line with government regulations. This will make small-scale mining legal entities and be able to access facilities that will put them on a path for growth. Illegal mining is a growing concern to all stakeholders across South Africa and the African continent. Apart from health and safety issues that comes with it, jurisdictions where illegal operations take place, substantial revenues realized from these activities go unaccounted for and in most cases leaving communities poorer and the environment more damaged. Largely due to socio economic issues such as, unemployment and growing poverty, many individuals have little choice but to become illegal Small-Scale miners in desperate bid to put food on the table. For this reason, the Directorate Small-Scale Mining encourages and advises illegal Small-Scale Miners to approach the Department of Mineral Resources regional offices to be assisted with lodging in of the application for Mining Permits, so that their operations can be legal, giving them access to financial and technical assistance.
Despite the many challenges faced by the Small-Scale Mining sector in South Africa, with the support and regulatory framework spearheaded by the Directorate to open up opportunities, Small-Scale Mining operations will become more viable and contribute to sustainable economic growth of the sector. There are positive movements within sector to make it more accountable and responsible after many years of stagnant growth caused by mostly lack of proper regulatory frame work. The importance of Small -Scale Mining cannot be downplayed as it provides between 13 and 20 million jobs worldwide and a further 80 and 100 million people depends on it for their livelihood. In Africa, about 3.7 million are directly engaged in the subsector, with 30 million people deriving their livelihood from it and this number is expected to substantially increase by 2020.
MINERALS AND METALS PRICES 2016
Commodity prices fluctuates driven by changes in global demand and supply. Commodity price instability has a negative impact on economic growth and may lead to increased poverty instead of poverty alleviation. Developing countries are particularly affected by external shocks that can result in increased poverty.
Minerals and metals prices have been declining during the past five years. The gold price decreased significantly by 25 percent from the annual average of $1 669.59/ozt in 2012 to $1 248.18/ozt in 2016, while platinum declined by 36 percent during the period, from an average of $1 554.33/ozt in 2012 to $986.94/ozt in 2016. On the other hand, commodities such as palladium, rhodium, copper and nickel closed the year 2016 positively with increased prices in the fourth quarter. The strong demand from China, supply constraints as well as increased optimism for the global economy gave boost to the price of these commodities. However, the annual average price of commodities declined in 2016 compared with 2015 resulting from slowing investment, mine closures and policy developments particularly in Indonesia.
Gold
Weak demand in 2016, particularly in China and India, the two largest consuming countries of the meta, resulted in the gold price decrease of 14 percent, from the highest monthly average price of $1 340/ozt in August 2016 to the lowest monthly average price of $1 151.80/ozt in December 2016
22
and averaged $1 219.23/ozt in the fourth quarter. Nonetheless, the annual average price of the yellow metal increased by 7.6 percent in 2016 to $1 248.18/ozt from $1 160.35 in 2015. The gold price is likely to continue on the downward trend in 2017 as demand has been weak in China and India.
PGMs
Platinum price decreased significantly by 18 percent from the highest monthly average price of $1 123/ozt in August 2016 to the lowest monthly average price of $919.84/ozt in December 2016 and, closed the fourth quarter with an average of $944.53/ozt compared with an average of $1 085.69 in the third quarter 2016. The price drop could be attributed to weakening demand in China and policy plans to phase out diesel vehicles in major European cities. The annual average price of decreased by 6.4 percent in 2016 from $1 054.28 in 2015 to $986.94/ozt. In 2016, palladium and rhodium rose significantly by 42 percent and 21 percent respectively but, recorded the low annual average price of $612.66/ozt and $693.64/ozt compared with $691.51/ozt and $955.40/ozt in 2015. The price of platinum may rise slightly in 2017.
Copper
Strong demand from China in the automotive and construction sectors led to the significant increase of copper price by 27 percent in 2016, from monthly average price of $4 462.70/t in January 2016 to the highest monthly average price of $5 666.25/t in December 2016 and averaged $5 280.55/t in the fourth quarter from an average of $4 668.57/t in first quarter 2016. However, the annual average price dropped in 2016, despite price increase, from an average of $5 501.79/t in 2015 to $4 863.38.
Nickel
Furthermore, nickel price went up noticeably by 30 percent in 2016, from an average of $8 483.00/t in January to an average of $11 009.75/t in December, due to strong stainless-steel demand in China. Nonetheless, the annual average price fell from $11 833.15/t in 2015 to an average of $9 594.05/t in 2016.
Coal
Coal steam fob and for prices also showed an upward trend in 2016 with an increase of 20 percent and 48 percent respectively, with the annual average price of R329.85/t and R727.21/t from the average of R306.81/t and R617.90/t in 2015. Again, the price of thermal coal which is used for electricity generation, increased by 38 percent in the fourth quarter of 2016, resulting from increased demand and supply constraints in China. The coal price may drop in 2017, due to weak import demand.
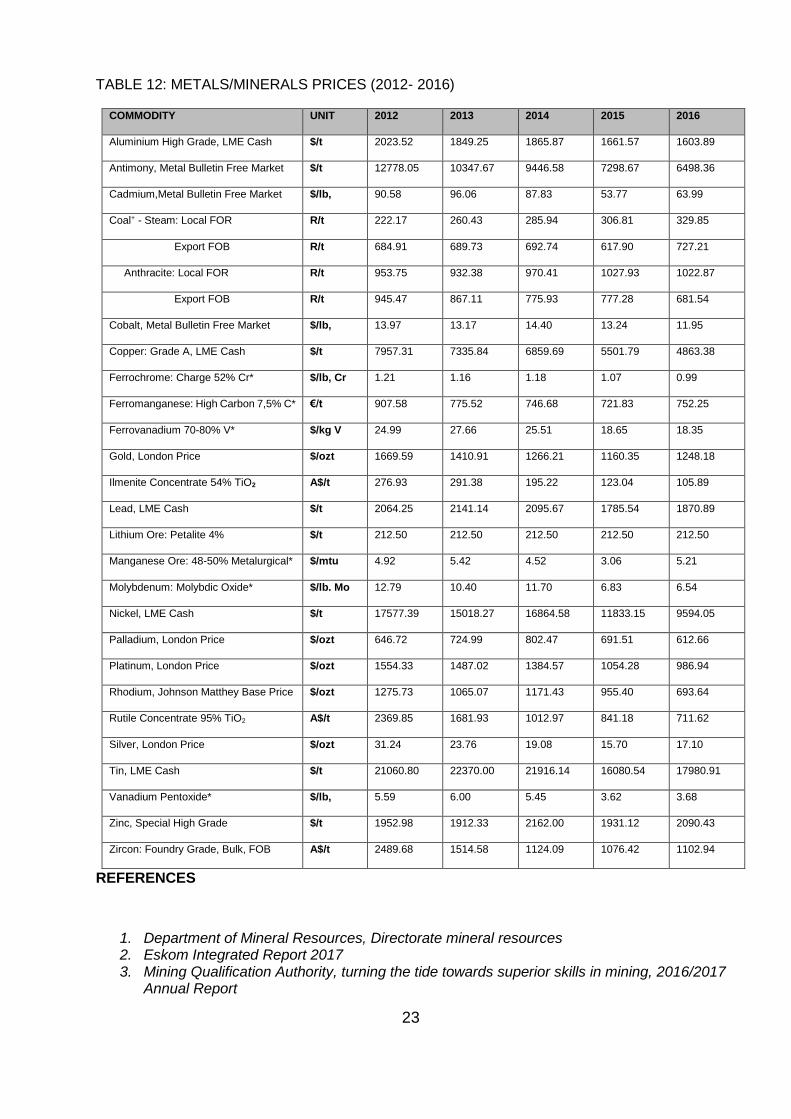
23
TABLE 12: METALS/MINERALS PRICES (2012- 2016)
COMMODITY UNIT 2012 2013 2014 2015 2016
Aluminium High Grade, LME Cash $/t 2023.52 1849.25 1865.87 1661.57 1603.89
Antimony, Metal Bulletin Free Market $/t 12778.05 10347.67 9446.58 7298.67 6498.36
Cadmium,Metal Bulletin Free Market $/lb, 90.58 96.06 87.83 53.77 63.99
Coal+ - Steam: Local FOR R/t 222.17 260.43 285.94 306.81 329.85
Export FOB R/t 684.91 689.73 692.74 617.90 727.21
Anthracite: Local FOR R/t 953.75 932.38 970.41 1027.93 1022.87
Export FOB R/t 945.47 867.11 775.93 777.28 681.54
Cobalt, Metal Bulletin Free Market $/lb, 13.97 13.17 14.40 13.24 11.95
Copper: Grade A, LME Cash $/t 7957.31 7335.84 6859.69 5501.79 4863.38
Ferrochrome: Charge 52% Cr* $/lb, Cr 1.21 1.16 1.18 1.07 0.99
Ferromanganese: High Carbon 7,5% C* €/t 907.58 775.52 746.68 721.83 752.25
Ferrovanadium 70-80% V* $/kg V 24.99 27.66 25.51 18.65 18.35
Gold, London Price $/ozt 1669.59 1410.91 1266.21 1160.35 1248.18
Ilmenite Concentrate 54% TiO2 A$/t 276.93 291.38 195.22 123.04 105.89
Lead, LME Cash $/t 2064.25 2141.14 2095.67 1785.54 1870.89
Lithium Ore: Petalite 4% $/t 212.50 212.50 212.50 212.50 212.50
Manganese Ore: 48-50% Metalurgical* $/mtu 4.92 5.42 4.52 3.06 5.21
Molybdenum: Molybdic Oxide* $/lb. Mo 12.79 10.40 11.70 6.83 6.54
Nickel, LME Cash $/t 17577.39 15018.27 16864.58 11833.15 9594.05
Palladium, London Price $/ozt 646.72 724.99 802.47 691.51 612.66
Platinum, London Price $/ozt 1554.33 1487.02 1384.57 1054.28 986.94
Rhodium, Johnson Matthey Base Price $/ozt 1275.73 1065.07 1171.43 955.40 693.64
Rutile Concentrate 95% TiO2 A$/t 2369.85 1681.93 1012.97 841.18 711.62
Silver, London Price $/ozt 31.24 23.76 19.08 15.70 17.10
Tin, LME Cash $/t 21060.80 22370.00 21916.14 16080.54 17980.91
Vanadium Pentoxide* $/lb, 5.59 6.00 5.45 3.62 3.68
Zinc, Special High Grade $/t 1952.98 1912.33 2162.00 1931.12 2090.43
Zircon: Foundry Grade, Bulk, FOB A$/t 2489.68 1514.58 1124.09 1076.42 1102.94
REFERENCES
1. Department of Mineral Resources, Directorate mineral resources 2. Eskom Integrated Report 2017 3. Mining Qualification Authority, turning the tide towards superior skills in mining, 2016/2017
Annual Report
24
4. PWC Capital Project and Infrastructure, November 2014 5. South Africa Reserve Bank: Quarterly Bulletin, June 2017 6. S&P Global Market Intelligence 7. USGS, Mineral Commodity Summaries 2017
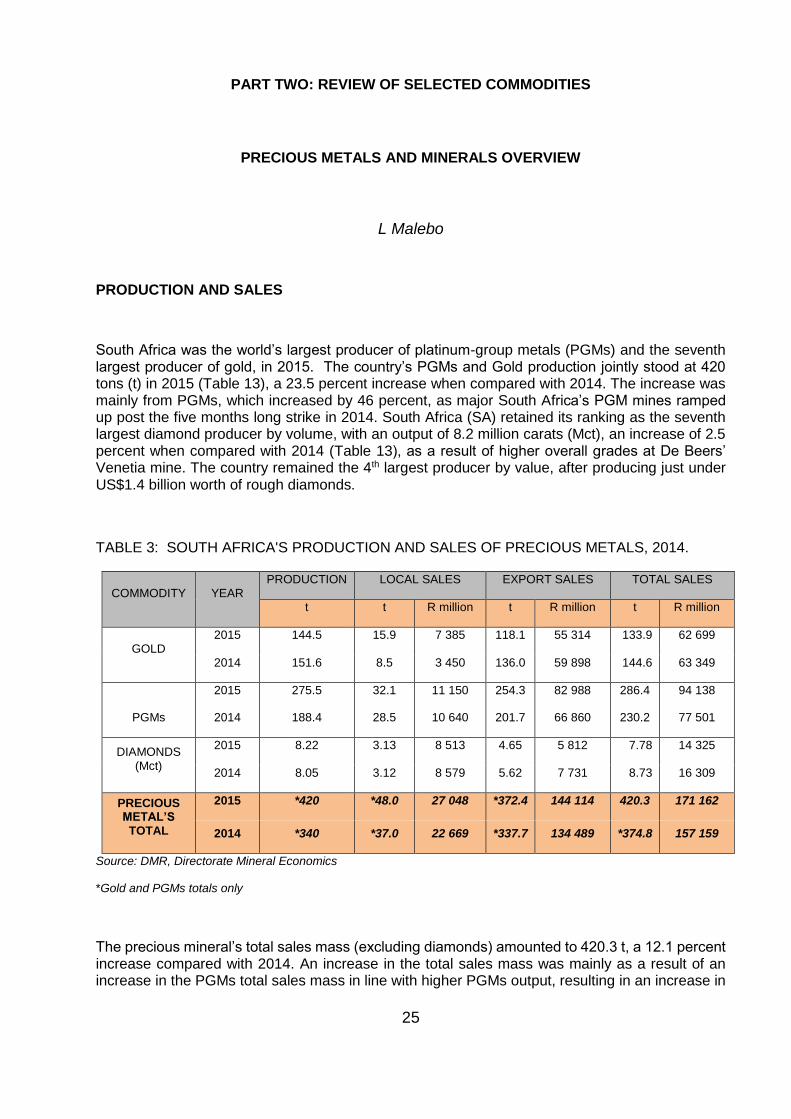
25
PART TWO: REVIEW OF SELECTED COMMODITIES
PRECIOUS METALS AND MINERALS OVERVIEW
L Malebo
PRODUCTION AND SALES
South Africa was the world’s largest producer of platinum-group metals (PGMs) and the seventh largest producer of gold, in 2015. The country’s PGMs and Gold production jointly stood at 420 tons (t) in 2015 (Table 13), a 23.5 percent increase when compared with 2014. The increase was mainly from PGMs, which increased by 46 percent, as major South Africa’s PGM mines ramped up post the five months long strike in 2014. South Africa (SA) retained its ranking as the seventh largest diamond producer by volume, with an output of 8.2 million carats (Mct), an increase of 2.5 percent when compared with 2014 (Table 13), as a result of higher overall grades at De Beers’ Venetia mine. The country remained the 4th largest producer by value, after producing just under US$1.4 billion worth of rough diamonds.
TABLE 3: SOUTH AFRICA'S PRODUCTION AND SALES OF PRECIOUS METALS, 2014.
COMMODITY YEAR PRODUCTION LOCAL SALES EXPORT SALES TOTAL SALES
t t R million t R million t R million
GOLD 2015 144.5 15.9 7 385 118.1 55 314 133.9 62 699
2014 151.6 8.5 3 450 136.0 59 898 144.6 63 349
PGMs
2015 275.5 32.1 11 150 254.3 82 988 286.4 94 138
2014 188.4 28.5 10 640 201.7 66 860 230.2 77 501
DIAMONDS
(Mct)
2015 8.22 3.13 8 513 4.65 5 812 7.78 14 325
2014 8.05 3.12 8 579 5.62 7 731 8.73 16 309
PRECIOUS METAL’S TOTAL
2015 *420 *48.0 27 048 *372.4 144 114 420.3 171 162
2014 *340 *37.0 22 669 *337.7 134 489 *374.8 157 159
Source: DMR, Directorate Mineral Economics
*Gold and PGMs totals only
The precious mineral’s total sales mass (excluding diamonds) amounted to 420.3 t, a 12.1 percent increase compared with 2014. An increase in the total sales mass was mainly as a result of an increase in the PGMs total sales mass in line with higher PGMs output, resulting in an increase in
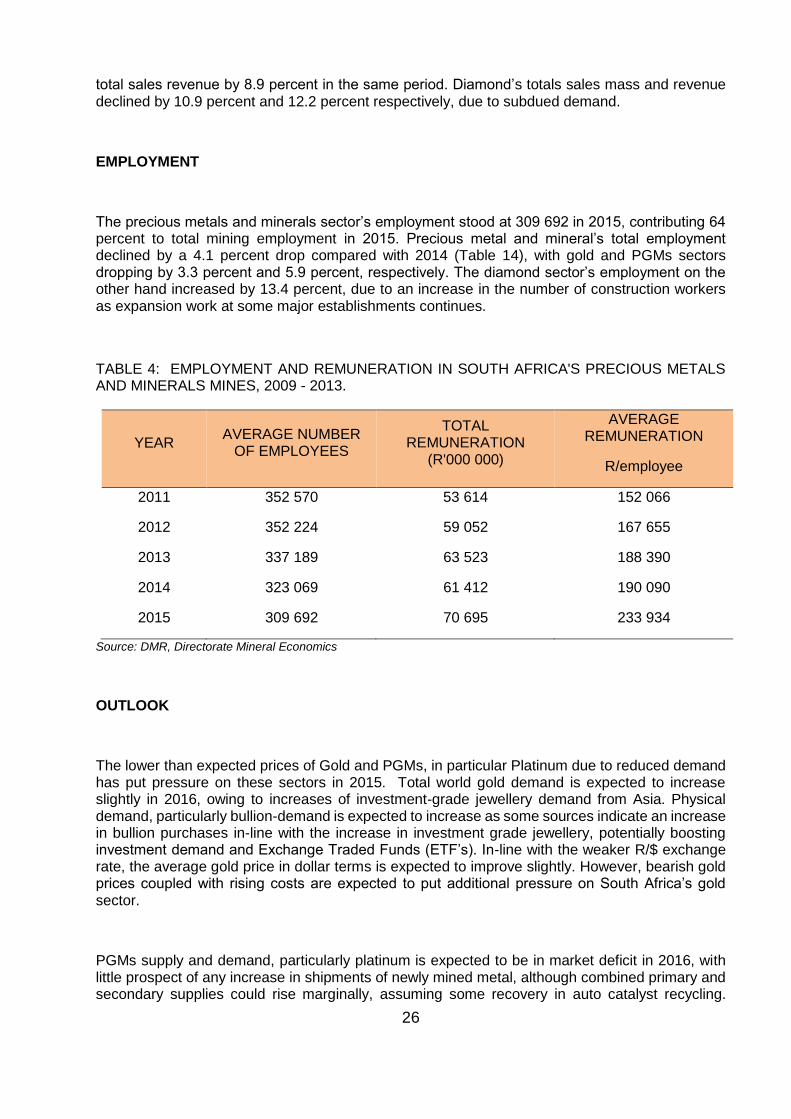
26
total sales revenue by 8.9 percent in the same period. Diamond’s totals sales mass and revenue declined by 10.9 percent and 12.2 percent respectively, due to subdued demand.
EMPLOYMENT
The precious metals and minerals sector’s employment stood at 309 692 in 2015, contributing 64 percent to total mining employment in 2015. Precious metal and mineral’s total employment declined by a 4.1 percent drop compared with 2014 (Table 14), with gold and PGMs sectors dropping by 3.3 percent and 5.9 percent, respectively. The diamond sector’s employment on the other hand increased by 13.4 percent, due to an increase in the number of construction workers as expansion work at some major establishments continues.
TABLE 4: EMPLOYMENT AND REMUNERATION IN SOUTH AFRICA'S PRECIOUS METALS AND MINERALS MINES, 2009 - 2013.
YEAR AVERAGE NUMBER
OF EMPLOYEES
TOTAL REMUNERATION
(R'000 000)
AVERAGE REMUNERATION
R/employee
2011 352 570 53 614 152 066
2012 352 224 59 052 167 655
2013 337 189 63 523 188 390
2014 323 069 61 412 190 090
2015 309 692 70 695 233 934
Source: DMR, Directorate Mineral Economics
OUTLOOK
The lower than expected prices of Gold and PGMs, in particular Platinum due to reduced demand has put pressure on these sectors in 2015. Total world gold demand is expected to increase slightly in 2016, owing to increases of investment-grade jewellery demand from Asia. Physical demand, particularly bullion-demand is expected to increase as some sources indicate an increase in bullion purchases in-line with the increase in investment grade jewellery, potentially boosting investment demand and Exchange Traded Funds (ETF’s). In-line with the weaker R/$ exchange rate, the average gold price in dollar terms is expected to improve slightly. However, bearish gold prices coupled with rising costs are expected to put additional pressure on South Africa’s gold sector.
PGMs supply and demand, particularly platinum is expected to be in market deficit in 2016, with little prospect of any increase in shipments of newly mined metal, although combined primary and secondary supplies could rise marginally, assuming some recovery in auto catalyst recycling.
27
PGMs demand is forecast to rise, particularly from the automotive sector due to tighter emissions legislation in Western Europe. In addition, platinum demand is expected to be boosted further by increased jewellery demand, with growth expected in China, the US, India and Western Europe.
Global rough diamond production is expected to decline marginally in 2016 due to the limited number of new productive projects and the depletion of existing operations. The US and continued growth of the middle class in China and India are expected to add to the polished diamond demand growth. Due to inherent production constraints, supply is expected to struggle to keep pace with demand, resulting in a bullish outlook for both rough and polished diamond prices.
REFERENCES
1. DMR, Directorate Mineral Economics. 2. GFMS Platinum, Palladium and Gold Survey, 2016. 3. PGM Market Report, Johnson Matthey, 2016 4. Kimberley Process Certification Scheme Statistics
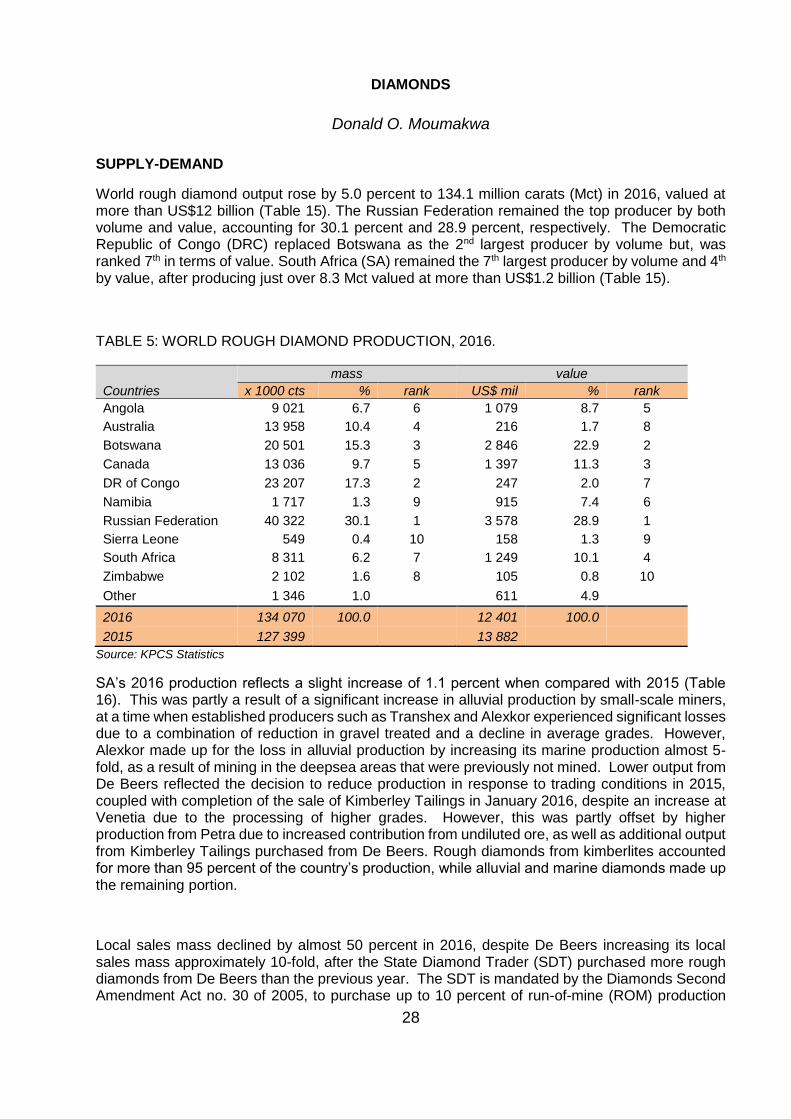
28
DIAMONDS
Donald O. Moumakwa
SUPPLY-DEMAND
World rough diamond output rose by 5.0 percent to 134.1 million carats (Mct) in 2016, valued at more than US$12 billion (Table 15). The Russian Federation remained the top producer by both volume and value, accounting for 30.1 percent and 28.9 percent, respectively. The Democratic Republic of Congo (DRC) replaced Botswana as the 2nd largest producer by volume but, was ranked 7th in terms of value. South Africa (SA) remained the 7th largest producer by volume and 4th by value, after producing just over 8.3 Mct valued at more than US$1.2 billion (Table 15).
TABLE 5: WORLD ROUGH DIAMOND PRODUCTION, 2016.
Countries
mass value
x 1000 cts % rank US$ mil % rank
Angola 9 021 6.7 6 1 079 8.7 5
Australia 13 958 10.4 4 216 1.7 8
Botswana 20 501 15.3 3 2 846 22.9 2
Canada 13 036 9.7 5 1 397 11.3 3
DR of Congo 23 207 17.3 2 247 2.0 7
Namibia 1 717 1.3 9 915 7.4 6
Russian Federation 40 322 30.1 1 3 578 28.9 1
Sierra Leone 549 0.4 10 158 1.3 9
South Africa 8 311 6.2 7 1 249 10.1 4
Zimbabwe 2 102 1.6 8 105 0.8 10
Other 1 346 1.0 611 4.9
2016 134 070 100.0 12 401 100.0
2015 127 399 13 882
Source: KPCS Statistics
SA’s 2016 production reflects a slight increase of 1.1 percent when compared with 2015 (Table 16). This was partly a result of a significant increase in alluvial production by small-scale miners, at a time when established producers such as Transhex and Alexkor experienced significant losses due to a combination of reduction in gravel treated and a decline in average grades. However, Alexkor made up for the loss in alluvial production by increasing its marine production almost 5-fold, as a result of mining in the deepsea areas that were previously not mined. Lower output from De Beers reflected the decision to reduce production in response to trading conditions in 2015, coupled with completion of the sale of Kimberley Tailings in January 2016, despite an increase at Venetia due to the processing of higher grades. However, this was partly offset by higher production from Petra due to increased contribution from undiluted ore, as well as additional output from Kimberley Tailings purchased from De Beers. Rough diamonds from kimberlites accounted for more than 95 percent of the country’s production, while alluvial and marine diamonds made up the remaining portion.
Local sales mass declined by almost 50 percent in 2016, despite De Beers increasing its local sales mass approximately 10-fold, after the State Diamond Trader (SDT) purchased more rough diamonds from De Beers than the previous year. The SDT is mandated by the Diamonds Second Amendment Act no. 30 of 2005, to purchase up to 10 percent of run-of-mine (ROM) production
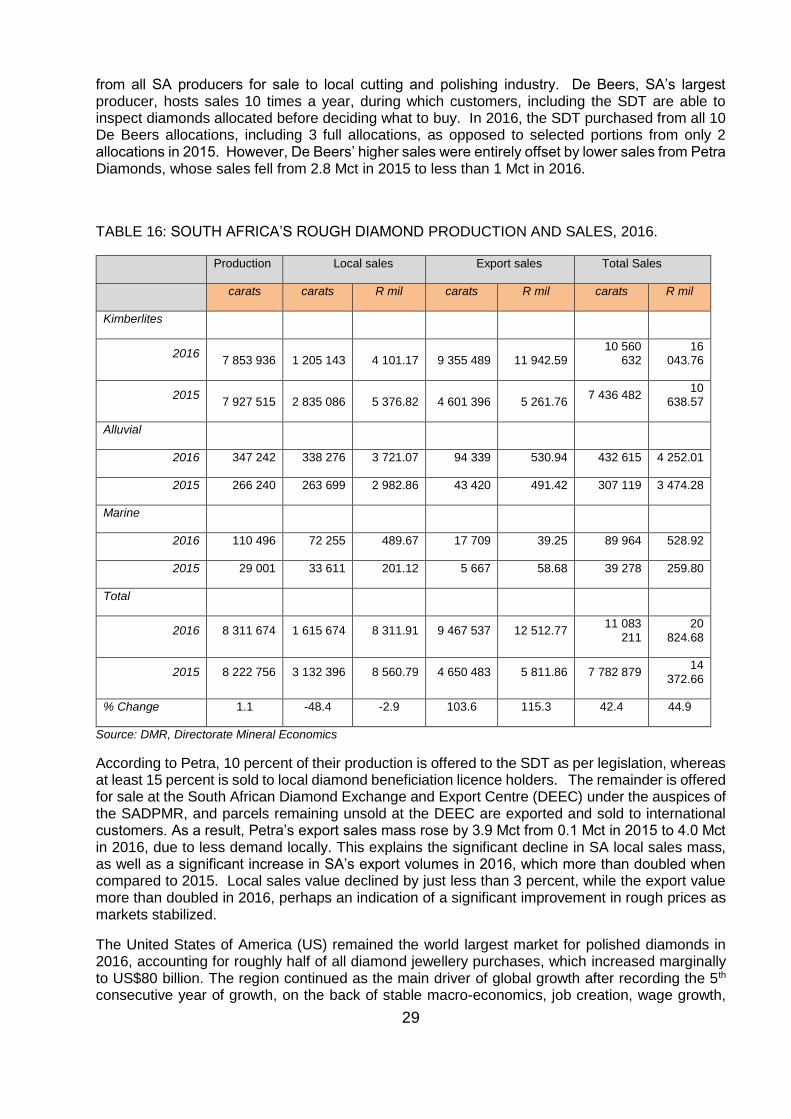
29
from all SA producers for sale to local cutting and polishing industry. De Beers, SA’s largest producer, hosts sales 10 times a year, during which customers, including the SDT are able to inspect diamonds allocated before deciding what to buy. In 2016, the SDT purchased from all 10 De Beers allocations, including 3 full allocations, as opposed to selected portions from only 2 allocations in 2015. However, De Beers’ higher sales were entirely offset by lower sales from Petra Diamonds, whose sales fell from 2.8 Mct in 2015 to less than 1 Mct in 2016.
TABLE 16: SOUTH AFRICA’S ROUGH DIAMOND PRODUCTION AND SALES, 2016.
Production Local sales Export sales Total Sales
carats carats R mil carats R mil carats R mil
Kimberlites
2016 7 853 936 1 205 143 4 101.17 9 355 489 11 942.59
10 560 632
16 043.76
2015 7 927 515 2 835 086 5 376.82 4 601 396 5 261.76
7 436 482 10
638.57
Alluvial
2016 347 242 338 276 3 721.07 94 339 530.94 432 615 4 252.01
2015 266 240 263 699 2 982.86 43 420 491.42 307 119 3 474.28
Marine
2016 110 496 72 255 489.67 17 709 39.25 89 964 528.92
2015 29 001 33 611 201.12 5 667 58.68 39 278 259.80
Total
2016 8 311 674 1 615 674 8 311.91 9 467 537 12 512.77 11 083
211
20
824.68
2015 8 222 756 3 132 396 8 560.79 4 650 483 5 811.86 7 782 879 14
372.66
% Change 1.1 -48.4 -2.9 103.6 115.3 42.4 44.9
Source: DMR, Directorate Mineral Economics
According to Petra, 10 percent of their production is offered to the SDT as per legislation, whereas at least 15 percent is sold to local diamond beneficiation licence holders. The remainder is offered for sale at the South African Diamond Exchange and Export Centre (DEEC) under the auspices of the SADPMR, and parcels remaining unsold at the DEEC are exported and sold to international customers. As a result, Petra’s export sales mass rose by 3.9 Mct from 0.1 Mct in 2015 to 4.0 Mct in 2016, due to less demand locally. This explains the significant decline in SA local sales mass, as well as a significant increase in SA’s export volumes in 2016, which more than doubled when compared to 2015. Local sales value declined by just less than 3 percent, while the export value more than doubled in 2016, perhaps an indication of a significant improvement in rough prices as markets stabilized.
The United States of America (US) remained the world largest market for polished diamonds in 2016, accounting for roughly half of all diamond jewellery purchases, which increased marginally to US$80 billion. The region continued as the main driver of global growth after recording the 5th consecutive year of growth, on the back of stable macro-economics, job creation, wage growth,
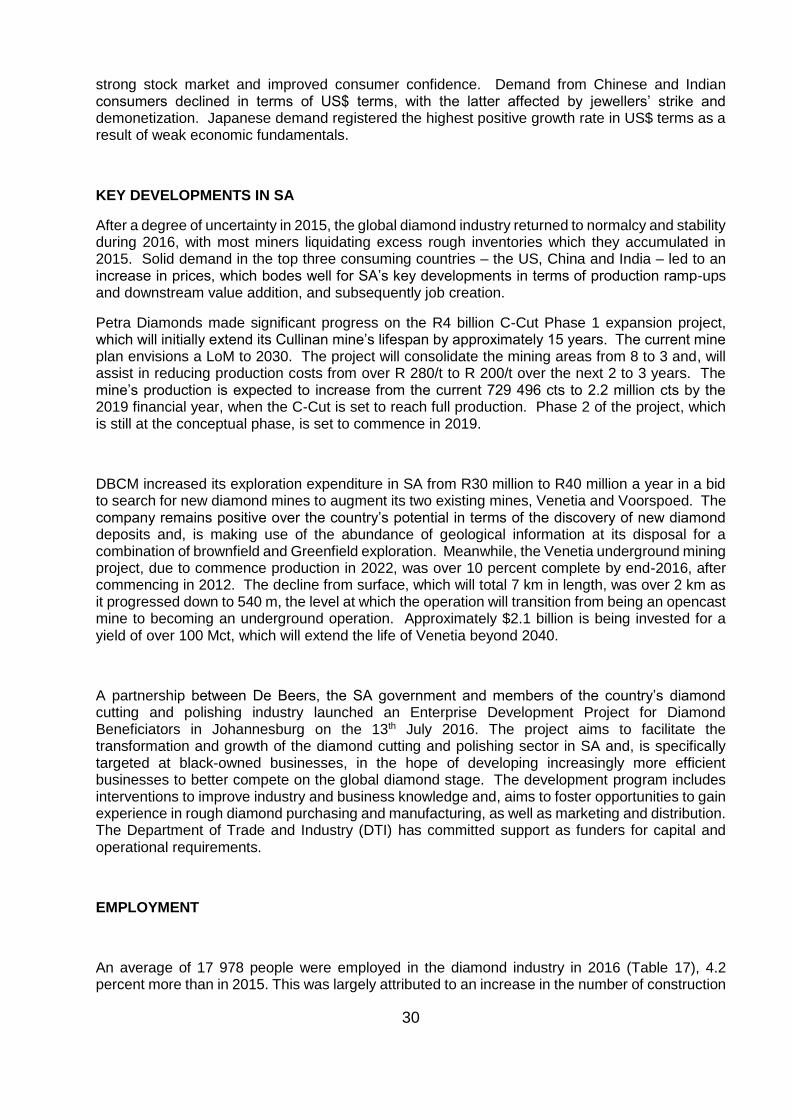
30
strong stock market and improved consumer confidence. Demand from Chinese and Indian consumers declined in terms of US$ terms, with the latter affected by jewellers’ strike and demonetization. Japanese demand registered the highest positive growth rate in US$ terms as a result of weak economic fundamentals.
KEY DEVELOPMENTS IN SA
After a degree of uncertainty in 2015, the global diamond industry returned to normalcy and stability during 2016, with most miners liquidating excess rough inventories which they accumulated in 2015. Solid demand in the top three consuming countries – the US, China and India – led to an increase in prices, which bodes well for SA’s key developments in terms of production ramp-ups and downstream value addition, and subsequently job creation.
Petra Diamonds made significant progress on the R4 billion C-Cut Phase 1 expansion project, which will initially extend its Cullinan mine’s lifespan by approximately 15 years. The current mine plan envisions a LoM to 2030. The project will consolidate the mining areas from 8 to 3 and, will assist in reducing production costs from over R 280/t to R 200/t over the next 2 to 3 years. The mine’s production is expected to increase from the current 729 496 cts to 2.2 million cts by the 2019 financial year, when the C-Cut is set to reach full production. Phase 2 of the project, which is still at the conceptual phase, is set to commence in 2019.
DBCM increased its exploration expenditure in SA from R30 million to R40 million a year in a bid to search for new diamond mines to augment its two existing mines, Venetia and Voorspoed. The company remains positive over the country’s potential in terms of the discovery of new diamond deposits and, is making use of the abundance of geological information at its disposal for a combination of brownfield and Greenfield exploration. Meanwhile, the Venetia underground mining project, due to commence production in 2022, was over 10 percent complete by end-2016, after commencing in 2012. The decline from surface, which will total 7 km in length, was over 2 km as it progressed down to 540 m, the level at which the operation will transition from being an opencast mine to becoming an underground operation. Approximately $2.1 billion is being invested for a yield of over 100 Mct, which will extend the life of Venetia beyond 2040.
A partnership between De Beers, the SA government and members of the country’s diamond cutting and polishing industry launched an Enterprise Development Project for Diamond Beneficiators in Johannesburg on the 13th July 2016. The project aims to facilitate the transformation and growth of the diamond cutting and polishing sector in SA and, is specifically targeted at black-owned businesses, in the hope of developing increasingly more efficient businesses to better compete on the global diamond stage. The development program includes interventions to improve industry and business knowledge and, aims to foster opportunities to gain experience in rough diamond purchasing and manufacturing, as well as marketing and distribution. The Department of Trade and Industry (DTI) has committed support as funders for capital and operational requirements.
EMPLOYMENT
An average of 17 978 people were employed in the diamond industry in 2016 (Table 17), 4.2 percent more than in 2015. This was largely attributed to an increase in the number of construction
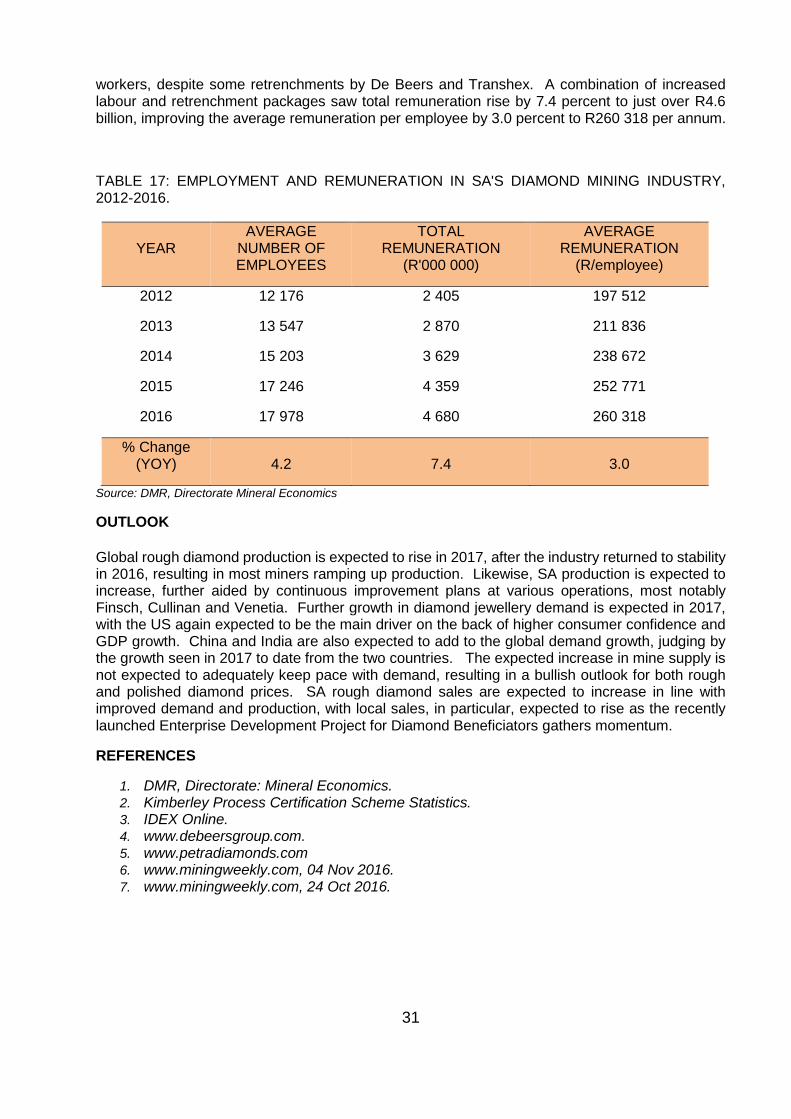
31
workers, despite some retrenchments by De Beers and Transhex. A combination of increased labour and retrenchment packages saw total remuneration rise by 7.4 percent to just over R4.6 billion, improving the average remuneration per employee by 3.0 percent to R260 318 per annum.
TABLE 17: EMPLOYMENT AND REMUNERATION IN SA'S DIAMOND MINING INDUSTRY, 2012-2016.
YEAR AVERAGE
NUMBER OF EMPLOYEES
TOTAL REMUNERATION
(R'000 000)
AVERAGE REMUNERATION
(R/employee)
2012 12 176 2 405 197 512
2013 13 547 2 870 211 836
2014 15 203 3 629 238 672
2015 17 246 4 359 252 771
2016 17 978 4 680 260 318
% Change (YOY) 4.2 7.4 3.0
Source: DMR, Directorate Mineral Economics
OUTLOOK
Global rough diamond production is expected to rise in 2017, after the industry returned to stability in 2016, resulting in most miners ramping up production. Likewise, SA production is expected to increase, further aided by continuous improvement plans at various operations, most notably Finsch, Cullinan and Venetia. Further growth in diamond jewellery demand is expected in 2017, with the US again expected to be the main driver on the back of higher consumer confidence and GDP growth. China and India are also expected to add to the global demand growth, judging by the growth seen in 2017 to date from the two countries. The expected increase in mine supply is not expected to adequately keep pace with demand, resulting in a bullish outlook for both rough and polished diamond prices. SA rough diamond sales are expected to increase in line with improved demand and production, with local sales, in particular, expected to rise as the recently launched Enterprise Development Project for Diamond Beneficiators gathers momentum.
REFERENCES
1. DMR, Directorate: Mineral Economics. 2. Kimberley Process Certification Scheme Statistics. 3. IDEX Online. 4. www.debeersgroup.com. 5. www.petradiamonds.com 6. www.miningweekly.com, 04 Nov 2016. 7. www.miningweekly.com, 24 Oct 2016.
32
GOLD
P J Perold
SUPPLY- DEMAND
Total world gold supply which includes mine production, scrap supply and producer hedging increased by 2.5 percent from 4 395.1 tons (t) in 2015 to 4 503 t in 2016. Mine production at 71.4 percent contributed largely to world gold production, followed by scrap supply and producer hedging at 28.2 percent and 0.5 percent, respectively (Figure 6). Mine production increased by 0.4 percent to 3 214 t, while scrap supply increased by 8.2 percent. This resulted in a 10.0 percent increase in producer hedging which stood on the supply-side of the market for the 3rd consecutive year. In 2016, roughly 77 international gold-producing companies entered a modest currency denominated gold hedge (most notably the Australian dollar (A$ based)).
FIGURE 6: GLOBAL GOLD MINE SUPPLY, 2016.
Source: Klapwijk, et al, 2017, pp 11-12
Adjusted Global Fig: DMR Statistics Sub-Directorate, 2017
China remained the largest gold producer, contributing 14.1 percent to world production, followed by Australia and Russia, at 9.0 percent and 7.9 percent, respectively. South Africa’s (SA) gold production decreased by 1.6 percent, from 144.5 t in 2015 to 142.2 t in 2016, contributing roughly 4.4 percent to global production, falling to 8th place in global ranking (Figure 7). The country’s gold production has been on a declining trend for more than a decade, due to lower grades, challenges in deep-level mining, care and maintenance of shafts as well as reduction in the recovery of scrap-gold.
71.4 %
28.2 %
0.5 %
Mine production (MB) Old gold scrap Net hedging supply
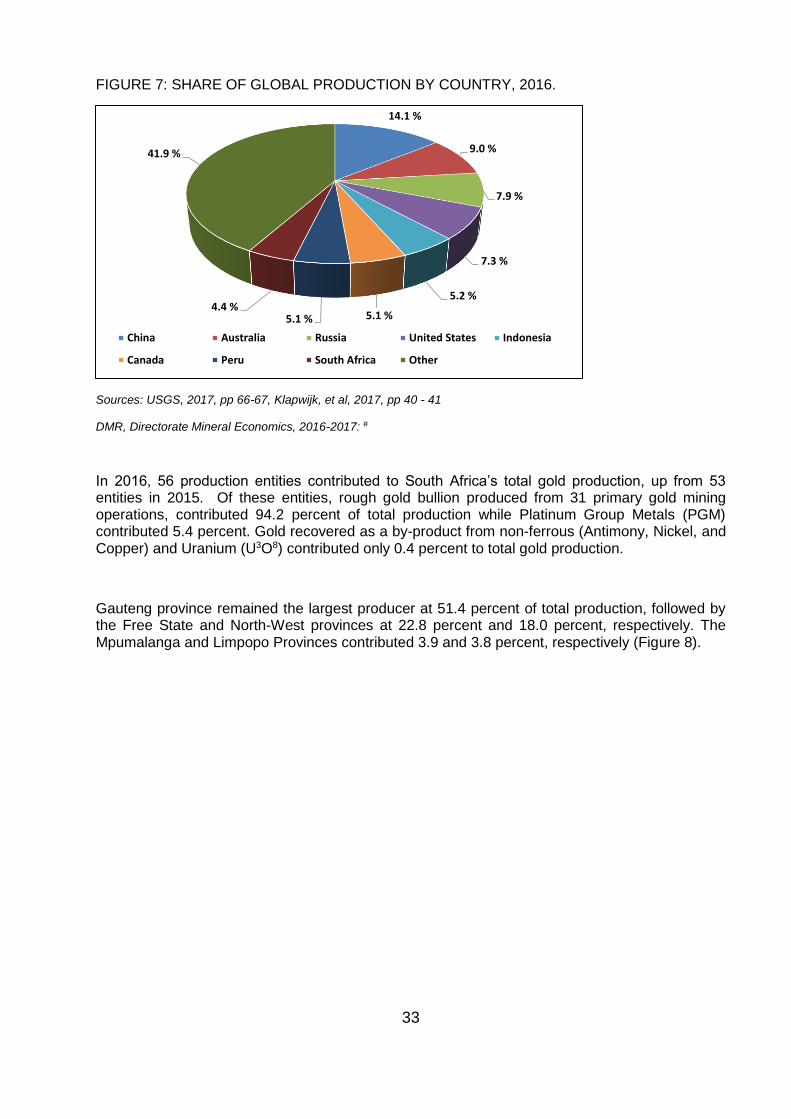
33
FIGURE 7: SHARE OF GLOBAL PRODUCTION BY COUNTRY, 2016.
Sources: USGS, 2017, pp 66-67, Klapwijk, et al, 2017, pp 40 - 41
DMR, Directorate Mineral Economics, 2016-2017: #
In 2016, 56 production entities contributed to South Africa’s total gold production, up from 53 entities in 2015. Of these entities, rough gold bullion produced from 31 primary gold mining operations, contributed 94.2 percent of total production while Platinum Group Metals (PGM) contributed 5.4 percent. Gold recovered as a by-product from non-ferrous (Antimony, Nickel, and Copper) and Uranium (U3O8) contributed only 0.4 percent to total gold production.
Gauteng province remained the largest producer at 51.4 percent of total production, followed by the Free State and North-West provinces at 22.8 percent and 18.0 percent, respectively. The Mpumalanga and Limpopo Provinces contributed 3.9 and 3.8 percent, respectively (Figure 8).
14.1 %
9.0 %
7.9 %
7.3 %
5.2 %
5.1 %5.1 %4.4 %
41.9 %
China Australia Russia United States Indonesia
Canada Peru South Africa Other
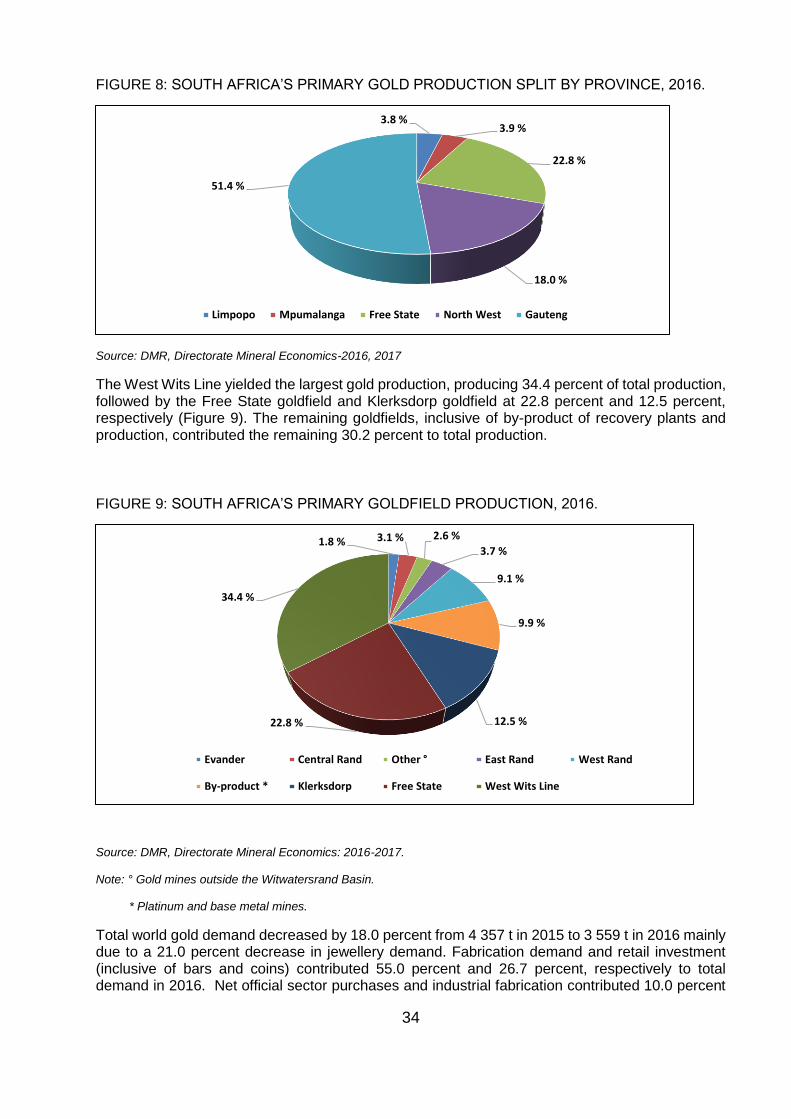
34
FIGURE 8: SOUTH AFRICA’S PRIMARY GOLD PRODUCTION SPLIT BY PROVINCE, 2016.
Source: DMR, Directorate Mineral Economics-2016, 2017
The West Wits Line yielded the largest gold production, producing 34.4 percent of total production, followed by the Free State goldfield and Klerksdorp goldfield at 22.8 percent and 12.5 percent, respectively (Figure 9). The remaining goldfields, inclusive of by-product of recovery plants and production, contributed the remaining 30.2 percent to total production.
FIGURE 9: SOUTH AFRICA’S PRIMARY GOLDFIELD PRODUCTION, 2016.
Source: DMR, Directorate Mineral Economics: 2016-2017.
Note: ° Gold mines outside the Witwatersrand Basin.
* Platinum and base metal mines.
Total world gold demand decreased by 18.0 percent from 4 357 t in 2015 to 3 559 t in 2016 mainly due to a 21.0 percent decrease in jewellery demand. Fabrication demand and retail investment (inclusive of bars and coins) contributed 55.0 percent and 26.7 percent, respectively to total demand in 2016. Net official sector purchases and industrial fabrication contributed 10.0 percent
3.8 %3.9 %
22.8 %
18.0 %
51.4 %
Limpopo Mpumalanga Free State North West Gauteng
1.8 % 3.1 % 2.6 %
3.7 %
9.1 %
9.9 %
12.5 %22.8 %
34.4 %
Evander Central Rand Other ° East Rand West Rand
By-product * Klerksdorp Free State West Wits Line
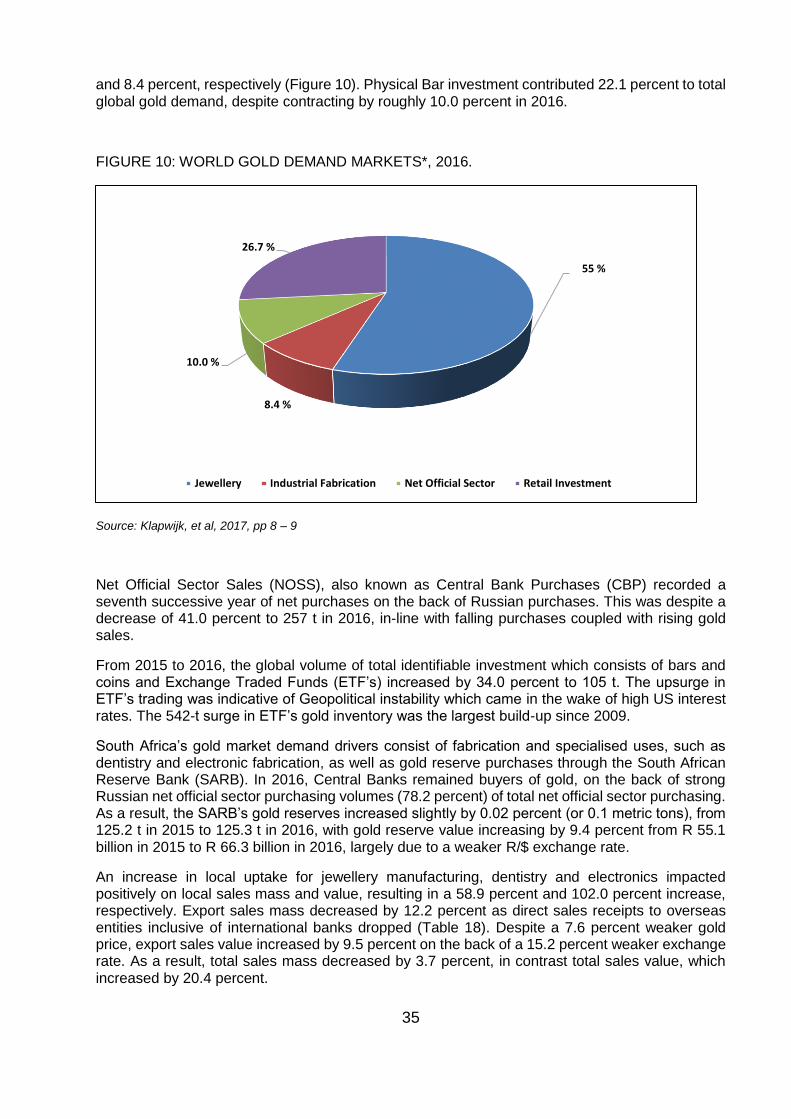
35
and 8.4 percent, respectively (Figure 10). Physical Bar investment contributed 22.1 percent to total global gold demand, despite contracting by roughly 10.0 percent in 2016.
FIGURE 10: WORLD GOLD DEMAND MARKETS*, 2016.
Source: Klapwijk, et al, 2017, pp 8 – 9
Net Official Sector Sales (NOSS), also known as Central Bank Purchases (CBP) recorded a seventh successive year of net purchases on the back of Russian purchases. This was despite a decrease of 41.0 percent to 257 t in 2016, in-line with falling purchases coupled with rising gold sales.
From 2015 to 2016, the global volume of total identifiable investment which consists of bars and coins and Exchange Traded Funds (ETF’s) increased by 34.0 percent to 105 t. The upsurge in ETF’s trading was indicative of Geopolitical instability which came in the wake of high US interest rates. The 542-t surge in ETF’s gold inventory was the largest build-up since 2009.
South Africa’s gold market demand drivers consist of fabrication and specialised uses, such as dentistry and electronic fabrication, as well as gold reserve purchases through the South African Reserve Bank (SARB). In 2016, Central Banks remained buyers of gold, on the back of strong Russian net official sector purchasing volumes (78.2 percent) of total net official sector purchasing. As a result, the SARB’s gold reserves increased slightly by 0.02 percent (or 0.1 metric tons), from 125.2 t in 2015 to 125.3 t in 2016, with gold reserve value increasing by 9.4 percent from R 55.1 billion in 2015 to R 66.3 billion in 2016, largely due to a weaker R/$ exchange rate.
An increase in local uptake for jewellery manufacturing, dentistry and electronics impacted positively on local sales mass and value, resulting in a 58.9 percent and 102.0 percent increase, respectively. Export sales mass decreased by 12.2 percent as direct sales receipts to overseas entities inclusive of international banks dropped (Table 18). Despite a 7.6 percent weaker gold price, export sales value increased by 9.5 percent on the back of a 15.2 percent weaker exchange rate. As a result, total sales mass decreased by 3.7 percent, in contrast total sales value, which increased by 20.4 percent.
55 %
8.4 %
10.0 %
26.7 %
Jewellery Industrial Fabrication Net Official Sector Retail Investment
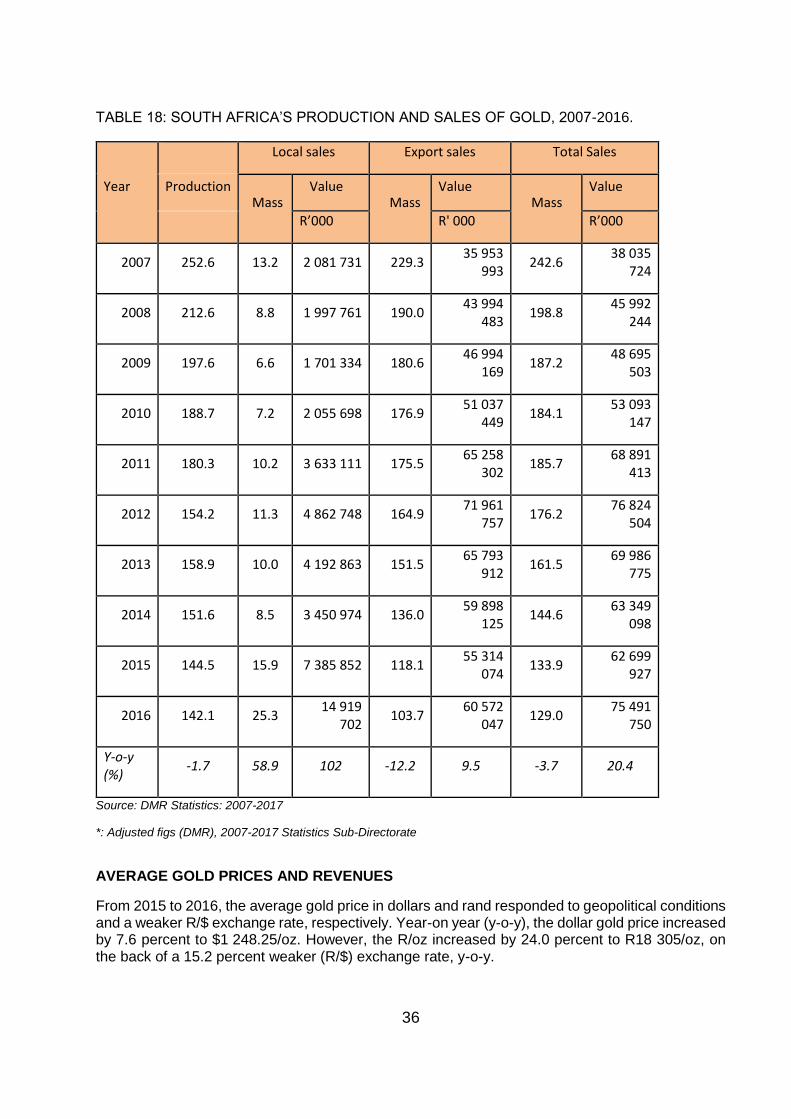
36
TABLE 18: SOUTH AFRICA’S PRODUCTION AND SALES OF GOLD, 2007-2016.
Year
Local sales Export sales Total Sales
Production Mass
Value Mass
Value Mass
Value
R’000 R' 000 R’000
2007 252.6 13.2 2 081 731 229.3 35 953
993 242.6
38 035 724
2008 212.6 8.8 1 997 761 190.0 43 994
483 198.8
45 992 244
2009 197.6 6.6 1 701 334 180.6 46 994
169 187.2
48 695 503
2010 188.7 7.2 2 055 698 176.9 51 037
449 184.1
53 093 147
2011 180.3 10.2 3 633 111 175.5 65 258
302 185.7
68 891 413
2012 154.2 11.3 4 862 748 164.9 71 961
757 176.2
76 824 504
2013 158.9 10.0 4 192 863 151.5 65 793
912 161.5
69 986 775
2014 151.6 8.5 3 450 974 136.0 59 898
125 144.6
63 349 098
2015 144.5 15.9 7 385 852 118.1 55 314
074 133.9
62 699 927
2016 142.1 25.3 14 919
702 103.7
60 572 047
129.0 75 491
750
Y-o-y (%)
-1.7 58.9 102 -12.2 9.5 -3.7 20.4
Source: DMR Statistics: 2007-2017
*: Adjusted figs (DMR), 2007-2017 Statistics Sub-Directorate
AVERAGE GOLD PRICES AND REVENUES
From 2015 to 2016, the average gold price in dollars and rand responded to geopolitical conditions and a weaker R/$ exchange rate, respectively. Year-on year (y-o-y), the dollar gold price increased by 7.6 percent to $1 248.25/oz. However, the R/oz increased by 24.0 percent to R18 305/oz, on the back of a 15.2 percent weaker (R/$) exchange rate, y-o-y.
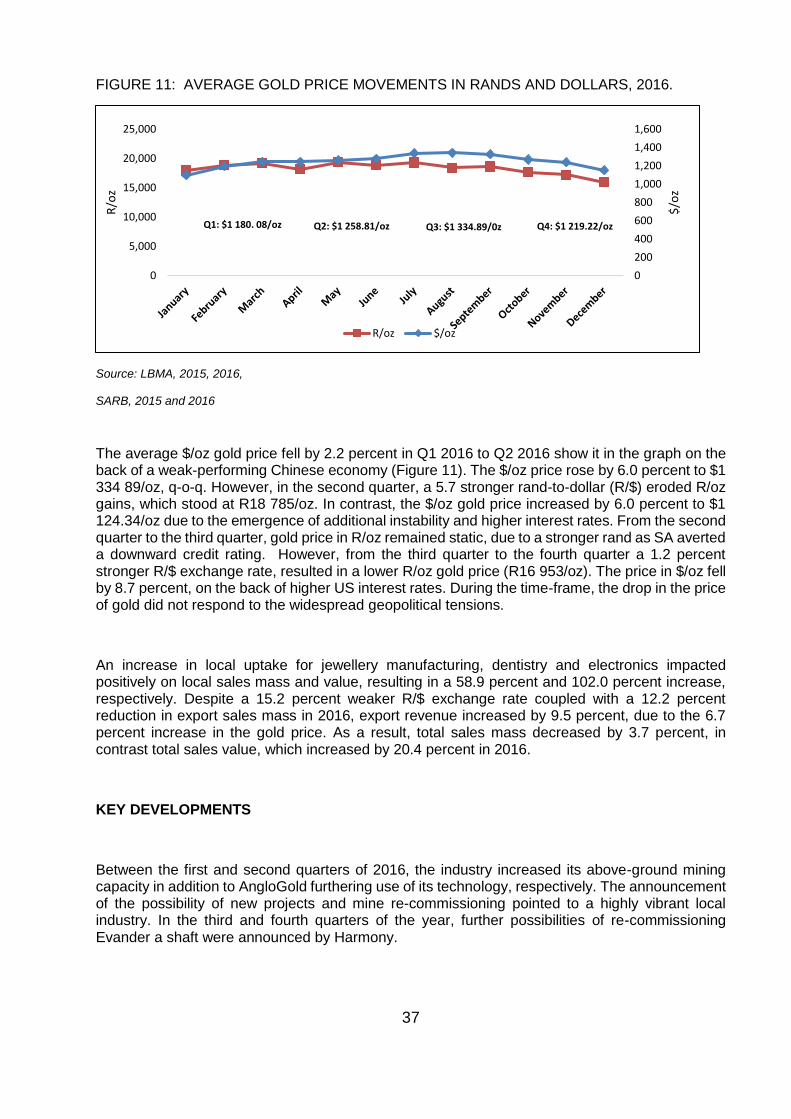
37
FIGURE 11: AVERAGE GOLD PRICE MOVEMENTS IN RANDS AND DOLLARS, 2016.
Source: LBMA, 2015, 2016,
SARB, 2015 and 2016
The average $/oz gold price fell by 2.2 percent in Q1 2016 to Q2 2016 show it in the graph on the back of a weak-performing Chinese economy (Figure 11). The $/oz price rose by 6.0 percent to $1 334 89/oz, q-o-q. However, in the second quarter, a 5.7 stronger rand-to-dollar (R/$) eroded R/oz gains, which stood at R18 785/oz. In contrast, the $/oz gold price increased by 6.0 percent to $1 124.34/oz due to the emergence of additional instability and higher interest rates. From the second quarter to the third quarter, gold price in R/oz remained static, due to a stronger rand as SA averted a downward credit rating. However, from the third quarter to the fourth quarter a 1.2 percent stronger R/$ exchange rate, resulted in a lower R/oz gold price (R16 953/oz). The price in $/oz fell by 8.7 percent, on the back of higher US interest rates. During the time-frame, the drop in the price of gold did not respond to the widespread geopolitical tensions.
An increase in local uptake for jewellery manufacturing, dentistry and electronics impacted positively on local sales mass and value, resulting in a 58.9 percent and 102.0 percent increase, respectively. Despite a 15.2 percent weaker R/$ exchange rate coupled with a 12.2 percent reduction in export sales mass in 2016, export revenue increased by 9.5 percent, due to the 6.7 percent increase in the gold price. As a result, total sales mass decreased by 3.7 percent, in contrast total sales value, which increased by 20.4 percent in 2016.
KEY DEVELOPMENTS
Between the first and second quarters of 2016, the industry increased its above-ground mining capacity in addition to AngloGold furthering use of its technology, respectively. The announcement of the possibility of new projects and mine re-commissioning pointed to a highly vibrant local industry. In the third and fourth quarters of the year, further possibilities of re-commissioning Evander a shaft were announced by Harmony.
0
200
400
600
800
1,000
1,200
1,400
1,600
0
5,000
10,000
15,000
20,000
25,000
$/o
z
R/o
z
R/oz $/oz
Q1: $1 180. 08/oz Q2: $1 258.81/oz Q3: $1 334.89/0z Q4: $1 219.22/oz
38
South Africa’s biggest above-ground reclamation producer, DRDGold announced on 18 April 2016 that it had successfully increased its deposition capacity from 200 million tons to 800 million tonnes. The company has resources of 10.8 million oz of gold in mine waste and processed 24 million tonnes of ore in the preceding year.
AngloGold Ashanti announced on 01 May 2016, the development of new reef-boring technology to access ore. This method only extracts the gold ore before filling the hole with cement and chemicals to prevent collapse of the structure. Thus far a company had invested more than R1.4 billion in the project and it is expected to yield more than 20 000 ounces (oz) of gold in 2016.
Despite weathering a weak performance, Harmony announced early in the second quarter of 2016 that it will re-commission a previously decommissioned shaft after dewatering has been completed. The main ventilation shaft will be deepened to roughly 2 340 metres (m). In addition, a metallurgical plant will be constructed in the next year to process ore from underground mining.
During the third quarter of 2016, a UK-listed producer approved a new surface gold mining project, Elikhulu valued at R1.7 billion (bn.). If approved, the project could increase group output to 250 000 oz/y for the first eight years of its life.
EMPLOYMENT
Total employment in the gold mining sector increased by 1.1 percent from 115 055 in 2015 to 116 299 in 2016 (Table 19). This was supported by a 12.5 percent and 24.0 percent increase in the employment of contractors in the second and third quarters of 2016, respectively. Male and female employment increased by 0.8 percent and 3.8 percent, despite retrenchments at Kloof, West Wits and Sibanye’s shafts throughout 2016. Total remuneration increased by 4.1 percent, in-line with the increase in the employment of contractors. Female remuneration increased by 38.2 percent due to an increase in the number of jobs.
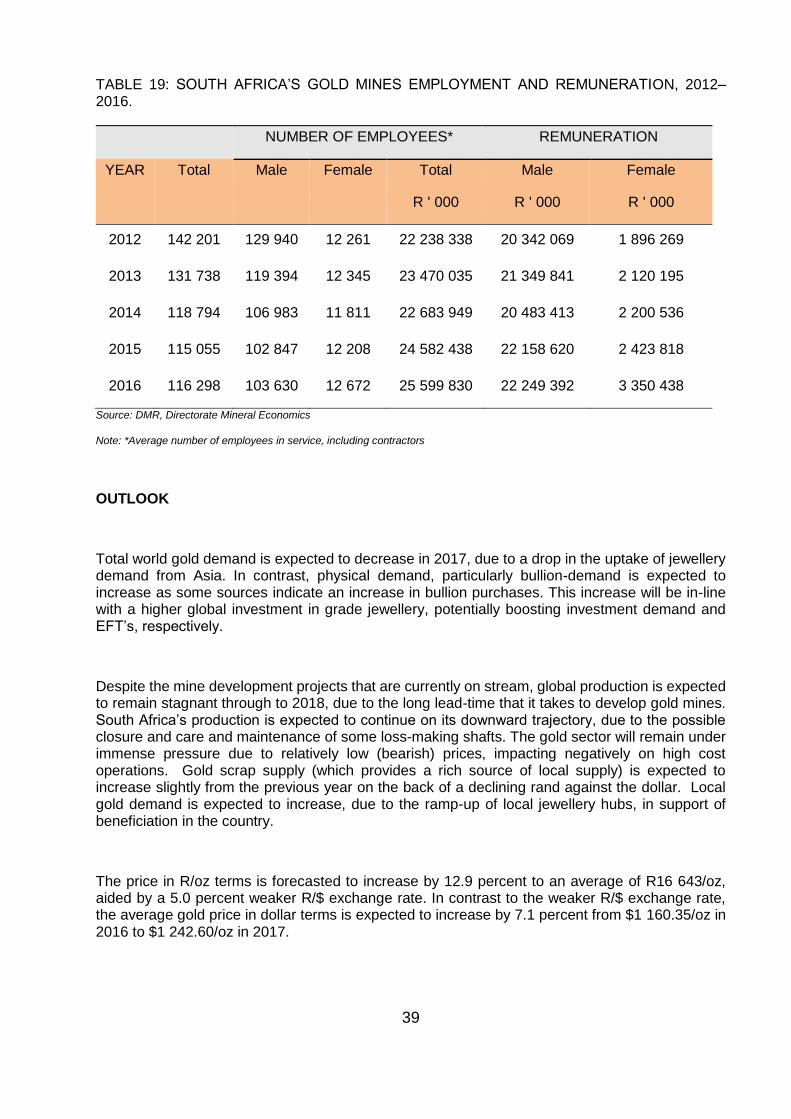
39
TABLE 19: SOUTH AFRICA’S GOLD MINES EMPLOYMENT AND REMUNERATION, 2012–2016.
NUMBER OF EMPLOYEES* REMUNERATION
YEAR Total Male Female Total Male Female
R ' 000 R ' 000 R ' 000
2012 142 201 129 940 12 261 22 238 338 20 342 069 1 896 269
2013 131 738 119 394 12 345 23 470 035 21 349 841 2 120 195
2014 118 794 106 983 11 811 22 683 949 20 483 413 2 200 536
2015 115 055 102 847 12 208 24 582 438 22 158 620 2 423 818
2016 116 298 103 630 12 672 25 599 830 22 249 392 3 350 438
Source: DMR, Directorate Mineral Economics
Note: *Average number of employees in service, including contractors
OUTLOOK
Total world gold demand is expected to decrease in 2017, due to a drop in the uptake of jewellery demand from Asia. In contrast, physical demand, particularly bullion-demand is expected to increase as some sources indicate an increase in bullion purchases. This increase will be in-line with a higher global investment in grade jewellery, potentially boosting investment demand and EFT’s, respectively.
Despite the mine development projects that are currently on stream, global production is expected to remain stagnant through to 2018, due to the long lead-time that it takes to develop gold mines. South Africa’s production is expected to continue on its downward trajectory, due to the possible closure and care and maintenance of some loss-making shafts. The gold sector will remain under immense pressure due to relatively low (bearish) prices, impacting negatively on high cost operations. Gold scrap supply (which provides a rich source of local supply) is expected to increase slightly from the previous year on the back of a declining rand against the dollar. Local gold demand is expected to increase, due to the ramp-up of local jewellery hubs, in support of beneficiation in the country.
The price in R/oz terms is forecasted to increase by 12.9 percent to an average of R16 643/oz, aided by a 5.0 percent weaker R/$ exchange rate. In contrast to the weaker R/$ exchange rate, the average gold price in dollar terms is expected to increase by 7.1 percent from $1 160.35/oz in 2016 to $1 242.60/oz in 2017.
40
REFERENCES
1. DMR, Directorate Mineral Economics Statistics Sub-Directorate
2. Klapwijk P, Walker P, et al, 2016. Gold Survey 2017; GFMS Ltd, London, 121 pp
3. London Bullion Market Association, 2017. Internet Website:
4. South African Reserve Bank, 2016, 2017. Internet Website: http://www.reservebank.co.za/internet/publication.nsf/
5. US Geological Survey, 2017. Mineral Commodity Summaries, 2017: Internet Website: http://minerals.usgs.gov/minerals/pubs/commodity/gold/mcs-2017-gold.pdf
6. DMR, quarterly reports, 2017
7. https://www.marketslant.com/articles/gold-price-forecasts-2017-and-2018-research-report
8. https://www.ft.com/content/53893bfa-8bfe-11de-b14f-00144feabdc0
9. http://news.goldseek.com/GoldSeek/1505654915.php
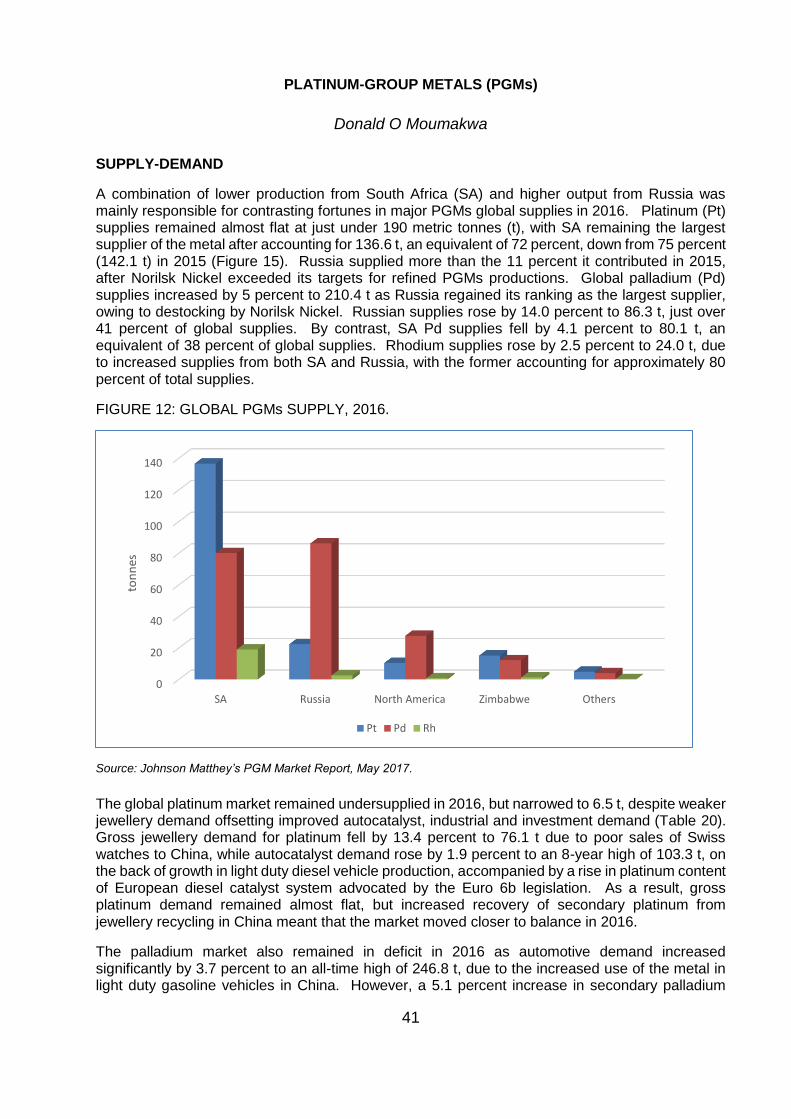
41
PLATINUM-GROUP METALS (PGMs)
Donald O Moumakwa
SUPPLY-DEMAND
A combination of lower production from South Africa (SA) and higher output from Russia was mainly responsible for contrasting fortunes in major PGMs global supplies in 2016. Platinum (Pt) supplies remained almost flat at just under 190 metric tonnes (t), with SA remaining the largest supplier of the metal after accounting for 136.6 t, an equivalent of 72 percent, down from 75 percent (142.1 t) in 2015 (Figure 15). Russia supplied more than the 11 percent it contributed in 2015, after Norilsk Nickel exceeded its targets for refined PGMs productions. Global palladium (Pd) supplies increased by 5 percent to 210.4 t as Russia regained its ranking as the largest supplier, owing to destocking by Norilsk Nickel. Russian supplies rose by 14.0 percent to 86.3 t, just over 41 percent of global supplies. By contrast, SA Pd supplies fell by 4.1 percent to 80.1 t, an equivalent of 38 percent of global supplies. Rhodium supplies rose by 2.5 percent to 24.0 t, due to increased supplies from both SA and Russia, with the former accounting for approximately 80 percent of total supplies.
FIGURE 12: GLOBAL PGMs SUPPLY, 2016.
Source: Johnson Matthey’s PGM Market Report, May 2017.
The global platinum market remained undersupplied in 2016, but narrowed to 6.5 t, despite weaker jewellery demand offsetting improved autocatalyst, industrial and investment demand (Table 20). Gross jewellery demand for platinum fell by 13.4 percent to 76.1 t due to poor sales of Swiss watches to China, while autocatalyst demand rose by 1.9 percent to an 8-year high of 103.3 t, on the back of growth in light duty diesel vehicle production, accompanied by a rise in platinum content of European diesel catalyst system advocated by the Euro 6b legislation. As a result, gross platinum demand remained almost flat, but increased recovery of secondary platinum from jewellery recycling in China meant that the market moved closer to balance in 2016.
The palladium market also remained in deficit in 2016 as automotive demand increased significantly by 3.7 percent to an all-time high of 246.8 t, due to the increased use of the metal in light duty gasoline vehicles in China. However, a 5.1 percent increase in secondary palladium
0
20
40
60
80
100
120
140
SA Russia North America Zimbabwe Others
ton
nes
Pt Pd Rh
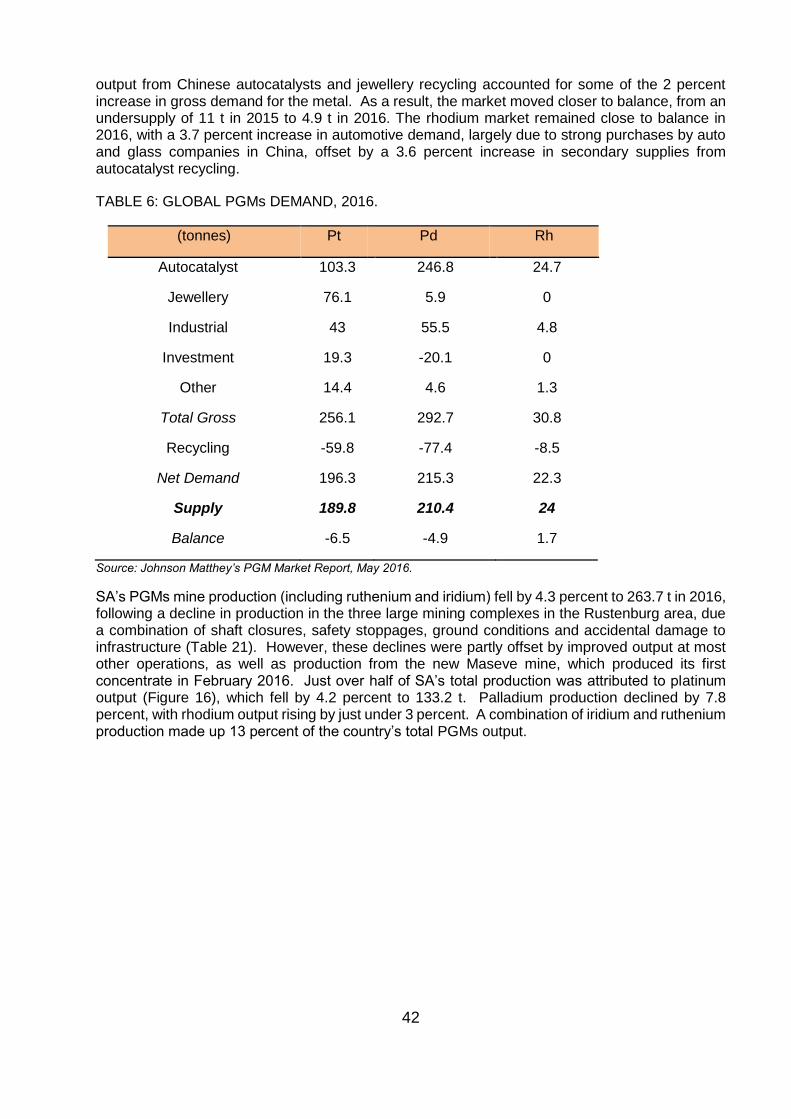
42
output from Chinese autocatalysts and jewellery recycling accounted for some of the 2 percent increase in gross demand for the metal. As a result, the market moved closer to balance, from an undersupply of 11 t in 2015 to 4.9 t in 2016. The rhodium market remained close to balance in 2016, with a 3.7 percent increase in automotive demand, largely due to strong purchases by auto and glass companies in China, offset by a 3.6 percent increase in secondary supplies from autocatalyst recycling.
TABLE 6: GLOBAL PGMs DEMAND, 2016.
(tonnes) Pt Pd Rh
Autocatalyst 103.3 246.8 24.7
Jewellery 76.1 5.9 0
Industrial 43 55.5 4.8
Investment 19.3 -20.1 0
Other 14.4 4.6 1.3
Total Gross 256.1 292.7 30.8
Recycling -59.8 -77.4 -8.5
Net Demand 196.3 215.3 22.3
Supply 189.8 210.4 24
Balance -6.5 -4.9 1.7
Source: Johnson Matthey’s PGM Market Report, May 2016.
SA’s PGMs mine production (including ruthenium and iridium) fell by 4.3 percent to 263.7 t in 2016, following a decline in production in the three large mining complexes in the Rustenburg area, due a combination of shaft closures, safety stoppages, ground conditions and accidental damage to infrastructure (Table 21). However, these declines were partly offset by improved output at most other operations, as well as production from the new Maseve mine, which produced its first concentrate in February 2016. Just over half of SA’s total production was attributed to platinum output (Figure 16), which fell by 4.2 percent to 133.2 t. Palladium production declined by 7.8 percent, with rhodium output rising by just under 3 percent. A combination of iridium and ruthenium production made up 13 percent of the country’s total PGMs output.
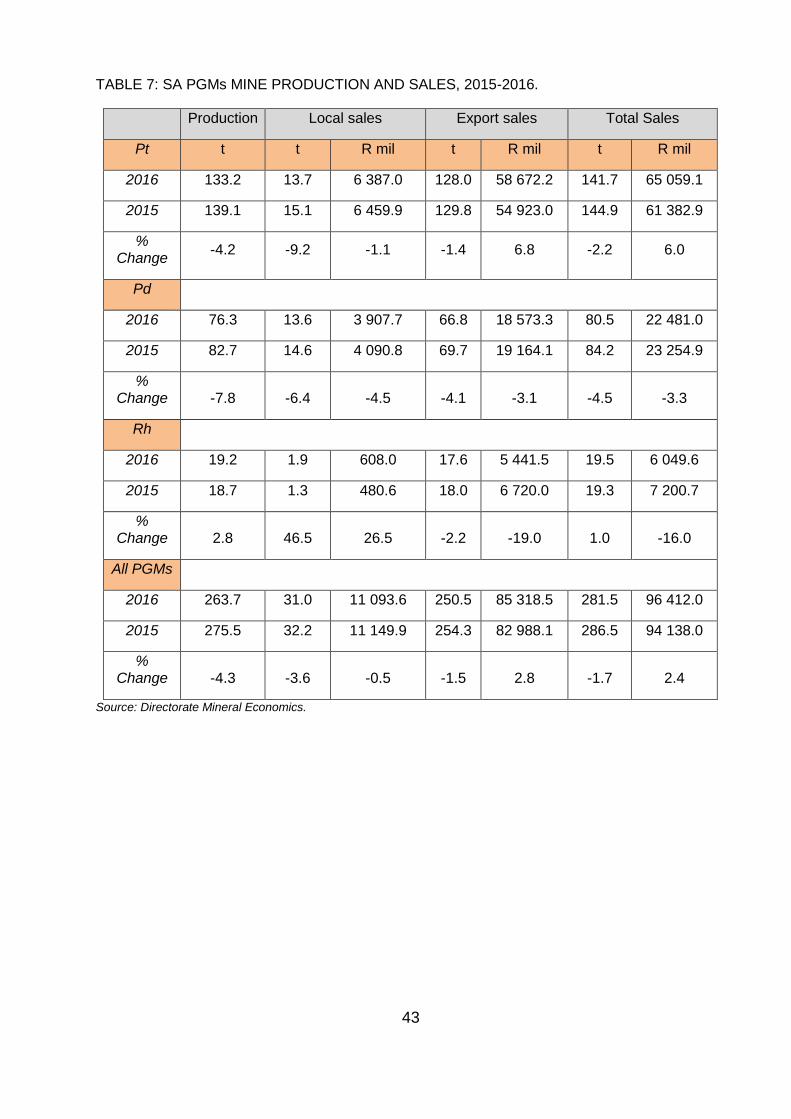
43
TABLE 7: SA PGMs MINE PRODUCTION AND SALES, 2015-2016.
Production Local sales Export sales Total Sales
Pt t t R mil t R mil t R mil
2016 133.2 13.7 6 387.0 128.0 58 672.2 141.7 65 059.1
2015 139.1 15.1 6 459.9 129.8 54 923.0 144.9 61 382.9
% Change
-4.2 -9.2 -1.1 -1.4 6.8 -2.2 6.0
Pd
2016 76.3 13.6 3 907.7 66.8 18 573.3 80.5 22 481.0
2015 82.7 14.6 4 090.8 69.7 19 164.1 84.2 23 254.9
% Change -7.8 -6.4 -4.5 -4.1 -3.1 -4.5 -3.3
Rh
2016 19.2 1.9 608.0 17.6 5 441.5 19.5 6 049.6
2015 18.7 1.3 480.6 18.0 6 720.0 19.3 7 200.7
% Change 2.8 46.5 26.5 -2.2 -19.0 1.0 -16.0
All PGMs
2016 263.7 31.0 11 093.6 250.5 85 318.5 281.5 96 412.0
2015 275.5 32.2 11 149.9 254.3 82 988.1 286.5 94 138.0
% Change -4.3 -3.6 -0.5 -1.5 2.8 -1.7 2.4
Source: Directorate Mineral Economics.
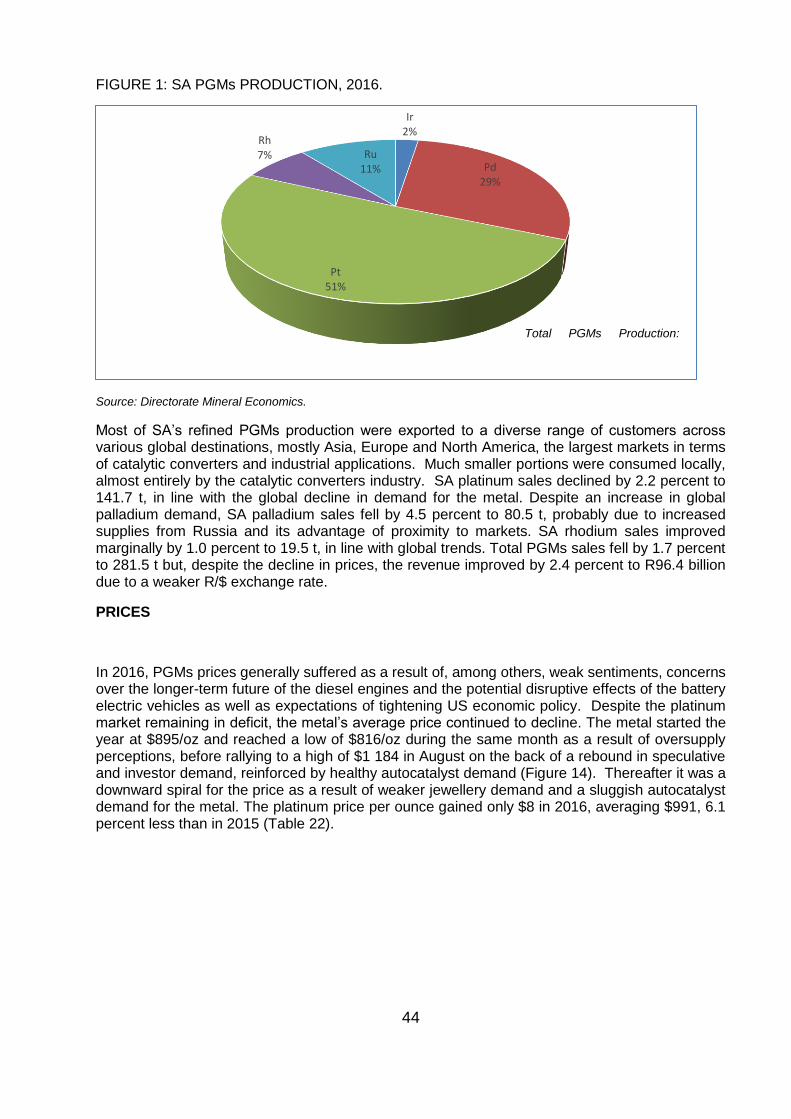
44
FIGURE 1: SA PGMs PRODUCTION, 2016.
Source: Directorate Mineral Economics.
Most of SA’s refined PGMs production were exported to a diverse range of customers across various global destinations, mostly Asia, Europe and North America, the largest markets in terms of catalytic converters and industrial applications. Much smaller portions were consumed locally, almost entirely by the catalytic converters industry. SA platinum sales declined by 2.2 percent to 141.7 t, in line with the global decline in demand for the metal. Despite an increase in global palladium demand, SA palladium sales fell by 4.5 percent to 80.5 t, probably due to increased supplies from Russia and its advantage of proximity to markets. SA rhodium sales improved marginally by 1.0 percent to 19.5 t, in line with global trends. Total PGMs sales fell by 1.7 percent to 281.5 t but, despite the decline in prices, the revenue improved by 2.4 percent to R96.4 billion due to a weaker R/$ exchange rate.
PRICES
In 2016, PGMs prices generally suffered as a result of, among others, weak sentiments, concerns over the longer-term future of the diesel engines and the potential disruptive effects of the battery electric vehicles as well as expectations of tightening US economic policy. Despite the platinum market remaining in deficit, the metal’s average price continued to decline. The metal started the year at $895/oz and reached a low of $816/oz during the same month as a result of oversupply perceptions, before rallying to a high of $1 184 in August on the back of a rebound in speculative and investor demand, reinforced by healthy autocatalyst demand (Figure 14). Thereafter it was a downward spiral for the price as a result of weaker jewellery demand and a sluggish autocatalyst demand for the metal. The platinum price per ounce gained only $8 in 2016, averaging $991, 6.1 percent less than in 2015 (Table 22).
Ir2%
Pd29%
Pt51%
Rh7% Ru
11%
Total PGMs Production: 263.7 t
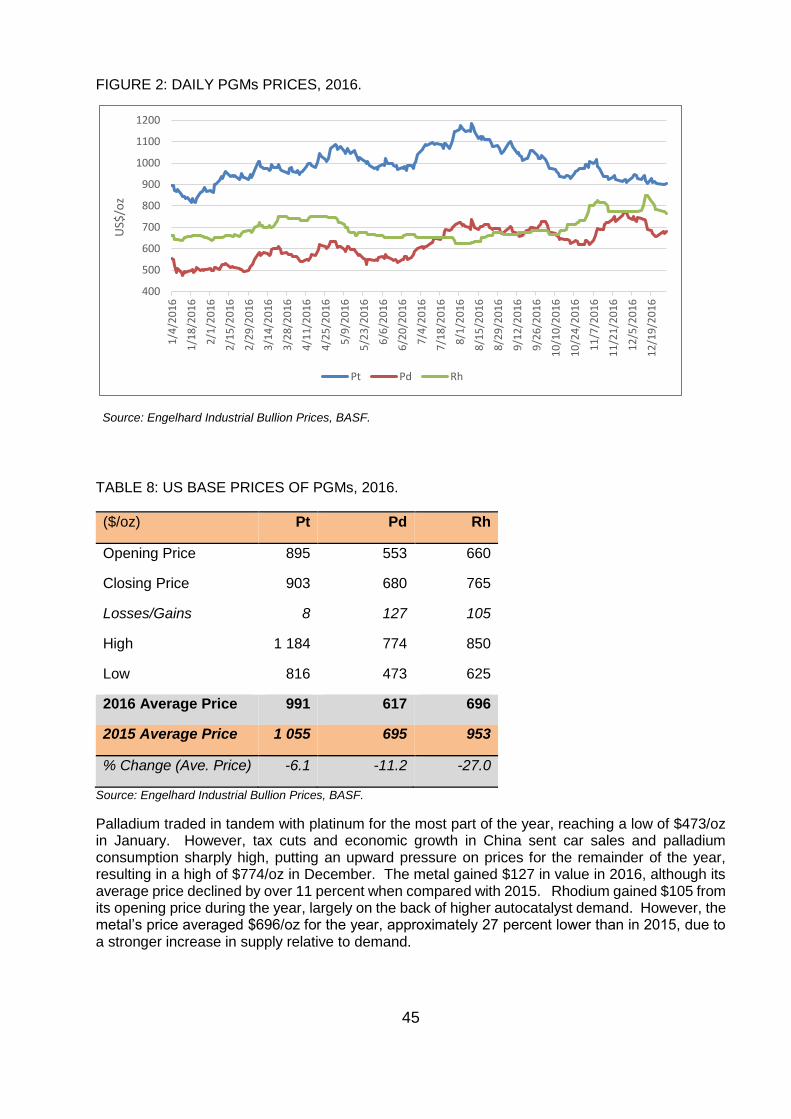
45
FIGURE 2: DAILY PGMs PRICES, 2016.
Source: Engelhard Industrial Bullion Prices, BASF.
TABLE 8: US BASE PRICES OF PGMs, 2016.
($/oz) Pt Pd Rh
Opening Price 895 553 660
Closing Price 903 680 765
Losses/Gains 8 127 105
High 1 184 774 850
Low 816 473 625
2016 Average Price 991 617 696
2015 Average Price 1 055 695 953
% Change (Ave. Price) -6.1 -11.2 -27.0
Source: Engelhard Industrial Bullion Prices, BASF.
Palladium traded in tandem with platinum for the most part of the year, reaching a low of $473/oz in January. However, tax cuts and economic growth in China sent car sales and palladium consumption sharply high, putting an upward pressure on prices for the remainder of the year, resulting in a high of $774/oz in December. The metal gained $127 in value in 2016, although its average price declined by over 11 percent when compared with 2015. Rhodium gained $105 from its opening price during the year, largely on the back of higher autocatalyst demand. However, the metal’s price averaged $696/oz for the year, approximately 27 percent lower than in 2015, due to a stronger increase in supply relative to demand.
400
500
600
700
800
900
1000
1100
1200
1/4
/20
16
1/1
8/2
01
6
2/1
/20
16
2/1
5/2
01
6
2/2
9/2
01
6
3/1
4/2
01
6
3/2
8/2
01
6
4/1
1/2
01
6
4/2
5/2
01
6
5/9
/20
16
5/2
3/2
01
6
6/6
/20
16
6/2
0/2
01
6
7/4
/20
16
7/1
8/2
01
6
8/1
/20
16
8/1
5/2
01
6
8/2
9/2
01
6
9/1
2/2
01
6
9/2
6/2
01
6
10
/10
/20
16
10
/24
/20
16
11
/7/2
01
6
11
/21
/20
16
12
/5/2
01
6
12
/19
/20
16
US$
/oz
Pt Pd Rh
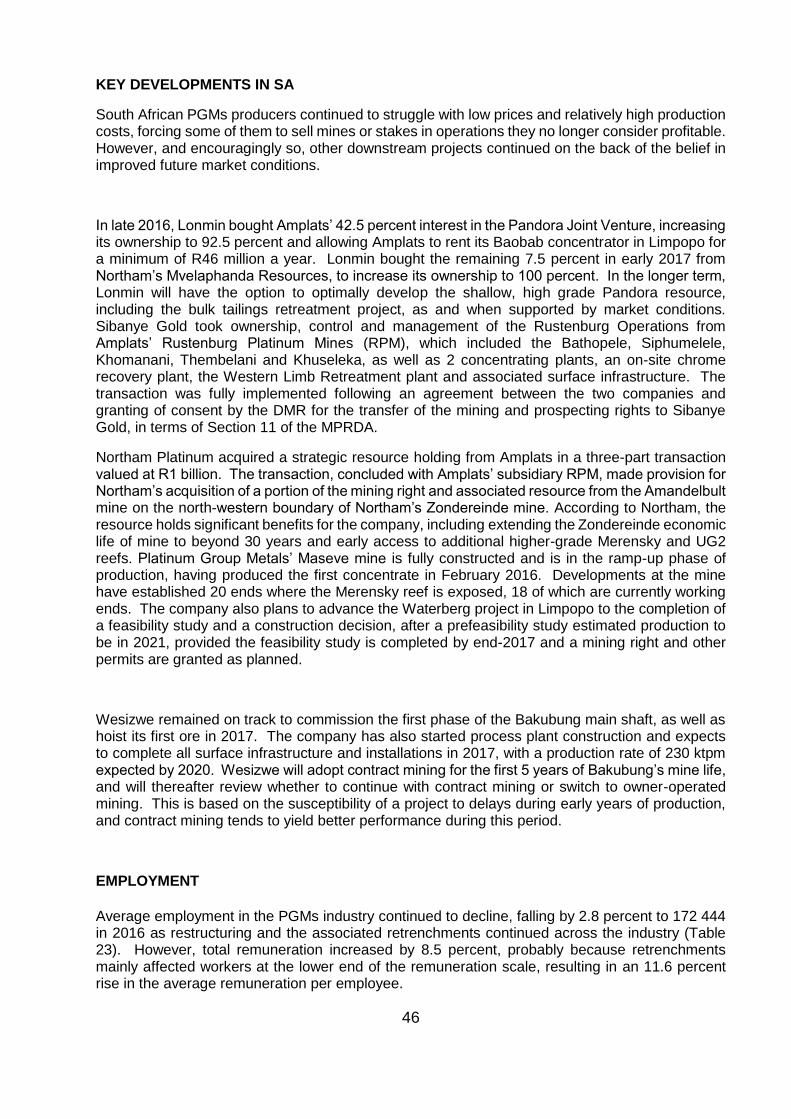
46
KEY DEVELOPMENTS IN SA
South African PGMs producers continued to struggle with low prices and relatively high production costs, forcing some of them to sell mines or stakes in operations they no longer consider profitable. However, and encouragingly so, other downstream projects continued on the back of the belief in improved future market conditions.
In late 2016, Lonmin bought Amplats’ 42.5 percent interest in the Pandora Joint Venture, increasing its ownership to 92.5 percent and allowing Amplats to rent its Baobab concentrator in Limpopo for a minimum of R46 million a year. Lonmin bought the remaining 7.5 percent in early 2017 from Northam’s Mvelaphanda Resources, to increase its ownership to 100 percent. In the longer term, Lonmin will have the option to optimally develop the shallow, high grade Pandora resource, including the bulk tailings retreatment project, as and when supported by market conditions. Sibanye Gold took ownership, control and management of the Rustenburg Operations from Amplats’ Rustenburg Platinum Mines (RPM), which included the Bathopele, Siphumelele, Khomanani, Thembelani and Khuseleka, as well as 2 concentrating plants, an on-site chrome recovery plant, the Western Limb Retreatment plant and associated surface infrastructure. The transaction was fully implemented following an agreement between the two companies and granting of consent by the DMR for the transfer of the mining and prospecting rights to Sibanye Gold, in terms of Section 11 of the MPRDA.
Northam Platinum acquired a strategic resource holding from Amplats in a three-part transaction valued at R1 billion. The transaction, concluded with Amplats’ subsidiary RPM, made provision for Northam’s acquisition of a portion of the mining right and associated resource from the Amandelbult mine on the north-western boundary of Northam’s Zondereinde mine. According to Northam, the resource holds significant benefits for the company, including extending the Zondereinde economic life of mine to beyond 30 years and early access to additional higher-grade Merensky and UG2 reefs. Platinum Group Metals’ Maseve mine is fully constructed and is in the ramp-up phase of production, having produced the first concentrate in February 2016. Developments at the mine have established 20 ends where the Merensky reef is exposed, 18 of which are currently working ends. The company also plans to advance the Waterberg project in Limpopo to the completion of a feasibility study and a construction decision, after a prefeasibility study estimated production to be in 2021, provided the feasibility study is completed by end-2017 and a mining right and other permits are granted as planned.
Wesizwe remained on track to commission the first phase of the Bakubung main shaft, as well as hoist its first ore in 2017. The company has also started process plant construction and expects to complete all surface infrastructure and installations in 2017, with a production rate of 230 ktpm expected by 2020. Wesizwe will adopt contract mining for the first 5 years of Bakubung’s mine life, and will thereafter review whether to continue with contract mining or switch to owner-operated mining. This is based on the susceptibility of a project to delays during early years of production, and contract mining tends to yield better performance during this period.
EMPLOYMENT
Average employment in the PGMs industry continued to decline, falling by 2.8 percent to 172 444 in 2016 as restructuring and the associated retrenchments continued across the industry (Table 23). However, total remuneration increased by 8.5 percent, probably because retrenchments mainly affected workers at the lower end of the remuneration scale, resulting in an 11.6 percent rise in the average remuneration per employee.
47
TABLE 9: EMPLOYMENT (INCLUDING CONTRACTORS) AND REMUNERATION IN SOUTH AFRICA'S PGMs MINES, 2012-2016.
YEAR AVERAGE
NUMBER OF EMPLOYEES
TOTAL REMUNERATION
(R'000 000)
AVERAGE REMUNERATION
(R/employee)
2012 197 847 34 409 173 917
2013 192 051 37 210 193 751
2014 188 480 35 677 189 288
2015 177 391 41 754 235 378
2016 172 444 45 301 262 700
% Change (YOY) -2.8 8.5 11.6
Source: DMR, Directorate Mineral Economics
OUTLOOK
The prospects of any significant changes in global PGMs supplies in 2017, particularly platinum and rhodium, will largely depend on the extent to which SA mining output is disrupted by labour, safety or other unforeseen circumstances. Higher output at operations in the ramp-up phase, such as Maseve mine and Impala’s new 16 and 20 shafts, is expected to be offset by the impact of shaft closures at Lonmin. With an expected fall in global autocatalyst, jewellery and investment demand for platinum, SA sales are also expected to fall, resulting in a more evenly balanced market and marginally higher prices in 2017. Autocatalyst demand for palladium is set to reach new records, and with combined primary and secondary supplies of the metal only expected to rise marginally, the palladium market deficit is expected to widen in 2017, resulting in significant increase in prices. The rhodium market is expected to remain in marginal surplus, as a significant increase in automotive demand will be partly accounted for by higher recycling volumes. As a result, SA sales and prices are expected to increase marginally in 2017.
48
REFERENCES
1. DMR, Directorate Mineral Economics. 2. PGMs Market Report, May 2017, Johnson Matthey plc. 3. WPIC Platinum Quarterly, Q4 2016 and Q1 2017. 4. Engelhard Industrial Bullion Prices, BASF. 5. Anglo American Platinum Integrated Report, 2016. 6. www.miningweekly.com, 11 November 2016, 01 November 2016, 25 October 2016, 21
October 2016, 11 October 2016, 30 March 2016, 17 March 2016.
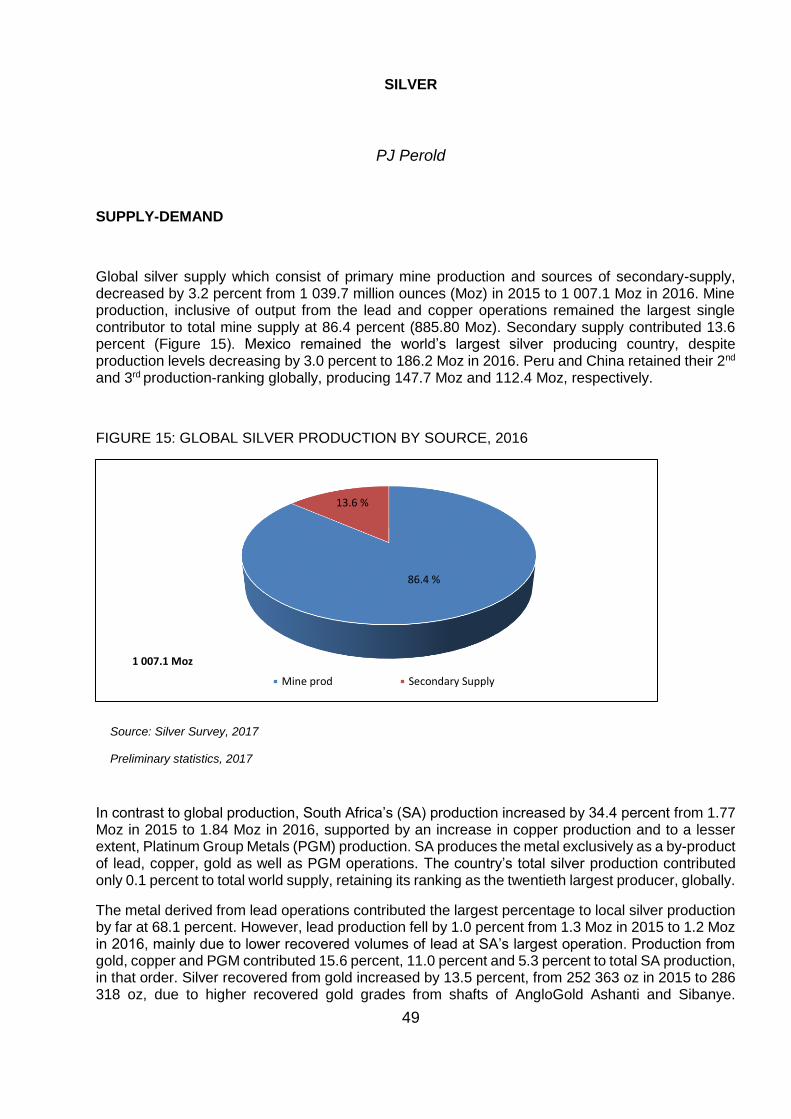
49
SILVER
PJ Perold
SUPPLY-DEMAND
Global silver supply which consist of primary mine production and sources of secondary-supply, decreased by 3.2 percent from 1 039.7 million ounces (Moz) in 2015 to 1 007.1 Moz in 2016. Mine production, inclusive of output from the lead and copper operations remained the largest single contributor to total mine supply at 86.4 percent (885.80 Moz). Secondary supply contributed 13.6 percent (Figure 15). Mexico remained the world’s largest silver producing country, despite production levels decreasing by 3.0 percent to 186.2 Moz in 2016. Peru and China retained their 2nd and 3rd production-ranking globally, producing 147.7 Moz and 112.4 Moz, respectively.
FIGURE 15: GLOBAL SILVER PRODUCTION BY SOURCE, 2016
Source: Silver Survey, 2017
Preliminary statistics, 2017
In contrast to global production, South Africa’s (SA) production increased by 34.4 percent from 1.77 Moz in 2015 to 1.84 Moz in 2016, supported by an increase in copper production and to a lesser extent, Platinum Group Metals (PGM) production. SA produces the metal exclusively as a by-product of lead, copper, gold as well as PGM operations. The country’s total silver production contributed only 0.1 percent to total world supply, retaining its ranking as the twentieth largest producer, globally.
The metal derived from lead operations contributed the largest percentage to local silver production by far at 68.1 percent. However, lead production fell by 1.0 percent from 1.3 Moz in 2015 to 1.2 Moz in 2016, mainly due to lower recovered volumes of lead at SA’s largest operation. Production from gold, copper and PGM contributed 15.6 percent, 11.0 percent and 5.3 percent to total SA production, in that order. Silver recovered from gold increased by 13.5 percent, from 252 363 oz in 2015 to 286 318 oz, due to higher recovered gold grades from shafts of AngloGold Ashanti and Sibanye.
86.4 %
13.6 %
Mine prod Secondary Supply
1 007.1 Moz
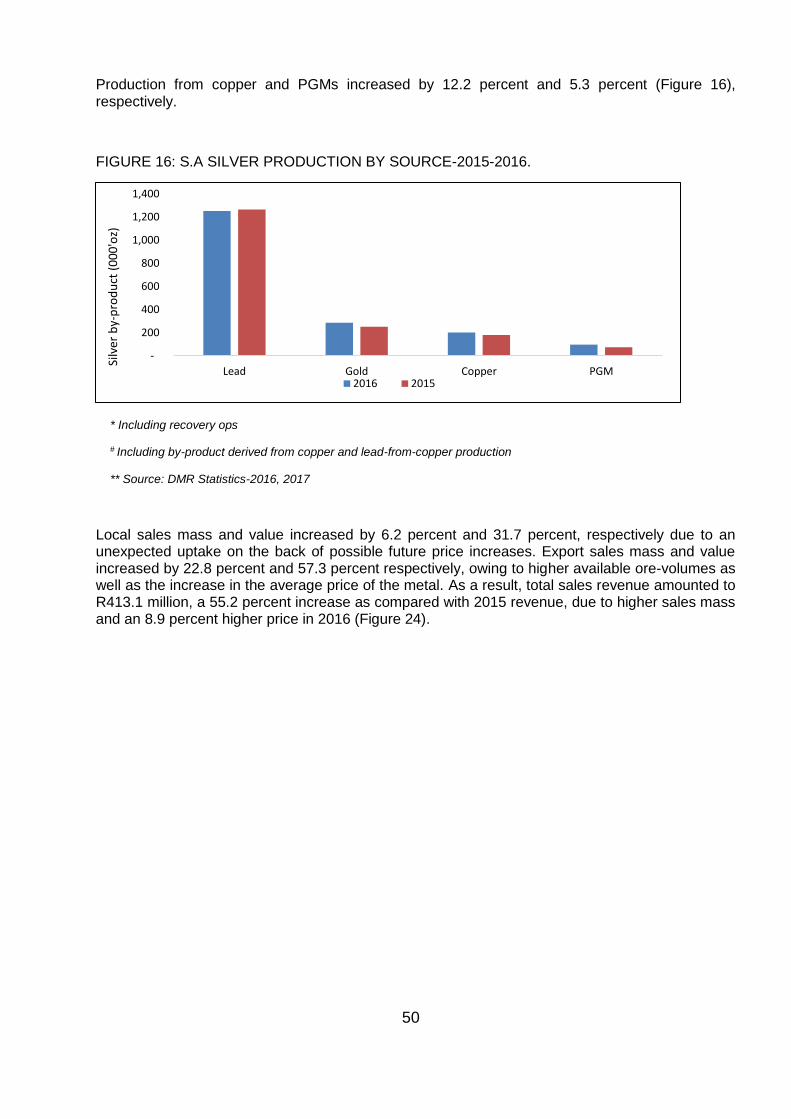
50
Production from copper and PGMs increased by 12.2 percent and 5.3 percent (Figure 16), respectively.
FIGURE 16: S.A SILVER PRODUCTION BY SOURCE-2015-2016.
* Including recovery ops
# Including by-product derived from copper and lead-from-copper production
** Source: DMR Statistics-2016, 2017
Local sales mass and value increased by 6.2 percent and 31.7 percent, respectively due to an unexpected uptake on the back of possible future price increases. Export sales mass and value increased by 22.8 percent and 57.3 percent respectively, owing to higher available ore-volumes as well as the increase in the average price of the metal. As a result, total sales revenue amounted to R413.1 million, a 55.2 percent increase as compared with 2015 revenue, due to higher sales mass and an 8.9 percent higher price in 2016 (Figure 24).
-
200
400
600
800
1,000
1,200
1,400
Lead Gold Copper PGM
Silv
er b
y-p
rod
uct
(0
00
'oz)
2016 2015
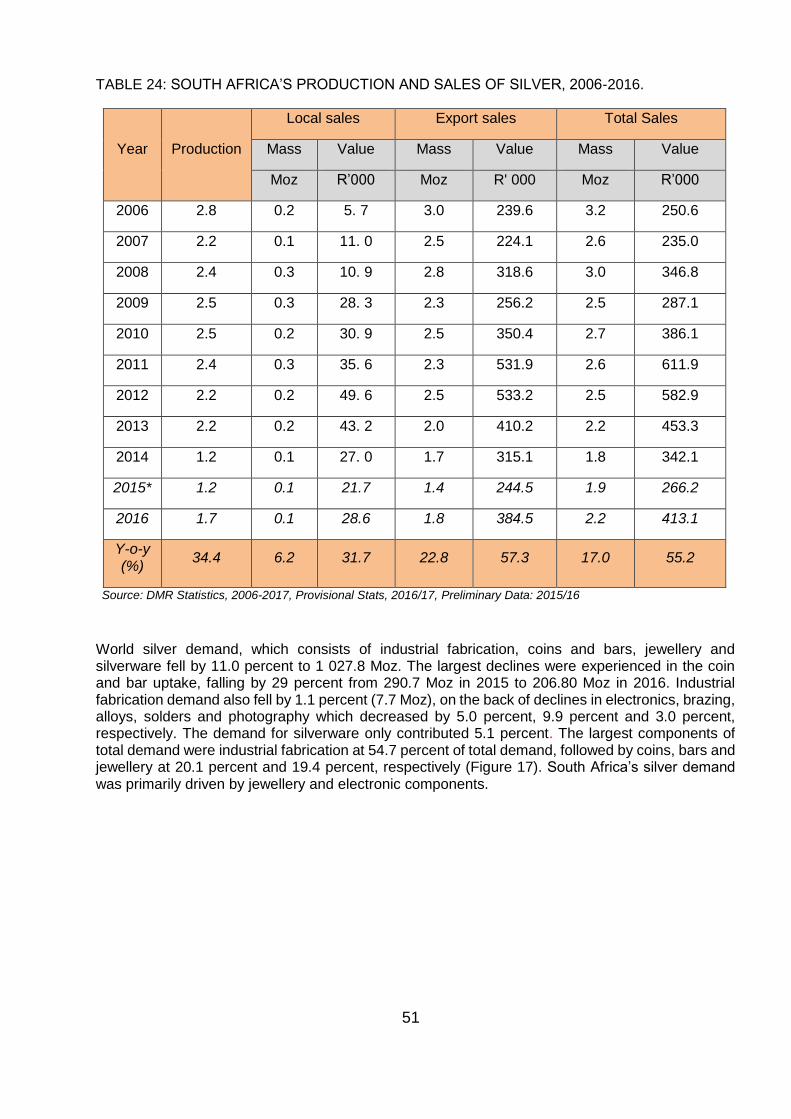
51
TABLE 24: SOUTH AFRICA’S PRODUCTION AND SALES OF SILVER, 2006-2016.
Year Production
Local sales Export sales Total Sales
Mass Value Mass Value Mass Value
Moz R’000 Moz R' 000 Moz R’000
2006 2.8 0.2 5. 7 3.0 239.6 3.2 250.6
2007 2.2 0.1 11. 0 2.5 224.1 2.6 235.0
2008 2.4 0.3 10. 9 2.8 318.6 3.0 346.8
2009 2.5 0.3 28. 3 2.3 256.2 2.5 287.1
2010 2.5 0.2 30. 9 2.5 350.4 2.7 386.1
2011 2.4 0.3 35. 6 2.3 531.9 2.6 611.9
2012 2.2 0.2 49. 6 2.5 533.2 2.5 582.9
2013 2.2 0.2 43. 2 2.0 410.2 2.2 453.3
2014 1.2 0.1 27. 0 1.7 315.1 1.8 342.1
2015* 1.2 0.1 21.7 1.4 244.5 1.9 266.2
2016 1.7 0.1 28.6 1.8 384.5 2.2 413.1
Y-o-y (%)
34.4 6.2 31.7 22.8 57.3 17.0 55.2
Source: DMR Statistics, 2006-2017, Provisional Stats, 2016/17, Preliminary Data: 2015/16
World silver demand, which consists of industrial fabrication, coins and bars, jewellery and silverware fell by 11.0 percent to 1 027.8 Moz. The largest declines were experienced in the coin and bar uptake, falling by 29 percent from 290.7 Moz in 2015 to 206.80 Moz in 2016. Industrial fabrication demand also fell by 1.1 percent (7.7 Moz), on the back of declines in electronics, brazing, alloys, solders and photography which decreased by 5.0 percent, 9.9 percent and 3.0 percent, respectively. The demand for silverware only contributed 5.1 percent. The largest components of total demand were industrial fabrication at 54.7 percent of total demand, followed by coins, bars and jewellery at 20.1 percent and 19.4 percent, respectively (Figure 17). South Africa’s silver demand was primarily driven by jewellery and electronic components.
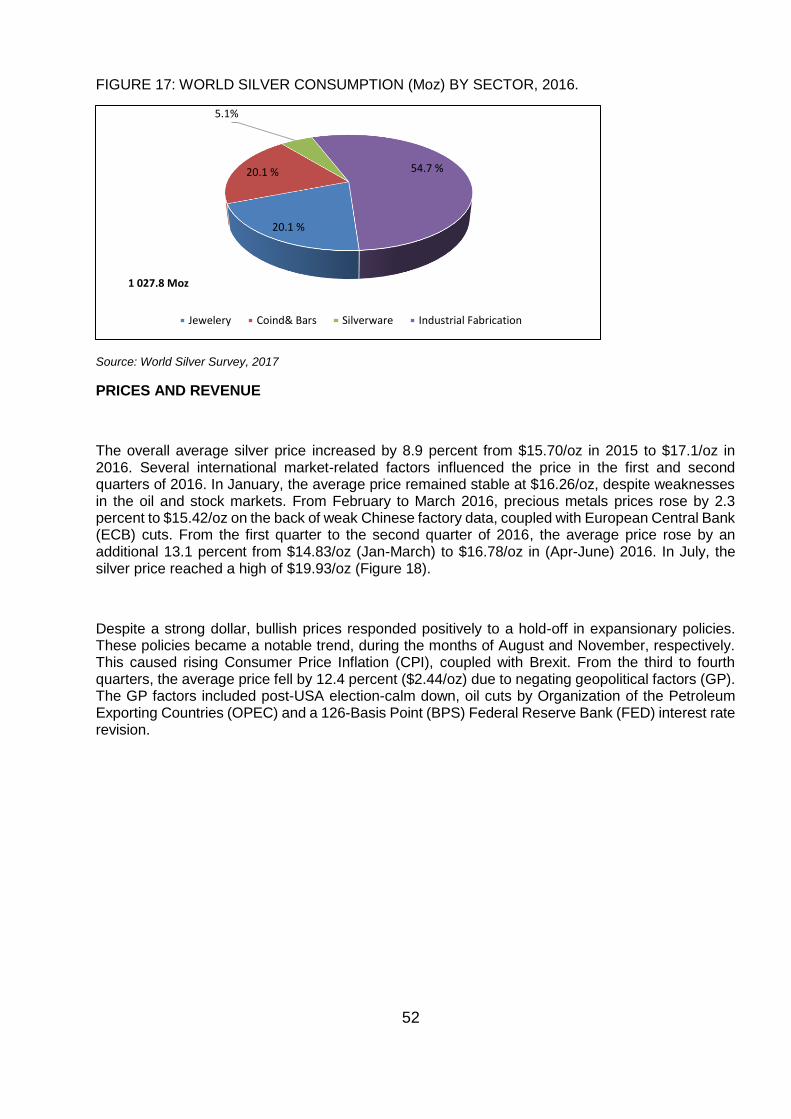
52
FIGURE 17: WORLD SILVER CONSUMPTION (Moz) BY SECTOR, 2016.
Source: World Silver Survey, 2017
PRICES AND REVENUE
The overall average silver price increased by 8.9 percent from $15.70/oz in 2015 to $17.1/oz in 2016. Several international market-related factors influenced the price in the first and second quarters of 2016. In January, the average price remained stable at $16.26/oz, despite weaknesses in the oil and stock markets. From February to March 2016, precious metals prices rose by 2.3 percent to $15.42/oz on the back of weak Chinese factory data, coupled with European Central Bank (ECB) cuts. From the first quarter to the second quarter of 2016, the average price rose by an additional 13.1 percent from $14.83/oz (Jan-March) to $16.78/oz in (Apr-June) 2016. In July, the silver price reached a high of $19.93/oz (Figure 18).
Despite a strong dollar, bullish prices responded positively to a hold-off in expansionary policies. These policies became a notable trend, during the months of August and November, respectively. This caused rising Consumer Price Inflation (CPI), coupled with Brexit. From the third to fourth quarters, the average price fell by 12.4 percent ($2.44/oz) due to negating geopolitical factors (GP). The GP factors included post-USA election-calm down, oil cuts by Organization of the Petroleum Exporting Countries (OPEC) and a 126-Basis Point (BPS) Federal Reserve Bank (FED) interest rate revision.
20.1 %
20.1 %
5.1%
54.7 %
Jewelery Coind& Bars Silverware Industrial Fabrication
1 027.8 Moz
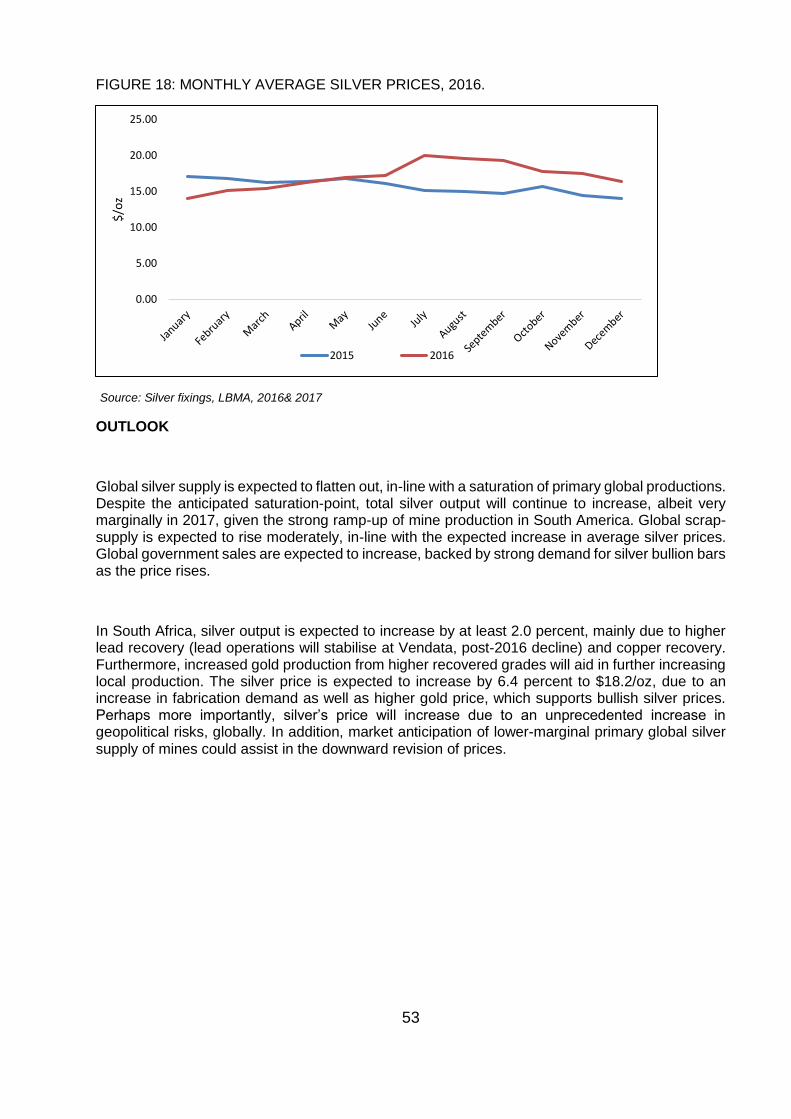
53
FIGURE 18: MONTHLY AVERAGE SILVER PRICES, 2016.
Source: Silver fixings, LBMA, 2016& 2017
OUTLOOK
Global silver supply is expected to flatten out, in-line with a saturation of primary global productions. Despite the anticipated saturation-point, total silver output will continue to increase, albeit very marginally in 2017, given the strong ramp-up of mine production in South America. Global scrap-supply is expected to rise moderately, in-line with the expected increase in average silver prices. Global government sales are expected to increase, backed by strong demand for silver bullion bars as the price rises.
In South Africa, silver output is expected to increase by at least 2.0 percent, mainly due to higher lead recovery (lead operations will stabilise at Vendata, post-2016 decline) and copper recovery. Furthermore, increased gold production from higher recovered grades will aid in further increasing local production. The silver price is expected to increase by 6.4 percent to $18.2/oz, due to an increase in fabrication demand as well as higher gold price, which supports bullish silver prices. Perhaps more importantly, silver’s price will increase due to an unprecedented increase in geopolitical risks, globally. In addition, market anticipation of lower-marginal primary global silver supply of mines could assist in the downward revision of prices.
0.00
5.00
10.00
15.00
20.00
25.00$
/oz
2015 2016
54
REFERENCES
1. DMR, Directorate Mineral Economics, 2017
2. The Silver Institute, www.silverinstitute.org, 2017
3. World Silver Survey, 2017
4. Silver fixings, LBMA, 2017
5. http://www.tradingnrg.com/gold-price, 2016
6. http://www.forecasts.org/gold.htm, 2016
7. http://blogs.marketwatch.com/thetell/2012/07/10/silver-targets-lowered-for-second-half-of-year/
55
ENERGY COMMODITIES
OVERVIEW
K L Revombo
INTRODUCTION
The Energy Sector is very important for the wellbeing South Africa’s economy. Coal, uranium, oil and natural gas are the most crucial components of the country’s energy mix. Coal in particular accounts for about 91 percent of the electricity generated in the country. South Africa’s coal resources are ranked sixth in the world. Uranium, the second significant component in the country’s energy mix, accounts for about 5.6 percent of the country’s electricity. The country’s uranium reserves are ranked fifth globally. South Africa’s Necsa (South African Nuclear Energy Corporation SOC Limited) is the only company on the African continent with an American Society of Mechanical Engineers III (ASME III) and ASME VIII certification for the design and manufacture of nuclear components and equipment. The majority of the uranium is produced mainly as a by-product from the treatment of gold-bearing ores. The country’s coal reserves are located mainly in Mpumalanga, northern Kwazulu-Natal and Limpopo provinces.
South Africa’s oil and gas resources have dwindled drastically to the extent that the country did not produce oil for two consecutive years. The country hosts very small deposits of oil. However, the country potentially hosts large quantities of shale gas in the Karoo basin.
PRODUCTION AND SALES
In 2016, global oil production grew by 0.49 percent or 0.45 million barrels per day (mbbl/d) to 92.1 mbbl/d from 91.7 mbbl/d in 2015, owing to production increases in the Middle East, and, Europe and Eurasia by 5.7 percent and 1.4 percent respectively.
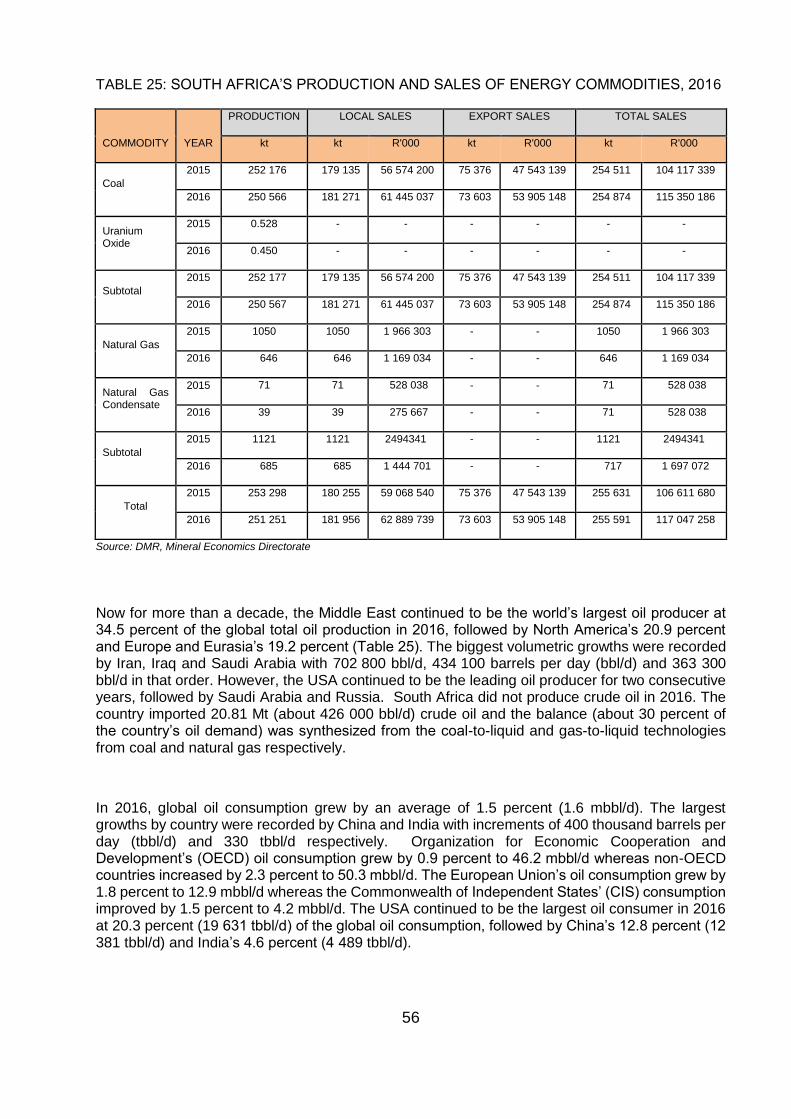
56
TABLE 25: SOUTH AFRICA’S PRODUCTION AND SALES OF ENERGY COMMODITIES, 2016
COMMODITY YEAR
PRODUCTION LOCAL SALES EXPORT SALES TOTAL SALES
kt kt R'000 kt R'000 kt R'000
Coal
2015 252 176 179 135 56 574 200 75 376 47 543 139 254 511 104 117 339
2016 250 566 181 271 61 445 037 73 603 53 905 148 254 874 115 350 186
Uranium Oxide
2015 0.528 - - - - - -
2016 0.450 - - - - - -
Subtotal
2015 252 177 179 135 56 574 200 75 376 47 543 139 254 511 104 117 339
2016 250 567 181 271 61 445 037 73 603 53 905 148 254 874 115 350 186
Natural Gas
2015 1050 1050 1 966 303 - - 1050 1 966 303
2016 646 646 1 169 034 - - 646 1 169 034
Natural Gas Condensate
2015 71 71 528 038 - - 71 528 038
2016 39 39 275 667 - - 71 528 038
Subtotal
2015 1121 1121 2494341 - - 1121 2494341
2016 685 685 1 444 701 - - 717 1 697 072
Total
2015 253 298 180 255 59 068 540 75 376 47 543 139 255 631 106 611 680
2016 251 251 181 956 62 889 739 73 603 53 905 148 255 591 117 047 258
Source: DMR, Mineral Economics Directorate
Now for more than a decade, the Middle East continued to be the world’s largest oil producer at 34.5 percent of the global total oil production in 2016, followed by North America’s 20.9 percent and Europe and Eurasia’s 19.2 percent (Table 25). The biggest volumetric growths were recorded by Iran, Iraq and Saudi Arabia with 702 800 bbl/d, 434 100 barrels per day (bbl/d) and 363 300 bbl/d in that order. However, the USA continued to be the leading oil producer for two consecutive years, followed by Saudi Arabia and Russia. South Africa did not produce crude oil in 2016. The country imported 20.81 Mt (about 426 000 bbl/d) crude oil and the balance (about 30 percent of the country’s oil demand) was synthesized from the coal-to-liquid and gas-to-liquid technologies from coal and natural gas respectively.
In 2016, global oil consumption grew by an average of 1.5 percent (1.6 mbbl/d). The largest growths by country were recorded by China and India with increments of 400 thousand barrels per day (tbbl/d) and 330 tbbl/d respectively. Organization for Economic Cooperation and Development’s (OECD) oil consumption grew by 0.9 percent to 46.2 mbbl/d whereas non-OECD countries increased by 2.3 percent to 50.3 mbbl/d. The European Union’s oil consumption grew by 1.8 percent to 12.9 mbbl/d whereas the Commonwealth of Independent States’ (CIS) consumption improved by 1.5 percent to 4.2 mbbl/d. The USA continued to be the largest oil consumer in 2016 at 20.3 percent (19 631 tbbl/d) of the global oil consumption, followed by China’s 12.8 percent (12 381 tbbl/d) and India’s 4.6 percent (4 489 tbbl/d).
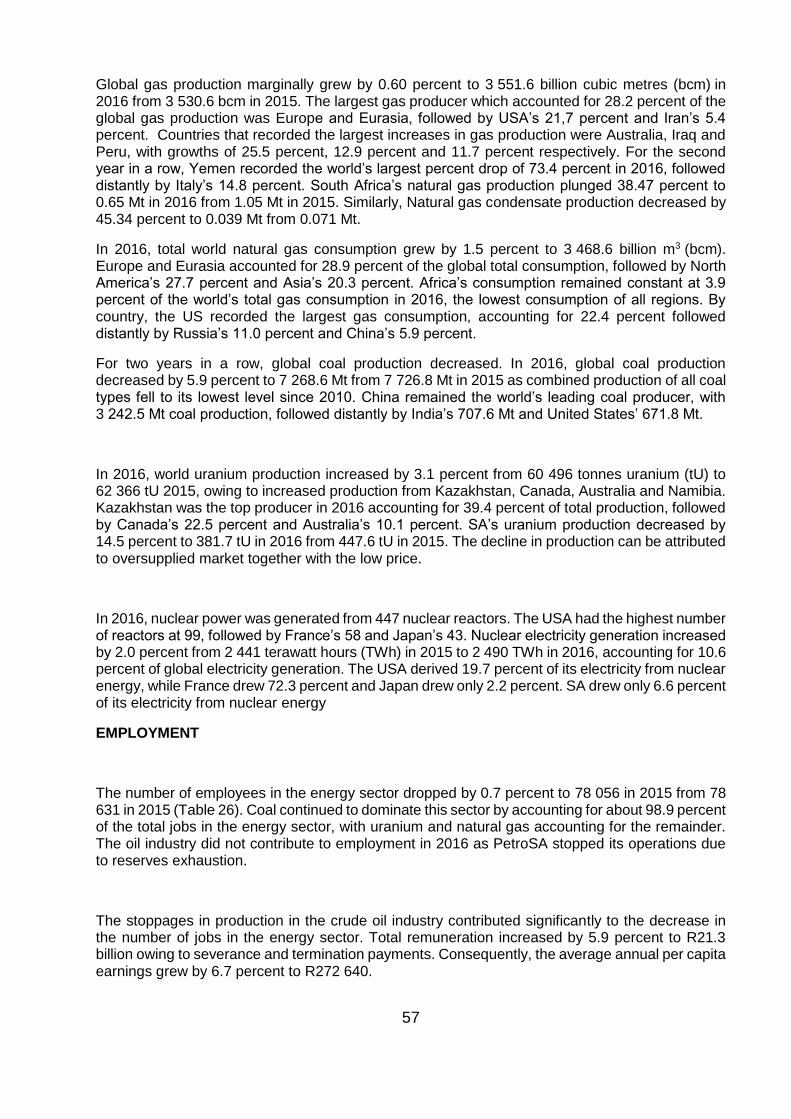
57
Global gas production marginally grew by 0.60 percent to 3 551.6 billion cubic metres (bcm) in 2016 from 3 530.6 bcm in 2015. The largest gas producer which accounted for 28.2 percent of the global gas production was Europe and Eurasia, followed by USA’s 21,7 percent and Iran’s 5.4 percent. Countries that recorded the largest increases in gas production were Australia, Iraq and Peru, with growths of 25.5 percent, 12.9 percent and 11.7 percent respectively. For the second year in a row, Yemen recorded the world’s largest percent drop of 73.4 percent in 2016, followed distantly by Italy’s 14.8 percent. South Africa’s natural gas production plunged 38.47 percent to 0.65 Mt in 2016 from 1.05 Mt in 2015. Similarly, Natural gas condensate production decreased by 45.34 percent to 0.039 Mt from 0.071 Mt.
In 2016, total world natural gas consumption grew by 1.5 percent to 3 468.6 billion m3 (bcm). Europe and Eurasia accounted for 28.9 percent of the global total consumption, followed by North America’s 27.7 percent and Asia’s 20.3 percent. Africa’s consumption remained constant at 3.9 percent of the world’s total gas consumption in 2016, the lowest consumption of all regions. By country, the US recorded the largest gas consumption, accounting for 22.4 percent followed distantly by Russia’s 11.0 percent and China’s 5.9 percent.
For two years in a row, global coal production decreased. In 2016, global coal production decreased by 5.9 percent to 7 268.6 Mt from 7 726.8 Mt in 2015 as combined production of all coal types fell to its lowest level since 2010. China remained the world’s leading coal producer, with 3 242.5 Mt coal production, followed distantly by India’s 707.6 Mt and United States’ 671.8 Mt.
In 2016, world uranium production increased by 3.1 percent from 60 496 tonnes uranium (tU) to 62 366 tU 2015, owing to increased production from Kazakhstan, Canada, Australia and Namibia. Kazakhstan was the top producer in 2016 accounting for 39.4 percent of total production, followed by Canada’s 22.5 percent and Australia’s 10.1 percent. SA’s uranium production decreased by 14.5 percent to 381.7 tU in 2016 from 447.6 tU in 2015. The decline in production can be attributed to oversupplied market together with the low price.
In 2016, nuclear power was generated from 447 nuclear reactors. The USA had the highest number of reactors at 99, followed by France’s 58 and Japan’s 43. Nuclear electricity generation increased by 2.0 percent from 2 441 terawatt hours (TWh) in 2015 to 2 490 TWh in 2016, accounting for 10.6 percent of global electricity generation. The USA derived 19.7 percent of its electricity from nuclear energy, while France drew 72.3 percent and Japan drew only 2.2 percent. SA drew only 6.6 percent of its electricity from nuclear energy
EMPLOYMENT
The number of employees in the energy sector dropped by 0.7 percent to 78 056 in 2015 from 78 631 in 2015 (Table 26). Coal continued to dominate this sector by accounting for about 98.9 percent of the total jobs in the energy sector, with uranium and natural gas accounting for the remainder. The oil industry did not contribute to employment in 2016 as PetroSA stopped its operations due to reserves exhaustion.
The stoppages in production in the crude oil industry contributed significantly to the decrease in the number of jobs in the energy sector. Total remuneration increased by 5.9 percent to R21.3 billion owing to severance and termination payments. Consequently, the average annual per capita earnings grew by 6.7 percent to R272 640.
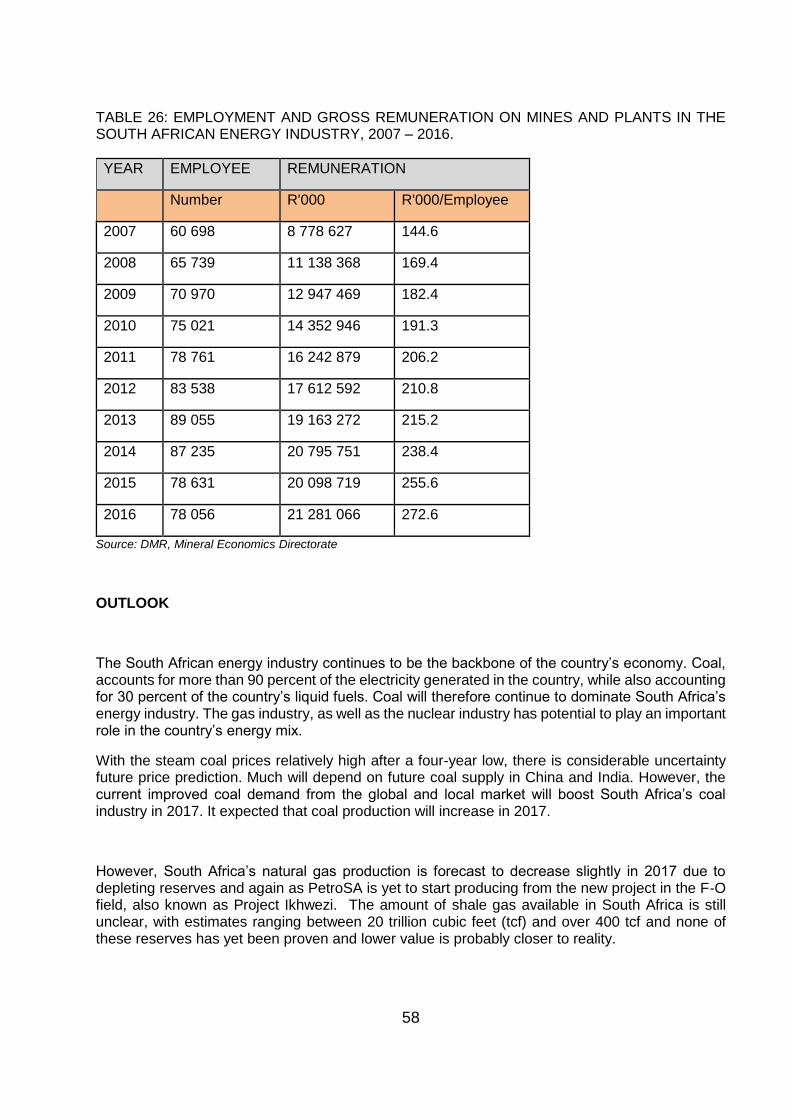
58
TABLE 26: EMPLOYMENT AND GROSS REMUNERATION ON MINES AND PLANTS IN THE SOUTH AFRICAN ENERGY INDUSTRY, 2007 – 2016.
YEAR EMPLOYEE REMUNERATION
Number R'000 R'000/Employee
2007 60 698 8 778 627 144.6
2008 65 739 11 138 368 169.4
2009 70 970 12 947 469 182.4
2010 75 021 14 352 946 191.3
2011 78 761 16 242 879 206.2
2012 83 538 17 612 592 210.8
2013 89 055 19 163 272 215.2
2014 87 235 20 795 751 238.4
2015 78 631 20 098 719 255.6
2016 78 056 21 281 066 272.6
Source: DMR, Mineral Economics Directorate
OUTLOOK
The South African energy industry continues to be the backbone of the country’s economy. Coal, accounts for more than 90 percent of the electricity generated in the country, while also accounting for 30 percent of the country’s liquid fuels. Coal will therefore continue to dominate South Africa’s energy industry. The gas industry, as well as the nuclear industry has potential to play an important role in the country’s energy mix.
With the steam coal prices relatively high after a four-year low, there is considerable uncertainty future price prediction. Much will depend on future coal supply in China and India. However, the current improved coal demand from the global and local market will boost South Africa’s coal industry in 2017. It expected that coal production will increase in 2017.
However, South Africa’s natural gas production is forecast to decrease slightly in 2017 due to depleting reserves and again as PetroSA is yet to start producing from the new project in the F-O field, also known as Project Ikhwezi. The amount of shale gas available in South Africa is still unclear, with estimates ranging between 20 trillion cubic feet (tcf) and over 400 tcf and none of these reserves has yet been proven and lower value is probably closer to reality.
59
While there is a possibility of shale gas breakthrough, exploratory fracking is still needed to determine the commercial prospects of shale gas. Exploration for shale gas is now allowed to proceed and the Petroleum Agency of South Africa is tasked with looking at the applications. So far, only five applications have been received. To support the shale gas industry, urgent steps need to be implemented by relevant government departments, in collaboration with industry, to coordinate all skills planning initiatives needed to develop a single, coordinated development plan for the shale gas industry. There are no major changes expected in the country’s uranium industry in 2017 as there are no new mines to be commissioned soon. The Integrated Resource Plan 2010 (IRP 2010) has committed a nuclear fleet of 9 600 MW by 2030, increasing nuclear’s contribution from 5 to 20 percent towards the country’s energy mix.
REFERENCES
1. BP Statistical Review of World Energy, June 2017 2. Department of Mineral Resources, Mineral Economics Directorate 3. Coal Information 2017, International Energy Agency – OECD/IEA, 2017
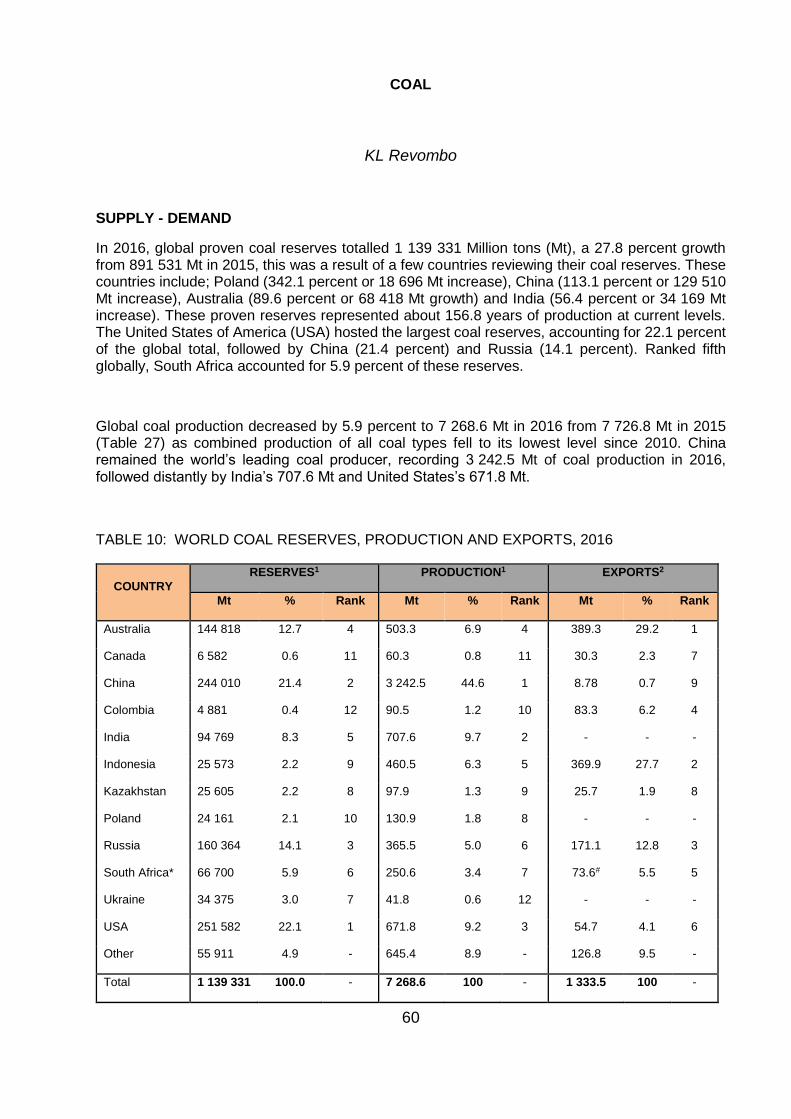
60
COAL
KL Revombo
SUPPLY - DEMAND
In 2016, global proven coal reserves totalled 1 139 331 Million tons (Mt), a 27.8 percent growth from 891 531 Mt in 2015, this was a result of a few countries reviewing their coal reserves. These countries include; Poland (342.1 percent or 18 696 Mt increase), China (113.1 percent or 129 510 Mt increase), Australia (89.6 percent or 68 418 Mt growth) and India (56.4 percent or 34 169 Mt increase). These proven reserves represented about 156.8 years of production at current levels. The United States of America (USA) hosted the largest coal reserves, accounting for 22.1 percent of the global total, followed by China (21.4 percent) and Russia (14.1 percent). Ranked fifth globally, South Africa accounted for 5.9 percent of these reserves.
Global coal production decreased by 5.9 percent to 7 268.6 Mt in 2016 from 7 726.8 Mt in 2015 (Table 27) as combined production of all coal types fell to its lowest level since 2010. China remained the world’s leading coal producer, recording 3 242.5 Mt of coal production in 2016, followed distantly by India’s 707.6 Mt and United States’s 671.8 Mt.
TABLE 10: WORLD COAL RESERVES, PRODUCTION AND EXPORTS, 2016
COUNTRY
RESERVES1 PRODUCTION1 EXPORTS2
Mt % Rank Mt % Rank Mt % Rank
Australia 144 818 12.7 4 503.3 6.9 4 389.3 29.2 1
Canada 6 582 0.6 11 60.3 0.8 11 30.3 2.3 7
China 244 010 21.4 2 3 242.5 44.6 1 8.78 0.7 9
Colombia 4 881 0.4 12 90.5 1.2 10 83.3 6.2 4
India 94 769 8.3 5 707.6 9.7 2 - - -
Indonesia 25 573 2.2 9 460.5 6.3 5 369.9 27.7 2
Kazakhstan 25 605 2.2 8 97.9 1.3 9 25.7 1.9 8
Poland 24 161 2.1 10 130.9 1.8 8 - - -
Russia 160 364 14.1 3 365.5 5.0 6 171.1 12.8 3
South Africa* 66 700 5.9 6 250.6 3.4 7 73.6# 5.5 5
Ukraine 34 375 3.0 7 41.8 0.6 12 - - -
USA 251 582 22.1 1 671.8 9.2 3 54.7 4.1 6
Other 55 911 4.9 - 645.4 8.9 - 126.8 9.5 -
Total 1 139 331 100.0 - 7 268.6 100 - 1 333.5 100 -
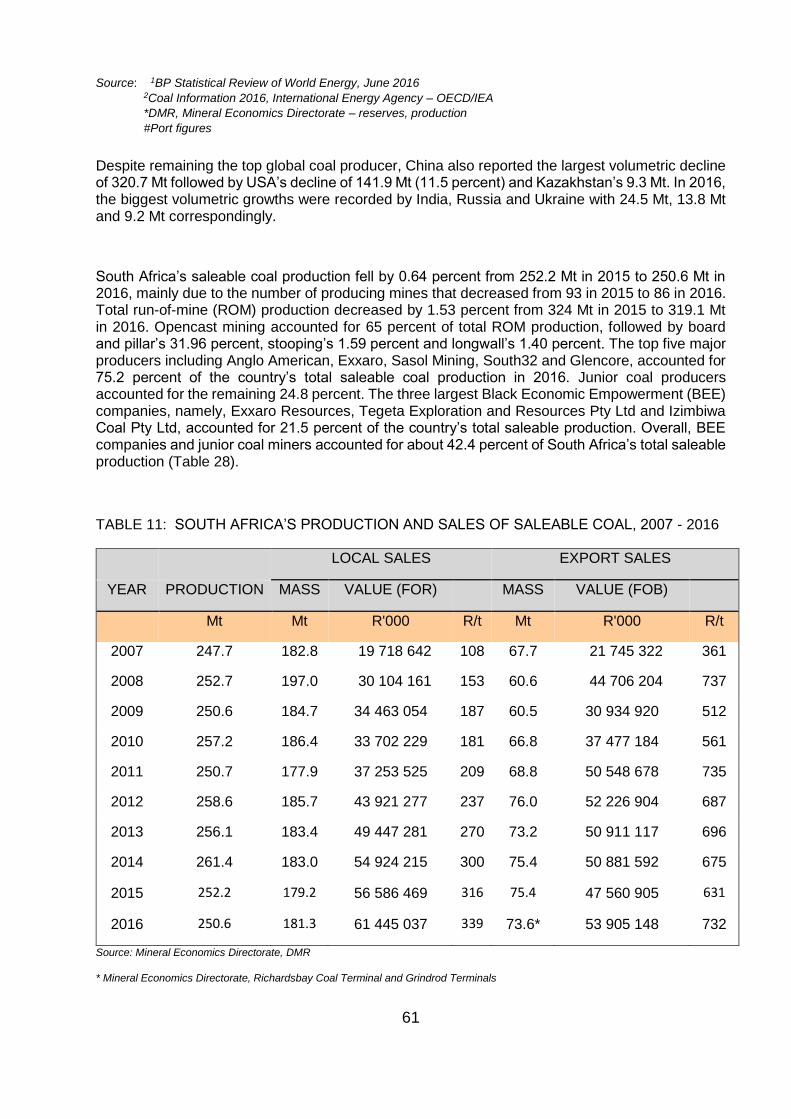
61
Source: 1BP Statistical Review of World Energy, June 2016
2Coal Information 2016, International Energy Agency – OECD/IEA
*DMR, Mineral Economics Directorate – reserves, production
#Port figures
Despite remaining the top global coal producer, China also reported the largest volumetric decline of 320.7 Mt followed by USA’s decline of 141.9 Mt (11.5 percent) and Kazakhstan’s 9.3 Mt. In 2016, the biggest volumetric growths were recorded by India, Russia and Ukraine with 24.5 Mt, 13.8 Mt and 9.2 Mt correspondingly.
South Africa’s saleable coal production fell by 0.64 percent from 252.2 Mt in 2015 to 250.6 Mt in 2016, mainly due to the number of producing mines that decreased from 93 in 2015 to 86 in 2016. Total run-of-mine (ROM) production decreased by 1.53 percent from 324 Mt in 2015 to 319.1 Mt in 2016. Opencast mining accounted for 65 percent of total ROM production, followed by board and pillar’s 31.96 percent, stooping’s 1.59 percent and longwall’s 1.40 percent. The top five major producers including Anglo American, Exxaro, Sasol Mining, South32 and Glencore, accounted for 75.2 percent of the country’s total saleable coal production in 2016. Junior coal producers accounted for the remaining 24.8 percent. The three largest Black Economic Empowerment (BEE) companies, namely, Exxaro Resources, Tegeta Exploration and Resources Pty Ltd and Izimbiwa Coal Pty Ltd, accounted for 21.5 percent of the country’s total saleable production. Overall, BEE companies and junior coal miners accounted for about 42.4 percent of South Africa’s total saleable production (Table 28).
TABLE 11: SOUTH AFRICA’S PRODUCTION AND SALES OF SALEABLE COAL, 2007 - 2016
LOCAL SALES EXPORT SALES
YEAR PRODUCTION MASS VALUE (FOR) MASS VALUE (FOB)
Mt Mt R'000 R/t Mt R'000 R/t
2007 247.7 182.8 19 718 642 108 67.7 21 745 322 361
2008 252.7 197.0 30 104 161 153 60.6 44 706 204 737
2009 250.6 184.7 34 463 054 187 60.5 30 934 920 512
2010 257.2 186.4 33 702 229 181 66.8 37 477 184 561
2011 250.7 177.9 37 253 525 209 68.8 50 548 678 735
2012 258.6 185.7 43 921 277 237 76.0 52 226 904 687
2013 256.1 183.4 49 447 281 270 73.2 50 911 117 696
2014 261.4 183.0 54 924 215 300 75.4 50 881 592 675
2015 252.2 179.2 56 586 469 316 75.4 47 560 905 631
2016 250.6 181.3 61 445 037 339 73.6* 53 905 148 732
Source: Mineral Economics Directorate, DMR
* Mineral Economics Directorate, Richardsbay Coal Terminal and Grindrod Terminals
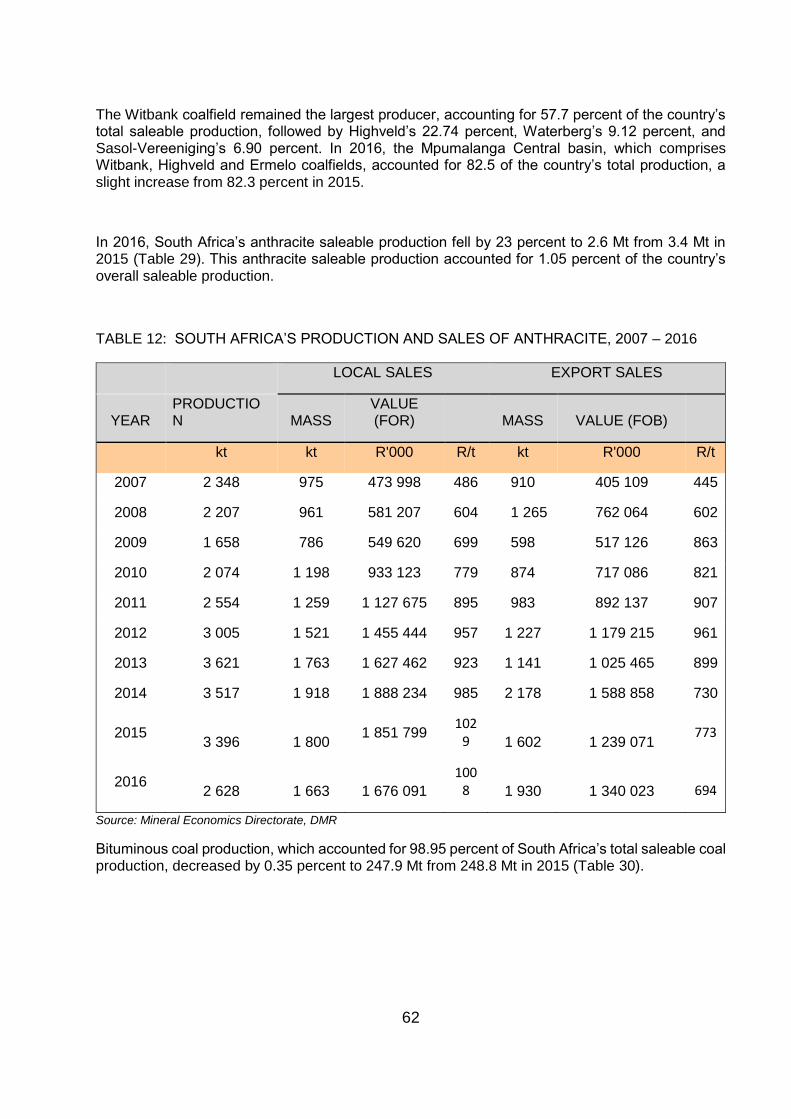
62
The Witbank coalfield remained the largest producer, accounting for 57.7 percent of the country’s total saleable production, followed by Highveld’s 22.74 percent, Waterberg’s 9.12 percent, and Sasol-Vereeniging’s 6.90 percent. In 2016, the Mpumalanga Central basin, which comprises Witbank, Highveld and Ermelo coalfields, accounted for 82.5 of the country’s total production, a slight increase from 82.3 percent in 2015.
In 2016, South Africa’s anthracite saleable production fell by 23 percent to 2.6 Mt from 3.4 Mt in 2015 (Table 29). This anthracite saleable production accounted for 1.05 percent of the country’s overall saleable production.
TABLE 12: SOUTH AFRICA’S PRODUCTION AND SALES OF ANTHRACITE, 2007 – 2016
LOCAL SALES EXPORT SALES
YEAR PRODUCTION MASS
VALUE (FOR) MASS VALUE (FOB)
kt kt R'000 R/t kt R'000 R/t
2007 2 348 975 473 998 486 910 405 109 445
2008 2 207 961 581 207 604 1 265 762 064 602
2009 1 658 786 549 620 699 598 517 126 863
2010 2 074 1 198 933 123 779 874 717 086 821
2011 2 554 1 259 1 127 675 895 983 892 137 907
2012 3 005 1 521 1 455 444 957 1 227 1 179 215 961
2013 3 621 1 763 1 627 462 923 1 141 1 025 465 899
2014 3 517 1 918 1 888 234 985 2 178 1 588 858 730
2015 3 396 1 800
1 851 799 102
9 1 602 1 239 071 773
2016 2 628 1 663 1 676 091
1008 1 930 1 340 023 694
Source: Mineral Economics Directorate, DMR
Bituminous coal production, which accounted for 98.95 percent of South Africa’s total saleable coal production, decreased by 0.35 percent to 247.9 Mt from 248.8 Mt in 2015 (Table 30).
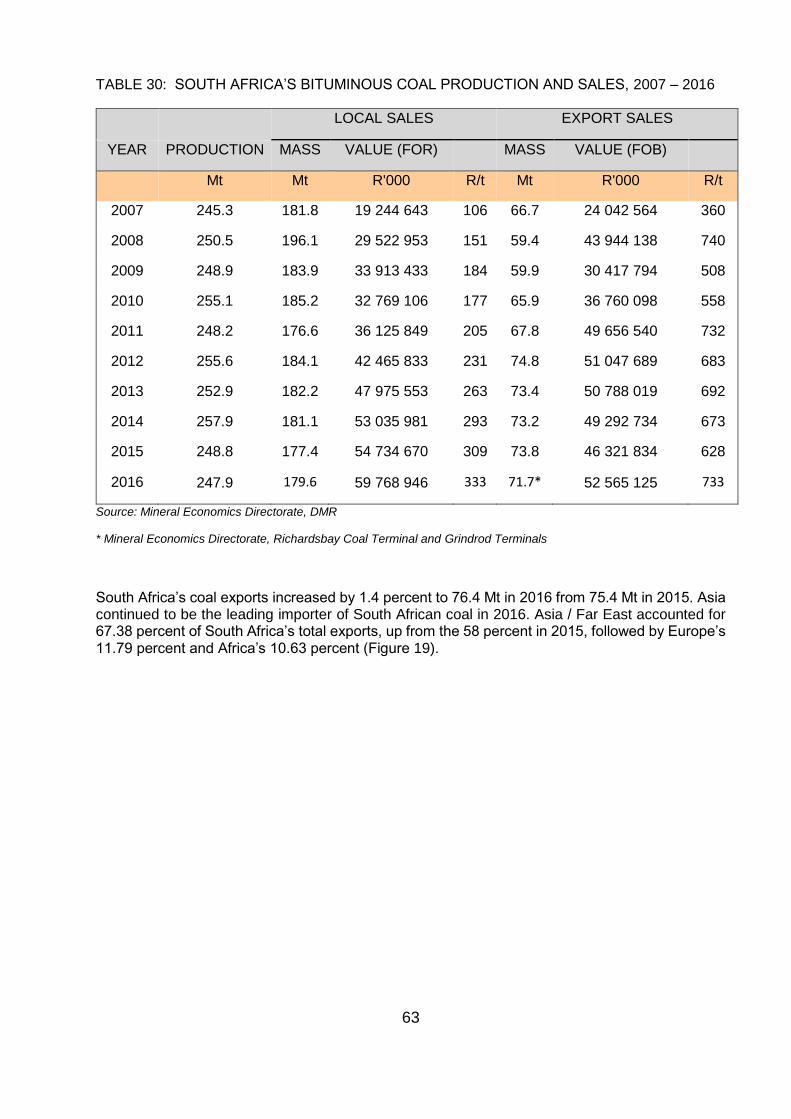
63
TABLE 30: SOUTH AFRICA’S BITUMINOUS COAL PRODUCTION AND SALES, 2007 – 2016
LOCAL SALES EXPORT SALES
YEAR PRODUCTION MASS VALUE (FOR)
MASS VALUE (FOB)
Mt Mt R'000 R/t Mt R'000 R/t
2007 245.3 181.8 19 244 643 106 66.7 24 042 564 360
2008 250.5 196.1 29 522 953 151 59.4 43 944 138 740
2009 248.9 183.9 33 913 433 184 59.9 30 417 794 508
2010 255.1 185.2 32 769 106 177 65.9 36 760 098 558
2011 248.2 176.6 36 125 849 205 67.8 49 656 540 732
2012 255.6 184.1 42 465 833 231 74.8 51 047 689 683
2013 252.9 182.2 47 975 553 263 73.4 50 788 019 692
2014 257.9 181.1 53 035 981 293 73.2 49 292 734 673
2015 248.8 177.4 54 734 670 309 73.8 46 321 834 628
2016 247.9 179.6 59 768 946 333 71.7* 52 565 125 733
Source: Mineral Economics Directorate, DMR
* Mineral Economics Directorate, Richardsbay Coal Terminal and Grindrod Terminals
South Africa’s coal exports increased by 1.4 percent to 76.4 Mt in 2016 from 75.4 Mt in 2015. Asia continued to be the leading importer of South African coal in 2016. Asia / Far East accounted for 67.38 percent of South Africa’s total exports, up from the 58 percent in 2015, followed by Europe’s 11.79 percent and Africa’s 10.63 percent (Figure 19).
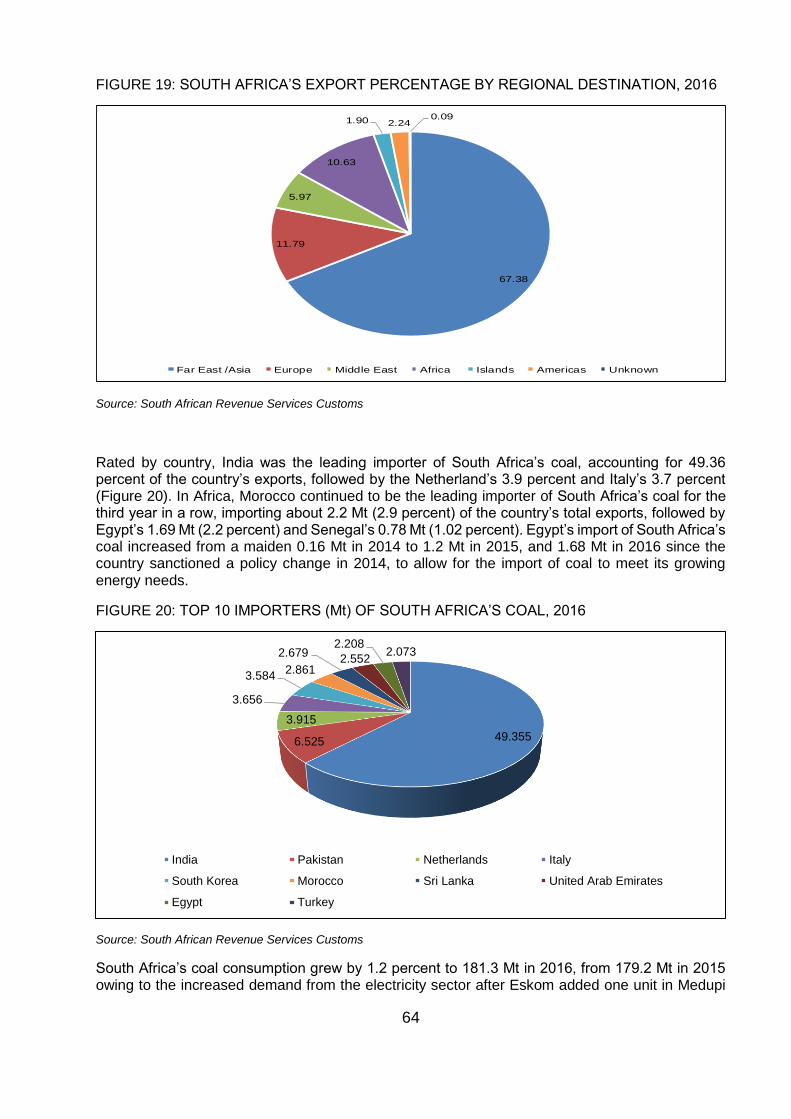
64
FIGURE 19: SOUTH AFRICA’S EXPORT PERCENTAGE BY REGIONAL DESTINATION, 2016
Source: South African Revenue Services Customs
Rated by country, India was the leading importer of South Africa’s coal, accounting for 49.36 percent of the country’s exports, followed by the Netherland’s 3.9 percent and Italy’s 3.7 percent (Figure 20). In Africa, Morocco continued to be the leading importer of South Africa’s coal for the third year in a row, importing about 2.2 Mt (2.9 percent) of the country’s total exports, followed by Egypt’s 1.69 Mt (2.2 percent) and Senegal’s 0.78 Mt (1.02 percent). Egypt’s import of South Africa’s coal increased from a maiden 0.16 Mt in 2014 to 1.2 Mt in 2015, and 1.68 Mt in 2016 since the country sanctioned a policy change in 2014, to allow for the import of coal to meet its growing energy needs.
FIGURE 20: TOP 10 IMPORTERS (Mt) OF SOUTH AFRICA’S COAL, 2016
Source: South African Revenue Services Customs
South Africa’s coal consumption grew by 1.2 percent to 181.3 Mt in 2016, from 179.2 Mt in 2015 owing to the increased demand from the electricity sector after Eskom added one unit in Medupi
67.38
11.79
5.97
10.63
1.90 2.240.09
Far East /Asia Europe Middle East Africa Islands Americas Unknown
49.3556.525
3.915
3.656
3.5842.861
2.6792.552
2.2082.073
India Pakistan Netherlands Italy
South Korea Morocco Sri Lanka United Arab Emirates
Egypt Turkey
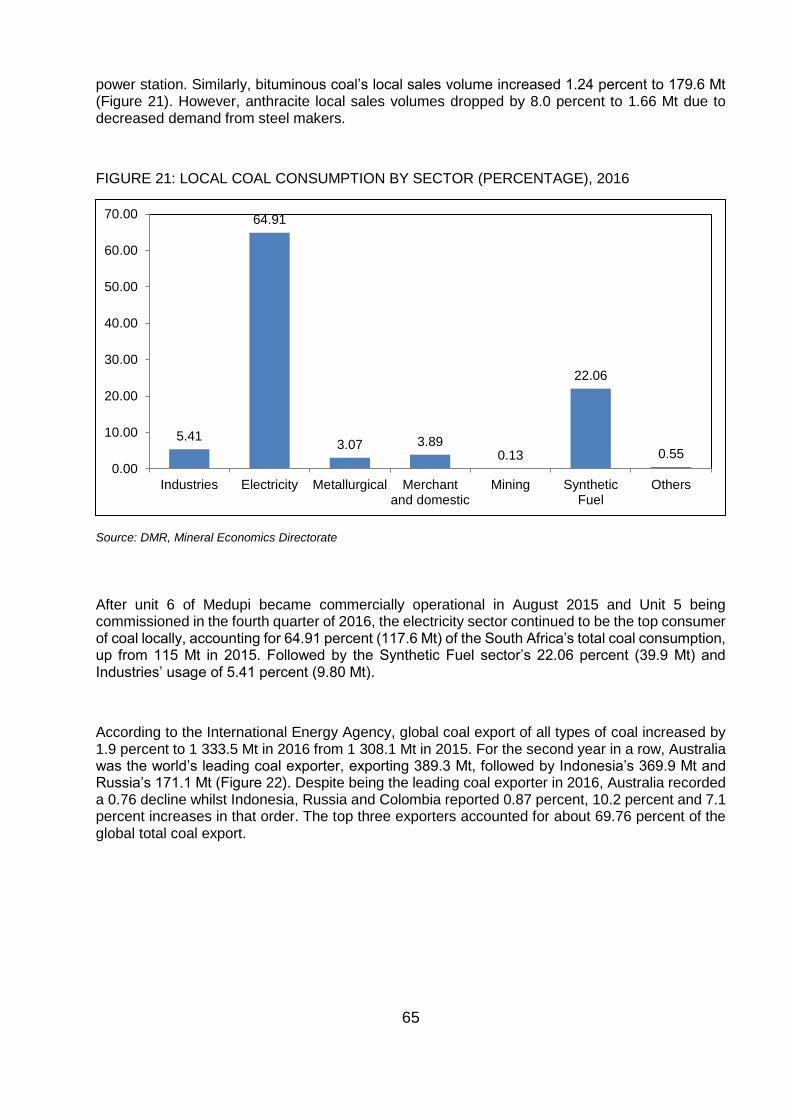
65
power station. Similarly, bituminous coal’s local sales volume increased 1.24 percent to 179.6 Mt (Figure 21). However, anthracite local sales volumes dropped by 8.0 percent to 1.66 Mt due to decreased demand from steel makers.
FIGURE 21: LOCAL COAL CONSUMPTION BY SECTOR (PERCENTAGE), 2016
Source: DMR, Mineral Economics Directorate
After unit 6 of Medupi became commercially operational in August 2015 and Unit 5 being commissioned in the fourth quarter of 2016, the electricity sector continued to be the top consumer of coal locally, accounting for 64.91 percent (117.6 Mt) of the South Africa’s total coal consumption, up from 115 Mt in 2015. Followed by the Synthetic Fuel sector’s 22.06 percent (39.9 Mt) and Industries’ usage of 5.41 percent (9.80 Mt).
According to the International Energy Agency, global coal export of all types of coal increased by 1.9 percent to 1 333.5 Mt in 2016 from 1 308.1 Mt in 2015. For the second year in a row, Australia was the world’s leading coal exporter, exporting 389.3 Mt, followed by Indonesia’s 369.9 Mt and Russia’s 171.1 Mt (Figure 22). Despite being the leading coal exporter in 2016, Australia recorded a 0.76 decline whilst Indonesia, Russia and Colombia reported 0.87 percent, 10.2 percent and 7.1 percent increases in that order. The top three exporters accounted for about 69.76 percent of the global total coal export.
5.41
64.91
3.07 3.890.13
22.06
0.550.00
10.00
20.00
30.00
40.00
50.00
60.00
70.00
Industries Electricity Metallurgical Merchantand domestic
Mining SyntheticFuel
Others
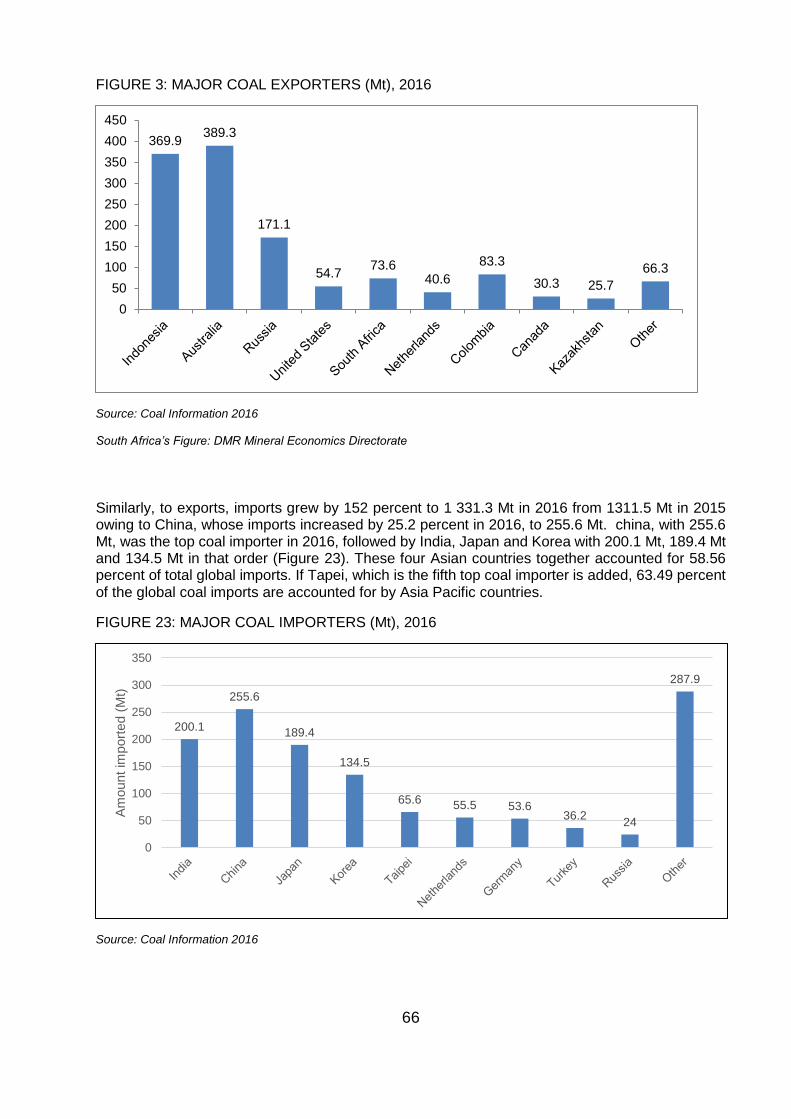
66
FIGURE 3: MAJOR COAL EXPORTERS (Mt), 2016
Source: Coal Information 2016
South Africa’s Figure: DMR Mineral Economics Directorate
Similarly, to exports, imports grew by 152 percent to 1 331.3 Mt in 2016 from 1311.5 Mt in 2015 owing to China, whose imports increased by 25.2 percent in 2016, to 255.6 Mt. china, with 255.6 Mt, was the top coal importer in 2016, followed by India, Japan and Korea with 200.1 Mt, 189.4 Mt and 134.5 Mt in that order (Figure 23). These four Asian countries together accounted for 58.56 percent of total global imports. If Tapei, which is the fifth top coal importer is added, 63.49 percent of the global coal imports are accounted for by Asia Pacific countries.
FIGURE 23: MAJOR COAL IMPORTERS (Mt), 2016
Source: Coal Information 2016
369.9389.3
171.1
54.773.6
40.6
83.3
30.3 25.7
66.3
0
50
100
150
200
250
300
350
400
450
200.1
255.6
189.4
134.5
65.6 55.5 53.636.2
24
287.9
0
50
100
150
200
250
300
350
Am
ount im
port
ed (
Mt)
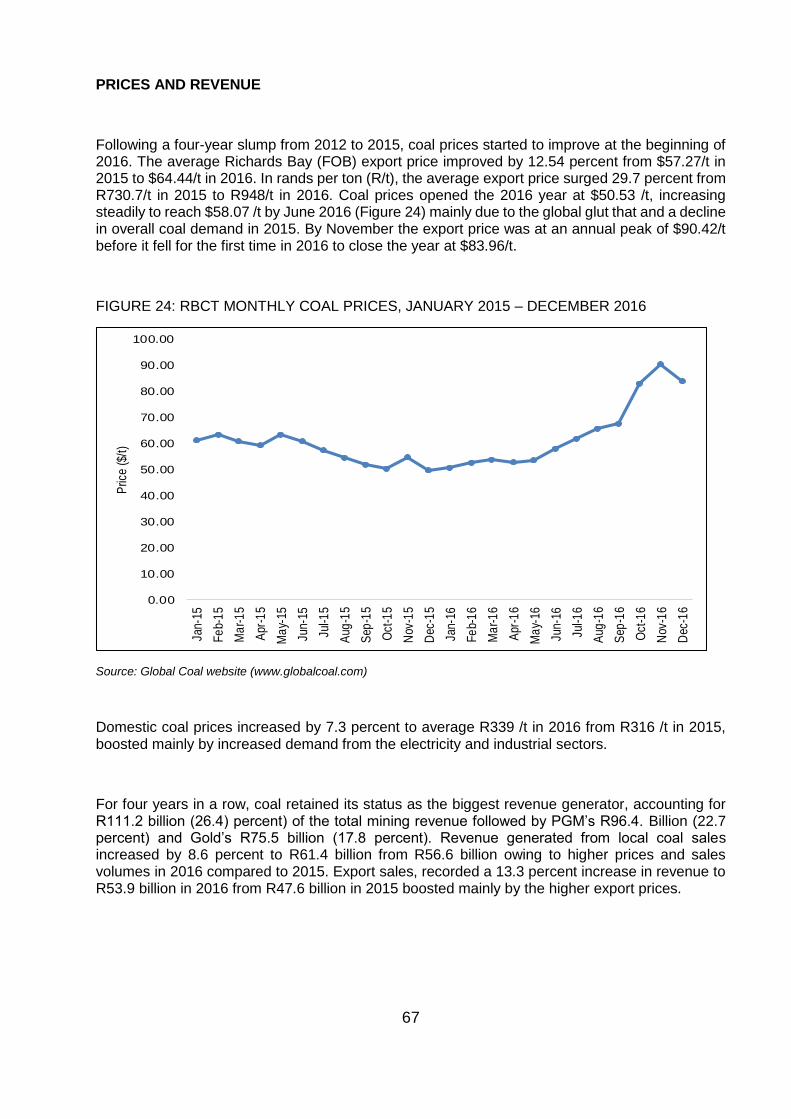
67
PRICES AND REVENUE
Following a four-year slump from 2012 to 2015, coal prices started to improve at the beginning of 2016. The average Richards Bay (FOB) export price improved by 12.54 percent from $57.27/t in 2015 to $64.44/t in 2016. In rands per ton (R/t), the average export price surged 29.7 percent from R730.7/t in 2015 to R948/t in 2016. Coal prices opened the 2016 year at $50.53 /t, increasing steadily to reach $58.07 /t by June 2016 (Figure 24) mainly due to the global glut that and a decline in overall coal demand in 2015. By November the export price was at an annual peak of $90.42/t before it fell for the first time in 2016 to close the year at $83.96/t.
FIGURE 24: RBCT MONTHLY COAL PRICES, JANUARY 2015 – DECEMBER 2016
Source: Global Coal website (www.globalcoal.com)
Domestic coal prices increased by 7.3 percent to average R339 /t in 2016 from R316 /t in 2015, boosted mainly by increased demand from the electricity and industrial sectors.
For four years in a row, coal retained its status as the biggest revenue generator, accounting for R111.2 billion (26.4) percent) of the total mining revenue followed by PGM’s R96.4. Billion (22.7 percent) and Gold’s R75.5 billion (17.8 percent). Revenue generated from local coal sales increased by 8.6 percent to R61.4 billion from R56.6 billion owing to higher prices and sales volumes in 2016 compared to 2015. Export sales, recorded a 13.3 percent increase in revenue to R53.9 billion in 2016 from R47.6 billion in 2015 boosted mainly by the higher export prices.
0.00
10.00
20.00
30.00
40.00
50.00
60.00
70.00
80.00
90.00
100.00
Jan-
15
Fe
b-1
5
Ma
r-1
5
Apr
-15
Ma
y-15
Jun-
15
Jul-1
5
Aug
-15
Sep
-15
Oct
-15
Nov
-15
Dec
-15
Jan-
16
Fe
b-1
6
Ma
r-1
6
Apr
-16
Ma
y-16
Jun-
16
Jul-1
6
Aug
-16
Sep
-16
Oct
-16
Nov
-16
Dec
-16
Pric
e ($
/t)
68
MAJOR DEVELOPMENTS IN 2016
In January 2016, Eskom announced its plans to move to fixed-price coal contracts, rather than the cost-plus coal procurement strategy. This is according to their new sourcing strategy, seeks to contain coal cost escalation. The strategy states that Eskom will primarily use competitive open market bidding for fair, equitable, cost-effective and transparent opportunity to all potential suppliers. This will also allow for coal contract flexibility to cater for demand changes and market volatility.
In another development, Keaton Energy placed its Vaalkrantz Colliery, in Kwazulu-Natal, on care and maintenance as the operation was no longer profitable. Keaton Energy has cited the ongoing global decline in coal prices, force majeure declared by its biggest customer and the unavailability of water owing to the continued drought in the region as the reasons for placing Vaalkrantz on care and maintenance.
In February 2016, Anglo American (AA) announced plans to refocus the group on a core portfolio of 16 diamond, platinum-group metals and copper assets, with its South African and Australian coal assets and its South African iron-ore operations put up for sale. This measure will, according to Anglo American sustainably improve cash flows and materially reduce net debt and enable a much more efficient and effective management of assets.
SGS, the world’s leading inspection, verification, testing and Certification Company, opened a R49 million coal sampling laboratory at the Richards Bay Coal Terminal (RBCT) in June 2016. This new 2,203 square metre, state-of-the-art laboratory is more than twice the size of the previous laboratory and will support efficient coal preparation, sampling and certification. The new laboratory is designed to service RBCT’s requirements up to 110 Mt of coal per annum and will improve sampling and testing turnaround time by 25%.
In August 2016, Wescoal secured a five-year coal supply agreement (CSA) with Eskom for the Elandspruit mine. Following this, in September 2016, the company secured further coal export contracts to raise exports to more than one million tonnes a year (Mt/y). Also in September, Wescoal entered into a subscription agreement with a consortium of shareholders to increase its black ownership to 59 percent.
In another major development that boosted the coal industry when it comes to production and employment, Universal Coal commissioned its New Clydesdale colliery, in Mpumalanga in September 2016. Subsequently, in November 2016, the company signed a coal supply agreement with Eskom for the supply of 1.2 Mt/y of coal for seven years from this newly commissioned mine.
In October 2016, Resource Generation signed a head of agreement with a preferred mining contractor for its Boikarabelo mine, in Limpopo. In the same month, amid ongoing discussions with a financing syndicate, Resource Generation announced a delay in the first coal production target for this mine, from the last quarter of 2018, to the first quarter of 2019.
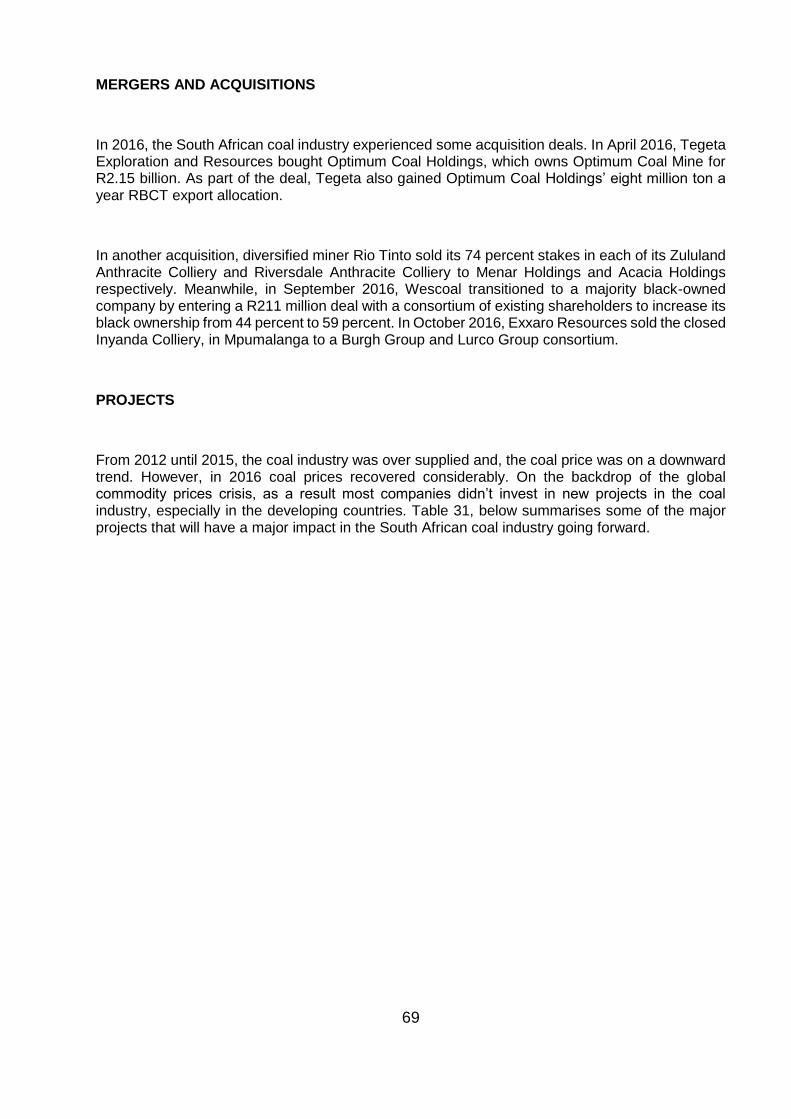
69
MERGERS AND ACQUISITIONS
In 2016, the South African coal industry experienced some acquisition deals. In April 2016, Tegeta Exploration and Resources bought Optimum Coal Holdings, which owns Optimum Coal Mine for R2.15 billion. As part of the deal, Tegeta also gained Optimum Coal Holdings’ eight million ton a year RBCT export allocation.
In another acquisition, diversified miner Rio Tinto sold its 74 percent stakes in each of its Zululand Anthracite Colliery and Riversdale Anthracite Colliery to Menar Holdings and Acacia Holdings respectively. Meanwhile, in September 2016, Wescoal transitioned to a majority black-owned company by entering a R211 million deal with a consortium of existing shareholders to increase its black ownership from 44 percent to 59 percent. In October 2016, Exxaro Resources sold the closed Inyanda Colliery, in Mpumalanga to a Burgh Group and Lurco Group consortium.
PROJECTS
From 2012 until 2015, the coal industry was over supplied and, the coal price was on a downward trend. However, in 2016 coal prices recovered considerably. On the backdrop of the global commodity prices crisis, as a result most companies didn’t invest in new projects in the coal industry, especially in the developing countries. Table 31, below summarises some of the major projects that will have a major impact in the South African coal industry going forward.
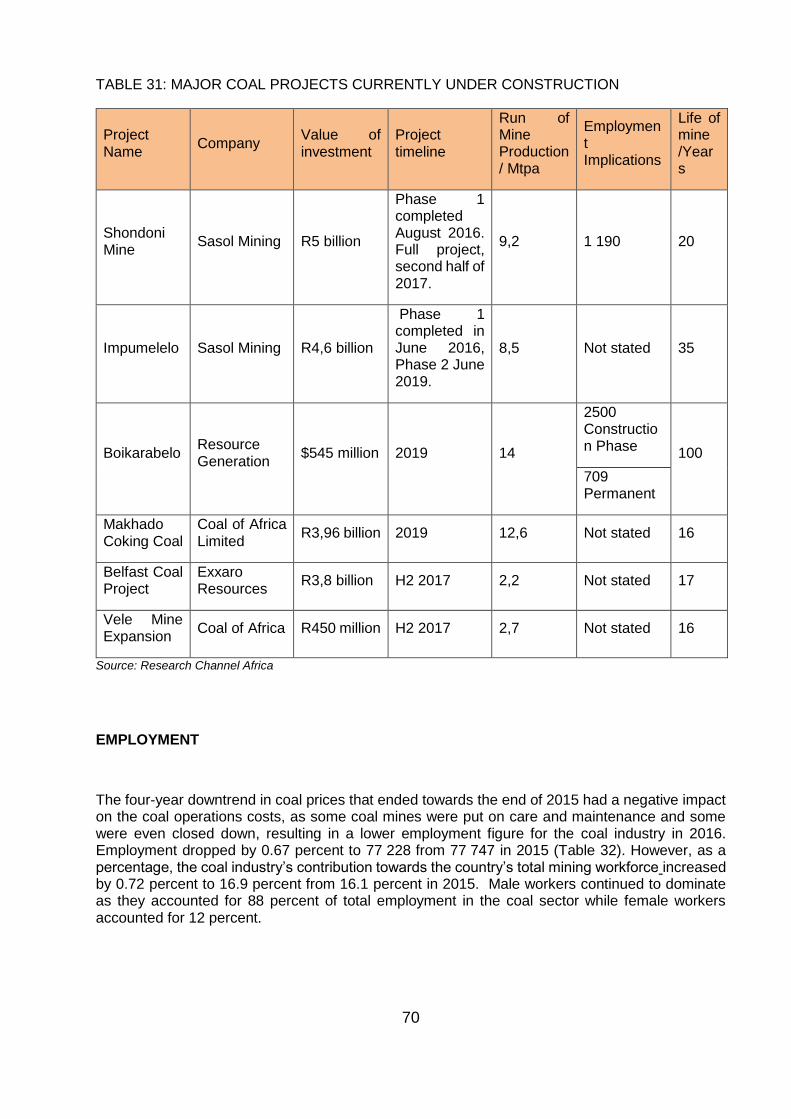
70
TABLE 31: MAJOR COAL PROJECTS CURRENTLY UNDER CONSTRUCTION
Project Name
Company Value of investment
Project timeline
Run of Mine Production / Mtpa
Employment Implications
Life of mine /Years
Shondoni Mine
Sasol Mining R5 billion
Phase 1 completed August 2016. Full project, second half of 2017.
9,2 1 190 20
Impumelelo Sasol Mining R4,6 billion
Phase 1 completed in June 2016, Phase 2 June 2019.
8,5 Not stated 35
Boikarabelo Resource Generation
$545 million 2019 14
2500 Construction Phase
100
709 Permanent
Makhado Coking Coal
Coal of Africa Limited
R3,96 billion 2019 12,6 Not stated 16
Belfast Coal Project
Exxaro Resources
R3,8 billion H2 2017 2,2 Not stated 17
Vele Mine Expansion
Coal of Africa R450 million H2 2017 2,7 Not stated 16
Source: Research Channel Africa
EMPLOYMENT
The four-year downtrend in coal prices that ended towards the end of 2015 had a negative impact on the coal operations costs, as some coal mines were put on care and maintenance and some were even closed down, resulting in a lower employment figure for the coal industry in 2016. Employment dropped by 0.67 percent to 77 228 from 77 747 in 2015 (Table 32). However, as a percentage, the coal industry’s contribution towards the country’s total mining workforce increased by 0.72 percent to 16.9 percent from 16.1 percent in 2015. Male workers continued to dominate as they accounted for 88 percent of total employment in the coal sector while female workers accounted for 12 percent.
71
TABLE 13: EMPLOYMENT IN THE COAL SECTOR, 2007 – 2016
Year
Average Employees Earnings – R 1000
Total Male Female Total Males Females
2007 60 439 56 582 3 857 8 692 014 8 107 180 584 834
2008 65 484 60 804 4 680 11 020 687 10 194 389 826 298
2009 70 791 65 227 5 564 12 815 351 11 717 347 1 098 004
2010 74 025 67 348 6 677 14 186 482 12 803 317 1 383 166
2011 78 580 71 545 7 035 16 094 850 14 523 209 1 571 641
2012 78 579 71 542 7 037 16 039 447 14 469 109 1 570 338
2013 88 039 79 270 8 769 18 949 314 16 855 402 2 0939 13
2014 86 242 77 109 9 133 20 581 868 18 156 465 2 425 403
2015 77 747 68 820 8 927 19 932 153 17 412 771 2 519 383
2016 77 228 67 912 9 316 21 108 109 18 366 847 2 741 261
Source: DMR, Mineral Economics Directorate
In 2016, earnings in the coal sector grew by 5.9 percent to R21.1 billion from R19.8 billion in 2015 owing to the increased payments of severance and terminations in 2016. Average per capita earnings were R273 322, representing 6.6 percent increase from 2015’s R256 372. Average per capita earnings in the coal industry was lower than the country’s mining industry’s average of R263 182. Productivity in the coal industry, in terms of production per employee fell by 0.22 percent to 3.24 kt per employee in 2016 from 3.25 kt per employee in 2015.
OUTLOOK
Globally, there has been a slowdown in energy consumption growth. At the same time, technological advances have increased the availability of different fuels. However, coal continues to be the backbone of global electricity generation and still makes up 40 percent of global electricity.
Even as coal declines in Europe and America, the shift to the East is accelerating. Coal is the preferred option to increase power generation in growing economies that face electricity shortages. Solid consumption and growth is expected for India, Vietnam, and Indonesia, although China will continue to be the largest coal consumer by far. According to the BP Energy Outlook 2017, coal production will increase by 0.4 percent to 7 297.7 Mt in 2017.
The Vele Mine and Makhado Coking Coal will be crucial for the country’s metallurgical industry. South Africa has potential to be a net exporter of coking coal if these two projects become operational at the levels envisioned. Coal will continue to be an important source of primary energy in South Africa for the next decade or more. It is predicted that the country’s coal production will
72
grow in 2017 and breach the 260 Mt mark, following the price recovery and the restarting of several mines. Some coal producers are also developing some new mines while, other producers are expanding current operations. The South African coal export price is expected to continue with the upward trend and average above $90 /t, even though it will still be lower than the highest average of above $110 /t reached in 2011 /12. Coal exports are also expected to grow to reach about 77 Mt in 2017.
REFERENCES
1. BP Statistical Review of World Energy, June 2017 2. www.globalCoal.com 3. Real Economy Yearbook, 2017. Creamer media publication 4. Coal Information 2016, International Energy Agency – OECD/IEA
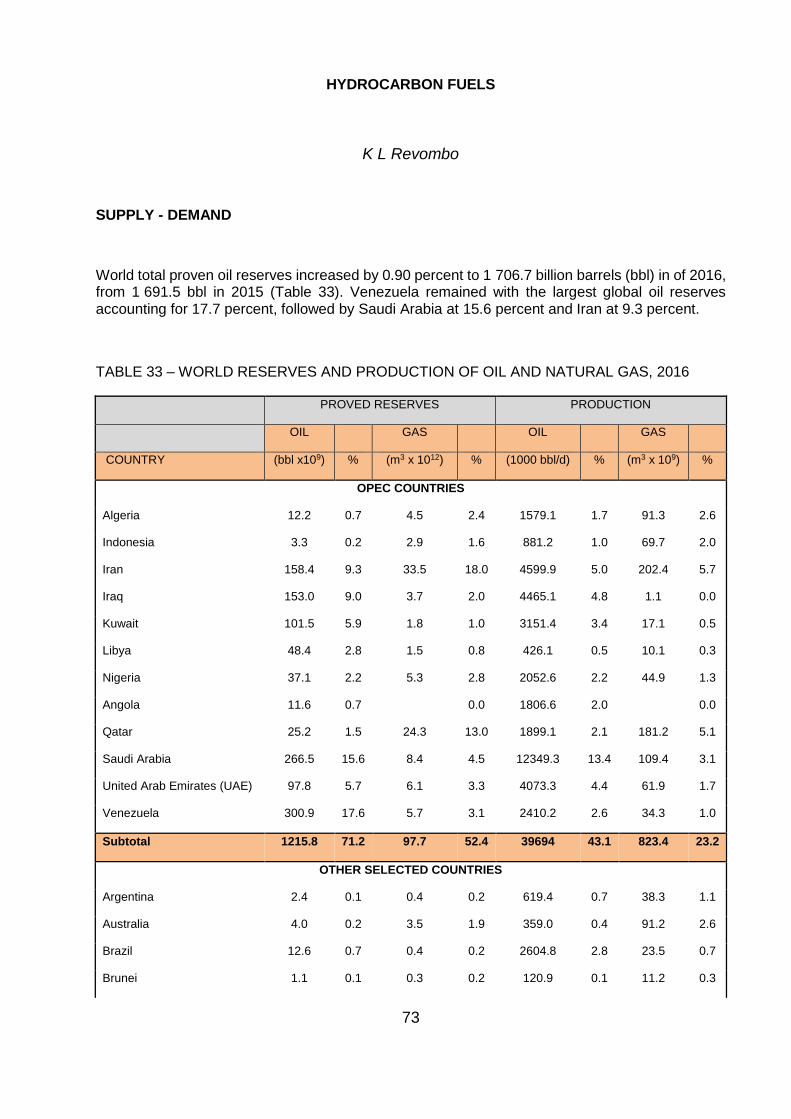
73
HYDROCARBON FUELS
K L Revombo
SUPPLY - DEMAND
World total proven oil reserves increased by 0.90 percent to 1 706.7 billion barrels (bbl) in of 2016, from 1 691.5 bbl in 2015 (Table 33). Venezuela remained with the largest global oil reserves accounting for 17.7 percent, followed by Saudi Arabia at 15.6 percent and Iran at 9.3 percent.
TABLE 33 – WORLD RESERVES AND PRODUCTION OF OIL AND NATURAL GAS, 2016
PROVED RESERVES PRODUCTION
OIL GAS OIL GAS
COUNTRY (bbl x109) % (m3 x 1012) % (1000 bbl/d) % (m3 x 109) %
OPEC COUNTRIES
Algeria 12.2 0.7 4.5 2.4 1579.1 1.7 91.3 2.6
Indonesia 3.3 0.2 2.9 1.6 881.2 1.0 69.7 2.0
Iran 158.4 9.3 33.5 18.0 4599.9 5.0 202.4 5.7
Iraq 153.0 9.0 3.7 2.0 4465.1 4.8 1.1 0.0
Kuwait 101.5 5.9 1.8 1.0 3151.4 3.4 17.1 0.5
Libya 48.4 2.8 1.5 0.8 426.1 0.5 10.1 0.3
Nigeria 37.1 2.2 5.3 2.8 2052.6 2.2 44.9 1.3
Angola 11.6 0.7 0.0 1806.6 2.0 0.0
Qatar 25.2 1.5 24.3 13.0 1899.1 2.1 181.2 5.1
Saudi Arabia 266.5 15.6 8.4 4.5 12349.3 13.4 109.4 3.1
United Arab Emirates (UAE) 97.8 5.7 6.1 3.3 4073.3 4.4 61.9 1.7
Venezuela 300.9 17.6 5.7 3.1 2410.2 2.6 34.3 1.0
Subtotal 1215.8 71.2 97.7 52.4 39694 43.1 823.4 23.2
OTHER SELECTED COUNTRIES
Argentina 2.4 0.1 0.4 0.2 619.4 0.7 38.3 1.1
Australia 4.0 0.2 3.5 1.9 359.0 0.4 91.2 2.6
Brazil 12.6 0.7 0.4 0.2 2604.8 2.8 23.5 0.7
Brunei 1.1 0.1 0.3 0.2 120.9 0.1 11.2 0.3
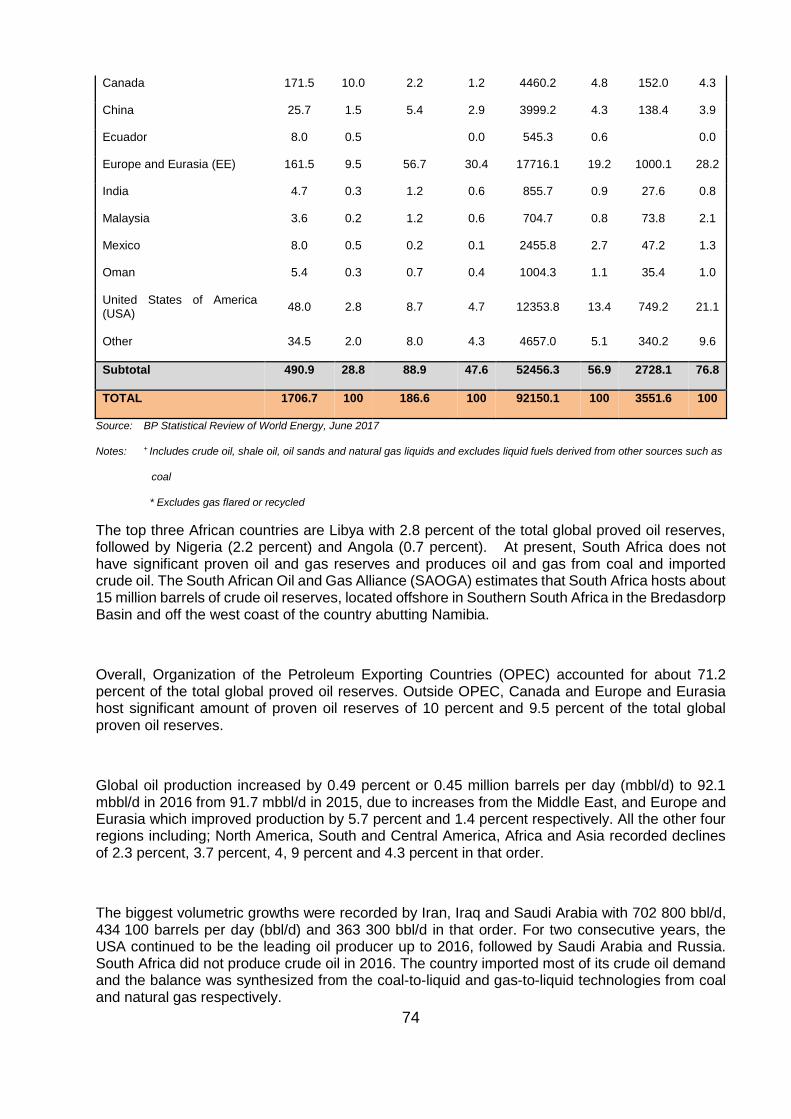
74
Canada 171.5 10.0 2.2 1.2 4460.2 4.8 152.0 4.3
China 25.7 1.5 5.4 2.9 3999.2 4.3 138.4 3.9
Ecuador 8.0 0.5
0.0 545.3 0.6 0.0
Europe and Eurasia (EE) 161.5 9.5 56.7 30.4 17716.1 19.2 1000.1 28.2
India 4.7 0.3 1.2 0.6 855.7 0.9 27.6 0.8
Malaysia 3.6 0.2 1.2 0.6 704.7 0.8 73.8 2.1
Mexico 8.0 0.5 0.2 0.1 2455.8 2.7 47.2 1.3
Oman 5.4 0.3 0.7 0.4 1004.3 1.1 35.4 1.0
United States of America (USA)
48.0 2.8 8.7 4.7 12353.8 13.4 749.2 21.1
Other 34.5 2.0 8.0 4.3 4657.0 5.1 340.2 9.6
Subtotal 490.9 28.8 88.9 47.6 52456.3 56.9 2728.1 76.8
TOTAL 1706.7 100 186.6 100 92150.1 100 3551.6 100
Source: BP Statistical Review of World Energy, June 2017
Notes: + Includes crude oil, shale oil, oil sands and natural gas liquids and excludes liquid fuels derived from other sources such as
coal
* Excludes gas flared or recycled
The top three African countries are Libya with 2.8 percent of the total global proved oil reserves, followed by Nigeria (2.2 percent) and Angola (0.7 percent). At present, South Africa does not have significant proven oil and gas reserves and produces oil and gas from coal and imported crude oil. The South African Oil and Gas Alliance (SAOGA) estimates that South Africa hosts about 15 million barrels of crude oil reserves, located offshore in Southern South Africa in the Bredasdorp Basin and off the west coast of the country abutting Namibia.
Overall, Organization of the Petroleum Exporting Countries (OPEC) accounted for about 71.2 percent of the total global proved oil reserves. Outside OPEC, Canada and Europe and Eurasia host significant amount of proven oil reserves of 10 percent and 9.5 percent of the total global proven oil reserves.
Global oil production increased by 0.49 percent or 0.45 million barrels per day (mbbl/d) to 92.1 mbbl/d in 2016 from 91.7 mbbl/d in 2015, due to increases from the Middle East, and Europe and Eurasia which improved production by 5.7 percent and 1.4 percent respectively. All the other four regions including; North America, South and Central America, Africa and Asia recorded declines of 2.3 percent, 3.7 percent, 4, 9 percent and 4.3 percent in that order.
The biggest volumetric growths were recorded by Iran, Iraq and Saudi Arabia with 702 800 bbl/d, 434 100 barrels per day (bbl/d) and 363 300 bbl/d in that order. For two consecutive years, the USA continued to be the leading oil producer up to 2016, followed by Saudi Arabia and Russia. South Africa did not produce crude oil in 2016. The country imported most of its crude oil demand and the balance was synthesized from the coal-to-liquid and gas-to-liquid technologies from coal and natural gas respectively.
75
The world’s proven gas reserves grew by 0.64 percent to 186.6 trillion cubic metres (tcm) in 2016 from 185.4 tcm in 2015. The Middle East accounted for 42.5 percent of the reserves, followed by Europe and Eurasia’s 30.4 percent and Asia’s 9.4 percent. The top three countries with the highest gas reserves were Iran, Russia and Qatar, accounting for 18.0 percent, 17.3 percent and 13.0 percent of the global reserves, in that order.
Currently, South Africa has very small gas reserves. However, the country has a potential for unconventional gas in the form of Coal Bed Methane (CBM) and shale gas. The Council for Geosciences estimates that South Africa has about 390 trillion cubic feet (tcf) of technically recoverable natural gas that can be extracted from shale and this is embedded in the Karoo Basin. SAOGA reports that South Africa has 10 to 20 tcf of coalbed methane resources.
Like oil, global gas production marginally grew by 0.60 percent to 3 551.6 billion cubic metres (bcm)
in 2016 from 3 530.6 bcm in 2015. Europe and Eurasia, which accounted for 28.2 percent of the global total gas production, was the largest producer, followed by USA’s 21.7 percent and Iran’s 5.4 percent. Countries that recorded the largest increases in gas production were Australia, Iraq and Peru, with growths of 25.5 percent, 12.9 percent and 11.7 percent in that order. For two consecutive years, Yemen recorded the world’s largest percent decline of 73.4 percent in 2016, followed distantly by Italy’s 14.8 percent.
South Africa’s natural gas production plunged 38.47 percent to 0.65 Mt in 2016 from 1.05 Mt in 2015 as reserves continue to dwindle. Similarly, Natural gas condensate production decreased by 45.34 percent to 0.039 Mt from 0.071 Mt.
Global primary energy consumption increased by just 1.0 percent in 2016, following growth of 0.90 percent in 2015 and 1.0 percent in 2014. The Asia and Middle East regions recorded the biggest growth of 2.1 percent, followed by Africa’s 1.2 percent and Europe & Eurasia’s 0.4 percent. North America and South & Central America regions recorded negative growths of 0.4 percent and 1.0 percent respectively. Chinese growth slowed to 1.3 percent, while India with 5.4 percent recorded another robust increase in consumption. Despite the sluggish growth in energy consumption in 2016, China remained the world’s largest growth market for energy for a 16th consecutive year. Overall, emerging economies continued to increase their stake in global energy consumption. Chinese primary energy consumption remained the world’s largest, accounting for 23 percent of the total global primary energy consumption, followed by the USA’s 17.1 percent and India’s 5.5 percent. Oil remained the world’s leading energy source, accounting for a third of global energy consumption at 33.3 percent, followed by coal’s 28.1 percent, natural gas’s 24.1 percent, nuclear’s 4.46 percent, hydroelectric’s 6.86 percent and renewables 3.16 percent.
In 2016, global oil consumption grew by an average of 1.5 percent (1.6 mbbl/d). The USA continued to be the largest oil consumer in 2016 at 20.3 percent (19 631 tbbl/d), followed by China’s 12.8 percent (12 381 tbbl/d) and India’s 4.6 percent (4 489 tbbl/d).
World natural gas consumption grew by 1.5 percent to 3 468.6 billion m3 (bcm) in 2016. Europe and Eurasia accounted for 28.9 percent of the global total consumption, followed by North America’s 27.7 percent and Asia’s 20.3 percent. Africa’s consumption remained constant at 3.9 percent of the world’s total gas consumption in 2016, the lowest consumption of all regions. By
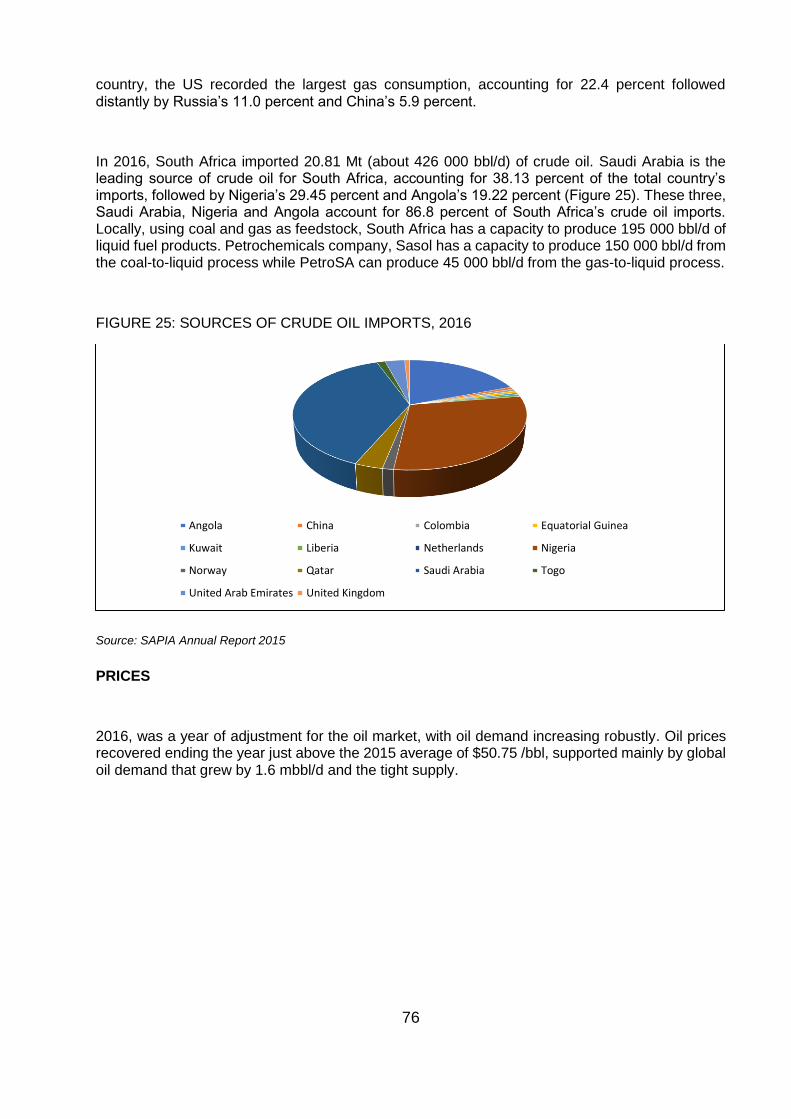
76
country, the US recorded the largest gas consumption, accounting for 22.4 percent followed distantly by Russia’s 11.0 percent and China’s 5.9 percent.
In 2016, South Africa imported 20.81 Mt (about 426 000 bbl/d) of crude oil. Saudi Arabia is the leading source of crude oil for South Africa, accounting for 38.13 percent of the total country’s imports, followed by Nigeria’s 29.45 percent and Angola’s 19.22 percent (Figure 25). These three, Saudi Arabia, Nigeria and Angola account for 86.8 percent of South Africa’s crude oil imports. Locally, using coal and gas as feedstock, South Africa has a capacity to produce 195 000 bbl/d of liquid fuel products. Petrochemicals company, Sasol has a capacity to produce 150 000 bbl/d from the coal-to-liquid process while PetroSA can produce 45 000 bbl/d from the gas-to-liquid process.
FIGURE 25: SOURCES OF CRUDE OIL IMPORTS, 2016
Source: SAPIA Annual Report 2015
PRICES
2016, was a year of adjustment for the oil market, with oil demand increasing robustly. Oil prices recovered ending the year just above the 2015 average of $50.75 /bbl, supported mainly by global oil demand that grew by 1.6 mbbl/d and the tight supply.
Angola China Colombia Equatorial Guinea
Kuwait Liberia Netherlands Nigeria
Norway Qatar Saudi Arabia Togo
United Arab Emirates United Kingdom
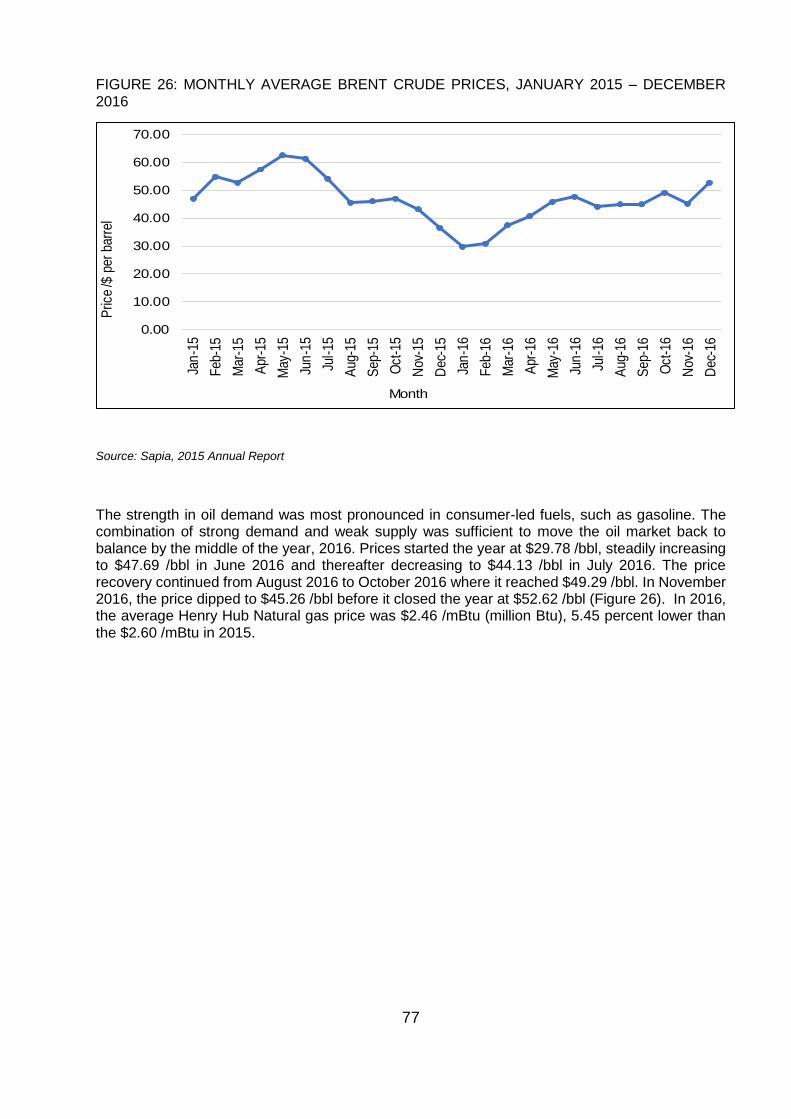
77
FIGURE 26: MONTHLY AVERAGE BRENT CRUDE PRICES, JANUARY 2015 – DECEMBER 2016
Source: Sapia, 2015 Annual Report
The strength in oil demand was most pronounced in consumer-led fuels, such as gasoline. The combination of strong demand and weak supply was sufficient to move the oil market back to balance by the middle of the year, 2016. Prices started the year at $29.78 /bbl, steadily increasing to $47.69 /bbl in June 2016 and thereafter decreasing to $44.13 /bbl in July 2016. The price recovery continued from August 2016 to October 2016 where it reached $49.29 /bbl. In November 2016, the price dipped to $45.26 /bbl before it closed the year at $52.62 /bbl (Figure 26). In 2016, the average Henry Hub Natural gas price was $2.46 /mBtu (million Btu), 5.45 percent lower than the $2.60 /mBtu in 2015.
0.00
10.00
20.00
30.00
40.00
50.00
60.00
70.00
Jan
-15
Feb
-15
Mar
-15
Apr
-15
May
-15
Jun
-15
Jul-
15
Aug
-15
Sep
-15
Oct
-15
Nov
-15
Dec
-15
Jan
-16
Feb
-16
Mar
-16
Apr
-16
May
-16
Jun
-16
Jul-
16
Aug
-16
Sep
-16
Oct
-16
Nov
-16
Dec
-16
Pric
e /$
per
bar
rel
Month
78
DEVELOPMENTS
In May 2016, Renergen and Afrox, a subsidiary of the Linde Group, announced on SENS the commercialisation of South Africa’s first onshore Helium and Natural Gas field in the Free State. The 187 000-hectare Helium and Natural Gas field in Virginia, near Welkom, has proven reserves of 25 billion cubic feet of Natural Gas and Helium and is the first and only onshore petroleum (and Natural Gas) right in South Africa capable of supplying Helium to numerous specialised and industrial markets. Helium, despite being the second most abundant gas, is relatively scarce and tends to be found trapped with Natural Gas in relatively low concentrations, typically up to 1 percent by volume of the gas released. The Free State Helium and Natural Gas field however, enjoys concentrations of up to 4 percent by volume. Tetra4, the natural gas subsidiary of JSE-listed energy company Renegern, is responsible for the operations at the gas fields.
In October 2016, the Academy of Science of South Africa (ASSAf), published a report titled, South Africa’s Technical Readiness to Support the Shale Gas Industry”. ASSAf was requested by the Department of Science and Technology (DST) to conduct this assessment. ASSAf partnered with the South African Academy of Engineering (SAAE) in this study. The report indicated that the amount of shale gas available in South Africa was still unclear, with estimates ranging between 20 trillion cubic feet (tcf) and over 400 tcf and, none of these reserves has yet been proven and lower value is probably closer to reality. And since shale gas exploitation requires the use of relatively large quantities of water, greater clarity was needed on the availability of alternative water sources such as underground saline water. The report went on to indicate that baseline studies were needed to ascertain the deep level underground geological characteristics of the Karoo and the current status of the environment.
And finally, according to this ASSAf’s report on South Africa’s technical readiness to support the shale gas industry, urgent steps need to be implemented by relevant government departments, in collaboration with industry, to coordinate all skills planning initiatives to develop a single, coordinated development plan for the shale gas industry.
OUTLOOK
According to the BP Energy outlook 2017, the overall demand for energy is set to continue to expand, as developing economies will be uplifting billions of people. The oil and gas sector is still a very exciting space and will continue to be economically vital for years to come.
For the second year in a row, South Africa did not produce any crude oil in 2016, as there were no new commercially viable oil fields discoveries made recently. It is not clear as to when PetroSA will restart crude oil production. The country’s oil industry can be revived by the offshore Orange Basin near Namibia, which is believed to hold substantial oil and gas resources.
South Africa’s Hydrocarbon industry has been growing very slowly because of resources depletion. However, the Shale gas in the Karoo Basin will change the fortunes for this industry. The South African government, together with research institutes and universities are busy with research work
79
aiming at supporting the Shale Gas Industry. Natural gas will play an important role in the country’s transition to a cleaner energy future, with applications in electricity, heat and transport. The amount of shale gas available in South Africa ranges between 20 trillion cubic feet (tcf) and over 400 tcf. This industry has potential to create about 200 thousand direct and indirect jobs and to add more than R80 billion to the South African economy.
For South Africa, in the next three to 10 years, the exploration activities for shale gas and crude oil will be dominating the local hydrocarbon industry. Production levels in this industry will remain modest during this period.
REFERENCES
.
1. BP Statistical Review of World Energy, June 2017.
2. Academy of Science of South Africa, South Africa’s Technical Readiness to Support the Shale Gas industry, October 2016.
3. Mineral Economics Directorate, DMR
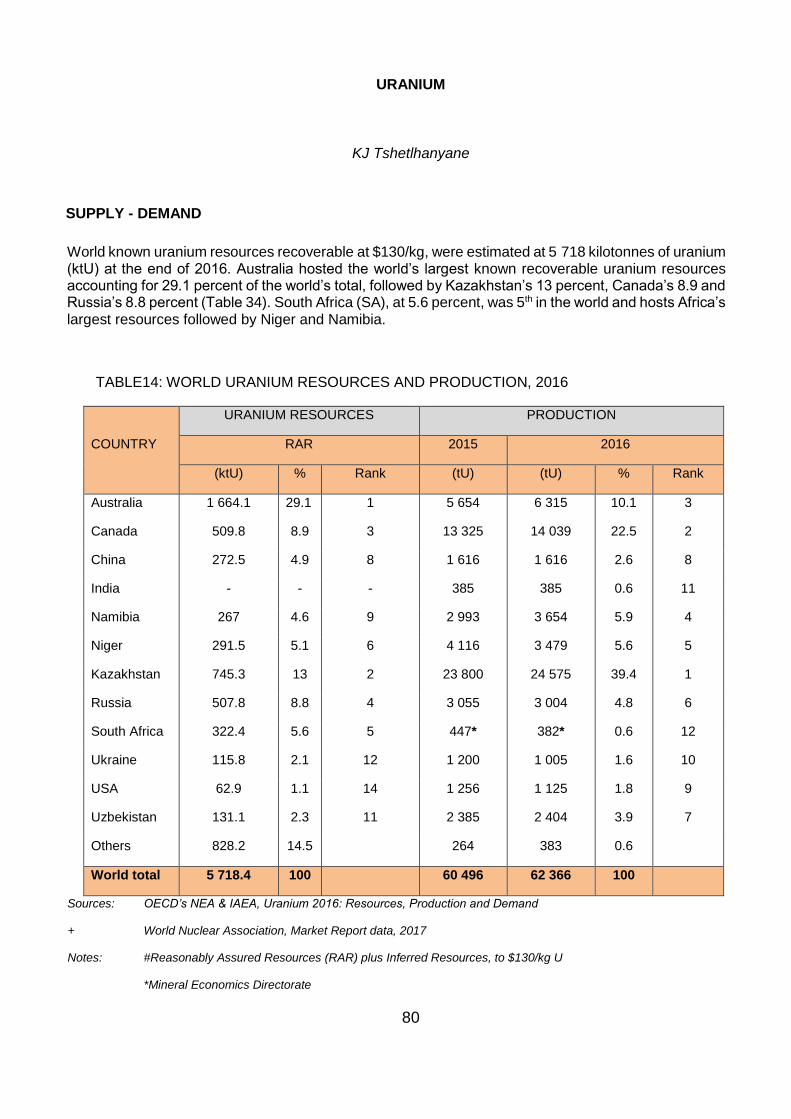
80
URANIUM
KJ Tshetlhanyane
SUPPLY - DEMAND
World known uranium resources recoverable at $130/kg, were estimated at 5 718 kilotonnes of uranium (ktU) at the end of 2016. Australia hosted the world’s largest known recoverable uranium resources accounting for 29.1 percent of the world’s total, followed by Kazakhstan’s 13 percent, Canada’s 8.9 and Russia’s 8.8 percent (Table 34). South Africa (SA), at 5.6 percent, was 5th in the world and hosts Africa’s largest resources followed by Niger and Namibia.
TABLE14: WORLD URANIUM RESOURCES AND PRODUCTION, 2016
COUNTRY
URANIUM RESOURCES PRODUCTION
RAR 2015 2016
(ktU) % Rank (tU) (tU) % Rank
Australia 1 664.1 29.1 1 5 654 6 315 10.1 3
Canada 509.8 8.9 3 13 325 14 039 22.5 2
China 272.5 4.9 8 1 616 1 616 2.6 8
India - - - 385 385 0.6 11
Namibia 267 4.6 9 2 993 3 654 5.9 4
Niger 291.5 5.1 6 4 116 3 479 5.6 5
Kazakhstan 745.3 13 2 23 800 24 575 39.4 1
Russia 507.8 8.8 4 3 055 3 004 4.8 6
South Africa 322.4 5.6 5 447* 382* 0.6 12
Ukraine 115.8 2.1 12 1 200 1 005 1.6 10
USA 62.9 1.1 14 1 256 1 125 1.8 9
Uzbekistan 131.1 2.3 11 2 385 2 404 3.9 7
Others 828.2 14.5
264 383 0.6
World total 5 718.4 100
60 496 62 366 100
Sources: OECD’s NEA & IAEA, Uranium 2016: Resources, Production and Demand
+ World Nuclear Association, Market Report data, 2017
Notes: #Reasonably Assured Resources (RAR) plus Inferred Resources, to $130/kg U
*Mineral Economics Directorate
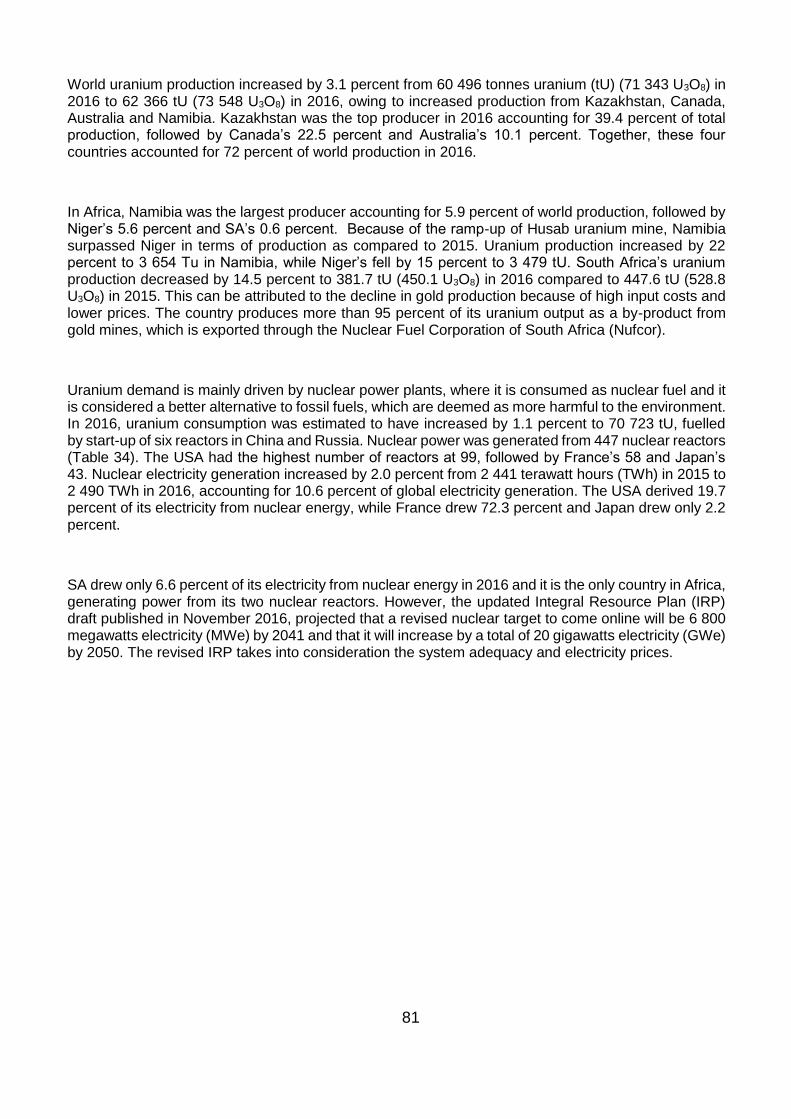
81
World uranium production increased by 3.1 percent from 60 496 tonnes uranium (tU) (71 343 U3O8) in 2016 to 62 366 tU (73 548 U3O8) in 2016, owing to increased production from Kazakhstan, Canada, Australia and Namibia. Kazakhstan was the top producer in 2016 accounting for 39.4 percent of total production, followed by Canada’s 22.5 percent and Australia’s 10.1 percent. Together, these four countries accounted for 72 percent of world production in 2016.
In Africa, Namibia was the largest producer accounting for 5.9 percent of world production, followed by Niger’s 5.6 percent and SA’s 0.6 percent. Because of the ramp-up of Husab uranium mine, Namibia surpassed Niger in terms of production as compared to 2015. Uranium production increased by 22 percent to 3 654 Tu in Namibia, while Niger’s fell by 15 percent to 3 479 tU. South Africa’s uranium production decreased by 14.5 percent to 381.7 tU (450.1 U3O8) in 2016 compared to 447.6 tU (528.8 U3O8) in 2015. This can be attributed to the decline in gold production because of high input costs and lower prices. The country produces more than 95 percent of its uranium output as a by-product from gold mines, which is exported through the Nuclear Fuel Corporation of South Africa (Nufcor).
Uranium demand is mainly driven by nuclear power plants, where it is consumed as nuclear fuel and it is considered a better alternative to fossil fuels, which are deemed as more harmful to the environment. In 2016, uranium consumption was estimated to have increased by 1.1 percent to 70 723 tU, fuelled by start-up of six reactors in China and Russia. Nuclear power was generated from 447 nuclear reactors (Table 34). The USA had the highest number of reactors at 99, followed by France’s 58 and Japan’s 43. Nuclear electricity generation increased by 2.0 percent from 2 441 terawatt hours (TWh) in 2015 to 2 490 TWh in 2016, accounting for 10.6 percent of global electricity generation. The USA derived 19.7 percent of its electricity from nuclear energy, while France drew 72.3 percent and Japan drew only 2.2 percent.
SA drew only 6.6 percent of its electricity from nuclear energy in 2016 and it is the only country in Africa, generating power from its two nuclear reactors. However, the updated Integral Resource Plan (IRP) draft published in November 2016, projected that a revised nuclear target to come online will be 6 800 megawatts electricity (MWe) by 2041 and that it will increase by a total of 20 gigawatts electricity (GWe) by 2050. The revised IRP takes into consideration the system adequacy and electricity prices.
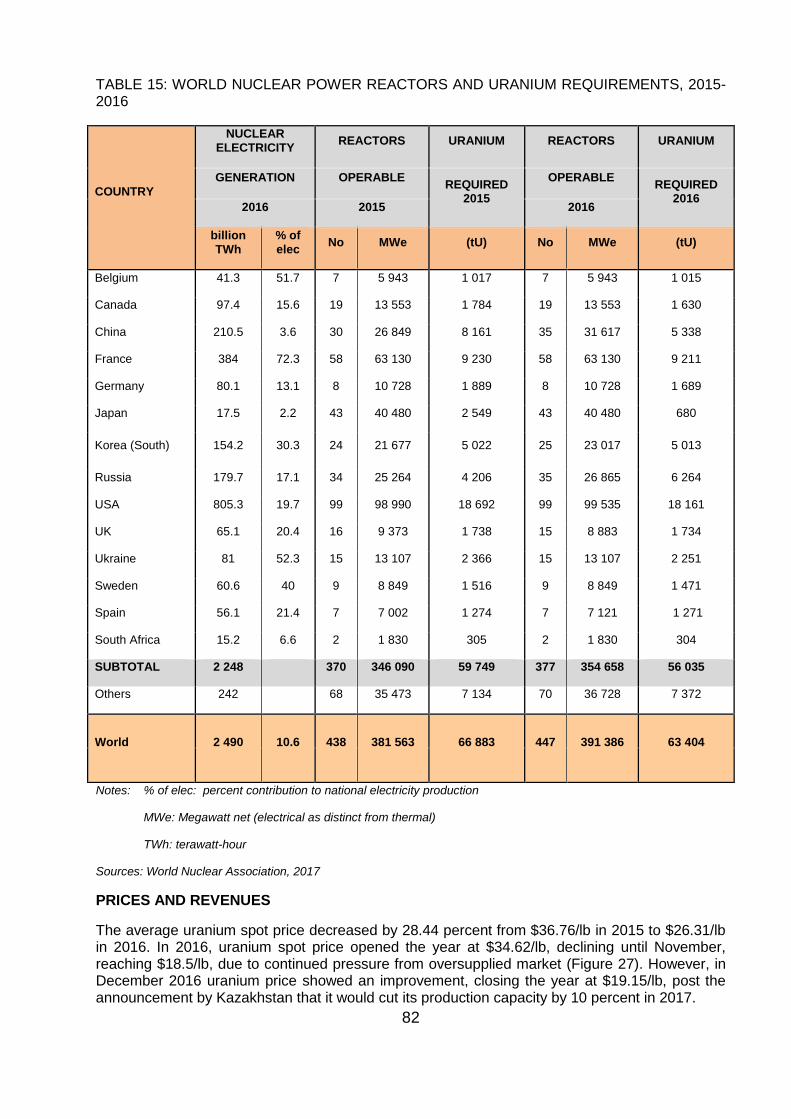
82
TABLE 15: WORLD NUCLEAR POWER REACTORS AND URANIUM REQUIREMENTS, 2015-2016
COUNTRY
NUCLEAR
ELECTRICITY REACTORS URANIUM REACTORS URANIUM
GENERATION OPERABLE REQUIRED
2015
OPERABLE REQUIRED
2016 2016 2015 2016
billion
TWh
% of
elec No MWe (tU) No MWe (tU)
Belgium 41.3 51.7 7 5 943 1 017 7 5 943 1 015
Canada 97.4 15.6 19 13 553 1 784 19 13 553 1 630
China 210.5 3.6 30 26 849 8 161 35 31 617 5 338
France 384 72.3 58 63 130 9 230 58 63 130 9 211
Germany 80.1 13.1 8 10 728 1 889 8 10 728 1 689
Japan 17.5 2.2 43 40 480 2 549 43 40 480 680
Korea (South) 154.2 30.3 24 21 677 5 022 25 23 017 5 013
Russia 179.7 17.1 34 25 264 4 206 35 26 865 6 264
USA 805.3 19.7 99 98 990 18 692 99 99 535 18 161
UK 65.1 20.4 16 9 373 1 738 15 8 883 1 734
Ukraine 81 52.3 15 13 107 2 366 15 13 107 2 251
Sweden 60.6 40 9 8 849 1 516 9 8 849 1 471
Spain 56.1 21.4 7 7 002 1 274 7 7 121 1 271
South Africa 15.2 6.6 2 1 830 305 2 1 830 304
SUBTOTAL 2 248 370 346 090 59 749 377 354 658 56 035
Others 242 68 35 473 7 134 70 36 728 7 372
World 2 490 10.6 438 381 563 66 883 447 391 386 63 404
Notes: % of elec: percent contribution to national electricity production
MWe: Megawatt net (electrical as distinct from thermal)
TWh: terawatt-hour
Sources: World Nuclear Association, 2017
PRICES AND REVENUES
The average uranium spot price decreased by 28.44 percent from $36.76/lb in 2015 to $26.31/lb in 2016. In 2016, uranium spot price opened the year at $34.62/lb, declining until November, reaching $18.5/lb, due to continued pressure from oversupplied market (Figure 27). However, in December 2016 uranium price showed an improvement, closing the year at $19.15/lb, post the announcement by Kazakhstan that it would cut its production capacity by 10 percent in 2017.
83
FIGURE 27: AVERAGE MONTHLY SPOT URANIUM PRICES, 2015-2017.
Source: Indexmundi.com
South Africa’s export sales unit value was no exception, as it recorded a decline of 26.76 percent from R1 065/lb in 2015 to R780/lb in 2016. The country’s uranium total sales revenue fell by 35.99 percent to R309 million in 2016 as compared with the previous year, due to decrease in prices and sales quantity. Total sales quantity decreased by 12.59 percent to 396 kt in 2016.
DEVELOPMENTS
The final feasibility study of Sibanye Gold’s West Rand Tailings Retreatment Project together with its front-end engineering design, was completed in the final quarter of 2016 thereby giving a go-ahead for construction of the project. The West Rand Tailings Retreatment Project has a total of 677.3 Mt of mineral reserves from Driefontein, Kloof and Cooke tailings storage facilities, containing 6.2 Moz of gold and 97.2 Mlb of uranium. The company plans to produce 900 000 lb of uranium in the first phase of the project, which will allow for the recovery of 31.1 Mlb of saleable uranium over the first 40 years of the project.
To successfully implement the project, the company is awaiting permits from regulators to construct high volume capacity network of pipelines connecting reclamation stations, thickeners and processing plants for economical extraction of gold and uranium. Regulators are expected to award permits during the second quarter of 2017.
0
5
10
15
20
25
30
35
40
45$
/lb
Months
84
OUTLOOK
Global uranium production is estimated to reach 74 000 tonnes in 2017, due to expected increase in output from Canada and Russia. Production from other parts of the world is expected to remain slow as low prices continue to put pressure on profits. Global supply from Uranium inventories held by nuclear utilities in secondary market continues to rise. It is estimated that nuclear utilities have sufficient inventories to cover up supply, for around seven years in China, around five years in Japan and about two years and six months in the USA.
South Africa’s uranium production is expected to remain stable in 2017 as the current low-price situation is not encouraging investment in existing projects. However, looking ahead of 2017 the West Rand Tailings Retreatment Project will add capacity to the country’s production once production starts.
Uranium demand which is mainly driven by development of new nuclear reactors, is estimated to reach 88 300 tonnes in 2017, owing to initial start-ups of reactors from Japan. New nuclear capacity is also expected to be developed in China and India, where energy policies are embracing nuclear energy to provide low carbon emitting base-load electricity. China has 21 nuclear power plants under construction and a further 35 plants are expected to commence construction by 2020. The government of India is aiming to derive a quarter of India’s electricity generation from nuclear sources by 2050.
Uranium prices have been constrained by uncertainties since the 2011 Fukushima nuclear disaster in Japan that led to decrease in demand of uranium. The uranium spot price has been on a decline since the accident, due to market oversupply. New nuclear facilities planned or expected to come online in the coming years as well as production curb, will reduce the supply surplus in the market, thereby causing possible price improvements. Prices are expected to average $25/lbs in 2017 and $28/lbs in 2018.
REFERENCES
1. Creamer Media, Uranium Report 2016
2. Schneider, Antony Froggatt et al, World Nuclear Industry Status Report 2016
3. World Nuclear Association, World Nuclear Power Reactors & Uranium Requirements, December 2016
4. http://www.wise-uranium.org/uissr14.html
5. Uranium 2016, Resources, Production and Demand, NEA No. 7209, OECD 2016
6. http://www.uraniumparticipation.com/s/Uranium_Market.asp
7. https://mininginmalawi.com/2017/05/23/kayelekera-reserves-for-6-more-years/
8. https://www.linkedin.com/pulse/update-a-cap-resources-letlhakane-uranium-project-botswana-taylor
85
NONFERROUS METALS AND MINERALS
OVERVIEW
L Ramane
INTRODUCTION South Africa is well endowed with non-ferrous minerals, particularly titanium and zirconium resources, which are found in heavy mineral sands along the coastal provinces of this country including Kwa-Zulu Natal, Eastern Cape and Western Cape. Cobalt, copper and nickel are produced as by-products of platinum mining in the Bushveld Complex. Copper is mainly found in the Palabora Complex in the Limpopo Province, with zirconium and nickel being produced as by-products. Lead and zinc deposits associated with copper are mined near Aggeneys, Northern Cape. Nickel deposits are mined in the Uitkomst Complex near Badplaas in the Mpumalanga Province. Antimony deposits are located in the Limpopo Province. PRODUCTION AND SALES In 2016, South Africa’s production of primary non-ferrous metals and minerals, excluding titanium and zircon, fell by 8.5 percent to 182 kt compared with 199 kt the previous year due to a decline in production of some metals particularly copper (-15.6%), nickel (-13.6%) and zinc (-8.1%) (Table 36). Local sales volume and revenue decreased by 20.7 and 19.5 percent, respectively. The decline was a result of the drop in sales of major base metals including cobalt and copper. Additionally, export sales volume and revenue also declined by 4.5 and 15.8 percent to 136.4 kt and R9.04 billion, as a result of a weaker demand from major consuming countries. South Africa’s total production of non-ferrous metals and minerals (primary and processed), excluding titanium and zircon minerals weakened by 13.4 percent from 1 691 kt in 2015 to 1 465 kt in 2016. Total sales volumes amounted to 1 450 Mt excluding titanium and zircon minerals, and total sales revenue was R32.9 billion.
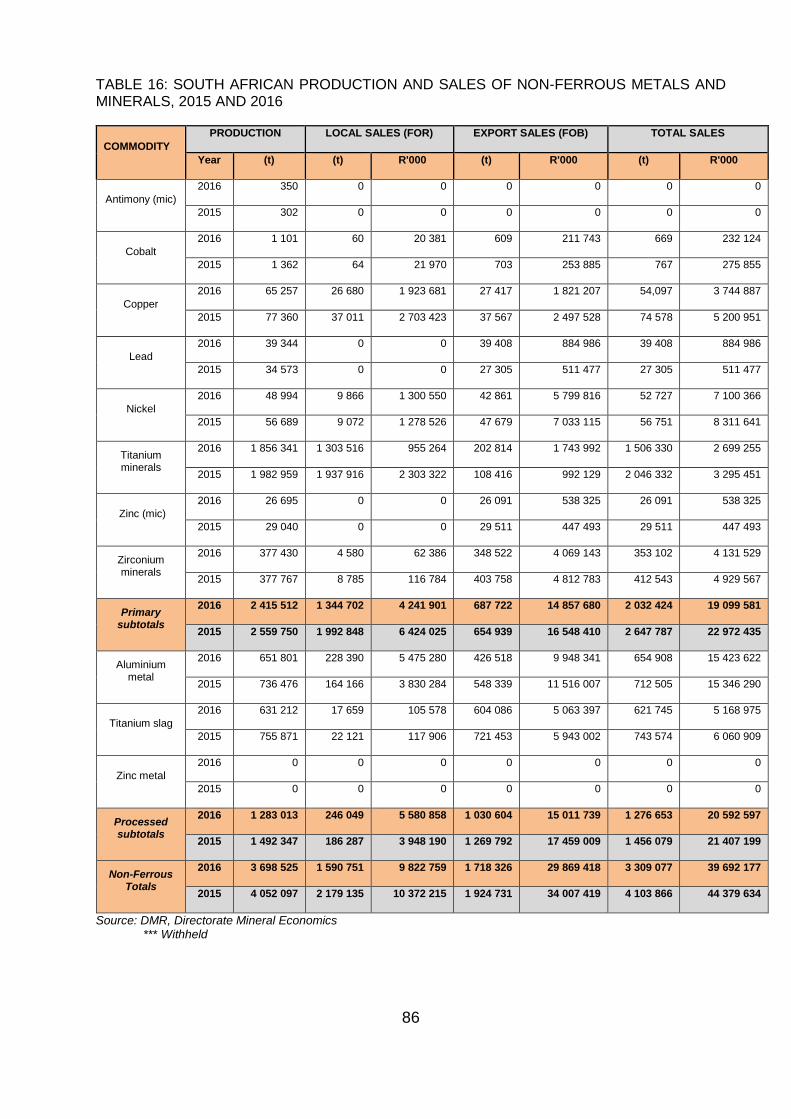
86
TABLE 16: SOUTH AFRICAN PRODUCTION AND SALES OF NON-FERROUS METALS AND MINERALS, 2015 AND 2016
COMMODITY
PRODUCTION LOCAL SALES (FOR) EXPORT SALES (FOB) TOTAL SALES
Year (t) (t) R'000 (t) R'000 (t) R'000
Antimony (mic)
2016 350 0 0 0 0 0 0
2015 302 0 0 0 0 0 0
Cobalt
2016 1 101 60 20 381 609 211 743 669 232 124
2015 1 362 64 21 970 703 253 885 767 275 855
Copper
2016 65 257 26 680 1 923 681 27 417 1 821 207 54,097 3 744 887
2015 77 360 37 011 2 703 423 37 567 2 497 528 74 578 5 200 951
Lead
2016 39 344 0 0 39 408 884 986 39 408 884 986
2015 34 573 0 0 27 305 511 477 27 305 511 477
Nickel
2016 48 994 9 866 1 300 550 42 861 5 799 816 52 727 7 100 366
2015 56 689 9 072 1 278 526 47 679 7 033 115 56 751 8 311 641
Titanium minerals
2016 1 856 341 1 303 516 955 264 202 814 1 743 992 1 506 330 2 699 255
2015 1 982 959 1 937 916 2 303 322 108 416 992 129 2 046 332 3 295 451
Zinc (mic)
2016 26 695 0 0 26 091 538 325 26 091 538 325
2015 29 040 0 0 29 511 447 493 29 511 447 493
Zirconium minerals
2016 377 430 4 580 62 386 348 522 4 069 143 353 102 4 131 529
2015 377 767 8 785 116 784 403 758 4 812 783 412 543 4 929 567
Primary subtotals
2016 2 415 512 1 344 702 4 241 901 687 722 14 857 680 2 032 424 19 099 581
2015 2 559 750 1 992 848 6 424 025 654 939 16 548 410 2 647 787 22 972 435
Aluminium metal
2016 651 801 228 390 5 475 280 426 518 9 948 341 654 908 15 423 622
2015 736 476 164 166 3 830 284 548 339 11 516 007 712 505 15 346 290
Titanium slag
2016 631 212 17 659 105 578 604 086 5 063 397 621 745 5 168 975
2015 755 871 22 121 117 906 721 453 5 943 002 743 574 6 060 909
Zinc metal
2016 0 0 0 0 0 0 0
2015 0 0 0 0 0 0 0
Processed subtotals
2016 1 283 013 246 049 5 580 858 1 030 604 15 011 739 1 276 653 20 592 597
2015 1 492 347 186 287 3 948 190 1 269 792 17 459 009 1 456 079 21 407 199
Non-Ferrous Totals
2016 3 698 525 1 590 751 9 822 759 1 718 326 29 869 418 3 309 077 39 692 177
2015 4 052 097 2 179 135 10 372 215 1 924 731 34 007 419 4 103 866 44 379 634
Source: DMR, Directorate Mineral Economics *** Withheld
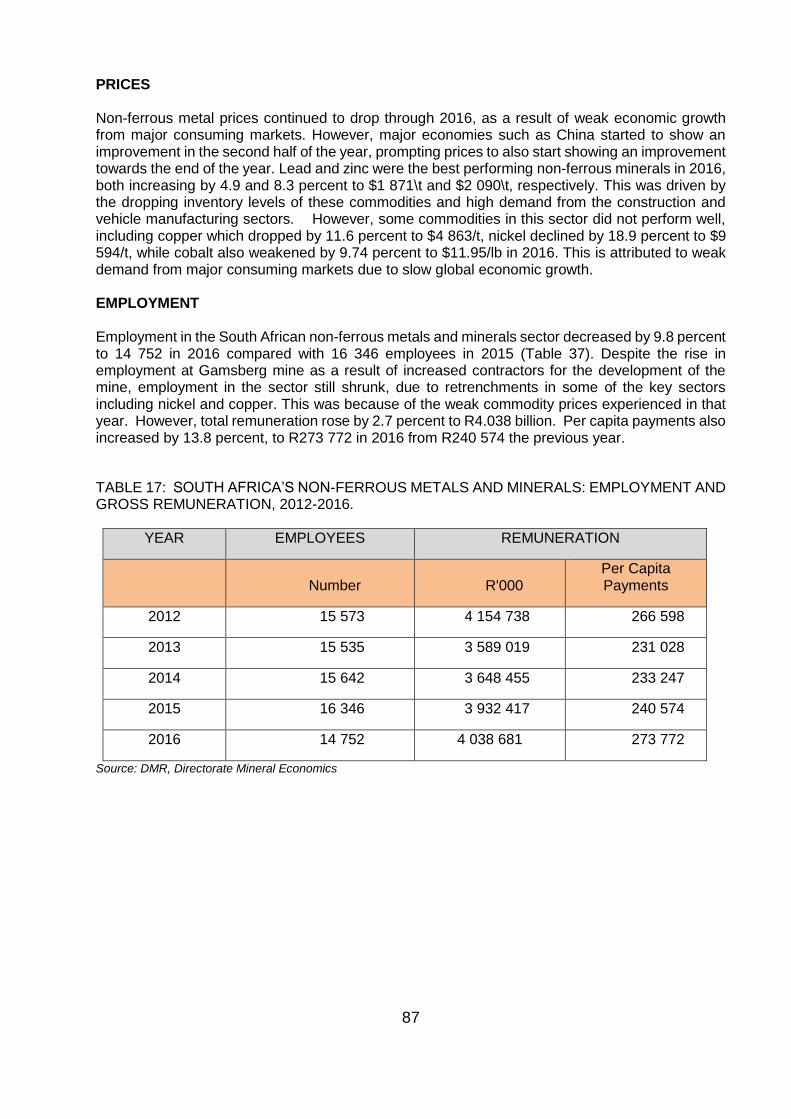
87
PRICES Non-ferrous metal prices continued to drop through 2016, as a result of weak economic growth from major consuming markets. However, major economies such as China started to show an improvement in the second half of the year, prompting prices to also start showing an improvement towards the end of the year. Lead and zinc were the best performing non-ferrous minerals in 2016, both increasing by 4.9 and 8.3 percent to $1 871\t and $2 090\t, respectively. This was driven by the dropping inventory levels of these commodities and high demand from the construction and vehicle manufacturing sectors. However, some commodities in this sector did not perform well, including copper which dropped by 11.6 percent to $4 863/t, nickel declined by 18.9 percent to $9 594/t, while cobalt also weakened by 9.74 percent to $11.95/lb in 2016. This is attributed to weak demand from major consuming markets due to slow global economic growth. EMPLOYMENT Employment in the South African non-ferrous metals and minerals sector decreased by 9.8 percent to 14 752 in 2016 compared with 16 346 employees in 2015 (Table 37). Despite the rise in employment at Gamsberg mine as a result of increased contractors for the development of the mine, employment in the sector still shrunk, due to retrenchments in some of the key sectors including nickel and copper. This was because of the weak commodity prices experienced in that year. However, total remuneration rose by 2.7 percent to R4.038 billion. Per capita payments also increased by 13.8 percent, to R273 772 in 2016 from R240 574 the previous year.
TABLE 17: SOUTH AFRICA’S NON-FERROUS METALS AND MINERALS: EMPLOYMENT AND GROSS REMUNERATION, 2012-2016.
YEAR EMPLOYEES REMUNERATION
Number R'000
Per Capita Payments
2012 15 573 4 154 738 266 598
2013 15 535 3 589 019 231 028
2014 15 642 3 648 455 233 247
2015 16 346 3 932 417 240 574
2016 14 752 4 038 681 273 772
Source: DMR, Directorate Mineral Economics
88
OUTLOOK The construction and transport sectors are the main drivers of the consumption of non-ferrous minerals and metals. Demand for these minerals is on a positive trajectory, surpassing their supply. As a result, prices of these commodities are also currently displaying significant improvement and this is expected to continue into 2018. Supply growth for copper will be driven mostly by ramp-ups and new projects in 2019. Demand is also anticipated to be strong, driven by global electrification demand, renewable energy project, construction and the increasing uptake of electric vehicles. However, a slowing Chinese property market is expected to weigh on growth. Nickel production is projected to rise as Indonesia eased its export ban in January 2017. Its demand is also expected to grow in the production of stainless steel and nickel-based batteries in electric vehicles (EVs). The production of South Africa’s nonferrous minerals is expected to increase in the short term due to higher output from the titanium, nickel, cobalt, lead and zinc sectors. This is due to improved demand for these minerals as a result of better economic growth and consumer spending. South Africa’s mid-term budget in October 2017, set aside R948 billion for infrastructural development for the next three years, which will further propel the demand for these minerals REFERENCES
1. Metal-Pages, various articles 2. Mineral Economics Directorate, DMR 3. Creamer Media’s Base Metals Report – December 2016 4. USGS, Mineral Commodity Summaries, 2016 5. http://www.treasury.gov.za/documents/mtbps/2016/mtbps/speech.pdf 6. https://www.fastmarkets.com/base-metals-news 7. Afriforesight, Monthly Commodity Industries Report Beginning February 2018
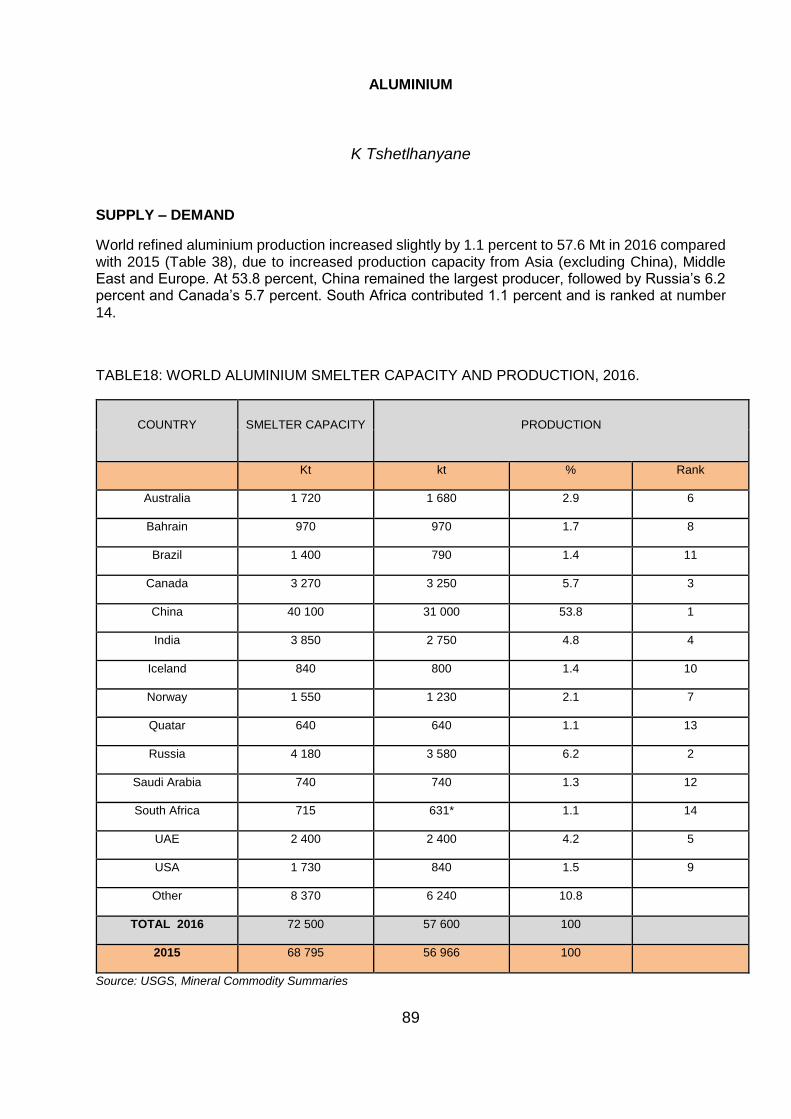
89
ALUMINIUM
K Tshetlhanyane
SUPPLY – DEMAND
World refined aluminium production increased slightly by 1.1 percent to 57.6 Mt in 2016 compared with 2015 (Table 38), due to increased production capacity from Asia (excluding China), Middle East and Europe. At 53.8 percent, China remained the largest producer, followed by Russia’s 6.2 percent and Canada’s 5.7 percent. South Africa contributed 1.1 percent and is ranked at number 14.
TABLE18: WORLD ALUMINIUM SMELTER CAPACITY AND PRODUCTION, 2016.
COUNTRY SMELTER CAPACITY PRODUCTION
Kt kt % Rank
Australia 1 720 1 680 2.9 6
Bahrain 970 970 1.7 8
Brazil 1 400 790 1.4 11
Canada 3 270 3 250 5.7 3
China 40 100 31 000 53.8 1
India 3 850 2 750 4.8 4
Iceland 840 800 1.4 10
Norway 1 550 1 230 2.1 7
Quatar 640 640 1.1 13
Russia 4 180 3 580 6.2 2
Saudi Arabia 740 740 1.3 12
South Africa 715 631* 1.1 14
UAE 2 400 2 400 4.2 5
USA 1 730 840 1.5 9
Other 8 370 6 240 10.8
TOTAL 2016 72 500 57 600 100
2015 68 795 56 966 100
Source: USGS, Mineral Commodity Summaries
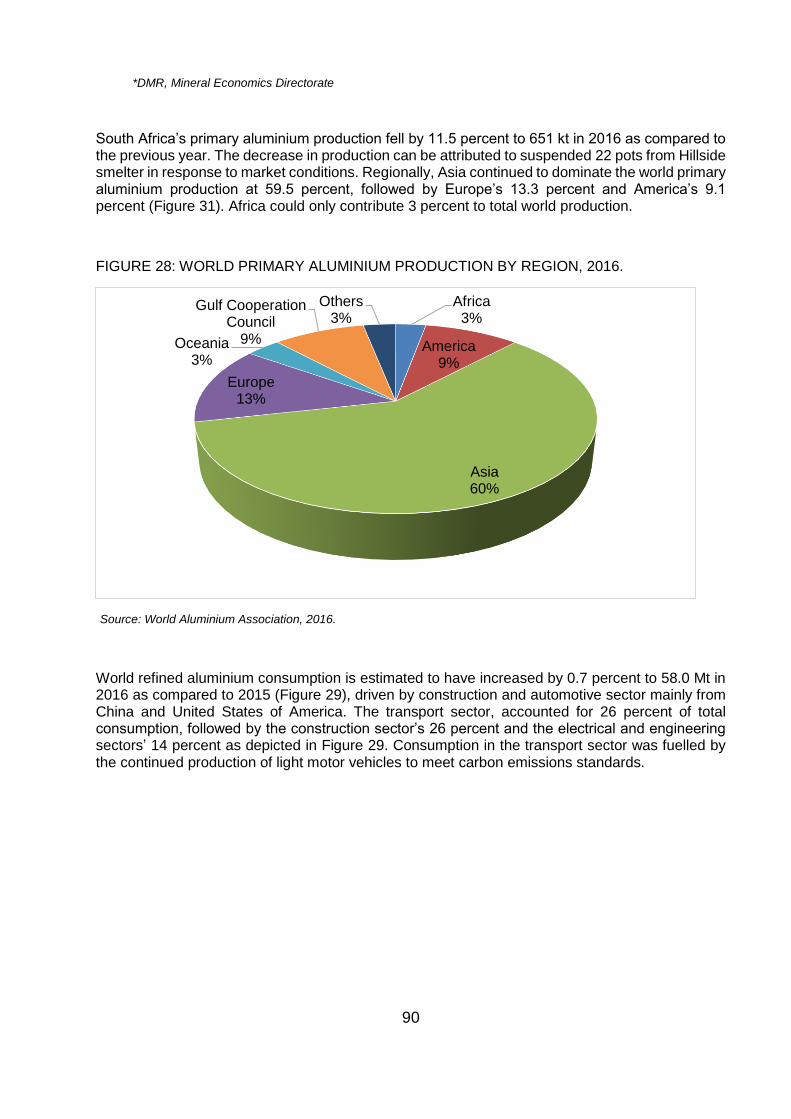
90
*DMR, Mineral Economics Directorate
South Africa’s primary aluminium production fell by 11.5 percent to 651 kt in 2016 as compared to the previous year. The decrease in production can be attributed to suspended 22 pots from Hillside smelter in response to market conditions. Regionally, Asia continued to dominate the world primary aluminium production at 59.5 percent, followed by Europe’s 13.3 percent and America’s 9.1 percent (Figure 31). Africa could only contribute 3 percent to total world production.
FIGURE 28: WORLD PRIMARY ALUMINIUM PRODUCTION BY REGION, 2016.
Source: World Aluminium Association, 2016.
World refined aluminium consumption is estimated to have increased by 0.7 percent to 58.0 Mt in 2016 as compared to 2015 (Figure 29), driven by construction and automotive sector mainly from China and United States of America. The transport sector, accounted for 26 percent of total consumption, followed by the construction sector’s 26 percent and the electrical and engineering sectors’ 14 percent as depicted in Figure 29. Consumption in the transport sector was fuelled by the continued production of light motor vehicles to meet carbon emissions standards.
Africa3%
America9%
Asia60%
Europe13%
Oceania3%
Gulf Cooperation Council
9%
Others3%
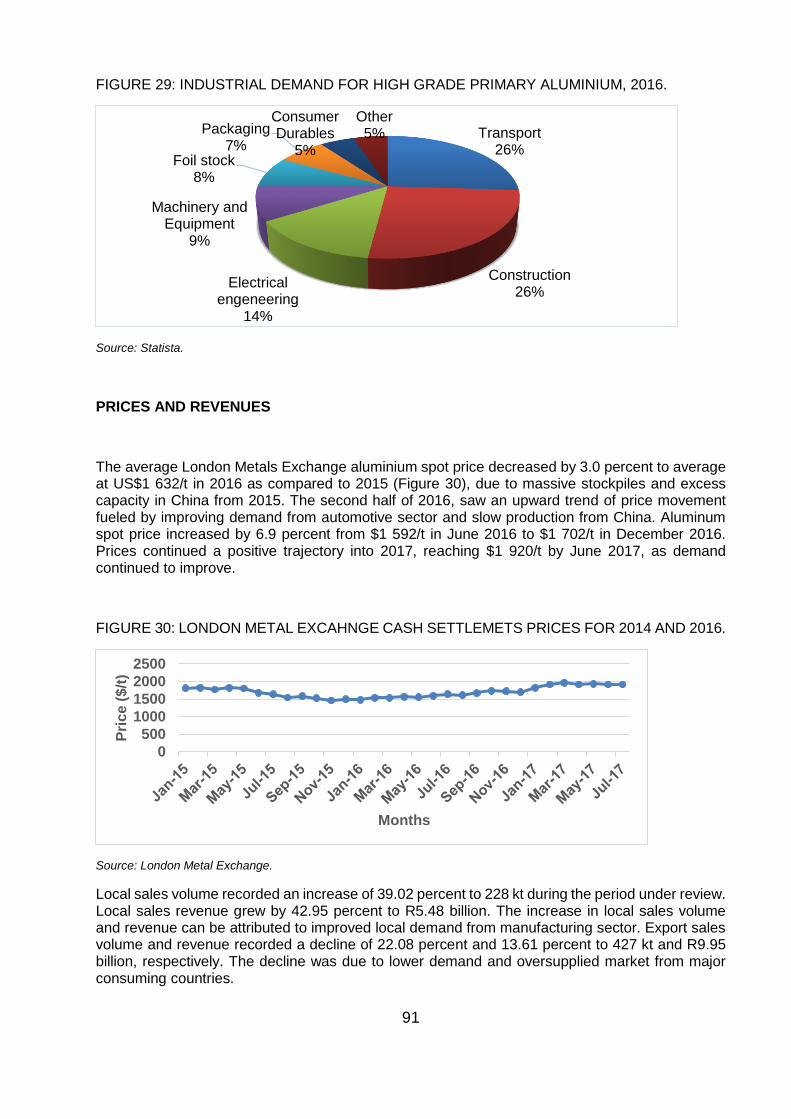
91
FIGURE 29: INDUSTRIAL DEMAND FOR HIGH GRADE PRIMARY ALUMINIUM, 2016.
Source: Statista.
PRICES AND REVENUES
The average London Metals Exchange aluminium spot price decreased by 3.0 percent to average at US$1 632/t in 2016 as compared to 2015 (Figure 30), due to massive stockpiles and excess capacity in China from 2015. The second half of 2016, saw an upward trend of price movement fueled by improving demand from automotive sector and slow production from China. Aluminum spot price increased by 6.9 percent from $1 592/t in June 2016 to $1 702/t in December 2016. Prices continued a positive trajectory into 2017, reaching $1 920/t by June 2017, as demand continued to improve.
FIGURE 30: LONDON METAL EXCAHNGE CASH SETTLEMETS PRICES FOR 2014 AND 2016.
Source: London Metal Exchange.
Local sales volume recorded an increase of 39.02 percent to 228 kt during the period under review. Local sales revenue grew by 42.95 percent to R5.48 billion. The increase in local sales volume and revenue can be attributed to improved local demand from manufacturing sector. Export sales volume and revenue recorded a decline of 22.08 percent and 13.61 percent to 427 kt and R9.95 billion, respectively. The decline was due to lower demand and oversupplied market from major consuming countries.
Transport26%
Construction26%
Electrical engeneering
14%
Machinery and Equipment
9%
Foil stock 8%
Packaging7%
Consumer Durables
5%
Other5%
0
500
1000
1500
2000
2500
Pri
ce (
$/t
)
Months
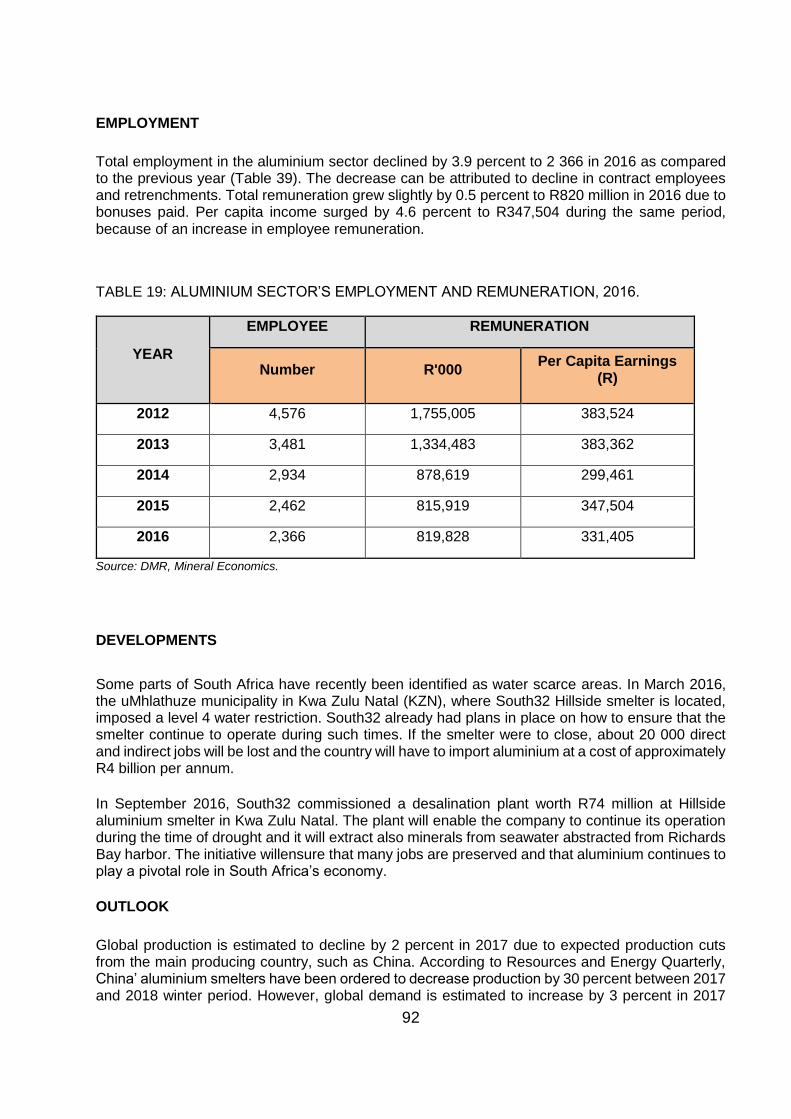
92
EMPLOYMENT
Total employment in the aluminium sector declined by 3.9 percent to 2 366 in 2016 as compared to the previous year (Table 39). The decrease can be attributed to decline in contract employees and retrenchments. Total remuneration grew slightly by 0.5 percent to R820 million in 2016 due to bonuses paid. Per capita income surged by 4.6 percent to R347,504 during the same period, because of an increase in employee remuneration.
TABLE 19: ALUMINIUM SECTOR’S EMPLOYMENT AND REMUNERATION, 2016.
YEAR
EMPLOYEE REMUNERATION
Number R'000 Per Capita Earnings
(R)
2012 4,576 1,755,005 383,524
2013 3,481 1,334,483 383,362
2014 2,934 878,619 299,461
2015 2,462 815,919 347,504
2016 2,366 819,828 331,405
Source: DMR, Mineral Economics.
DEVELOPMENTS
Some parts of South Africa have recently been identified as water scarce areas. In March 2016, the uMhlathuze municipality in Kwa Zulu Natal (KZN), where South32 Hillside smelter is located, imposed a level 4 water restriction. South32 already had plans in place on how to ensure that the smelter continue to operate during such times. If the smelter were to close, about 20 000 direct and indirect jobs will be lost and the country will have to import aluminium at a cost of approximately R4 billion per annum.
In September 2016, South32 commissioned a desalination plant worth R74 million at Hillside aluminium smelter in Kwa Zulu Natal. The plant will enable the company to continue its operation during the time of drought and it will extract also minerals from seawater abstracted from Richards Bay harbor. The initiative willensure that many jobs are preserved and that aluminium continues to play a pivotal role in South Africa’s economy.
OUTLOOK
Global production is estimated to decline by 2 percent in 2017 due to expected production cuts from the main producing country, such as China. According to Resources and Energy Quarterly, China’ aluminium smelters have been ordered to decrease production by 30 percent between 2017 and 2018 winter period. However, global demand is estimated to increase by 3 percent in 2017
93
driven by automotive sector. This sector is producing light motor vehicles with high intensity usage of aluminium order to meet energy efficiency requirements. In-line with the rising demand, the aluminium price is estimated to increase by 3 percent to average US$1 690/t in 2017.
South Africa’s aluminium production is expected to increase in 2017, as the previously suspended Hillside 22 pots resume production due to anticipated improvements in the market. Looking ahead of 2017, the country’s aluminium production is expected to improve fuelled by demand from automotive sector. South Africa is ranked 21st and contributes about 0.7 percent in terms of global vehicle production of 90 million vehicles every year. One of the aims of South Africa’s automotive industry is to grow the country’s automobile exports by1 percent by 2020. To achieve the goal and stay relevant to compete in export markets the country will have to produce light motor vehicles that meet required energy efficiency standards and carbon emissions.
REFERENCES
1. Department of Mineral Resources. 2. World Aluminium Association, 2016. 3. U.S Geological Survey, Mineral Commodity Summaries, January 2017. 4. Resources and Energy Quarterly, 2017. 5. South32 Annual Report 2016. 6. https://www.statista.com/statistics/280983/share-of-aluminum-consumption-by-sector/. 7. http://www.lme.com 8. https://www.investing.com/analysis/commodities {Accessed: 06/09/2017} 9. https://bizconnect.standardbank.co.za/sector-news/transport/key-factors-that-drive-south-
africa%E2%80%99s-automotive-manufacturing-industry.aspx 10. http://www.infrastructurene.ws/2016/12/15/desalination-plant-at-hillside-aluminium-
smelter-plant-in-richards-bay/
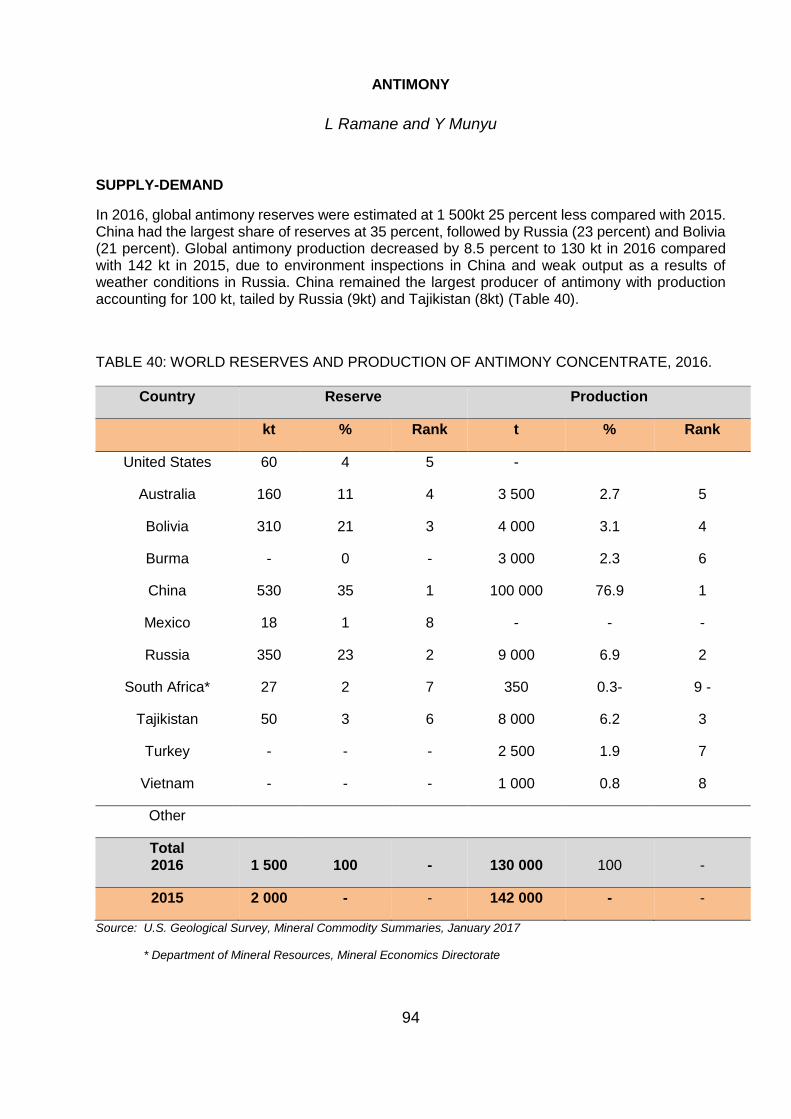
94
ANTIMONY
L Ramane and Y Munyu
SUPPLY-DEMAND
In 2016, global antimony reserves were estimated at 1 500kt 25 percent less compared with 2015. China had the largest share of reserves at 35 percent, followed by Russia (23 percent) and Bolivia (21 percent). Global antimony production decreased by 8.5 percent to 130 kt in 2016 compared with 142 kt in 2015, due to environment inspections in China and weak output as a results of weather conditions in Russia. China remained the largest producer of antimony with production accounting for 100 kt, tailed by Russia (9kt) and Tajikistan (8kt) (Table 40).
TABLE 40: WORLD RESERVES AND PRODUCTION OF ANTIMONY CONCENTRATE, 2016.
Country Reserve Production
kt % Rank t % Rank
United States 60 4 5 -
Australia 160 11 4 3 500 2.7 5
Bolivia 310 21 3 4 000 3.1 4
Burma - 0 - 3 000 2.3 6
China 530 35 1 100 000 76.9 1
Mexico 18 1 8 - - -
Russia 350 23 2 9 000 6.9 2
South Africa* 27 2 7 350 0.3- 9 -
Tajikistan 50 3 6 8 000 6.2 3
Turkey - - - 2 500 1.9 7
Vietnam - - - 1 000 0.8 8
Other
Total 2016 1 500 100 - 130 000 100 -
2015 2 000 - - 142 000 - -
Source: U.S. Geological Survey, Mineral Commodity Summaries, January 2017
* Department of Mineral Resources, Mineral Economics Directorate
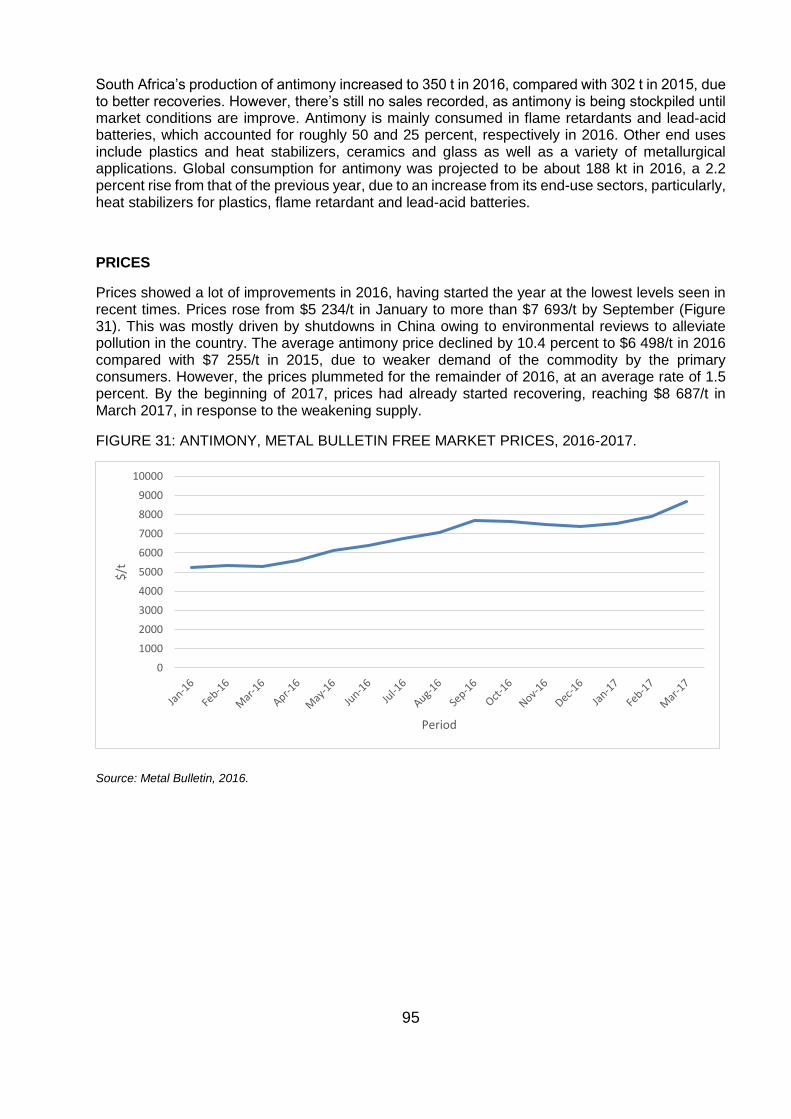
95
South Africa’s production of antimony increased to 350 t in 2016, compared with 302 t in 2015, due to better recoveries. However, there’s still no sales recorded, as antimony is being stockpiled until market conditions are improve. Antimony is mainly consumed in flame retardants and lead-acid batteries, which accounted for roughly 50 and 25 percent, respectively in 2016. Other end uses include plastics and heat stabilizers, ceramics and glass as well as a variety of metallurgical applications. Global consumption for antimony was projected to be about 188 kt in 2016, a 2.2 percent rise from that of the previous year, due to an increase from its end-use sectors, particularly, heat stabilizers for plastics, flame retardant and lead-acid batteries.
PRICES
Prices showed a lot of improvements in 2016, having started the year at the lowest levels seen in recent times. Prices rose from $5 234/t in January to more than $7 693/t by September (Figure 31). This was mostly driven by shutdowns in China owing to environmental reviews to alleviate pollution in the country. The average antimony price declined by 10.4 percent to $6 498/t in 2016 compared with $7 255/t in 2015, due to weaker demand of the commodity by the primary consumers. However, the prices plummeted for the remainder of 2016, at an average rate of 1.5 percent. By the beginning of 2017, prices had already started recovering, reaching $8 687/t in March 2017, in response to the weakening supply.
FIGURE 31: ANTIMONY, METAL BULLETIN FREE MARKET PRICES, 2016-2017.
Source: Metal Bulletin, 2016.
0
1000
2000
3000
4000
5000
6000
7000
8000
9000
10000
$/t
Period
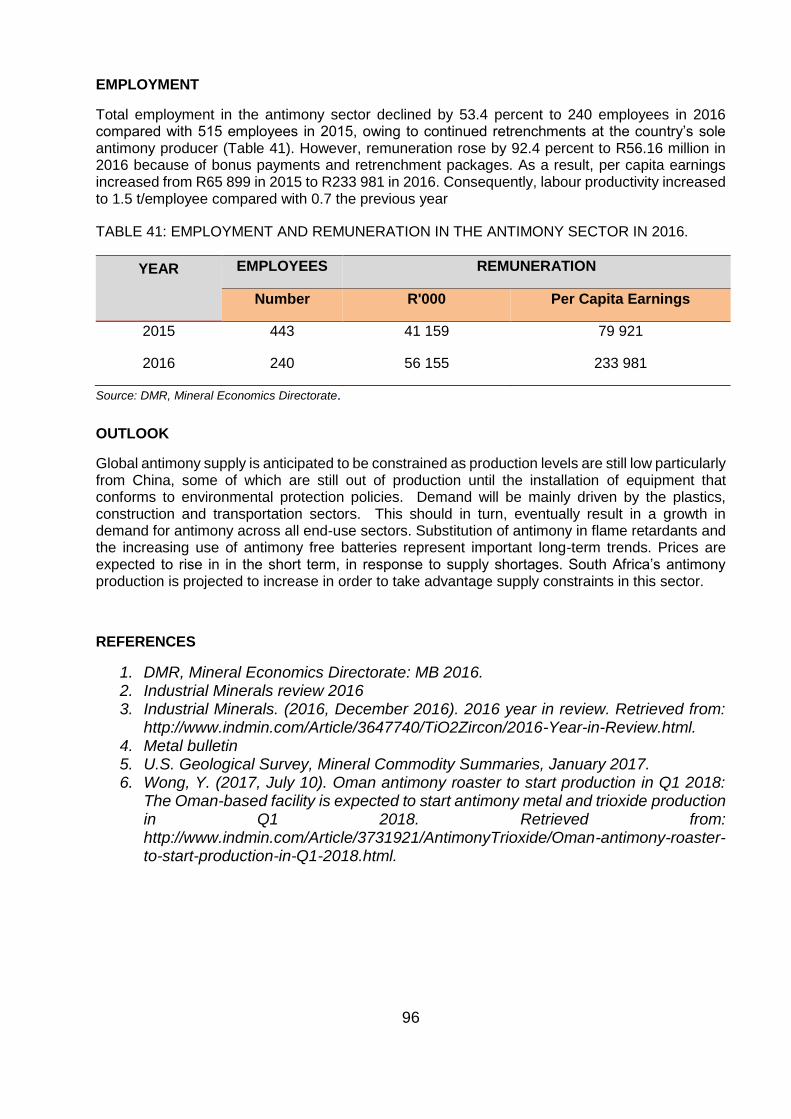
96
EMPLOYMENT
Total employment in the antimony sector declined by 53.4 percent to 240 employees in 2016 compared with 515 employees in 2015, owing to continued retrenchments at the country’s sole antimony producer (Table 41). However, remuneration rose by 92.4 percent to R56.16 million in 2016 because of bonus payments and retrenchment packages. As a result, per capita earnings increased from R65 899 in 2015 to R233 981 in 2016. Consequently, labour productivity increased to 1.5 t/employee compared with 0.7 the previous year
TABLE 41: EMPLOYMENT AND REMUNERATION IN THE ANTIMONY SECTOR IN 2016.
YEAR
EMPLOYEES REMUNERATION
Number R'000 Per Capita Earnings
2015 443 41 159 79 921
2016 240 56 155 233 981
Source: DMR, Mineral Economics Directorate
OUTLOOK
Global antimony supply is anticipated to be constrained as production levels are still low particularly from China, some of which are still out of production until the installation of equipment that conforms to environmental protection policies. Demand will be mainly driven by the plastics, construction and transportation sectors. This should in turn, eventually result in a growth in demand for antimony across all end-use sectors. Substitution of antimony in flame retardants and the increasing use of antimony free batteries represent important long-term trends. Prices are expected to rise in in the short term, in response to supply shortages. South Africa’s antimony production is projected to increase in order to take advantage supply constraints in this sector.
REFERENCES
1. DMR, Mineral Economics Directorate: MB 2016. 2. Industrial Minerals review 2016 3. Industrial Minerals. (2016, December 2016). 2016 year in review. Retrieved from:
http://www.indmin.com/Article/3647740/TiO2Zircon/2016-Year-in-Review.html. 4. Metal bulletin 5. U.S. Geological Survey, Mineral Commodity Summaries, January 2017. 6. Wong, Y. (2017, July 10). Oman antimony roaster to start production in Q1 2018:
The Oman-based facility is expected to start antimony metal and trioxide production in Q1 2018. Retrieved from: http://www.indmin.com/Article/3731921/AntimonyTrioxide/Oman-antimony-roaster-to-start-production-in-Q1-2018.html.
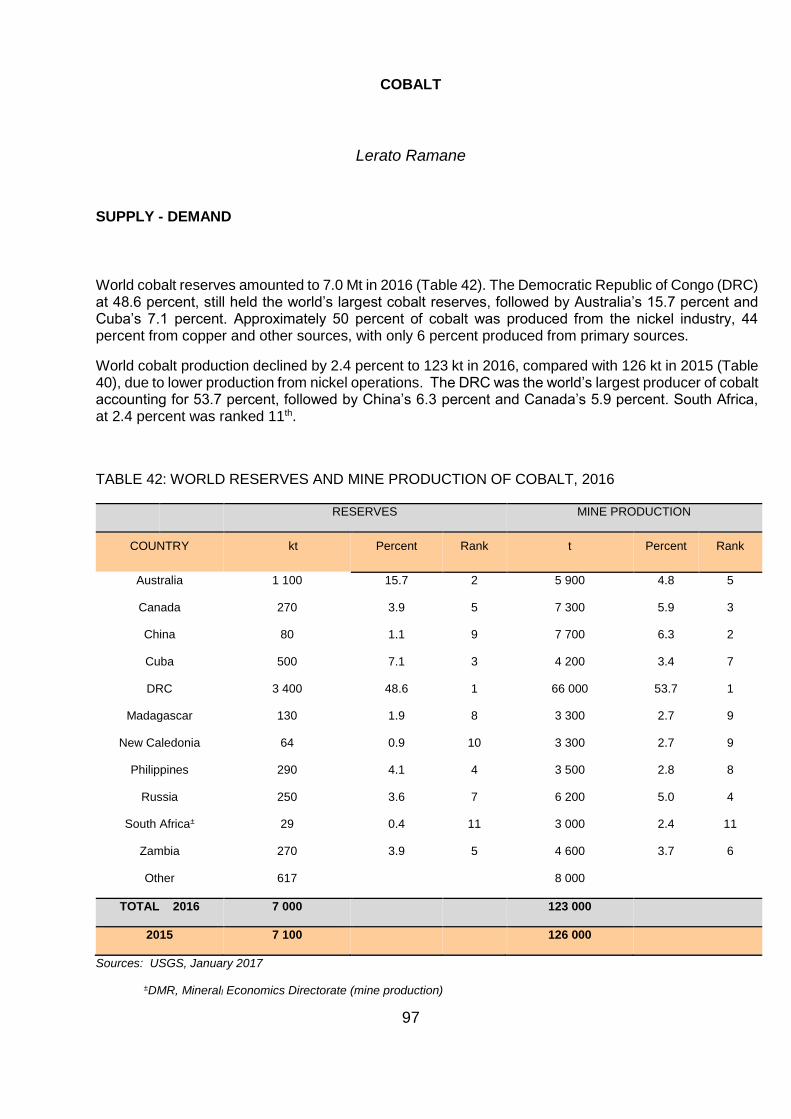
97
COBALT
Lerato Ramane
SUPPLY - DEMAND
World cobalt reserves amounted to 7.0 Mt in 2016 (Table 42). The Democratic Republic of Congo (DRC) at 48.6 percent, still held the world’s largest cobalt reserves, followed by Australia’s 15.7 percent and Cuba’s 7.1 percent. Approximately 50 percent of cobalt was produced from the nickel industry, 44 percent from copper and other sources, with only 6 percent produced from primary sources.
World cobalt production declined by 2.4 percent to 123 kt in 2016, compared with 126 kt in 2015 (Table 40), due to lower production from nickel operations. The DRC was the world’s largest producer of cobalt accounting for 53.7 percent, followed by China’s 6.3 percent and Canada’s 5.9 percent. South Africa, at 2.4 percent was ranked 11th.
TABLE 42: WORLD RESERVES AND MINE PRODUCTION OF COBALT, 2016
RESERVES MINE PRODUCTION
COUNTRY kt Percent Rank t Percent Rank
Australia 1 100 15.7 2 5 900 4.8 5
Canada 270 3.9 5 7 300 5.9 3
China 80 1.1 9 7 700 6.3 2
Cuba 500 7.1 3 4 200 3.4 7
DRC 3 400 48.6 1 66 000 53.7 1
Madagascar 130 1.9 8 3 300 2.7 9
New Caledonia 64 0.9 10 3 300 2.7 9
Philippines 290 4.1 4 3 500 2.8 8
Russia 250 3.6 7 6 200 5.0 4
South Africa± 29 0.4 11 3 000 2.4 11
Zambia 270 3.9 5 4 600 3.7 6
Other 617 8 000
TOTAL 2016 7 000 123 000
2015 7 100 126 000
Sources: USGS, January 2017
±DMR, Minerall Economics Directorate (mine production)
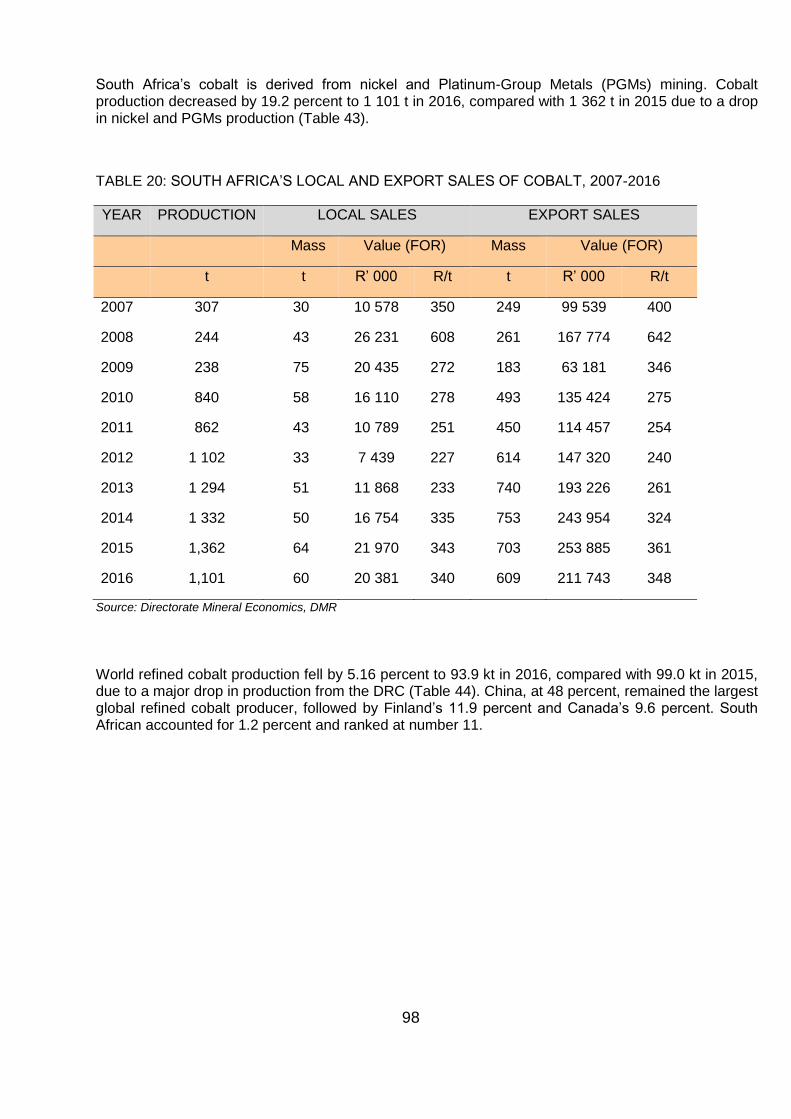
98
South Africa’s cobalt is derived from nickel and Platinum-Group Metals (PGMs) mining. Cobalt production decreased by 19.2 percent to 1 101 t in 2016, compared with 1 362 t in 2015 due to a drop in nickel and PGMs production (Table 43).
TABLE 20: SOUTH AFRICA’S LOCAL AND EXPORT SALES OF COBALT, 2007-2016
YEAR PRODUCTION LOCAL SALES EXPORT SALES
Mass Value (FOR) Mass Value (FOR)
t t R’ 000 R/t t R’ 000 R/t
2007 307 30 10 578 350 249 99 539 400
2008 244 43 26 231 608 261 167 774 642
2009 238 75 20 435 272 183 63 181 346
2010 840 58 16 110 278 493 135 424 275
2011 862 43 10 789 251 450 114 457 254
2012 1 102 33 7 439 227 614 147 320 240
2013 1 294 51 11 868 233 740 193 226 261
2014 1 332 50 16 754 335 753 243 954 324
2015 1,362 64 21 970 343 703 253 885 361
2016 1,101 60 20 381 340 609 211 743 348
Source: Directorate Mineral Economics, DMR
World refined cobalt production fell by 5.16 percent to 93.9 kt in 2016, compared with 99.0 kt in 2015, due to a major drop in production from the DRC (Table 44). China, at 48 percent, remained the largest global refined cobalt producer, followed by Finland’s 11.9 percent and Canada’s 9.6 percent. South African accounted for 1.2 percent and ranked at number 11.
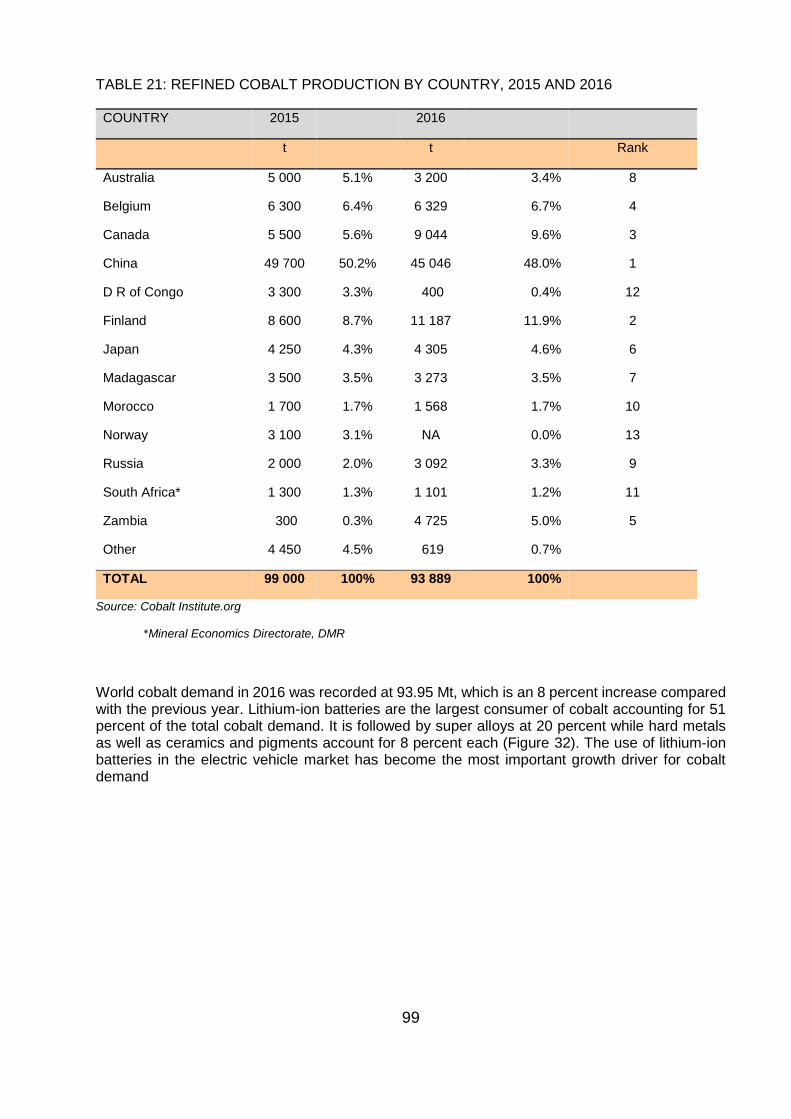
99
TABLE 21: REFINED COBALT PRODUCTION BY COUNTRY, 2015 AND 2016
COUNTRY 2015 2016
t t Rank
Australia 5 000 5.1% 3 200 3.4% 8
Belgium 6 300 6.4% 6 329 6.7% 4
Canada 5 500 5.6% 9 044 9.6% 3
China 49 700 50.2% 45 046 48.0% 1
D R of Congo 3 300 3.3% 400 0.4% 12
Finland 8 600 8.7% 11 187 11.9% 2
Japan 4 250 4.3% 4 305 4.6% 6
Madagascar 3 500 3.5% 3 273 3.5% 7
Morocco 1 700 1.7% 1 568 1.7% 10
Norway 3 100 3.1% NA 0.0% 13
Russia 2 000 2.0% 3 092 3.3% 9
South Africa* 1 300 1.3% 1 101 1.2% 11
Zambia 300 0.3% 4 725 5.0% 5
Other 4 450 4.5% 619 0.7%
TOTAL 99 000 100% 93 889 100%
Source: Cobalt Institute.org
*Mineral Economics Directorate, DMR
World cobalt demand in 2016 was recorded at 93.95 Mt, which is an 8 percent increase compared with the previous year. Lithium-ion batteries are the largest consumer of cobalt accounting for 51 percent of the total cobalt demand. It is followed by super alloys at 20 percent while hard metals as well as ceramics and pigments account for 8 percent each (Figure 32). The use of lithium-ion batteries in the electric vehicle market has become the most important growth driver for cobalt demand
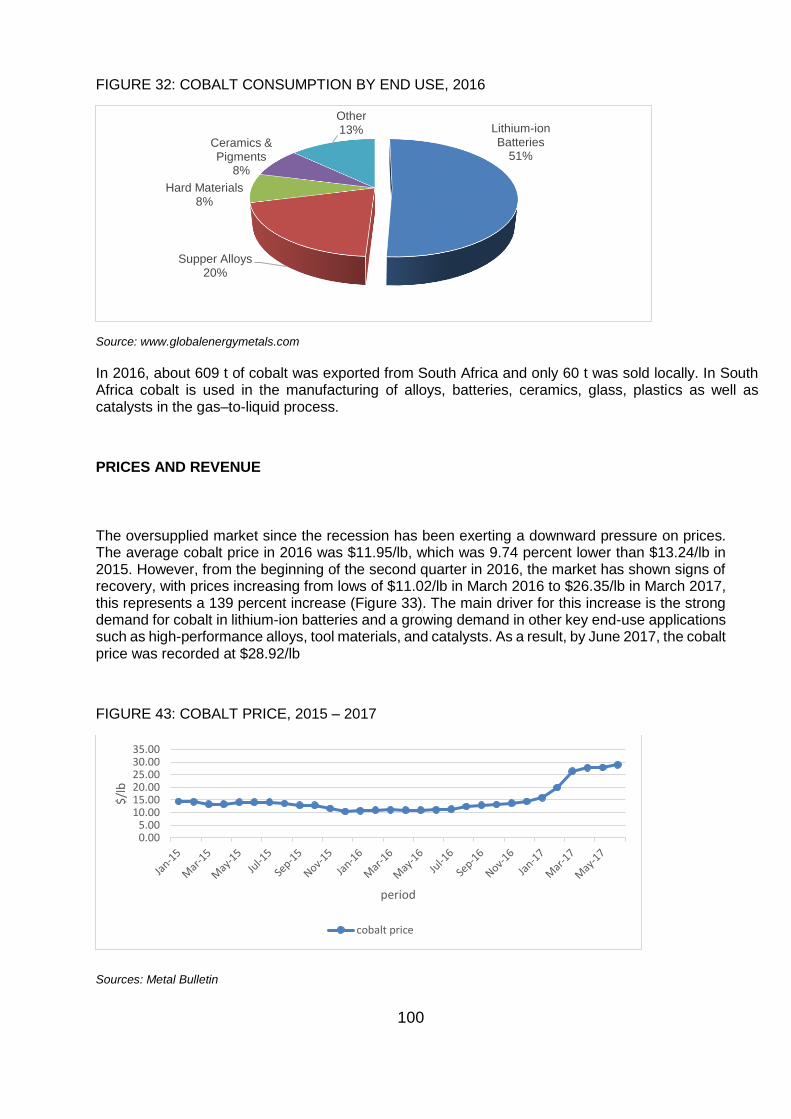
100
FIGURE 32: COBALT CONSUMPTION BY END USE, 2016
Source: www.globalenergymetals.com
In 2016, about 609 t of cobalt was exported from South Africa and only 60 t was sold locally. In South Africa cobalt is used in the manufacturing of alloys, batteries, ceramics, glass, plastics as well as catalysts in the gas–to-liquid process.
PRICES AND REVENUE
The oversupplied market since the recession has been exerting a downward pressure on prices. The average cobalt price in 2016 was $11.95/lb, which was 9.74 percent lower than $13.24/lb in 2015. However, from the beginning of the second quarter in 2016, the market has shown signs of recovery, with prices increasing from lows of $11.02/lb in March 2016 to $26.35/lb in March 2017, this represents a 139 percent increase (Figure 33). The main driver for this increase is the strong demand for cobalt in lithium-ion batteries and a growing demand in other key end-use applications such as high-performance alloys, tool materials, and catalysts. As a result, by June 2017, the cobalt price was recorded at $28.92/lb
FIGURE 43: COBALT PRICE, 2015 – 2017
Sources: Metal Bulletin
Lithium-ion Batteries
51%
Supper Alloys20%
Hard Materials8%
Ceramics & Pigments
8%
Other13%
0.005.00
10.0015.0020.0025.0030.0035.00
$/l
b
period
cobalt price
101
South Africa’s local and export sales revenues declined by 7.5 and 16.6 percent to 20.38 million and R211.74 million in 2016, respectively. This was as a result of the weak cobalt price and the drop in cobalt output. Local and export unit sales values also fell by 1.0 and 3.7 percent in 2016 to R339.7/t and R347.7/t, respectively.
OUTLOOK
Global refined cobalt consumption is expected to increase by 6.8 percent to 2020, driven by the strong demand for lithium-ion batteries in electric vehicles, which is projected to grow to 56 740 Mt in 2018 and 72 500 Mt by 2020. Global supply is anticipated to grow at a more modest rate in 2017 considering that there is no new supply expected to come on stream until 2018. However, in the next few years supply is most likely to rise, due to the restart of Katanga mining in the DRC in 2018 and a few other projects that are expected to be commissioned before 2020. As a result of supply constraints, the cobalt prices will remain high and relatively stable over the next few years as demand continues to upsurge.
South Africa will also benefit from high cobalt prices, considering that more than 90 percent of its cobalt is exported. Due to the lack of addition supply from both the PGMs and nickel sectors locally, it is anticipated that domestic cobalt production will remain stagnant in 2017.
REFERENCES
1. Darton Commodities Limited, Cobalt Market Review 2016-2017
2. Directorate Mineral Economics, DMR
3. Metal bulletin, prices
4. U.S. Geological Survey, Mineral Commodity Summaries, January 2017
5. http://www.miningweekly.com/
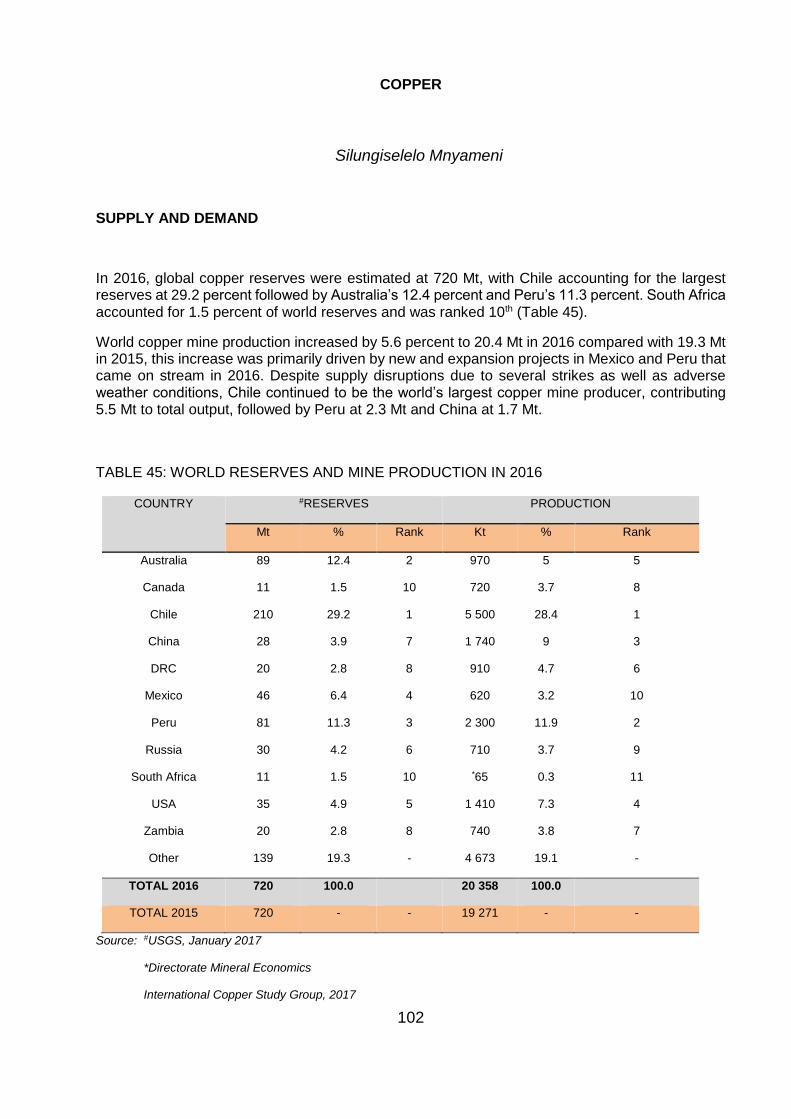
102
COPPER
Silungiselelo Mnyameni
SUPPLY AND DEMAND
In 2016, global copper reserves were estimated at 720 Mt, with Chile accounting for the largest reserves at 29.2 percent followed by Australia’s 12.4 percent and Peru’s 11.3 percent. South Africa accounted for 1.5 percent of world reserves and was ranked 10th (Table 45).
World copper mine production increased by 5.6 percent to 20.4 Mt in 2016 compared with 19.3 Mt in 2015, this increase was primarily driven by new and expansion projects in Mexico and Peru that came on stream in 2016. Despite supply disruptions due to several strikes as well as adverse weather conditions, Chile continued to be the world’s largest copper mine producer, contributing 5.5 Mt to total output, followed by Peru at 2.3 Mt and China at 1.7 Mt.
TABLE 45: WORLD RESERVES AND MINE PRODUCTION IN 2016
COUNTRY #RESERVES PRODUCTION
Mt % Rank Kt % Rank
Australia 89 12.4 2 970 5 5
Canada 11 1.5 10 720 3.7 8
Chile 210 29.2 1 5 500 28.4 1
China 28 3.9 7 1 740 9 3
DRC 20 2.8 8 910 4.7 6
Mexico 46 6.4 4 620 3.2 10
Peru 81 11.3 3 2 300 11.9 2
Russia 30 4.2 6 710 3.7 9
South Africa 11 1.5 10 *65 0.3 11
USA 35 4.9 5 1 410 7.3 4
Zambia 20 2.8 8 740 3.8 7
Other 139 19.3 - 4 673 19.1 -
TOTAL 2016 720 100.0 20 358 100.0
TOTAL 2015 720 - - 19 271 - -
Source: #USGS, January 2017
*Directorate Mineral Economics
International Copper Study Group, 2017
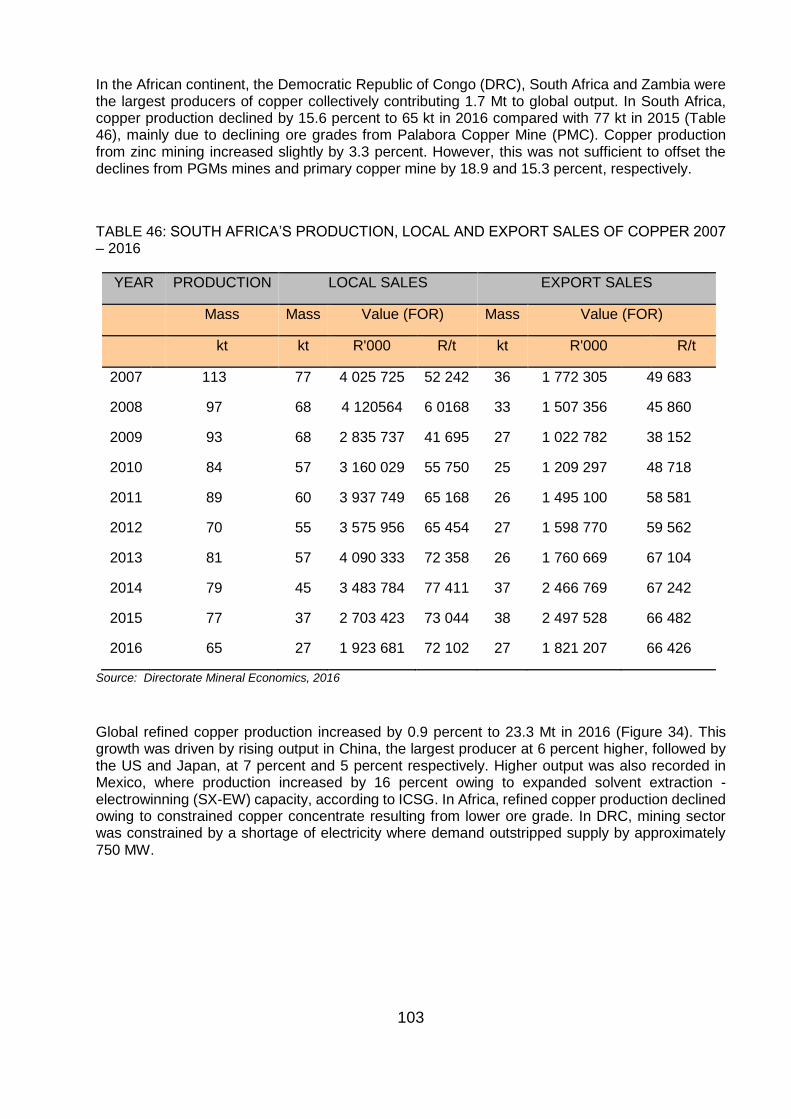
103
In the African continent, the Democratic Republic of Congo (DRC), South Africa and Zambia were the largest producers of copper collectively contributing 1.7 Mt to global output. In South Africa, copper production declined by 15.6 percent to 65 kt in 2016 compared with 77 kt in 2015 (Table 46), mainly due to declining ore grades from Palabora Copper Mine (PMC). Copper production from zinc mining increased slightly by 3.3 percent. However, this was not sufficient to offset the declines from PGMs mines and primary copper mine by 18.9 and 15.3 percent, respectively.
TABLE 46: SOUTH AFRICA’S PRODUCTION, LOCAL AND EXPORT SALES OF COPPER 2007 – 2016
YEAR PRODUCTION LOCAL SALES EXPORT SALES
Mass Mass Value (FOR) Mass Value (FOR)
kt kt R'000 R/t kt R'000 R/t
2007 113 77 4 025 725 52 242 36 1 772 305 49 683
2008 97 68 4 120564 6 0168 33 1 507 356 45 860
2009 93 68 2 835 737 41 695 27 1 022 782 38 152
2010 84 57 3 160 029 55 750 25 1 209 297 48 718
2011 89 60 3 937 749 65 168 26 1 495 100 58 581
2012 70 55 3 575 956 65 454 27 1 598 770 59 562
2013 81 57 4 090 333 72 358 26 1 760 669 67 104
2014 79 45 3 483 784 77 411 37 2 466 769 67 242
2015 77 37 2 703 423 73 044 38 2 497 528 66 482
2016 65 27 1 923 681 72 102 27 1 821 207 66 426
Source: Directorate Mineral Economics, 2016
Global refined copper production increased by 0.9 percent to 23.3 Mt in 2016 (Figure 34). This growth was driven by rising output in China, the largest producer at 6 percent higher, followed by the US and Japan, at 7 percent and 5 percent respectively. Higher output was also recorded in Mexico, where production increased by 16 percent owing to expanded solvent extraction - electrowinning (SX-EW) capacity, according to ICSG. In Africa, refined copper production declined owing to constrained copper concentrate resulting from lower ore grade. In DRC, mining sector was constrained by a shortage of electricity where demand outstripped supply by approximately 750 MW.
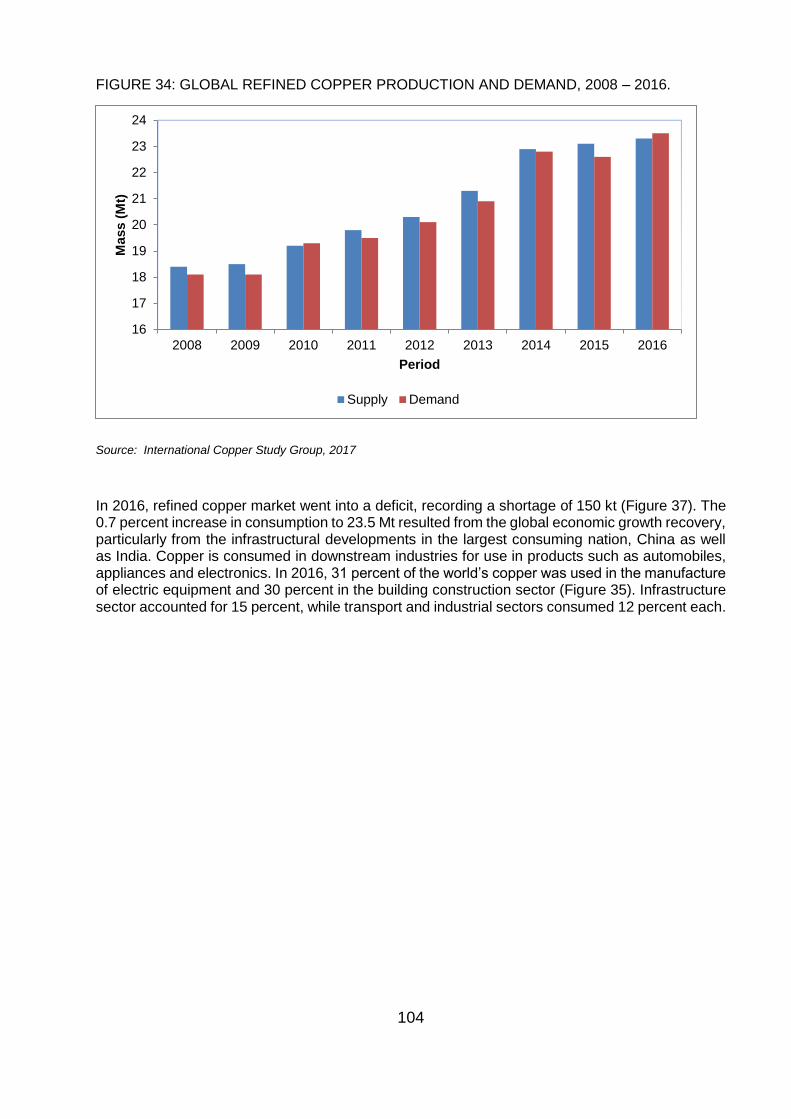
104
FIGURE 34: GLOBAL REFINED COPPER PRODUCTION AND DEMAND, 2008 – 2016.
Source: International Copper Study Group, 2017
In 2016, refined copper market went into a deficit, recording a shortage of 150 kt (Figure 37). The 0.7 percent increase in consumption to 23.5 Mt resulted from the global economic growth recovery, particularly from the infrastructural developments in the largest consuming nation, China as well as India. Copper is consumed in downstream industries for use in products such as automobiles, appliances and electronics. In 2016, 31 percent of the world’s copper was used in the manufacture of electric equipment and 30 percent in the building construction sector (Figure 35). Infrastructure sector accounted for 15 percent, while transport and industrial sectors consumed 12 percent each.
16
17
18
19
20
21
22
23
24
2008 2009 2010 2011 2012 2013 2014 2015 2016
Mass (
Mt)
Period
Supply Demand
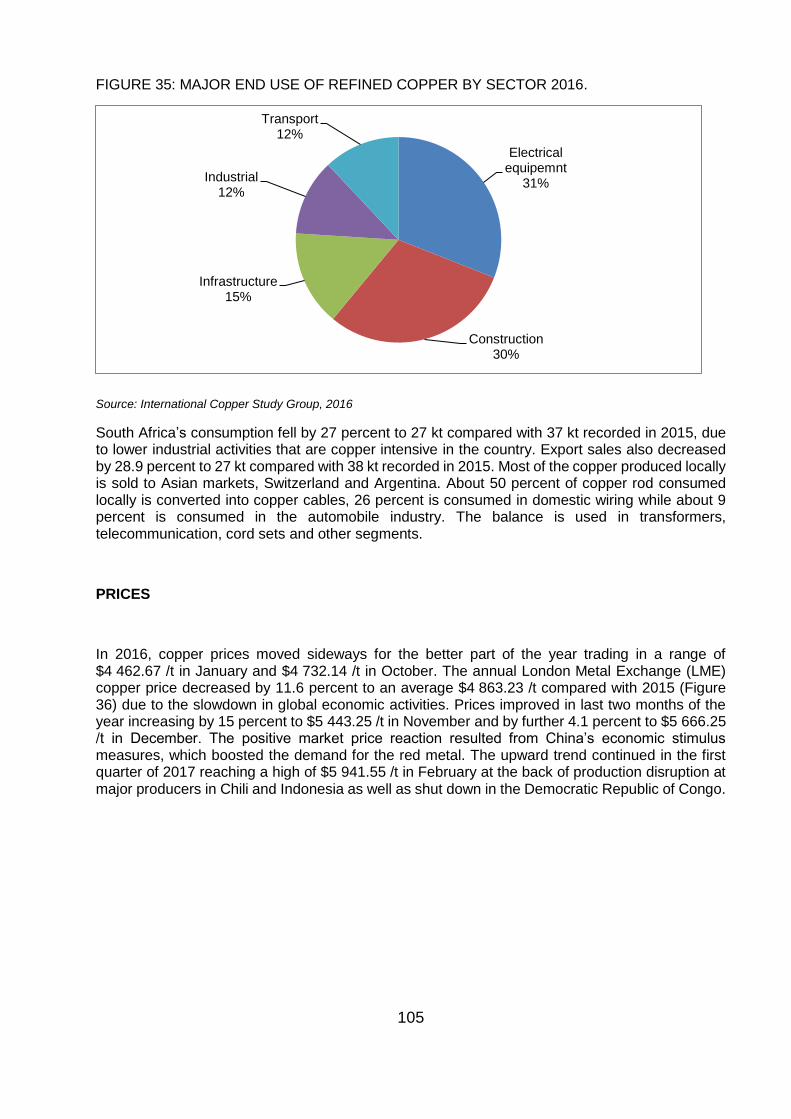
105
FIGURE 35: MAJOR END USE OF REFINED COPPER BY SECTOR 2016.
Source: International Copper Study Group, 2016
South Africa’s consumption fell by 27 percent to 27 kt compared with 37 kt recorded in 2015, due to lower industrial activities that are copper intensive in the country. Export sales also decreased by 28.9 percent to 27 kt compared with 38 kt recorded in 2015. Most of the copper produced locally is sold to Asian markets, Switzerland and Argentina. About 50 percent of copper rod consumed locally is converted into copper cables, 26 percent is consumed in domestic wiring while about 9 percent is consumed in the automobile industry. The balance is used in transformers, telecommunication, cord sets and other segments.
PRICES
In 2016, copper prices moved sideways for the better part of the year trading in a range of $4 462.67 /t in January and $4 732.14 /t in October. The annual London Metal Exchange (LME) copper price decreased by 11.6 percent to an average $4 863.23 /t compared with 2015 (Figure 36) due to the slowdown in global economic activities. Prices improved in last two months of the year increasing by 15 percent to $5 443.25 /t in November and by further 4.1 percent to $5 666.25 /t in December. The positive market price reaction resulted from China’s economic stimulus measures, which boosted the demand for the red metal. The upward trend continued in the first quarter of 2017 reaching a high of $5 941.55 /t in February at the back of production disruption at major producers in Chili and Indonesia as well as shut down in the Democratic Republic of Congo.
Electrical equipemnt
31%
Construction30%
Infrastructure15%
Industrial12%
Transport12%
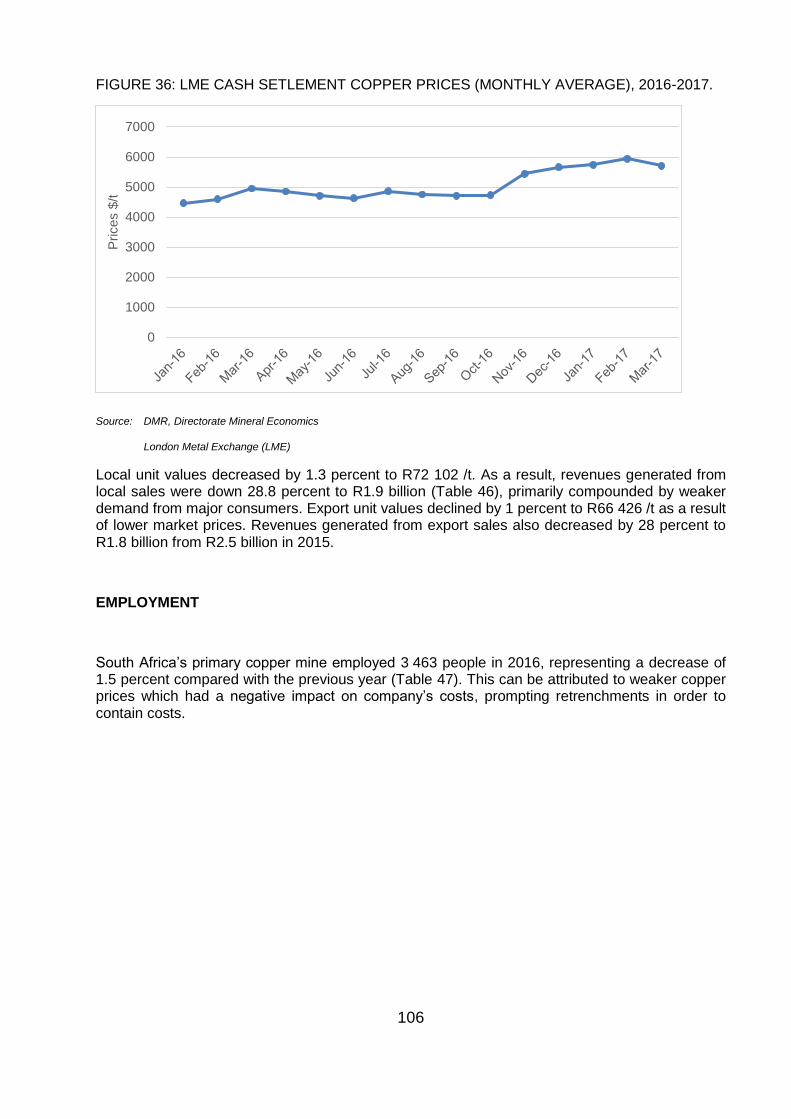
106
FIGURE 36: LME CASH SETLEMENT COPPER PRICES (MONTHLY AVERAGE), 2016-2017.
Source: DMR, Directorate Mineral Economics
London Metal Exchange (LME)
Local unit values decreased by 1.3 percent to R72 102 /t. As a result, revenues generated from local sales were down 28.8 percent to R1.9 billion (Table 46), primarily compounded by weaker demand from major consumers. Export unit values declined by 1 percent to R66 426 /t as a result of lower market prices. Revenues generated from export sales also decreased by 28 percent to R1.8 billion from R2.5 billion in 2015.
EMPLOYMENT
South Africa’s primary copper mine employed 3 463 people in 2016, representing a decrease of 1.5 percent compared with the previous year (Table 47). This can be attributed to weaker copper prices which had a negative impact on company’s costs, prompting retrenchments in order to contain costs.
0
1000
2000
3000
4000
5000
6000
7000P
rices $
/t
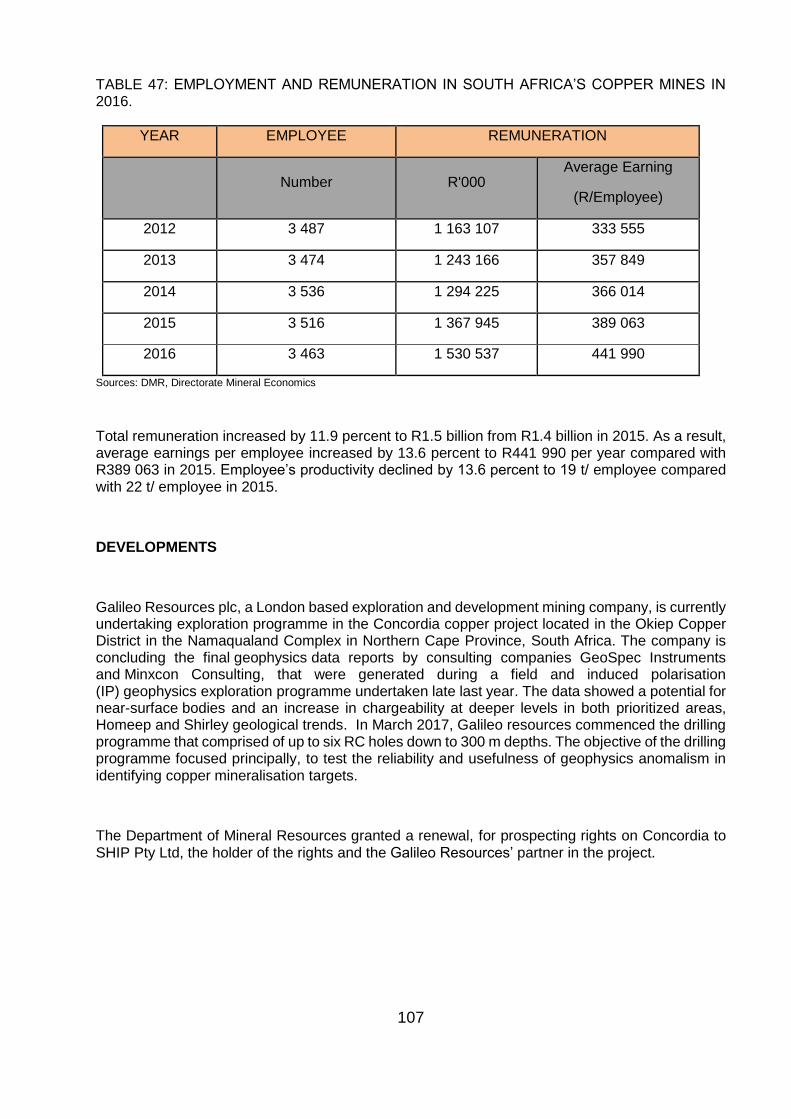
107
TABLE 47: EMPLOYMENT AND REMUNERATION IN SOUTH AFRICA’S COPPER MINES IN 2016.
YEAR EMPLOYEE REMUNERATION
Number R'000 Average Earning
(R/Employee)
2012 3 487 1 163 107 333 555
2013 3 474 1 243 166 357 849
2014 3 536 1 294 225 366 014
2015 3 516 1 367 945 389 063
2016 3 463 1 530 537 441 990
Sources: DMR, Directorate Mineral Economics
Total remuneration increased by 11.9 percent to R1.5 billion from R1.4 billion in 2015. As a result, average earnings per employee increased by 13.6 percent to R441 990 per year compared with R389 063 in 2015. Employee’s productivity declined by 13.6 percent to 19 t/ employee compared with 22 t/ employee in 2015.
DEVELOPMENTS
Galileo Resources plc, a London based exploration and development mining company, is currently undertaking exploration programme in the Concordia copper project located in the Okiep Copper District in the Namaqualand Complex in Northern Cape Province, South Africa. The company is concluding the final geophysics data reports by consulting companies GeoSpec Instruments and Minxcon Consulting, that were generated during a field and induced polarisation (IP) geophysics exploration programme undertaken late last year. The data showed a potential for near-surface bodies and an increase in chargeability at deeper levels in both prioritized areas, Homeep and Shirley geological trends. In March 2017, Galileo resources commenced the drilling programme that comprised of up to six RC holes down to 300 m depths. The objective of the drilling programme focused principally, to test the reliability and usefulness of geophysics anomalism in identifying copper mineralisation targets.
The Department of Mineral Resources granted a renewal, for prospecting rights on Concordia to SHIP Pty Ltd, the holder of the rights and the Galileo Resources’ partner in the project.
108
OUTLOOK
World copper mine production is expected to decline by 3 percent in 2017 to 19.7 Mt and recover by 2.5 percent to 20.2 Mt in 2018, according to the International Copper Study Group (ICSG). Mine supply disruptions in Chile and Indonesia as well as capacity reduction in the DRC and Zambia’s operations is expected to have a significant impact on total world output. In 2018, Chile, the DRC, Peru and Zambia are expected to be the biggest contributors to mine production growth.
In 2017, world refined copper production is expected to increase by 1 percent to 23.6 Mt and by further 2.5 percent in 2018, according to ICSG. This growth is expected to come from the secondary refined production resulting from improved availability of scrap while primary refined production is expected to decline due to shutdowns of smelters in major producing countries. In 2017, refined copper consumption is expected to increase by 1 percent, which is likely to result in a 150 kt market deficit. Demand growth is expected to be sustained by the modern technological society which is copper intensive as well as infrastructural developments in major countries such as China and India
Copper prices are anticipated to remain on an upward trend in 2017 driven by limited supply resulting from the lack of new projects and rising demand from major consumers as economic growth across the globe gears up. On the LME warehouses, inventories are being drawn down as investors anticipate a looming short fall in the market. Copper prices are expected to rise above $6 500 /t in 2017, taking into consideration the current global economic growth as well as the supply deficit expected.
The South African mid-term budget in October 2017, set aside R948 billion for infrastructural development for the next three years. This development prioritizing infrastructural investment in energy, transport and telecommunications is likely to drive the demand for copper higher. Over 50 percent of the locally produced copper is consumed within the country, where Eskom, the biggest consumer through its infrastructure and maintenance on existing power stations is expected to drive the domestic copper demand.
REFERENCES
1. Creamer Media: Base Metals Report, October 2017
2. DMR, Directorate Mineral Economics
3. International Copper Study Group, Copper Market Forecast 2017-2018
4. London Metal Exchange (LME)
5. Mining Weekly, August 2017
6. U.S Geological Survey, Mineral Commodity Summaries, January 2017
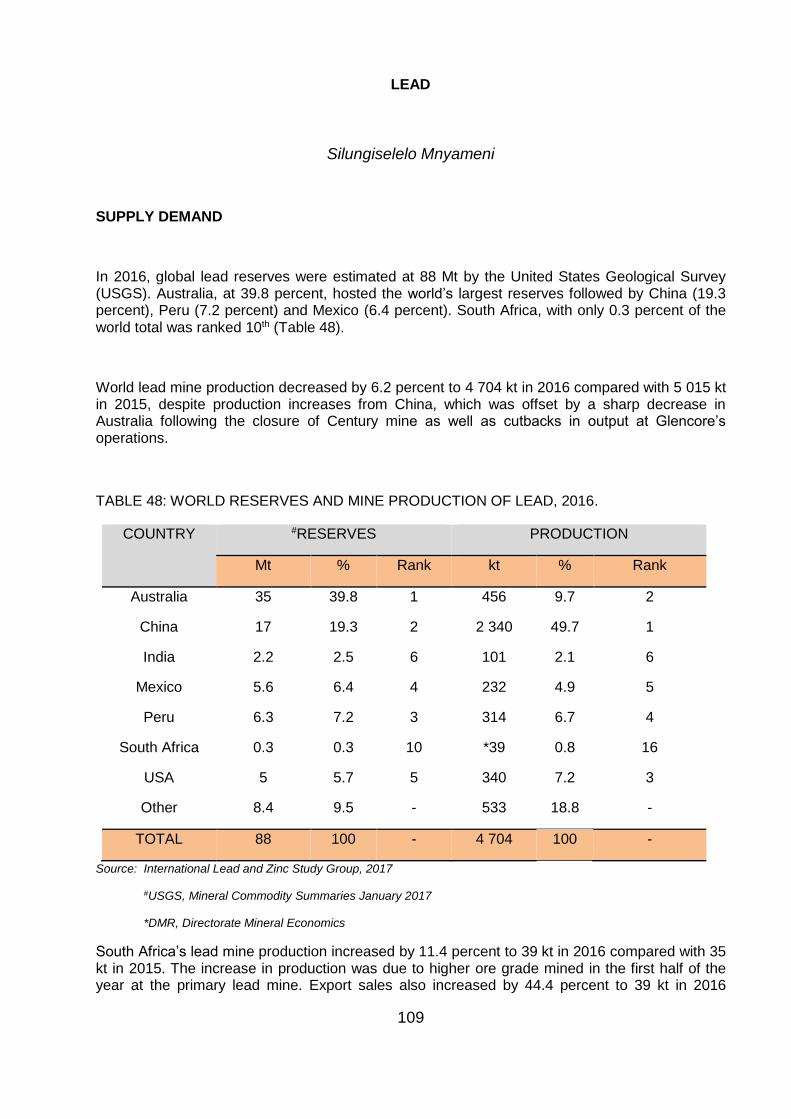
109
LEAD
Silungiselelo Mnyameni
SUPPLY DEMAND
In 2016, global lead reserves were estimated at 88 Mt by the United States Geological Survey (USGS). Australia, at 39.8 percent, hosted the world’s largest reserves followed by China (19.3 percent), Peru (7.2 percent) and Mexico (6.4 percent). South Africa, with only 0.3 percent of the world total was ranked 10th (Table 48).
World lead mine production decreased by 6.2 percent to 4 704 kt in 2016 compared with 5 015 kt in 2015, despite production increases from China, which was offset by a sharp decrease in Australia following the closure of Century mine as well as cutbacks in output at Glencore’s operations.
TABLE 48: WORLD RESERVES AND MINE PRODUCTION OF LEAD, 2016.
COUNTRY #RESERVES PRODUCTION
Mt % Rank kt % Rank
Australia 35 39.8 1 456 9.7 2
China 17 19.3 2 2 340 49.7 1
India 2.2 2.5 6 101 2.1 6
Mexico 5.6 6.4 4 232 4.9 5
Peru 6.3 7.2 3 314 6.7 4
South Africa 0.3 0.3 10 *39 0.8 16
USA 5 5.7 5 340 7.2 3
Other 8.4 9.5 - 533 18.8 -
TOTAL 88 100 - 4 704 100 -
Source: International Lead and Zinc Study Group, 2017
#USGS, Mineral Commodity Summaries January 2017
*DMR, Directorate Mineral Economics
South Africa’s lead mine production increased by 11.4 percent to 39 kt in 2016 compared with 35 kt in 2015. The increase in production was due to higher ore grade mined in the first half of the year at the primary lead mine. Export sales also increased by 44.4 percent to 39 kt in 2016
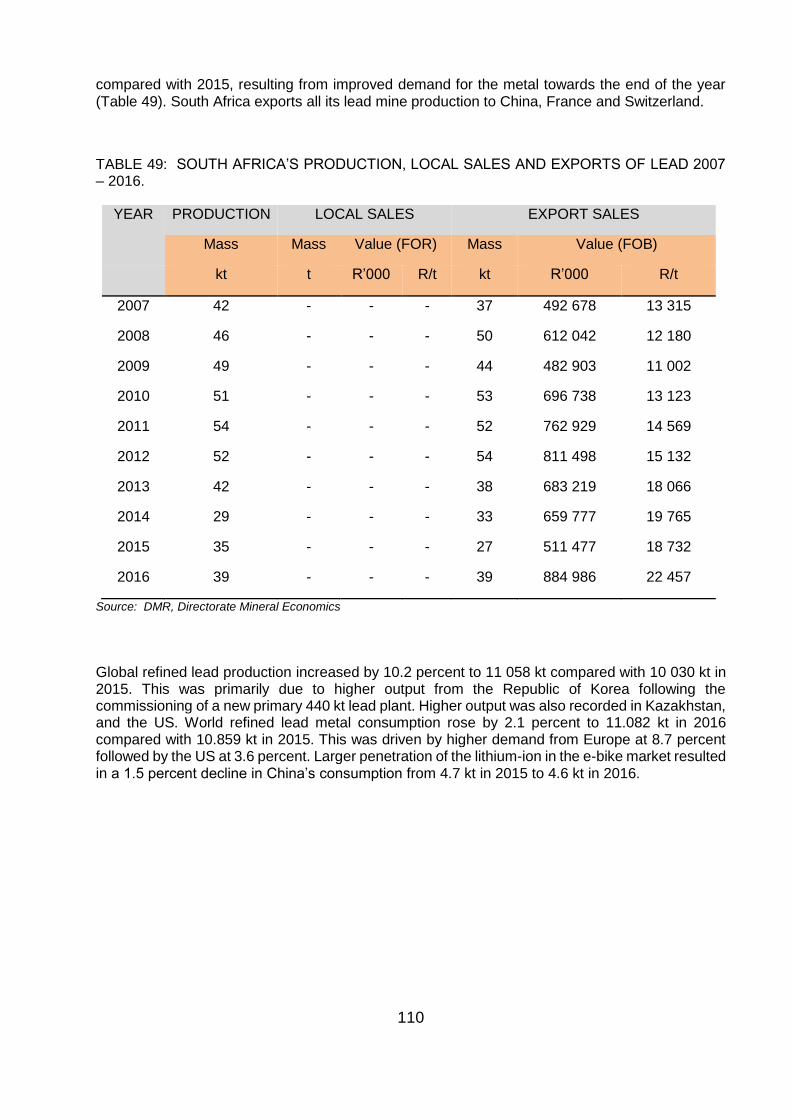
110
compared with 2015, resulting from improved demand for the metal towards the end of the year (Table 49). South Africa exports all its lead mine production to China, France and Switzerland.
TABLE 49: SOUTH AFRICA’S PRODUCTION, LOCAL SALES AND EXPORTS OF LEAD 2007 – 2016.
YEAR PRODUCTION LOCAL SALES EXPORT SALES
Mass Mass Value (FOR) Mass Value (FOB)
kt t R’000 R/t kt R’000 R/t
2007 42 - - - 37 492 678 13 315
2008 46 - - - 50 612 042 12 180
2009 49 - - - 44 482 903 11 002
2010 51 - - - 53 696 738 13 123
2011 54 - - - 52 762 929 14 569
2012 52 - - - 54 811 498 15 132
2013 42 - - - 38 683 219 18 066
2014 29 - - - 33 659 777 19 765
2015 35 - - - 27 511 477 18 732
2016 39 - - - 39 884 986 22 457
Source: DMR, Directorate Mineral Economics
Global refined lead production increased by 10.2 percent to 11 058 kt compared with 10 030 kt in 2015. This was primarily due to higher output from the Republic of Korea following the commissioning of a new primary 440 kt lead plant. Higher output was also recorded in Kazakhstan, and the US. World refined lead metal consumption rose by 2.1 percent to 11.082 kt in 2016 compared with 10.859 kt in 2015. This was driven by higher demand from Europe at 8.7 percent followed by the US at 3.6 percent. Larger penetration of the lithium-ion in the e-bike market resulted in a 1.5 percent decline in China’s consumption from 4.7 kt in 2015 to 4.6 kt in 2016.
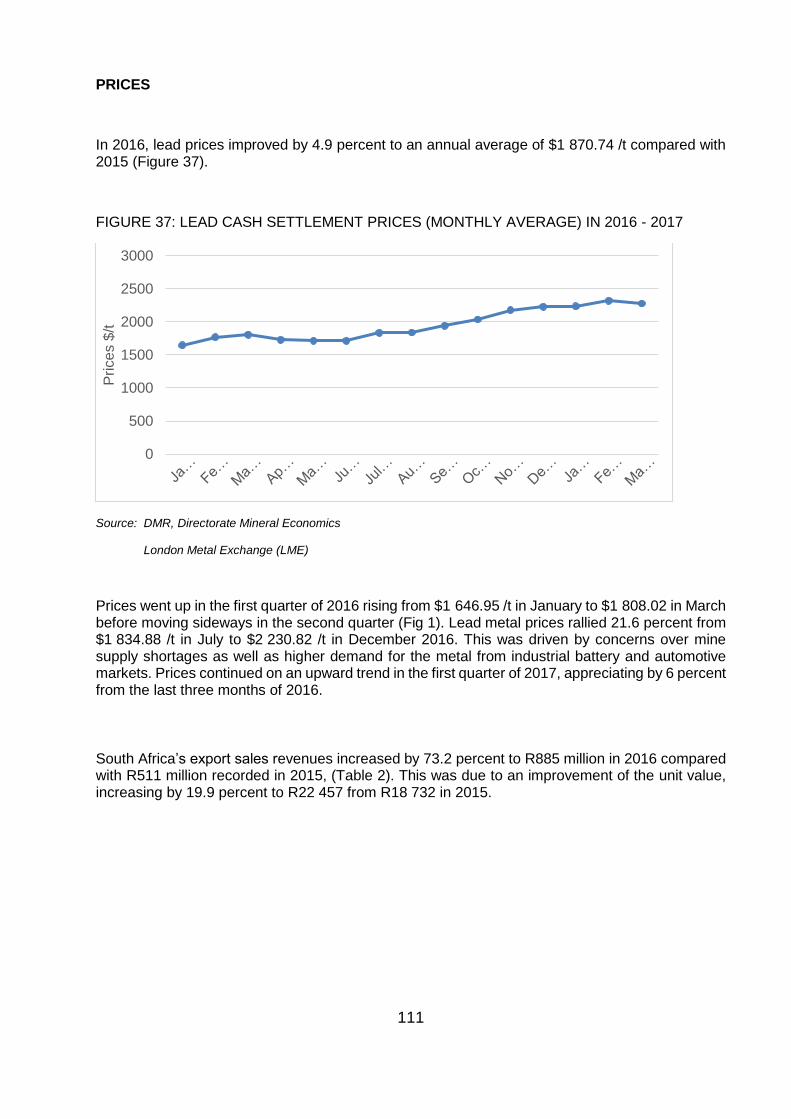
111
PRICES
In 2016, lead prices improved by 4.9 percent to an annual average of $1 870.74 /t compared with 2015 (Figure 37).
FIGURE 37: LEAD CASH SETTLEMENT PRICES (MONTHLY AVERAGE) IN 2016 - 2017
Source: DMR, Directorate Mineral Economics
London Metal Exchange (LME)
Prices went up in the first quarter of 2016 rising from $1 646.95 /t in January to $1 808.02 in March before moving sideways in the second quarter (Fig 1). Lead metal prices rallied 21.6 percent from $1 834.88 /t in July to $2 230.82 /t in December 2016. This was driven by concerns over mine supply shortages as well as higher demand for the metal from industrial battery and automotive markets. Prices continued on an upward trend in the first quarter of 2017, appreciating by 6 percent from the last three months of 2016.
South Africa’s export sales revenues increased by 73.2 percent to R885 million in 2016 compared with R511 million recorded in 2015, (Table 2). This was due to an improvement of the unit value, increasing by 19.9 percent to R22 457 from R18 732 in 2015.
0
500
1000
1500
2000
2500
3000
Price
s $
/t
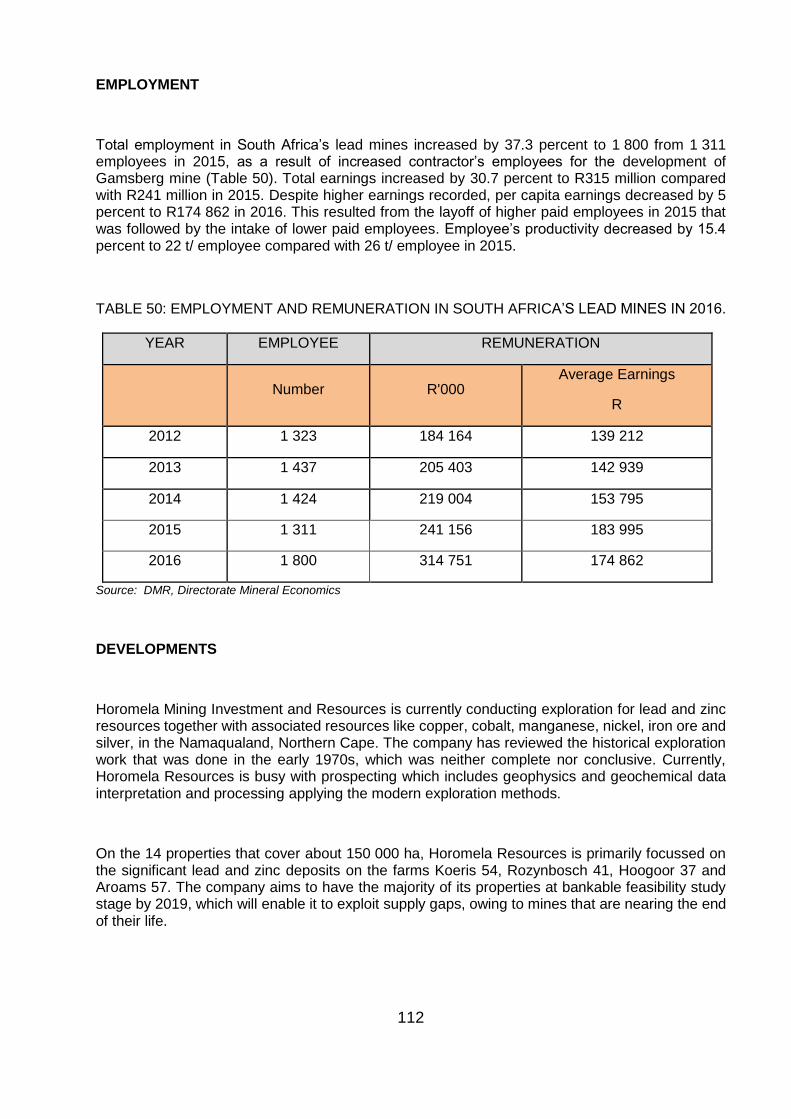
112
EMPLOYMENT
Total employment in South Africa’s lead mines increased by 37.3 percent to 1 800 from 1 311 employees in 2015, as a result of increased contractor’s employees for the development of Gamsberg mine (Table 50). Total earnings increased by 30.7 percent to R315 million compared with R241 million in 2015. Despite higher earnings recorded, per capita earnings decreased by 5 percent to R174 862 in 2016. This resulted from the layoff of higher paid employees in 2015 that was followed by the intake of lower paid employees. Employee’s productivity decreased by 15.4 percent to 22 t/ employee compared with 26 t/ employee in 2015.
TABLE 50: EMPLOYMENT AND REMUNERATION IN SOUTH AFRICA’S LEAD MINES IN 2016.
YEAR EMPLOYEE REMUNERATION
Number R'000 Average Earnings
R
2012 1 323 184 164 139 212
2013 1 437 205 403 142 939
2014 1 424 219 004 153 795
2015 1 311 241 156 183 995
2016 1 800 314 751 174 862
Source: DMR, Directorate Mineral Economics
DEVELOPMENTS
Horomela Mining Investment and Resources is currently conducting exploration for lead and zinc resources together with associated resources like copper, cobalt, manganese, nickel, iron ore and silver, in the Namaqualand, Northern Cape. The company has reviewed the historical exploration work that was done in the early 1970s, which was neither complete nor conclusive. Currently, Horomela Resources is busy with prospecting which includes geophysics and geochemical data interpretation and processing applying the modern exploration methods.
On the 14 properties that cover about 150 000 ha, Horomela Resources is primarily focussed on the significant lead and zinc deposits on the farms Koeris 54, Rozynbosch 41, Hoogoor 37 and Aroams 57. The company aims to have the majority of its properties at bankable feasibility study stage by 2019, which will enable it to exploit supply gaps, owing to mines that are nearing the end of their life.
113
OUTLOOK
Global lead mine production is forecast to increase by 5.6 percent to 5.06 Mt in 2017 and a further 1.1 percent to 5.11 Mt in 2018, according to International Lead and Zinc Study Group (ILZSG). This is primarily due to higher output in China following the re-opening of smaller operations that were closed as a result of environmental issues in 2015. Other contributions are expected from India, Kazakhstan and Canada, where Coeur mining’s Silvertip mine was commissioned in January 2017.
Global refined lead production is expected to grow by 3.7 percent to 11.58 Mt in 2017 and by further 1.6 percent in 2018, according to ILZSG. This will mainly result from higher output in China, India and the Republic of Korea. In China, higher output is expected from the country’s secondary sector following upgrades to comply with environmental regulations after a total shut down in 2015. Additional output is expected from the recently commissioned lead-acid battery recycling plant in Nevada, USA. Global refined lead consumption is expected to rise by 5 percent to 11.70 Mt in 2017, driven by a rise in the use of three-wheeled e-trikes that has more than offset reductions in the e-bike sector in China, the largest consumer of the lead metal. In Europe, demand for lead-acid battery is expected to increase by 2.2 percent resulting from a positive outlook in the automotive sector and power storage in the renewable energy sector. Refined lead market is expected to be in deficit by 125 kt in 2017, according to the industry body, ILZSG. LME lead prices are expected to continue to rise for the rest of 2017, as a result of tighter primary supply and falling levels of inventories held at LME warehouses. Given the less projects expected to come on stream while global economic growth is improving, the outlook for lead price looks positive for the coming years. This is anticipated to be driven by the rising automotive sector as well as the booming power storage in the renewable energy sector. Therefore, LME lead prices are expected to rise to an annual average above $2 500 /t in 2017. LME stock levels are gradually decreasing as investors anticipate a shortage in the short to medium term, this is expected to put an upward pressure on prices.
South Africa’s lead mine production is expected to rise as a result of the higher-grade ores on the feed towards the end of the year in 2016. Positive outlook for lead prices incited interest in lead and zinc mining resulting in recent exploration work that is underway in the Namaqualand in Northern Cape. These projects have incentives to take full advantage of market prices as the cycle is expected to change to more favourable conditions.
REFERENCES
1. DMR, Mineral Economics Directorate 2. http://www.metalbulletin.com 3. International Lead and Zinc Study Group Session/Forecast, October 2017 4. International Lead and Zinc Study Group, Review of Trends, February 2017. 5. Mining Weekly, 32 August 2017 6. U.S. Geological Survey, Mineral Commodity Summaries, January 2017
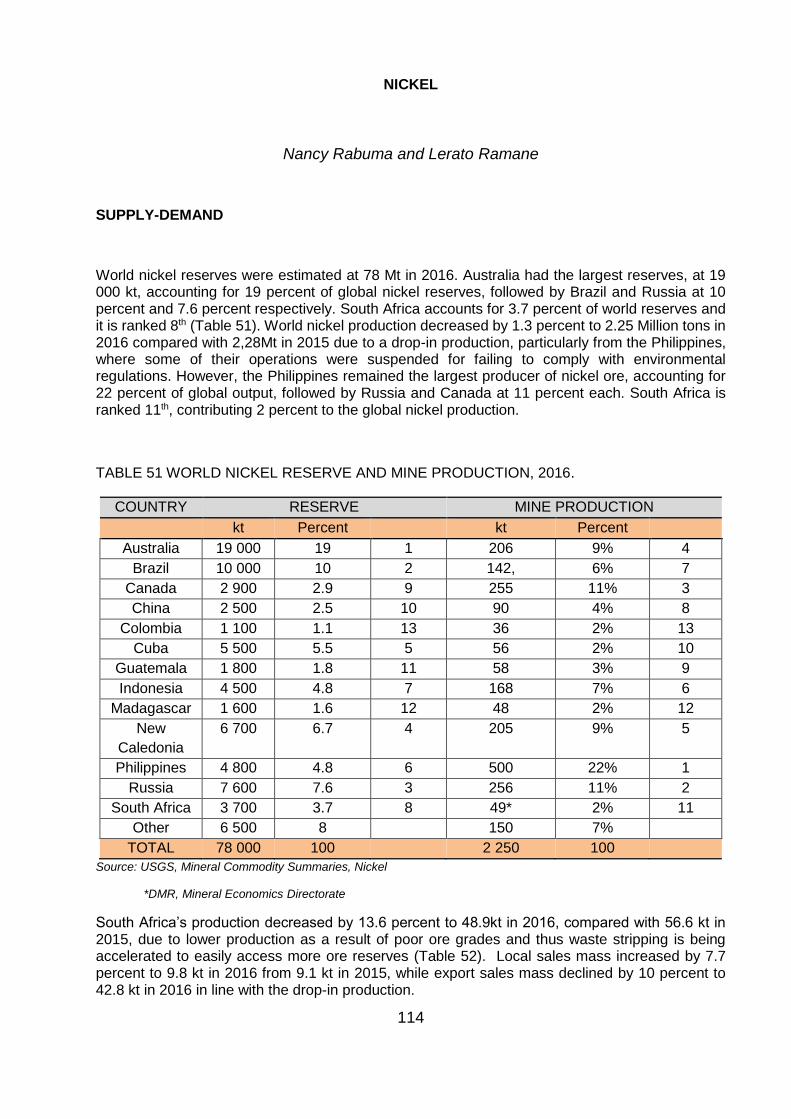
114
NICKEL
Nancy Rabuma and Lerato Ramane
SUPPLY-DEMAND
World nickel reserves were estimated at 78 Mt in 2016. Australia had the largest reserves, at 19 000 kt, accounting for 19 percent of global nickel reserves, followed by Brazil and Russia at 10 percent and 7.6 percent respectively. South Africa accounts for 3.7 percent of world reserves and it is ranked 8th (Table 51). World nickel production decreased by 1.3 percent to 2.25 Million tons in 2016 compared with 2,28Mt in 2015 due to a drop-in production, particularly from the Philippines, where some of their operations were suspended for failing to comply with environmental regulations. However, the Philippines remained the largest producer of nickel ore, accounting for 22 percent of global output, followed by Russia and Canada at 11 percent each. South Africa is ranked 11th, contributing 2 percent to the global nickel production.
TABLE 51 WORLD NICKEL RESERVE AND MINE PRODUCTION, 2016.
COUNTRY RESERVE MINE PRODUCTION
kt Percent kt Percent
Australia 19 000 19 1 206 9% 4
Brazil 10 000 10 2 142, 6% 7
Canada 2 900 2.9 9 255 11% 3
China 2 500 2.5 10 90 4% 8
Colombia 1 100 1.1 13 36 2% 13
Cuba 5 500 5.5 5 56 2% 10
Guatemala 1 800 1.8 11 58 3% 9
Indonesia 4 500 4.8 7 168 7% 6
Madagascar 1 600 1.6 12 48 2% 12
New
Caledonia
6 700 6.7 4 205 9% 5
Philippines 4 800 4.8 6 500 22% 1
Russia 7 600 7.6 3 256 11% 2
South Africa 3 700 3.7 8 49* 2% 11
Other 6 500 8 150 7%
TOTAL 78 000 100 2 250 100
Source: USGS, Mineral Commodity Summaries, Nickel
*DMR, Mineral Economics Directorate
South Africa’s production decreased by 13.6 percent to 48.9kt in 2016, compared with 56.6 kt in 2015, due to lower production as a result of poor ore grades and thus waste stripping is being accelerated to easily access more ore reserves (Table 52). Local sales mass increased by 7.7 percent to 9.8 kt in 2016 from 9.1 kt in 2015, while export sales mass declined by 10 percent to 42.8 kt in 2016 in line with the drop-in production.
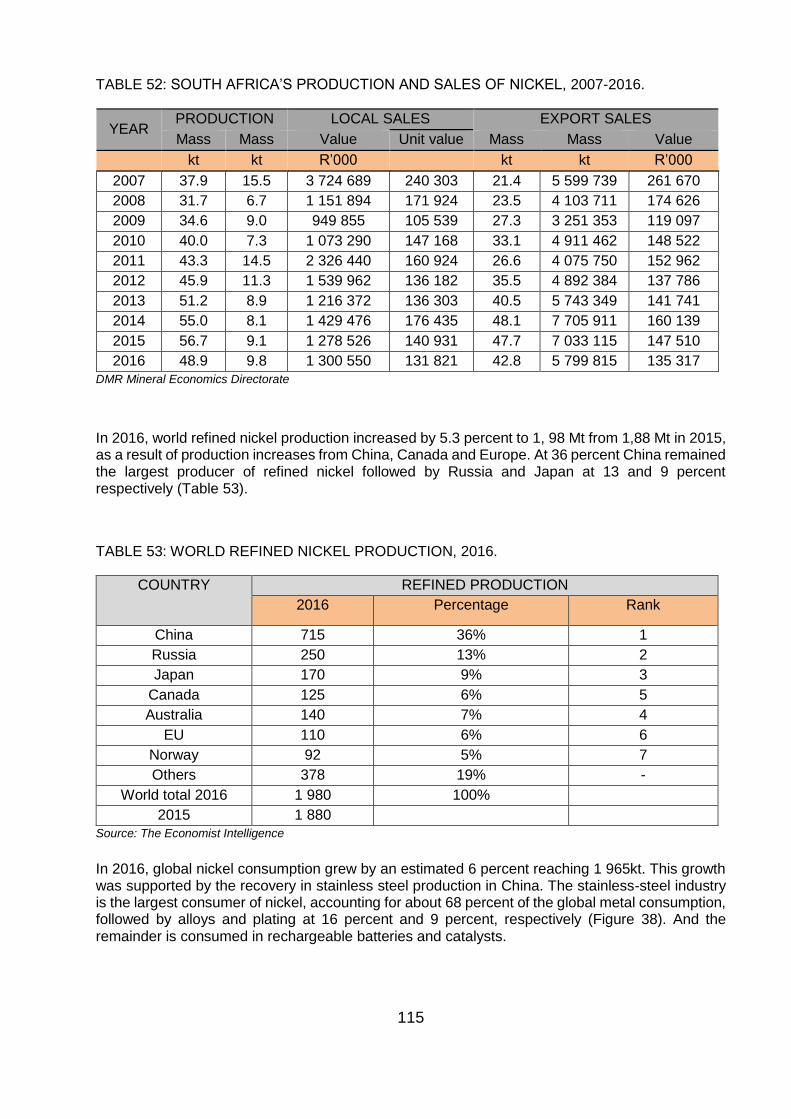
115
TABLE 52: SOUTH AFRICA’S PRODUCTION AND SALES OF NICKEL, 2007-2016.
YEAR PRODUCTION LOCAL SALES EXPORT SALES
Mass Mass Value Unit value Mass Mass Value
kt kt R’000 kt kt R’000
2007 37.9 15.5 3 724 689 240 303 21.4 5 599 739 261 670
2008 31.7 6.7 1 151 894 171 924 23.5 4 103 711 174 626
2009 34.6 9.0 949 855 105 539 27.3 3 251 353 119 097
2010 40.0 7.3 1 073 290 147 168 33.1 4 911 462 148 522
2011 43.3 14.5 2 326 440 160 924 26.6 4 075 750 152 962
2012 45.9 11.3 1 539 962 136 182 35.5 4 892 384 137 786
2013 51.2 8.9 1 216 372 136 303 40.5 5 743 349 141 741
2014 55.0 8.1 1 429 476 176 435 48.1 7 705 911 160 139
2015 56.7 9.1 1 278 526 140 931 47.7 7 033 115 147 510
2016 48.9 9.8 1 300 550 131 821 42.8 5 799 815 135 317
DMR Mineral Economics Directorate
In 2016, world refined nickel production increased by 5.3 percent to 1, 98 Mt from 1,88 Mt in 2015, as a result of production increases from China, Canada and Europe. At 36 percent China remained the largest producer of refined nickel followed by Russia and Japan at 13 and 9 percent respectively (Table 53).
TABLE 53: WORLD REFINED NICKEL PRODUCTION, 2016.
COUNTRY REFINED PRODUCTION
2016 Percentage Rank
China 715 36% 1
Russia 250 13% 2
Japan 170 9% 3
Canada 125 6% 5
Australia 140 7% 4
EU 110 6% 6
Norway 92 5% 7
Others 378 19% -
World total 2016 1 980 100%
2015 1 880
Source: The Economist Intelligence
In 2016, global nickel consumption grew by an estimated 6 percent reaching 1 965kt. This growth was supported by the recovery in stainless steel production in China. The stainless-steel industry is the largest consumer of nickel, accounting for about 68 percent of the global metal consumption, followed by alloys and plating at 16 percent and 9 percent, respectively (Figure 38). And the remainder is consumed in rechargeable batteries and catalysts.
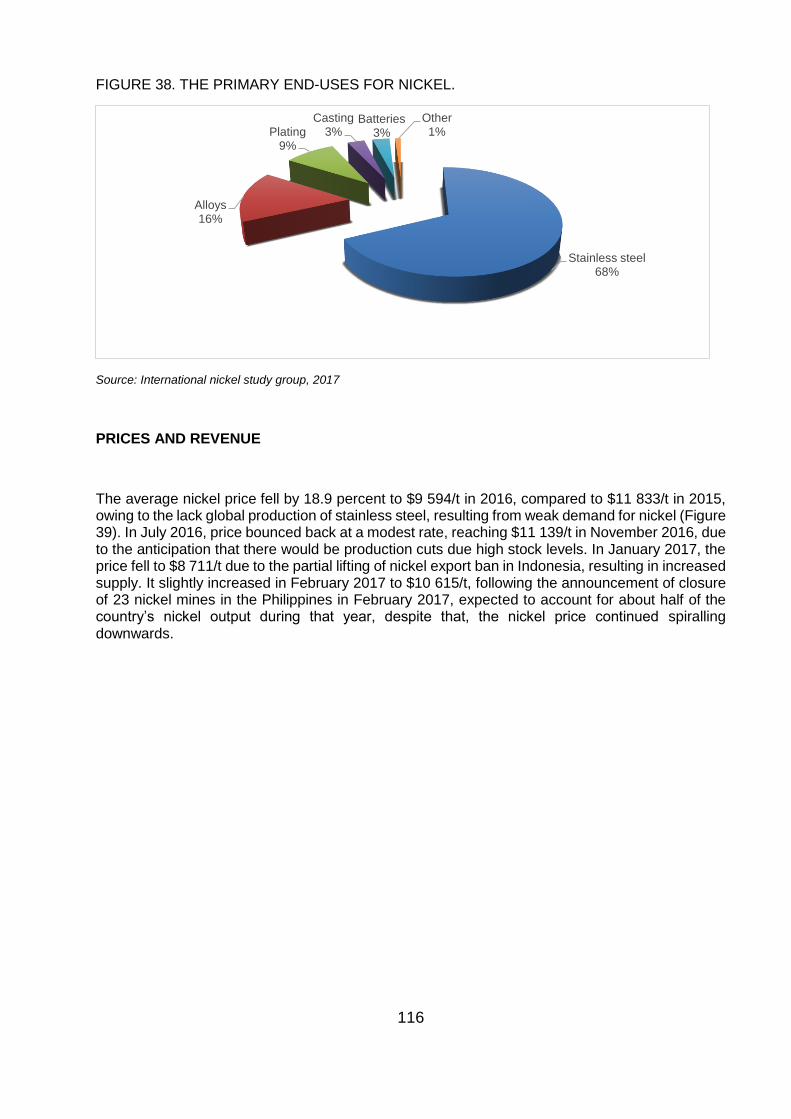
116
FIGURE 38. THE PRIMARY END-USES FOR NICKEL.
Source: International nickel study group, 2017
PRICES AND REVENUE
The average nickel price fell by 18.9 percent to $9 594/t in 2016, compared to $11 833/t in 2015, owing to the lack global production of stainless steel, resulting from weak demand for nickel (Figure 39). In July 2016, price bounced back at a modest rate, reaching $11 139/t in November 2016, due to the anticipation that there would be production cuts due high stock levels. In January 2017, the price fell to $8 711/t due to the partial lifting of nickel export ban in Indonesia, resulting in increased supply. It slightly increased in February 2017 to $10 615/t, following the announcement of closure of 23 nickel mines in the Philippines in February 2017, expected to account for about half of the country’s nickel output during that year, despite that, the nickel price continued spiralling downwards.
Stainless steel68%
Alloys16%
Plating9%
Casting3%
Batteries3%
Other1%
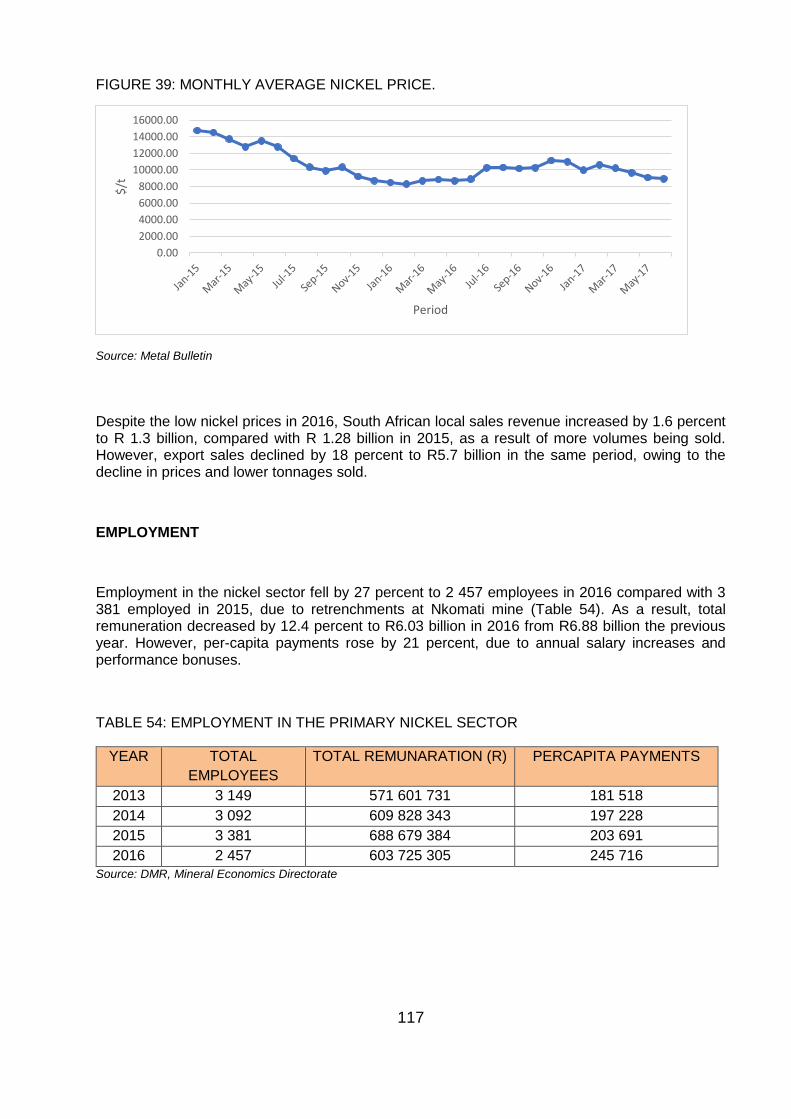
117
FIGURE 39: MONTHLY AVERAGE NICKEL PRICE.
Source: Metal Bulletin
Despite the low nickel prices in 2016, South African local sales revenue increased by 1.6 percent to R 1.3 billion, compared with R 1.28 billion in 2015, as a result of more volumes being sold. However, export sales declined by 18 percent to R5.7 billion in the same period, owing to the decline in prices and lower tonnages sold.
EMPLOYMENT
Employment in the nickel sector fell by 27 percent to 2 457 employees in 2016 compared with 3 381 employed in 2015, due to retrenchments at Nkomati mine (Table 54). As a result, total remuneration decreased by 12.4 percent to R6.03 billion in 2016 from R6.88 billion the previous year. However, per-capita payments rose by 21 percent, due to annual salary increases and performance bonuses.
TABLE 54: EMPLOYMENT IN THE PRIMARY NICKEL SECTOR
YEAR TOTAL
EMPLOYEES
TOTAL REMUNARATION (R) PERCAPITA PAYMENTS
2013 3 149 571 601 731 181 518
2014 3 092 609 828 343 197 228
2015 3 381 688 679 384 203 691
2016 2 457 603 725 305 245 716
Source: DMR, Mineral Economics Directorate
0.00
2000.00
4000.00
6000.00
8000.00
10000.00
12000.00
14000.00
16000.00$
/t
Period
118
DEVELOPMENTS
In South Africa, there are no new nickel projects that are expected to come on stream in the short term. However, there are two projects, both of which are at prospecting level. These projects are the Zebediela and Burgersfort nickel projects both owned by URU metals and located in Limpopo Province. However, additional capacity is expected from newly developed PGMs projects, where nickel will be produced as a by-product (refer to the PGMs chapter).
OUTLOOK
In 2017, global nickel mine production is expected to remain relatively stable with increased output from Indonesian nickel mines offsetting the reduced mine output from the Philippines. Long-term global nickel mine production is expected to increase at an annual average of 2.7 percent in the next three years. Additional capacity is expected from Indonesia, Australia and New Caledonia. The global refined nickel production is expected to increase marginally at an annual average of 1.2 percent in the next three years, driven by the continued ramp up of smelters in Indonesia.
Furthermore, in 2017, global nickel demand is expected to increase by 4 percent annually to 2 045kt, driven by the ramp up of stainless steel smelting capacity in China and plans to increase investment in the US infrastructure sector. In addition, the increase in production of the austenitic stainless-steel grades will increase nickel usage in all the key markets such as China, Japan, the US and Europe. The long-term global nickel consumption is expected to increase at 4.3 percent on an annual basis, to 2 318kt in 2020. During the next 3 years, consumption is likely to be determined by the wide range of applications in other industries, such as vehicle batteries and aerospace equipment.
In 2017, nickel prices are expected to increase by 16 percent y-o-y to US$11,155/t, owing to the decline in global nickel stocks and consumption exceeding supply. Long-term nickel prices are expected to increase at a compound annual growth rate of 11 percent from US$11,155/t in 2017 to US$15,256/t in 2020. Nickel consumption growth will be supported by strong infrastructure investment in China and the US, and strong growth in stainless steel production in China. Reduced supply from the Philippines is expected to support the increase in prices. Nevertheless, uncertainty still exists about the frequency of enforcement of mine suspensions in the Philippines. In addition, prices are expected to change depending on the production output from newly built smelters in Indonesia.
Despite reduced supply from the primary nickel producer in South Africa, output from the PGMs is expected to balance the loss. Furthermore, additional capacity from new projects in the aforementioned sector will also provide additional capacity. Growth in the stainless-steel sector is very bleak, due to imports of finished products flooding the market and this might have a negative impact on the local consumption of nickel if this trend continues. However, the consumption of nickel in vehicle batteries and aerospace equipment is steadily increasing.
119
REFERENCES
1. African Rainbow Minerals 2016 (ARM) 2. DMR Mineral Economics Directorate 3. International stainless-steel forum (ISSF) 4. MBR Research 5. Nickel Institute 6. Metal Bulletin 7. USGS, Mineral Commodity Summaries, Nickel 8. KPMG, Commodity Insight Bulletin, Nickel:2016-2017
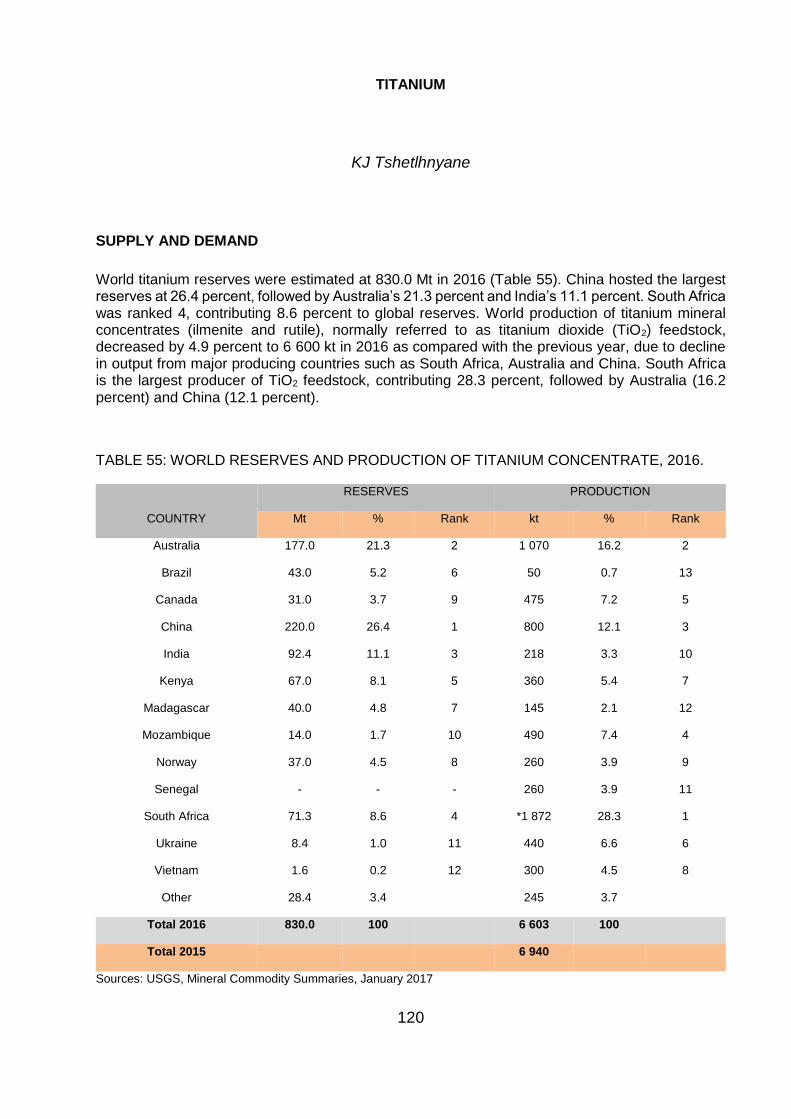
120
TITANIUM
KJ Tshetlhnyane
SUPPLY AND DEMAND
World titanium reserves were estimated at 830.0 Mt in 2016 (Table 55). China hosted the largest reserves at 26.4 percent, followed by Australia’s 21.3 percent and India’s 11.1 percent. South Africa was ranked 4, contributing 8.6 percent to global reserves. World production of titanium mineral concentrates (ilmenite and rutile), normally referred to as titanium dioxide (TiO2) feedstock, decreased by 4.9 percent to 6 600 kt in 2016 as compared with the previous year, due to decline in output from major producing countries such as South Africa, Australia and China. South Africa is the largest producer of TiO2 feedstock, contributing 28.3 percent, followed by Australia (16.2 percent) and China (12.1 percent).
TABLE 55: WORLD RESERVES AND PRODUCTION OF TITANIUM CONCENTRATE, 2016.
COUNTRY
RESERVES PRODUCTION
Mt % Rank kt % Rank
Australia 177.0 21.3 2 1 070 16.2 2
Brazil 43.0 5.2 6 50 0.7 13
Canada 31.0 3.7 9 475 7.2 5
China 220.0 26.4 1 800 12.1 3
India 92.4 11.1 3 218 3.3 10
Kenya 67.0 8.1 5 360 5.4 7
Madagascar 40.0 4.8 7 145 2.1 12
Mozambique 14.0 1.7 10 490 7.4 4
Norway 37.0 4.5 8 260 3.9 9
Senegal - - - 260 3.9 11
South Africa 71.3 8.6 4 *1 872 28.3 1
Ukraine 8.4 1.0 11 440 6.6 6
Vietnam 1.6 0.2 12 300 4.5 8
Other 28.4 3.4
245 3.7
Total 2016 830.0 100
6 603 100
Total 2015
6 940
Sources: USGS, Mineral Commodity Summaries, January 2017
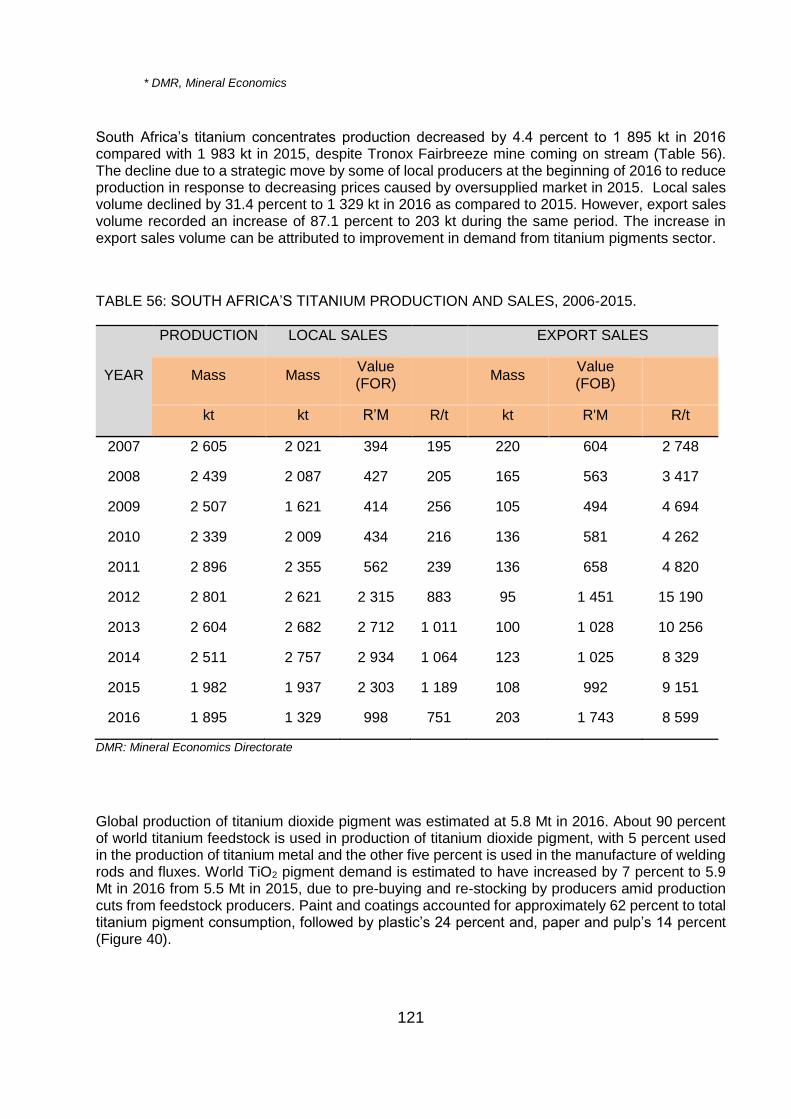
121
* DMR, Mineral Economics
South Africa’s titanium concentrates production decreased by 4.4 percent to 1 895 kt in 2016 compared with 1 983 kt in 2015, despite Tronox Fairbreeze mine coming on stream (Table 56). The decline due to a strategic move by some of local producers at the beginning of 2016 to reduce production in response to decreasing prices caused by oversupplied market in 2015. Local sales volume declined by 31.4 percent to 1 329 kt in 2016 as compared to 2015. However, export sales volume recorded an increase of 87.1 percent to 203 kt during the same period. The increase in export sales volume can be attributed to improvement in demand from titanium pigments sector.
TABLE 56: SOUTH AFRICA’S TITANIUM PRODUCTION AND SALES, 2006-2015.
YEAR
PRODUCTION LOCAL SALES EXPORT SALES
Mass Mass Value (FOR)
Mass Value (FOB)
kt kt R’M R/t kt R'M R/t
2007 2 605 2 021 394 195 220 604 2 748
2008 2 439 2 087 427 205 165 563 3 417
2009 2 507 1 621 414 256 105 494 4 694
2010 2 339 2 009 434 216 136 581 4 262
2011 2 896 2 355 562 239 136 658 4 820
2012 2 801 2 621 2 315 883 95 1 451 15 190
2013 2 604 2 682 2 712 1 011 100 1 028 10 256
2014 2 511 2 757 2 934 1 064 123 1 025 8 329
2015 1 982 1 937 2 303 1 189 108 992 9 151
2016 1 895 1 329 998 751 203 1 743 8 599
DMR: Mineral Economics Directorate
Global production of titanium dioxide pigment was estimated at 5.8 Mt in 2016. About 90 percent of world titanium feedstock is used in production of titanium dioxide pigment, with 5 percent used in the production of titanium metal and the other five percent is used in the manufacture of welding rods and fluxes. World TiO2 pigment demand is estimated to have increased by 7 percent to 5.9 Mt in 2016 from 5.5 Mt in 2015, due to pre-buying and re-stocking by producers amid production cuts from feedstock producers. Paint and coatings accounted for approximately 62 percent to total titanium pigment consumption, followed by plastic’s 24 percent and, paper and pulp’s 14 percent (Figure 40).
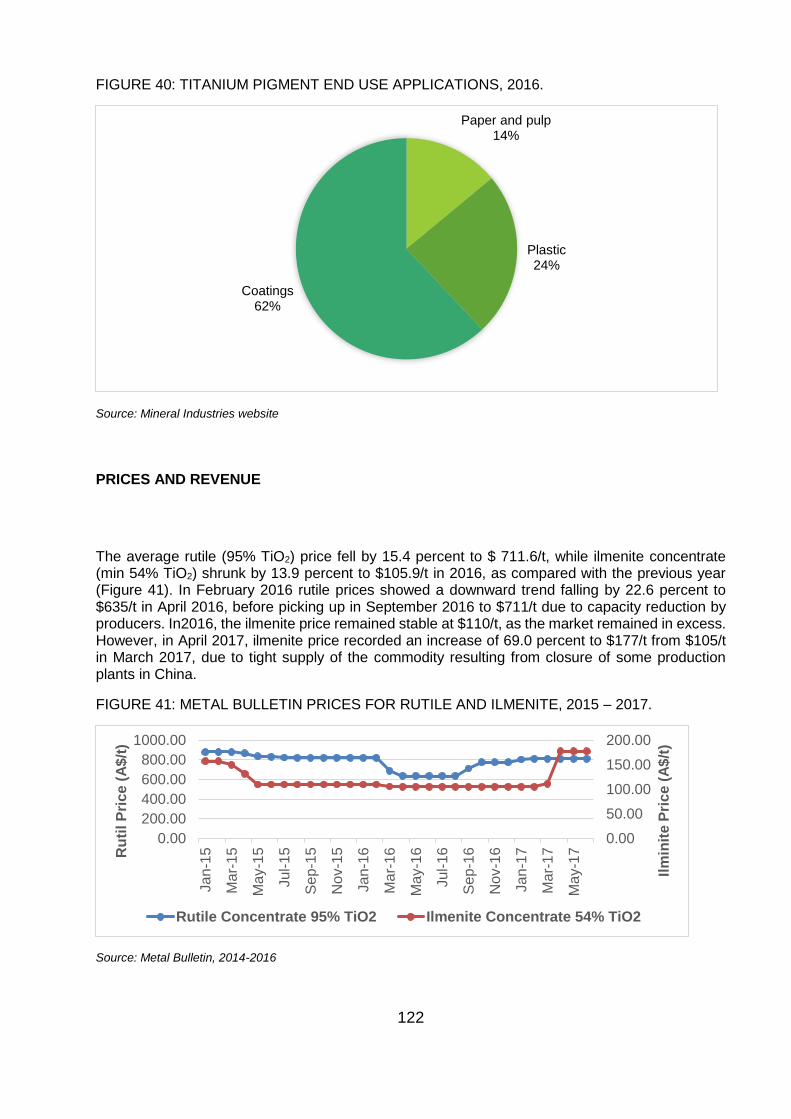
122
FIGURE 40: TITANIUM PIGMENT END USE APPLICATIONS, 2016.
Source: Mineral Industries website
PRICES AND REVENUE
The average rutile (95% TiO2) price fell by 15.4 percent to $ 711.6/t, while ilmenite concentrate (min 54% TiO2) shrunk by 13.9 percent to $105.9/t in 2016, as compared with the previous year (Figure 41). In February 2016 rutile prices showed a downward trend falling by 22.6 percent to $635/t in April 2016, before picking up in September 2016 to $711/t due to capacity reduction by producers. In2016, the ilmenite price remained stable at $110/t, as the market remained in excess. However, in April 2017, ilmenite price recorded an increase of 69.0 percent to $177/t from $105/t in March 2017, due to tight supply of the commodity resulting from closure of some production plants in China.
FIGURE 41: METAL BULLETIN PRICES FOR RUTILE AND ILMENITE, 2015 – 2017.
Source: Metal Bulletin, 2014-2016
Paper and pulp14%
Plastic24%
Coatings62%
0.00
50.00
100.00
150.00
200.00
0.00
200.00
400.00
600.00
800.00
1000.00
Ja
n-1
5
Ma
r-1
5
Ma
y-1
5
Ju
l-1
5
Se
p-1
5
No
v-1
5
Ja
n-1
6
Ma
r-1
6
Ma
y-1
6
Ju
l-1
6
Se
p-1
6
No
v-1
6
Ja
n-1
7
Ma
r-1
7
Ma
y-1
7
Ilm
init
e P
ric
e (
A$
/t)
Ru
til P
ric
e (
A$
/t)
Rutile Concentrate 95% TiO2 Ilmenite Concentrate 54% TiO2
123
South Africa’s total revenue earned from the sale of titanium concentrates was no exception as it recorded a decline of 18.6 percent from R3.3 billion in 2015 to R2.7 billion in 2016, despite a 11.1 percent increase of unit price to R1 789/t. The decrease can be attributed to decline in sales quantity. Local sales revenue fell by 56.7 percent to R998 million in 2016. Export sales revenue recorded an increase of 75.8 percent to R1.7 billion during the same period, due to increased sales capacity that was not enough to offset the overall decline in sales.
EMPLOYMENT
Total employment in the titanium sector declined by 9.0 percent to 6 591 in 2016 compared with the previous year (Table 57). The decrease can be attributed to a decrease in contract employees, because of cost containment measures by producers. Thus, a 4.7 percent decrease of total remuneration to R1.4 billion was recorded for 2016.
TABLE 57: EMPLOYMENT AND REMUNERATION IN THE TITANIUM SECTOR IN 2016
YEAR EMPLOYEE REMUNERATION
Number R'000 Per Capita Earnings
2012 6 503 2 092 252 322
2013 6 335 1 373 440 217
2014 6 576 1 342 184 204
2015 7 243 1 494 836 206
2016 6 591 1 423 953 216
Source: DMR, Mineral Economics
DEVELOPMENTS
Richards Bay Minerals (RBM) is extending its operations by 20 kilometers strip along the coastline south of the town in northern KZN. The move is a step closer to the development of RBM’s Zulti South mine which sets to extend life of RBM operations until 2037. RBM’s Zulti North’s mineral deposits are depleting and Zulti South mine is expected to come online in time to maintain production at 200 million tonnes per year. Zulti South mine is expected to retain 4000 employees, including permanent and contractors, from Zulti North mine, once the mine is operational. The US$500 million project falls under Richards Bay Minerals which is controlled by Rio Tinto.
Fairbreeze mine was officially opened in April 2016 in Kwa Zulu Natal (KZN). During the construction phase, more than 1 000 jobs were created and once operational another 1 000 jobs are expected to be created. Approximately R5 billion is said to be invested in expanding the mine, which is partially owned by Tronox (74 percent) and Exxaro (26 percent).
124
Huntsman closed its 25 kt Umbogintwini titanium dioxide manufacturing plant in the last quarter of 2016, due to ageing of the plant and low profit margins. Post closure, the company arranged to serve its African region customers titanium dioxide pigments from facilities based in Europe. The closure is part of Huntsman’s restructuring plan. The Umbogintwini plant had 140 employees and was regarded as the smallest and oldest titanium dioxide manufacturing plant in the pigments and additives division of Huntsman.
Recently the DTI announced the R4.5 billion titanium plant deal between SA’s Nyanza Light Metals and New Zealand company Avertana. This will see the stockpiled waste steel slag in the Evraz Highveld Steel and Vanadium, being used to create titanium dioxide pigment, which is used as an input to produce paints and coatings, food colourants, paper and plastics. The stockpile is estimated to be 45 million tons, equating to 200 years of project life time. The project is scheduled to commence in 2018 with an expected capacity of 50 000t/a of titanium dioxide by 2019. This will be followed by the second phase, known as the Avertana front-end plant, which will commence production in 2021. The third phase, is expected to focus on beneficiation capacity which will be produced by Richards Bay Minerals. At full operation, the plant is expected to create 550 permanent jobs and an additional 1 200 indirect jobs. Approximately 800 jobs will be created during the construction phase. It will be situated in the Richard’s Bay Industrial Development Zone in Kwa Zulu Natal.
OUTLOOK
The strategic decision by some of the global titanium producers to reduce production, in order to induce demand, was a step in the right direction. According to TZMI, titanium pigment sector showed an improvement during the second half of 2016, causing an increase in demand for titanium concentrates and is expected to persist during 2017. World titanium production is expected to increase slightly in 2017, with producers closely monitoring the extend of demand during the year.
Demand for titanium dioxide is expected to increase in 2017 influenced by re-stocking and re-buying by titanium dioxide pigment producers to keep production maximum to meet consumers demand. Titanium concentrates prices are expected to improve in 2017 due to price increase announcements, already made by some global producers during the first half of the year and, by improving demand from titanium pigments producers. Pigments producers are also expected to increase their prices to recoup some profit lost to high costs from titanium concentrate.
South Africa’s production is expected to increase in 2017, as most producers that curbed production in the previous year, are also likely to increase production in response to improved market conditions. Looking ahead of 2017, in 2019 the country’s production capacity is expected to receive additional 50 000t/a titanium dioxides from recently announced titanium plant deal between by South Africa’s Nyanza Light Metals and New Zealand company Avertana. The project is regarded as a major milestone for the development of titanium mineral value chain not only in South Africa but Africa. It will serve as a cornerstone for titanium mineral beneficiation in the country once the final phase is completed and will replace the foregone production from closed Umbogintwini plant. Additionally, this project will positively contribute to the economy through revenues and job creation. The completion of Rio Tinto’s Zulti South project, will also add capacity to the country’s titanium production in the near future.
125
REFERENCES
1. Chemours, Annual Report 2016. 2. Rio Tinto, Annual Report 206. 3. Department of Mineral Resources, Mineral Economics Directorate. 4. Department of Trade and Industry. 5. http://www.grandviewresearch.com/industry-analysis/titanium-dioxide-industry. 6. http://www.indmin.com/Article/3596833/TiO2Zircon-PricingNews/Huntsman-hikes-TiO2-
pigment-prices-further.html 7. http://www.pcimag.com/articles/100036-a-review-of-global-supply-and-demand-for-
titanium-dioxide 8. Metal Bulletin 9. Mineral Sands Report, January 2017. 10. Tronox Limited 2016, Annual Report and corporate Responsibility report 11. USGS, Mineral Commodity Summaries, January 2017 12. http://www.miningweekly.com/article/savannah-earns-20-stake-in-rio-tintos-mutamba-
project-2017-05-30 13. African News Agency. (27 March 2017). R4bn titanium beneficiation project in Richards
Bay IDZ. http://www.engineeringnews.co.za/article/dti-optimistic-about-r4bn-titanium-beneficiation-project-in-richards-bay-idz-2017-03-27.
http://www.miningweekly.com/article/savannah-earns-20-stake-in-rio-tintos-mutamba-project-2017-05-30
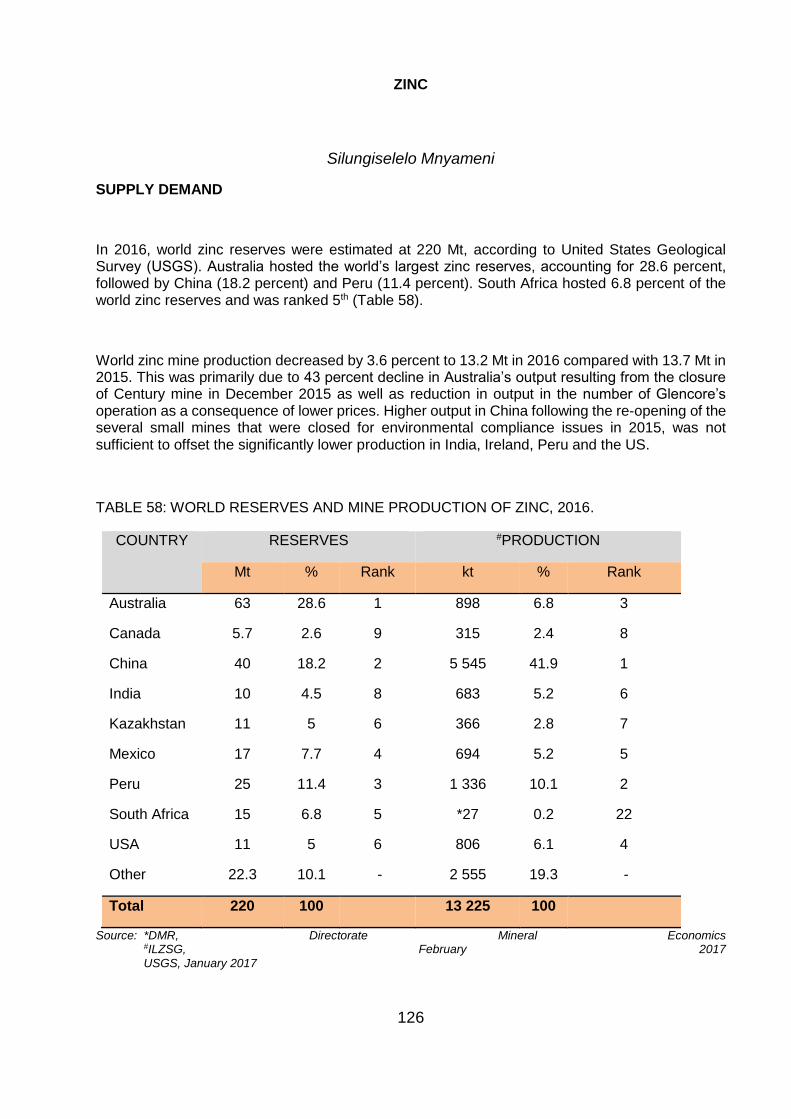
126
ZINC
Silungiselelo Mnyameni
SUPPLY DEMAND
In 2016, world zinc reserves were estimated at 220 Mt, according to United States Geological Survey (USGS). Australia hosted the world’s largest zinc reserves, accounting for 28.6 percent, followed by China (18.2 percent) and Peru (11.4 percent). South Africa hosted 6.8 percent of the world zinc reserves and was ranked 5th (Table 58).
World zinc mine production decreased by 3.6 percent to 13.2 Mt in 2016 compared with 13.7 Mt in 2015. This was primarily due to 43 percent decline in Australia’s output resulting from the closure of Century mine in December 2015 as well as reduction in output in the number of Glencore’s operation as a consequence of lower prices. Higher output in China following the re-opening of the several small mines that were closed for environmental compliance issues in 2015, was not sufficient to offset the significantly lower production in India, Ireland, Peru and the US.
TABLE 58: WORLD RESERVES AND MINE PRODUCTION OF ZINC, 2016.
COUNTRY RESERVES #PRODUCTION
Mt % Rank kt % Rank
Australia 63 28.6 1 898 6.8 3
Canada 5.7 2.6 9 315 2.4 8
China 40 18.2 2 5 545 41.9 1
India 10 4.5 8 683 5.2 6
Kazakhstan 11 5 6 366 2.8 7
Mexico 17 7.7 4 694 5.2 5
Peru 25 11.4 3 1 336 10.1 2
South Africa 15 6.8 5 *27 0.2 22
USA 11 5 6 806 6.1 4
Other 22.3 10.1 - 2 555 19.3 -
Total 220 100 13 225 100
Source: *DMR, Directorate Mineral Economics #ILZSG, February 2017
USGS, January 2017
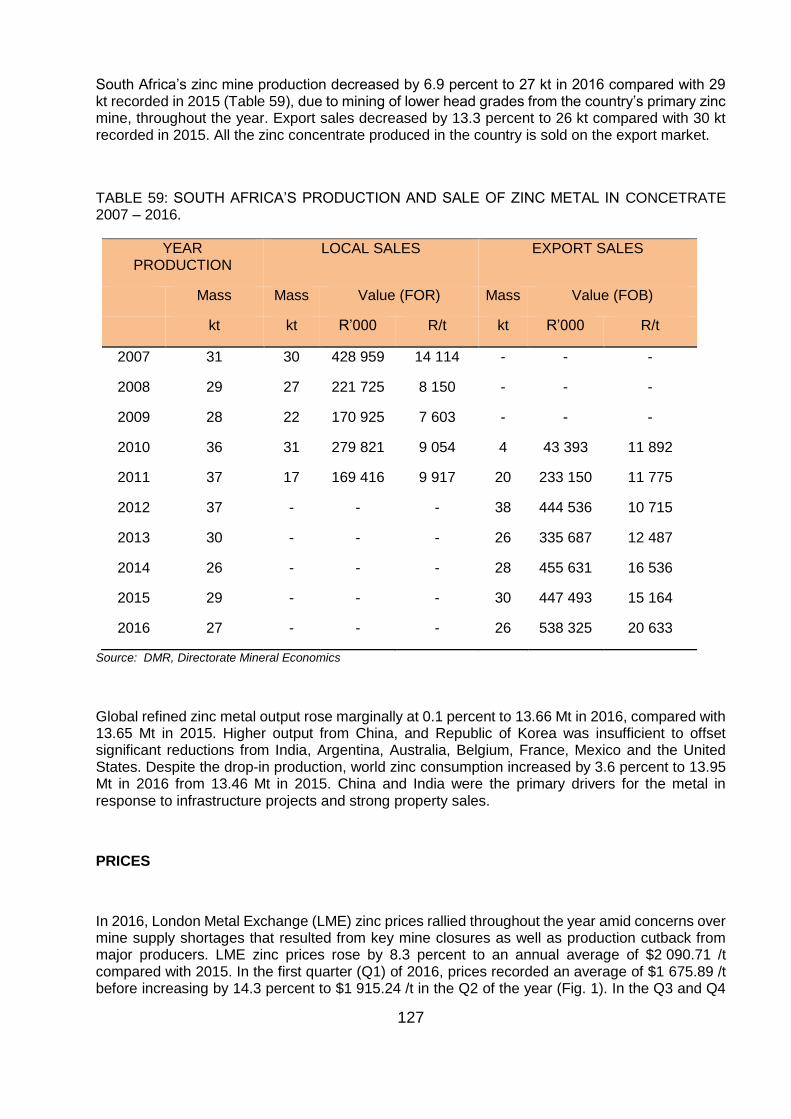
127
South Africa’s zinc mine production decreased by 6.9 percent to 27 kt in 2016 compared with 29 kt recorded in 2015 (Table 59), due to mining of lower head grades from the country’s primary zinc mine, throughout the year. Export sales decreased by 13.3 percent to 26 kt compared with 30 kt recorded in 2015. All the zinc concentrate produced in the country is sold on the export market.
TABLE 59: SOUTH AFRICA’S PRODUCTION AND SALE OF ZINC METAL IN CONCETRATE 2007 – 2016.
YEAR PRODUCTION
LOCAL SALES EXPORT SALES
Mass Mass Value (FOR) Mass Value (FOB)
kt kt R’000 R/t kt R’000 R/t
2007 31 30 428 959 14 114 - - -
2008 29 27 221 725 8 150 - - -
2009 28 22 170 925 7 603 - - -
2010 36 31 279 821 9 054 4 43 393 11 892
2011 37 17 169 416 9 917 20 233 150 11 775
2012 37 - - - 38 444 536 10 715
2013 30 - - - 26 335 687 12 487
2014 26 - - - 28 455 631 16 536
2015 29 - - - 30 447 493 15 164
2016 27 - - - 26 538 325 20 633
Source: DMR, Directorate Mineral Economics
Global refined zinc metal output rose marginally at 0.1 percent to 13.66 Mt in 2016, compared with 13.65 Mt in 2015. Higher output from China, and Republic of Korea was insufficient to offset significant reductions from India, Argentina, Australia, Belgium, France, Mexico and the United States. Despite the drop-in production, world zinc consumption increased by 3.6 percent to 13.95 Mt in 2016 from 13.46 Mt in 2015. China and India were the primary drivers for the metal in response to infrastructure projects and strong property sales.
PRICES
In 2016, London Metal Exchange (LME) zinc prices rallied throughout the year amid concerns over mine supply shortages that resulted from key mine closures as well as production cutback from major producers. LME zinc prices rose by 8.3 percent to an annual average of $2 090.71 /t compared with 2015. In the first quarter (Q1) of 2016, prices recorded an average of $1 675.89 /t before increasing by 14.3 percent to $1 915.24 /t in the Q2 of the year (Fig. 1). In the Q3 and Q4
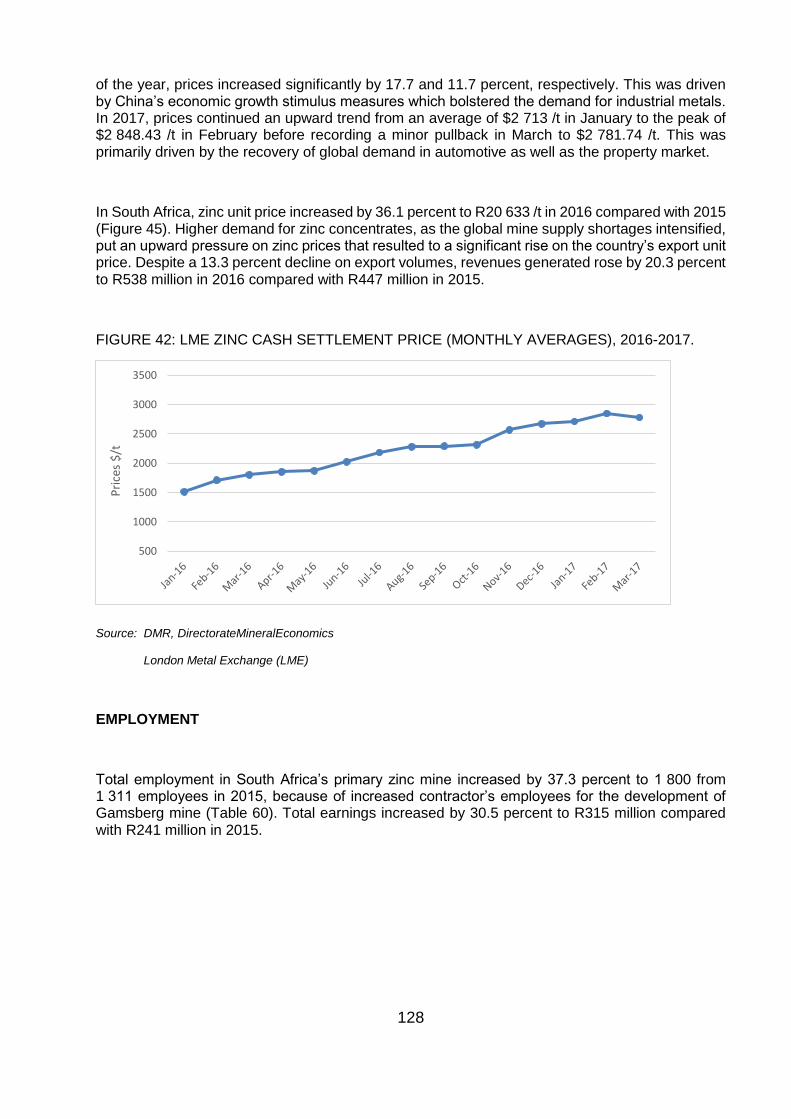
128
of the year, prices increased significantly by 17.7 and 11.7 percent, respectively. This was driven by China’s economic growth stimulus measures which bolstered the demand for industrial metals. In 2017, prices continued an upward trend from an average of $2 713 /t in January to the peak of $2 848.43 /t in February before recording a minor pullback in March to $2 781.74 /t. This was primarily driven by the recovery of global demand in automotive as well as the property market.
In South Africa, zinc unit price increased by 36.1 percent to R20 633 /t in 2016 compared with 2015 (Figure 45). Higher demand for zinc concentrates, as the global mine supply shortages intensified, put an upward pressure on zinc prices that resulted to a significant rise on the country’s export unit price. Despite a 13.3 percent decline on export volumes, revenues generated rose by 20.3 percent to R538 million in 2016 compared with R447 million in 2015.
FIGURE 42: LME ZINC CASH SETTLEMENT PRICE (MONTHLY AVERAGES), 2016-2017.
Source: DMR, DirectorateMineralEconomics
London Metal Exchange (LME)
EMPLOYMENT
Total employment in South Africa’s primary zinc mine increased by 37.3 percent to 1 800 from 1 311 employees in 2015, because of increased contractor’s employees for the development of Gamsberg mine (Table 60). Total earnings increased by 30.5 percent to R315 million compared with R241 million in 2015.
500
1000
1500
2000
2500
3000
3500
Pri
ces
$/t
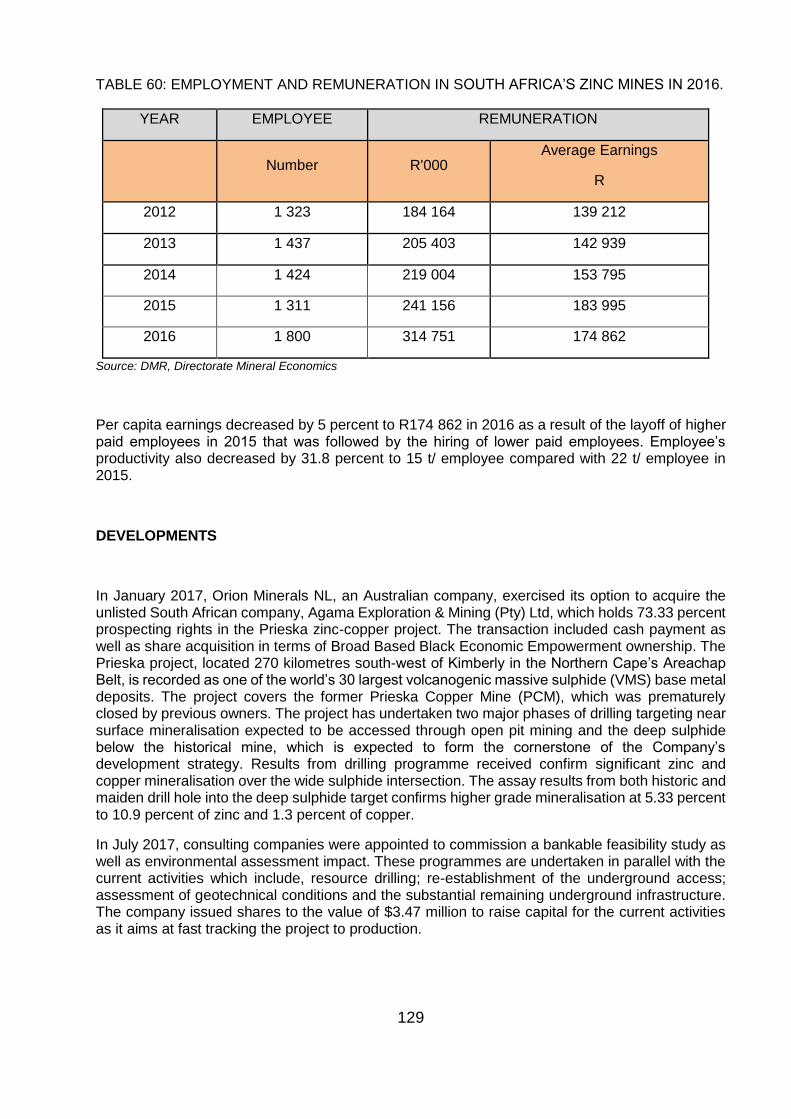
129
TABLE 60: EMPLOYMENT AND REMUNERATION IN SOUTH AFRICA’S ZINC MINES IN 2016.
YEAR EMPLOYEE REMUNERATION
Number R'000 Average Earnings
R
2012 1 323 184 164 139 212
2013 1 437 205 403 142 939
2014 1 424 219 004 153 795
2015 1 311 241 156 183 995
2016 1 800 314 751 174 862
Source: DMR, Directorate Mineral Economics
Per capita earnings decreased by 5 percent to R174 862 in 2016 as a result of the layoff of higher paid employees in 2015 that was followed by the hiring of lower paid employees. Employee’s productivity also decreased by 31.8 percent to 15 t/ employee compared with 22 t/ employee in 2015.
DEVELOPMENTS
In January 2017, Orion Minerals NL, an Australian company, exercised its option to acquire the unlisted South African company, Agama Exploration & Mining (Pty) Ltd, which holds 73.33 percent prospecting rights in the Prieska zinc-copper project. The transaction included cash payment as well as share acquisition in terms of Broad Based Black Economic Empowerment ownership. The Prieska project, located 270 kilometres south-west of Kimberly in the Northern Cape’s Areachap Belt, is recorded as one of the world’s 30 largest volcanogenic massive sulphide (VMS) base metal deposits. The project covers the former Prieska Copper Mine (PCM), which was prematurely closed by previous owners. The project has undertaken two major phases of drilling targeting near surface mineralisation expected to be accessed through open pit mining and the deep sulphide below the historical mine, which is expected to form the cornerstone of the Company’s development strategy. Results from drilling programme received confirm significant zinc and copper mineralisation over the wide sulphide intersection. The assay results from both historic and maiden drill hole into the deep sulphide target confirms higher grade mineralisation at 5.33 percent to 10.9 percent of zinc and 1.3 percent of copper.
In July 2017, consulting companies were appointed to commission a bankable feasibility study as well as environmental assessment impact. These programmes are undertaken in parallel with the current activities which include, resource drilling; re-establishment of the underground access; assessment of geotechnical conditions and the substantial remaining underground infrastructure. The company issued shares to the value of $3.47 million to raise capital for the current activities as it aims at fast tracking the project to production.
130
Development progress on the Vedanta Resources’ Gamsberg project situated in Aggeneys in the Northern Cape Province of South Africa remains on track for the first production in mid-2018. From the ground breaking in July 2015, over 22.5 Mt of waste was removed and the access ramp for waste pre-stripping to access the ore body has been completed. As a result, a full pre-stripping rate of 3.5 Mt per month has been achieved and is expected to continue at this rate until the start of ore production. The construction of a 250 kt per annum concentrator plant has begun as well as the key infrastructure for the project that includes power lines and water pipes construction is underway. Approximately, 1500 people will be employed where more than half comprises of local people. Following the reduction of the capital investment for the first phase from $600 million to $400 million, phase 2 could start as soon as phase 1 is complete. Phase 2 entails construction of the larger North pit which has an estimated 154 Mt of resources at a grade of 6.3 percent of zinc with approximately 50-year life of mine. Depending on market conditions, Gamsberg is considering the development of its own 300 – 350 MW zinc refinery at a cost estimated to $600 million as part of phase 2.
OUTLOOK
Global zinc mine production is anticipated to increase by 1.8 percent to 13.00 Mt in 2017 and by further 6 percent in 2018, due to additional output from major producing countries including South Africa. Despite the recovery in India’s refined output, the global refined zinc metal output is expected to fall by 1.4 percent to 13.53 Mt in 2017. This is likely to be influenced by reduction in Canada, influenced by the ongoing strike at Noranda Income Fund’s Valleyfield refinery. Output is also forecast to be lower in China, Peru, the Republic of Korea and Thailand, where Padaeng’s Tak refinery ceased production in July 2017. World refined zinc consumption is anticipated to exceed the constrained supply by 398 kt in 2017, driven by global zinc metal demand which is expected to increase by 0.7 percent to 13.93 Mt. Higher demand is expected from China resulting from rising galvanised steel production as well as rising demand in Europe and the US.
The upward trend of the zinc market price is expected to continue, resulting from an anticipated market deficit in 2017 and higher demand. As a result, the zinc price is expected to reach an annual average of $3 000 /t. The upcoming zinc market deficit associated with higher metal prices is expected to ignite a new wave of investment in projects. In South Africa, the development of Gamsberg project together with the Prieska copper-zinc project in the Namaqualand district, in Northern Cape are positioned to take advantage of the looming boom cycle in the zinc market. These projects are expected to raise South Africa’s contribution to world zinc supply, moving the country to one of the top zinc producers.
131
REFERENCES
1. Creamer Media: Mining weekly 2017 2. DMR, Mineral Economics Directorate 3. Economic Times, May 2017 4. International Lead and Zinc Study Group, Session/Forecast, October 2017. 5. International Lead and Zinc Study Group, Session/Forecast, February 2017 6. http://www.metalbulletin.com 7. U.S. Geological Survey, Mineral Commodity Summaries, January 2017
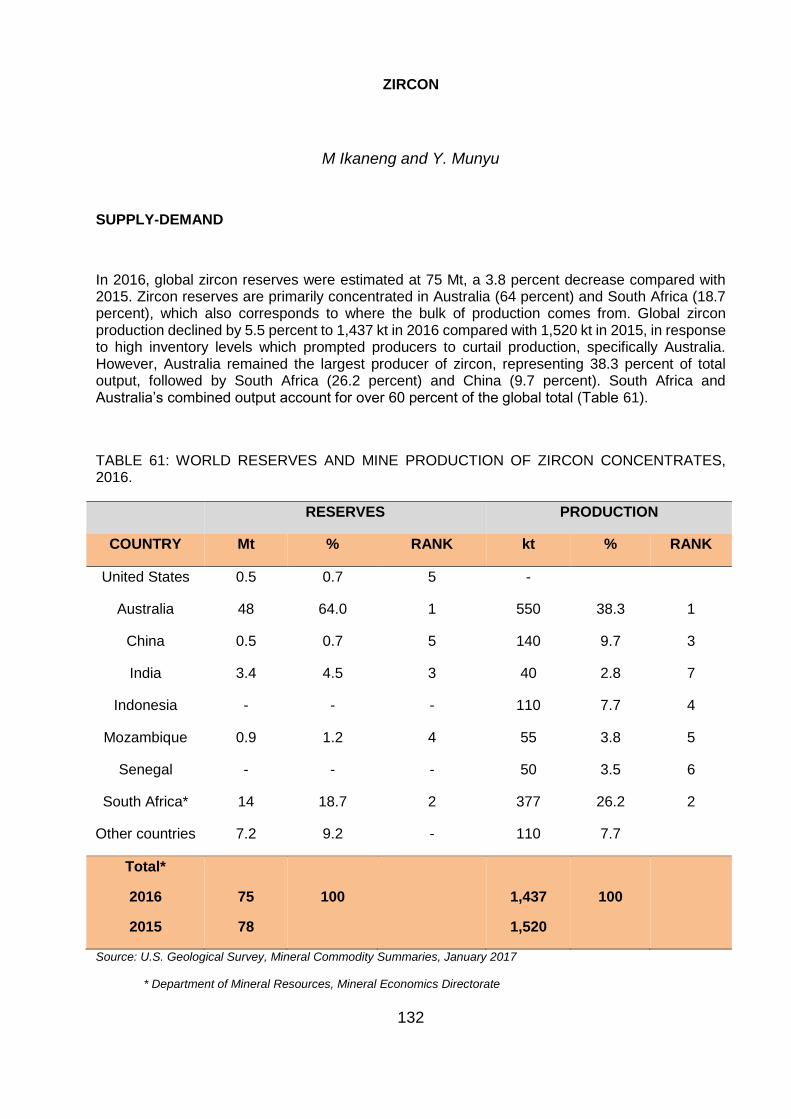
132
ZIRCON
M Ikaneng and Y. Munyu
SUPPLY-DEMAND
In 2016, global zircon reserves were estimated at 75 Mt, a 3.8 percent decrease compared with 2015. Zircon reserves are primarily concentrated in Australia (64 percent) and South Africa (18.7 percent), which also corresponds to where the bulk of production comes from. Global zircon production declined by 5.5 percent to 1,437 kt in 2016 compared with 1,520 kt in 2015, in response to high inventory levels which prompted producers to curtail production, specifically Australia. However, Australia remained the largest producer of zircon, representing 38.3 percent of total output, followed by South Africa (26.2 percent) and China (9.7 percent). South Africa and Australia’s combined output account for over 60 percent of the global total (Table 61).
TABLE 61: WORLD RESERVES AND MINE PRODUCTION OF ZIRCON CONCENTRATES, 2016.
RESERVES PRODUCTION
COUNTRY Mt % RANK kt % RANK
United States 0.5 0.7 5 -
Australia 48 64.0 1 550 38.3 1
China 0.5 0.7 5 140 9.7 3
India 3.4 4.5 3 40 2.8 7
Indonesia - - - 110 7.7 4
Mozambique 0.9 1.2 4 55 3.8 5
Senegal - - - 50 3.5 6
South Africa* 14 18.7 2 377 26.2 2
Other countries 7.2 9.2 - 110 7.7
Total*
2016
2015
75
78
100
1,437
1,520
100
Source: U.S. Geological Survey, Mineral Commodity Summaries, January 2017
* Department of Mineral Resources, Mineral Economics Directorate
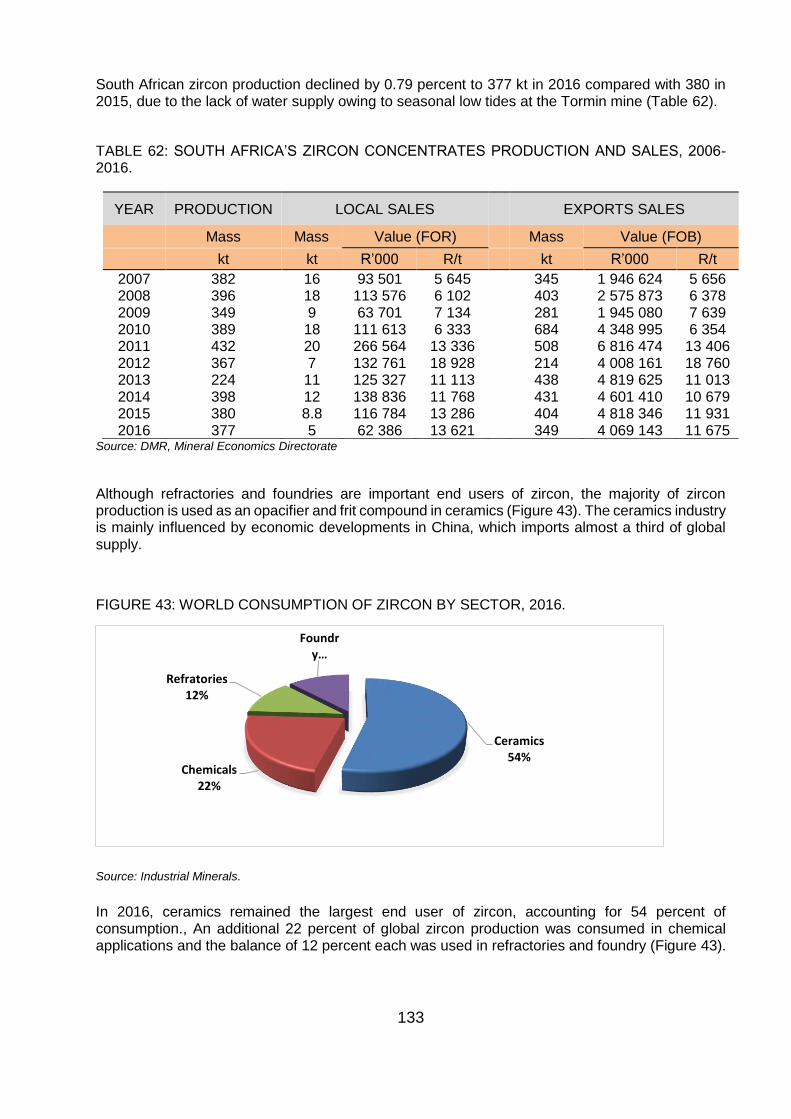
133
South African zircon production declined by 0.79 percent to 377 kt in 2016 compared with 380 in 2015, due to the lack of water supply owing to seasonal low tides at the Tormin mine (Table 62).
TABLE 62: SOUTH AFRICA’S ZIRCON CONCENTRATES PRODUCTION AND SALES, 2006-2016.
YEAR PRODUCTION LOCAL SALES EXPORTS SALES
Mass Mass Value (FOR) Mass Value (FOB)
kt kt R’000 R/t kt R’000 R/t
2007 382 16 93 501 5 645 345 1 946 624 5 656 2008 396 18 113 576 6 102 403 2 575 873 6 378 2009 349 9 63 701 7 134 281 1 945 080 7 639 2010 389 18 111 613 6 333 684 4 348 995 6 354 2011 432 20 266 564 13 336 508 6 816 474 13 406 2012 367 7 132 761 18 928 214 4 008 161 18 760 2013 224 11 125 327 11 113 438 4 819 625 11 013 2014 398 12 138 836 11 768 431 4 601 410 10 679 2015 380 8.8 116 784 13 286 404 4 818 346 11 931 2016 377 5 62 386 13 621 349 4 069 143 11 675
Source: DMR, Mineral Economics Directorate
Although refractories and foundries are important end users of zircon, the majority of zircon production is used as an opacifier and frit compound in ceramics (Figure 43). The ceramics industry is mainly influenced by economic developments in China, which imports almost a third of global supply.
FIGURE 43: WORLD CONSUMPTION OF ZIRCON BY SECTOR, 2016.
Source: Industrial Minerals.
In 2016, ceramics remained the largest end user of zircon, accounting for 54 percent of consumption., An additional 22 percent of global zircon production was consumed in chemical applications and the balance of 12 percent each was used in refractories and foundry (Figure 43).
Ceramics54%
Chemicals22%
Refratories12%
Foundry…
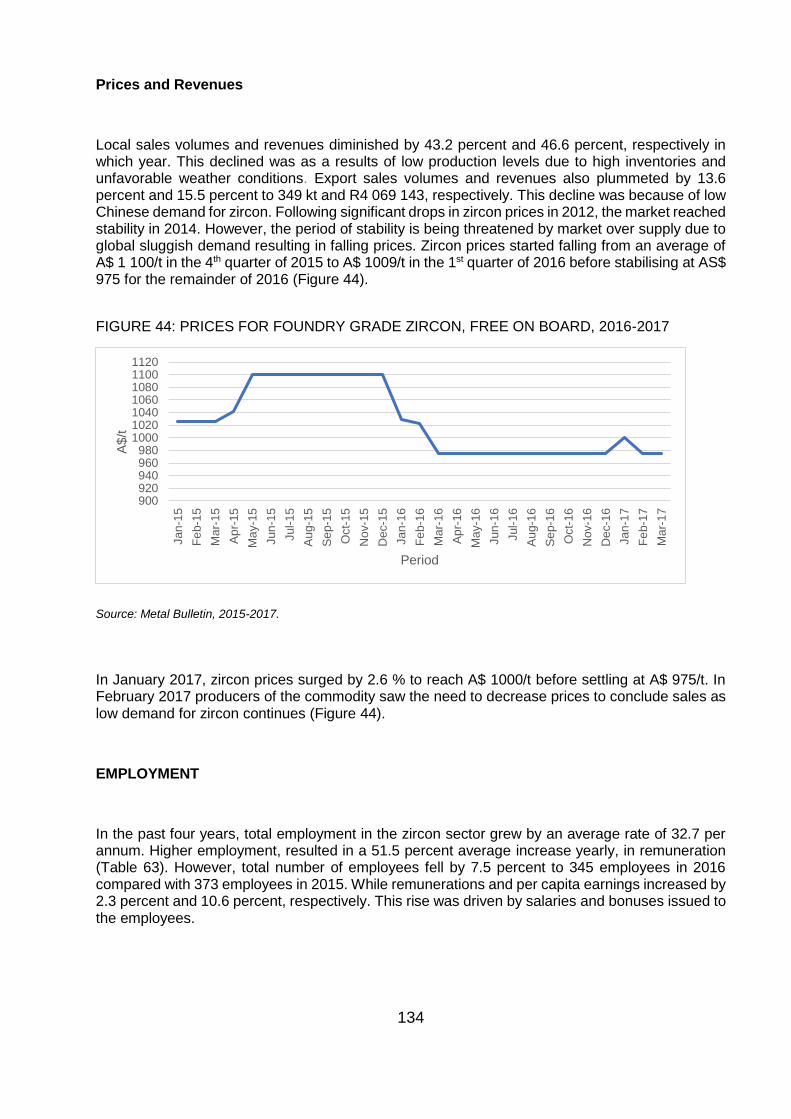
134
Prices and Revenues
Local sales volumes and revenues diminished by 43.2 percent and 46.6 percent, respectively in which year. This declined was as a results of low production levels due to high inventories and unfavorable weather conditions. Export sales volumes and revenues also plummeted by 13.6 percent and 15.5 percent to 349 kt and R4 069 143, respectively. This decline was because of low Chinese demand for zircon. Following significant drops in zircon prices in 2012, the market reached stability in 2014. However, the period of stability is being threatened by market over supply due to global sluggish demand resulting in falling prices. Zircon prices started falling from an average of A$ 1 100/t in the 4th quarter of 2015 to A$ 1009/t in the 1st quarter of 2016 before stabilising at AS$ 975 for the remainder of 2016 (Figure 44).
FIGURE 44: PRICES FOR FOUNDRY GRADE ZIRCON, FREE ON BOARD, 2016-2017
Source: Metal Bulletin, 2015-2017.
In January 2017, zircon prices surged by 2.6 % to reach A$ 1000/t before settling at A$ 975/t. In February 2017 producers of the commodity saw the need to decrease prices to conclude sales as low demand for zircon continues (Figure 44).
EMPLOYMENT
In the past four years, total employment in the zircon sector grew by an average rate of 32.7 per annum. Higher employment, resulted in a 51.5 percent average increase yearly, in remuneration (Table 63). However, total number of employees fell by 7.5 percent to 345 employees in 2016 compared with 373 employees in 2015. While remunerations and per capita earnings increased by 2.3 percent and 10.6 percent, respectively. This rise was driven by salaries and bonuses issued to the employees.
900920940960980
1000102010401060108011001120
Jan
-15
Fe
b-1
5
Ma
r-1
5
Ap
r-15
Ma
y-1
5
Jun
-15
Jul-
15
Au
g-1
5
Se
p-1
5
Oct-
15
Nov-1
5
Dec-1
5
Jan
-16
Fe
b-1
6
Ma
r-1
6
Ap
r-16
Ma
y-1
6
Jun
-16
Jul-
16
Au
g-1
6
Se
p-1
6
Oct-
16
Nov-1
6
Dec-1
6
Jan
-17
Fe
b-1
7
Ma
r-1
7
A$/t
Period
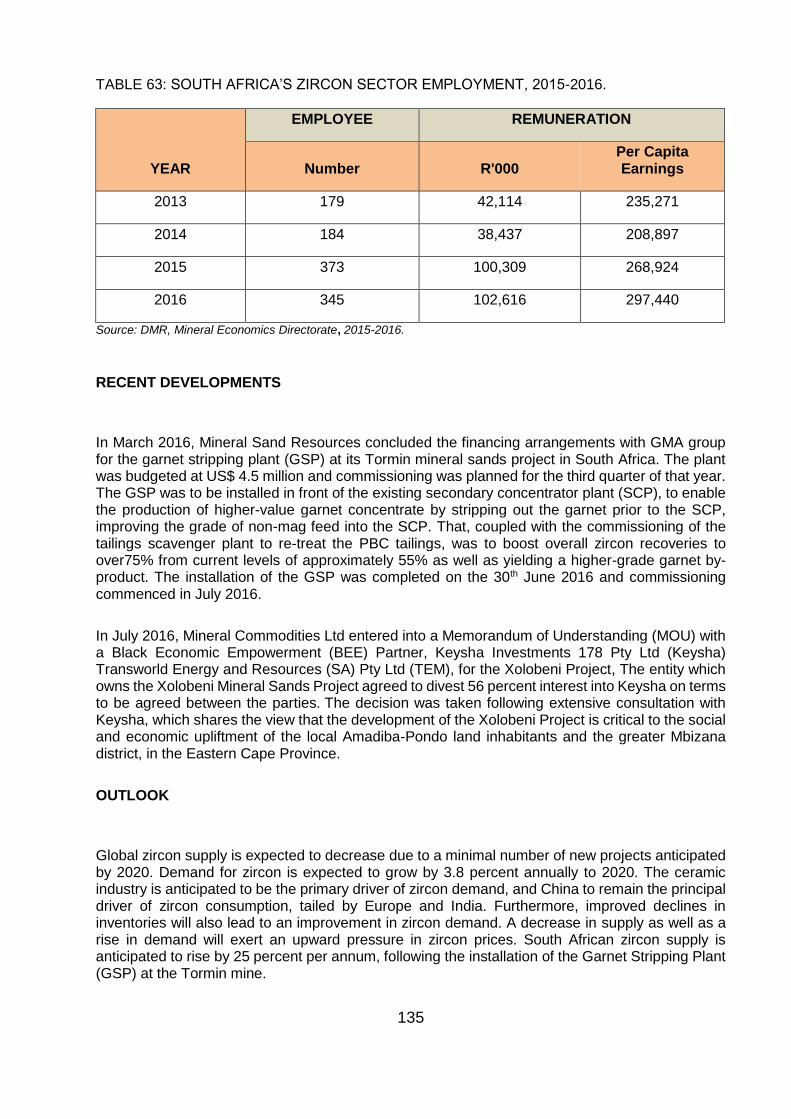
135
TABLE 63: SOUTH AFRICA’S ZIRCON SECTOR EMPLOYMENT, 2015-2016.
YEAR
EMPLOYEE REMUNERATION
Number R'000 Per Capita Earnings
2013 179 42,114 235,271
2014 184 38,437 208,897
2015 373 100,309 268,924
2016 345 102,616 297,440
Source: DMR, Mineral Economics Directorate, 2015-2016.
RECENT DEVELOPMENTS
In March 2016, Mineral Sand Resources concluded the financing arrangements with GMA group for the garnet stripping plant (GSP) at its Tormin mineral sands project in South Africa. The plant was budgeted at US$ 4.5 million and commissioning was planned for the third quarter of that year. The GSP was to be installed in front of the existing secondary concentrator plant (SCP), to enable the production of higher-value garnet concentrate by stripping out the garnet prior to the SCP, improving the grade of non-mag feed into the SCP. That, coupled with the commissioning of the tailings scavenger plant to re-treat the PBC tailings, was to boost overall zircon recoveries to over75% from current levels of approximately 55% as well as yielding a higher-grade garnet by-product. The installation of the GSP was completed on the 30th June 2016 and commissioning commenced in July 2016.
In July 2016, Mineral Commodities Ltd entered into a Memorandum of Understanding (MOU) with a Black Economic Empowerment (BEE) Partner, Keysha Investments 178 Pty Ltd (Keysha) Transworld Energy and Resources (SA) Pty Ltd (TEM), for the Xolobeni Project, The entity which owns the Xolobeni Mineral Sands Project agreed to divest 56 percent interest into Keysha on terms to be agreed between the parties. The decision was taken following extensive consultation with Keysha, which shares the view that the development of the Xolobeni Project is critical to the social and economic upliftment of the local Amadiba-Pondo land inhabitants and the greater Mbizana district, in the Eastern Cape Province.
OUTLOOK
Global zircon supply is expected to decrease due to a minimal number of new projects anticipated by 2020. Demand for zircon is expected to grow by 3.8 percent annually to 2020. The ceramic industry is anticipated to be the primary driver of zircon demand, and China to remain the principal driver of zircon consumption, tailed by Europe and India. Furthermore, improved declines in inventories will also lead to an improvement in zircon demand. A decrease in supply as well as a rise in demand will exert an upward pressure in zircon prices. South African zircon supply is anticipated to rise by 25 percent per annum, following the installation of the Garnet Stripping Plant (GSP) at the Tormin mine.
136
REFERENCES
1. Bulbulia, T. (2017, March 17). Fungoni springboard for larger-scale projects. Retrieved from: http://www.miningweekly.com/article/fungoni-springboard-for-larger-scale-projects-2017-03-17.
2. Credit Suisse. (2016, July 28). Mining sand price forecast. Retrieved from: http://www.tngltd.com.au/images/tngltd---oocheataep.pdf.
3. DMR, Mineral Economics Directorate. 4. http://www.mineralcommodities.com/tag/tormin/ 5. Illuka Resources Limited. (2017, March 15). Industry outlook and Illuka’s approach
mineral sands. Retrieved from: https://www.iluka.com/docs/default-source/company-presentations/mineral-sands-conference-by-matt-blackwell.
6. Iluka. (2017, June 21). Australian Security Exchange Notice: Australian operations update. Retrieved from: https://www.iluka.com/docs/default-source/asx-releases/iluka-australian-operations-update-21-june-2017.pdf?sfvrsn=4.
7. Iluka. Cataby, Perth basin. Retrieved from: https://www.iluka.com/company-overview/operations/projects/cataby-perth-basin.
8. Industrial Minerals, TiO2/Zircon Market Brief: Zircon consumption by end market. retrieved from: http://www.indmin.com/TiO2Zircon.html#/MarketBrief.
9. Metal Bulletin, Mineral/Metal Prices, 2015-2017. 10. Metal-Pages. (2017, May 2017). Savannah confirms Mutamba mineral sands
potentials. Retrieved from: https://www.metal-pages.com/news/story/100003/savannah-confirms-mutamba-mineral-sands-potential/.
11. Mineral Commodities Ltd (MRC). (2016, February 02). MRC secures $4.5M facality to complete garnet stripping plant. Retrieved from: http://www.asx.com.au/asxpdf/20160202/pdf/434s5kxp6nv776.pdf.
12. TZMI Market Update. (2016, September). 2016 to remain challenging for TiO. Retrieved from:http://www.tzmi.com/sites/default/files/pdf/TZMI%20Market%20update%20Sep%202016.pdf.
13. TZMI, Mineral Sands Report. (2017, March 201). Global Data and Analysis of Titanium and Zircon industries.
14. U.S. Geological Survey, Mineral Commodity Summaries, January 2017.
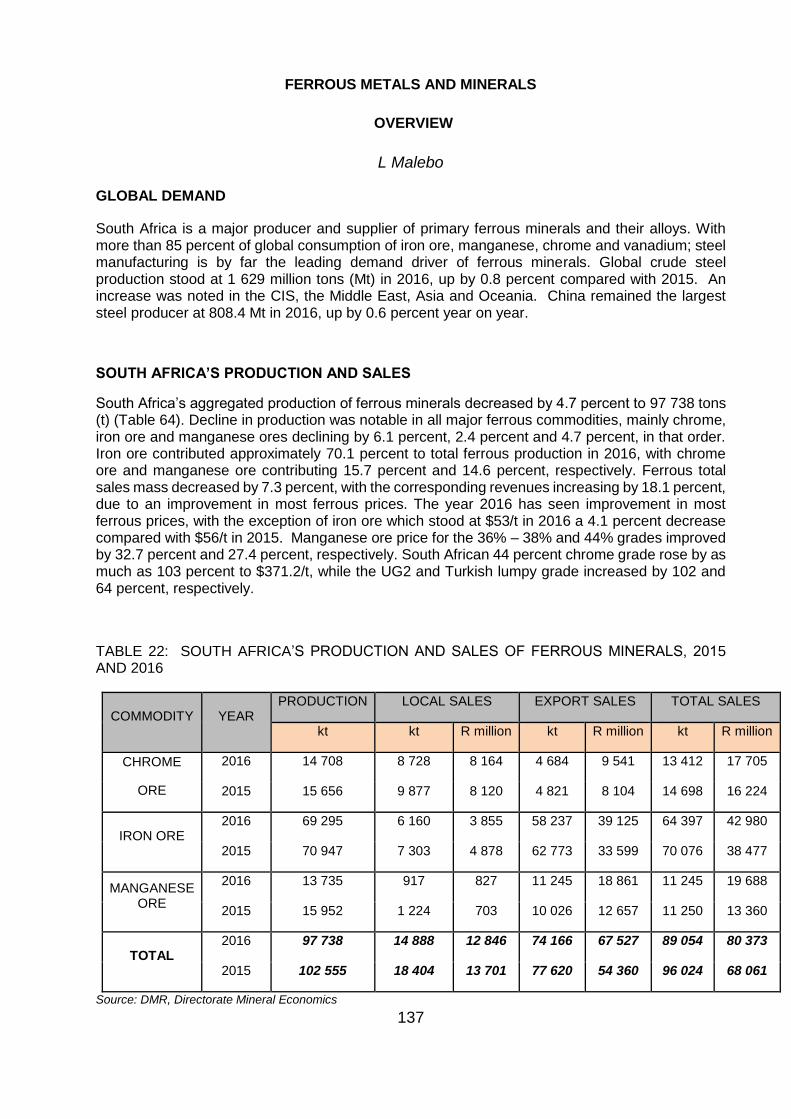
137
FERROUS METALS AND MINERALS
OVERVIEW
L Malebo
GLOBAL DEMAND
South Africa is a major producer and supplier of primary ferrous minerals and their alloys. With more than 85 percent of global consumption of iron ore, manganese, chrome and vanadium; steel manufacturing is by far the leading demand driver of ferrous minerals. Global crude steel production stood at 1 629 million tons (Mt) in 2016, up by 0.8 percent compared with 2015. An increase was noted in the CIS, the Middle East, Asia and Oceania. China remained the largest steel producer at 808.4 Mt in 2016, up by 0.6 percent year on year.
SOUTH AFRICA’S PRODUCTION AND SALES
South Africa’s aggregated production of ferrous minerals decreased by 4.7 percent to 97 738 tons (t) (Table 64). Decline in production was notable in all major ferrous commodities, mainly chrome, iron ore and manganese ores declining by 6.1 percent, 2.4 percent and 4.7 percent, in that order. Iron ore contributed approximately 70.1 percent to total ferrous production in 2016, with chrome ore and manganese ore contributing 15.7 percent and 14.6 percent, respectively. Ferrous total sales mass decreased by 7.3 percent, with the corresponding revenues increasing by 18.1 percent, due to an improvement in most ferrous prices. The year 2016 has seen improvement in most ferrous prices, with the exception of iron ore which stood at $53/t in 2016 a 4.1 percent decrease compared with $56/t in 2015. Manganese ore price for the 36% – 38% and 44% grades improved by 32.7 percent and 27.4 percent, respectively. South African 44 percent chrome grade rose by as much as 103 percent to $371.2/t, while the UG2 and Turkish lumpy grade increased by 102 and 64 percent, respectively.
TABLE 22: SOUTH AFRICA’S PRODUCTION AND SALES OF FERROUS MINERALS, 2015 AND 2016
COMMODITY YEAR PRODUCTION LOCAL SALES EXPORT SALES TOTAL SALES
kt kt R million kt R million kt R million
CHROME
ORE
2016 14 708 8 728 8 164 4 684 9 541 13 412 17 705
2015 15 656 9 877 8 120 4 821 8 104 14 698 16 224
IRON ORE 2016 69 295 6 160 3 855 58 237 39 125 64 397 42 980
2015 70 947 7 303 4 878 62 773 33 599 70 076 38 477
MANGANESE ORE
2016 13 735 917 827 11 245 18 861 11 245 19 688
2015 15 952 1 224 703 10 026 12 657 11 250 13 360
TOTAL 2016 97 738 14 888 12 846 74 166 67 527 89 054 80 373
2015 102 555 18 404 13 701 77 620 54 360 96 024 68 061
Source: DMR, Directorate Mineral Economics
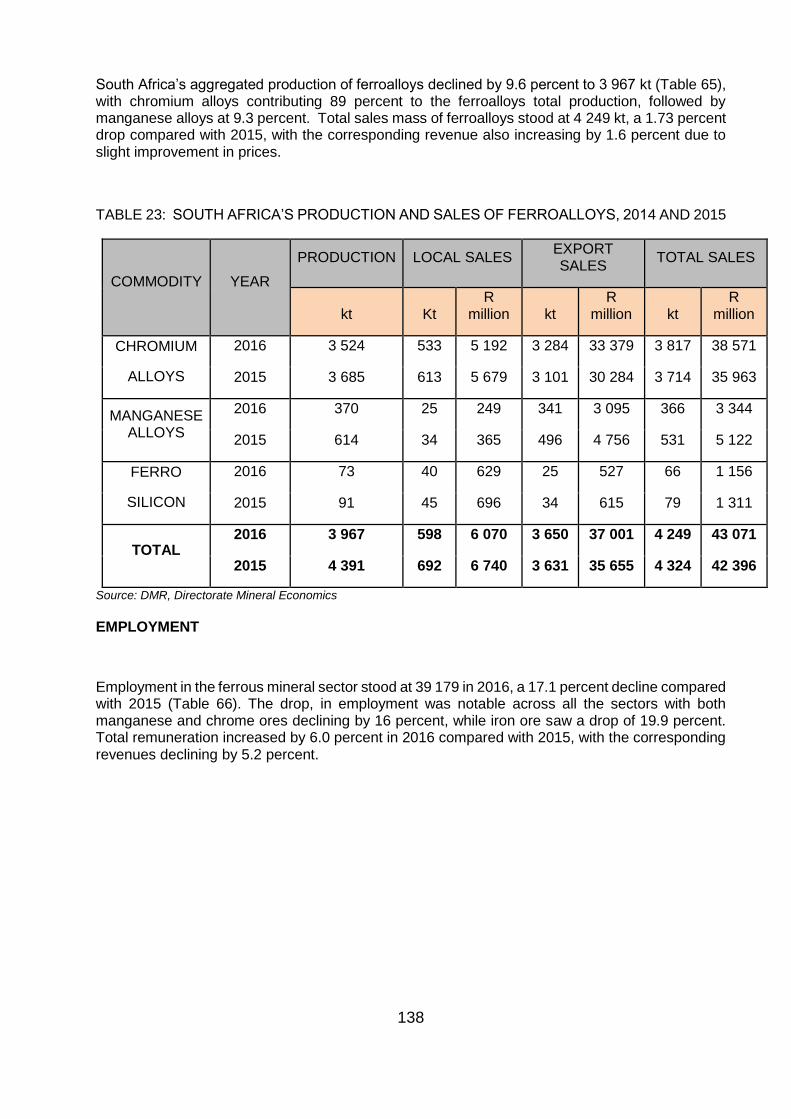
138
South Africa’s aggregated production of ferroalloys declined by 9.6 percent to 3 967 kt (Table 65), with chromium alloys contributing 89 percent to the ferroalloys total production, followed by manganese alloys at 9.3 percent. Total sales mass of ferroalloys stood at 4 249 kt, a 1.73 percent drop compared with 2015, with the corresponding revenue also increasing by 1.6 percent due to slight improvement in prices.
TABLE 23: SOUTH AFRICA’S PRODUCTION AND SALES OF FERROALLOYS, 2014 AND 2015
COMMODITY YEAR
PRODUCTION LOCAL SALES EXPORT SALES
TOTAL SALES
kt Kt R
million kt R
million kt R
million
CHROMIUM
ALLOYS
2016 3 524 533 5 192 3 284 33 379 3 817 38 571
2015 3 685 613 5 679 3 101 30 284 3 714 35 963
MANGANESE ALLOYS
2016 370 25 249 341 3 095 366 3 344
2015 614 34 365 496 4 756 531 5 122
FERRO
SILICON
2016 73 40 629 25 527 66 1 156
2015 91 45 696 34 615 79 1 311
TOTAL 2016 3 967 598 6 070 3 650 37 001 4 249 43 071
2015 4 391 692 6 740 3 631 35 655 4 324 42 396
Source: DMR, Directorate Mineral Economics
EMPLOYMENT
Employment in the ferrous mineral sector stood at 39 179 in 2016, a 17.1 percent decline compared with 2015 (Table 66). The drop, in employment was notable across all the sectors with both manganese and chrome ores declining by 16 percent, while iron ore saw a drop of 19.9 percent. Total remuneration increased by 6.0 percent in 2016 compared with 2015, with the corresponding revenues declining by 5.2 percent.
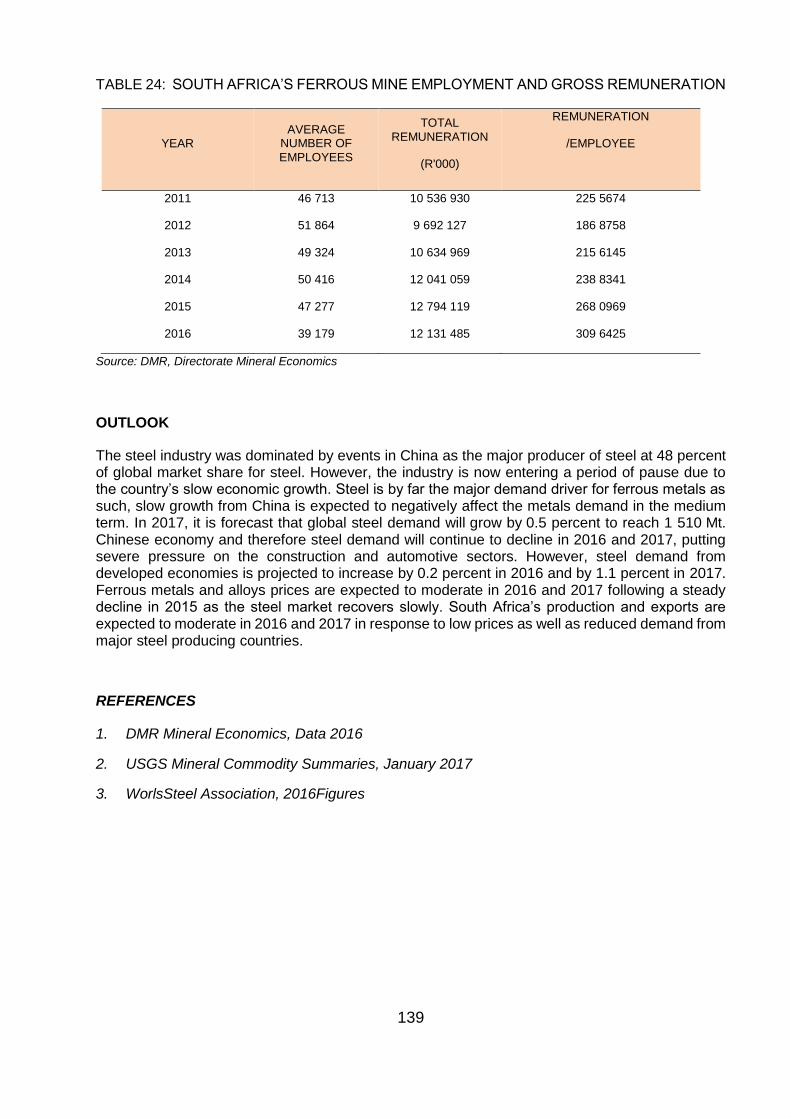
139
TABLE 24: SOUTH AFRICA’S FERROUS MINE EMPLOYMENT AND GROSS REMUNERATION
YEAR AVERAGE
NUMBER OF
EMPLOYEES
TOTAL
REMUNERATION
(R'000)
REMUNERATION
/EMPLOYEE
2011 46 713 10 536 930 225 5674
2012 51 864 9 692 127 186 8758
2013 49 324 10 634 969 215 6145
2014 50 416 12 041 059 238 8341
2015 47 277 12 794 119 268 0969
2016 39 179 12 131 485 309 6425
Source: DMR, Directorate Mineral Economics
OUTLOOK
The steel industry was dominated by events in China as the major producer of steel at 48 percent of global market share for steel. However, the industry is now entering a period of pause due to the country’s slow economic growth. Steel is by far the major demand driver for ferrous metals as such, slow growth from China is expected to negatively affect the metals demand in the medium term. In 2017, it is forecast that global steel demand will grow by 0.5 percent to reach 1 510 Mt. Chinese economy and therefore steel demand will continue to decline in 2016 and 2017, putting severe pressure on the construction and automotive sectors. However, steel demand from developed economies is projected to increase by 0.2 percent in 2016 and by 1.1 percent in 2017. Ferrous metals and alloys prices are expected to moderate in 2016 and 2017 following a steady decline in 2015 as the steel market recovers slowly. South Africa’s production and exports are expected to moderate in 2016 and 2017 in response to low prices as well as reduced demand from major steel producing countries.
REFERENCES
1. DMR Mineral Economics, Data 2016
2. USGS Mineral Commodity Summaries, January 2017
3. WorlsSteel Association, 2016Figures
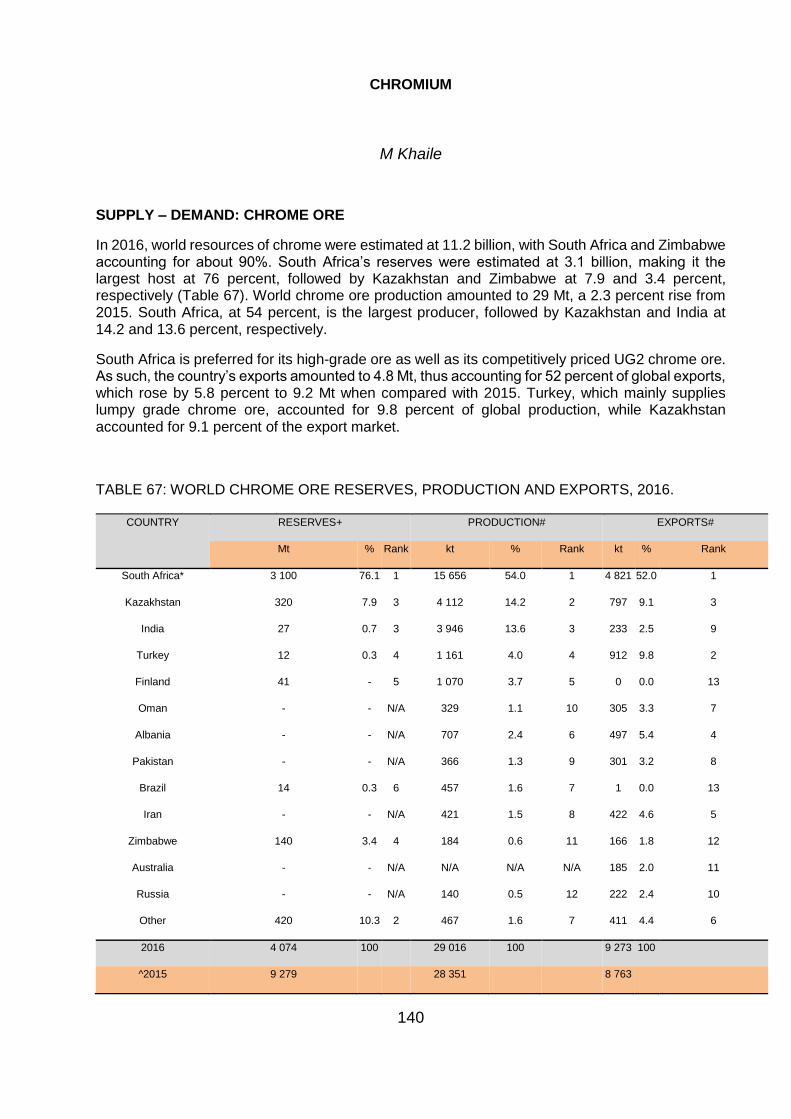
140
CHROMIUM
M Khaile
SUPPLY – DEMAND: CHROME ORE
In 2016, world resources of chrome were estimated at 11.2 billion, with South Africa and Zimbabwe accounting for about 90%. South Africa’s reserves were estimated at 3.1 billion, making it the largest host at 76 percent, followed by Kazakhstan and Zimbabwe at 7.9 and 3.4 percent, respectively (Table 67). World chrome ore production amounted to 29 Mt, a 2.3 percent rise from 2015. South Africa, at 54 percent, is the largest producer, followed by Kazakhstan and India at 14.2 and 13.6 percent, respectively.
South Africa is preferred for its high-grade ore as well as its competitively priced UG2 chrome ore. As such, the country’s exports amounted to 4.8 Mt, thus accounting for 52 percent of global exports, which rose by 5.8 percent to 9.2 Mt when compared with 2015. Turkey, which mainly supplies lumpy grade chrome ore, accounted for 9.8 percent of global production, while Kazakhstan accounted for 9.1 percent of the export market.
TABLE 67: WORLD CHROME ORE RESERVES, PRODUCTION AND EXPORTS, 2016.
COUNTRY RESERVES+ PRODUCTION# EXPORTS#
Mt % Rank kt % Rank kt % Rank
South Africa* 3 100 76.1 1 15 656 54.0 1 4 821 52.0 1
Kazakhstan 320 7.9 3 4 112 14.2 2 797 9.1 3
India 27 0.7 3 3 946 13.6 3 233 2.5 9
Turkey 12 0.3 4 1 161 4.0 4 912 9.8 2
Finland 41 - 5 1 070 3.7 5 0 0.0 13
Oman - - N/A 329 1.1 10 305 3.3 7
Albania - - N/A 707 2.4 6 497 5.4 4
Pakistan - - N/A 366 1.3 9 301 3.2 8
Brazil 14 0.3 6 457 1.6 7 1 0.0 13
Iran - - N/A 421 1.5 8 422 4.6 5
Zimbabwe 140 3.4 4 184 0.6 11 166 1.8 12
Australia - - N/A N/A N/A N/A 185 2.0 11
Russia - - N/A 140 0.5 12 222 2.4 10
Other 420 10.3 2 467 1.6 7 411 4.4 6
2016 4 074 100 29 016 100 9 273 100
^2015 9 279 28 351 8 763
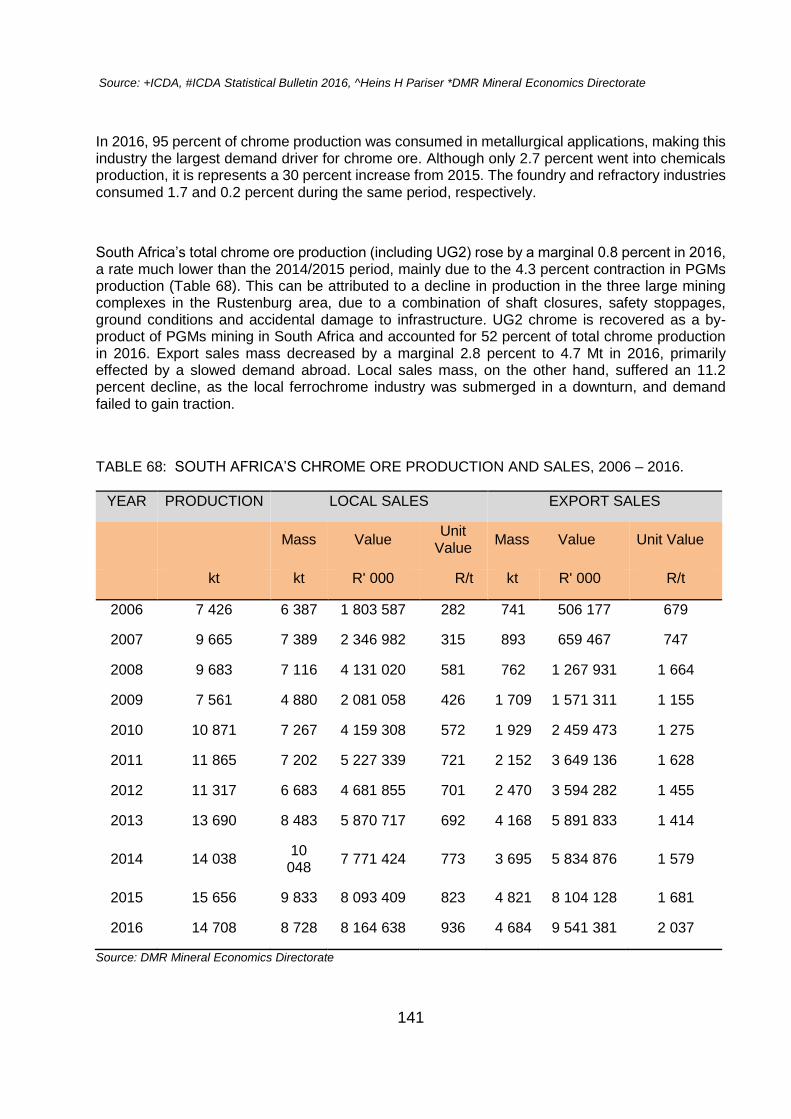
141
Source: +ICDA, #ICDA Statistical Bulletin 2016, ^Heins H Pariser *DMR Mineral Economics Directorate
In 2016, 95 percent of chrome production was consumed in metallurgical applications, making this industry the largest demand driver for chrome ore. Although only 2.7 percent went into chemicals production, it is represents a 30 percent increase from 2015. The foundry and refractory industries consumed 1.7 and 0.2 percent during the same period, respectively.
South Africa’s total chrome ore production (including UG2) rose by a marginal 0.8 percent in 2016, a rate much lower than the 2014/2015 period, mainly due to the 4.3 percent contraction in PGMs production (Table 68). This can be attributed to a decline in production in the three large mining complexes in the Rustenburg area, due to a combination of shaft closures, safety stoppages, ground conditions and accidental damage to infrastructure. UG2 chrome is recovered as a by-product of PGMs mining in South Africa and accounted for 52 percent of total chrome production in 2016. Export sales mass decreased by a marginal 2.8 percent to 4.7 Mt in 2016, primarily effected by a slowed demand abroad. Local sales mass, on the other hand, suffered an 11.2 percent decline, as the local ferrochrome industry was submerged in a downturn, and demand failed to gain traction.
TABLE 68: SOUTH AFRICA’S CHROME ORE PRODUCTION AND SALES, 2006 – 2016.
YEAR PRODUCTION LOCAL SALES EXPORT SALES
Mass Value Unit
Value Mass Value Unit Value
kt kt R' 000 R/t kt R' 000 R/t
2006 7 426 6 387 1 803 587 282 741 506 177 679
2007 9 665 7 389 2 346 982 315 893 659 467 747
2008 9 683 7 116 4 131 020 581 762 1 267 931 1 664
2009 7 561 4 880 2 081 058 426 1 709 1 571 311 1 155
2010 10 871 7 267 4 159 308 572 1 929 2 459 473 1 275
2011 11 865 7 202 5 227 339 721 2 152 3 649 136 1 628
2012 11 317 6 683 4 681 855 701 2 470 3 594 282 1 455
2013 13 690 8 483 5 870 717 692 4 168 5 891 833 1 414
2014 14 038 10 048
7 771 424 773 3 695 5 834 876 1 579
2015 15 656 9 833 8 093 409 823 4 821 8 104 128 1 681
2016 14 708 8 728 8 164 638 936 4 684 9 541 381 2 037
Source: DMR Mineral Economics Directorate
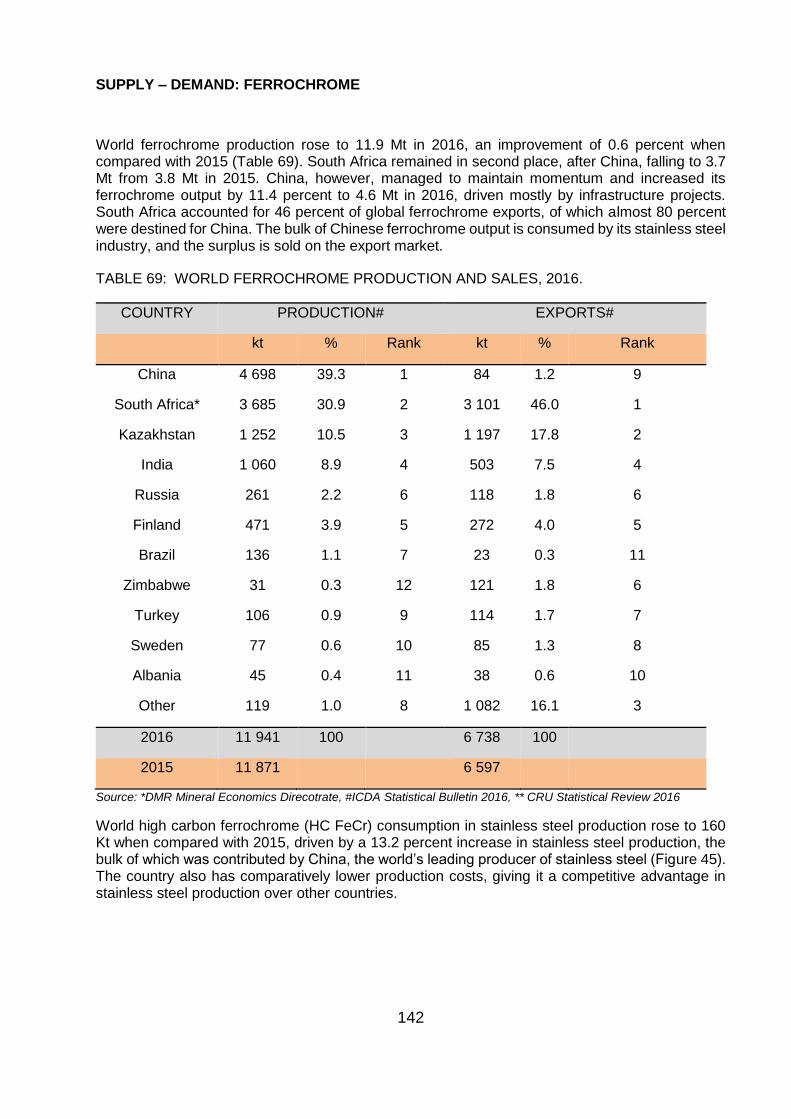
142
SUPPLY – DEMAND: FERROCHROME
World ferrochrome production rose to 11.9 Mt in 2016, an improvement of 0.6 percent when compared with 2015 (Table 69). South Africa remained in second place, after China, falling to 3.7 Mt from 3.8 Mt in 2015. China, however, managed to maintain momentum and increased its ferrochrome output by 11.4 percent to 4.6 Mt in 2016, driven mostly by infrastructure projects. South Africa accounted for 46 percent of global ferrochrome exports, of which almost 80 percent were destined for China. The bulk of Chinese ferrochrome output is consumed by its stainless steel industry, and the surplus is sold on the export market.
TABLE 69: WORLD FERROCHROME PRODUCTION AND SALES, 2016.
COUNTRY PRODUCTION# EXPORTS#
kt % Rank kt % Rank
China 4 698 39.3 1 84 1.2 9
South Africa* 3 685 30.9 2 3 101 46.0 1
Kazakhstan 1 252 10.5 3 1 197 17.8 2
India 1 060 8.9 4 503 7.5 4
Russia 261 2.2 6 118 1.8 6
Finland 471 3.9 5 272 4.0 5
Brazil 136 1.1 7 23 0.3 11
Zimbabwe 31 0.3 12 121 1.8 6
Turkey 106 0.9 9 114 1.7 7
Sweden 77 0.6 10 85 1.3 8
Albania 45 0.4 11 38 0.6 10
Other 119 1.0 8 1 082 16.1 3
2016 11 941 100
6 738 100
2015 11 871 6 597
Source: *DMR Mineral Economics Direcotrate, #ICDA Statistical Bulletin 2016, ** CRU Statistical Review 2016
World high carbon ferrochrome (HC FeCr) consumption in stainless steel production rose to 160 Kt when compared with 2015, driven by a 13.2 percent increase in stainless steel production, the bulk of which was contributed by China, the world’s leading producer of stainless steel (Figure 45). The country also has comparatively lower production costs, giving it a competitive advantage in stainless steel production over other countries.
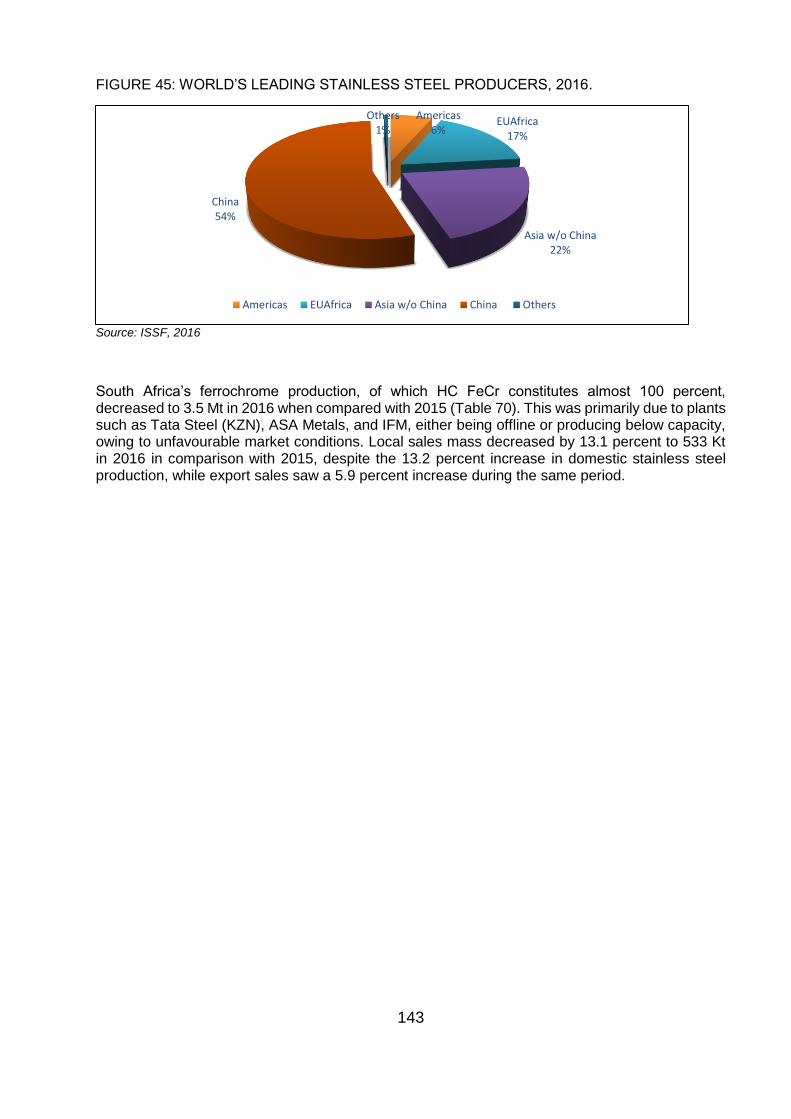
143
FIGURE 45: WORLD’S LEADING STAINLESS STEEL PRODUCERS, 2016.
Source: ISSF, 2016
South Africa’s ferrochrome production, of which HC FeCr constitutes almost 100 percent, decreased to 3.5 Mt in 2016 when compared with 2015 (Table 70). This was primarily due to plants such as Tata Steel (KZN), ASA Metals, and IFM, either being offline or producing below capacity, owing to unfavourable market conditions. Local sales mass decreased by 13.1 percent to 533 Kt in 2016 in comparison with 2015, despite the 13.2 percent increase in domestic stainless steel production, while export sales saw a 5.9 percent increase during the same period.
Americas6%
EUAfrica17%
Asia w/o China22%
China 54%
Others1%
Americas EUAfrica Asia w/o China China Others
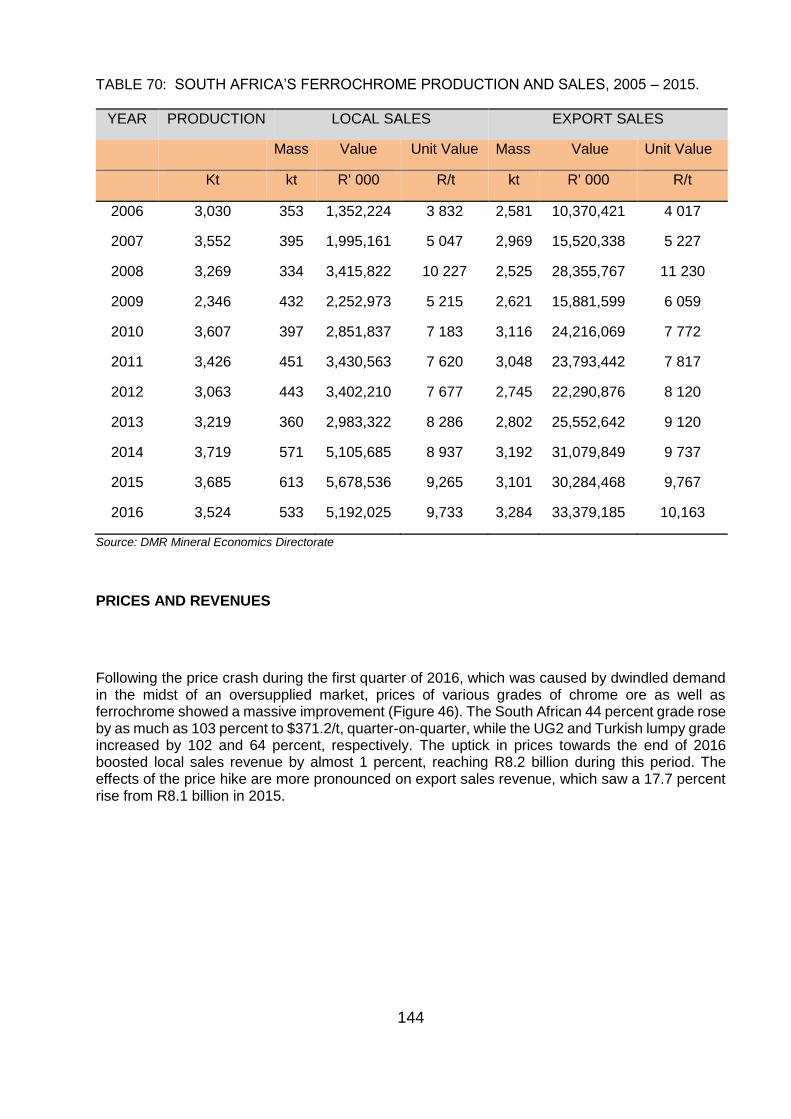
144
TABLE 70: SOUTH AFRICA’S FERROCHROME PRODUCTION AND SALES, 2005 – 2015.
YEAR PRODUCTION LOCAL SALES EXPORT SALES
Mass Value Unit Value Mass Value Unit Value
Kt kt R' 000 R/t kt R' 000 R/t
2006 3,030 353 1,352,224 3 832 2,581 10,370,421 4 017
2007 3,552 395 1,995,161 5 047 2,969 15,520,338 5 227
2008 3,269 334 3,415,822 10 227 2,525 28,355,767 11 230
2009 2,346 432 2,252,973 5 215 2,621 15,881,599 6 059
2010 3,607 397 2,851,837 7 183 3,116 24,216,069 7 772
2011 3,426 451 3,430,563 7 620 3,048 23,793,442 7 817
2012 3,063 443 3,402,210 7 677 2,745 22,290,876 8 120
2013 3,219 360 2,983,322 8 286 2,802 25,552,642 9 120
2014 3,719 571 5,105,685 8 937 3,192 31,079,849 9 737
2015 3,685 613 5,678,536 9,265 3,101 30,284,468 9,767
2016 3,524 533 5,192,025 9,733 3,284 33,379,185 10,163
Source: DMR Mineral Economics Directorate
PRICES AND REVENUES
Following the price crash during the first quarter of 2016, which was caused by dwindled demand in the midst of an oversupplied market, prices of various grades of chrome ore as well as ferrochrome showed a massive improvement (Figure 46). The South African 44 percent grade rose by as much as 103 percent to $371.2/t, quarter-on-quarter, while the UG2 and Turkish lumpy grade increased by 102 and 64 percent, respectively. The uptick in prices towards the end of 2016 boosted local sales revenue by almost 1 percent, reaching R8.2 billion during this period. The effects of the price hike are more pronounced on export sales revenue, which saw a 17.7 percent rise from R8.1 billion in 2015.
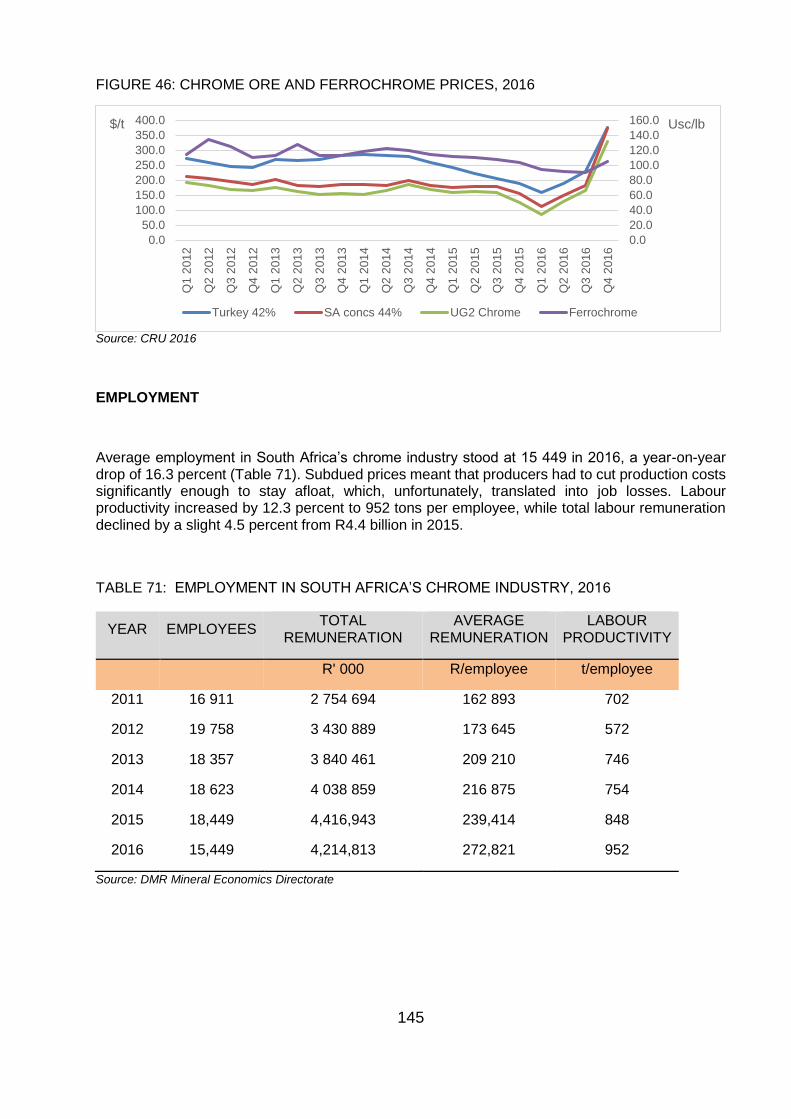
145
FIGURE 46: CHROME ORE AND FERROCHROME PRICES, 2016
Source: CRU 2016
EMPLOYMENT
Average employment in South Africa’s chrome industry stood at 15 449 in 2016, a year-on-year drop of 16.3 percent (Table 71). Subdued prices meant that producers had to cut production costs significantly enough to stay afloat, which, unfortunately, translated into job losses. Labour productivity increased by 12.3 percent to 952 tons per employee, while total labour remuneration declined by a slight 4.5 percent from R4.4 billion in 2015.
TABLE 71: EMPLOYMENT IN SOUTH AFRICA’S CHROME INDUSTRY, 2016
YEAR EMPLOYEES TOTAL
REMUNERATION AVERAGE
REMUNERATION LABOUR
PRODUCTIVITY
R' 000 R/employee t/employee
2011 16 911 2 754 694 162 893 702
2012 19 758 3 430 889 173 645 572
2013 18 357 3 840 461 209 210 746
2014 18 623 4 038 859 216 875 754
2015 18,449 4,416,943 239,414 848
2016 15,449 4,214,813 272,821 952
Source: DMR Mineral Economics Directorate
0.0
20.0
40.0
60.0
80.0
100.0
120.0
140.0
160.0
0.0
50.0
100.0
150.0
200.0
250.0
300.0
350.0
400.0
Q1
201
2
Q2
201
2
Q3
201
2
Q4
201
2
Q1
201
3
Q2
201
3
Q3
201
3
Q4
201
3
Q1
201
4
Q2
201
4
Q3
201
4
Q4
201
4
Q1
201
5
Q2
201
5
Q3
201
5
Q4
201
5
Q1
201
6
Q2
201
6
Q3
201
6
Q4
201
6
Usc/lb$/t
Turkey 42% SA concs 44% UG2 Chrome Ferrochrome
146
KEY DEVELOPMENTS
During 2016, Samancor succeeded in taking over IFM-SA’s assets, as the DMR subsequently approved the transfer of the Lesedi mine, while that of Sky Chrome is still pending. IFM’s 267 ktpa ferrochrome plant was producing below capacity since 2012, before the company opted for business rescue in 2015. ASA metals, which operated the Dilokong mine, suffered the same fate during this period, as market conditions marshalled it into business rescue. A spate of community unrest caused a number of production interruptions at the Dilokong Chrome mine, leading to its demise in 2016. Newton, a new joint venture of Sinosteel and Samancor might acquire ASA metals in 2017. The Alton North plant (formerly Tata Steel KZN) had not produced significant material by the end of 2016, despite its 150 ktpa capacity. Its distance from the chrome sources in the Bushveld Igneous Complex places this plant at a competitive disadvantage and, increases the likelihood that costs will rise above the prevailing market price.
OUTLOOK
Global stainless steel production is expected to slow down in 2017, increasing by only 3.5 percent and by a further 3.7 percent in 2018. Being the leading producer of stainless steel, China is the main driver of market dynamics. As such, the slowdown in global production will likely be effected by reduction in stocks by Chinese stainless steel mills, as well as the price. The start of Chinese-owned production in Indonesia, with a capacity of 1 Mtpa, might cause a drop in China’s stainless steel exports in the coming years. The ferrochrome market, particularly HCFeCr, is expected to move into surplus during 2017, owing to supply growth from South Africa and China, each contributing around 5 percent. This despite Mitsubishi’s planned divesture from Hernic Ferrochrome in South Africa, which could lead to the latter company going into business rescue. Following a sterling recovery at the end of 2016, chrome ore, and, by extension, ferrochrome prices, are expected to soften in response to growing supply in 2017. The price of UG2 chrome could drop by as much as 43 percent by quarter 3 of 2017, while the South African 44 percent and the Turkish 42 percent lumpy grades are likely to drop by 34 and 26 percent, respectively.
REFERENCES
1. DMR Mineral Economics, 2017 2. ICDA: Overview of the Chromium Industry 2017, Statistical Bulletin 2017, Analysis
of the Global Ferrochrome Market 2017, Ferrochrome, Focus on China (2nd edition 2015)
3. World Steel Association, www.worldsteel.org 4. International Stainless Steel Forum 5. CRU, Ferrochrome Market Outlook, 2017 6. MEPS International, www.meps.co.uk 7. Mining Weekly, www.miningweekly.com 8. Engineering News, www.engineeringnews.co.za 9. Metal Bulletin, www.metalbulletin.com
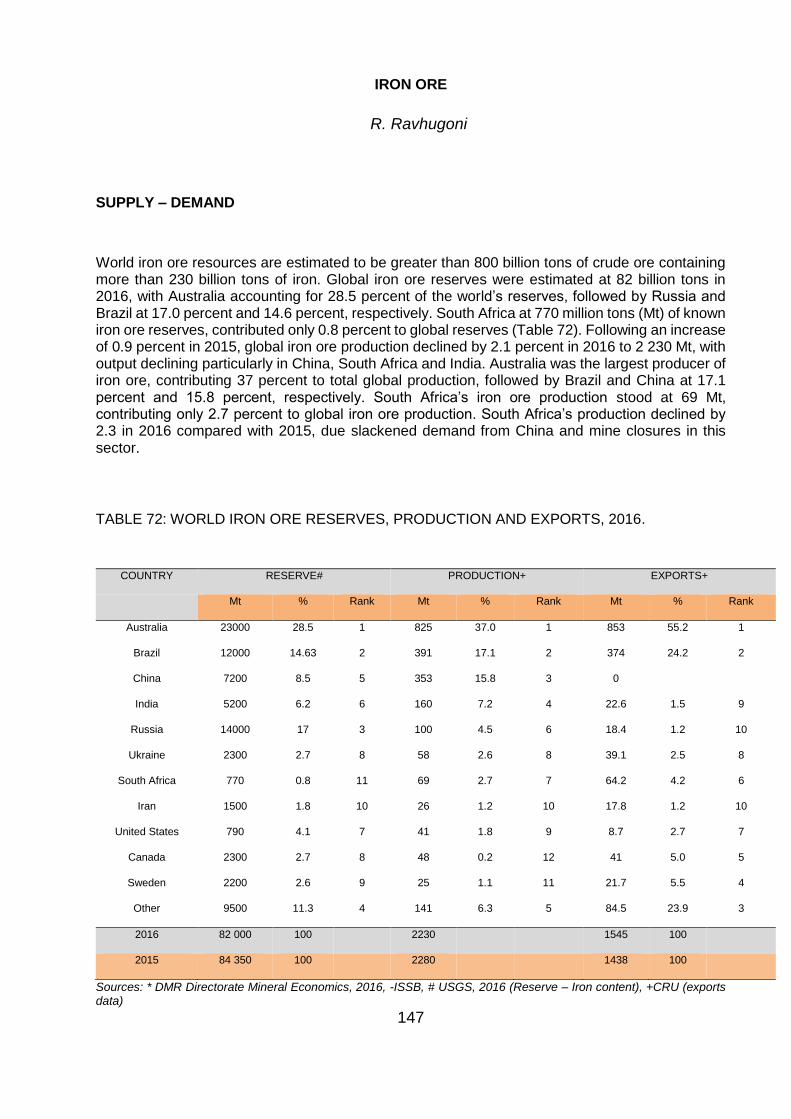
147
IRON ORE
R. Ravhugoni
SUPPLY – DEMAND
World iron ore resources are estimated to be greater than 800 billion tons of crude ore containing more than 230 billion tons of iron. Global iron ore reserves were estimated at 82 billion tons in 2016, with Australia accounting for 28.5 percent of the world’s reserves, followed by Russia and Brazil at 17.0 percent and 14.6 percent, respectively. South Africa at 770 million tons (Mt) of known iron ore reserves, contributed only 0.8 percent to global reserves (Table 72). Following an increase of 0.9 percent in 2015, global iron ore production declined by 2.1 percent in 2016 to 2 230 Mt, with output declining particularly in China, South Africa and India. Australia was the largest producer of iron ore, contributing 37 percent to total global production, followed by Brazil and China at 17.1 percent and 15.8 percent, respectively. South Africa’s iron ore production stood at 69 Mt, contributing only 2.7 percent to global iron ore production. South Africa’s production declined by 2.3 in 2016 compared with 2015, due slackened demand from China and mine closures in this sector.
TABLE 72: WORLD IRON ORE RESERVES, PRODUCTION AND EXPORTS, 2016.
COUNTRY RESERVE# PRODUCTION+ EXPORTS+
Mt % Rank Mt % Rank Mt % Rank
Australia 23000 28.5 1 825 37.0 1 853 55.2 1
Brazil 12000 14.63 2 391 17.1 2 374 24.2 2
China 7200 8.5 5 353 15.8 3 0
India 5200 6.2 6 160 7.2 4 22.6 1.5 9
Russia 14000 17 3 100 4.5 6 18.4 1.2 10
Ukraine 2300 2.7 8 58 2.6 8 39.1 2.5 8
South Africa 770 0.8 11 69 2.7 7 64.2 4.2 6
Iran 1500 1.8 10 26 1.2 10 17.8 1.2 10
United States 790 4.1 7 41 1.8 9 8.7 2.7 7
Canada 2300 2.7 8 48 0.2 12 41 5.0 5
Sweden 2200 2.6 9 25 1.1 11 21.7 5.5 4
Other 9500 11.3 4 141 6.3 5 84.5 23.9 3
2016 82 000 100
2230
1545 100
2015 84 350 100 2280 1438 100
Sources: * DMR Directorate Mineral Economics, 2016, -ISSB, # USGS, 2016 (Reserve – Iron content), +CRU (exports data)
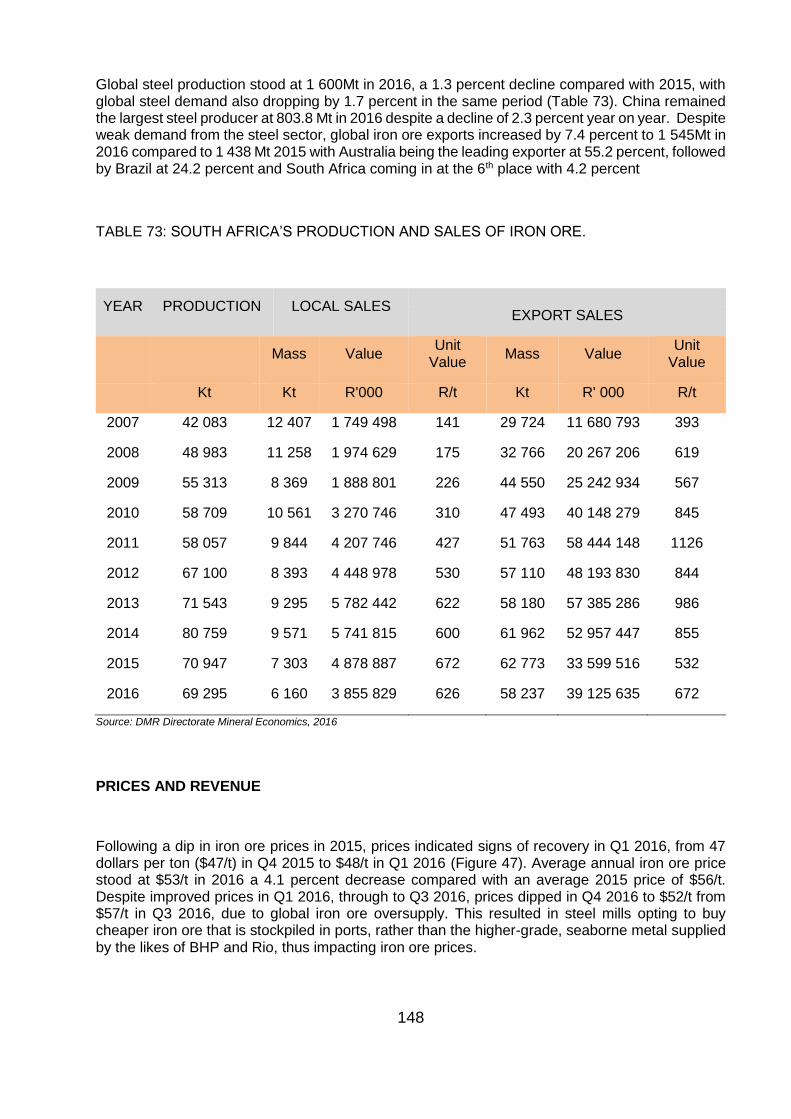
148
Global steel production stood at 1 600Mt in 2016, a 1.3 percent decline compared with 2015, with global steel demand also dropping by 1.7 percent in the same period (Table 73). China remained the largest steel producer at 803.8 Mt in 2016 despite a decline of 2.3 percent year on year. Despite weak demand from the steel sector, global iron ore exports increased by 7.4 percent to 1 545Mt in 2016 compared to 1 438 Mt 2015 with Australia being the leading exporter at 55.2 percent, followed by Brazil at 24.2 percent and South Africa coming in at the 6th place with 4.2 percent
TABLE 73: SOUTH AFRICA’S PRODUCTION AND SALES OF IRON ORE.
YEAR PRODUCTION LOCAL SALES
EXPORT SALES
Mass Value Unit
Value Mass Value
Unit Value
Kt Kt R'000 R/t Kt R' 000 R/t
2007 42 083 12 407 1 749 498 141 29 724 11 680 793 393
2008 48 983 11 258 1 974 629 175 32 766 20 267 206 619
2009 55 313 8 369 1 888 801 226 44 550 25 242 934 567
2010 58 709 10 561 3 270 746 310 47 493 40 148 279 845
2011 58 057 9 844 4 207 746 427 51 763 58 444 148 1126
2012 67 100 8 393 4 448 978 530 57 110 48 193 830 844
2013 71 543 9 295 5 782 442 622 58 180 57 385 286 986
2014 80 759 9 571 5 741 815 600 61 962 52 957 447 855
2015 70 947 7 303 4 878 887 672 62 773 33 599 516 532
2016 69 295 6 160 3 855 829 626 58 237 39 125 635 672
Source: DMR Directorate Mineral Economics, 2016
PRICES AND REVENUE
Following a dip in iron ore prices in 2015, prices indicated signs of recovery in Q1 2016, from 47 dollars per ton ($47/t) in Q4 2015 to $48/t in Q1 2016 (Figure 47). Average annual iron ore price stood at $53/t in 2016 a 4.1 percent decrease compared with an average 2015 price of $56/t. Despite improved prices in Q1 2016, through to Q3 2016, prices dipped in Q4 2016 to $52/t from $57/t in Q3 2016, due to global iron ore oversupply. This resulted in steel mills opting to buy cheaper iron ore that is stockpiled in ports, rather than the higher-grade, seaborne metal supplied by the likes of BHP and Rio, thus impacting iron ore prices.
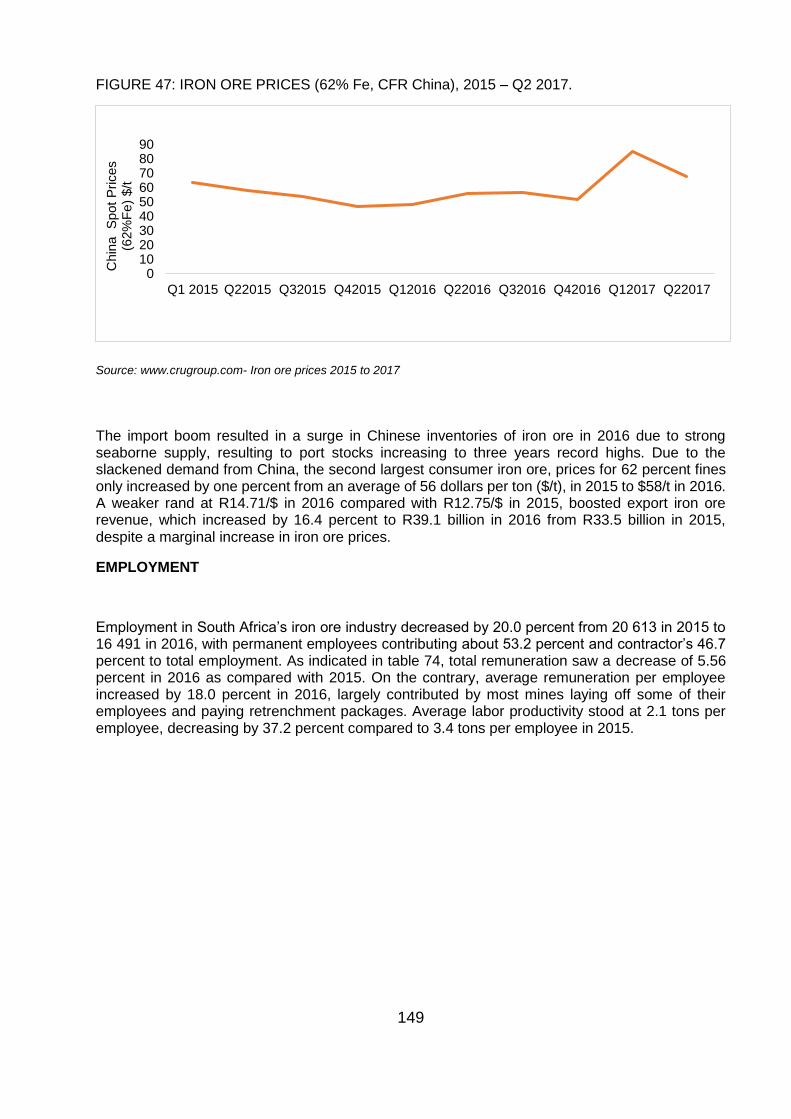
149
FIGURE 47: IRON ORE PRICES (62% Fe, CFR China), 2015 – Q2 2017.
Source: www.crugroup.com- Iron ore prices 2015 to 2017
The import boom resulted in a surge in Chinese inventories of iron ore in 2016 due to strong seaborne supply, resulting to port stocks increasing to three years record highs. Due to the slackened demand from China, the second largest consumer iron ore, prices for 62 percent fines only increased by one percent from an average of 56 dollars per ton ($/t), in 2015 to $58/t in 2016. A weaker rand at R14.71/$ in 2016 compared with R12.75/$ in 2015, boosted export iron ore revenue, which increased by 16.4 percent to R39.1 billion in 2016 from R33.5 billion in 2015, despite a marginal increase in iron ore prices.
EMPLOYMENT
Employment in South Africa’s iron ore industry decreased by 20.0 percent from 20 613 in 2015 to 16 491 in 2016, with permanent employees contributing about 53.2 percent and contractor’s 46.7 percent to total employment. As indicated in table 74, total remuneration saw a decrease of 5.56 percent in 2016 as compared with 2015. On the contrary, average remuneration per employee increased by 18.0 percent in 2016, largely contributed by most mines laying off some of their employees and paying retrenchment packages. Average labor productivity stood at 2.1 tons per employee, decreasing by 37.2 percent compared to 3.4 tons per employee in 2015.
0102030405060708090
Q1 2015 Q22015 Q32015 Q42015 Q12016 Q22016 Q32016 Q42016 Q12017 Q22017
Chin
a
Spot
Prices
(62%
Fe)
$/t
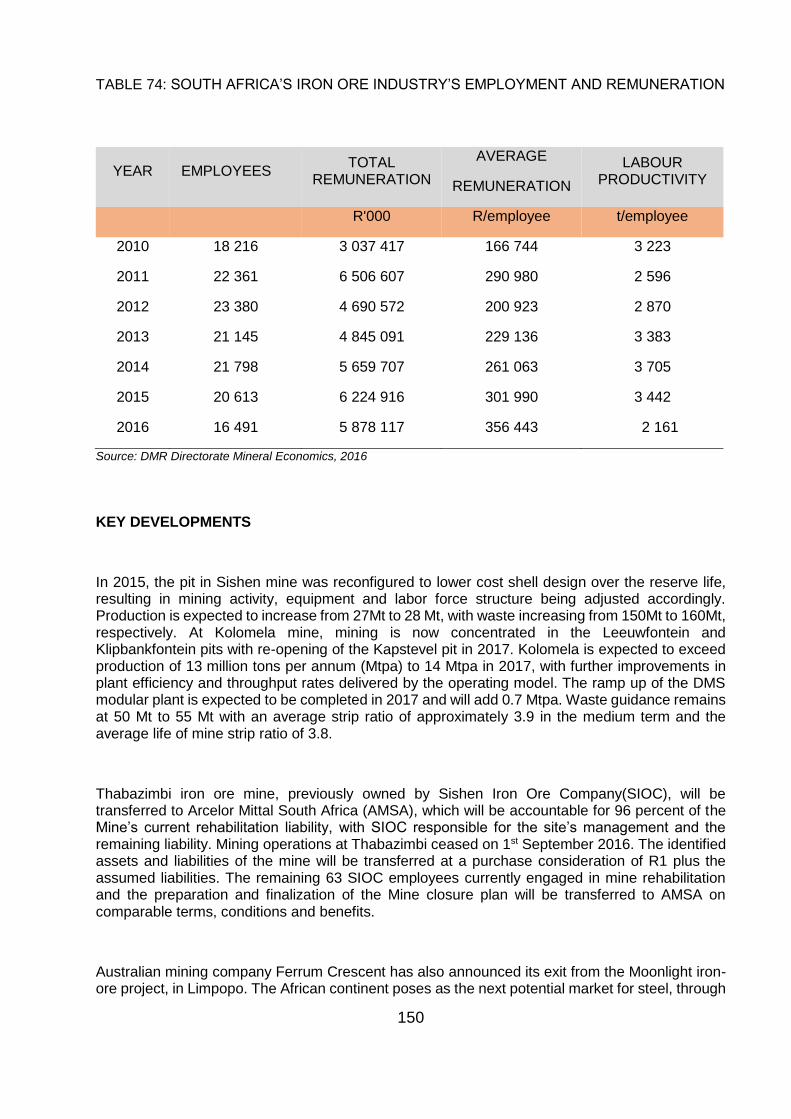
150
TABLE 74: SOUTH AFRICA’S IRON ORE INDUSTRY’S EMPLOYMENT AND REMUNERATION
YEAR EMPLOYEES TOTAL
REMUNERATION
AVERAGE LABOUR PRODUCTIVITY REMUNERATION
R'000 R/employee t/employee
2010 18 216 3 037 417 166 744 3 223
2011 22 361 6 506 607 290 980 2 596
2012 23 380 4 690 572 200 923 2 870
2013 21 145 4 845 091 229 136 3 383
2014 21 798 5 659 707 261 063 3 705
2015 20 613 6 224 916 301 990 3 442
2016 16 491 5 878 117 356 443 2 161
Source: DMR Directorate Mineral Economics, 2016
KEY DEVELOPMENTS
In 2015, the pit in Sishen mine was reconfigured to lower cost shell design over the reserve life, resulting in mining activity, equipment and labor force structure being adjusted accordingly. Production is expected to increase from 27Mt to 28 Mt, with waste increasing from 150Mt to 160Mt, respectively. At Kolomela mine, mining is now concentrated in the Leeuwfontein and Klipbankfontein pits with re-opening of the Kapstevel pit in 2017. Kolomela is expected to exceed production of 13 million tons per annum (Mtpa) to 14 Mtpa in 2017, with further improvements in plant efficiency and throughput rates delivered by the operating model. The ramp up of the DMS modular plant is expected to be completed in 2017 and will add 0.7 Mtpa. Waste guidance remains at 50 Mt to 55 Mt with an average strip ratio of approximately 3.9 in the medium term and the average life of mine strip ratio of 3.8.
Thabazimbi iron ore mine, previously owned by Sishen Iron Ore Company(SIOC), will be transferred to Arcelor Mittal South Africa (AMSA), which will be accountable for 96 percent of the Mine’s current rehabilitation liability, with SIOC responsible for the site’s management and the remaining liability. Mining operations at Thabazimbi ceased on 1st September 2016. The identified assets and liabilities of the mine will be transferred at a purchase consideration of R1 plus the assumed liabilities. The remaining 63 SIOC employees currently engaged in mine rehabilitation and the preparation and finalization of the Mine closure plan will be transferred to AMSA on comparable terms, conditions and benefits.
Australian mining company Ferrum Crescent has also announced its exit from the Moonlight iron-ore project, in Limpopo. The African continent poses as the next potential market for steel, through
151
the programme of Infrastructure Development in Africa (PIDA) as well the drive for rapid urbanization, which present added demand opportunities for infrastructure inputs such as iron ore.
OUTLOOK
Global steel demand is expected to grow more than previously anticipated in 2017 due to a recovery in developed economies and accelerating growth in emerging and developing markets, especially Russia, Brazil and India. Demand is on course to expand by 1.3 percent in 2017 to 1 535 billion tons and a further 0.9 percent in 2018 to 1 549 billion tons. China’s demand for steel is expected to be flat, at 681 million tons in 2017, with an expected decline of 2 percent in 2018 to 667.4 million tons, due to the fading effects by infrastructure-led government stimulus in the previous year. Steel demand in emerging and developing economies excluding China, is expected to grow by 4 percent in 2017, to 452.7 million tons, and a further 4.9 percent in 2018, to 474.9 million tons.
The seaborne glut is expected to increase, from 34 Mt in 2016 to 81 Mt in 2017, reaching 1 85Mt by 2021. It is expected that 2018 will mark the low point of the iron ore cycle with prices averaging $52/t in real terms. Prices need to fall to the low $50/t range and remain there for several months to force out excess high cost supply. From 2019/20 a gradual price recovery is expected as a more concentrated industry structure leads to enhanced pricing power and positive cost push. Incentive price analysis indicates long run price support around $60/t CFR (real 2017 terms) effective from 2025. Despite added production from mines such as Assen in 2018, South Africa’s iron ore production is expected to stagnate at about 58Mt yearly over 2017 to 2021 due to slow demand from China and some mine closures such as Thabazimbi mine.
REFERENCES
1. Department of Mineral Resources, Directorate Mineral Economics, 2015 2. www.crugroup.com-Iron ore prices,2017 3. CRU, Iron Ore Market Outlook, January 2017 4. www.usgs.com “Iron ore Production and Reserves 2017” 5. World Steel Association, Steel Statistical Yearbook, 20117 6. www.woodmac.com “Global Iron Ore outlook 2017 7. www.rueters.com 8. www.fin24.co.za “Sub-Saharan Africa’s iron ore production to stagnate amid
unfavorable regulatory environment”
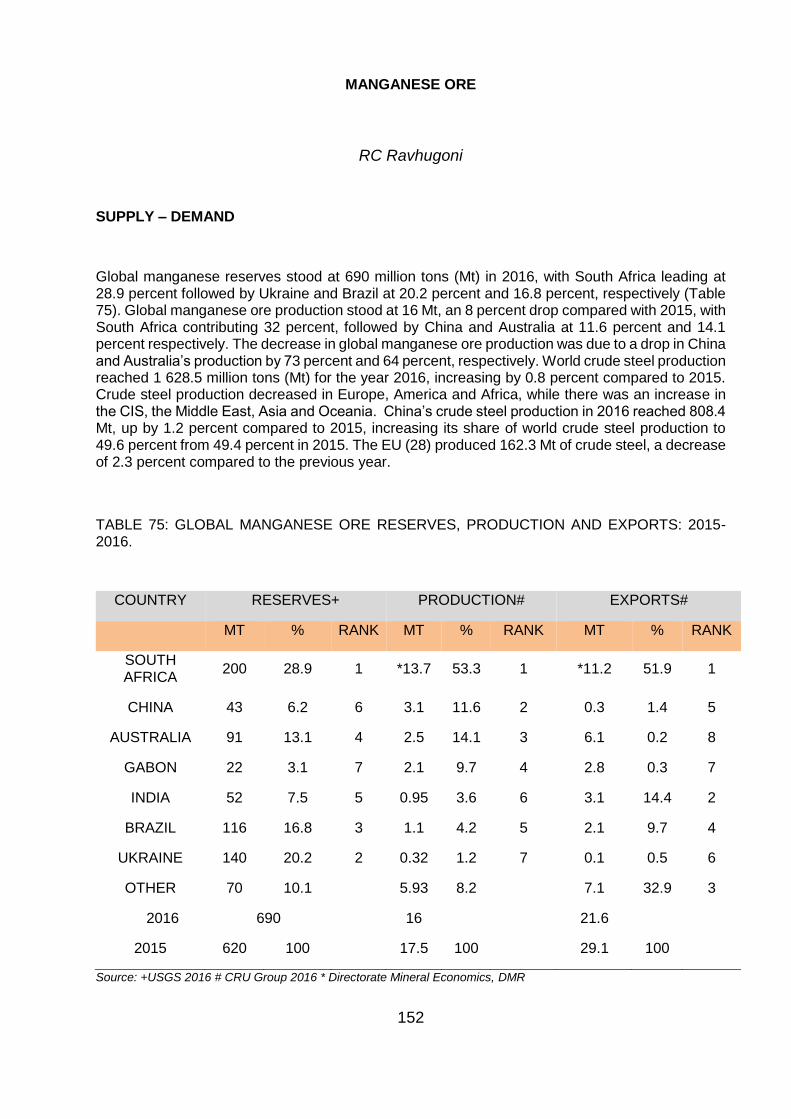
152
MANGANESE ORE
RC Ravhugoni
SUPPLY – DEMAND
Global manganese reserves stood at 690 million tons (Mt) in 2016, with South Africa leading at 28.9 percent followed by Ukraine and Brazil at 20.2 percent and 16.8 percent, respectively (Table 75). Global manganese ore production stood at 16 Mt, an 8 percent drop compared with 2015, with South Africa contributing 32 percent, followed by China and Australia at 11.6 percent and 14.1 percent respectively. The decrease in global manganese ore production was due to a drop in China and Australia’s production by 73 percent and 64 percent, respectively. World crude steel production reached 1 628.5 million tons (Mt) for the year 2016, increasing by 0.8 percent compared to 2015. Crude steel production decreased in Europe, America and Africa, while there was an increase in the CIS, the Middle East, Asia and Oceania. China’s crude steel production in 2016 reached 808.4 Mt, up by 1.2 percent compared to 2015, increasing its share of world crude steel production to 49.6 percent from 49.4 percent in 2015. The EU (28) produced 162.3 Mt of crude steel, a decrease of 2.3 percent compared to the previous year.
TABLE 75: GLOBAL MANGANESE ORE RESERVES, PRODUCTION AND EXPORTS: 2015-2016.
COUNTRY RESERVES+ PRODUCTION# EXPORTS#
MT % RANK MT % RANK MT % RANK
SOUTH AFRICA
200 28.9 1 *13.7 53.3 1 *11.2 51.9 1
CHINA 43 6.2 6 3.1 11.6 2 0.3 1.4 5
AUSTRALIA 91 13.1 4 2.5 14.1 3 6.1 0.2 8
GABON 22 3.1 7 2.1 9.7 4 2.8 0.3 7
INDIA 52 7.5 5 0.95 3.6 6 3.1 14.4 2
BRAZIL 116 16.8 3 1.1 4.2 5 2.1 9.7 4
UKRAINE 140 20.2 2 0.32 1.2 7 0.1 0.5 6
OTHER 70 10.1 5.93 8.2 7.1 32.9 3
2016 690 16 21.6
2015 620 100 17.5 100 29.1 100
Source: +USGS 2016 # CRU Group 2016 * Directorate Mineral Economics, DMR
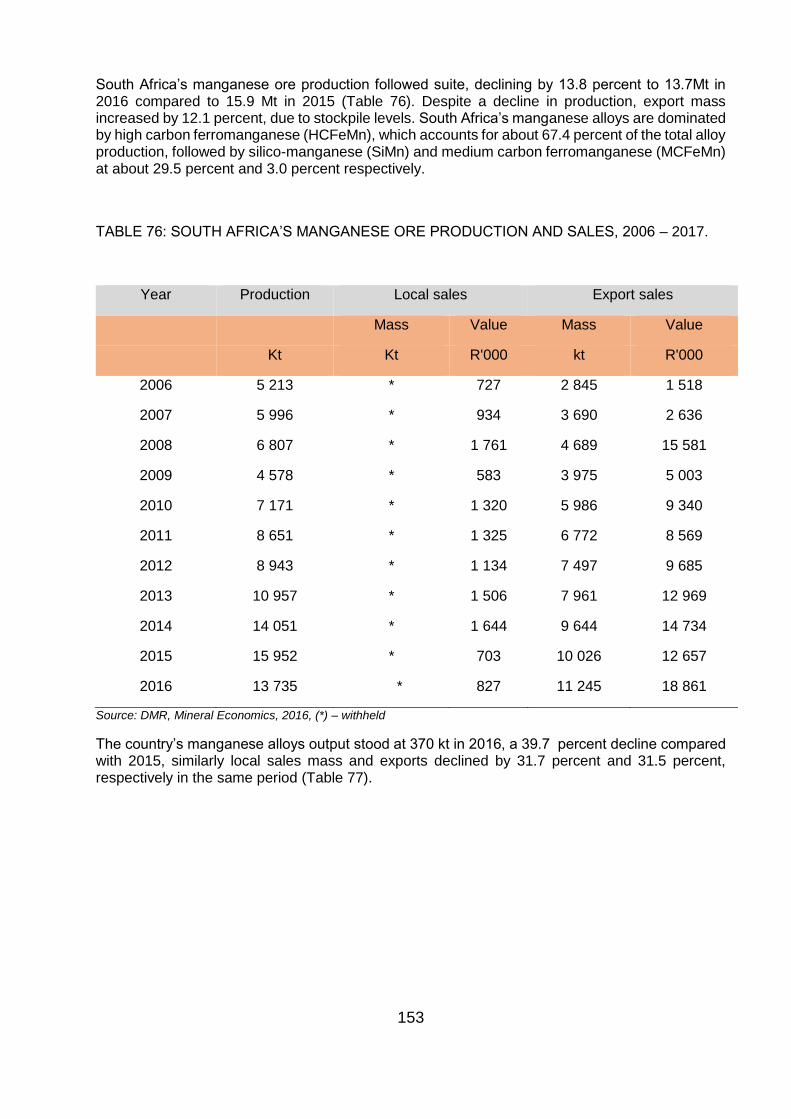
153
South Africa’s manganese ore production followed suite, declining by 13.8 percent to 13.7Mt in 2016 compared to 15.9 Mt in 2015 (Table 76). Despite a decline in production, export mass increased by 12.1 percent, due to stockpile levels. South Africa’s manganese alloys are dominated by high carbon ferromanganese (HCFeMn), which accounts for about 67.4 percent of the total alloy production, followed by silico-manganese (SiMn) and medium carbon ferromanganese (MCFeMn) at about 29.5 percent and 3.0 percent respectively.
TABLE 76: SOUTH AFRICA’S MANGANESE ORE PRODUCTION AND SALES, 2006 – 2017.
Year Production Local sales Export sales
Mass Value Mass Value
Kt Kt R'000 kt R'000
2006 5 213 * 727 2 845 1 518
2007 5 996 * 934 3 690 2 636
2008 6 807 * 1 761 4 689 15 581
2009 4 578 * 583 3 975 5 003
2010 7 171 * 1 320 5 986 9 340
2011 8 651 * 1 325 6 772 8 569
2012 8 943 * 1 134 7 497 9 685
2013 10 957 * 1 506 7 961 12 969
2014 14 051 * 1 644 9 644 14 734
2015 15 952 * 703 10 026 12 657
2016 13 735 * 827 11 245 18 861
Source: DMR, Mineral Economics, 2016, (*) – withheld
The country’s manganese alloys output stood at 370 kt in 2016, a 39.7 percent decline compared with 2015, similarly local sales mass and exports declined by 31.7 percent and 31.5 percent, respectively in the same period (Table 77).
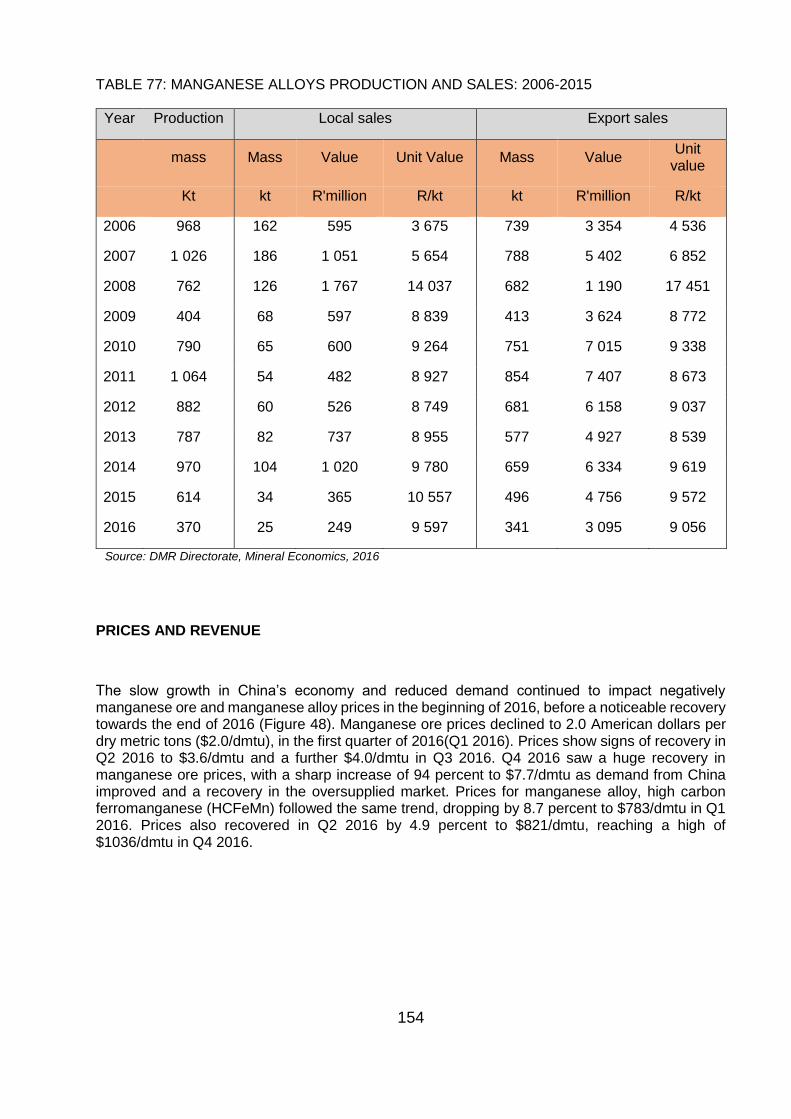
154
TABLE 77: MANGANESE ALLOYS PRODUCTION AND SALES: 2006-2015
Year Production Local sales Export sales
mass Mass Value Unit Value Mass Value Unit
value
Kt kt R'million R/kt kt R'million R/kt
2006 968 162 595 3 675 739 3 354 4 536
2007 1 026 186 1 051 5 654 788 5 402 6 852
2008 762 126 1 767 14 037 682 1 190 17 451
2009 404 68 597 8 839 413 3 624 8 772
2010 790 65 600 9 264 751 7 015 9 338
2011 1 064 54 482 8 927 854 7 407 8 673
2012 882 60 526 8 749 681 6 158 9 037
2013 787 82 737 8 955 577 4 927 8 539
2014 970 104 1 020 9 780 659 6 334 9 619
2015 614 34 365 10 557 496 4 756 9 572
2016 370 25 249 9 597 341 3 095 9 056
Source: DMR Directorate, Mineral Economics, 2016
PRICES AND REVENUE
The slow growth in China’s economy and reduced demand continued to impact negatively manganese ore and manganese alloy prices in the beginning of 2016, before a noticeable recovery towards the end of 2016 (Figure 48). Manganese ore prices declined to 2.0 American dollars per dry metric tons ($2.0/dmtu), in the first quarter of 2016(Q1 2016). Prices show signs of recovery in Q2 2016 to $3.6/dmtu and a further $4.0/dmtu in Q3 2016. Q4 2016 saw a huge recovery in manganese ore prices, with a sharp increase of 94 percent to $7.7/dmtu as demand from China improved and a recovery in the oversupplied market. Prices for manganese alloy, high carbon ferromanganese (HCFeMn) followed the same trend, dropping by 8.7 percent to $783/dmtu in Q1 2016. Prices also recovered in Q2 2016 by 4.9 percent to $821/dmtu, reaching a high of $1036/dmtu in Q4 2016.
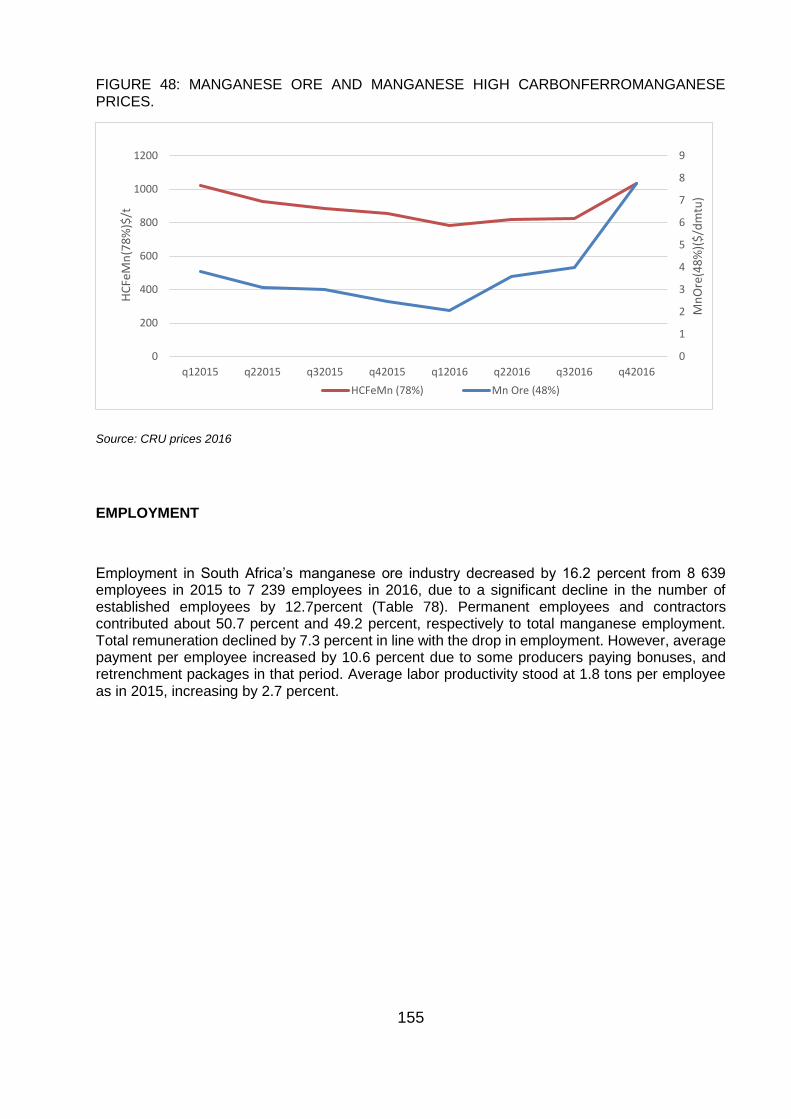
155
FIGURE 48: MANGANESE ORE AND MANGANESE HIGH CARBONFERROMANGANESE PRICES.
Source: CRU prices 2016
EMPLOYMENT
Employment in South Africa’s manganese ore industry decreased by 16.2 percent from 8 639 employees in 2015 to 7 239 employees in 2016, due to a significant decline in the number of established employees by 12.7percent (Table 78). Permanent employees and contractors contributed about 50.7 percent and 49.2 percent, respectively to total manganese employment. Total remuneration declined by 7.3 percent in line with the drop in employment. However, average payment per employee increased by 10.6 percent due to some producers paying bonuses, and retrenchment packages in that period. Average labor productivity stood at 1.8 tons per employee as in 2015, increasing by 2.7 percent.
0
1
2
3
4
5
6
7
8
9
0
200
400
600
800
1000
1200
q12015 q22015 q32015 q42015 q12016 q22016 q32016 q42016
Mn
Ore
(48
%)(
$/d
mtu
)
HC
FeM
n(7
8%
)$/t
HCFeMn (78%) Mn Ore (48%)
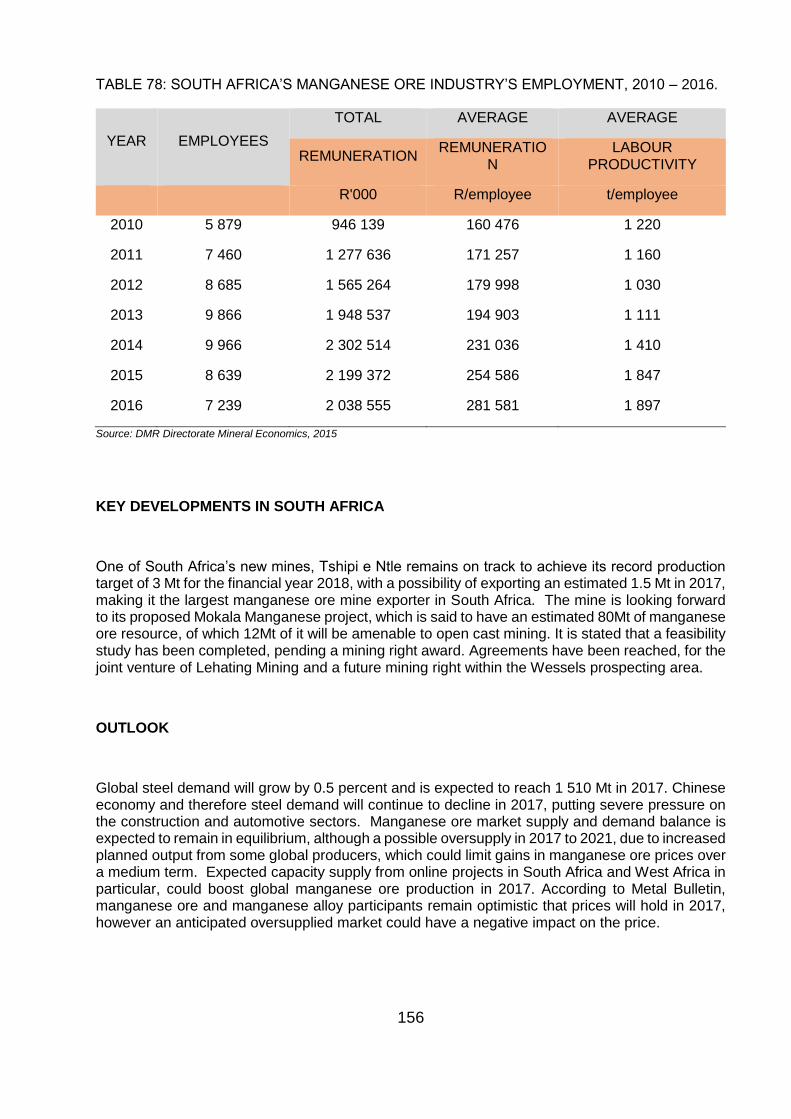
156
TABLE 78: SOUTH AFRICA’S MANGANESE ORE INDUSTRY’S EMPLOYMENT, 2010 – 2016.
YEAR EMPLOYEES
TOTAL AVERAGE AVERAGE
REMUNERATION REMUNERATIO
N LABOUR
PRODUCTIVITY
R'000 R/employee t/employee
2010 5 879 946 139 160 476 1 220
2011 7 460 1 277 636 171 257 1 160
2012 8 685 1 565 264 179 998 1 030
2013 9 866 1 948 537 194 903 1 111
2014 9 966 2 302 514 231 036 1 410
2015 8 639 2 199 372 254 586 1 847
2016 7 239 2 038 555 281 581 1 897
Source: DMR Directorate Mineral Economics, 2015
KEY DEVELOPMENTS IN SOUTH AFRICA
One of South Africa’s new mines, Tshipi e Ntle remains on track to achieve its record production target of 3 Mt for the financial year 2018, with a possibility of exporting an estimated 1.5 Mt in 2017, making it the largest manganese ore mine exporter in South Africa. The mine is looking forward to its proposed Mokala Manganese project, which is said to have an estimated 80Mt of manganese ore resource, of which 12Mt of it will be amenable to open cast mining. It is stated that a feasibility study has been completed, pending a mining right award. Agreements have been reached, for the joint venture of Lehating Mining and a future mining right within the Wessels prospecting area.
OUTLOOK
Global steel demand will grow by 0.5 percent and is expected to reach 1 510 Mt in 2017. Chinese economy and therefore steel demand will continue to decline in 2017, putting severe pressure on the construction and automotive sectors. Manganese ore market supply and demand balance is expected to remain in equilibrium, although a possible oversupply in 2017 to 2021, due to increased planned output from some global producers, which could limit gains in manganese ore prices over a medium term. Expected capacity supply from online projects in South Africa and West Africa in particular, could boost global manganese ore production in 2017. According to Metal Bulletin, manganese ore and manganese alloy participants remain optimistic that prices will hold in 2017, however an anticipated oversupplied market could have a negative impact on the price.
157
REFERENCES
1. CRU, Manganese Ferroalloy Market Outlook, July 2016 2. Department of Mineral Resources, Directorate Mineral Economics, 2016 3. CRU, Manganese Market Outlook, 2017 4. World Steel Association, World Crude Steel Production - Summary, 2016 5. www.miningweekley.com-“Tshipi now South Africa’s largest manganese exporter-
Jupiter: 13/07/2017 6. www.mining.com “More than 400 jobs to go at South32 manganese mine in south
Africa” 7. Outlook of South Africa’s manganese sector: 29/05/2014 8. CRU: Manganese-Are prices heading for a new floor? 16/05/2017 9. Economics update: Chamber of Mines 081/2017 10. www.investingnews.com, January 2017
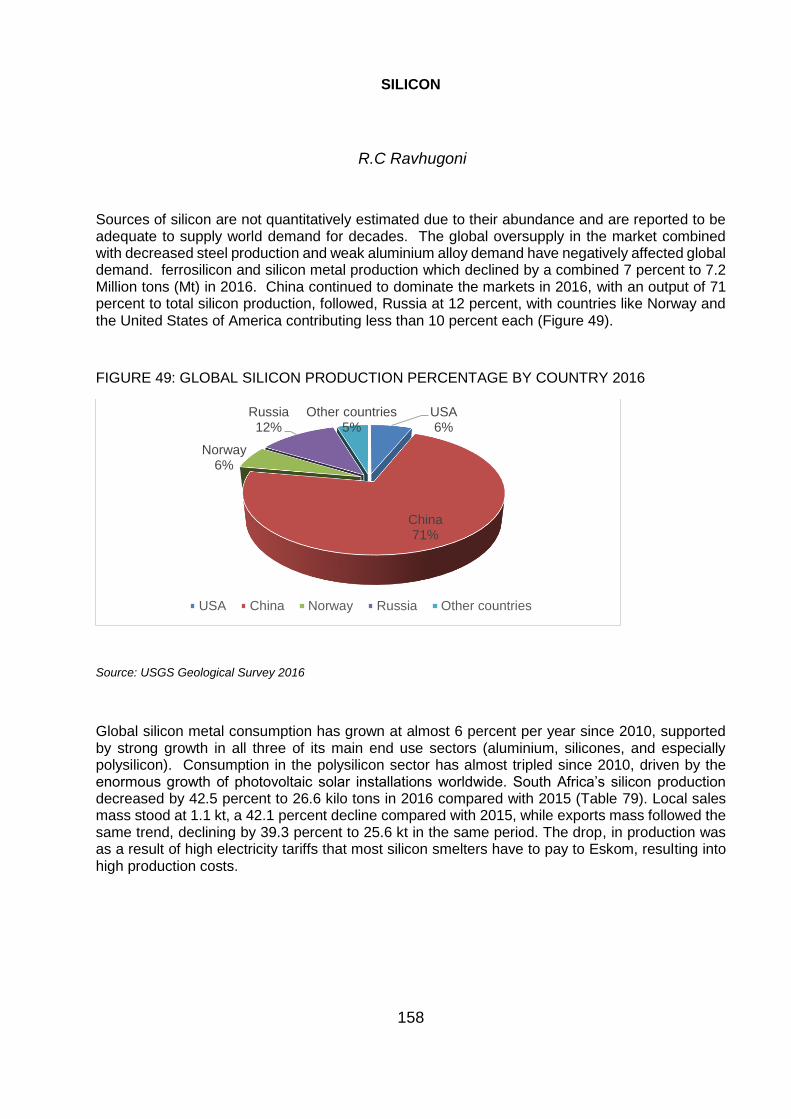
158
SILICON
R.C Ravhugoni
Sources of silicon are not quantitatively estimated due to their abundance and are reported to be adequate to supply world demand for decades. The global oversupply in the market combined with decreased steel production and weak aluminium alloy demand have negatively affected global demand. ferrosilicon and silicon metal production which declined by a combined 7 percent to 7.2 Million tons (Mt) in 2016. China continued to dominate the markets in 2016, with an output of 71 percent to total silicon production, followed, Russia at 12 percent, with countries like Norway and the United States of America contributing less than 10 percent each (Figure 49).
FIGURE 49: GLOBAL SILICON PRODUCTION PERCENTAGE BY COUNTRY 2016
Source: USGS Geological Survey 2016
Global silicon metal consumption has grown at almost 6 percent per year since 2010, supported by strong growth in all three of its main end use sectors (aluminium, silicones, and especially polysilicon). Consumption in the polysilicon sector has almost tripled since 2010, driven by the enormous growth of photovoltaic solar installations worldwide. South Africa’s silicon production decreased by 42.5 percent to 26.6 kilo tons in 2016 compared with 2015 (Table 79). Local sales mass stood at 1.1 kt, a 42.1 percent decline compared with 2015, while exports mass followed the same trend, declining by 39.3 percent to 25.6 kt in the same period. The drop, in production was as a result of high electricity tariffs that most silicon smelters have to pay to Eskom, resulting into high production costs.
USA6%
China71%
Norway6%
Russia12%
Other countries5%
USA China Norway Russia Other countries
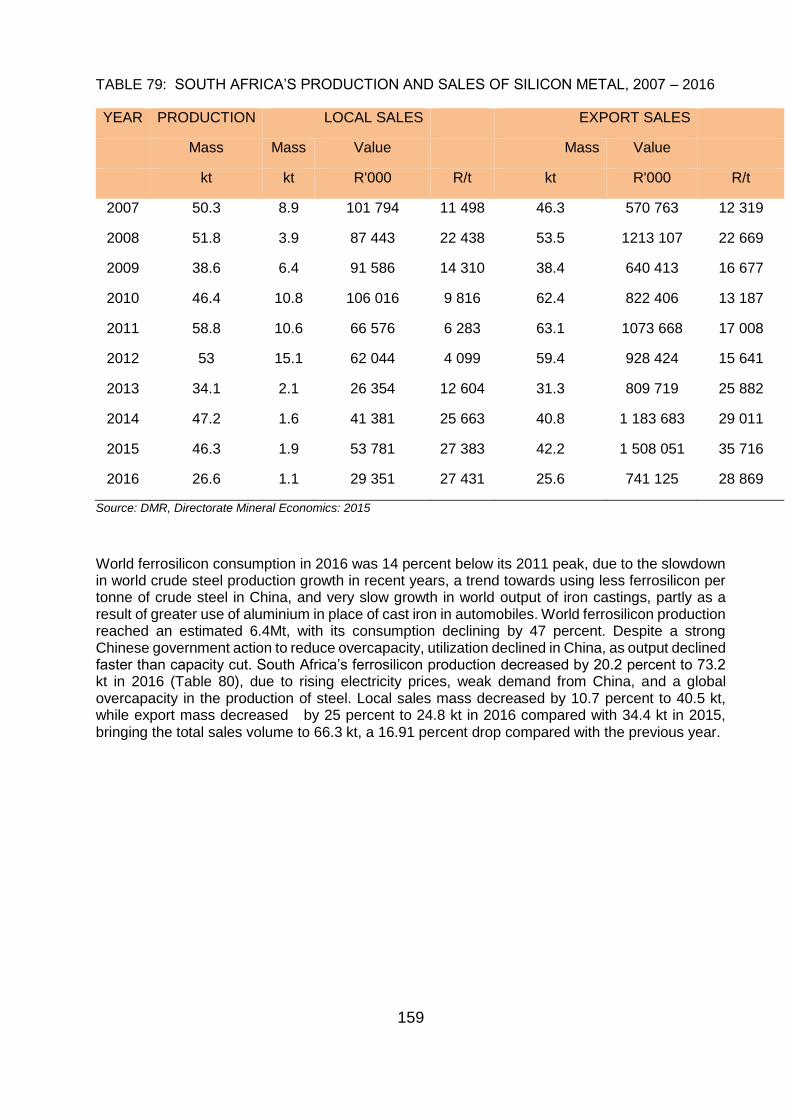
159
TABLE 79: SOUTH AFRICA’S PRODUCTION AND SALES OF SILICON METAL, 2007 – 2016
YEAR PRODUCTION LOCAL SALES EXPORT SALES
Mass Mass Value Mass Value
kt kt R'000 R/t kt R'000 R/t
2007 50.3 8.9 101 794 11 498 46.3 570 763 12 319
2008 51.8 3.9 87 443 22 438 53.5 1213 107 22 669
2009 38.6 6.4 91 586 14 310 38.4 640 413 16 677
2010 46.4 10.8 106 016 9 816 62.4 822 406 13 187
2011 58.8 10.6 66 576 6 283 63.1 1073 668 17 008
2012 53 15.1 62 044 4 099 59.4 928 424 15 641
2013 34.1 2.1 26 354 12 604 31.3 809 719 25 882
2014 47.2 1.6 41 381 25 663 40.8 1 183 683 29 011
2015 46.3 1.9 53 781 27 383 42.2 1 508 051 35 716
2016 26.6 1.1 29 351 27 431 25.6 741 125 28 869
Source: DMR, Directorate Mineral Economics: 2015
World ferrosilicon consumption in 2016 was 14 percent below its 2011 peak, due to the slowdown in world crude steel production growth in recent years, a trend towards using less ferrosilicon per tonne of crude steel in China, and very slow growth in world output of iron castings, partly as a result of greater use of aluminium in place of cast iron in automobiles. World ferrosilicon production reached an estimated 6.4Mt, with its consumption declining by 47 percent. Despite a strong Chinese government action to reduce overcapacity, utilization declined in China, as output declined faster than capacity cut. South Africa’s ferrosilicon production decreased by 20.2 percent to 73.2 kt in 2016 (Table 80), due to rising electricity prices, weak demand from China, and a global overcapacity in the production of steel. Local sales mass decreased by 10.7 percent to 40.5 kt, while export mass decreased by 25 percent to 24.8 kt in 2016 compared with 34.4 kt in 2015, bringing the total sales volume to 66.3 kt, a 16.91 percent drop compared with the previous year.
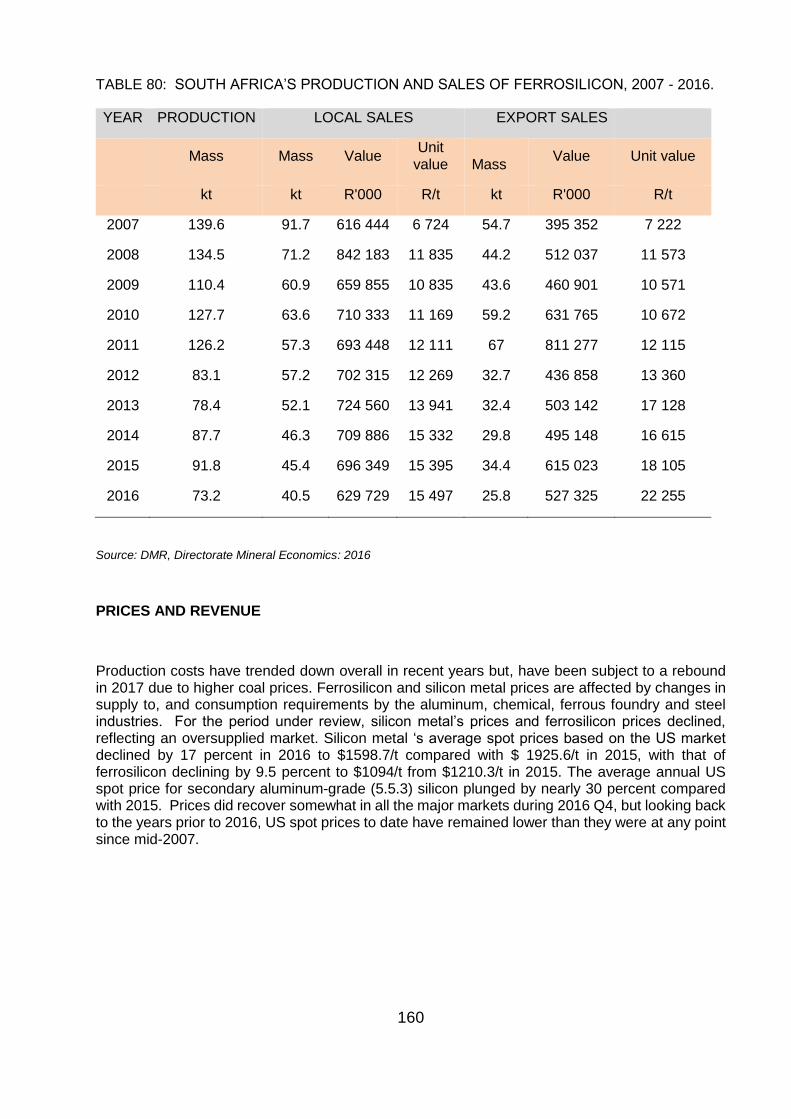
160
TABLE 80: SOUTH AFRICA’S PRODUCTION AND SALES OF FERROSILICON, 2007 - 2016.
YEAR PRODUCTION LOCAL SALES EXPORT SALES
Mass Mass Value Unit
value Mass
Value Unit value
kt kt R'000 R/t kt R'000 R/t
2007 139.6 91.7 616 444 6 724 54.7 395 352 7 222
2008 134.5 71.2 842 183 11 835 44.2 512 037 11 573
2009 110.4 60.9 659 855 10 835 43.6 460 901 10 571
2010 127.7 63.6 710 333 11 169 59.2 631 765 10 672
2011 126.2 57.3 693 448 12 111 67 811 277 12 115
2012 83.1 57.2 702 315 12 269 32.7 436 858 13 360
2013 78.4 52.1 724 560 13 941 32.4 503 142 17 128
2014 87.7 46.3 709 886 15 332 29.8 495 148 16 615
2015 91.8 45.4 696 349 15 395 34.4 615 023 18 105
2016 73.2 40.5 629 729 15 497 25.8 527 325 22 255
Source: DMR, Directorate Mineral Economics: 2016
PRICES AND REVENUE
Production costs have trended down overall in recent years but, have been subject to a rebound in 2017 due to higher coal prices. Ferrosilicon and silicon metal prices are affected by changes in supply to, and consumption requirements by the aluminum, chemical, ferrous foundry and steel industries. For the period under review, silicon metal’s prices and ferrosilicon prices declined, reflecting an oversupplied market. Silicon metal ‘s average spot prices based on the US market declined by 17 percent in 2016 to $1598.7/t compared with $ 1925.6/t in 2015, with that of ferrosilicon declining by 9.5 percent to $1094/t from $1210.3/t in 2015. The average annual US spot price for secondary aluminum-grade (5.5.3) silicon plunged by nearly 30 percent compared with 2015. Prices did recover somewhat in all the major markets during 2016 Q4, but looking back to the years prior to 2016, US spot prices to date have remained lower than they were at any point since mid-2007.
161
OUTLOOK
World silicon market is expected to increase at moderate rates, due to increased demand from various applications. Rising use of silicon to produce aluminum alloys that find application in the automotive sector; and burgeoning growth in automobiles production in China and other emerging nations is triggering growth in silicon demand. Growing demand for polysilicon in photovoltaic solar panels driven by government incentives formulated to encourage wider penetration of solar power represents another prime factor driving growth in demand worldwide. Robust demand for silicon based semiconductor materials supported by rising proliferation of advanced gadgets and electronic devices worldwide also bodes well for market expansion in the long run. The estimated growing silicon demand in various applications is expected to propel silicon global and local production. Silicon metal and ferrosilicon prices are expected to increase slightly in response to increased demand, however an oversupplied marked could have a negative impact on prices in the short term.
REFERENCES
1. DMR, Mineral economics 2. USGS Mineral Commodity Summaries, 2015/2016 3. www.worldsteel.org 4. www.cru.com 5. www.roskill.com
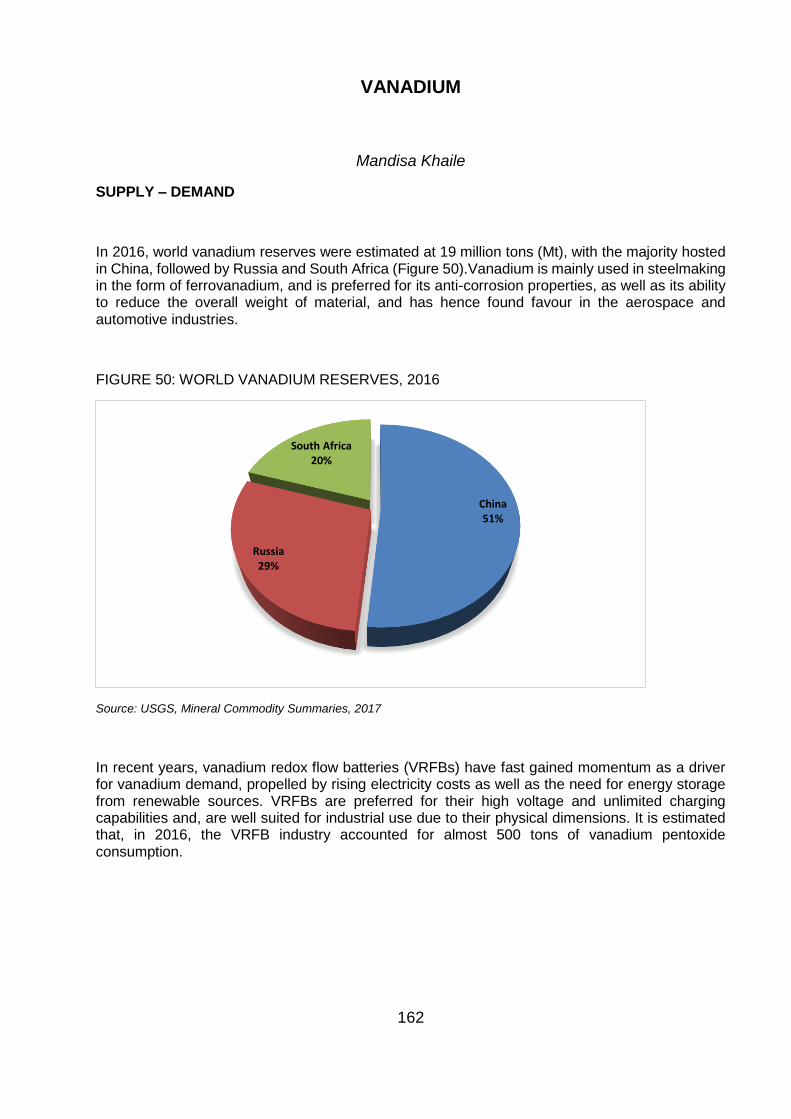
162
VANADIUM
Mandisa Khaile
SUPPLY – DEMAND
In 2016, world vanadium reserves were estimated at 19 million tons (Mt), with the majority hosted in China, followed by Russia and South Africa (Figure 50).Vanadium is mainly used in steelmaking in the form of ferrovanadium, and is preferred for its anti-corrosion properties, as well as its ability to reduce the overall weight of material, and has hence found favour in the aerospace and automotive industries.
FIGURE 50: WORLD VANADIUM RESERVES, 2016
Source: USGS, Mineral Commodity Summaries, 2017
In recent years, vanadium redox flow batteries (VRFBs) have fast gained momentum as a driver for vanadium demand, propelled by rising electricity costs as well as the need for energy storage from renewable sources. VRFBs are preferred for their high voltage and unlimited charging capabilities and, are well suited for industrial use due to their physical dimensions. It is estimated that, in 2016, the VRFB industry accounted for almost 500 tons of vanadium pentoxide consumption.
China51%
Russia29%
South Africa20%
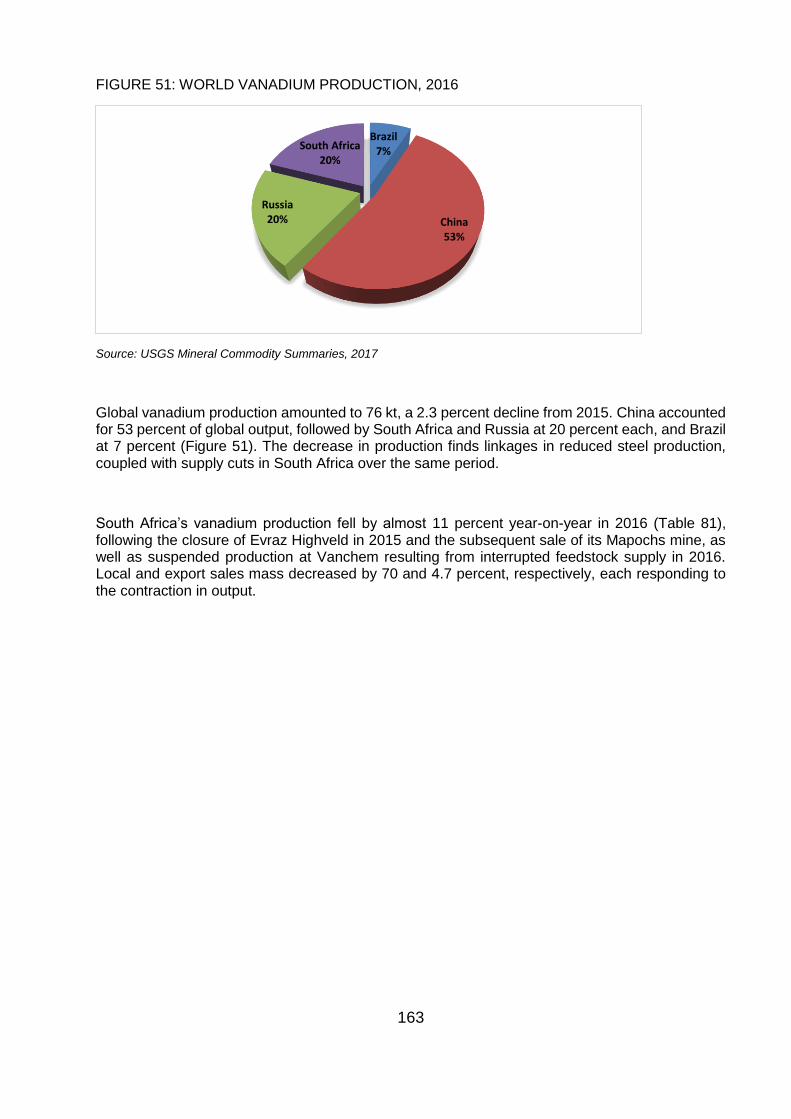
163
FIGURE 51: WORLD VANADIUM PRODUCTION, 2016
Source: USGS Mineral Commodity Summaries, 2017
Global vanadium production amounted to 76 kt, a 2.3 percent decline from 2015. China accounted for 53 percent of global output, followed by South Africa and Russia at 20 percent each, and Brazil at 7 percent (Figure 51). The decrease in production finds linkages in reduced steel production, coupled with supply cuts in South Africa over the same period.
South Africa’s vanadium production fell by almost 11 percent year-on-year in 2016 (Table 81), following the closure of Evraz Highveld in 2015 and the subsequent sale of its Mapochs mine, as well as suspended production at Vanchem resulting from interrupted feedstock supply in 2016. Local and export sales mass decreased by 70 and 4.7 percent, respectively, each responding to the contraction in output.
Brazil7%
China53%
Russia20%
South Africa20%
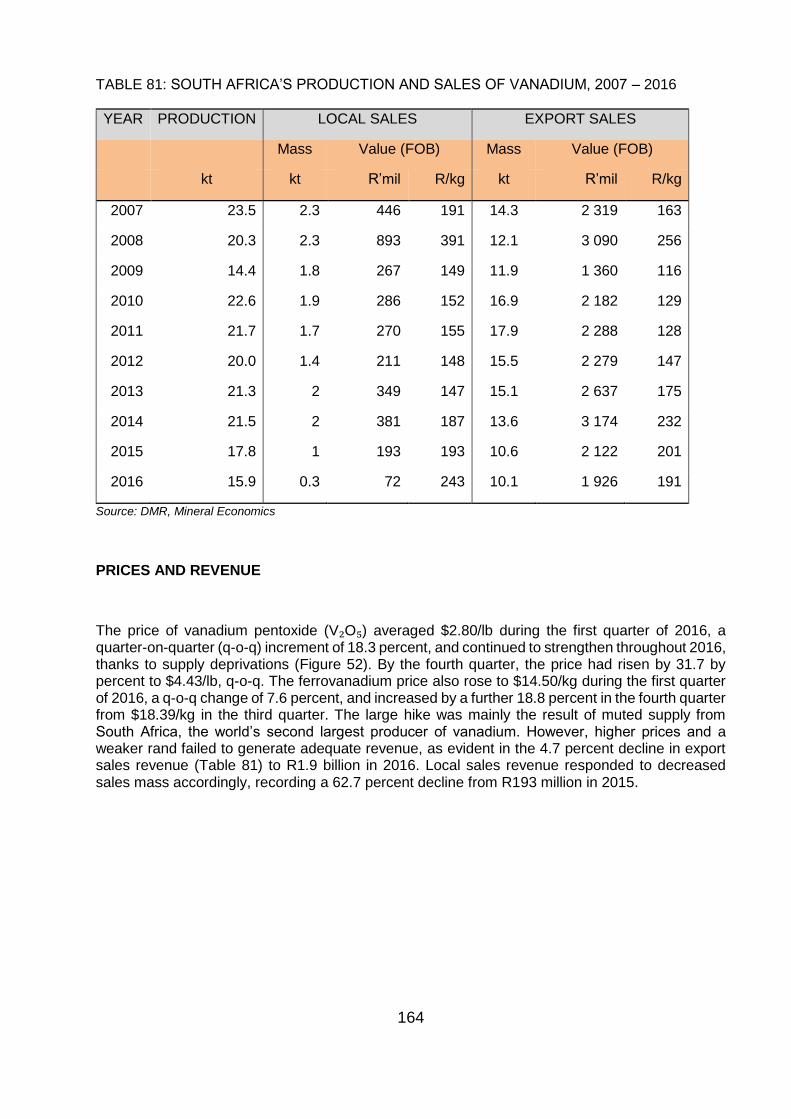
164
TABLE 81: SOUTH AFRICA’S PRODUCTION AND SALES OF VANADIUM, 2007 – 2016
YEAR PRODUCTION LOCAL SALES EXPORT SALES
Mass Value (FOB) Mass Value (FOB)
kt kt R’mil R/kg kt R’mil R/kg
2007 23.5 2.3 446 191 14.3 2 319 163
2008 20.3 2.3 893 391 12.1 3 090 256
2009 14.4 1.8 267 149 11.9 1 360 116
2010 22.6 1.9 286 152 16.9 2 182 129
2011 21.7 1.7 270 155 17.9 2 288 128
2012 20.0 1.4 211 148 15.5 2 279 147
2013 21.3 2 349 147 15.1 2 637 175
2014 21.5 2 381 187 13.6 3 174 232
2015 17.8 1 193 193 10.6 2 122 201
2016 15.9 0.3 72 243 10.1 1 926 191
Source: DMR, Mineral Economics
PRICES AND REVENUE
The price of vanadium pentoxide (V₂O₅) averaged $2.80/lb during the first quarter of 2016, a quarter-on-quarter (q-o-q) increment of 18.3 percent, and continued to strengthen throughout 2016, thanks to supply deprivations (Figure 52). By the fourth quarter, the price had risen by 31.7 by percent to $4.43/lb, q-o-q. The ferrovanadium price also rose to $14.50/kg during the first quarter of 2016, a q-o-q change of 7.6 percent, and increased by a further 18.8 percent in the fourth quarter from $18.39/kg in the third quarter. The large hike was mainly the result of muted supply from South Africa, the world’s second largest producer of vanadium. However, higher prices and a weaker rand failed to generate adequate revenue, as evident in the 4.7 percent decline in export sales revenue (Table 81) to R1.9 billion in 2016. Local sales revenue responded to decreased sales mass accordingly, recording a 62.7 percent decline from R193 million in 2015.
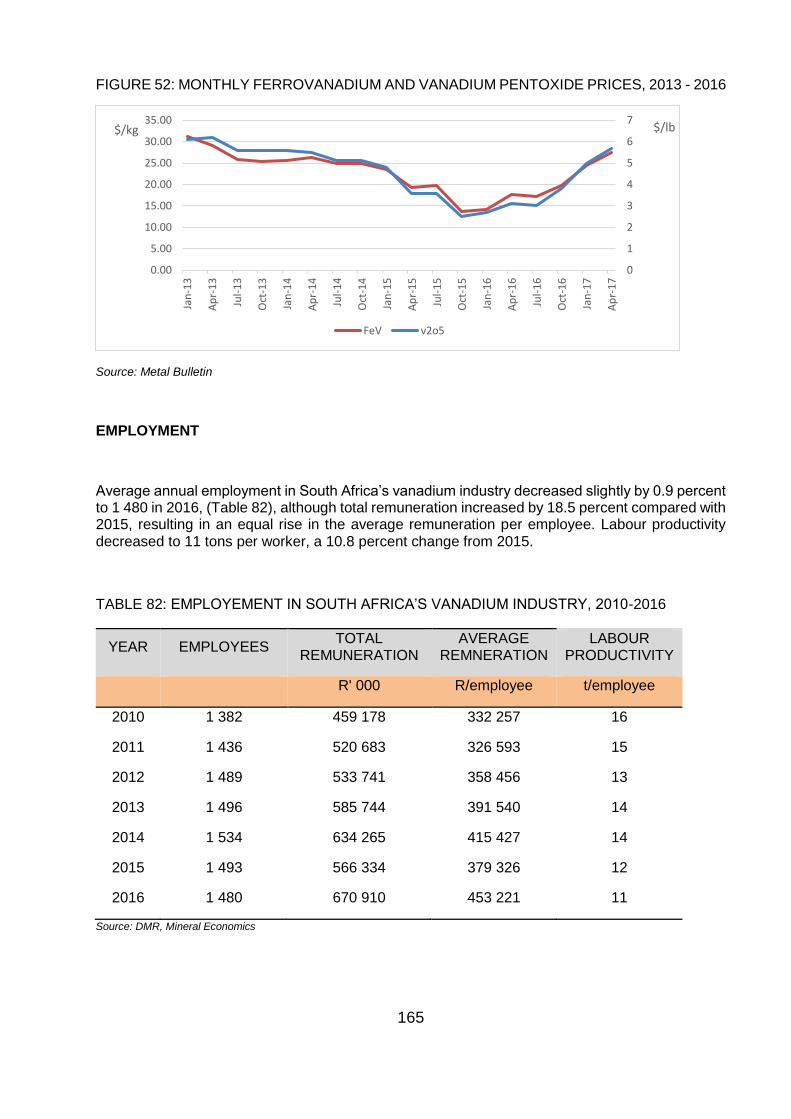
165
FIGURE 52: MONTHLY FERROVANADIUM AND VANADIUM PENTOXIDE PRICES, 2013 - 2016
Source: Metal Bulletin
EMPLOYMENT
Average annual employment in South Africa’s vanadium industry decreased slightly by 0.9 percent to 1 480 in 2016, (Table 82), although total remuneration increased by 18.5 percent compared with 2015, resulting in an equal rise in the average remuneration per employee. Labour productivity decreased to 11 tons per worker, a 10.8 percent change from 2015.
TABLE 82: EMPLOYEMENT IN SOUTH AFRICA’S VANADIUM INDUSTRY, 2010-2016
YEAR EMPLOYEES TOTAL
REMUNERATION AVERAGE
REMNERATION LABOUR
PRODUCTIVITY
R' 000 R/employee t/employee
2010 1 382 459 178 332 257 16
2011 1 436 520 683 326 593 15
2012 1 489 533 741 358 456 13
2013 1 496 585 744 391 540 14
2014 1 534 634 265 415 427 14
2015 1 493 566 334 379 326 12
2016 1 480 670 910 453 221 11
Source: DMR, Mineral Economics
0
1
2
3
4
5
6
7
0.00
5.00
10.00
15.00
20.00
25.00
30.00
35.00
Jan
-13
Ap
r-1
3
Jul-
13
Oct
-13
Jan
-14
Ap
r-1
4
Jul-
14
Oct
-14
Jan
-15
Ap
r-1
5
Jul-
15
Oct
-15
Jan
-16
Ap
r-1
6
Jul-
16
Oct
-16
Jan
-17
Ap
r-1
7
$/lb$/kg
FeV v2o5
166
KEY DEVELOPMENTS
The financing of the Ironveld High Purity Iron, Vanadium and Titanium project, is nearing completion, and the construction of the 15 MW smelter, which has a projected vanadium output of 381 tons, will be complete upon financial closure. Offtake agreements are already in place for the first five years of production, and water use licenses have already been lodged. Bushveld Minerals has concluded its acquisition of Vametco, and plans create a vanadium platform which will integrate Vametco’s vanadium mine and processing plant, as well as Bushveld’s Mokobane vanadium project in the North-West province.
OUTLOOK
The Chinese government plans to introduce stricter policies to govern the production of structural steel, in particular, reinforcement bars (rebar). This is in an effort to strengthen the earthquake resistance of the material, which means that larger quantities of vanadium will have to be added to the product mix in order to increase tensile strength. This is likely to stimulate demand for feedstock material going into 2017 and beyond. However, the expected cutbacks in steel production in China could neutralize this demand. Additionally, in the event that supply deficits in South Africa and Russia do not to correct in the near future, this will have a spill-over effect on prices in the form of a hike. The FeV price is forecast to rise by as much as 9 percent during the first quarter of 2017 to $24.95/kg, reaching $27.42/kg by April. Similarly, V₂O₅, is forecast to increase by 12.8 percent in quarter 1 of 2017 to $5.00/lb.
There is growing interest in VRFBs globally, as such, in support for the energy storage market, the Industrial Development Corporation (IDC), through its New Industries Strategic Business Unit, and in partnership with the U.S. Trade and Development Agency (USTDA), plans to develop and implement an energy storage industry development strategy roadmap for South Africa in order to expedite the country’s energy storage value proposition. Again, this is a stimulus for demand from a fairly new market, but it is not likely to surpass the steel sector a major demand driver.
REFERENCES
1. DMR, Mineral Economics 2. USGS Mineral Commodity Summaries Vanadium, 2017 3. World Steel Association, www.worldsteel.org 4. Mining Review, www.miningreview.com 5. Mining Weekly, www.miningweekly.com 6. Engineering News. www.engineeringnews.co.za 7. Metal Bulletin, www.metalbulletin.com 8. Nedbank Annual Exchange Rates, www.nedbank.co.za 9. Ironveld PLC, Interim results for the six months ended 31 December 2016
10. Roskill Vanadium Report, 2017
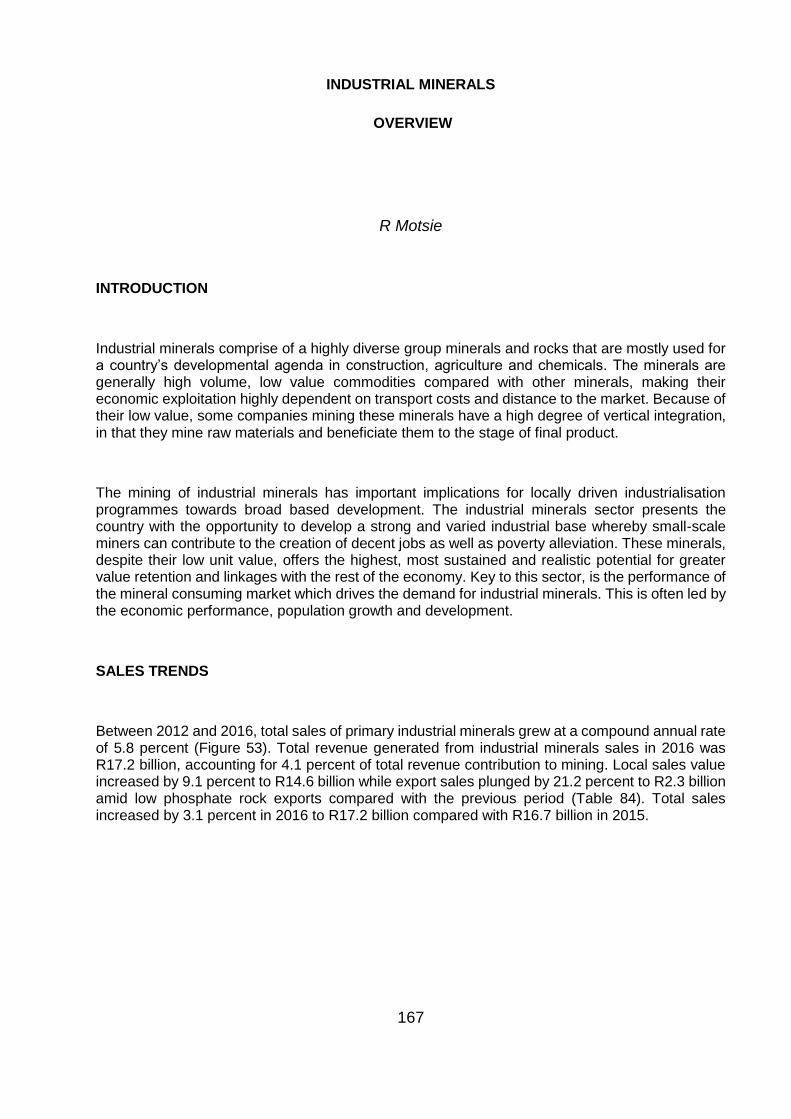
167
INDUSTRIAL MINERALS
OVERVIEW
R Motsie
INTRODUCTION
Industrial minerals comprise of a highly diverse group minerals and rocks that are mostly used for a country’s developmental agenda in construction, agriculture and chemicals. The minerals are generally high volume, low value commodities compared with other minerals, making their economic exploitation highly dependent on transport costs and distance to the market. Because of their low value, some companies mining these minerals have a high degree of vertical integration, in that they mine raw materials and beneficiate them to the stage of final product.
The mining of industrial minerals has important implications for locally driven industrialisation programmes towards broad based development. The industrial minerals sector presents the country with the opportunity to develop a strong and varied industrial base whereby small-scale miners can contribute to the creation of decent jobs as well as poverty alleviation. These minerals, despite their low unit value, offers the highest, most sustained and realistic potential for greater value retention and linkages with the rest of the economy. Key to this sector, is the performance of the mineral consuming market which drives the demand for industrial minerals. This is often led by the economic performance, population growth and development.
SALES TRENDS
Between 2012 and 2016, total sales of primary industrial minerals grew at a compound annual rate of 5.8 percent (Figure 53). Total revenue generated from industrial minerals sales in 2016 was R17.2 billion, accounting for 4.1 percent of total revenue contribution to mining. Local sales value increased by 9.1 percent to R14.6 billion while export sales plunged by 21.2 percent to R2.3 billion amid low phosphate rock exports compared with the previous period (Table 84). Total sales increased by 3.1 percent in 2016 to R17.2 billion compared with R16.7 billion in 2015.
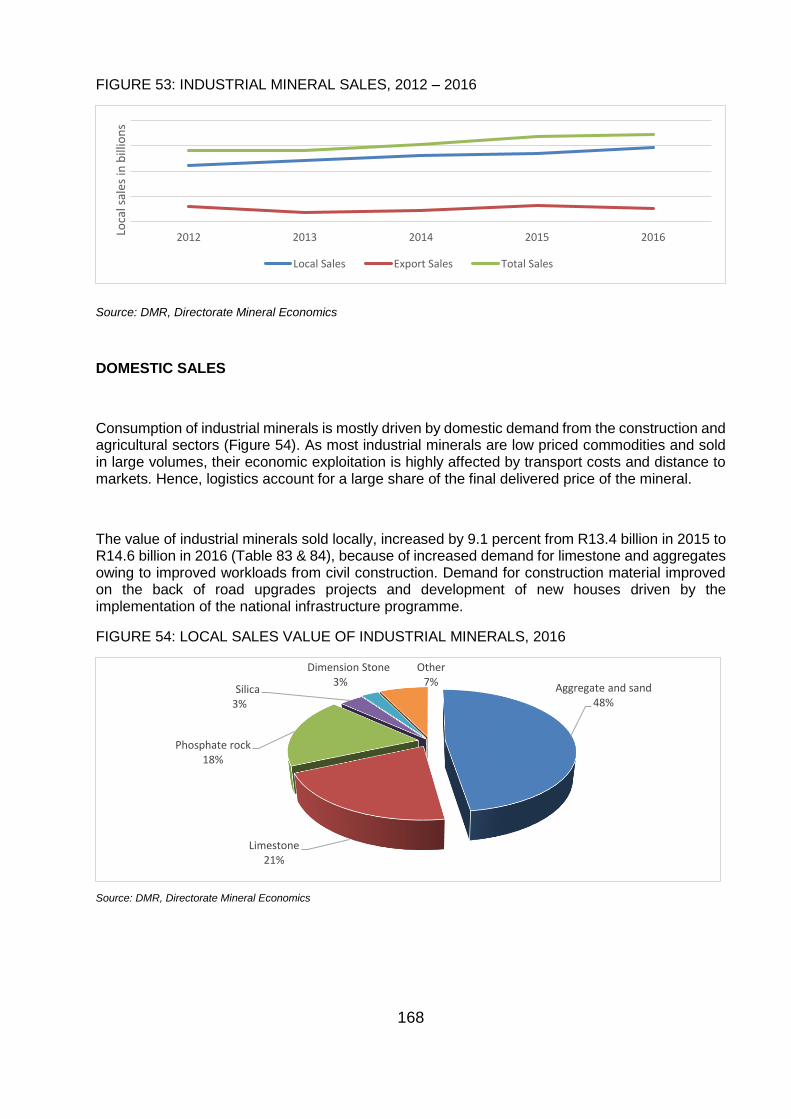
168
FIGURE 53: INDUSTRIAL MINERAL SALES, 2012 – 2016
Source: DMR, Directorate Mineral Economics
DOMESTIC SALES
Consumption of industrial minerals is mostly driven by domestic demand from the construction and agricultural sectors (Figure 54). As most industrial minerals are low priced commodities and sold in large volumes, their economic exploitation is highly affected by transport costs and distance to markets. Hence, logistics account for a large share of the final delivered price of the mineral.
The value of industrial minerals sold locally, increased by 9.1 percent from R13.4 billion in 2015 to R14.6 billion in 2016 (Table 83 & 84), because of increased demand for limestone and aggregates owing to improved workloads from civil construction. Demand for construction material improved on the back of road upgrades projects and development of new houses driven by the implementation of the national infrastructure programme.
FIGURE 54: LOCAL SALES VALUE OF INDUSTRIAL MINERALS, 2016
Source: DMR, Directorate Mineral Economics
2012 2013 2014 2015 2016Loca
l sal
es in
bill
ion
s
Local Sales Export Sales Total Sales
Aggregate and sand48%
Limestone21%
Phosphate rock18%
Silica 3%
Dimension Stone 3%
Other7%
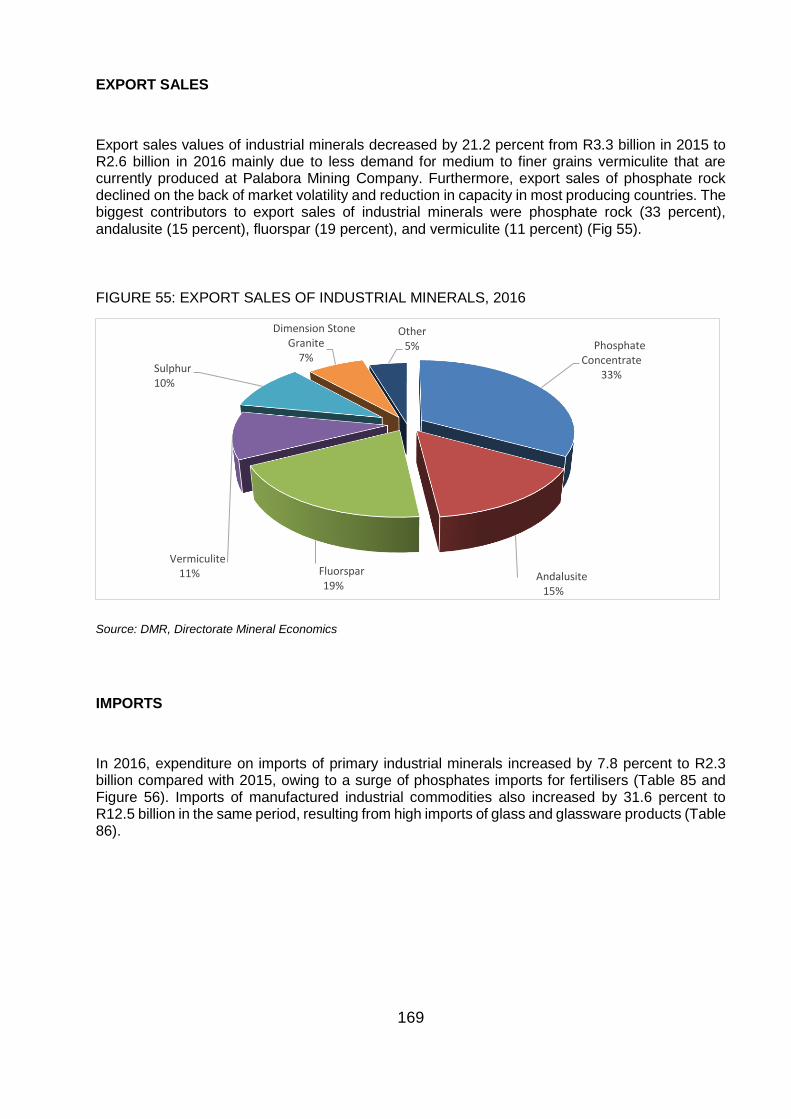
169
EXPORT SALES
Export sales values of industrial minerals decreased by 21.2 percent from R3.3 billion in 2015 to R2.6 billion in 2016 mainly due to less demand for medium to finer grains vermiculite that are currently produced at Palabora Mining Company. Furthermore, export sales of phosphate rock declined on the back of market volatility and reduction in capacity in most producing countries. The biggest contributors to export sales of industrial minerals were phosphate rock (33 percent), andalusite (15 percent), fluorspar (19 percent), and vermiculite (11 percent) (Fig 55).
FIGURE 55: EXPORT SALES OF INDUSTRIAL MINERALS, 2016
Source: DMR, Directorate Mineral Economics
IMPORTS
In 2016, expenditure on imports of primary industrial minerals increased by 7.8 percent to R2.3 billion compared with 2015, owing to a surge of phosphates imports for fertilisers (Table 85 and Figure 56). Imports of manufactured industrial commodities also increased by 31.6 percent to R12.5 billion in the same period, resulting from high imports of glass and glassware products (Table 86).
Phosphate Concentrate
33%
Andalusite 15%
Fluorspar 19%
Vermiculite 11%
Sulphur 10%
Dimension Stone Granite
7%
Other5%
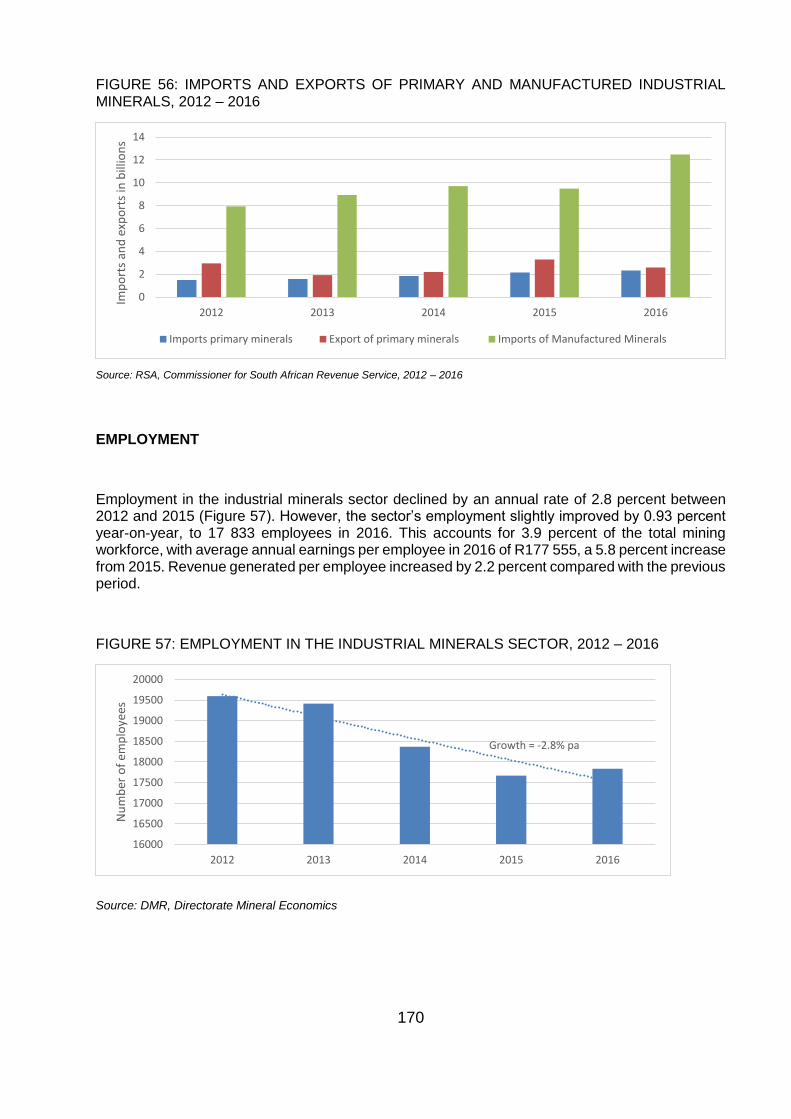
170
FIGURE 56: IMPORTS AND EXPORTS OF PRIMARY AND MANUFACTURED INDUSTRIAL MINERALS, 2012 – 2016
Source: RSA, Commissioner for South African Revenue Service, 2012 – 2016
EMPLOYMENT
Employment in the industrial minerals sector declined by an annual rate of 2.8 percent between 2012 and 2015 (Figure 57). However, the sector’s employment slightly improved by 0.93 percent year-on-year, to 17 833 employees in 2016. This accounts for 3.9 percent of the total mining workforce, with average annual earnings per employee in 2016 of R177 555, a 5.8 percent increase from 2015. Revenue generated per employee increased by 2.2 percent compared with the previous period.
FIGURE 57: EMPLOYMENT IN THE INDUSTRIAL MINERALS SECTOR, 2012 – 2016
Source: DMR, Directorate Mineral Economics
0
2
4
6
8
10
12
14
2012 2013 2014 2015 2016
Imp
ort
s an
d e
xpo
rts
in b
illio
ns
Imports primary minerals Export of primary minerals Imports of Manufactured Minerals
Growth = -2.8% pa
16000
16500
17000
17500
18000
18500
19000
19500
20000
2012 2013 2014 2015 2016
Nu
mb
er o
f em
plo
yees
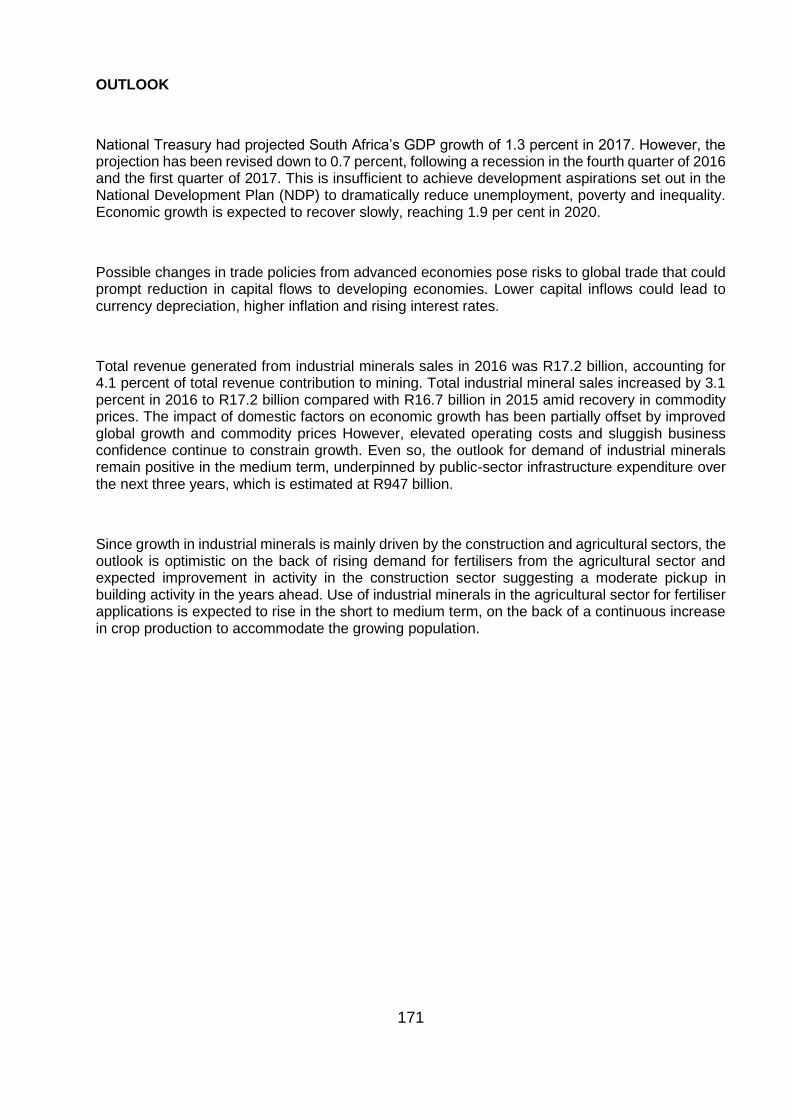
171
OUTLOOK
National Treasury had projected South Africa’s GDP growth of 1.3 percent in 2017. However, the projection has been revised down to 0.7 percent, following a recession in the fourth quarter of 2016 and the first quarter of 2017. This is insufficient to achieve development aspirations set out in the National Development Plan (NDP) to dramatically reduce unemployment, poverty and inequality. Economic growth is expected to recover slowly, reaching 1.9 per cent in 2020.
Possible changes in trade policies from advanced economies pose risks to global trade that could prompt reduction in capital flows to developing economies. Lower capital inflows could lead to currency depreciation, higher inflation and rising interest rates.
Total revenue generated from industrial minerals sales in 2016 was R17.2 billion, accounting for 4.1 percent of total revenue contribution to mining. Total industrial mineral sales increased by 3.1 percent in 2016 to R17.2 billion compared with R16.7 billion in 2015 amid recovery in commodity prices. The impact of domestic factors on economic growth has been partially offset by improved global growth and commodity prices However, elevated operating costs and sluggish business confidence continue to constrain growth. Even so, the outlook for demand of industrial minerals remain positive in the medium term, underpinned by public-sector infrastructure expenditure over the next three years, which is estimated at R947 billion.
Since growth in industrial minerals is mainly driven by the construction and agricultural sectors, the outlook is optimistic on the back of rising demand for fertilisers from the agricultural sector and expected improvement in activity in the construction sector suggesting a moderate pickup in building activity in the years ahead. Use of industrial minerals in the agricultural sector for fertiliser applications is expected to rise in the short to medium term, on the back of a continuous increase in crop production to accommodate the growing population.
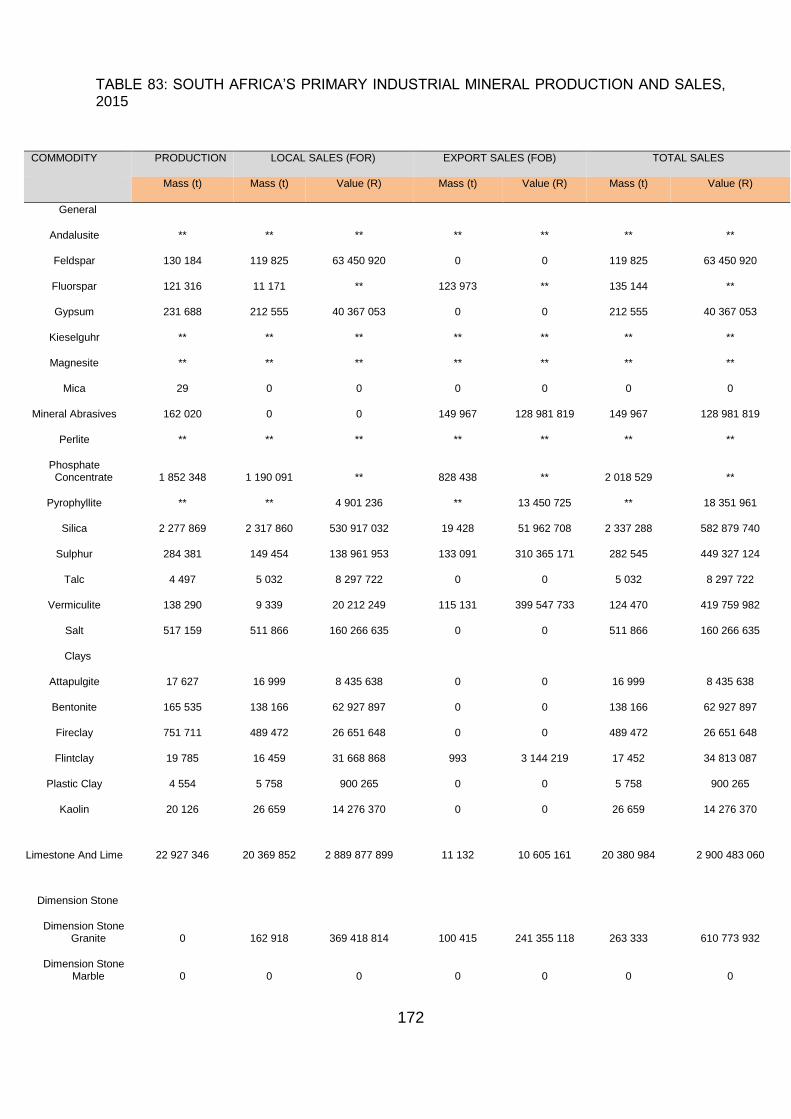
172
TABLE 83: SOUTH AFRICA’S PRIMARY INDUSTRIAL MINERAL PRODUCTION AND SALES, 2015
COMMODITY PRODUCTION LOCAL SALES (FOR) EXPORT SALES (FOB) TOTAL SALES
Mass (t) Mass (t) Value (R) Mass (t) Value (R) Mass (t) Value (R)
General
Andalusite ** ** ** ** ** ** **
Feldspar 130 184 119 825 63 450 920 0 0 119 825 63 450 920
Fluorspar 121 316 11 171 ** 123 973 ** 135 144 **
Gypsum 231 688 212 555 40 367 053 0 0 212 555 40 367 053
Kieselguhr ** ** ** ** ** ** **
Magnesite ** ** ** ** ** ** **
Mica 29 0 0 0 0 0 0
Mineral Abrasives 162 020 0 0 149 967 128 981 819 149 967 128 981 819
Perlite ** ** ** ** ** ** **
Phosphate Concentrate 1 852 348 1 190 091 ** 828 438 ** 2 018 529 **
Pyrophyllite ** ** 4 901 236 ** 13 450 725 ** 18 351 961
Silica 2 277 869 2 317 860 530 917 032 19 428 51 962 708 2 337 288 582 879 740
Sulphur 284 381 149 454 138 961 953 133 091 310 365 171 282 545 449 327 124
Talc 4 497 5 032 8 297 722 0 0 5 032 8 297 722
Vermiculite 138 290 9 339 20 212 249 115 131 399 547 733 124 470 419 759 982
Salt 517 159 511 866 160 266 635 0 0 511 866 160 266 635
Clays
Attapulgite 17 627 16 999 8 435 638 0 0 16 999 8 435 638
Bentonite 165 535 138 166 62 927 897 0 0 138 166 62 927 897
Fireclay 751 711 489 472 26 651 648 0 0 489 472 26 651 648
Flintclay 19 785 16 459 31 668 868 993 3 144 219 17 452 34 813 087
Plastic Clay 4 554 5 758 900 265 0 0 5 758 900 265
Kaolin 20 126 26 659 14 276 370 0 0 26 659 14 276 370
Limestone And Lime 22 927 346 20 369 852 2 889 877 899 11 132 10 605 161 20 380 984 2 900 483 060
Dimension Stone
Dimension Stone
Granite 0 162 918 369 418 814 100 415 241 355 118 263 333 610 773 932
Dimension Stone Marble 0 0 0 0 0 0 0
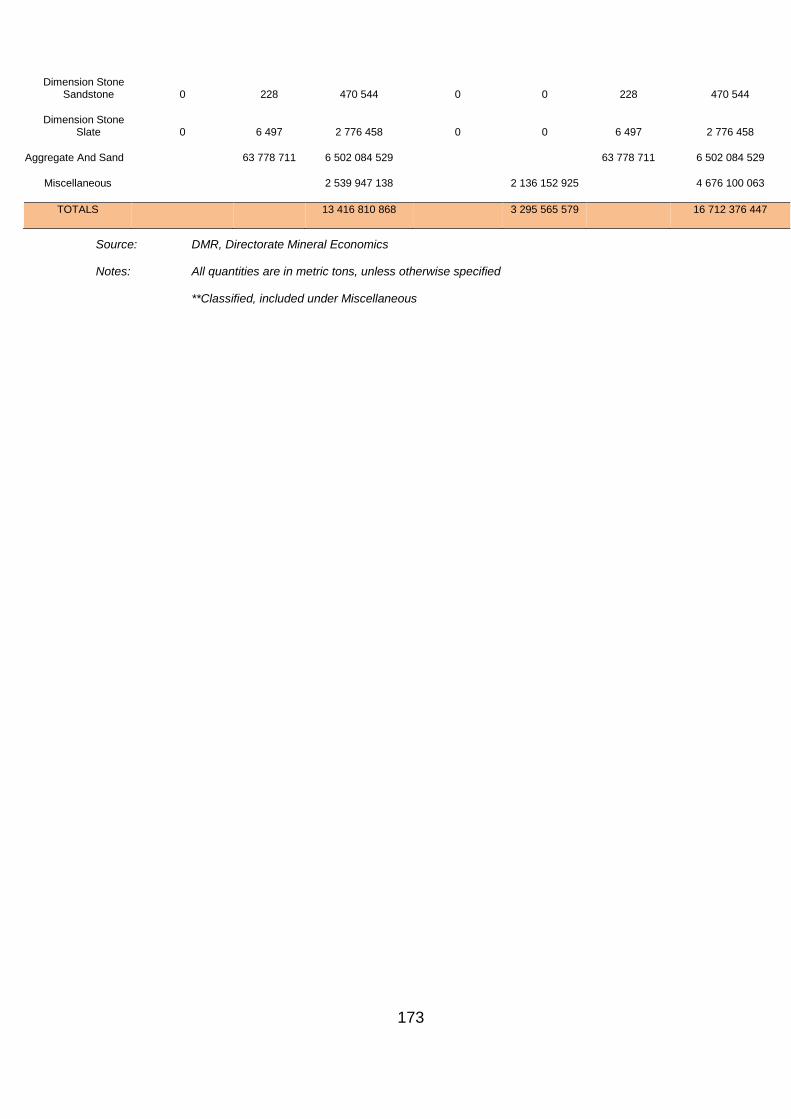
173
Dimension Stone Sandstone 0 228 470 544 0 0 228 470 544
Dimension Stone Slate 0 6 497 2 776 458 0 0 6 497 2 776 458
Aggregate And Sand
63 778 711 6 502 084 529
63 778 711 6 502 084 529
Miscellaneous
2 539 947 138
2 136 152 925
4 676 100 063
TOTALS
13 416 810 868
3 295 565 579
16 712 376 447
Source: DMR, Directorate Mineral Economics
Notes: All quantities are in metric tons, unless otherwise specified
**Classified, included under Miscellaneous
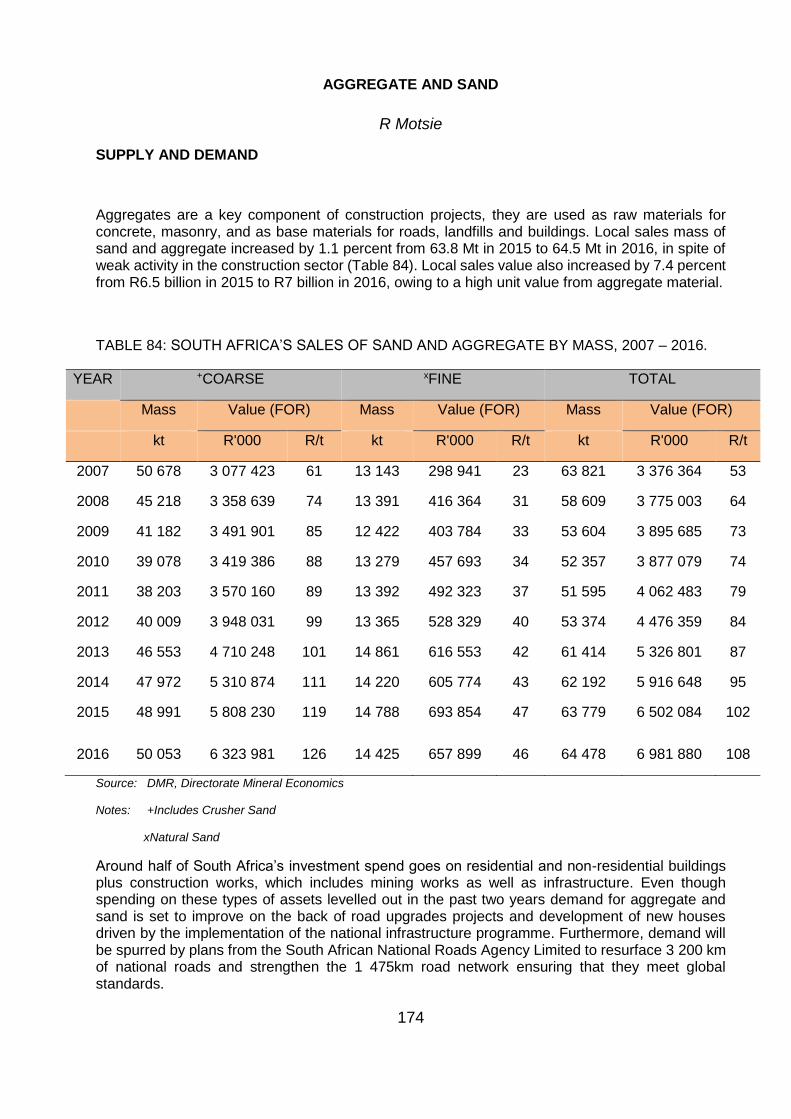
174
AGGREGATE AND SAND
R Motsie
SUPPLY AND DEMAND
Aggregates are a key component of construction projects, they are used as raw materials for concrete, masonry, and as base materials for roads, landfills and buildings. Local sales mass of sand and aggregate increased by 1.1 percent from 63.8 Mt in 2015 to 64.5 Mt in 2016, in spite of weak activity in the construction sector (Table 84). Local sales value also increased by 7.4 percent from R6.5 billion in 2015 to R7 billion in 2016, owing to a high unit value from aggregate material.
TABLE 84: SOUTH AFRICA’S SALES OF SAND AND AGGREGATE BY MASS, 2007 – 2016.
YEAR +COARSE xFINE TOTAL
Mass Value (FOR) Mass Value (FOR) Mass Value (FOR)
kt R'000 R/t kt R'000 R/t kt R'000 R/t
2007 50 678 3 077 423 61 13 143 298 941 23 63 821 3 376 364 53
2008 45 218 3 358 639 74 13 391 416 364 31 58 609 3 775 003 64
2009 41 182 3 491 901 85 12 422 403 784 33 53 604 3 895 685 73
2010 39 078 3 419 386 88 13 279 457 693 34 52 357 3 877 079 74
2011 38 203 3 570 160 89 13 392 492 323 37 51 595 4 062 483 79
2012 40 009 3 948 031 99 13 365 528 329 40 53 374 4 476 359 84
2013 46 553 4 710 248 101 14 861 616 553 42 61 414 5 326 801 87
2014 47 972 5 310 874 111 14 220 605 774 43 62 192 5 916 648 95
2015 48 991 5 808 230 119 14 788 693 854 47 63 779 6 502 084 102
2016 50 053 6 323 981 126 14 425 657 899 46 64 478 6 981 880 108
Source: DMR, Directorate Mineral Economics
Notes: +Includes Crusher Sand
xNatural Sand
Around half of South Africa’s investment spend goes on residential and non-residential buildings plus construction works, which includes mining works as well as infrastructure. Even though spending on these types of assets levelled out in the past two years demand for aggregate and sand is set to improve on the back of road upgrades projects and development of new houses driven by the implementation of the national infrastructure programme. Furthermore, demand will be spurred by plans from the South African National Roads Agency Limited to resurface 3 200 km of national roads and strengthen the 1 475km road network ensuring that they meet global standards.
175
DEVELOPMENTS
In March 2016, Afrimat acquired 100 percent of the issued ordinary shares of lime and associated products producer, Cape Lime Proprietary Limited (Cape Lime). The acquisition became unconditional following regulatory approval. Cape lime is well known for providing exceptional quality mineral products, such as dolomitic aggregate, dolomitic agricultural lime, white lime, etc. The purchase will complement and expand Afrimat’s industrial minerals product. The company also entered into an agreement with Wearne on 6 July 2016 to purchase the Bethlehem quarry, Bethlehem property and ancillary businesses as a going concern for R30,0 million with an effective date of 17 October 2016. The company has also embarked on Greenfield projects in Mpumalanga and KwaZulu-Natal in line with its business strategy to diversify.
In May 2016, the Eastern Cape Development (ECDC) unveiled a R200 million quarry aggregate mine with estimated lifespan of 30 years. The quarry is situated in Indwe which is 120 km outside Queenstown in the Eastern Cape. The quarry has provided some relief to the high unemployment rates in the area and it employs 40 permanent staff from the surrounding communities. The quarry has secured two off-take agreements already and is in negotiation with the local municipality to supply material for 1 500 RDP houses and several companies in road construction.
PRICES AND REVENUE
Average unit value for aggregates increased by 5.9 percent to 126 R/t in 2016, while the unit value for sand declined by 2.1 percent to 46 R/t (Table 84). Aggregate sales value improved on the back of increased volumes resulting in an 8.9 percent rise in revenue of R6.3 billion. Sales value for sand decreased by 5.2 percent recording a revenue of R657 million as a result of lower volumes traded compared with the previous year.
EMPLOYMENT
Employment in the sand and aggregate sector increased by 1.7 percent from 7 452 employees in 2015 to 7 578 employees in 2016 (Table 85). Labour productivity slightly decreased by 0.6 percent from 8.56 kt/employee in 2015 to 8.51 kt/employee in 2016. Revenue generated per employee increased by 5.6 percent to R921 335/employee. Average annual earnings increased by 5.3 percent from R148 788/employee in 2015 to R156 594/employee in 2016.
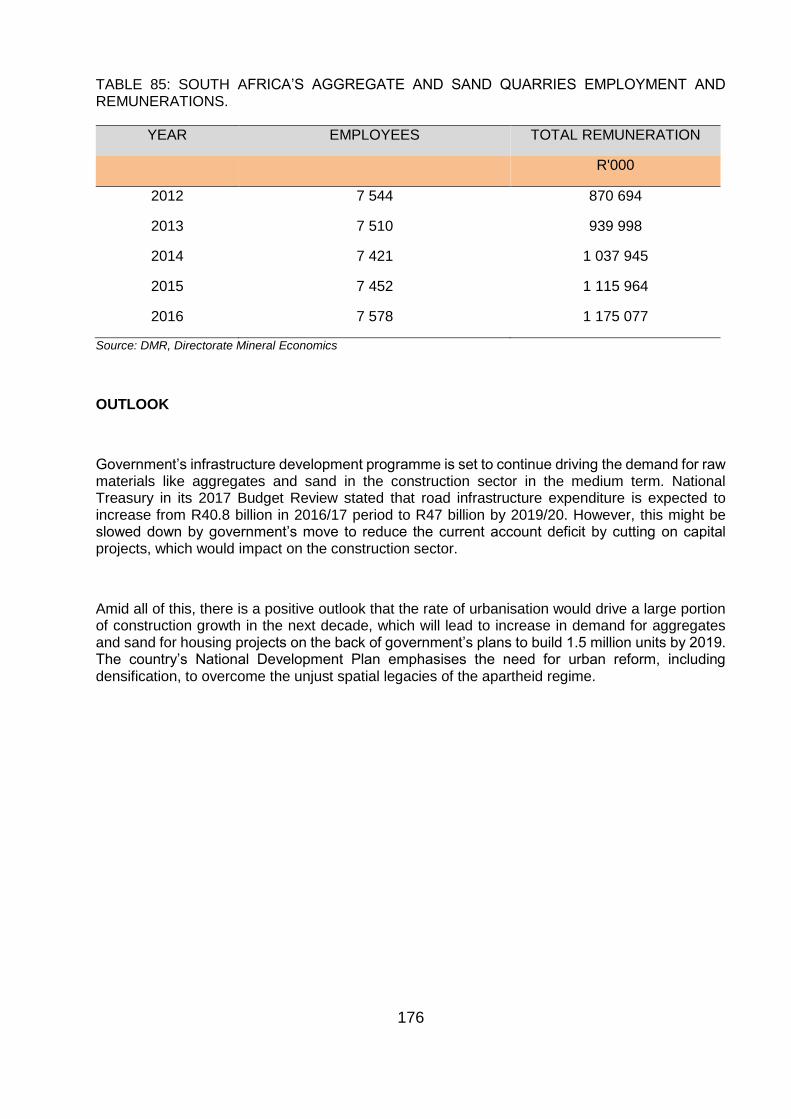
176
TABLE 85: SOUTH AFRICA’S AGGREGATE AND SAND QUARRIES EMPLOYMENT AND REMUNERATIONS.
YEAR EMPLOYEES TOTAL REMUNERATION
R'000
2012 7 544 870 694
2013 7 510 939 998
2014 7 421 1 037 945
2015 7 452 1 115 964
2016 7 578 1 175 077
Source: DMR, Directorate Mineral Economics
OUTLOOK
Government’s infrastructure development programme is set to continue driving the demand for raw materials like aggregates and sand in the construction sector in the medium term. National Treasury in its 2017 Budget Review stated that road infrastructure expenditure is expected to increase from R40.8 billion in 2016/17 period to R47 billion by 2019/20. However, this might be slowed down by government’s move to reduce the current account deficit by cutting on capital projects, which would impact on the construction sector.
Amid all of this, there is a positive outlook that the rate of urbanisation would drive a large portion of construction growth in the next decade, which will lead to increase in demand for aggregates and sand for housing projects on the back of government’s plans to build 1.5 million units by 2019. The country’s National Development Plan emphasises the need for urban reform, including densification, to overcome the unjust spatial legacies of the apartheid regime.
177
REFERENCES
1. Afrimat, Reviewed Condensed Consolidated Provisional Financial Results for year ended 28 February 2017.
2. DMR, Directorate Mineral Economics 3. Engineering News, ECDC unveils new quarry venture, May 2016 4. National Treasury, Budget Review, 2017. 5. SAFCEC Annual report 2015/2016 6. The Real Economy Bulletin, Trends, Development and Data, 3rd Quarter 2017
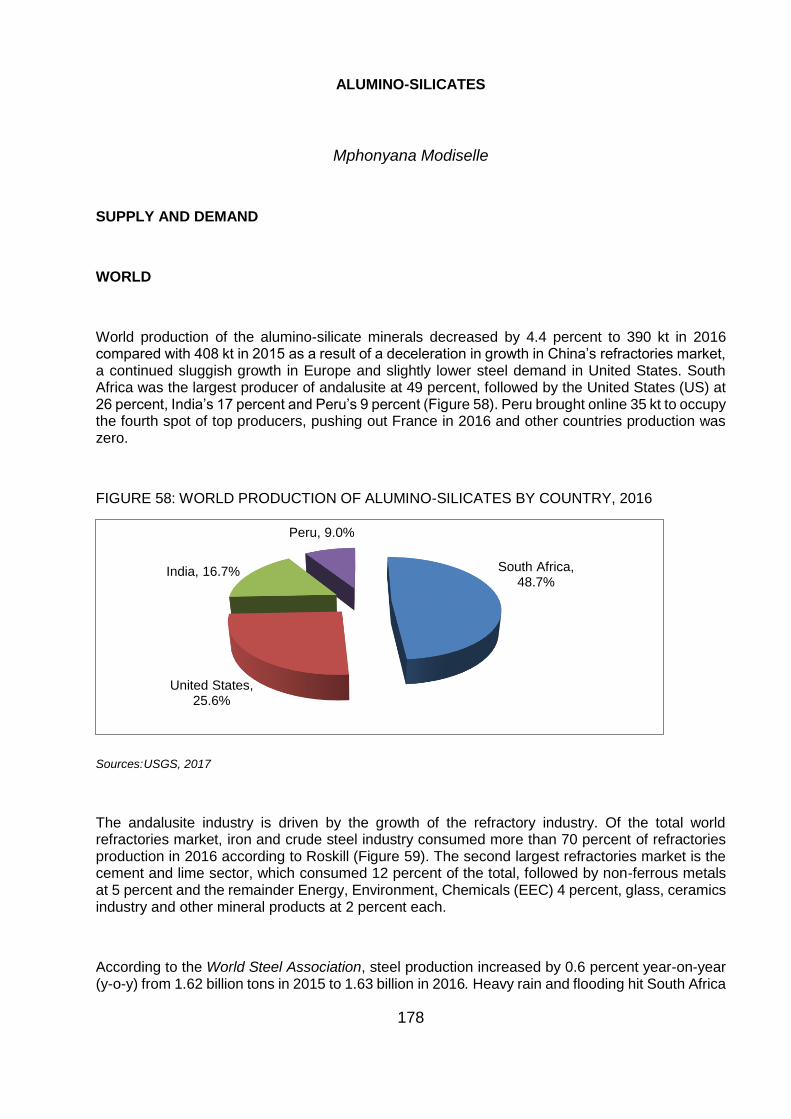
178
ALUMINO-SILICATES
Mphonyana Modiselle
SUPPLY AND DEMAND
WORLD
World production of the alumino-silicate minerals decreased by 4.4 percent to 390 kt in 2016 compared with 408 kt in 2015 as a result of a deceleration in growth in China’s refractories market, a continued sluggish growth in Europe and slightly lower steel demand in United States. South Africa was the largest producer of andalusite at 49 percent, followed by the United States (US) at 26 percent, India’s 17 percent and Peru’s 9 percent (Figure 58). Peru brought online 35 kt to occupy the fourth spot of top producers, pushing out France in 2016 and other countries production was zero.
FIGURE 58: WORLD PRODUCTION OF ALUMINO-SILICATES BY COUNTRY, 2016
Sources: USGS, 2017
The andalusite industry is driven by the growth of the refractory industry. Of the total world refractories market, iron and crude steel industry consumed more than 70 percent of refractories production in 2016 according to Roskill (Figure 59). The second largest refractories market is the cement and lime sector, which consumed 12 percent of the total, followed by non-ferrous metals at 5 percent and the remainder Energy, Environment, Chemicals (EEC) 4 percent, glass, ceramics industry and other mineral products at 2 percent each.
According to the World Steel Association, steel production increased by 0.6 percent year-on-year (y-o-y) from 1.62 billion tons in 2015 to 1.63 billion in 2016. Heavy rain and flooding hit South Africa
South Africa, 48.7%
United States, 25.6%
India, 16.7%
Peru, 9.0%
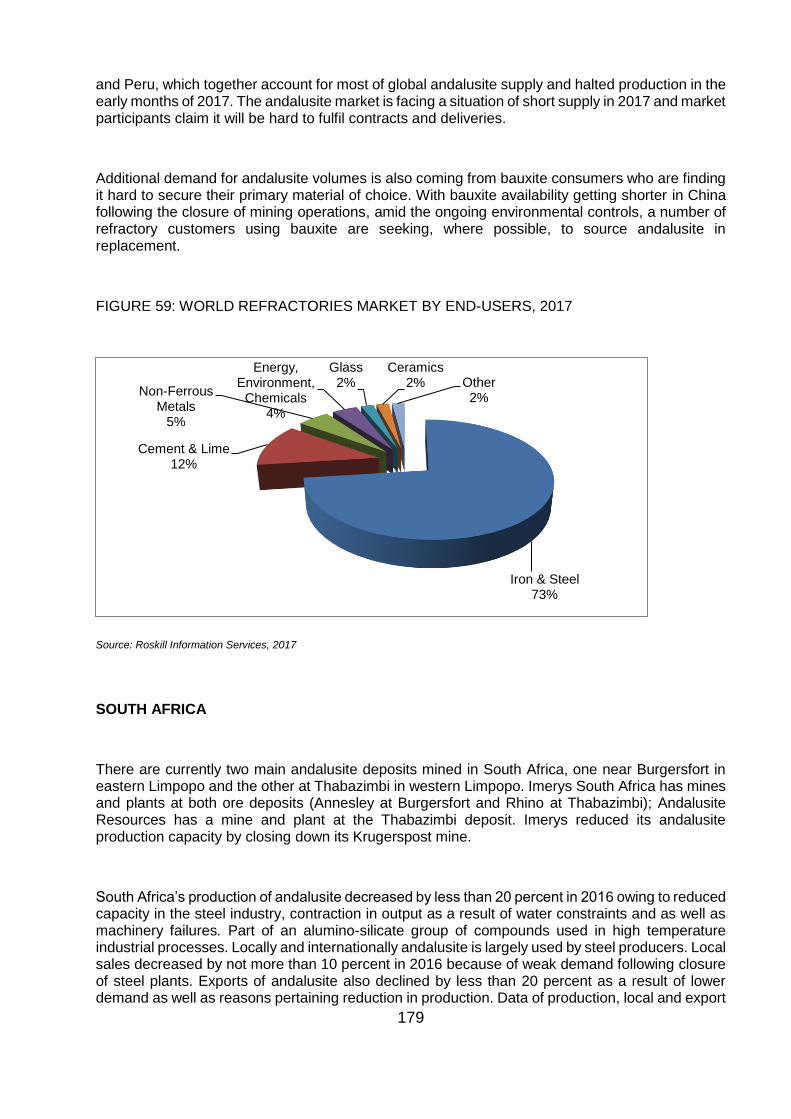
179
and Peru, which together account for most of global andalusite supply and halted production in the early months of 2017. The andalusite market is facing a situation of short supply in 2017 and market participants claim it will be hard to fulfil contracts and deliveries.
Additional demand for andalusite volumes is also coming from bauxite consumers who are finding it hard to secure their primary material of choice. With bauxite availability getting shorter in China following the closure of mining operations, amid the ongoing environmental controls, a number of refractory customers using bauxite are seeking, where possible, to source andalusite in replacement.
FIGURE 59: WORLD REFRACTORIES MARKET BY END-USERS, 2017
Source: Roskill Information Services, 2017
SOUTH AFRICA
There are currently two main andalusite deposits mined in South Africa, one near Burgersfort in eastern Limpopo and the other at Thabazimbi in western Limpopo. Imerys South Africa has mines and plants at both ore deposits (Annesley at Burgersfort and Rhino at Thabazimbi); Andalusite Resources has a mine and plant at the Thabazimbi deposit. Imerys reduced its andalusite production capacity by closing down its Krugerspost mine.
South Africa’s production of andalusite decreased by less than 20 percent in 2016 owing to reduced capacity in the steel industry, contraction in output as a result of water constraints and as well as machinery failures. Part of an alumino-silicate group of compounds used in high temperature industrial processes. Locally and internationally andalusite is largely used by steel producers. Local sales decreased by not more than 10 percent in 2016 because of weak demand following closure of steel plants. Exports of andalusite also declined by less than 20 percent as a result of lower demand as well as reasons pertaining reduction in production. Data of production, local and export
Iron & Steel73%
Cement & Lime12%
Non-Ferrous Metals
5%
Energy, Environment,
Chemicals4%
Glass2%
Ceramics2% Other
2%
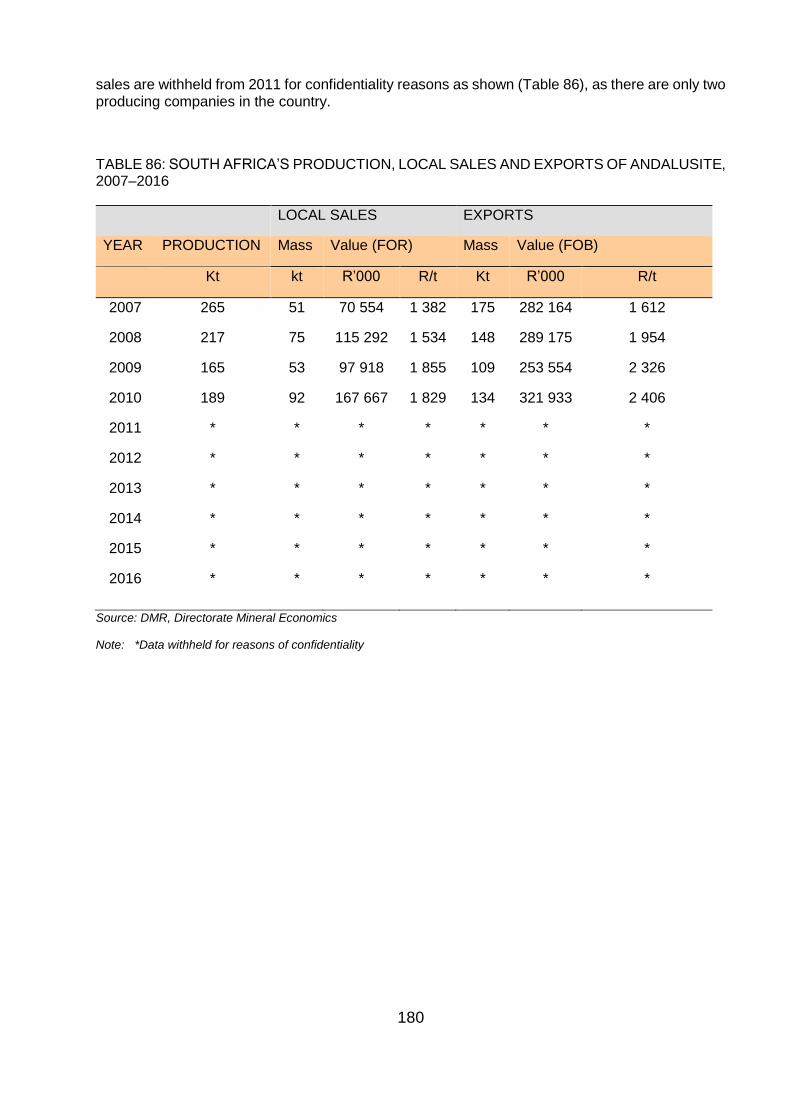
180
sales are withheld from 2011 for confidentiality reasons as shown (Table 86), as there are only two producing companies in the country.
TABLE 86: SOUTH AFRICA’S PRODUCTION, LOCAL SALES AND EXPORTS OF ANDALUSITE, 2007–2016
LOCAL SALES EXPORTS
YEAR PRODUCTION Mass Value (FOR) Mass Value (FOB)
Kt kt R’000 R/t Kt R’000 R/t
2007 265 51 70 554 1 382 175 282 164 1 612
2008 217 75 115 292 1 534 148 289 175 1 954
2009 165 53 97 918 1 855 109 253 554 2 326
2010 189 92 167 667 1 829 134 321 933 2 406
2011 * * * * * * *
2012 * * * * * * *
2013 * * * * * * *
2014
2015
2016
*
*
*
*
*
*
*
*
*
*
*
*
*
*
*
*
*
*
*
*
*
Source: DMR, Directorate Mineral Economics
Note: *Data withheld for reasons of confidentiality
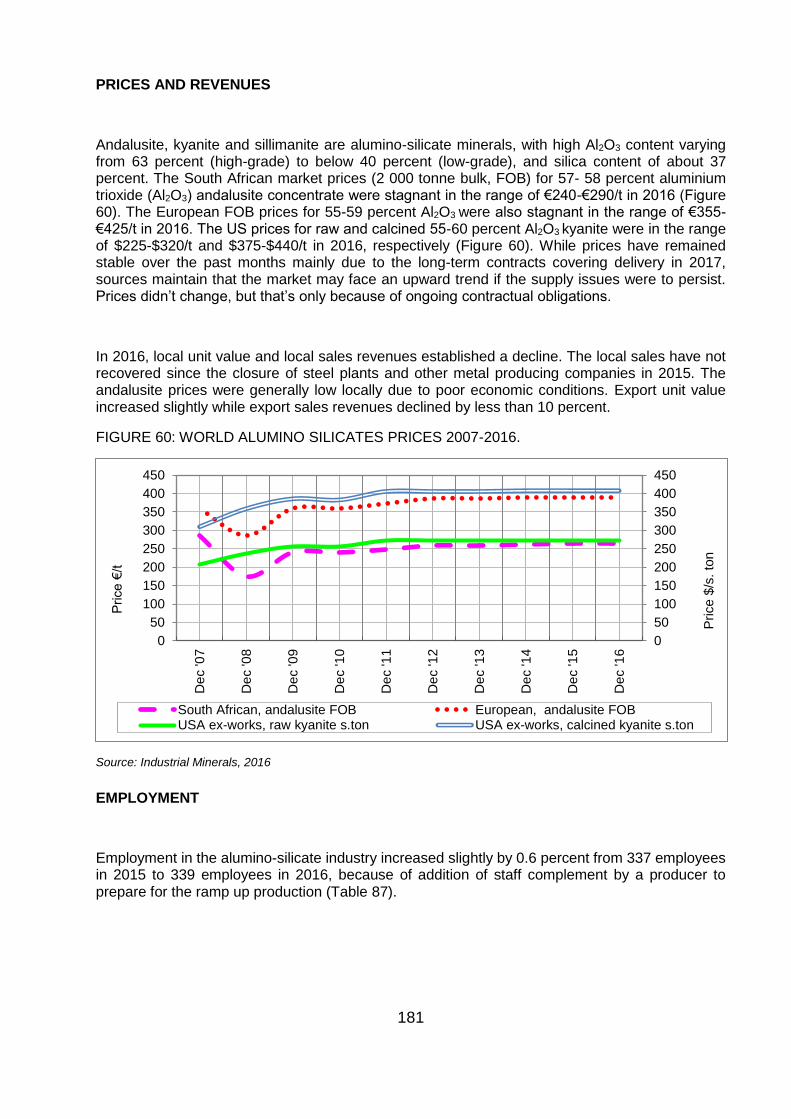
181
PRICES AND REVENUES
Andalusite, kyanite and sillimanite are alumino-silicate minerals, with high Al2O3 content varying from 63 percent (high-grade) to below 40 percent (low-grade), and silica content of about 37 percent. The South African market prices (2 000 tonne bulk, FOB) for 57- 58 percent aluminium trioxide (Al2O3) andalusite concentrate were stagnant in the range of €240-€290/t in 2016 (Figure 60). The European FOB prices for 55-59 percent Al2O3 were also stagnant in the range of €355-€425/t in 2016. The US prices for raw and calcined 55-60 percent Al2O3 kyanite were in the range of $225-$320/t and $375-$440/t in 2016, respectively (Figure 60). While prices have remained stable over the past months mainly due to the long-term contracts covering delivery in 2017, sources maintain that the market may face an upward trend if the supply issues were to persist. Prices didn’t change, but that’s only because of ongoing contractual obligations.
In 2016, local unit value and local sales revenues established a decline. The local sales have not recovered since the closure of steel plants and other metal producing companies in 2015. The andalusite prices were generally low locally due to poor economic conditions. Export unit value increased slightly while export sales revenues declined by less than 10 percent.
FIGURE 60: WORLD ALUMINO SILICATES PRICES 2007-2016.
Source: Industrial Minerals, 2016
EMPLOYMENT
Employment in the alumino-silicate industry increased slightly by 0.6 percent from 337 employees in 2015 to 339 employees in 2016, because of addition of staff complement by a producer to prepare for the ramp up production (Table 87).
0
50
100
150
200
250
300
350
400
450
0
50
100
150
200
250
300
350
400
450
De
c '0
7
De
c '0
8
De
c '0
9
De
c '1
0
De
c '1
1
De
c '1
2
De
c '1
3
De
c '1
4
De
c '1
5
De
c '1
6
Price $
/s. to
n
Price €
/t
South African, andalusite FOB European, andalusite FOBUSA ex-works, raw kyanite s.ton USA ex-works, calcined kyanite s.ton
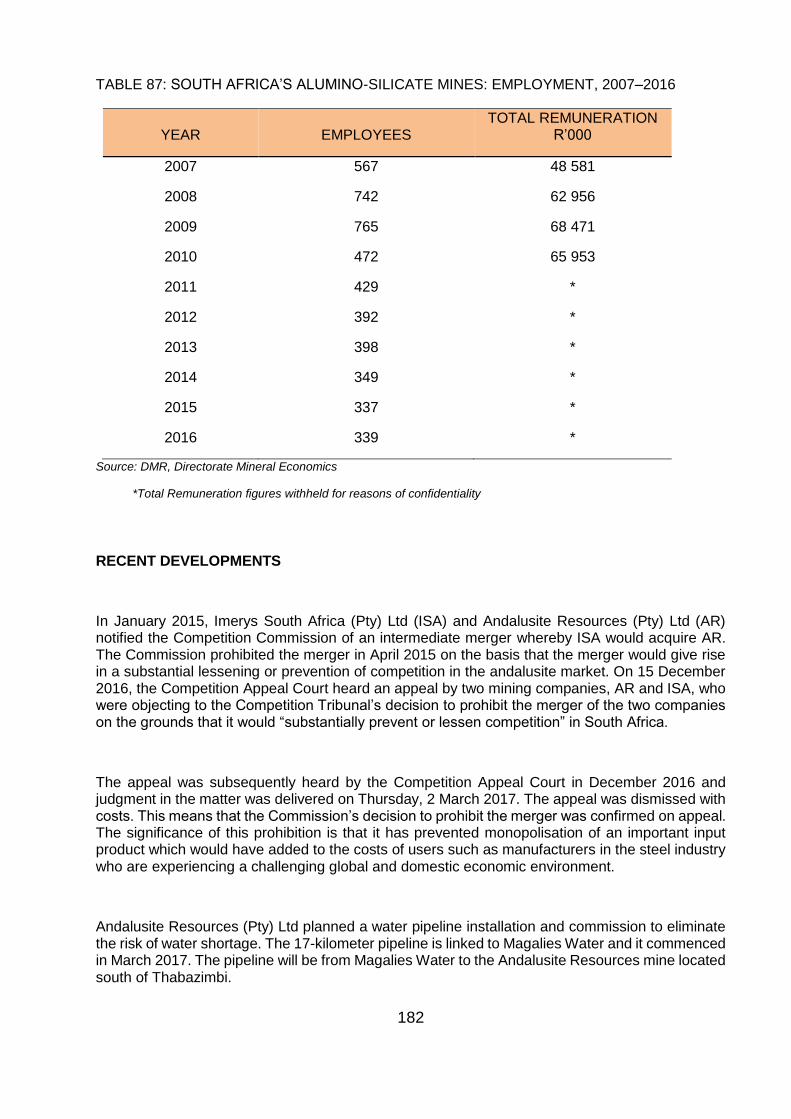
182
TABLE 87: SOUTH AFRICA’S ALUMINO-SILICATE MINES: EMPLOYMENT, 2007–2016
YEAR EMPLOYEES TOTAL REMUNERATION
R’000
2007 567 48 581
2008 742 62 956
2009 765 68 471
2010 472 65 953
2011 429 *
2012 392 *
2013
2014
2015
2016
398
349
337
339
*
*
*
*
Source: DMR, Directorate Mineral Economics
*Total Remuneration figures withheld for reasons of confidentiality
RECENT DEVELOPMENTS
In January 2015, Imerys South Africa (Pty) Ltd (ISA) and Andalusite Resources (Pty) Ltd (AR) notified the Competition Commission of an intermediate merger whereby ISA would acquire AR. The Commission prohibited the merger in April 2015 on the basis that the merger would give rise in a substantial lessening or prevention of competition in the andalusite market. On 15 December 2016, the Competition Appeal Court heard an appeal by two mining companies, AR and ISA, who were objecting to the Competition Tribunal’s decision to prohibit the merger of the two companies on the grounds that it would “substantially prevent or lessen competition” in South Africa.
The appeal was subsequently heard by the Competition Appeal Court in December 2016 and judgment in the matter was delivered on Thursday, 2 March 2017. The appeal was dismissed with costs. This means that the Commission’s decision to prohibit the merger was confirmed on appeal. The significance of this prohibition is that it has prevented monopolisation of an important input product which would have added to the costs of users such as manufacturers in the steel industry who are experiencing a challenging global and domestic economic environment.
Andalusite Resources (Pty) Ltd planned a water pipeline installation and commission to eliminate the risk of water shortage. The 17-kilometer pipeline is linked to Magalies Water and it commenced in March 2017. The pipeline will be from Magalies Water to the Andalusite Resources mine located south of Thabazimbi.
183
OUTLOOK
The gap between andalusite demand and supply is widening. The beginning of 2017, saw andalusite producers struggle with the heavy rains and floods, affecting operations in mining areas. On the other side globally, Chinese government closed several bauxite mines, this then pushed up the demand of andalusite as bauxite is being used as a substitute for andalusite. For some specific refractory applications, bauxite can be swapped with andalusite. Since bauxite is getting expensive and short in supply, customers are trying to shift to andalusite, and this will likely lead to additional demand, either from new customers or from existing customers asking for higher volumes.
Andalusite outlook is positive in the short-term, due to a large increase in the world demand partially as a result of recovery in the world economy and an increase in steel production, especially in China. Another opportunity which may boost demand may arise owing to higher prices and lower availability for competing raw materials. While andalusite has been characterised by broad balance between supply and demand in recent years, the coming months or years appear to be holding availability issues for customers.
If the developed economies continue along the present pathway toward full recovery from the subdued economic conditions, opportunities are likely to abound for expanding refractory markets, especially in the steel production, construction and infrastructure development sectors.
REFERENCES
1. Arnold O. Tanner, Kyanite and Related Materials Review, USGS 2017 2. Cecil Naude, Andalusite Resources Pty Ltd, Personal communication 3. Competition Commission, Andalusite-Media-Release-Final, 3 March 2017 4. Competition Commission, Competition Alert, 12 April 2017 5. Competition Tribunal South Africa, Competition Tribunal prohibits merger between Imerys
South Africa (Pty) Limited and Andalusite Resources (Pty) Limited website: http://www.comptrib.co.za/publications/press-releases/competition-tribunal-prohibits-merger-between-imerys-south-africa-pty-limited-and-andalusite-resources-pty-limited/...accessed 2017/07/24
6. Competition Tribunal South Africa, Mining merger appeal is to be heard by the Competition Appeal Court website: http://www.comptrib.co.za/publications/press-releases/mining-merger-appeal-is-to-be-heard-by-the-competition-appeal-court/…accessed 2017/07/24
7. DMR, Directorate Mineral Economics
8. Industrial Minerals, 2016-2017. 9. Industrial Mineral Forum & Research (IMFORMED), 2017, Imerys appeal
dismissed: Andalusite Resources merger prohibition stands, website: imformed.com/imerys-appeal-dismissed-andalusite-resources-merger-prohibition-stands/…accessed 2017/07/24
10. Industrial Mineral Forum & Research (IMFORMED), 2017, Imerys merger with Andalusite Resources prohibited website: https://imformed.com/imerys-merger-with-andalusite-resources-prohibited..accessed accessed 2017/07/24
184
11. Mining Weekly, Competition Appeal Court upholds Tribunal’s prohibition of Imerys, Andalusite merger website: http://www.miningweekly.com/article/competition-appeal-court-upholds-tribunals-prohibition-of-imerys-andalusite-merger-2017-03-03
12. Saflii, 2017, In the Competition Appeal Court In the matter between…website: http://www.saflii.org/za/cases/ZACAC/2017/1.pdf…accessed 2017/08/17
13. Willie Nicklin, Samrec Pty Ltd, Personal communication
14. World Steel Association, World Steel in Figures 2017
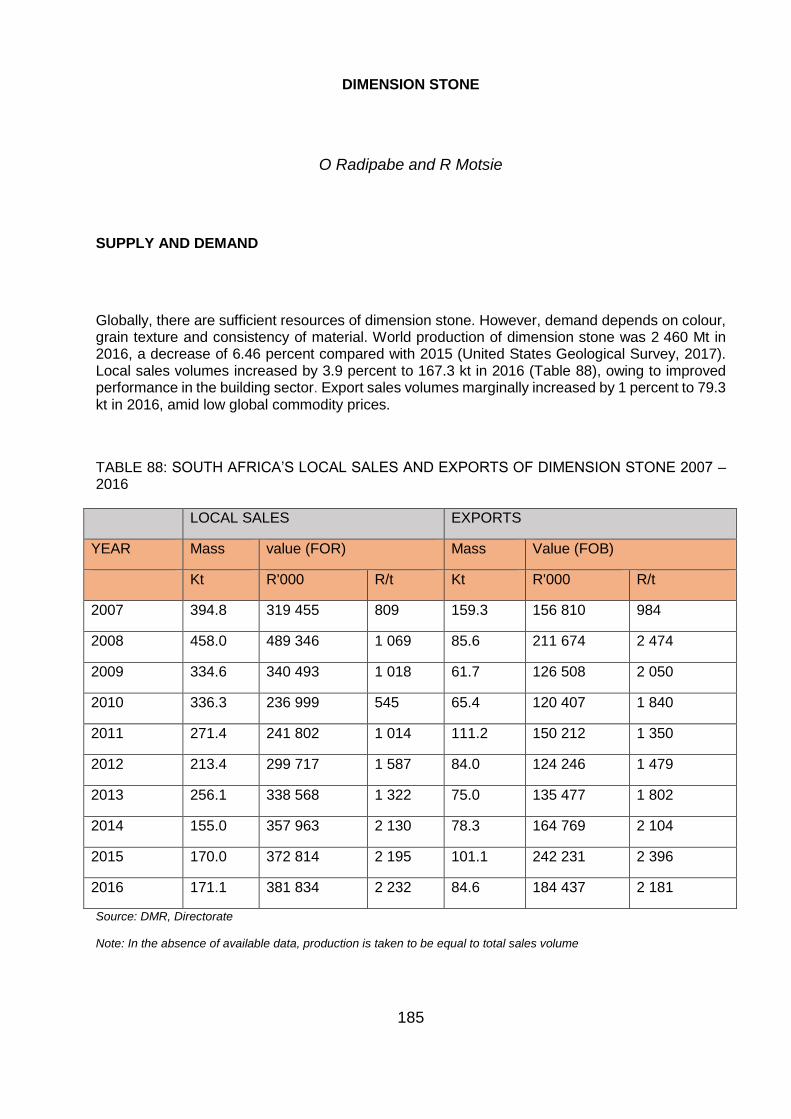
185
DIMENSION STONE
O Radipabe and R Motsie
SUPPLY AND DEMAND
Globally, there are sufficient resources of dimension stone. However, demand depends on colour, grain texture and consistency of material. World production of dimension stone was 2 460 Mt in 2016, a decrease of 6.46 percent compared with 2015 (United States Geological Survey, 2017). Local sales volumes increased by 3.9 percent to 167.3 kt in 2016 (Table 88), owing to improved performance in the building sector. Export sales volumes marginally increased by 1 percent to 79.3 kt in 2016, amid low global commodity prices.
TABLE 88: SOUTH AFRICA’S LOCAL SALES AND EXPORTS OF DIMENSION STONE 2007 – 2016
LOCAL SALES EXPORTS
YEAR Mass value (FOR) Mass Value (FOB)
Kt R'000 R/t Kt R'000 R/t
2007 394.8 319 455 809 159.3 156 810 984
2008 458.0 489 346 1 069 85.6 211 674 2 474
2009 334.6 340 493 1 018 61.7 126 508 2 050
2010 336.3 236 999 545 65.4 120 407 1 840
2011 271.4 241 802 1 014 111.2 150 212 1 350
2012 213.4 299 717 1 587 84.0 124 246 1 479
2013 256.1 338 568 1 322 75.0 135 477 1 802
2014 155.0 357 963 2 130 78.3 164 769 2 104
2015 170.0 372 814 2 195 101.1 242 231 2 396
2016 171.1 381 834 2 232 84.6 184 437 2 181
Source: DMR, Directorate
Note: In the absence of available data, production is taken to be equal to total sales volume
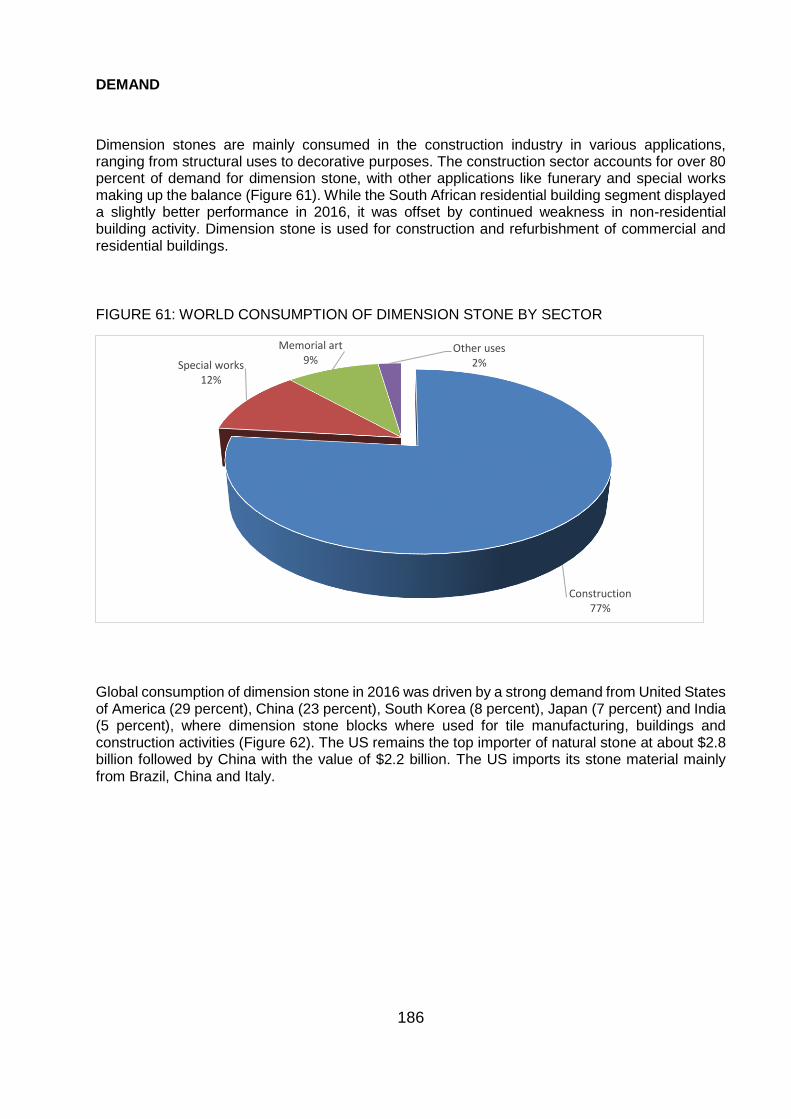
186
DEMAND
Dimension stones are mainly consumed in the construction industry in various applications, ranging from structural uses to decorative purposes. The construction sector accounts for over 80 percent of demand for dimension stone, with other applications like funerary and special works making up the balance (Figure 61). While the South African residential building segment displayed a slightly better performance in 2016, it was offset by continued weakness in non-residential building activity. Dimension stone is used for construction and refurbishment of commercial and residential buildings.
FIGURE 61: WORLD CONSUMPTION OF DIMENSION STONE BY SECTOR
Global consumption of dimension stone in 2016 was driven by a strong demand from United States of America (29 percent), China (23 percent), South Korea (8 percent), Japan (7 percent) and India (5 percent), where dimension stone blocks where used for tile manufacturing, buildings and construction activities (Figure 62). The US remains the top importer of natural stone at about $2.8 billion followed by China with the value of $2.2 billion. The US imports its stone material mainly from Brazil, China and Italy.
Construction77%
Special works12%
Memorial art9%
Other uses2%
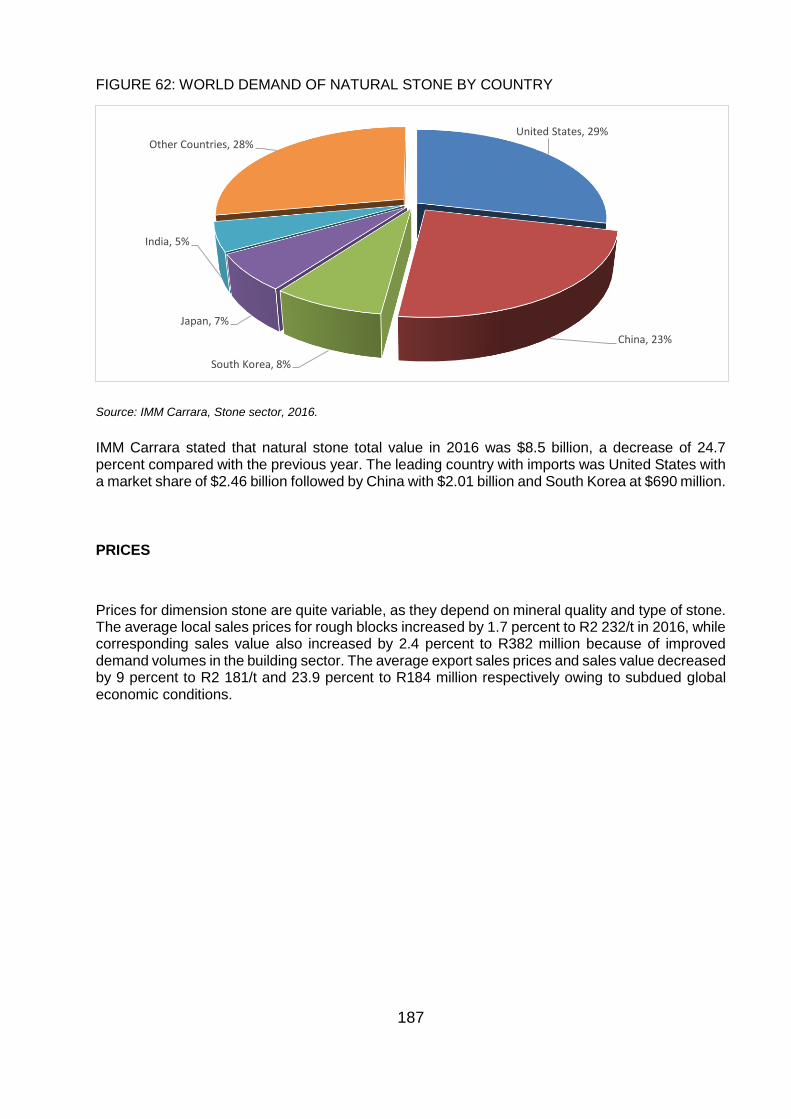
187
FIGURE 62: WORLD DEMAND OF NATURAL STONE BY COUNTRY
Source: IMM Carrara, Stone sector, 2016.
IMM Carrara stated that natural stone total value in 2016 was $8.5 billion, a decrease of 24.7 percent compared with the previous year. The leading country with imports was United States with a market share of $2.46 billion followed by China with $2.01 billion and South Korea at $690 million.
PRICES
Prices for dimension stone are quite variable, as they depend on mineral quality and type of stone. The average local sales prices for rough blocks increased by 1.7 percent to R2 232/t in 2016, while corresponding sales value also increased by 2.4 percent to R382 million because of improved demand volumes in the building sector. The average export sales prices and sales value decreased by 9 percent to R2 181/t and 23.9 percent to R184 million respectively owing to subdued global economic conditions.
United States, 29%
China, 23%
South Korea, 8%
Japan, 7%
India, 5%
Other Countries, 28%
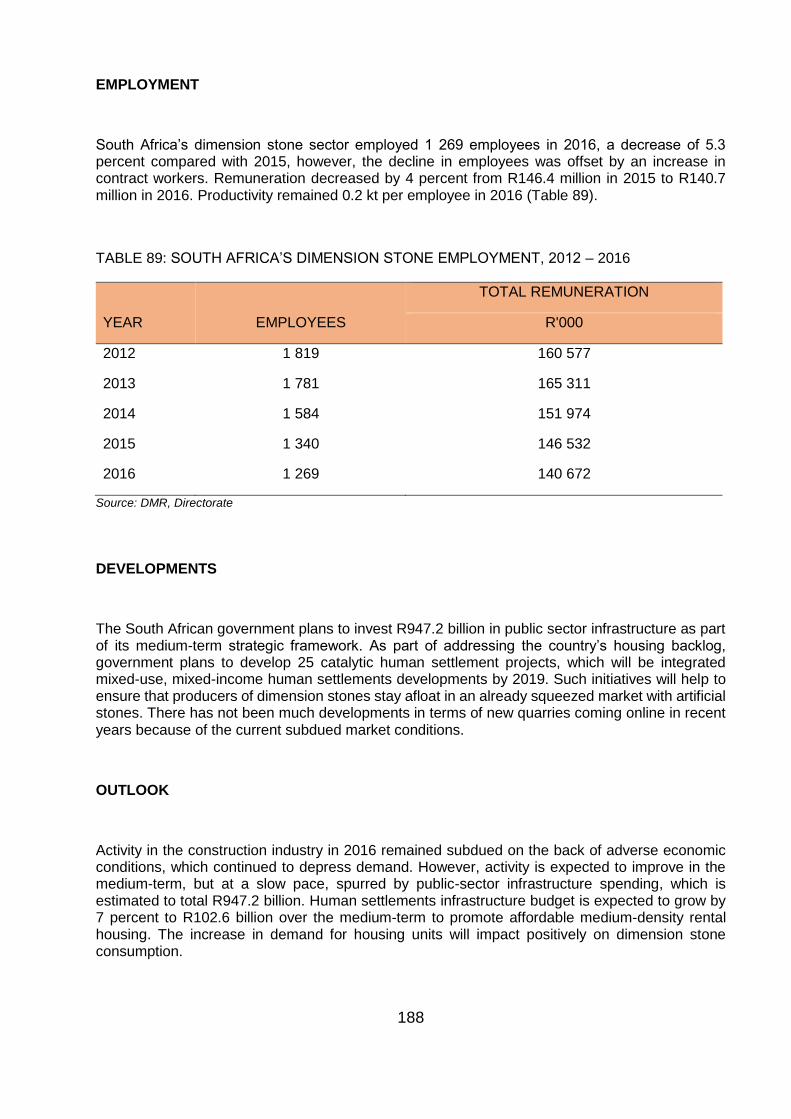
188
EMPLOYMENT
South Africa’s dimension stone sector employed 1 269 employees in 2016, a decrease of 5.3 percent compared with 2015, however, the decline in employees was offset by an increase in contract workers. Remuneration decreased by 4 percent from R146.4 million in 2015 to R140.7 million in 2016. Productivity remained 0.2 kt per employee in 2016 (Table 89).
TABLE 89: SOUTH AFRICA’S DIMENSION STONE EMPLOYMENT, 2012 – 2016
YEAR EMPLOYEES
TOTAL REMUNERATION
R'000
2012 1 819 160 577
2013 1 781 165 311
2014 1 584 151 974
2015 1 340 146 532
2016 1 269 140 672
Source: DMR, Directorate
DEVELOPMENTS
The South African government plans to invest R947.2 billion in public sector infrastructure as part of its medium-term strategic framework. As part of addressing the country’s housing backlog, government plans to develop 25 catalytic human settlement projects, which will be integrated mixed-use, mixed-income human settlements developments by 2019. Such initiatives will help to ensure that producers of dimension stones stay afloat in an already squeezed market with artificial stones. There has not been much developments in terms of new quarries coming online in recent years because of the current subdued market conditions.
OUTLOOK
Activity in the construction industry in 2016 remained subdued on the back of adverse economic conditions, which continued to depress demand. However, activity is expected to improve in the medium-term, but at a slow pace, spurred by public-sector infrastructure spending, which is estimated to total R947.2 billion. Human settlements infrastructure budget is expected to grow by 7 percent to R102.6 billion over the medium-term to promote affordable medium-density rental housing. The increase in demand for housing units will impact positively on dimension stone consumption.
189
The global market for dimension stone is expected to continue on a recovery trajectory, driven by rapid industrialisation and urbanisation in developing countries. The growing trend of dimension stones in building architecture on the back of increasing focus on environmentally friendly building materials will also help spur demand in the long-run.
REFERENCES:
1. Directorate Mineral Economics, DMR 2. IMM Carrara. Stone Sector 2017, Annual Report and Prospects for international Stone
Trade (accessed July 2017) 3. SA Construction 4th edition, 2016 Annual Report, Trends in South African Construction
Industry, (accessed: July, 2017). 4. Sebolelo. M, Development Bank http://www.dbsa.org/EN/DBSA-in-the-
News/NEWS/Pages/DBSA-partners-with-SADC.aspx (accessed: July 2017) 5. Rabozzi, C (16-17 June 2016). Stone Change 2016, Recycling of Natural Stone Slurries:
an analysis through the environment and economic indicators, Stone Sector 2016. (accessed: 2017)
6. United States Geological Survey 2017, Mineral Commodity Summaries, Stone(dimension) (accessed: July 2017)
7. The South Africa Institute of Mining and Metallurgy, Dimension Stone, Surface Mining, 2008 (accessed: July 2017).
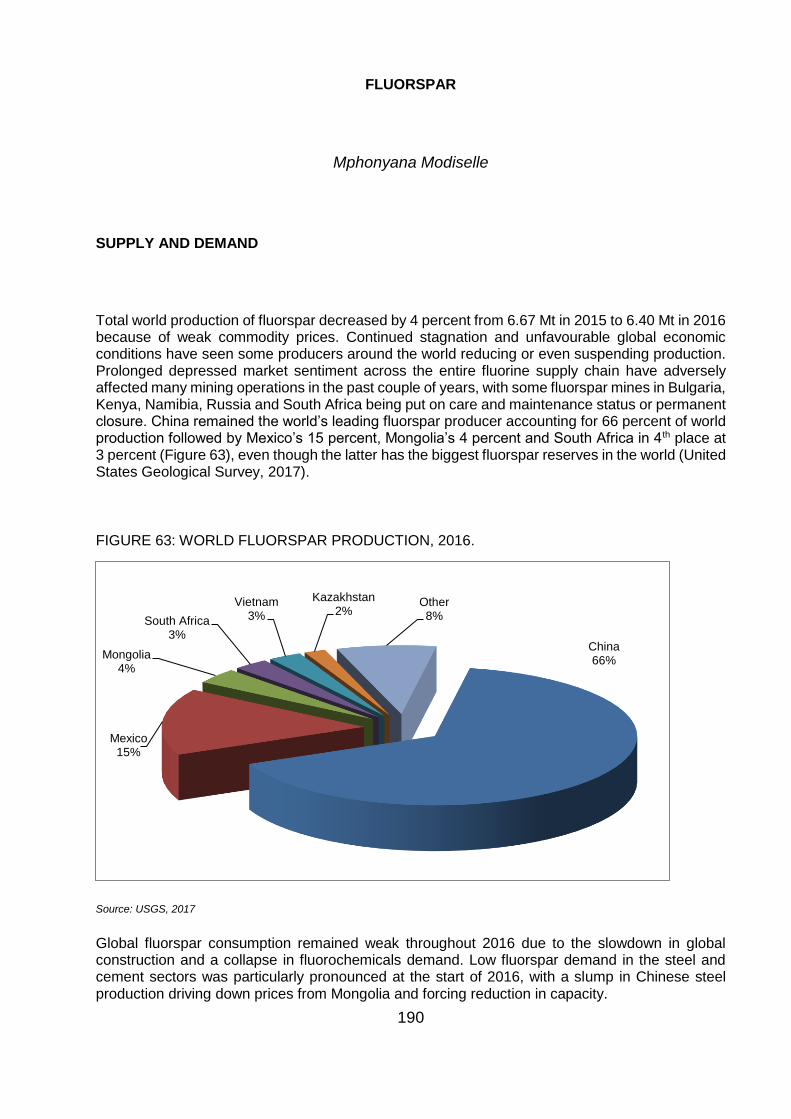
190
FLUORSPAR
Mphonyana Modiselle
SUPPLY AND DEMAND
Total world production of fluorspar decreased by 4 percent from 6.67 Mt in 2015 to 6.40 Mt in 2016 because of weak commodity prices. Continued stagnation and unfavourable global economic conditions have seen some producers around the world reducing or even suspending production. Prolonged depressed market sentiment across the entire fluorine supply chain have adversely affected many mining operations in the past couple of years, with some fluorspar mines in Bulgaria, Kenya, Namibia, Russia and South Africa being put on care and maintenance status or permanent closure. China remained the world’s leading fluorspar producer accounting for 66 percent of world production followed by Mexico’s 15 percent, Mongolia’s 4 percent and South Africa in 4th place at 3 percent (Figure 63), even though the latter has the biggest fluorspar reserves in the world (United States Geological Survey, 2017).
FIGURE 63: WORLD FLUORSPAR PRODUCTION, 2016.
Source: USGS, 2017
Global fluorspar consumption remained weak throughout 2016 due to the slowdown in global construction and a collapse in fluorochemicals demand. Low fluorspar demand in the steel and cement sectors was particularly pronounced at the start of 2016, with a slump in Chinese steel production driving down prices from Mongolia and forcing reduction in capacity.
China66%
Mexico15%
Mongolia4%
South Africa3%
Vietnam3%
Kazakhstan2%
Other8%
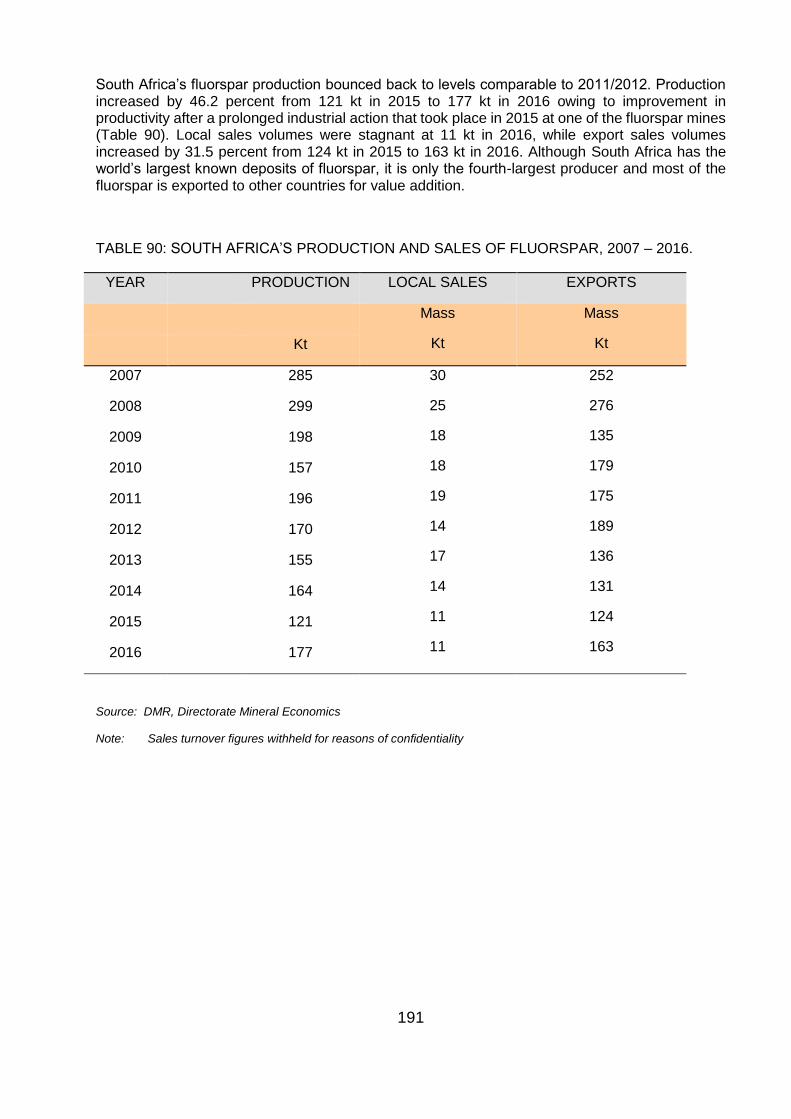
191
South Africa’s fluorspar production bounced back to levels comparable to 2011/2012. Production increased by 46.2 percent from 121 kt in 2015 to 177 kt in 2016 owing to improvement in productivity after a prolonged industrial action that took place in 2015 at one of the fluorspar mines (Table 90). Local sales volumes were stagnant at 11 kt in 2016, while export sales volumes increased by 31.5 percent from 124 kt in 2015 to 163 kt in 2016. Although South Africa has the world’s largest known deposits of fluorspar, it is only the fourth-largest producer and most of the fluorspar is exported to other countries for value addition.
TABLE 90: SOUTH AFRICA’S PRODUCTION AND SALES OF FLUORSPAR, 2007 – 2016.
YEAR PRODUCTION LOCAL SALES EXPORTS
Mass
Kt
Mass
Kt Kt
2007 285 30
25
18
18
19
14
17
14
11
11
252
276
135
179
175
189
136
131
124
163
2008 299
2009 198
2010 157
2011 196
2012 170
2013 155
2014 164
2015 121
2016 177
Source: DMR, Directorate Mineral Economics
Note: Sales turnover figures withheld for reasons of confidentiality
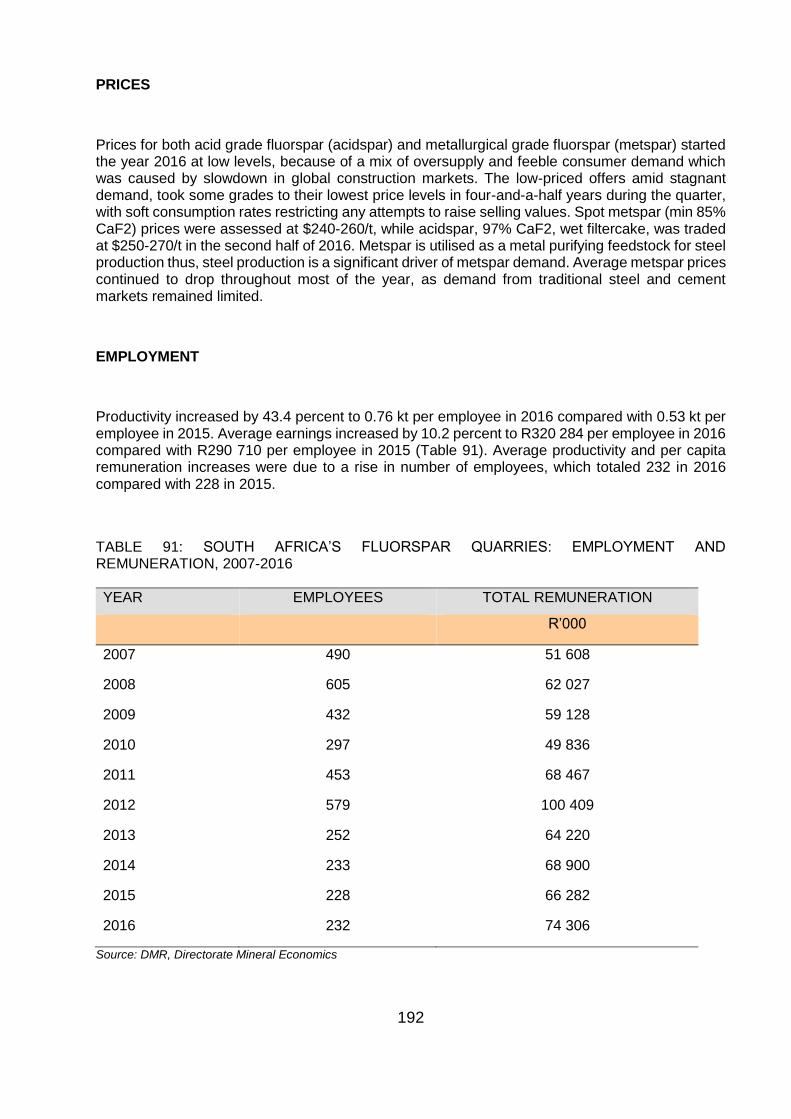
192
PRICES
Prices for both acid grade fluorspar (acidspar) and metallurgical grade fluorspar (metspar) started the year 2016 at low levels, because of a mix of oversupply and feeble consumer demand which was caused by slowdown in global construction markets. The low-priced offers amid stagnant demand, took some grades to their lowest price levels in four-and-a-half years during the quarter, with soft consumption rates restricting any attempts to raise selling values. Spot metspar (min 85% CaF2) prices were assessed at $240-260/t, while acidspar, 97% CaF2, wet filtercake, was traded at $250-270/t in the second half of 2016. Metspar is utilised as a metal purifying feedstock for steel production thus, steel production is a significant driver of metspar demand. Average metspar prices continued to drop throughout most of the year, as demand from traditional steel and cement markets remained limited.
EMPLOYMENT
Productivity increased by 43.4 percent to 0.76 kt per employee in 2016 compared with 0.53 kt per employee in 2015. Average earnings increased by 10.2 percent to R320 284 per employee in 2016 compared with R290 710 per employee in 2015 (Table 91). Average productivity and per capita remuneration increases were due to a rise in number of employees, which totaled 232 in 2016 compared with 228 in 2015.
TABLE 91: SOUTH AFRICA’S FLUORSPAR QUARRIES: EMPLOYMENT AND REMUNERATION, 2007-2016
YEAR EMPLOYEES TOTAL REMUNERATION
R’000
2007
2008
490
605
51 608
62 027
2009 432 59 128
2010 297 49 836
2011
2012
2013
2014
2015
2016
453
579
252
233
228
232
68 467
100 409
64 220
68 900
66 282
74 306
Source: DMR, Directorate Mineral Economics
193
RECENT DEVELOPMENTS
Following many years of having one active mine, the emergence of a new era for the South African fluorspar industry may have been signalled by Sephaku Fluoride (SepFluor) commencement of its building programme of the R1.7 billion Nokeng fluorspar mine at Rust de Winter, northeast of Pretoria, with funding provided by private equity and banks. SepFluor, which was unbundled from Sephaku Holdings in 2012, has been planning the mine for at least seven years and originally intended to couple it with a fluorochemical plant at Ekandustria, in Mpumalanga Province. However, it had to shelve plans for the plant in 2016 because of difficulties in raising funds amid general decline in demand for commodities as well as the weakening exchange rate. Construction of the mine is expected to be completed within 21 months, with commissioning envisaged for November 2018 and for first production in early 2019. It is targeting an output of 180 kt per year of acid-grade fluorspar and 30 kt per year of metallurgical grade. A long-term deal has been concluded with Traxys Project to market and distribute the fluorspar product. About 300 fixed-term jobs will be created during construction phase and an additional 200 permanent jobs during operations. The Department of Trade and Industry has approved an infrastructure grant of R21 million, primarily as a contribution towards power supply and road works. Nokeng’s social and labour plan (SLP) has committed R26 million. The estimated life of mine is 19 years, for Nokeng’s two deposits, Plattekop and Outwash Fan, with the prospect of extending its life of mine with a third deposit, Nokeng’s Wilton.
SA Fluorite is also emerging with its development of the Doornhoek fluorspar deposit, anticipating to secure their mining rights by the end of 2018. The Doornhoek project is in a joint venture with ferrochrome giant Eurasian Natural Resources Corp (ENRC), a South African-based fluorspar developer with extensive experience in exploration. The project contains in excess of 50 Mt of inferred contained CaF2 at an average grade exceeding 20 percent CaF2. The anticipated production target is 275 kt per annum. The construction employment is estimated at over 200 employees and full mine operational employment is estimated to be 222 direct jobs. The company is actively seeking investors to assist in developing this project and the exploration drilling is complete, while an application for a mining right has been lodged with the Department of Mineral Resources (DMR). The company’s detailed environmental management programme and environmental impact assessment for the Doornhoek project, have been approved by the DMR. Plans are underway to finalise the metallurgical test work and possibly, commencement with pilot plant test work will ensue. The company is currently seeking partners or offtake agreements to allow for the completion of a feasibility study and enable the company to raise funds to develop the project.
Kenya Fluorspar Co. Ltd Kerio Valley mine’s quality issues, reduced global demand, falling prices and competition from new producers led to the suspension of operations, which in turn forced its closure by end of April 2016. The company intended to sell 30 kt of accumulated fluorspar stock prior to resuming operations.
OUTLOOK
Despite the continued sluggish world demand of commodities, acidspar prices are expected to increase going forward due to lower overhanging stocks and production supply in better balance. However, increasing environmental concerns around restricted fluorine compounds in the chemical sector, owing to their global warming effects might lead to a decrease in demand. Regardless of a decline in world fluorspar production in 2016 owing to weak demand particularly for metallurgical
194
grade, the outlook remains strong in steel, aluminium and fluoropolymers as prices firm in 2017. Surge in the manufacturing of hydrofluoric acid and steel making market is expected to bolster the global fluorspar market.
An economic boost determined by rebound in Chinese construction and infrastructure presented certain optimism of recovery in demand. However, a rebound in fluorspar prices is doubtful unless global economic situations recover on current uninspiring growth rates or rather a production trim from suppliers and assist to realign the market.
Projects such as SA Fluorite Doornhoek fluorspar and Sephaku Fluoride development will boost South Africa’s fluorspar production as well as prelude the local fluorochemical industry. In addition, the two projects will contribute a total of 422 jobs to the mining sector. Thus, South Africa is set to be the world’s premium fluorspar provider as it is strategically positioned to global markets and it possess excellent logistics from its ports. The recent trend of increasing Chinese fluorspar consumption and continuing interruptions from its mines owing to the introduction of tighter environmental controls in that country would likely boost demand for production from South Africa.
REFERENCES
1. Allan Saad, SA Fluorite, personal communication
2. Braam DuRant, Vergenoeg Mining Co (Pty) Ltd, personal communication 3. Business Live, Allan Seccombe, Sepfluor seeks to assure banks that the new project is
safe, 2017, http://www.businesslive.co.za/bd/companies/mining/2017/07-19-sepflu...accessed 2017/08/03
4. Elize Pretorius, Sallies Limited, personal communication
5. Imformed Newsfile 26 July 2017, Mike O’ Driscoll, Fluorspar renaissance rallies in South Africa, http://imformed.com/fluorspar-renaissance-rallies-in-south-africa/
6. Industrial Minerals Magazine and website, 2016-2017: http://www.indmin.com 7. Johan Brits, Sepfluor Ltd, personal communication 8. Johan Heyl, Sallies Limited, personal communication
9. Kevin Dabinett, Sepfluor Ltd, personal communication 10. McRae ME, Fluorspar Reviews, USGS 2016-2017
11. Mineral Economics Directorate, DMR
12. Miningmx, David McKay, Sepfluor to buildR1.7 bn Nokeng fluorspar mine, concentrator, 2017, http://www.miningmx.com/news/markets/29990-sepfluor-kickstart-r1-7bn-nokeng-mine-east-pretoria/
13. Mining Weekly, Martin Creamer, Work starts on R1.7 bn fluorspar mine, 2017, http://www,miningweekly.com/article/work-starts-on-r1.7bn-fluorspar-mine-2017-07-10
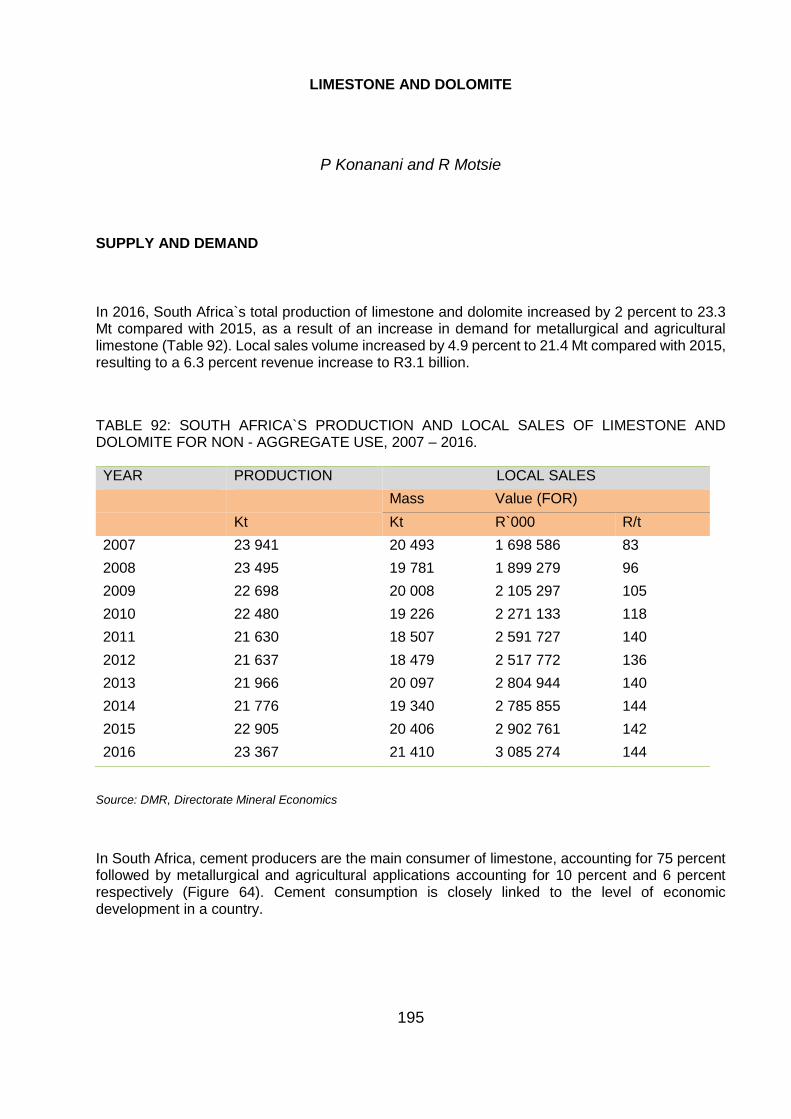
195
LIMESTONE AND DOLOMITE
P Konanani and R Motsie
SUPPLY AND DEMAND
In 2016, South Africa`s total production of limestone and dolomite increased by 2 percent to 23.3 Mt compared with 2015, as a result of an increase in demand for metallurgical and agricultural limestone (Table 92). Local sales volume increased by 4.9 percent to 21.4 Mt compared with 2015, resulting to a 6.3 percent revenue increase to R3.1 billion.
TABLE 92: SOUTH AFRICA`S PRODUCTION AND LOCAL SALES OF LIMESTONE AND DOLOMITE FOR NON - AGGREGATE USE, 2007 – 2016.
YEAR PRODUCTION LOCAL SALES
Mass Value (FOR)
Kt Kt R`000 R/t
2007 23 941 20 493 1 698 586 83
2008 23 495 19 781 1 899 279 96
2009 22 698 20 008 2 105 297 105
2010 22 480 19 226 2 271 133 118
2011 21 630 18 507 2 591 727 140
2012 21 637 18 479 2 517 772 136
2013 21 966 20 097 2 804 944 140
2014 21 776 19 340 2 785 855 144
2015 22 905 20 406 2 902 761 142
2016 23 367 21 410 3 085 274 144
Source: DMR, Directorate Mineral Economics
In South Africa, cement producers are the main consumer of limestone, accounting for 75 percent followed by metallurgical and agricultural applications accounting for 10 percent and 6 percent respectively (Figure 64). Cement consumption is closely linked to the level of economic development in a country.
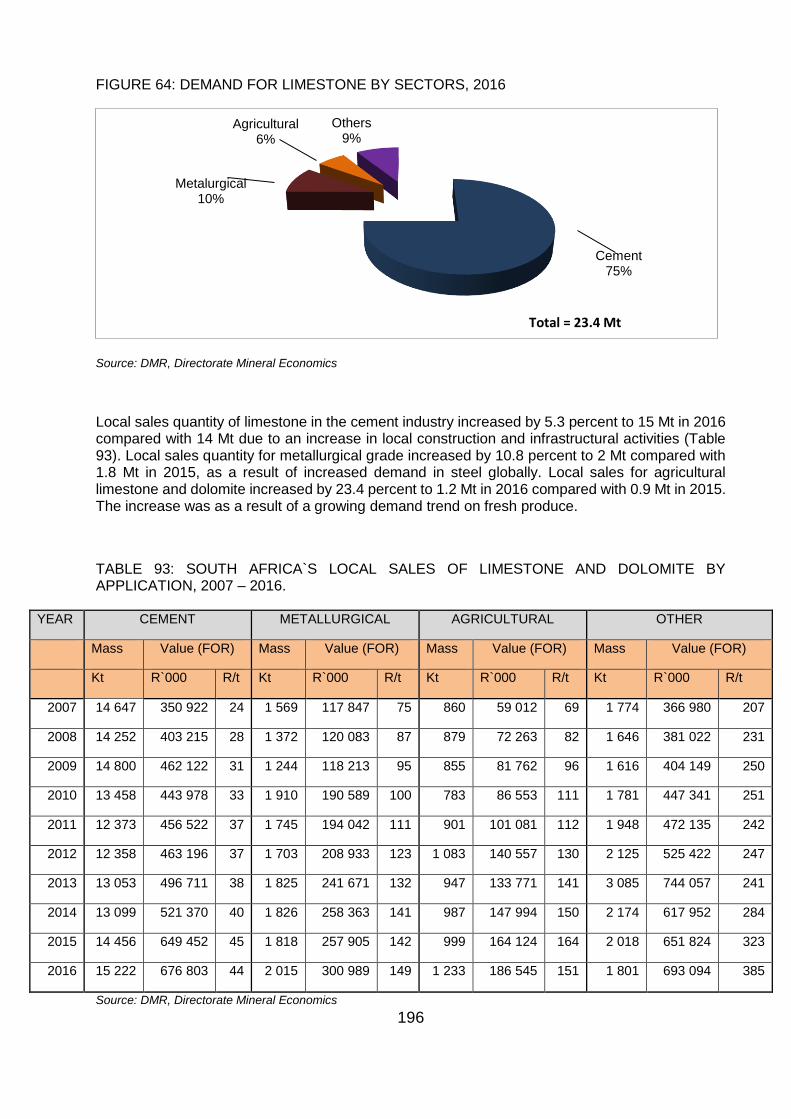
196
FIGURE 64: DEMAND FOR LIMESTONE BY SECTORS, 2016
Source: DMR, Directorate Mineral Economics
Local sales quantity of limestone in the cement industry increased by 5.3 percent to 15 Mt in 2016 compared with 14 Mt due to an increase in local construction and infrastructural activities (Table 93). Local sales quantity for metallurgical grade increased by 10.8 percent to 2 Mt compared with 1.8 Mt in 2015, as a result of increased demand in steel globally. Local sales for agricultural limestone and dolomite increased by 23.4 percent to 1.2 Mt in 2016 compared with 0.9 Mt in 2015. The increase was as a result of a growing demand trend on fresh produce.
TABLE 93: SOUTH AFRICA`S LOCAL SALES OF LIMESTONE AND DOLOMITE BY APPLICATION, 2007 – 2016.
YEAR CEMENT METALLURGICAL AGRICULTURAL OTHER
Mass Value (FOR) Mass Value (FOR) Mass Value (FOR) Mass Value (FOR)
Kt R`000 R/t Kt R`000 R/t Kt R`000 R/t Kt R`000 R/t
2007 14 647 350 922 24 1 569 117 847 75 860 59 012 69 1 774 366 980 207
2008 14 252 403 215 28 1 372 120 083 87 879 72 263 82 1 646 381 022 231
2009 14 800 462 122 31 1 244 118 213 95 855 81 762 96 1 616 404 149 250
2010 13 458 443 978 33 1 910 190 589 100 783 86 553 111 1 781 447 341 251
2011 12 373 456 522 37 1 745 194 042 111 901 101 081 112 1 948 472 135 242
2012 12 358 463 196 37 1 703 208 933 123 1 083 140 557 130 2 125 525 422 247
2013 13 053 496 711 38 1 825 241 671 132 947 133 771 141 3 085 744 057 241
2014 13 099 521 370 40 1 826 258 363 141 987 147 994 150 2 174 617 952 284
2015 14 456 649 452 45 1 818 257 905 142 999 164 124 164 2 018 651 824 323
2016 15 222 676 803 44 2 015 300 989 149 1 233 186 545 151 1 801 693 094 385
Source: DMR, Directorate Mineral Economics
Cement75%
Metalurgical10%
Agricultural6%
Others9%
Total = 23.4 Mt
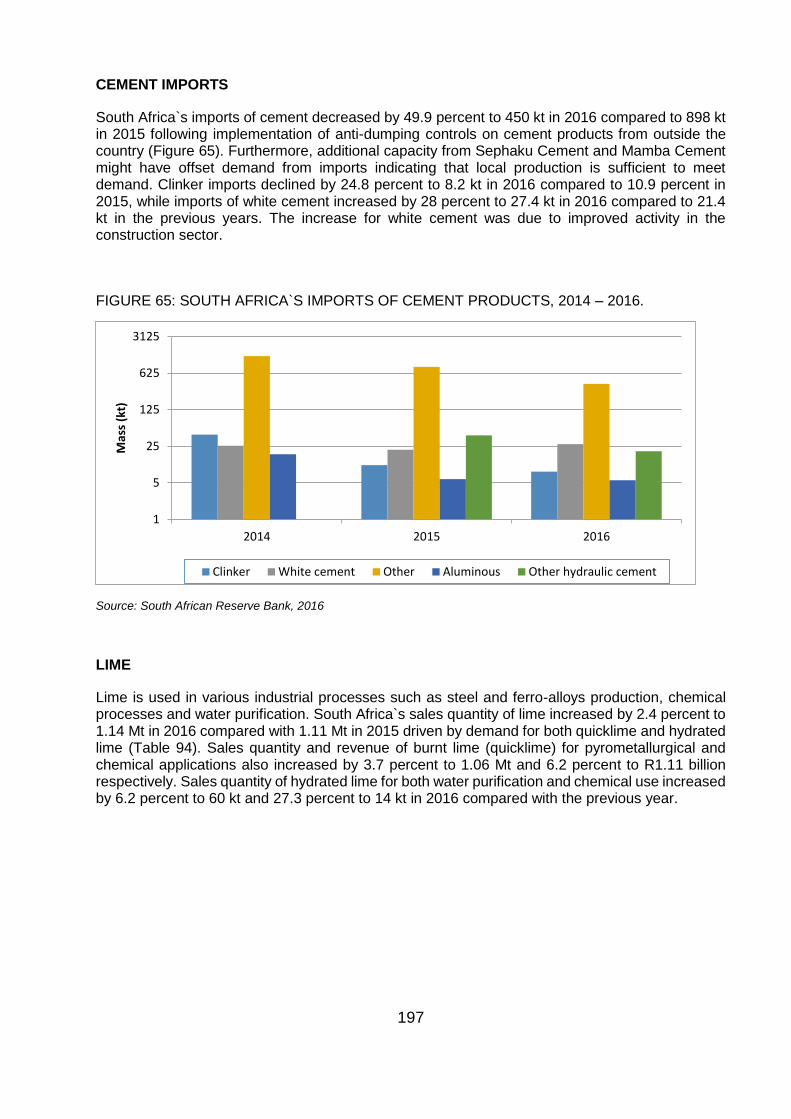
197
CEMENT IMPORTS
South Africa`s imports of cement decreased by 49.9 percent to 450 kt in 2016 compared to 898 kt in 2015 following implementation of anti-dumping controls on cement products from outside the country (Figure 65). Furthermore, additional capacity from Sephaku Cement and Mamba Cement might have offset demand from imports indicating that local production is sufficient to meet demand. Clinker imports declined by 24.8 percent to 8.2 kt in 2016 compared to 10.9 percent in 2015, while imports of white cement increased by 28 percent to 27.4 kt in 2016 compared to 21.4 kt in the previous years. The increase for white cement was due to improved activity in the construction sector.
FIGURE 65: SOUTH AFRICA`S IMPORTS OF CEMENT PRODUCTS, 2014 – 2016.
Source: South African Reserve Bank, 2016
LIME
Lime is used in various industrial processes such as steel and ferro-alloys production, chemical processes and water purification. South Africa`s sales quantity of lime increased by 2.4 percent to 1.14 Mt in 2016 compared with 1.11 Mt in 2015 driven by demand for both quicklime and hydrated lime (Table 94). Sales quantity and revenue of burnt lime (quicklime) for pyrometallurgical and chemical applications also increased by 3.7 percent to 1.06 Mt and 6.2 percent to R1.11 billion respectively. Sales quantity of hydrated lime for both water purification and chemical use increased by 6.2 percent to 60 kt and 27.3 percent to 14 kt in 2016 compared with the previous year.
1
5
25
125
625
3125
2014 2015 2016
Mas
s (k
t)
Clinker White cement Other Aluminous Other hydraulic cement
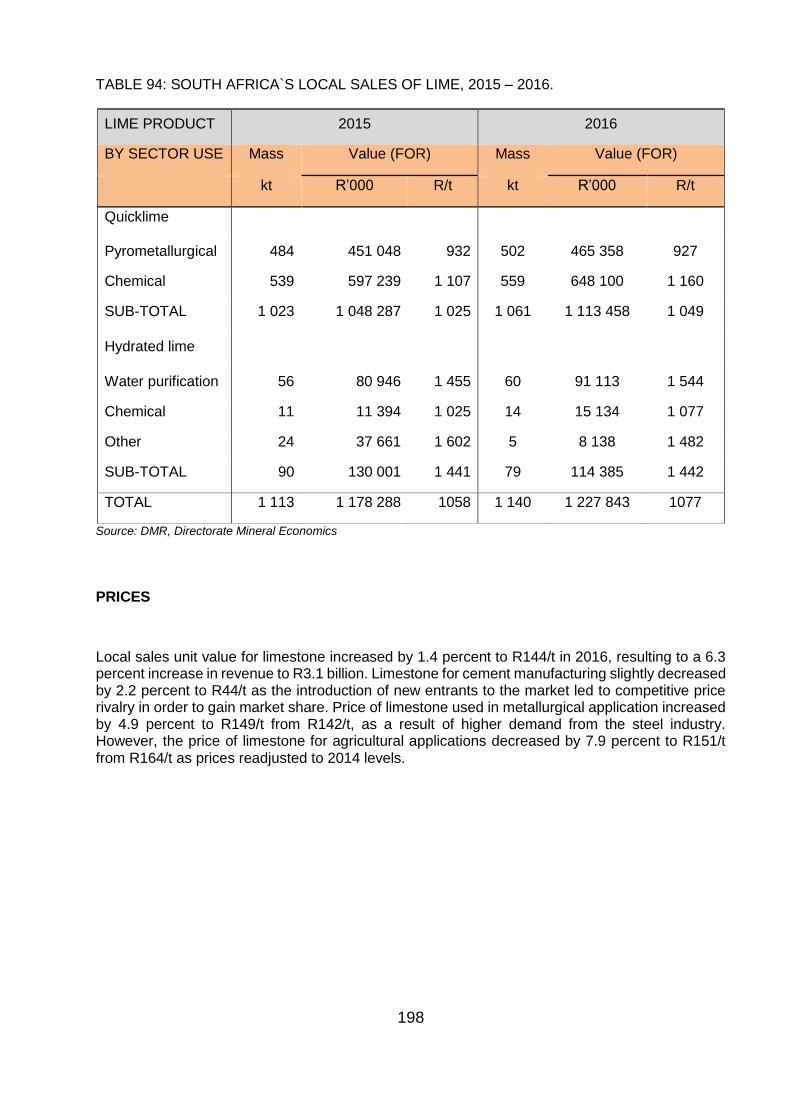
198
TABLE 94: SOUTH AFRICA`S LOCAL SALES OF LIME, 2015 – 2016.
LIME PRODUCT 2015 2016
BY SECTOR USE Mass Value (FOR) Mass Value (FOR)
kt R’000 R/t kt R’000 R/t
Quicklime
Pyrometallurgical 484 451 048 932 502 465 358 927
Chemical 539 597 239 1 107 559 648 100 1 160
SUB-TOTAL 1 023 1 048 287 1 025 1 061 1 113 458 1 049
Hydrated lime
Water purification 56 80 946 1 455 60 91 113 1 544
Chemical 11 11 394 1 025 14 15 134 1 077
Other 24 37 661 1 602 5 8 138 1 482
SUB-TOTAL 90 130 001 1 441 79 114 385 1 442
TOTAL 1 113 1 178 288 1058 1 140 1 227 843 1077
Source: DMR, Directorate Mineral Economics
PRICES
Local sales unit value for limestone increased by 1.4 percent to R144/t in 2016, resulting to a 6.3 percent increase in revenue to R3.1 billion. Limestone for cement manufacturing slightly decreased by 2.2 percent to R44/t as the introduction of new entrants to the market led to competitive price rivalry in order to gain market share. Price of limestone used in metallurgical application increased by 4.9 percent to R149/t from R142/t, as a result of higher demand from the steel industry. However, the price of limestone for agricultural applications decreased by 7.9 percent to R151/t from R164/t as prices readjusted to 2014 levels.
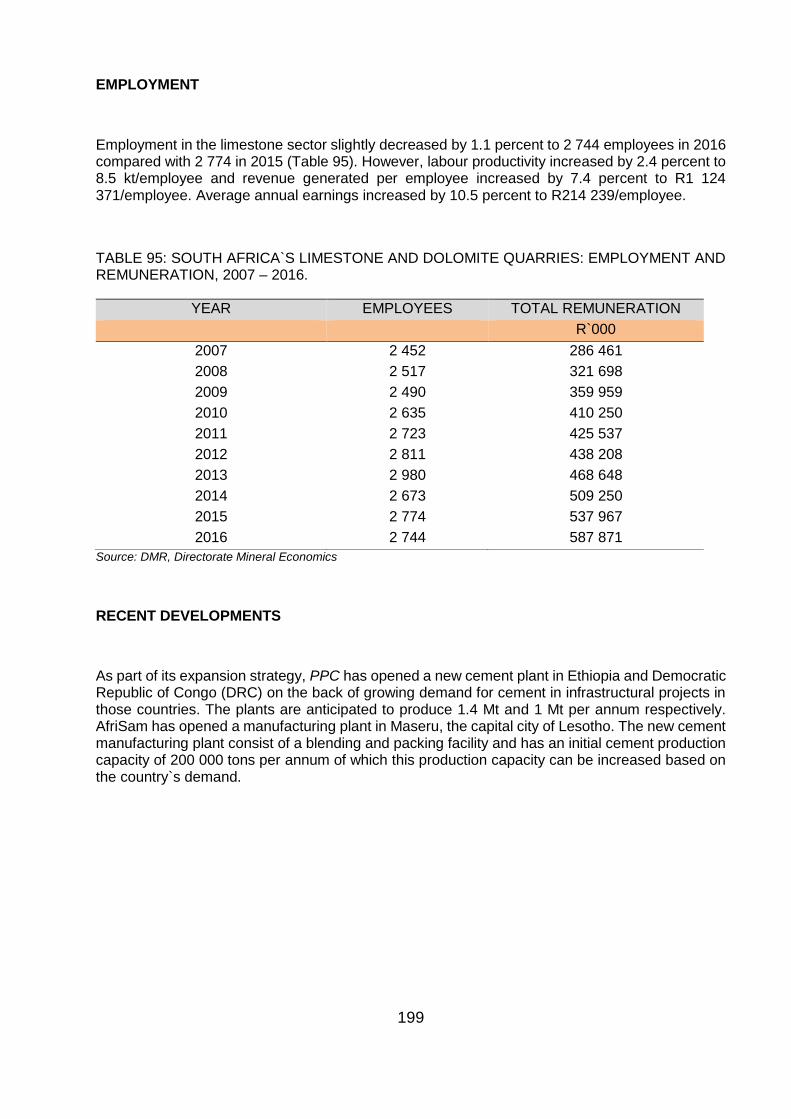
199
EMPLOYMENT
Employment in the limestone sector slightly decreased by 1.1 percent to 2 744 employees in 2016 compared with 2 774 in 2015 (Table 95). However, labour productivity increased by 2.4 percent to 8.5 kt/employee and revenue generated per employee increased by 7.4 percent to R1 124 371/employee. Average annual earnings increased by 10.5 percent to R214 239/employee.
TABLE 95: SOUTH AFRICA`S LIMESTONE AND DOLOMITE QUARRIES: EMPLOYMENT AND REMUNERATION, 2007 – 2016.
YEAR EMPLOYEES TOTAL REMUNERATION
R`000
2007 2 452 286 461
2008 2 517 321 698
2009 2 490 359 959
2010 2 635 410 250
2011 2 723 425 537
2012 2 811 438 208
2013 2 980 468 648
2014 2 673 509 250
2015 2 774 537 967
2016 2 744 587 871
Source: DMR, Directorate Mineral Economics
RECENT DEVELOPMENTS
As part of its expansion strategy, PPC has opened a new cement plant in Ethiopia and Democratic Republic of Congo (DRC) on the back of growing demand for cement in infrastructural projects in those countries. The plants are anticipated to produce 1.4 Mt and 1 Mt per annum respectively. AfriSam has opened a manufacturing plant in Maseru, the capital city of Lesotho. The new cement manufacturing plant consist of a blending and packing facility and has an initial cement production capacity of 200 000 tons per annum of which this production capacity can be increased based on the country`s demand.
200
OUTLOOK
South Africa`s economy is expected to grow by 2 percent in 2018 and 2.2 percent in 2019 according to National Treasury. The medium-term outlook for cement demand is positive on the back of projected economic activity and government’s commitment to spend R947.2 billion on public sector infrastructure by 2020. Activity in public sector infrastructure expenditure is a good indicator of construction industry performance.
Supply-demand dynamics in the cement industry have improved owing to all new cement plants coming online. Therefore, it is anticipated that there will be minimal further price disruptions in future as there are no new plants expected to be commissioned any time soon. Producers who were initially responsible for cutting prices have now readjusted their prices.
Although the current industry capacity exceeds demand, urbanisation growth rates in South Africa and the continent are expected to exceed global averages over the next decade, driving demand for cement and limestone for infrastructure development. Limestone consumption in other sectors of the economy like steel manufacturing is also anticipated to increase, as the sector regains traction.
REFERENCES
1. Department of Mineral Resources, Directorate Mineral Economics
2. National Treasury, Budget Review, 2017
3. PPC, Integrated Report, 2016
4. SA Construction News, Lesotho gets local cement plant, 01 June 2017. http://www.saconstructionnews.co.za/building/17048-lesotho-gets-local-cement-plant. Accessed: 22 September 2017
5. South African Revenue Services, Trade Statistics, 2016
6. World Steel Association, World Steel in Figures, 2017
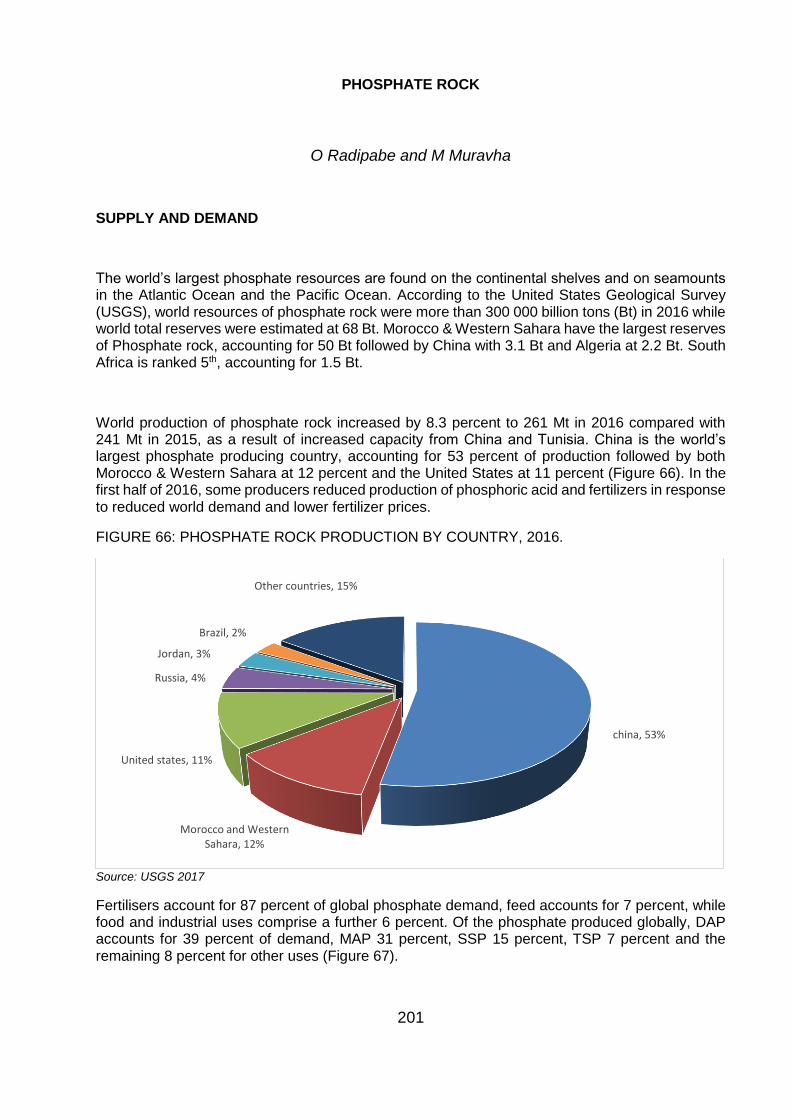
201
PHOSPHATE ROCK
O Radipabe and M Muravha
SUPPLY AND DEMAND
The world’s largest phosphate resources are found on the continental shelves and on seamounts in the Atlantic Ocean and the Pacific Ocean. According to the United States Geological Survey (USGS), world resources of phosphate rock were more than 300 000 billion tons (Bt) in 2016 while world total reserves were estimated at 68 Bt. Morocco & Western Sahara have the largest reserves of Phosphate rock, accounting for 50 Bt followed by China with 3.1 Bt and Algeria at 2.2 Bt. South Africa is ranked 5th, accounting for 1.5 Bt.
World production of phosphate rock increased by 8.3 percent to 261 Mt in 2016 compared with 241 Mt in 2015, as a result of increased capacity from China and Tunisia. China is the world’s largest phosphate producing country, accounting for 53 percent of production followed by both Morocco & Western Sahara at 12 percent and the United States at 11 percent (Figure 66). In the first half of 2016, some producers reduced production of phosphoric acid and fertilizers in response to reduced world demand and lower fertilizer prices.
FIGURE 66: PHOSPHATE ROCK PRODUCTION BY COUNTRY, 2016.
Source: USGS 2017
Fertilisers account for 87 percent of global phosphate demand, feed accounts for 7 percent, while food and industrial uses comprise a further 6 percent. Of the phosphate produced globally, DAP accounts for 39 percent of demand, MAP 31 percent, SSP 15 percent, TSP 7 percent and the remaining 8 percent for other uses (Figure 67).
china, 53%
Morocco and Western Sahara, 12%
United states, 11%
Russia, 4%
Jordan, 3%
Brazil, 2%
Other countries, 15%
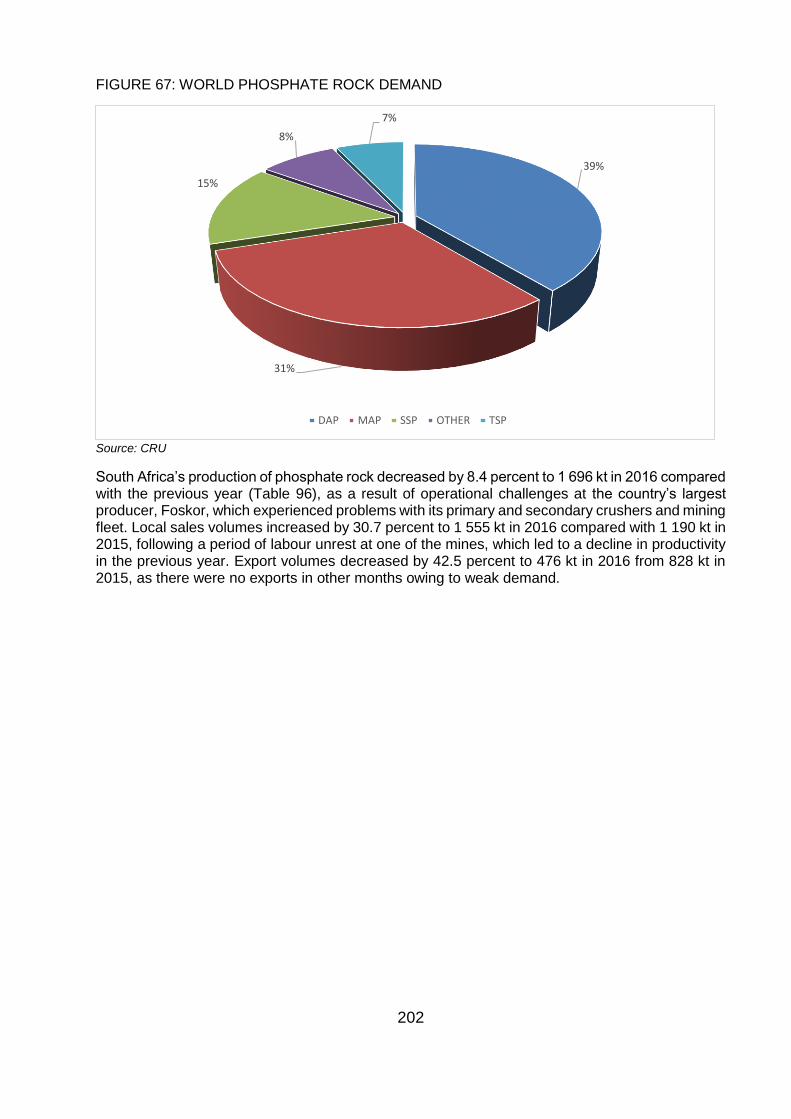
202
FIGURE 67: WORLD PHOSPHATE ROCK DEMAND
Source: CRU
South Africa’s production of phosphate rock decreased by 8.4 percent to 1 696 kt in 2016 compared with the previous year (Table 96), as a result of operational challenges at the country’s largest producer, Foskor, which experienced problems with its primary and secondary crushers and mining fleet. Local sales volumes increased by 30.7 percent to 1 555 kt in 2016 compared with 1 190 kt in 2015, following a period of labour unrest at one of the mines, which led to a decline in productivity in the previous year. Export volumes decreased by 42.5 percent to 476 kt in 2016 from 828 kt in 2015, as there were no exports in other months owing to weak demand.
39%
31%
15%
8%
7%
DAP MAP SSP OTHER TSP
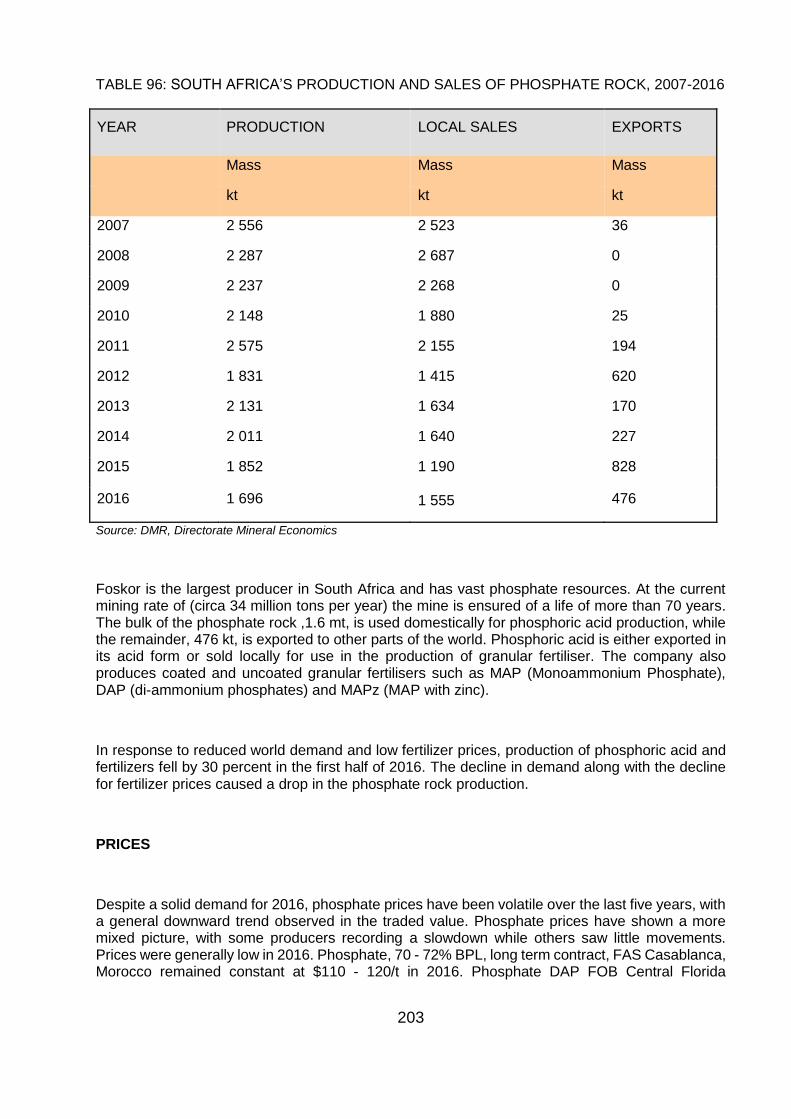
203
TABLE 96: SOUTH AFRICA’S PRODUCTION AND SALES OF PHOSPHATE ROCK, 2007-2016
YEAR PRODUCTION LOCAL SALES EXPORTS
Mass Mass Mass
kt kt kt
2007 2 556 2 523 36
2008 2 287 2 687 0
2009 2 237 2 268 0
2010 2 148 1 880 25
2011 2 575 2 155 194
2012 1 831 1 415 620
2013 2 131 1 634 170
2014 2 011 1 640 227
2015 1 852 1 190 828
2016 1 696 1 555 476
Source: DMR, Directorate Mineral Economics
Foskor is the largest producer in South Africa and has vast phosphate resources. At the current mining rate of (circa 34 million tons per year) the mine is ensured of a life of more than 70 years. The bulk of the phosphate rock ,1.6 mt, is used domestically for phosphoric acid production, while the remainder, 476 kt, is exported to other parts of the world. Phosphoric acid is either exported in its acid form or sold locally for use in the production of granular fertiliser. The company also produces coated and uncoated granular fertilisers such as MAP (Monoammonium Phosphate), DAP (di-ammonium phosphates) and MAPz (MAP with zinc).
In response to reduced world demand and low fertilizer prices, production of phosphoric acid and fertilizers fell by 30 percent in the first half of 2016. The decline in demand along with the decline for fertilizer prices caused a drop in the phosphate rock production.
PRICES
Despite a solid demand for 2016, phosphate prices have been volatile over the last five years, with a general downward trend observed in the traded value. Phosphate prices have shown a more mixed picture, with some producers recording a slowdown while others saw little movements. Prices were generally low in 2016. Phosphate, 70 - 72% BPL, long term contract, FAS Casablanca, Morocco remained constant at $110 - 120/t in 2016. Phosphate DAP FOB Central Florida
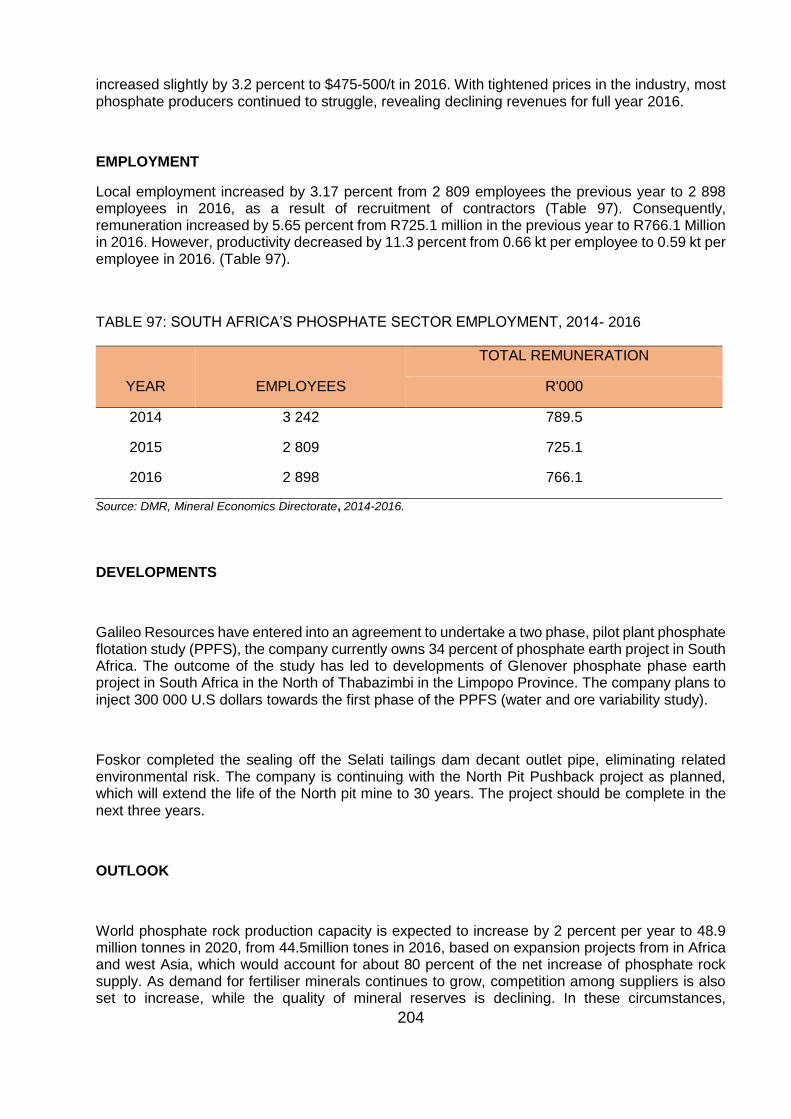
204
increased slightly by 3.2 percent to $475-500/t in 2016. With tightened prices in the industry, most phosphate producers continued to struggle, revealing declining revenues for full year 2016.
EMPLOYMENT
Local employment increased by 3.17 percent from 2 809 employees the previous year to 2 898 employees in 2016, as a result of recruitment of contractors (Table 97). Consequently, remuneration increased by 5.65 percent from R725.1 million in the previous year to R766.1 Million in 2016. However, productivity decreased by 11.3 percent from 0.66 kt per employee to 0.59 kt per employee in 2016. (Table 97).
TABLE 97: SOUTH AFRICA’S PHOSPHATE SECTOR EMPLOYMENT, 2014- 2016
YEAR EMPLOYEES
TOTAL REMUNERATION
R'000
2014 3 242 789.5
2015 2 809 725.1
2016 2 898 766.1
Source: DMR, Mineral Economics Directorate, 2014-2016.
DEVELOPMENTS
Galileo Resources have entered into an agreement to undertake a two phase, pilot plant phosphate flotation study (PPFS), the company currently owns 34 percent of phosphate earth project in South Africa. The outcome of the study has led to developments of Glenover phosphate phase earth project in South Africa in the North of Thabazimbi in the Limpopo Province. The company plans to inject 300 000 U.S dollars towards the first phase of the PPFS (water and ore variability study).
Foskor completed the sealing off the Selati tailings dam decant outlet pipe, eliminating related environmental risk. The company is continuing with the North Pit Pushback project as planned, which will extend the life of the North pit mine to 30 years. The project should be complete in the next three years.
OUTLOOK
World phosphate rock production capacity is expected to increase by 2 percent per year to 48.9 million tonnes in 2020, from 44.5million tones in 2016, based on expansion projects from in Africa and west Asia, which would account for about 80 percent of the net increase of phosphate rock supply. As demand for fertiliser minerals continues to grow, competition among suppliers is also set to increase, while the quality of mineral reserves is declining. In these circumstances,
205
processing techniques will be key to preserving producer margins, increasing the effectiveness of fertiliser end products, and for minimising waste in an industry that continues to be closely scrutinised for its efficiency and environmental impact.
Disappointing consumption from countries like India, undermined global phosphate demand growth in 2016. However, a good monsoon season and above average reservoir storage is expected to bolster India’s appetite for phosphate in 2017. Robust demand is also expected to continue from Brazil, but significant shifts in global shipment volumes will be dictated by India and the Latin American continent as a whole.
In South Africa, production of phosphoric acid is anticipated to improve on the back of growing demand for granulation production in the local markets. Production is also expected to be bolstered in a long run by prospecting projects on marine phosphates. Furthermore, the anticipated demand for fertilisers in agricultural uses underpinned by the need for more food reserves as a result of the growing population, will drive increases in production.
REFERENCES
1. Fertilizer International Magazine, 2015-2016, The global fertilizer industry, http://www. fertiliser international. Asp .(accessed: July 2017)
2. Foskor Intergrated Annual Report ,2016, http://www.foskor.co.za/sitepages/home.aspx ,( accessed: May 2017)
3. Heffer, P and Prud’homme, M, Fertilizer Outlook 2017-2021.International Fertilizer Industry Association,
4. http://www.FertiliserOutlook.org,2017_IFA_Annual_Conference_Marrakech (accessed: August 2017)
5. Perks, C. & IM Staff (2017, July 7) 2016 year in review and potash & phosphate: demand industry. www.industrial minerals.com (accessed: July, 2017)
6. Odendaal,N. (2017, June 12). Galileo subsidiary, undisclosed phosphate producer to undertake pilot plant phosphate flotation study.http:// www.miningweekly.com (accessed: June 2017)
7. United States Geological Survey, Mineral Commodity Summaries, Phosphate Rock, January 2017, https://www.usgs.gov (accessed: May 2017)
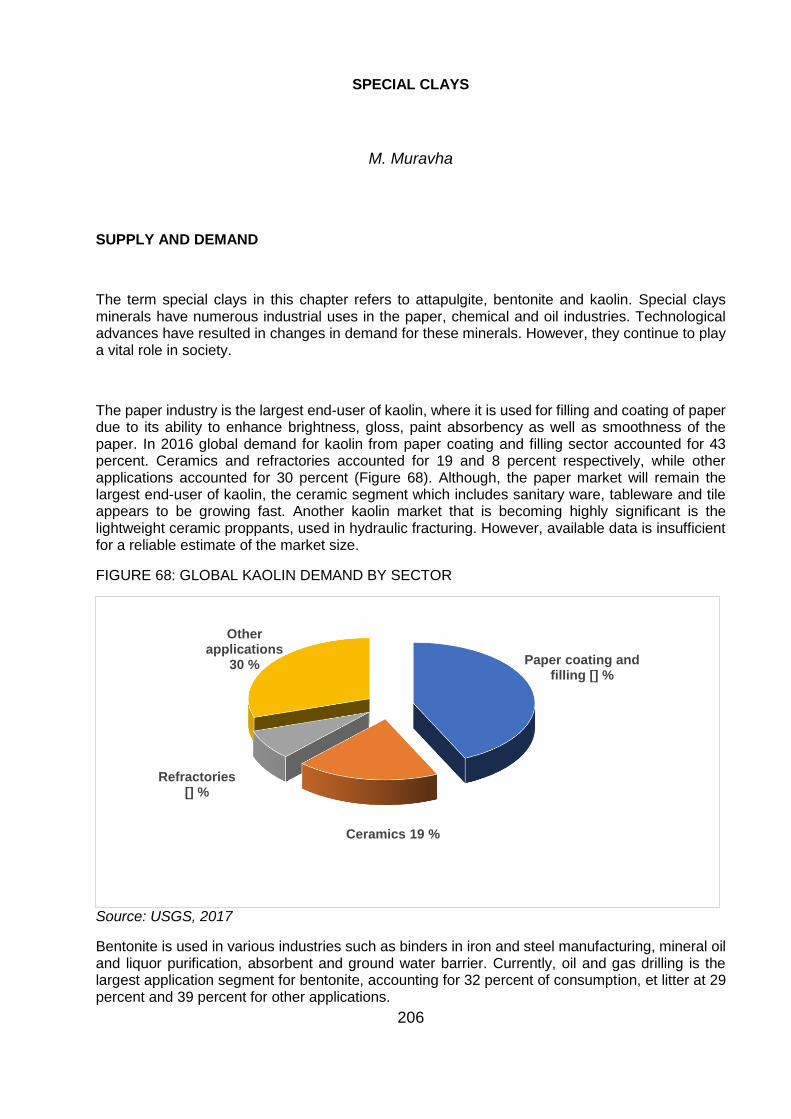
206
SPECIAL CLAYS
M. Muravha
SUPPLY AND DEMAND
The term special clays in this chapter refers to attapulgite, bentonite and kaolin. Special clays minerals have numerous industrial uses in the paper, chemical and oil industries. Technological advances have resulted in changes in demand for these minerals. However, they continue to play a vital role in society.
The paper industry is the largest end-user of kaolin, where it is used for filling and coating of paper due to its ability to enhance brightness, gloss, paint absorbency as well as smoothness of the paper. In 2016 global demand for kaolin from paper coating and filling sector accounted for 43 percent. Ceramics and refractories accounted for 19 and 8 percent respectively, while other applications accounted for 30 percent (Figure 68). Although, the paper market will remain the largest end-user of kaolin, the ceramic segment which includes sanitary ware, tableware and tile appears to be growing fast. Another kaolin market that is becoming highly significant is the lightweight ceramic proppants, used in hydraulic fracturing. However, available data is insufficient for a reliable estimate of the market size.
FIGURE 68: GLOBAL KAOLIN DEMAND BY SECTOR
Source: USGS, 2017
Bentonite is used in various industries such as binders in iron and steel manufacturing, mineral oil and liquor purification, absorbent and ground water barrier. Currently, oil and gas drilling is the largest application segment for bentonite, accounting for 32 percent of consumption, et litter at 29 percent and 39 percent for other applications.
Paper coating and filling [] %
Ceramics 19 %
Refractories [] %
Other applications
30 %
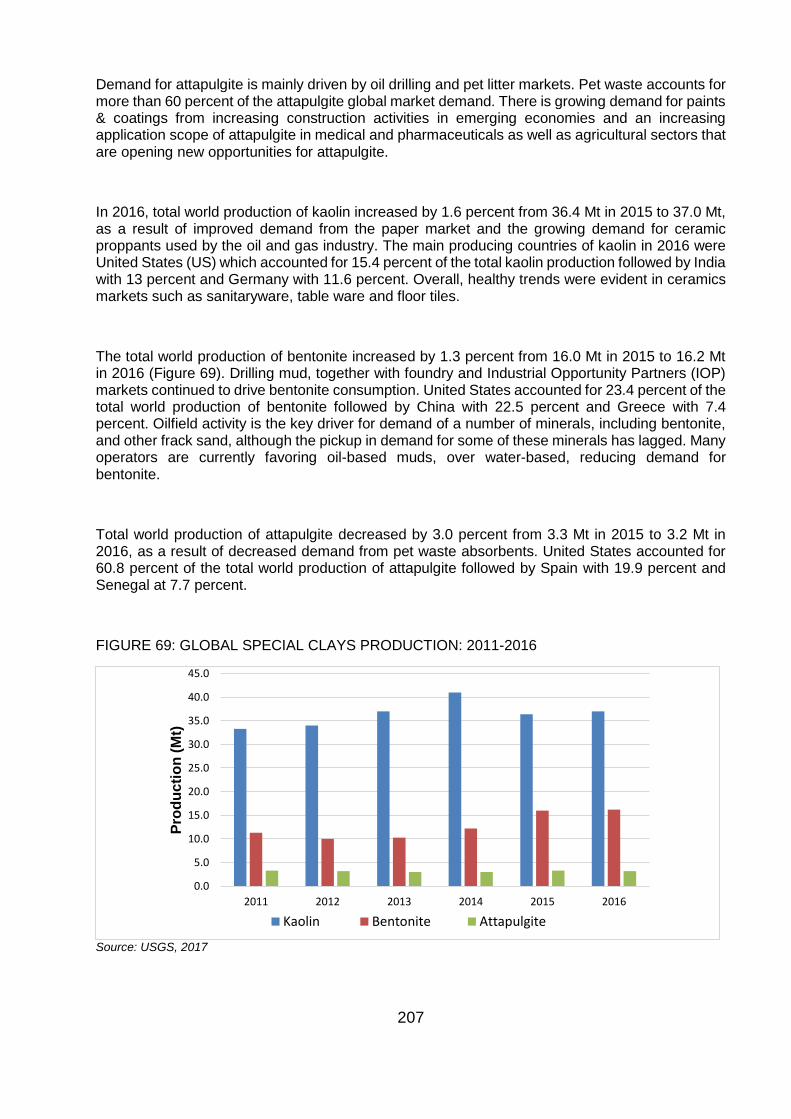
207
Demand for attapulgite is mainly driven by oil drilling and pet litter markets. Pet waste accounts for more than 60 percent of the attapulgite global market demand. There is growing demand for paints & coatings from increasing construction activities in emerging economies and an increasing application scope of attapulgite in medical and pharmaceuticals as well as agricultural sectors that are opening new opportunities for attapulgite.
In 2016, total world production of kaolin increased by 1.6 percent from 36.4 Mt in 2015 to 37.0 Mt, as a result of improved demand from the paper market and the growing demand for ceramic proppants used by the oil and gas industry. The main producing countries of kaolin in 2016 were United States (US) which accounted for 15.4 percent of the total kaolin production followed by India with 13 percent and Germany with 11.6 percent. Overall, healthy trends were evident in ceramics markets such as sanitaryware, table ware and floor tiles.
The total world production of bentonite increased by 1.3 percent from 16.0 Mt in 2015 to 16.2 Mt in 2016 (Figure 69). Drilling mud, together with foundry and Industrial Opportunity Partners (IOP) markets continued to drive bentonite consumption. United States accounted for 23.4 percent of the total world production of bentonite followed by China with 22.5 percent and Greece with 7.4 percent. Oilfield activity is the key driver for demand of a number of minerals, including bentonite, and other frack sand, although the pickup in demand for some of these minerals has lagged. Many operators are currently favoring oil-based muds, over water-based, reducing demand for bentonite.
Total world production of attapulgite decreased by 3.0 percent from 3.3 Mt in 2015 to 3.2 Mt in 2016, as a result of decreased demand from pet waste absorbents. United States accounted for 60.8 percent of the total world production of attapulgite followed by Spain with 19.9 percent and Senegal at 7.7 percent.
FIGURE 69: GLOBAL SPECIAL CLAYS PRODUCTION: 2011-2016
Source: USGS, 2017
0.0
5.0
10.0
15.0
20.0
25.0
30.0
35.0
40.0
45.0
2011 2012 2013 2014 2015 2016
Pro
du
cti
on
(M
t)
Kaolin Bentonite Attapulgite
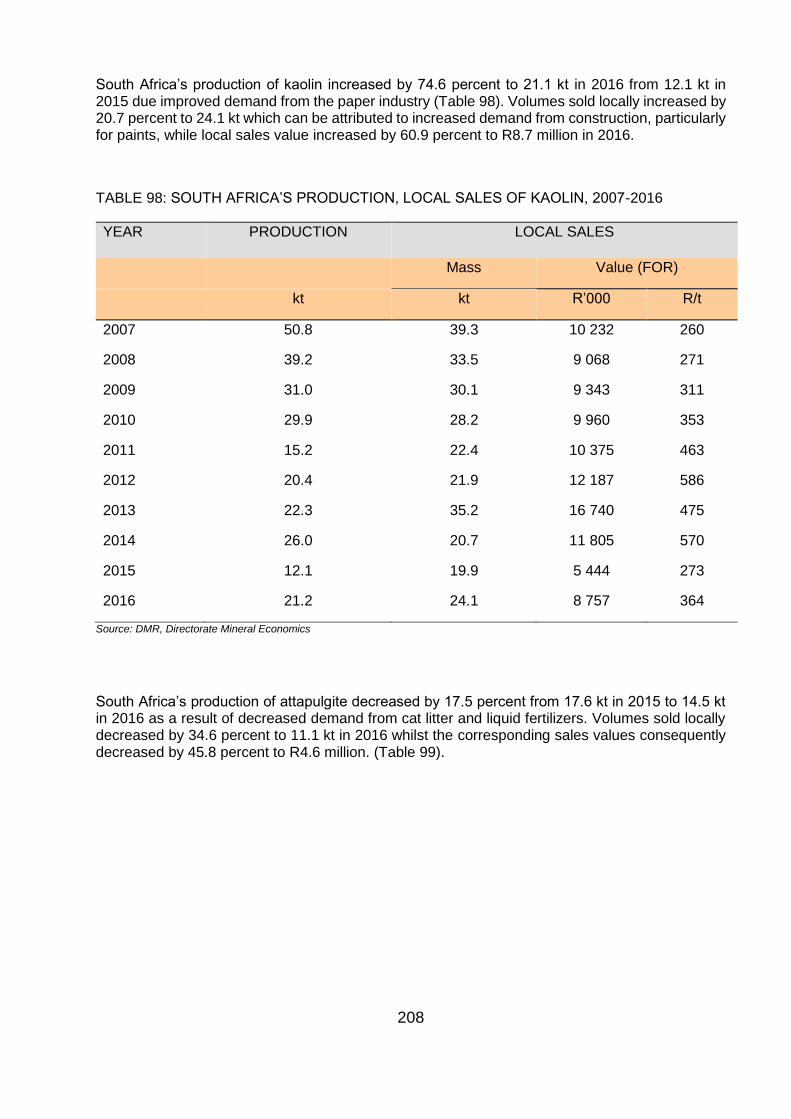
208
South Africa’s production of kaolin increased by 74.6 percent to 21.1 kt in 2016 from 12.1 kt in 2015 due improved demand from the paper industry (Table 98). Volumes sold locally increased by 20.7 percent to 24.1 kt which can be attributed to increased demand from construction, particularly for paints, while local sales value increased by 60.9 percent to R8.7 million in 2016.
TABLE 98: SOUTH AFRICA’S PRODUCTION, LOCAL SALES OF KAOLIN, 2007-2016
YEAR PRODUCTION LOCAL SALES
Mass Value (FOR)
kt kt R’000 R/t
2007 50.8 39.3 10 232 260
2008 39.2 33.5 9 068 271
2009 31.0 30.1 9 343 311
2010
2011
2012
2013
2014
2015
2016
29.9
15.2
20.4
22.3
26.0
12.1
21.2
28.2
22.4
21.9
35.2
20.7
19.9
24.1
9 960
10 375
12 187
16 740
11 805
5 444
8 757
353
463
586
475
570
273
364
Source: DMR, Directorate Mineral Economics
South Africa’s production of attapulgite decreased by 17.5 percent from 17.6 kt in 2015 to 14.5 kt in 2016 as a result of decreased demand from cat litter and liquid fertilizers. Volumes sold locally decreased by 34.6 percent to 11.1 kt in 2016 whilst the corresponding sales values consequently decreased by 45.8 percent to R4.6 million. (Table 99).
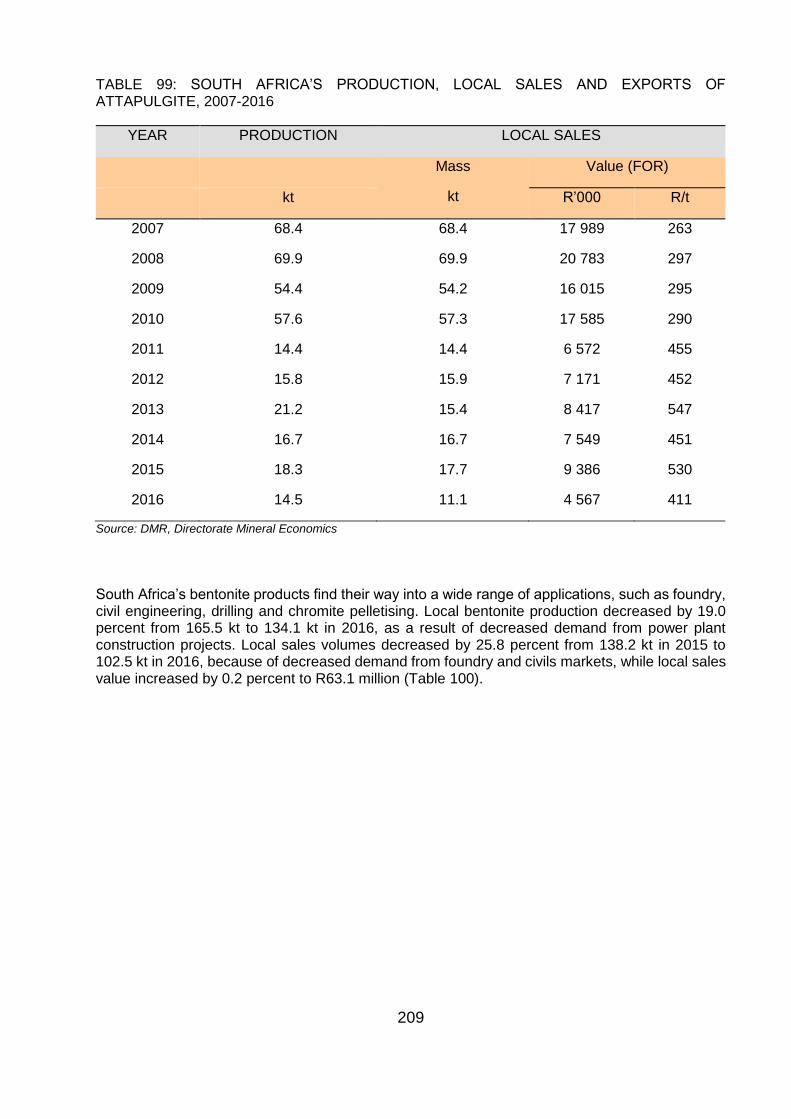
209
TABLE 99: SOUTH AFRICA’S PRODUCTION, LOCAL SALES AND EXPORTS OF ATTAPULGITE, 2007-2016
YEAR PRODUCTION LOCAL SALES
Mass
kt
Value (FOR)
kt R’000 R/t
2007 68.4 68.4 17 989 263
2008 69.9 69.9 20 783 297
2009 54.4 54.2 16 015 295
2010
2011
2012
2013
2014
2015
2016
57.6
14.4
15.8
21.2
16.7
18.3
14.5
57.3
14.4
15.9
15.4
16.7
17.7
11.1
17 585
6 572
7 171
8 417
7 549
9 386
4 567
290
455
452
547
451
530
411
Source: DMR, Directorate Mineral Economics
South Africa’s bentonite products find their way into a wide range of applications, such as foundry, civil engineering, drilling and chromite pelletising. Local bentonite production decreased by 19.0 percent from 165.5 kt to 134.1 kt in 2016, as a result of decreased demand from power plant construction projects. Local sales volumes decreased by 25.8 percent from 138.2 kt in 2015 to 102.5 kt in 2016, because of decreased demand from foundry and civils markets, while local sales value increased by 0.2 percent to R63.1 million (Table 100).
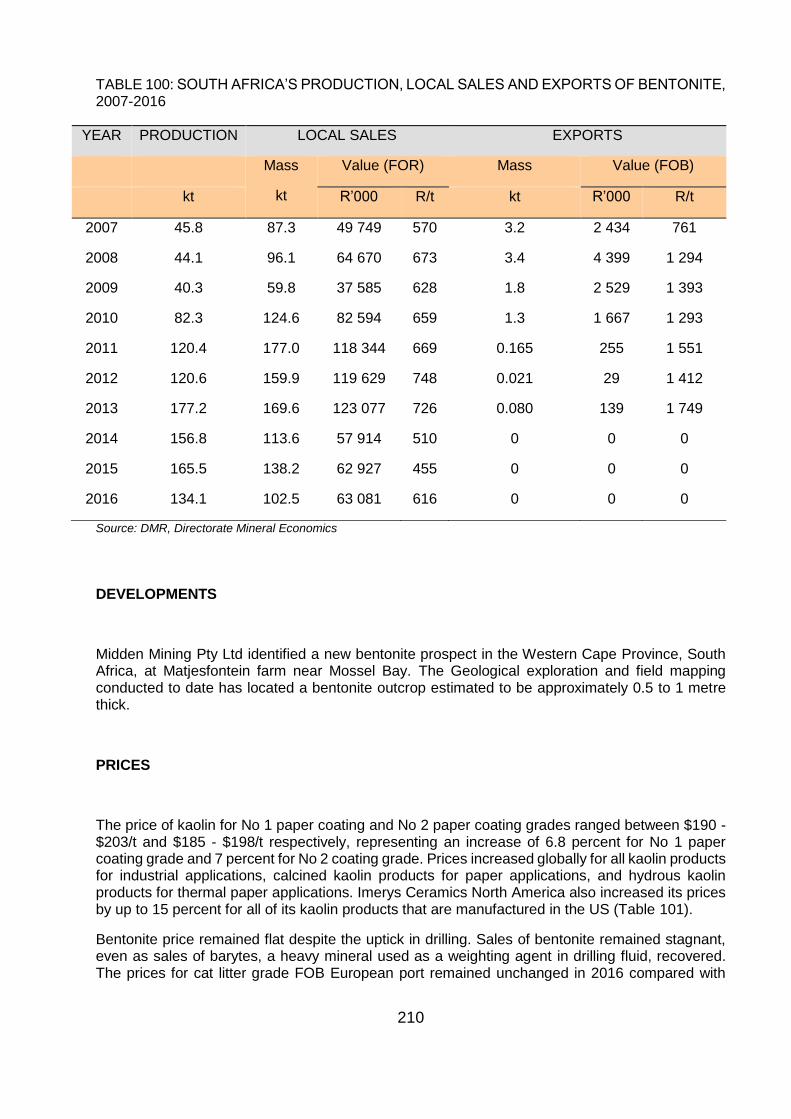
210
TABLE 100: SOUTH AFRICA’S PRODUCTION, LOCAL SALES AND EXPORTS OF BENTONITE, 2007-2016
YEAR PRODUCTION LOCAL SALES EXPORTS
Mass
kt
Value (FOR) Mass Value (FOB)
kt R’000 R/t kt R’000 R/t
2007 45.8 87.3 49 749 570 3.2 2 434 761
2008 44.1 96.1 64 670 673 3.4 4 399 1 294
2009 40.3 59.8 37 585 628 1.8 2 529 1 393
2010
2011
2012
2013
2014
2015
2016
82.3
120.4
120.6
177.2
156.8
165.5
134.1
124.6
177.0
159.9
169.6
113.6
138.2
102.5
82 594
118 344
119 629
123 077
57 914
62 927
63 081
659
669
748
726
510
455
616
1.3
0.165
0.021
0.080
0
0
0
1 667
255
29
139
0
0
0
1 293
1 551
1 412
1 749
0
0
0
Source: DMR, Directorate Mineral Economics
DEVELOPMENTS
Midden Mining Pty Ltd identified a new bentonite prospect in the Western Cape Province, South Africa, at Matjesfontein farm near Mossel Bay. The Geological exploration and field mapping conducted to date has located a bentonite outcrop estimated to be approximately 0.5 to 1 metre thick.
PRICES
The price of kaolin for No 1 paper coating and No 2 paper coating grades ranged between $190 - $203/t and $185 - $198/t respectively, representing an increase of 6.8 percent for No 1 paper coating grade and 7 percent for No 2 coating grade. Prices increased globally for all kaolin products for industrial applications, calcined kaolin products for paper applications, and hydrous kaolin products for thermal paper applications. Imerys Ceramics North America also increased its prices by up to 15 percent for all of its kaolin products that are manufactured in the US (Table 101).
Bentonite price remained flat despite the uptick in drilling. Sales of bentonite remained stagnant, even as sales of barytes, a heavy mineral used as a weighting agent in drilling fluid, recovered. The prices for cat litter grade FOB European port remained unchanged in 2016 compared with
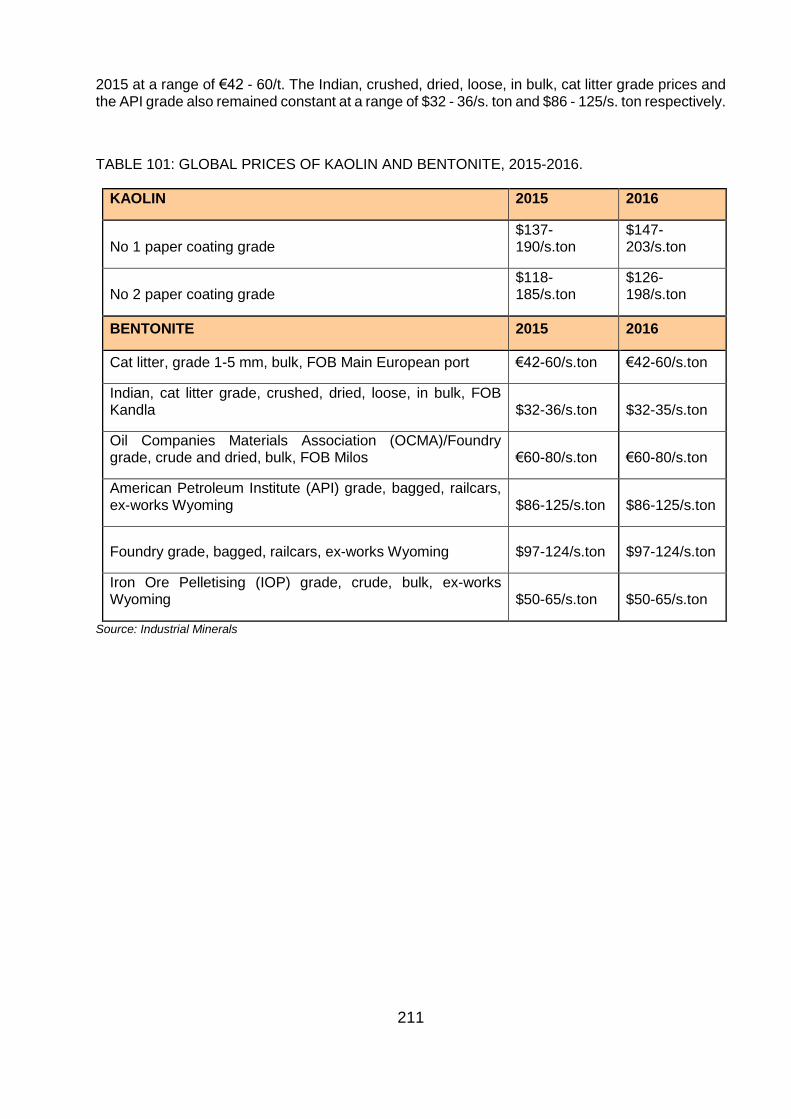
211
2015 at a range of €42 - 60/t. The Indian, crushed, dried, loose, in bulk, cat litter grade prices and the API grade also remained constant at a range of $32 - 36/s. ton and $86 - 125/s. ton respectively.
TABLE 101: GLOBAL PRICES OF KAOLIN AND BENTONITE, 2015-2016.
KAOLIN 2015 2016
No 1 paper coating grade $137-190/s.ton
$147-203/s.ton
No 2 paper coating grade $118-185/s.ton
$126-198/s.ton
BENTONITE 2015 2016
Cat litter, grade 1-5 mm, bulk, FOB Main European port €42-60/s.ton €42-60/s.ton
Indian, cat litter grade, crushed, dried, loose, in bulk, FOB Kandla $32-36/s.ton $32-35/s.ton
Oil Companies Materials Association (OCMA)/Foundry grade, crude and dried, bulk, FOB Milos €60-80/s.ton €60-80/s.ton
American Petroleum Institute (API) grade, bagged, railcars, ex-works Wyoming $86-125/s.ton $86-125/s.ton
Foundry grade, bagged, railcars, ex-works Wyoming $97-124/s.ton $97-124/s.ton
Iron Ore Pelletising (IOP) grade, crude, bulk, ex-works Wyoming $50-65/s.ton $50-65/s.ton
Source: Industrial Minerals
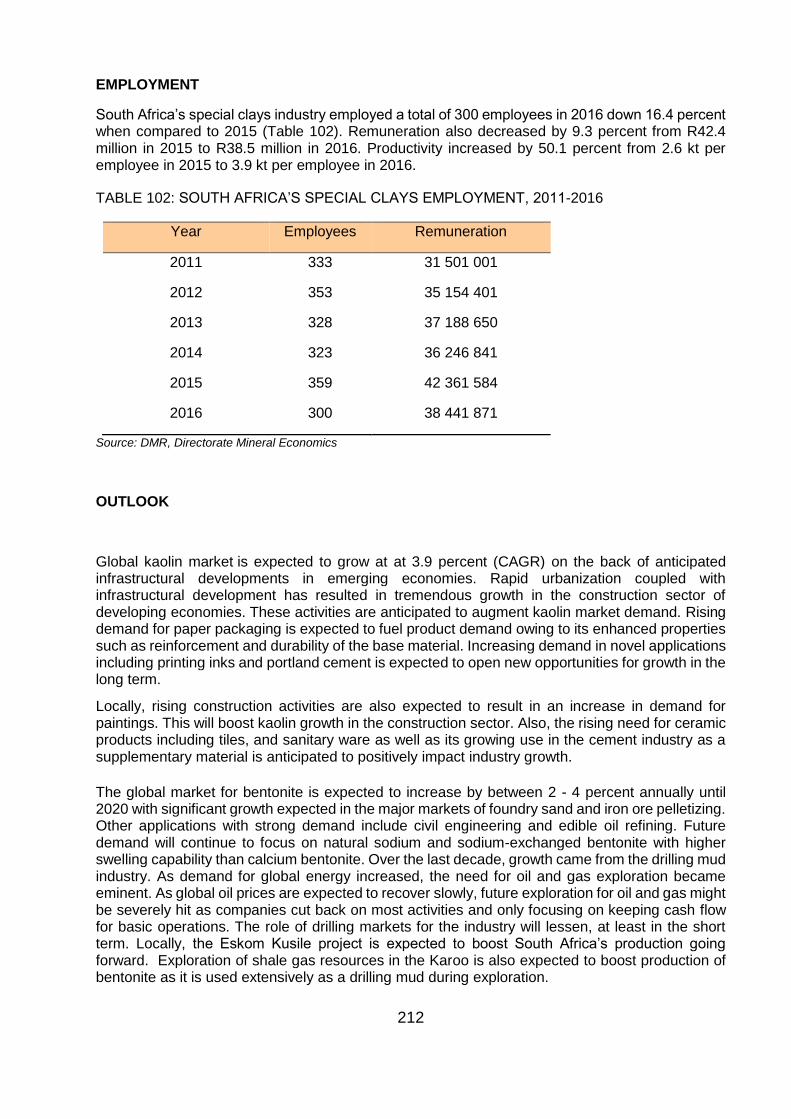
212
EMPLOYMENT
South Africa’s special clays industry employed a total of 300 employees in 2016 down 16.4 percent when compared to 2015 (Table 102). Remuneration also decreased by 9.3 percent from R42.4 million in 2015 to R38.5 million in 2016. Productivity increased by 50.1 percent from 2.6 kt per employee in 2015 to 3.9 kt per employee in 2016.
TABLE 102: SOUTH AFRICA’S SPECIAL CLAYS EMPLOYMENT, 2011-2016
Year Employees Remuneration
2011 333 31 501 001
2012 353 35 154 401
2013
2014
2015
2016
328
323
359
300
37 188 650
36 246 841
42 361 584
38 441 871
Source: DMR, Directorate Mineral Economics
OUTLOOK
Global kaolin market is expected to grow at at 3.9 percent (CAGR) on the back of anticipated infrastructural developments in emerging economies. Rapid urbanization coupled with infrastructural development has resulted in tremendous growth in the construction sector of developing economies. These activities are anticipated to augment kaolin market demand. Rising demand for paper packaging is expected to fuel product demand owing to its enhanced properties such as reinforcement and durability of the base material. Increasing demand in novel applications including printing inks and portland cement is expected to open new opportunities for growth in the long term.
Locally, rising construction activities are also expected to result in an increase in demand for paintings. This will boost kaolin growth in the construction sector. Also, the rising need for ceramic products including tiles, and sanitary ware as well as its growing use in the cement industry as a supplementary material is anticipated to positively impact industry growth.
The global market for bentonite is expected to increase by between 2 - 4 percent annually until 2020 with significant growth expected in the major markets of foundry sand and iron ore pelletizing. Other applications with strong demand include civil engineering and edible oil refining. Future demand will continue to focus on natural sodium and sodium-exchanged bentonite with higher swelling capability than calcium bentonite. Over the last decade, growth came from the drilling mud industry. As demand for global energy increased, the need for oil and gas exploration became eminent. As global oil prices are expected to recover slowly, future exploration for oil and gas might be severely hit as companies cut back on most activities and only focusing on keeping cash flow for basic operations. The role of drilling markets for the industry will lessen, at least in the short term. Locally, the Eskom Kusile project is expected to boost South Africa’s production going forward. Exploration of shale gas resources in the Karoo is also expected to boost production of bentonite as it is used extensively as a drilling mud during exploration.
213
Globally, attapulgite market has witnessed substantial growth over the past few years, on account of increasing demand from oil & gas industry. Growing demand for paints & coatings owing to increasing construction activities in emerging economies is likely to positively impact the attapulgite market in the next six years. In addition, demand will be driven by the cat litter market growth. Furthermore, increasing application scope of attapulgite in medical & pharmaceuticals as well agricultural sectors is likely to open new opportunities for attapulgite in near future.
REFERENCES
1. Department of Mineral Resources, Directorate Mineral Economics, 2017
2. Merchant Research and Consulting Ltd. Bentonite and kaolin: 2017 World Market Review and Forecast
3. IMERYS Group, personal communication,2016
4. Industrial Minerals Magazine, various articles,2016
5. Industry analysis: attapulgite market grandviewresearch.com,
6. Mineral commodity summaries 2016
7. United States Geological Survey, Mineral Commodity Summaries, Clays, January 2017, https://www.usgs.gov (accessed: May 2017)
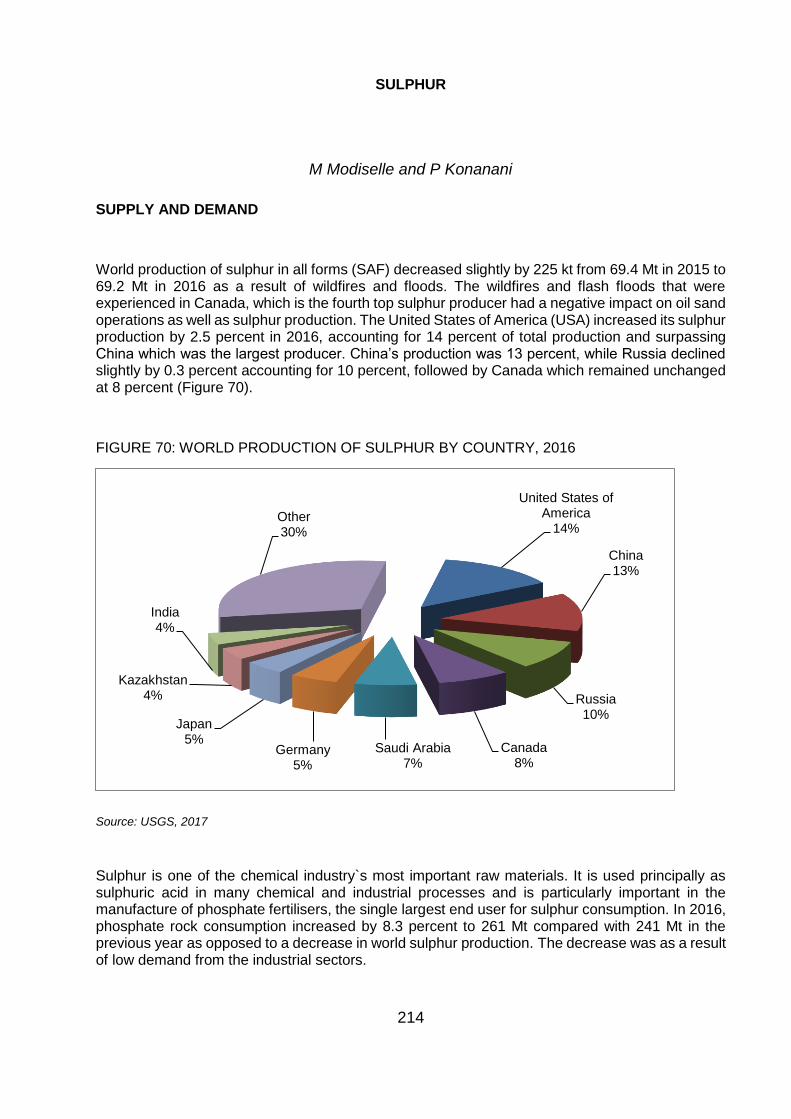
214
SULPHUR
M Modiselle and P Konanani
SUPPLY AND DEMAND
World production of sulphur in all forms (SAF) decreased slightly by 225 kt from 69.4 Mt in 2015 to 69.2 Mt in 2016 as a result of wildfires and floods. The wildfires and flash floods that were experienced in Canada, which is the fourth top sulphur producer had a negative impact on oil sand operations as well as sulphur production. The United States of America (USA) increased its sulphur production by 2.5 percent in 2016, accounting for 14 percent of total production and surpassing China which was the largest producer. China’s production was 13 percent, while Russia declined slightly by 0.3 percent accounting for 10 percent, followed by Canada which remained unchanged at 8 percent (Figure 70).
FIGURE 70: WORLD PRODUCTION OF SULPHUR BY COUNTRY, 2016
Source: USGS, 2017
Sulphur is one of the chemical industry`s most important raw materials. It is used principally as sulphuric acid in many chemical and industrial processes and is particularly important in the manufacture of phosphate fertilisers, the single largest end user for sulphur consumption. In 2016, phosphate rock consumption increased by 8.3 percent to 261 Mt compared with 241 Mt in the previous year as opposed to a decrease in world sulphur production. The decrease was as a result of low demand from the industrial sectors.
United States of America
14%
China13%
Russia10%
Canada8%
Saudi Arabia7%
Germany5%
Japan5%
Kazakhstan4%
India4%
Other30%
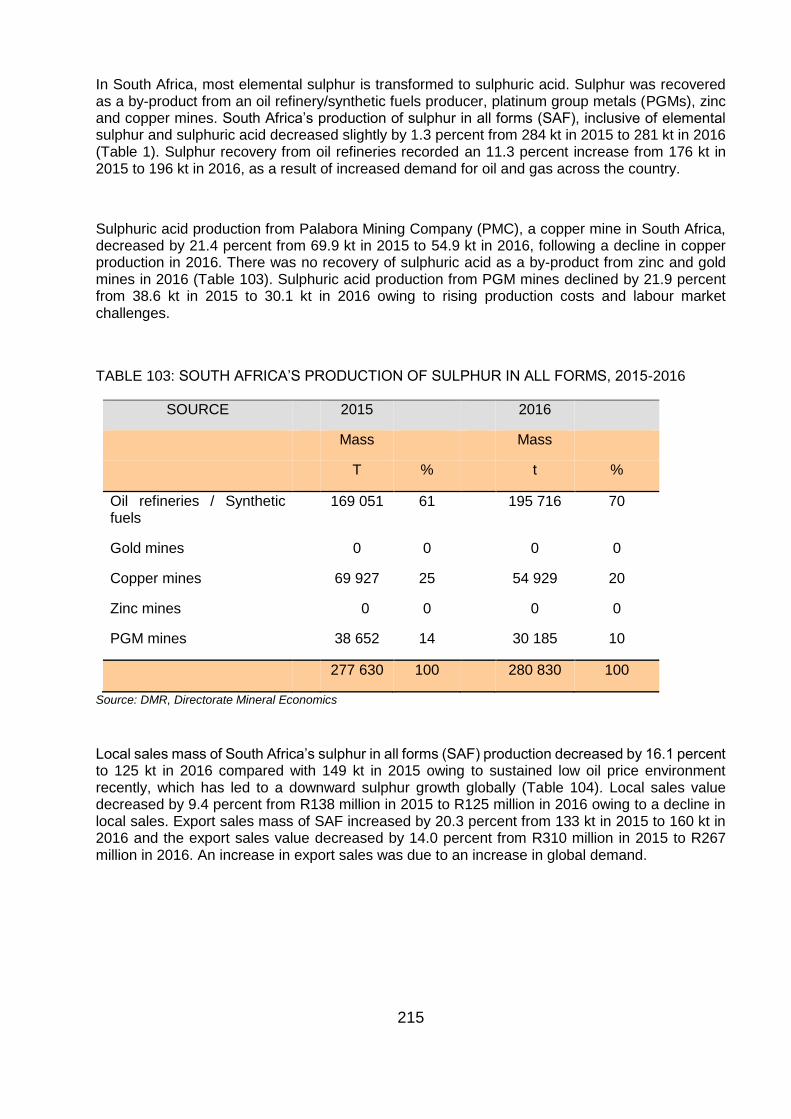
215
In South Africa, most elemental sulphur is transformed to sulphuric acid. Sulphur was recovered as a by-product from an oil refinery/synthetic fuels producer, platinum group metals (PGMs), zinc and copper mines. South Africa’s production of sulphur in all forms (SAF), inclusive of elemental sulphur and sulphuric acid decreased slightly by 1.3 percent from 284 kt in 2015 to 281 kt in 2016 (Table 1). Sulphur recovery from oil refineries recorded an 11.3 percent increase from 176 kt in 2015 to 196 kt in 2016, as a result of increased demand for oil and gas across the country.
Sulphuric acid production from Palabora Mining Company (PMC), a copper mine in South Africa, decreased by 21.4 percent from 69.9 kt in 2015 to 54.9 kt in 2016, following a decline in copper production in 2016. There was no recovery of sulphuric acid as a by-product from zinc and gold mines in 2016 (Table 103). Sulphuric acid production from PGM mines declined by 21.9 percent from 38.6 kt in 2015 to 30.1 kt in 2016 owing to rising production costs and labour market challenges.
TABLE 103: SOUTH AFRICA’S PRODUCTION OF SULPHUR IN ALL FORMS, 2015-2016
SOURCE 2015 2016
Mass Mass
T % t %
Oil refineries / Synthetic fuels
169 051 61 195 716 70
Gold mines 0 0 0 0
Copper mines 69 927 25 54 929 20
Zinc mines 0 0 0 0
PGM mines 38 652 14 30 185 10
277 630 100 280 830 100
Source: DMR, Directorate Mineral Economics
Local sales mass of South Africa’s sulphur in all forms (SAF) production decreased by 16.1 percent to 125 kt in 2016 compared with 149 kt in 2015 owing to sustained low oil price environment recently, which has led to a downward sulphur growth globally (Table 104). Local sales value decreased by 9.4 percent from R138 million in 2015 to R125 million in 2016 owing to a decline in local sales. Export sales mass of SAF increased by 20.3 percent from 133 kt in 2015 to 160 kt in 2016 and the export sales value decreased by 14.0 percent from R310 million in 2015 to R267 million in 2016. An increase in export sales was due to an increase in global demand.
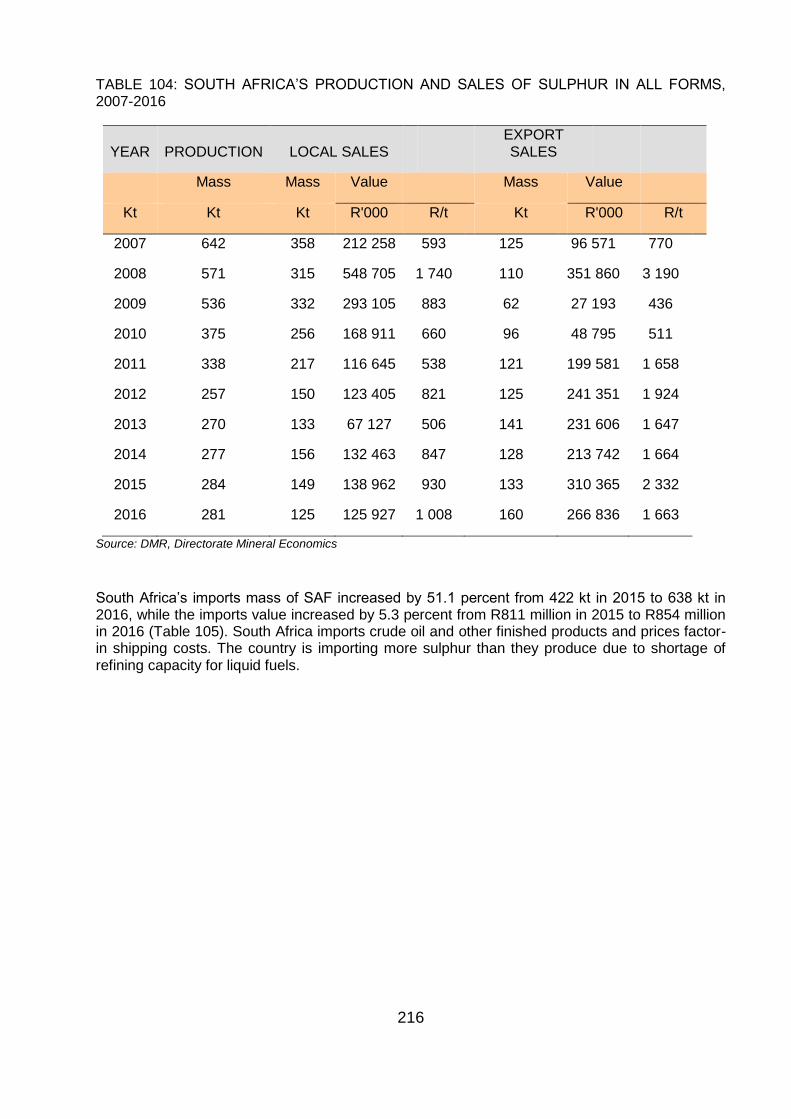
216
TABLE 104: SOUTH AFRICA’S PRODUCTION AND SALES OF SULPHUR IN ALL FORMS, 2007-2016
YEAR PRODUCTION LOCAL SALES EXPORT SALES
Mass Mass Value Mass Value
Kt Kt Kt R'000 R/t Kt R'000 R/t
2007 642 358 212 258 593 125 96 571 770
2008 571 315 548 705 1 740 110 351 860 3 190
2009 536 332 293 105 883 62 27 193 436
2010 375 256 168 911 660 96 48 795 511
2011
2012
338
257
217
150
116 645
123 405
538
821
121
125
199 581
241 351
1 658
1 924
2013 270 133 67 127 506 141 231 606 1 647
2014
2015
277
284
156
149
132 463
138 962
847
930
128
133
213 742
310 365
1 664
2 332
2016 281 125 125 927 1 008 160 266 836 1 663
Source: DMR, Directorate Mineral Economics
South Africa’s imports mass of SAF increased by 51.1 percent from 422 kt in 2015 to 638 kt in 2016, while the imports value increased by 5.3 percent from R811 million in 2015 to R854 million in 2016 (Table 105). South Africa imports crude oil and other finished products and prices factor-in shipping costs. The country is importing more sulphur than they produce due to shortage of refining capacity for liquid fuels.
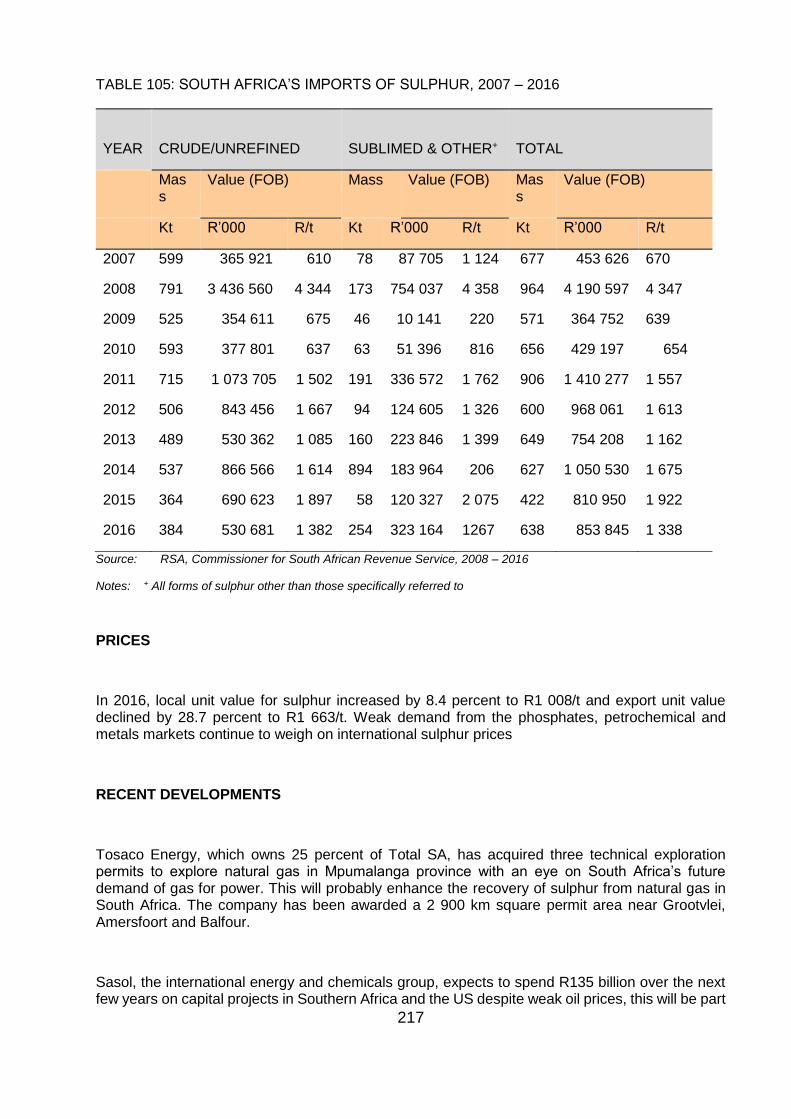
217
TABLE 105: SOUTH AFRICA’S IMPORTS OF SULPHUR, 2007 – 2016
YEAR
CRUDE/UNREFINED
SUBLIMED & OTHER+
TOTAL
Mass
Value (FOB) Mass Value (FOB) Mass
Value (FOB)
Kt R’000 R/t Kt R’000 R/t Kt R’000 R/t
2007
2008
599
791
365 921
3 436 560
610
4 344
78
173
87 705
754 037
1 124
4 358
677
964
453 626
4 190 597
670
4 347
2009 525 354 611 675 46 10 141 220 571 364 752 639
2010 593 377 801 637 63 51 396 816 656 429 197 654
2011
2012
2013
2014
2015
715
506
489
537
364
1 073 705
843 456
530 362
866 566
690 623
1 502
1 667
1 085
1 614
1 897
191
94
160
894
58
336 572
124 605
223 846
183 964
120 327
1 762
1 326
1 399
206
2 075
906
600
649
627
422
1 410 277
968 061
754 208
1 050 530
810 950
1 557
1 613
1 162
1 675
1 922
2016 384 530 681 1 382 254 323 164 1267 638 853 845 1 338
Source: RSA, Commissioner for South African Revenue Service, 2008 – 2016
Notes: + All forms of sulphur other than those specifically referred to
PRICES
In 2016, local unit value for sulphur increased by 8.4 percent to R1 008/t and export unit value declined by 28.7 percent to R1 663/t. Weak demand from the phosphates, petrochemical and metals markets continue to weigh on international sulphur prices
RECENT DEVELOPMENTS
Tosaco Energy, which owns 25 percent of Total SA, has acquired three technical exploration permits to explore natural gas in Mpumalanga province with an eye on South Africa’s future demand of gas for power. This will probably enhance the recovery of sulphur from natural gas in South Africa. The company has been awarded a 2 900 km square permit area near Grootvlei, Amersfoort and Balfour.
Sasol, the international energy and chemicals group, expects to spend R135 billion over the next few years on capital projects in Southern Africa and the US despite weak oil prices, this will be part
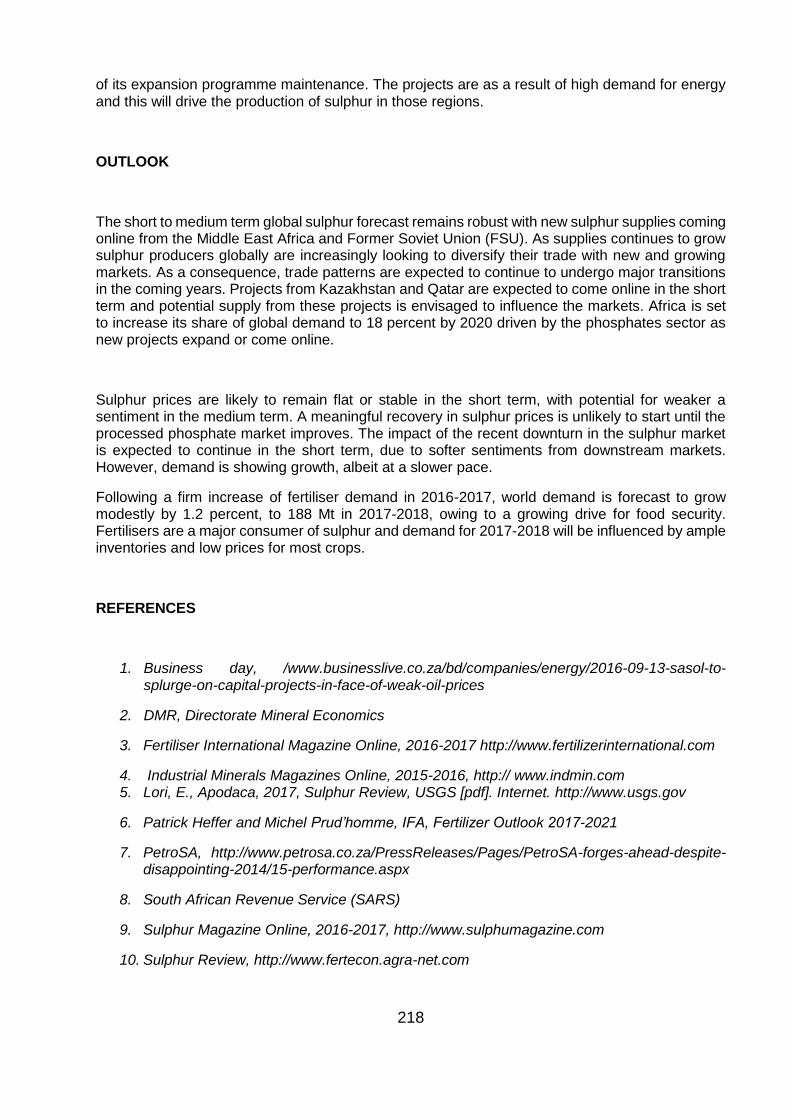
218
of its expansion programme maintenance. The projects are as a result of high demand for energy and this will drive the production of sulphur in those regions.
OUTLOOK
The short to medium term global sulphur forecast remains robust with new sulphur supplies coming online from the Middle East Africa and Former Soviet Union (FSU). As supplies continues to grow sulphur producers globally are increasingly looking to diversify their trade with new and growing markets. As a consequence, trade patterns are expected to continue to undergo major transitions in the coming years. Projects from Kazakhstan and Qatar are expected to come online in the short term and potential supply from these projects is envisaged to influence the markets. Africa is set to increase its share of global demand to 18 percent by 2020 driven by the phosphates sector as new projects expand or come online.
Sulphur prices are likely to remain flat or stable in the short term, with potential for weaker a sentiment in the medium term. A meaningful recovery in sulphur prices is unlikely to start until the processed phosphate market improves. The impact of the recent downturn in the sulphur market is expected to continue in the short term, due to softer sentiments from downstream markets. However, demand is showing growth, albeit at a slower pace.
Following a firm increase of fertiliser demand in 2016-2017, world demand is forecast to grow modestly by 1.2 percent, to 188 Mt in 2017-2018, owing to a growing drive for food security. Fertilisers are a major consumer of sulphur and demand for 2017-2018 will be influenced by ample inventories and low prices for most crops.
REFERENCES
1. Business day, /www.businesslive.co.za/bd/companies/energy/2016-09-13-sasol-to-splurge-on-capital-projects-in-face-of-weak-oil-prices
2. DMR, Directorate Mineral Economics
3. Fertiliser International Magazine Online, 2016-2017 http://www.fertilizerinternational.com
4. Industrial Minerals Magazines Online, 2015-2016, http:// www.indmin.com 5. Lori, E., Apodaca, 2017, Sulphur Review, USGS [pdf]. Internet. http://www.usgs.gov
6. Patrick Heffer and Michel Prud’homme, IFA, Fertilizer Outlook 2017-2021
7. PetroSA, http://www.petrosa.co.za/PressReleases/Pages/PetroSA-forges-ahead-despite-disappointing-2014/15-performance.aspx
8. South African Revenue Service (SARS)
9. Sulphur Magazine Online, 2016-2017, http://www.sulphumagazine.com
10. Sulphur Review, http://www.fertecon.agra-net.com
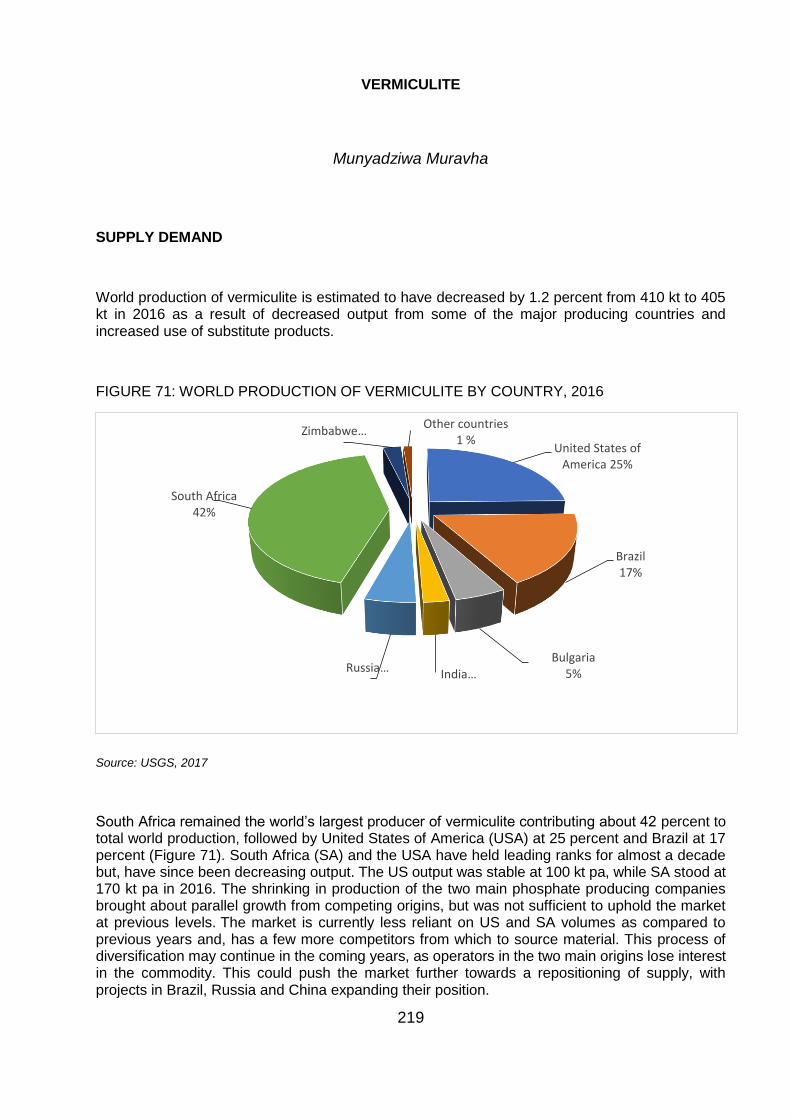
219
VERMICULITE
Munyadziwa Muravha
SUPPLY DEMAND
World production of vermiculite is estimated to have decreased by 1.2 percent from 410 kt to 405 kt in 2016 as a result of decreased output from some of the major producing countries and increased use of substitute products.
FIGURE 71: WORLD PRODUCTION OF VERMICULITE BY COUNTRY, 2016
Source: USGS, 2017
South Africa remained the world’s largest producer of vermiculite contributing about 42 percent to total world production, followed by United States of America (USA) at 25 percent and Brazil at 17 percent (Figure 71). South Africa (SA) and the USA have held leading ranks for almost a decade but, have since been decreasing output. The US output was stable at 100 kt pa, while SA stood at 170 kt pa in 2016. The shrinking in production of the two main phosphate producing companies brought about parallel growth from competing origins, but was not sufficient to uphold the market at previous levels. The market is currently less reliant on US and SA volumes as compared to previous years and, has a few more competitors from which to source material. This process of diversification may continue in the coming years, as operators in the two main origins lose interest in the commodity. This could push the market further towards a repositioning of supply, with projects in Brazil, Russia and China expanding their position.
United States of America 25%
Brazil 17%
Bulgaria 5%India …Russia …
South Africa42%
Zimbabwe …Other countries
1 %
220
Globally horticulture accounted for 50 percent of vermiculite consumption followed by light weight concrete at 10 percent and insulation applications at 5 percent (Figure 72). Demand for vermiculite is closely tied to some of the world’s most GDP-sensitive markets, including construction and crop production. Vermiculite has a potential of growth into other applications such as, animal feed, fire protection materials and acting as a good substitute for asbestos. Fruit and vegetable growers around the world are continually trying to maximise yields from ever smaller areas of land, with as little water input as possible and nutrients like vermiculite have played an important role in achieving these aims. However, vermiculite is also facing a challenge of increase of a number of substitute products in the market, such as expanded perlite, shale, clay and slag.
World vermiculite consumption decreased and, this is mainly due to substitution and new methods in end use markets. This has created a much more competitive market, which has benefitted customers, as suppliers have had to improve their offerings.
FIGURE 72: VERMICULITE CONSUMPTION BY SECTOR, 2016
Source: USGS Commodity Summaries, 2017
Europe remains the main market for South African’s vermiculite whilst North America and Asia show, big growth potential for future consumption.
Palabora Mining Company (PMC) is the world’s largest producer of vermiculite and South Africa’s sole vermiculite producer. PMC’s production of vermiculite increased by 20.3 percent to 143.0 kt in 2016 compared with 138.3 kt in 2015 which can be attributed to increased demand from the construction and the fire protection sectors (Table 106).
Tonnages sold locally increased by 12.6 percent to 10.5 kt in 2016 compared with 9.3 kt in 2015, while local sales values increased by 22.9 percent to R24.9 million in the same period, due to strong demand from agriculture and horticulture sectors. Export volumes decreased by 50.7 percent from 115.1 kt to 56.8 kt in 2016 due to decreased demand for medium to finer grains that are currently produced at Palabora Mining Company (PMC), while export sales values decreased
Agriculture50%
Concrete aggregates
10%
Insulation5%
Other35%
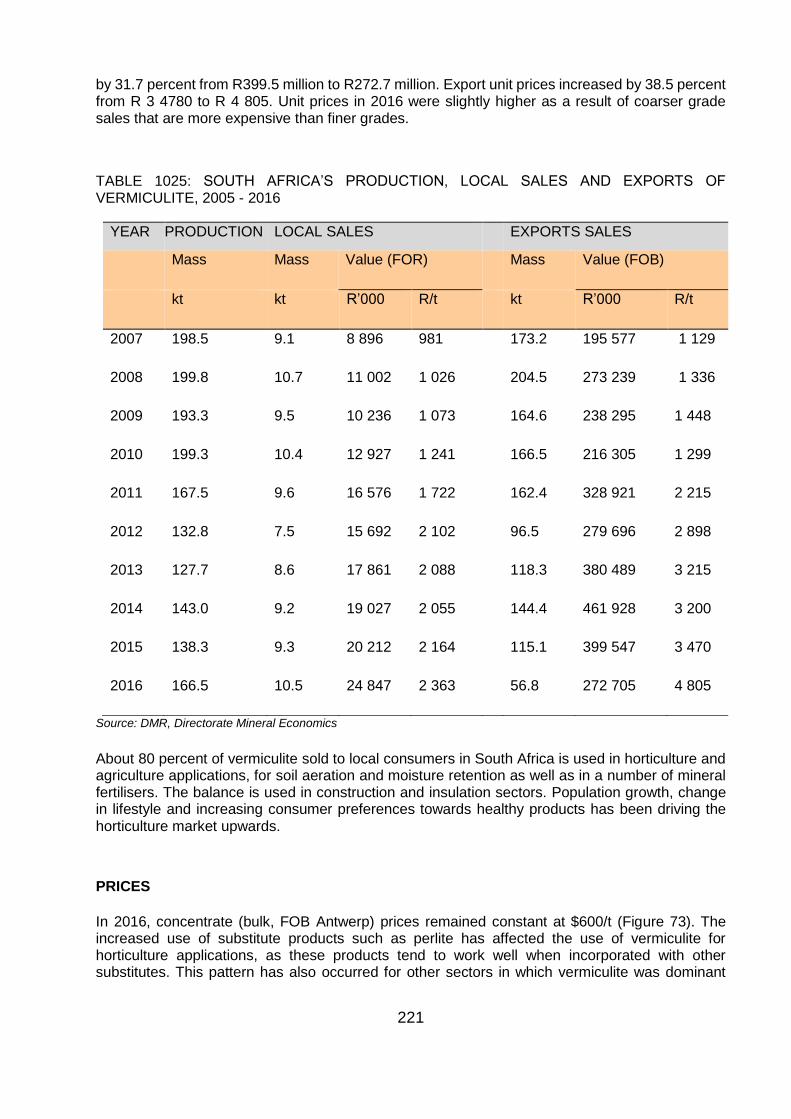
221
by 31.7 percent from R399.5 million to R272.7 million. Export unit prices increased by 38.5 percent from R 3 4780 to R 4 805. Unit prices in 2016 were slightly higher as a result of coarser grade sales that are more expensive than finer grades.
TABLE 1025: SOUTH AFRICA’S PRODUCTION, LOCAL SALES AND EXPORTS OF VERMICULITE, 2005 - 2016
YEAR PRODUCTION LOCAL SALES EXPORTS SALES
Mass Mass Value (FOR) Mass Value (FOB)
kt kt R’000 R/t kt R’000 R/t
2007 198.5 9.1 8 896 981 173.2 195 577 1 129
2008 199.8 10.7 11 002 1 026 204.5 273 239 1 336
2009 193.3 9.5 10 236 1 073 164.6 238 295 1 448
2010 199.3 10.4 12 927 1 241 166.5 216 305 1 299
2011 167.5 9.6 16 576 1 722 162.4 328 921 2 215
2012 132.8 7.5 15 692 2 102 96.5 279 696 2 898
2013 127.7 8.6 17 861 2 088 118.3 380 489 3 215
2014 143.0 9.2 19 027 2 055 144.4 461 928 3 200
2015 138.3 9.3 20 212 2 164 115.1 399 547 3 470
2016 166.5 10.5 24 847 2 363 56.8 272 705 4 805
Source: DMR, Directorate Mineral Economics
About 80 percent of vermiculite sold to local consumers in South Africa is used in horticulture and agriculture applications, for soil aeration and moisture retention as well as in a number of mineral fertilisers. The balance is used in construction and insulation sectors. Population growth, change in lifestyle and increasing consumer preferences towards healthy products has been driving the horticulture market upwards.
PRICES
In 2016, concentrate (bulk, FOB Antwerp) prices remained constant at $600/t (Figure 73). The increased use of substitute products such as perlite has affected the use of vermiculite for horticulture applications, as these products tend to work well when incorporated with other substitutes. This pattern has also occurred for other sectors in which vermiculite was dominant
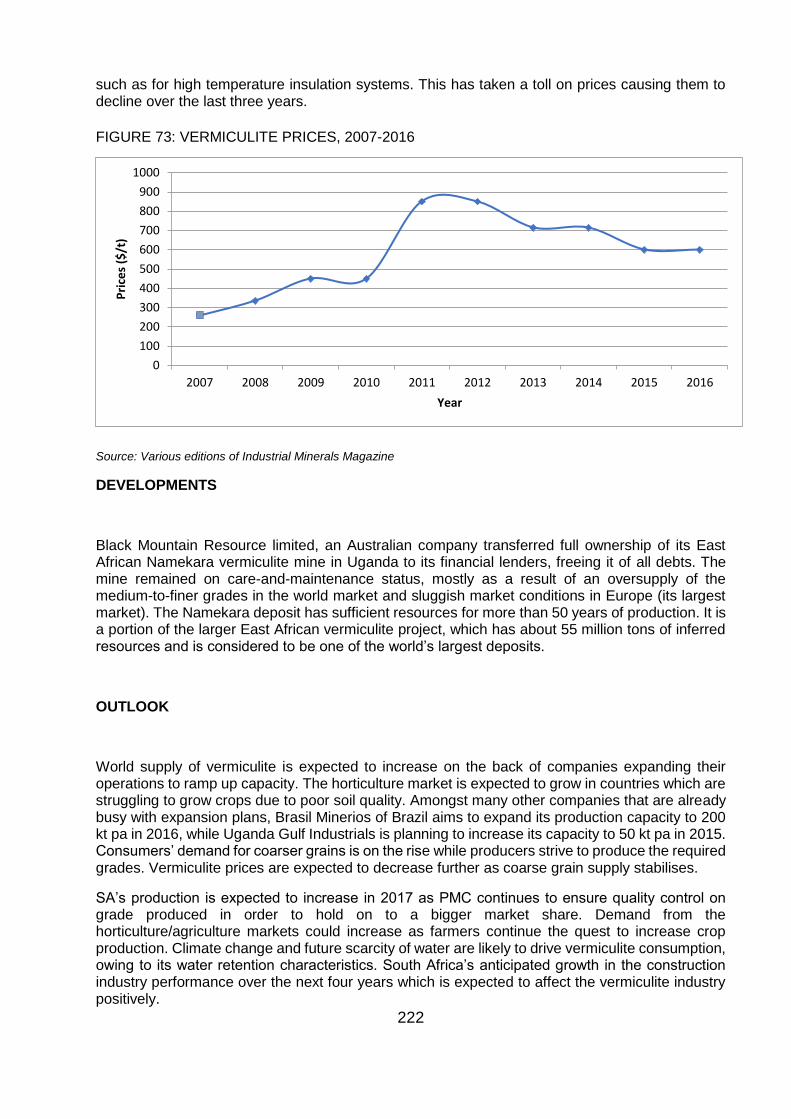
222
such as for high temperature insulation systems. This has taken a toll on prices causing them to decline over the last three years.
FIGURE 73: VERMICULITE PRICES, 2007-2016
Source: Various editions of Industrial Minerals Magazine
DEVELOPMENTS
Black Mountain Resource limited, an Australian company transferred full ownership of its East African Namekara vermiculite mine in Uganda to its financial lenders, freeing it of all debts. The mine remained on care-and-maintenance status, mostly as a result of an oversupply of the medium-to-finer grades in the world market and sluggish market conditions in Europe (its largest market). The Namekara deposit has sufficient resources for more than 50 years of production. It is a portion of the larger East African vermiculite project, which has about 55 million tons of inferred resources and is considered to be one of the world’s largest deposits.
OUTLOOK
World supply of vermiculite is expected to increase on the back of companies expanding their operations to ramp up capacity. The horticulture market is expected to grow in countries which are struggling to grow crops due to poor soil quality. Amongst many other companies that are already busy with expansion plans, Brasil Minerios of Brazil aims to expand its production capacity to 200 kt pa in 2016, while Uganda Gulf Industrials is planning to increase its capacity to 50 kt pa in 2015. Consumers’ demand for coarser grains is on the rise while producers strive to produce the required grades. Vermiculite prices are expected to decrease further as coarse grain supply stabilises.
SA’s production is expected to increase in 2017 as PMC continues to ensure quality control on grade produced in order to hold on to a bigger market share. Demand from the horticulture/agriculture markets could increase as farmers continue the quest to increase crop production. Climate change and future scarcity of water are likely to drive vermiculite consumption, owing to its water retention characteristics. South Africa’s anticipated growth in the construction industry performance over the next four years which is expected to affect the vermiculite industry positively.
0
100
200
300
400
500
600
700
800
900
1000
2007 2008 2009 2010 2011 2012 2013 2014 2015 2016
Pri
ces
($/t
)
Year
223
REFERENCES
1. Department of Mineral Resources, Directorate Mineral Economics ,2017
2. Industrial Minerals, 2016.Growing gains: Perlite and Vermiculite, July 2017 http://www.indmin.com/Article/3730509/Growing-gains-Perlite-and-vermiculite.html
3. Merchant Research and Consulting: Perlite and Vermiculite: Global Market Review 2015/2016
4. Palabora Mining Company, personal communication,2016
5. United States Geological Survey, Mineral Commodity Summaries, Phosphate Rock, January 2017, https://www.usgs.gov (accessed: May 2017)
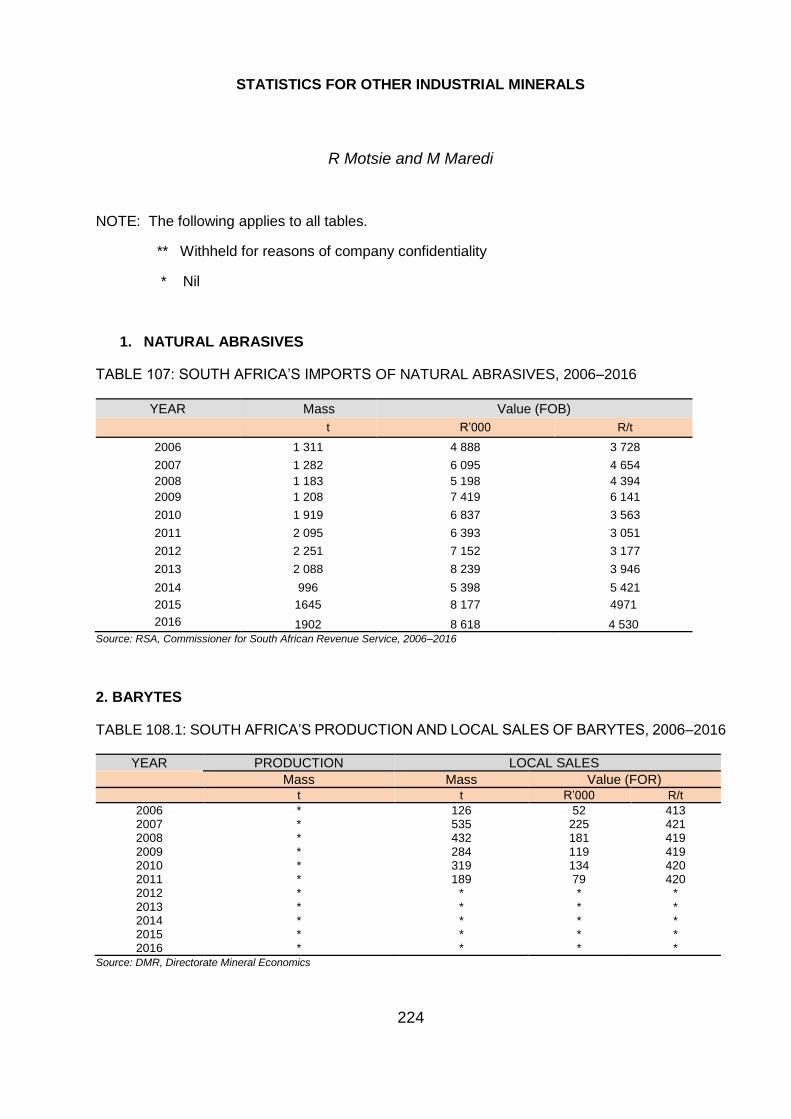
224
STATISTICS FOR OTHER INDUSTRIAL MINERALS
R Motsie and M Maredi
NOTE: The following applies to all tables.
** Withheld for reasons of company confidentiality
* Nil
1. NATURAL ABRASIVES
TABLE 107: SOUTH AFRICA’S IMPORTS OF NATURAL ABRASIVES, 2006–2016
YEAR Mass Value (FOB)
t R’000 R/t
2006 1 311 4 888 3 728
2007 1 282 6 095 4 654
2008 1 183 5 198 4 394
2009 1 208 7 419 6 141
2010 1 919 6 837 3 563
2011 2 095 6 393 3 051
2012 2 251 7 152 3 177
2013 2 088 8 239 3 946
2014 996 5 398 5 421
2015 1645 8 177 4971
2016 1902 8 618 4 530 Source: RSA, Commissioner for South African Revenue Service, 2006–2016
2. BARYTES
TABLE 108.1: SOUTH AFRICA’S PRODUCTION AND LOCAL SALES OF BARYTES, 2006–2016
YEAR PRODUCTION LOCAL SALES
Mass Mass Value (FOR) t t R’000 R/t
2006 * 126 52 413 2007 * 535 225 421 2008 * 432 181 419 2009 * 284 119 419 2010 * 319 134 420 2011 * 189 79 420 2012 * * * * 2013 * * * * 2014 * * * * 2015 * * * * 2016 * * * *
Source: DMR, Directorate Mineral Economics
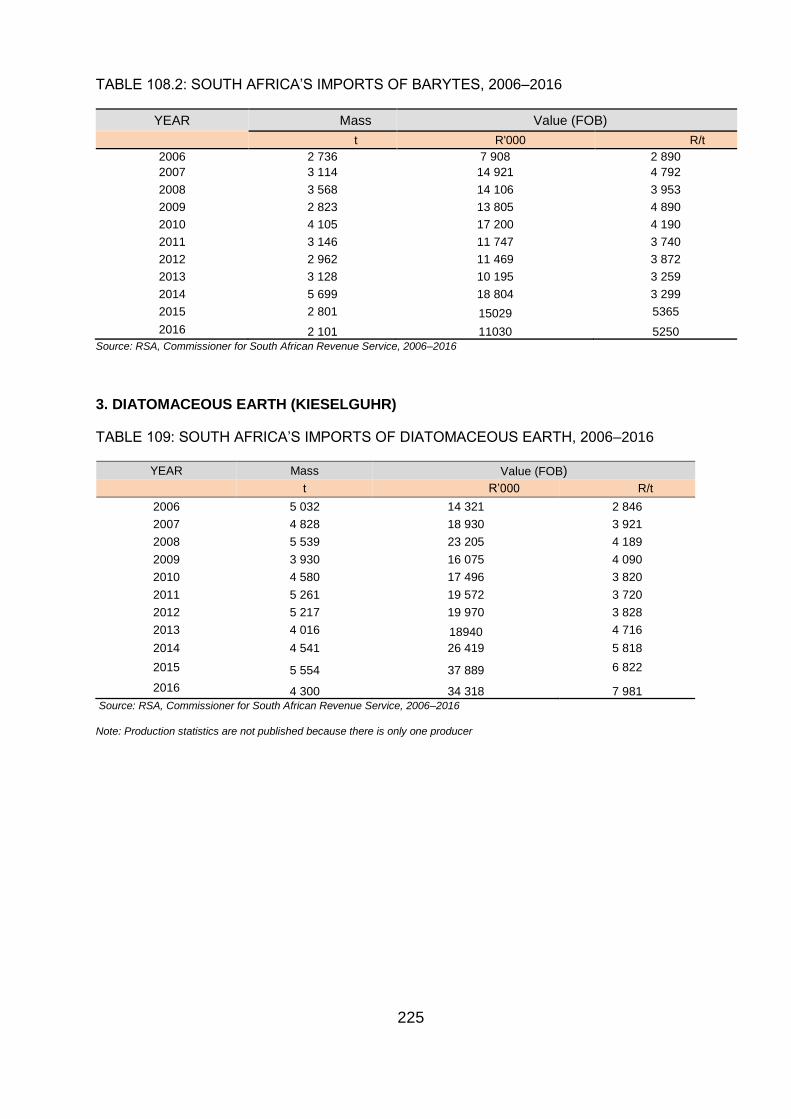
225
TABLE 108.2: SOUTH AFRICA’S IMPORTS OF BARYTES, 2006–2016
YEAR Mass Value (FOB)
t R'000 R/t
2006 2 736 7 908 2 890
2007 3 114 14 921 4 792
2008 3 568 14 106 3 953
2009 2 823 13 805 4 890
2010 4 105 17 200 4 190
2011 3 146 11 747 3 740
2012 2 962 11 469 3 872
2013 3 128 10 195 3 259
2014 5 699 18 804 3 299
2015 2 801 15029 5365
2016 2 101 11030 5250
Source: RSA, Commissioner for South African Revenue Service, 2006–2016
3. DIATOMACEOUS EARTH (KIESELGUHR)
TABLE 109: SOUTH AFRICA’S IMPORTS OF DIATOMACEOUS EARTH, 2006–2016
YEAR Mass Value (FOB) t R’000 R/t
2006 5 032 14 321 2 846 2007 4 828 18 930 3 921 2008 5 539 23 205 4 189 2009 3 930 16 075 4 090 2010 4 580 17 496 3 820 2011 5 261 19 572 3 720 2012 5 217 19 970 3 828 2013 4 016 18940 4 716 2014 4 541 26 419 5 818 2015 5 554 37 889 6 822
2016 4 300 34 318 7 981
Source: RSA, Commissioner for South African Revenue Service, 2006–2016
Note: Production statistics are not published because there is only one producer
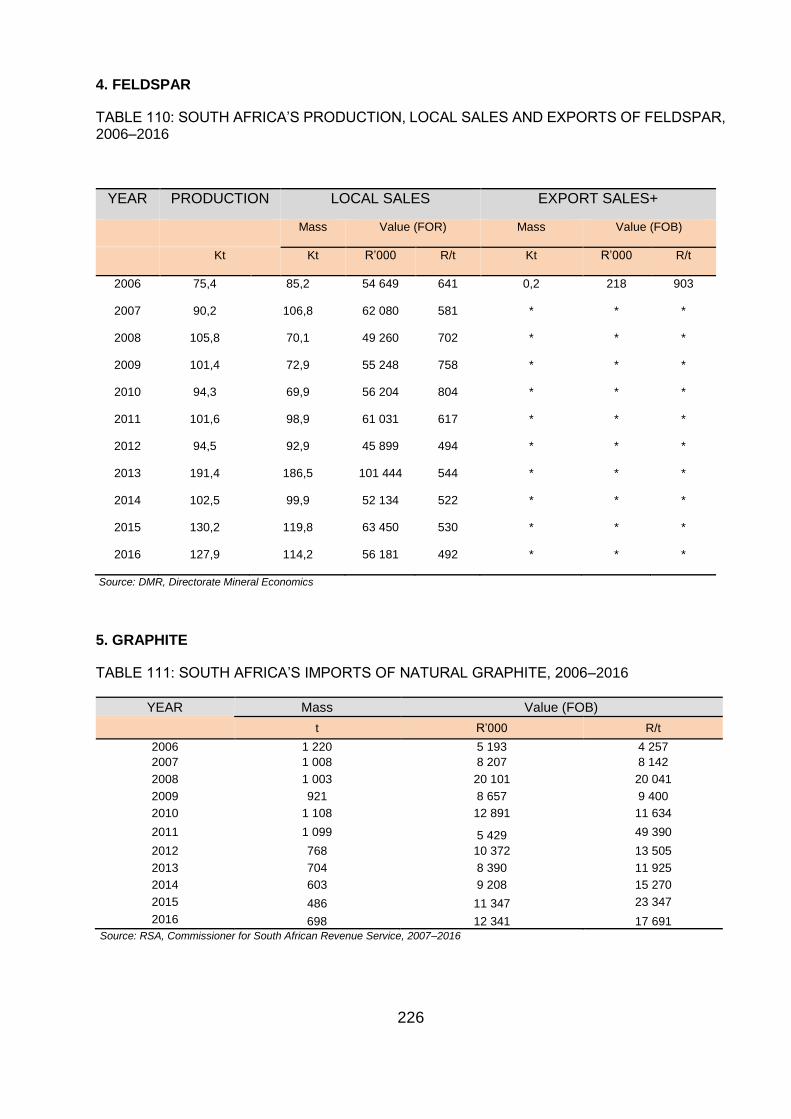
226
4. FELDSPAR
TABLE 110: SOUTH AFRICA’S PRODUCTION, LOCAL SALES AND EXPORTS OF FELDSPAR, 2006–2016
YEAR PRODUCTION LOCAL SALES EXPORT SALES+
Mass Value (FOR) Mass Value (FOB)
Kt Kt R’000 R/t Kt R’000 R/t
2006 75,4 85,2 54 649 641 0,2 218 903
2007 90,2 106,8 62 080 581 * * *
2008 105,8 70,1 49 260 702 * * *
2009 101,4 72,9 55 248 758 * * *
2010 94,3 69,9 56 204 804 * * *
2011 101,6 98,9 61 031 617 * * *
2012 94,5 92,9 45 899 494 * * *
2013 191,4 186,5 101 444 544 * * *
2014 102,5 99,9 52 134 522 * * *
2015 130,2 119,8 63 450 530 * * *
2016 127,9 114,2 56 181 492 * * *
Source: DMR, Directorate Mineral Economics
5. GRAPHITE
TABLE 111: SOUTH AFRICA’S IMPORTS OF NATURAL GRAPHITE, 2006–2016
YEAR Mass Value (FOB)
t R’000 R/t
2006 1 220 5 193 4 257
2007 1 008 8 207 8 142
2008 1 003 20 101 20 041
2009 921 8 657 9 400
2010 1 108 12 891 11 634
2011 1 099 5 429 49 390
2012 768 10 372 13 505
2013 704 8 390 11 925
2014 603 9 208 15 270
2015 486 11 347 23 347
2016 698 12 341 17 691
Source: RSA, Commissioner for South African Revenue Service, 2007–2016
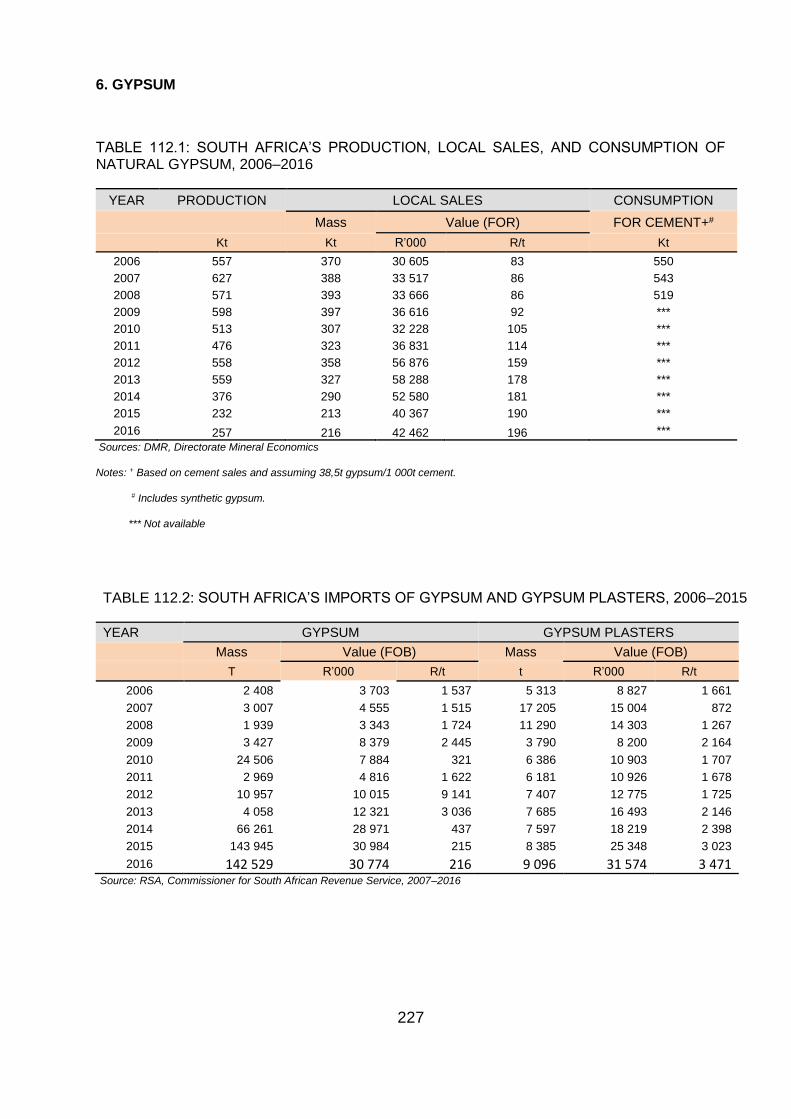
227
6. GYPSUM
TABLE 112.1: SOUTH AFRICA’S PRODUCTION, LOCAL SALES, AND CONSUMPTION OF NATURAL GYPSUM, 2006–2016
YEAR PRODUCTION LOCAL SALES CONSUMPTION
Mass Value (FOR) FOR CEMENT+#
Kt Kt R’000 R/t Kt
2006 557 370 30 605 83 550
2007 627 388 33 517 86 543
2008 571 393 33 666 86 519
2009 598 397 36 616 92 ***
2010 513 307 32 228 105 ***
2011 476 323 36 831 114 ***
2012 558 358 56 876 159 ***
2013 559 327 58 288 178 ***
2014 376 290 52 580 181 ***
2015 232 213 40 367 190 ***
2016 257 216 42 462 196 ***
Sources: DMR, Directorate Mineral Economics
Notes: + Based on cement sales and assuming 38,5t gypsum/1 000t cement.
# Includes synthetic gypsum.
*** Not available
TABLE 112.2: SOUTH AFRICA’S IMPORTS OF GYPSUM AND GYPSUM PLASTERS, 2006–2015
YEAR GYPSUM GYPSUM PLASTERS
Mass Value (FOB) Mass Value (FOB) T R’000 R/t t R’000 R/t
2006 2 408 3 703 1 537 5 313 8 827 1 661 2007 3 007 4 555 1 515 17 205 15 004 872 2008 1 939 3 343 1 724 11 290 14 303 1 267 2009 3 427 8 379 2 445 3 790 8 200 2 164 2010 24 506 7 884 321 6 386 10 903 1 707 2011 2 969 4 816 1 622 6 181 10 926 1 678 2012 10 957 10 015 9 141 7 407 12 775 1 725 2013 4 058 12 321 3 036 7 685 16 493 2 146 2014 66 261 28 971 437 7 597 18 219 2 398 2015 143 945 30 984 215 8 385 25 348 3 023 2016 142 529 30 774 216 9 096 31 574 3 471
Source: RSA, Commissioner for South African Revenue Service, 2007–2016
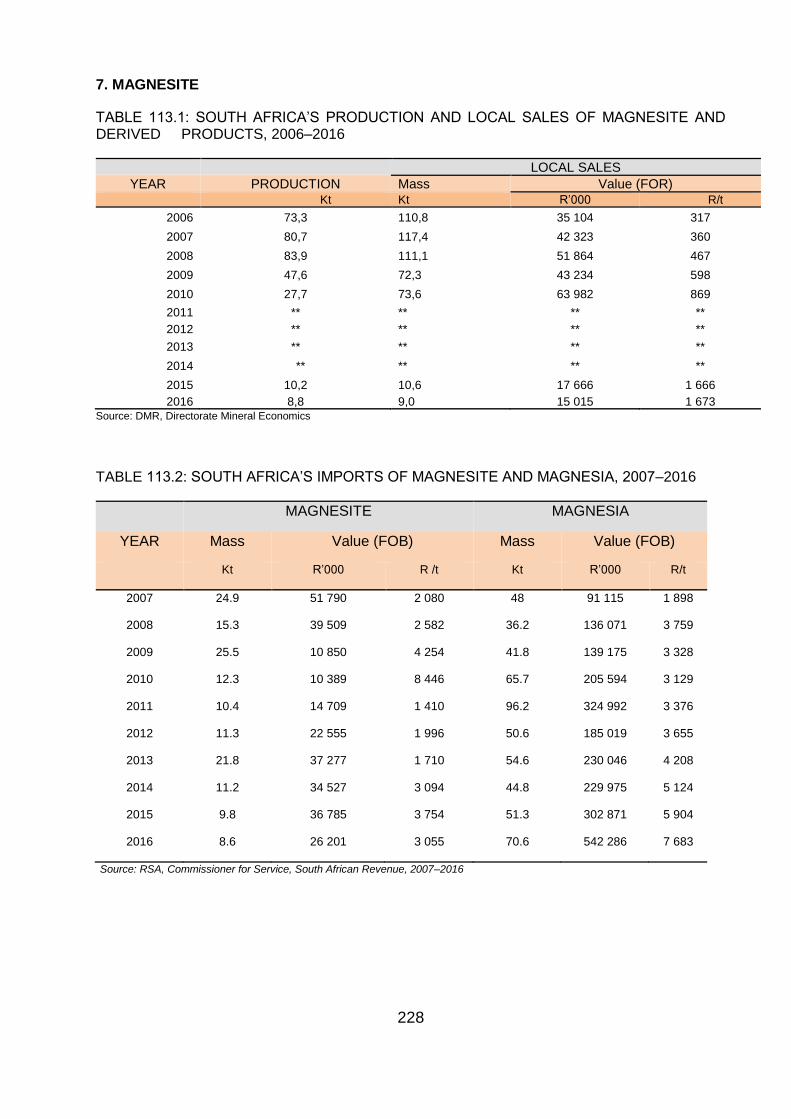
228
7. MAGNESITE
TABLE 113.1: SOUTH AFRICA’S PRODUCTION AND LOCAL SALES OF MAGNESITE AND DERIVED PRODUCTS, 2006–2016
LOCAL SALES
YEAR PRODUCTION Mass Value (FOR) Kt Kt R’000 R/t
2006 73,3 110,8 35 104 317
2007 80,7 117,4 42 323 360
2008 83,9 111,1 51 864 467
2009 47,6 72,3 43 234 598
2010 27,7 73,6 63 982 869
2011 ** ** ** **
2012 ** ** ** **
2013 ** ** ** **
2014 ** ** ** **
2015 10,2 10,6 17 666 1 666
2016 8,8 9,0 15 015 1 673 Source: DMR, Directorate Mineral Economics
TABLE 113.2: SOUTH AFRICA’S IMPORTS OF MAGNESITE AND MAGNESIA, 2007–2016
MAGNESITE MAGNESIA
YEAR Mass Value (FOB) Mass Value (FOB)
Kt R’000 R /t Kt R’000 R/t
2007 24.9 51 790 2 080 48 91 115 1 898
2008 15.3 39 509 2 582 36.2 136 071 3 759
2009 25.5 10 850 4 254 41.8 139 175 3 328
2010 12.3 10 389 8 446 65.7 205 594 3 129
2011 10.4 14 709 1 410 96.2 324 992 3 376
2012 11.3 22 555 1 996 50.6 185 019 3 655
2013 21.8 37 277 1 710 54.6 230 046 4 208
2014 11.2 34 527 3 094 44.8 229 975 5 124
2015 9.8 36 785 3 754 51.3 302 871 5 904
2016 8.6 26 201 3 055 70.6 542 286 7 683
Source: RSA, Commissioner for Service, South African Revenue, 2007–2016
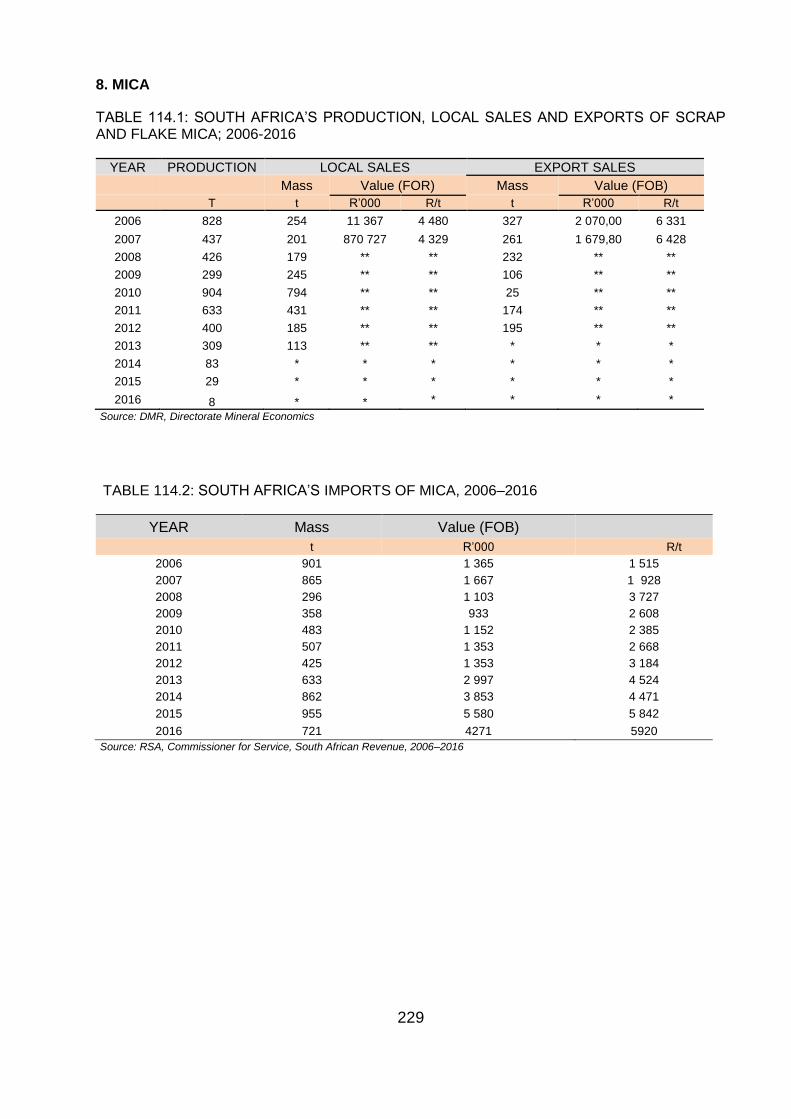
229
8. MICA
TABLE 114.1: SOUTH AFRICA’S PRODUCTION, LOCAL SALES AND EXPORTS OF SCRAP AND FLAKE MICA; 2006-2016
YEAR PRODUCTION LOCAL SALES EXPORT SALES Mass Value (FOR) Mass Value (FOB) T t R’000 R/t t R’000 R/t
2006 828 254 11 367 4 480 327 2 070,00 6 331
2007 437 201 870 727 4 329 261 1 679,80 6 428
2008 426 179 ** ** 232 ** **
2009 299 245 ** ** 106 ** **
2010 904 794 ** ** 25 ** **
2011 633 431 ** ** 174 ** **
2012 400 185 ** ** 195 ** **
2013 309 113 ** ** * * *
2014 83 * * * * * *
2015 29 * * * * * *
2016 8 * * * * * *
Source: DMR, Directorate Mineral Economics
TABLE 114.2: SOUTH AFRICA’S IMPORTS OF MICA, 2006–2016
YEAR Mass Value (FOB) t R’000 R/t
2006 901 1 365 1 515 2007 865 1 667 1 928 2008 296 1 103 3 727 2009 358 933 2 608 2010 483 1 152 2 385 2011 507 1 353 2 668 2012 425 1 353 3 184 2013 633 2 997 4 524 2014 862 3 853 4 471 2015 955 5 580 5 842 2016 721 4271 5920
Source: RSA, Commissioner for Service, South African Revenue, 2006–2016
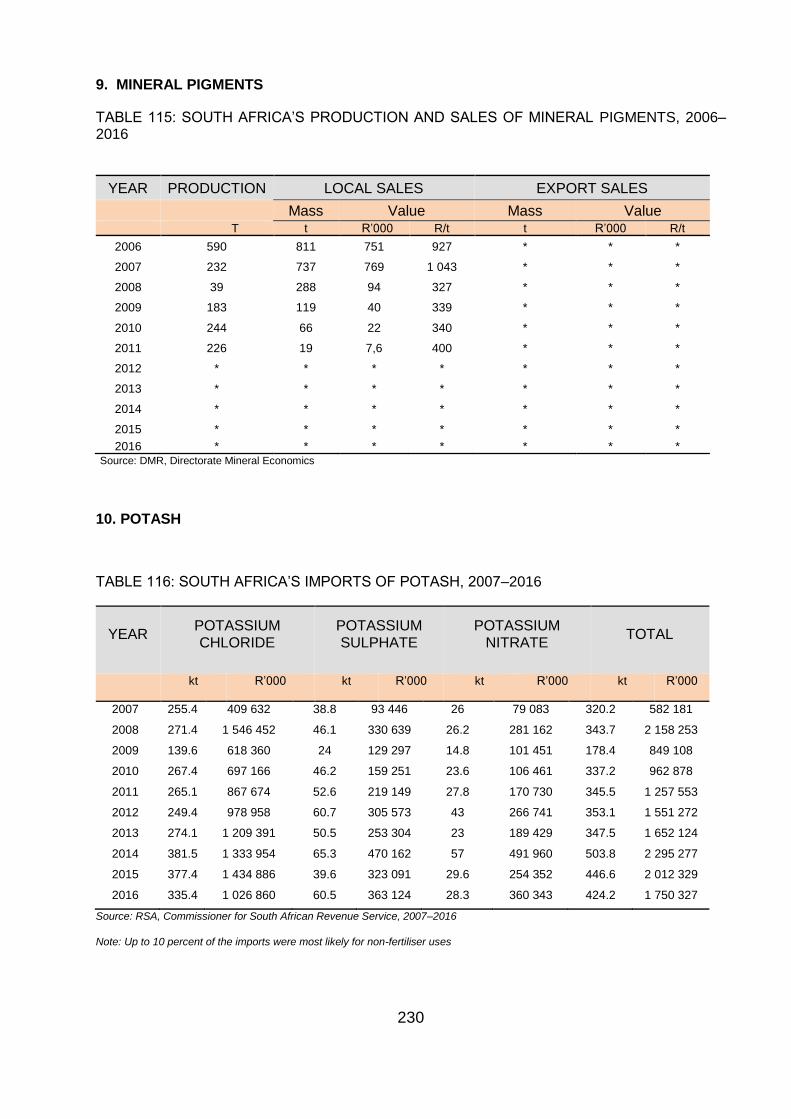
230
9. MINERAL PIGMENTS
TABLE 115: SOUTH AFRICA’S PRODUCTION AND SALES OF MINERAL PIGMENTS, 2006–2016
YEAR PRODUCTION LOCAL SALES EXPORT SALES
Mass Value Mass Value T t R’000 R/t t R’000 R/t
2006 590 811 751 927 * * *
2007 232 737 769 1 043 * * *
2008 39 288 94 327 * * *
2009 183 119 40 339 * * *
2010 244 66 22 340 * * *
2011 226 19 7,6 400 * * *
2012 * * * * * * *
2013 * * * * * * *
2014 * * * * * * *
2015 * * * * * * *
2016 * * * * * * * Source: DMR, Directorate Mineral Economics
10. POTASH
TABLE 116: SOUTH AFRICA’S IMPORTS OF POTASH, 2007–2016
YEAR POTASSIUM CHLORIDE
POTASSIUM SULPHATE
POTASSIUM NITRATE
TOTAL
kt R’000 kt R’000 kt R’000 kt R’000
2007 255.4 409 632 38.8 93 446 26 79 083 320.2 582 181
2008 271.4 1 546 452 46.1 330 639 26.2 281 162 343.7 2 158 253
2009 139.6 618 360 24 129 297 14.8 101 451 178.4 849 108
2010 267.4 697 166 46.2 159 251 23.6 106 461 337.2 962 878
2011 265.1 867 674 52.6 219 149 27.8 170 730 345.5 1 257 553
2012 249.4 978 958 60.7 305 573 43 266 741 353.1 1 551 272
2013 274.1 1 209 391 50.5 253 304 23 189 429 347.5 1 652 124
2014 381.5 1 333 954 65.3 470 162 57 491 960 503.8 2 295 277
2015 377.4 1 434 886 39.6 323 091 29.6 254 352 446.6 2 012 329
2016 335.4 1 026 860 60.5 363 124 28.3 360 343 424.2 1 750 327
Source: RSA, Commissioner for South African Revenue Service, 2007–2016
Note: Up to 10 percent of the imports were most likely for non-fertiliser uses
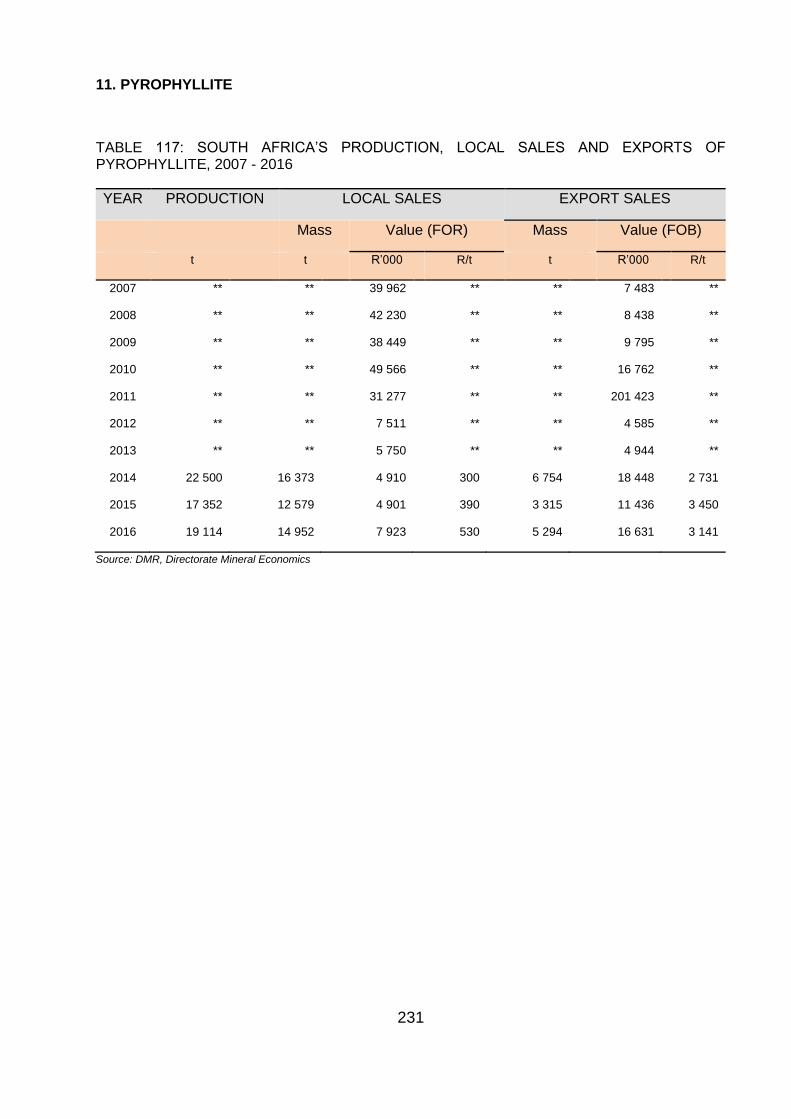
231
11. PYROPHYLLITE
TABLE 117: SOUTH AFRICA’S PRODUCTION, LOCAL SALES AND EXPORTS OF PYROPHYLLITE, 2007 - 2016
YEAR PRODUCTION LOCAL SALES EXPORT SALES
Mass Value (FOR) Mass Value (FOB)
t t R’000 R/t t R’000 R/t
2007 ** ** 39 962 ** ** 7 483 **
2008 ** ** 42 230 ** ** 8 438 **
2009 ** ** 38 449 ** ** 9 795 **
2010 ** ** 49 566 ** ** 16 762 **
2011 ** ** 31 277 ** ** 201 423 **
2012 ** ** 7 511 ** ** 4 585 **
2013 ** ** 5 750 ** ** 4 944 **
2014 22 500 16 373 4 910 300 6 754 18 448 2 731
2015 17 352 12 579 4 901 390 3 315 11 436 3 450
2016 19 114 14 952 7 923 530 5 294 16 631 3 141
Source: DMR, Directorate Mineral Economics
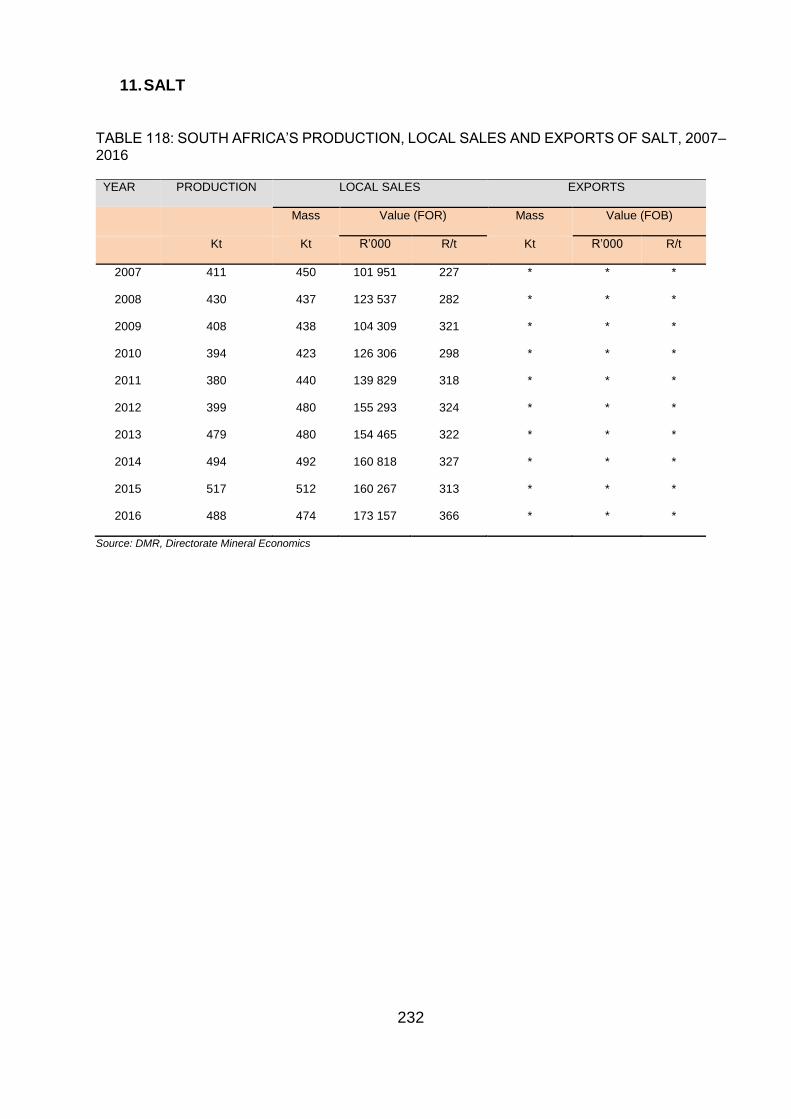
232
11. SALT
TABLE 118: SOUTH AFRICA’S PRODUCTION, LOCAL SALES AND EXPORTS OF SALT, 2007–2016
YEAR PRODUCTION LOCAL SALES EXPORTS
Mass Value (FOR) Mass Value (FOB)
Kt Kt R’000 R/t Kt R’000 R/t
2007 411 450 101 951 227 * * *
2008 430 437 123 537 282 * * *
2009 408 438 104 309 321 * * *
2010 394 423 126 306 298 * * *
2011 380 440 139 829 318 * * *
2012 399 480 155 293 324 * * *
2013 479 480 154 465 322 * * *
2014 494 492 160 818 327 * * *
2015 517 512 160 267 313 * * *
2016 488 474 173 157 366 * * *
Source: DMR, Directorate Mineral Economics
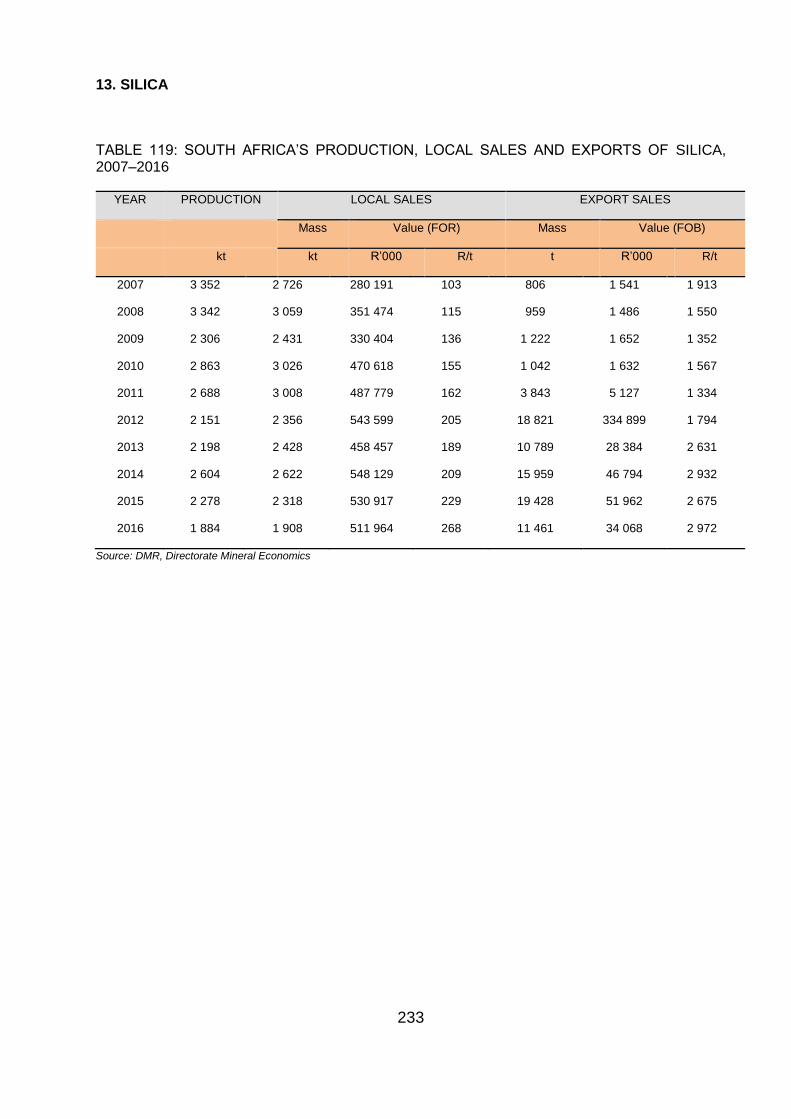
233
13. SILICA
TABLE 119: SOUTH AFRICA’S PRODUCTION, LOCAL SALES AND EXPORTS OF SILICA, 2007–2016
YEAR PRODUCTION LOCAL SALES EXPORT SALES
Mass Value (FOR) Mass Value (FOB)
kt kt R’000 R/t t R’000 R/t
2007 3 352 2 726 280 191 103 806 1 541 1 913
2008 3 342 3 059 351 474 115 959 1 486 1 550
2009 2 306 2 431 330 404 136 1 222 1 652 1 352
2010 2 863 3 026 470 618 155 1 042 1 632 1 567
2011 2 688 3 008 487 779 162 3 843 5 127 1 334
2012 2 151 2 356 543 599 205 18 821 334 899 1 794
2013 2 198 2 428 458 457 189 10 789 28 384 2 631
2014 2 604 2 622 548 129 209 15 959 46 794 2 932
2015 2 278 2 318 530 917 229 19 428 51 962 2 675
2016 1 884 1 908 511 964 268 11 461 34 068 2 972
Source: DMR, Directorate Mineral Economics
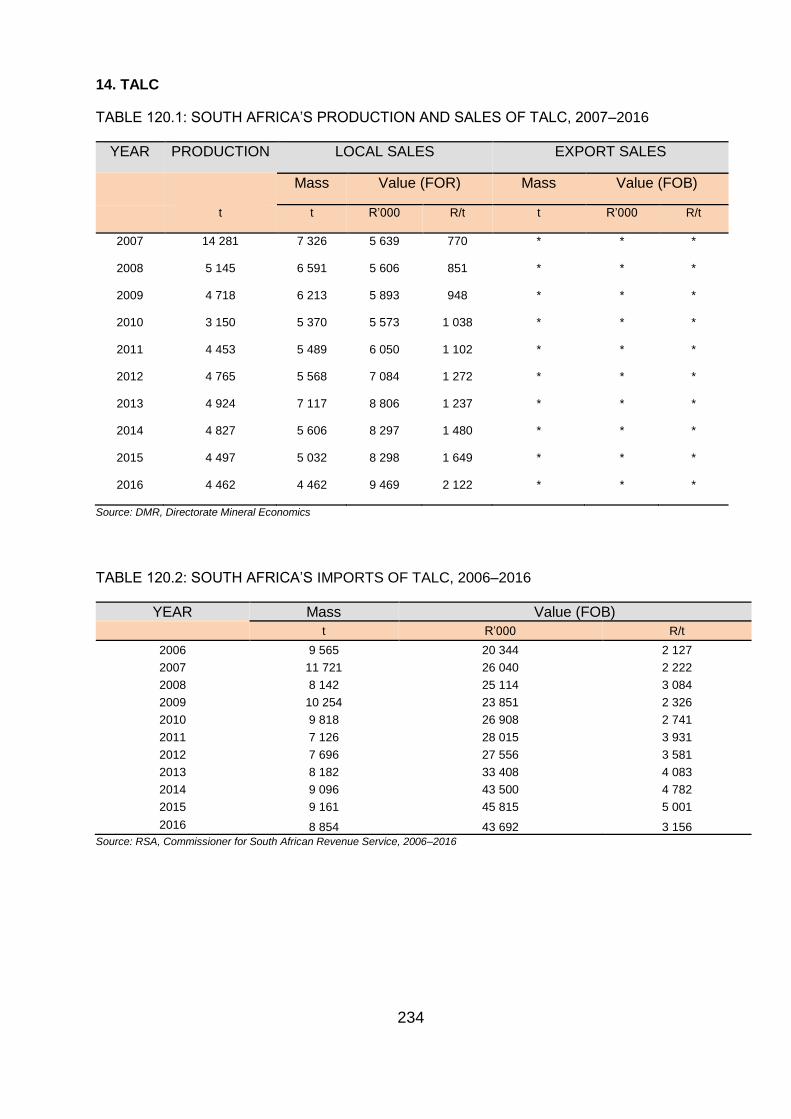
234
14. TALC
TABLE 120.1: SOUTH AFRICA’S PRODUCTION AND SALES OF TALC, 2007–2016
YEAR PRODUCTION LOCAL SALES EXPORT SALES
Mass Value (FOR) Mass Value (FOB)
t t R’000 R/t t R’000 R/t
2007 14 281 7 326 5 639 770 * * *
2008 5 145 6 591 5 606 851 * * *
2009 4 718 6 213 5 893 948 * * *
2010 3 150 5 370 5 573 1 038 * * *
2011 4 453 5 489 6 050 1 102 * * *
2012 4 765 5 568 7 084 1 272 * * *
2013 4 924 7 117 8 806 1 237 * * *
2014 4 827 5 606 8 297 1 480 * * *
2015 4 497 5 032 8 298 1 649 * * *
2016 4 462 4 462 9 469 2 122 * * *
Source: DMR, Directorate Mineral Economics
TABLE 120.2: SOUTH AFRICA’S IMPORTS OF TALC, 2006–2016
YEAR Mass Value (FOB) t R’000 R/t
2006 9 565 20 344 2 127
2007 11 721 26 040 2 222
2008 8 142 25 114 3 084
2009 10 254 23 851 2 326
2010 9 818 26 908 2 741
2011 7 126 28 015 3 931
2012 7 696 27 556 3 581
2013 8 182 33 408 4 083
2014 9 096 43 500 4 782
2015 9 161 45 815 5 001
2016 8 854 43 692 3 156
Source: RSA, Commissioner for South African Revenue Service, 2006–2016
235
PART THREE: GENERAL INFORMATION
USEFUL ADDRESSES
DEPARTMENT OF MINERAL RESOURCES HEAD OFFICE
The Director-General Trevenna Office Campus
Department: Mineral Resources Buildings 2B and 2C
Private Bag X 59 www.dmr.gov.za Corner of Francis Baard & Meintjies Street
0007 Arcadia Pretoria
Tel: (012) 444 3000
Telefax :( 012) 341 4134 / 5886
SAMRAD Online Helpdesk: (012) 444 3119
SAMRAD Online e-mail: [email protected]
Statistical data submission:[email protected]
MINERAL REGULATION REGIONAL DIRECTORATES
Regional Manager: Mineral Regulation - Pier 14 Building
Eastern Cape 444 Govan Mbeki Avenue
Private Bag X 6076 North End
6000 Port Elizabeth Port Elizabeth
Tel: (041) 396 3900
236
Telefax: (041) 373 8171 / 484 2044
Private Bag X 5252 PRD Building
5099 Umthata 96 Sutherland Road
Umthata
Tel: (047) 532 4488
Telefax: (047) 532 4547
Regional Manager: Mineral Regulation - Free State DMR Building
Private Bag X 33 314 Stateway c/o Bok Street
9460 Welkom Welkom
Tel: (057) 391 1300
Telefax: (057) 357 6003 / 1241
Regional Manager: Mineral Regulation - Gauteng Mineralia Building
Private Bag X 5 c/o De Korte and De Beer Streets
2017 Braamfontein Braamfontein
2017
Tel: (011) 358 9700
Telefax: (011) 339 1858 / 2423
237
Regional Manager: Mineral Regulation – Durban Bay House
KwaZulu/Natal 333 Smith Street
Private Bag X 54307 Durban
4000 Durban
Tel: (031) 335 9600
Telefax: (031) 301 6950
Regional Manager: Mineral Regulation – Saveways Crescent Centre
Mpumalanga Mandela Drive
Private Bag X 7279 Emalahleni
1035 Emalahleni
Tel: (013) 653 0500
Telefax: (013) 690 3288
Regional Manager: Mineral Regulation - Perm Building
Northern Cape 65 Phakamile Mabija Street
Private Bag X 6093 Kimberley
8300 Kimberley
Tel: (053) 807 1700
Telefax: (053) 832 5631 / 830 0827
Private Bag X 14 Hopley Centre
8240 Springbok c/o Van Der Stel & Van Riebeeck Street 8240 Springbok
Tel: (027) 712 8160
Fax: (027) 712 1959
238
Regional Manager: Mineral Regulation – Limpopo Broll Building
Private Bag X 9467 101 Dorp Street
0700 Polokwane Polokwane
Tel: (015) 287 4700
Telefax: (015) 287 4729
Regional Manager: Mineral Regulation - North-West Vaal University of Technology Building
Private Bag A1 Corner Margaret Prinsloo & Voortrekker Str
2570 Klerksdorp Klerksdorp
Tel: (018) 487 9830
Telefax: (018) 487 9831 / 9836 / 462 9039
Regional Manager: Mineral Regulation - 9 th Floor, Atterbury House
Western Cape Corner Riebeeck and Lower Burg Str
Private Bag X 9 Cape Town
8012 Roggebaai
Tel: (021) 427 1000
Telefax: (021) 427 1046 / 1047
239
The Principal Inspector: Mine Health and Safety – Propcor Building
Rustenburg cnr Beyers Naudé and Unie Streets
PO Box 150 Rustenburg
0309 Tlhabane
Tel: (014) 594 9240
Telefax: (014) 594 9260
ASSOCIATED GOVERNMENT DEPARTMENTS
Department of Energy c/o Visagie and Paul Kruger Streets
Private Bag X 96 www.energy.gov.za Pretoria
0001 Pretoria
Tel: +27 (0) 12 406 8000 / 7300
Fax: +27 (0) 12 406 7788
Department of Environmental Affairs Fedsure Forum Building
Private Bag X 447 www.environment.gov.za North Tower
0001, Pretoria Cnr Lillian Ngoyi & Pretorius Street
Tel: +27 (0) 12 310 3911
Fax: +27 (0) 12 322 2682
Department of Rural Development & Land Reform Cnr Jacob Mare & Paul Kruger Street
Private Bag X 833 www.ruraldevelopment.gov.za Pretoria
0001, Pretoria
240
Tel: +27 (0) 12 312 8911
Fax: +27 (0) 12 323 6072
+27 (0) 12 312 8066
Department of Science and Technology CSIR Campus (South Gate Entrance)
Private Bag X 894 Meiring Naudé Road, Brummeria
0001, Pretoria www.dst.gov.za Pretoria
Tel: +27 (0) 12 843 6300 / 6303
Fax: +27 (0) 12 349 1037
Department of Trade and Industry DTI Campus – Block E
Private Bag X 84 www.thedti.gov.za Cnr Robert Sobukwe & Meintjies Streets
0001 Pretoria Sunnyside, Pretoria
Tel: +27 (0) 861 843 384
Telefax: +27 (0) 12 394 4612 / 0517
+27 (0) 861 843 888
Department of Water Affairs Sedibeng Building
Private Bag X 313 www.dwaf.co.za 185 Francis Baard Street
0001 Pretoria Pretoria
Tel: +27 (0) 12 336 7500 / 6696
Fax: +27 (0) 12 326 2715 / 336 8850
+27 (0) 12 324 6592
241
Statistics South Africa De Bruyn Park
Private Bag X 44 www.statssa.gov.za 170 Thabo Sehume Street
0001, Pretoria Pretoria
Tel: +27 (0) 12 310 8911 / 8600
Fax: +27 (0) 12 310 8500 / 8944
STATE OWNED ENTERPRISES
Council for Geoscience 280 Pretoria Road
Private Bag X 112 www.geoscience.org.za Silverton
0001 Pretoria Pretoria
Tel: +27 (0) 12 841 1911
Telefax: +27 (0) 12 841 1221
CSIR Meiring Naude Road
PO Box 395 www.csir.co.za Brummeria
0001 Pretoria Pretoria
Tel: +27 (0) 12 841 2911
Telefax: +27 (0) 12 349 1153
CSIR – Mining Technology (Miningtek) cnr Carlow & Rustenburg Avenue
PO Box 91230 www.csir.co.za/miningtek Mellville
2006 Auckland Park Johannesburg
242
Tel: +27 (0) 11 358 0000
Telefax: +27 (0) 11 726 5405
Eskom Megawatt Park
PO Box 1091 www.eskom.co.za Maxwell Drive
2000 Johannesburg Sunninghill Ext 3
Sandton
Tel: +27 (0) 11 800 8111
Telefax: +27 (0) 11 800 4299
Mine Health and Safety Council Woodmead Business Park
Private Bag X 63 www.mhsc.org.za 145 Western Service Road
Braamfontein Maple North Building
2017 Woodmead
Tel: +27 (0) 11 656 1797
Fax: +27 (0) 11 656 1796
Mining Qualifications Authority 7 Anerley Road
Private Bag X 118 www.mqa.org.za Parktown
Marshalltown Johannesburg
2107
Tel: +27 (0) 11 547 2600
Fax: +27 (0) 11 832 1027
Mintek 200 Malibongwe Drive
Private Bag X 3015 www.mintek.co.za Randburg
243
2125 Randburg
Tel: +27 (0) 11 709 4111
Telefax: +27 (0) 11 793 2413
Petro SA 151 Frans Conradie Drive
Private Bag X5 www.petrosa.co.za Cape Town 7500
Parow, Cape Town
7499
Tel: +27 (0) 21 929 3000
Telefax: +27 (0) 21 929 3144
NECSA Elias Motswaledi Street, West Extension
PO Box 582 www.necsa.co.za Pelindaba, Brits District
0001 Pretoria
Tel: +27 (0) 12 305 4911
Telefax: +27 (0) 12 305 3111
South African Agency for Promotion of Tygerpoort Building
Petroleum Exploration and Exploitation (Pty) Ltd 7 Mispel Street
Petroleum Agency SA Bellville 7530
PO Box 5111 www.petroleumagencysa.com
Tygervalley
7536
Tel: +27 (0) 21 938 3500
Fax: +27 (0) 21 938 3520
The Industrial Development Corporation of SA Ltd 19 Fredman Drive
(IDC) www.idc.co.za Sandton
PO Box 784055
244
2146 Sandton Tel: +27 (0) 11 269 3000
Telefax: +27 (0) 11 269 3116
South African Diamond and 5th Floor, Office 501
Precious Metals Regulator www.sadpmr.co.za S A Diamond Centre
PO Box 16001 Corner Main and Phillip Str
2028 Doornfontein Johannesburg
Tel: +27 (0) 11 223 7043 / 7000
Telefax: +27 (0) 11 334 8898 / 8980
National Nuclear Regulator Eco Glades Office Park,
PO Box 7106 www.nnr.co.za Eco Glades 2 Block G
0046 Centurion Witch Hazel Avenue
Highveld Ext 75
Eco Park
Centurion
Tel: +27 (0) 12 674 7100
Telefax: +27 (0) 12 663 5513
State Diamond Trader Suite 510, 5th Floor
PO Box 61212 www.statediamondtrader.gov.za SA Diamond Centre
Marshalltown 225 Main Street
2107 Johannesburg
Tel: +27 (0) 11 334 2691
Telefax: +27 (0) 11 334 1540
245
OTHER MINERAL-RELATED ORGANISATIONS
Aggregate and Sand Producers Association of Unit 8
South Africa (ASPASA) www.aspasa.co.za Coram Office Park
PO Box 1983 Ferero Road
2107 Ruimsig Randpark Ridge
Tel: +27 (0) 11 791 3327
Telefax: +27 (0) 86 647 7967
Chamber of Mines of South Africa 5 Hollard Street
PO Box 61809 www.chamberofmines.org.za Marshalltown
2107 Marshalltown Johannesburg
Tel: +27 (0) 11 498 7100
Telefax: +27 (0) 11 498 1884
Copper Development Association (Pty) Ltd 53 Rendell Road
PO Box 14785 www.copper.co.za Wadeville
1422 Wadeville Germiston
Tel: +27 (0) 11 824 3712
Telefax: +27 (0) 11 824 3120
Federation of SA Gem & Mineralogical Societies 584 Dune Street
PO Box 17273 www.fosagams.co.za Elarduspark
246
0027 Groenkloof 0181 Pretoria
Tel: +27 (0) 86 677 4001
Ferro Alloy Producers Association (FAPA) Metal Industries House
PO Box 1338 www.seissa.co.za 42 Anderson Street
2000 Johannesburg Johannesburg
Tel: +27 (0) 11 298 9400
Telefax: +27 (0) 11 298 9500
South African Mining Development Association The Riviera
(SAMDA) Ground Floor Block 3
PO Box 2057 www.samda.co.za 606 Oxford Road corner North Ave
2121 Parklands Riviera, Parktown
Tel: +27 (0) 11 486 0510
Telefax: +27 (0) 11 486 1394
Steel and Engineering Industries Metal Industries House
Federation of SA (Seifsa) 42 Anderson Street
PO Box 1338 www.seifsa.co.za Johannesburg
2000 Johannesburg
Tel: +27 (0) 11 298 9400
Telefax: +27 (0) 11 838 1522
The Institute of Mine Surveyors of SA Chamber of Mines Building, Room 509
PO Box 62339 www.ims.org.za 5 Hollard Street
247
2107 Marshalltown Marshalltown
Tel: +27 (0) 11 498 7682
Telefax: +27 (0) 11 498 7681
The South African Institute of Mining and Metallurgy Chamber of Mines Building, 5th Floor
PO Box 61127 www.saimm.co.za 5 Hollard Street
2107 Marshalltown Marshalltown
Tel: +27 (0) 11 834 1273
Telefax: +27 (0) 11 838 5923 / 833 8156
248
DIRECTORATE: MINERAL ECONOMICS
RECENT PUBLICATIONS
(Updated 2018-03-20)
REVIEWS
South Africa’s Mineral Industry, 2015/2016 (General overview of the SA minerals industry)
South Africa – Invest in an Intense and Diverse Mineral Industry (2012)
INFORMATION CIRCULAR
MB Bulletin (Published three times per annum)
STATISTICS
Mineral Production and Sales, and Mining Labour Statistics (Monthly, Quarterly and annually by e-mail subscription)
BULLETINS
B1/2017: Minerals – South Africa: Statistical Tables 1993-2014
REPORTS
R39/2010: Investment in South Africa’s Mineral Sector
R40/2006: Possible Financial Sources for Small to Junior Empowerment Mining Companies
R42/2005: An Overview of South Africa’s Primary Industrial Mineral Imports and Exports, 2005
R43/2003: A Review of the Dolomite and Limestone Industry in South Africa
R44/2004: The Silica Industry in the Republic of South Africa
R45/2008: An Overview of the South African Iron, Manganese and Steel Industry during the period 1986-2006
R46/2005: Bentonite, Pyrophyllite and Talc in South Africa
R47/2005: The Kaolin Industry in South Africa, 2005
R48/2005: South African Ferrous Minerals Production Trends, 1994-2003
R49/2005: Dolomite and Limestone in South Africa: Supply and Demand, 2005
R50/2005: South Africa‘s Mineral Production and Sales, 1985 - 2004
R51/2015: An overview of Current Platinum-group Metal Exploration Projects and New Mine Developments in South Africa
R52/2006: South African Ferroalloy Production Trends, 1995 - 2004
249
R53/2006: Review of the Dimension Stone Industry
R54/2006: An Analysis of the Impact of a Third Player on South Africa’s Manganese Industry, 2006
R55/2008: An Overview of South Africa's Vanadium Industry during the period 1997 - 2006
R56/2007: Provision of Export Facilities for BEE’s at the Richards Bay Coal Terminal
R57/2007: Uranium: Future Sources (South Africa)
R58/2008: Overview of the Sand and Aggregate Industry in South Africa
R59/2011: Mining’s Contribution to the National Economy, 2000 – 2009
R60/2007: The impact of Chrome-Ore Exports on the Local Ferrochrome Industry, 2007
R61/2007: Historical Diamond Production (South Africa)
R62/2007: Structure of the Salt Industry in the Republic of South Africa, 2007
R63/2007: Overview of the South Africa's Zircon Industry and the role of BEE
R64/2007: Mineral Abrasives in South Africa
R65/2007: Nepheline Mineral Production in South Africa
R66/2007: Overview of Value systems of selected Ferrous Mineral Commodities, 2007
R68/2013: An Overview of South African Gold Exploration Projects and New Mine Developments in South Africa
R69/2008: Overview of the South Africa's Mineral Based Fertilizer Industry
R71/2008: An Overview of South Africa's Titanium Mineral Concentrate Industry
R73/2008: An Overview of South Africa's Clay and Brick Industry
R74/2009: Overview of the Nickel Industry in South Africa, 1997-2006
R75/2009: Supply, Demand Dynamics of Base Metals versus Prices, 1997-2006
R76/2009: The future role of the Waterberg Coalfield in the SA Coal Industry
R77/2009: Growth Prospects of SA Coal exports and the effect on black economic empowerment companies
R78/2009: Developments in the Economic contribution of Hydrocarbons, Natural Gas and Coal
R80/2009: Special Clays Industry in the Republic of South Africa
R81/2009: Status of the Fluorspar Industry in the RSA, 2009
250
R82/2009: Gypsum in South Africa
R83/2009: Structure of the Andalusite Industry in South Africa
R84/2010: Value Chain System of the South African Heavy Minerals Industry
R85/2010: The Lime Industry in South Africa
R86/2010: Chromium Industry Developments, 1997 - 2008
R87/2010: The Ceramic Industry in South Africa
R88/2011: Overview of the Cobalt Industry in South Africa, 2000 - 2009
R89/2010: Refractory Clays in South Africa
R90/2011: South Africa's Silicon Industry Developments, 1988 - 2009
R91/2012 The future role of the Catalytic Converters Industry in the Downstream Value Addition to SA’s Platinum Group Metals
R92/2012 South Africa’s Ferroalloys Production Trends, 2001 – 2010
R93/2011 Structure of the Salt Industry in the Republic of South Africa
R94/2012 Review of the South African Sand and Aggregate Industry
R95/2011 Review of the Fluorspar Industry in the Republic of South Africa
R96/2012: Overview of the South Africa’s Phosphate Fertilizer Industry
R97/2012: Developments in South Africa’s Coal Industry, 2006 - 2010
R99/2013: Fuel Cells and the future role of SA through its Platinum Resources
R101/2013: Review of the Sulphur Industry in the RSA, 2012
R102/2013: South Africa’s Manganese Industry Developments, 2004 – 2011
R103/2013: The Hydrocarbons Industry in South Africa, 2013
R104/2013: The South African Titanium Industry and Global Market Review
R105/2013: New Technological Applications in Deep-Level Gold Mining
R106/2013: The importance of Fluorspar in developing Fluorochemical Industry in the RSA, 2013
R107/2014: An overview of SA’s Diamond Industry
R108/2014: SA’s Iron Ore Industry Development, 2004 - 2013
R109/2014: The Role of Aggregates and Sands in the Construction Industry
R110/2014: The Nexus between Agriculture and Mining sectors ‘’Securing food for South Africa’’ 2011, Part 1
251
R111/2014: South Africa’s Coal Industry Overview, 2014
R112/2014: Structural Changes in South Africa’s PGM Industry
R113/2015: South Africa’s Infrastructural Development for Economic Growth and Prosperity
R114/2015: Overview of the South African Zinc Industry 2004 – 2014
R115/2015: Is Green Economy the Future for South Africa?
R116/2016: Exploring the Nexus between Agriculture and Mining Sector for Development: “Securing food for South Africa”
R117/2016: Environmental Issues surrounding Coal & mitigation strategies: Implications on the Coal Sector
R118/2016: Economic Potential and Strategic Relevance of Fluorspar
R119/2016: The Volatility of Nonferrous Metal Prices
R120/2016: SA Precious Minerals Wealth: Blessing or Curse?
R121/2017: Contribution of Industrial Minerals to SA’s Economic Growth
HANDBOOKS
H1/2017: South African Ferroalloy Handbook, 2073
H2/2009: Precious Metals Trade - General Information Handbook, 2009
H3/2011: South African Steel Producers Handbook
252
DIRECTORIES
D1/2018: Operating Mines and Quarries and Mineral Processing Plants in the Republic of South Africa, (2016)
D2/2018: Operating and Developing Coal Mines in the Republic of South Africa,
D3/2017: Operating Gold Mines and Recovery Plants in the RSA, (2015)
D4/2017: Salt Producers in the Republic of South Africa, (2013)
D5/2017 South African Mineral Beneficiators, (2012)
D6/2016: Platinum-group Metal Mines in South Africa, (2014)
D7/2016: South African Diamond Handbook and Operating Diamond Mines Directory, (2015)
D8/2016: Ferrous Mineral Commodities Produced in the Republic of South Africa, (2016)
D9/2016: Producers of Dimension Stone in South Africa, (2012)
D10/2017: Producers of Non-ferrous Metal Commodities in South Africa, (2014)
D11/2017: Producers of Industrial Mineral Commodities in South Africa, (2014)
D12/2010: Operating and Developing Black Empowerment Mining Companies in the Republic of South Africa, (2010)
D13/2009: African Mining – Mining Companies, Government Departments and Related Organizations, (2009)
D14/2015: Producers of Sand and Aggregate in the RSA, (2015)
253
SUBSCRIPTION FORM FOR THE PUBLICATIONS
DEPT OF MINERAL RESOURCES
Name, Surname:
Companies Name:
Postal Address:
Tel No: Email Address:
RECORD OF FREE PUBLICATIONS DISTRIBUTED BY MINERAL ECONOMICS
SAMI 15/16 R43/2003 R66/2007 R94/2012 R120/2016
Invest in SA R44/2004 R68/2016 R95/2011 R121/2017
MB Bulletin R45/2008 R69/2008 R96/2012
H1/2017 R46/2005 R71/2008 R97/2012 MPRDA, Charter, Scorecard
H2/2009 R47/2005 R73/2008 R99/2013 Beneficiation strategy
H3/2011 R48/2005 R74/2009 R101/2013 Info on how to start a mine
B1/2017 R49/2005 R75/2009 R102/2013
D1/2018 R50/2006 R76/2009 R103/2013
D2/2018 R51/2006 R77/2009 R104/2013
Address: Private Bag X 59
Arcadia, 0007
Tel: (012) 444-3531/3046/3750
254
D3/2017 R51/2015 R78/2009 R105/2013
D4/2017 R52/2006 R80/2009 R106/2013
D5/2017 R53/2006 R81/2009 R107/2014
D6/2016 R54/2006 R82/2009 R108/2014
D7/2016 R55/2008 R83/2009 R109/2014
D8/2016 R56/2007 R84/2010 R110/2014
D9/2016 R57/2007 R85/2009 R111/2014
D10/2017 R58/2008 R86/2010 R112/2014
D11/2017 R59/2010 R87/2010 R113/2015
D12/2010 R60/2007 R88/2011 R114/2015
D13/2009 R61/2007 R89/2010 R115/2015
D14/2015 R62/2007 R90/2011 R116/2016
R39/2010 R63/2007 R91/2012 R117/2016
R40/2006 R64/2007 R92/2012 R118/2016
R42/2005 R65/2007 R93/2011 R119/2016
Signature: __________________________________ Date: ___________________________
NB! SOME OF THESE PUBLICATIONS ARE ALSO AVAILABLE ON THE DMR WEBSITE:
www//dmr.gov.za/publications/
255