Top-Down Systems Biology Modeling of Host Metabotype��� Microbiome Associations in Obese...
15
Top-Down Systems Biology Modeling of Host Metabotype-Microbiome Associations in Obese Rodents Alison Waldram, † Elaine Holmes, † Yulan Wang, †,+ Mattias Rantalainen, † Ian D. Wilson, ‡ Kieran M. Tuohy, § Anne L. McCartney, § Glenn R. Gibson,* ,§ and Jeremy K. Nicholson* ,† Department of Biomolecular Medicine, SORA Division, Faculty of Medicine, Sir Alexander Fleming Building, Imperial College London, South Kensington SW7 2AZ, United Kingdom, AstraZeneca, Alderley Park, Mereside, Macclesfield, Cheshire SK10 4TF, United Kingdom, and Department of Food Biosciences, Whiteknights, The University of Reading, P.O. Box 226 Reading RG6 6AP, United Kingdom Received November 14, 2008 Covariation in the structural composition of the gut microbiome and the spectroscopically derived metabolic phenotype (metabotype) of a rodent model for obesity were investigated using a range of multivariate statistical tools. Urine and plasma samples from three strains of 10-week-old male Zucker rats (obese (fa/fa, n ) 8), lean (fa/-, n ) 8) and lean (-/-, n ) 8)) were characterized via high-resolution 1 H NMR spectroscopy, and in parallel, the fecal microbial composition was investigated using fluorescence in situ hydridization (FISH) and denaturing gradient gel electrophoresis (DGGE) methods. All three Zucker strains had different relative abundances of the dominant members of their intestinal microbiota (FISH), with the novel observation of a Halomonas and a Sphingomonas species being present in the (fa/fa) obese strain on the basis of DGGE data. The two functionally and phenotypically normal Zucker strains (fa/- and -/-) were readily distinguished from the (fa/fa) obese rats on the basis of their metabotypes with relatively lower urinary hippurate and creatinine, relatively higher levels of urinary isoleucine, leucine and acetate and higher plasma LDL and VLDL levels typifying the (fa/fa) obese strain. Collectively, these data suggest a conditional host genetic involvement in selection of the microbial species in each host strain, and that both lean and obese animals could have specific metabolic phenotypes that are linked to their individual microbiomes. Keywords: Zucker rat • FISH • metabonomics • metabotype • microbiota • obesity • OPLS-DA • O2PLS • 1 H NMR • metagenomics Introduction All coelomate animals have symbiotic gut microorganisms providing an extended genome consortium (microbiome) that closely interacts with and modulates the metabolism, immune systems and general health of the host. 1-4 These microbiome- mammalian metabolic interactions result in the formation of a diverse range of co-metabolites via enzyme systems contrib- uted by multiple interacting genomes. 4,5 Such ‘transgenomic’ interactions result in enriched complexity of the host’s me- tabotype, and statistical links between microbiome variation and specific metabolic patterns have been reported, 6 which may be modulated in diverse disorders such as parasitic diseases, 7-9 in fat-fed models of nonalcoholic fatty liver dis- ease, 10 type II diabetes 11 and obesity. 12 Gut microbial consortia can also be transplanted from species to species 13 and modu- lated using probiotics with resulting effects on host metabolism of short-chain fatty acids, lipoproteins and bile acids. 14 Large- scale metabolic variation between phenotypes of human populations are also partly attributable to variations in gut microbial activities 15,16 and the modulating effects of dietary choice in individuals on both the host and the microbiome. 17,18 Gut microbes have a high metabolic capacity and strongly affect drug toxicity; therefore, they may be important in population differences in drug metabolism and toxicity. 4,19 However, the role of gut microbes in the etiology of the various pathologies they have been associated with and the interacting responses of the gut microbes to the developing pathology are difficult to unravel. Top-down systems biology approaches have proved useful in understanding gut microbial-mammalian metabolic network interactions 18 and methods for connecting microbial population signatures with metabolic profiles have recently been described. 6 To investigate the potential for such trans- genomic “keystone interactions”, that is, the degree to which the host genome determines the microbiome and its modula- tion in disorder, we have chosen to apply a combined meta- bonomic and microbiomic 20 approach to investigate the co- * To whom correspondence should be addressed. J.K.N.: e-mail, [email protected]; tel, +44 (0)20 7594 3195; fax, +44 (0)20 7594 3226. G.R.G.: e-mail, [email protected]; tel, +44 (0)118 378 8715, fax, +44 (0)118 931 0080. † Imperial College London. + Current address: State Key Laboratory of Magnetic Resonance and Atomic and Molecular Physics, Wuhan Centre for Magnetic Resonance, Wuhan Institute of Physics and Mathematics, The Chinese Academy of Sciences, Wuhan, 430071, PR China. ‡ AstraZeneca. § The University of Reading. 10.1021/pr8009885 CCC: $40.75 2009 American Chemical Society Journal of Proteome Research 2009, 8, 2361–2375 2361 Published on Web 03/10/2009
-
Upload
independent -
Category
Documents
-
view
0 -
download
0
Transcript of Top-Down Systems Biology Modeling of Host Metabotype��� Microbiome Associations in Obese...

Top-Down Systems Biology Modeling of Host
Metabotype-Microbiome Associations in Obese Rodents
Alison Waldram,† Elaine Holmes,† Yulan Wang,†,+ Mattias Rantalainen,† Ian D. Wilson,‡
Kieran M. Tuohy,§ Anne L. McCartney,§ Glenn R. Gibson,*,§ and Jeremy K. Nicholson*,†
Department of Biomolecular Medicine, SORA Division, Faculty of Medicine, Sir Alexander Fleming Building,Imperial College London, South Kensington SW7 2AZ, United Kingdom, AstraZeneca, Alderley Park, Mereside,
Macclesfield, Cheshire SK10 4TF, United Kingdom, and Department of Food Biosciences, Whiteknights,The University of Reading, P.O. Box 226 Reading RG6 6AP, United Kingdom
Received November 14, 2008
Covariation in the structural composition of the gut microbiome and the spectroscopically derivedmetabolic phenotype (metabotype) of a rodent model for obesity were investigated using a range ofmultivariate statistical tools. Urine and plasma samples from three strains of 10-week-old male Zuckerrats (obese (fa/fa, n ) 8), lean (fa/-, n ) 8) and lean (-/-, n ) 8)) were characterized via high-resolution1H NMR spectroscopy, and in parallel, the fecal microbial composition was investigated usingfluorescence in situ hydridization (FISH) and denaturing gradient gel electrophoresis (DGGE) methods.All three Zucker strains had different relative abundances of the dominant members of their intestinalmicrobiota (FISH), with the novel observation of a Halomonas and a Sphingomonas species beingpresent in the (fa/fa) obese strain on the basis of DGGE data. The two functionally and phenotypicallynormal Zucker strains (fa/- and -/-) were readily distinguished from the (fa/fa) obese rats on the basisof their metabotypes with relatively lower urinary hippurate and creatinine, relatively higher levels ofurinary isoleucine, leucine and acetate and higher plasma LDL and VLDL levels typifying the (fa/fa)obese strain. Collectively, these data suggest a conditional host genetic involvement in selection ofthe microbial species in each host strain, and that both lean and obese animals could have specificmetabolic phenotypes that are linked to their individual microbiomes.
Keywords: Zucker rat • FISH • metabonomics • metabotype • microbiota • obesity • OPLS-DA • O2PLS• 1H NMR • metagenomics
Introduction
All coelomate animals have symbiotic gut microorganismsproviding an extended genome consortium (microbiome) thatclosely interacts with and modulates the metabolism, immunesystems and general health of the host.1-4 These microbiome-mammalian metabolic interactions result in the formation ofa diverse range of co-metabolites via enzyme systems contrib-uted by multiple interacting genomes.4,5 Such ‘transgenomic’interactions result in enriched complexity of the host’s me-tabotype, and statistical links between microbiome variationand specific metabolic patterns have been reported,6 whichmay be modulated in diverse disorders such as parasiticdiseases,7-9 in fat-fed models of nonalcoholic fatty liver dis-
ease,10 type II diabetes11 and obesity.12 Gut microbial consortiacan also be transplanted from species to species13 and modu-lated using probiotics with resulting effects on host metabolismof short-chain fatty acids, lipoproteins and bile acids.14 Large-scale metabolic variation between phenotypes of humanpopulations are also partly attributable to variations in gutmicrobial activities15,16 and the modulating effects of dietarychoice in individuals on both the host and the microbiome.17,18
Gut microbes have a high metabolic capacity and strongly affectdrug toxicity; therefore, they may be important in populationdifferences in drug metabolism and toxicity.4,19 However, therole of gut microbes in the etiology of the various pathologiesthey have been associated with and the interacting responsesof the gut microbes to the developing pathology are difficultto unravel. Top-down systems biology approaches have proveduseful in understanding gut microbial-mammalian metabolicnetwork interactions18 and methods for connecting microbialpopulation signatures with metabolic profiles have recentlybeen described.6 To investigate the potential for such trans-genomic “keystone interactions”, that is, the degree to whichthe host genome determines the microbiome and its modula-tion in disorder, we have chosen to apply a combined meta-bonomic and microbiomic20 approach to investigate the co-
* To whom correspondence should be addressed. J.K.N.: e-mail,[email protected]; tel, +44 (0)20 7594 3195; fax, +44 (0)20 75943226. G.R.G.: e-mail, [email protected]; tel, +44 (0)118 378 8715, fax,+44 (0)118 931 0080.
† Imperial College London.+ Current address: State Key Laboratory of Magnetic Resonance and
Atomic and Molecular Physics, Wuhan Centre for Magnetic Resonance,Wuhan Institute of Physics and Mathematics, The Chinese Academy ofSciences, Wuhan, 430071, PR China.
‡ AstraZeneca.§ The University of Reading.
10.1021/pr8009885 CCC: $40.75 2009 American Chemical Society Journal of Proteome Research 2009, 8, 2361–2375 2361Published on Web 03/10/2009

variation between the metabolic phenotype and the metagenomeof the Zucker rat which is an established and important modelof obesity and type II diabetes.
Certain strains of the Zucker rat have a mutation of the fagene21 which leads to a defect in the leptin receptor,22 resultingin the animal becoming overweight and glucose-intolerant. Inparticular, the homozygous Zucker (fa/fa) obese rat, widely usedas a type II diabetes model, readily becomes obese and insulin-resistant typically by 12 weeks.23,24 In contrast, the heterozy-gous (fa/-) and homozygous (-/-) Zucker rats remain leanas they age and do not become insulin-resistant.21
Metabonomic and metabolomic studies rely mainly on arange of NMR- and MS-based techniques to generate multi-parametic metabolic profiles of physiological and pathologicalvariation.25-29 These techniques have been variously appliedto the analysis of urine and plasma from the Zucker rat andshown to be suitable for characterizing metabolic phenotypes(metabotypes).24,30-32 To investigate metabolic interactionsbetween host and gut microbiota in this animal model, urineand plasma from all three Zucker strains were “metabotyped”via high-resolution 1H NMR spectroscopy and correlated withstrain-related differences in the microbiome measured usingsemiqualitative and semiquantitative molecular-based tech-niques, polymerase chain reaction (PCR) followed by denatur-ing gradient gel electrophoresis (DGGE)33 and fluorescence insitu hybridization (FISH),34 respectively. These resulting datawere thus analyzed using various multivariate statistical meth-ods in order to discover any underlying associations betweenhost and gut microbiota. This pilot study presents an integratedcharacterization of the microbiome-host phenotype of adisease model and represents a first step toward generatinghypotheses regarding potential contributions of transgenomicmetabolic interactions to the development of obesity.
Materials and Methods
Animals and Sample Collection. Three strains of male rat,Zucker (fa/fa) obese n ) 8, Zucker (fa/-) lean n ) 8 and Zucker(-/-) lean n ) 8 were used in this study (animals bred on site,Alderley-Park, AstraZeneca). The animals were produced bymating (fa/-) male and female Zucker rats to produce therequired crosses. The pups were reared together until 6 weeksof age, at which point they were separated into three strainsafter genotyping. Thereafter, the animals were gang-housed inpolycarbonate cages, with all three groups maintained in thesame animal room and rack. Food (standard rat and mousediet, R&M No 1 modified irradiated diet, Special Diet ServicesLtd., Essex, U.K.) and water were available ad libitum through-out. At 10 weeks of age, the animals were euthanized, and urine,feces and plasma were collected. Urine and feces were storedfrozen at -20 °C until analysis. Blood was collected into lithiumheparin vials and centrifuged at ∼2400g for 10 min, and theplasma was then removed and stored at -20 °C until analysis.
1H NMR Spectroscopy. For urine, an aliquot of 460 µL ofeach sample was mixed with 240 µL of phosphate buffer (0.2M in 10% D2O; pH 7.4) containing sodium 3-(trimethylsilyl)propionate-2,2,3,3-d4 (TSP) (0.5 mg/mL) as a chemical shiftreference. The samples were centrifuged at ∼16 000g for 10 minand 600 µL of the solution was transferred to a 5 mm outerdiameter Precision NMR tube (GPE Scientific Ltd.) before beinganalyzed by 1H NMR spectroscopy. For plasma, 300 µL of eachsample was diluted with 600 µL of a 0.9% (w/v) saline solutionin 10% D2O. The samples were centrifuged at ∼16 000g for 10min and 600 µL of solution was transferred to a 5 mm outer
diameter Precision NMR tube (GPE Scientific Ltd.) before beinganalyzed by 1H NMR spectroscopy, as with the urine samples.The analysis was carried out using a Bruker Avance 600 NMRspectrometer (Bruker, Germany) operating at a 600.44 MHz 1Hresonance frequency with a BBI probe. For the urine samples,a standard one-dimensional pulse sequence was used with apresaturation water suppression pulse sequence: 90°-t1-90°-t2-90° acquire FID (Free Induction Decay) [t1 ) 3 µs, t2 ) 100ms].35
For each spectrum, 128 transients were collected into 32kdata points. The temperature remained constant at 298 K andthe 90° pulse was set to 13 µs for the urine spectra and 11.5 µsfor the plasma spectra. For the plasma samples, three types of1H NMR experiment were performed, that is, the standard one-dimensional pulse sequence used with water suppression asdescribedabove,thewater-suppressedCarr-Purcell-Meiboom-Gill(CPMG) spin-echo spectrum: RD-90°-(t-180°-t)n- acquireFID.36,37
This pulse sequence attenuates signals from fast relaxingspecies, such as broad peaks from high molecular weightcompounds, and so forth. Finally, the one-dimensional diffu-sion-edited 1H NMR spectrum which attenuates signals fromsmall molecules with fast translational diffusion rates38,39
(generally small molecules with a low Stokes’ radius): RD-90°-t1-180°-t1-90°-t2-90°-t1-180°-t1-90°-LED-90° acquire FID.
Absolute Glucose Measurements. Each plasma sample wasanalyzed for glucose using a MediSense Precision QID monitorand MediSense blood glucose test strips (Abbott, Kent) withone drop of plasma.
Microbiome Analyses. 1. Microbial DNA Extraction. Eachfecal sample was thawed on ice; for each, a 1 in 10 dilution(w/w) was made in phosphate-buffered saline (Oxoid). Analiquot (1 mL) of sample was centrifuged at ∼13 800g (rotorno. 3753, Biofuge 28RS; Heraeus SEPATECH) and 4 °C for 5min in a weighed sterile 2 mL Safe-Lock tube. The supernatantwas discarded and the pellet weighed. Additional sample wasadded to the tube and centrifuged to give a pellet of ∼500 mg.For each sample, DNA was extracted from the pellet by usingthe FastDNA SPIN Kit (for soil) (QBiogene) following themanufacturer’s instructions. The quantity of DNA in eachsample was assessed by running 5 µL aliquots of the sampleswith a MassRuler-DNA Ladder Mix (Helena Biosciences Eu-rope) on 1.5% (w/v) ultraPURE agarose (GibcoBRL) gelscontaining ethidium bromide (0.4 mg/mL), and visualizing thebands using a UV light. For each sample, DNA was diluted insterile distilled water to give a concentration of ∼5 ng/µL.
2. Polymerase Chain Reaction (PCR). Fragments derivedfrom the variable V3 region of the 16S rRNA gene wereamplified from samples by using the universal primers p2 (5′-ATTACCGCGGCTGCTGG-3′; synthesized by MWG Biotech) andp3 (5′-CGCCCGCCGCGCGCGGCGGGCGGGGCGGGGGCACG-GGGGGCCTACGGGAGGCAGCAG-3′; synthesized by MWG Bio-tech).33 PCR mixtures comprised 5 µL of 10× MgCl2-free buffer(Promega), 5 µL of dNTPs (12.5 mM each; Promega), 1 µL ofprimer p2 (20 pmol), 1 µL of primer p3 (20 pmol), 6 µL of MgCl2
(25 mM; Promega), 30 µL of H2O, 1 µL of Taq (1.25 U DNApolymerase; Promega) and 1 µL of template DNA. The PCR wascarried out using a MJ Research PTC-200 Peltier Thermal Cycler(GRI) machine with the following parameters under ‘block’control. Samples were heated at 94 °C for 5 min; following thehot start, two cycles consisting of 1 min at 94 °C, 1 min at 65°C and 1 min at 72 °C were run; the annealing temperaturewas subsequently decreased by 1 °C every second cycle until a
research articles Waldram et al.
2362 Journal of Proteome Research • Vol. 8, No. 5, 2009
‘touchdown’ at 55 °C, at which temperature five additionalcycles were carried out (27 cycles in total).33 Amplificationproducts were examined using agarose gel electrophoresis;products were stored at -20 °C until required.
3. Denaturing Gradient Gel Electrophoresis (DGGE). Thiswas carried out using the INGENYphorU2 system (GRI). PCRsamples were applied directly onto polyacrylamide gels in 0.5×TAE buffer (diluted from a 50× concentrated solution; FisherScientific) with gradients (30-60%) that were formed with 8%(w/v) acrylamide stock solutions [40% acrylamide/bis solution,37.5:1 (2.6% C); Bio-Rad] containing 2% (v/v) glycerol (BDH),and which contained 0 and 100% denaturant [(7 M PlusOneurea; Pharmacia Biotech) and 40% (w/v) PlusOne formamide(Amersham Biosciences)]. Electrophoresis was run at a constantvoltage of 150 V and a temperature of 60 °C for 16 h. Followingelectrophoresis, the gels were silver-stained according to themethod of Sanguinetti et al.40 with minor modifications. Gelswere scanned at 600 dpi and the images analyzed usingGeneTools and GeneDirectory (Syngene).
4. Cloning and Sequencing of Bands. Bands of interest wereexcised, crushed in 20 µL of sterile distilled H2O and left at 4°C overnight. Samples were pulse-centrifuged and aliquots (3µL) of the supernatants from the crushed bands were used inPCRs with primer p2 and primer p3 as described above. Eachresulting PCR product was cloned using the StrataClone PCRCloning Kit (Stratagene) according to the manufacturer’sinstructions. Three clones for each PCR product were selectedrandomly from LB/ampicillin agar plates and subcultured. Afterincubation overnight at 37 °C, plasmids were extracted fromthe clones by using the QIAprep Spin Miniprep kit (Qiagen).Sequencing reactions were set up containing the following: 4µL of BigDye Terminator v3.1 (Applied Biosystems), 1 µL ofprimer T7 (5′-TAATACGACTCACTATAGGG-3′), 3 µL of PCRproduct and 2 µL of sterile distilled H2O. The reactions wererun on an MJ Research PTC-200 Peltier Thermal Cyclermachine with the following parameters under ‘block’ control:25 cycles of 96 °C for 10 s, 50 °C for 5 s and 60 °C for 4 min.Sequencing of PCR products was done via the University ofReading’s Biocenter.
5. Analysis of Sequence Data. All sequences were edited via4Peaks version 1.7.2 (by A. Griekspoor and Tom Groothuis,http://www.mekentosj.com) and proofread. WU-Blast2 searcheswere conducted via the European Bioinformatics Institute Website (http://www.ebi.ac.uk/databases). Sequence results arepresented as similarity (%) to nearest relative, as absoluteidentification of species represented by bands cannot be madeon the basis of an ∼190 nt fragment.
6. Fluorescence in Situ Hybridization (FISH). Frozen fecalsamples were diluted 1 in 10 (w/v) with phosphate-bufferedsaline (pH 7.2; Oxoid) and homogenized by pipetting througha 1 mL tip for 2 min. Aliquots (375 µL) of homogenized fecalsamples were fixed overnight in 3 vol of cold 4% paraformal-dehyde. Cells were harvested by centrifugation and washedtwice in 1 mL of phosphate buffered saline, then resuspendedin 300 µL of phosphate-buffered saline/ethanol (1:1, v/v) andstored at -20 °C until required.
Differences in fecal bacterial populations were assessedthrough the use of FISH with DNA probes targeting specificdiagnostic regions of the 16S rRNA molecule. To provide up-to-date information on probe specificity, probe sequences werechecked against database sequences via Probe Match at theRDP (http://rdp.cme.msu.edu/index.jsp) using the following
search options: 0 mismatches; strains, type and nontype;source, isolates; size g1200 nt; quality good.
The probes used were Bif164 (targeting most bifidobacteriaand Parascardovia denticolens41), Bac303 (most Bacteroides andPrevotella spp., Barnesiella spp. and Odoribacter splanchni-cus42), Chis150 (most members of Clostridium cluster I and allmembers of Clostridium cluster II43), Erec482 (most membersof Clostridium cluster XIVa43), Lab158 (most Lactobacillus,Leuconostoc and Weissella spp., all Enterococcus, Vagococcus,Melisococcus, Tetragenococcus, Paralactobacillus, Pediococcus,Oenococcus and Catellicoccus spp. and Lactococcus lactis44), andAto291 (all Cryptobacterium, Collinsella, Atopobium, Eggerthellaand Olsenella spp.45). Probes were commercially synthesizedand 5′-labeled with the fluorescent dye Cy3 (Sigma Aldrich).Hybridization and washing conditions were as described in theliterature. The nucleic acid stain DAPI (4′6-diamidino-2-phe-nylindole) was used for total bacterial counts. Washed sampleswere collected on vacuum-mounted 0.2 µm polycarbonatefilters (Millipore), which were transferred to slides. A drop ofSlowFade Light Antifade Kit (Invitrogen Ltd.) and a coverslipwere applied to each slide. Slides were stored in the dark at 4°C until counted or for a maximum of 3 days. Slides wereviewed under a Nikon E400 Eclipse microscope. DAPI slideswere visualized with the aid of a DM 400 filter; probe slideswere visualized with the aid of a DM 575 filter. Cells (between15 and 50 per field of view) were counted for 15 fields of view,and the numbers of specific bacteria and total bacteria weredetermined by using the following equation;
Where the DF (dilution factor) was calculated by taking intoaccount the concentration of the original sample (375 µL to300 µL ) 0.8×, taken to 8× to account for the 1/10 dilutionmade of the original fecal sample), dilution of the sample inhybridization buffer and the ratio of total hybridization volumeto volume of sample added. ACC (average cell count) wasdetermined by counting 15 fields of view and assumes that anormal distribution was observed for the counts. The figure14873.73 refers to the area of the filter divided by the area ofthe field of view. VH refers to the volume of hybridizationmixture added to the wash buffer. Results from the FISH dataare given as means ( standard deviations (SD). Statisticallysignificant differences in bacterial groups between the differentgroups of animals were determined using the unpaired Stu-dent’s t-test (P < 0.05).
7. Data Analysis. XWIN NMR software was used to manuallyphase, baseline correct and calibrate the NMR spectra. Forurine, the TSP peak was calibrated to δ0.0; for plasma, thechemical shift of the anomeric proton from alpha-glucose wascalibrated to δ5.223. The spectra were then exported into theMATLAB (MathWorks) program where, for the urine spectra,the spectral regions containing water and urea signals wasremoved (δ4.6-6.0) and spectra normalized to the total area.Orthogonal Projection to Latent Structures Discriminant Analy-sis (OPLS-DA) models were constructed using unit variancescaled and mean-centered NMR data as the descriptor matrixand class information as the response variable.46-48 The plasmaCPMG spectra were also imported into MATLAB and the waterpeak (δ4.6-5.0) was removed. Again an OPLS-DA model wascreated, as for the urine data. As the spectra were affected byshifts relating to small pH changes, both models were recreated
DF × ACC × 14873.73 × 1000VH
Host Metabotype-Microbiome Associations in Obese Rodents research articles
Journal of Proteome Research • Vol. 8, No. 5, 2009 2363
with the use of a peak alignment protocol.49 Both the micro-biology and NMR data were analyzed by OPLS-DA to assessthe difference between the animal genotypes as indicated bythe OPLS-DA predictive cross-validated scores. The OPLS-DAmodel was interpreted by means of the OPLS coefficients.Integrated modeling of microbiology and NMR data wasaccomplished using the OPLS and O2PLS methods50 using backprojection of the variables to the covariance matrix accordingto the method of Cloarec et al.47 In the O2PLS analysis, theDGGE data were used as the response matrix with the urinespectra as the descriptor matrix. Prediction performance wasassessed by the Q2 parameter,51 indicating how well eachvariable is predicted over cross-validation. Individual DGGEbands were used as response variables with the urine 1H NMRdata as the descriptor matrix to complete OPLS analysis.
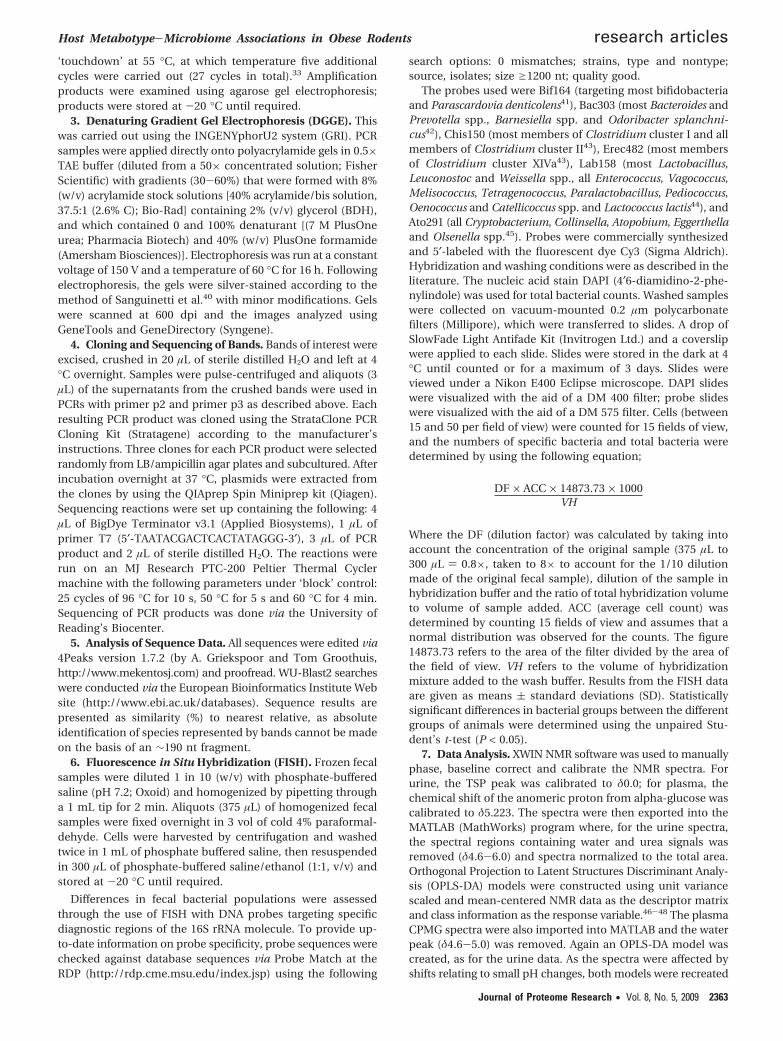
Results1H NMR Spectroscopy of Urine. Selected expansions of
typical urinary 1H NMR spectra of each Zucker strain are shownin Figure 1. For clarity, the spectra are displayed in fourfrequency ranges and were broadly similar in composition topublished rat urine spectra from previous studies with me-tabolites such as citrate, 2-oxoglutarate, trimethylamine N-oxide (TMAO), hippurate and creatinine dominating theprofile.24,52,53 Visual examination of the spectra indicated thatthe (fa/fa) obese strain of the Zucker rats contained relatively
higher levels of acetate (δ1.93 singlet (s)) and lower levels ofhippurate (δ3.97 doublet (d), δ7.56 triplet (t), δ7.65 t, δ7.84 d)and creatinine (δ3.05 s, δ4.05 s) compared to the other twostrains.
The rat strains were easily discriminated using an OrthogonalProjection to Latent Structure-Discriminant Analysis (OPLS-DA) model as indicated in the cross-validated OPLS scores plot(Figure 2A). The obese (fa/fa) strain is completely separatedfrom the lean strains, but the two phenotypically lean strainclusters overlap. To systematically assess detailed metabolicdifferences between the three strains, an OPLS-DA model of1H NMR data obtained from urine was used to establishpairwise models between all the strains. Successful discrimina-tion between the (-/-) and the (fa/fa) strains and (fa/-) and(fa/fa) strains was achieved based on a Q2 or goodness-of-prediction value of 0.86 and 0.82, respectively, whereas thecomparison for the (-/-) and (fa/-) showed no stronglysignificant differences. The OPLS coefficient plots generatedfor each model provided a means for interpretation of therelative influence of the original variables (chemical shifts) onthe OPLS-DA models. The coefficient plots are color-codedaccording to the strength of the OPLS coefficients, which arecalculated from the correlation matrix. Orientation of the peakrepresents its positive correlation with a given class, and themagnitude of the signals in the plot is back-scaled to thecovariance matrix. This process results in a plot which is similar
Figure 1. Typical urinary 1H NMR spectra for each Zucker strain. 1, 3-methylglutarate; 2, Propionate; 3, 3-hydroxyisobutyrate; 4, Lactate;5, Threonine; 6, Alanine; 7, Acetate; 8, 9, Glycoprotein fragments (N-acetyl); 10, Formiminoglutamic acid; 11, Succinate; 12, 2-oxoglutarate;13, Pyridoxine; 14, Citrate; 15, Methylamine; 16, Dimethylamine; 17, Trimethylamine; 18, Dimethylglycine; 19, Creatinine; 20, cis Aconitate;21, Taurine; 22, Trimethylamine-N-oxide; 23, Guanidoacetate; 24, Betaine; 25, Hippurate; 26, unknown; 27, N-methylnicotinamide; 28,Formate; 29, unknown.
research articles Waldram et al.
2364 Journal of Proteome Research • Vol. 8, No. 5, 2009

to the original NMR spectra thereby aiding the interpretationof the discriminating peaks.47 Thus, a red colored peak pointingupright, for example, creatinine (19) in Figure 3, is positivelycorrelated with the (-/-) lean strain (the lean strain isrepresented at the top of each pairwise coefficient plot). It alsosignifies that the (-/-) lean strain has a relatively higherconcentration of a particular metabolite than the comparatorstrain. To confer equal influence of all variables on the model,unit variance scaling of mean-centered data was applied to thedescriptor matrix such that even metabolites with low con-centrations can influence the overall model if the direction and
nature of differentiation is consistent throughout all animalsin a given strain. Selected sections of the OPLS coefficient plotillustrating the differences between the (-/-) lean and the (fa/fa) obese strains are shown in Figure 3. The (-/-) and the(fa/-) strains produced similar metabolite profiles, resultingin a poor prediction model when these strains were compared.This was also consistent with the model comparing the (fa/-)against the (fa/fa) strain being highly similar to the modelcomparing (-/-) and (fa/fa) strains (data not shown).
The major differences in metabolite concentrations betweenthe (fa/fa) obese and the (-/-) lean Zucker strains included
Figure 2. Fully cross-validated scores plot from the OPLS-DA model for the three Zucker strains. (A) Scores plot from the urinary 1HNMR data. (B) Scores plot from the plasma CPMG 1H NMR data. (C) Scores plot from the DGGE data (red circle, (-/-) lean strain; bluecircle, (fa/-) lean strain; green circle, (fa/fa) obese strain).
Figure 3. An OPLS-DA model discriminating between the lean (-/-) strain and the (fa/fa) obese strain from the urinary 1H NMR profiles.R2 ) 0.97; Q2 ) 0.86. 1, 3-Methylglutarate; 2, Propionate; 4, Lactate; 6, Alanine; 7, Acetate; 8, 9, Glycoprotein fragments (N-acetyl); 10,Formiminoglutamic acid; 11, Succinate; 12, 2-Oxoglutarate; 13, Pyridoxine; 14, Citrate; 18, Dimethylglycine; 19, Creatinine; 20, cisaconitate; 21, Taurine; 22, Trimethylamine-N-oxide; 23, Guanidoacetate; 24, Betaine; 25, Hippurate; 28, Formate; 29, unknown; 30,Phenylacetylglycine.
Host Metabotype-Microbiome Associations in Obese Rodents research articles
Journal of Proteome Research • Vol. 8, No. 5, 2009 2365
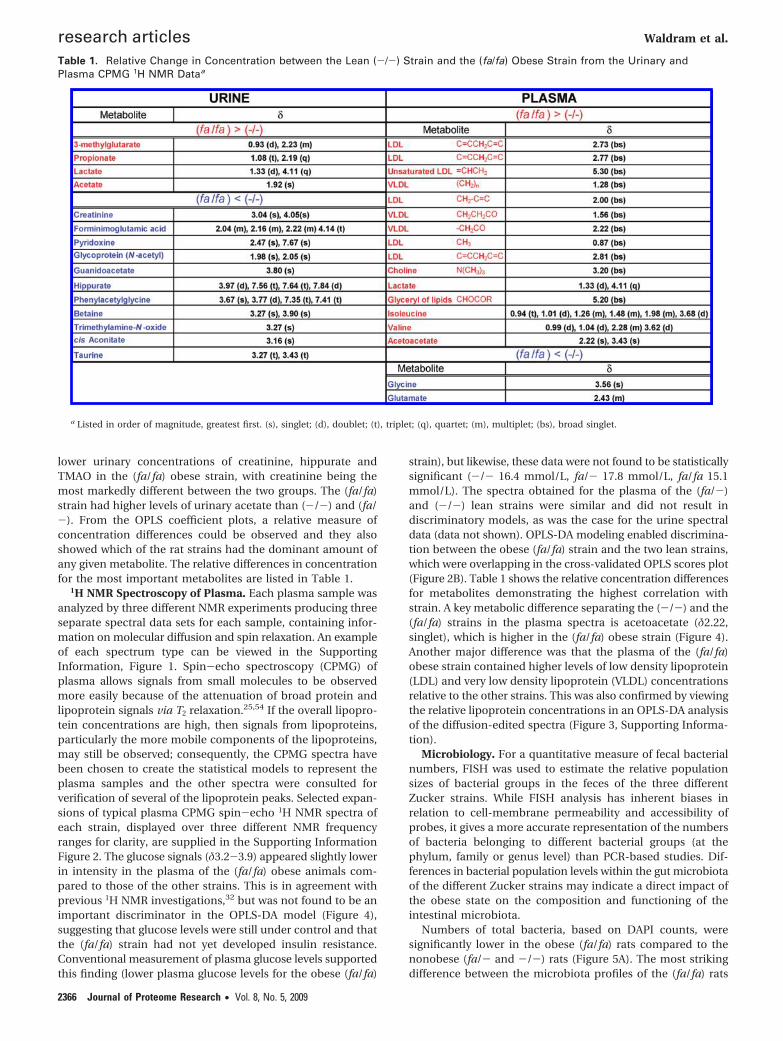
lower urinary concentrations of creatinine, hippurate andTMAO in the (fa/fa) obese strain, with creatinine being themost markedly different between the two groups. The (fa/fa)strain had higher levels of urinary acetate than (-/-) and (fa/-). From the OPLS coefficient plots, a relative measure ofconcentration differences could be observed and they alsoshowed which of the rat strains had the dominant amount ofany given metabolite. The relative differences in concentrationfor the most important metabolites are listed in Table 1.
1H NMR Spectroscopy of Plasma. Each plasma sample wasanalyzed by three different NMR experiments producing threeseparate spectral data sets for each sample, containing infor-mation on molecular diffusion and spin relaxation. An exampleof each spectrum type can be viewed in the SupportingInformation, Figure 1. Spin-echo spectroscopy (CPMG) ofplasma allows signals from small molecules to be observedmore easily because of the attenuation of broad protein andlipoprotein signals via T2 relaxation.25,54 If the overall lipopro-tein concentrations are high, then signals from lipoproteins,particularly the more mobile components of the lipoproteins,may still be observed; consequently, the CPMG spectra havebeen chosen to create the statistical models to represent theplasma samples and the other spectra were consulted forverification of several of the lipoprotein peaks. Selected expan-sions of typical plasma CPMG spin-echo 1H NMR spectra ofeach strain, displayed over three different NMR frequencyranges for clarity, are supplied in the Supporting InformationFigure 2. The glucose signals (δ3.2-3.9) appeared slightly lowerin intensity in the plasma of the (fa/fa) obese animals com-pared to those of the other strains. This is in agreement withprevious 1H NMR investigations,32 but was not found to be animportant discriminator in the OPLS-DA model (Figure 4),suggesting that glucose levels were still under control and thatthe (fa/fa) strain had not yet developed insulin resistance.Conventional measurement of plasma glucose levels supportedthis finding (lower plasma glucose levels for the obese (fa/fa)
strain), but likewise, these data were not found to be statisticallysignificant (-/- 16.4 mmol/L, fa/- 17.8 mmol/L, fa/fa 15.1mmol/L). The spectra obtained for the plasma of the (fa/-)and (-/-) lean strains were similar and did not result indiscriminatory models, as was the case for the urine spectraldata (data not shown). OPLS-DA modeling enabled discrimina-tion between the obese (fa/fa) strain and the two lean strains,which were overlapping in the cross-validated OPLS scores plot(Figure 2B). Table 1 shows the relative concentration differencesfor metabolites demonstrating the highest correlation withstrain. A key metabolic difference separating the (-/-) and the(fa/fa) strains in the plasma spectra is acetoacetate (δ2.22,singlet), which is higher in the (fa/fa) obese strain (Figure 4).Another major difference was that the plasma of the (fa/fa)obese strain contained higher levels of low density lipoprotein(LDL) and very low density lipoprotein (VLDL) concentrationsrelative to the other strains. This was also confirmed by viewingthe relative lipoprotein concentrations in an OPLS-DA analysisof the diffusion-edited spectra (Figure 3, Supporting Informa-tion).
Microbiology. For a quantitative measure of fecal bacterialnumbers, FISH was used to estimate the relative populationsizes of bacterial groups in the feces of the three differentZucker strains. While FISH analysis has inherent biases inrelation to cell-membrane permeability and accessibility ofprobes, it gives a more accurate representation of the numbersof bacteria belonging to different bacterial groups (at thephylum, family or genus level) than PCR-based studies. Dif-ferences in bacterial population levels within the gut microbiotaof the different Zucker strains may indicate a direct impact ofthe obese state on the composition and functioning of theintestinal microbiota.
Numbers of total bacteria, based on DAPI counts, weresignificantly lower in the obese (fa/fa) rats compared to thenonobese (fa/- and -/-) rats (Figure 5A). The most strikingdifference between the microbiota profiles of the (fa/fa) rats
Table 1. Relative Change in Concentration between the Lean (-/-) Strain and the (fa/fa) Obese Strain from the Urinary andPlasma CPMG 1H NMR Dataa
a Listed in order of magnitude, greatest first. (s), singlet; (d), doublet; (t), triplet; (q), quartet; (m), multiplet; (bs), broad singlet.
research articles Waldram et al.
2366 Journal of Proteome Research • Vol. 8, No. 5, 2009

and the nonobese phenotypes was a significantly lower Bif164count in the obese rats. Erec482 and Lab158 counts weresignificantly higher in the (fa/fa) rats compared to the (-/-)and (fa/-) rats, respectively. Ato291 counts were significantlylower in the (fa/fa) rats compared to the (fa/-) rats. In addition,significant differences were observed between the microbiotaprofiles of the (fa/-) and (-/-) strains. The (-/-) rats hadsignificantly lower Erec482 and Lab158 counts compared to the(fa/-) rats. Similar Chis150 counts were observed for all threeZucker strains, while much variation and no significant strain-related differences were observed in the Bac303 counts betweenthe different strains. A cross-validated scores plot from theOPLS-DA analysis using the FISH count information is shownin Figure 5B, which describes differences in the gut microbiotaprofiles. With the use of the bacterial count information, thethree Zucker strains are each occupying their own space in theplot, although there was one outlier from the (-/-) strainwhich was closer to the (fa/-) strain (due to higher Bif164,Ato291, Erec482 and Bac303 counts). The plot shows that theobese (fa/fa) rats were clearly separated from the other animalsdue to lower Bif164 and higher Erec482 and Lab158 counts.
The DGGE profiles obtained from the feces of each individualrat are shown in Figure 6. These profiles provide a semiquali-tative fingerprint of the bacteria present in the feces of theanimals. It is well-known that qualitative methods such ascloning, and by extension DGGE, provide only a ‘snapshot’ ofa bacterial community, with “...each physical, chemical andbiological step involved in the molecular analysis of an envi-
ronment...a source of bias which will lead to a distorted view ofthe ‘real world’’’.55 The advantage of DGGE over other meth-odologies is that it allows a relatively high throughput of largenumbers of samples for a modest cost. Its disadvantage is thatphylogenetically useful information cannot be retrieved fromsequences of <200 nt, as is the case with the primers usedherein. This is also a disadvantage with novel high-throughputsequencing (HTS) methods, from which reads of 25-250 basesare produced.56 DGGE does, however, allow genus-level clas-sifications to be made. While HTS methods are widely used inanalyses of microbial diversity, they are generally applied tosmall numbers of samples, which precludes characterizationof patterns of microbial diversity across space and time.57
Tagging approaches may increase the robustness of HTSmethodologies, but they still do not get around the fact thatmany thousands of sequences have to be collated and analyzedfrom several separate libraries of clones. In a study such asthe one described herein, analyzing thousands of clones fromeach of the animals studied would be impractical. In addition,while approaches such as 454 pyrosequencing can determinethe sequences of huge numbers of different DNA strands atone time, to date, it seems that these new approaches are notas yet much cheaper than electrophoresis technologies.56 WhileHTS methods are ideal for sequencing whole genomes relativelycheaply, their use in ecological studies is still limited. Only onestudy has used fecal samples (from calves) with a HTS method(pyrosequencing).58 Fingerprinting techniques are better suitedtoward ecological studies, and allow us to monitor shifts in
Figure 4. An OPLS-DA model discriminating between the lean (-/-) strain and the (fa/fa) obese strain from the plasma CPMG 1H NMRprofiles; R2 ) 0.82; Q2 ) 0.69. 4, Lactate; 6, Alanine; 7, Acetate; 14, Citrate; 17, Trimethylamine; 19, Creatinine; 21, Taurine; 31, LDL(CH3); 32, VLDL (CH3); 33, Isoleucine; 34, Leucine; 35, Valine; 36, D-3-Hydroxybutyrate; 37, LDL (CH2)n; 38, VLDL (CH2)n; 39, VLDL(CH2CH2CO); 40, LDL (CH2CdC); 41, LDL (CH2CO); 42, Acetoacetate; 43, Glutamate; 44, LDL (CdCCH2CdC); 45, Phosphocholine; 46,Glucose; 47, Glycine; 48, Glyceryl of lipids (CHOCOR); 49, Unsaturated LDL ()CHCH2CH2).
Host Metabotype-Microbiome Associations in Obese Rodents research articles
Journal of Proteome Research • Vol. 8, No. 5, 2009 2367

bacterial populations over time and between different animals;hence, DGGE was also applied in this study.
The DGGE gel was analyzed using Syngene GeneTools, whichwas used to extract the bands in multiple lanes providing asemiquantitative measure of area under the curve (banddensity). A total of 102 bands were detected in the DGGE gel,with some bands only present in one animal and othersubiquitous. These data were used to create OPLS coefficientplots in the same way as for the 1H NMR data (OPLS-DAanalysis). To allow the best model, the data were filtered andonly bands that appeared in at least 50% of the animals in atleast one strain were retained; this resulted in 68 of the bandsremaining. The cross-validated scores plot from the OPLS-DAanalysis of the Zucker strains using the DGGE data showedexcellent separation and good predictive ability for all threestrains (Figure 2C). Several bands were seen to be causing theseparation of the lean (-/-) and obese (fa/fa) strains (Sup-porting Information, Figure 4) and this was also true for eachof the pairwise OPLS coefficient plots. OPLS-DA models gener-ated using DGGE data were significant for all the pairwisecomparisons.
To decide which bands should be examined further bycloning and 16S rRNA gene fragment sequencing, the OPLScoefficients were used to indicate the relative influence of each
band on the OPLS-DA models. Three bands were excised,cloned and sequenced to give a preliminary view of themicrobial species which caused the separation for the obeseanimals. All three bands were positively correlated with theobese (fa/fa) strain. Band 39 only appeared in the (fa/fa) strain;band 66 was intense for the obese (fa/fa) strain, but the twolean (fa/- and -/-) strains had equally less intense bands,and band 70 showed a gradual decrease in intensity from the(fa/fa) to (fa/-) and finally the lean (-/-) strain. Assessmentof the intensity of the bands was based on the area under thecurve for each peak. However, it should be noted that assumingthat the appearance and disappearance of a band, or indeedits intensity, can be attributed to the increase or decrease innumbers of a specific type of bacterium is a conclusion thatcan only be reached with considerable caution, particularlywhen using universal primer sets to examine complex ecosys-tems.59
Multiple clones, from the bands mentioned above, wereprocessed and each replicate sequence was subject to an WU-Blast2 search for sequence identification. Although one of thereplicates of band 39 was 100% similar to Halomonas sp. 10003(GenBank accession no. EU432573; a member of the classGammaproteobacteria), another replicate was 100% similar toan uncultured member of the phylum Bacteroidetes (cloneD748, GenBank accession no. AY986347). More refined se-quence analyses revealed that the uncultured Bacteroidetesclone was most closely related to Bacteroides caccae andBacteroides coprosius (∼5% sequence divergence, based on acomparison of 189 nt). The finding of one band representing
Figure 5. (A) Fecal bacterial population levels determined via FISHanalysis for the three rat strains examined in this study. Data (n) 8 per rat strain) are expressed as mean ( standard deviation.Details for the bacterial groups covered by the probes are givenin Materials and Methods. Significant differences (P < 0.05) inthe counts between strains were determined by unpaired Stu-dent’s t-test and are represented by the following; †, (fa/fa) and(fa/-); *, (fa/fa) and (-/-); ‡, (fa/-) and (-/-). (fa/fa) green square;(fa/-) blue square; and (-/-) red square. (B) Cross-validatedscores plot from the OPLS-DA model showing clear separationof the Zucker genotypes according to fecal bacterial populationlevels as determined by FISH. Red circle, (-/-) lean; blue circle,(fa/-) lean, green circle, (fa/fa) obese.
Figure 6. DGGE gel showing the bacterial profiles generated fromthe fecal microbiota of the three Zucker strains examined in thisstudy. Arrows indicate bands that were shown to be of signifi-cance in relation to the different genotypes. Band 39 was uniqueto the (fa/fa) strain and its sequences were derived from aHalomonas sp. and a member of the Bacteroidetes; band 66 wasmost intense in the (fa/fa) strain but the two lean (fa/- and -/-)strains had equally less intense bands, and its sequence wasderived from a Sphingomonas sp.; band 70 showed a gradualdecrease in intensity from the (fa/fa) to (fa/-) and finally the lean(-/-) strain, and its sequence, was derived from a Halomonassp. (99.5% sequence similarity to band 39).
research articles Waldram et al.
2368 Journal of Proteome Research • Vol. 8, No. 5, 2009

more than one species of bacteria in DGGE profiles is notunique, but it is a phenomenon that is often overlooked or notreported by researchers.59,60 It is also important to rememberthat sequences that are different may still result in similardenaturing properties, causing them to comigrate on a gel.59
For example, the Halomonas sp. and Bacteroides sp. identifiedin band 39 were 194 and 189 nt long, respectively, and differedin their G + C contents (56.7 and 47.6 mol%, respectively), yetthey migrated to the same point of the gel. Band 70 was alsoclosely related to Halomonas sp. 10003 (99.5%). Comparisonof the Halomonas sequences from bands 39 and 70 showedthem to display 99.5% sequence similarity (i.e., 1 mismatch in194 nt). It is possible that both bands are from the samebacterium, with the organism having multiple copies of the 16SrRNA gene but with sequence heterogeneities. The problemsof variable copy numbers and sequence heterogeneities inrelation to cloning and DGGE studies based on 16S rRNA genesequences have been highlighted by a number of authors,61-63
although it has been acknowledged that targeting the V3 regionof the 16S rRNA gene for the DGGE studies of gastrointestinalmicrobiomes generates the best profiles in terms of speciesrichness and resolution.64 Band 66 was 100% similar to Sph-ingomonas sp. BF14 (GenBank accession no. Z23157; a memberof the class Alphaproteobacteria). The sequences determinedfrom the bands discussed in this study have been depositedwith GenBank under accession numbers AM950263-AM950266.
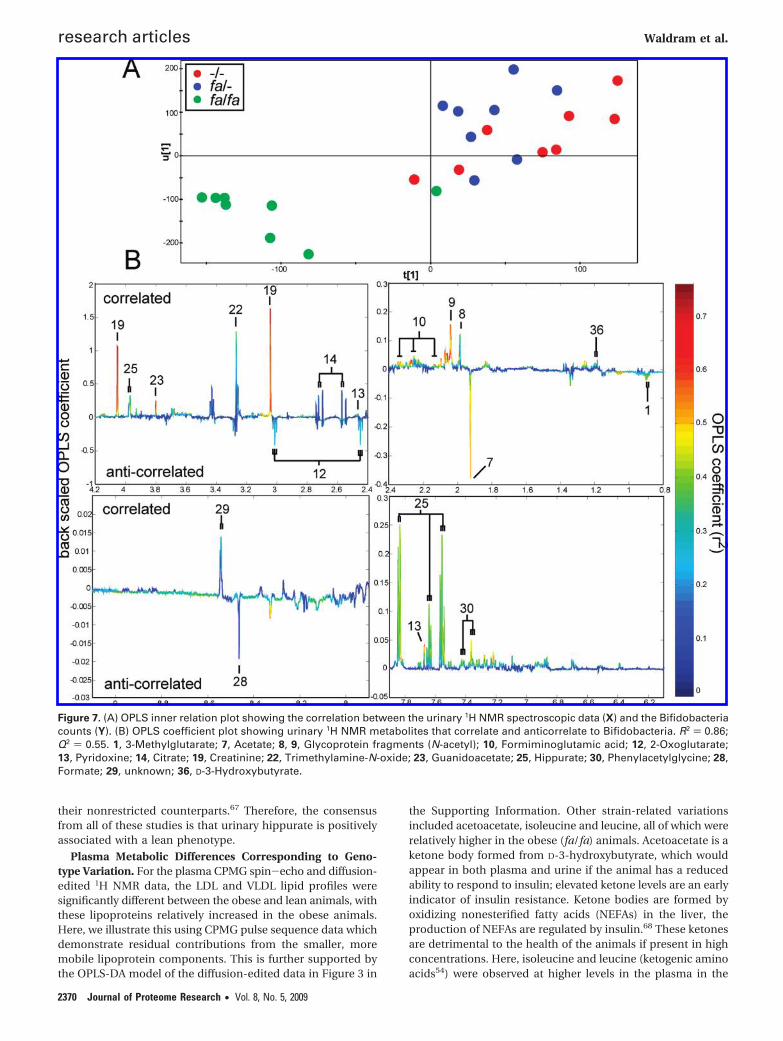
Integration of Metabotype and Microbiome Data. To modelcovariation patterns between metabolic data and microbiomedata, and investigate potential relationships between theurinary 1H NMR metabolite data and the individual bacterialcounts from FISH, OPLS models using the 1H NMR data topredict the relevant bacteria were established. As an example,the 1H NMR urinary data were used as the descriptor matrix(X) and the bacterial count for Bif164 was used as the responsevariable (Y). The bacteria targeted by this probe were chosenas an example as they had connections to the “healthier” strainand showed the most important difference for the (fa/fa) straincompared to the other two strains. The OPLS model shows thecorrelation between the urinary 1H NMR data (descriptormatrix) and the Bif164 count from FISH (response variable) asseen in the OPLS inner relation plot (Figure 7A). The plot notonly showed the correlation but also that the obese (fa/fa)animals had consistently lower Bif164 counts. The correspond-ing OPLS coefficient plot indicates which metabolites arecorrelated and which are anticorrelated with the particularbacterial group (Figure 7B). The metabolites that correlatedmost strongly with the Bif164 population were creatinine,hippurate and phenylacetylglycine (PAG), whereas acetate wasanticorrelated.
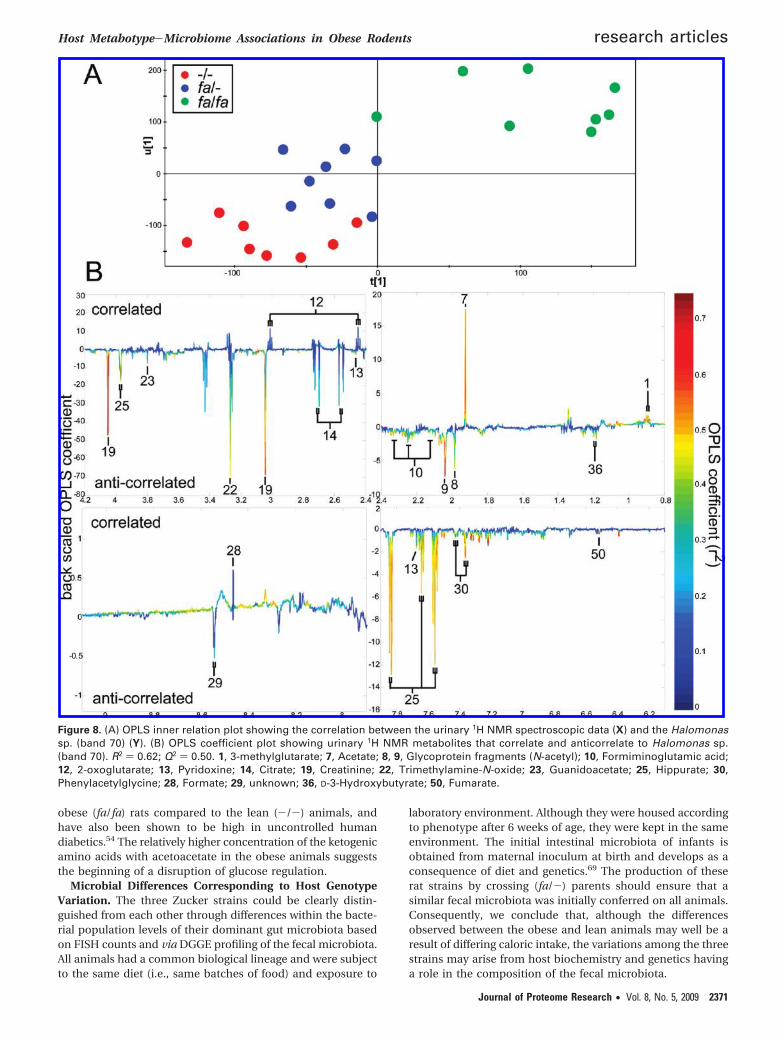
Another method of achieving an integrated model is to usea single DGGE band as the response variable to show interac-tions between metabolites and bacteria. Band 70 was selectedfrom the DGGE gel and regressed against the 1H NMR urinarymetabolite profiles. This band was selected as it had the highestpositive correlation with the (fa/fa) strain and was successfullyidentified (Halomonas sp.). The OPLS inner relation plot isshown in Figure 8A. The corresponding OPLS coefficient plotindicates which metabolites are correlated and which areanticorrelated with band 70 (Figure 8B).
While band 70 (Halomonas sp.) was positively correlated tothe (fa/fa) obese strain, the OPLS coefficient plot showed thatthere were only a few specific metabolites that were positivelycorrelated to this band, acetate being the main covarying
metabolite. However, there were many more metabolites thatwere anticorrelated to this band, including hippurate, pheny-lacetylglycine and TMAO, which are microbial cometabolites.
Since the model predicting individual DGGE bands from theurinary 1H NMR data was strong, that is, Q2 values of ∼0.55,using OPLS modeling, an O2PLS model was established tofurther examine if a joint model including all DGGE variablescould be used for prediction modeling between the two datasets, which would indicate that consistent multivariate cova-riation patterns between the metabolites and bacterial strainswere present. The urinary 1H NMR data were used as thedescriptor matrix and the filtered DGGE data used as theresponse matrix. The models that were created are shown inFigure 9, where the color indicates the Q2 values (predictionperformance) for each variable, peaks or bars which appearred have high predictive capability.
The 1H NMR peaks which were statistically well-predictedby the DGGE data were citrate, hippurate and three sets ofpeaks at δ2.03, δ2.16 and δ2.26 (all multiplets) which have beententatively identified as formiminoglutamic acid (FIGLU) basedon their concordance with the literature.65 FIGLU, citrate andhippurate had Q2 values of 0.69, 0.40, and 0.31, respectively.Several of the DGGE bands were well-predicted by the 1H NMRdata. Two of the bands that appeared in red (highest correla-tion) had already been identified from the OPLS-DA modelsof the strain comparison using the DGGE data; band 66(Sphingomonas sp.) had a predictive Q2 value of 0.58 and band70 (Halomonas sp.) had a predictive Q2 value of 0.54. To furthertest the robustness of this method, several peaks/bands fromthe 1H NMR and the DGGE gel were selected, with high andlow Q2 values, and both Pearson and Spearman correlationswere completed. The results are consistent with the O2PLSmodel and are displayed in the Supporting Information inTable 1.
Discussion
Urinary Metabolic Differences Corresponding to Geno-type Variation. Significant metabolic differences were estab-lished between the disease-prone Zucker (fa/fa) obese rats andthe other two lean strains even at 10 weeks of age, that is, priorto the development of insulin resistance in the obese strain,but after the onset of obesity (from weaning at 4 weeks). The1H NMR spectroscopic data obtained from the analysis of urineshowed major differences between strains including creatinine,TMAO and hippurate which were all lower in the urine of the(fa/fa) strain; conversely, acetate was relatively higher in the(fa/fa) obese strain. Creatinine is linked to muscle mass66 andthe lower levels observed could be a result of their excessiveweight and relative lack of muscle due to low physical activity.TMAO derives both from the diet and also from microbialmetabolism of choline. Hippurate is a gut microbial mam-malian co-metabolite of benzoic acid which can be generatedby a range of gut microbes from other low molecular weightaromatic compounds and polyphenolics in the gut and issubsequently glycine conjugated in the mitochondria andexcreted in the urine.4 Given that the food type and supplywas constant, the observed strain differences in hippurate andTMAO excretion is more likely an indication of functionaldifferences in the microbiome metabolic activity of the (fa/fa)animals.24 Hippurate has also been linked inversely to bloodpressure, suggesting a further connection with diet and obe-sity16 and has been reported to be present in higher concentra-tions in the urine of caloric-restricted dogs in comparison with
Host Metabotype-Microbiome Associations in Obese Rodents research articles
Journal of Proteome Research • Vol. 8, No. 5, 2009 2369
their nonrestricted counterparts.67 Therefore, the consensusfrom all of these studies is that urinary hippurate is positivelyassociated with a lean phenotype.
Plasma Metabolic Differences Corresponding to Geno-type Variation. For the plasma CPMG spin-echo and diffusion-edited 1H NMR data, the LDL and VLDL lipid profiles weresignificantly different between the obese and lean animals, withthese lipoproteins relatively increased in the obese animals.Here, we illustrate this using CPMG pulse sequence data whichdemonstrate residual contributions from the smaller, moremobile lipoprotein components. This is further supported bythe OPLS-DA model of the diffusion-edited data in Figure 3 in
the Supporting Information. Other strain-related variationsincluded acetoacetate, isoleucine and leucine, all of which wererelatively higher in the obese (fa/fa) animals. Acetoacetate is aketone body formed from D-3-hydroxybutyrate, which wouldappear in both plasma and urine if the animal has a reducedability to respond to insulin; elevated ketone levels are an earlyindicator of insulin resistance. Ketone bodies are formed byoxidizing nonesterified fatty acids (NEFAs) in the liver, theproduction of NEFAs are regulated by insulin.68 These ketonesare detrimental to the health of the animals if present in highconcentrations. Here, isoleucine and leucine (ketogenic aminoacids54) were observed at higher levels in the plasma in the
Figure 7. (A) OPLS inner relation plot showing the correlation between the urinary 1H NMR spectroscopic data (X) and the Bifidobacteriacounts (Y). (B) OPLS coefficient plot showing urinary 1H NMR metabolites that correlate and anticorrelate to Bifidobacteria. R2 ) 0.86;Q2 ) 0.55. 1, 3-Methylglutarate; 7, Acetate; 8, 9, Glycoprotein fragments (N-acetyl); 10, Formiminoglutamic acid; 12, 2-Oxoglutarate;13, Pyridoxine; 14, Citrate; 19, Creatinine; 22, Trimethylamine-N-oxide; 23, Guanidoacetate; 25, Hippurate; 30, Phenylacetylglycine; 28,Formate; 29, unknown; 36, D-3-Hydroxybutyrate.
research articles Waldram et al.
2370 Journal of Proteome Research • Vol. 8, No. 5, 2009
obese (fa/fa) rats compared to the lean (-/-) animals, andhave also been shown to be high in uncontrolled humandiabetics.54 The relatively higher concentration of the ketogenicamino acids with acetoacetate in the obese animals suggeststhe beginning of a disruption of glucose regulation.
Microbial Differences Corresponding to Host GenotypeVariation. The three Zucker strains could be clearly distin-guished from each other through differences within the bacte-rial population levels of their dominant gut microbiota basedon FISH counts and via DGGE profiling of the fecal microbiota.All animals had a common biological lineage and were subjectto the same diet (i.e., same batches of food) and exposure to
laboratory environment. Although they were housed accordingto phenotype after 6 weeks of age, they were kept in the sameenvironment. The initial intestinal microbiota of infants isobtained from maternal inoculum at birth and develops as aconsequence of diet and genetics.69 The production of theserat strains by crossing (fa/-) parents should ensure that asimilar fecal microbiota was initially conferred on all animals.Consequently, we conclude that, although the differencesobserved between the obese and lean animals may well be aresult of differing caloric intake, the variations among the threestrains may arise from host biochemistry and genetics havinga role in the composition of the fecal microbiota.
Figure 8. (A) OPLS inner relation plot showing the correlation between the urinary 1H NMR spectroscopic data (X) and the Halomonassp. (band 70) (Y). (B) OPLS coefficient plot showing urinary 1H NMR metabolites that correlate and anticorrelate to Halomonas sp.(band 70). R2 ) 0.62; Q2 ) 0.50. 1, 3-methylglutarate; 7, Acetate; 8, 9, Glycoprotein fragments (N-acetyl); 10, Formiminoglutamic acid;12, 2-oxoglutarate; 13, Pyridoxine; 14, Citrate; 19, Creatinine; 22, Trimethylamine-N-oxide; 23, Guanidoacetate; 25, Hippurate; 30,Phenylacetylglycine; 28, Formate; 29, unknown; 36, D-3-Hydroxybutyrate; 50, Fumarate.
Host Metabotype-Microbiome Associations in Obese Rodents research articles
Journal of Proteome Research • Vol. 8, No. 5, 2009 2371

The (fa/fa) obese strain had significantly lower DAPI (totalbacteria) and Bif164 counts when compared to the lean (fa/-and -/-) strains. Differences in bacterial populations were alsoobserved between the two lean phenotypes, with the (-/-) ratshaving significantly lower Lab158 and Erec482 counts com-pared to the (fa/-) rats. The physiological status of the rats’gastrointestinal tracts is clearly genotype-dependent, and thedifferences observed in the fecal microbiota of the three strainsstudied here support previous findings,70 that is, the physi-ological status of the gastrointestinal tract and not just diet hasa major role in the regulation of important groups of thegastrointestinal microbiota. The finding of lower Bif164 countsin the obese rats compared with the lean rats provides the firstreport demonstrating a direct and inverse association betweenbifidobacteria and an obese phenotype. It also provides sup-port, in relation to obesity-associated conditions, for theconclusions of Cani et al.,71 who suggested a role for bifido-bacteria in the regulation of endotoxaemia in C57b16/J mice.
The lower Bif164 counts in the (fa/fa) strain were parallel tothe decrease in urinary hippurate observed in this strain,suggesting that bifidobacteria are important in distinguishingbetween the obese and lean strains. Bifidobacterium speciesare known to produce acetate and lactate as principal end-products of glucose fermentation, are recognized as beingimportant members of the beneficial gut microbiota, arecommonly used probiotics and are the means through whichmost prebiotic functional foods are proposed to mediate theirhealth-promoting activities.72 There are currently no publishedreports on the ability of bifidobacteria to produce hippuratefrom benzoate via glycine conjugation or an associated rolefor them influencing systemic hippurate levels and hippurateis not observed in the fecal water of any strain of animal.Comparison of the benzoic acid-producing capabilities ofstrains of bifidobacteria with other intestinal bacteria would
provide information on those members of the fecal microbiotaresponsible for benzoate products and/or its metabolicintermediaries.
While recent studies have shown the importance ofBacteroidetes/Firmicutes ratio in obesity,73 our data broadlysupport these findings, and additionally, we provide analysesat a lower taxonomic level (genus) indicating that bifidobacteriamay also play a role in protection against obesogenesis. Thebifidobacteria are rarely considered in such global studiesbecause they are not usually recovered in metagenomic PCR-based clone libraries employing “universal bacterial” 16S rRNAgene primers. Various reasons have been provided for thisobservation, including selection of PCR primers (in relation toefficiency and target) and cycle conditions.74,75 Genome sizeand the copy number of the 16S rRNA gene also vary betweenspecies and even strains of the same species, confounding theissue further.55,76 It is important to consider the DGGE profile,as well as the FISH data, as it attempts to map the entirecolonization found in feces, although the same biasing againstbifidobacteria is encountered as for clone libraries. The DGGEprofile indicates that there are differences in the other bacteriapresent in the gut. The relative intensities of the bands fromthe DGGE profiles are also capable of completely separatingeach strain, providing a useful tool to microbiotype the threestrains of animals.
Three bands (39, 66 and 70) selected from the OPLS-DAanalyses of DGGE data were cloned. Two bands were successfullyidentified as a Halomonas sp. (band 70) and a Sphingomonas sp.(band 66). Band 70 (Halomonas sp.), which was present in theDGGE profiles of all animals, was the most significantly differentwhen comparing the lean (-/-) and the obese (fa/fa) strains, witha relatively denser band in the obese animals. Halomonas aqua-marina has been detected via a cloning study in pigs77 and‘Halomonas phocaeensis’ has been the cause of an outbreak of
Figure 9. (A) 1H NMR prediction results from the O2PLS model using the urine data. FIGLU, Formiminoglutamic acid. (B) DGGE predictionresults from the O2PLS model using the bacterial band information (*, identified bands). Color corresponds to the predictive ability ofthe model (Q2).
research articles Waldram et al.
2372 Journal of Proteome Research • Vol. 8, No. 5, 2009

bacteraemia in a neonatal intensive care unit.78 Halomonasmagadiensis has been shown to have antagonistic activity againstlipopolysaccharide (LPS) produced from Escherichia coli, with thisLPS having been shown to be associated with endotoxic shock inthe human enteric system.79 Recent work identified Halomonasspp. as important components of acetate-fed sludge reactors.80
Thus, the relative acetate levels of the different rat strains may beresponsible for the observed distinction in the density of band70, with the obese strain associated with higher acetate levels. Thecurrent study is the first to suggest an association betweenHalomonas spp. and obesity. With regard to band 66, the genusSphingomonas includes important xenobiotic-degrading bacteriathat are sometimes associated with human infections81 andimmune responses.82 Sphingomonas spp. have also been isolatedfrom the oral cavity of mice83 and, together with Bacteroidesthetaiotaomicron and other bacterial species, are considered tobe efficient carbohydrate scavengers (via TonB-dependent recep-tors).84
Metagenomic-Metabolic Data Integration. An OPLS analy-sis of the urinary 1H NMR data and a single band (70) revealedthat several microbiota co-metabolites, hippurate, pheny-lacetylglycine, TMAO, are anticorrelated to the detected Ha-lomonas sp. The O2PLS analysis integrating the urinary 1H NMRdata and the filtered DGGE data provided insights into whichmetabolites were associated to the microbiota. Unsurprisingly,it revealed that the hippurate concentration in the urine, asrepresented by the 1H NMR data, was well-predicted by themicrobial data, especially bands 28, 29, 32, and 66 (Sphin-gomonas sp.). These results could be further tested by intro-ducing inoculums obtained from the three different Zuckerstrains into germfree animals.
An OPLS model assessing the multivariate associations ofthe 1H NMR urinary data and the Bif164 counts (from FISH)revealed a good relationship. It was also illustrated that theobese (fa/fa) strain had lower Bif164 counts, together with arelatively lower hippurate concentration and a higher acetateconcentration. The concentration of acetate is likely to beattributed to other bacteria present in the obese animals, asbifidobacteria are acetate producers.85
The O2PLS model using the urinary 1H NMR data and thefiltered DGGE density data allowed visualization of severalpossible associations between the two data sets. This modelsupported many of the results already discussed, that is, theassociation of urinary hippurate with several microbial speciesand that Halomonas sp. (band 70) and Sphingomonas sp. (band66) are closely associated with the urinary 1H NMR data.
Conclusions
Classification of the metabolic phenotypes for lean (-/-)and obese (fa/fa) strains was readily achieved using 1H NMRspectra. However, the two lean strains (-/- and fa/-) couldnot be easily discriminated. Interestingly, despite being meta-bolically similar, the (fa/-) and the (-/-) leans rats differedin their microbiomes to the extent that the DGGE profile couldbe used to robustly predict a separation, suggesting that themicrobial differences did not significantly impact on the hostend-point metabolic status. Fecal bacterial counting using FISHalso achieved good separation between all three strains usingseven FISH probes. The (fa/fa) obese rat was unlike the otheranimals in this study, separating in each of the three methods,that is, 1H NMR, FISH and DGGE, from the other two strainsof Zucker rat. Modeling the metabolic and microbial covariationusing the O2PLS method identified correlations between
specific DGGE bands and several urinary variables, which gaveinsight into possible interactions between the host and themicrobiome. It is not clear how the differences in microbiotypebetween the (fa/fa) obese animals and the lean rats relate tohost genotype variation. However, both the metabolic andmetagenomic data sets show obvious associations with leanand obese phenotypes, consistent with previous observationson obese (ob/ob) mouse models.86 It now appears that evenphenotypically silent gene or SNP variations (e.g., (fa/-) and(-/-)) may have occult host phenotype physiological influ-ences that give rise to microbiome population selection and/or activity variations which may have wider implications whenconsidering interspecies and interstrain variations in diseasedevelopment and responses to therapies and their relevanceto problems in personalized healthcare.4,5,87,88 It also opensup new discovery biology opportunities for finding novelfunctional members of the microbiome that connect to hostmetabolism in disease states and as we have recently suggestedthe possibility of treating or selectively drugging the micro-biome with its large number of targets to achieve personalizedhealthcare benefits.19
Acknowledgment. The authors wish to thank the staffat the ABU in Alderley-Park, Nestle for funding Yulan Wangand AstraZeneca for its continued financial support. LesleyHoyles is thanked for processing and running the samplesfor DGGE and for sequencing and analyzing the bands.
Supporting Information Available: Table showingboth Pearson correlations and Spearman correlations forimportant metabolites and bands from the O2PLS analysis;examples of 1H NMR spectra produced from each pulseprogram from the plasma samples; typical plasma CPMG 1HNMR for each Zucker strain; OPLS coefficient plot comparingthe (-/-) lean strain and the (fa/fa) obese strain from thediffusion-edited plasma 1H NMR data; OPLS coefficient plotcomparing the (-/-) lean strain and the (fa/fa) obese strainfrom the DGGE profile. This material is available free of chargevia the Internet at http://pubs.acs.org.
References(1) Gill, S. R.; Pop, M.; DeBoy, R. T.; Eckburg, P. B.; Turnbaugh, P. J.;
Samuel, B. S.; Gordon, J. I.; Relman, D. A.; Fraser-Liggett, C. M.;Nelson, K. E. Metagenomic analysis of the human distal gut micro-biome. Science 2006, 312 (5778), 1355–1359.
(2) Kirjavainen, P. V.; Gibson, G. R. Healthy gut microflora and allergy:factors influencing development of the microbiota. Ann. Med. 1999,31 (4), 288–292.
(3) Lederberg, J. Infectious history. Science 2000, 288 (5464), 287–293.(4) Nicholson, J. K.; Holmes, E.; Wilson, I. D. Gut microorganisms,
mammalian metabolism and personalized health care. Nat. Rev.Microbiol. 2005, 3 (5), 431–438.
(5) Nicholson, J. K.; Wilson, I. D. Understanding ‘global’ systems biology:Metabonomics and the continuum of metabolism. Nat. Rev. DrugDiscovery 2003, 2 (8), 668–676.
(6) Li, M.; Wang, B.; Zhang, M.; Rantalainen, M.; Wang, S.; Zhou, H.;Zhang, Y.; Shen, J.; Pang, X.; Zhang, M.; Wei, H.; Chen, Y.; Lu, H.;Zuo, J.; Su, M.; Qiu, Y.; Jia, W.; Xiao, C.; Smith, L. M.; Yang, S.; Holmes,E.; Tang, H.; Zhao, G.; Nicholson, J. K.; Li, L.; Zhao, L. Symbiotic gutmicrobes modulate human metabolic phenotypes. Proc. Natl. Acad.Sci. U.S.A. 2008, 105 (6), 2117–2122.
(7) Martin, F. P. J.; Verdu, E. F.; Wang, Y. L.; Dumas, M. E.; Yap, I. K. S.;Cloarec, O.; Bergonzelli, G. E.; Corthesy-Theulaz, I.; Kochhar, S.;Holmes, E.; Lindon, J. C.; Collins, S. M.; Nicholson, J. K. Transgenomicmetabolic interactions in a mouse disease model: Interactions ofTrichinella spiralis infection with dietary Lactobacillus paracaseisupplementation. J. Proteome Res. 2006, 5 (9), 2185–2193.
(8) Wang, Y. L.; Holmes, E.; Nicholson, J. K.; Cloarec, O.; Chollet, J.;Tanner, M.; Singer, B. H.; Utzinger, J. Metabonomic investigationsin mice infected with Schistosoma mansoni: An approach for biom-
Host Metabotype-Microbiome Associations in Obese Rodents research articles
Journal of Proteome Research • Vol. 8, No. 5, 2009 2373
arker identification. Proc. Natl. Acad. Sci. U.S.A. 2004, 101 (34),12676–12681.
(9) Wang, Y.; Utzinger, J.; Saric, J.; Li, J. V.; Burckhardt, J.; Dirnhofer, S.;Nicholson, J. K.; Singer, B. H.; Brun, R.; Holmes, E. Global metabolicresponses of mice to Trypanosoma brucei brucei infection. Proc. Natl.Acad. Sci. U.S.A. 2008, 105 (16), 6127–6132.
(10) Dumas, M. E.; Barton, R. H.; Toye, A.; Cloarec, O.; Blancher, C.;Rothwell, A.; Fearnside, J.; Tatoud, R.; Blanc, V.; Lindon, J. C.; Mitchell,S. C.; Holmes, E.; McCarthy, M. I.; Scott, J.; Gauguier, D.; Nicholson,J. K. Metabolic profiling reveals a contribution of gut microbiota tofatty liver phenotype in insulin-resistant mice. Proc. Natl. Acad. Sci.U.S.A. 2006, 103 (33), 12511–12516.
(11) Dumas, M. E.; Wilder, S. P.; Bihoreau, M. T.; Barton, R. H.; Fearnside,J. F.; Argoud, K.; D’Amato, L.; Wallis, R. H.; Blancher, C.; Keun, H. C.;Baunsgaard, D.; Scott, J.; Sidelmann, U. G.; Nicholson, J. K.; Gauguier,D. Direct quantitative trait locus mapping of mammalian metabolicphenotypes in diabetic and normoglycemic rat models. Nat. Genet.2007, 39 (5), 666–672.
(12) Ley, R. E.; Turnbaugh, P. J.; Klein, S.; Gordon, J. I. MicrobialecologysHuman gut microbes associated with obesity. Nature 2006,444 (7122), 1022–1023.
(13) Martin, F. P. J.; Dumas, M. E.; Wang, Y. L.; Legido-Quigley, C.; Yap,I. K. S.; Tang, H. R.; Zirah, S.; Murphy, G. M.; Cloarec, O.; Lindon,J. C.; Sprenger, N.; Fay, L. B.; Kochhar, S.; van Bladeren, P.; Holmes,E.; Nicholson, J. K. A top-down systems biology view of microbiome-mammalian metabolic interactions in a mouse model. Mol. Syst. Biol.2007, 3, 112.
(14) Martin, F. P. J.; Wang, Y. L.; Sprenger, N.; Holmes, E.; Lindon, J. C.;Kochhar, S.; Nicholson, J. K. Effects of probiotic Lactobacillus para-casei treatment on the host gut tissue metabolic profiles probed viamagic-angle-spinning NMR spectroscopy. J. Proteome Res. 2007, 6(4), 1471–1481.
(15) Dumas, M. E.; Maibaum, E. C.; Teague, C.; Ueshima, H.; Zhou, B. F.;Lindon, J. C.; Nicholson, J. K.; Stamler, J.; Elliott, P.; Chan, Q.; Holmes,E. Assessment of analytical reproducibility of 1H NMR spectroscopybased metabonomics for large-scale epidemiological research: theINTERMAP study. Anal. Chem. 2006, 78 (7), 2199–2208.
(16) Holmes, E.; Loo, R. L.; Stamler, J.; Bictash, M.; Yap, I. K. S.; Chan, Q.;Ebbels, T.; De Iorio, M.; Brown, I. J.; Veselkov, K.; Daviglus, M.;Kestleloot, H.; Ueshima, H.; Zhao, L.; Nicholson, J. K.; Elliot, P. Humanmetabolic phenotype diversity and its association with diet and bloodpressure. Nature 2008, 453 (7193), 396–400.
(17) Rezzi, S.; Ramadan, Z.; Fay, L. B.; Kochhar, S. Nutritional metabo-nomics: Applications and perspectives. J. Proteome Res. 2007, 6 (2),513–525.
(18) Rezzi, S.; Ramadan, Z.; Martin, F. P. J.; Fay, L. B.; van Bladeren,P.; Lindon, J. C.; Nicholson, J. K.; Kochhar, S. Human metabolicphenotypes link directly to specific dietary preferences inhealthy individuals. J. Proteome Res. 2007, 6, 4469–4477.
(19) Wei, J.; Houkai, L.; Liping, Z.; Nicholson, J. K. Gut microbiota: apotential new territory for drug targeting. Nat. Rev. Drug Discovery2008, 7, 123–129.
(20) Manichanh, C.; Rigottier-Gois, L.; Bonnaud, E.; Gloux, K.; Pelletier,E.; Frangeul, L.; Nalin, R.; Jarrin, C.; Chardon, P.; Marteau, P.; Roca,J.; Dore, J. Reduced diversity of faecal microbiota in Crohn’s diseaserevealed by a metagenomic approach. Gut 2006, 55 (2), 205–211.
(21) Kava, R.; Greenwood, M. R. C.; Johnson, P. R. Zucker (fa/fa) rat. ILARJ. 1990, 32, 3.
(22) Friedman, J. M.; Halaas, J. L. Leptin and the regulation of body weightin mammals. Nature. 1998, 395 (22), 763–770.
(23) Burguera, B.; Couce, M. E.; Curran, G. L.; Jensen, M. D.; Lloyd, R. V.;Cleary, M. P.; Poduslo, J. F. Obesity is associated with a decreasedleptin transport across the blood-brain barrier in rats. Diabetes 2000,49 (7), 1219–1223.
(24) Williams, R. E.; Lenz, E. M.; Rantalainen, M.; Willson, I. D. Thecomparative metabonomics of age-related changes in the urinarycomposition of male Wistar-derived and Zucker (fa/fa) obese rats.Mol. BioSyst. 2006, 2 (3-4), 193–202.
(25) Nicholson, J. K.; Timbrell, J. A.; Sadler, P. J. Proton NMR spectra ofurine as indicators of renal damage: Mercury-induced nephrotoxicityin rats. Mol. Pharmacol. 1985, 27 (6), 644–651.
(26) Nicholson, J. K.; Wilson, I. D. High resolution proton NMR spectros-copy of biological fluids. Prog. Nucl. Magn. Reson. Spectrosc. 1989,29, 449–501.
(27) Nicholson, J. K.; Lindon, J. C.; Holmes, E. ‘Metabonomics’: under-standing the metabolic responses of living systems to pathophysi-ological stimuli via multivariate statistical analysis of biological NMRspectroscopic data. Xenobiotica 1999, 29 (11), 1181–1189.
(28) Wilson, I. D.; Nicholson, J. K.; Castro-Perez, J.; Granger, J. H.; Johnson,K. A.; Smith, B. W.; Plumb, R. S. High resolution “Ultra performance”liquid chromatography coupled to oa-TOF mass spectrometry as a
tool for differential metabolic pathway profiling in functional genomicstudies. J. Proteome Res. 2005, 4 (2), 591–598.
(29) Zhang, Q.; Wang, G. J.; Du, Y.; Zhu, L. L.; Jiye, A. GC/MS analysis ofthe rat urine for metabonomic research. J. Chromatogr., B:Anal.Technol. Biomed. Life Sci. 2007, 854 (1-2), 20–25.
(30) Granger, J. H.; Williams, R.; Lenz, E. M.; Plumb, R. S.; Stumpf, C. L.;Wilson, I. D. A metabonomic study of strain- and age-relateddifferences in the Zucker rat. Rapid Commun. Mass Spectrom. 2007,21 (13), 2039–2045.
(31) Gavaghan, C. L.; Holmes, E.; Lenz, E.; Wilson, I. D.; Nicholson, J. K.An NMR-based metabonomic approach to investigate the biochemi-cal consequences of genetic strain differences: application to theC57BL10J and Alpk: ApfCD mouse. FEBS Lett. 2000, 484 (3), 169–174.
(32) Williams, R. E.; Lenz, E. A.; Wilson, A. J.; Granger, J.; Wilson, I. D.;Major, H.; Stumpf, C. L.; Plumb, R. A multi-analytical platformapproach to the metabonomic analysis of plasma from normal andzucker (fa/fa) obese rats. Mol. BioSyst. 2006, 2 (1), 174–183.
(33) Muyzer, G.; de Waal, E. C.; Uitterlinden, A. G. Profiling of complexmicrobial populations by denaturing gradient gel electrophoresisanalysis of polymerase chain reaction-amplified genes coding for 16SrRNA. Appl. Environ. Microbiol. 1993, 59 (3), 695–700.
(34) Harmsen, H. J. M.; Gibson, G. R.; Elfferich, P.; Raangs, G. C.;Wildeboer-Veloo, A. C. M.; Argaiz, A.; Roberfroid, M. B.; Welling, G. W.Comparison of viable cell counts and fluorescence in situ hybridiza-tion using specific rRNA-based probes for the quantification ofhuman fecal bacteria. FEMS Microbiol. Lett. 2000, 183 (1), 125–129.
(35) Neuhaus, D.; Ismail, I. M.; Chung, C. W. “FLIPSY”sA new solvent-suppression sequence for nonexchanging solutes offering improvedintegral accuracy relative to 1D NOESY. J. Magn. Reson. 1996, 118(2), 256–263.
(36) Carr, H. Y.; Purcell, E. M. Effects of diffusion on free precession innuclear magnetic resonance experiments. Phys. Rev. 1954, 94 (3),630–638.
(37) Meiboom, S.; Gill, D. Modified spin-echo method for measuringnuclear relaxation times. Rev. Sci. Instrum. 1958, 29, 688–691.
(38) Liu, M. L.; Nicholson, J. K.; London, J. C. High-resolution diffusionand relaxation edited one- and two-dimensional 1H NMR spectros-copy of biological fluids. Anal. Chem. 1996, 68 (19), 3370–3376.
(39) Liu, M. L.; Nicholson, J. K.; Parkinson, J. A.; Lindon, J. C.Measurement of biomolecular diffusion coefficients in bloodplasma using two-dimensional 1H-1H diffusion-edited total-cor-relation NMR spectroscopy. Anal. Chem. 1997, 69 (8), 1504–1509.
(40) Sanguinetti, C. J.; Dias Neto, E.; Simpson, A. J. Rapid silver stainingand recovery of PCR products separated on polyacrylamide gels.BioTechniques 1994, 17 (5), 914–21.
(41) Langendijk, P. S.; Schut, F.; Jansen, G. J.; Raangs, G. C.; Kamphuis,G. R.; Wilkinson, M. H. F.; Welling, G. W. Quantitative fluorescencein-situ hybridization of Bifidobacterium spp. with genus-specific16s ribosomal-RNA-targeted probes and its application in fecalsamples. Appl. Environ. Microbiol. 1995, 61 (8), 3069–3075.
(42) Manz, W.; Amann, R.; Ludwig, W.; Vancanneyt, M.; Schleifer, K. H.Application of a suite of 16S rRNA-specific oligonucleotide probesdesigned to investigate bacteria of the phylum cytophaga-fla-vobacter-bacteroides in the natural environment. Microbiology(Reading, U.K.) 1996, 142, 1097–1106.
(43) Franks, A. H.; Harmsen, H. J. M.; Raangs, G. C.; Jansen, G. J.; Schut,F.; Welling, G. W. Variations of bacterial populations in humanfeces measured by fluorescent in situ hybridization with group-specific 16S rRNA-Targeted oligonucleotide probes. Appl. Environ.Microbiol. 1998, 64 (9), 3336–3345.
(44) Harmsen, H. J. M.; Elfferich, P.; Schut, F.; Welling, G. W. A 16SrRNA-targeted probe for detection of lactobacilli and enterococciin faecal samples by fluorescent in situ hybridization. Microb. Ecol.Health Dis. 1999, 11, 3–12.
(45) Harmsen, H. J. M.; Wildeboer-Veloo, A. C. M.; Grijpstra, J.; Knol,J.; Degener, J. E.; Welling, G. W. Development of 16S rRNA-basedprobes for the Coriobacterium group and the Atopobium clusterand their application for enumeration of Coriobacteriaceae inhuman feces from volunteers of different age groups. Appl.Environ. Microbiol. 2000, 66 (10), 4523–4527.
(46) Trygg, J.; Wold, S. Orthogonal projections to latent structures (O-PLS). J. Chemom. 2002, 16 (3), 119–128.
(47) Cloarec, O.; Dumas, M. E.; Trygg, J.; Craig, A.; Barton, R. H.; Lindon,J. C.; Nicholson, J. K.; Holmes, E. Evaluation of the orthogonalprojection on latent structure model limitations caused by chemi-cal shift variability and improved visualization of biomarkerchanges in 1H NMR spectroscopic metabonomic studies. Anal.Chem. 2005, 77 (2), 517–526.
research articles Waldram et al.
2374 Journal of Proteome Research • Vol. 8, No. 5, 2009
(48) Bylesjo, M.; Rantalainen, M.; Cloarec, O.; Nicholson, J. K.; Holmes,E.; Trygg, J. OPLS discriminant analysis: combining the strengthsof PLS-DA and SIMCA classification. J Chemom. 2006, 20 (8-10),341–351.
(49) Veselkov, K. A.; Lindon, J. C.; Ebbels, T. M.; Crockford, D.; Volynkin,V. V.; Holmes, E.; Davies, D. B.; Nicholson, J. K. Recursive segment-wise peak alignment of biological 1H NMR spectra for improvedmetabolic biomarker recovery. Anal. Chem. 2009, 81 (1), 56–66.
(50) Trygg, J. O2-PLS for qualitative and quantitative analysis inmultivariate calibration. J. Chemom. 2002, 16 (6), 283–293.
(51) Eriksson, L.; Johanaaon, E.; Kettaneh-Wold, N.; Wold, S. Multi-and Megavariate Data Analysis Principles and Applications; Umet-rics: Umea, 2001.
(52) Williams, R. E.; Lenz, E. A.; Evans, J. A.; Wilson, I. D.; Granger,J. H.; Plumb, R. S.; Stumpf, C. L. A combined 1H NMR and HPLC-MS-based metabonomic study of urine from obese (fa/fa) Zuckerand normal Wistar-derived rats. J. Pharm. Biomed. Anal. 2005, 38(3), 465–471.
(53) Williams, R. E.; Lenz, E. M.; Lowden, J. S.; Rantalainen, M.; Wilson,I. D. The metabonomics of aging and development in the rat: aninvestigation into the effect of age on the profile of endogenousmetabolites in the urine of male rats using 1H NMR and HPLC-TOF MS. Mol. BioSyst. 2005, 1 (2), 166–175.
(54) Nicholson, J. K.; O’Flynn, M. P.; Sadler, P. J.; Macleod, A. F.; Juul,S. M.; Sonksen, P. H. Proton NMR studies of serum, plasma andurine from fasting normal and diabetic subjects. Biochem. J. 1984,217 (2), 365–375.
(55) von Wintzingerode, F.; Gobel, U. B.; Stackebrandt, E. Determina-tion of microbial diversity in environmental samples: pitfalls ofPCR-based rRNA analysis. FEMS Microbiol. Rev. 1997, 21 (3), 213–229.
(56) Hertl, D. G.; Fredlake, C. P.; Barron, A. E. Advantages andlimitations of next-generation sequencing technologies: a com-parison of electrophoresis and non-electrophoresis methods.Electrophoresis 2008, 29, 4618–4626.
(57) Taylor, D. L.; Booth, M. G.; Mcfarland, J. W.; Herriott, I. C.; Lennon,N. J.; Nusbaum, C.; Marr, T. G. Increasing ecological inference fromhigh throughput sequencing of fungi in the environment througha tagging approach. Mol. Ecol. Resour. 2008, 8 (4), 742–752.
(58) Dowd, S. E.; Callaway, T. R.; Wolcott, R. D.; Sun, Y.; McKeehan,T.; Hagevoort, R. G.; Edrington, T. S. Evaluation of the bacterialdiversity in the feces of cattle using 16S rDNA bacterial tag-encoded FLX amplicon pyrosequencing (bTEFAP). BMC Microbiol.2008, 8, 125.
(59) Abecia, L.; Fondevila, M.; Balcells, J.; Edwards, J. E.; Newbold, C. J.;McEwan, N. R. Effect of antibiotics on the bacterial population ofthe rabbit caecum. FEMS Microbiol. Lett. 2007, 272 (2), 144–153.
(60) Kocherginskaya, S. A.; Aminov, R. I.; White, B. A. Analysis of therumen bacterial diversity under two different diet conditions usingdenaturing gradient gel electrophoresis, random sequencing, andstatistical ecology approaches. Anaerobe 2001, 7 (3), 119–134.
(61) Case, R. J.; Boucher, Y.; Dahllof, I.; Holmstrom, C.; Doolittle, W. F.;Kjelleberg, S. Use of 16S rRNA and rpoB genes as molecularmarkers for microbial ecology studies. Appl. Environ. Microbiol.2007, 73 (1), 278–288.
(62) Crosby, L. D.; Criddle, C. S. Understanding bias in microbialcommunity analysis techniques due to rrn operon copy numberheterogeneity. BioTechniques 2003, 34 (4), 790+.
(63) Dahllof, I.; Baillie, H.; Kjelleberg, S. rpoB-based microbial com-munity analysis avoids limitations inherent in 16S rRNA geneintraspecies heterogeneity. Appl. Environ. Microbiol. 2000, 66 (8),3376–3380.
(64) Yu, Z. T.; Morrison, M. Comparisons of different hypervariableregions of rrs genes for use in fingerprinting of microbial com-munities by PCR-denaturing gradient gel electrophoresis. Appl.Environ. Microbiol. 2004, 70 (8), 4800–4806.
(65) Perry, T. L.; Applegarth, D. A.; Evans, M. E.; Hansen, S.; Jellum, E.Metabolic studies of a family with massive formiminoglutamicaciduria. Pediatr. Res. 1975, 9 (3), 117–122.
(66) Rikimaru, T.; Oozeki, T.; Ichikawa, M.; Ebisawa, H.; Fujita, Y.Comparisons of urinary creatinine, skeletal-muscle mass, andindexes of muscle protein catabolism in rats fed ad-libitum, withrestricted food-intake, and deprived of food. J. Nutr. Sci. Vitaminol.1989, 35 (3), 199–209.
(67) Wang, Y. L.; Lawler, D.; Larson, B.; Ramadan, Z.; Kochhar, S.;Holmes, E.; Nicholson, J. K. Metabonomic investigations of agingand caloric restriction in a life-long dog study. J. Proteome Res.2007, 6 (5), 1846–1854.
(68) Holt, R. I. G.; Hanley, N. A., Essential Endocrinology and Diabetes,5th ed.; Blackwell Publishing Ltd: Malden, MA, 2007.
(69) Roger, L. C.; McCartney, A. L., Prebiotics and the infant microbiota.In Probiotics & Prebiotics: Scientific Aspects; Tannock, G. W., Ed.;Caister Academic Press: Norfolk, U.K., 2005; pp 195-216.
(70) Lesniewska, V.; Rowland, I.; Cani, P. D.; Neyrinck, A. M.; Delzenne,N. M.; Naughton, P. J. Effect on components of the intestinalmicroflora and plasma neuropeptide levels of feeding Lactobacillusdelbrueckii, Bifidobacterium lactis, and inulin to adult and elderlyrats. Appl. Environ. Microbiol. 2006, 72 (10), 6533–6538.
(71) Cani, P. D.; Neyrinck, A. M.; Fava, F.; Knauf, C.; Burcelin, R. G.;Tuohy, K. M.; Gibson, G. R.; Delzenne, N. M. Selective increasesof bifidobacteria in gut microflora improve high-fat-diet-induceddiabetes in mice through a mechanism associated with endotox-aemia. Diabetologia 2007, 50 (11), 2374–2383.
(72) Tuohy, K. M.; Probert, H. M.; Smejkal, C. W.; Gibson, G. R. Usingprobiotics and prebiotics to improve gut health. Drug DiscoveryToday 2003, 8 (15), 692–700.
(73) Turnbaugh, P. J.; Ley, R. E.; Mahowald, M. A.; Magrini, V.; Mardis,E. R.; Gordon, J. I. An obesity-associated gut microbiome withincreased capacity for energy harvest. Nature 2006, 444 (7122),1027–1031.
(74) Bonnet, R.; Suau, A.; Dore, J.; Gibson, G. R.; Collins, M. D.Differences in rDNA libraries of faecal bacteria derived from 10-and 25-cycle PCRs. Int. J. Syst. Evol. Microbiol. 2002, 52, 757–763.
(75) Suau, A.; Bonnet, R.; Sutren, M.; Godon, J. J.; Gibson, G. R.; Collins,M. D.; Dore, J. Direct analyses of genes encoding 16S rRNA fromcomplex communities reveals many novel molecular specieswithin the human gut. Appl. Environ. Microbiol. 1999, 65, 4799–4807.
(76) Nubel, U.; Engelen, B.; Felske, A.; Snaidr, J.; Wieshuber, A. I.;Amann, R.; Ludwig, W.; Backhaus, H. Sequence heterogeneitiesof genes encoding 16S rRNAs in Paenibacillus polymyxa detectedby temperature gradient gel electrophoresis. J. Bacteriol. 1996, 178,5636–5643.
(77) Leser, T. D.; Amenuvor, J. Z.; Jensen, T. K.; Lindecrona, R. H.; Boye,M.; Moller, K. Culture-independent analysis of gut bacteria: thepig gastrointestinal tract microbiota revisited. Appl. Environ.Microbiol. 2002, 68 (2), 673–690.
(78) Berger, P.; Barguellil, F.; Raoult, D.; Drancourt, M. An outbreak ofHalomonas phocaeensis sp nov bacteraemia in a neonatal intensivecare unit. J. Hosp. Infect. 2007, 67 (1), 79–85.
(79) Ialenti, A.; Di Meglio, P.; Grassia, G.; Maffia, P.; Di Rosa, M.; Lanzetta,R.; Molinaro, A.; Silipo, A.; Grant, W.; Ianaro, A. A novel lipid A fromHalomonas magadiensis inhibits enteric LPS-induced human mono-cyte activation. Eur. J. Immunol. 2006, 36 (2), 354–360.
(80) Osaka, T.; Shirotani, K.; Yoshie, S.; Tsuneda, S. Effects of carbon sourceon denitrification efficiency and microbial community structure ina saline wastewater treatment process. Water Res. 2008, 42 (14),3709–3718.
(81) Hsueh, P. R.; Teng, L. J.; Yang, P. C.; Chen, Y. C.; Pan, H. J.; Ho, S. W.;Luh, K. T. Nosocomial infections caused by Sphingomonas pauci-mobilis: Clinical features and microbiological characteristics. Clin.Infect. Dis. 1998, 26 (3), 676–681.
(82) Kinjo, Y.; Wu, D.; Kim, G. S.; Xing, G. W.; Poles, M. A.; Ho, D. D.;Tsuji, M.; Kawahara, K.; Wong, C. H.; Kronenberg, M. Recognition ofbacterial glycosphingolipids by natural killer T cells. Nature 2005,434 (7032), 520–525.
(83) Lee, B.; Bowden, G. H.; Myal, Y. Identification of mouse submaxillarygland protein in mouse saliva and its binding to mouse oral bacteria.Arch. Oral Biol. 2002, 47 (4), 327–332.
(84) Blanvillain, S.; Meyer, D.; Boulanger, A.; Lautier, M.; Guynet, C.;Denance, N.; Vasse, J.; Lauber, E.; Arlat, M. Plant carbohydratescavenging through TonB-dependent receptors: a feature shared byphytopathogenic and aquatic bacteria. PLoS ONE 2007, 2, e224.
(85) Gibson, G. R.; Wang, X. Regulatory effects of bifidobacteria on thegrowth of other colonic bacteria. J. Appl. Bacteriol. 1994, 77 (4), 412–420.
(86) Ley, R. E.; Backhed, F.; Turnbaugh, P.; Lozupone, C. A.; Knight, R. D.;Gordon, J. I. Obesity alters gut microbial ecology. Proc. Natl. Acad.Sci. U.S.A. 2005, 102 (31), 11070–11075.
(87) Clayton, T. A.; Lindon, J. C.; Cloarec, O.; Antti, H.; Charuel, C.; Hanton,G.; Provost, J. P.; Le Net, J. L.; Baker, D.; Walley, R. J.; Everett, J. R.;Nicholson, J. K. Pharmaco-metabonomic phenotyping and personal-ized drug treatment. Nature 2006, 440 (7087), 1073–1077.
(88) Nicholson, J. K.; Holmes, E.; Lindon, J. C.; Wilson, I. D. Thechallenges of modeling mammalian biocomplexity. Nat. Biotech-nol. 2004, 22 (10), 1268–1274.
PR8009885
Host Metabotype-Microbiome Associations in Obese Rodents research articles
Journal of Proteome Research • Vol. 8, No. 5, 2009 2375