GUT MICROBIOME IN HIV-1 INFECTION MUNTSA ...
135
ADVERTIMENT. Lʼaccés als continguts dʼaquesta tesi queda condicionat a lʼacceptació de les condicions dʼús establertes per la següent llicència Creative Commons: http://cat.creativecommons.org/?page_id=184 ADVERTENCIA. El acceso a los contenidos de esta tesis queda condicionado a la aceptación de las condiciones de uso establecidas por la siguiente licencia Creative Commons: http://es.creativecommons.org/blog/licencias/ WARNING. The access to the contents of this doctoral thesis it is limited to the acceptance of the use conditions set by the following Creative Commons license: https://creativecommons.org/licenses/?lang=en
-
Upload
khangminh22 -
Category
Documents
-
view
0 -
download
0
Transcript of GUT MICROBIOME IN HIV-1 INFECTION MUNTSA ...

ADVERTIMENT. Lʼaccés als continguts dʼaquesta tesi queda condicionat a lʼacceptació de les condicions dʼúsestablertes per la següent llicència Creative Commons: http://cat.creativecommons.org/?page_id=184
ADVERTENCIA. El acceso a los contenidos de esta tesis queda condicionado a la aceptación de las condiciones de usoestablecidas por la siguiente licencia Creative Commons: http://es.creativecommons.org/blog/licencias/
WARNING. The access to the contents of this doctoral thesis it is limited to the acceptance of the use conditions setby the following Creative Commons license: https://creativecommons.org/licenses/?lang=en

GUT MICROBIOME IN HIV-1 INFECTION
MUNTSA ROCAFORT JUNCÀ
DOCTORAL THESIS
Universitat Autònoma de Barcelona
Facultat de Biociències, Departament de Genètica I Microbiologia
2014-2018
Thesis directors:
Dr. Roger Paredes Deiros
Dr. Marc Noguera Julian
Thesis tutor:
Dr. Pere Coll Figa


Muntsa Rocafort Junca’s PhD work was supported by the University and Research
Secretary -Department of Economy and Knowledge of the Government of Catalonia
and the European Social Fund (Ref. 2015 FI_B 00184)


El Dr. Roger Paredes Deiros, investigador principal del grup de Genòmica
Microbiana de l’Institut de Recerca de la SIDA IrsiCaixa, i el Dr. Marc Noguera-
Julián, investigador sènior del mateix grup,
fan constar que
la realització experimental i la redacció d’aquesta tesis doctoral titulada Gut
Microbiome in HIV-1 Infection han estat realitzades per l’estudiant Muntsa
Rocafort Juncà sota la seva direcció
i consideren que
la memòria resultant és apta per optar al títol de Doctor en Microbiologia amb
menció internacional per la Universitat Autònoma de Barcelona.
I per a deixar constància, firmen el següent document a Badalona, a 19 d’octubre de
2018.
Dr. Roger Paredes Deiros Dr. Marc Noguera Julian


El Dr. Pere Coll Figa, director del servei de Microbiologia de l’Hospital Sant Pau i
catedràtic de Microbiologia i parasitologia a la Universitat Autònoma de Barcelona,
fa constar que
la realització experimental i la redacció d’aquesta tesis doctoral titulada Gut
Microbiome in HIV-1 Infection han estat realitzades per l’estudiant Muntsa
Rocafort Juncà sota la seva tutoria
i consideren que
la memòria resultant és apta per optar al títol de Doctor en Microbiologia amb
menció internacional per la Universitat Autònoma de Barcelona.
I per a deixar constància, firmen el següent document a Badalona, a 19 d’octubre de
2018.
Dr. Pere Coll Figa


Per la mare, que ho és tot per mi.


LIST OF CONTENTS
ABBREVIATIONS AND ACRONYMS ......................................................................... 1
SUMMARY .................................................................................................................. 5
RESUM ........................................................................................................................ 7
RESUMEN ................................................................................................................... 9
1. INTRODUCTION ............................................................................................... 11
1.1. MICROBES MATTER ................................................................................... 11
1.1.1. CLASSIC MICROBIOLOGY .................................................................... 11
1.1.2. MOLECULAR APPROACH ..................................................................... 12
1.1.3. SEQUENCING APPROACHES .............................................................. 13
1.1.3.1. LAB PROCEDURES .......................................................................... 14
1.1.3.2. BIOINFORMATIC ANALYSIS: SOFTWARE AND DATABASES ...... 16
1.2. HUMAN MICROBIOME ................................................................................ 21
1.2.1. HUMAN MICROBIOME PROJECT ......................................................... 22
1.2.2. META-HIT ................................................................................................ 22
1.3. ACQUIRED IMMUNODEFICIENCY SYNDROME (AIDS) ........................... 23
1.3.1. HIV - CHARACTERISTICS AND LIFE CYCLE ....................................... 24
1.3.2. HIV - MICROBIAL TRANSLOCATION, IMMUNE ACTIVATION AND
CHRONIC INFLAMMATION ................................................................................ 25
1.4. HUMAN GUT MICROBIOTA AND HIV-1 ..................................................... 29
1.4.1. CHRONIC HIV-1 INFECTION ................................................................. 29
1.4.2. ACUTE HIV-1 INFECTION ...................................................................... 35
1.4.3. NON-BACTERIAL MICROBIOME........................................................... 35
2. OBJECTIVES .................................................................................................... 37
3. MATERIAL AND METHODS ............................................................................. 39
3.1. STUDY 1: META HIV-PHENO ..................................................................... 39
3.1.1. STUDY COHORT .................................................................................... 39
3.1.2. LAB PROCEDURES ............................................................................... 41
3.1.2.1. Sample collection ............................................................................... 41
3.1.2.2. DNA/RNA extraction........................................................................... 41
3.1.2.3. 16S rRNA gene amplification ............................................................. 42
3.1.2.4. Illumina MiSeq sequencing ................................................................ 42
3.1.2.5. Immune measurements...................................................................... 43

3.1.2.6. Nutritional assessment ...................................................................... 43
3.1.3. BIOINFORMATIC ANALYSES ............................................................... 44
3.1.3.1. OTU picking and taxonomic assessment .......................................... 44
3.1.4. STATISTICAL ANALYSES ..................................................................... 45
3.1.4.1. Ecological parameters ....................................................................... 45
3.1.4.2. Taxonomic composition ..................................................................... 45
3.1.4.3. Nutrient assessment .......................................................................... 47
3.1.4.4. Immune markers assessment ........................................................... 47
3.2. STUDY 2: META HIV-ACUTE ..................................................................... 48
3.2.1. STUDY COHORT ................................................................................... 48
3.2.2. LAB PROCEDURE ................................................................................. 49
3.2.2.1. Sample collection .............................................................................. 49
3.2.2.2. DNA/RNA extraction .......................................................................... 50
3.2.2.3. 16S rRNA gene amplification ............................................................ 50
3.2.2.4. RT-PCR testing of eukaryotic viruses ............................................... 51
3.2.2.5. Illumina MiSeq and Illumina HiSeq sequencing ................................ 51
3.2.2.6. Immune measurements ..................................................................... 51
3.2.3. BIOINFORMATIC ANALYSIS ................................................................ 52
3.2.3.1. OTU picking and taxonomic assessment .......................................... 52
3.2.3.2. Whole genome sequencing ............................................................... 53
3.2.4. STATISTICAL ANALYSIS ...................................................................... 53
3.2.4.1. Ecological parameters ....................................................................... 53
3.2.4.2. Taxonomic composition ..................................................................... 54
3.2.4.3. Eukaryotic virus expansion ................................................................ 55
4. RESULTS .......................................................................................................... 57
4.1. STUDY 1: META-HIV PHENO ..................................................................... 57
4.1.1. Baseline characteristics of the study cohort ........................................... 57
4.1.2. European gay men have a distinct gut microbiota composition ............. 60
4.1.3. HIV-1 infection is independently associated with reduced bacterial
richness. .............................................................................................................. 68
4.1.4. Diet had a minor impact on gut microbiota composition in the BCN0
cohort. 70
4.2. STUDY 2: META-HIV ACUTE ..................................................................... 71
4.2.1. Baseline characteristics of the study cohort ............................................ 71
4.2.2. Recent HIV-1 infection is followed by increased fecal adenovirus
shedding ............................................................................................................... 74
4.2.3. Recent HIV-1 infection is followed by transient non-HIV-1-specific
changes in the gut bacteriome ............................................................................. 74
4.2.4. An HIV-1-specific signature in the gut microbiota previously associated
with chronic inflammation is observed in chronically HIV-1 infected subjects ..... 79
4.2.5. HIV-1 infection is linked to reduced bacterial gene richness with potential
microbial functional changes. ............................................................................... 80
5. DISCUSSION .................................................................................................... 83
6. CONCLUSIONS ................................................................................................ 91
7. REFERENCES .................................................................................................. 93
8. APPENDIX ....................................................................................................... 113
9. ACKNOWLEDGMENTS .................................................................................. 115


1
ABBREVIATIONS AND ACRONYMS
AIDS Acquired immunodeficiency syndrome
AP-1 Activator protein 1
ART Antiretroviral treatment
ATB Antibiotic
AUC Area under the curve
BAFF B-cell activating factor
BH Benjamini-Hochberg
BMA Barcelona metropolitan area
bp Base pairs
CAG Co-abundance genes
CCR5 C-C chemokine receptor type 5
CD14 / 163 / 27 Cluster of differentiation 14 / 163 / 27
CHI_ART Chronically HIV-1 infected subjects on ART
CHI_noART Chronically HIV-1 infected subjects ART-naive
cDNA Complementary deoxyribonucleic acid
CRAI Condomless receptive anal intercourse
CRP C-reactive protein
CTLA4 Cytotoxic T-lymphocyte associated protein 4
CXCR4 C-X-C chemokine receptor type 4
DNA Deoxyribonucleic acid
FDR False discovery rate
GALT Gut associated lymphoid tissue
HBV Human Hepatitis B virus
HCV Human Hepatitis C virus
HGC High gene count
2
HIV-1 Human immunodeficiency virus type-1
HMP Human microbiome project
HPV Human Papillomavirus
HTS Heterosexuals
IBD Inflammatory bowel disease
IDO1 Indoleamine-pyrrole 2,3-dioxygenase enzyme 1
IFABP Intestinal fatty-acid binding protein
Ig Immunoglobulin
IGC Integrated gene catalogue
IL 12 / 17 / 22 / 23 Interleukin 12 / 17 / 22 / 23
IP10 Interferon gamma-induced protein 10
IQR Interquartile range
ITS Internal transcribed spacer
KT ratio Kynurenine to Tryptophan ratio
LBP Lipopolysaccharide binding protein
LGC Low gene count
LMM Linear Mixed Model
LPS Lipopolysaccharide
MD2 Lymphocyte antigen 96
MDH Manhiça District Hospital
MGS Metagenomic species
MSM Men who have sex with men
NFkB Nuclear factor kappa of activated B-cells
NEG HIV-1 negative subjects
NGS Next generation sequencing
nM Nanomolar
NHPM Non-human primate model

3
NMDS Non-metric muldimensional scaling
OTU Operational taxonomic unit
PAM Partitioning around medioids
PCR Polymerase chain reaction
PD-1 Programmed cell death protein 1
PDL2 PD ligand type 2
PMN elastase Leukocyte elastase
PWID People who inject drugs
RHI Recently HIV-1 infected / infection
RNA Ribonucleic acid
rRNA Ribosomal ribonucleic acid
RT-PCR Real time polymerase chain reaction
SCFA Short chain fatty acids
SIV Simian immunodeficiency virus
SOP Standard operating procedure
Th17 / Th22 T helper 17 / 22 cells
TLR4 Toll-like receptor 4
TMA Trimethylamine
TMAO Trimethylamine oxide
TNFα Tumor necrosis factor α
TNFR2 Tumor necrosis factor receptor type 2
WGS Whole genome sequencing

4

5
SUMMARY
Soon after Human Immunodeficiency Virus type 1 (HIV-1) infection, a severe and
rapid depletion of the gut-associated lymphoid tissue (GALT) occurs, including
significant loss of both, immune and epithelial host cells. This is followed by an
increased permeability of the intestinal cell lining which facilitates microbial
translocation. Microbial cells and products that are usually contained and controlled
within the intestinal lumen, can now circulate in the bloodstream and become a new
source for immune activation and inflammation. Because of the significant immune
imbalance in the GALT after HIV-1 infection, recent microbiome research has focused
on understanding the changes occurring in the microbial communities inhabiting the
human gut after HIV-1 perturbation and in response to antiretroviral treatment (ART).
Initial cross-sectional studies provided contradictory associations between gut
microbial richness and diversity and HIV-1 infection and suggested shifts from
Bacteroides to Prevotella predominance following viral infection. Nonetheless, these
results have not been confirmed in animal models or in studies matched for HIV-1
transmission risk groups. For instance, in non-human primate models (NHPM),
Simian Immunodeficiency Virus (SIV) infection is followed by expansion of enteric
virome but has a limited impact on the gut bacteriome.
In two independent European cross-sectionals cohorts of chronically HIV-1-infected
subjects and uninfected controls, in Barcelona (n=156) and Stockholm (n=84), men-
who-have-sex-with-men (MSM) showed a Prevotella-enriched gut microbiota and
higher microbial richness and diversity compared to non-MSM individuals who
predominantly showed a Bacteroides-enriched microbiota, regardless of HIV-1
infection. After stratifying for sexual orientation (MSM vs. non-MSM), we described
lower microbial richness and diversity in HIV-1 infected subjects, more so in subjects
with an immune-discordant response to ART, but there was no solid evidence of an
HIV-1-specific dysbiosis. In our Barcelona cohort, diet did not have a major impact on
gut microbiota composition.
To understand the longitudinal effects of HIV-1 infection on the human gut microbiota,
we prospectively followed 49 Mozambican subjects diagnosed with recent HIV-1
infection and 54 uninfected controls for 9-18 months and compared them with 98
chronically HIV-1-infected subjects ART-treated (n=27) or not (n=71). Recent HIV-1

6
infection was characterized by increased fecal Adenovirus shedding, which persisted
during chronic HIV-1 infection and did not resolve with ART. Recent HIV-1 infection
was also followed by transient non-HIV-1-specific changes in the gut bacterial
richness and composition. Despite early resilience to change, an HIV-1-specific
signature in the gut bacteriome could be eventually identified in chronically HIV-1-
infected subjects. Such signature featured depletion of Akkermansia, Anaerovibrio,
Bifidobacterium, and Clostridium, and has been previously associated with chronic
inflammation, CD8+ T-cell anergy and metabolic disorders.
In conclusion: 1) Sexual practice is an important confounding factor in microbiome
studies that needs to be considered, especially in HIV-1-gut microbiota studies; 2) Gut
microbiota is initially resilient to change right after HIV-1 acquisition but a pro-
inflammatory-bacterial signature eventually appears in chronic phases of the infection,
and 3) Changes on the gut microbiota do not only impact bacterial communities, but,
at least, also viral communities.

7
RESUM
Una vegada el Virus de la Immunodeficiència Humana tipus 1 (HIV-1 de l’anglès
Human Immunodeficiency Virus type 1) infecta l’organisme hoste es produeix una
ràpida i severa destrucció del teixit limfoide associat a tracte gastrointestinal que
inclou, entre d’altres, significants pèrdues cel·lulars del sistema immunitari i epitelial
de l’hoste. Seguidament es produeix un increment de la permeabilitat de la paret
intestinal que permet la translocació microbiana. Així i doncs, productes i cèl·lules
microbianes que normalment queden confinats i controlats dins la llum intestinal ara
poden travessar l’epiteli intestinal i entrar en circulació sanguínia convertint-se en un
nou focus d’activació immunitària i inflamació. Per la seva significant contribució en
la patogènesis del HIV-1, gran part de la recerca en microbioma dels últims anys s’ha
centrat en entendre els canvis que tenen lloc en les comunitats microbianes que
habiten dins l’intestí humà després de la infecció per HIV-1 i de l’inici de tractament
antiretroviral (ART de l’anglès Antiretroviral treatment).
Els primers estudis transversals van descriure relacions contradictòries entre la
riquesa i diversitat microbiana a l’intestí i la infecció per HIV-1 i van suggerir una
substitució de Bacteroides per Prevotella com a conseqüència de l’adquisició viral.
Aquests resultats però, no s’han confirmat ni en models animals ni en estudis
balancejats per grups de risc de transmissió de VIH-1. En estudis en models de
primats no humans (NHPM de l’anglès non-human primate models), la infecció per
SIV (de l’anglès Simian Immunodeficiency Virus) s’ha associat a una expansió de les
comunitats víriques intestinals però no s’ha descrit un canvi consistent en les
comunitats bacterianes.
En dues cohorts europees independents de persones amb infecció crònica per HIV-
1 i persones no infectades de Barcelona (n=156) i Estocolm (n=84), els individus
homosexuals (MSM de l’anglès Men-who-have-Sex-with-Men), presentaven una
microbiota intestinal més rica i diversa i una major abundància relativa de Prevotella,
en comparació amb individus heterosexuals (no-MSM) que estaven enriquits per
Bacteroides, independentment de la infecció per HIV-1. Estratificant els grups d’estudi
en funció de la seva preferència sexual (MSM vs non-MSM), individus infectats amb
HIV-1 presentaven valors inferiors de riquesa i diversitat bacteriana, amb els valors

8
més baixos en el grup de individus amb una resposta discordant a ART. Tot i així no
hi havia canvis evidents respecte una disbiosi específica de infecció per VIH-1. En la
nostra cohort d’estudi de Barcelona, la dieta tenia un efecte limitat sobre la
composició de la microbiota intestinal.
Per estudiar els efectes longitudinals de la infecció per HIV-1 en la microbiota
intestinal, vam fer un seguiment de 9-18 mesos a 49 persones de Moçambic
diagnosticades amb infecció recent per HIV-1 i 54 persones no infectades, i les vam
comparar amb dos grups de persones amb infecció crònica per HIV-1, tan si estaven
amb ART (n=27) o no (n=71). En aquest estudi, seguint la infecció recent per HIV-1,
es produïa una major secreció d’Adenovirus en femta, la qual persistia en infecció
crònica i no desapareixia amb l’administració de ART. Paral·lelament també vam
descriure canvis transitoris no específics en la riquesa i la composició bacteriana
després de la infecció recent per HIV-1. Malgrat certa resiliència inicial al canvi, sí
que s’evidenciava una signatura en quan a composició bacteriana en individus amb
infecció crònica per HIV-1. Aquesta signatura, que incloïa pèrdua de Akkermansia,
Anaerovibrio, Bifidobacterium i Clostridium, ja ha estat prèviament associada a
inflamació crònica, anergia de limfòcits T CD8+ i desordres metabòlics.
En conclusió: 1) La preferència sexual és un factor de confusió important que s’hauria
de considerar d’ara endavant, especialment en estudis de microbioma intestinal i HIV-
1; 2) La microbiota intestinal sembla ser inicialment resilient a canviar després la
infecció per HIV-1 però amb el pas del temps i progressió a fase crònica sí que apareix
una signatura bacteriana amb perfil pro-inflamatori; i 3) Els canvis en la microbiota
intestinal no només afecten les comunitats bacterianes sinó també, com a mínim, les
comunitats víriques.

9
RESUMEN
Una vez el Virus de la Inmunodeficiencia Humana tipo 1 (HIV-1 del inglés Human
Immunodeficiency Virus type 1) entra en el organismo huésped, se produce una
importante y severa destrucción del tejido linfoide asociado al tracto gastrointestinal
que incluye, entre otros, significativas pérdidas celulares del sistema inmune y
epitelial del huésped. Seguidamente se produce un incremento de la permeabilidad
de la pared intestinal que permite la translocación microbiana. Entonces, productos y
células microbianas que normalmente quedan confinadas y controladas en la luz
intestinal, ahora pueden cruzar el epitelio intestinal y entrar en circulación sanguínea
convirtiéndose en un nuevo foco de activación inmunitaria e inflamación. Debido a su
significante contribución en la patogénesis del HIV-1, gran parte de la investigación
reciente en microbioma se ha centrado en entender los cambios que tienen lugar en
las comunidades microbianas que habitan dentro del intestino humano después de
la infección por el HIV-1 y del inicio de tratamiento antirretroviral (ART del inglés
Antiretroviral treatment).
Los primeros estudios transversales describieron relaciones contradictorias entre la
riqueza y diversidad microbiana del intestino y la infección por HIV-1 y sugirieron una
sustitución de Bacteroides por Prevotella como consecuencia de la adquisición viral.
Estos resultados, pero, no se han confirmado ni en modelos animales ni en estudios
balanceados por grupos de riesgo de transmisión de HIV-1. En estudios de modelos
de primates no humanos (NHPM de l’anglès non-human primate models), la infección
por SIV (del inglés Simian Immunodeficiency Virus) se ha asociado a una expansión
de las comunidades víricas intestinales, pero no se ha descrito un cambio consistente
en las comunidades de bacterias.
En dos cohortes europeas independientes de personas con infección crónica por HIV-
1 y personas no infectadas de Barcelona (n=156) y Estocolmo (n=84), los individuos
homosexuales (MSM del inglés Men-who-have-Sex-with-Men), presentaban una
microbiota intestinal más rica y diversa, y mayor abundancia relativa de Prevotella en
comparación con individuos heterosexuales (non-MSM) que estaban enriquecidos
por Bacteroides, independientemente de la infección por HIV-1. Estratificando los
grupos de estudio según su preferencia sexual (MSM vs non-MSM), las personas

10
infectadas por HIV-1 presentaban valores inferiores de riqueza y diversidad
bacteriana, con los valores más bajos en el grupo de individuos con una respuesta
discordante a ART. Aun así, no había cambios evidentes respecto a una disbiosi
específica de infección por HIV-1. En nuestra cohorte de estudio de Barcelona, la
dieta tenía un efecto limitado sobre la composición de la flora intestinal.
Para estudiar los efectos longitudinales de la infección por HIV-1 en la microbiota
intestinal, también hicimos un seguimiento de 9-18 meses a 49 personas de
Mozambique diagnosticadas con infección reciente por HIV-1 y a 54 personas no
infectadas, y las comparamos con dos grupos de personas con infección crónica por
HIV-1, estando con ART (n=27) o no (n=71). En este estudio, siguiendo la infección
reciente por HIV-1, se producía una mayor secreción de Adenovirus en heces que
persistía en infección crónica y no desaparecía con la administración de ART.
Paralelamente también se describieron cambios transitorios y no específicos en la
riqueza y la composición bacteriana después de la infección reciente por HIV-1. A
pesar de cierta resiliencia inicial al cambio después de la infección por HIV-1, sí que
se evidenciaba una signatura en cuanto a composición bacteriana en individuos con
infección crónica por HIV-1. Dicha signatura incluía depleción de Akkermansia,
Anaerovibrio, Bifidobacterium y Clostridium, y ya ha estado previamente asociada a
inflamación crónica, anergia de linfocitos T CD8+ y desórdenes metabólicos.
En conclusión: 1) La preferencia sexual es un factor de confusión importante que se
debería tener en cuenta en el futuro, especialmente en estudios de microbioma
intestinal y HIV-1; 2) La microbiota intestinal parece ser resiliente al cambio justo
después de la adquisición del VIH-1 pero con el paso del tiempo y progresión a SIDA
sí que aparece una signatura bacteriana con perfil pro-inflamatorio; y 3) Los cambios
en la microbiota intestinal no solo afectan las comunidades bacterianas sino también,
como mínimo, las comunidades víricas.
11
1. INTRODUCTION
1.1. MICROBES MATTER
Prokaryotes have been evolving for more than 3.8 billion years in almost every niche
on planet Earth. It is estimated that about 4-6x1030 prokaryotic cells exist all over the
biosphere, 2 to 3 orders of magnitude more than all plant and animal cells.
Constituting up to 60% of overall biomass, their practically ubiquitous presence makes
prokaryotes essential components of the Earth’s biota and represents a huge and
mostly unexplored source of genetic information and diversity (Whitman et al., 1998).
Microorganisms participate in many activities in a wide range of environments and
conditions: 1) modulation of biogeochemical cycles either through active metabolism
or by recycling other organisms’ dead remains (Falkowski et al., 2008), 2) applicability
in industry thanks to their broad metabolic potential (e.g. food-industry or biotechnical
industry) (reviewed in (Taylor and Richardson, 1979)), 3) applicability in energy
production, transformation of unusable fuels and water treatments (Min and Logan,
2004), 4) interaction with higher order multicellular organisms (Casadevall and
Pirofski, 2000).
Interestingly, microorganisms not only interact with superior organisms in a parasitic
manner, but some microbes are known to be commensals or mutualists to their hosts.
For instance, the microbial biota residing in the human’s gut (the gut microbiota) helps
the host in gut immunity development, synthesis of vitamins such as biotin or folic
acid, and in digestion (reviewed in (Clemente et al., 2012)). Similarly, microorganisms
inhabiting the human skin help the human host to protect against invasion by other
pathogenic or harmful microorganisms by directly interacting with closely-located host
immune cells (Christensen and Brüggemann, 2014). Other niches in the human body
such as the vaginal tract, respiratory tract and the oral cavity, are also known to have
been colonized by microbial communities through evolution (reviewed in (Meisel and
Grice, 2017)).
1.1.1. CLASSIC MICROBIOLOGY
When discovered in the 17th century, microorganisms were classified relying uniquely
on their phenotypic characteristics. By the early 20th century, researchers agreed that
microorganisms with different biochemical, physiological and metabolic

12
characteristics could share observable phenotypic traits and that the former should
also be used for classification. However, major caveats were still present: 1) the
number of biochemical and phenotypic properties to test was limited, 2) the
observable characteristics were restricted to those bacteria that could be isolated and
cultured in the lab (The Great Plate Count Anomaly coined by Staley and Konopka in
1985 estimated this microbial cultivable-fraction to be that less than 1% of the
observable bacteria in oligo/meso-trophic aquatic habitats), and 3) microorganisms
could have different behavior in pure culture compared to their natural niche where
they might be involved in significant co-operation networks with other members of the
microbial community (Wintermute and Silver, 2010). Thus, the research community
was already aware of the important biases and limitations linked to the
characterization of microorganisms based on pure phenotypic traits.
1.1.2. MOLECULAR APPROACH
Molecular biology started to gain weight around 1960 and provided microbiologists
with a new perspective for characterizing bacteria using genetic information. The main
advantages of the genotypic characterization included: 1) genotypic variation is
continually producing multiple changes that do not necessarily imply phenotypic
changes, 2) the way information is exposed at the genotypic level is much more
constrained with 4 nucleotides and 20 amino acids allowing more precise evaluation
and quantification, and 3) many different genetic changes can produce similar
phenotypes. Thus, evaluation of genotypes led to a more objective, reproducible and
comprehensive concept of species, thus reducing errors in microbial taxonomic
classification.
At first, properties derived from DNA composition such as GC content or DNA-DNA
hybridization were used to taxonomically characterize microbes (Meier-Kolthoff et al.,
2014). However, the highest revolutionary event in molecular taxonomy took place in
the mid-1980s with the advent of full-sequence analysis of molecular chronometers
such as the ribosomal RNA (rRNA) genes. Confirming prior suspicions, new
phylogenetic branching based on molecular markers showed that characters
traditionally used to cluster microorganisms had restricted phylogenetic linkage
(reviewed in (Amit Roy, 2014)). By the end of 1980s, most molecular techniques relied
on polymerase-chain-reaction (PCR) amplification and targeted Sanger sequencing

13
thus increasing the capabity to detect and properly identify a wider range of
microorganisms in a wider range of ecological niches based on their genetic code.
Nevertheless, the real explosion of microbial community analysis did not occur until
the advent of next-generation sequencing (NGS).
1.1.3. SEQUENCING APPROACHES
It was 2005 when first Roche’s 454-sequencing technology was launched. This new
sequencing technology, popularly named NGS, produced higher throughput at lower
costs. At the molecular level, and compared to the previous Sanger sequencing,
multiple short input DNA fragments were concurrently sequenced following an
automated process of spatially clustered PCR of single DNA templates. The input
DNA could either be genomic DNA fragmented into smaller fragments or a PCR-
amplified targeted library. Hence, the higher throughput enhanced analysis on whole
eukaryotic genomes and/or on DNA mixtures including multiple molecules from one
or various sources.
Since the advent of NGS, multiple improvements have been made to reduce costs
and increase relationship between coverage and read length. Increasing the coverage
(i.e. number of sequencing reads mapping a given region of the input DNA), increased
sensitivity in detecting minor changes in input genomic DNA, such as when
discriminating two phylogenetically close taxa (reviewed in (Loman and Pallen,
2015)).
In microbiome research, NGS has become a highly useful culture-independent
technique to characterize communities of microorganisms and predict their functional
interactions within a given sample. High throughput sequencing is not restricted to
taxonomical profiling of biological samples (phylogeny) but also might provide data on
gene content (metagenomics) and gene expression profiling (metatranscriptomics)
(Figure 1).

14
Figure 1. Main –omics sciences used in microbiome studies.
Main questions regarding microbial communities resolved using different input material and different
sequencing approaches.
Nowadays, more recent third-generation sequencing platforms allow sequencing of a
single molecule without having to create amplification libraries and still generate
longer reads in shorter periods of time and at lower costs (reviewed in (Kchouk et al.,
2018)). These new technologies broaden the scope and potential of the applications
in microbial studies even more.
1.1.3.1. LAB PROCEDURES
Most common sequencing approaches to taxonomically characterize microbial
communities are: targeted-sequencing and whole genome sequencing (WGS)
(reviewed in (Clooney et al., 2016)).
In a targeted-sequencing approach, PCR protocols are used to specifically amplify
genetic molecular markers. The choice of this molecular marker is crucial since it
determines the extent and precision of the derived taxonomic and phylogenetic
information. In the 1970s Carl Woese described the usefulness of the ribosomic RNA
genes as molecular chronometers in bacterial phylogeny (Fox et al., 1977). He
defended that rRNA genes were a good reflection of the evolution of the entire
genome (Woese et al., 1990).
The 16S rRNA gene is found in all prokaryotic genomes (bacteria and archaea) and
codifies for a ribosomal RNA molecule which is part of the ribosome. This RNA
molecule is in average 1500 ribonucleotides long and it is characterized by the
alternation of highly conserved and highly variable regions within its primary structure
(Figure 2). This primary structure is ideal to design universal primers to taxonomically

15
identify prokaryotes since within the variable regions there are several characteristic
sequences known as sign oligonucleotides, that appear in most, if not all
microorganisms within a certain phylogenetic group (ranging from domain to genus,
or even to species level), and rather never in other groups of microorganisms.
Figure 2. Primary and secondary structure of the prokaryotic 16S rRNA gene.
A, Schematic representation of the 16S rRNA gene showing alternation of highly variable (colored in dark
grey and labeled from V1 to V9) and highly conserved regions (colored in light grey). B, Primary and
secondary structure of the Escherichia coli 16S rDNA gene with its 9 described hypervariable regions
(named V1 to V9) through its complete length. Source of 16S rDNA gene:
http://rna.ucsc.edu/rnacenter/xrna/xrna_gallery.html
Concurrently to the 16S rRNA gene in prokaryotes, the 18S rRNA gene is usually
used to classify eukaryotes and the internal transcribed spacers (ITS) within the
eukaryotic ribosomal RNA genes operon for high resolution classification of fungi.
In the WGS approach we sequence all raw DNA content directly extracted from the
sample rather than focusing on a single target. Following this approach, we get
A
B

16
massive amounts of sequencing data that go beyond taxonomic profiling. For
instance, it also provides insights into communities’ internal metabolic and gene
function networks. Moreover, WGS also allows profiling other microbial populations
beyond bacteria (e.g. virus, minor eukaryotes, fungi, etc.). Of note, taxonomic
characterization using WGS not only reaches higher resolution (usually species level
compared to the genus level with 16S rRNA sequencing), but also provides less-
biased data since no PCR of molecular markers is necessary.
1.1.3.2. BIOINFORMATIC ANALYSIS: SOFTWARE AND DATABASES
Either by using a targeted-sequencing or a WGS approach, the use of bioinformatics
tools is required to analyze the data generated. Targeted-sequencing is commonly
used to taxonomically characterize microbial communities. Depending on the
molecular marker chosen, it is possible to characterize bacteria and archaea, fungi or
eukaryotes. Once the amplicons are generated and sequence data is obtained,
resolution of taxonomic profiling essentially depends on the algorithm used to process
and annotate query sequences and the taxonomic reference database chosen.
Targeted sequencing data can basically follow two analysis routes: phylotyping,
where query sequences are individually aligned against the taxonomic reference, or
de novo OTU clustering, where sequences are clustered into operational taxonomic
units (OTU) uniquely based on overall sequence similarity prior to alignment.
Grouping sequencing reads into OTUs has three major advantages (Figure 3): 1)
reduces the impact of sequencing errors in individual sequencing reads, 2) sequences
not aligned against the taxonomic reference are kept and labeled as unknown taxa
and not discarded as with phylotyping, and 3) a given taxa can be represented by
more than one representative sequence (i.e. two or more OTUs with same taxonomic
assignment representing distinct subspecies or strains). Minimum percentage of
sequence similarity among sequences clustered within the same OTUs are usually
97% and 99% for genus and species identification, respectively.
Regardless of the approach used, we eventually generate a matrix, known as OTU
table, indicating how many sequencing read belong to each of the taxa identified in
each sample, thus quantifying the taxonomical profile of each sample.

17
Exam
ple
data
set
to s
how
diffe
rences i
n m
icro
bia
l ta
xonom
ic c
hara
cte
riza
tio
n d
erived f
rom
16S
rR
NA
gene s
equencin
g d
ata
usin
g either
phylo
typin
g
(appro
ach 2
) or
de n
ovo O
TU
clu
ste
ring (
appro
ach 1
). M
ain
constr
ain
ts u
sin
g p
hylo
typin
g a
re lis
ted in the N
ote
s s
ectio
n.
Fig
ure
3.
Dif
fere
nces
an
d s
imila
riti
es
betw
een
ph
ylo
typ
ing
an
d d
e n
ovo
OT
U c
luste
rin
g.

18
Although the number of data analysis pipelines has significantly increased over the
past years, most common used bioinformatic pipelines to process targeted
sequencing data so far are QIIME (Caporaso et al., 2010) and Mothur (Schloss et al.,
2009). Concurrently, most widely used reference databases used for taxonomic
profiling are GreenGenes (DeSantis et al., 2006) and SILVA (Quast et al., 2013) for
bacteria, archaea and eukaryotes, and UNITE (Kõljalg et al., 2013) for fungi.
Although targeted-sequencing aims to perform the taxonomic profiling of the
sequencing dataset, there are various bioinformatic tools designed to infer the
functional capacity of the microbial communities relying only on taxonomic
characterization such as PICRUSt (Langille et al., 2013), Tax4Fun (Aßhauer et al.,
2015) and Piphillin (Iwai et al., 2016). Overall, these software use the OTU table with
relative abundances as input and, considering both, the 16S rRNA copy number per
bacteria and the gene copy number for each gene family, predict the contribution of
each taxa to the overall gene content of the sample. Eventually, they sum all individual
contributions to produce an estimate of the genes present in the sample.
For the WGS data analysis, MetaPhlan2 (Truong et al., 2015) uses approximately 1
million clade specific marker genes derived from almost 18000 reference genomes to
eventually generate a bacterial species abundance table providing relative abundance
of each of the identified taxa. WGS reads can also be directly mapped against other
available reference databases. Although metagenomics does not provide information
on in vivo enzymatic activity (contrary to metatranscriptomics), it provides information
about the functional potential of microorganisms identified. For instance, by aligning
WGS reads to the Integrated reference catalogue of the human gut microbiome (Li et
al., 2014) we can calculate richness (i.e. how many distinct categories are detected)
of enzymes, modules and metabolic pathways in each sample. Similarly, other
databases commonly used to characterize microbial communities are those including
references on antibiotic resistance genes (Liu and Pop, 2009) and/or virulence factors
(Chen et al., 2016).
Analyses of WGS can also be made independently of any reference database. For
instance, it is common to compute gene richness on microbial communities (i.e. total
number of different genes identified in a given sample). To do so, MOCAT (Kultima et
al., 2012) and Prokka (Seemann, 2014) are useful tools to quality-trim and filter

19
Illumina-derived sequencing reads to further assemble them into longer units, known
as contigs, to enhance protein-coding gene prediction. Interestingly, in 2014 Nielsen
et al. used a WGS approach to identify microbial species (labeled as metagenomic
species, MGS) through grouping genes that reported similar abundances across the
different samples (labeled co-abundance genes, CAG)(Nielsen et al., 2014).
With the data obtained from either approach (targeted- or whole genome-
sequencing), downstream analyses take advantage of many of the theoretical
concepts from classical ecology (Figure 4). Alpha diversity measures are intrinsic to
each sample and independent from other samples. Both, parametric and non-
parametric statistical tests are commonly used to compare these measures among
groups of samples. Simplest example would be to compute richness (i.e number of
different taxa detected in a given sample) and evenness (i.e. distribution of
abundances within all taxa detected in a given sample) ecological indices and
compare mean or median values between groups of samples. A common, but not
globally accepted practice in alpha diversity analysis, is to overcome unequal
sequencing coverage between samples through rarefying all samples to a given
number of randomly selected reads (McMurdie and Holmes, 2014).
Beta diversity measures need to be defined between two or more samples and aim to
determine their degree of similarity based on the composition data. Most common
inter-sample test involves computing ecological pairwise distance matrices between
various samples and then project such distance matrix in a low-dimension ordination
plot. Many similarity metrics exist, but they can be classified into three groups: a) those
that only consider presence/absence of taxa, b) those that also consider abundance
of the taxa and c) those that also consider the phylogenetic relationship among the
taxa identified. Although QIIME and MOTHUR have embedded scripts to perform
basic alpha and beta diversity analysis, many R packages have also been published
to do so: Vegan (Oksanen et al., 2013), Phyloseq (McMurdie and Holmes, 2013), and
BiodiversityR (Kindt, 2016), among others.

20
Brie
f descrip
tio
n a
nd p
ros a
nd c
ons o
f th
e m
ain
ecolo
gic
al para
mete
rs u
sed for
alp
ha a
nd b
eta
div
ers
ity a
ssessm
ent
of sequencin
g d
ata
on m
icro
bio
me s
tudie
s.
Fig
ure
4. M
ain
alp
ha a
nd
beta
div
ers
ity e
co
log
ical
para
mete
rs.

21
1.2. HUMAN MICROBIOME
The human microbiome refers to the entire genomic content derived from all
microorganisms inhabiting in and on the human body in association with the human
host. Although these microbial communities, globally known as the human microbiota,
are primarily dominated by bacteria (initially described to outnumber human cells by
a factor of 10 and human genes by a factor of 1000 (ratios reviewed in (Sender et al.,
2016))); archaea, minor eukaryotes and viruses are also present. Contrary to the The
Germ Theory initially coined in the 14th century, most of these microorganisms were
further seen to be harmless to the host. Some of them were even described as key
members in maintaining human health and cell homeostasis (Clemente et al., 2012).
This discovery led researchers to describe the human as a superorganism composed,
not only of human cells, but also of large invisible communities of microorganisms that
live in homeostasis with the host cells through mutualistic relationships (Caricilli,
2014)(Wang et al., 2017).
The microorganisms inhabiting in the human intestines, the human gut microbiota,
can reach up to 10 trillion cells including hundreds of different microbial species
(Bäckhed et al., 2005). Both, the human enteric cells and the microorganisms,
establish a delicate mutualistic relationship in the gut. On one hand, the human host
provides the microbial cells with a continuous food source and many diverse
ecological niches where to grow and reproduce (Pereira and Berry, 2017). On the
other hand, the microorganisms help the host in several ways: 1) produce vitamins
like biotin, thiamine and folate (LeBlanc et al., 2013) and various short-chain fatty
acids (SCFA) such as butyrate, propionate and acetate (Ramakrishna, 2013), 2)
break down food components and extract nutrients to help digestion (Flint et al.,
2012), 3) help develop a mature and fully competent immune system (Belizário and
Napolitano, 2015)(Clemente et al., 2012), and 4) produce anti-inflammatory
compounds that help the human defense system to fight off other potentially
pathogenic invading microorganisms (Tanaka and Nakayama, 2017)(Francino,
2014).
If this delicate equilibrium between the human host and the microbial communities is
perturbed, microbial dysbiosis might occur and some of these microbes may become
harmful to the host. Even though dysbiosis might have different outcomes in different

22
conditions, it is usually described as an imbalance that disturbs the microbial functions
which are essentials for maintaining health and introduces processes that eventually
promote disease (i.e. adverse phenotype) (reviewed in (Kriss et al., 2018)). Hence,
dysbiosis usually includes: 1) presence of pathogenic microorganisms related to
inefficient natural microbial defense barriers, 2) low microbial richness and diversity,
3) presence of bacterial products in blood which cause inflammation, and 4) altered
metabolic functions, among others. Specifically, in the human gut, the most common
manifestation of dysbiosis is the replacement of complex communities of anaerobic
microbes with a community of lower overall microbial richness and diversity with
increased presence of facultative anaerobes.
1.2.1. HUMAN MICROBIOME PROJECT
The human microbiome project (HMP) started in 2008 in the United States aiming to
identify and characterize the human microbiota both in health and disease. HMP
researchers performed WGS of many diverse human samples (collected from oral
cavity, skin, vagina, gut and nose/lung) to provide a deep genetic perspective of the
human microbial communities.
Alongside with the development of standard operating procedures (SOP) for
experimental and bioinformatics analysis in metagenomics studies, it also aimed to
develop a reference set of microbial genome sequences which would serve as a
resource repository for further studies on the human microbiome (NIH HMP Working
Group et al., 2009)(Gevers et al., 2012).
1.2.2. META-HIT
The META-HIT project was also launched in 2008 aiming to specifically characterize
the human gut microbiota in human health and disease such as in obesity and in
inflammatory bowel disease (IBD).
Authors initially created a reference catalogue of microbial genes present in the
human gut through sequencing stool samples from more than one hundred Spanish
and Danish individuals (Qin et al., 2010). They concluded that a healthy adult carries
in his gut around 160 different bacterial species out from a 1000-pool of described
bacteria and that this bacterial richness corresponds to more than 500000 bacterial

23
genes. They also stated that up to 60 bacterial species are present in everyone’s gut
as well as that approximately 40% of a given subject’s bacterial genes are
undoubtedly present in at least 50% of the rest of the population. Of note, they also
reported for the first time the stratification of the human population into, at least, three
main enterotypes, each characterized by a dominant bacterial genus: Bacteroides,
Prevotella and Ruminococcus (Arumugam et al., 2011).
Of note, in 2014, they integrated the Meta-HIT derived sequencing data to the already
existing microbial genomic sequencing data derived from the HMP. Authors thus
defined a new Integrated Gene Catalogue (IGC) which comprised 9,750,788 non-
redundant genes derived from 1267 gut metagenomes from individuals spread
through 3 different continents (America, Europe and Asia) (Li et al., 2014). With this
expanded catalog, they expected to enhance characterization of metagenomic and
metatranscriptomic data from the gut microbiota to better understand its variation
across populations in human health and disease.
1.3. ACQUIRED IMMUNODEFICIENCY SYNDROME (AIDS)
Since AIDS was first reported in the United States of America in 1981 (CDC, 1981)
and the HIV was declared its etiologic agent in 1983 (Barre-Sinoussi, F., J. C.
Chermann, 1983), the HIV pandemic has become one of the most devastating on
human history ever recorded (Sharp and Hahn, 2011). Regardless of the
improvements and efforts in both the clinic and the society on increasing
consciousness about HIV/AIDS during the last two decades, AIDS remains among
the top 10 leading causes of death especially in non-developed countries (Figure 5).

24
Figure 5. Top 10 causes of death in low-income economies in 2016
Ten leading causes of death in low-income countries worldwide in 2016. Image source:
http://www.who.int/news-room/fact-sheets/detail/the-top-10-causes-of-death
In 2017, 36.7 million individuals were living with HIV with 1.8 million new infections
reported per year and 1 million AIDS-related illnesses reported as death causes
worldwide. Up to 76.1 million people have become infected since the start of the
epidemic and over half of them, 35 million, have already died because of AIDS-related
illnesses (Joint United Nations Programme on HIV/AIDS (UNAIDS), 2017).
1.3.1. HIV - CHARACTERISTICS AND LIFE CYCLE
HIV-1 is a lentivirus within the Retroviridae family that has an enveloped capsid and
a viral core with two single-stranded RNA molecules. The HIV-1 can infect host
immune cells expressing the surface receptor CD4 as well as either the CCR5 or
CXCR4 co-receptor. Lymphocytes, monocytes and dendritic cells, among others, are
either directly destroyed by HIV-1 or, at least, their defensive function results impaired
(Swanstrom and Coffin, 2012). Once inside the host cell, the virus generates a double-
stranded cDNA copy by reverse transcribing the RNA template, and integrates its
proviral DNA into the human genome using its viral integrase enzyme, thus
establishing its own viral reservoir in the host (Schacker et al., 2000). If environmental

25
conditions are favorable for the virus, the proviral DNA is transcribed and translated
using host’s enzymatic machinery so that new progeny is eventually released to
continue with the infection (Figure 6). ART can block one or more of the enzymatic
steps in the replication process (Figure 6), but without ART, HIV-1 infection naturally
progresses weakening the host’s immune system and leading the host to a state of
immunosuppression in 8 to 10 years where a number of opportunistic infections and
AIDS-related illnesses can occur and eventually cause the host’s death (Simon et al.,
2006).
Figure 6. HIV-1 infection and replication cycle.
HIV-1 replication cycle. Potential ART targets listed in white boxes. Image source:
https://codehealth.io/library/article-128/opportunistic-infections-and-clinical-monitoring-in-acquired-
immune-deficiency-syndrome-aids/
1.3.2. HIV - MICROBIAL TRANSLOCATION, IMMUNE ACTIVATION AND
CHRONIC INFLAMMATION
The GALT is the largest lymphoid tissue in the body harboring more than the half of
the total lymphoid cells (Lefrançois and Puddington, 2006). Because the intestinal
mucosa is constantly exposed to external antigen circulating derived from food
ingestion, the GALT plays a crucial role for maintaining the immunological
homeostasis through innate and acquired immunological responses (Cheroutre and

26
Madakamutil, 2004). Alongside with the diversity of immune cells (e.g. neutrophils,
macrophages and monocytes) and immune products (e.g. secretory IgA and
antimicrobial peptides) involved in controlling bacterial invasion and growth in the gut,
the gut-blood physical barrier is composed of tightly connected enterocytes that
strictly regulate the transfer of fluids, nutrients and electrolytes (Nagler-Anderson,
2001)(Kayama and Takeda, 2015)(Zhang and Luo, 2015) (Figure 7A).
The gut CD4+ T-cell population is rapidly depleted in primary HIV-1 infection, more so
than in the blood or in peripheral lymphoid sites (Mehandru et al., 2007)(Poles et al.,
2001). This severe and early damage to the GALT immune cell population contributes
to weaken the intestinal lining. Consequent increased permeability allows bacterial
cells and products usually contained in the gut lumen to translocate into the blood
circulation (Nazli et al., 2010) (Figure 7B). Once in the bloodstream, these microbial
particles have the potential to enhance immune activation and inflammation which is
a key feature of HIV-1 infection and disease-progression to AIDS (Brenchley et al.,
2006)(Ancuta et al., 2008)(Dinh et al., 2015)(Hofer and Speck, 2009).
The exact mechanisms involved in this loss of intestinal barrier function are not
completely understood. Nonetheless, direct epithelial damage including enterocyte
apoptosis, high cell turnover, impaired phagocytic activity and physical destruction of
tight junctions have been reported (Kotler et al., 1984)(Estes et al., 2010). It has also
been highlighted a preferential loss of Th17 CD4+ T-cells at mucosal sites in HIV-1
infection (Brenchley et al., 2008)(Prendergast et al., 2010)(Shaw et al., 2011)(Lu et
al., 2016). These cells are known to be essential for the gut epithelial cells
homeostasis, help recruit neutrophils when fighting opportunistic commensal bacteria,
enhance proliferation of enterocytes, as well as produce significant levels of IL-17, IL-
22/IL-23 and several defensins (Guglani and Khader, 2010)(Maloy and Kullberg,
2008). Scamurra et al. also observed decreased population of functional mucosal
plasma cells as well as low intraluminal concentration of soluble IgA which has a
significant role in the gut homeostasis by neutralizing microbial products hampering
their attachment and translocation across the epithelial barrier (Scamurra et al.,
2002).

27
Figure 7. Gut epithelium and mucosal tissue in health and in HIV-1 infection.
A, Gut mucosa and epithelial barrier in health. B, Gut mucosa and epithelial barrier in HIV-1 infected
subjects showing enterocyte damage, loss of tight-junctions, decreased IgA production, etc. Image source:
Microbial translocation in HIV infection: causes, consequences and treatment opportunities (Sandler and
Douek, 2012)
Microbial products reported to translocate through the weakened gut barrier and be
potentially recognized by the host’s immune system include: peptidoglycans which
are present in the cell wall from gram-positive bacteria (Clarke et al., 2010), flagellin
(Svärd et al., 2015), bacterial DNA (Jiang et al., 2009), viral RNA/DNA (Li et al., 2013),
B
A

28
and β-glucans which are present in cell walls from bacteria and fungi (Morris et al.,
2012), among others.
For instance, lipopolysaccharide (LPS), a major component of the cell wall from gram-
negative bacteria also known as endotoxin, has been suggested a major player in the
generalized chronic immune activation commonly observed in the HIV-1 infected
population (Fujigaki et al., 2001)(Figure 8). It contributes to the host immune activation
by binding to the LPS-binding protein (LBP), the pattern recognition receptor CD14,
MD-2 and the toll-like receptor 4 (TLR4) present in the cell membranes of monocytes
and macrophages. Consequently, many intracellular signaling pathways get activated
leading to increased levels of NF-kB nuclear transcription factor and activator protein
AP-1. In turn, these increases result in higher production of inflammatory cytokines
including several interleukins, TNFα and interferons (Rhee, 2014). The LPS
commonly translocate from the gut lumen to the hepatic portal vein and travel towards
the liver where Kupffer cells (i.e. specialized liver-resident macrophages) get activated
by TLR4-CD14 interaction and clear the enteric-derived LPS (Su et al., 2000). HIV-1
infection has been associated with decreased abundance of functional Kupffer cells
(Balagopal et al., 2009), thus reinforcing the role of translocated LPS in promoting
immune activation because of impaired bacterial product clearance in blood (Balmer
et al., 2014).
Figure 8. TLR4 signaling pathway in response to bacterial LPS.
The TLR4 signaling pathway in response to LPS activation. Image source: Recognition of LPS by TLR4:
Potential for anti-inflammatory therapies (Nijland, Reindert Hofland, Tom Van Strijp, Jos A G, 2014).

29
The administration of ART has been proved to significantly reduce plasma viral loads
hampering HIV-1 replication at various levels (extensively reviewed in (Arts and
Hazuda, 2012)). Nevertheless, immune cell recovery after treatment initiation is more
variable and not all subjects on ART recover pre-infection CD4+ T-cell counts
(Gianella et al., 2016). Actually, subjects with good immune recovery and viral
suppression upon ART administration, also show symptoms of residual immune
activation and chronic inflammation that cannot be pharmacologically fully suppressed
(Guadalupe et al., 2003)(Almeida et al., 2002)(Stone et al., 2005). Residual replication
in pre-established HIV-1 reservoirs has been proposed as a main actor in this chronic
immune activation (Martinez-Picado and Deeks, 2016). But, it is still unclear the
contribution of microbial translocation to this chronic immune activation even in ART-
treated immune responders (Cassol et al., 2010).
1.4. HUMAN GUT MICROBIOTA AND HIV-1
1.4.1. CHRONIC HIV-1 INFECTION
Studies in NHPM reported that chronic SIV infection did not result in an universal and
clearly defined dysbiosis of the gut microbiota (McKenna et al., 2008)(Klase et al.,
2015)(Moeller et al., 2013)(Moeller et al., 2015). Otherwise, multiple groups reported
significant changes on the human gut microbiota linked to either ART treated or non-
treated chronic HIV-1 infection (results summarized in Table 1).
Enrichment of Proteobacteria and pro-inflammatory bacteria in HIV-1 infection
Most consistent change on the human gut microbiota in relation to HIV-1 infection is
a significant increase in the relative abundance of bacteria from phylum
Proteobacteria, especially, members of order Enterobacteriales and family
Enterobacteriaceae. This increase has been reported, independently of ART-
administration, in both, mucosa (Dillon et al., 2014)(Vujkovic-Cvijin et al., 2013)(Mutlu
et al., 2014) and stool samples from HIV-1 infected individuals (Ellis et al.,
2011)(Lozupone et al., 2013)(Dinh et al., 2015). More precisely, Yang et al. found
enrichment in Burkholderia fungorium and Bradyrhizobium pachyrhizi in mucosal
samples from HIV-1 infected individuals and hypothesized that a decrease of
colonization resistance in the gut was occurring after HIV-1 infection so that non-
commensal environmental species could easily appear in the gut (Yang et al., 2016).

30
Similarly, Dillon et al. found increases in Acitenobacter junii and Schlegella
thermodepolymerans in colonic mucosal samples (Dillon et al., 2016a) and Lozupone
et al. increases in Desulfovibrio piger in stool samples from HIV-1 infected subjects
(Lozupone et al., 2013). Both, in vitro and in vivo observations confirmed that both,
Enterobacteriales and Enterobacteriaceae, strongly correlate with gut CD4+ and CD8+
T-cell depletion, activation and death (Dillon et al., 2016a)(Vujkovic-Cvijin et al.,
2013)(Ellis et al., 2011)(Steele et al., 2014), increased levels of sCD14 and other
inflammation markers such as IFNγ and IL-1β (Dinh et al., 2015), and lower values of
circulating CD4+ T-cell counts (Yang et al., 2016).
Depletion of Firmicutes and Bacteroidetes in HIV-1 infection
Published data also suggested that the abovementioned colonization by
Proteobacteria and other potentially pathogenic bacteria might occur alongside
significant decreases in relative abundance of commensal members of the phyla
Firmicutes and Bacteroidetes in both, treated and untreated HIV-1 subjects (Dillon et
al., 2014)(McHardy et al., 2013)(Vázquez-Castellanos et al., 2014)(Vujkovic-Cvijin et
al., 2013). Yang et al. and Perez-Santiago et al. both reported decreases in genus
Lactobacillus following HIV-1 infection and the former linked such decreases to low
CD4+ T-cell counts and higher HIV-1 viremia and sCD14 levels (Yang et al.,
2016)(Pérez-Santiago et al., 2013). Class Clostridia, including genera Lachnospira
and Oribacterium, have also been reported to be impacted, not only by HIV-1 infection
(Nowak et al., 2015), but also by other diseases affecting gut homeostasis (Sokol et
al., 2009). Butyrate, as well as other SCFA, is a key element for the regulation of the
intestinal homeostasis acting as an energy source for enterocytes and other epithelial
cells, and a signaling molecule that modulates intestinal immune responses (Hamer
et al., 2008). Not surprisingly, other taxa reported to be depleted in HIV-1 infected
subjects contain numerous butyrate producing bacteria such as Faecalibacterium,
Roseburia, Coprococcus and Eubacterium, among others (Dillon et al.,
2014)(McHardy et al., 2013)(Nowak et al., 2015)(Vázquez-Castellanos et al., 2014).
Additionally, Mutlu et al. found negative correlations between relative abundance of
Bacteroides and Faecalibacterium and levels of IL-6 and soluble CD14 (Mutlu et al.,
2014). Of note, family Erysipelotrichaceae within phylum Firmicutes, has been found
increased in both, treated and untreated HIV-1 individuals (Dinh et al.,

31
2015)(Lozupone et al., 2013)(Vujkovic-Cvijin et al., 2013) and has also been linked to
other inflammatory disorders (Kaakoush, 2015).
Prevotella to Bacteroides shift following HIV-1 infection
While several investigators also found a shift from a Bacteroides- to a Prevotella-
dominated gut microbiota as the main association to HIV-1 infection (Dillon et al.,
2014)(Lozupone et al., 2013)(Mutlu et al., 2014)(Vázquez-Castellanos et al.,
2014)(Vujkovic-Cvijin et al., 2013), others found no significant changes (McHardy et
al., 2013)(Dinh et al., 2015). Nowak et al. found higher relative abundance of
Prevotella in subjects on ART compared to non-treated HIV-1 infected subjects
(Nowak et al., 2015).
Regarding the role of Bacteroides and Prevotella in immune cell activation, Dillon et
al. found a slight inverse correlation between abundance of Bacteroides and CD4+ T-
cell counts in HIV-1 infected non-treated subjects and that abundance of Prevotella
was strongly positively associated to activation levels of T-lymphocytes (measured by
CD38+ HLA-DR+) as well as to numbers of mucosal Th22/Th17 T-cells and mucosal
dendritic cells (mDC) (Dillon et al., 2014)(Dillon et al., 2016b). They described
Prevotella as a pathobiont after finding that this bacterial genus induced higher
production and secretion of pro-inflammatory cytokines compared to other genera
such as Ruminococcus in animal models. Vázquez-Castellanos et al. linked a
dysbiotic gut microbiota with HIV-1-derived immune alteration by reporting positive
correlation between relative abundance of Prevotella and Succinivibrio, with various
markers of T-cell activation and the inflammation marker C-reactive protein (CRP)
(Vázquez-Castellanos et al., 2014). Significantly, Prevotella has also been described
as a pro-inflammatory bacteria in other studies beyond of HIV-1 infection (Lucke et
al., 2006)(Kumar et al., 2003).
Reduced bacterial richness and diversity in HIV-1 infection
Following ecology basics, a healthy gut microbiota community (eubiotic community)
is expected to be richer and more diverse compared to a dysbiotic community. While
Lozupone et al. reported in 2013 higher richness and diversity in HIV-1 infected ART-
naïve individuals than in the corresponding HIV-1 negative controls (Lozupone et al.,
2013), other groups reported either no changes (Dillon et al., 2014)(Dinh et al.,

32
2015)(Vujkovic-Cvijin et al., 2013)(Yang et al., 2016) or reduced bacterial richness
and diversity in the HIV-1 infected group (Mutlu et al., 2014)(McHardy et al.,
2013)(Nowak et al., 2015). Low gut microbial diversity has been correlated with
several markers of disease progression such as CD4+/CD8+ T-cell ratio, as well as to
several markers of monocyte activation (soluble CD14 and soluble CD163) and
microbial translocation (LPS and LBP)(Nowak et al., 2015).
Feces vs mucosal samples to characterize the gut microbiota
The use of fecal samples as a proxy of gut microbiota is still on debate since sample
source has been underlined as a possible factor affecting gut microbiota composition.
Significant differences in taxonomic composition have been observed between stool
and gut mucosal samples from same individual independently of HIV-1 infection
immune status (Nava et al., 2011)(Eckburg et al., 2005)(Zoetendal et al., 2002).
Although mucosal samples might be more relevant because of its proximity to real
bacterial niches within human gastrointestinal tract, its difficulty to collect, makes gut
mucosa a very interesting but poorly explored environment. Of note, it has been
highlighted that differences between HIV-1 positive and HIV-1 negative subjects are
more evident in mucosal than in lumen-derived samples (i.e. stool)(Mutlu et al., 2014).
Whole genome sequencing and gut microbiota functional potential
WGS data have shed light on metabolic pathways that result altered in response to
HIV-1 infection and have linked them to microbial translocation and immune activation
(Vázquez-Castellanos et al., 2014)(Vujkovic-Cvijin et al., 2013). Indoleamine-pyrrole
2,3-dioxygenase enzyme 1 (IDO1) is a human enzyme known to participate in the
tryptophan to kynurenine catabolism pathway and in the control of lymphocyte T-cell
population functioning and tolerance (Munn and Mellor, 2013)(Katz et al., 2008). It is
already well described that kynurenine to tryptophan ratio (KT) in blood is altered in
HIV-1 infection and linked to progression to AIDS (Huengsberg et al., 1998). The
hypothesis in relation to the gut microbiota is that the enrichment of bacteria capable
to catabolize tryptophan to kynurenine using an IDO1 homolog gene favors the gut
mucosa disruption hence contributing to microbial translocation and immune
activation. While most bacteria are primary producers of tryptophan as well as other
amino acids, very few bacteria are known to contain the homolog enzymatic

33
machinery to the human IDO1 enzyme. Interestingly, bacteria favoring higher levels
of KT ratio belong to phyla Proteobacteria which is consistently reported to increase
and translocate in HIV-1 infection (Vujkovic-Cvijin et al., 2013)(Mutlu et al., 2014).
Particularly, Vujkovic-Cvijin et al. reported positive correlation between levels of KT
ratio and relative abundance of Pseudomonas, Xantomonas, Burkholderia,
Stenotrophomonas, Shewanella and Bacillus (Vujkovic-Cvijin et al., 2013). LPS
biosynthesis is another metabolic pathway found enriched in the microbiome of HIV-
1 infected subjects and positively correlated to reduced bacterial diversity and
increased proportion of gram-negative bacteria (Vázquez-Castellanos et al.,
2014)(Vujkovic-Cvijin et al., 2013). Genes involved in glutathione and seleno-
compound metabolism, as well as in folate and siderophore biosynthesis have also
been found enriched in HIV-1 infected individuals (McHardy et al., 2013). Conversely,
McHardy et al. also reported lower levels of genes involved in amino acid production
and metabolism, fructose/mannose metabolism, CoA biosynthesis and energy
processing in HIV-1 infected individuals. Other metabolic candidates linked to HIV-1
gut dysbiosis are the choline-derived trimethylamine (TMA) and trimethylamine oxide
(TMAO) compounds. Choline degradation is a major source of TMA formation in the
human gut by symbiotic anaerobic bacteria. Interestingly, choline catabolism genes
were not found to be evenly distributed between major bacterial phyla: while genes
were commonly found in phyla Firmicutes and Proteobacteria, they were almost
absent in Bacteroidetes (Craciun and Balskus, 2012). A recent study showed that
HIV-1 positive individuals exhibited worsened calcified coronary plaque features
compared to non-HIV-1 infected controls and that such features were correlated to
TMA and LPS levels (Srinivasa et al., 2015). These results would support the pro-
inflammatory-bacteria label on Prevotella since it is able to produce TMA and derived
metabolites, as well as the anti-inflammatory-bacteria label on Akkermansia and other
bacteria found depleted in HIV-1 infection that are known to be protective against
metabolic disorders (Everard et al., 2013).
Effect of ART on the gut microbiota in HIV-1 infection
How the administration of ART modulates the gut microbiota and its contribution to
AIDS progression is still unclear. Initial results suggested that ART could have a

34
negative impact on gut microbial diversity as unexpectedly these ecological values
were lower after ART initiation (Nowak et al., 2015).
Tab
le 1
. M
ain
fin
din
gs
on
hu
ma
n g
ut
mic
rob
iota
in
ch
ron
ica
lly H
IV-1
in
fecte
d s
ub
jects
.
Ma
in r
esults o
n g
ut
mic
robio
ta a
naly
ses in
rela
tio
n t
o H
IV-1
in
fectio
n.

35
1.4.2. ACUTE HIV-1 INFECTION
Because of the very early effects of HIV-1 infection on the human gut homeostasis
(Sankaran et al., 2008), collecting human’s fecal samples soon enough to see the
hyper-acute effects on the gut microbiota turns out to be logistically very complex.
Hence SIV/NHPM have been used to investigate the HIV-1 pathogenesis during acute
infection.
In 2008, McKenna et al. described that the macaque gut microbiota was, similarly to
humans, primarily dominated by phyla Firmicutes and Bacteroidetes with low
abundance of Proteobacteria and Actinobacteria, even though significant differences
appeared at lower taxonomic ranks (McKenna et al., 2008). In 2016, Glavan et al.
reported transient increases in relative abundance of potentially pathogenic bacterial
taxa including Pasteurellaceae, Aggregatibacter, Actinobacillus and
Mycoplasmataceae in acute SIV infection (Glavan et al., 2016). Increased levels of
phylum Proteobacteria were found in macaque mesenteric lymph nodes supporting
that these bacteria would be the ones translocating from gut lumen after SIV infection
(Klase et al., 2015). Significant decreases in Lactobacillus, a bacterial genus known
to be important for regulating and maintaining physiological gut immunity, have been
also reported after SIV challenge (Vujkovic-Cvijin et al., 2015).
1
1.4.3. NON-BACTERIAL MICROBIOME
A longitudinal study in 2010 described the evolution of the fecal bacteriome and
virome in healthy individuals and reported a significant temporal covariation between
both microbial community types (Minot et al., 2011). Of note, they also reported that
the major source of divergence in the virome composition over time was interpersonal
variation and highlighted diet as being a key modulator on gut microbial communities.
Similar results were published in 2015 when Lim et al. reported that viral richness was
low early in life and increased with age, thus suggesting that the virome, similarly to
bacteriome, was mainly established through environmental exposure (Lim et al.,
2015).
Beyond health, De Vlaminck et al. observed significant changes on the plasma
virome, including overall increased viral load and increased abundance of Anellovirus,
in immunosuppressed individuals after organ transplant reception (De Vlaminck et al.,

36
2013). Same year, Li et al. reported similar increase in Anellovirus in plasma from
subjects with AIDS both from Africa and United States of America, especially in
subjects with low CD4+ T-cell counts (Li et al., 2013). Focusing on HIV-1/SIV recent
infection, Handley et al. reported in 2012 a significant expansion of the enteric virome
in progressive, but not in non-progressive, SIV-infected monkeys after 24 weeks post-
infection (Handley et al., 2012). Authors also highlighted the existence of a common
core of enteropathogenic eukaryotic viruses expanding in most of their rhesus
macaque models including Adenoviridae, Calciviridae, Papillomaviridae and
Parvoviridae, after SIV-challenge. Norman et al. highlighted the role of enteric
Caudovirales as a key contributors to intestinal inflammation and concurrent bacterial
dysbiosis in IBD (Norman et al., 2015).

37
2. OBJECTIVES
1. Analyze the influence of the gut microbiota in the ability of HIV-1 infected subjects
to reach a proper immune reconstitution, control HIV-1 replication and control the
chronic inflammation associated to HIV-1 infection.
2. Characterize the coevolution of the gut microbiota and the immune system
following acute HIV-1 infection.

38

39
3. MATERIAL AND METHODS
3.1. STUDY 1: META HIV-PHENO
3.1.1. STUDY COHORT
To assess the link between HIV-1 infection, gut microbiota and host’s immune
deterioration and restoration on ART, we set up one test cohort in Barcelona and then
validated our 16S rRNA findings in another European independent cohort from
Stockholm.
The original test cohort, named BCN0, was enrolled in Barcelona, Catalonia, Spain,
between January and December 2014. HIV-1 infected individuals were recruited from
the HIV Clinics at the University Hospitals Germans Trias i Pujol and Vall d'Hebrón.
HIV-1-negative individuals were mainly recruited from an ongoing prospective cohort
of HIV-negative homosexual men at risk of becoming infected by HIV-1 (Coll et al.,
2017) who attend quarterly medical and counseling visits including HIV-1 testing at
BCN Checkpoint, a community-based center for MSM in Barcelona (Meulbroek et al.,
2013). Additional controls were HIV-1-negative partners from HIV-1 infected subjects
attending the HIV clinics. The inclusion criteria were: age within 18 and 60 years and
body mass index within 18.5 and 30. Exclusion criteria were: (a) any gross dietary
deviation from a regular diet including vegetarian, low-carb, etc., (b) antibiotic use
during the previous 3 months, (c) pregnancy or willingness to become pregnant, (d)
current drug consumption or alcohol abuse, (e) any chronic digestive disease such as
peptic ulcer, Crohn's disease, ulcerative colitis or coeliac disease, (f) any surgical
resection of the intestines except for appendectomy, (g) any autoimmune disease;
and (h) any symptomatic chronic liver disease or presence of hepatic insufficiency
defined as a Child–Pugh C score.
HIV-1 infected subjects in the study were selected to represent a wide spectrum of
different HIV-1 phenotypes according to their immune status, ART administration, and
capacity to control viral replication (Table 2).

40
Table 2. HIV-1 phenotypes included in the BCN0 cohort.
Main clinical parameters for the HIV-1 phenotypes included in the BCN0 cohort. Phenotypes were
described based on their CD4+ T-cell counts, ART-administration and viral load.
All subjects went through a clinical evaluation following a standardized questionnaire
including: a checklist for fulfillment of inclusion and exclusion criteria, anthropometric
data, age at study entry, age at HIV-1 diagnosis, gender, ethnicity, city of residence,
HIV-1 transmission risk group, history of allergies, antibiotic intake between 3 and 6
months before inclusion, frequency and consistency of feces, history of medical or
surgical problems and/or interventions, present and previous ART, history of AIDS-
and non-AIDS-related diseases, nadir and most recent CD4+ T-cell counts, HIV-1
RNA levels, history of sexually transmitted diseases and infection by the human
papillomavirus (HPV) and/or hepatitis B (HBV) or C (HCV) viruses. The HIV-1
transmission risk categories in our study were mutually excluding: male study
participants who reported being homosexual or referred insertive or receptive anal
intercourse with other men were included in the MSM category, even if they also
reported intravenous drug use or sex with women. Females and non-MSM males
reporting past intravenous drug use were classified as drug users (people-who-inject-
drugs, PWID). Participants not included in the preceding categories were classified
as heterosexual (HTS). All participants went through a proctology evaluation by a
specialized HIV-1 physician/proctologist to assess perianal lesions, either HPV-
related or not, and test for Chlamydia trachomatis and Neisseria gonorrhoeae. No
cases of anal cancer were detected.
An internal validation cohort, named BCN1, included 110 individuals from the BCN0
who provided a second fecal sample one month later.

41
Observations in Barcelona were also externally validated in an independent
observational cohort, named STK, which was recruited at the HIV outpatient clinic in
the Karolinska University Hospital, Stockholm, Sweden. All HIV-1-infected subjects in
the STK cohort were at least 18 years old, had been diagnosed with HIV-1 between
1 and 25 years earlier and were ART-naïve at the time of fecal sampling. HIV-1
uninfected controls were healthy individuals matched by sex and age. Neither patients
nor controls had been prescribed antibiotics or probiotics; or had had infectious
diarrhea during the preceding 2 months.
3.1.2. LAB PROCEDURES
3.1.2.1. Sample collection
Fecal samples from Barcelona were collected using sterile fecal collection tubes the
same day or the day before their clinical appointment and following instructions pre-
specified on SOP. Samples were immediately extracted upon arrival to the laboratory.
If required, samples were stored at 4 °C overnight until DNA extraction. Before
discarding the samples, small amounts of feces were saved both, in dry conditions
and suspended in RNA later, for preserving DNA and RNA molecules for further
analysis.
Blood samples from Barcelona were collected at the HIV Clinics at University
Hospitals Germans Trias I Pujol and Vall d’Hebrón and cryopreserved at -80ºC until
immune markers quantification.
Fecal samples from Stockholm were cryopreserved at −80 °C within the first 36 hours
after collection and shipped on dry ice in batch to IrsiCaixa AIDS Research Institute,
where they were stored at -80ºC until further use.
3.1.2.2. DNA/RNA extraction
Fecal DNA was extracted from fecal samples using the PowerSoil DNA Extraction Kit
following manufacturer’s instructions. RNA was extracted from RNA later-
cryopreserved fecal samples using the Stool total RNA Purification Kit following
manufacturer’s instructions.

42
3.1.2.3. 16S rRNA gene amplification
To amplify the variable region V3-V4 from the 16S rRNA gene (expected amplicon
size ~460 bp), we used the primer pair described in the MiSeq rRNA Amplicon
Sequencing protocol which already have the Illumina adapter overhang nucleotide
sequences added to the 16S rRNA V3-V4 specific primers, i.e.: 16S_F 5’-(TCG TCG
GCA GCG TCA GAT GTG TAT AAG AGA CAG CCT ACG GGN GGC WGC AG)-3’
and 16S_R 5’-(GTC TCG TGG GCT CGG AGA TGT GTA TAA GAG ACA GGA CTA
CHV GGG TAT CTA ATC C)-3’.
DNA from BCN0, BCN1 and STK datasets, was amplified in triplicate 25 μL reactions
under the PCR conditions listed in Table 3.
Table 3. PCR protocol for the 16S rRNA gene amplification in the MetaHIV-
Pheno study.
PCR conditions to amplify the 16S rRNA gene in fecal samples from Barcelona and Stockholm cohorts.
Once the desired amplicon was confirmed in 1% agarose gel electrophoresis, all three
replicates were pooled and stored at -30ºC until sequencing library preparation.
3.1.2.4. Illumina MiSeq sequencing
16S rRNA amplicons were cleaned-up for non-DNA molecules and Illumina
sequencing adapters, and dual indices were further attached using the Nextera XT
Index Kit as described in the MiSeq 16S rRNA Amplicon Sequencing protocol. After
a second round of clean-up, amplicons were quantified using the Quant-iT PicoGreen
double strand DNA Assay Kit and Nanodrop 1000, and diluted in equimolar
concentrations (4nM) for further pooling. Sequencing was performed on an Illumina
MiSeq platform according to the manufacturer's specifications to generate paired-end

43
reads of 300 base lengths in each direction at the Institut Germans Trias I Pujol
(IGTP), Badalona, Spain.
3.1.2.5. Immune measurements
Immune measurements were only performed in blood samples from the BCN0 cohort.
Plasma levels markers of enterocyte damage (intestinal fatty acid binding protein
(IFABP)), microbial translocation (soluble CD14 and LBP) and systemic inflammation
(IL6, CRP and IP-10) were analyzed using commercial ELISA kits in accordance with
manufacturer’s instructions. If plasma levels were above the upper detection limit, its
concentration was calculated as the maximum quantifiable value, i.e. the highest
concentration included in the standard curve.
3.1.2.6. Nutritional assessment
The nutritional assessment was only performed in the BCN0 cohort. In a first visit, the
HIV Unit dietitian in the University Hospital Germans Trias I Pujol, provided two
different validated questionnaires to the study participants and explained them how to
complete them.
The first questionnaire was a standardized prospective dietary nutrient survey
consisting on recording, as precisely as possible, everything that the patient ate or
drank during 3 to 5 consecutive days, including at least one weekend day. Particular
emphasis was put on recording the amounts of dietary complements like sugar, salt,
sauces, etc. and/or the amount of oil used for cooking or dressing, for example. The
collected information was translated into numerical estimates of energy (kcal), and
grams and percentage of the total energy intake contributed by proteins, total lipids,
saturated, monounsaturated and polyunsaturated fat, total carbohydrates, sugars and
digestive polysaccharides, as well as grams of total dietary fiber, vitamins and
minerals. Such transformation was done using a non-commercial software (Programa
de Càlcul Nutricional - PCN Pro, version 1.0, compilation 32, authors: David Cantós
López, Andreu Farran Codina and Imma Palma Linares) developed by the University
of Barcelona. This program implements the nutrient composition tables developed by
the Centre d'Ensenyament de Nutrició Humana i Dietètica, CESNID (Tablas de
composición de alimentos del CESNID, ISBN 84-486-0590-X), which are the
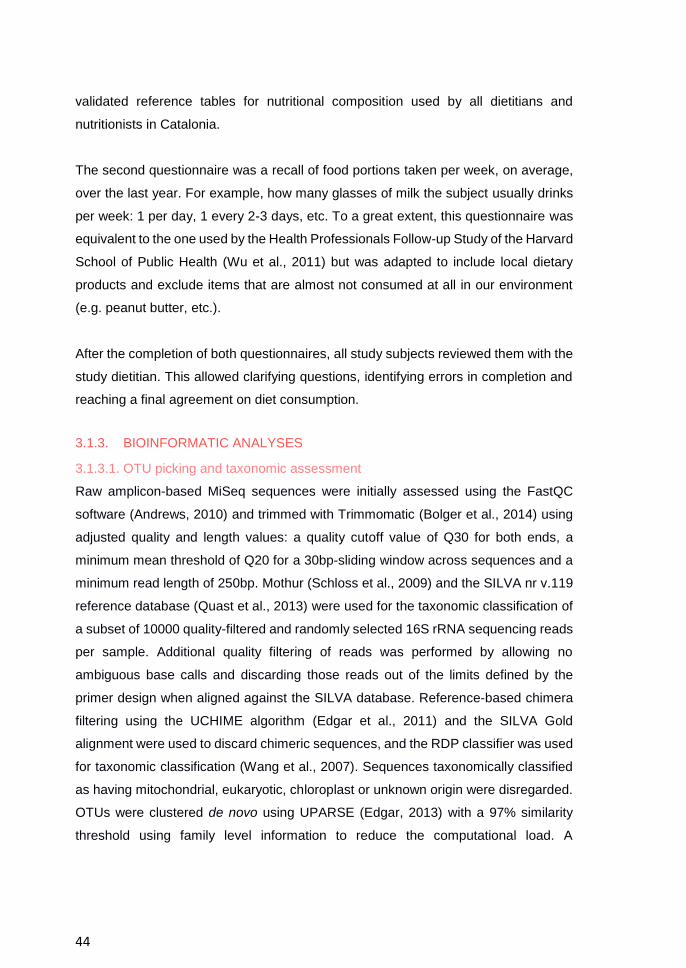
44
validated reference tables for nutritional composition used by all dietitians and
nutritionists in Catalonia.
The second questionnaire was a recall of food portions taken per week, on average,
over the last year. For example, how many glasses of milk the subject usually drinks
per week: 1 per day, 1 every 2-3 days, etc. To a great extent, this questionnaire was
equivalent to the one used by the Health Professionals Follow-up Study of the Harvard
School of Public Health (Wu et al., 2011) but was adapted to include local dietary
products and exclude items that are almost not consumed at all in our environment
(e.g. peanut butter, etc.).
After the completion of both questionnaires, all study subjects reviewed them with the
study dietitian. This allowed clarifying questions, identifying errors in completion and
reaching a final agreement on diet consumption.
3.1.3. BIOINFORMATIC ANALYSES
3.1.3.1. OTU picking and taxonomic assessment
Raw amplicon-based MiSeq sequences were initially assessed using the FastQC
software (Andrews, 2010) and trimmed with Trimmomatic (Bolger et al., 2014) using
adjusted quality and length values: a quality cutoff value of Q30 for both ends, a
minimum mean threshold of Q20 for a 30bp-sliding window across sequences and a
minimum read length of 250bp. Mothur (Schloss et al., 2009) and the SILVA nr v.119
reference database (Quast et al., 2013) were used for the taxonomic classification of
a subset of 10000 quality-filtered and randomly selected 16S rRNA sequencing reads
per sample. Additional quality filtering of reads was performed by allowing no
ambiguous base calls and discarding those reads out of the limits defined by the
primer design when aligned against the SILVA database. Reference-based chimera
filtering using the UCHIME algorithm (Edgar et al., 2011) and the SILVA Gold
alignment were used to discard chimeric sequences, and the RDP classifier was used
for taxonomic classification (Wang et al., 2007). Sequences taxonomically classified
as having mitochondrial, eukaryotic, chloroplast or unknown origin were disregarded.
OTUs were clustered de novo using UPARSE (Edgar, 2013) with a 97% similarity
threshold using family level information to reduce the computational load. A

45
representative sequence for each of the OTUs was extracted and a phylogenetic tree
was created using the FastTree2 software (Price et al., 2010) upon Mothur derived
alignments in order to calculate phylogenetic UniFrac (weighted and unweighted)
distances (Lozupone et al., 2011).
To provide a technical validation of this procedure and confirm the absence of user-
or pipeline-dependent biases, similar analyses were repeated by Prof. Dr. Peer Bork’s
group in EMBL in Heidelberg using LotuS1.35 (Hildebrand et al., 2014) with a
maximum accumulated error set to 0.75, a minimal average quality of 27 and
truncating reads to 170 bp in short paired-end mode.
3.1.4. STATISTICAL ANALYSES
3.1.4.1. Ecological parameters
To characterize alpha diversity, species richness (Observed richness and the numeric
richness estimators Chao1 and ACE) as well as diversity / evenness measurements
(Shannon and Simpson indices) were calculated using Vegan (Oksanen et al., 2013)
and BiodiversityR (Kindt, 2016) /R packages. For each sample, a subset of 4000
sequencing reads was randomly selected per sample using the rrarefy function from
Vegan, as representative of the entire dataset. Samples below the corresponding
threshold were not considered for the ecological analysis.
Cross-sectional comparisons between groups in each cohort were done using the
Wilcoxon Rank-Sum Test or the Kruskal-Wallis and post-hoc pairwise tests corrected
for multiple comparisons using Benjamini-Hochberg (BH) or False Discovery Rate
(FDR), as corresponded.
3.1.4.2. Taxonomic composition
For the taxonomic characterization, all OTUs with less than 10 counts in 10% of the
samples were excluded for each of the cohorts studied. To assess bacterial genera
and phyla relative abundances, OTUs were collapsed to these taxonomic levels for
each sample so that relative abundances were summed. Cross-sectional
comparisons of specific taxa between groups in the different cohorts were done using

46
the Wilcoxon Rank-Sum Test or the Kruskal-Wallis and post-hoc pairwise tests
corrected for multiple comparisons using BH or FDR, as corresponded.
The stringent criterion on the LEfSe algorithm (Segata et al., 2011) (i.e. significant
taxa had to differ between every pair of class values) was used to describe which
bacterial genera were significantly enriched between sexual orientation groups (MSM
vs non-MSM) consistently across HIV-1 immune status (class: sexual orientation,
subclass: HIV-1 immune status) and vice versa (class: HIV-1 immune status,
subclass: sexual orientation) in the BCN0 and STK cohorts.
To explore if the datasets were structured in clusters, the Partitioning Around Medoids
(PAM) algorithm (Reynolds et al., 2006) (Maechler et al., 2015), as implemented in
the Cluster R/ package, was used considering Bray-Curtis distances between
microbiota samples. Silhouette coefficients were used to assess the goodness-of-fit
of the different possible partitions of each cohort sequencing dataset.
Ordination analyses were performed using non-metric multidimensional scaling
(NMDS) in a two-dimensional space based on ecological distance matrices calculated
by Bray-Curtis as well as UnWeighted and Weighted UniFrac dissimilarities
(Lozupone et al., 2011) as implemented in Phyloseq R/ package (McMurdie and
Holmes, 2013).
Permutational analysis of variance using Bray-Curtis distances was used to test the
influence of different covariates on microbiota structure similarity measures as
implemented in Adonis function from Vegan R/ package (Oksanen et al., 2013).
To evaluate the concordance between the NMDS coordinate matrices of the BCN0
and BCN1 datasets we performed a Procrustes analysis (Gower, 1975) and used a
Procrustean randomization test (PROTEST) (Jackson, 1995) to test for statistical
significance.
A statistical procedure named SIAMCAT and equivalent to one previously developed,
tested and validated to classify risk of colorectal cancer based on fecal metagenomic

47
biomarkers based on LASSO regression classifier (Zeller et al., 2014), was used to
characterize the strength of the association between sexual orientation (MSM vs. non-
MSM), HIV-1 immune status and global fecal microbiota composition in the BCN0
cohort.
3.1.4.3. Nutrient assessment
To ensure that nutrient amounts were comparable between individuals with different
total energy intake, individual nutritional data was standardized by the corresponding
energy intake by fitting a linear model (mean= 0 and standard deviation=1) and taking
residuals as new nutritional values (Willett et al., 1997). To identify food
portion/nutrients-microbiota associations, we used the Dirichlet-Multinomial
distribution to implement a penalized logistic regression model (Chen and Li, 2013).
Hence, we identified the strongest relationships between nutritional intake and genera
abundance and variance in the BCN0 dataset by applying strong penalties to weak
associations using a penalized likelihood approach.
Spearman correlations were used to assess the global relationship between nutrients
/ food portions and the overall gut microbiota composition. Strength of associations
was described using R-square and BH-adjusted p-values.
A Permanova test was used to assess overall differences in nutrient consumption
between clusters in the BCN0 dataset. The relative consumption of nutrients and food
portions by sexual orientation group and microbiota clusters (Prevotella vs.
Bacteroides) was assessed in the BCN0 cohort using bootstrapping to build 95%
confidence intervals for the mean difference between groups.
3.1.4.4. Immune markers assessment
Cross-sectional differences between groups in the BCN0 dataset were tested using
Wilcoxon-Rank-Sum test or the Kruskal-Wallis and post-hoc pairwise tests corrected
for multiple comparisons as corresponded.

48
3.2. STUDY 2: META HIV-ACUTE
3.2.1. STUDY COHORT
To study the coevolution of the gut microbiota and the immune system after acute
HIV-1 infection, we studied 4 groups of subjects recruited in Mozambique: individuals
with recent HIV-1 infection (RHI) and HIV-1 negative controls (NEG), which were
followed prospectively during 9-18 months, and chronic HIV-1-infected subjects either
on ART (CHI_ART) or not (CHI_noART), who provided a single cross-sectional
sample for comparison. The study population was enrolled between April 2013 and
May 2014 at the Manhica District Hospital (MDH) in Manhica, Southern Mozambique.
Written informed consent was obtained from all subjects before participation. Adults
older than 18 years, who were residents of the established District Surveillance
System study area, and who presented to the outpatient clinic of the MDH for non-
specific febrile symptoms or voluntary HIV counseling and testing were invited to
participate in the study. Chronically HIV-1-infected adults were selected from the
outpatient HIV-1 clinic at the MDH. Pregnant women were not allowed to enter the
study. Blood was collected by finger prick for HIV-1 rapid antibody testing with
Determine HIV ½. Positive results were then confirmed with a more specific Uni-Gold
rapid test. Individuals with a positive HIV-1 serology in both rapid tests were referred
for clinical management and were not eligible for enrollment into the study. Recent
HIV-1 infection was diagnosed in patients with a negative or indeterminate rapid test
serology (first test negative or first test positive and second test negative) and positive
HIV-1 viremia by reverse transcriptase–polymerase chain reaction testing on frozen
plasma using Abbott Real-Time HIV-1 assay according to the manufacturer’s
instructions with a sensitivity of detection of 150 copies/mL. HIV-1 RNA was quantified
by applying a multilevel pooling scheme of 10 samples/pool as described and
validated in previous works (Serna-Bolea et al., 2010). The group of HIV-1 negative
time-matched controls was selected by computer randomization. RHI and NEG
individuals were invited to attend a first study visit 1 month after the screening date to
start the follow-up in the context of the GAMA cohort (Pastor et al., 2017). RHI
individuals were followed during months 1, 2, 3, 4, 6, 9, 12, 15 and 18 after study
enrollment, whereas NEG controls were seen at months 1, 4 and 9 after study
enrollment, which was considered as the only realistic feasible follow-up in otherwise
healthy subjects in the Mozambican setting. Medical consultation and HIV counseling

49
were provided at each medical visit. Study participants received antibiotic treatment
when required according to their clinical status. They also began ART when needed
according to the Mozambican ART guidelines applicable at the time of the study; i.e.,
when CD4+ T-cell counts were lower than 250 cells/mm3 or if clinical complications
requiring ART initiation developed. Follow-up was terminated if subjects started
antibiotic or ART or if they became pregnant. Chronically HIV-1-infected adults
(CHI_ART and CHI_noART) provided only one cross-sectional clinical and analytical
assessment. In this pilot exploratory study no formal sample size calculation was
performed.
Demographic and clinical data were collected in a specific questionnaire which
included the study group to which the subject belonged (RHI, NEG, CHI_ART and
CHI_noART), the time point of follow-up in months, the participant’s gender, age,
weight and height, CD4+ and CD8+ T-cell counts, CD4+/CD8+ ratio, HIV-1 RNA levels,
hemogram, body temperature, whether fever was reported or not within the 24h prior
to sample collection, whether the patient reported or not diarrhea the week before
sample collection and its severity, as well as information on pregnancy, ART and
antibiotic use. The dataset also included information on a malaria optic microscopic
determination, whether the participant reported malaria within the month before
sample collection, the presence of occult blood in feces, the result of several
microbiological tests in feces including Giardia spp., Cryptosporidium spp.,
Entamoeba spp., Clostridium difficile toxin, and the result of serologies for HBV,
syphilis and Strongyloides stercoralis.
3.2.2. LAB PROCEDURE
3.2.2.1. Sample collection
Fecal samples were collected and stored in sterile tubes at -80ºC either in dry
conditions and/or suspended in 1ml of RNAlater to preserve RNA molecules in
Mozambique. Samples were properly labeled according to subject ID and number of
follow-up visit and directly shipped in dry ice to the IrsiCaixa AIDS Research Institute.
Once in the receiving lab, they were directly stored at -80ºC until further use.
In all cases, collection procedures were the same for cases and controls.

50
3.2.2.2. DNA/RNA extraction
Fecal DNA was extracted using the PowerSoil DNA Extraction Kit following
manufacturer’s instructions from dry frozen fecal samples. RNA was extracted from
RNA later cryopreserved fecal samples using the Stool total RNA Purification Kit
following manufacturer’s instructions.
3.2.2.3. 16S rRNA gene amplification
To amplify the variable region V3-V4 from the 16S rRNA gene (expected amplicon
size ~460 bp), we used the primer pair described in the MiSeq rRNA Amplicon
Sequencing protocol which already have the Illumina adapter overhang nucleotide
sequences added to the 16S rRNA V3-V4 specific primers, i.e.: 16S_F 5’-(TCG TCG
GCA GCG TCA GAT GTG TAT AAG AGA CAG CCT ACG GGN GGC WGC AG)-3’
and 16S_R 5’-(GTC TCG TGG GCT CGG AGA TGT GTA TAA GAG ACA GGA CTA
CHV GGG TAT CTA ATC C)-3’.
All samples from the Mozambican cohort were amplified once in a 75µl reaction under
the PCR conditions listed in Table 4.
Table 4. PCR protocol for 16S rRNA gene amplification in the MetaHIV-Acute
study.
PCR conditions to amplify the 16S rRNA gene in fecal samples from the Mozambican cohort.
Once the desired amplicon was confirmed in 1% agarose gel electrophoresis,
amplified solution was stored at -30ºC until further sequencing library preparation.

51
3.2.2.4. RT-PCR testing of eukaryotic viruses
Bioméreiux RT-PCR Rgene kits were used to detect Adenovirus and Enterovirus in
cryopreserved extracted stool DNA/RNA aliquots following the manufacturer’s
instructions, respectively. Quantitative results were adjusted using a sensitivity control
at 1 copy/µl.
Specific probe/primer mixes for real time-PCR assays (RT-PCR) were used to
quantitatively detect Cytomegalovirus, Human Herpesvirus 6A&6B and Human
Herpesvirus 8 in cryopreserved DNA aliquots. Probe/primer mixes were combined
with the TaqMan Gene Expression Master Mix at 1/20 dilution. Quantitative results
were adjusted using the corresponding sensitivity control at 1 copy/µl.
3.2.2.5. Illumina MiSeq and Illumina HiSeq sequencing
16S rRNA amplicons were cleaned-up for non-DNA molecules and Illumina
sequencing adaptersm and dual indices were attached using the Nextera XT Index
Kit as described in the MiSeq 16S rRNA Amplicon Sequencing protocol. After a
second round of clean-up, amplicons were quantified using the Quant-iT PicoGreen
double strand DNA Assay Kit and Nanodrop 1000, and diluted in equimolar
concentrations (4nM) for further pooling. Sequencing was performed on an Illumina
MiSeq platform according to the manufacturer's specifications to generate paired-end
reads of 300 base lengths in each direction at the Institut Germans Trias I Pujol
(IGTP), Badalona, Spain.
For the WGS, total fecal DNA was fragmented using the Nextera-XT Illumina kit which
uses modified transposons to randomly fragment DNA and incorporates nucleotide
tags to identify samples (approximately 125 base pairs are added per paired-end
reads). One library of approximately 300-basepair-clone insert size was constructed
for each sample. Total fecal DNA was sequenced in an Illumina Hi-SeqTM platform
at the Institut de Medicina Predictiva Del Cancer (IMPPC), Badalona, Spain.
3.2.2.6. Immune measurements
Plasma and fecal samples from Mozambique were collected and cryopreserved at
-80ºC until quantification. A total number of 51 cytokines were quantified in plasma

52
including general markers of inflammation, cell death and growth factors,
angiogenesis, monocyte function and mobility, T- and B- cell function, neutrophil and
eosinophil activation, enterocyte damage, intestinal permeability and microbial
translocation (Table 5).
Table 5. Immune measurements in blood and feces tested in the Mozambican
samples.
List of all immune measurements tested in fecal and blood samples in the Mozambican cohort.
All immune quantifications were performed according to the manufacturer’s
instructions. Overflow and under limit of detection values were validated for every
analyte as the double and the half of the detection limit, respectively.
3.2.3. BIOINFORMATIC ANALYSIS
3.2.3.1. OTU picking and taxonomic assessment
Raw MiSeq sequences were initially assessed using the FastQC software (Andrews,
2010) and trimmed with Trimmomatic (Bolger et al., 2014) using adjusted quality and
length values: a quality cutoff value of Q20 in at least 50% of the bases and a minimum
sequence average quality of Q20. QIIME 1.9.1 (Caporaso et al., 2010) was used for
the taxonomic classification of the 16S rDNA sequences contained in each sample
using GreenGenes 13.8 as the reference database (DeSantis et al., 2006). The first
step was to join forward and reverse reads per sample using the join_paired_ends.py
script. The maximum percent differences accepted in the overlapping region was set
to 15. Reads were then filtered to contain a maximum of 2 ambiguous bases (N) using
the split_libraries_fastq.py script. An open-reference OTU picking approach was used
to cluster the sequencing reads at 97% sequence similarity and construct OTUs.
Briefly, in this pick_open_reference_otus.py approach, reads were clustered against
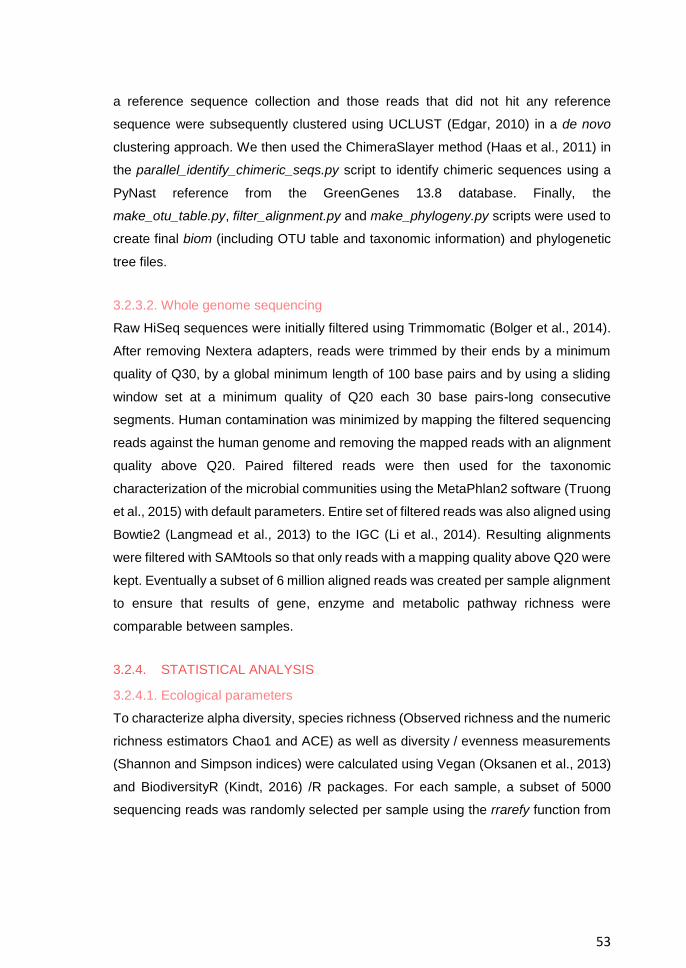
53
a reference sequence collection and those reads that did not hit any reference
sequence were subsequently clustered using UCLUST (Edgar, 2010) in a de novo
clustering approach. We then used the ChimeraSlayer method (Haas et al., 2011) in
the parallel_identify_chimeric_seqs.py script to identify chimeric sequences using a
PyNast reference from the GreenGenes 13.8 database. Finally, the
make_otu_table.py, filter_alignment.py and make_phylogeny.py scripts were used to
create final biom (including OTU table and taxonomic information) and phylogenetic
tree files.
3.2.3.2. Whole genome sequencing
Raw HiSeq sequences were initially filtered using Trimmomatic (Bolger et al., 2014).
After removing Nextera adapters, reads were trimmed by their ends by a minimum
quality of Q30, by a global minimum length of 100 base pairs and by using a sliding
window set at a minimum quality of Q20 each 30 base pairs-long consecutive
segments. Human contamination was minimized by mapping the filtered sequencing
reads against the human genome and removing the mapped reads with an alignment
quality above Q20. Paired filtered reads were then used for the taxonomic
characterization of the microbial communities using the MetaPhlan2 software (Truong
et al., 2015) with default parameters. Entire set of filtered reads was also aligned using
Bowtie2 (Langmead et al., 2013) to the IGC (Li et al., 2014). Resulting alignments
were filtered with SAMtools so that only reads with a mapping quality above Q20 were
kept. Eventually a subset of 6 million aligned reads was created per sample alignment
to ensure that results of gene, enzyme and metabolic pathway richness were
comparable between samples.
3.2.4. STATISTICAL ANALYSIS
3.2.4.1. Ecological parameters
To characterize alpha diversity, species richness (Observed richness and the numeric
richness estimators Chao1 and ACE) as well as diversity / evenness measurements
(Shannon and Simpson indices) were calculated using Vegan (Oksanen et al., 2013)
and BiodiversityR (Kindt, 2016) /R packages. For each sample, a subset of 5000
sequencing reads was randomly selected per sample using the rrarefy function from

54
Vegan, as representative of the entire dataset. Samples below the corresponding
threshold were not considered for the ecological analyses.
Cross-sectional comparisons between groups were done using the Wilcoxon Rank-
Sum Test or the Kruskal-Wallis and post-hoc pairwise tests corrected for multiple
comparisons using BH or FDR, as corresponded. To avoid over-representation of
groups with longitudinal follow-up compared to the chronically HIV-1 infected groups,
we only considered first sample available per individual for the RHI and NEG groups.
Moreover, we split RHI samples into two groups: RHI≤6 including first sample
collected per individual within the first 6 months of follow-up, and RHI>6 including first
sample per individual collected beyond.
Longitudinal changes on the abovementioned ecological parameters in the RHI and
NEG groups were tested using Linear Mixed Models (LMM). These models were
adjusted to test overall community dynamics and to detect statistically significant
increases or decreases of alpha diversity estimators in the defined time ranges (i.e. 1
to 6 months for the RHI group and 1 to 4 months in the NEG group).
3.2.4.2. Taxonomic composition
For the taxonomic characterization, all OTUs with less than 10 counts in 10% of the
samples were excluded. To assess genus and phylum relative abundances, OTUs
were collapsed to these taxonomic levels for each sample and relative abundances
were summed. Cross-sectional comparisons of individual taxa between groups in the
different cohorts were done using the Wilcoxon Rank-Sum Test or the Kruskal-Wallis
and post-hoc pairwise tests corrected for multiple comparisons using BH or FDR, as
corresponded. We used same cross-sectional representation of RHI and NEG groups
as cited in the section above.
Longitudinal changes on relative abundances in the RHI and NEG groups in the
cohort, were tested using LMM providing same statistical information as cited above
for the ecological parameters. All pairwise associations between bacterial taxa were
assessed using Spearman’s correlation statistic and BH-correction.

55
Ordination analyses were performed using NMDS in a two-dimensional space based
on ecological distance matrices calculated by Bray-Curtis as well as UnWeighted and
Weighted UniFrac dissimilarities (Lozupone et al., 2011) as implemented in R/
Phyloseq (McMurdie and Holmes, 2013) wrappers.
Permutational analysis of variance using Bray-Curtis distances as implemented in
Adonis function from Vegan (Oksanen et al., 2013) package was used to test the
influence of different covariates on microbiota structure similarity measures.
Clustering of bacterial genera into co-abundance groups was performed using the
hclust algorithm in stats R/ package (R Core Team, 2014) with ward.D2 methodology
on Euclidean distance matrix computed from a relative abundance table of bacterial
genera across groups. For each genus and group, we calculated the mean value of
all previously scaled individual abundance percentages (force mean=0 and standard
deviation=1). A phylogenetic distance threshold of 0.8 allowed us to identify 7 different
bacterial clusters on the resulting dendrogram.
3.2.4.3. Eukaryotic virus expansion
Results derived from RT-PCR testing were used as presence/absence of viral
DNA/RNA in feces. Comparison of number of individuals with virus in feces among
groups at study entry was performed using Fisher’s exact statistical test. To resume
results from tested samples from same individual at different time points to a single
value per individual we used two different criteria: 1) if first sample available from that
given individual was positive, that subject was positive, 2) if that given individual had
at least 1 sample testing positive along its follow-up, that subject was positive.

56

57
4. RESULTS
4.1. STUDY 1: META-HIV PHENO
4.1.1. Baseline characteristics of the study cohort
The test cohort (BCN0) included a total number of 156 subjects from which 129 were
HIV-1 positive (82.7%) and 27 HIV-1 negative (17.3%). The internal validation cohort
(BCN1) included 110 individuals from which 87 (79.1%) were HIV-1 positive and 23
(20.9%) HIV-1 negative. The external validation cohort (STK) included 84 individuals
from which 77 were HIV-1 infected (91.6%) and 7 HIV-1 negative (8.4%).
In Barcelona, the median age of the study participants was 43 years and their median
body mass index was 23.8 kg/m2. Eighty percent of subjects were men, mostly from
Caucasian ethnicity. Regarding their transmission risk group, 64% of all subjects were
MSM, 26% HTS and 10% PWID. There were 8 (5.1%) elite controllers, 11 (7.1%)
viremic controllers, 15 (9.6%) ART-naïve, 13 (8.3%) early-treated, 53 (34.1%) immune
concordant, 18 (11.5%) immune discordant, and 11 (7.1%) late presenters. HIV-1-
infected subjects were slightly older and were more likely to be HBV and HCV positive
than HIV-1 negative controls. HIV-1 positive and HIV-1 negative groups were well
balanced in all other factors as shown in Table 6.

58
Table 6. Demographics of the BCN0 cohort.

59
Median (IQR) and p-values for continuous and discrete variables were calculated with the Wilcoxon rank
sum and Fisher's tests, respectively. ATB, antibiotic; BMA, Barcelona Metropolitan Area; NA, not available;
IQR, interquartile range; BMI, Body Mass Index; U, units.
In Stockholm, 60% of all subjects were men; 23% were MSM, 66% HTS and 11%
PWID. Only half were nationals from Scandinavian countries; 62% individuals were
Caucasian and 33% were black (Table 7).

60
Table 7. Demographics of the STK cohort.
Median (IQR) and p-values for continuous and discrete variables were calculated with the Wilcoxon rank
sum and Fisher's tests, respectively.
4.1.2. European gay men have a distinct gut microbiota composition
Clustering of the fecal microbiota in BCN0 using a PAM algorithm suggested the
presence of at least 2 clusters of bacterial communities (Figure 9A). Such clusters
were primarily enriched either in genus Bacteroides or Prevotella and had a similar
bacterial composition to the corresponding previously described human gut microbial
enterotypes (Figure 9B)(Arumugam et al., 2011)(Koren et al., 2013).

61
Figure 9. Bacterial composition of the fecal samples from BCN0 and STK.
A, The bacterial genera composition of the fecal microbiota in the BCN0 cohort (top) was largely determined
by HIV transmission group (third horizontal line on the top of the graph), with MSM (light green) being
enriched in Prevotella (in purple in the barplot) and non-MSM individuals (dark green) in the Bacteroides
(in red in the barplot). Genera with mean abundance of at least 2% across all samples are represented in
colors; those with b2% abundance are grouped into the category “Others”. Each column represents one
individual. Below, same plot for the STK cohort. B, The PAM analysis of the BCN0 dataset shows that this
population structure in this dataset is better explained by 2 rather than more clusters, with reasonable
Silhouette support (0.38).
A
Prevotella Bacteroides Faecalibacterium Lachnospiraceae_unclassified
Ruminococcaceae_unclassified Blautia Alistipes Succinivibrio
Alloprevotella Parabacteroides Others
Prevotella Bacteroides Faecalibacterium Lachnospiraceae_unclassified Ruminococcaceae_unclassified
Blautia Alistipes Anaerostipes Lachnospiraceae_Incertae_Sedis Subdoligranulum
Bidifobacterium Ruminococcus Others
B Ellipse: 95%

62
There were strong positive correlations between the genus Bacteroides and
Parabacteroides, Barnesiella, Alistipes and Odoribacter, as well as between
Prevotella and Alloprevotella, Catenibacterium, Mitsuokella and Intestinimonas,
among others. These results highlight that differences between the clustering groups
extended beyond the Bacteroides/Prevotella ratio. The genera correlating with
Prevotella were negatively correlated with Bacteroides and vice versa (Figure 10).
Figure 10. Correlations between Bacteroides and Prevotella-relative
abundances and other bacterial genera.
Spearman correlation between bacterial genera’s relative abundances. Only significant values (Holm's-
corrected p-values<0.05) are shown. The plot confirms previous observations, i.e.: a) strong positive
correlations between Bacteroides, Parabacteroides, Barnesiella, Alistipes and Odoribacter, b) strong
positive correlations between Prevotella, Alloprevotella, Mitsuokella and Intestinimonas, among others, and
c) strong inverse correlations between the groups including Prevotella and Bacteroides.

63
We then explored the metadata variables potentially explaining variation observed in
the composition of the fecal microbiota according to a univariate ADONIS test of
ecological distance. We found possible effects of HIV-1 transmission risk group,
gender, feces consistency, place of residency, ethnicity, HIV-1 immune status and
altered abdominal transit (Table 8). However, only the HIV-1 transmission risk group
(MSM, HTS, PWID) retained statistical significance in a multivariate ADONIS analysis
with terms added sequentially (R2: 0.373, p<0.001).
Table 8. ADONIS test on metadata variables collected for the BCN0 dataset.
Based on an ADONIS statistical test, only those factors explaining distance variations among human
microbiota profiles in the BCN0 dataset are shown.
As expected, fecal microbiota in the BCN0, BCN1 and STK datasets clustered by HIV-
1 risk group rather than by HIV-1 immune status, either using Bray–Curtis or other
ecological distances in two-dimensional ordination plots (Figure 11). MSM individuals,
both in BCN0 and STK cohorts, belonged to the Prevotella-rich cluster, whereas non-
MSM individuals (including PWID and HTS risk groups) mainly belonged to the
Bacteroides-rich cluster.

64
Figure 11. Bacterial composition clustering in the BCN0 and STK cohorts.
A, Two-dimensional ordination plots showing that cluster on the left included both, HTS and PWID, whereas
cluster on the right, mainly included MSM individuals. B, Boxplots (median±IQR) on Bacteroides and
Prevotella relative abundances. HTS and PWID were highly enriched in Bacteroides and showed almost
no Prevotella, whereas MSM individuals had really high levels of Prevotella and almost no presence of
Bacteroides.
Although a few individuals showed marked differences in their gut bacterial
composition between the two-time points in the Barcelona cohorts, fecal microbiota
ordination was highly concordant between BCN0 and BCN1 datasets (Procrustes
m2= 0.3475, PROTEST p = 0.001), indicating that differences in microbial ordination
were not due to random variation but quite stable over time (Figure 12).
A
B

65
Figure 12. Procrustes analysis testing the stability of the gut microbiota
composition between BCN0 and BCN1 datasets.
Procrustes analysis was performed with the 110 samples with the two-time points available (BCN0 and
BCN1). The analysis shows high overall concordance between the NMDS matrices of the two datasets,
even though a few individuals showed marked variations in microbiota ordination. The NMDS matrices
were constructed using Bray-Curtis distance. Circles are samples at BCN01 and each circle is connected
to the corresponding sample at BCN1 with a blue arrow.
In an analysis accounting for the potential interdependency of HIV-1 transmission risk
group and HIV-1 immune status using LEfSe (Segata et al., 2011), we detected
consistent differences in both, BCN0 and STK cohorts only by sexual preference
group (MSM vs. non-MSM), with enrichment of Prevotella, Alloprevotella,
Succinvibrio, Dorea, RC 9 gut group, Desulfovibrio, Phascolarctobacterium and
unclassified Bacteroidales in MSM, and enrichment in Bacteroides, Odoribacter and
Barnesiella in non-MSM individuals.
To quantify the strength of the association between sexual preference group, HIV-1
immune status and global fecal microbiota composition, we applied a previously
validated global microbiota classification concept based on LASSO regression (Zeller
et al., 2014) to the BCN0 dataset. Cross-validation accuracy was extraordinarily high
for sexual preference group (mean area under the curve (AUC) = 95%), confirming a
different fecal microbiota composition between MSM and non-MSM individuals
(Figure 13A). When we considered only MSM individuals, HIV-1 immune status was
PROTEST Statistics: Procrustes Sum of Squares (m2): 0.3475 Correlation in a symmetric Procrustes rotation: 0.8078 Significance: 0.001 Permutation: free Number of permutations: 999

66
not associated with consistent changes in the global fecal microbiota composition at
the genus level (mean AUC=61%) (Figure 13B).
Figure 13. LASSO regression model testing the predictability of HIV-1 infection
status and sexual orientation relying on gut microbiota composition.
Global microbiota classifier by sexual preference group (A) and HIV-1 status (B). Relative abundances of
28 gut microbial genera collectively associated with MSM and HIV-1 infection, respectively, are displayed
as heatmap of log-abundance z-scores with the direction of association indicated to the left. To avoid
confounding by sexual preference, the HIV-1 classifier (B) only includes MSM subjects. The mean
contribution of each marker bacterial genus to the classification is shown to the left (bars correspond to log-
odds ratio in logistic regression). Below each heatmap the classification score of the microbial signature
from cross-validation is shown as gray scale. HIV-1 status and HIV-1 risk group are color-coded below the
first heatmap (see color key). Cross-validation accuracy of the microbiota classifier is depicted as receiver–
operator-characteristic (ROC) curve summarizing mean test predictions made in ten times resampled
tenfold cross-validation with the area under the curve (AUC) indicated inside each plot.
Relative to non-MSM subjects, MSM were younger, were more likely to live in
Barcelona city, reported softer fecal consistency, and were less likely to be infected
A
B
Prevotella Branchyspira Howardella RC9 gut group Alloprevotella Megasphaera Slackia Unclassified Burkholderiales Unclassified RF9 Clostridium sense stricto 1
Marvinbryantia Oribacterium Dialister Lachnospira Turicibacter Lactobacillus Barnesiella Bifidobacterium Unclassified Clostridiales Family XIII Akkermansia Christensenellla Ruminococcus Porphyromonas Gelria Bilophila Alistipes Papilibacter Ruminococcaceae Incertae Sedis
Unclassified Erysipelotrichaceae Fusobacterium Methanobrevibacter Subdoligranulum Succinivibrio Unclassified Desulfovibrionaceae Unclassified Rikenellaceae Oscillibacter Anaerovibrio Campylobacter Escherichia-Shigella DgA-11 gut group Unclassified RF16 Lactobacillus Helicobacter Veillonella Dehalobacterium Paraprevotella Megasphaera Branchyspira Streptococcus RC9 gut group Clostridium sense stricto 1 Unclassified Oligosphaeraceae Unclassified Preoteobacteria Turicibacter Oribacterium
Butyricimonas

67
with HBV and HCV (Table 9). However, none of these factors among others were
likely to confound the previous LASSO models.
Table 9. Potential microbiota confounders in MSM vs. non MSM in BCN0 cohort.
Median (IQR) and p-values for continuous and discrete variables were calculated with the Wilcoxon rank
sum and Fisher's tests, respectively. ATB, antibiotic; BMA, Barcelona Metropolitan Area; NA, not available;
IQR, interquartile range; BMI, Body Mass Index; U, units.

68
4.1.3. HIV-1 infection is independently associated with reduced bacterial richness.
The fecal microbiota was significantly richer and more diverse in MSM compared to
non-MSM individuals both in BCN0 and STK, also after correcting for multiple
comparisons (Figure 14A). Because of the significance of sexual orientation on overall
gut microbiota composition, when we stratified for MSM vs. non-MSM, HIV-1 infection
remained consistently associated with reduced bacterial richness in both cohorts
(15% to 30% reduction in HIV-1 infected individuals compared to HIV-1 negative
individuals) (Figure 14B). Since LASSO predictor did not found consistent changes in
overall bacterial composition and HIV-1 infection status, these results suggest that
this reduction in microbial richness observed in HIV-1 infected individuals is not
bacterial genus-specific.
Figure 14. Bacterial richness and diversity in the cross-sectional European
cohorts.
A, The highest richness and diversity values in the human fecal microbiota were observed in MSM in both,
BCN0 and STK cohorts, compared to both non-MSM transmission risk categories. There were no
differences between HTS and PWID. Kruskal–Wallis p-values were adjusted for multiple comparisons using
the BH method. Note: “Simpson” refers to 1-Simpson index. The remaining ecological index names are
self-explanatory. *p b 0.1, **p b 0.05, ***p b 0.001. B, When stratifying for sexual orientation, in both
B
A

69
European cohorts, HIV-1 infection was consistently associated with reduced values for bacterial richness
and diversity irrespective of individuals being MSM or non-MSM. Comparisons were made with the
Wilcoxon rank sum test with continuity correction. Note: “Simpson” refers to 1-Simpson index. The
remaining ecological index names are self-explanatory. *p b 0.1, **p b 0.05, ***p b 0.001.
In the BCN0 cohort, the lowest microbial richness and diversity values were observed
among the HIV-1-infected individuals with an immune-virological discordant
phenotype (Figure 15). Subjects with an immune-virological concordant phenotype
had higher microbial richness than those immune-virological discordant individuals,
but, still showed reduced bacterial richness compared to HIV-1 negative controls. This
observation suggests that despite adequate immune recovery [median (IQR) CD4+ T-
cell counts: 761 (640, 932) cells/mm3] at the time of testing, ART had not been able
to fully normalize microbial richness in these subjects.
Figure 15. Bacterial richness and diversity among different HIV-1 phenotypes.
HIV-1-infected subjects with an immune discordant phenotype (i.e. those which do not recover good CD4+
T-cell counts despite at least 2 years of effective ART) had the lowest microbiota richness of all HIV-1
phenotypes. Individuals with an immune concordant phenotype (i.e. those achieving good CD4+ T-cell
counts reconstitution on ART) also had lower microbiome richness than HIV-1-negative individuals, but not
as low as immune discordant subjects. “Simpson” refers to 1-Simpson index. The remaining ecological
index names are self-explanatory. Comparisons were done using a Kruskal–Wallis test including post-hoc
pairwise analyses. Benjamini–Hochberg-adjusted p-values are shown at the top of each index; for post-hoc
pairwise comparisons: *p b 0.1, **p b 0.05, ***p b 0.001

70
4.1.4. Diet had a minor impact on gut microbiota composition in the BCN0 cohort.
Although long-term dietary patterns have been previously linked to alternative
enterotype states (Wu et al., 2011), the effect of diet on the gut microbiota composition
was limited in our BCN0 cohort. None of the diet components tested was selected by
a multivariate LASSO regression model as a consistent predictor of the microbiota
clustering. Subjects belonging to the Prevotella cluster and MSM individuals had
significantly higher total energy intake. Therefore, all subsequent nutritional analyses
were normalized for this factor.
The Dirichlet statistical approach used to seek for links between bacterial genera and
diet highlighted several categories: saturated-fat, water, ethanol, iron, total protein,
plant protein and digestible sugars for nutrients; and coffee/tea, dairy products and
meat for food portions (Figure 16).
Figure 16. Main correlations between bacterial genera and nutrients / food
portion consumption.
Main associations between bacterial genera, normalized amounts of nutrients (left) and food portions
(right), according to a Dirichlet multinomial regression model. Positive and negative associations are shown
in red and blue, respectively. Line thickness is proportional to the strength of the association.
1: Prevotella 2: Faecalibacterium 3: Bacteroides
4: Lachnospiraceae_unclassified 5: Succinivibrio 6: Alloprevotella
7: Ruminococcaceae_unclassified 8: Blautia 9: Lachnospira
10: RC9_gut_group 11: Alistipes 12: Barnesiella
13: Bacteria_unclassified 14: Coprococcus 15: Dialister
16: Clostridium_sensu_stricto_1 17: Ruminococcus
18: Paraprevotella 19: Ruminococcaceae_Incertae_Sedis 20: Bacteroidales_unclassified
21: Victivallis 22: Sutterella 23: vadinBB60_unclassified
24: Elusimicrobium 25: Christensenellaceae_unclassified 26: Intestinimonas
27: Butyricimonas 28: Satured fat 29: Water
30: Ethanol 31: Iron 32: Total Protein
33: Plant Protein 34: Digestible Sugars
1: Prevotella 2: Faecalibacterium 3: Bacteroides
4: Lachnospiraceae_unclassified 5: Succinivibrio 6: Alloprevotella
7: Ruminococcaceae_unclassified 8: Lachnospira 9: Erysipelotrichaceae_Incertae_Sedis
10: RC9_gut_group 11: Dorea 12: Alistipes
13: Bacteria_unclassified 14: Coprococcus 15: Catenibacterium
16: Megasphaera 17: Odoribacter 18: Mitsuokella
19: Bacteroidales_unclassified 20: Escherichia-Shigella 21: vadinBb60_unclassified
22: Streptococcus 23: Anaerotruncus 24: Oribacterium
25: Intestinimonas 26: Solobacterium 27: Clostridiales_unclassified
28: Coffee and tea 29: Dairy products 30: Meat

71
Of all links identified, the only significant differences between groups after adjusting
for multiple comparisons (FDR≤0.1) were increased consumption of meat in the
cluster Bacteroides (Figure 17) and increased intake of dietary water in MSM.
Figure 17. Differences in nutrient and portions of food consumption between
individuals enriched in Bacteroides and individuals enriched in Prevotella.
Mean and 95% confidence intervals for the differences between clusters in consumption of nutrients (left)
and portions of food (right). Comparisons were significant if the 95-confidence interval did not cross 0
(dashed red line).
4.2. STUDY 2: META-HIV ACUTE
4.2.1. Baseline characteristics of the study cohort
The study included a total of 312 fecal samples collected from 49 RHI and 55 NEG
individuals that provided longitudinal samples, and from two chronically HIV-1 infected
cross-sectional groups: 27 CHI_ART and 71 CHI_noART. All demographic data is
shown in Table 10.
Both CHI_ART and CHI_noART group participants were significantly older and had
higher BMI scores than NEG and RHI groups at baseline. As expected, the NEG
group showed the highest values for the CD4+ T-cell counts whereas no differences
were observed among the three HIV-1 infected groups. The RHI group presented the
highest CD8+ T-cell counts, followed by the CHI_noART and the CHI_ART group.
Thus, the CD4+/CD8+ ratio was highest for the NEG group (median 1.65; IQR: 1.17,
2.17), while it ranged between 0.4 and 0.6 for all the HIV-1 infected groups. RHI

72
individuals had 3.5 times higher viral loads than the CHI_noART. A significant
decrease in viral load in the RHI group was observed between the screening viral load
(i.e. tested at first hospital visit) and that from their first follow-up visit (paired Wilcoxon
rank sum test, p=3.81-05). Of note, almost all individuals reporting a positive test and
treated Malaria the previous month to study enrollment belonged to the RHI and NEG
groups.
Table 10. Demographics of the Mozambican dataset.
Only first sample is considered per individual in the RHI and NEG groups. In the CHI_ART and CHI_noART
groups, the only fecal sample provided is considered. Continuous variables are tested using ANOVA

73
statistical test (except for Time with HIV variable which is tested using a Student T test). Categorical
variables are tested using a Fisher statistical test. Significance threshold is set to p=0.05. *Malaria test was
only performed in subjects reporting febrile symptoms. Malaria severity is measured in a scale 1 to 5, from
light to severe.
During the first 6 months of follow-up after HIV-1 acquisition, the RHI group showed
statistically significant decreases in CD8+ T-cell counts and viral load, together with a
significant increase in CD4+/CD8+ ratio (Figure 18). Such trends were not observed
beyond month 6. CD4+ T-cell counts remained stable along the first six months and
seemed to decrease after time point 6. Additionally, we observed significant
decreases of pro-inflammatory cytokines along the first 6 months after HIV-1
acquisition: IL-12, IP-10, BAFF, Fas ligand, TNFR2 and PDL2. IL-17 which has been
described as playing a dual role in inflammatory processes, showed a significant
increase along the first 6 months, as well as IgA and IgG measurements in blood. In
stool test, significant increase of PMN elastase levels along the first 6 months after
HIV-1 acquisition was detected.
Figure 18. Evolution of CD4+, CD8+, CD4+/CD8+ T-cell ratio and viral load in the
RHI and NEG groups along follow-up.
LMM showing longitudinal evolution of CD4+ and CD8+ T-cell counts and HIV-1 RNA levels in RHI (red)
and NEG individuals (green). Slopes (black) were obtained using LMM. Statistically significant differences
from 0 (flat slope) are shown with asterisks. P-values: *<0.1; **<0.05

74
4.2.2. Recent HIV-1 infection is followed by increased fecal adenovirus shedding
HIV-1 infection was associated with increased fecal shedding of Adenovirus
measured by RT-PCR (Table 11). This was observed in RHI (53% of subjects) but
also in chronically HIV-1-infected individuals, regardless of whether they were ART-
naïve (51%) or received ART (44%) (all p values <0.05 in comparison to the 20% of
HIV-1 negative individuals). Conversely, increased shedding of Cytomegalovirus and
Enterovirus was only observed in CHI_noART subjects (11% and 21%, respectively),
compared to the NEG group (2% and 4%, respectively) (all p values <0.05). Human
herpes viruses 6A, 6B and 8 were not detected in any individual, despite using proper
extraction and positive RT-PCR controls.
Table 11. Detection of eukaryotic viruses on human feces using RT-PCR.
Numbers (percentage) of subjects with detectable virus in feces by qualitative commercial real-time PCR.
To avoid ascertainment bias due to different follow-up between groups, only the first fecal sample available
for testing was used for comparison (stringent criteria). *p <0.1; **p<0.05, Fisher’s pairwise comparisons
relative to HIV-1 negative.
4.2.3. Recent HIV-1 infection is followed by transient non-HIV-1-specific changes in
the gut bacteriome
Bacterial genus richness and diversity were not different between groups in cross-
sectional comparisons except for the ACE richness numeric parameter, which was
significantly lower in HIV-negative subjects than in the remaining groups (Figure 19A).
Longitudinally, richness and diversity increased during the first 6 and 4 months in both
RHI and NEG subjects, respectively, with similar slopes between the two groups
(Figure 19B).

75
Figure 19. Cross-sectional comparison of richness and diversity ecological
parameters at baseline as well as their evolution in the RHI and NEG groups.
A, Median ± IQR values in different cross-sectional comparison groups. Kruskal-Wallis p-values are shown
at the bottom of each plot. Asterisks (p-values: *<0.1; **<0.05) highlight statistically significant Tukey post-
hoc pairwise differences between groups, corrected for multiple comparisons (FDR <0.05). B, LMM of the
richness and diversity indices tested in RHI (red) and NEG (green) individuals over time. Horizontal axes
show months after study enrollment. Thick black lines correspond to the modelled slope of each parameter.
Vertical dashed lines show the inflexion point used for modelling in b and c. Statistically significant
differences from 0 (flat slope) are shown with asterisks. P-values: *<0.1; **<0.05.
Using NMDS on bacterial phyla and genera composition data matrices, there were no
significant clustering patterns between cross-sectional comparison groups,
regardless of the distance metric used (Figure 20). PAM algorithm did not support
anymicrobiota clustering, and none of the metadata variables showed a significant
explanatory effect on gut microbiota composition groups in PERMANOVA analysis.
A
B
B
B

76
However, there was a statistically significant reduction in genus beta-diversity from
RHI<6 to RHI>6.
Figure 20. Two-dimensional ordination plots using bacterial phyla and genera
relative abundance data matrices.
Non-metric multi-dimensional scaling plots using three different ecologic distances summarizing the 16S-
rDNA gut microbiota composition at microbial phylum (left) and genera (right) taxonomic ranks.
To evaluate the longitudinal evolution of the bacterial genera, 7 co-abundant bacterial
genera clusters were identified and named SP1 to SP7 (Figure 21A). Only clusters
SP1, 4 and 7 showed significant longitudinal changes during follow-up on LMM, and

77
only in subjects with RHI (Figure 21B). Cluster SP1, which was associated with
increased plasma levels of cytokines involved in TNF-mediated innate responses (IL-
10, IL-12, IP-10, BAFF, CD27, IL-2 receptor, Fas ligand and TNF receptor 2),
decreased during the first 6 months of follow-up (Figure 21C). Conversely, clusters
SP4 and SP7, which included Odoribacter, Rikenellaceae unclassified and
Barnesiaellaceae unclassified; and Clostridiales unclassified, Butyricimonas,
Faecalibacterium and Succinivibrio, respectively, increased during the same period.
There was no evidence, however, that the longitudinal evolution of such clusters was
significantly different between RHI and NEG (Figure 21B). Clusters SP2 and SP3 did
not significantly change in abundance over time but showed reduced abundance of
Akkermansia, Anaerovibrio, and Clostridium in CHI_noART, relative to HIV-negative
individuals (Figure 21A). Moreover, SP2 was negatively correlated with markers of
microbial translocation (sCD14), inflammation (IP10) and gut integrity (fecal
calprotectin) (Figure 21C).

78
Figure 21. Evolution of the co-abundance bacterial clusters in the NEG and RHI
groups over follow-up and their relation to immune parameters.
A, Co-abundant bacterial genera clusters (SP1 to SP7) obtained using 16S rRNA sequencing. The color
gradient is proportional to the mean of scaled individual relative abundance values (mean=0, standard
deviation=1) per bacterial genera and study group. Dots show statistically-significant differences in genus
abundance relative to NEG group. B, LMM of the longitudinal evolution of bacterial clusters in RHI and
NEG individuals. Horizontal axes show months after study enrollment. Thick black lines correspond to the
modelled slope of each bacterial cluster. Statistically significant differences from 0 (flat slope) are shown
with asterisks. P-values: *<0.1; **<0.05. C, Spearman's correlation between bacterial clusters and: CD8+
A B C
B

79
(blue), CD4+ (green), blood (red), and stool (brown) immune parameters. The color gradient is proportional
to the Spearman's Rho value. Black boxes highlight unadjusted statistically significant correlations (p-value
<0.05).
4.2.4. An HIV-1-specific signature in the gut microbiota previously associated with
chronic inflammation is observed in chronically HIV-1 infected subjects
Cross-sectional comparisons of individual bacterial genera confirmed depletion of
Akkermansia, Anaerovibrio, Bifidobacterium, and Clostridium in CHI_noART relative
to NEG individuals (Figure 22). ART exposure (CHI_ART) was not associated with
changes in abundance of such genera, relative to CHI_noART. Individuals with RHI<6
months were enriched in Haemophilus and Veillonella relative to NEG subjects.
Finally, there was an enrichment in Odoribacter and depletion in Dorea in RHI>6
months relative to RHI<6 months (Figure 22).
Figure 22. Relative abundance of bacterial genera among groups at baseline.
Box plots show median ±IQR relative abundance of individual bacterial genera. Bacterial genera named
“unclassified” are identified by their closest taxonomic level identification. Only bacterial genera with a
significantly different abundance between groups (Kruskal-Wallis p-value <0.05) are shown. Statistically
significant post-hoc pairwise differences (Tukey post-hoc pairwise tests corrected for multiple comparison,
FDR <0.05) are shown with asterisks.

80
4.2.5. HIV-1 infection is linked to reduced bacterial gene richness with potential
microbial functional changes.
Like in previous publications from European subjects (Guillén et al., 2018)(Le
Chatelier et al., 2013), gut microbial gene richness also followed a bimodal distribution
in our Mozambican population (Figure 23A). Samples with gene counts above and
below a gene richness threshold of 444.219 genes were categorized as high (HGC)
and low gene counts (LGCs), respectively. Whereas 63% (22/35) of the RHI samples
were included in the LGC category, only 37% (7/19) of NEG samples were LGC
(Fisher’s test p-value 0.003). At the first timepoint, 10/13 (76.9%) of RHI vs 4/8 (50%)
of NEG subjects (Fisher’s test p-value 0.172) were already LGC (Figure 23B).
Eight/13 (61.5%) subjects from the RHI group but none of the NEG individuals showed
low gene count values in all follow-up timepoints. Moreover, 5/8 HIV-negative subjects
(62.5%) showed increases in gene richness during follow-up.
Figure 23. Microbial gene richness in RHI and NEG individuals using WGS.
A, The leftmost density plot shows a bimodal distribution of all samples according to their observed gene
richness value, which enables their classification into LGC and HGC. The rightmost density plot shows that
HGCs are enriched in NEG, whereas RHI predominate in LGCs. B, longitudinal evolution of microbial gene
A
B

81
richness in RHI (in red) and NEG (in green) individuals. The dark gray colored area represents the LGC
zone, whereas light gray colored area represents the HGC zone.
In a longitudinal evaluation, several microbial species associated with gene richness
were depleted in RHI compared NEG individuals (Figure 24A). In general, such
depletion occurred already at the first time point, and in some cases (i.e.,
methanogenic archaea, Ruminococcus champanellensis and Ruminococcus
flavencis) did not recover during the available follow-up. LMM only identified
significant increases in Eubacterium biforme and Collinsella aerofaciens in RHI
individuals and increases in Dorea unclassified and Ruminococcus flavencis in NEG
subjects (Figure 24 B).
Figure 24. Evolution of richness-associated microbial species in RHI vs. NEG
individuals using WGS.
A
B

82
A, Microbial species significantly (p<0.05) associated with microbial gene richness in both study groups.
Color gradient shows Spearman’s correlation Rho values (red is for positive, blue is for negative
correlation). B, Relative abundance of richness-associated bacterial species over time (months 1, 4 and 9).
P-values within each box compare month 1 to 4 area under the curves of RHI vs NEG individuals. Asterisks
show slope values significantly different from 0 in LMM for each bacteria and study group.
Consistent with previous reports (Guillén et al., 2018), subjects with RHI had higher
counts of bacterial antioxidant enzymes including catalase, bacterioferritin, glucose-
6-phosphate dehydrogenase or peroxiredoxin, although this shotgun analysis was
underpowered to identify more granular differences (Figure 25).
Figure 25. Evolution of reactive oxygen species (ROS)-associated enzymes in
recently HIV-1-infected vs. HIV-1-negative subjects.
Relative abundance of ROS-associated enzymes over time (months 1, 4 and 9). P-values within each box
compare month 1 to 4 area under the curves of RHI vs. NEG subjects.

83
5. DISCUSSION
HIV-1 infection and the human gut microbiota richness and diversity
In agreement with previous groups reporting lower richness and diversity values in
association to HIV-1 infection (Mutlu et al., 2014)(McHardy et al., 2013)(Nowak et al.,
2015), results from the MetaHIV-Pheno study showed lower microbial richness and
diversity in HIV-1 infected subjects compared to HIV-1 uninfected controls. More
precisely, we found the lowest values in individuals with an immune-virological
discordant response to ART. Individuals with an immune-virological concordant profile
showed greater bacterial richness and diversity values than the previous although
they did not reach those values from the HIV-1 negative control group. Individuals
initiating ART during the first 6 months of HIV-1 infection, as well as ART-naïve
individuals with ≥500 CD4+ T-cells/mm3, maintained similar bacterial richness and
diversity values compared to the HIV-1 negative. These results support previous
observations linking low bacterial richness with immune dysfunction as well as that
early ART initiation might help to preserve gut microbial richness (Nowak et al., 2015).
The first study analyzing the gut microbiota in association to HIV-1 infection in Mexico
also reported lower microbial richness and diversity in either, long-term EFV- or PI-
treated HIV-1 infected subjects (Pinto-Cardoso et al., 2017). Of note, subjects in this
study started ART when their immune status dropped below <250 CD4+ T-cell counts
thus reinforcing that starting ART before severe immune deterioration might be crucial
to maintain good bacterial richness and diversity. Monaco et al. described in a Sub-
Saharan population that HIV-1 infection was associated with decreased richness and
diversity and with viral-mediated decline of CD4+ T-cells, but not with strong
compositional differences in gut microbiota (Monaco et al., 2016). However, in our
Mozambican study we did not find significant differences in richness and diversity
between groups at baseline. Of note, one of the limitations of the MetaHIV-Acute study
was that its design didn’t include prospectively screening of HIV-1 negative subjects
at risk of becoming HIV-1 infected. Thus, we missed the very early events occurring
between HIV-1 infection and diagnosis, including early variations in microbiota
richness, diversity and/or composition. Nonetheless, we detected significant
increases in bacterial richness and diversity only during the first 6 and 4 months of
follow-up in the RHI and NEG groups. Bearing this temporal limitation in mind, these

84
“increase—plateau” dynamics on microbial richness observed in RHI and NEG groups
could be explained by a return to baseline values after a transient and unobserved
early richness depletion due to an external insult. This hypothesis would then agree
with the results observed by Monaco et al. linking HIV-1 infection to reduced microbial
richness and diversity. In our study, the microbiota richness kinetics in RHI individuals
mirrored that of CD4+ T-cell counts and were inverse to the HIV-1-RNA kinetics,
reinforcing the idea that our first follow-up sample might come after the initial peak of
viremia typically observed in acute HIV-1 infection. However, the observation of
similar microbiota dynamics in HIV-1-negative individuals suggested that such
changes were not HIV-1-specific. Of note, most HIV-1 negative controls in our study
were seeking medical care due to fever and/or mononucleosis-like symptoms when
they were recruited into the study, and this possibly affected microbial richness as
well other authors have previously reported (Xu et al., 2018).
The Bacteroides – Prevotella dominance in the human gut microbiota
Bacteroides to Prevotella shift in HIV-1 infection was not observed in any of our study
cohorts. The MetaHIV-Pheno study showed that the Prevotella- and Bacteroides-
dominated gut microbiota enterotypes were not linked to HIV-1 immune status but to
sexual orientation (MSM vs non-MSM). Compared to non-MSM individuals, MSM
individuals consistently harbored richer and more diverse microbial communities
clearly dominated by genus Prevotella. This was, to our knowledge, the first evidence
that sexual preference might have an impact on the gut microbiota composition
(Noguera-Julian et al., 2016). Sexual orientation being a significant driver in the gut
microbiota composition, suggested that results from previous reports describing
Bacteroides to Prevotella replacement following HIV-1 infection (Mutlu et al.,
2014)(Lozupone et al., 2013)(Dillon et al., 2014)(Vujkovic-Cvijin et al.,
2013)(Vázquez-Castellanos et al., 2014), might be explained by enrichment of HIV-1
infected groups by MSM individuals related to HIV-1 negative control groups whose
participants were mainly recruited from hospital research staff or college students and
did not account for MSM factor. Since our findings in 2016, MSM-Prevotella
association has been further supported by more recent publications (Armstrong et al.,
2018)(Neff et al., 2018)(Kelley et al., 2017). Aiming to characterize the rectal mucosa
immune environment and the microbiota composition in MSM individuals engaging in

85
condomless receptive anal intercourse (CRAI), Kelley et al. reported a distinct
mucosal phenotype after unprotected anal intercourse including higher levels of
mucosal CD8+ T-cell proliferation, an increased pro-inflammatory cytokine production
including TNFα and IFNγ, a distinct gut microbiota composition enriched for
Prevotellaceae family members and a significantly higher expression of genes
associated with cell proliferation, mucosal injury and repair, and neutrophil and Th17
cell activity (Kelley et al., 2017). Beyond enrichment of Prevotella, they also described
enrichment of microbial metabolic pathways linked to arachidonic acid, a known
intermediate of inflammatory responses. Interestingly, they hypothesized that
dysbiosis linked to CRAI might involve increases in species able to metabolize
products derived from mucosal injury. In April 2018, Neff et al. published interesting
results on whether a gut microbiota with particularly pro-inflammatory bacteria,
regardless of microbial translocation, was sufficient to drive high immune activation in
individuals with HIV-1, including both MSM and non-MSM (Neff et al., 2018). They
confirmed enrichment of Prevotella in the gut microbiota from MSM individuals
independently of HIV-1 status. Remarkably, they reported that the gut microbiota from
HIV-1 uninfected MSM individuals induced higher activation of monocytes compared
to that from HIV-1 uninfected non-MSM subjects, suggesting that a MSM-associated
gut microbiota might be pro-inflammatory itself, regardless of HIV-1 infection. These
results agreed with previous reports where high levels of LPS in plasma of HIV-1
uninfected MSM individuals correlated with markers of innate immune activation
including TNFα, IP10 and MCP-1 (Palmer et al., 2014). Meanwhile Prevotella has
been linked to immune activation in diverse ex vivo studies (Vázquez-Castellanos et
al., 2014)(Dillon et al., 2016b); members of the Bacteroides have reported anti-
inflammatory properties through their stimulation of iNKT in the GALT which, in turn,
increase secretion of IL-4 and IL-10 cytokines and are linked to less microbial
translocation (Paquin-Proulx et al., 2017). Nonetheless, in our BCN0 cohort we did
not find significant differences in immune activation, inflammation and/or microbial
translocation between Bacteroides-rich and Prevotella-rich gut bacterial communities.
The MetaHIV-Acute study was performed in a Prevotella-rich African population and
we did not collect information on same-sex relationships from our Mozambican
subjects. In addition, there is extensive data showing Prevotella predominance in

86
African populations (Ou et al., 2013)(De Filippo et al., 2010), so the effect of same-
sex intercourse on the gut microbiota would have been hard to discern in this study.
Taxonomic changes on the gut microbiota composition linked to HVI-1 infection
Although we did not observe an HIV-1-specific gut microbiota composition in our
European study cohorts (BCN and STK), we observed that the gut microbiota from
recently HIV-1 infected Mozambicans experienced transient longitudinal changes
after viral infection. Main changes included reductions in bacterial clusters associated
with TNF-mediated innate immune responses and increases in certain butyrate-
producing bacteria like Odoribacter. In the RHI group, weak reductions in
Enterobacteriaceae family were also detected over the first 6 months of follow-up.
Links between enrichment of Proteobacteria and higher levels of immune activation
and inflammation have been reported both in vitro (Dillon et al., 2014) and in vivo in
chronic HIV-1 infected individuals (Dinh et al., 2015)(Vujkovic-Cvijin et al., 2013)(Yang
et al., 2016) and in NHPM with acute SIV infection (Glavan et al., 2016). This
observation agreed with the abovementioned hypothesis that we started our follow-
up in Mozambique when subject’s gut microbiota was returning to baseline values
after a transient dysbiosis. Again, such dynamics were not clear enough to be
considered HIV-1-specific when also assessed in the NEG group.
The only statistically significant association between the gut microbiota and HIV-1
infection in our sub-Saharan study population was a reduction in Akkermansia,
Anaerovibrio, Bifidobacterium, and Clostridium in CHI_noART individuals compared
to NEG individuals. Previous reports already reported depletions in Bifidobacterium,
and Clostridium in HIV-1 infected subjects (McHardy et al., 2013)(Dillon et al.,
2014)(Vujkovic-Cvijin et al., 2013) so our observations support the hypothesis that
reductions in these genera could contribute to chronic inflammation commonly
observed in HIV-1-infected subjects. Akkermansia has a key role in human fat and
sugar metabolism (Schneeberger et al., 2015) and promotes CD8+ T-cell-mediated
immune responses to anti-cancer immune modulators like PD-1 and CTLA-4 agonists
(Routy et al., 2018). Defects in Akkermansia might thus be related to the HIV-1-
associated metabolic disorders as well as to CD8+ T-cell exhaustion. In our study,
Akkermansia and Clostridiaceae abundance was negatively correlated with markers

87
of microbial translocation (sCD14), inflammation (IP10) and gut damage (fecal
calprotectin). Interestingly, ART initiation was not associated with improved
abundance of such microbes. Pinto-Cardoso et al. also reported lower relative
abundance of key bacterial players in maintaining gut homeostasis in HIV-1-infected
individuals on long-term ART compared to HIV-1 uninfected controls (Pinto-Cardoso
et al., 2017). Their commensal-bacteria depletion was led by Faecalibacterium
prausnitzii although correlation with other members of order Clostridiales such as
family Ruminococcaceae were also reported. Significantly, relative abundance of
such bacteria were negatively correlated to IFABP which is released into circulation
after mucosal tissue damage (Funaoka et al., 2010). Nonetheless they did not find
correlation between any individual taxa and sCD14, CD4+ and CD8+ T-cell activation,
D-dimer or high sensitivity CRP protein. Limited by our MetaHIV-Acute study follow-
up, we could not properly assess dynamics on these bacterial genera after acute HIV-
1 infection, so we couldn’t describe the exact timing of their depletion. Similarly, it
would have been interesting to assess changes in their relative abundance in immune-
deteriorated subjects initiating ART. In our European cross-sectional dataset, plasma
levels markers of enterocyte damage, microbial translocation and systemic
inflammation followed an overall predictable response across the different HIV-1
phenotypes tested with the highest levels corresponding to individuals with an
immune-virological discordant profile and the late-presenters (Noguera-Julian et al.,
2016). We found slight positive correlations between viral load and IL-6 (Spearman’s
rho=0.26, p-value=0.002) and IP10 (Spearman’s rho=0.21, p=value=0.015), and
negative correlations between CD4+ T-cell counts and IL-6 (Spearman’s rho=-0.19,
p=value=0.026) and LBP (Spearman’s rho=-0.23, p=value=0.0086). Nowak et al.
reported that the gut microbiota composition might be linked to HIV-1 viral load since
HIV-1 infected subjects with an elite controller phenotype (i.e. immune competent
individuals with suppressed viral load in absence of ART) had a distinct gut microbiota
that those with a viremic controller phenotype (i.e. immune competent individuals with
viral load <2000 copies/ml in absence of ART) and closer to that of HIV-1 negative
subjects (Nowak et al., 2015).

88
Other factors shaping the human gut microbiota composition
Non-HIV-1 related factors have also been reported to affect the gut microbiota.
Previous studies reported that the gut microbiota bacterial composition was linked to
genetic (Goodrich et al., 2014), environmental and lifestyle factors (Modi et al.,
2014)(Wu et al., 2011)(Clarke et al., 2014)(David et al., 2014). Although some studies
reported that Prevotella was linked to carbohydrate-rich diets and Bacteroides to fat
and animal protein-rich diets (Wu et al., 2011), this was not observed in our BCN0
cohort, as we found diet as having a marginal effect on the gut microbiota composition
(Noguera-Julian et al., 2016). But, we should mention that extreme diets were
excluded in our BCN0 cohort since exclusion criteria included any gross dietary
deviation from a regular diet or any specific regular diet such as vegetarian and low-
carb. Still, Pinto-Cardoso et al. also reported no correlation between gut microbiota
composition and dietary measurements in their Mexican cohort, thus reinforcing the
hypothesis that other factors beyond diet might be driving gut microbiota overall
composition (Pinto-Cardoso et al., 2017).
Since the original aim of the MetaHIV-Pheno study was not to elucidate the
mechanisms influencing the gut microbiota composition in relation to sexual
orientation, there are other many potential factors that were not studied such as if
enrichment of Prevotella in MSM is comparable to heterosexual women engaging
receptive anal intercourse, its influence on transmission of HIV-1 and/or the existence
of person-to-person transmission of commensal bacteria.
Changes on the gut viral communities in relation to HIV-1 infection
Importantly, beyond bacterial changes in the gut microbiota, our Mozambican cohort
showed increased Adenovirus fecal shedding in all HIV-1 infected groups compared
to the NEG control group. This result is consistent with previous studies in NHPM
where SIV infection was associated with expansion of the enteric virome with minimal
changes in the bacteriome (Handley et al., 2012)(Handley et al., 2016). Using RT-
PCR we observed that fecal Adenovirus shedding was detectable not only in more
than half of RHI subjects, but also in subjects with chronic HIV-1 infection, regardless
of ART-administration. These results are interesting because: 1) this Adenovirus
expansion seems to occur already in hyper-acute phases of HIV-1 infection, and 2) it
is persistent in ART-treated subjects with good CD4+ T-cell recovery and undetectable

89
HIV-1 viral load. Similar findings were reported in Ugandan subjects infected by HIV-
1, where an Adenovirus-dominated viral expansion was linked to CD4+ T-cell counts
below 200 cells/mm3 (Monaco et al., 2016). Contrary to Adenovirus, fecal
Cytomegalovirus and Enterovirus shedding was mostly observed in CHI_noART
individuals, suggesting that their expansion in the human gut and fecal shedding might
require more prolonged immune dysregulation. Of note, we did not detect any of the
tested Human Herpesvirus in our Mozambican dataset so its link to human gut
microbiota could not be assessed. Precise role of bacteriophage gut communities in
HIV-1 infection is still unclear. So far, Monaco et al. did not find a link between phage
richness and diversity and CD4+ T-cell counts, HIV-1 infection, type of ART or
bacterial richness and diversity (Monaco et al., 2016). Our RT-PCR based virome
approach was not intended to detect nor quantify bacteriophages in our fecal samples,
so their role could not be discussed in our studies.
Gut microbiota gene richness and changes on its functional potential in HIV-1 infection
More sensitive WGS analysis on the MetaHIV-Acute study showed that RHI
individuals had lower bacterial gene richness compared to the NEG controls. This
observation agreed with other studies linking low gene richness to gut-associated
alterations (Le Chatelier et al., 2013)(Guillén et al., 2018). Even though this reduction
in gene richness would occur alongside the hypothetic reduction in bacterial
taxonomic richness and diversity before first sampling at month 1, their evolution over
time seemed to differ. While we detected significant longitudinal increases in bacterial
richness and taxonomy in both RHI and NEG individuals over follow-up, reductions in
gene richness seemed to resolve earlier in NEG than in RHI. This difference in
evolution between groups, might be explained by a chronicity-effect linked to HIV-1
infection that was absent in the external non-HIV-1 perturbations from NEG group.
Most bacterial species that were positively correlated to bacterial gene richness were
depleted in RHI individuals compared NEG individuals, both, at month 1 and over the
first 4 months of follow-up. Significantly, species depleted in RHI have been already
reported to be linked to HIV-1 infection and to RNS/ROS-oxidative responses to
external insults in previous European cohorts (Guillén et al., 2018).

90
To summarize, our study in Barcelona and Stockholm showed a strong association
between fecal microbiota composition and sexual orientation and that HIV-1 infection
was only linked to reduced gut microbiota richness and diversity. The mechanisms
behind the Prevotella-enriched gut bacterial communities in MSM individuals have not
been elucidated yet and are beyond the scope of this thesis. Thus, complete
assessments on socioeconomic status as well as complete and detailed assessment
of sexual practices are needed to understand the role of sexual orientation on the gut
microbial communities. Results from our Mozambican study led to hypothesize that
HIV-1 infection might negatively impact the gut microbiota in hyper-acute phases of
the infection (i.e. at least before the first month after diagnosis) and that the HIV-1
signature does not appear until chronic phases of the infection. Additionally,
observation of fecal viral shedding in HIV-1 infected subjects, already in recent
infection, highlighted the importance of studying other microbial communities beyond
bacteria in the loss of gut homeostasis.

91
6. CONCLUSIONS
1. The fecal microbiota of gay men in two European cohorts from Barcelona and
Stockholm was richer and more diverse and had a Prevotella-enriched bacterial
composition compared to heterosexual individuals.
2. Some factor associated with sexual orientation was an important confounding
factor in HIV-1 - gut microbiome studies.
3. HIV-1 infection was significantly and independently associated to lower
bacterial richness and diversity in European cohorts, more so in subjects with
an immune-virological discordant phenotype.
4. Recent HIV-1 infection in Mozambique was followed by increased fecal
Adenovirus shedding and by transient, non-HIV-1 specific, changes in the gut
bacteriome.
5. An HIV-1 specific signature previously associated with chronic inflammation,
CD8+ T-cell anergy and metabolic disorders including depletion of
Akkermansia, Anaerovibrio, Bifidobacterium, and Clostridium was observed in
the gut microbiota of chronically HIV-1 infected subjects in Mozambique.

92

93
7. REFERENCES
Almeida, C.-A.M., Price, P., and French, M. a H. (2002). Immune activation in patients
infected with HIV type 1 and maintaining suppression of viral replication by
highly active antiretroviral therapy. AIDS Res. Hum. Retroviruses 18, 1351–
1355.
Amit Roy, S.R. (2014). Molecular Markers in Phylogenetic Studies-A Review. J.
Phylogenetics Evol. Biol.
Ancuta, P., Kamat, A., Kunstman, K.J., Kim, E.Y., Autissier, P., Wurcel, A., Zaman,
T., Stone, D., Mefford, M., Morgello, S., et al. (2008). Microbial translocation is
associated with increased monocyte activation and dementia in AIDS patients.
PLoS One 3.
Andrews, S. (2010). FastQC: A quality control tool for high throughput sequence data.
Armstrong, A.J., Shaffer, M., Nusbacher, N.M., Griesmer, C., Fiorillo, S., Schneider,
J.M., Neff, C.P., Li, S.X., Fontenot, A.P., Campbell, T., et al. (2018). An
exploration of Prevotella-rich microbiomes in HIV and men who have sex with
men. bioRxiv 424291.
Arts, E.J., and Hazuda, D.J. (2012). HIV-1 antiretroviral drug therapy. Cold Spring
Harb. Perspect. Med. 2.
Arumugam, M., Raes, J., Pelletier, E., Le Paslier, D., Yamada, T., Mende, D.R.,
Fernandes, G.R., Tap, J., Bruls, T., Batto, J.M., et al. (2011). Enterotypes of
the human gut microbiome. Nature 473, 174–180.
Aßhauer, K.P., Wemheuer, B., Daniel, R., and Meinicke, P. (2015). Tax4Fun:
Predicting functional profiles from metagenomic 16S rRNA data. Bioinformatics
31, 2882–2884.
Bäckhed, F., Ley, R.E., Sonnenburg, J.L., Peterson, D.A., and Gordon, J.I. (2005).
Host-bacterial mutualism in the human intestine. Science (80-. ).
Balagopal, A., Ray, S.C., De Oca, R.M., Sutcliffe, C.G., Vivekanandan, P., Higgins,
Y., Mehta, S.H., Moore, R.D., Sulkowski, M.S., Thomas, D.L., et al. (2009).
Kupffer cells are depleted with HIV immunodeficiency and partially recovered
with antiretroviral immune reconstitution. AIDS 23, 2397–2404.

94
Balmer, M.L., Slack, E., De Gottardi, A., Lawson, M.A.E., Hapfelmeier, S., Miele, L.,
Grieco, A., Van Vlierberghe, H., Fahrner, R., Patuto, N., et al. (2014). The liver
may act as a firewall mediating mutualism between the host and its gut
commensal microbiota. Sci. Transl. Med. 6.
Barre-Sinoussi, F., J. C. Chermann, E. Al (1983). Isolation of a T-lymphotropic
retrovirus from a patient at risk for acquired immune deficiency syndrome
(AIDS). Science (80-. ). 220(4599), 868–871.
Belizário, J.E., and Napolitano, M. (2015). Human microbiomes and their roles in
dysbiosis, common diseases, and novel therapeutic approaches. Front.
Microbiol. 6.
Bolger, A.M., Lohse, M., and Usadel, B. (2014). Trimmomatic: A flexible trimmer for
Illumina sequence data. Bioinformatics 30, 2114–2120.
Brenchley, J.M., Price, D. a, Schacker, T.W., Asher, T.E., Silvestri, G., Rao, S.,
Kazzaz, Z., Bornstein, E., Lambotte, O., Altmann, D., et al. (2006). Microbial
translocation is a cause of systemic immune activation in chronic HIV infection.
Nat. Med. 12, 1365–1371.
Brenchley, J.M., Paiardini, M., Knox, K.S., Asher, A.I., Cervasi, B., Asher, T.E.,
Scheinberg, P., Price, D.A., Hage, C.A., Kholi, L.M., et al. (2008). Differential
Th17 CD4 T-cell depletion in pathogenic and nonpathogenic lentiviral
infections. Blood 112, 2826–2835.
Caporaso, J.G., Kuczynski, J., Stombaugh, J., Bittinger, K., Bushman, F.D., Costello,
E.K., Fierer, N., Peña, A.G., Goodrich, J.K., Gordon, J.I., et al. (2010). QIIME
allows analysis of high-throughput community sequencing data. Nat. Methods
7, 335–336.
Caricilli, A.M. (2014). Intestinal barrier: A gentlemen’s agreement between microbiota
and immunity. World J. Gastrointest. Pathophysiol. 5, 18.
Casadevall, A., and Pirofski, L.A. (2000). Host-pathogen interactions: Basic concepts
of microbial commensalism, colonization, infection, and disease. Infect. Immun.
68, 6511–6518.

95
Cassol, E., Malfeld, S., Mahasha, P., van der Merwe, S., Cassol, S., Seebregts, C.,
Alfano, M., Poli, G., and Rossouw, T. (2010). Persistent Microbial Translocation
and Immune Activation in HIV‐1–Infected South Africans Receiving
Combination Antiretroviral Therapy. J. Infect. Dis. 202, 723–733.
CDC (1981). Pneumocystis Pneumonia – Los Angeles. MMWR. Morb. Mortal. Wkly.
Rep.
Le Chatelier, E., Nielsen, T., Qin, J., Prifti, E., Hildebrand, F., Falony, G., Almeida, M.,
Arumugam, M., Batto, J.-M., Kennedy, S., et al. (2013). Richness of human gut
microbiome correlates with metabolic markers. Nature 500, 541–546.
Chen, J., and Li, H. (2013). Variable selection for sparse Dirichlet-multinomial
regression with an application to microbiome data analysis. Ann. Appl. Stat. 7,
418–442.
Chen, L., Zheng, D., Liu, B., Yang, J., and Jin, Q. (2016). VFDB 2016: Hierarchical
and refined dataset for big data analysis - 10 years on. Nucleic Acids Res. 44,
D694–D697.
Cheroutre, H., and Madakamutil, L. (2004). Acquired and natural memory T cells join
forces at the mucosal front line. Nat. Rev. Immunol. 4, 290–300.
Christensen, G.J.M., and Brüggemann, H. (2014). Bacterial skin commensals and
their role as host guardians. Benef. Microbes 5, 201–215.
Clarke, S.F., Murphy, E.F., O’Sullivan, O., Lucey, A.J., Humphreys, M., Hogan, A.,
Hayes, P., O’Reilly, M., Jeffery, I.B., Wood-Martin, R., et al. (2014). Exercise
and associated dietary extremes impact on gut microbial diversity. Gut 63,
1913–1920.
Clarke, T.B., Davis, K.M., Lysenko, E.S., Zhou, A.Y., Yu, Y., and Weiser, J.N. (2010).
Recognition of peptidoglycan from the microbiota by Nod1 enhances systemic
innate immunity. Nat. Med. 16, 228–231.
Clemente, J.C., Ursell, L.K., Parfrey, L.W., and Knight, R. (2012). The impact of the
gut microbiota on human health: An integrative view. Cell 148, 1258–1270.
Clooney, A.G., Fouhy, F., Sleator, R.D., O’Driscoll, A., Stanton, C., Cotter, P.D., and
Claesson, M.J. (2016). Comparing apples and oranges?: Next generation
sequencing and its impact on microbiome analysis. PLoS One.

96
Coll, J., Videla, S., Leon, A., Ornelas, A., García, F., Fernández, E., Blanco, J.L.,
Carrillo, A., Bravo, I., Meulbroek, M., et al. (2017). Early detection of HIV
infection and of asymptomatic sexually transmitted infections among men who
have sex with men. Clin. Microbiol. Infect.
Craciun, S., and Balskus, E.P. (2012). Microbial conversion of choline to
trimethylamine requires a glycyl radical enzyme. Proc. Natl. Acad. Sci. 109,
21307–21312.
David, L.A., Maurice, C.F., Carmody, R.N., Gootenberg, D.B., Button, J.E., Wolfe,
B.E., Ling, A. V., Devlin, A.S., Varma, Y., Fischbach, M.A., et al. (2014). Diet
rapidly and reproducibly alters the human gut microbiome. Nature 505, 559–
563.
DeSantis, T.Z., Hugenholtz, P., Larsen, N., Rojas, M., Brodie, E.L., Keller, K., Huber,
T., Dalevi, D., Hu, P., and Andersen, G.L. (2006). Greengenes, a chimera-
checked 16S rRNA gene database and workbench compatible with ARB. Appl.
Environ. Microbiol. 72, 5069–5072.
Dillon, S.M., Lee, E.J., Kotter, C. V, Austin, G.L., Dong, Z., Hecht, D.K., Gianella, S.,
Siewe, B., Smith, D.M., Landay, A.L., et al. (2014). An altered intestinal mucosal
microbiome in HIV-1 infection is associated with mucosal and systemic immune
activation and endotoxemia. Mucosal Immunol. 7, 983–994.
Dillon, S.M., Lee, E.J., Donovan, A.M., Guo, K., Harper, M.S., Frank, D.N., McCarter,
M.D., Santiago, M.L., and Wilson, C.C. (2016a). Enhancement of HIV-1
infection and intestinal CD4+ T cell depletion ex vivo by gut microbes altered
during chronic HIV-1 infection. Retrovirology 13.
Dillon, S.M., Lee, E.J., Kotter, C. V, Austin, G.L., Gianella, S., Siewe, B., Smith, D.M.,
Landay, A.L., McManus, M.C., Robertson, C.E., et al. (2016b). Gut dendritic
cell activation links an altered colonic microbiome to mucosal and systemic T-
cell activation in untreated HIV-1 infection. Mucosal Immunol. 9, 24–37.
Dinh, D.M., Volpe, G.E., Duffalo, C., Bhalchandra, S., Tai, A.K., Kane, A. V, Wanke,
C.A., and Ward, H.D. (2015). Intestinal microbiota, microbial translocation, and
systemic inflammation in chronic HIV infection. J. Infect. Dis. 211, 19–27.

97
Eckburg, P.B., Bik, E.M., Bernstein, C.N., Purdom, E., Dethlefsen, L., Sargent, M.,
Gill, S.R., Nelson, K.E., and Relman, D.A. (2005). Diversity of the human
intestinal microbial flora. Science 308, 1635–1638.
Edgar, R.C. (2010). Search and clustering orders of magnitude faster than BLAST.
Bioinformatics 26, 2460–2461.
Edgar, R.C. (2013). UPARSE: Highly accurate OTU sequences from microbial
amplicon reads. Nat. Methods 10, 996–998.
Edgar, R.C., Haas, B.J., Clemente, J.C., Quince, C., and Knight, R. (2011). UCHIME
improves sensitivity and speed of chimera detection. Bioinformatics 27, 2194–
2200.
Ellis, C.L., Ma, Z.-M., Mann, S.K., Li, C.-S., Wu, J., Knight, T.H., Yotter, T., Hayes,
T.L., Maniar, A.H., Troia-Cancio, P. V, et al. (2011). Molecular characterization
of stool microbiota in HIV-infected subjects by panbacterial and order-level 16S
ribosomal DNA (rDNA) quantification and correlations with immune activation.
J. Acquir. Immune Defic. Syndr. 57, 363–370.
Estes, J.D., Harris, L.D., Klatt, N.R., Tabb, B., Pittaluga, S., Paiardini, M., Barclay,
G.R., Smedley, J., Pung, R., Oliveira, K.M., et al. (2010). Damaged intestinal
epithelial integrity linked to microbial translocation in pathogenic simian
immunodeficiency virus infections. PLoS Pathog. 6, 49–50.
Everard, A., Belzer, C., Geurts, L., Ouwerkerk, J.P., Druart, C., Bindels, L.B., Guiot,
Y., Derrien, M., Muccioli, G.G., Delzenne, N.M., et al. (2013). Cross-talk
between Akkermansia muciniphila and intestinal epithelium controls diet-
induced obesity. Proc Natl Acad Sci U S A 110, 9066–9071.
Falkowski, P.G., Fenchel, T., and Delong, E.F. (2008). The microbial engines that
drive earth’s biogeochemical cycles. Science (80-. ). 320, 1034–1039.
De Filippo, C., Cavalieri, D., Di Paola, M., Ramazzotti, M., Poullet, J.B., Massart, S.,
Collini, S., Pieraccini, G., and Lionetti, P. (2010). Impact of diet in shaping gut
microbiota revealed by a comparative study in children from Europe and rural
Africa. Proc. Natl. Acad. Sci. U. S. A. 107, 14691–14696.
Flint, H.J., Scott, K.P., Duncan, S.H., Louis, P., and Forano, E. (2012). Microbial
degradation of complex carbohydrates in the gut. Gut Microbes 3.

98
Fox, G.E., Pechman, K.R., and Woese, C.R. (1977). Comparative Cataloging of 16S
Ribosomal Ribonucleic Acid: Molecular Approach to Procaryotic Systematics.
Int. J. Syst. Bacteriol. 27, 44–57.
Francino, M.P. (2014). Early development of the gut microbiota and immune health.
Pathog. (Basel, Switzerland) 3, 769–790.
Fujigaki, S., Saito, K., Sekikawa, K., Tone, S., Takikawa, O., Fujii, H., Wada, H.,
Noma, A., and Seishima, M. (2001). Lipopolysaccharide induction of
indoleamine 2,3-dioxygenase is mediated dominantly by an IFNg-independent
mechanism. Eur. J. Immunol. 31, 2313–2318.
Funaoka, H., Kanda, T., and Fujii, H. (2010). Intestinal fatty acid-binding protein (I-
FABP) as a new biomarker for intestinal diseases. Rinsho Byori. 58.
Gevers, D., Knight, R., Petrosino, J.F., Huang, K., McGuire, A.L., Birren, B.W.,
Nelson, K.E., White, O., Methé, B.A., and Huttenhower, C. (2012). The Human
Microbiome Project: a community resource for the healthy human microbiome.
PLoS Biol. 10, e1001377.
Gianella, S., Anderson, C.M., Var, S.R., Oliveira, M.F., Lada, S.M., Vargas, M. V,
Massanella, M., Little, S.J., Richman, D.D., Strain, M.C., et al. (2016).
Replication of Human Herpesviruses Is Associated with Higher HIV DNA Levels
during Antiretroviral Therapy Started at Early Phases of HIV Infection. J. Virol.
90, 3944–3952.
Glavan, T.W., Gaulke, C.A., Santos Rocha, C., Sankaran-Walters, S., Hirao, L.A.,
Raffatellu, M., Jiang, G., Bäumler, A.J., Goulart, L.R., and Dandekar, S. (2016).
Gut immune dysfunction through impaired innate pattern recognition receptor
expression and gut microbiota dysbiosis in chronic SIV infection. Mucosal
Immunol. 9, 677–688.
Goodrich, J.K., Waters, J.L., Poole, A.C., Sutter, J.L., Koren, O., Blekhman, R.,
Beaumont, M., Van Treuren, W., Knight, R., Bell, J.T., et al. (2014). Human
genetics shape the gut microbiome. Cell 159, 789–799.
Gower, J.C. (1975). Generalized procrustes analysis. Psychometrika 40, 33–51.

99
Guadalupe, M., Reay, E., Sankaran, S., Prindiville, T., Flamm, J., McNeil, A., and
Dandekar, S. (2003). Severe CD4+ T-cell depletion in gut lymphoid tissue
during primary human immunodeficiency virus type 1 infection and substantial
delay in restoration following highly active antiretroviral therapy. J. Virol. 77,
11708–11717.
Guglani, L., and Khader, S.A. (2010). Th17 cytokines in mucosal immunity and
inflammation. Curr. Opin. HIV AIDS 5, 120–127.
Guillén, Y., Noguera-Julian, M., Rivera, J., Casadella, M., Zevin, A.S., Rocafort, M.,
Parera, M., Rodríguez, C., Arumí, M., Carrillo, J., et al. (2018). Low nadir CD4+
T-cell counts predict gut dysbiosis in HIV-1 infection. Mucosal Immunol.
Haas, B.J., Gevers, D., Earl, A.M., Feldgarden, M., Ward, D. V., Giannoukos, G.,
Ciulla, D., Tabbaa, D., Highlander, S.K., Sodergren, E., et al. (2011). Chimeric
16S rRNA sequence formation and detection in Sanger and 454-
pyrosequenced PCR amplicons. Genome Res. 21, 494–504.
Hamer, H.M., Jonkers, D., Venema, K., Vanhoutvin, S., Troost, F.J., and Brummer,
R.J. (2008). Review article: The role of butyrate on colonic function. Aliment.
Pharmacol. Ther. 27, 104–119.
Handley, S.A., Thackray, L.B., Zhao, G., Presti, R., Miller, A.D., Droit, L., Abbink, P.,
Maxfield, L.F., Kambal, A., Duan, E., et al. (2012). Pathogenic simian
immunodeficiency virus infection is associated with expansion of the enteric
virome. Cell 151, 253–266.
Handley, S.A., Desai, C., Zhao, G., Droit, L., Monaco, C.L., Schroeder, A.C., Nkolola,
J.P., Norman, M.E., Miller, A.D., Wang, D., et al. (2016). SIV Infection-Mediated
Changes in Gastrointestinal Bacterial Microbiome and Virome Are Associated
with Immunodeficiency and Prevented by Vaccination. Cell Host Microbe 19,
323–335.
Hildebrand, F., Tito, R.Y., Voigt, A.Y., Bork, P., and Raes, J. (2014). Correction to:
LotuS: An efficient and user-friendly OTU processing pipeline [Microbiome, 2,
(2014), 30]. Microbiome 2.
Hofer, U., and Speck, R.F. (2009). Disturbance of the gut-associated lymphoid tissue
is associated with disease progression in chronic HIV infection. Semin.
Immunopathol. 31, 257–266.
100
Huengsberg, M., Winer, J.B., Compels, M., Round, R., Ross, J., and Shahmanesh,
M. (1998). Serum kynurenine-to-tryptophan ratio increases with progressive
disease in HIV-infected patients. Clin. Chem. 44, 858–862.
Iwai, S., Weinmaier, T., Schmidt, B.L., Albertson, D.G., Poloso, N.J., Dabbagh, K.,
and DeSantis, T.Z. (2016). Piphillin: Improved prediction of metagenomic
content by direct inference from human microbiomes. PLoS One 11.
Jackson, D.A. (1995). PROTEST: A PROcrustean Randomization TEST of
community environment concordance. Écoscience 2, 297–303.
Jiang, W., Lederman, M.M., Hunt, P., Sieg, S.F., Haley, K., Rodriguez, B., Landay,
A., Martin, J., Sinclair, E., Asher, A.I., et al. (2009). Plasma Levels of Bacterial
DNA Correlate with Immune Activation and the Magnitude of Immune
Restoration in Persons with Antiretroviral‐Treated HIV Infection. J. Infect. Dis.
199, 1177–1185.
Joint United Nations Programme on HIV/AIDS (UNAIDS) (2017). UNAIDS DATA.
Kaakoush, N.O. (2015). Insights into the Role of Erysipelotrichaceae in the Human
Host. Front. Cell. Infect. Microbiol. 5.
Katz, J.B., Muller, A.J., and Prendergast, G.C. (2008). Indoleamine 2,3-dioxygenase
in T-cell tolerance and tumoral immune escape. Immunol. Rev. 222, 206–221.
Kayama, H., and Takeda, K. (2015). Functions of innate immune cells and commensal
bacteria in gut homeostasis. J. Biochem. 159, 141–149.
Kchouk, M., Gibrat, J.-F., and Elloumi, M. (2018). Generations of Sequencing
Technologies: From First to Next Generation.
Kelley, C.F., Kraft, C.S., De Man, T.J.B., Duphare, C., Lee, H.W., Yang, J., Easley,
K.A., Tharp, G.K., Mulligan, M.J., Sullivan, P.S., et al. (2017). The rectal
mucosa and condomless receptive anal intercourse in HIV-negative MSM:
Implications for HIV transmission and prevention. Mucosal Immunol. 10, 996–
1007.
Kindt, R. (2016). Package “ BiodiversityR .” R Proj. 153.
Klase, Z., Ortiz, A., Deleage, C., Mudd, J.C., Quiñones, M., Schwartzman, E., Klatt,
N.R., Canary, L., Estes, J.D., and Brenchley, J.M. (2015). Dysbiotic Bacteria
Translocate in Progressive SIV Infection. Mucosal Immunol. 8, 1009–1020.

101
Kõljalg, U., Nilsson, R.H., Abarenkov, K., Tedersoo, L., Taylor, A.F.S., Bahram, M.,
Bates, S.T., Bruns, T.D., Bengtsson-Palme, J., Callaghan, T.M., et al. (2013).
Towards a unified paradigm for sequence-based identification of fungi. Mol.
Ecol. 22, 5271–5277.
Koren, O., Knights, D., Gonzalez, A., Waldron, L., Segata, N., Knight, R.,
Huttenhower, C., and Ley, R.E. (2013). A Guide to Enterotypes across the
Human Body: Meta-Analysis of Microbial Community Structures in Human
Microbiome Datasets. PLoS Comput. Biol. 9.
Kotler, D.P., Gaetz, H.P., Lange, M., Klein, E.B., and Holt, P.R. (1984). Enteropathy
associated with the acquired immunodeficiency syndrome. Ann Intern Med 101,
421–428.
Kriss, M., Hazleton, K.Z., Nusbacher, N.M., Martin, C.G., and Lozupone, C.A. (2018).
Low diversity gut microbiota dysbiosis: drivers, functional implications and
recovery. Curr. Opin. Microbiol. 44, 34–40.
Kultima, J.R., Sunagawa, S., Li, J., Chen, W., Chen, H., Mende, D.R., Arumugam, M.,
Pan, Q., Liu, B., Qin, J., et al. (2012). MOCAT: A Metagenomics Assembly and
Gene Prediction Toolkit. PLoS One 7.
Kumar, P.S., Griffen, A.L., Barton, J.A., Paster, B.J., Moeschberger, M.L., and Leys,
E.J. (2003). New Bacterial Species Associated with Chronic Periodontitis. J.
Dent. Res. 82, 338–344.
Langille, M., Zaneveld, J., Caporaso, J.G., McDonald, D., Knights, D., Reyes, J.,
Clemente, J., Burkepile, D., Vega Thurber, R., Knight, R., et al. (2013).
Predictive functional profiling of microbial communities using 16S rRNA marker
gene sequences. Nat. Biotechnol. 31, 814–821.
Langmead, B., Salzberg, S.L., and Langmead (2013). Bowtie2. Nat. Methods 9, 357–
359.
LeBlanc, J.G., Milani, C., de Giori, G.S., Sesma, F., van Sinderen, D., and Ventura,
M. (2013). Bacteria as vitamin suppliers to their host: A gut microbiota
perspective. Curr. Opin. Biotechnol. 24, 160–168.
Lefrançois, L., and Puddington, L. (2006). Intestinal and pulmonary mucosal T cells:
Local Heroes Fight to Maintain the Status Quo. Annu. Rev. Immunol. 24, 681–
704.

102
Li, J., Jia, H., Cai, X., Zhong, H., Feng, Q., Sunagawa, S., Arumugam, M., Kultima,
J.R., Prifti, E., Nielsen, T., et al. (2014). An integrated catalog of reference
genes in the human gut microbiome. Nat. Biotechnol. 32, 834–841.
Li, L., Deng, X., Linsuwanon, P., Bangsberg, D., Bwana, M.B., Hunt, P., Martin, J.N.,
Deeks, S.G., and Delwart, E. (2013). AIDS Alters the Commensal Plasma
Virome. J. Virol. 87, 10912–10915.
Lim, E.S., Zhou, Y., Zhao, G., Bauer, I.K., Droit, L., Ndao, I.M., Warner, B.B., Tarr,
P.I., Wang, D., and Holtz, L.R. (2015). Early life dynamics of the human gut
virome and bacterial microbiome in infants. Nat. Med. 21, 1228–1234.
Liu, B., and Pop, M. (2009). ARDB - Antibiotic resistance genes database. Nucleic
Acids Res. 37.
Loman, N.J., and Pallen, M.J. (2015). Twenty years of bacterial genome sequencing.
Nat. Rev. Microbiol.
Lozupone, C., Lladser, M.E., Knights, D., Stombaugh, J., and Knight, R. (2011).
UniFrac: An effective distance metric for microbial community comparison.
ISME J. 5, 169–172.
Lozupone, C.A., Li, M., Campbell, T.B., Flores, S.C., Linderman, D., Gebert, M.J.,
Knight, R., Fontenot, A.P., and Palmer, B.E. (2013). Alterations in the gut
microbiota associated with HIV-1 infection. Cell Host Microbe 14, 329–339.
Lu, X., Li, Z., Li, Q., Jiao, Y., Ji, Y., Zhang, H., Liu, Z., Li, W., and Wu, H. (2016).
Preferential loss of gut-homing α4β7 CD4 + T cells and their circulating
functional subsets in acute HIV-1 infection. Cell. Mol. Immunol. 13, 776–784.
Lucke, K., Miehlke, S., Jacobs, E., and Schuppler, M. (2006). Prevalence of
Bacteroides and Prevotella spp. in ulcerative colitis. J. Med. Microbiol. 55, 617–
624.
Maechler, M., Struyf, A., Hubert, M., Hornik, K., Studer, M., and Roudier, P. (2015).
Package “ cluster .” R Top. Doc. 79.
Maloy, K.J., and Kullberg, M.C. (2008). IL-23 and Th17 cytokines in intestinal
homeostasis. Mucosal Immunol. 1, 339–349.
Martinez-Picado, J., and Deeks, S.G. (2016). Persistent HIV-1 replication during
antiretroviral therapy. Curr. Opin. HIV AIDS 11, 417–423.

103
McHardy, I.H., Li, X., Tong, M., Ruegger, P., Jacobs, J., Borneman, J., Anton, P., and
Braun, J. (2013). HIV Infection is associated with compositional and functional
shifts in the rectal mucosal microbiota. Microbiome 1, 26.
McKenna, P., Hoffmann, C., Minkah, N., Aye, P.P., Lackner, A., Liu, Z., Lozupone,
C.A., Hamady, M., Knight, R., and Bushman, F.D. (2008). The macaque gut
microbiome in health, lentiviral infection, and chronic enterocolitis. PLoS
Pathog. 4.
McMurdie, P.J., and Holmes, S. (2013). Phyloseq: An R Package for Reproducible
Interactive Analysis and Graphics of Microbiome Census Data. PLoS One 8.
McMurdie, P.J., and Holmes, S. (2014). Waste Not, Want Not: Why Rarefying
Microbiome Data Is Inadmissible. PLoS Comput. Biol. 10.
Mehandru, S., Poles, M. a, Tenner-Racz, K., Manuelli, V., Jean-Pierre, P., Lopez, P.,
Shet, A., Low, A., Mohri, H., Boden, D., et al. (2007). Mechanisms of
gastrointestinal CD4+ T-cell depletion during acute and early human
immunodeficiency virus type 1 infection. J. Virol. 81, 599–612.
Meier-Kolthoff, J.P., Klenk, H.P., and Göker, M. (2014). Taxonomic use of DNA G+C
content and DNA-DNA hybridization in the genomic age. Int. J. Syst. Evol.
Microbiol.
Meisel, J.S., and Grice, E.A. (2017). The Human Microbiome. In Genomic and
Precision Medicine, (Elsevier), pp. 63–77.
Meulbroek, M., Ditzel, E., Saz, J., Taboada, H., Pérez, F., Pérez, A., Carrillo, A., Font,
G., Marazzi, G., Uya, J., et al. (2013). BCN Checkpoint, a community-based
centre for men who have sex with men in Barcelona, Catalonia, Spain, shows
high efficiency in HIV detection and linkage to care. HIV Med. 14, 25–28.
Min, B., and Logan, B.E. (2004). Continuous Electricity Generation from Domestic
Wastewater and Organic Substrates in a Flat Plate Microbial Fuel Cell. Environ.
Sci. Technol.
Minot, S., Sinha, R., Chen, J., Li, H., Keilbaugh, S.A., Wu, G.D., Lewis, J.D., and
Bushman, F.D. (2011). The human gut virome: Inter-individual variation and
dynamic response to diet. Genome Res. 21, 1616–1625.
Modi, S.R., Collins, J.J., and Relman, D.A. (2014). Antibiotics and the gut microbiota.
J. Clin. Invest. 124, 4212–4218.

104
Moeller, A.H., Shilts, M., Li, Y., Rudicell, R.S., Lonsdorf, E. V., Pusey, A.E., Wilson,
M.L., Hahn, B.H., and Ochman, H. (2013). Siv-induced instability of the
chimpanzee gut microbiome. Cell Host Microbe 14, 340–345.
Moeller, A.H., Peeters, M., Ayouba, A., Ngole, E.M., Esteban, A., Hahn, B.H., and
Ochman, H. (2015). Stability of the gorilla microbiome despite simian
immunodeficiency virus infection. Mol. Ecol. 24, 690–697.
Monaco, C.L., Gootenberg, D.B., Zhao, G., Handley, S.A., Ghebremichael, M.S., Lim,
E.S., Lankowski, A., Baldridge, M.T., Wilen, C.B., Flagg, M., et al. (2016).
Altered Virome and Bacterial Microbiome in Human Immunodeficiency Virus-
Associated Acquired Immunodeficiency Syndrome. Cell Host Microbe 19, 311–
322.
Morris, A., Hillenbrand, M., Finkelman, M., George, M.P., Singh, V., Kessinger, C.,
Lucht, L., Busch, M., McMahon, D., Weinman, R., et al. (2012). Serum (1→3)-
β-D-glucan levels in HIV-infected individuals are associated with
immunosuppression, inflammation, and cardiopulmonary function. J. Acquir.
Immune Defic. Syndr. 61, 462–468.
Munn, D.H., and Mellor, A.L. (2013). Indoleamine 2,3 dioxygenase and metabolic
control of immune responses. Trends Immunol. 34, 137–143.
Mutlu, E.A., Keshavarzian, A., Losurdo, J., Swanson, G., Siewe, B., Forsyth, C.,
French, A., DeMarais, P., Sun, Y., Koenig, L., et al. (2014). A Compositional
Look at the Human Gastrointestinal Microbiome and Immune Activation
Parameters in HIV Infected Subjects. PLoS Pathog. 10.
Nagler-Anderson, C. (2001). Man the barrier! Strategic defences in the intestinal
mucosa. Nat.Rev.Immunol. 1, 59–67.
Nava, G.M., Friedrichsen, H.J., and Stappenbeck, T.S. (2011). Spatial organization of
intestinal microbiota in the mouse ascending colon. ISME J. 5, 627–638.
Nazli, A., Chan, O., Dobson-Belaire, W.N., Ouellet, M., Tremblay, M.J., Gray-Owen,
S.D., Arsenault, A.L., and Kaushic, C. (2010). Exposure to HIV-1 directly
impairs mucosal epithelial barrier integrity allowing microbial translocation.
PLoS Pathog. 6, e1000852.

105
Neff, C.P., Krueger, O., Xiong, K., Arif, S., Nusbacher, N., Schneider, J.M.,
Cunningham, A.W., Armstrong, A., Li, S., McCarter, M.D., et al. (2018). Fecal
Microbiota Composition Drives Immune Activation in HIV-infected Individuals.
EBioMedicine 30, 192–202.
Nielsen, H.B., Almeida, M., Juncker, A.S., Rasmussen, S., Li, J., Sunagawa, S.,
Plichta, D.R., Gautier, L., Pedersen, A.G., Le Chatelier, E., et al. (2014).
Identification and assembly of genomes and genetic elements in complex
metagenomic samples without using reference genomes. Nat. Biotechnol.
NIH HMP Working Group, T.N.H.W., Peterson, J., Garges, S., Giovanni, M., McInnes,
P., Wang, L., Schloss, J.A., Bonazzi, V., McEwen, J.E., Wetterstrand, K.A., et
al. (2009). The NIH Human Microbiome Project. Genome Res. 19, 2317–2323.
Noguera-Julian, M., Rocafort, M., Guillén, Y., Rivera, J., Casadellà, M., Nowak, P.,
Hildebrand, F., Zeller, G., Parera, M., Bellido, R., et al. (2016). Gut Microbiota
Linked to Sexual Preference and HIV Infection. EBioMedicine 5, 135–146.
Norman, J.M., Handley, S.A., Baldridge, M.T., Droit, L., Liu, C.Y., Keller, B.C.,
Kambal, A., Monaco, C.L., Zhao, G., Fleshner, P., et al. (2015). Disease-
specific alterations in the enteric virome in inflammatory bowel disease. Cell
160, 447–460.
Nowak, P., Troseid, M., Avershina, E., Barqasho, B., Neogi, U., Holm, K., Hov, J.R.,
Noyan, K., Vesterbacka, J., Svärd, J., et al. (2015). Gut microbiota diversity
predicts immune status in HIV-1 infection. AIDS 29, 2409–2418.
Oksanen, J., Blanchet, F.G., Kindt, R., Legendre, P., Minchin, P.R., O’Hara, R.B.,
Simpson, G.L., Solymos, P., Stevens, M.H.H., and Wagner, H. (2013). Package
“vegan.” R Packag. Ver. 2.0–8 254.
Ou, J., Carbonero, F., Zoetendal, E.G., DeLany, J.P., Wang, M., Newton, K., Gaskins,
H.R., and O’Keefe, S.J.D. (2013). Diet, microbiota, and microbial metabolites
in colon cancer risk in rural Africans and African Americans. Am. J. Clin. Nutr.
98, 111–120.
Palmer, C.D., Tomassilli, J., Sirignano, M., Romero-Tejeda, M., Arnold, K.B., Che, D.,
Lauffenburger, D.A., Jost, S., Allen, T., Mayer, K.H., et al. (2014). Enhanced
immune activation linked to endotoxemia in HIV-1 seronegative MSM. AIDS 28,
2162–2166.

106
Paquin-Proulx, D., Ching, C., Vujkovic-Cvijin, I., Fadrosh, D., Loh, L., Huang, Y.,
Somsouk, M., Lynch, S. V., Hunt, P.W., Nixon, D.F., et al. (2017). Bacteroides
are associated with GALT iNKT cell function and reduction of microbial
translocation in HIV-1 infection. Mucosal Immunol. 10, 69–78.
Pastor, L., Parker, E., Carrillo, J., Urrea, V., Fuente-soro, L., Respeito, D., Jairoce, C.,
Mandomando, I., Blanco, J., and Naniche, D. (2017). A Cytokine Pattern That
Differentiates Preseroconversion From Postseroconversion Phases of Primary
HIV Infection. 74, 459–466.
Pereira, F.C., and Berry, D. (2017). Microbial nutrient niches in the gut. Environ.
Microbiol. 19, 1366–1378.
Pérez-Santiago, J., Gianella, S., Massanella, M., Spina, C.A., Karris, M.Y., Var, S.R.,
Patel, D., Jordan, P.S., Young, J.A., Little, S.J., et al. (2013). Gut
Lactobacillales are associated with higher CD4 and less microbial translocation
during HIV infection. AIDS 27, 1921–1931.
Pinto-Cardoso, S., Lozupone, C., Bricenõ, O., Alva-Hernández, S., Téllez, N.,
Adriana, A., Murakami-Ogasawara, A., and Reyes-Terán, G. (2017). Fecal
Bacterial Communities in treated HIV infected individuals on two antiretroviral
regimens. Sci. Rep. 7.
Poles, M.A., Elliott, J., Taing, P., Anton, P.A., and Chen, I.S.Y. (2001). A
Preponderance of CCR5+ CXCR4+ Mononuclear Cells Enhances
Gastrointestinal Mucosal Susceptibility to Human Immunodeficiency Virus
Type 1 Infection. J. Virol. 75, 8390–8399.
Prendergast, A., Prado, J.G., Kang, Y.-H., Chen, F., Riddell, L. a, Luzzi, G., Goulder,
P., and Klenerman, P. (2010). HIV-1 infection is characterized by profound
depletion of CD161+ Th17 cells and gradual decline in regulatory T cells. AIDS
24, 491–502.
Price, M.N., Dehal, P.S., and Arkin, A.P. (2010). FastTree 2 - Approximately
maximum-likelihood trees for large alignments. PLoS One 5.
Qin, J., Li, R., Raes, J., Arumugam, M., Burgdorf, K.S., Manichanh, C., Nielsen, T.,
Pons, N., Levenez, F., Yamada, T., et al. (2010). A human gut microbial gene
catalogue established by metagenomic sequencing. Nature 464, 59–65.

107
Quast, C., Pruesse, E., Yilmaz, P., Gerken, J., Schweer, T., Yarza, P., Peplies, J.,
and Glöckner, F.O. (2013). The SILVA ribosomal RNA gene database project:
imporved data processing and web-based tools. Nucleic Acids Res. 41, D590-
6.
R Core Team (2014). R: A language and environment for statistical computing. R
Found. Stat. Comput. Vienna, Austria.
Ramakrishna, B.S. (2013). Role of the gut microbiota in human nutrition and
metabolism. J. Gastroenterol. Hepatol. 28, 9–17.
Reynolds, A.P., Richards, G., De La Iglesia, B., and Rayward-Smith, V.J. (2006).
Clustering rules: A comparison of partitioning and hierarchical clustering
algorithms. J. Math. Model. Algorithms 5, 475–504.
Rhee, S.H. (2014). Lipopolysaccharide: basic biochemistry, intracellular signaling,
and physiological impacts in the gut. Intest. Res. 12, 90–95.
Routy, B., Le Chatelier, E., Derosa, L., Duong, C.P.M., Alou, M.T., Daillère, R.,
Fluckiger, A., Messaoudene, M., Rauber, C., Roberti, M.P., et al. (2018). Gut
microbiome influences efficacy of PD-1-based immunotherapy against
epithelial tumors. Science (80-. ). 359, 91–97.
Sankaran, S., George, M.D., Reay, E., Guadalupe, M., Flamm, J., Prindiville, T., and
Dandekar, S. (2008). Rapid onset of intestinal epithelial barrier dysfunction in
primary human immunodeficiency virus infection is driven by an imbalance
between immune response and mucosal repair and regeneration. J. Virol. 82,
538–545.
Scamurra, R.W., Nelson, D.B., Lin, X.M., Miller, D.J., Silverman, G.J., Kappel, T.,
Thurn, J.R., Lorenz, E., Kulkarni-Narla, A., and Janoff, E.N. (2002). Mucosal
plasma cell repertoire during HIV-1 infection. J. Immunol. 169.
Schacker, T., Little, S., Connick, E., Gebhard-Mitchell, K., Zhang, Z.Q., Krieger, J.,
Pryor, J., Havlir, D., Wong, J.K., Richman, D., et al. (2000). Rapid accumulation
of human immunodeficiency virus (HIV) in lymphatic tissue reservoirs during
acute and early HIV infection: implications for timing of antiretroviral therapy. J.
Infect. Dis. 181, 354–357.

108
Schloss, P.D., Westcott, S.L., Ryabin, T., Hall, J.R., Hartmann, M., Hollister, E.B.,
Lesniewski, R.A., Oakley, B.B., Parks, D.H., Robinson, C.J., et al. (2009).
Introducing mothur: Open-source, platform-independent, community-supported
software for describing and comparing microbial communities. Appl. Environ.
Microbiol. 75, 7537–7541.
Schneeberger, M., Everard, A., Gómez-Valadés, A.G., Matamoros, S., Ramírez, S.,
Delzenne, N.M., Gomis, R., Claret, M., and Cani, P.D. (2015). Akkermansia
muciniphila inversely correlates with the onset of inflammation, altered adipose
tissue metabolism and metabolic disorders during obesity in mice. Sci. Rep. 5,
16643.
Seemann, T. (2014). Prokka: Rapid prokaryotic genome annotation. Bioinformatics.
Segata, N., Izard, J., Waldron, L., Gevers, D., Miropolsky, L., Garrett, W.S., and
Huttenhower, C. (2011). Metagenomic biomarker discovery and explanation.
Genome Biol. 12.
Sender, R., Fuchs, S., and Milo, R. (2016). Revised Estimates for the Number of
Human and Bacteria Cells in the Body. PLOS Biol. 14, e1002533.
Serna-Bolea, C., Muñoz, J., Almeida, J.M., Nhacolo, A., Letang, E., Nhampossa, T.,
Ferreira, E., Alonso, P., and Naniche, D. (2010). High prevalence of
symptomatic acute HIV infection in an outpatient ward in southern
Mozambique: Identification and follow-up. AIDS 24, 603–608.
Sharp, P.M., and Hahn, B.H. (2011). Origins of HIV and the AIDS pandemic. Cold
Spring Harb. Perspect. Med. 1.
Shaw, J.M., Hunt, P.W., Critchfield, J.W., McConnell, D.H., Garcia, J.C., Pollard, R.B.,
Somsouk, M., Deeks, S.G., and Shacklett, B.L. (2011). Increased Frequency of
Regulatory T Cells Accompanies Increased Immune Activation in Rectal
Mucosae of HIV-Positive Noncontrollers. J. Virol. 85, 11422–11434.
Simon, V., Ho, D.D., and Abdool Karim, Q. (2006). HIV/AIDS epidemiology,
pathogenesis, prevention, and treatment. Lancet (London, England) 368, 489–
504.

109
Sokol, H., Seksik, P., Furet, J.P., Firmesse, O., Nion-Larmurier, I., Beaugerie, L.,
Cosnes, J., Corthier, G., Marteau, P., and Doraé, J. (2009). Low counts of
faecalibacterium prausnitzii in colitis microbiota. Inflamm. Bowel Dis. 15, 1183–
1189.
Srinivasa, S., Fitch, K. V, Lo, J., Kadar, H., Knight, R., Wong, K., Abbara, S., Gauguier,
D., Capeau, J., Boccara, F., et al. (2015). Plaque burden in HIV-infected
patients is associated with serum intestinal microbiota-generated
trimethylamine. AIDS 29, 443–452.
Steele, A.K., Lee, E.J., Manuzak, J.A., Dillon, S.M., Beckham, J.D., McCarter, M.D.,
Santiago, M.L., and Wilson, C.C. (2014). Microbial exposure alters HIV-1-
induced mucosal CD4+ T cell death pathways Ex vivo. Retrovirology 11.
Stone, S.F., Price, P., and French, M.A. (2005). Dysregulation of CD28 and CTLA-4
expression by CD4 T cells from previously immunodeficient HIV-infected
patients with sustained virological responses to highly active antiretroviral
therapy. HIV Med. 6, 278–283.
Su, G.L., Klein, R.D., Aminlari, A., Zhang, H.Y., Steinstraesser, L., Alarcon, W.H.,
Remick, D.G., and Wang, S.C. (2000). Kupffer cell activation by
lipopolysaccharide in rats: role for lipopolysaccharide binding protein and toll-
like receptor 4. Hepatology 31, 932–936.
Svärd, J., Paquin-Proulx, D., Buggert, M., Noyan, K., Barqasho, B., Sönnerborg, A.,
and Nowak, P. (2015). Role of translocated bacterial flagellin in monocyte
activation among individuals with chronic HIV-1 infection. Clin. Immunol. 161,
180–189.
Swanstrom, R., and Coffin, J. (2012). HIV-1 Pathogenesis: The Virus.
Tanaka, M., and Nakayama, J. (2017). Development of the gut microbiota in infancy
and its impact on health in later life.
Taylor, M.J., and Richardson, T. (1979). Applications of Microbial Enzymes in Food
Systems and in Biotechnology. Adv. Appl. Microbiol. 25, 7–35.
Truong, D.T., Franzosa, E.A., Tickle, T.L., Scholz, M., Weingart, G., Pasolli, E., Tett,
A., Huttenhower, C., and Segata, N. (2015). MetaPhlAn2 for enhanced
metagenomic taxonomic profiling. Nat. Methods 12, 902–903.

110
Vázquez-Castellanos, J.F., Serrano-Villar, S., Latorre, A., Artacho, A., Ferrús, M.L.,
Madrid, N., Vallejo, A., Sainz, T., Martínez-Botas, J., Ferrando-Martínez, S., et
al. (2014). Altered metabolism of gut microbiota contributes to chronic immune
activation in HIV-infected individuals. Mucosal Immunol. 8, 760–772.
De Vlaminck, I., Khush, K.K., Strehl, C., Kohli, B., Luikart, H., Neff, N.F., Okamoto, J.,
Snyder, T.M., Cornfield, D.N., Nicolls, M.R., et al. (2013). Temporal response
of the human virome to immunosuppression and antiviral therapy. Cell 155.
Vujkovic-Cvijin, I., Dunham, R.M., Iwai, S., Maher, M.C., Albright, R.G., Broadhurst,
M.J., Hernandez, R.D., Lederman, M.M., Huang, Y., Somsouk, M., et al. (2013).
Dysbiosis of the gut microbiota is associated with HIV disease progression and
tryptophan catabolism. Sci. Transl. Med. 5, 193ra91.
Vujkovic-Cvijin, I., Swainson, L.A., Chu, S.N., Ortiz, A.M., Santee, C.A., Petriello, A.,
Dunham, R.M., Fadrosh, D.W., Lin, D.L., Faruqi, A.A., et al. (2015). Gut-
Resident Lactobacillus Abundance Associates with IDO1 Inhibition and Th17
Dynamics in SIV-Infected Macaques. Cell Rep. 13, 1589–1597.
Wang, B., Yao, M., Lv, L., Ling, Z., and Li, L. (2017). The Human Microbiota in Health
and Disease. Engineering 3, 71–82.
Wang, Q., Garrity, G.M., Tiedje, J.M., and Cole, J.R. (2007). Naïve Bayesian classifier
for rapid assignment of rRNA sequences into the new bacterial taxonomy. Appl.
Environ. Microbiol. 73, 5261–5267.
Whitman, W.B., Coleman, D.C., and Wiebe, W.J. (1998). Prokaryotes: The unseen
majority. Proc. Natl. Acad. Sci. 95, 6578–6583.
Willett, W.C., Howe, G.R., and Kushi, L.H. (1997). Adjustment for total energy intake
in epidemiologic studies. Am. J. Clin. Nutr. 65, 1220S–1228S; discussion
1229S–1231S.
Wintermute, E.H., and Silver, P.A. (2010). Dynamics in the mixed microbial
concourse. Genes Dev. 24, 2603–2614.
Woese, C.R., Kandler, O., and Wheelis, M.L. (1990). Towards a natural system of
organisms: proposal for the domains Archaea, Bacteria, and Eucarya. Proc.
Natl. Acad. Sci. 87, 4576–4579.

111
Wu, G.D., Chen, J., Hoffmann, C., Bittinger, K., Chen, Y.Y., Keilbaugh, S.A., Bewtra,
M., Knights, D., Walters, W.A., Knight, R., et al. (2011). Linking long-term
dietary patterns with gut microbial enterotypes. Science (80-. ). 334, 105–108.
Xu, H., Wei, Y., Ma, H., Liu, Y., Zhang, Y., Hu, L., and Li, J. (2018). Alterations of Gut
Microbiome in the Patients with Severe Fever with Thrombocytopenia
Syndrome. Front. Microbiol. 9, 2315.
Yang, L., Poles, M.A., Fisch, G.S., Ma, Y., Nossa, C., Phelan, J.A., and Pei, Z. (2016).
HIV-induced immunosuppression is associated with colonization of the
proximal gut by environmental bacteria. AIDS 1.
Zeller, G., Tap, J., Voigt, A.Y., Sunagawa, S., Kultima, J.R., Costea, P.I., Amiot, A.,
Bohm, J., Brunetti, F., Habermann, N., et al. (2014). Potential of fecal
microbiota for early-stage detection of colorectal cancer. Mol. Syst. Biol. 10,
766–766.
Zhang, H., and Luo, X.M. (2015). Control of commensal microbiota by the adaptive
immune system. Gut Microbes 6, 156–160.
Zoetendal, E.G., Von Wright, A., Vilpponen-Salmela, T., Ben-Amor, K., Akkermans,
A.D.L., and De Vos, W.M. (2002). Mucosa-associated bacteria in the human
gastrointestinal tract are uniformly distributed along the colon and differ from
the community recovered from feces. Appl. Environ. Microbiol. 68, 3401–3407.

112

113
8. APPENDIX
Marc Noguera-Julian1, Muntsa Rocafort1, Yolanda Guillén, Javier Rivera, Maria
Casadellà, Piotr Nowak, Falk Hildebrand, Georg Zeller, Mariona Parera, Rocío
Bellido, Cristina Rodríguez, Jorge Carrillo, Beatriz Mothe, Josep Coll, Isabel Bravo,
Carla Estany, Cristina Herrero, Jorge Saz, Guillem Sirera, Ariadna Torrela, Jordi
Navarro, Manel Crespo, Christian Brander, Eugènia Negredo, Julià Blanco, Francisco
Guarner, Maria Luz Calle, Peer Bork, Anders Sönnerborg, Bonaventura Clotet, Roger
Paredes. 2016. Gut Microbiota Linked to Sexual Preference and HIV Infection.
EBioMedicine, Volume 5, Pages 135:146.
1All authors contributed equally.
Guillén Y1, Noguera-Julian M1, Rivera J, Casadellà M, Zevin AS, Rocafort M, Parera
M, Rodríguez C, Arumí M, Carrillo J, Mothe B, Estany C, Coll J, Bravo I, Herrero C,
Saz J, Sirera G, Torrella A, Navarro J, Crespo M, Negredo E, Brander C, Blanco J,
Calle ML, Klatt NR, Clotet B, Paredes R. 2018. Low nadir CD4+ T-cell counts
predict gut dysbiosis in HIV-1 infection. Mucosal Immunology.
1All authors contributed equally.
Muntsa Rocafort, Marc Noguera-Julian, Javier Rivera, Lucía Pastor, Yolanda Guillén, Jost Langhorst, Mariona Parera, Inacio Mandomando, Jorge Carrillo, Víctor Urrea, Cristina Rodríguez, Maria Casadellà, Maria Luz Calle, Bonaventura Clotet, Julià Blanco, Denise Naniche and Roger Paredes. Evolution of the Gut Microbiome Following Acute HIV-1 Infection. Submitted

114

115
9. ACKNOWLEDGMENTS
Ara que em planto davant de l’ordinador amb la intenció d’escriure els agraïments de
la tesis és quan me n’adono que això ja s’acaba. Fa dos dies estava nerviosa per fer
l’últim examen de la llicenciatura i dubtava de si acceptar una feina de tècnic de
laboratori que m’havien ofert. Buf, com han canviat les coses. I no, no fa dos dies, fa
6 anys!
En primer lloc voldria donar les gràcies a en Ventura. Quan vaig acabar la llicenciatura
vaig decidir anar-me’n a fer un màster de Virologia a Madrid perquè durant la carrera
pràcticament no m’havien parlat de virus, i en volia saber alguna cosa més. Gràcies
a un conegut comú (gràcies Pere!) vaig poder quedar amb ell i xerrar una estona
sobre ciència i recerca. I recodo que em va dir: “a Madrid no marxes pas. Et quedes
a Catalunya!”. Em va parlar de la possibilitat de fer el màster que aleshores tenien a
IrsiCaixa sobre la patogènesis del VIH. Doncs bé, seguint un instint una mica suïcida
(bé, segons el meu parer d’aquell moment), vaig dir que sí, que em quedava aquí, i
deia adéu a l’aventura madrilenya. Ventura, sense tu, res de tot el que he viscut hauria
estat possible, moltíssimes gràcies!
Seguint cronologia, voldria agrair al Christian Brander i a la Bea, els meus directors
del màster que vaig fer a IrsiCaixa. Ells són els que en un inici em van donar les ales
per a començar a créixer, tan com a persona com a científica. Si hagués de resumir
aquell any en una paraula, clarament la paraula seria ELISPOT! Quins records. Quin
fart de vestir-me per entrar i sortir de P3 durant incubacions. Quan pensaves que
s’havien acabat, pam, una altra! Era un no parar. Això sí, em va quedar un projecte
d’investigació molt xulo i vaig aprendre molt. Gràcies també a tots els integrants del
grup de Immunitat cel·lular d’aleshores. Gràcies per fer-me sentir com una més des
del primer dia! Àlex, et toca buscar un nou company empordanès, ha estat un plaer
haver representat la terra amb tu durant aquests últims 6 anys! ;)
I aquí és on comenca l’aventura del doctorat. En primer lloc, gràcies Roger per pensar
en mi quan buscaves nous integrants pel grup quan vas començar a investigar això
del microbioma. Moltes gràcies per la confiança dipositada i per tota l’ajuda i consells
durant aquests últims 4 anys! Ha estat un plaer endinsar-me en aquest mon envoltada

116
de gent tan entusiasta i amb tantíssim coneixement. Marc, la teva padawan es
gradua. Qui t’ho hauria de dir! Estic molt contenta d’haver estat la teva primera tesis
i sobretot molt agraïda per la paciència i tot el que m’has ensenyat. Gràcies per
explicar-me les coses 3 vegades (o més) i per no desesperar. Gràcies per fer-me
veure una mica de llum entre tant codi de programació! Gràcies també Maria
Casadellà i Mariona per ensenyar-me tot el que m’heu ensenyat de laboratori i del
funcionament de P3, ha estat un plaer! Yolanda, igual que en Marc, gràcies per ser
una de les meves guies en el mon de la bioinformàtica. Ha estat un súper plaer i se’m
farà estrany no trobar-te a la taula del costat. Sort que els memes i el contingut xorra
d’internet / facebook / instagram traspassa fronteres ;) Javi, a tu el gràcies no és gran,
és gegant! Tenir algú que fa el doctorat paral·lelament a tu és un suport moral que no
es pot descriure fàcilment en paraules. Tenir algú amb qui parlar de tot, des de com
d’angoixada et sents, fins a la desesperació absoluta que sents amb la universitat
perquè no entens quins papers et demanen o perquè no paren d’escurar-te la butxaca
de matrícula en matrícula. Gràcies per haver estat sempre preparat per ajudar quan
fos necessari i per fer broma quan ens estressàvem. Gràcies per les “estirades de
cames”, les “finestres” i els “tes”. No m’imagino haver fet la theme discussion del
CROI com la vaig fer si no fos perquè tu també tenies un pòster i vas estar allà per
calmar-me en tot moment! De nou, moltíssimes gràcies! :) I a tu Chiara, doncs també
moltíssimes gràcies per haver estat una peça clau de la meva estada a IrsiCaixa. Has
confiat sempre en mi i això m’ha ajudat a aconseguir reptes que segurament sense
el teu suport no haguessin estat possibles. Gràcies per totes ses confidències,
crítiques, bromes, infusions, etc! Espero que ja tinguis l’skype instal·lat al portàtil ara
que marxaré cap a les Amèriques ;) Gràcies també a la Rocio i a la Cristina que,
malgrat ja no estan al grup, també he tingut la sort de treballar amb elles durant quasi
la meitat de la tesi. Ha estat un plaer conèixer-vos i compartir estones amb vosaltres!
També agrair a la resta de companys d’IrsiCaixa. Amb alguns hauré interaccionat
més que amb d’altres, però lo important és que tots estem sempre disposats a ajudar
i fer la jornada laboral una mica menys feixuga. No crec que hi hagi ningú que marxi
sense pena de deixar enrere el bon ambient que envolta aquest súper laboratori!
Gràcies per fer d’Irsicaixa és el que és!

117
I per acabar, doncs agrair a la família. Gràcies mare. No he dubtat ni un sol minut a
l’hora de dedicar aquesta tesis. Gràcies pel teu suport incondicional, per la confiança
cega que tens en mi, per tot l’esforc que fas i has fet sempre i per ajudar a aixecar-
me sempre que he caigut. Gràcies per fer de mi el què sóc. Avi i àvia, sé que tot això
se us fa un món, que no ho acabeu d’entendre i que donaríeu el què fos perquè a
Cadaqués hi hagués un centre pioner de recerca i no hagués de marxar a l’estranger.
Però de moment, és difícil. Tot i així, gràcies per haver ajudat sempre, sense vosaltres
tot hauria estat molt diferent! Gràcies oncle, tia, Anna i Albert. Gràcies per confiar en
mi i donar-me suport en totes les decisions sempre! Ricard, donar-te les gràcies per
decidir formar part d’aquesta familia i sobretot per tota l’ajuda i l’experiència durant
els meus primers temps a Barcelona, no se m’acut un millor guia! Dolors, Martí i Aida,
sou una família política genial. Gràcies per no dubtar mai del meu potencial i ajudar-
me sempre. I a tu Lluís, gràcies per decidir ser es meu company, per haver crescut
as meu costat, per deixar-me ser partícip de sa teu vida,... gràcies, gràcies i més
gràcies! Aquí només tanquem una etapa, però tu i jo ens embarquem en una aventura
nova molt més gran, i estic segura que no serà l’última que compartirem. Us estimo
molt familia.
GRÀCIES

118

119

120