Prognostic correlations with the microbiome of breast cancer ...
14
ARTICLE OPEN Prognostic correlations with the microbiome of breast cancer subtypes Sagarika Banerjee 1 , Zhi Wei 2 , Tian Tian 2 , Dipayan Bose 1 , Natalie N. C. Shih 3 , Michael D. Feldman 3 , Thaer Khoury 4 , Angela De Michele 5 and Erle S. Robertson 1 ✉ © The Author(s) 2021 Alterations to the natural microbiome are linked to different diseases, and the presence or absence of specific microbes is directly related to disease outcomes. We performed a comprehensive analysis with unique cohorts of the four subtypes of breast cancer (BC) characterized by their microbial signatures, using a pan-pathogen microarray strategy. The signature (includes viruses, bacteria, fungi, and parasites) of each tumor subtype was correlated with clinical data to identify microbes with prognostic potential. The subtypes of BC had specific viromes and microbiomes, with ER+ and TN tumors showing the most and least diverse microbiome, respectively. The specific microbial signatures allowed discrimination between different BC subtypes. Furthermore, we demonstrated correlations between the presence and absence of specific microbes in BC subtypes with the clinical outcomes. This study provides a comprehensive map of the oncobiome of BC subtypes, with insights into disease prognosis that can be critical for precision therapeutic intervention strategies. Cell Death and Disease (2021)12:831 ; https://doi.org/10.1038/s41419-021-04092-x INTRODUCTION The microbiome can influence many aspects of normal healthy life and specific changes may have clinical implications for several diseases [1–5]. Furthermore, specific microbial signatures are associated with different types of cancers [2, 3, 6–10]. Therefore, we posit that pathological states, like oncogenesis, create microenvironments amenable to the persistence of a disease- specific microbiome. Alternatively, a pre-existing microbiome in a microenvironment may contribute to the development of the disease. Therefore, disease-specific microbiome may have prog- nostic and diagnostic value. In addition, the cancer microbiome (oncobiome, inclusive of viruses, bacteria, fungi, and parasites) and its metabolites have a major impact on the local and distant immune system, which can influence clinical outcomes in cancer patients [11, 12]. There are four subtypes of breast cancer (BC) that are based on the status of the estrogen receptor, progesterone receptor, and human epidermal growth (Her2) expression in cancerous breast cells [3]. The endocrine hormone receptor positive cancers include (1) estrogen receptor positive and/or progesterone receptor positive, and Her2 negative (designated herein as ER), and (2) triple positive (TP) cancers that are ER positive, PR positive, and Her2 positive [13]. These cancers are generally responsive to treatment with hormone receptor blockers [13]. They are less aggressive with better prognosis compared to hormone receptor negative BCs, which include the Her2 BC (Her2+, ER–, and PR–, designated herein as HR), and triple-negative (TN) cancer, which are ER, PR, and Her2 negative [9, 14]. TN BC (15–20% of BC patients) is the most aggressive of all the BCs, is non-responsive to treatment, is highly angiogenic, highly proliferative, and has the lowest survival rate [15]. Identifying the oncobiome of the four BC subtypes may identify a connection between the microbiome and therapeutic response to treatment [12, 16]. Recent studies have shown that the status of the microbiome may improve response to cancer therapies [11, 12]. In the present study, we used the pan- pathogen microarray (PathoChip [17]) to screen a larger cohort of BC and control patient samples, to validate our previous small-scale study [3], and showed a trend or correlation between unique microbial signature patterns in different BC types with clinical intervention or outcomes. This could provide both prognostic and diagnostic values for BC subtypes. Our findings demonstrated that the oncobiome of each BC cancer subtype is diverse and contains a variety of microbial signatures. ER showed the most diverse oncobiome, while TN was the least diverse. Further, each BC subtype can be distinguished by the presence or absence of specific viruses and other microbes, and thus the level of detection of these microbes was predictive of patient outcomes. Our data suggest that a thorough knowledge of the status of the tumor oncobiome is important and provides prognostic and diagnos- tic information toward precision patient care. Received: 3 March 2021 Revised: 19 July 2021 Accepted: 20 July 2021 1 Department of Otorhinolaryngology-Head and Neck Surgery, Perelman School of Medicine, University of Pennsylvania, Philadelphia, PA, USA. 2 Department of Computer Science, New Jersey Institute of Technology, Newark, NJ, USA. 3 Department of Pathology and Laboratory Medicine, Perelman School of Medicine, University of Pennsylvania, Philadelphia, PA, USA. 4 Department of Pathology, Roswell Park Cancer Institute, Buffalo, NY, USA. 5 Division of Hematology Oncology, Department of Medicine, Perelman School of Medicine, University of Pennsylvania, Philadelphia, PA, USA. ✉ email: [email protected] Edited by Dr Wei Jia www.nature.com/cddis Official journal of CDDpress
-
Upload
khangminh22 -
Category
Documents
-
view
4 -
download
0
Transcript of Prognostic correlations with the microbiome of breast cancer ...

ARTICLE OPEN
Prognostic correlations with the microbiome of breast cancersubtypesSagarika Banerjee1, Zhi Wei2, Tian Tian2, Dipayan Bose 1, Natalie N. C. Shih3, Michael D. Feldman3, Thaer Khoury4,Angela De Michele5 and Erle S. Robertson 1✉
© The Author(s) 2021
Alterations to the natural microbiome are linked to different diseases, and the presence or absence of specific microbes is directlyrelated to disease outcomes. We performed a comprehensive analysis with unique cohorts of the four subtypes of breast cancer(BC) characterized by their microbial signatures, using a pan-pathogen microarray strategy. The signature (includes viruses, bacteria,fungi, and parasites) of each tumor subtype was correlated with clinical data to identify microbes with prognostic potential. Thesubtypes of BC had specific viromes and microbiomes, with ER+ and TN tumors showing the most and least diverse microbiome,respectively. The specific microbial signatures allowed discrimination between different BC subtypes. Furthermore, wedemonstrated correlations between the presence and absence of specific microbes in BC subtypes with the clinical outcomes. Thisstudy provides a comprehensive map of the oncobiome of BC subtypes, with insights into disease prognosis that can be critical forprecision therapeutic intervention strategies.
Cell Death and Disease (2021) 12:831 ; https://doi.org/10.1038/s41419-021-04092-x
INTRODUCTIONThe microbiome can influence many aspects of normal healthy lifeand specific changes may have clinical implications for severaldiseases [1–5]. Furthermore, specific microbial signatures areassociated with different types of cancers [2, 3, 6–10]. Therefore,we posit that pathological states, like oncogenesis, createmicroenvironments amenable to the persistence of a disease-specific microbiome. Alternatively, a pre-existing microbiome in amicroenvironment may contribute to the development of thedisease. Therefore, disease-specific microbiome may have prog-nostic and diagnostic value. In addition, the cancer microbiome(oncobiome, inclusive of viruses, bacteria, fungi, and parasites) andits metabolites have a major impact on the local and distantimmune system, which can influence clinical outcomes in cancerpatients [11, 12].There are four subtypes of breast cancer (BC) that are based on
the status of the estrogen receptor, progesterone receptor, andhuman epidermal growth (Her2) expression in cancerous breastcells [3]. The endocrine hormone receptor positive cancers include(1) estrogen receptor positive and/or progesterone receptorpositive, and Her2 negative (designated herein as ER), and (2)triple positive (TP) cancers that are ER positive, PR positive, andHer2 positive [13]. These cancers are generally responsive totreatment with hormone receptor blockers [13]. They are lessaggressive with better prognosis compared to hormone receptornegative BCs, which include the Her2 BC (Her2+, ER–, and PR–,
designated herein as HR), and triple-negative (TN) cancer, whichare ER, PR, and Her2 negative [9, 14]. TN BC (15–20% of BCpatients) is the most aggressive of all the BCs, is non-responsive totreatment, is highly angiogenic, highly proliferative, and has thelowest survival rate [15].Identifying the oncobiome of the four BC subtypes may
identify a connection between the microbiome and therapeuticresponse to treatment [12, 16]. Recent studies have shown thatthe status of the microbiome may improve response to cancertherapies [11, 12]. In the present study, we used the pan-pathogen microarray (PathoChip [17]) to screen a larger cohortof BC and control patient samples, to validate our previoussmall-scale study [3], and showed a trend or correlationbetween unique microbial signature patterns in different BCtypes with clinical intervention or outcomes. This could provideboth prognostic and diagnostic values for BC subtypes. Ourfindings demonstrated that the oncobiome of each BC cancersubtype is diverse and contains a variety of microbialsignatures. ER showed the most diverse oncobiome, while TNwas the least diverse. Further, each BC subtype can bedistinguished by the presence or absence of specific virusesand other microbes, and thus the level of detection of thesemicrobes was predictive of patient outcomes. Our data suggestthat a thorough knowledge of the status of the tumoroncobiome is important and provides prognostic and diagnos-tic information toward precision patient care.
Received: 3 March 2021 Revised: 19 July 2021 Accepted: 20 July 2021
1Department of Otorhinolaryngology-Head and Neck Surgery, Perelman School of Medicine, University of Pennsylvania, Philadelphia, PA, USA. 2Department of Computer Science,New Jersey Institute of Technology, Newark, NJ, USA. 3Department of Pathology and Laboratory Medicine, Perelman School of Medicine, University of Pennsylvania, Philadelphia,PA, USA. 4Department of Pathology, Roswell Park Cancer Institute, Buffalo, NY, USA. 5Division of Hematology Oncology, Department of Medicine, Perelman School of Medicine,University of Pennsylvania, Philadelphia, PA, USA. ✉email: [email protected] by Dr Wei Jia
www.nature.com/cddis
Official journal of CDDpress

MATERIALS AND METHODSAll experiments were performed according to relevant guidelines andregulations, and according to all the licensing and approvals byinstitutional committees at Perelman School of Medicine, University ofPennsylvania and the University of Buffalo School of Medicine, RoswellPark Cancer Institute IRB# BDR084317 who provided an independentcohort of patients and clinical data to support our findings.
PathoChip designThe details of the PathoChip array have been previously described in detail[18]. The PathoChip contains 60,000 probes for parallel DNA and RNAdetection of viruses (>4200), and known pathogenic bacteria (>320), fungi(>360), helminths (>250), and protozoa (>130) [17]. The array contains twotypes of probes: unique probes for each virus and other microorganism,and conserved probes that target genomic regions conserved betweenmembers of a family of viruses. The conserved probes allow detection ofdetect previously uncharacterized members of the family. These bespokearrays are SurePrint glass slide microarrays (Agilent Technologies Inc.),containing eight replicate arrays per slide. Each probe is a 60 nucleotide(nt) DNA oligomer that targets genomic regions of viruses, prokaryotic, andeukaryotic microorganisms [3, 7, 18, 19].
Sample preparation and microarray processingCohort of 95–105 formalin-fixed paraffin-embedded (FFPE) samples foreach BC subtypes, 20 matched control samples, and 68 non-matchedcontrol samples from breast reduction surgeries were received as 10 µmsections. The de-identified samples we obtained as an independent cohortfor each BC subtype to validate and provide clinical data of prognosticvalue. IRB approval was obtained from the Roswell Park Cancer InstituteInternal Review Board. The Biomedical Data Science office delivers HIPAAcompliant de-identified clinical data that ensures IRB compliance asInstitute Honest Brokers. Patient identifiers were stripped from all data filesand replaced with a de-identified ID. The Biomedical Data Science Officestaff is the holder of the identified information. Researchers are unable tomatch patient samples and clinical data back to the identified patientinformation. HIPAA compliant de-identified patient samples and clinicaldata were delivered to University of Pennsylvania. Consequently, weobtained clinical information for these samples, including age of thepatients, grade, stage of the tumor, primary site of the tumor, age atdiagnosis, recurrence type, response to treatment, survival and disease-free time post treatment. The tumor and control tissues were prepared,examined, and verified, by the breast pathologists at the Department ofPathology, RPCI, Buffalo, New York. The samples were prepared and cut ina sterile environment and the microtome sterilized between samples, toprevent contamination between sample. Utmost care was taken during theprocurement and handling of the samples, and during PathoChipscreening to minimize contamination.The PathoChip screen workflow was described previously [3, 6–8].
Briefly, DNA and RNA were extracted from FFPE samples; 50 ng each ofDNA and 50 ng of RNA were used for whole transcriptome amplificationusing the TransPlex Whole Transcriptome Amplification Kit (Sigma-Aldrich,St. Louis, MO). Human reference RNA and DNA were extracted from thehuman B cell line, BJAB (obtained from ATCC, and cultured in the lab forless than 6 months) and 15 ng of each were used for WTA. The cellularDNA/RNA provided a reference to compensate for dye bias. Onemicrogram of amplified products from the cancer and control tissueswas labeled with Cy3, and the human reference was labeled with Cy5(SureTag labeling kit, Agilent Technologies, Santa Clara, CA). The labeledsamples (Cy3 plus Cy5) were hybridized to the PathoChip for 40 h at 65 °Cwith rotation. The slides were then washed and scanned for visualizationusing an Agilent SureScan G4900DA array scanner.
Microarray data extraction and statistical analysisThe microarray data extraction and analyses have been describedpreviously [3]. Raw data from the images were extracted with AgilentFeature Extraction software. We used the R-program for normalization anddata analyses [20, 21]. The microarray data are available in Gene ExpressionOmnibus. We calculated scale factors using signals of green and redchannels for human probes. Scale factors are the sum of green and sum ofred signal ratios [∑(g)/∑(r)] of human probes. Then we used scale factors toobtain normalized signals for all other probes. For all probes except humanprobes, normalized signal is log2 transformed of green signals/scale factorsmodified red signals (log2g-scale factor*log2r). On the normalized signals,
t-test was applied to select probes present in cancer samples bycomparing cancer samples versus controls and to select probes presentin the BC samples versus the non-matched controls. The cut-off forsignificant detections in cancers versus the controls was log2 fold change>1 and adjusted p value (with multiple testing corrections) <0.05.Prevalence was calculated by counting the number of cancer cases withhybridization signals greater than the average signal or negative controlprobes and represented as a percentage.Analyses at the individual probe level (both for specific and conserved
probes), and at the family (for viruses) or genera (for bacteria, fungi, andparasite) level, taking into account all the probes per family or genera,were performed. Microbial detections were represented based on theiraverage hybridization signal (average of the hybridization signals ofdetected probes per family or genera) and prevalence.The cancer samples were also subjected to unsupervised hierarchical
clustering, based on the detection of microbial signatures in the samples(average hybridization signal per viral family or microbial genus), using theR-program (Euclidean distance, complete linkage, non-adjusted values)[21, 22].After obtaining the aggregated hybridization signals (average of the
hybridization signals of probes from same family or genus; for virus, weaggregated per family; for bacteria, fungi, and parasite, we aggregated pergenus) of the oncobiome of each BC subtype, we used principalcomponent analysis (PCA) plot to display the four BC subtypes of BCs(Fig. 1A). Violin plots were used to display the distinct microbial signatures,i.e., the organisms that were detected in one BC subtype only; or theorganisms that had significantly higher aggregated hybridization signals inone subtype compared to the other three (one-sided Wilcoxon test p value< 0.05 and logFC > 1) (Fig. 1A).Additional topological-based data analyses were conducted with Ayasdi
software (Ayasdi, Inc.) using correlation metric, and metric PCA co-ordinates lenses (Fig. 1B). The differences in microbial detections betweendifferent types of BCs were determined using the two-sided t-test(Supplementary Table S2).
Clinical analysis in each cancer subtypesWe first choose organisms that had correlation with disease outcomes.Based on the median of hybridization signals of each organism, we dividedpatients into high and low groups. We applied Kaplan–Meier survivalanalysis [23] to test if the survival rates or disease-free rates weresignificantly different in the high and low groups. We applied theBenjamini–Hochberg procedure [24] for multiple testing correction. Noorganisms had adjusted p values < 0.05 (Supplementary Material S8), andwe reported the top ones with a nominal p value < 0.05 to highlight thetrend. We also ran Cox regression [25] with prognostic factors included fortesting disease outcome association. See Supplementary Table S8 for thedetailed Cox regression results. Then patients were subjected to clusteringbased on the disease outcomes correlated organisms. Since the prevailingzero measurements, we applied a robust multi-kernel clustering method—SIMLR [21] to group patients into two clusters (the number of clusters wasdetermined by the “SIMLR_Estimate_Number_of_Clusters” function).Barplot and heatmap were made to display the proportions of clinicalfeatures and hybridization signals of organisms, respectively. To gain morestatistical power, we aggregated numerical clinical features into levels. Thetumor sizes were aggregated into three levels: T1 (<20mm), T2(20–50mm), and T3 (>50mm). The diagnosis ages were aggregated intotwo levels: ≤40, and >40, since age 40 is a critical age as women over age40 have increased rates of BC [26]. χ2 test was conducted to compare ifthere were significant differences in proportions of clinical featuresbetween the two clusters. To compare the proportions of some interestingclinical features (e.g., stage 3–4, distant metastasis, etc.), we used one-sidedFisher’s exact test. We also applied cox regression to see if clinical factors(such as tumor size, and grade) were correlated with survival and disease-free rates (Supplementary Table S9).
RESULTSMicrobiome characteristics in different subtypes of breastcancersMicroarray analysis was performed to identify the oncobiome offour different BC subtypes (shown in Figs. 1–3). The PCA of on theoncobiomes of the four BC subtypes (Fig. 1) validated our previousstudy [3]. The TN BC oncobiome was strikingly different from the
S. Banerjee et al.
2
Cell Death and Disease (2021) 12:831
1234567890();,:

others. This was primarily due to (1) the detection of fewermicrobial agents in the TN samples (the least diverse); (2) asignificantly higher detection of Aggregatibacter (Fig. 1A, violinplots); and (3) the detection of Plagiorchis and Trichostrongylus(Fig. 1A, violin plots). These factors made a distinct cluster for theTN BC samples in the PCA plot. Conversely, ER+ BC samplesshowed the most robust oncobiome, with a greater number ofbacterial (mostly Proteobacteria), fungal, viral, and parasiticsignatures with higher unique signals (Fig. 1A, violin plot). HRand TP BC subtypes showed intermediate oncobiome densitieswith fewer bacterial (Citrobacter, Streptobacillus), fungal (Enterocy-tozoon, Issatchenkia), and parasitic (Blastocystis, Cryptosporidium,
Dientamoeba, Hartmannella, Isospora, Macracanthorhynchus, Meta-gonimus) signatures uniquely detected, or had significantly highersignals in the HR samples. The parasitic signature of Taenia wasprominently detected in TP samples.Figure 1B used topological data analysis that suggested greater
similarity between the oncobiomes of TP and ER subtypes, whileHR and TN cancers had oncobiome characteristics very differentfrom the other BCs. Among the receptor negative BCs, HR differedfrom TN by having greater signals for signatures of Togaviridaeand Astroviridae, and signatures of Ehrlichia, Wolbachia, Bartonella,Legionella, and Campylobacter, whereas the TNs had higher signalsfor signatures of Alloherpesviridae, Arenaviridae, and Nodaviridae
Fig. 1 Oncobiome diversity in different breast cancer subtypes. A The four types of breast cancers have distinct oncobiome compositions.PCA plot using NBClust shows that TN breast cancer oncobiome is strikingly different from the other three breast cancer subtypes studied.The unique aspects of the oncobiomes of each breast cancer subtype are represented as violin plots showing the full distribution of the data.ER+ BC shows the most diversity in oncobiome. B Using topological data analysis, we further show the similarity in the oncobiomes of triplepositive and ER positive BCs, while both Her2+ and triple-negative breast cancer have oncobiome characteristics very different from otherBCs. C Bar graphs showing different types and phyla of oncobiome in the four breast cancer subtypes. D Venn diagrams show the viral andmicrobial signatures that are shared and unique to the four breast cancer subtypes.
S. Banerjee et al.
3
Cell Death and Disease (2021) 12:831

compared to the HRs (Supplementary Table S2). Among the ERshad higher signals for signatures of Hepeviridae, Aeromonas,Alcaligenes, Propionibacterium, Capnocytophaga, Pediococcus, Bar-tonella, Pasteurella, Madurella, and Ancylostoma compared to theTPs (Supplementary Table S2). The receptor positives (ER and TP)as a whole had higher signals for signatures of Filoviridae,Pleistophora, Azorhizobium, Paragonimus, Taenia, Corynebacterium,Brevibacillus, Chryseobacterium, Angiostrongylus, and Leishmania(Supplementary Table S2).Figure 1C shows the overall percentage of signatures (viral,
bacterial, fungal, and parasite) in each BC subtype separated intodifferent types and phyla. In the oncobiomes of the four BCsubtypes, we found that cancer-associated viral signatures madeup 26 and 38% of the total viral signatures, with the highestpercentage in HR (Fig. 1C, virus). Enteric viruses represented anequal proportion in each BC subtype, while respiratory virusesmade up 10–15%, and a variety of other viruses made up theremainder of each virome (Fig. 1C and Supplementary Table S1,virus).The bacterial signatures of all the BC subtypes screened were
predominated by Proteobacteria (40–50%), followed by a lowerpercentage of Firmicutes and small amounts of a variety of otherbacterial types (Fig. 1C, bacteria).The fungal signatures in the oncobiome of the four BC subtypes
were predominated by the phylum Ascomycota (50–60%, Fig. 1C,fungi); however, the TN oncobiome included a higher percentageof Basidiomycota compared to the other BC subtypes.The parasitic signatures in the oncobiome of the four BC
subtypes generally had a higher percentage of Nematoda,followed by Platyhelminthes, Apicomplexa, and Protozoa (Fig.1C, parasites). HR samples had the most diverse parasitic presencefollowed by ER positive with TN having the least diversity.Figure 1D shows Venn diagrams displaying the viral and other
microbial signatures that are shared and unique to the four BCsubtypes. Signatures of 19 viral families, 20 bacterial genera, 6fungal genera, and 6 parasitic genera were detected in all the fourBC subtypes (Fig. 1D and Supplementary Table S10). ER and TPcancers shared 1 viral family signature, 3 bacterial genera, 1 fungalgenus, and 2 parasitic genera. HR and TN cancers shared no viral,bacterial, fungal, or parasite signatures. A few viruses and othermicrobes were found to be unique to each of the four BC subtypesand they are better highlighted in Fig. 2 and Supplementary TableS10.Together the data in Fig. 1 showed the broad diversity of viruses
and other microbes that make up the BC oncobiome. Yet withinthis diversity, the oncobiome of each BC subtype had uniquecharacteristics that make them distinguishable.
Viral and other microbial signatures, and their prevalence inthe four breast cancer subtypesIn Figs. 2A, C and 3A, B, the bar graphs indicate the averagehybridization signal for different families of viral and othermicroorganisms detected in the four BC subtypes. The reddiamonds indicate the percent prevalence of the viruses andmicroorganisms in each BC subtype.Figure 2A shows that a variety of viral families are detected at
varying hybridization intensities in each BC subtype. ER and HRtumors had the most and the least diverse virome. The other BCsubtypes lacked specific viral families, suggesting that thedifferent BC subtype can be distinguished by the presence orabsence of signatures for specific viral families.Figure 2B shows a heatmap of the total hybridization signals for
viruses represented in the four different BC subtypes. Interestingly,TN cancer showed little to no papilloma signal except for a verylow detection of HPV 18 and even lower signals for HPV 7, 26, 49,131, and 132. The ER subtype showed low to moderate levels ofpapillomaviruses except for HPV49. The oncogenic HPV16 wasdetected only in ER and HR subtypes, while oncogenic HPV 18 was
detected at low to moderate levels in all BC subtypes. Otheroncogenic viruses specifically the adeno and hepatitis viruseswere seen in all BC subtypes, HHV8 primarily in ER and TN, MerkelCell Polyoma Virus and human T-lymphotropic virus (HTLV) inboth ER and HR. Interestingly, signatures related to oncogenicviruses that are better characterized in non-human hosts were alsodetected. For example, Yaba Monkey Tumor Virus and MonkeypoxZaire were detected in three BC subtypes, Avian Carcinoma Virussignature in HR, Mouse Mammary Tumor Virus detected in all,Torque Teno Virus detected in all, and Parapoxvirus detected inthree subtypes except TN. These signatures may indicate humanvariants of these viruses. In this regard, a signature related to HIV-1sequences was also detected with high average hybridizationsignal in all the BC subtypes. Since these patients were HIVnegative, this result suggests the probable presence of anuncharacterized human lentivirus.Figure 2C shows the representation and prevalence of bacterial
genera in the BC subtypes. ER subtype had the most diversebacterial microbiome, whereas TN subtype had a modest bacterialmicrobiome. Some of the bacterial signatures were detected withhigh average hybridization signal intensity, suggesting higherlevels of nucleic acids representing these bacteria (Fig. 2C). Forexample, we noted higher detection of Bacillus and Chlamydia in90% of TN samples; Chlamydia, Anaplasma, and Bifidobacterium in80–90% of HR samples; Chlamydia and Chrysobacterium in 82–98%of TP samples; and Borrelia, Chrysobacterium, Methylobacterium,and Staphylococcus in 85–95% of ER samples (Fig. 2C andSupplementary Table S1). Among the genera in the BC subtypesthose in the phylum proteobacteria dominated (approx. 55%)followed by Firmicutes and Actinobacteria (Fig. 1C and Supple-mentary Table S1). These include Brucella, Haemophilus, Neisseria,Rickettsia, Salmonella, Shewanella, Shigella, Sphingomonas, Vibrio,and Yersinia from the proteobacteria (Fig. 2C and SupplementaryTable S1). The Bacteroidetes phyla were next predominant.However, we detected more Chlamydiae followed by theBacteroidetes in the TNs (Fig. 1C and Supplementary Table S1).Tenericutes and Fusobacteria were also detected in all BCsubtypes (Fig. 1C and Supplementary Table S1).
Specific fungal and parasite signatures and their prevalence inthe four breast cancer typesEach BC subtypes had unique fungal signatures (Fig. 3A). The mostdiverse fungal biome (mycobiome) was detected in ER and theleast complex in TN. Most of the fungal signatures detected in theTN samples were yeast or skin fungi and were detected at lowlevels and only in 50–75% of the samples. In contrast, a very highaverage hybridization signal was detected for Arthroderma in 95%of ER samples. In addition, high average hybridization signals weredetected for Penicillium, Rhizopus, Rhodotorula, and Cocciodes in80–90% of the TP samples, and Arthroderma, Rhizopus, andRhodotorula in 80–97% of the HR samples (Fig. 3A andSupplementary Table S1).Figure 3B represents prevalence of parasite genera in the four
BC subtypes. The most diverse mycobiome was detected in ER+and the least complex in TN, where all were detected at loweraverage hybridization signals (Fig. 3B and Supplementary TableS1). Among the parasites with higher detection, Thelazia,Mansonella, Dirofilaria, Balantidium, Entamoeba, and Capillariawere detected in greater than 90% of the ER samples; Capillariaand Dirofilaria in the TP samples; and Thelazia and Dirofilaria inover 93% of the HR samples (Fig. 3B and Supplementary Table S1).Supplementary Fig. S1 shows a heatmap of the average
hybridization signal for viruses and microorganisms detected innon-matched control tissues, matched control tissues, and the ERpositive tumor tissues. Supplementary Figs. S2–S4 show similarheat maps for the TP, HR, and TN samples. In all the BC subtypesanalyzed, we observed that the hybridization signals for the non-matched controls were significantly less intense than the tumor
S. Banerjee et al.
4
Cell Death and Disease (2021) 12:831

Fig. 2 Viral and bacterial microbial signatures detected in the four types of breast cancers. A, C The bars represent the averagehybridization signal for each virus and bacterial signatures respectively, while the percent prevalence of those virus and bacterial signatures inthe sample set is indicated by the red dots. B The average hybridization signals for specific viruses were summed and represented as heatmapto show low to high detections of specific viral signatures in the four types of breast cancers.
S. Banerjee et al.
5
Cell Death and Disease (2021) 12:831
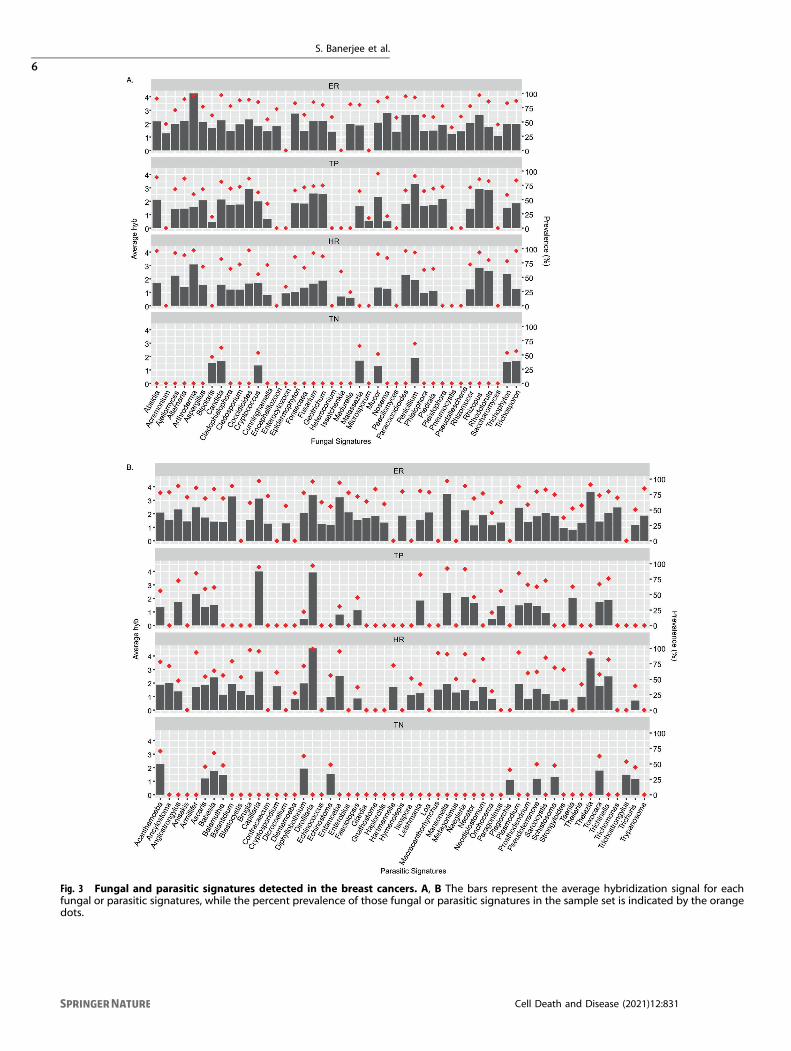
Fig. 3 Fungal and parasitic signatures detected in the breast cancers. A, B The bars represent the average hybridization signal for eachfungal or parasitic signatures, while the percent prevalence of those fungal or parasitic signatures in the sample set is indicated by the orangedots.
S. Banerjee et al.
6
Cell Death and Disease (2021) 12:831

samples. Conversely, the hybridization signals for the matchedcontrol samples were more similar to the tumor samples. This iscomplicated by the finding that with hierarchical clustering therewere sub-signatures for each subtype (Supplementary Fig. S5).However, this observation suggests that the tissue surroundingthe tumor may take on biome characteristics that are similar tothat of the tumor. Conversely, it suggests that a tumor-likemicrobiome maybe present on the breast tissues prior to tumorformation.Supplementary Fig. S5 shows that each of the BC subtypes can
be grouped into two or more sub-groups based on the higher,lower, or no detection of specific microbial signatures in theirtumor microenvironment.
Clinical correlations with the presence of specificmicroorganisms in TN breast cancer microbiomeWe next analyzed patient survival time or disease-free time posttreatment with the presence of viruses and other microorgan-isms in the oncobiome. Analysis of TN patient samples showedhigher average hybridization signals of Bacillus, Mucor, Nodavir-idae, Toxocara, and Trichophyton that significantly correlatedwith longer disease-free time or survival time (Fig. 4A). Thus, weclustered the TN samples based on high and low hybridizationsignals for Bacillus, Mucor, Nodaviridae, Toxocara, and Trichophy-ton and correlated these clusters with clinical data (Fig. 4B andSupplementary Table S3). Note that not all samples originally
tested had sufficient data on disease-free time and survival. Wethen compared the two resulting clusters (cluster 1: highhybridization signals; cluster 2: low hybridization signals) withclinical data [Fig. 4Ba (stage), 4Bb (grade), 4Bc (tumor size), 4Bd(age at diagnosis), 4Be (histology), 4Bf (Primary site of tumor),and 4Bg (recurrence)]. Among these we found significantdifferences in the two clusters related to stage, tumor size,recurrence, and position of the tumor in the breast. Specifically,patients in cluster 1 (high hybridization signal) had a much lowerproportion of grade 2, 3, and 4 cancers (Fig. 4Ba), significantlysmaller tumors (Fig. 4Bc), and a significantly longer disease-freeperiod after treatment (Fig. 4Bg) compared to patients with a lowhybridization signal (cluster 2). We also found that patients withTN tumors in the auxiliary tail and the lower inner quadrant ofthe breast were almost exclusively in cluster 1, while patientswith tumors in the lower outer quadrant of the breast werealmost exclusively in cluster 2. In Fig. 4Ch, we showed that thegeneral treatment of patients in the two clusters was very similar;thus, the overall improved outcomes of patients in cluster1 suggests that patients with higher hybridization signals for thefive viruses and other microorganisms responded better totreatment.Supplementary Fig. S6 shows additional microorganisms in the
tumor oncobiome where higher average hybridization signalssuggested a trend toward better disease prognosis for patients. Insum, these data suggest that the average hybridization signals of
Fig. 4 Oncobiome signatures in triple-negative breast cancer where higher hybridization signals correlated with better disease outcome.A The graphs show disease-free rate and/or survival relative to high or low hybridization signals for the specific microorganisms in the TNsample set. In the cases shown, higher hybridization signal correlates with increased disease-free time and/or survival. B TN BC samples wereclustered based on high and low hybridization signals for those organisms where high hybridization signal correlated with higher disease-freetime and survival (better outcomes). The high (cluster 1) and low (cluster 2) hybridization clusters were then correlated with clinical datashown as horizontal (a–g) and vertical (h) cluster barplot.
S. Banerjee et al.
7
Cell Death and Disease (2021) 12:831
this subset of organisms in TN tumors can provide significantinsights into the severity of the cancer and predictable outcomes.
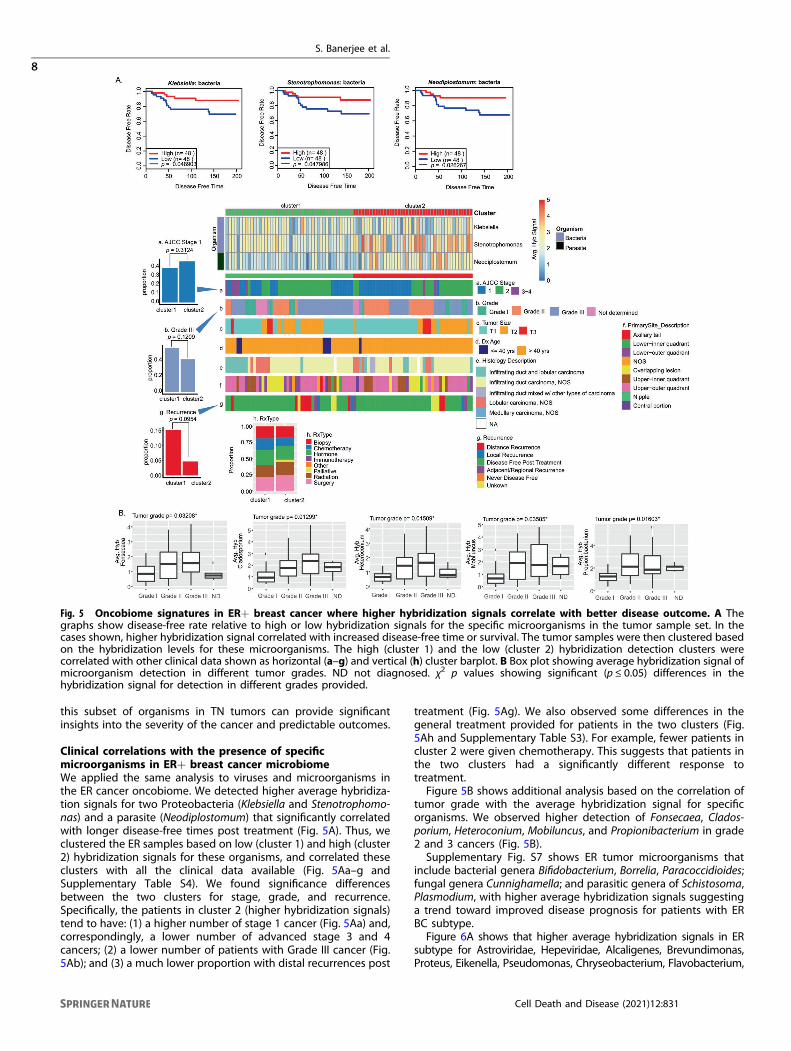
Clinical correlations with the presence of specificmicroorganisms in ER+ breast cancer microbiomeWe applied the same analysis to viruses and microorganisms inthe ER cancer oncobiome. We detected higher average hybridiza-tion signals for two Proteobacteria (Klebsiella and Stenotrophomo-nas) and a parasite (Neodiplostomum) that significantly correlatedwith longer disease-free times post treatment (Fig. 5A). Thus, weclustered the ER samples based on low (cluster 1) and high (cluster2) hybridization signals for these organisms, and correlated theseclusters with all the clinical data available (Fig. 5Aa–g andSupplementary Table S4). We found significance differencesbetween the two clusters for stage, grade, and recurrence.Specifically, the patients in cluster 2 (higher hybridization signals)tend to have: (1) a higher number of stage 1 cancer (Fig. 5Aa) and,correspondingly, a lower number of advanced stage 3 and 4cancers; (2) a lower number of patients with Grade III cancer (Fig.5Ab); and (3) a much lower proportion with distal recurrences post
treatment (Fig. 5Ag). We also observed some differences in thegeneral treatment provided for patients in the two clusters (Fig.5Ah and Supplementary Table S3). For example, fewer patients incluster 2 were given chemotherapy. This suggests that patients inthe two clusters had a significantly different response totreatment.Figure 5B shows additional analysis based on the correlation of
tumor grade with the average hybridization signal for specificorganisms. We observed higher detection of Fonsecaea, Clados-porium, Heteroconium, Mobiluncus, and Propionibacterium in grade2 and 3 cancers (Fig. 5B).Supplementary Fig. S7 shows ER tumor microorganisms that
include bacterial genera Bifidobacterium, Borrelia, Paracoccidioides;fungal genera Cunnighamella; and parasitic genera of Schistosoma,Plasmodium, with higher average hybridization signals suggestinga trend toward improved disease prognosis for patients with ERBC subtype.Figure 6A shows that higher average hybridization signals in ER
subtype for Astroviridae, Hepeviridae, Alcaligenes, Brevundimonas,Proteus, Eikenella, Pseudomonas, Chryseobacterium, Flavobacterium,
Fig. 5 Oncobiome signatures in ER+ breast cancer where higher hybridization signals correlate with better disease outcome. A Thegraphs show disease-free rate relative to high or low hybridization signals for the specific microorganisms in the tumor sample set. In thecases shown, higher hybridization signal correlated with increased disease-free time or survival. The tumor samples were then clustered basedon the hybridization levels for these microorganisms. The high (cluster 1) and the low (cluster 2) hybridization detection clusters werecorrelated with other clinical data shown as horizontal (a–g) and vertical (h) cluster barplot. B Box plot showing average hybridization signal ofmicroorganism detection in different tumor grades. ND not diagnosed. χ2 p values showing significant (p ≤ 0.05) differences in thehybridization signal for detection in different grades provided.
S. Banerjee et al.
8
Cell Death and Disease (2021) 12:831

Fig. 6 Oncobiome signatures in ER+ BCs where high hybridization signals correlated with worse disease outcome. A The graphs showsurvival time relative to high or low hybridization signals for the specific microorganisms shown. In the cases shown, higher hybridizationsignal correlated with decreased survival. B. ER+ BC samples were then clustered based on the hybridization levels for these microorganisms.The low (cluster 1) and the high (cluster 2) hybridization detection clusters correlated with other clinical data shown as horizontal (a–g) andvertical (h) cluster barplot.
S. Banerjee et al.
9
Cell Death and Disease (2021) 12:831

Ureaplasma, Echinococcus, Giardia, Trypanosoma, Brugia, Strongy-loides, Paragonimus, and Saccharomyces correlated with reducedsurvival rates. In Fig. 6B, the ER samples were clustered according tolow (cluster 1) and high (cluster 2) hybridization signals for theseorganisms. We found that patients in cluster 2 tended to have: (1) alower proportion of grade 1 tumors (Fig. 6Bb); and (2) and a higherproportion of distant recurrence of cancer post treatment (Fig. 6Bg).We did not find any significant differences in the treatment regimefor the cluster 1 and 2 patients (Supplementary Table S5 and Fig.6Bh) suggesting that cluster 2 patients may have responded betterto specific treatments. Additional examples of microorganisms wherehigher detection may be associated with poor disease prognosis inER+ cancer are shown in Supplementary Fig. S8.As noted for TN cancers, the average hybridization signal of a
small number of specific viruses and microorganisms in ER+tumors can provide significant insight into the severity of thecancer and the predictable outcomes.
Clinical correlations with the presence of specificmicroorganisms in HR tumorsIn HR cancers we did not find significant correlations betweenhigher detection of specific microorganisms and better diseaseoutcome, as indicated by less recurrence or greater survival(Supplementary Fig. S7). However, Fig. 7A shows that lower average
hybridization signals for Pseudoterranova, Ancylostoma, Trichuris,and Issatchenkia statistically correlated with increased disease-freetime after treatment. In Fig. 7B, we clustered the HR samples basedon low (cluster 1) and high (cluster 2) hybridization signals for thefour organisms. HR patients in cluster 2, who had relatively higherdetection of these microorganisms (1) were mostly above 40 yearsof age (Fig. 7Bd); and (2) showed a higher proportion of distantrecurrence of disease post treatment (Fig. 7Bg). There were nosignificant differences in the general treatment regime betweencluster 1 and 2 (Fig. 7Bh and Supplementary Table S6) suggestingthat patients in cluster 2 may not have responded to theirtreatment as well as patients in cluster 1. These data againsuggested that the average hybridization signal of a few specificmicroorganisms in ER+ tumors can provide significant insights intothe severity of the cancer and the predictable outcomes. However,a larger study may provide more statistical significance and thusbroader and stronger correlations with available clinical data.
Clinical correlations with the presence of specificmicroorganisms in TP tumorsAnalysis of the TP tumor data showed a number of organisms,where high average signals correlated significantly with lessdisease-free time post treatment or less survival time (Fig. 8A).These microorganisms include bacterial genera of Orientia,
Fig. 7 Oncobiome signatures in HER2+ BCs where high hybridization signals correlated with worse disease outcome. A The graphs showdisease-free rate relative to high or low hybridization signals for the specific microorganisms in the tumor sample set. In the cases shown,higher hybridization signal correlates with decreased disease-free time. These microorganisms detected in patients with lower disease-freerate or survival were not significantly associated with higher cancer staging. B The tumor samples were then clustered based on thehybridization levels for these microorganisms. The low (cluster 1) and the high (cluster 2) hybridization detection clusters correlated withother clinical data shown as horizontal (a–g) and vertical (h) cluster barplot.
S. Banerjee et al.
10
Cell Death and Disease (2021) 12:831

Fig. 8 Oncobiome signatures in TP+ BCs where higher hybridization signals correlated with worse outcome. A The graphs show disease-free rate relative to high or low hybridization signals for specific microorganisms in the tumor sample set. In the cases shown, higherhybridization signal correlated with decreased disease-free time. B The tumor samples were then clustered based on the hybridization levelsfor these microorganisms. The high (cluster 1) and the low (cluster 2) hybridization detection clusters correlated with other clinical data shownas horizontal (a–g) and vertical (h) cluster barplot.
S. Banerjee et al.
11
Cell Death and Disease (2021) 12:831

Klebsiella, Fusobacterium, Azorhizobium, Yersinia, Arthroderma, viralfamily Anelloviridae and parasitic genera Angiostrongylus, andToxocara. Patients were clustered into high (cluster 1) and low(cluster 2) levels of detection and correlated with clinical data (Fig.8B and Supplementary Table S7). The patients who had higherdetection levels for these microorganisms (cluster 1) tended tohave a higher proportion who were never disease free posttreatment (Fig. 8Bg). However, this small number of patients incluster 1 that resulted in this specific observation had limitedstatistical significance and so was strongly correlative. Supple-mentary Fig. S10 gives further examples of specific microorganismthat tended to correlate with better or worse clinical outcome, butagain for this group, the statistical significance was limited. Alarger study of TP samples will increase sample size for the clustersand therefore increase the statistical significance and strongercorrelations with clinical data.
DISCUSSIONSWe have previously studied the oncobiome of TN, ER, HR, and TPBC, the four subtypes of BC with a small number of study cohort[3]. In this current study, we re-examined our previous findingsusing an independent cohort of patients from a distinct site andscreened over 400 BC samples, with associated clinical data. Inagreement with the previous study, we showed that each BCsubtype had a very diverse oncobiome with ER having the mostdiverse and TN having the least diverse oncobiome. There aremany shared viruses and microorganisms across the oncobiomes,but also unique ones, the presence or absence of which canspecifically distinguish TN, ER, HR, and TP cancers from each other.Since the four BC subtypes differ in Her2 expression andendocrine receptor signaling, it is possible that they havedeveloped their own subtype-specific oncobiomes. Whether ornot these oncobiomes contribute to the genesis or developmentof the cancers is still unknown. It is also possible that the tumormicroenvironment provides a unique niche in which thecomponents of the oncobiome can persist. No matter what thecase may be, the unique oncobiomes provide biomarkers fordiagnostic and prognostic purpose.In this study we reported nucleic acid signatures of the viruses
and other microorganisms that were found to be significantlyhigher in the BCs compared to healthy, non-matched controls(breast tissue from non-cancerous patients). The lack ofdetection of a specific virus or microorganism does not implythat the cancer is devoid of the virus or microorganism, but thatthe detection level is not significantly higher than the healthynon-matched controls. We found that matched control samples(pathologically normal tissues adjacent to the tumor tissue) oftenhad microbial signatures that were significantly greater than thehealthy, non-matched controls, and often similar to the levelsseen in the tumors, most obvious in TN and ER cancers. Thisfinding suggests two intriguing possibilities (1) that theoncobiome in the local microenvironment can extend tosurrounding tissues; or (2) that the oncobiome found in thetumor formed prior to the genesis of the tumor. The latterpossibility suggests a more active role at the site for tumordevelopment. In this regard, we noted that the position of TNtumors in the breast correlated with levels of detection ofspecific oncobiome signatures.The detection of nucleic acid signatures for different DNA
viruses, such as herpesviruses, papillomaviruses, and polyoma-viruses in different BC subtypes, has been well documented[6, 27–31]. What is more surprising is our consistent detection, inthis and previous studies [3, 6], of signatures of poxviruses andparapoxviruses in the BC microbiome [32–35]. We have recentlyshown that the viral-VEGF encoded by Parapoxviruses, to promoteproliferation of breast cancer and normal breast cells, whilealtering metabolic phenotype in normal breast cells, thus
contributing to disease progression [36]. The detection of DNAsignatures related to the Yaba Monkey Tumor Virus, a tumorigenicpoxvirus, in all but TN cancer, suggests a potential role of thisvirus, or a human variant or fragments of this virus, in theoncogenic process [37]. Also noteworthy is the detection of mousemammary tumor virus Env gene signatures significantly detectedin all the BC types agreeing with our previous study and studies ofothers [6, 38, 39]. We cannot explain this finding but noted thatnot all probes for MMTV were detected and it may be that thisrepresents a representation of a highly similar family member yetunidentified. In some BC subtypes that are not HIV positive, wenoted significantly higher detection of signatures for HTLV, andother lentiviral signatures of SHIV, HIV-1, and bovine immunode-ficiency virus 1 that may be uncharacterized human lentiviruses.The abundance of the gram-negative Proteobacteria phylum
detected tissues of the BC subtypes was not surprising, as it wasreported earlier [3, 40–42], and may be associated with cancerdevelopment and/or with different responses to therapy. Thedetection of the signatures for the gram-negative anaerobicbacteria Fusobacterium in the BC subtypes was interesting as it isknown to accelerate cancer development by enhancing cellularproliferation and protecting tumors from immune cell attack[43–45].We detected signatures of skin fungi, yeasts, and parasitic
signatures in all cancer types in agreement with our previousresults [3]. In addition, the cancer samples contained signatures ofpreviously described cancer-associated fungi such as Fonsecaea,Trichosporon, Microsporidians such as Nosema and Pleistophora[3, 6, 8, 46–49], and some parasites such as Trypanosoma,Plasmodium, Strongyloides, Trichinella, and Taenia [3, 6–8, 46, 50, 51].Hierarchical clustering of the tumor microbiome signatures
showed specific sub-signatures for each cancer, in agreementwith previous studies [3, 6, 7, 18, 19, 52]. We examined whetherthe level of detection of viruses and other microorganismsstrongly correlated with better or worse outcomes. As shown inFigs. 4–8, the levels of detection of a few viruses andmicroorganisms strongly correlated with survival time ordisease-free time, and depended on the cancer subtype, tumorgrade, tumor size, position of the tumor in the breast, andresponse to treatment. These data were statistically significantfor TN and ER and strongly correlative for HR and TP. Thus, ourdata showed that the level of detection of some viruses andother microorganisms in the oncobiome of each BC subtype canprovide significant prognostic and diagnostic value with insightsinto intervention strategies that can precisely target patientswith a specific BC subtype.Our study on more than 450 breast tumor samples, matched
control, and non-matched control draws a comprehensive mapshowing the microbial population prevalent in each of the BCsubtypes. We have successfully established a signature onco-biome for each BC subtype, and established a trend or correlationbetween the abundance of specific microbes with survival time ordisease-free time for each subtype. Thus, our current studyprovides more clarity regarding the prognostic and diagnosticaspects of the oncobiome in BCs, which could be important fordeveloping future treatment strategies with targeted precisiontherapies.
REFERENCES1. Xuan C, Shamonki JM, Chung A, Dinome ML, Chung M, Sieling PA, et al. Microbial
dysbiosis is associated with human breast cancer. PLoS One. 2014;9:e83744.2. Castano-Rodriguez N, Goh KL, Fock KM, Mitchell HM, Kaakoush NO. Dysbiosis of
the microbiome in gastric carcinogenesis. Sci Rep. 2017;7:15957.3. Banerjee S, Tian T, Wei Z, Shih N, Feldman MD, Peck KN, et al. Distinct microbial
signatures associated with different breast cancer types. Front Microbiol.2018;9:951.
S. Banerjee et al.
12
Cell Death and Disease (2021) 12:831

4. Sheflin AM, Whitney AK, Weir TL. Cancer-promoting effects of microbial dysbiosis.Curr Oncol Rep. 2014;16:406.
5. Turnbaugh PJ, Ley RE, Mahowald MA, Magrini V, Mardis ER, Gordon JI. An obesity-associated gut microbiome with increased capacity for energy harvest. Nature.2006;444:1027–31.
6. Banerjee S, Wei Z, Tan F, Peck KN, Shih N, Feldman M, et al. Distinct micro-biological signatures associated with triple negative breast cancer. Sci Rep.2015;5:15162. https://doi.org/10.1038/srep15162
7. Banerjee S, Tian T, Wei Z, Shih N, Feldman MD, Alwine JC, et al. The ovariancancer oncobiome. Oncotarget. 2017;8:36225–45.
8. Banerjee S, Tian T, Wei Z, Peck KN, Shih N, Chalian AA, et al. Microbial signaturesassociated with oropharyngeal and oral squamous cell carcinomas. Sci Rep.2017;7:4036.
9. Porter CM, Shrestha E, Peiffer LB, Sfanos KS. The microbiome in prostateinflammation and prostate cancer. Prostate Cancer Prostatic Dis. 2018;21:345–54.
10. Zhao H, Chu M, Huang Z, Yang X, Ran S, Hu B, et al. Variations in oral microbiotaassociated with oral cancer. Sci Rep. 2017;7:11773.
11. Gopalakrishnan V, Helmink BA, Spencer CN, Reuben A, Wargo JA. The influence ofthe gut microbiome on cancer, immunity, and cancer immunotherapy. CancerCell. 2018;33:570–80.
12. Zitvogel L, Ma Y, Raoult D, Kroemer G, Gajewski TF. The microbiome in cancerimmunotherapy: diagnostic tools and therapeutic strategies. Science.2018;359:1366–70.
13. Dai X, Cheng H, Bai Z, Li J. Breast cancer cell line classification and its relevancewith breast tumor subtyping. J Cancer. 2017;8:3131–41.
14. Thursby E, Juge N. Introduction to the human gut microbiota. Biochem J.2017;474:1823–36.
15. Siegel RL, Miller KD, Jemal A. Cancer statistics, 2019. CA Cancer J Clin.2019;69:7–34.
16. Rea D, Coppola G, Palma G, Barbieri A, Luciano A, Del Prete P, et al. Microbiotaeffects on cancer: from risks to therapies. Oncotarget. 2018;9:17915–27.
17. Baldwin DA, Feldman M, Alwine JC, Robertson ES. Metagenomic assay for iden-tification of microbial pathogens in tumor tissues. mBio. 2014;5:e01714–14.
18. Banerjee S, Peck KN, Feldman MD, Schuster MG, Alwine JC, Robertson ES. Iden-tification of fungal pathogens in a patient with acute myelogenic leukemia usinga pathogen detection array technology. Cancer Biol Ther. 2016;17:339–45.
19. Banerjee S, Alwine JC, Wei Z, Tian T, Shih N, Sperling C, et al. Microbiome sig-natures in prostate cancer. Carcinogenesis. 2019;40:749–64.
20. Kelly JR, Minuto C, Cryan JF, Clarke G, Dinan TG. Cross talk: the microbiota andneurodevelopmental disorders. Front Neurosci. 2017;11:490.
21. Wang B, Zhu J, Pierson E, Ramazzotti D, Batzoglou S. Visualization and analysis ofsingle-cell RNA-seq data by kernel-based similarity learning. Nat Methods.2017;14:414–6.
22. Kolde R. pheatmap: pretty heatmaps. R package version 1.0.8. 2015.23. Kaplan EL, Meier P. Nonparametric estimation from incomplete observations. J
Am Stat Assoc. 1958;53:457–81.24. Benjamini Y, Hochberg Y. Controlling the false discovery rate: a practical and
powerful approach to multiple testing. J R Statist Soc B. 1995;57:289–300.25. Cox DR, Royal Statistical Society. Regression models and life-tables. J R Statist Soc
B. 1972;34:187–220.26. DeSantis CE, Ma J, Goding Sauer A, Newman LA, Jemal A. Breast cancer sta-
tistics, 2017, racial disparity in mortality by state. CA Cancer J Clin.2017;67:439–48.
27. Corbex M, Bouzbid S, Traverse-Glehen A, Aouras H, McKay-Chopin S, Carreira C,et al. Prevalence of papillomaviruses, polyomaviruses, and herpesviruses in triple-negative and inflammatory breast tumors from algeria compared with othertypes of breast cancer tumors. PLoS One. 2014;9:e114559.
28. Hachana M, Amara K, Ziadi S, Gacem RB, Korbi S, Trimeche M. Investigation ofhuman JC and BK polyomaviruses in breast carcinomas. Breast Cancer Res Treat.2012;133:969–77.
29. Hsu CR, Lu TM, Chin LW, Yang CC. Possible DNA viral factors of human breastcancer. Cancers. 2010;2:498–512.
30. Omura Y, Jones MK, Nihrane A, Duvvi H, Shimotsuura Y, Ohki M. More than 97%of human papilloma virus type 16 (HPV-16) was found with chrysotile asbestos &relatively smooth round tumor outline, and less than 3% was found with HPV-18and tremolite asbestos & irregular sawtooth-like zigzag outline in breast cancertissues in over 500 mammograms of female patients: their implications indiagnosis, treatment, and prevention of breast cancer. Acupunct Electrother Res.2013;38:211–30.
31. Salman NA, Davies G, Majidy F, Shakir F, Akinrinade H, Perumal D, et al. Asso-ciation of high risk human papillomavirus and breast cancer: a UK based study.Sci Rep. 2017;7:43591.
32. Borgstrom P, Gold DP, Hillan KJ, Ferrara N. Importance of VEGF for breast cancerangiogenesis in vivo: implications from intravital microscopy of combination
treatments with an anti-VEGF neutralizing monoclonal antibody and doxorubicin.Anticancer Res. 1999;19:4203–14.
33. Ferrara N. Vascular endothelial growth factor: basic science and clinical progress.Endocr Rev. 2004;25:581–611.
34. Lyttle DJ, Fraser KM, Fleming SB, Mercer AA, Robinson AJ. Homologs of vascularendothelial growth factor are encoded by the poxvirus orf virus. J Virol.1994;68:84–92.
35. Savory LJ, Stacker SA, Fleming SB, Niven BE, Mercer AA. Viral vascular endo-thelial growth factor plays a critical role in orf virus infection. J Virol.2000;74:10699–706.
36. Bose D, Banerjee S, Singh RK, Wise LM, Robertson ES. Vascular endothelial growthfactor encoded by Parapoxviruses can regulate metabolism and survival of triplenegative breast cancer cells. Cell Death & Disease 2020;11. https://doi.org/10.1038/s41419-020-03203-4
37. Brunetti CR, Amano H, Ueda Y, Qin J, Miyamura T, Suzuki T, et al. Completegenomic sequence and comparative analysis of the tumorigenic poxvirus Yabamonkey tumor virus. J Virol. 2003;77:13335–47.
38. Mazzanti CM, Al Hamad M, Fanelli G, Scatena C, Zammarchi F, Zavaglia K, et al. Amouse mammary tumor virus env-like exogenous sequence is strictly related toprogression of human sporadic breast carcinoma. Am J Pathol. 2011;179:2083–90.
39. Pogo BG, Melana SM, Holland JF, Mandeli JF, Pilotti S, Casalini P, et al. Sequenceshomologous to the mouse mammary tumor virus env gene in human breastcarcinoma correlate with overexpression of laminin receptor. Clin Cancer Res.1999;5:2108–11.
40. Fernandez MF, Reina-Perez I, Astorga JM, Rodriguez-Carrillo A, Plaza-Diaz J,Fontana L. Breast cancer and its relationship with the microbiota. Int J EnvironRes Public Health. 2018;15:1747.
41. Wang H, Altemus J, Niazi F, Green H, Calhoun BC, Sturgis C, et al. Breast tissue,oral and urinary microbiomes in breast cancer. Oncotarget. 2017;8:88122–38.
42. Urbaniak C, Gloor GB, Brackstone M, Scott L, Tangney M, Reid G. The microbiotaof breast tissue and its association with breast cancer. Appl Environ Microbiol.2016;82:5039–48.
43. Chen Y, Peng Y, Yu J, Chen T, Wu Y, Shi L, et al. Invasive Fusobacterium nucleatumactivates beta-catenin signaling in colorectal cancer via a TLR4/P-PAK1 cascade.Oncotarget. 2017;8:31802–14.
44. Abed J, Maalouf N, Parhi L, Chaushu S, Mandelboim O, Bachrach G. Tumor tar-geting by Fusobacterium nucleatum: a pilot study and future perspectives. FrontCell Infect Microbiol. 2017;7:295.
45. Gur C, Ibrahim Y, Isaacson B, Yamin R, Abed J, Gamliel M, et al. Binding of theFap2 protein of Fusobacterium nucleatum to human inhibitory receptor TIGITprotects tumors from immune cell attack. Immunity. 2015;42:344–55.
46. Azevedo CM, Marques SG, Santos DW, Silva RR, Silva NF, Santos DA, et al.Squamous cell carcinoma derived from chronic chromoblastomycosis in Brazil.Clin Infect Dis. 2015;60:1500–4.
47. Magee K, Hata DJ, Meza D. Trichosporon asahii infection in a patient withmetastatic prostate cancer as an example of an emerging fungal pathogen. LabMed. 2015;46:e74–78.
48. de Almeida Junior JN, Hennequin C. Invasive trichosporon infection: a systematicreview on a re-emerging fungal pathogen. Front Microbiol. 2016;7:1629.
49. Chandramathi S, Suresh K, Anita ZB, Kuppusamy UR. Infections of Blastocystishominis and microsporidia in cancer patients: are they opportunistic? Trans R SocTropical Med Hyg. 2012;106:267–9.
50. Kristek J, Marjanovic K, Dmitrovic B, Krajinovic Z, Sakic K. Trichinella spiralis andbreast carcinoma—a case report. Coll Antropolo. 2005;29:775–7.
51. Herrera LA, Ramirez T, Rodriguez U, Corona T, Sotelo J, Lorenzo M, et al. Possibleassociation between Taenia solium cysticercosis and cancer: increased frequencyof DNA damage in peripheral lymphocytes from neurocysticercosis patients.Trans R Soc Tropical Med Hyg. 2000;94:61–65.
52. Baquero F, Nombela C. The microbiome as a human organ. Clin Microbiol Infect.2012;18:2–4.
ACKNOWLEDGEMENTSWe would like to acknowledge Ayasdi Inc., for providing access to their topologicaldata analysis software. We would also like to thank the Pathology Resource Networkat RPCCC, and the Tumor Tissue Bank personnel at the Hospital of the University ofPennsylvania for their efforts in the acquisition and processing of all samples used inthis study. Dr James Alwine was extremely helpful in discussion of the project andextensively editing and organizing the data during preparation of the manuscriptand we are thankful for his valuable insights. We would also like to thank Sean Nievesfor his assistance in screening of the human samples and helped in sample storageand maintenance, and provided technical assistance for microarray screening of allthe samples.
S. Banerjee et al.
13
Cell Death and Disease (2021) 12:831

AUTHOR CONTRIBUTIONSESR conceptualized the study; SB and ESR planned the experiments; SB performedthe microarray screening; SB analyzed part of the data, made tables and figures forthe manuscript, and wrote the manuscript with contributions from DB; ZW and TTanalyzed the microarray raw data, performed statistics and correlation analysis; DBhelped in critical evaluation of the data and reviewing the manuscript and addressingthe reviewers queries; NS and MDF were the pathologists who provided andevaluated the samples for identification of breast cancer and controls; ADM identifiedthe patients with different breast cancer types for inclusion in the study; and TKprovided all the patient clinical data for the study.
FUNDINGThe study was supported by Avon Foundation Grant no. Avon-02-2012-053 (to ESR),and from the Abramson Cancer Center Director’s fund. Support was also obtainedfrom the Penn Innovational StartUp company ExcaliViR Inc. to ESR, and a subcontractfrom BioRad Laboratories Inc.
COMPETING INTERESTSThe authors declare no competing interests.
ETHICS APPROVALAll the experiments were performed according to relevant guidelines and regulationsas needed and according to all the licensing and approvals by institutionalcommittees at Perelman School of Medicine, University of Pennsylvania and theUniversity of Buffalo School of Medicine, Roswell Park Cancer Institute IRB #BDR084317 who provided an independent cohort of patients and clinical data tosupport our findings.
ADDITIONAL INFORMATIONSupplementary information The online version contains supplementary materialavailable at https://doi.org/10.1038/s41419-021-04092-x.
Correspondence and requests for materials should be addressed to ErleS. Robertson
Reprints and permission information is available at http://www.nature.com/reprints
Publisher’s note Springer Nature remains neutral with regard to jurisdictional claimsin published maps and institutional affiliations.
Open Access This article is licensed under a Creative CommonsAttribution 4.0 International License, which permits use, sharing,
adaptation, distribution and reproduction in anymedium or format, as long as you giveappropriate credit to the original author(s) and the source, provide a link to the CreativeCommons license, and indicate if changes were made. The images or other third partymaterial in this article are included in the article’s Creative Commons license, unlessindicated otherwise in a credit line to the material. If material is not included in thearticle’s Creative Commons license and your intended use is not permitted by statutoryregulation or exceeds the permitted use, you will need to obtain permission directlyfrom the copyright holder. To view a copy of this license, visit http://creativecommons.org/licenses/by/4.0/.
© The Author(s) 2021
S. Banerjee et al.
14
Cell Death and Disease (2021) 12:831