Prognostic factors in Uveal Melanoma
161
Prognostic factors in Uveal Melanoma Emine Kılıç
-
Upload
khangminh22 -
Category
Documents
-
view
0 -
download
0
Transcript of Prognostic factors in Uveal Melanoma

Prognostic factors in Uveal Melanoma
Emine Kılıç

Prognostic factors in Uveal Melanoma
Prognostische factoren in oogmelanomen
Emine Kılıç

ISBN-10: 90-9020525-X
ISBN-13: 978-90-9020525-0
© Emine Kılıç
No part of this book may be reproduced, stored in a retrieval system or transmitted in any form or by any
means, without permission of the author. The copyright of published papers remains with the publishers.
Lay-out: Tom de Vries Lentsch
Cover: Emine Kılıç / Tom de Vries Lentsch
Printed by PrintPartners Ipskamp, Enschede
The work described in this thesis was supported by the Dutch Foundation Fighting against Blindness
(ANVVB), the Rotterdam Blindness Foundation (Rotterdamse Vereniging Blindenbelangen), Stichting
OOG, Henkes stichting, Stichting Wetenschappelijk Onderzoek Oogziekenhuis (SWOO) and Revolving
Fund of the Erasmus University Rotterdam.

Prognostic factors in Uveal Melanoma
Prognostische factoren in oogmelanomen
Proefschrift
ter verkrijging van de graad van doctor aan de Erasmus Universiteit Rotterdam
op gezag van de rector magnificusProf.dr. S.W.J. Lamberts
en volgens besluit van het College voor Promoties
De openbare verdediging zal plaatsvinden op
woensdag 19 april 2006 om 13:45 uur
door
Emine Kılıçgeboren te Gorinchem

Promotiecommissie
Promotor Prof.dr. G. van Rij
Overige leden Prof.dr. P.C. Levendag Prof.dr. P.T.V.M. de Jong Prof.dr. B.A. Oostra
Copromotoren Dr. A. de Klein Dr. G.P.M. Luyten

Contents
7 Publications and manuscripts based on studies described in this thesis
Chapter 1 11 General introduction
Part 1 Radiotherapy in uveal melanoma
Chapter 2 22 Dose fractionation effects in primary and metastatic human uveal melanoma cell lines
Chapter 3 36 Reduced melanoma-related mortality in uveal melanoma by pre-enucleation radiotherapy
Part 2 Characterisation of chromosomal aberrations in uveal melanoma
Chapter 4 46 Concurrent loss of chromosome 1p and 3 predicts a decreased disease free survival in uveal melanoma patients
Chapter 5 60 Clinical and cytogenetic analyses in uveal melanoma
Chapter 6 72 Chromosome imbalances in familial uveal melanoma detected by comparative genomic hybridisation
Part 3 Candidate genes and regions associated with uveal melanoma progression
Chapter 7 82 Fine mapping of chromosome 3 structural deletions in uveal melanoma cell lines
Chapter 8 98 Differential expression of TP63 and TP73 in uveal melanoma reveals an increased expression of p73∆ex2 transcript in tumours with loss of chromosome 1p
Chapter 9 110 RAS-BRAF kinase pathway is not involved in uveal melanoma
Chapter 10 117 General discussion and future prospects
References 125
Summary / Samenvatting 139
Biography 143
Dankwoord 145
Supplementary information 151
Colour figures 155


�
Publications and manuscripts based on the studies described in this thesis
Chapter 2 G.J.M.J. van den Aardweg, E. Kilic, A. de Klein, G.P.M. Luyten Dose fractionating effects in uveal melanoma cell lines. IOVS 2003 Nov.; 44(11):4660-4
Chapter 3 E. Kilic, T. Stijnen, P.T.V.M. de Jong, C.M. Mooy, W.M.H. Eijkenboom, P. Ringens, G.P.M. Luyten Reduced melanoma related mortality in uveal melanoma by pre-enucleation radiotherapy. Arch. Ophthalmol. 2005 Oct;123(10) 1363-7
Chapter 4 E. Kilic, N.C. Naus, W. van Gils, C.C.W. Klaver, M.E. van Til, M.M.P.J. Verbiest, C.M. Mooy, T. Stijnen, D. Paridaens, H.B. Beverloo, G.P.M. Luyten, A. de Klein; Concurrent loss of chromosome 1p and 3 predicts a decreased disease free survival in uveal melanoma patients. IOVS 2005 Jun; 46(7); 2253-7
Chapter 5 E. Kilic, W. van Gils, E. Lodder, H.B. Beverloo, M.E. van Til, C.M. Mooy, D. Paridaens, A. de Klein, G.P.M. Luyten Clinical and cytogenetic aberrations in uveal melanoma. (submitted)
Chapter 6 E. Kilic, W. van Gils, A. Azmani, N.C. Naus, H. Douben, H.W. Mensink, D. Paridaens, C.M. Mooy, J.U. Prause, G.P.M. Luyten, A. de Klein Chromosome imbalances in familial uveal melanoma detected by comparative genomic hybridisation. (submitted)
Chapter 7 H.B. Brüggenwirth, E. Kilic, M.M.P.J. Verbiest, W. van Gils, A. Verhoeven, N.C. Naus, G.P.M. Luyten, A. de Klein Fine mapping of chromosome 3 structural deletions in uveal melanoma cell lines. (submitted)
Chapter 8 E. Kilic, H.B. Brüggenwirth, M. Meier, N.C. Naus, H.B. Beverloo, J.P.P. Meijerink, G.P.M. Luyten, A. de Klein Differential expression of TP63 and TP73 in uveal melanoma reveals an increased expression of p73∆ex2 transcript in tumours with loss of chromosome 1p. (submitted)
Chapter 9 E. Kilic, H.B. Brüggenwirth, M.M.P.J. Verbiest, E.C. Zwarthoff, C.M. Mooy, G.P.M. Luyten, A. de Klein RAS-BRAF kinase pathway is not involved in uveal melanoma. Mel. Res. 2004 jun;14(3):203-5


General introduction
Chapter 1
General introduction


General introduction
11
Cancer in general
Cancer is the second leading cause of death in the Netherlands affecting 69.000 people annually (KWF 1999). It refers to any malignant growth of cells in the body. Tumour cells grow tempestuously and have acquired the ability to invade surrounding tissues. This implies, in general, that they can escape and enter the bloodstream or lymphatic vessels, and form secondary tumours at other sites of the body. Cancer can be divided in two separate groups: haematological and solid malignancies.
Chromosomal aberrations in cancerEvery normal human somatic cell has a diploid karyotype consisting of 46 chromosomes, from which 22 pairs of autosomes (1-22) and 2 sex chromosomes (X and Y). In 1890 David von Hansemann already observed abnormal mitoses in cancer cells. Boveri (1914) elaborated on this finding by suggesting that abnormalities of chromosome constitution are fundamental to cancer. These alterations may involve the number, or more frequently, the structure of the chromosomes. Numerical changes comprise losses and gains of chromosomes and an altered ploidy. Tumours with characteristic ploidy changes are colorectal cancers, melanoma (skin/uvea), bladder and breast tumours. Structural changes may arise through breakage and reunion of different chromosomes resulting in deletions, insertions, inversions, translocations and rings. The first recurrent chromosomal alteration was the Philadelphia chromosome in chronic myelogenous leukaemia discovered by Hungerford in 1960. This rearrangement resulted in formation of a fusion gene that encoded for a fusion protein with oncogenic activity. Furthermore, gene amplifications are seen as homogenously stained regions or double minute chromosomes (Heim 1995; Lengauer, et al. 1998). The amplicons contain 0.5-1.0 megabases of DNA and at molecular level multiple copies of gene(s) can be seen. An example is the amplification of N-myc that occurs in approximately 30% of advanced neuroblastoma (Seeger, et al. 1985).
Initiation and progression related chromosomal aberrationsTumorigenesis has long been thought to be a multi step process with genetic alterations. Based on the amount of chromosomal aberrations two karyotypic patterns can be distinguished: simple and complex patterns. The simple pattern is characterised by rearrangements of chromosomal segments in specific cancers. Amongst these are the haematological malignancies, lymphomas, some sarcomas and other rare tumours (Le Beau and Rowley 1986). The simple karyotype represents in general primary chromosomal changes. These primary changes can be specific for a certain tumour-type, occur frequently and indicate a causal role in tumour initiation. Generally, these rearrangements lead to the activation of an

12
Chapter 1
oncogene (s.a. c-MYC translocation in Burkitt’s lymphoma) or fusion with another gene (s.a. fusion of BCR and c-ABL on the Philadelphia chromosome in chronic myelogenous leukaemia). The number of aberrations increases in more advanced tumours (Albertson, et al. 2003), and aggressive tumours have relative high copy number alterations per case (Ried, et al. 1999). Thus, the complex karyotype exhibits many chromosomal aberrations and supports a role for acquisition of additional chromosomal changes (secondary changes), which are less tumour-type specific, during tumour progression (Albertson, et al. 2003; Lengauer, et al. 1998; Sandberg 1991). Since there are many more aberrations in solid tumours than the non-random ones, it is assumed that many aberrations are mere noise representing the chromosomal instability of the tumour. Chromosomal instability, involving gains and losses of whole chromosomes, is likely to occur in most human malignancies (Albertson, et al. 2003; Lengauer, et al. 1998). In breast cancer, for example, the frequency of aberrations is low in hyperplasia and higher in carcinoma in situ. The same holds for colorectal carcinomas (Albertson, et al. 2003). Furthermore, due to the chromosomal instability a tumour can lose for example one maternal chromosome and duplicate the paternal counterpart, which results in two copies, but an abnormal ‘allelotype’ (Lengauer, et al. 1998), indicating an underestimation of such changes.
“…In every normal cell there is a specific arrangement for inhibiting, which allows the process of division to begin only when the inhibition has been overcome by a special stimulus…On the other hand, the assumption of the existence of chromosomes which promote division, might satisfy this postulate…” Boveri 1914
Genes involved in cancerChanges in gene copy number due to recurrent chromosomal aberrations may probably contribute to tumour development or progression (Albertson, et al. 2003). The genes that play a part in tumour development encode proteins, which regulate cellular growth and differentiation under normal circumstances. These processes are controlled through inactivation and activation of genes with growth inhibiting (tumour suppressor genes) and growth promoting (proto-oncogenes) function. Predisposition to cancer was explained by Knudsons’ two-hit-hypothesis where two successive inactivating hits (mutations) of tumour suppressor genes are required for malignant transformation of cells (Knudson 1971). Examples of classical tumour suppressor genes are Rb and p53. Both have a regulatory role during the cell cycle, thus when activated cell cycle arrest and apoptosis is induced. Rb was the first discovered tumour suppressor gene. In familial cases of retinoblastoma one allele had a germ-

General introduction
13
Figure 1.Schematic illustration of the eye on the left. Histological sections of uveal melanoma on the right; melanoma lo-cated in the iris (A), ciliary body (B) and choroid (C).
line mutation and the second allele was inactivated by a somatic mutation (Cavenee, et al. 1983). In contrast to inactivation of tumour suppressor genes, proto-oncogenes need to be activated. Oncogenes may cause malignant transformation when they are overexpressed due to amplification or constitutively activated by mutation(s). An example of an oncogene is RAS. Under normal circumstances the RAS-family of genes mediates cellular responses to growth signals. Activating mutations of RAS are found in 25% of all cancers, for example colon and lung cancers (Bos 1989).
Uveal Melanoma
During embryogenesis neural crest cells migrate to the uveal tract, where they develop into melanocytes. Melanomas of the uvea are derived from these melanocytes. Uveal melanoma is the most common cause of primary eye cancer in the Western world with an annual incidence of approximately 7 per million per year. Approximately 80% of the primary intraocular tumours above the age of 20 years are diagnosed as uveal melanoma, with a mean age of 60 years (Singh and Topham 2003). Nearly 50% of all patients will die from distant metastasis that are mainly located in the liver (Zimmerman and McLean 1984), with a peak incidence of death due to melanoma 2 years after enucleation (Zimmerman, et al. 1978). Uveal melanomas may arise in the iris (5%), ciliary body (23%) or choroid (72%) (Figure 1). Choroidal melanomas are the most common and usually display a discoid, dome-shaped or mushroom-shaped growth pattern.

14
Chapter 1
Prognostic factorsPrognostic factors for uveal melanoma can be subdivided into three categories: clinical histopathological and genetical. Clinical predictive factors have been extensively described. Location of the tumour, tumour thickness and tumour diameter (Augsburger and Gamel 1990; Augsburger, et al. 1989; Coleman, et al. 1993; Seddon, et al. 1983; Shields, et al. 2000; Shields, et al. 1995) are clinical factors predicting tumour growth. In addition, age at time of treatment, male gender (Augsburger and Gamel 1990; Luyten, et al. 1995) and secondary glaucoma (Coleman, et al. 1993) were prognostic relevant. Shields et al. constructed a mnemonic ”TFSOM” “to find small ocular melanoma” (thickness greater than 2 mm, subretinal fluid, symptoms, orange pigment and margin at the disc) to assist in identifying small choroidal melanoma at risk for growth (Shields, et al. 2000). The most important histopathological markers predicting clinical behaviour are the presence of epithelioid cells (Coleman, et al. 1993; Seddon, et al. 1983), largest tumour diameter (Mooy, et al. 1995), scleral invasion (Seddon, et al. 1983) and presence of vascular loops (Folberg, et al. 1993). Other valuable prognostic factors are the presence of mitotic figures (Folberg, et al. 1993; Mooy, et al. 1995) and tumour-infiltrating lymphocytes (de Waard-Siebinga, et al. 1996; Whelchel, et al. 1993). Genetic prognostic factors in uveal melanoma consist mainly of the chromosomal aberrations. As is the case in other solid tumours non-random chromosomal alterations occur in uveal melanoma. Uveal melanoma often contain minimal chromosomal alterations and are highly amenable to chromosome analysis (Prescher, et al. 1995; Sisley, et al. 1990). This has led to identification of abnormalities of chromosomes 1, 3, 6 and 8 (Figure 2) Loss of chromosome 3 is clearly associated with a decreased survival (Prescher, et al. 1996; Sisley, et al. 1997; White, et al. 1998a). In general, loss of chromosome 3 involves the whole chromosome, however, partial deletions, one on the long arm and one on the short arm, of chromosome 3 have been identified, suggesting a role for tumour suppressor genes which might explain the frequently observed loss of an entire chromosome 3 (Tschentscher, et al. 2001). Additionally, several studies indicated that monosomy 3 seemed to be an early event in uveal melanoma (Aalto, et al. 2001; Prescher, et al. 1994), causing isochromosome formation of especially isochromosome 6p and 8q (Prescher, et al. 1994; Prescher, et al. 1995). Gain of chromosome 6p has been associated with a better survival (White, et al. 1998a), whereas loss of chromosome 6q has been associated with a decreased survival (Aalto, et al. 2001). Sisley et al. demonstrated that presence of extra copies of chromosome 8q was correlated with a decreased survival (Sisley, et al. 1997). Furthermore, loss of chromosome 1p was identified in these tumours. Any prognostic significance has not been determined, yet Aalto et al. detected loss of chromosome 1p particularly in metastasising tumours (Aalto, et al. 2001).

General introduction
15
Familial uveal melanomaThe hereditary basis for uveal melanoma was first questioned by Silcock et al., who described in 1892 a mother and daughter, both with apparent intraocular melanoma (Silcock 1892). More families have been described in literature and an autosomal dominant inheritance with incomplete penetrance was suggested (Lynch, et al. 1968; Singh, et al. 1996b). The occurrence of familial uveal melanoma is rare, only 0.6% of all uveal melanoma cases (Singh, et al. 1996a), making it hard to identify genetic predisposing factors. Familial uveal melanoma have been reported to occur in several familial cancer syndromes: familial atypical mole and malignant melanoma (FAMM) syndrome, xeroderma pigmentosum (XP), Li-Fraumeni syndrome and familial breast and ovarian cancer. CDKN2A is the main cutaneous melanoma predisposing gene and mutations have been described in families with both cutaneous and uveal melanoma. Expression of this gene causes cells to arrest in the G1 phase of the cell cycle by Rb inactivation. CDKN2A gives a predisposition in the FAMM syndrome, but is rarely involved in familial uveal melanoma (Singh, et al. 1996b; Soufir, et al. 2000). Persons with FAMM (Familial Atypical Mole Syndrome) were more likely to possess conjunctival, iris and choroidal nevi (Rodriguez-Sains 1986). In addition, BRCA2, another cell cycle regulator, was mutated in a number of cases with uveal
Figure 2. Karyotype of tumor EOM 207 This tumor showed the typical chromosomal changes for uveal melanoma, -3, i(6)(p) and +8. In addition, there is a loss of a Y chromosome, which is commonly observed in solid tumors.

16
Chapter 1
melanoma. However, germline BRCA2 mutations, which are present in only a small proportion of the patients (Hearle, et al. 2003), do not explain all familial cases.
Genes and uveal melanomaLosses and gains of chromosomes will result in gain and loss of genes that may play an important role in cell cycle regulation, differentiation and apoptosis. As described in a previous paragraph tumour suppressor genes and oncogenes may play a role. According to the Knudsons’ two hit hypothesis, the first hit could be a mutation or small deletion, whereas the second hit might the loss of a part of a chromosome. This hypothesis is applicable to classical tumour suppressor genes, such as p53 and Rb. Association of cytogenetic alterations in uveal melanoma with survival enables researchers to identify regions of interest. Chromosome 1p36 is frequently deleted in solid tumours, such as uveal melanoma, skin melanoma and neuroblastoma. In the latter tumour type it is also a predictor for an unfavourable outcome of the patient (Caron, et al. 1996). P73, a candidate tumour suppressor gene, is located in this region. Another chromosome of interest is chromosome 3, on which p63 is located, 3q27-28. Both genes, p73 and p63, will be explained in more detail in the following paragraph. The role of oncogenes restricts to overexpression due to amplification of the complete gene or constitutively activation due to mutations. One of such genes is BRAF, which will be described, in addition to p73 and p63.
P73 / P63The candidate tumour suppressor genes p73 gene and the p63, both encoding homologues of p53, are located on chromosome 1p36 and 3q27-28, respectively (Kaghad, et al. 1997; Yang, et al. 1998). P73 and p63 are homologous to p53, a well-known tumour suppressor gene. They have a similar structure with an amino-terminal transactivation domain, a central core DNA-binding domain and a carboxy-terminal oligomerisation domain (Kaghad, et al. 1997; Yang, et al. 1998). The p53-protein is a key regulator of the cell cycle as a checkpoint mediator during the G1/S and G2/M transition. Upon DNA damage p53 is stabilised and accumulated resulting in an increased activity and consequently cell cycle arrest and apoptosis is mediated. P53, located on chromosome 17q13.1, is mutated in 50% of all human cancers. In uveal melanoma, however, p53 mutations or loss of the p53 locus do not seem to be a cause of protein inactivation (Chana, et al. 1999), but instead the p53 pathway may be functionally impaired (Brantley and Harbour 2000). In experimental set-up both, p73 and p63, showed p53 like properties, s.a. binding to p53 DNA target sites, transactivate p53-responsive genes and induce cell cycle arrest and apoptosis (Jost, et al. 1997; Kaghad, et al. 1997; Yang, et al. 1998). In contrast to p53, transcripts

General introduction
1�
lacking the N-terminal transactivation domain have been identified for p73 and p63. Both are transcribed by an alternative promoters located in intron 3 of either gene. Furthermore, once in a complex with e.g. p53 the ΔN-variants have dominant negative activity (Irwin and Kaelin 2001) (Figure 3).
Figure 3.A: Schematic representation of TP63 and TP73 in upper panel. The lower panel illustrates the mRNA sequence.B: Diagram illustrating the interaction between p53, p63 and p73 proteins. P53 is able to drive the cell into apoptosis or cell cycle arrest in reaction to specific stimuli. P63 and p73 proteins can act in two different man-ners. Since the TA-forms are able to transactivate p53 target genes they can induce apoptosis. The ∆N-forms that lack the transactivating domain act as dominant-negatives and therefore induce proliferation.
1 2 3 3’ 4 5 6 7 8 9 10 11 12 13 14 15
∆N-promotorTA-promotor
TA-transcripts
∆N-transcripts
TP63/TP73
Transactivation DNA binding Oligomerisation
P63/P73
P53
p63 p53 p73
ATM
c-Abl
other signals?
other signals?
chk 2
MDM2 MDM2
ARF
rasmyc
cell cycle arrestapoptosis
anti-apoptotic / proliferative
TAp73
ionizingradiation
ATM
taxolcisplatin
ARF
UV
ATR
A
B
∆Np63 TAp63 ∆Np73

18
Chapter 1
BRAFThe RAF family consists of three genes, ARAF, BRAF and CRAF, encoding for cytoplasmic serine/threonine kinases (Chong, et al. 2003; Peyssonnaux and Eychene 2001). The RAF proteins are part of the RAS-RAF pathway. This pathway plays an important role in melanogenesis by mediating cellular responses to growth signals. In response to UVB-radiation cAMP is upregulated, leading to increased proliferation and melanogenesis (Barbacid 1987). The RAF proteins are activated by the upstream component in this pathway, RAS.
Comparable to RAS, RAF-genes are also considered as proto-oncogenes. Activating mutations of BRAF in human cancer have been identified by Davies et al. (Davies, et al. 2002). BRAF mutations were present in 60-66% of the malignant melanoma and at a lower frequency in a wide range of other human cancers (Brose, et al. 2002; Davies, et al. 2002). The most common mutation, 1796T-A transversion in exon 15 of the BRAF gene, was located in the serine/threonine kinase domain, resulting in a Valine to Glutamic Acid substitution at position 599 (Davies, et al. 2002). Thus, resulting in a constitutive active protein promoting proliferation (Zhang and Guan 2000). Several less common mutations of BRAF were located in exon 11 (Brose, et al. 2002; Davies, et al. 2002).
TherapyNowadays there are many more treatment options besides enucleation, which was the only option for most of last century (COMS 1998). The more conservative treatment options aim to spare the affected eye and retain vision. Treatment of uveal melanoma depends on various factors including age of the patients, systemic health of the patient, condition of the opposite eye, tumour size and location. In general small and medium melanomas may be treated with transpupillary thermotherapy (TTT), plaque radiotherapy combined with TTT, proton beam or stereotactic radiotherapy. Large melanomas are usually treated with enucleation while in some cases proton beam radiotherapy or stereotactic radiotherapy is indicated. With stereotactic radiotherapy several large dose fractions are given to reduce the side effects of radiotherapy and gain an optimal result in tumour control. Reduction of side effects and improvement of the therapeutic ratio can be achieved with a better understanding of the radiosensitivity and capacity for DNA damage repair of these tumours. Smaller fraction doses and consequent smaller high-dose volumes are justified to optimise dose and fractionation. Fractionated stereotactic irradiation has a challenging potential as an eye-preserving treatment in uveal melanoma. Nevertheless, metastases cannot be prevented. Based on theoretical models, clinically manifest metastases are likely to occur 5 or 6 years

General introduction
19
after onset of the systemic dissemination (Gamel, et al. 1992; Manschot and van Peperzeel 1980; Manschot and van Strik 1992; McLean 1993). At the time that uveal melanoma is diagnosed, micrometastases may have been spread already (Eskelin, et al. 2000; Manschot and van Strik 1992). Therefore, metastatic disease occurring after treatment is not uncommon. Approximately half of the patients will die from the disease within 10 to 15 years of enucleation. Once a metastasis is discovered the survival is less than 7 months (Kath, et al. 1993). If a metastasis arises as a solitary lesion in the liver, increased survival may be obtained by local resection of the lesion (Aoyama, et al. 2000). Furthermore, there have been reports on tumour regression after treatment with hepatic arterial chemo-embolisation (Mavligit, et al. 1988), isolated hepatic perfusion with high-dose melphalan (Noter, et al. 2004) and a combination of chemo-immunotherapy in the BOLD study (Kivela, et al. 2003; Pyrhonen, et al. 2002). These therapies may prolong survival, but they will not cure the patients. Enucleation induced metastases may occur through manipulation of the eye during treatment, as was demonstrated in animal studies (Niederkorn 1984). Pre-enucleation radiotherapy, aimed at reducing enucleation induced metastases, proved to be effective in animal models (Char and Phillips 1982; Hoye and Smith 1961; Kenneally, et al. 1988; Powers and Palmer 1968; Sanborn, et al. 1987). However, it is not applied at the moment since clinical studies did not show any survival benefit (Augsburger, et al. 1990; Bornfeld, et al. 1989; Char, et al. 1988; COMS 1998; Gunalp and Batioglu 1998; Kreissig, et al. 1989; Luyten, et al. 1995). Despite diagnostic advances the rate of metastatic disease is still not reduced, making it more important to find alternative treatments for metastases in particular.
Scope and outline of this thesis
Identification of prognostic factors is a major goal of current cancer research. It can be used to ease diagnostics and speculate on disease progress. Moreover, patients may be treated selectively or at an earlier stage in which the disease has not yet disseminated. To avoid dissemination radiotherapy may be applied. In the first part of this thesis the effect of radiotherapy in uveal melanoma cell lines and primary uveal melanoma will be discussed. Results of dose fractionating will be presented in Chapter 2. Chapter 3 reports for the first time a reduction in melanoma related mortality after pre-enucleation radiotherapy.
Cytogenetic abnormalities that occur non-randomly in uveal melanoma, such as monosomy 3, amplification of 8q, 6p and deletion of chromosome 6q and 1p are associated with prognosis of UM patients. The association of these cytogenetic

20
Chapter 1
alterations with survival will be dealt with in the second part of this thesis. Chapter 4 reports mainly on the importance of concurrent loss of chromosome 1p and 3 as a prognostic parameter for uveal melanoma metastases. However, there are several different aberrations, which will be discussed in more detail in chapter 5. Besides the sporadic occurrence of uveal melanoma it may also appear in predisposed families. Chapter 6 will illustrate the cytogenetic aberrations observed in familial uveal melanoma.
The association of cytogenetic alterations with survival enables us to identify regions of interest. Part 3 of this thesis concerns structural deletions and candidate genes involved in uveal melanoma progression. Demarcation of structural deletions of chromosome 3 may aid in delineation of candidate regions for tumour suppressor genes (chapter 7). In addition, the association of concurrent loss of chromosome 1p and chromosome 3 with decreased survival (chapter 4) suggests the presence of genes involved in tumour progression on these chromosomes. Candidate tumour suppressor genes, TP73 and TP63, were located on chromosome 1p36 and 3q27-29, respectively. In Chapter 8 the expression of various transcripts of these genes is described. Another candidate gene analysed was BRAF (Chapter 9). This gene is mutated in 80% of the cutaneous melanoma in which no RAS mutation was present. Considering the common origin of uveal and cutaneous melanoma, both arise from neural crest derived melanocytes and lack of RAS mutations in uveal melanoma, BRAF was an interesting candidate.
A general discussion and future prospects are presented in chapter 10.

Part 1. Radiotherapy in uveal melanoma
Chapter 2
Dose fractionation effects in primary and metastatic humanuveal melanoma cell lines

22
Chapter 2
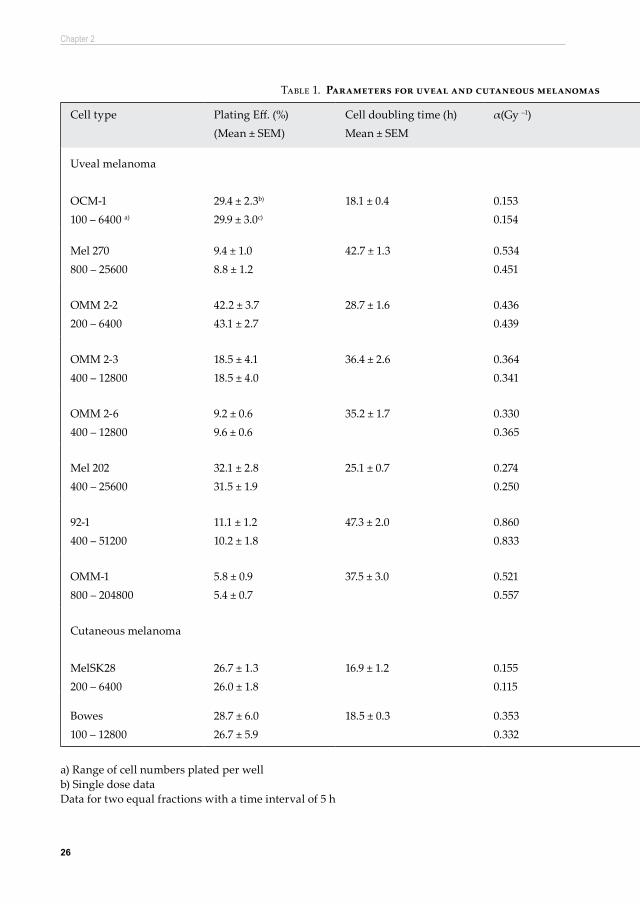
AbstractPurpose: To investigate the effects of split dose irradiation on primary and metastatic uveal melanoma cell lines using a clonogenic survival assay. Methods: Appropriate cell concentrations of four primary and four metastatic human uveal melanoma cell lines were cultured for irradiation with single doses and with two equal fractions separated by 5 h. After irradiation colony formation was allowed for 7-21 days. Two cutaneous melanomas were also tested for comparison. All survival curves were analysed using the Linear Quadratic (LQ) model. Specific parameters for the intrinsic radiosensitivity (α-component, SF2 –value), for the capacity of repair of DNA damage (β-component), as well as the α/β ratio were calculated. Results: After single dose irradiation a wide range in α- and β-values was obtained for both primary and metastatic uveal melanomas, which resulted in a wide range of α/β ratios. In contrast, calculations based on split dose data with which the β-component could be estimated independent of the α-component, indicated that estimates for the capacity of sublethal DNA damage repair was very similar for all cell lines. This indicated that intrinsic factors dominated the radiosensitivity of these cell lines. Split dose irradiation had little influence on the intrinsic radiosensitivity (α-component), but cell survival increased for all cell lines. For the two cutaneous melanomas comparable split dose results were obtained. Conclusions: For both primary and metastatic uveal melanoma cell lines data from single and fractionated doses do indicate large variations in radiosensitivity, which are mainly dominated by the intrinsic radiosensitivities. Doses of around 8 Gy in 5 fractions would be sufficient to eradicate 109 cells (approximately 1 cm3) of the most radioresistant tumour cell lines, but this schedule is overkill for the radiosensitive tumour cell lines. Based on specific morphological and histological tumour markers more individualised dose fractionation schedules could improve the therapeutic ratio for uveal melanomas. IOVS 2003 Nov;44(11):4660-4.

Dose fractionation effects in primary and metastatic human uveal melanoma cell lines
23
Introduction
For small and medium sized uveal melanomas radiotherapy is the first choice of treatment. Large dose fractions of 10 – 12 Gy offer patients an eye and vision-sparing alternative to enucleation. However, radiotherapy-related acute and late ocular complications have been reported (Char, et al. 1998; Finger 1997). Reduction of these side effects and improvement of the therapeutic ratio could be achieved by a better understanding of the radiosensitivity and capacity for DNA damage repair of these tumours. So far, only limited information on the cellular radiosensitivity of uveal melanoma cell lines is available (Logani, et al. 1995a; Logani, et al. 1995b; Soulieres, et al. 1995). In a recent publication large differences in the intrinsic cellular radiosensitivity were demonstrated for primary and metastatic human uveal melanoma cell lines (van den Aardweg, et al. 2002). The data also pointed to large differences in the capacity for repair of radiation-induced DNA damage justifying a more refined study with the use of split dose irradiation. In this paper we present single dose and split dose data for cell survival curves analysed with the Linear Quadratic (LQ) model (Barendsen 1982; Douglas and Fowler 1976; Thames, et al. 1982). This provides information on the intrinsic radiosensitivity and repair capacity of these uveal melanoma cell lines. In the LQ model the α-component is regarded as a suitable parameter for the intrinsic radiosensitivity. An alternative way of expressing the radiosensitivity is the surviving fraction at 2 Gy (SF2) (Brock, et al. 1989; Davidson, et al. 1990; Steel and Peacock 1989). When a single dose of X-rays is divided into two fractions separated by an interval of several hours, an enhancement in survival occurs. The magnitude of this recovery, interpreted as a reflection of the repair of sublethal DNA damage induced by the first dose, can be expressed by the β-component in the LQ model.
Material and methods
Cell lines and culture conditions Four primary and four metastatic uveal melanoma cell lines were used throughout this study. Two cutaneous melanoma cell lines were also tested for comparison. Details of the cell lines and culture conditions have been described previously (van den Aardweg, et al. 2002). A few adjustments were made in comparison with the previous study. Cells were plated with a range of increasing concentrations and incubated for 2 hr instead of overnight incubation, to allow cell attachment before commencing with radiation. Overnight incubation for cell attachment is not appropriate for cell lines with short doubling times, as indicated in this study. For

24
Chapter 2
some cell lines (OCM-1, 92-1, OMM-1 and Bowes) higher cell concentrations were also used in this study, particularly after the higher doses, in order to increase colony numbers and hence to obtain more reliable data
Irradiation and clonogenic assayTechnical details of the irradiation procedure and the colony assay have been described previously (van den Aardweg, et al. 2002). Single doses of 0-10 Gy were given with one 6-well plate per dose point containing two consecutive cell concentrations. In the dose fractionation experiment the total dose was split in two equal fractions with a time interval of 5 h. An interval of 5 h is sufficient for maximum repair of DNA damage without substantial cell cycle progression (Elkind and Sutton 1960; Steel 1993). For the split dose study a separate set of 6-well plates was used again with one plate per dose point and containing two consecutive cell concentrations. Both single and fractionated irradiations were carried out in conjunction on the same day. After irradiation cells were incubated for colony formation. Slow growing cell lines (92-1) were incubated for 21 days instead of the standard 7 days (OCM-1, MelSK28, Bowes) or 14 days (Mel 202, OMM 2-2, OMM 2-3, OMM 2-6, Mel 270, OMM-1) to achieve sufficient colony formation. Once the colonies reached an appropriate size they were fixed and counted, as published previously (van den Aardweg, et al. 2002).
Data Analysis
Cell survival curves were obtained for each cell line by analysing the surviving fractions with the Linear Quadratic (LQ) model, as described in detail previously (van den Aardweg, et al. 2002). For both single dose and split dose irradiations cell survival curves were averaged from at least 3 repeat experiments per cell line and with two different cell concentrations per dose point (Table 1). The α-coefficients and the surviving fractions at 2 Gy (SF2) were calculated as estimates of the intrinsic radiosensitivity. Along similar lines β-coefficients were calculated, which represent the capacity for repair of sublethal DNA damage. Both the α- and β-components are cell (and tissue) specific and were used to derive the α/β ratio, the dose at which the contribution of the linear and the quadratic component are equal. Low α/β ratios (<5 Gy) provides a ‘curvy’ cell survival curve for radiosensitive cells with a relatively low α-value, while higher α/β ratios give less ‘curvier’ cell survival curves indicative for cells with a relatively high α-value. In addition, cells displaying low α/β ratios are being spared by dose fractionation, while opposite effects are seen for cells with high α/β ratios.For very steep cell survival curves representing radiosensitive cells, the

Dose fractionation effects in primary and metastatic human uveal melanoma cell lines
25
correspondingly low α- and SF2 -values dominate these curves, which makes it difficult to establish reliable values for the β-coefficients. In such cases large values for the β-component can be overlooked (Peacock, et al. 1988; Steel and Peacock 1989). A low plating efficiency would hamper the analysis even further, due to the small dose range for which cell survival could be measured (Peacock, et al. 1988). To overcome this problem the use of the split-dose method provides a much more reliable estimate for the β-component. Based on the LQ-model it is predicted that the survival recovery ratio, the ratio of split dose and single dose cell survival, increases progressively with dose per fraction (Thames, et al. 1982). There is a linear relationship between the recovered ratio and the dose per fraction d. Recovered ratio (RR)=exp(2βd2) which converts into ln(RR)=2βd2. In this formula d are equal doses per fraction in a split dose experiment; a split of d + d (i.e. 1 + 1 Gy, 2 + 2 Gy, etc). The slope of this linear relationship provides an estimate of the β-component, termed βRR, which is derived independently of the α-component. It was argued that at least 4 different dose levels were required for a proper estimate of the slope of this linear relationship (Peacock, et al. 1992). In this study all split-dose experiments were carried out standard at 6 different dose levels. The βRR values presented in Table 1 are averages of at least 3 independent experiments per cell line with two different cell concentrations per experiment.
26
Chapter 2
Cell type Plating Eff. (%)(Mean ± SEM)
Cell doubling time (h)Mean ± SEM
α(Gy –1) β (Gy –2) α/β (Gy)(Mean ± SEM)
SF2 βRR (Gy –2) α/β RR (Gy)
Uveal melanoma
OCM-1100 – 6400 a)
29.4 ± 2.3b)
29.9 ± 3.0c)
18.1 ± 0.4 0.1530.154
0.047 3.5 ± 0.5
0.610.66
0.039 3.9
Mel 270800 – 25600
9.4 ± 1.08.8 ± 1.2
42.7 ± 1.3 0.5340.451
0.027 20.8 ± 1.6 0.310.37
0.031 17.5
OMM 2-2200 – 6400
42.2 ± 3.743.1 ± 2.7
28.7 ± 1.6 0.4360.439
0.092 4.7 ± 0.5
0.290.34
0.048 9.2
OMM 2-3400 – 12800
18.5 ± 4.118.5 ± 4.0
36.4 ± 2.6 0.3640.341
0.039 10.3 ± 1.6 0.410.47
0.041 8.9
OMM 2-6400 – 12800
9.2 ± 0.69.6 ± 0.6
35.2 ± 1.7 0.3300.365
0.046 8.8 ± 2.0
0.430.45
0.034 9.6
Mel 202400 – 25600
32.1 ± 2.831.5 ± 1.9
25.1 ± 0.7 0.2740.250
0.035 10.3 ± 3.0 0.500.56
0.032 8.5
92-1400 – 51200
11.1 ± 1.210.2 ± 1.8
47.3 ± 2.0 0.8600.833
0.010 84.5 ± 28.4 0.170.19
0.037 23.2
OMM-1800 – 204800
5.8 ± 0.95.4 ± 0.7
37.5 ± 3.0 0.5210.557
0.042 14.1 ± 2.6 0.300.30
0.024 21.3
Cutaneous melanoma
MelSK28200 – 6400
26.7 ± 1.326.0 ± 1.8
16.9 ± 1.2 0.1550.115
0.053 3.3 ± 0.6 0.590.66
0.029 5.3
Bowes100 – 12800
28.7 ± 6.026.7 ± 5.9
18.5 ± 0.3 0.3530.332
0.114 3.7 ± 1.2 0.340.36
0.062 5.7
a) Range of cell numbers plated per well b) Single dose dataData for two equal fractions with a time interval of 5 h
Table 1. Parameters for uveal and cutaneous melanomas after single and fractionated doses of X-irradiation

Dose fractionation effects in primary and metastatic human uveal melanoma cell lines
2�
Cell type Plating Eff. (%)(Mean ± SEM)
Cell doubling time (h)Mean ± SEM
α(Gy –1) β (Gy –2) α/β (Gy)(Mean ± SEM)
SF2 βRR (Gy –2) α/β RR (Gy)
Uveal melanoma
OCM-1100 – 6400 a)
29.4 ± 2.3b)
29.9 ± 3.0c)
18.1 ± 0.4 0.1530.154
0.047 3.5 ± 0.5
0.610.66
0.039 3.9
Mel 270800 – 25600
9.4 ± 1.08.8 ± 1.2
42.7 ± 1.3 0.5340.451
0.027 20.8 ± 1.6 0.310.37
0.031 17.5
OMM 2-2200 – 6400
42.2 ± 3.743.1 ± 2.7
28.7 ± 1.6 0.4360.439
0.092 4.7 ± 0.5
0.290.34
0.048 9.2
OMM 2-3400 – 12800
18.5 ± 4.118.5 ± 4.0
36.4 ± 2.6 0.3640.341
0.039 10.3 ± 1.6 0.410.47
0.041 8.9
OMM 2-6400 – 12800
9.2 ± 0.69.6 ± 0.6
35.2 ± 1.7 0.3300.365
0.046 8.8 ± 2.0
0.430.45
0.034 9.6
Mel 202400 – 25600
32.1 ± 2.831.5 ± 1.9
25.1 ± 0.7 0.2740.250
0.035 10.3 ± 3.0 0.500.56
0.032 8.5
92-1400 – 51200
11.1 ± 1.210.2 ± 1.8
47.3 ± 2.0 0.8600.833
0.010 84.5 ± 28.4 0.170.19
0.037 23.2
OMM-1800 – 204800
5.8 ± 0.95.4 ± 0.7
37.5 ± 3.0 0.5210.557
0.042 14.1 ± 2.6 0.300.30
0.024 21.3
Cutaneous melanoma
MelSK28200 – 6400
26.7 ± 1.326.0 ± 1.8
16.9 ± 1.2 0.1550.115
0.053 3.3 ± 0.6 0.590.66
0.029 5.3
Bowes100 – 12800
28.7 ± 6.026.7 ± 5.9
18.5 ± 0.3 0.3530.332
0.114 3.7 ± 1.2 0.340.36
0.062 5.7
Table 1. Parameters for uveal and cutaneous melanomas after single and fractionated doses of X-irradiation

28
Chapter 2
Sulforhodamine B (SRB) assayThe cell doubling times were determined with the SRB-assay, which is a colorimetric and non-destructive assay (Skehan, et al. 1990). Cells were grown at 37°C in 96-well plates with lanes of 8 wells containing cell concentrations of 100, 250, 500, 1000, 2500 and 5000 cells/ml and 200 μl medium / conditioned medium (1:1 v/v) per well. For each consecutive day, excluding Sundays, up to 7 days a separate plate was used. In each plate a lane of 8 wells with medium only acted as control. At harvest the medium was removed and cells were washed three times with distilled water. Cells were fixed with 10% trichloroacetic acid (TCA) solution for 1 h at 4°C using 200 μl per well. The plates were washed 5 times with distilled water, air dried overnight and kept at 4°C. All plates were stained simultaneously for 2 h adding 50 μl per well of a 0.4% sulforhodamine B (SRB) solution in 1% acetic acid. Plates were washed 5 times in 1% acetic acid to remove unbound SRB. Per well 150 μl Tris (10 mMol/l) was added and kept overnight at room temperature to dissolve the bound SRB. The following day the optical density of the dye was measured for each well at 540 nm using a spectrophotometer (Biorad). For each lane of 8 wells the optical density was averaged omitting the highest and lowest value and subtracting the averaged control value. For each cell concentration the logarithmic values for the mean optical densities, expressed in arbitrary units and plotted as a function of time, gave straight lines. In a Slide Write Plus program linear regression analysis was used to computer fit lines to the data points. Examples of optical densities as a function of time are presented in Figure 1. From the slopes of these lines the cell doubling time was calculated. Data for the lowest cell concentration were occasionally unreliable producing lines with very shallow slopes indicating a very slow cell growth. For the highest cell concentrations and the longer growth periods arbitrary units in excess of 2000 were ignored, because it appeared the maximum reliable value in this assay. Beyond this value cell growth was not logarithmic anymore and diminished due to too high cell densities in the wells, as seen in figure 1 for OCM-1. Growth curves for the high cell concentrations based on only 2 or 3 time points were ignored. Values for the slopes of the growth curves from the intermittent cell concentrations were averaged and used to calculate a cell doubling time for each experiment. The overall cell doubling time for each cell line was an average obtained from at least three independent experiments.
Results
Cell doubling timeThe cell doubling times for the uveal and cutaneous melanomas are presented in

Dose fractionation effects in primary and metastatic human uveal melanoma cell lines
29
Table 1. They range from 16.9 h (MelSK28) to 47.3 h (92-1). Examples of growth curves for a fast (OCM-1) and slow growing cell line (Mel 270) are presented in Figure 1. The short doubling times for some of these cell lines justified a short attachment period after plating before commencing irradiation. The short doubling times for some of these cell lines could have influenced the outcome of dose fractionation due to cell growth in between fractions. For the fast growing cell lines no significant cell growth could be determined with the SRB assay within 6 h after plating (data not shown).
Plating efficiencyThe plating efficiencies, as obtained from the surviving fractions after a dose of 0 Gy, ranged from 5.4 % (OMM-1) to 43.1 % (OMM 2-2) with no significant differences with cell concentration for both single and fractionated doses (p> 0.16). Hence for each cell line data obtained for the two consecutive cell concentrations were combined. Also the plating efficiencies between the single and fractionated doses differed not significantly (p> 0.38) (Table 1).
Cell survival curve parametersCell survival curves after single and fractionated doses are presented in Figure 2 for the uveal and cutaneous melanomas. The parameters associated with these survival curves are presented in Table 1. A wide range of α-coefficients was found after single doses with very high and low values for OCM-1 cells (0.153 Gy -1) and for 92-1 cells (0.860 Gy -1), respectively. Estimates for the α-coefficients, indicative for the intrinsic radiosensitivity, are reflected in the SF2 values with high values for radioresistant cell lines and lower values for the more radiosensitive cell lines. After single doses the β-coefficients ranged from 0.027 Gy –2 to 0.053 Gy –2, except for OMM
0 1 2 3 4 5 6 7Time (days)
0.1
1
10
100
1000
4000
Opt
ical
Den
sity
OCM-1
0 1 2 3 4 5 6 7 8Time (days)
0.1
1
10
100
1000
4000
Opt
ical
Den
sity
Mel 270
Figure 1. Growth curves for a fast (OCM-1) and a slow growing cell line (Mel 270) as obtained with the SRB assay. The slope of the curves is an estimate for the cell doubling time. Increasing cell concentrations of 100 cells/ml ( ), 250 cells/ml ( ), 500 cells/ml ( ), 1000 cells/ml ( ), 2500 cells/ml ( ), and 5000 cells/ml ( ) were used. Cells were cultured in standard medium in the presence of conditioned medium (1:1 v/v).

30
Chapter 2
2-2 cells and the cutaneous melanoma Bowes cells, which produced much larger β -values of ≈ 0.10 Gy -2 (Table 1) indicating less efficient repair of DNA damage. This resulted in low α/β ratios of 3.5 - 4.7 Gy (OCM-1, OMM 2-2, SK28 and Bowes) and higher α/β ratios (> 8.8 Gy) for the other primary and metastatic uveal melanomas. The exception is cell line 92-1 with a large α-value of 0.86 Gy -1, while the β-value is very low resulting in a high α/β ratio of 84.5 Gy. The low SF2 value indicates that this cell line is very radiosensitive. As expected, after split dose irradiation the α-components (initial DNA damage) remained very similar to those obtained after single doses with only minor deviations of ± 10%. For cell lines Mel270 and MelSK28 larger deviations of +15.4% and +25.5%, respectively, were obtained for the α-component. As expected, the SF2
values increased after split dose irradiation for all but one cell line, OMM-1. This increment in SF2 values is a reflection of repair of sublethal DNA damage in between the two fractions. The alternative method for obtaining a more accurate estimate for the β-component independent of the α-component, as reported by Peacock et al. (Peacock, et al. 1988; Peacock, et al. 1992), resulted in βRR- values similar to those obtained with single dose survival curves for the majority of cell lines (Table 1). Only for cell lines OMM 2-2, 92-1, and OMM-1 the βRR- values deviated substantially which resulted in much higher (OMM 2-2 and OMM-1), or lower α/β ratios (92-1).
Figure 2. Cell survival curves for various primary (OCM-1, Mel 270, Mel 202, 92-1) and metastatic (OMM 2-2, OMM 2-3, OMM 2-6, OMM-1) human, uveal melanomas in comparison with cutaneous melanomas (MelSK28, Bowes) after single doses of X-rays (solid lines) and split dose irradiation involving 2 equal fractions with an interfraction interval of 5 h (dotted lines). Cells were cultured in standard medium in the presence of condi-tioned medium (1:1 v/v). If standard errors are not present they fall within the symbol. Data indicate a/b ratios (± SEM).

Dose fractionation effects in primary and metastatic human uveal melanoma cell lines
31
Discussion
The single dose data, presented in this paper on the radiosensitivity for primary and metastatic human uveal melanoma cell lines, are more refined compared with those published earlier (van den Aardweg, et al. 2002). These earlier results could have been influenced by a confounding factor as cell growth during overnight attachment. The short cell doubling time for some of the cell lines indicated that a short attachment period of 2 h before commencing irradiation was more appropriate than overnight attachment. Apart from reduced plating efficiencies for nearly all cell lines this shorter attachment period gave also much higher α-values for OCM-1 cells and Bowes cells, while for the cell types OMM 2–2, OMM 2-3, OMM 2-6 and MelSK28 cells the β-coefficient increased. This resulted in low α/β ratios of ≈ 3.5 Gy for the fast growing cell lines. In this study also better estimates for the single dose cell survival curves of 92-1 cells and OMM-1 cells could be obtained due to higher cell concentrations at the higher dose points and a longer post-radiation incubation time of 21 days (92-1). This resulted in more reliable data at higher doses explaining the differences in parameters with previously published data for these two cell lines (van den Aardweg, et al. 2002). Cells displaying a low α/β ratio, which is indicative for a sparing effect after dose fractionation, require large doses per fraction for effective tumour treatment. In this instance little benefit in therapeutic ratio will be seen, since the late responding normal tissues also display low α/β ratios in the range of 1-5 Gy. For cell lines with higher α/β ratios (> 6 Gy) conventional doses per fraction of 2 Gy should provide therapeutic gain with increased probability of tumour cure and sparing of late responding normal tissues. In this study, cell lines Mel270, 92-1, and OMM-1 displayed low plating efficiencies and high α-values after single dose irradiation and therefore estimates for the β-value could be inaccurate (Peacock, et al. 1988; Steel and Peacock 1989). The βRR-values for all cell lines displayed a narrow range of 0.024 Gy -2 (OMM-1) to 0.047 Gy -2 (OMM 2-2), which was much smaller than that obtained from analysis of the single dose cell survival curves (Table 1). It appeared that for cell lines OMM 2-2, 92-1 and OMM-1 the βRR-values differed substantially from those obtained after single dose irradiation, but were now within the range of the other cell lines. Surprisingly, also for OMM2-2 cells a much lower βRR-value was found as compared with the original β-value after single dose irradiation. Only for Bowes cells the βRR-value (0.0622 Gy -2) was outside this range, but it was about half the value obtained from the single dose cell survival curve. This had an effect on the new α/βRR ratios with that for OMM 2-2 cells in the same range as for the other metastatic cell lines OMM 2-3 and OMM 2-6; all three cell lines derived from the same primary melanoma Mel 270 (Table 1). Also for cell

32
Chapter 2
line 92-1 and OMM-1 the α/βRR ratios changed to approximately 22 Gy. The new α/βRR
ratios for the cutaneous melanomas increased to around 5.5 Gy. For a number of human tumour cell lines a linear relationship between ln(RR) and fraction dose (d), as predicted by the LQ model, has been demonstrated (Holmes, et al. 1990; Peacock, et al. 1988; Peacock, et al. 1992; Yang, et al. 1990), which resulted in a βRR-value independent of the α-component. It was also argued that an estimate of the α-component could be obtained independent of the β-component by low dose irradiation (Peacock, et al. 1988; Peacock, et al. 1992). In our institute facilities for low dose irradiation were not available and hence an estimate for an independent α-component could not be achieved. The βRR-values are in the normal range for tumour cell lines and differ only by a factor of 2. This would indicate that the capacity for repair of sublethal DNA damage is fairly constant for all cell lines investigated. This implies that the variations in radiosensitivity of these melanoma cell lines are more determined by the α-components, i.e. the intrinsic radiosensitivity, and to a lesser extent by contributions of sublethal DNA damage repair. This has implications for clinical relevant dose fractionation schedules since cell types OCM-1, Mel 202 and MelSK28 with low α-values and high SF2 -values would require relative large doses of around 8 Gy in 5 fractions for effective elimination of a tumour containing approximately 109 cells. In contrast, for cell type 92-1 doses of around 4 Gy in 5 fractions should be sufficient for effective eradication with a beneficial effect of limiting adverse normal tissue toxicity. In low dose rate (LDR) brachytherapy cell survival is entirely determined by the α-component, i.e. the intrinsic radiosensitivity, due to repair of sublethal DNA damage during the long exposure times and hence the absence of the β-component. For the two most extreme α-values in this study elimination of 109 cells of tumour type OCM-1 would require around 135 Gy, while this is only around 24 Gy for tumour type 92-1. With a dose rate of approximately 1 Gy /h this would indicate an exposure time of around 5.6 days for OCM-1 cells, while cells of tumour type 92-1 would be eliminated in 1 day. Caution should be taken in translating these in vitro data directly to the clinical practice. However, studies have shown that for many tumour cell lines in vitro data and especially parameters related to the initial part of the cell survival curve, such as the α-component and SF2-value, seem to correlate with the clinical radioresponsiveness of human tumours (Malaise, et al. 1986). The fact that the radiosensitivity of these uveal melanomas is mainly determined by the intrinsic radiosensitivity should encourage a study on specific morphological and histological tumour markers, which could be applied in the clinical situation without biopsying the tumour. Based on these morphological markers tumour classification would become a possibility leading to more individualised dose fractionation schedules.

Dose fractionation effects in primary and metastatic human uveal melanoma cell lines
33
AcknowledgementThis study was supported by grants from The Dutch Foundation Fighting against Blindness, The Rotterdam Blindness Foundation, The Hague Ophthalmic Foundation and the Revolving Fund of the University Hospital Rotterdam. The authors gratefully thank Miss Anita Siewert for advice on the SRB-assay and Dr HB Kal for fruitful discussions and critical comments on the manuscript.


Part 1. Radiotherapy in uveal melanoma
Chapter 3
Reduced melanoma-related mortality in uveal melanoma by pre-enucleation radiotherapy

36
Chapter 3
AbstractContext: Radiotherapy of an eye before enucleation, so called pre-enucleation radiotherapy (PER) of uveal melanoma patients, was initiated in order to reduce enucleation-induced systemic metastasis. So far, earlier studies with a short follow-up period did not demonstrate a significant effect on survival. Objective: To study the effect of PER on melanoma-related mortality after over nine years of follow-up. Design In a prospective study, 167 uveal melanoma patients were treated between 1978 and 1992 by irradiation with 8 Gy given in two fractions two days before enucleation. A group of 108 uveal melanoma patients, treated between 1971 and 1992 by enucleation only (EO) in the same hospital, served as a historical control group. Patients were followed until December 2002 or until death. Main Outcome Measure: Effect of PER on survival. Results: Melanoma-related death occurred in 32.3% of the PER treated group and in 40.7% of the EO group. Mean follow-up was 9.25 years. After 48 months of follow-up a significant difference in survival became evident in favour of the PER group. The estimated 15-year survival rates for patients with melanoma in the PER group and EO group were 63.7% and 51.0%, respectively. For patients dying due to all causes these percentages were 47.5% and 25.2%, respectively. In both groups, women had a better prognostic outcome than men. Conclusions: This study suggests that PER improves long-term survival in uveal melanoma patients. Arch Ophthalmol. 2005 Oct;123(10):1363-7

Reduced melanoma-related mortality in uveal melanoma by pre-enucleation radiotherapy
3�
Introduction
Uveal melanoma is the most common primary malignancy of the eye. Although radiotherapy has become the treatment of choice, primary enucleation of the tumour-containing eye is still indicated in 30 to 50% of the cases. Nearly half of all patients will die from distant metastasis in time (Zimmerman and McLean 1984). In the past there was a controversy if early metastasis was due to the enucleation procedure or to undetectable micro-metastases prior to enucleation (Manschot and van Peperzeel 1980; Zimmerman, et al. 1978). Spreading of melanoma cells has been detected during the enucleation procedure in animal models as a result of physical manipulation of the eye (Niederkorn 1984). One method to reduce the potential risk of enucleation-induced metastasis is pre-enucleation radiotherapy (PER), which proved to be effective in animal models (Char and Phillips 1982; Hoye and Smith 1961; Kenneally, et al. 1988; Powers and Palmer 1968; Sanborn, et al. 1987). However, clinical application of PER has been abandoned, because no significant difference in survival could be demonstrated between PER and enucleation only (EO) groups (Augsburger, et al. 1990; Bornfeld, et al. 1989; Char, et al. 1988; COMS 1998; Gunalp and Batioglu 1998; Kreissig, et al. 1989; Luyten, et al. 1995). The mean follow-up time in these clinical studies ranged from 5 to 8 years. Based on theoretical models, clinically manifest metastases are likely to occur 5 or 6 years after onset of the systemic dissemination (Eskelin, et al. 2000; Gamel, et al. 1992; Manschot and van Peperzeel 1980; Manschot and van Strik 1992; McLean 1993). For this reason, we extended our earlier study (Luyten, et al. 1995) with a longer follow-up to study the effect of PER.
Methods
Data collectionAll consecutive patients with a diagnosis of choroidal or ciliary body melanoma without clinical evidence of metastatic disease at presentation and who were treated either by EO or by PER between 1971 and 1992 (Table 1) were entered in this study. All patients were diagnosed and treated in the Rotterdam Eye Hospital or the University Hospital Rotterdam. Patients were extensively informed on the various treatment options, such as observation, EO or PER. Between 1978 and 1982 patients were treated by PER or EO depending on personal preference of their ophthalmologist in the hospital. From 1982 until 1992 all patients were treated by PER as a standard protocol, unless there were contraindications. From April 1992 on, PER was discontinued because interim analysis showed no beneficial effect on

38
Chapter 3
survival. PER was delivered 48 and 24 hours before enucleation by two fractions of 4 Gy electron beams (16 MeV) by means of a 5 x 5 cm anterior field on a linear accelerator. The present study includes the same groups of uveal melanoma patients treated between 1971 and 1990 on which we previously reported (Luyten, et al. 1995), plus all consecutive uveal melanoma patients treated till December 1992. The control group consisted of all patients treated by EO between 1971 and 1992 (Table 1). All patients were followed till death or December 2002.
Patients had a complete physical examination before surgery, including chest X-ray, and liver function tests; from 1978 on liver ultrasonography was routinely added. In case of clinical evidence for metastatic disease prior to surgery they were excluded Patients were followed up twice a year in the first two postoperative years; after that annual check-ups were performed. The follow-up program included ophthalmoscopy of the remaining eye, inspection of the socket, palpation of pre-auricular and submandibular lymph nodes, and liver-enzyme tests. Follow-up data on patients failing their appointment were obtained by contacting their general practitioner, local ophthalmologist, or both. To verify the date and cause of death, the files from the general practitioner, hospital or both were recovered. Melanoma-related death was diagnosed in case of histopathologic confirmation of metastases or by clinical evidence (laboratory and radiodiagnostic) of metastatic disease. Otherwise, the patients were considered to have died from other causes.
The following patient and histopathologic data were recorded: date of enucleation, age at date of the enucleation, gender, location of the tumour (ciliary body, choroid), on histology largest tumour diameter (mm) and tumour thickness (mm), cell type (epitheloid, non-epitheloid), extrascleral growth, follow-up time, and eventual cause of death. An ophthalmic pathologist reviewed all histopathologic data. From each tumour, at least ten consecutive slides were examined.
Data analysisThe χ2-test was used for comparison of gender, tumour location, cell type and extra-scleral growth in the PER and control group. We used the two-sample Student t-test comparing largest tumour diameter and age. Univariate survival analysis was performed by Kaplan Meier curves accompanied by the log rank test to study the effect of PER. To investigate whether PER had a different effect on late follow-up compared with early follow-up, the log rank test was performed separately for both periods. A cut-off period of 48 months was chosen because for this time point the likelihood of our statistical model was maximal. The Cox regression model was used for multivariate analyses. In this model, the effect of PER was allowed to

Reduced melanoma-related mortality in uveal melanoma by pre-enucleation radiotherapy
39
differ between the periods before and after 48 months of follow-up, using two time-dependent covariates defined as follows: the first, representing the effect of PER in the first 48 months, was defined as being equal to 1 at follow-up times before 48 months for patients with PER, and equal to 0 otherwise. The second, which represented the PER effect after 48 months, was defined as being 1 after 48 months for patients in the PER group, and 0 otherwise. We checked on the linearity assumption of each of the continuous covariates in the model by looking whether adding its square made the model significantly better. We also checked on the proportional hazards assumption by testing the significance of the interaction of each covariate with the logarithm of follow-up time. All survival analyses were performed both for melanoma-related death (other causes of death censored) as well as for death due to all causes.
Table 1. Clinical and histopathologic data
Enucleation only (N=108)
Pre-enucleation radiotherapy (N=167)
P-value
1971 - 1977 53 01978 - 1981 31 211982 - 1992 24 146
Average age, mean (range), yr 62.5 (16-89) 57.6 (21-92) 0.006
Gender, No. (%) 0.388
Male 64 (59.3%) 90 (53.9%)
Female 44 (40.7%) 77 (46.1%)
Posterior location, No. (%) 98 (90.7%) 144 (86.2%) 0.261
Largest tumor diameter, mean (range), mm 12.2 (4 - 20) 11.6 (2 - 22) 0.150
Prominence, mean (range), mm 7.0 (1 - 20) 6.4 (1 - 20) 0.248
Epitheloid cell type, No. (%) 61 (56.5%) 90 (53.9%) 0.673
Extrascleral growth, No. (%) 29 (26.6%) 39 (23.4%) 0.114
Mean Follow-up (Months) 111 114

40
Chapter 3
Results
Between 1971 and 1992 275 patients were treated of whom 167 patients received PER (Table 1). Seven cases received no PER because of acute angle closure glaucoma (n=1), unexpected melanoma in a phthisic eye (n=1) and a period of breakdown of the radiation equipment (n=5), and were included in the EO group. Mean follow-up was 114 months in the PER group and 111 months in the EO group. In the PER group four patients were lost to follow-up after 115-234 months; in the EO group one patient after 24 months. Six patients in the PER group and 10 in the EO group received postoperative radiation therapy (28-32 Gy in fractions of 4 Gy) due to extrascleral tumour extension. Data on age, gender, tumour location, tumour size, cell type and extrascleral growth for the PER and the EO group are shown in table 1. The two groups differed significantly (P=.006) in age. There was no statistically significant difference between both groups in gender, tumour location, largest tumour diameter, cell type and extrascleral growth. In 54 of 167 (32.3%) patients treated with PER and in 44 of 108 (40.7%) EO patients melanoma-related death occurred. All-cause death was specified in 90 of 167 (53.9%) patients treated with PER and 81 of 108 (78.8%) patients treated with EO. The estimated Kaplan Meier 5-, 10- and 15-year survival rates in the patient group with melanoma-related death were 76.5%, 69.8% and 63.76% respectively in the PER group and 71.2%, 57.2% and 51.0%, in the EO group (Figure 1A). No difference in survival rates between the PER and EO group was found with the log-rank test (P=.091) for the whole period of follow-up. Also in the early follow-up, the period before 48 months, no significant difference (P=.709) between both groups could be demonstrated by the log-rank test. However, survival was better (P=.003) after 48 months in the PER group. The estimated 5-, 10- and 15-year survival rates in the patient group dying of all causes were 71.3%, 57.5% and 47.5%, respectively, in the PER group and 62.7%, 40.2% and 25.2%, respectively, in the EO group (Figure 1B).
Melanoma-related death was associated with older age (P<.001), male gender (P=.026), larger tumour size (P<.001), and epitheloid cell type (P=.006) in the univariate analysis. No association was found for the year of treatment (P=.164). To adjust for the potential confounding prognostic variables, such as year of enucleation, age at enucleation, gender, tumour location, tumour size and cell type, on the effect of PER a multivariate Cox-regression was used (Table 2) for melanoma-related death. In the first period of 48 months there was no significant effect of PER (P=.479) on survival, whereas after 48 months there was a significant association (P=.006).

Reduced melanoma-related mortality in uveal melanoma by pre-enucleation radiotherapy
41
The estimated adjusted hazard ratio (PER versus EO) for melanoma-related death after 48 months was 0.39 (P=.006). Similar Cox regression was also used for death due to all causes (results not shown). The estimated adjusted hazard ratio (PER versus EO) for all cause death before 48 months was 1.21 (P=.476) and after 48 months 0.50 (P=.003). In the EO group metastases seemed to occur more often in men than in women (P=.073), whereas in the PER group the percentages were not significantly different (P=.994). A significant difference was demonstrated in the effect of PER on survival between men and women (P=.026) when the interaction between gender and PER was added in the multivariate analysis.
A.
Sur
viva
l Pro
babi
lity
(mel
anom
a re
late
d de
ath)
Sur
viva
l Pro
babi
lity
(all-
caus
e de
ath)
1.00
.75
.50
.25
0.00
B. 1.00
.75
.50
.25
0.00
0 5 10 15 20 25 30
0 5 10 15 20 25 30
Pre-enucleationradiotherapy
Enucleationonly
Pre-enucleationradiotherapy
Post-Treatment follow-up (years)
Post-Treatment follow-up (years)
Enucleationonly
No. at risk
EO 167 120 96 54 14 - -
PER 108 68 44 22 18 10 2
Figure 1.Estimated Kaplan-Meier survival curves of patients managed by pre-enucleation radiotherapy versus enucle-ation alone. A. indicates melanoma-related deaths and B. deaths from all causes.

42
Chapter 3
Discussion
In this study, we observed a beneficial effect on long-term survival of PER by two fractions of 4 Gy compared to EO. The effect became apparent after 48 months of follow-up. This dose should be sufficient to eradicate most (±90%) of the tumour cells and induce a reduction in proliferation activity of melanoma cells as has been demonstrated in in vitro and experimental studies (Kenneally, et al. 1988; Mooy, et al. 1990; van den Aardweg, et al. 2002).
Pre-enucleation radiotherapy did not decrease the short-term melanoma-related death (Augsburger and Gamel 1990; Bornfeld, et al. 1989; Gunalp and Batioglu 1998). Likewise, no beneficial effect of PER on survival was found in an uncontrolled prospective study of 80 patients with primary choroidal and ciliary body melanoma (Bornfeld, et al. 1989) or in an uncontrolled retrospective study on 26 patients with choroidal melanoma (Kreissig, et al. 1989). Moreover, preoperative radiation with five fractions of 4 Gy had a worse prognosis in a series of 41 non-randomly selected patients (Char, et al. 1988). Augsburger et al. (Augsburger, et al. 1990) found a non-significant cumulative 5-year survival probability of 63.9% for 29 patients in the PER group versus 57.9% for 29 patients in the EO group. The COMS trial (COMS 1998) reported an estimated 5-year survival rate of 62% in the PER group and 57% in the EO group. In our earlier report we found a cumulative 7.5-year survival probability
Table 2. Influence of treatment and possible confounders on melanoma-related deathß¹ standard
errorp-value hazard ratio²
(95% CI)
PER vs. EO
before 48 months .22 .31 .479 1.25 (0.67-2.31)after 48 months -.94 .34 .006 0.39 (0.20-0.76)
Age (one year increase) .04 .01 <.001 1.03 (1.02-1.06)Gender (women vs. men) -.48 .21 .026 0.62 (0.41-0.95)Tumour location (anterior vs. posterior) .63 .25 .014 1.88 (1.14-3.10)Largest tumour diameter (one mm increase) .12 .03 <.001 1.13 (1.07-1.19)Cell type (epithelioid vs. spindle) .62 .23 .006 1.86 (1.19-2.90)Year of treatment .03 .02 .164 1.03 (0.99-1.07)
¹The ß-coefficient is the natural logarithm of the hazard ratio.²A hazard ratio, for instance .62 for gender, means that at each time during follow-up women have a chance of dying within one month equal to .62 times the chance of dying within one month for men.

Reduced melanoma-related mortality in uveal melanoma by pre-enucleation radiotherapy
43
of 75.9% in the PER group and 72.1% in the EO group (Luyten, et al. 1995), which was not significantly different. However, in the present extended study we observed a reduction in risk in the PER group after a period of 48 months (P=.006). This suggests that a longer follow-up is needed to confirm differences.
Death in the first 48 months is therefore probably mainly due to micrometastatic spreading of tumour cells before initiation of the treatment (Eskelin, et al. 2000; Manschot and van Strik 1992). Peroperative spreading is most likely responsible for a significant part of the melanoma-related deaths after 48 months and could be prevented by irradiation prior to enucleation.The positive effect of PER is more evident in the 15-year all-cause survival rates (PER group versus the EO group 47.5% and 25.2%, respectively) in our study while these melanoma-related survival rates were 63.7% in the PER group and 51.0% in the EO group. All-cause survival is considered to be important since a significant proportion of melanoma patients die of non-melanoma causes after treatment (COMS 1998; Kroll, et al. 1998). However, Kroll et al. (Kroll, et al. 1998) published a report on all-cause versus cause-specific analyses of mortality after radiation of uveal melanoma. They reported that in analysing prognostic factors information might be lost if analyses are based only on all-cause survival, since the disease does not appear to increase the risk of death from other causes. Survival after treatment is dependent on tumour parameters as well as the expected survival of the patients independent of the melanoma.
In our Cox proportional hazard analysis, melanoma-related death was associated with age, tumour size and cell type as previously described by others (Augsburger and Gamel 1990; Coleman, et al. 1993; Folberg, et al. 1993; Jensen 1982; McLean, et al. 1982). Although no significant difference was observed in several previous studies between men and women (Augsburger and Gamel 1990; Coleman, et al. 1993; Egan, et al. 1993; Gamel, et al. 1992; Jensen 1982; McLean, et al. 1982), we found that women had a better prognostic outcome than men. This difference in prognosis remained after adjusting for irradiation, age, tumour size, tumour location, cell type, and year of treatment. This confirms Folbergs’ finding of a more favourable outcome for women (Folberg, et al. 1993) and more recently it was put forward that women with a history of childbearing had an even better survival compared to nulliparae and men (Egan, et al. 1999). Also in studies with cutaneous melanoma women have a better prognosis than men (Stidham, et al. 1994; Thorn, et al. 1987).
Compared to other studies our study has a large sample size and a long follow-up with little drop out. Patients of the EO and PER groups were not treated during the

44
Chapter 3
same period, which could be considered as a shortcoming of our study. However, the effect of year of treatment, studied in a multivariate analysis, showed no significant association with melanoma-related death (P=.164). A significant difference in age was observed between the PER group and EO group. The average ages in EO and PER groups were 62.5 and 57.6 years, respectively. The older age in the EO group could have a negative influence on survival in this group. This might be a reason for the difference in the Kaplan-Meier survival estimate in favour for the PER group. After adjusting for this prognostic covariate in the multivariate analysis, the difference was still present. We cannot tell if this difference in age between the EO and PER groups was due to earlier tumour detection or shorter observation time of smaller tumours before the advice for enucleation was given.
In conclusion, we found a long-term beneficial effect on survival after two fractions of 4 Gy PER. Life expectancy in women was more favorable than in men. Even though, our study has a long-term follow-up after PER, it would be interesting to see if longer follow-up in similar studies would lead to the same conclusion.
AcknowledgementsThis study was supported by the Netherlands Society for Prevention of Blindness, The Netherlands, and Henkes Stichting, The Netherlands.

Part 2. Characterisation of chromosomal aberrations in uveal melanoma
Chapter 4
Concurrent loss of chromosome 1p and 3 predicts a decreaseddisease free survival in uveal melanoma patients

46
Chapter 4
AbstractPurpose: Uveal melanoma is a highly malignant disease with a mortality of 50% at 10-15 years. Previous studies have shown that chromosomal changes are associated with a decreased survival of the patient. However, these studies analysed small numbers of tumours that did not allow robust statistical analysis. Here we assess the independent value of numerical changes of chromosomes 1, 3, 6 and 8 on the disease free survival (DFS) in a large series of uveal melanoma patients. Patients and methods: 120 tumours from uveal melanoma patients were analysed for numerical changes of chromosomes 1, 3, 6 and 8 with cytogenetic analysis, fluorescent in situ hybridisation and/or comparative genomic hybridisation. Data were correlated with disease outcome in univariate and multivariate analyses using Kaplan-Meier and Cox regression analyses. Results: At a mean follow-up time of 45 months, 42 patients had died or were suffering from metastatic disease. In the univariate analysis, loss of chromosome 3, gain of 8q, largest tumour diameter or the presence of epithelioid cells was associated with a decreased disease free survival. In the multivariate analysis, the effect of monosomy 3 on survival was largely modified by changes in chromosome 1p36. We found that, regarding all chromosomal changes, only concurrent loss of chromosome 1p and 3 was an independent prognostic parameter for DFS (p<0.001). Conclusions: In uveal melanoma, concurrent loss of chromosomes 1p and 3 is an independent predictor of decreased disease free survival. IOVS 2005 Jul;46(7):2253-7

Concurrent loss of chromosome 1p and 3 predicts a decreased disease free survival in uveal melanoma patients
4�
Introduction
Uveal melanoma is the most common form of primary eye cancer in adults with a mortality rate of fifty percent after ten to fifteen years (Egan, et al. 1988). Metastases occur predominantly in the liver. Early identification of patients at high risk of metastases may allow detection of metastases at a stage in which adjuvant therapy can be justified. Several prognostic factors based on clinical and histological features are known, for instance gender, age at time of diagnosis, largest tumour diameter (LTD), involvement of ciliary body and presence of epithelioid cells (Mooy and De Jong 1996). Nevertheless, none of these prognostic factors is specific enough for identification of patients at risk of metastatic disease. Cytogenetic abnormalities are correlated with the clinical outcome of patients with leukaemia and lymphoma (Le Beau and Rowley 1986). Uveal melanomas are highly amenable for cytogenetic analysis and show mostly simple karyotypes in contrast to most other solid tumours. Non random chromosomal abnormalities, such as variation in chromosomes 1p, 3, 6 and 8 were detected in these tumours (Prescher, et al. 1995; Sisley, et al. 1990). Loss of chromosome 3 and gain of chromosome 8q have been associated with a high mortality rate, whereas abnormalities of chromosome 6 were found to correlate with a good prognosis (White, et al. 1998a). However, these data were obtained from relatively small studies. Furthermore, the independent value of these chromosomal changes and the effect of chromosome 1p loss on survival remain to be determined. The purpose of this present study was to investigate the association between chromosomal changes and clinical and histological variables. Furthermore, we aimed to examine the independent effect and interactions of numerical changes of chromosomes 1, 3, 6 and 8 on disease free survival (DFS) of uveal melanoma patients.
Patients and methods
Patients and tumour samplesFrom March 1992 to April 2003, we collected tumour material of 152 consecutive patients who underwent enucleation for ciliary body or choroidal melanoma. Informed consent was obtained prior to enucleation and the study was performed according to the tenets of the Declaration of Helsinki. Fresh tumour material was obtained within 1 hour after enucleation according to a standardised protocol; incision is made through the tumour leaving the optic nerve intact. The quantity of obtained tissue (5-8 mm3) depended on tumour size. A sample was taken from the side opposed to the optic nerve and divided into two; one part was processed
48
Chapter 4
for cytogenetic analysis and/or fluorescent in situ hybridisation (FISH), whereas the other part was stored in liquid nitrogen. Until January 1995 only cytogenetic analysis was performed which was successful in 15 out of 46 cases. From that time on tumours (n=106) were analysed with FISH and, if metaphases could be obtained, with cytogenetic analysis. In the latter ones comparative genomic hybridisation (CGH) analysis (n=30) was performed on tumour material that could not be completely analysed by these two techniques. Conventional histopathologic examination was performed on all tumours and confirmed the origin of the tumour. Cytogenetic studies were also carried out on stimulated peripheral blood samples of each patient to exclude the presence of congenital chromosome abnormalities. Follow-up data from time of diagnosis till the end of the study in April 2004 were obtained by reviewing each patient’s charts and contacting their general physician. Three patients were at that time lost to follow-up. From two of these patients, however, a late date of follow-up was obtained and they were therefore also included in the study. From the 120 patients included in the survival analysis, there were 67 men and 53 women. The age at time of diagnosis ranged from 21 to 87 years (mean 61). The mean duration of follow-up, from diagnosis to presence of metastases or end of study, was 45 months (range 6-142 months).
Histological findings The mean and median tumour diameter and thickness were 12.7 and 13.0 mm (SD 3.3; range 4.5-19), and 7.8 and 8.0 mm (SD 3.7; range 1.5-22), respectively. Twenty tumours showed involvement of the ciliary body and 100 were located in the choroid. Cell type was classified as mixed/epithelioid in 69 tumours and spindle cell type in 51 tumours.
Cytogenetic, FISH and CGH analysisCytogenetic analysisChromosome preparations were made according to standard procedures and stained with acridine orange or atebrine to obtain R or Q banding. Cytogenetic abnormalities were described in accordance with the ISCN (1995)(Mitelman 1995).
FISH analysisDual colour FISH on uncultured tumour material using centromeric and locus specific cosmid, P1 or YAC probes for chromosome 1, 3, 6 and 8 was performed as described previously (Naus, et al. 2002). Seven probes were used: p1-79 (mapped to chromosome band 1p36), Pa 3.5 (centromere 3), YAC 827D3 (3q24), cos85 (6p21) and cos52 (6q23) (Prof. Y Nakamura, Tokyo, Japan), D8Z2 (centromere 8) and ETO (8q22). The probes were validated on normal peripheral blood cell metaphase spreads and

Concurrent loss of chromosome 1p and 3 predicts a decreased disease free survival in uveal melanoma patients
49
ten metaphases were analysed for each probe. Cut-off limits were less than three percent. The concentration for centromeric probes was 5 ng per slide; for cosmids, P1 and YAC probes 50 to 75 ng per slide were used. After hybridisation and washing, slides were counterstained with 4’, 6-diamidino-2-phenylindole and mounted in anti-fade solution (Dabco-Vectashield 1:1). Signals were counted in 300 interphase nuclei according to the criteria of Hopman et al. (Hopman, et al. 1988). Scoring for deletion (>15% of the nuclei with one signal) or amplification (>10% of the nuclei with 3 or more signals) were adapted from the available literature (van Dekken, et al. 1990).
CGH analysisDNA from formalin-fixed paraffin-embedded tumour material was isolated from 40 10μm sections. The pigmented tumour was scraped off from the glass slides using a fine scalpel. Excised material was deparaffinised in xylene and ethanol and air-dried. Isolation of DNA was performed using the DNA tissue kit (Qiagen, Hilden, Germany). Concentration was determined using a fluorometer (Biorad, Veenendaal, The Netherlands), whereas molecular weight was estimated on ethidium-bromide stained agarose gels. Tumour DNA and reference DNA (0.5mg) was labelled using the Bio-prime DNA labelling kit (Invitrogen, Breda, The Netherlands) with Spectrum Green (Vysis, Hoofddorp, The Netherlands) or Alexa 594 (Molecular Probes, Leiden, The Netherlands) respectively. Equal probe mixture of tumour and reference DNA was denatured and hybridised in the presence of human cot-1 DNA to normal male metaphase chromosomes for three days at 37ºC. Samples were counterstained with DAPI in anti-fade solution. Images were acquired with a Zeiss axioplan microscope equipped with Isis software from Metasystems (Metasystems, Altlussheim, Germany). For each case ten metaphases were analysed. Loss of DNA sequences was defined as chromosomal regions where the mean green: red ratio was below 0.8, while gain was defined as chromosomal regions where the ratio was above 1.2. Threshold levels were determined on basis of analysis of known chromosomal aberrations.
Data classificationWe subdivided the variation in chromosomes 1p, 3, 6p, 6q and 8q using cytogenetic and FISH analysis into 3 categories: loss of one copy, normal copy numbers (two copies) and gain of one or more copies. Monosomy 3 was defined when, using FISH, there was only one signal seen for both the centromere 3 and 3q24 probe. Gains of 6p and 8q were scored when more than 2 signals were found for both the 6p21 and 8q22 probe, and loss of 1p and 6q when the probes for 1p36 and 6q23 showed only one signal.

50
Chapter 4
When different subclones were identified, only the FISH findings of the largest clone were classified. Cytogenetic and CGH results were classified for those regions studied with FISH analysis. All major chromosomal changes detected by cytogenetic analysis could also be detected by FISH analysis.
Statistical analysisThe primary end point for DFS was the time to development of metastatic disease from time of enucleation, whereby death due to other causes was treated as censored. The influence of single prognostic factors on DFS was assessed using the log rank test (for categorical variables) or Cox proportional hazard analysis (for continuous variables) and Kaplan-Meier curves were made to illustrate the differences in survival. Comparisons of the distributions of clinical and chromosomal variables were performed with Fisher’s exact test (for categorical variables) and the Mann-Whitney test (for continuous variables). To identify the independent value of the prognostic factors on disease-free survival we used a multivariate Cox proportional hazard analysis and the likelihood ratio test. Possible prognostic factors were age at time of diagnosis, cell type (spindle cell vs. mixed / epithelioid cell), largest tumour diameter, mutual loss of chromosome 1p36 and 3, and gain of 8q. All tests were two-sided. An effect was considered significant if the p-value was 0.05 or less. The statistical analyses were performed with the SPSS-11 software.
Results Of the 152 uveal melanoma, 32 cases we could not be analysed for chromosome 1p, 3, 6 and 8 abnormalities. A total of 120 uveal melanoma cases were analysed for chromosomal changes using cytogenetic, FISH and/or CGH analyses. Cytogenetic analysis was successful in 69 out of 120 tumours. For 55 tumours cytogenetic and FISH data were available, while for 47 tumours only FISH was performed. Additionally, in 30 tumours CGH analysis was performed. Not all probes could be tested on all tumours because of lack of material. The mean number of probes successfully used for FISH was 5.5. Combining cytogenetic, FISH and CGH data genomic abnormalities were found in 88 percent of the 120 tumours. Results for all chromosome regions (1p, 3, 6p, 6q and 8q) were obtained for 108 tumours (varying from 108-118 successful analyses per region, Table 1). Thirty-eight patients had died from metastatic disease and four were suffering from metastases at time of evaluation.

Concurrent loss of chromosome 1p and 3 predicts a decreased disease free survival in uveal melanoma patients
51
Univariate analysis of the single prognostic factors showed significantly lower DFS for patients with loss of chromosome 3, gain of 8q and with a mixed/epithelioid cell type in the tumour compared to patients without these chromosomal changes or with a spindle cell type (Table 1). The largest tumour diameter was also significant in the univariate analysis. Other potential prognostic factors such as gender, age at time of diagnosis, tumour thickness and tumour location (i.e. involvement of ciliary body) did not reach significance. Also chromosomal changes such as loss of chromosome band 1p36, gain of chromosome 6p and loss of chromosome 6q were not significantly associated with disease free survival. To examine the possibility that other chromosomal variations may affect the prognosis of the monosomy 3 patients, we constructed Kaplan-Meier curves of
Table 1. Univariate analysis of prognostic markers on disease free survival in uveal melanoma
variable mean p-value*
Age at time of diagnosis (yrs) 61 0.079†
Largest tumor diameter (mm) 12.7 0.011†
Tumor thickness (mm) 7.8 0.293†
variable no. of patients (%) p-value*
Mixed/epithelioid cell type 69 (58) 0.003
Involvement ciliary body 20 (17) 0.521
Male gender 67 (56) 0.978
loss of 1p36 41/118 (35) 0.081
loss of chromosome 3 55/109 (50) <0.001
gain of chromosome 6p 34/111 (27) 0.497
loss of chromosome 6q 33/108 (31) 0.319
gain of chromosome 8q 69/110 (63) <0.001
* Log-rank test † Cox-regression analysis

52
Chapter 4
chromosome 3 changes stratified for the other chromosomal changes and performed log rank tests (results not shown). We found that the effect of monosomy 3 on DFS was substantially modified by changes in copy number of chromosome 1p36. In tumours with normal copy numbers of chromosome 1p36, a small difference in DFS was observed between those patients with and without loss of chromosome 3 (p=0.064) whereas this difference was highly significant in patients with tumours with also loss of chromosome 1p36 (p<0.001). The interaction term between tumours with loss of chromosome 1p36 and 3 and the remaining patients (i.e. patients with tumours with normal copies of chromosome 1p36 and 3 or with either 1p36 or 3 loss) was highly suggestive (HR= 3.61), but did not reach significance (p=0.155). In addition, we compared the DFS of patients with a concurrent loss of chromosome 1p36 and chromosome 3 with the remaining patients using the log rank test. The difference in survival was found to be highly significant (p<0.001) (Figure 1). Remarkably, gain of chromosome 1p36 occurred in 5 patients, but this number was too small to perform statistical analysis.
Considering the strong interaction between chromosome 1p and 3 losses, we validated whether this concurrent loss is an independent parameter for DFS. Significant correlations between age at time of diagnosis, tumour diameter, cell type, chromosome 6p and 8q gains using Mann-Whitney and Fisher’s exact tests (Table 2) were observed. Monosomy 3 was associated with age at time of diagnosis (p=0.050),
Sur
viva
l Pro
babi
lity
Time (months)
1.0
.6
.8
.4
.2
0.00 20 40 60 80 100 120 140
Figure 1. Kaplan-Meier survival curve of loss of chromosome 1p36 and/or chromosome 3 Dashed line: tumours with concurrent loss of 1p36 and 3; solid line: tumours with loss of only chromosome 1, region p36; only monosomy 3; or neither 1p36 nor 3 (P < 0.001).

Concurrent loss of chromosome 1p and 3 predicts a decreased disease free survival in uveal melanoma patients
53
cell type (p=0.013) and mean tumour diameter (p=0.002). Gain of chromosome 6p was correlated with cell type (p=0.008) and gain of chromosome 8q with mean tumour diameter (p<0.001). These chromosomal changes and confounding variables were analysed in a multivariate model. After correcting for these variables, we found that patients with tumours with concurrent loss of chromosomes 1p36 and 3 have an almost 7.8 times higher chance of developing metastases compared to those without these losses or with either 1p36 or 3 loss (p=0.039) (Table 3). Gain of chromosome 8q (HR=2.43, p=0.054) and mixed/epithelioid cell type (HR=2.24, p=0.077) almost reached significance and the other variables (gain of chromosome 6p, largest tumour diameter and age at time of diagnosis) were not significant. Furthermore, the interaction term between monosomy 3 and gain of chromosome 8q was not significant (HR=0.53; p=0.469). When analysed in a multivariate model with the confounding variables, such as age at time of diagnosis, gain of chromosome 6p, cell type and mean tumour diameter, we found a hazard ratio of 0.67 with a p-value of 0.676 (data not shown).
Discussion
Previous studies already demonstrated the non-random occurrence of cytogenetic abnormalities of chromosome 1, 3, 6 and 8 in uveal melanoma. Monosomy 3 and gain of 8q have been shown to be associated with poor survival after treatment for uveal melanoma (Prescher, et al. 1996; Sisley, et al. 1997; White, et al. 1998a). Using univariate analysis we confirmed these findings. In addition, we demonstrated in the present study, which is the largest series described so far therefore allowing multivariate statistical analysis, that tumours with a concurrent loss of chromosomes 3 and 1p36 are at high risk of metastasising (HR=7.81, Table 3). The molecular genetic changes that underlie these chromosomal changes have not yet been determined. Chromosome 1p loss occurs frequently in many solid tumours like skin melanoma and neuroblastoma. In the latter tumour type, loss of chromosome 1p is known to be a predictor of unfavourable outcome of the patient (Caron, et al. 1996; Knuutila, et al. 1999). In uveal melanoma loss of chromosome 1p has been described, but any prognostic significance had not been determined up to now. Contrary to Sisley et al. (Sisley, et al. 2000) in our study loss of material of 1p36 was not associated with large ciliary body melanomas, but was rather detected in metastasising tumours in agreement with Aalto et al. (Aalto, et al. 2001). Eighty-nine percent of the metastasised tumours with chromosome 1p36 loss had concurrent monosomy 3. Concurrent loss affecting survival suggests an interaction of proteins encoded by genes located on these chromosomes, which may promote tumorigenesis, metastatic disease and

54
Chapter 4
Chromosome 1p36 loss* Chromosome 3 loss* Chromosome 6p gain* Chromosome 8q gain*
Clinical data - + p-value - + p-value - + p-value - + p-value
Gender male female
42 200.193†
32 290.311†
45 190.481†
24 390.498†
29 21 22 26 32 15 17 30
Mean age (yrs) 61 61 0.345‡ 57 64 0.050‡ 61 59 0.298‡ 59 61 0.223‡
Cell type spindle mixed/epithelioid
32 170.432†
24 170.013†
27 210.008†
23 240.024†
39 24 25 38 50 13 18 45
Mean tumor thickness (mm) 7.8 8.0 0.355‡ 7.7 8.5 0.133‡ 7.8 8.6 0.135‡ 7.5 8.4 0.127‡
Mean tumor diameter (mm) 12.5 13.0 0.186‡ 12.1 13.9 0.002‡ 12.6 13.6 0.059‡ 11.3 13.9 <0.001‡
Involvement of ciliary body no yes
61 31 0.133† 48 43 0.106† 62 30 0.239† 34 57 0.592† 10 10 6 12 15 4 7 12
Table 2. Correlation between chromosomal abnormalities and clinical data
Table 3. Prognostic markers for metastasis in 120 uveal melanoma patients *
variable hazard ratio p-value†
Loss of chromosome 1p36 with loss of 3 7.81 0.039
Gain of chromosome 8q 2.43 0.054
Mixed/epithelioid cell type 2.24 0.077
Gain of chromosome 6p 1.33 0.558
Largest tumor diameter 1.03 0.588
Age at time of diagnosis 1.00 0.900
* Multivariate analysis using Cox proportional hazard analysis† Likelihood ratio test

Concurrent loss of chromosome 1p and 3 predicts a decreased disease free survival in uveal melanoma patients
55
Chromosome 1p36 loss* Chromosome 3 loss* Chromosome 6p gain* Chromosome 8q gain*
Clinical data - + p-value - + p-value - + p-value - + p-value
Gender male female
42 200.193†
32 290.311†
45 190.481†
24 390.498†
29 21 22 26 32 15 17 30
Mean age (yrs) 61 61 0.345‡ 57 64 0.050‡ 61 59 0.298‡ 59 61 0.223‡
Cell type spindle mixed/epithelioid
32 170.432†
24 170.013†
27 210.008†
23 240.024†
39 24 25 38 50 13 18 45
Mean tumor thickness (mm) 7.8 8.0 0.355‡ 7.7 8.5 0.133‡ 7.8 8.6 0.135‡ 7.5 8.4 0.127‡
Mean tumor diameter (mm) 12.5 13.0 0.186‡ 12.1 13.9 0.002‡ 12.6 13.6 0.059‡ 11.3 13.9 <0.001‡
Involvement of ciliary body no yes
61 31 0.133† 48 43 0.106† 62 30 0.239† 34 57 0.592† 10 10 6 12 15 4 7 12
* Chromosome locus at which the abnormality is absent (-) or present (+)
† The p-value is for the comparison among different subgroups within a chromosome aberration group and was calculated by Fisher’s exact test
‡ The p-value is for the comparison of means among different subgroups within a chromosome aberration group and was calculated by Mann-Whitney test
Significant p-values are indicated in bold
consequently reduce survival. However, we cannot exclude that these sites encode for proteins that might independently promote tumorigenesis and metastasis.Gain of chromosome 8q was a significant predictor of survival in the univariate analysis. In the multivariate analysis it did not reach statistical significance as an independent prognostic marker. Previous studies already suggested that acquisition of isochromosome 8q is a secondary event and that gain of additional copies is related to tumour size (Gordon, et al. 1994; Prescher, et al. 1994; Sisley, et al. 1997). Moreover, monosomy 3 seemed to predispose to isochromosome formation (Prescher, et al. 1995). This may explain the correlation of gain of chromosome 8q with survival as observed in other studies (Sisley, et al. 1997; White, et al. 1998a). We demonstrated a strong correlation between the largest tumour diameter and the presence of chromosome 8q abnormalities, suggesting that acquisition of additional copies of 8q may result in a growth advantage of the tumour. Similarly, the abnormalities of chromosome 6 were not independently associated with survival, in contrast to previous claims (White, et al. 1998a). We found a strong correlation between the gain of chromosome 6p and spindle cell type. Sisley and

56
Chapter 4
White and coworkers associated chromosomal changes, such as loss of chromosome 3, gain of chromosome 8q and abnormalities of chromosome 6 with prognosis (Sisley, et al. 2000; White, et al. 1998a). However, as far as we know their findings were not corrected for tumour diameter or cell type as in the present study. This could have influenced their findings, leading to contradictory observations. Another known prognostic marker for a poor outcome of uveal melanoma patients is the presence of epithelioid cells. We found a strong correlation between chromosomal aberrations (chromosomes 3, 6 and 8) and cell type (Table 2). Even though epithelioid or mixed cell type was significantly associated with decreased DFS in the univariate analysis, it was not in the multivariate analysis. Although loss of an entire chromosome is a common change in uveal melanoma, partial deletions of chromosome 3 have been reported leading to the hypothesis that two regions, one on the p-arm and one on the q-arm, might be involved in metastasis (Tschentscher, et al. 2001). Seven patients in our study had a partial deletion of chromosome 3 (either one copy of the centromeric region or 3q-region) from whom 2 patients had died due to metastatic disease. In five tumours two signals for the centromere and only one signal for the 3q probe were observed, whereas two tumours had one copy of the centromere and two of the 3q-probe. Since these changes were observed with FISH analysis and karyograms of these tumours were not available, we were not able to identify any breakpoints. These and more subtle structural aberrations can be resolved with techniques with higher resolution, such as genomic arrays or LOH. However, changes such as base substitutions, very small deletions or insertions will still be missed. Our study on chromosomal abnormalities in uveal melanoma is, to our knowledge, the largest series reported in the literature. Our study may be biased because we examined only tumours from patients treated by enucleation, as no tumour material is available from patients treated with radiotherapy protocols. There is a need to stratify patients prospectively into low and high-risk groups for metastases. Our findings suggest that chromosomal abnormalities may be useful in identifying patients at high risk of metastases. Previous studies by Sisley et al. have shown a correspondence between major clonal alterations in FNAB’s and the main tumour using cytogenetic techniques (Sisley, et al. 1998). Furthermore, they showed that with short-term cultures of FNAB’s conventional cytogenetic analysis was possible in 60% of the cases. In addition, Naus et al. indicated that application of FISH on FNAB’s is a reliable method for assaying genetic prognostic parameters (Naus, et al. 2002). Only in 0.8% a small variation that have could lead to a misclassification was found.
There are at least two potential challenges involved in the application of our data

Concurrent loss of chromosome 1p and 3 predicts a decreased disease free survival in uveal melanoma patients
5�
to patients on a prospective basis. First, our study involves patient samples from relatively large tumours that were treated by enucleation. It remains to be seen that our data can be applied to smaller tumours that will be treated by radiation therapy. Second, despite correspondence between chromosomal abnormalities detected from FNAB samples and tissue retrieved at enucleation, there are no studies to date that confirm the uniform distribution of cytogenetic abnormalities in uveal melanoma, and it is at least theoretically possible that an FNAB might capture tissue that does not contain the cytogenetic markers of interest. Nevertheless, data from our study, the largest cohort of patients studied to date for cytogenetic abnormalities in primary uveal melanoma, suggests the feasibility of studying patients with uveal melanoma in prospective trials using samples retrieved by FNAB.
Acknowledgements
Prof. Dr. A. Hagemeijer, Dr. R. Slater and E. van Drunen performed the majority of the cytogenetic analyses during the early years of the study.


Part 2. Characterisation of chromosomal aberrations in uveal melanoma
Chapter 5
Clinical and cytogenetic analyses in uveal melanoma

60
Chapter 5
AbstractPurpose: Uveal melanoma is one of the most frequent primary intraocular malignancies in the western world. Cytogenetically these tumours are characterised by typical chromosomal losses and gains, such as loss of chromosome 1p, 3, 6q and gain of chromosome 6p, and 8q. Whereas most studies focus on known aberrations we characterised cytogenetic changes and correlated them with clinical and histopathological parameters. Patients and methods: Karyotypes of 74 primary uveal melanomas were analysed with respect to the presence or absence of chromosomal gains and losses. In the analysis classical clinical and histopathological parameters were analysed together with the chromosomal aberrations. Results: At a median follow up of 43 months 34 patients had died or were suffering form metastatic disease. Clonal chromosomal abnormalities were present in 59 tumours. The most frequent chromosomal abnormalities involved chromosome 8 (53%), loss of chromosome 3, p-arm (41%) and q-arm (42%), partial loss of chromosome 1p (24%) and abnormalities of chromosome 6, which results in gain of material of 6p (18%) and/or loss of 6q (28%). Less frequent aberrations were abnormalities of chromosome 16, in particular loss of chromosome 16q (16%). In the univariate analysis loss of chromosome 3, largest tumour diameter, gain of 8q and mixed/epithelioid cell type in the tumour compared to tumours without these chromosomal changes or with a spindle cell type was associated with a decreased disease free survival. Conclusions: Monosomy 3 and largest tumour diameter are the most significant in determining survival for uveal melanoma patients. Abnormalities of chromosome 16q are relatively common in uveal melanoma, but are not associated with survival or other cytogenetic or histopathological parameters. Submitted for publication

Clinical and cytogenetic analyses in uveal melanoma
61
Introduction
Uveal melanoma (UM) is the most common primary intra-ocular tumour in the western world, affecting approximately 7 per million people each year. Tumorigenesis and progression of cancer is in general preceded by the occurrence of genetic changes in normal cells (Heim 1995). In this respect UMs are quite homogenous with a few tumour specific cytogenetic aberrations. Some of these aberrations are correlated with the metastatic potential of the tumour resulting in metastatic disease followed by death. Recurrent aberrations in UM concern loss of chromosome 1p, monosomy of chromosome 3, loss of chromosome 6q and 8p, gain of chromosome 6p and 8q.
Loss of chromosome 1p was observed in metastases (Aalto, et al. 2001) and concurrent loss of chromosome 1p and 3 is associated with decreased survival (Hausler, et al. 2005; Kilic, et al. 2005). Furthermore, monosomy 3 is considered to be an early event in UM and several studies have shown that it is a strong predictor for survival (Prescher, et al. 1996; Sisley, et al. 1997; White, et al. 1998a). Loss of chromosome 3 is frequently associated with amplification of chromosome 8q, often seen as an isochromosome 8q (Prescher, et al. 1994; Prescher, et al. 1995).Recently, Hoglund et al. elucidated a common genetic pathway for both uveal as cutaneous melanoma (Hoglund, et al. 2004). Monosomy 3 occurs probably as an early event and loss of chromosome 1p, 8p and gain of 8q as secondary events.
Regions of chromosomal loss are thought to harbour tumour suppressor genes and regions of gain oncogenes. Previous cytogenetic analyses focus in general on the known aberrations. In this study we performed cytogenetic analysis on short-term cell cultures of fresh tissue from 74 primary UMs to characterize all chromosomal changes and correlate these changes with clinical and histopathological parameters. Significant prognostic parameters for UM at high-risk for metastases were identified.
Material and methods
Patients and tumour samplesFrom March 1992 to April 2003, we collected tumour material of patients who underwent enucleation for ciliary body or choroidal melanoma. Informed consent was obtained prior to enucleation and the study was performed according to the tenets of the Declaration of Helsinki. Fresh tumour material was obtained within 1 hour after enucleation and processed as described before (Kilic, et al. 2005).
62
Chapter 5
Conventional histopathologic examination was performed on all tumours and confirmed the origin of the tumour. Cytogenetic studies were also carried out on stimulated peripheral blood samples of each patient to exclude the presence of congenital chromosome abnormalities. Follow-up data from time of diagnosis till the end of the study in December 2005 were obtained by reviewing patient’s charts and contacting their general physician.
Cytogenetic analysisChromosome preparations were made according to standard procedures and stained with acridine orange or atebrine to obtain R or Q banding. Cytogenetic abnormalities were described in accordance with the ISCN (1995)(Mitelman 1995).
Data classificationBased on the cytogenetic analysis tumours were classified for gain and or loss for all chromosomal regions, p-arm or q-arm. When different subclones were identified, only the cytogenetic findings of the largest clone were classified. Chromosomal regions with loss in more than 10% of all tumours and gain in more than 15% of all tumours were included for analysis. Tumours were identified as small (<12mm) and large (> 12mm).
Statistical analysisThe primary end point for disease free survival (DFS) was the time to development of metastatic disease, whereby death due to other causes was treated as censored. The influence of single prognostic factors on DFS was assessed using the log rank test (for categorical variables) or Cox proportional hazard analysis (for continuous variables) and Kaplan-Meier curves were made to illustrate the differences in survival. To examine the possibility that other clinical, histopathological or chromosomal variations may affect the prognosis we performed Cox proportional hazard analysis for each confounding variable. An effect was considered significant if the p-value was 0.05 or less. The odds-ratios with corresponding p-values were calculated to identify association between the different parameters. The statistical analyses were performed with the SPSS-11 software.

Clinical and cytogenetic analyses in uveal melanoma
63
Results
PatientsChromosome analysis was successfully performed in 74 cases. The clinical and histopathological features of the 74 primary UMs are listed in the supplementary information. The median age of the patients at time of enucleation was 60 years (range 21-87 years), 29 women and 45 men. One patient was lost to follow-up after 27 months. At the end of follow-up time 31 patients had died of melanoma-related disease, 3 patients were diagnosed with metastases, 9 patients had died due to other causes and 31 patients were still alive without metastases. The median follow-up time was 42.8 months (range 6.4 - 164.4 months).
Histolopathology All tumours were confirmed histopathologically as UM. Based on their cell type 16 tumours were classified as epithelioid cell type, 24 as mixed cell type and 34 tumours as spindle cell type. The mean tumour diameter and thickness were 13.2 mm (range 6-19) and 8.4 mm (range 2-22), respectively. Four tumours were located in the ciliary body and 70 were located in the choroid. CytogeneticSeventy-four UMs were analysed for cytogenetic changes (see supplementary information) and classified for gain and loss for all chromosomal regions (Table 1). Clonal chromosomal abnormalities were present in 59 tumours. The most frequent chromosomal abnormality involved chromosome 8, trisomy of chromosome 8 or gain of material of from 8q, most often in the form of an i(8q) (53%). Other abnormalities involved loss of chromosome 3, p-arm (41%) and q-arm (42%). Partial loss of chromosome 1p (24%) and abnormalities of chromosome 6, resulting in gain of material of 6p (18%) and/or loss of 6q (28%). Other less frequent aberrations were abnormalities of chromosome 16, in particular loss of chromosome 16q (16%) (Figure 1). Other chromosomal aberrations, such as loss of 6p, 9p, 15p, 15q, 21p, 22p and gain of 2p, 2q, 7q, 9p, 11q were present but did not reach the 10%.

64
Chapter 5
Loss and gain >10% of all tumors n=741p loss 18 (24%)3p loss 30 (41%)3q loss 31 (42%)6p gain 13 (18%)6q loss 21 (28%)8p gain 13 (18%)8p loss 18 (24%)8q gain 39 (53%)16q loss 12 (16%)
Loss and gain <10% of all tumors2p gain 4 (5%)2q gain 4 (5%)6p loss 7 (9%)7q gain 4 (5%)9p gain 4 (5%)9p loss 7 (9%)11q gain 7 (9%)15p loss 7 (9%)15q loss 7 (9%)21p loss 7 (9%)22p loss 7 (9%)
Figure 1.Karyotype of tumour EOM 63This tumour showed chro-mosomal changes for UM: -3, i(6)(p), i(8)q (multiple copies) and del(16)(q21).
Table 1. Recurrent changes in karyotype of primary uveal melanoma

Clinical and cytogenetic analyses in uveal melanoma
65
Statistical analysisUnivariate analysis was performed for all clinical, histopathological and cytogenetic parameters (Table 2, Figure 2). Univariate analysis of the single prognostic factors showed significant lower disease free survival (DFS) for patients with loss of chromosome 3, largest tumour diameter, gain of 8q and with a mixed/epithelioid cell type in the tumour compared to tumours without these chromosomal changes or with a spindle cell type. Other potential prognostic factors such as gender, age at time of diagnosis and tumour location (i.e. involvement of ciliary body) did not reach significance. Also chromosomal changes such as loss of chromosome 1p, gain of chromosome 6p and loss of chromosome 6q were not significantly associated with disease free survival. To examine the possibility that other clinical, histopathological or chromosomal variations may affect the prognosis we performed Cox proportional hazard analysis for each confounding variable (Table 2). Parameters presented in the columns are the investigated prognostic parameters; in the rows the same parameters resemble the confounders with a possible modifying effect. Significance of loss of chromosome 3p/3q did not alter after correcting for the possible confounders. A similar pattern was observed for largest tumour diameter and cell type. Odds ratios were calculated to identify association between the different parameters (Table 3). Associations were shown for loss of chromosome 3 with gain of 8q, loss of chromosome 8p, vascular patterns and largest tumour diameter (>12mm), and a weak association with mixed/epithelioid cell type. Presence of vascular patterns and largest tumour diameter (>12mm) showed also association with gain of chromosome 8q. Associations were also present for loss of chromosome 1p with loss of 16q and loss of chromosome 3p, and weak association with cell type, vascular patterns largest tumour diameter, chromosome 3q loss and 8q gain. Loss of chromosome 6q was weakly associated with gain of chromosome 8q. Loss of chromosome 16q was weakly associated with gain of chromosome 8p.

66
Chapter 5
Tabl
e. 2
Pro
gnos
tic
sign
ific
ance
of
clin
ical
, his
topa
thol
ogic
al a
nd c
hrom
osom
al a
berr
atio
ns in
uve
al m
elan
oma†‡
m/v
age
epitheloid present
involv. ciliary body
vascular pattern
cell type
LTD
1p loss
3p loss
3q loss
6p gain
6q loss
8p gain
8p loss
8q gain
16q loss
p-va
lue*
,897
,063
,298
,840
,116
,018
,007
,284
,000
9,0
021
,424
,699
7,6
192
,117
,023
,233
m/v
,063
,304
,849
,125
,020
,008
,272
,001
,003
,427
,698
,613
,118
,020
,195
age
,964
,443
,643
,289
,039
,026
,376
,004
,009
,405
,488
,557
,149
,014
,262
epith
elio
id p
rese
nt,9
62,0
86,6
49,2
57,0
46,0
09,3
09,0
03,0
05,4
90,5
76,5
94,1
61,0
26,1
86in
volv
. cili
ary
body
,912
,057
,264
,091
,015
,010
,269
,001
,003
,421
,716
,616
,118
,025
,218
vasc
ular
patt
ern
,701
,034
,419
,502
,141
,070
,531
,012
,027
,283
,157
,816
,438
,172
,687
cell
type
,671
,105
,771
,458
,248
,004
,112
,008
,013
,597
,688
,427
,512
,53?
,145
LTD
,498
,205
,256
,797
,198
,005
,775
,022
,062
,272
,580
,561
,446
,128
,511
1p lo
ss,7
76,0
75,3
22,7
27,1
67,0
09,0
16,0
03,0
04,5
21,6
47,9
35,0
93,0
42,4
203p
loss
,543
,187
,719
,482
,356
,176
,105
,663
,730
,258
,844
,510
,465
,603
,399
3q lo
ss,6
47,2
04,6
58,5
23,4
56,1
41,1
41,4
17,2
59,2
84,6
63,4
82,6
17,4
81,3
586p
gai
n,9
21,0
60,3
41,8
05,1
67,0
28,0
08,3
54,0
01,0
02,5
71,6
94,1
22,0
27,1
856q
loss
,885
,053
,269
,873
,058
,021
,010
,274
,002
,003
,379
,651
,124
,029
,251
8p g
ain
,872
,060
,295
,830
,117
,017
,010
,347
,002
,003
,455
,741
,084
,021
,251
8p lo
ss,7
87,0
74,3
89,7
56,1
50,0
74,0
21,2
13,0
02,0
06,4
26,7
12,3
48,0
68,2
198q
gai
n,4
56,0
33,2
80,6
76,2
51,0
51,0
38,6
28,0
26,0
43,4
30,9
49,5
28,5
46,4
9016
q lo
ss,5
89,0
67,2
48,7
02,1
26,0
14,0
15,5
05,0
02,0
04,3
42,7
70,6
74,1
14,0
41
* Log
-ran
k te
st (f
or c
ateg
oric
al v
aria
bles
) or c
ox p
ropo
rtio
nal h
azar
d an
alys
is (f
or c
ontin
uous
var
iabl
es)
† Mul
tivar
iate
ana
lysi
s us
ing
Cox
pro
port
iona
l haz
ard
anal
ysis
‡ Lik
elih
ood
ratio
test
, p-v
alue
repr
esen
ted
by c
olor
: >.1
0 =w
hite
, <.1
0 an
d >.
05 =
ligh
t sha
ded,
< .0
5 =
dark
sha
ded

Clinical and cytogenetic analyses in uveal melanoma
6�
020
4060
8010
012
014
016
018
0
Tim
e (m
onth
s)
0,0
0,2
0,4
0,6
0,8
1,0
Survival probabilityLo
ss o
f chr
omos
ome
1p
020
4060
8010
012
014
016
018
0
Tim
e (m
onth
s)
0,0
0,2
0,4
0,6
0,8
1,0
Survival probability
Loss
of c
hrom
osom
e 3p
020
4060
8010
012
014
016
018
0
Tim
e (m
onth
s)
0,0
0,2
0,4
0,6
0,8
1,0
Survival probability
Loss
of c
hrom
osom
e 3q
020
4060
8010
012
014
016
018
0
Tim
e (m
onth
s)
0,0
0,2
0,4
0,6
0,8
1,0
Survival probability
Gai
n of
chr
omos
ome
6p
020
4060
8010
012
014
016
018
0
Tim
e (m
onth
s)
0,0
0,2
0,4
0,6
0,8
1,0
Survival probability
Loss
of c
hrom
osom
e 6q
020
4060
8010
012
014
016
018
0
Tim
e (m
onth
s)
0,0
0,2
0,4
0,6
0,8
1,0
Survival probability
Gai
n of
chr
omso
me
8p
020
4060
8010
012
014
016
018
0
Tim
e (m
onth
s)
0,0
0,2
0,4
0,6
0,8
1,0
Survival probability
Loss
of c
hrom
osom
e 8p
020
4060
8010
012
014
016
018
0
Tim
e (m
onth
s)
0,0
0,2
0,4
0,6
0,8
1,0
Survival probability
Gai
n of
chr
omos
ome
8q
020
4060
8010
012
014
016
018
0
Tim
e (m
onth
s)
0,0
0,2
0,4
0,6
0,8
1,0
Survival probability
Loss
of c
hrom
osom
e 16
q
ab
erra
tion
not p
rese
nt
------
- ab
erra
tion
pres
ent
____
020
4060
8010
012
014
016
018
0
Tim
e (m
onth
s)
0,0
0,2
0,4
0,6
0,8
1,0
Survival probability
Cel
l typ
e
020
4060
8010
012
014
016
018
0
Tim
e (m
onth
s)
0,0
0,2
0,4
0,6
0,8
1,0
Survival probability
Larg
est t
umor
dia
met
er
020
4060
8010
012
014
016
018
0
Tim
e (m
onth
s)
0,0
0,2
0,4
0,6
0,8
1,0
Survival probability
Gen
der
020
4060
8010
012
014
016
018
0
Tim
e (m
onth
s)
0,0
0,2
0,4
0,6
0,8
1,0
Survival probability
Invo
lvem
ent c
iliar
y bo
dy
020
4060
8010
012
014
016
018
0
Tim
e (m
onth
s)
0,0
0,2
0,4
0,6
0,8
1,0
Survival probability
Vasc
ular
pat
tern
s
sp
indl
e
------
- ep
ithel
ioid
/ mix
ed
< 1
2 m
m
------
- >
12.1
mm
____
fe
mal
e ---
----
mal
e
____
ye
s ---
----
no
____
no
---
----
yes
____
____
Figu
re 2
. K
apla
n-M
eier
sur
viva
l cur
ves
for
clin
ical
, his
topa
thol
ogic
al a
nd c
hrom
osom
al a
berr
atio
ns.

68
Chapter 5
Tabl
e 3.
Rel
atio
n be
twee
n di
ffer
ent
hist
opat
holo
gica
l, c
lini
cal
and
chro
mos
omal
abe
rati
ons
m/v
involv. ciliary body
8p gain
16q loss
1p loss
cell type
epithelioid present
vascular pattern
3p loss
3q loss
8q gain
8p loss
6q loss
6p gain
m/v
0.16
70.
953
0.04
20.
283
0.19
60.
218
0.86
20.
118
0.09
90.
079
0.60
00.
903
0.07
7in
volv
. cili
ary
body
0.34
30.
562
0.48
10.
365
0.25
9na
0.18
50.
566
0.68
40.
559
0.96
20.
313
0.69
28p
gai
n1.
038
1.66
70.
010
0.92
90.
208
0.56
50.
071
0.65
00.
816
nana
0.37
80.
322
16q
loss
0.25
61.
867
0.92
70.
005
0.75
60.
766
0.57
50.
178
0.25
50.
103
0.43
00.
271
0.12
91p
loss
0.55
62.
040
5.30
36.
491
0.08
80.
426
0.08
60.
012
0.08
40.
063
0.38
90.
948
0.15
5ce
ll ty
pe0.
440
0.40
93.
913
0.79
66.
220
na0.
136
0.04
90.
085
0.15
30.
002
0.77
40.
550
epith
elio
id p
rese
nt1.
889
na1.
508
0.81
81.
658
na0.
003
0.04
80.
076
0.41
80.
173
0.32
40.
161
vasc
ular
patt
ern
0.91
53.
200
3.75
81.
500
2.90
00.
367
6.50
00.
016
0.00
40.
003
0.15
30.
268
0.16
33p
loss
0.46
71.
538
1.32
12.
374
4.22
20.
316
3.14
83.
600
0.00
00.
000
0.00
00.
798
0.86
63q
loss
0.44
81.
357
1.15
42.
072
2.61
90.
367
2.66
74.
800
396.
333
0.00
00.
000
0.96
60.
702
8q g
ain
0.42
11.
569
na3.
200
3.00
00.
424
1.51
35.
042
24.0
0019
.727
0.00
20.
047
0.60
38p
loss
0.75
01.
042
na1.
714
0.54
70.
143
2.56
82.
333
24.0
0020
.000
11.4
780.
593
0.55
36q
loss
1.06
60.
329
1.75
82.
054
0.96
20.
838
0.58
30.
523
1.14
30.
978
3.02
11.
367
0.12
66p
gai
n0.
328
0.64
30.
340
2.94
40.
216
1.63
80.
415
0.36
10.
900
0.78
70.
727
1.49
22.
629
na =
not
ava
ilabl
eTh
e od
ds ra
tios
are
give
n be
low
the
blac
k bo
xes
and
the
corr
espo
ndin
g p-
valu
es a
bove
. The
sha
ded
area
s re
pres
ent p
-val
ue <
. 05.

Clinical and cytogenetic analyses in uveal melanoma
69
Discussion
By means of karyotyping we have analysed chromosomal aberrations in UM. Previous reports have revealed that abnormalities of chromosome 1, 3, 6 and 8 occur non-random in UM. Some of these tumour specific aberrations have been associated with the metastatic potential of the tumour. In this study loss of chromosome 1p, chromosome 3, aberrations of chromosome 6, 8 and 16 are most often encountered. Furthermore, we have demonstrated that tumours with abnormalities of chromosome 3, gain of chromosome 8q, epithelioid/mixed cell type and a larger tumour diameter are strongly associated with a poor prognosis.
In UM numerous parameters have been used to predict survival, with the conventional parameters being tumour size, tumour location, cell type and vascular patterns (Foss, et al. 1997). None of these factors are entirely solid, and there has been considerable variation in interpretation among observers. In contrast to some earlier reports (Sisley, et al. 2000) we did not find chromosome 11 and 21 to occur very often (Table 1) and therefore these aberrations were not included in the analysis. In addition, we identified loss of chromosome 16q. Chromosome 16 loss, in particular 16q, also mentioned in earlier reports (Hoglund, et al. 2004; Sisley, et al. 2000; Kilic et al. unpublished results) occurred in more than 10% of the UMs. Even though it was not significantly associated with disease free survival it still might be involved in tumour progression. A remarkable association was shown for loss of chromosome 16q with loss of chromosome 1p. Delineation of a region on chromosome 16q may depict a region of interest with possible candidate genes. Other tumours, s.a. breast cancer and neuro-ectodermal tumours have also shown deletion on 16q (Dallas, et al. 2005). Since UM cells are derived from neuro-ectodermal tissue this might be of potential interest. In many reports outcome was correlated with tumour location (Sisley, et al. 1992; White, et al. 1998a). Since we had limited sample size in the group tumours located in the ciliary body we were not able to make reliable assumptions on association of outcome with tumour location. Largest tumour diameter in our study was histopathologically measured. This parameter may be used non-invasively in a clinical setting (measurement on ultrasound) and may be the most reliable non-invasive prognostic parameter. However, there is a variation between clinical and histopathological measurements. The tumour size measured on ultrasound is in general larger than the histopathological measurement. In contrast, the detection of specific chromosomal aberrations by routine FISH, CGH and karyotyping provides a more objective measurement of potential tumour behaviour. Identification of monosomy 3 in a tumour sample is widely accepted as the most reliable prognostic parameter (Prescher, et al. 1996; Sisley, et al. 1997;

�0
Chapter 5
White, et al. 1998a). Monosomy of chromosome 3 is considered as an early event, occurring before alterations of chromosome 8, 1 and 6. In table 3 the odds ratios were shown for different chromosomal parameters. If we put the odds ratios in following order, chromosome 8q gain, and consequently 8p loss, follows monosomy 3, and loss of chromosome 1p and 16q occur thereafter. This is consistent with the findings observed by Hoglund et al. (Hoglund, et al. 2004). Furthermore, tumour diameter is associated with most of the chromosomal aberrations, implying that larger tumours have more aberrations. Our study involves patient samples from relatively large tumours that were treated by enucleation. Considering monosomy 3 as an early event it would be observed in even the smallest amount of tissue (e.g. FNAB) despite the heterogeneity of UM (Naus, et al. 2002). Though, there are no studies to date that confirm the uniform distribution of cytogenetic abnormalities in UM, and it is at least theoretically possible that a FNAB might capture tissue that does not contain the cytogenetic markers of interest.
Acknowledgements
Prof. Dr. A. Hagemeijer, Dr. R. Slater and E. van Drunen performed the majority of the cytogenetic analyses during the early years of the study.

Part 2. Characterisation of chromosomal aberrations in uveal melanoma
Chapter 6
Chromosome imbalances in familial uveal melanoma detectedby comparative genomic hybridisation

�2
Chapter 6
AbstractIntroduction: Familial melanoma accounts for 0.6% of all uveal melanoma patients. A locus for genetic predisposition is still unknown and so far the chromosomal aberrations arising in these tumours have not been characterised. To elucidate the genetic similarity between familial uveal melanoma and sporadically occurring primary uveal melanoma, tumour material of individuals with a family history of uveal melanoma and sporadic occurring melanoma were screened for DNA copy number alterations by comparative genomic hybridisation (CGH). Patients and methods: DNA copy number changes were studied on six familial uveal melanoma and 15 sporadic primary uveal melanomas. Tumour DNA extracted from paraffin-embedded uveal melanoma labelled with Spectrum Green and normal DNA labelled with Alexa 594 were hybridised to normal metaphase chromosomes. Results and conclusion: The changes in both groups were similar. Comparison between both showed that the most common DNA copy number alterations were monosomy 3 (83.3% and 80%), gain of 8q (66.7% and 73.3%), loss of 8p (50% and 40%), 1p (66.7% and 40%), and 16q (66.7% and 33.3%). In conclusion, familial and sporadic uveal melanomas display similar aberrations, indicating tumorigenesis involves a common genetic pathway. Submitted for publication

Chromosome imbalances in familial uveal melanoma detected by comparative genomic hybridisation
�3
Introduction
Uveal Melanoma (UM) is the most common primary intraocular malignancy in adults in the western world, accounting for 70% of all malignant ocular tumours. Environmental and genetic factors involved in the pathogenesis are rather unknown. It is a rare disease with an annual incidence of 6-7 per million. The occurrence of familial melanoma (FUM) is even more rare, only 0.6% of all UM cases (Singh, et al. 1996a). A total of 73 families have been described in literature and an autosomal dominant inheritance with incomplete penetrance was suggested (Lynch, et al. 1968; Singh, et al. 1996b). Nevertheless, genetic predisposing factors have not yet been clarified. In a small proportion of all UM patients germline BRCA2 mutations are present, but not all familial cases can be explained by these mutations (Hearle, et al. 2003). Uveal melanomas occur in several familial cancer syndromes: familial atypical mole and malignant melanoma (FAMM) syndrome, xeroderma pigmentosum (XP), Li-Fraumeni syndrome and familial breast and ovarian cancer. CDKN2A, which gives a predisposition in the FAMM syndrome, is rarely involved in familial UM (Singh, et al. 1996b; Soufir, et al. 2000). Chromosomal changes occur in sporadic UM, with monosomy 3, loss of 1p and 6q, and gains of 6p and 8q being the most common changes. In familial UM chromosomal changes have not been identified. By using comparative genomic hybridisation, a molecular cytogenetic technique that allows the comprehensive analysis of genomes, gains and losses of chromosomal material can be detected. An additional advantage of this technique is that it is applicable to paraffin embedded archived tumour specimens. To elucidate the genetic similarity between familial UM and sporadically occurring primary UM, tumour material of individuals with a family history of UM and sporadic occurring UM were screened for chromosomal abnormalities.
Material and Methods
Patient and tumour samplesTumour material was collected from six patients with a positive family history of UM. Informed consent was obtained prior to enucleation and the study was performed according to the tenets of the Declaration of Helsinki. Samples FU 4 and FU 5 were obtained from patients who were related. The other samples (n=4) were single cases with a one other relative with an uveal melanoma. FU3 and FU6 had a first-degree relative, whereas FU1 and FU2 could be coupled through family studies to another relative with an uveal melanoma. A family history of any cancer

�4
Chapter 6
was obtained from all patients. Fifteen UMs from patients without a positive family history were randomly selected as a control group. The clinical diagnosis was confirmed by histology.
Comparative Genomic Hybridisation (CGH)DNA from formalin-fixed paraffin-embedded tumour material was isolated from 40 10μm sections. The tumour was scraped off from the glass slides using a fine scalpel. Excised material was deparaffinised in xylene and ethanol and air-dried. Isolation of DNA was performed using the DNA tissue kit (Qiagen, Hilden, Germany). Concentration was determined using a fluorometer (Biorad, Veenendaal, The Netherlands), whereas molecular weight was estimated on ethidium-bromide stained agarose gels. Tumour DNA and reference DNA was labelled using the Bio-prime DNA labelling kit (Invitrogen, Breda, The Netherlands) with Spectrum Green (Vysis, Hoofddorp, The Netherlands) or Alexa 594 (Molecular Probes, Leiden, The Netherlands) respectively. The probe mixture of tumour and reference DNA was denatured and hybridised to normal male metaphase chromosomes for three days at 37˚C. Samples were counterstained with DAPI in anti-fade solution. Images were acquired with a Zeiss axioplan microscope equipped with Isis software from Metasystems (Metasystems, Altlussheim, Germany). For each case at least ten metaphases were analysed. Loss of DNA sequences was defined as chromosomal regions where the mean green: red ratio was below 0.8, while gain was defined as chromosomal regions where the ratio was above 1.2. Threshold levels were determined on basis of analysis of known chromosomal aberrations.
Results
In all cases CGH was performed and results were obtained (Figure 1). All tumours showed changes in DNA copy number, with a mean of 7 aberrations per tumour in the familial melanoma (range 3-11) and 4.5 aberrations per tumour in the sporadic melanoma (range 2-7) (Table 1). Due to the limited number of tumours statistical analysis could not be performed. The most common changes in both groups were monosomy 3, 83.3% of the familial melanoma and 80% of the sporadic melanoma, and gain of 8q in 66.7% and 73.3%, respectively. Other losses concerned 8p (50% and 40%), 1p (66.7% and 40%), 6q (66.7% and 26.7%), and 16q (66.7% and 33.3%) and, whereas gain of 6p was not seen in familial UM, but solely in sporadic melanoma (20%).

Chromosome imbalances in familial uveal melanoma detected by comparative genomic hybridisation
�5
Samples FU 4 and FU 5 displayed similar aberrations. In both tumours, loss of chromosome 3, 6q and 16q and gain of 8q was present, whereas loss of 8p and gain of chromosome 21 occurred only in sample FU 5. In addition, in sample FU 4 loss of chromosome 1p and gain of chromosome 16p, 19 and 21 was observed.
Figure 1A. Example of a CGH hybridisation of FU 5.
Figure 1B.Summary of the most frequent DNA copy number changes detected by CGH in six familial uveal melanoma, upper panel, and 15 sporadic uveal melanomas, lower panel. Vertical lines on the right side of the chromosome represent gains and vertical lines on the left side of the chromosome indicate losses. Bold lines indicate high-level amplifications.

�6
Chapter 6
Table 1. CliniCal CharaCteristiCs and dna Copy number Changes in 21 uveal melanoma
No. Age/sex Cell type Localisation Gains LossesFollow-
up (months)
Death(melanoma
related)
FU 1 74/F mixed choroid 1p32.3-36.3, 1q32.1-32.3, 6q, 10p, 16, 21
85 no
FU 2 62/M mixed choroid 8q 3, 8p 16 yes
FU 3 69/F spindle choroid 8q, 19, 20, 22 1, 3, 8p, 16 40 yes
FU 4 51/F epithelioid choroid 8q, 16p, 19, 22 1p21-31.1, 3, 6q, 16q 56 no
FU 5 65/M epithelioid choroid 8q, 21 3, 6q, 8p, 16q 31 yes
FU 6 73/M mixed choroid 16, 17, 19, 20, 22
1p21-31.3, 1q25-32.1, 3, 4q, 5, 6q
50 -
S 1 73/F mixed choroid 8q, 19p 3, 8p 37 no
S 2 72/F mixed choroid 21 3 28 no
S 3 62/M epithelioid choroid 8q, 19p 3, 6q, 8p, 16q 10 yes
S 4 61/M spindle choroid 6p22, 8q13 1p32, 6q, 19, 20, 21 64 yes
S 5 65/M spindle choroid 8, 16p, 19, 22 3, 10 46 no
S 6 52/F mixed choroid 1p, 3 36 yes
S 7 53/F spindle choroid 1q, 11q, 22 1p, 3, 11p 45 no
S 8 59/M spindle choroid 6p12, 8q, 22 8p 35 yes
S 9 42/M spindle choroid 6p12, 8q23, 11q13.1-13.5 11q23.1 41 no
S 10 70/F mixed choroid 1p21, 3, 6q13 16 yes
S 11 52/F spindle choroid 8 1p21, 3, 16q 30 no
S 12 64/F mixed choroid 8q, 21 3, 6q, 8p, 16q 19 yes
S 13 64/F spindle choroid 8q 1p21, 3, 16q, 19 49 yes
S 14 80/F unknown choroid 7q, 8q 3, 8p, 16q 17 yes
S 15 47/F epithelioid choroid 8q, 19 3, 8p 32 yes

Chromosome imbalances in familial uveal melanoma detected by comparative genomic hybridisation
��
Discussion
In this study we have investigated six patients that had a highly suspected UM predisposition. The events that are important in malignant transformation and melanoma progression remain unclear. We observed that several chromosomal imbalances were consistently present in familial UM. The most common losses, monosomy 3 and loss of 1p and 6q, and the most frequent gain, 8q, were seen in both familial and sporadic melanoma. In general, the samples of the familial UM showed relatively more aberrations than the sporadic tumour samples, though this could not be statistically supported. Compared to results described in the literature (Aalto, et al. 2001; Ghazvini, et al. 1996; Hughes, et al. 2005; Kilic, et al. 2005; Tschentscher, et al. 2000) the occurrence of monosomy 3 seems to be similar in the familial UM group as well as in the sporadic group (Table 2). Since the sporadic group in this study is small there might be a selection bias. In addition, with CGH analysis clonal imbalances are not identified and loss is more easily detected than gain (Lichter, et al. 2000). The results of the studies mentioned before are mainly based on analyses, among whilst is FISH analyses, where the largest clone is selected as a representative of the primary tumour (Aalto, et al. 2001; Kilic, et al. 2005). Previous studies have shown that loss of one copy of chromosome 3 occurs exclusively in UM, whereas loss of one part of chromosome 3, short arm, may occur in other tumour types. The short arm of chromosome 3 harbours candidate genes, such as VHL, MLH1, and XPC, whereas candidate genes on the long arm are not identified yet. Nevertheless, two regions, one on the short arm and one on the long arm, show LOH in some studies (Horsman and White 1993; Prescher, et al. 1994; Sisley, et al. 1998; Tschentscher, et al. 2001). These regions might be important in the initiation of loss of one copy of chromosome 3, which is thought to be an early event and may lead to increased genomic instability, resulting in isochromosome formation (Aalto, et al. 2001; Prescher, et al. 1994). Corresponding with CGH analyses of other studies we assessed isochromosome-like findings of chromosome 6p and 8q (Aalto, et al. 2001; Gordon, et al. 1994; Speicher, et al. 1994). Gain of chromosome 8q, which is considered to be a late event in sporadic UM (Horsman and White 1993; Prescher, et al. 1995; Sisley, et al. 1992), was present in the familial tumours, whereas gain of chromosome 6p was not observed at all. Deletion of chromosome 1p does not occur solely in UM, but is also present in other solid tumours. It has been associated with tumour progression and was detected in metastasising UM (Aalto, et al. 2001; Kilic, et al. 2005). Remarkably, we observed deletion of the short arm of chromosome 1 (Figure 1A) in the sporadic tumours and a loss of the complete chromosome 1 in the familial tumours, which is interesting for further analysis. In our series we could not make reliable assumptions on the

�8
Chapter 6
metastatic potential of the tumours, since we had a limited number of tumours. In this small series we found however an increased number of losses of chromosome 1p in FUM (66.6%) compared to our sporadic UM control group (40%). Also in other larger series with sporadic primary UM loss of chromosomal region 1p seemed to occur lest often (Hughes, et al. 2005; Kilic, et al. 2005; Tschentscher, et al. 2000) (Table 2). This might indicate that chromosome 1p may harbour genes specifically involved in familial UM. Even so chromosome region 1p is difficult to analyse with CGH due to the limited resolution of CGH (5-10 Mb) in combination with many repeats at the telomeric region (Yu, et al. 2003), and therefore additional FISH analyses for this region might be useful. Although the number of familial cases is low, again we found a higher incidence of loss of 6q compared to the sporadic UM control group and literature (p=.045) (Table 2.). As for the absence of a gain of chromosome 6p in familial UM this might be due to the small series of available patients and tumours and the relative low incidence of this change in primary UM.
Table 2. Results of cgh analysis (%)
variable fu um1 sporadic um1 Kilic et al. 20051 Aalto et al.* 20011 Ghazvini et
al. 19961Hughes et al.
20053Tschentscher et
al. 20002
PMNM PMM MM
Monosomy 3 83.3 80 50 21 73 67 85 56 45
Gain chromosome 8q 66.7 73.3 63 14 53 100 57 78 65
Loss chromosome 8p 50 40 21** 14 27 0 28 39 15
Loss of chromosome 1p 66.7 40 35 0 33 33 14 33 nd
Loss chromosome 6q 66.7 26.7 31 7 40 83 28 39 40
Loss chromosome 16q 66.7 33.3 nd 7 0 nd 0 nd
Gain chromosome 6p 0 20 27 29 20 17 42 67 55
* PM NM : non-metastasizing primary melanoma, PMM: metastasizing primary melanoma, MM: metastases** personal communication1Paraffin embedded tumour specimens2Fresh frozen tumour specimens3Not specified

Chromosome imbalances in familial uveal melanoma detected by comparative genomic hybridisation
�9
In our present series we perceived aberrations of chromosome 16, especially loss of 16q, next to the non-random aberrations. Two samples, FU 4 and FU 5, of patients who were related to each other displayed similar aberrations. In both samples we observed beside the non-random aberrations a loss of chromosome 16q. Additionally, in sample FU 5 a gain of 16p was observed. Moreover, also sporadic melanoma, displayed loss of 16q, which may indicate that it could play a larger role in UM progression than was assumed up to now. Even though our sample size was too small to correlate prognostic data with specific copy number alterations further study needs to clarify the significance of this loss in UM development and progression.
In conclusion, familial UM and sporadic UM seem to display similar aberrations, indicating a common genetic pathway in tumor initiation. Although there is not statistical evidence, chromosomal aberrations seem to occur more often in familial cases and specifically loss of 1p and 6q are seen more frequently. Performing larger studies on familial UM may give more insight into UM development.


Part 3. Candidate genes and regions associated with uveal melanoma progression
Chapter 7
Fine mapping of chromosome 3 structural deletions in uveal melanoma cell lines

82
Chapter 7
AbstractPurpose: Loss of chromosome 3 is frequently observed in uveal melanoma and is associated with poor prognosis. In about half of the uveal melanomas one copy of chromosome 3 is lost. Using comparative genomic hybridisation (CGH) we have detected a chromosome 3q13-3q21 deletion in a uveal melanoma cell line, Mel270, which is derived from a primary tumour. The aim of the present study is to demarcate this region, which could presumably harbour a tumour suppressor gene (TSG). Methods: Genomic DNA was extracted from nine uveal melanoma cell lines, established from primary and metastatic tumours, amongst which Mel270. Subsequently, loss of heterozygosity (LOH) analysis was performed. In case of Mel270, LOH studies were complemented with fluorescent in situ hybridisation (FISH). Results: LOH and FISH studies revealed a chromosome 3q deletion ranging from 3q21.2-3q24 in two cell lines, Mel270 and OMM2.3, derived from the primary tumour and one of its metastases, respectively. In addition, a region of allelic loss, mapping to 3p24, was found in these cell lines. In contrast, FISH probes mapping to 3p24 revealed the presence of two copies. In OMM2.2, established from a different metastasis that originated from the same primary tumour from which OMM2.3 was also derived, LOH was detected at most of the loci that were analysed. This finding is consistent with isodisomy of chromosome 3 in OMM2.2. Conclusions: We have fine-mapped structural deletions located at chromosome 3q and a hemizygous region at chromosome 3p in uveal melanoma cell lines. These results contribute to a further demarcation of a candidate region for tumour suppressor genes. Submitted for publication

Fine mapping of chromosome 3 structural deletions in uveal melanoma cell lines
83
Introduction
Uveal melanoma, the most common malignant intra-ocular tumour in adults, affects 6 per 1,000,000 adults of the Western population yearly (Egan, et al. 1988). Uveal melanomas originate from neural crest derived melanocytes of the uvea and can be located posterior in the choroid and anterior in the ciliary body or in the iris. In the past the only treatment available was enucleation of the eye, while nowadays eye-conservative treatments like brachytherapy and external beam irradiation have become the first choice of treatment. Only 2% of the cases have clinically detectable metastasis at presentation and despite improved primary tumour treatment protocols, 50% of the patients die from distant metastasis that most often disseminate to the liver (90% of all cases with metastasis) (Diener-West, et al. 1992).
Cytogenetic and molecular genetic studies revealed that the larger part of the uveal melanomas from sporadic cases have a nearly diploid character with simple non-random chromosomal aberrations. Loss of chromosomes 1 and 3, structural abnormalities of chromosome 6, and gain of chromosome 8q are most frequently observed (Aalto, et al. 2001; Horsman and White 1993; Parrella, et al. 1999; Prescher, et al. 1996; Sisley, et al. 1997; White, et al. 1998a). Chromosome 3 loss is a prognostic marker for decreased survival of the patient (Prescher, et al. 1996; Sisley, et al. 2000; Sisley, et al. 1997; White, et al. 1998a) and several studies indicated gain of chromosome 8 as an independent prognostic marker of poor survival (Sisley, et al. 1997; White, et al. 1998a). Furthermore, loss of chromosome 1p was observed in primary tumours that had metastasised and in metastases (Aalto, et al. 2001; Kilic, et al. 2005).
Involvement of chromosome 3 is considered a primary event (Horsman and White 1993; Prescher, et al. 1994). In uveal melanomas that are characterised by different sub-populations, loss of chromosome 3 is a constant event, whereas a variable number of copies of the long arm of chromosome 8 can be observed. In many uveal melanomas an entire chromosome 3 is lost (Aalto, et al. 2001; Scholes, et al. 2001; White, et al. 1998b) and in some cases with two apparently normal chromosomes 3, acquired isodisomy has been observed (White, et al. 1998b). It is generally believed that loss of a tumour suppressor gene (TSG) located at chromosome 3 plays a role in uveal melanoma development. Only a few melanomas with structural abnormalities of chromosome 3 or translocations involving chromosome 3 have been reported up to now, which complicates mapping of putative TSGs. However, a study by Tschentscher et al. (Tschentscher, et al. 2001), who investigated uveal melanomas with structural abnormalities of chromosome 3, revealed two regions of allelic loss on chromosome 3, i.e. 3p25 and 3q24-3q26. Moreover, they concluded that tumours that metastasised

84
Chapter 7
showed loss of both regions. Parrella et al. (2003) defined a minimal region of allelic loss, ranging from 3p25.1-3p25.2 in a set of uveal melanomas (Parrella, et al. 2003).
The present study aimed at further delineation of a chromosome 3q deletion, previously detected with conventional comparative genomic hybridisation (CGH) in Mel270, a uveal melanoma cell line established from a primary tumour that metastasised (Naus, et al. 2001). LOH analysis and FISH analysis were performed on a series of primary and metastasis-derived uveal melanoma cell lines, including Mel270 and its liver metastasised cell lines, allowing identification of chromosomal aberrations on a single cell level. In addition, we have analysed the p-arm of chromosome 3 for the presence of allelic loss. Our results are discussed in the context of other published structural chromosome 3 deletions found in uveal melanomas.
Material and methods
Cell linesFor the present study nine different uveal melanoma cell lines were used. Four cell lines, OCM1 (Kan-Mitchell, et al. 1989), Mel202, Mel270 (Verbik, et al. 1997) and EOM3 (Luyten, et al. 1996), were established from primary uveal melanomas. OMM2.2, OMM2.3 and OMM2.6 are metastatic cell lines that originated from three different liver metastases of the same patient from whose primary tumour Mel270 was established (Luyten, et al. 1996). The other metastatic cell lines OMM1 and OMM3 were derived from metastases of two different patients(Luyten, et al. 1996). All cell lines were grown in HEPES and glutamate containing RPMI 1640 culture medium, supplemented with 10% fetal calf serum, 1% penicillin and 1% streptomycin. Cells were passaged, depending on growth rate.
Comparative Genomic Hybridisation (CGH)Comparative genomic hybridisation on metaphases was performed according to Naus et al. (Naus, et al. 2001).
Loss of Heterozygosity (LOH)Polymorphic microsatellites for LOH studies were selected using the UCSC Genome Bioinformatics website (http://www.genome.cse.ucsc.edu) and synthesised by Life Technologies (Breda, The Netherlands). An overview of the markers that we used is given in Table 1 (chromosome 3q) and Table 2 (chromosome 3p). Primer sequences

Fine mapping of chromosome 3 structural deletions in uveal melanoma cell lines
85
and locations are available upon request. Genomic DNA was isolated from the cell lines using standard techniques. Amplification reactions were performed in a 50 μl mixture, containing 50 pmoles of each oligonucleotide, 10 mM of each dNTP, 0.25 units Supertaq polymerase (HT Biotechnology Ltd., Cambridge, England), Supertaq buffer and about 100 ng genomic DNA. Reactions were denatured at 95ºC and subjected to 30 cycles of denaturation at 95ºC for 1 minute, annealing for 1.5 minutes at 55ºC (except for markers D3S1580 and D3S3703: annealing temperatures 57ºC and 58ºC, respectively) and elongation at 72ºC for 2 minutes, followed by 10 minutes final extension at 72ºC. Obtained polymerase chain reaction (PCR) products were purified using Qiaquick PCR purification system (Qiagen, Westburg, Leusden, The Netherlands). Subsequently, 1 μl purified PCR product was radioactively end-labelled, using 5 U polynucleotide kinase (Roche Molecular Biochemicals, Almere, The Netherlands) and 2 μCi [γ-32P] ATP (Amersham Pharmacia Biotech UK Ltd., Little Chalfont, United Kingdom). Denaturing stop mix (95% deionised formamide, 20 mM EDTA, 0.02% xylene cyanol FF, 0.02% bromophenol blue) was added in an equal volume. After heating for 5 minutes, the samples were quickly chilled and 3 μl samples were loaded on a 6% denaturing polyacrylamide gel, which was run at 60 W. After electrophoresis the gel was dried on Whattman paper and a Fuji super RX film was exposed. Autoradiograms were visually analysed. Since cell lines were used, marker patterns specific for the uveal melanoma cell lines could not be compared with that of a corresponding control. Therefore, results obtained for Mel270 were compared to those achieved for the corresponding metastases. Furthermore, DNA samples extracted from other uveal melanoma cell lines and human placenta DNA from a healthy individual were taken along.
Fluorescent in Situ Hybridisation (FISH)Dual colour interphase FISH was performed on cultured Mel270 cells as described previously by Naus et al. (Naus, et al. 2002). The probes that we used are locus-specific bacterial artificial chromosome (BAC) clones, selected from the Roswell Park Cancer Institute database (http://genomics.roswellpark.org/human/overview.html) and obtained from CHORI-BACPAC Resources (Oakland, CA, United States). An overview of the BAC probes that we used is given in Tables 1 and 2. Some of them correspond to the markers that we selected for LOH analysis. Five ng of centromeric probe Pα3.5 was used per slide, 100 ng of telomeric probe B47A2 (kind gift of L. Kearney and J. Flint) (Ning Y 1996) and 75 ng probe in case of BAC clones. Probes were tested first on normal peripheral blood cell metaphase spreads and 10 metaphases were analysed for each probe. For deletion mapping, signals in 300 interphase nuclei were counted according to the criteria of Hopman et al. (Hopman, et al. 1988).

86
Chapter 7
The cut-off values used for monosomy (only one signal in more than 15% of the nuclei) or polysomy (more than 10% of the nuclei with 3 or more signals) were adapted from available literature (van Dekken, et al. 1990). In case subclones were identified, only findings concerning the largest clone were used for analysis.
Table 1. Results of chromosome 3q analysis of Mel270, using fish and loh
BAC Position* Copy number Marker Position* Number
of alleles
217P4 3q21.1 2 D3S1267 3q21.1 295H16 3q21.2 2 D3S1269 3q21.2 2205A6 3q21.2 1 D3S1589 3q21.2 159J16 3q21.3 ? D3S3606 3q21.3 1- D3S1587 3q21.3 1- D3S1292 3q22.1 1- D3S1273 3q22.1 1220J13 3q22.2 ? D3S1615 3q22.2 1219P10 3q22.3 1 D3S3528 3q22.3 1162J10 3q22.3 1 D3S1576 3q22.3 1166D18 3q23 1 D3S3554 3q23 1- D3S1309 3q23 (2)- D3S3694 3q23 1- D3S3546 3q23 1160A13 3q23 1165M11 3q24 ? D3S1569 3q24 272E23 3q24 1 D3S1557 3q24 1- D3S1593 3q24 188H10 3q24 1 D3S1608 3q24 (2)- D3S3627 3q24 1- D3S196 3q24 (2)- D3S2440 3q24 1- D3S3618 3q24 (2)- D3S1306 3q24 1- D3S3626 3q24 2229G6 3q24 2 -145F16 3q25.1 ? D3S1299 3q25.1 164F6 3q25.1 2 D3S1279 3q25.1 265L11 3q25.1 2 -80I14 3q25.2 2 D3S1280 3q25.2 2- D3S3702 3q26.1 2- D3S2421 3q26.31 1- D3S1580 3q28 (2)- D3S1294 3q28 2147L6 3q28 2 -- D3S1601 3q28 2- D3S1272 3q29 1
Corresponding FISH clones and markers are presented at the same line. ?: presence of a subclone, (2): presence of a weak second allele.* position according to the Humane Genome Browser (May 2004)(http://genome.cse.ucsc.edu/).

Fine mapping of chromosome 3 structural deletions in uveal melanoma cell lines
8�
Table 2. Results of chromosome 3p analysis of Mel270, using fish and loh
BAC Position* Copy number Marker Position* Number
of alleles
D3S3050 3p26.2 228P14 3p26.1 2 D3S1304 3p26.1 (2)- D3S3728 3p26.1 2- D3S3591 3p26.1 1- D3S1537 3p25.3 2- D3S4545 3p25.3 2
-128A5 3p25.3 2 D3S3691 3p25.3 2- D3S1597 3p25.3 2- D3S3693 3p25.2 1- D3S3608 3p25.1 2255O19 3p25.1 2 D3S1286 3p25.1 2- D3S1293 3p24.3 1208G16 3p24.3 2 -41F5 3p24.3-24.2 2 -- D3S1266 3p24.1 111L6 3p24.1 2 -
D3S3727 3p24.1 1D3S1211 3p24.1 1D3S2432 3p24.1 2D3S3518 3p23 2D3S1619 3p23 2
209O16 3p22.2 2 -
189H19 3p21.32-3p21.31 2 -
D3S2406 3p13 2
Corresponding FISH clones and markers are presented at the same line. (2): presence of a weak second allele.* Position according to the Humane Genome Browser (May 2004)(http://genome.cse.ucsc.edu/).

88
Chapter 7
Results
Loss of Heterozygosity (LOH)We have previously shown a deletion of chromosome 3q13-3q21 in Mel270, using conventional CGH (Figure 1) (Naus, et al. 2001). For a further demarcation of this region of loss, LOH studies were performed. For the LOH analyses microsatellite markers were selected in and around the deletion region 3q13-3q21 in Mel270. Using this set of markers, loss of heterozygosity was identified for Mel270 but only with markers, mapping to chromosome 3q22.1. Therefore, we extended our marker set with markers mapping between chromosome band 3q22 and the 3q telomere. Cell lines from corresponding metastases, i.e. OMM2.2, OMM2.3, and OMM2.6 and several other uveal melanoma cell lines were analysed along with Mel270. Mel270 and OMM2.3 showed LOH with consecutive markers, mapping to loci at 3q21.2-3q23 (Figure 2 and 3). In OMM2.6 our results were indicative of loss at loci from 3q13.31 to the 3q telomere, whereas OMM2.2 and Mel202 showed loss at most loci tested along the q-arm (Figure 2). In uveal melanomas that metastasised, another region of LOH, mapping to chromosome 3p25, has been observed (Parrella, et al. 2003; Tschentscher, et al. 2001). To establish whether chromosome 3p deletions could also be detected in Mel270 and related cell lines OMM2.2, OMM2.3 and OMM2.6, nineteen different markers, mapping between chromosome band 3p26.2 and 3p13, were analysed (Figure 2). In Mel270, OMM2.3 and OMM2.6 loss of heterozygosity was detected with successive markers D3S1293, D3S1266, D3S3727 and D3S1211, representing loci at 3p24.1-3p24.3 (Figure 2). Results obtained for OMM2.2 and Mel202 were again indicative of isodisomy. In the other cell lines no obvious regions of LOH were detected.

Fine mapping of chromosome 3 structural deletions in uveal melanoma cell lines
89
Figure 1. CGH analysis of Mel270 The green and red line represent, res-pectively, the upper and lower thresholds of the normal range. The red line on the left of the ideogram represents the copy number decrease. Average expression profile of 9 metaphases.

90
Chapter 7
D3S3050 3p26.2 ndD3S1304 3p26.1D3S3728 3p26.1D3S3591 3p26.1D3S1537 3p25.3D3S4545 3p25.3D3S3691 3p25.3D3S1597 3p25.3D3S3693 3p25.2 ni ni ni ni ni niD3S3608 3p25.1D3S1286 3p25.1 ndD3S1293 3p24.3D3S1266 3p24.1 ndD3S3727 3p24.1 niD3S1211 3p24.1 ndD3S2432 3p24.1D3S3518 3p23D3S1619 3p23 nd ndD3S2406 3p13 n.d.
D3S3045 3q13.12 n.d.D3S3675 3q13.2 nd nd nd ndD3S1558 3q13.31 nd nd nd ndD3S3649 3q13.32 nd nd nd nd ndD3S1303 3q13.32 nd nd nd nd ndD3S3703 3q13.32 nd nd nd nd ndD3S3515 3q13.32D3S3620 3q13.33 nd nd nd nd ndD3S3576 3q21.1 ndD3S1267 3q21.1 n.d.D3S1269 3q21.2 niD3S1589 3q21.2 ni ni ni ni ni ni niD3S3606 3q21.3 ni ni ni ni nd nd nd nd nd ndD3S1587 3q21.3D3S1292 3q22.1 n.d.D3S1273 3q22.1D3S1615 3q22.2D3S3528 3q22.3 ni ni ni ni ni nd nd niD3S1576 3q22.3D3S3554 3q23 n.d.D3S1309 3q23D3S3694 3q23 ndD3S3546 3q23D3S1569 3q24 ndD3S1557 3q24D3S1593 3q24 n.d.D3S1608 3q24D3S3627 3q24D3S196 3q24D3S2440 3q24 n.d.D3S3618 3q24D3S1306 3q24D3S3626 3q24 n.d. n.d.D3S1299 3q25.1D3S1279 3q25.1 ndD3S1280 3q25.2D3S3702 3q26.1D3S2421 3q26.31 nd ndD3S1580 3q28D3S1294 3q28D3S1601 3q28D3S1272 3q29 nd
Figure 2. Results of microsatellite analy-ses of chromosome 3p and 3q in 9 UM cell linesLight gray box: no copy number change was observed; black box: loss of hetero-zygosity; gray box: presence of a weak second allele; n.d.: not determined.

Fine mapping of chromosome 3 structural deletions in uveal melanoma cell lines
91
Fluorescent In Situ Hybridisation (FISH)Complementary to the LOH studies, interphase FISH was performed on Mel270 cells, using eighteen BAC clones mapping to 3q21.1-3q28. Fourteen of these clones corresponded to the markers used (see Table 1). Results obtained from LOH analysis and FISH studies were not completely in accordance with each other. While FISH clone RP11-88H10 showed loss of one copy, the corresponding microsatellite marker D3S1608 showed the presence of a weak second allele (Table I and Figure 4A). With FISH clone RP11-165M11 unclear results were obtained and the corresponding marker D3S1569 showed presence of 2 alleles. Markers D3S1309, D3S196 and D3S3618 also revealed a weak second allele while flanking FISH probes and markers were indicative of loss. Marker D3S3626 showed no allelic loss and could demarcate the telomeric border of the deletion. Results obtained with markers D3S1299, D3S2421 and D3S1272, located at the telomeric site of the deletion border, showed the presence of one allele and marker D3S1580 the presence of a weak second allele.The p-arm of chromosome 3 was studied with a panel of eight FISH clones, mapping from 3p21.32-3p26.1. Although microsatellite analysis was indicative of allelic loss at four consecutive loci ranging from 3p24.1-3p24.3, interphase FISH revealed the presence of two copies of chromosome 3p at all the loci studied (Table 2 and Figure 4B). Signals obtained with probe RP11-11L6 were not specific enough, using interphase FISH. Therefore, metaphases were analysed; in 33 out of 36 metaphases two copies were detected.
c nalB
1M
CO
202leM
072 leM
6-2M
MO
1M
MO
3M
MO
3M
OE
2-2M
MO
3-2M
MO
lp namu
Hatneca
D3S3546
D3S1280 Figure 3. Microsatellite analysis of several cell lines with different primer setsRepresentative results ob-tained with chromosome 3q markers D3S3546 and D3S1280 are shown.

92
Chapter 7
Discussion
Cytogenetic studies revealed that Mel270 exhibits the most important chromosomal aberrations, i.e. loss of chromosome 3 and gain of chromosome 8, which are consistently observed in uveal melanoma (Naus, et al. 2001). Therefore, we believe that Mel270 can safely be used as a model system, guaranteeing an unlimited supply of material, which is very helpful in the search of putative TSGs. Loss of heterozygosity analysis on cell lines is complicated by the fact that corresponding
A
RP11-95H16
RP11-208G16 RP11-255O19 RP11-41F5
RP11-88H10 RP11-229G6
B
Figure 4. FISH analysis of Mel270
A: representative results of dual color FISH on Mel270 cells, hybridised with a combination of a chromosome
3q probe (red) and a centromere 3 probe (Pa3.5) (#3) (green), except for probe RP11-95H16 (green) that was
combined with a 3pter probe (B47A2) (red). Panel A: 3pter probe and RP11-95H16; #3 and RP11-88H10; and
#3 and RP11-229G6.
B: representative results of dual color FISH on Mel270 cells, hybridised with a combination of a chromosome
3p probe (red) and a centromere 3 probe (Pa3.5) (#3) (green). Panel B: #3 and RP11-208G16, #3 and RP11-
255O19, and #3 and RP11-41F5.

Fine mapping of chromosome 3 structural deletions in uveal melanoma cell lines
93
wild type cells are not available. In case only one allele is observed it is not possible to discriminate between loss of one allele and lack of heterozygosity of the used microsatellite. However, we were able to compare a cell line derived from a primary tumour (Mel270) and three metastatic cell lines (OMM2.2, OMM2.3 and OMM2.6) obtained from three different liver metastases from this same primary tumour. Furthermore, in case of Mel270, FISH was performed, complementary to LOH analysis.
Combining the data obtained with microsatellite analysis and FISH revealed allelic loss at chromosome 3q21.2-3q24 in Mel270 (Table 1). Cell line OMM2.3 showed LOH at the same loci. Results obtained with microsatellite analysis and FISH were not always in concordance. Markers D3S1569 and D3S3626 showed presence of two alleles, while FISH revealed only one copy of chromosome 3 in the same region. Marker D3S3626 could, however, be located at the breakpoint. Markers D3S1309, D3S1608, D3S196 and D3S3618 showed the presence of a weak second allele, which could be explained by the presence of a subclone. However, FISH data obtained with probe RP11-88H10, corresponding to D3S1608 clearly showed loss of one allele, while results, obtained with RP11-165M11, corresponding to D3S1569, pointed to the presence of a subclone. Also at the telomeric site of the deletion border some inconsistencies were observed. Markers D3S1299, D3S2421 and D3S1272 showed the presence of one allele and marker D3S1580 showed only a weak second allele. Inconsistencies like this can also be explained by lack of heterozygosity for these markers. Furthermore, it is also known from literature that LOH analysis is not always a reliable technique (Tomlinson, et al. 2002). While CGH analysis previously revealed a deletion at 3q13-3q21 (Naus, et al. 2001), our fine-mapping studies pointed to a deletion ranging from 3q21.2-3q24. This discrepancy can be explained by the fact that the resolution of conventional CGH on metaphases is limited (Pinkel, et al. 1998). Along the p-arm allelic loss was detected in Mel270 and corresponding cell lines OMM2.3 and OMM2.6 with four consecutive markers, mapping to 3p24.1-3p24.3. Since FISH analysis revealed two copies in this region, this could point to a hemizygous region. However, false positive results, due to lack of heterozygosity, cannot be excluded.While CGH analysis and karyotyping (results not shown) were not indicative of any chromosome 3 loss in OMM2.2 and OMM2.6, our LOH analysis pointed to isodisomy of chromosome 3 in OMM2.2, whereas allelic loss of a large part of the long arm of chromosome 3 was observed in OMM2.6.
The other uveal melanoma cell lines, taken along in the present study, were cytogenetically characterised in previous studies (Luyten, et al. 1996; Naus, et al.

94
Chapter 7
2001). OCM1, established from a primary tumour, is a tetraploid cell line with many structural chromosomal aberrations, including net loss of chromosome 3q. Our analysis indicated LOH for the 3q21 and 3q22 region but whether this was real LOH or just lack of heterozygosity for these markers could not be established. Despite the observed net loss of 3q, cytogenetically two alleles were retained from 3q23 till 3qter. OMM1, derived from a metastasis, is nearly triploid with net gain of chromosome 3. Our microsatellite analysis visualized the presence of at least two different copies of chromosome 3 in both cell lines. EOM3, derived from a primary tumour, is a pseudodiploid cell line with numerical changes i.e. loss of the Y chromosome, trisomy 5, monosomy 6, and trisomy 18 (Luyten, et al. 1996). Both OMM1 and EOM3 demonstrated a possible LOH of the 3p24.1-3p25.2 region. Metastatic cell line OMM3 shows a normal karyotype (Luyten, et al. 1996) and our LOH studies confirmed the presence of two different copies of chromosome 3. In case of Mel202, established from a primary UM (Verbik, et al. 1997), loss of chromosome 3 was not detected with either karyotyping, Spectral Karyotyping or CGH analysis (Naus, et al. 2001). Our LOH studies, however, revealed the presence of only one allele at different loci along chromosome 3, which is indicative of isodisomy.
Although in a large part of the uveal melanomas monosomy of chromosome 3 is found (Scholes, et al. 2001), several studies revealed structural abnormalities of chromosome 3p and or 3q in uveal melanomas. A partial duplication, involving the long arm of chromosome 3 with a breakpoint at 3q25 has been described by Prescher et al. (1995) (Prescher, et al. 1995). Scholes et al. (2001) (Scholes, et al. 2001), who performed LOH studies, reported a 3q deletion, ranging from a region between marker D3S1589 (3q21.2) and D3S1605 (3q25.32) to the telomere. A LOH study by Tschentscher et al. (2001) (Tschentscher, et al. 2001), performed on uveal melanoma with structural abnormalities, allowed definition of a smallest region of overlap (SRO) at chromosome 3q24-3q26. At the telomeric site the SRO is flanked by marker D3S1763, mapping to 3q26.1, and marker D3S2425 located at 3q26.31, showing loss and retention, respectively. At the centromeric site the SRO is flanked by marker D3S196 (3q24) showing LOH and marker Mdf2 at the RHO locus (3q21.3) showing retention of both alleles. In the present study, a deletion, starting between marker D3S1269 at 3q21.2 and FISH probe RP11-205A6 at 3q21.2 at the centromeric site, and ending between FISH probe RP11-88H10 (3q24) and FISH probe RP11-229G6 (3q24) at the telomeric site, was found. Combining present data with data from Tschentscher et al. (Tschentscher, et al. 2001) revealed a SRO, ranging from 3q21.3-3q24. Thus the SRO, previously defined by Tschentscher et al., who used a low-resolution marker set, could be reduced at the telomeric site. Furthermore, these data corroborate with a study by Dahlenfors et al. pointing to the 3q23 region as a possible TSG location,
Fine mapping of chromosome 3 structural deletions in uveal melanoma cell lines
95
based on a rearrangement found in one UM (Dahlenfors, et al. 1993). As far as we know, TSGs mapping to 3q21.3-3q24 have not been identified to date. In other tumour types loss of chromosome 3 has also been described. Loss of chromosome 3q seems to be an early event in pheochromocytomas as well (Dannenberg, et al. 2000).
Aberrations of the p-arm of chromosome 3 have also been described. In one uveal melanoma a translocation with a breakpoint at 3p13 was found (Blasi, et al. 1999).
Tschentscher et al. suggested that in metastasised uveal melanoma two regions on chromosome 3 (a region on the q-arm and a region on the p-arm) harbour TSGs (Tschentscher, et al. 2001). This could explain the frequently observed loss of an entire chromosome 3 in those tumours. Although our CGH and FISH analysis did not reveal a chromosome 3p deletion in Mel270, microsatellite analysis pointed to a region of allelic loss, ranging from 3p24.1-3p24.3. This possible hemizygous region is flanked by marker D3S1293 (3p24.3) showing LOH and marker D3S1286 (3p25.1) showing retention of two alleles at the telomeric site. The border of the centromeric site is defined by marker D3S1211 (3p24.1) and D3S2432 (3p24.1), showing allelic loss and retention of two alleles, respectively. This region does not overlap with the SRO’s defined by Tschentscher et al. (3p25.3-3p26.1) and Parrella et al. (3p25.1-3p25.2) (Parrella, et al. 2003; Tschentscher, et al. 2001). However, in an earlier study by Sisley et al. allelic loss of the Thyroid Hormone Receptor B (THRB) locus was observed in 60% of the uveal melanoma investigated (Sisley, et al. 1993). The human THRB locus, which maps to chromosome 3p24.2 (human genome draft, version May 2004), acts as a transcriptional activator and silencer. Aberrant expression and/or mutations in THR genes could be associated with carcinogenesis (Yang, et al. 2002). Another candidate TSG that is located in the hemizygous region is Retinoic Acid Receptor β2 (RARβ2) (3p24.2). Decreased levels of this receptor are associated with malignancies, like breast tumours, lung cancer and squamous cell cancer of head and neck (Yang, et al. 2002). Other possible TSGs on 3p like the Von Hippel Lindau (VHL) gene (3p25.3), Ras association domain family 1 (RASSF1) (3p21.31) and the Fragile Histidine Triad (FHIT) (3p14.2) map to regions outside the hemizygous region, detected in the present study (Yang, et al. 2002).
Although we have clearly reduced the SRO at chromosome 3q, the region is still large. It would be interesting to study metastasised uveal melanomas without apparent loss of 3q. For analysis, high-resolution techniques, like array-CGH should be used. Those kind of studies might finally pinpoint to candidate TSGs.

96
Chapter 7
Acknowledgements
We would like to thank Anette Verhoeven for excellent technical assistance.

Part 3. Candidate genes and regions associated with uveal melanoma progression
Chapter 8
Differential expression of TP63 and TP73 in uveal melanoma reveals an increased expression of p73∆ex2 transcript in tumours with
loss of chromosome 1p
98
Chapter 8
AbstractLoss of chromosome 1p and chromosome 3 are associated with metastatic disease and decreased survival of Uveal Melanoma (UM) patients. The p53 homologues, p73 and p63 are located on chromosomes 1p and 3q, respectively. Both are able to activate p53 target genes, resulting in growth arrest, apoptosis and differentiation. N-terminally truncated isoforms of these genes may act as dominant negative inhibitors of wild-type p53 and transactivating activity. Although, p53 is frequently involved in several malignancies it does not play a major role in UM. Altered expression has been reported for both p63 and p73 in various malignancies. In this study fluorescent in situ hybridisation was performed to identify gains or losses of p63 and p73 loci in UM. The expression of the different p63 and p73 isoforms was evaluated by RT-PCR followed by Southern blotting analysis. Furthermore, the expression pattern of the various ∆TAp73-transcripts was analysed in 7 primary UM and eleven UM-derived cell lines using isoform-specific real-time PCR. Our results indicated that the isoform p73∆ex2/3 was abundantly expressed and a relative loss of the p73 locus was associated with upregulation of p73∆ex2 and TAp73 transcripts. TA-forms of both p73 and p63 were observed in primary and metastasis derived cell lines, as well as in primary melanomas, but in only one of the cell lines a ∆Np63 mRNA transcript was observed. Our data suggest a potential function of p73 deletion transcripts in UM progression. Submitted for publication

p63 and p73 expression in UM
99
Introduction
Uveal Melanoma (UM) is the most common malignant intra-ocular tumour in the Western world. Over 80% of the tumours show non-random chromosomal aberrations, Loss of chromosome 3 is a typical change in UM and loss of chromosome 1p36 is commonly observed (Aalto, et al. 2001; Kilic, et al. 2005). Loss of chromosome 1p occurs frequently in solid tumours (Knuutila, et al. 1999), and in neuroblastoma loss of chromosome 1p is known to be a predictor of unfavourable outcome of the patient (Caron, et al. 1996; Casciano, et al. 2002). In UM loss of chromosome 1p was detected in metastasising UM (Aalto, et al. 2001), and concurrent loss of chromosome 1p and 3 was associated with decreased survival of UM patients (Kilic, et al. 2005). Interestingly, the candidate tumour suppressor genes p73 and p63, both encoding homologues of p53, are located on chromosome 1p36 and 3q27-28, respectively (Kaghad, et al. 1997; Yang, et al. 1998). Besides the structural resemblance to p53, p63 and p73 protein products are able to turn on a similar set of downstream genes, such as MDM2 and p21, and induce apoptosis (Kaghad, et al. 1997; Vossio, et al. 2002). Both, p63 as well as p73, can be transcribed as full length proteins with a N-terminal transactivation (TA) domain or as shorter truncated isoforms, lacking different parts or the complete N-terminal domain (Kaghad, et al. 1997; Yang, et al. 1998). Despite their functional similarity with p53, TA-transcripts of p63 and p73 compete with p53 and this leads to a lower transactivation of p53-target genes. The truncated transcripts, commonly denoted as ∆, even have a stronger inhibiting effect. In this manner, apoptosis is inhibited and consequently cell proliferation is induced.
P53 is frequently involved in human malignancies. Mutational inactivation of the p73 gene in human malignancies is rare (Stiewe and Putzer 2002), instead, increased expression of wild type p73 is correlated with tumour progression (Zaika, et al. 2002). This complicates the understanding of the role of p73 in tumour development. Next to the ∆N-p73 transcript, regulated by an independent promoter in intron 3, three different deletion variants (p73Δex2, p73∆ex2/3 and ∆N’-p73), regulated by the first promoter, are observed in tumour cells (Kaghad, et al. 1997; Stiewe, et al. 2002). The deletion-variants (∆) counteract p53 activity and suppress the transactivation activity of the full-length variant (TAp73) by oligomerisation and competition for DNA binding (Stiewe and Putzer 2000). Furthermore, the alternative intronic promoter has been shown to be p53/p73 responsive, resulting in an autoregulatory feedback loop (Grob, et al. 2001). Mutations of the p63 gene also appear to be rare in primary tumours and cell lines (Hagiwara, et al. 1999; Park, et al. 2000). Nevertheless, differential expression of various p63 isoforms may contribute to cancer development; high levels of ΔNp63 were found in e.g. squamous cell carcinomas (Hibi, et al. 2000) .

100
Chapter 8
Aberrations in UM, such as loss of chromosome 1p and chromosome 3, can result in loss of one copy of the p73 and p63 genes. This may affect the expression of full-length or N-terminal deletion variants. Considering the potential relevance of both proteins in tumorigenesis, we investigated the expression of the deletion-variants in relation to copy number variation of p63 and p73 in several primary UM tissue specimens, primary UM-derived cell lines and metastases-derived cell lines.
Material and methods
Patients and cell linesThirteen primary UM were randomly selected for this study (Table 1.). Informed consent was given prior to enucleation and the study was performed according to the tenets of the Declaration of Helsinki. In addition, eleven UM cell lines, isolated from primary and metastatic UMs were used. Mel 270, Mel 202, EOM 3, OCM-1 and 92.1 are cell lines established from primary tumours (De Waard-Siebinga, et al. 1995; Kan-Mitchell, et al. 1989; Luyten, et al. 1996; Verbik, et al. 1997). OMM1, OMM 2, OMM 3 were established from metastases from three different UM patients (Luyten, et al. 1996). OMM 2-2, OMM 2-3 and OMM 2-6 are metastatic cell lines derived from separate tumour nodules in the liver of the same patient from whom Mel 270 was obtained (Verbik, et al. 1997). As a positive control for TA- and ΔN-p63/p73 expression we used the breast cancer cell line MCF-7. Cell cultures derived form normal eye melanocytes, EMC1 and EMC4, were used as control for expression in normal melanocytic tissue.
Fluorescent in situ hybridisationDual colour FISH analysis using p73 (RPCI-11 62M23) or p63 (RPCI-11 53D15) BAC-clones (CHORI-BACPAC Resources, Oakland, CA, USA) was performed according to protocols as described previously (Naus, et al. 2000). Per slide 75 ng of probe was used and the correct location of the probes was verified on normal peripheral blood lymphocyte metaphases. Signals were counted in 300 interphase nuclei. Cut-off limits for deletion (15% of the nuclei with one signal) or amplification (>15% of the nuclei with 3 or more signals) were adapted from the available literature (van Dekken, et al. 1990). Relative loss and gain was specified. For those for which no cytogenetics was available, the relative loss or gain was estimated based on ploidy as determined by FISH.

p63 and p73 expression in UM
101
Expression analysis Total RNA was isolated with the RNeasy Mini Kit (Qiagen, Hilden, Germany) according to the manufacturer’s protocol. cDNA was synthesised from 1-3 mg of total RNA using 2 ml of a random primer (0.5 mg/ml) and 10 U super RT (HT Bio-technology LTD, Cambridge, England). cDNA synthesis was verified by performing a PCR reaction with primers for AF4 (Gu, et al. 1992). Primer TAp63s (5’-ATGTCCCAGAGCACACAG-3’) or ΔNp63s2 (5’-GCCCAGACTCCATTTAGT GAG-3’) with reverse primer TAp63αs (5’-AGCTCATGGTTGGGGCAC-3’) were used for detection of TAp63 or ΔNp63, respectively. Amplification products were separated on a 1% agarose gel and transferred to nylon membranes. The Southern blot was hybridised with α-32P labelled, sequence verified, RT-PCR product of p63.
Real-time quantitative PCR expression analysiscDNA was synthesized from 1mg of total RNA. Real-time quantitative PCR reaction was performed in a total reaction volume of 50 ml containing 2.5 mM of each dNTP, 1x Taqman-buffer (Applied Biosystems), 0.25 U Amplitaq-Gold DNA-polymerase, 15 pmol of each primer, 50 nM dual-labelled fluorogenic internal probe and 50 ng cDNA, and was carried out in a ABI prism 7700 sequence detection system (Applied biosystems). Sequences of the primers are as follows: TA-p73 sense, 5’-GACGGACGCCGATG-3’ and antisense, 5’CTGGTCCATGGTG CTG-3’; p73Δex2 sense, 5'-TGCAGGGAACCAGACA-3’’and antisense 5’-CTGGTC CATGGTGCTG-3’; p73Δex2/3 sense 5’-GCAGGCCCAGTTCAAT-3’ and antisense 5’-CGGGGTAGTCGGTGTT-3’; ΔN’-p73 and ΔN- p73 sense 5’-CACGGCCCAGTT CAA-3’ and antisense 5’- CGGGGTAGTCGGTGTT-3’. The housekeeping gene
Table 1. Clinical characteristics of patients from which primary UM were derived
Gender Age Localisation Involvement ciliary body Cell type Epithelioid
cells LTD Prominence Metastases
P.1 M 59 Choroid No Spindle Yes 8 9 YesP.2 M 60 Choroid No Spindle No 11 9 NoP.3 M 57 Choroid Yes mixed Yes 15 12 NoP.4 M 54 Choroid No Epithelioid Yes 9 8 NoP.5 M 39 Ciliary body Yes Mixed Yes 20 7 NoP.6 F 76 Choroid No Mixed Yes 8 1.5 NoP.7 F 72 Choroid No Mixed Yes 14 9 YesP.8 F 74 Choroid No Mixed Yes 18 5 NoP.9 M 54 Choroid No Mixed Yes 11 7 NoP.10 M 82 Choroid No Epithelioid Yes 16 14 NoP.11 F 76 Choroid No Epithelioid Yes 15 15 YesP.12 F 70 Choroid No Mixed Yes 14 11 YesP.13 M 80 Choroid No Mixed Yes 14 14 Yes

102
Chapter 8
glyceraldehyde-3-phosphate dehydrogenase (GAPDH) was quantified with the following primers: 5’-GTCGGAGTCAACGGATT-3’ and antisense 5’- AAGCTTCC CGTTCTCAG-3. A serial dilution of pooled human cDNAs was used to measure the amplification efficiency (96%) (Meijerink, et al. 2001; Stam, et al. 2003). Relative mRNA expression levels of each sample were normalized for input RNA using GAPDH expression of the sample. The relative mRNA expression level of each sample was calculated using comparative cycle time (Ct) method. The target PCR Ct values, i.e. the cycle number at which emitted fluorescence exceeds 10x the standard deviation of base-line emissions as measured from cycles 1 to 20, is normalised by subtracting the GAPDH Ct value from the target PCR Ct value, which gives the ΔCt value. From this ΔCt value the relative expression level to GAPD, annotated in arbitrary units, can be calculated by using the following equation: relative mRNA expression = 2-ΔCtx 1000.
Results
Detection of loss or gain of the p73 and p63 lociFISH analysis, using locus specific probes was performed to detect numerical abnormalities for the p73 and p63 loci (Table 2). Classification was specified as a relative gain or loss based on cytogenetic data. Six cell lines and three primary UM showed variation in number of signals for the BAC-clone RPCI-11 62M23 at the p73 locus. Loss of p73 was observed in two primary cell lines (Mel 202 and EOM 3), two metastatic cell lines (OMM 2-3 and OMM 1) and six primary melanomas (P.5, P.7, P.9, P.10, P12 and P.13), whereas gain was observed in one primary tumour cell line (OCM-1), one metastatic cell line (OMM 2-2) and one primary melanoma (P.4). The BAC-clone RPCI-11 53D15, p63, showed agreement between the number of signals and the reported cytogenetic findings in five cell lines. In six cell lines variation in the number of FISH signals was observed. Loss of the p63 locus on chromosome 3 was observed in two primary (Mel 202 and EOM 3) and one metastatic cell line (OMM 1), whereas gain of p63 was observed in one primary (OCM-1) and one metastatic cell line (OMM 2-2). In one metastatic cell line we observed subclones with loss and subclones with gain of p63 (OMM 2-3). In the primary tumours we observed both loss (P.2, P.7 - P.13) and gain (P.4) (see Figure 1).

p63 and p73 expression in UM
103
Table 2. Copy number of the TP73 and TP63 loci in primary UM and UM-cell lines
P73 P63ploidy o† e‡ o e
P.1 diploid 2 2 2 2
P.2 diploid 2 2 1,2 2
P.3 diploid 2 2 2 2
P.4 diploid 2,4 2 2,4 2
P.5 diploid 1,2 2 2 2
P.6 diploid 2 2 2 2
P.7 diploid 1,2 1 1 1
P.8 diploid 2 2 1,2 2
P.9 diploid 1,2 2 1 2
P.10 diploid 1 2 1 1
P.11 diploid 2 2 1 1
P.12 diploid 1 2 1 2
P.13 diploid 1 1 1 1
OCM-1 tetraploid 4,5 4,5§ 5,6 4
92.1 diploid/tetraploid 2,4 2,4 2,4 2,4
Mel 202 diploid 1,2 2 1,2 2
EOM 3 diploid 1,2 2 1,2 2
Mel 270 diploid 2 2 2 2
OMM 2-2 tetraploid 4,5 4 4,5 4,5
OMM 2-3 diploid/triploid 1,2 2,3 3-5 4
OMM 2-6 diploid 2 2 2 2
OMM 1 triploid 2 2 2,3 3
OMM 2 diploid 2 2 2 2
OMM 3 diploid 2 2 2 2
Only significantly different cell populations (loss or gain >15% of the cells) are indicated. †Observed copy number by FISH analysis.‡Expected copy number based on cytogenetic or FISH data.§Tetraploid / triploid clone is indicated in bold.Ploidy based on cytogenetic or FISH data.

104
Chapter 8
Analysis of TAp63 and ΔNp63 transcripts in UM cell lines and primary UMExpression of the p63 genes was examined by performing a RT-PCR using primers for the N-terminal domain of the truncated and non-truncated isoforms in eight primary tumours and eleven cell lines (Figure 2). TAp63 was expressed in two of five primary cell lines (Mel 270 and EOM 3), four of six metastatic cell lines (OMM 2-2, OMM 2-3, OMM 2-6 and OMM 1) and in six of eight primary melanomas (P.1-P.4, P.6 and P.8), as well as in one of the normal eye melanocyte cultures (EMC1), though very weak. The ΔNp63 transcript was expressed in only one of the metastatic melanoma cell lines (OMM 2-3), and neither in primary melanomas nor in normal melanocytes. Expression in the control cell line was clearly detectable.
Quantification of TA-p73 and ΔN-p73 transcripts in primary UM and UM cell lines compared to copy number alterationsTo quantify the expression of the various TP73-transcripts we performed RT-PCRs using primers that discriminate between the N-terminal domain of the full length and deletion transcripts. Results were obtained for the cell lines and 7 primary uveal melanomas (P.3, P.5, P.9 - P.13) In general, the most abundantly expressed transcript was p73Δex2/3. Primary UM and cell lines were grouped on the basis of relative copy number of p73 obtained by Fluorescent in situ Hybridisation. In the group with a relative loss p73Δex2 and TAp73 were upregulated. P73Δex2/3 and ΔN’-/ΔN-p73 transcripts were diminished independent of copy number of TP73 (Figure 3).
Figure 1.Interphase FISH with the BAC-clones RPCI-11 62M23 for p73 in green and RPCI-11 53D15, located on 3q24 in red: A. P.7, B. P.13 and C. OCM-1.

p63 and p73 expression in UM
105
TAp63M
CF-
7
OC
M-1
92.1
Mel
202
EOM
3
Mel
270
OM
M2-
2
OM
M2-
3
OM
M2-
6
OM
M 1
OM
M 2
OM
M 3
EM
C 1
EM
C 4
P.1
P.2
P.3
P.4
P.5
P.6
P.7
P.8
TAp73
AF 4
Np63
Np73
Figure 2. The expression of TAp63, mNp63 mRNA was analysed in UM cell lines using RT-PCR. Lane 1 is the positive control MCF-7. Lanes 2-6 are cell lines derived from primary uveal melanoma. Lanes 7-12 are cell lines derived from metastases. Lanes 13 and 14 are cultured normal eye melanocytes. Lanes 15-22 are primary uveal mela-noma. AF4 demonstrates a successful RT-reaction for all samples.
100 -
Exp
ress
ion
in a
rbitr
ary
units
10 -
1 -
0.1 -
0.01 -
0.001 -
0.0001 -Relative loss Relative normal Normal control
TAp73
p73 ex2
p73 ex2/3
N-/ N’-p73
Figure 3.Quantification of TP73 transcripts in primary UM and UM cell lines grouped according to copy number. Bars represent the arbitrary units, whiskers indicate the standard deviation: Relative loss of the p73 locus (n=9), Relative normal copy number (n=7), and normal copy number in eye melanocytes (n=2).

106
Chapter 8
Discussion
In UM the p53 pathway is not affected through alterations in p53 protein levels (Brantley and Harbour 2000). This indicates that different mechanism might be involved in functional inactivation of transcriptional target genes of p53, such as inactivation by interacting proteins encoded by p63 and p73. In this study we have investigated the expression of p63 and p73 and their deletion-variants in relation to copy number variation in uveal melanoma. Although no homozygous deletions were found in any of the cell lines and primary UM, some showed loss of one allele whereas others had extra copies of p63 or p73. Moreover, we observed an effect of copy number alteration on expression of TP73. Based on the knowledge that loss of chromosome 1p is associated with metastasis, we assumed that tumours with loss would progress and eventually metastasise (Aalto, et al. 2001). In this study we demonstrate that a relative loss of the p73 locus in UM is associated with an increased expression of p73Δex2. O’nions et al. showed that the TA-promoter derived p73Δex2 is the main expressed transcript in vulval cancers (O’Nions, et al. 2001). Considering the oncogenic potential of ΔTA-p73 (Stiewe, et al. 2002), a shift towards oncogenic ΔTA-form would be expected. Nevertheless, we observed that beside increased levels of p73Δex2 TAp73-expression is also increased in comparison to normal eye melanocytes. This may be the result of an increased TA-promoter activity, which induces both transcripts (Fillippovich, et al. 2001; Ng, et al. 2000). Looking at all samples together increased expression of transcripts regulated by the first TA-promoter is observed (TAp73 and p73Δex2). In our analysis we were not able to differentiate between ΔN-p73 and ΔN’-p73. The ΔN-p73 is expressed by an intronic promoter (Stiewe, et al. 2002), whereas ΔN’-p73 is transcribed by the TA-promoter, resulting in the other Δ-transcript variants (Fillippovich, et al. 2001; Ng, et al. 2000). We were not able to correlate both transcripts independently with loss of chromosome 1p, because on mRNA level ΔN-p73 and ΔN’-p73 are not discernable (Stiewe, et al. 2002). However, analysed as a group we observed a slightly decreased level. In addition, the number of samples in our study was too small to perform reliable statistical analysis.
Furthermore, we showed that differences in copy number did not have an obvious influence on the expression of TAp63 or ΔNp63. This was demonstrated in cell lines with a relative gain of p63 (OCM-1, OMM 2-2 and OMM 2-3) that showed different expression patterns. Likewise, in cell lines with loss of one copy (Mel 202 and EOM 3) or with apparently normal copy numbers (92.1, Mel 270, OMM 2-6, OMM 2-3 and OMM 3) expression could not be associated with copy number. Also primary UM with either loss or gain of the TP63 locus showed no changes in expression. This is in contrast to findings in primary lung cancer and squamous cell cancers where the

p63 and p73 expression in UM
10�
predominantly expressed form is the ΔN-variant (Hibi, et al. 2000). In only one cell line (OMM2-3) that showed an extra copy of the TP63 locus, ΔN-p63 expression was demonstrated. Still, since amplification of chromosome 3 is generally not observed in UM a role for ΔN-p63 seems to be unlikely. Nevertheless, more studies need to be done.
Our results indicate that oncogenic splice variants, such as p73Δex2, occur more often if there is a relative loss of the p73 locus. However, this hypothesis must be clarified within a larger series of uveal melanoma. Expression of Δ-variants of p73 may result in a dominant-negative feedback loop ending in diminished p53 and TAp73 activity (Vossio, et al. 2002). In uveal melanoma p53 target genes, such as p21, were upregulated whereas p53 expression was not affected (Mouriaux, et al. 2000). In our series 3 of the patients without loss had died due to metastases, whereas 3 of 6 patients with loss of a copy of TP73 died. Considering the metastatic potential of tumours with chromosome 1p loss these findings support the assumption that enhanced expression of dominant-negative splice variants is associated with cancer development (Stiewe and Putzer 2002; Zaika, et al. 2002). In this way, an oncogenic property is attributable to Δ-p73 and thus p73 is likely to play a role in tumorigenesis of UM.
Acknowledgements
This study was supported by the Revolving Fund of the University Hospital Rotterdam, The Dutch Foundation Fighting against Blindness, The Rotterdam Blindness Foundation, The Hague Ophthalmic Foundation, the Dutch Cancer Society (EUR 2002-2695) and Henkes Stichting, The Netherlands.


Part 3. Candidate genes and regions associated with uveal melanoma progression
Chapter 9
RAS-BRAF kinase pathway is not involved in uveal melanoma

110
Chapter 9
AbstractAn activating mutation has recently been observed in a downstream component of RAS, BRAF. The most common mutation in 80% of the cutaneous melanoma samples is a T-to-A transition, resulting in a single amino acid substitution, V599E. Since cutaneous and uveal melanoma (UM) have a common origin, we aimed to establish whether activation of the BRAF proto-oncogene is also an important factor in the development of UM. Exons 11 trough 18 of the BRAF gene were screened from 33 primary UM and eleven UM cell lines. Genomic polymerase chain reaction products were analysed using single-strand conformation polymorphism analysis, followed by sequencing aberrant products. The most common mutation, T1796A, in the kinase domain of BRAF was not observed in any of the primary UM samples. This mutation was also absent in ten of the eleven UM cell lines. In one of the UM cell lines, OCM1, this T1796A mutation was present. Mel. Res. 2004 Jun;14(3):203-5
RAS-BRAF kinase pathway is not involved in uveal melanoma
111
Introduction
The RAS-RAF kinase pathway plays a distinct role in melanogenesis. It mediates cellular responses to growth signals. In response to UVB-radiation cAMP is up regulated, leading to increased proliferation and melanogenesis. Two components of this pathway, RAS and RAF, are proto-oncogenes. RAS is a member of a family, which consists of three functional genes, H-RAS, K-RAS and N-RAS, encoding highly similar proteins with molecular weights of 21 kDa (Barbacid 1987). Activating mutations of RAS are found in 25% of all cancers (Bos 1989). Mutations of RAS, predominantly N-RAS mutations, have been identified in 9-15% of cutaneous melanomas (Carr and Mackie 1994; van Elsas, et al. 1995). However, uveal melanomas (UM) do not seem to harbour activating mutations of RAS (Mooy, et al. 1991). The RAS proteins differ in their ability to activate the downstream component of this pathway, RAF. The RAF family consists of three genes, ARAF, BRAF and CRAF, encoding for cytoplasmic serine/threonine kinases that are regulated by binding to RAS (Chong, et al. 2003; Peyssonnaux and Eychene 2001). Recently, Davies reported on mutations of BRAF in human cancer (Davies, et al. 2002). BRAF mutations were present in 60-66% of the malignant melanoma and at a lower frequency in a wide range of other human cancers (Brose, et al. 2002; Davies, et al. 2002). The most common mutation, T1796A, was located in the serine/threonine kinase domain of BRAF, resulting in a Valine to Glutamic Acid substitution at position 599. Thus, resulting in a constitutive active protein promoting proliferation (Zhang and Guan 2000). In cell lines harbouring the T1796A BRAF mutation, concurrent mutation of RAS was not required for oncogenic behaviour. Several less common mutations of BRAF that occurred together with RAS mutations were located in exon 11 (Brose, et al. 2002; Davies, et al. 2002). The discovery of BRAF mutations in cutaneous melanoma urged us to investigate the role of BRAF in UM, since both cutaneous and UM arise from neural crest derived melanocytes. We were particularly interested to see whether BRAF mutations were present within RAS mutation negative samples.
Material and methods
Genomic DNADNA was obtained from 33 fresh frozen primary UM tissue sections as described previously (Mooy, et al. 1991) and eleven UM cell lines, derived from primary and metastatic melanoma (Naus, et al. 2000). EOM 3, OCM1, 92.1, Mel 270 and Mel202 were all established from primary tumours. OMM1, OMM2 and OMM3 were derived from metastases of three different UM patients. OMM2.2, OMM2.3 and OMM2.6

112
Chapter 9
were derived from separate tumour nodules in the liver of the same patient from whom also Mel270 was obtained. Two malignant melanoma cell lines, SKMel28 and Bowes, and two colon carcinoma cell lines, HT29 and LS194, were used as controls (Davies, et al. 2002).
Single-strand conformation polymorphism analysisGenomic DNA was screened for mutations using single strand conformation polymorphism analysis (SSCP). PCR reactions were performed using 8 pairs of primers for exon 11 through 18 resulting in PCR-fragments with lengths between 196-370 bp (Davies, et al. 2002). The forward primer for exon 18 was modified resulting in primer 5’-TGTAGATTCTCGCCTCTATTGAG-3’. Genomic tumour DNA was amplified using 2.5U Pfu Turbo polymerase (Stratagene, California, USA), 20 pmol of each primer, 2.5 mM dNTP’s per reaction. PCR products were purified using the Qiagen Quick Purification system (Qiagen Inc, Santa Clarita, USA). Fragments were end-labelled with 1 mCi [γ-32P] dATP and the labelled product was loaded on a MDE gel (J.T. Baker Inc., Philipsburg, USA) containing 0, 5 or 10% glycerol. The gels were run at 8W for 15-20 hours at RT. After electrophoresis, the gels were dried and exposed to a Kodak Biomax film for 24 hours. All aberrant bands were sequenced, using an automated sequencer (Base Clear, Leiden, The Netherlands).
Figure 1.SSCP of exon 15 of eight uveal melanoma cell line samples and SKMel28, a cutaneous melanoma cell line. Difference in pattern is clearly visible, indicated by arrows, in OCM1 and SKMel28. Both have the T-to-A transversion 1796 in exon 15 of the BRAF gene that leads to the Valine-to-Glutamic acid substitution at codon 599 (V599E).
SKMel28
OCM192
.1Mel2
02
Mel270
OMM2.2
OMM2.3
OMM2.6
EOM3

RAS-BRAF kinase pathway is not involved in uveal melanoma
113
Results and discussion
Recent investigations show that 60-66% of the cutaneous malignant melanoma harbour mutations of the proto-oncogene BRAF (Davies, et al. 2002). This led us to investigate the occurrence of BRAF mutations in primary UM and UM cell lines. Mutation analysis was performed on the coding sequence and exon-intron borders of exons 11 through 18, encoding the complete serine/threonine kinase domain of BRAF. No BRAF mutations were observed in our 33 freshly frozen primary UM samples. These primary UM samples were previously screened for their N-RAS status; no N-RAS mutations were observed (Mooy, et al. 1991). In ten out of eleven UM cell lines no BRAF mutations were found. However, SSCP analysis displayed an aberrant pattern in the case of OCM1 (Fig. 1). Sequencing analysis revealed the T1796A transversion. The same aberrant SSCP pattern was also seen in the control cutaneous melanoma cell line, SKMel28, and colon carcinoma cell line, HT29. While we were preparing this paper Edmunds et al. published their results on the absence of BRAF mutations in exons 11 and 15 (Edmunds, et al. 2003). Although we came to the same conclusion we have fully screened exons 11 through 18 and were able to detect a polymorphic nucleotide change (IVS12+35G>C) in four of the primary tumours (Fig. 2), the cell line Mel270 and its metastases (OMM2.2, OMM2.3, OMM2.6).
In view of the fact that we could not detect any BRAF, or earlier, RAS mutations in primary UM (Mooy, et al. 1991), suggest that RAS and its downstream components do not play a role in the aetiology of UM. This in contrast to primary cutaneous melanoma where mutations have been observed, indicating an involvement of BRAF (Brose, et al. 2002; Davies, et al. 2002).
1 2 3 4 5 6 7
Figure 2.SSCP of exon 12 of seven primary uveal melanoma samples. Sample 1, 3, 4, 6 and 7 represent the wild type pattern. Sample 2 and 5 show the pattern for the polymorphism (IVS12+35G>C), which is visible by an up-ward shift of the bands indicated by the arrows.
114
Chapter 9
Despite the common embryonic origin, these tumours probably follow a different path towards tumorigenesis and have different biological behaviour. The fact that the activating BRAF mutation was present in OCM1 strongly suggests that OCM1 was not derived from a primary UM. Since the melanocytic origin of this cell line was shown we suppose that this cell line was in fact a metastasis of a cutaneous melanoma in the eye (Kan-Mitchell, et al. 1989; Luyten, et al. 1996). In addition, the characteristics in the karyotype of OCM1 are also not very specific for primary UM as we do not find a monosomy of chromosome 3, which is very specific for UM (Luyten, et al. 1996). In summary, our results indicate that BRAF is not involved in the pathogenesis of UM and that tumorigenesis of UM involves different sets of genes compared to these involved in cutaneous melanoma.

General discussion
Chapter 10
General discussion and future prospects


General discussion and future prospects
11�
General discussion and future prospects
Identification of prognostic parameters is an important goal of current cancer research. The prognostic factors may be subdivided into clinical, histopathological and genetic parameters. To be able to prevent or predict metastases we need more insight in the development and progression of the tumour. Therefore the aim this thesis is to identify reliable parameters involved in uveal melanoma development and progression.
Radiotherapy in uveal melanomaThe indication for enucleation or any other treatment modality is directed by the size of the tumour. Stereotactic radiotherapy (SRT) is a rather new treatment option with relatively limited side effects (Muller, et al. 2005; Muller, et al. 2004). The effectiveness of fractionated SRT on tumour control, visual acuity and chance on secondary enucleation seems to be comparable with the results for proton beam irradiation, but clinical trials are needed to evaluate these treatment options. Survival rates are also similar for enucleation and radiotherapy. Radiotherapy has become the first option to treat small and medium-sized tumours. In the study in chapter 2 we demonstrated that a fractionation schedule of 5x 10 Gy is sufficient to kill most radio-resistant cell lines. The radiosensitivity of uveal melanoma cell lines is mainly determined by the intrinsic radiosensitivity, the a-component, and less due to sublethal DNA damage (b-component). The intrinsic radiosensitivity, the a-component, indicates the regenerative capacity of the tissue, i.e. unrepairable damage. The b-component represents the self-renewal/repair capacity of the DNA. Cells displaying a low a/b ratio, which is indicative for a sparing effect after dose fractionation, require large doses per fraction for effective tumour treatment. The same low a/b ratio is also seen in late responding normal tissue, resulting in little benefit of the therapeutic ratio. The results of this study could be translated into a clinical setting to determine a therapeutic ratio for fractionated radiotherapy. Nevertheless clinical use of the individual radiosensitivity of the tumour is not possible at this moment, and further research focusing on this subject is necessary. On the other hand fractionated SRT is already in use for the small and medium sized uveal melanoma (Muller, et al. 2005). The larger tumour, though, may not benefit from this treatment, mainly due to uncontrollable side effects, resulting in complications, s.a. neovascular glaucoma, total retinal detachment, and vitreous haemorrhage that will lead to secondary enucleation. Consequently, enucleation may be the first choice of treatment for the large tumours. Still enucleation is not without any risk, since it may induce micro metastases (Manschot and van Peperzeel 1980; Zimmerman, et al. 1978). The metastatic capacity of uveal melanoma is not clearly predicted by the size of the tumour, but late

118
Chapter 10
occurring metastases might be avoided by pre-enucleation radiotherapy. The COMS studied the randomly assignment of patients to pre-enucleation radiotherapy or enucleation alone in a large study with medium and large sized tumours. The latest report confirmed earlier reports of no survival advantage attribute to pre-enucleation radiotherapy (Hawkins 2004). In chapter 3 we demonstrated that late occurring metastases, induced by enucleation, benefit from radiotherapy prior to enucleation. The survival advantage occurs after a period of 4 years, which is in concordance with the time required for a tumour to grow sufficiently to be detectable (Eskelin, et al. 2000). We should therefore reconsider if we should re-introduce pre-enucleation radiotherapy in case of enucleation.
Chromosomal aberrations in uveal melanomaIn the second part of this thesis, results of chromosomal and clinical analyses performed on primary uveal melanoma are described. Many studies have been performed concerning chromosomal aberrations and prognosis. The chromosomes that are consistently affected are chromosomes 1, 3, 6 and 8, with alterations reflected as gains and losses. We have analysed 120 uveal melanomas for chromosomal changes of chromosomes 1, 3, 6 and 8 using cytogenetic, FISH and CGH analyses. In previous studies monosomy 3 occurred in about 50% of the cases, in ciliary as well as choroidal melanoma (Prescher, et al. 1994; Sisley, et al. 2000; White, et al. 1996). The role of chromosome 1 is less apparent and some investigators have shown that loss of chromosome 1p is more common in large aggressive tumours (Sisley, et al. 2000) or metastasising tumours (Aalto, et al. 2001). In general a deletion or rearrangement of chromosome region 1p is observed (Horsman and White 1993; Parrella, et al. 1999; Prescher, et al. 1990; Sisley, et al. 2000). None of the previous studies, however, have evidently analysed concurrent loss of both, chromosome 1p and 3. We demonstrated that after correcting for confounding variables tumours with concurrent loss of chromosome 1p and 3 had a 7.8 time higher chance to metastasise than tumours without these losses or either 1p or 3 loss (Chapter 4). From a clinical view, it may enable clinicians to identify patients at high risk of developing metastases. In addition, some researchers have shown an increasing decreased disease free survival in the presence of amplification of chromosome 8q and uveal melanoma showed a clear tendency of progressive acquisition of additional copies of chromosome 8q (Sisley, et al. 1997). As amplification occurs subsequently to the loss of chromosome 3 the change has been specifically related to the ability of some uveal melanoma to spread and metastasise (Prescher, et al. 1994; Sisley, et al. 1997). A large proportion of uveal melanomas with monosomy 3 show a multiplication of 8q (Horsman and White 1993; Prescher, et al. 1995; Sisley, et al. 1992). Though, in the study described in chapter 4 amplification of chromosome 8q did not appear to be of much prognostic

General discussion and future prospects
119
importance. Amplification of chromosome 6p and loss of chromosome 6q is present in approximately 40% of the uveal melanomas (Mudhar, et al. 2004; Sisley, et al. 2000; Speicher, et al. 1994; Tschentscher, et al. 2000; White, et al. 1998a). Up to now only one study showed a better survival with chromosome 6 alterations (White, et al. 1998a), whereas another study demonstrated that loss of chromosome 6q appeared more often in primary tumours and their metastases than in non-metastasising melanoma (Dahlenfors, et al. 1993). Therefore, chromosomal aberrations, such as of chromosome 6 and 8, have been considered as a late event (Horsman and White 1993; Prescher, et al. 1995; Sisley, et al. 1992), with amplification of chromosome 8q as a promoter of tumour growth, resulting in a larger tumour diameter (Figure 1).
Familial uveal melanoma account for only 0.6% of all uveal melanoma (Singh, et al. 1996b). Studies on chromosomal changes in the tumour have not been performed as has been done for the sporadic tumours. Familial uveal melanomas have some aberrations in common with sporadic occurring melanoma, especially monosomy 3, loss of chromosome 1p and gain of chromosome 8q. Considering the gains and losses observed in both, sporadic and familial UM, they might be etiologically related indicating common regions of interest (Chapter 6). Another interesting chromosome is 16; loss of chromosome 16q was observed in several studies (Hoglund, et al. 2004; Sisley, et al. 2000)(Chapter 5 and 6). Even though the occurrence of chromosome 16q loss cannot be associated with survival it could still be involved in tumour progression or either tumour growth comparable to chromosome 8q gain, which was also considered to be a late prognostic factor. Therefore, delineation of a region on chromosome 16q may give us an opportunity to depict a region of interest with possible candidate genes involved in tumour progression.
NORMAL MELANOCYTE
CHROMOSOME 1P
CHROMOSOME 3
CHROMOSOME 8Q
CHROMOSOME 6P/6Q
UVEAL MELANOMA
Figure 1.Simplistic model on accumulation of chromosomal abnormalities in uveal melanoma

120
Chapter 10
Candidate regions and genes associated with uveal melanoma progressionLoss of a complete chromosome 3 is considered an early event (Prescher, et al. 1994; Sisley, et al. 2000; White, et al. 1996) and appears to be characteristic for uveal melanoma. In other solid tumours the region of loss is generally restricted to a certain area. Nonetheless, partial deletions of chromosome 3 have been reported (Horsman and White 1993; Kilic, et al. 2005; Prescher, et al. 1994; Sisley, et al. 1998; Tschentscher, et al. 2001) resulting in the hypothesis that two regions, one on the p-arm and one on the q-arm, might be involved in metastasis (Tschentscher, et al. 2001). In chapter 4 several tumours with partial loss were described, but the precise region of loss was not defined for these tumours. To study the biological and molecular characteristics of factors involved in melanoma progression and metastases fresh tumour tissue and cell lines are available. Although cell lines are not often identical to the original tumour cells due to culture environment, they are of high value to study these characteristics. We have delineated a region on the q arm of chromosome 3, 3q21.2-3q24, in uveal melanoma cell lines (Chapter 7). Combined with the results of previous studies, which showed a smallest region of overlap (SRO) spanning 3q24-3q26, the size of region of interest could be reduced. Candidate genes within this second region might be the putative osteosarcoma tumour suppressor gene at 3q26. Another gene p63, mapped to 3q27 is located distal to the SRO. P63 is a p53 homologue encoding different transcripts, some with dominant negative function, resulting in a negative feedback of p53 expression. In chapter 8 expression of different transcription variants encoded by p63 could not be correlated with loss of the chromosome locus of p63, indicating that p63 does not play key role in uveal melanoma. In addition, ATR (Ataxia Telangiectasia and Rad3 related), THRB (Thyroid Hormone Receptor B) (Sisley, et al. 1993) and RARβ2 (Retinoic Acid Receptor β2) at the hemizygous region at 3q24 (Chapter 7) might be possible candidates. Chromosome region 1p may also harbour some candidate genes, since tumours with concurrent loss of chromosome 1p36 and monosomy 3, were associated with a decreased survival. As mentioned before Aalto et al. described that chromosomal region 1p is associated with metastasising UM (Aalto, et al. 2001). These findings are suggestive for an interaction of proteins encoded by genes located on these chromosomes that might promote tumorigenesis, metastatic disease and consequently reduce survival. Ample research is done in neuroblastoma demonstrating a strong correlation of chromosomal region 1p36 with worse prognosis. Interesting genes, that are selectively downregulated in this tumour are UBE4B, KIF1B, PGD, APITD1, DFFA and PEX14 (Caren, et al. 2005). P73, a gene associated with worse prognosis in neuroblastoma, is located on chromosome 1p36. Increased expression of the p73Δex2 transcript, which is one of the transcription variants encoded by p73, was observed in primary tumours and cell lines with loss of chromosome 1p (Chapter 8). Supported by studies in various cancers we assume

General discussion and future prospects
121
that a role is attribute for this gene in UM progression. The p73Δex2-transcription variant may act as a dominant negative regulator op p53 induced apoptosis (Kaghad, et al. 1997; Yang and McKeon 2000) and consequently promote cell division. Another gene associated with prognosis in neuroblastoma is the APITD1 gene, particularly involved in cell division and cellular growth. Due to expression variants this gene may act as a dominant negative regulator of cell growth and induce apoptosis. It was suggested that low expression of APITD1 might interfere with ability of apoptosis through the p53 pathway (Krona, et al. 2004). In UM APITD1 has not been studied yet and might be a candidate for future research, considering the role chromosome 1p deletion plays in uveal melanoma survival.
As depicted earlier monosomy 3 is considered as an early event in UM. In previous studies monosomy 3 was consistently present in several subclones of a primary uveal melanoma, whereas isochromosome 8q and other aberrations appeared not everywhere (Aalto, et al. 2001; Prescher, et al. 1995). This tumour heterogeneity complicates the study of uveal melanoma. In general the initial changes will be observed in all subclones, whereas late changes may appear in only a subset of the tumour. Onken et al. described a novel molecular classification of uveal melanoma, based on gene expression profile, which distinguished low-grade from high-grade tumours (Onken, et al. 2004). This profile demonstrated overexpression of a cluster of genes on chromosome 8q in high-grade tumours, implying a role for chromosome 8q amplification in uveal melanoma progression (Ehlers, et al. 2005). DDEF1 (development and differentiation enhancing factor 1) is one of the genes in this cluster and had a much stronger correlation with metastatic death than MYC (Chana, et al. 1999; Ehlers, et al. 2005). DDEF1 mRNA as well as protein level overexpression are correlated with gain of chromosome 8q. The gene itself is an ADP ribosylation factor-GTPase activating protein involved in growth and differentiation. Therefore it might be a good candidate that may be involved in tumour progression and ability of the tumour to metastasise (Ehlers, et al. 2005).
Genes involved in malignant melanoma development and progression are regularly investigated in uveal melanoma, as both tumours are frequently compared. However, both may have a different etiology. For instance a specific mutation of the BRAF gene, V599E mutation, was observed in 60%-66% of the malignant melanoma of the skin (Davies, et al. 2002). Once having the V599E mutation it results in a constitutively active protein in the RAS-BRAF pathway promoting proliferation (Zhang and Guan 2000). Several studies could not demonstrate this BRAF mutation in primary uveal melanoma (Chapter 9) (Zuidervaart, et al. 2005). However, one of the primary uveal melanoma cell lines we investigated did have the V599E mutation. The first

122
Chapter 10
publications on this cell line, OCM1, demonstrated an uveal melanoma origin. In OCM-1 a 28 bp deletion in exon two of the CDKN2 locus was detected (Naus et al. unpublished results). Inactivation of p16ink4a in uveal melanoma generally occurs through methylation and not through mutation or deletion as in cutaneous melanoma (Singh, et al. 1996b). That’s why OCM1 may resemble cutaneous melanoma, and since the melanocytic origin of the OCM1 cell line was shown (Foulkes, et al. 1997; Kan-Mitchell, et al. 1989; Luyten, et al. 1996; Walker, et al. 1998) this cell line may have been contaminated during cell culture. Conclusions and future prospectsAs all analyses are focused on identification of highly malignant tumour profiles, it is important to find a simple method that identifies these patients in a relative easy manner. FISH or CGH analyses are clear methods to identify tumours with monosomy 3. For the samples that do not show evident chromosomal abnormalities a technique that characterises small gains and losses may be useful (CGH-arrays). DNA copy number alterations have already been successfully analysed with CGH-arrays (Hughes, et al. 2005) Compared to metaphase chromosomes, which are conventionally used for CGH, a much more sensitive and higher resolution can be achieved. Arrays with mapped clones are useful to obtain information on known chromosomal regions, resulting in a simplified search for candidate regions. Furthermore, subtle structural aberrations may be resolved with techniques with higher resolution, s.a. LOH studies or SNP-arrays. However, changes such as base substitutions, very small deletions or insertions will still be missed. Oligonucleotide-arrays have become available for identification of candidate genes in a more rapid way. This technique will be a valuable tool for identification of interesting genes in uveal melanoma. Especially when combined with the results obtained by CGH-array analysis regions and genes of interest may be detected elucidating pathways involved in uveal melanoma progression. Moreover, defining chromosomal regions predictive of metastasis gives the opportunity to produce diagnostic arrays, and in a later stage these methods may be helpful to determine a chemo- or radioresistance profile useful in the therapeutic strategies against UM. Since the current treatment modalities have similar results, selection of patients at high risk for developing distant metastases is clinically the most important aspect. The present information on chromosomal abnormalities already enables us to select patients at high risk. Data from our study suggests the feasibility of studying patients with uveal melanoma in prospective trials using samples retrieved by FNABs (Naus, et al. 2002; Sisley, et al. 1998).
Micrometastatic spread of tumour cells during enucleation may be prevented by pre-enucleation radiotherapy. Contrary to the COMS who could not observe a survival

General discussion and future prospects
123
benefit of this treatment, we demonstrated a significant benefit in survival. The pre-enucleation radiation is a relatively innocent treatment with low dose irradiation and consequently limited side effects.


125
References
Aalto Y, Eriksson L, Seregard S, Larsson O, Knuutila S. 2001. Concomitant loss of chromosome 3 and whole arm losses and gains of chromosome 1, 6, or 8 in metastasizing primary uveal melanoma. Invest Ophthalmol Vis Sci 42(2):313-7.Albertson DG, Collins C, McCormick F, Gray JW. 2003. Chromosome aberrations in solid tumors. Nat Genet 34(4):369-76.Aoyama T, Mastrangelo MJ, Berd D, Nathan FE, Shields CL, Shields JA, Rosato EL, Rosato FE, Sato T. 2000. Protracted survival after resection of metastatic uveal melanoma. Cancer 89(7):1561-8.Augsburger JJ, Gamel JW. 1990. Clinical prognostic factors in patients with posterior uveal malignant melanoma. Cancer 66(7):1596-600.Augsburger JJ, Lauritzen K, Gamel JW, Lowry JC, Brady LW. 1990. Matched group study of preenucleation radiotherapy versus enucleation alone for primary malignant melanoma of the choroid and ciliary body. Am J Clin Oncol 13(5):382-7.Augsburger JJ, Schroeder RP, Territo C, Gamel JW, Shields JA. 1989. Clinical parameters predictive of enlargement of melanocytic choroidal lesions. Br J Ophthalmol 73(11):911-7.Barbacid M. 1987. ras genes. Annu Rev Biochem 56:779-827.Barendsen GW. 1982. Dose fractionation, dose rate and iso-effect relationships for normal tissue responses. Int J Radiat Oncol Biol Phys 8(11):1981-97.Blasi MA, Roccella F, Balestrazzi E, Del Porto G, De Felice N, Roccella M, Rota R, Grammatico P. 1999. 3p13 region: a possible location of a tumor suppressor gene involved in uveal melanoma. Cancer Genet Cytogenet 108(1):81-3.Bornfeld N, Huser U, Sauerwein W, Wessing A, Sack H. 1989. [Preoperative irradiation before enucleation in malignant melanoma of the uvea. Review of the literature and initial personal experiences]Praoperative Bestrahlung vor Enukleation bei malignem Melanom der Uvea. Literaturubersicht und erste eigene Erfahrungen. Klin Monatsbl Augenheilkd 194(4):252-60.Bos JL. 1989. ras oncogenes in human cancer: a review. Cancer Res 49(17):4682-9.Brantley MA, Jr., Harbour JW. 2000. Deregulation of the Rb and p53 pathways in uveal melanoma. Am J Pathol 157(6):1795-801.Brock WA, Baker FL, Peters LJ. 1989. Radiosensitivity of human head and neck squamous cell carcinomas in primary culture and its potential as a predictive assay of tumor radiocurability. Int J Radiat Biol 56(5):751-60.Brose MS, Volpe P, Feldman M, Kumar M, Rishi I, Gerrero R, Einhorn E, Herlyn M, Minna J, Nicholson A and others. 2002. BRAF and RAS mutations in human lung cancer and melanoma. Cancer Res 62(23):6997-7000.Caren H, Ejeskar K, Fransson S, Hesson L, Latif F, Sjoberg RM, Krona C, Martinsson T. 2005. A cluster of genes located in 1p36 are down-regulated in neuroblastomas with poor prognosis, but not due to CpG island methylation. Mol Cancer 4(1):10.Caron H, van Sluis P, de Kraker J, Bokkerink J, Egeler M, Laureys G, Slater R, Westerveld A, Voute PA, Versteeg R. 1996. Allelic loss of chromosome 1p as a predictor of unfavorable outcome in patients with neuroblastoma. N Engl J Med 334(4):225-30.Carr J, Mackie RM. 1994. Point mutations in the N-ras oncogene in malignant melanoma and congenital naevi. Br J Dermatol 131(1):72-7.

126
References
Casciano I, Mazzocco K, Boni L, Pagnan G, Banelli B, Allemanni G, Ponzoni M, Tonini GP, Romani M. 2002. Expression of DeltaNp73 is a molecular marker for adverse outcome in neuroblastoma patients. Cell Death Differ 9(3):246-51.Cavenee WK, Dryja TP, Phillips RA, Benedict WF, Godbout R, Gallie BL, Murphree AL, Strong LC, White RL. 1983. Expression of recessive alleles by chromosomal mechanisms in retinoblastoma. Nature 305(5937):779-84.Chana JS, Wilson GD, Cree IA, Alexander RA, Myatt N, Neale M, Foss AJ, Hungerford JL. 1999. c-myc, p53, and Bcl-2 expression and clinical outcome in uveal melanoma. Br J Ophthalmol 83(1):110-4.Char DH, Kroll SM, Castro J. 1998. Ten-year follow-up of helium ion therapy for uveal melanoma. Am J Ophthalmol 125(1):81-9.Char DH, Phillips TL. 1982. The potential for adjuvant radiotherapy in choroidal melanoma. Arch Ophthalmol 100(2):247-8.Char DH, Phillips TL, Andejeski Y, Crawford JB, Kroll S. 1988. Failure of preenucleation radiation to decrease uveal melanoma mortality. Am J Ophthalmol 106(1):21-6.Chong H, Vikis HG, Guan KL. 2003. Mechanisms of regulating the Raf kinase family. Cell Signal 15(5):463-9.Coleman K, Baak JP, Van Diest P, Mullaney J, Farrell M, Fenton M. 1993. Prognostic factors following enucleation of 111 uveal melanomas. Br J Ophthalmol 77(11):688-92.COMS. 1998. The Collaborative Ocular Melanoma Study (COMS) randomized trial of pre-enucleation radiation of large choroidal melnaoma II: initial mortality findings. COMS report no. 10. Am. J. Ophthalmology(125):779-96.Dahlenfors R, Tornqvist G, Wettrell K, Mark J. 1993. Cytogenetical observations in nine ocular malignant melanomas. Anticancer Res 13(5A):1415-20.Dallas PB, Terry PA, Kees UR. 2005. Genomic deletions in cell lines derived from primitive neuroectodermal tumors of the central nervous system. Cancer Genet Cytogenet 159(2):105-13.Dannenberg H, Speel EJ, Zhao J, Saremaslani P, van Der Harst E, Roth J, Heitz PU, Bonjer HJ, Dinjens WN, Mooi WJ and others. 2000. Losses of chromosomes 1p and 3q are early genetic events in the development of sporadic pheochromocytomas. Am J Pathol 157(2):353-9.Davidson SE, West CM, Roberts SA, Hendry JH, Hunter RD. 1990. Radiosensitivity testing of primary cervical carcinoma: evaluation of intra- and inter-tumour heterogeneity. Radiother Oncol 18(4):349-56.Davies H, Bignell GR, Cox C, Stephens P, Edkins S, Clegg S, Teague J, Woffendin H, Garnett MJ, Bottomley W and others. 2002. Mutations of the BRAF gene in human cancer. Nature 417(6892):949-54.De Waard-Siebinga I, Blom DJ, Griffioen M, Schrier PI, Hoogendoorn E, Beverstock G, Danen EH, Jager MJ. 1995. Establishment and characterization of an uveal-melanoma cell line. Int J Cancer 62(2):155-61.De Waard-Siebinga I, Hilders CG, Hansen BE, van Delft JL, Jager MJ. 1996. HLA expression and tumor-infiltrating immune cells in uveal melanoma. Graefes Arch Clin Exp Ophthalmol 234(1):34-42.Diener-West M, Hawkins BS, Markowitz JA, Schachat AP. 1992. A review of mortality from choroidal melanoma. II. A meta-analysis of 5-year mortality rates following enucleation, 1966 through 1988. Arch Ophthalmol 110(2):245-50.

References
12�
Douglas BG, Fowler JF. 1976. The effect of multiple small doses of x rays on skin reactions in the mouse and a basic interpretation. Radiat Res 66(2):401-26.Edmunds SC, Cree IA, Di Nicolantonio F, Hungerford JL, Hurren JS, Kelsell DP. 2003. Absence of BRAF gene mutations in uveal melanomas in contrast to cutaneous melanomas. Br J Cancer 88(9):1403-5.Egan KM, Quinn JL, Gragoudas ES. 1999. Childbearing history associated with improved survival in choroidal melanoma. Arch Ophthalmol 117(7):939-42.Egan KM, Seddon JM, Glynn RJ, Gragoudas ES, Albert DM. 1988. Epidemiologic aspects of uveal melanoma. Surv Ophthalmol 32(4):239-51.Egan KM, Walsh SM, Seddon JM, Gragoudas ES. 1993. An evaluation of the influence of reproductive factors on the risk of metastases from uveal melanoma. Ophthalmology 100(8):1160-5; discussion 1166.Ehlers JP, Worley L, Onken MD, Harbour JW. 2005. DDEF1 is located in an amplified region of chromosome 8q and is overexpressed in uveal melanoma. Clin Cancer Res 11(10):3609-13.Elkind MM, Sutton H. 1960. Radiation response of mammalian cells grown in culture. 1. Repair of X-ray damage in surviving Chinese hamster cells. Radiat Res 13:556-93.Eskelin S, Pyrhonen S, Summanen P, Hahka-Kemppinen M, Kivela T. 2000. Tumor doubling times in metastatic malignant melanoma of the uvea: tumor progression before and after treatment. Ophthalmology 107(8):1443-9.Fillippovich I, Sorokina N, Gatei M, Haupt Y, Hobson K, Moallem E, Spring K, Mould M, McGuckin MA, Lavin MF and others. 2001. Transactivation-deficient p73alpha (p73Deltaexon2) inhibits apoptosis and competes with p53. Oncogene 20(4):514-22.Finger PT. 1997. Radiation therapy for choroidal melanoma. Surv Ophthalmol 42(3):215-32.Folberg R, Rummelt V, Parys-Van Ginderdeuren R, Hwang T, Woolson RF, Pe’er J, Gruman LM. 1993. The prognostic value of tumor blood vessel morphology in primary uveal melanoma. Ophthalmology 100(9):1389-98.Foss AJ, Alexander RA, Hungerford JL, Harris AL, Cree IA, Lightman S. 1997. Reassessment of the PAS patterns in uveal melanoma. Br J Ophthalmol 81(3):240-6; discussion 247-8.Foulkes WD, Flanders TY, Pollock PM, Hayward NK. 1997. The CDKN2A (p16) gene and human cancer. Mol Med 3(1):5-20.Gamel JW, McCurdy JB, McLean IW. 1992. A comparison of prognostic covariates for uveal melanoma. Invest Ophthalmol Vis Sci 33(6):1919-22.Ghazvini S, Char DH, Kroll S, Waldman FM, Pinkel D. 1996. Comparative genomic hybridization analysis of archival formalin-fixed paraffin-embedded uveal melanomas. Cancer Genet Cytogenet 90(2):95-101.Gordon KB, Thompson CT, Char DH, O’Brien JM, Kroll S, Ghazvini S, Gray JW. 1994. Comparative genomic hybridization in the detection of DNA copy number abnormalities in uveal melanoma. Cancer Res 54(17):4764-8.Grob TJ, Novak U, Maisse C, Barcaroli D, Luthi AU, Pirnia F, Hugli B, Graber HU, De Laurenzi V, Fey MF and others. 2001. Human delta Np73 regulates a dominant negative feedback loop for TAp73 and p53. Cell Death Differ 8(12):1213-23.Gu Y, Nakamura T, Alder H, Prasad R, Canaani O, Cimino G, Croce CM, Canaani E. 1992. The t(4;11) chromosome translocation of human acute leukemias fuses the ALL-1 gene, related to Drosophila trithorax, to the AF-4 gene. Cell 71(4):701-8.

128
References
Gunalp I, Batioglu F. 1998. Effect of pre-enucleation irradiation on the survival of patients with uveal melanoma. Ophthalmologica 212(4):231-5.Hagiwara K, McMenamin MG, Miura K, Harris CC. 1999. Mutational analysis of the p63/p73L/p51/p40/CUSP/KET gene in human cancer cell lines using intronic primers. Cancer Res 59(17):4165-9.Hausler T, Stang A, Anastassiou G, Jockel KH, Mrzyk S, Horsthemke B, Lohmann DR, Zeschnigk M. 2005. Loss of heterozygosity of 1p in uveal melanomas with monosomy 3. Int J Cancer 116(6):909-13.Hawkins BS. 2004. The Collaborative Ocular Melanoma Study (COMS) randomized trial of pre-enucleation radiation of large choroidal melanoma: IV. Ten-year mortality findings and prognostic factors. COMS report number 24. Am J Ophthalmol 138(6):936-51.Hearle N, Damato BE, Humphreys J, Wixey J, Green H, Stone J, Easton DF, Houlston RS. 2003. Contribution of germline mutations in BRCA2, P16(INK4A), P14(ARF) and P15 to uveal melanoma. Invest Ophthalmol Vis Sci 44(2):458-62.Heim S, Mitelman, F. 1995. Cancer Cytogenetics. 2 ed. New York: Wiley-Liss.Hibi K, Trink B, Patturajan M, Westra WH, Caballero OL, Hill DE, Ratovitski EA, Jen J, Sidransky D. 2000. AIS is an oncogene amplified in squamous cell carcinoma. Proc Natl Acad Sci U S A 97(10):5462-7.Hoglund M, Gisselsson D, Hansen GB, White VA, Sall T, Mitelman F, Horsman D. 2004. Dissecting karyotypic patterns in malignant melanomas: temporal clustering of losses and gains in melanoma karyotypic evolution. Int J Cancer 108(1):57-65.Holmes A, McMillan TJ, Peacock JH, Steel GG. 1990. The radiation dose-rate effect in two human neuroblastoma cell lines. Br J Cancer 62(5):791-5.Hopman AH, Ramaekers FC, Raap AK, Beck JL, Devilee P, van der Ploeg M, Vooijs GP. 1988. In situ hybridization as a tool to study numerical chromosome aberrations in solid bladder tumors. Histochemistry 89(4):307-16.Horsman DE, White VA. 1993. Cytogenetic analysis of uveal melanoma. Consistent occurrence of monosomy 3 and trisomy 8q. Cancer 71(3):811-9.Hoye CH, Smith RR. 1961. The effectiveness of small amounts of pre-operative irradiation in preventing the growth of tumor cells disseminated at surgery. Cancer(14):284-95.Hughes S, Damato BE, Giddings I, Hiscott PS, Humphreys J, Houlston RS. 2005. Microarray comparative genomic hybridisation analysis of intraocular uveal melanomas identifies distinctive imbalances associated with loss of chromosome 3. Br J Cancer 93(10):1191-6.Irwin MS, Kaelin WG, Jr. 2001. Role of the newer p53 family proteins in malignancy. Apoptosis 6(1-2):17-29.Jensen OA. 1982. Malignant melanomas of the human uvea: 25-year follow-up of cases in Denmark, 1943--1952. Acta Ophthalmol (Copenh) 60(2):161-82.Jost CA, Marin MC, Kaelin WG, Jr. 1997. p73 is a simian [correction of human] p53-related protein that can induce apoptosis. Nature 389(6647):191-4.Kaghad M, Bonnet H, Yang A, Creancier L, Biscan JC, Valent A, Minty A, Chalon P, Lelias JM, Dumont X and others. 1997. Monoallelically expressed gene related to p53 at 1p36, a region frequently deleted in neuroblastoma and other human cancers. Cell 90(4):809-19.Kan-Mitchell J, Mitchell MS, Rao N, Liggett PE. 1989. Characterization of uveal melanoma cell lines that grow as xenografts in rabbit eyes. Invest Ophthalmol Vis Sci 30(5):829-34.
References
129
Kath R, Hayungs J, Bornfeld N, Sauerwein W, Hoffken K, Seeber S. 1993. Prognosis and treatment of disseminated uveal melanoma. Cancer 72(7):2219-23.Kenneally CZ, Farber MG, Smith ME, Devineni R. 1988. In vitro melanoma cell growth after preenucleation radiation therapy. Arch Ophthalmol 106(2):223-4.Kilic E, Naus NC, van Gils W, Klaver CC, van Til ME, Verbiest MM, Stijnen T, Mooy CM, Paridaens D, Beverloo HB and others. 2005. Concurrent loss of chromosome arm 1p and chromosome 3 predicts a decreased disease-free survival in uveal melanoma patients. Invest Ophthalmol Vis Sci 46(7):2253-7.Kivela T, Suciu S, Hansson J, Kruit WH, Vuoristo MS, Kloke O, Gore M, Hahka-Kemppinen M, Parvinen LM, Kumpulainen E and others. 2003. Bleomycin, vincristine, lomustine and dacarbazine (BOLD) in combination with recombinant interferon alpha-2b for metastatic uveal melanoma. Eur J Cancer 39(8):1115-20.Knudson AG, Jr. 1971. Mutation and cancer: statistical study of retinoblastoma. Proc Natl Acad Sci U S A 68(4):820-3.Knuutila S, Aalto Y, Autio K, Bjorkqvist AM, El-Rifai W, Hemmer S, Huhta T, Kettunen E, Kiuru-Kuhlefelt S, Larramendy ML and others. 1999. DNA copy number losses in human neoplasms. Am J Pathol 155(3):683-94.Kreissig I, Rohrbach M, Lincoff H. 1989. Irradiation of choroidal melanomas before enucleation? Retina 9(2):101-4.Kroll S, Char DH, Quivey J, Castro J. 1998. A comparison of cause-specific melanoma mortality and all-cause mortality in survival analyses after radiation treatment for uveal melanoma. Ophthalmology 105(11):2035-45.Krona C, Ejeskar K, Caren H, Abel F, Sjoberg RM, Martinsson T. 2004. A novel 1p36.2 located gene, APITD1, with tumour-suppressive properties and a putative p53-binding domain, shows low expression in neuroblastoma tumours. Br J Cancer 91(6):1119-30.KWF. 1999. Summary 1999.Le Beau MM, Rowley JD. 1986. Chromosomal abnormalities in leukemia and lymphoma: clinical and biological significance. Adv Hum Genet 15:1-54.Lengauer C, Kinzler KW, Vogelstein B. 1998. Genetic instabilities in human cancers. Nature 396(6712):643-9.Lichter P, Joos S, Bentz M, Lampel S. 2000. Comparative genomic hybridization: uses and limitations. Semin Hematol 37(4):348-57.Logani S, Cho AS, Ali BH, Withers HR, McBride WH, Kozlov KL, Hall MO, Lee DA, Straatsma BR. 1995a. Single-dose compared with fractionated-dose radiation of the OM431 choroidal melanoma cell line. Am J Ophthalmol 120(4):506-10.Logani S, Cho AS, Su LD, Withers HR, McBride WH, Hall MO, Lee DA, Milani JK, Straatsma BR. 1995b. Effects of gamma radiation on the OM431 human ocular melanoma cell line. Exp Eye Res 60(6):603-5.Luyten GP, Mooy CM, Eijkenboom WM, Stijnen T, Hellemons LP, Luider TM, de Jong PT. 1995. No demonstrated effect of pre-enucleation irradiation on survival of patients with uveal melanoma. Am J Ophthalmol 119(6):786-91.Luyten GP, Naus NC, Mooy CM, Hagemeijer A, Kan-Mitchell J, Van Drunen E, Vuzevski V, De Jong PT, Luider TM. 1996. Establishment and characterization of primary and metastatic uveal melanoma cell lines. Int J Cancer 66(3):380-7.

130
References
Lynch HT, Anderson DE, Krush AJ. 1968. Heredity and intraocular malignant melanoma. Study of two families and review of forty-five cases. Cancer 21(1):119-25.Malaise EP, Fertil B, Chavaudra N, Guichard M. 1986. Distribution of radiation sensitivities for human tumor cells of specific histological types: comparison of in vitro to in vivo data. Int J Radiat Oncol Biol Phys 12(4):617-24.Manschot WA, van Peperzeel HA. 1980. Choroidal melanoma. Enucleation or observation? A new approach. Arch Ophthalmol 98(1):71-7.Manschot WA, van Strik R. 1992. Uveal melanoma: therapeutic consequences of doubling times and irradiation results; a review. Int Ophthalmol 16(2):91-9.Mavligit GM, Charnsangavej C, Carrasco CH, Patt YZ, Benjamin RS, Wallace S. 1988. Regression of ocular melanoma metastatic to the liver after hepatic arterial chemoembolization with cisplatin and polyvinyl sponge. Jama 260(7):974-6.McLean IW. 1993. The biology of haematogenous metastasis in human uveal malignant melanoma. Virchows Arch A Pathol Anat Histopathol 422(6):433-7.McLean IW, Foster WD, Zimmerman LE. 1982. Uveal melanoma: location, size, cell type, and enucleation as risk factors in metastasis. Hum Pathol 13(2):123-32.Meijerink J, Mandigers C, van de Locht L, Tonnissen E, Goodsaid F, Raemaekers J. 2001. A novel method to compensate for different amplification efficiencies between patient DNA samples in quantitative real-time PCR. J Mol Diagn 3(2):55-61.Mitelman F. 1995. ISCN (1995): An International Sytem for Human Cytogenetic Nomenclature. Basel: S. Karger.Mooy CM, De Jong PT. 1996. Prognostic parameters in uveal melanoma: a review. Surv Ophthalmol 41(3):215-28.Mooy CM, de Jong PTVM, Van der Kwast TH, Mulder PG, Jager MJ, Ruiter DJ. 1990. Ki-67 immunostaining in uveal melanoma. The effect of pre-enucleation radiotherapy. Ophthalmology 97(10):1275-80.Mooy CM, Luyten GP, de Jong PT, Luider TM, Stijnen T, van de Ham F, van Vroonhoven CC, Bosman FT. 1995. Immunohistochemical and prognostic analysis of apoptosis and proliferation in uveal melanoma. Am J Pathol 147(4):1097-104.Mooy CM, Van der Helm MJ, Van der Kwast TH, De Jong PT, Ruiter DJ, Zwarthoff EC. 1991. No N-ras mutations in human uveal melanoma: the role of ultraviolet light revisited. Br J Cancer 64(2):411-3.Mouriaux F, Maurage CA, Labalette P, Sablonniere B, Malecaze F, Darbon JM. 2000. Cyclin-dependent kinase inhibitory protein expression in human choroidal melanoma tumors. Invest Ophthalmol Vis Sci 41(10):2837-43.Mudhar HS, Parsons MA, Sisley K, Rundle P, Singh A, Rennie IG. 2004. A critical appraisal of the prognostic and predictive factors for uveal malignant melanoma. Histopathology 45(1):1-12.Muller K, Nowak PJ, de Pan C, Marijnissen JP, Paridaens DA, Levendag P, Luyten GP. 2005. Effectiveness of fractionated stereotactic radiotherapy for uveal melanoma. Int J Radiat Oncol Biol Phys 63(1):116-22.Muller K, Nowak PJ, Luyten GP, Marijnissen JP, de Pan C, Levendag P. 2004. A modified relocatable stereotactic frame for irradiation of eye melanoma: design and evaluation of treatment accuracy. Int J Radiat Oncol Biol Phys 58(1):284-91.

References
131
Naus NC, van Drunen E, de Klein A, Luyten GP, Paridaens DA, Alers JC, Ksander BR, Beverloo HB, Slater RM. 2001. Characterization of complex chromosomal abnormalities in uveal melanoma by fluorescence in situ hybridization, spectral karyotyping, and comparative genomic hybridization. Genes Chromosomes Cancer 30(3):267-73.Naus NC, Verhoeven AC, van Drunen E, Slater R, Mooy CM, Paridaens DA, Luyten GP, de Klein A. 2002. Detection of genetic prognostic markers in uveal melanoma biopsies using fluorescence in situ hybridization. Clin Cancer Res 8(2):534-9.Naus NC, Zuidervaart W, Rayman N, Slater R, van Drunen E, Ksander B, Luyten GP, Klein A. 2000. Mutation analysis of the PTEN gene in uveal melanoma cell lines. Int J Cancer 87(1):151-3.Ng SW, Yiu GK, Liu Y, Huang LW, Palnati M, Jun SH, Berkowitz RS, Mok SC. 2000. Analysis of p73 in human borderline and invasive ovarian tumor. Oncogene 19(15):1885-90.Niederkorn JY. 1984. Enucleation-induced metastasis of intraocular melanomas in mice. Ophthalmology 91(6):692-700.Ning Y RA, Smith ACM, Macha M, Precht K, Riethman H, Ledbetter DH, Flint J, Horsley S, Regan R, Kearney L, Knight S, Kvaloy K, Brown WRA. 1996. A complete set of human telomeric probes and their clinical application. Nature Genetics 14:86-89.Noter SL, Rothbarth J, Pijl ME, Keunen JE, Hartgrink HH, Tijl FG, Kuppen PJ, van de Velde CJ, Tollenaar RA. 2004. Isolated hepatic perfusion with high-dose melphalan for the treatment of uveal melanoma metastases confined to the liver. Melanoma Res 14(1):67-72.O’Nions J, Brooks LA, Sullivan A, Bell A, Dunne B, Rozycka M, Reddy A, Tidy JA, Evans D, Farrell PJ and others. 2001. p73 is over-expressed in vulval cancer principally as the Delta 2 isoform. Br J Cancer 85(10):1551-6.Onken MD, Worley LA, Ehlers JP, Harbour JW. 2004. Gene expression profiling in uveal melanoma reveals two molecular classes and predicts metastatic death. Cancer Res 64(20):7205-9.Park BJ, Lee SJ, Kim JI, Lee CH, Chang SG, Park JH, Chi SG. 2000. Frequent alteration of p63 expression in human primary bladder carcinomas. Cancer Res 60(13):3370-4.Parrella P, Fazio VM, Gallo AP, Sidransky D, Merbs SL. 2003. Fine mapping of chromosome 3 in uveal melanoma: identification of a minimal region of deletion on chromosomal arm 3p25.1-p25.2. Cancer Res 63(23):8507-10.Parrella P, Sidransky D, Merbs SL. 1999. Allelotype of posterior uveal melanoma: implications for a bifurcated tumor progression pathway. Cancer Res 59(13):3032-7.Peacock JH, Cassoni AM, McMillan TJ, Steel GG. 1988. Radiosensitive human tumour cell lines may not be recovery deficient. Int J Radiat Biol 54(6):945-53.Peacock JH, Eady JJ, Edwards SM, McMillan TJ, Steel GG. 1992. The intrinsic alpha/beta ratio for human tumour cells: is it a constant? Int J Radiat Biol 61(4):479-87.Peyssonnaux C, Eychene A. 2001. The Raf/MEK/ERK pathway: new concepts of activation. Biol Cell 93(1-2):53-62.Pinkel D, Segraves R, Sudar D, Clark S, Poole I, Kowbel D, Collins C, Kuo WL, Chen C, Zhai Y and others. 1998. High resolution analysis of DNA copy number variation using comparative genomic hybridization to microarrays. Nat Genet 20(2):207-11.Powers WE, Palmer LA. 1968. Bilogic basis of preoperative radiation treatment. Am J Roentgenol Radium Ther Nucl Med 102(1):176-92.Prescher G, Bornfeld N, Becher R. 1990. Nonrandom chromosomal abnormalities in primary uveal melanoma. J Natl Cancer Inst 82(22):1765-9.

132
References
Prescher G, Bornfeld N, Becher R. 1994. Two subclones in a case of uveal melanoma. Relevance of monosomy 3 and multiplication of chromosome 8q. Cancer Genet Cytogenet 77(2):144-6.Prescher G, Bornfeld N, Friedrichs W, Seeber S, Becher R. 1995. Cytogenetics of twelve cases of uveal melanoma and patterns of nonrandom anomalies and isochromosome formation. Cancer Genet Cytogenet 80(1):40-6.Prescher G, Bornfeld N, Hirche H, Horsthemke B, Jockel KH, Becher R. 1996. Prognostic implications of monosomy 3 in uveal melanoma. Lancet 347(9010):1222-5.Pyrhonen S, Hahka-Kemppinen M, Muhonen T, Nikkanen V, Eskelin S, Summanen P, Tarkkanen A, Kivela T. 2002. Chemoimmunotherapy with bleomycin, vincristine, lomustine, dacarbazine (BOLD), and human leukocyte interferon for metastatic uveal melanoma. Cancer 95(11):2366-72.Ried T, Heselmeyer-Haddad K, Blegen H, Schrock E, Auer G. 1999. Genomic changes defining the genesis, progression, and malignancy potential in solid human tumors: a phenotype/genotype correlation. Genes Chromosomes Cancer 25(3):195-204.Rodriguez-Sains RS. 1986. Ocular findings in patients with dysplastic nevus syndrome. Ophthalmology 93(5):661-5.Sanborn GE, Nguyen P, Gamel J, Niederkorn JY, Ngyuen P. 1987. Reduction of enucleation-induced metastasis in intraocular melanoma by periorbital irradiation. Arch Ophthalmol 105(9):1260-4.Sandberg AA. 1991. Chromosome abnormalities in human cancer and leukemia. Mutat Res 247(2):231-40.Scholes AG, Liloglou T, Maloney P, Hagan S, Nunn J, Hiscott P, Damato BE, Grierson I, Field JK. 2001. Loss of heterozygosity on chromosomes 3, 9, 13, and 17, including the retinoblastoma locus, in uveal melanoma. Invest Ophthalmol Vis Sci 42(11):2472-7.Seddon JM, Albert DM, Lavin PT, Robinson N. 1983. A prognostic factor study of disease-free interval and survival following enucleation for uveal melanoma. Arch Ophthalmol 101(12):1894-9.Seeger RC, Brodeur GM, Sather H, Dalton A, Siegel SE, Wong KY, Hammond D. 1985. Association of multiple copies of the N-myc oncogene with rapid progression of neuroblastomas. N Engl J Med 313(18):1111-6.Shields CL, Cater J, Shields JA, Singh AD, Santos MC, Carvalho C. 2000. Combination of clinical factors predictive of growth of small choroidal melanocytic tumors. Arch Ophthalmol 118(3):360-4.Shields CL, Shields JA, Kiratli H, De Potter P, Cater JR. 1995. Risk factors for growth and metastasis of small choroidal melanocytic lesions. Ophthalmology 102(9):1351-61.Silcock AQ. 1892. Hereditary sarcoma of the eyeball. Trans. Patholog. Soc. Lond. 43:140-141.Singh AD, Shields CL, De Potter P, Shields JA, Trock B, Cater J, Pastore D. 1996a. Familial uveal melanoma. Clinical observations on 56 patients. Arch Ophthalmol 114(4):392-9.Singh AD, Topham A. 2003. Incidence of uveal melanoma in the United States: 1973-1997. Ophthalmology 110(5):956-61.Singh AD, Wang MX, Donoso LA, Shields CL, De Potter P, Shields JA. 1996b. Genetic aspects of uveal melanoma: a brief review. Semin Oncol 23(6):768-72.

References
133
Sisley K, Cottam DW, Rennie IG, Parsons MA, Potter AM, Potter CW, Rees RC. 1992. Non-random abnormalities of chromosomes 3, 6, and 8 associated with posterior uveal melanoma. Genes Chromosomes Cancer 5(3):197-200.Sisley K, Curtis D, Rennie IG, Rees RC. 1993. Loss of heterozygosity of the thyroid hormone receptor B in posterior uveal melanoma. Melanoma Res 3(6):457-61.Sisley K, Nichols C, Parsons MA, Farr R, Rees RC, Rennie IG. 1998. Clinical applications of chromosome analysis, from fine needle aspiration biopsies, of posterior uveal melanomas. Eye 12 ( Pt 2):203-7.Sisley K, Parsons MA, Garnham J, Potter AM, Curtis D, Rees RC, Rennie IG. 2000. Association of specific chromosome alterations with tumour phenotype in posterior uveal melanoma. Br J Cancer 82(2):330-8.Sisley K, Rennie IG, Cottam DW, Potter AM, Potter CW, Rees RC. 1990. Cytogenetic findings in six posterior uveal melanomas: involvement of chromosomes 3, 6, and 8. Genes Chromosomes Cancer 2(3):205-9.Sisley K, Rennie IG, Parsons MA, Jacques R, Hammond DW, Bell SM, Potter AM, Rees RC. 1997. Abnormalities of chromosomes 3 and 8 in posterior uveal melanoma correlate with prognosis. Genes Chromosomes Cancer 19(1):22-8.Skehan P, Storeng R, Scudiero D, Monks A, McMahon J, Vistica D, Warren JT, Bokesch H, Kenney S, Boyd MR. 1990. New colorimetric cytotoxicity assay for anticancer-drug screening. J Natl Cancer Inst 82(13):1107-12.Soufir N, Bressac-de Paillerets B, Desjardins L, Levy C, Bombled J, Gorin I, Schlienger P, Stoppa-Lyonnet D. 2000. Individuals with presumably hereditary uveal melanoma do not harbour germline mutations in the coding regions of either the P16INK4A, P14ARF or cdk4 genes. Br J Cancer 82(4):818-22.Soulieres D, Rousseau A, Tardif M, Larochelle M, Tremblay M, Vaillancourt L, Pelletier G. 1995. The radiosensitivity of uveal melanoma cells and the cell survival curve. Graefes Arch Clin Exp Ophthalmol 233(2):85-9.Speicher MR, Prescher G, du Manoir S, Jauch A, Horsthemke B, Bornfeld N, Becher R, Cremer T. 1994. Chromosomal gains and losses in uveal melanomas detected by comparative genomic hybridization. Cancer Res 54(14):3817-23.Stam RW, den Boer ML, Meijerink JP, Ebus ME, Peters GJ, Noordhuis P, Janka-Schaub GE, Armstrong SA, Korsmeyer SJ, Pieters R. 2003. Differential mRNA expression of Ara-C-metabolizing enzymes explains Ara-C sensitivity in MLL gene-rearranged infant acute lymphoblastic leukemia. Blood 101(4):1270-6.Steel GG. 1993. Clonogenic cells and the concept of cell survival. Basic Clinical Radiobiology. London: Edward Arnold Publishers. p 28-39.Steel GG, Peacock JH. 1989. Why are some human tumours more radiosensitive than others? Radiother Oncol 15(1):63-72.Stidham KR, Johnson JL, Seigler HF. 1994. Survival superiority of females with melanoma. A multivariate analysis of 6383 patients exploring the significance of gender in prognostic outcome. Arch Surg 129(3):316-24.Stiewe T, Putzer BM. 2000. Role of the p53-homologue p73 in E2F1-induced apoptosis. Nat Genet 26(4):464-9.Stiewe T, Putzer BM. 2002. Role of p73 in malignancy: tumor suppressor or oncogene? Cell Death Differ 9(3):237-45.

134
References
Stiewe T, Zimmermann S, Frilling A, Esche H, Putzer BM. 2002. Transactivation-deficient DeltaTA-p73 acts as an oncogene. Cancer Res 62(13):3598-602.Thames HD, Jr., Withers HR, Peters LJ, Fletcher GH. 1982. Changes in early and late radiation responses with altered dose fractionation: implications for dose-survival relationships. Int J Radiat Oncol Biol Phys 8(2):219-26.Thorn M, Adami HO, Ringborg U, Bergstrom R, Krusemo UB. 1987. Long-term survival in malignant melanoma with special reference to age and sex as prognostic factors. J Natl Cancer Inst 79(5):969-74.Tomlinson IP, Lambros MB, Roylance RR. 2002. Loss of heterozygosity analysis: practically and conceptually flawed? Genes Chromosomes Cancer 34(4):349-53.Tschentscher F, Prescher G, Horsman DE, White VA, Rieder H, Anastassiou G, Schilling H, Bornfeld N, Bartz-Schmidt KU, Horsthemke B and others. 2001. Partial deletions of the long and short arm of chromosome 3 point to two tumor suppressor genes in uveal melanoma. Cancer Res 61(8):3439-42.Tschentscher F, Prescher G, Zeschnigk M, Horsthemke B, Lohmann DR. 2000. Identification of chromosomes 3, 6, and 8 aberrations in uveal melanoma by microsatellite analysis in comparison to comparative genomic hybridization. Cancer Genet Cytogenet 122(1):13-7.van Dekken H, Pizzolo JG, Reuter VE, Melamed MR. 1990. Cytogenetic analysis of human solid tumors by in situ hybridization with a set of 12 chromosome-specific DNA probes. Cytogenet Cell Genet 54(3-4):103-7.van den Aardweg GJ, Naus NC, Verhoeven AC, de Klein A, Luyten GP. 2002. Cellular radiosensitivity of primary and metastatic human uveal melanoma cell lines. Invest Ophthalmol Vis Sci 43(8):2561-5.van Elsas A, Zerp S, van der Flier S, Kruse-Wolters M, Vacca A, Ruiter DJ, Schrier P. 1995. Analysis of N-ras mutations in human cutaneous melanoma: tumor heterogeneity detected by polymerase chain reaction/single-stranded conformation polymorphism analysis. Recent Results Cancer Res 139:57-67.Verbik DJ, Murray TG, Tran JM, Ksander BR. 1997. Melanomas that develop within the eye inhibit lymphocyte proliferation. Int J Cancer 73(4):470-8.Vossio S, Palescandolo E, Pediconi N, Moretti F, Balsano C, Levrero M, Costanzo A. 2002. DN-p73 is activated after DNA damage in a p53-dependent manner to regulate p53-induced cell cycle arrest. Oncogene 21(23):3796-803.Walker GJ, Flores JF, Glendening JM, Lin AH, Markl ID, Fountain JW. 1998. Virtually 100% of melanoma cell lines harbor alterations at the DNA level within CDKN2A, CDKN2B, or one of their downstream targets. Genes Chromosomes Cancer 22(2):157-63.Whelchel JC, Farah SE, McLean IW, Burnier MN. 1993. Immunohistochemistry of infiltrating lymphocytes in uveal malignant melanoma. Invest Ophthalmol Vis Sci 34(8):2603-6.White VA, Chambers JD, Courtright PD, Chang WY, Horsman DE. 1998a. Correlation of cytogenetic abnormalities with the outcome of patients with uveal melanoma. Cancer 83(2):354-9.White VA, McNeil BK, Horsman DE. 1998b. Acquired homozygosity (isodisomy) of chromosome 3 in uveal melanoma. Cancer Genet Cytogenet 102(1):40-5.

References
135
White VA, McNeil BK, Thiberville L, Horsman DE. 1996. Acquired homozygosity (isodisomy) of chromosome 3 during clonal evolution of a uveal melanoma: association with morphologic heterogeneity. Genes Chromosomes Cancer 15(2):138-43.Yang A, Kaghad M, Wang Y, Gillett E, Fleming MD, Dotsch V, Andrews NC, Caput D, McKeon F. 1998. p63, a p53 homolog at 3q27-29, encodes multiple products with transactivating, death-inducing, and dominant-negative activities. Mol Cell 2(3):305-16.Yang A, McKeon F. 2000. P63 and P73: P53 mimics, menaces and more. Nat Rev Mol Cell Biol 1(3):199-207.Yang Q, Yoshimura G, Mori I, Sakurai T, Kakudo K. 2002. Chromosome 3p and breast cancer. J Hum Genet 47(9):453-9.Yang X, Darling JL, McMillan TJ, Peacock JH, Steel GG. 1990. Radiosensitivity, recovery and dose-rate effect in three human glioma cell lines. Radiother Oncol 19(1):49-56.Yu W, Ballif BC, Kashork CD, Heilstedt HA, Howard LA, Cai WW, White LD, Liu W, Beaudet AL, Bejjani BA and others. 2003. Development of a comparative genomic hybridization microarray and demonstration of its utility with 25 well-characterized 1p36 deletions. Hum Mol Genet 12(17):2145-52.Zaika AI, Slade N, Erster SH, Sansome C, Joseph TW, Pearl M, Chalas E, Moll UM. 2002. DeltaNp73, a dominant-negative inhibitor of wild-type p53 and TAp73, is up-regulated in human tumors. J Exp Med 196(6):765-80.Zhang BH, Guan KL. 2000. Activation of B-Raf kinase requires phosphorylation of the conserved residues Thr598 and Ser601. Embo J 19(20):5429-39.Zimmerman LE, McLean IW. 1984. Do growth and onset of symptoms of uveal melanomas indicate subclinical metastasis? Ophthalmology 91(6):685-91.Zimmerman LE, McLean IW, Foster WD. 1978. Does enucleation of the eye containing a malignant melanoma prevent or accelerate the dissemination of tumour cells. Br J Ophthalmol 62(6):420-5.Zuidervaart W, van Nieuwpoort F, Stark M, Dijkman R, Packer L, Borgstein AM, Pavey S, van der Velden P, Out C, Jager MJ and others. 2005. Activation of the MAPK pathway is a common event in uveal melanomas although it rarely occurs through mutation of BRAF or RAS. Br J Cancer 92(11):2032-8.


Summary / Samenvatting


139
Summary
Uveal melanoma is the most common primary malignant intra-ocular tumour in the Western world with an annual incidence of seven per million. Approximately 50% of the patients die eventually due to metastatic disease, most commonly located in the liver. Besides enucleation there are nowadays more conservative treatment methods aimed at sparing the affected eye and retaining vision, s.a. plaque radiotherapy, proton beam or stereotactic radiotherapy, with or without additional transpupillary thermotherapy (TTT). The effect of radiotherapy in uveal melanoma cell lines and primary uveal melanoma was described in the first part of this thesis. In chapter 2 an experimental study that investigated the amount of radiation needed to eradicate tumour cells is described. Every tissue has an intrinsic regenerative capacity (a) besides the repair capacity to overcome DNA damage (b). With survival assays the sufficient amount of radiation to kill most of the radioresistent cells was determined. Data from single and fractionated doses indicate large variations in radiosensitivity, which are mainly dominated by the intrinsic radiosensitivities. Therefore doses of 5 fractions of 8 Gy would be more than enough to kill most of the radiosensitive tumour cells. These results may be extrapolated to a clinical setting where they may be used to plan the individual amount of radiation for treatment with stereotactic radiotherapy. In spite of the new treatment modalities enucleation is still performed on larger tumours. Manipulation of the tumour-containing eye during enucleation could induce metastatic spreading of tumour cells. Furthermore, tumour cells may have spread prior any treatment, explaining the peak incidence of metastatic disease at 2 years after enucleation. By means of pre-enucleation radiotherapy the spreading of tumour cells during enucleation may be diminished. In chapter 3 is demonstrated that pre-enucleation radiotherapy has a beneficial effect on survival compared to enucleation alone. The second part of this thesis focuses on identification of clinical and genetic prognostic parameters. It concentrates on parameters that identify patients at high risk of metastatic disease, in particular. Several prognostic markers have been associated with disease free survival. In chapter 4 we describe the analysis of 120 uveal melanomas of patients treated with enucleation for chromosomal changes using conventional cytogenetics, FISH and CGH techniques. Concurrent loss of chromosome region 1p36 and monosomy of chromosome 3 was the strongest predictor for disease free survival of uveal melanoma patients. Gain of chromosome 8q did not appear to be of much prognostic importance. In chapter 5 once more the significance of monosomy 3, compared to classical clinical and histopathological parameters, is emphasised. In contrast to sporadic primary uveal melanoma, familial uveal melanomas are rare.

140
Summary
However, these tumours have similar aberrations, such as loss of chromosome 1p, 3 and 8p, and gain of chromosome 8q (Chapter 6). Furthermore in both, familial as sporadic uveal melanoma, abnormalities of chromosome 16q are relatively common, but are not associated with survival or other cytogenetic or histopathological parameters (Chapter 5 and 6). Besides monosomy 3 some tumours may show partial loss of chromosome 3. The last part focuses on delineation of critical regions and genes of interest. Two regions, one on the p-arm and one on the q-arm of chromosome 3, might be involved in metastases. In chapter 7 we studied the partial aberrations observed in uveal melanoma cell lines. The cell lines used were a primary tumour derived cell line and three metastases-derived cell lines, which originated from the same primary tumour. A region on chromosome 3q was delineated and reduced the size of the smallest region of overlap compared with literature. The strong correlation between concurrent loss of chromosome region 1p36 and monosomy 3 (Chapter 4) was suggestive for genes encoded on these chromosomes that might play a role in tumour progression. Two genes, p73 and p63, located on chromosome 3q24 and 1p36 respectively were investigated in chapter 8. These genes are transcribed with several dominant negative isoforms, implying that they may induce cell growth. P73 showed an upregulation of a dominant negative isoform, in tumours with loss of chromosome 1p36 region. On the other hand p63 showed no aberrant expression, meaning it does not play a role in UM progression. Both, uveal melanoma and cutaneous melanoma are derived from melanocytes. In cutaneous melanoma mutations in exon 15 of the BRAF gene appeared to promote malignant transformation of melanocytes. In chapter 9 mutation analysis of BRAF in thirty-three primary uveal melanoma and commonly used uveal melanoma cell lines is described. Contrary to cutaneous melanoma, where 66% of the tumours have this mutation, no mutations were found in this gene in primary uveal melanoma. This suggests that both uveal and cutaneous melanoma follow a different pathway in tumorigenesis.
Finally, in chapter 10 the results of this thesis are discussed and considerations for further research are given. The content of this thesis has given us more insight into identification of patients at high risk and may be useful in the therapeutic approach towards uveal melanoma patients.

141
Samenvatting
Het oogmelanoom is de meest voorkomende primair maligne intra-oculaire tumor in het westen met een jaarlijkse incidentie van 7 op de miljoen. Ongeveer 50% van de patiënten overlijdt ten gevolge van metastasen, voornamelijk gelokaliseerd in de lever. Naast enucleatie zijn er tegenwoordig ook andere behandelingsmogelijkheden die erop gericht zijn het oog en het zicht te sparen, zoals plaque radiotherapie, proton beam of stereotactische radiotherapie, met of zonder transpupilaire thermotherapie (TTT). Het effect van radiotherapie op oogmelanoom cellijnen en primaire tumoren is beschreven in het eerste deel van dit proefschrift. In hoofdstuk 2 wordt een experimentele studie beschreven, waarin is onderzocht hoeveel bestraling noodzakelijk is om tumorcellen te elimineren. Elk weefsel heeft een intrinsieke regeneratieve capaciteit (a) naast het normale herstelmechanisme (b) om DNA schade te repareren. Door middel van overlevings-assays werd de mate van bestraling, die voldoende is om het overgrote deel van de bestralingsresistente tumorcellen uit te schakelen, bepaald. Data van enkele en gefractioneerde doses tonen een grote variatie in bestralingsgevoeligheid, welke voornamelijk gedomineerd word door de intrinsieke bestralingsgevoeligheid. Zodoende zijn vijf doses van acht Gy meer dan voldoende om het merendeel van de bestralingsgevoelige cellen te elimineren. Deze resultaten kunnen vertaald worden naar een klinische setting, alwaar er gebruik van kan worden gemaakt om de individuele hoeveelheid bestraling voor de stereotactische bestraling te bepalen. Ondanks de nieuwe behandelingsmogelijkheden worden grote tumoren nog steeds geënucleëerd. Manipulatie van het oog met de tumor gedurende de enucleatie kan verspreiding van tumorcellen veroorzaken. Daarnaast kan de tumor ook metastaseren voor de behandeling, welke de piek incidentie van metastasen twee jaar na enucleatie verklaart. Door middel van voorbestraling zou de verspreiding van tumorcellen tijdens de enucleatie verminderd kunnen worden. In hoofdstuk 3 is beschreven dat voorbestraling van uvea melanomen een gunstig effect heeft op de lange termijn overleving van patiënten.
Het tweede deel van dit proefschrift richt zich op identificatie en klinische en genetische prognostische parameters. Het besteedt vooral aandacht aan parameters die patiënten met hoog risico op metastasen identificeren. Verscheidene prognostische markers zijn geassocieerd met ziektevrije overleving. In hoofdstuk 4 wordt een studie beschreven van 120 oogmelanomen van geënucleëerde patiënten die geanalyseerd zijn voor chromosomale veranderingen met behulp van conventionele cytogenetica, FISH en CGH. Gelijktijdig verlies van chromosoom regio 1p en monosomie van chromosoom 3 was de sterkste voorspeller van ziektevrije interval van oogmelanoom patiënten. Winst van chromosoom 8q was niet van prognostisch belang. In hoofdstuk

142
Samenvatting
5 wordt nogmaals de significantie van monosomie 3, in vergelijking met klassieke klinische en histopathologische parameters, benadrukt. In tegenstelling tot de sporadische primaire oogmelanomen zijn familiaire oogmelanomen zeldzaam. Echter deze tumoren hebben soortgelijke afwijkingen, zoals verlies van chromosoom 1p, 3 en 8p en winst van chromosoom 8q (Hoofdstuk 6). Verder zijn afwijkingen van chromosoom 16q, zowel in familiaire als sporadische oogmelanomen, vaak voorkomend, maar zijn niet geassocieerd met overleving of andere cytogenetische of histopathologische parameters (Hoofdstuk 5 en 6). Behalve het verlies van heel chromosoom 3 laten sommige tumoren partiële verliezen van chromosoom 3 zien. Het laatste deel richt zich op de afbakening van kritische regio’s en interessante genen. Twee regio’s, één op de p-arm en één op de q-arm van chromosoom 3, zouden mogelijk betrokken kunnen zijn bij metastasering. In hoofdstuk 7 werden partiële afwijkingen in oogmelanoom cellijnen geanalyseerd. De gebruikte cellijnen waren afkomstig van één primaire tumor en drie metastasen, welke van dezelfde primaire tumor waren. Op chromosoom 3q is er een gebied afgebakend, welke de grootte van de kleinste regio van overlap verminderde in vergelijking met de literatuur. De sterke correlatie tussen verlies van chromosoom regio 1p36 en monosomy 3 (Hoofdstuk 4) was suggestief voor genen op deze chromosomen welke een mogelijke rol zouden kunnen spelen in tumor progressie. Twee genen, p73 en p63, gelegen op chromosoom 3q24 en 1p36, zijn onderzocht in hoofdstuk 8. Deze genen worden overgeschreven met verscheidene dominant negatieve iso-vormen, betekenend dat zij mogelijk celgroei zouden kunnen induceren. P73 liet een opregulatie van een dominant negatieve iso-vorm in tumoren met verlies van chromosoom 1p36. Aan de andere kant liet p63 geen afwijkende expressie zien, beduidend dat het geen rol speelt in oogmelanoom progressie. Zowel oogmelanomen als huidmelanomen zijn afkomstig van melanocyten. In huidmelanomen lijken mutaties in exon 15 van het BRAF gen maligne transformatie van melanocyten te bewerkstelligen. In hoofdstuk 9 wordt de mutatie analyse van BRAF in 33 primaire oogmelanomen en oogmelanoom cellijnen beschreven. In tegenstelling tot huidmelanomen, waar 66% van de tumoren de mutatie hebben, zijn er geen mutaties waargenomen in primaire oogmelanomen. Dit was suggestief voor een verschil in etiologie van huid en oogmelanomen.
Uiteindelijk wordt in hoofdstuk 10 de resultaten van dit proefschrift bediscussieerd en overwegingen voor toekomstig onderzoek gegeven. De inhoud van dit proefschrift heeft ons meer inzicht gegeven tot identificatie van patiënten met hoog risico en is mogelijk bruikbaar in de therapeutische benadering van oogmelanoom patiënten.

143
Biography
The author of this thesis was born on the 27th of June 1976 in Gorinchem. She graduated from VWO (gymnasium) at the “Gymnasium Camphusianum” in 1994. She started her medical study at Erasmus University in Rotterdam the same year. During her study, she founded and was a council member of two different student organisations. From the second until the fourth year of her medical study, she worked at the laboratory of the Department of Genetics, where she became familiar with several molecular biological techniques under the supervision of Dr. A. de Klein. This resulted in an internship of two months at the Department of Immunology at Hacettepe University in Turkey (Prof. Dr. Ö. Sanal). During her study, she also worked as a student assistant at the maternity ward of the Sint Franciscus Gasthuis. After obtaining her medical degree, she began her PhD study described in this thesis under the supervision of Dr. A. de Klein (Clinical Genetics) and Dr. G. Luyten (Ophthalmology) in November 2000. In November 2004, she commenced her residency in Ophthalmology at the Department of Ophthalmology at Erasmus MC, headed by Prof. Dr. G. van Rij.


145
Dankwoord
Işte bitti! Dit zijn dan de laatste woorden die ik nog aan het proefschrift kan toevoegen. Bij het tot stand komen van dit proefschrift waren veel mensen direct of indirect betrokken. Vanzelfsprekend wil ik hier dan ook de mensen bedanken die een bijdrage hebben geleverd aan de totstandkoming.
Allereerst wil ik graag mijn beide co-promotoren bedanken. Beste Annelies, door jou ben ik al in een vroeg stadium van mijn opleiding in aanraking gekomen met het doen van wetenschappelijk onderzoek. Jouw enthousiasme voor onderzoek werkt aanstekelijk. Heel erg bedankt voor jouw enthousiasme en begeleiding de afgelopen jaren. Gre, ik heb je op een later moment in mijn opleiding leren kennen, maar ook jouw enthousiasme en ideeën zijn een goede drijfveer geweest gedurende de afgelopen jaren en hopelijk ook in de toekomst.
Mijn promotor, Prof.dr. G. van Rij, bedank ik voor de interesse en betrokkenheid bij mijn onderzoek. Daarnaast wil ik u nog bedanken voor de mogelijkheid tot het voortzetten van mijn opleiding tot oogarts.
De leden van de kleine commissie, Prof.dr. P. Levendag, Prof.dr. P.T.V.M. de Jong, Prof.dr. B.A. Oostra, bedank ik hartelijk voor de snelle beoordeling van het manuscript.
De afgelopen jaren heeft het onderzoek zich op verschillende locaties afgespeeld. De collega’s van het genetica lab 10.18, Henk, Laura, Ingrid, Roald en Yvette bedankt voor de gezellige tijden op het lab. Vervolgens lab 24.53 en na de gezamelijke verhuizing 9.22. Marjan, Violeta, Leontien, Mark, Özgur, Elly, Rachel, André en Arnold bedankt voor de interesse en gezelligheid. Wat door de jaren heen wel altijd gelijk is gebleven en waar ik ook heel veel tijd heb doorgebracht is lab 8.16, cytogenetica. Berna, heel veel dank voor het nakijken van FISH resultaten en de kritische beoordeling. Marjan bedankt voor het karyotyperen van al het tumormateriaal. Laura, wij zijn ongeveer tegelijk begonnen als AIO, veel succes met de opleiding tot Klinisch Cytogeneticus. Alle andere dames van de 8e dank voor jullie interesse. De research van de 24e Bert heel erg bedankt voor alle ins en outs over de FISH. Jaqueline en Hannie ik heb heel veel van jullie geleerd en jullie waren mijn steunpilaren voor de karyogrammen en CGH. 21 en 22 vind ik nog steeds erg lastig. Marieke, Rolduc was erg gezellig, maar op de sportschool viel het ook niet tegen. Ik moet me weer eens gaan inschrijven. Merel, Ik vind het erg leuk dat ik je heb leren kennen, zowel op het werk als daarbuiten. Veel plezier in Houston.

146
Dankwoord
En kamer 16.10 de enige stabiele factor gedurende de afgelopen jaren waar pittige discussie gevoerd werden. Sjoukje en Walter dank voor alle koffie-pauzes en vakkundig overleg over badkamers en keukens. Michael heel erg bedankt voor de technische ondersteuning en natuurlijk niet te vergeten de chaos in deze kamer. Hennie, inmiddels niet meer gesitueerd op kamer 16.10, maar toch heel er bedankt voor alle hulp en luisterend oor als het allemaal niet volgens plan verliep. Heel veel succes met je opleiding bij de Klinische Genetica. Jan-Roelof bedankt voor de fijne muzikale inbreng. De donderdag begon pas echt goed met een “capo”. Caroline, bedankt voor de “nieuwe” leiding op deze kamer en natuurlijk ook alle uitleg over statistiek. Alle studenten die er gedurende de afgelopen jaren voorbij zijn gekomen Anneke, Judith, Asma, Mariam en Eline heel erg bedankt voor de afwisseling en gezelligheid. Hanneke en Jolanda heel veel succes met het vervolgen van het oogmelanoomonderzoek.
Neeltje zonder de pathologie zou er weinig van dit onderzoek plaats kunnen vinden. Heel erg bedankt voor de interesse en hulp. Alle andere helpende handen bij de pathologie, betrokken bij de opvang en verwerking van de “ogen” bedankt. Beste Dion, bedankt voor het insturen van alle ogen. Kees, Corrie en Monique bedankt voor het prikken van alle bloedjes. Natuurlijk bedank ik ook alle patienten die mee hebben gewerkt aan het onderzoek.
Beste Nicole (van Basten) ondanks het goed organiseren verliep het soms niet zoals gepland (ik heb geen rekening meer ontvangen).
Beste Tom, zonder jou zag het boekje er niet uit zoals het er nu uitziet. Bedankt voor dit fantastische werk. Beste automatiseringsmensen, Ton, Pim en Leo zonder jullie
had de computer het al meerdere keren opgegeven.
Mijn “nieuwe” collega AIOS’en Alberta, Antoinette, Boris, Kasper, Nicole, Redmer, Rogier, Ruchi en Sabine bedankt voor de interesse in de vorderingen.
Sjoukje we hebben zowel op de 16e als op buitenlandse congressen een onwijs leuke en leerzame tijd gehad, wie zou ik anders kunnen kiezen als mijn paranimf. Succes met de co-schappen en het afronden van jouw promotie.

14�
Dankwoord
Nazik jij bent logischerwijs mijn andere paranimf. We hebben elkaar de eerste dag van de geneeskunde opleiding ontmoet en zijn nog steeds bevriend. Dat jij mijn paranimf bent is in feite vanzelfsprekend en behoeft dan ook geen uitleg. Heel veel sterkte met de “dubbele bevalling”.
En Nihal, Aysel, Bilge, Ozgur, Vahide, Bahri, Serpil, Behiye heel erg bedankt voor de steun en interesse zowel in mijn onderzoek als privé. Nuray, bedankt voor alle tips met betrekking tot promoveren. Ik wens je al het goeds samen met Selin.
Anne baba, işte bitti!!! Siz benim ben olmamı sağladınız. Desteğiniz için ne kadar teşekkűr etsem azdır. Ayşe, Hacer, Sebiha, Şükrü ve Mehtap desteğiniz için teşekkürler. Riza, Hakan ve Erol sizlere de tesekkür etmeden gecemem. Ve son olarak yeğenlerime de tesekkür etmek isterim. Hepiniz her zaman ve her türlü yardımı esirgemediğiniz için sonsuz tesekkürler.


Supplementary information / Colour figures


151
EOM gender age localisation cell type Largest tumour
diameter
vascular pattern
metastasis Karyotype
3 m 62 choroid mixed 12 ND no* 46,X,-Y,+5,-6,+18
9 m 62 choroid epithelioid 15 ND yes 46,XY (6/11)/ 46,X,-Y,i(6)(p10),i(8)(q10),+i(8)(q10),+i(8)(q10),der(13)t(13;16?)(p12;p11?),-16 (4/11)
27 m 86 ciliary body epithelioid 8 ND no* 46,XY normal
31 m 65 choroid epithelioid 7 yes yes 44,X,-Y,der(1)t(1;6)(p11;p11),add(2)(q22),-3,-6,+8
36 m 27 ciliary body epithelioid 10.5 yes yes 45,XY,-3 (37,5%)/45,XY,-3,i(8q) (62,5%) 1/16 46,XY,-3,i(8q),+8
37 m 71 choroid mixed 7 ND yes 46, XY,del(11)(q22q25),add(15)
38 m 49 choroid mixed 5.5 ND no 45,X,-Y (79%)/46,XY (21%)
40 m 33 choroid mixed 13 ND no 47,XY,del(1)(p22),add(7)(q36),+i(8q)? (18%)/47,XY,del(1)(p22),del(6)(q13q24),add(7)(q36),+i(8q) (82%).
42 f 47 choroid mixed 14 yes yes 46,XX normal
43 m 80 choroid mixed 13 yes no* 45,X,-Y,del(1)(p22p32),+der(2;8)(q10;q10),+i(2)(q10),-3,+4,der(6)t(6;15)(p22;q21),7?,-8,-8,del(9)(p13),add(21)(p11)
45 m 61 choroid epithelioid 11 ND yes 46,XY (56%)/ 45,X,-Y (44%)
48 f 55 ciliary body spindle 10 no yes 43,XX,i(1)(q10),-3,-4,der(6)del(6)(q1?5q2?5)ins(6;?3)(q1?5;?p12p22),der(13;22)(q10;q10),t(14;19)(q22;?p13),der(16)t(3;16)(q21;p12),-18,+20
50 m 57 choroid epithelioid 6 no yes 45,X,-Y (18%)/ 45,X,-Y,add(13)(q14)(70%)/ 45,X,-Y,der(10;15)(q10;q10),add(13)(q14)(12%)
53 m 68 choroid mixed 13 ND yes 46,X,-Y,dic(1;16)(p11;q11),inv(2)(p11p13),-3,+8[16]
55 f 38 choroid spindle 11 ND yes 46,XX(20%)/ 45,X,-X(20%)/ 88,XXXX,der(1)t(1;6)(p12;p11)x2,+der(1)t(1;6)[1],add(2)(q36 of q37)x2,-6,-6,+8,+8,-14,-15,-16,-21
62 f 21 choroid spindle 7 no no 46,XX,t(11;15)(q13.2;q13)(87.5%)/46,XX (12.5%)
63 f 73 choroid epithelioid 12 ND no* 46-48,XX,-3,i(6)(p10)[5],i(8)(q10),+i(8)(q10),+i(8)(q10)x2[4],del(16)(q21)[5]
71 m 66 choroid mixed 10 no yes 45,X,-Y
97 m 73 choroid spindle 8 no no* 45,X,-Y(57%).46,XY(43%)
102 m 76 choroid spindle 12 no no* 46,XY,add(9)(q34),add(22)(p11)[3]/46,XY,add(9)(q34),add(9)(p24),add(22)(p11)[15]
107 m 76 choroid mixed 19 yes no* 43,X,-Y,dic(3;19)(q11;q13.2),-13,der(17)t(13;17)(q13;p12),-21,add(22)(p11) [4]/43,X,-Y,dic(3;19)(q11;q13.2),-13,der(17)t(13;17)(q13;p12),add(22)(p11) [6]
121 m 49 choroid mixed 14 yes yes 46-47,XY,del(1)(p31p36),-3,der(4)t(1;4)(q12;q21),+8,+21[cp3]/45,X,-Y[3]/46,XY[8]
123 m 58 choroid epithelioid 11 yes no 46,XY[22]
125 f 74 choroid mixed 18 yes no 72-76,XXX,dic(1;7)(p10;p14),+dic(1;7)(p10;p14),-3,+4,+6,-7,+i(8)(q10),+9,-11,-15,+16,+18,+20,+?21,+22[cp12]/49-54,idem[cp2]
130 f 57 ciliary body mixed 16 yes no 41-48,XX,der(1)t(1;6)(p11;p1?2),add(4)(q1?2),-5,-6,+7,+8,+8,-9,add(11)(q13~14),+add(11)(q13~14),-13,-16,+22,+mar.ish der(6)(wcp6+),+mar.ish der(16)t(6;16)(wcp6+,wcp16+)[cp6]
131 f 60 choroid mixed 8 yes no 46,XX[11]
136 f 85 choroid mixed 15 no yes 41-44,XX,der(1;8)(q10;q10).ish der(1;8)(wcp8+,2053b3+,p1.164+,D8Z2+,puc1.77+,wcp1+),-3,+der(8).ish der(8)ins(8)(p?21q?23q?24.1)del(8)(q22q22)(wcp8+,114C11+,105H8+,p1.164-,2053b3+),-15,del(16)(q11q1?3).ish del(16)(wcp16+,pHUR195-)[cp15]
141 m 54 choroid mixed 11 no no 46,XY,+2,dic(6;13)(q12;p10),dic(6;14)(q12;p10)[16]
147 m 56 choroid spindle 13 no no 44~47,XY,del(1)(p2?)[5],add(7)(p?2)[4],+9[2],-15[4],add(19)(q1?3[3],+mar[2][cp6]/46,XY[3]
Supplementary information

152
EOM gender age localisation cell type Largest tumour
diameter
vascular pattern
metastasis Karyotype
148 m 59 choroid mixed 13 yes yes 45,X,-Y[3]/46,XY[10]/47,XY,+?der(2)[2]/46,XY,add(8)(p),der(15)t(1;15)(q11;p11)[1]
150 m 42 choroid spindle 12 no no 46,XY[4]/47,XY,+9[3]/47,XY,+9,der(10)t(6;10)(p12;q26)[4]
151 f 48 choroid spindle 12 no no 46,XX[3]/46,XX,der(20)t(6;20)(p12;p12)[5]/47,XX,idem,+8[4]/47,XX,idem,+8,psudic(17;15)(p13;p11)[3]
152 f 76 choroid epithelioid 15 yes yes 45~48,XX,-3,i(8)(q10),+i(8)(q10),+i(8)(q10)[cp5]/46,XX[4]/47~49,XX,+3[3],+5[2],+6[2][cp4]
157 f 72 choroid mixed 13 yes no* 46,XX[10]/47,XX,+8[7]
158 m 61 choroid spindle 11 no yes 45,X,-Y[10]/46,XY[4]
159 f 37 choroid spindle 12 no no 40~46,XX,add(2)(q3?4).ish der(2)t(2;6)[6],der(5)t(5;6)(q34;?)[9],del(6)(q?)[3],der(7)t(7;8)(p21;q?),add(10)(p1?4).ish der(10)t(8;10)[2],add(11)(q1?4).ish der(11)t(8;11)[9],der(16)t(8;16)(q?;q24)[7],add(18)(q23)[1] [cp19][19]/46,XX[1]
160 f 72 choroid mixed 14 yes yes 46,XX[10]/40~42,XX,del(1)(p21),-3,-6,i(8)(q10)[1],-12,-18[cp5]/47,XX,del(1q),der(1)t(1;8)(p;q),+7,-8,+9,del(11p)[1]
165 m 42 choroid spindle 12 no no 47,XY,add(6)(q21),der(7)t(1;7)(q12;q36),+8[20]
166 f 49 choroid mixed 18 no no 47,X,-X,-3,+7,i(8)(q10),+i(8)(q10)[1]/46,XX[4]
174 f 59 choroid spindle 19 no yes 75,XXY,1p+,-3,+i(6)(p),i(8)(q),9p+
177 m 59 choroid spindle 8 yes yes 45~47,XY,-5[2],+8[2],add(8)(p22),+add(8)(p22)[4],-9[2],del(13)(?q14q21),der(17)ins(17;13)(q12;?q14q21)del(17)(q22q23),-19[2],-22,+mar[cp7]
178 f 73 choroid mixed 17 yes no 45~47,XX,del(1)(p21),add(7)(q36),+8[2],-15,add(17)(p12),+ring[1][cp5]/46,XX,del(1)(p21),der(5)t(5;14),add(7)(q36),+8,-14,-15,add(17)(p12),+ring[5]
179 m 60 choroid spindle 11 no no 46,XY[15]
180 f 79 choroid epithelioid 16 no yes 43~45,X,-X,-3,i(8)(q10),+i(8)(q10),+i(8)(q10)[2],der(16;21)(q10;q10),der(22)[1][cp5][5]
182 f 52 choroid spindle 14 no no 46,XX,der(6)t(6;6)(q16;p12),add(22)(p11),add(22)(q13)[16]
187 m 65 choroid epithelioid 15 yes yes 45,X,-Y,-3,-4,i(8)(q10),+i(8)(q10),+mar
189 m 80 choroid mixed 14 yes yes 44,XY,-1,-2,-3,dic(1;6)(q10;q10),+ring[5]/45,XY,-1,-2,-3,dic(1;6)(q10;q10),+8,+ring[12]/90,XXYY,idem,+8,+8[1]
191 f 46 choroid spindle 14 no yes 46,XX,add(1)(q42),add(4)(q3?2),del(6)(q1?4q2?5),der(8)t(6;8)(p12;q24),-16,add(16)(q?2),add(17)(p13),add(21)(p11),+mar1,+mar2 [19]
193 m 44 choroid epithelioid 16 yes yes 46, XY[16]
195 m 68 choroid epithelioid 16 no no 46, X,-Y,-3,+i(8)(q10),+i(8)(q10)[4]/47,idem,+add8(p?)[12]
199 f 64 choroid spindle 17 yes yes 44~45,XX,der(1)t(1;6)(p12;p11),-3,+i(8)(q10),+i(8)(q10)[1],der(14)t(14;22)(q13;q11),-16,-22[cp19]
205 m 46 choroid spindle 7 yes no 44,X,-X,der(22)t(12;22)(q12;p12) [3]/45,X,-X,I(12)(q10),idic(22)(p12) [2]/46 XX [26]
207 m 76 choroid spindle 15 yes no 45,X,-Y,-3,i(6)(p10),+8[8]/46,XY[7]
211 f 66 choroid spindle 14 no yes 73,X,-X,-X,add(1)(q43),+2,-3,+7,+8,+i(8)(q10),+i(8)(q10),-9,add(9)(q?13),-10,+11,+12,+13,+14,+15,-17,+19,-21[1]/149,idemx2[1]
218 m 60 choroid spindle 17 no no 41,XY,-1,der(11)t(1;11)(q12;p15),add(12)(p13),-15,-16,-21,-22[16]
219 m 69 choroid mixed 18 yes yes 45,XY,-3,i(8)(q10)[14]
226 m 27 choroid mixed 13 yes no 46,XY,-3,i(8)(q10),+i(8)(q10)[6]/47,XY,-3,i(8)(q10),+i(8)(q10)[3]/46,XY[2]
237 m 77 choroid spindle 14 no yes 45,X,-Y,add(1)(p2),-3,+i(8)(q10)[4]

153
EOM gender age localisation cell type Largest tumour
diameter
vascular pattern
metastasis Karyotype
240 m 52 choroid spindle 15 no yes 46,XY,-3,+i(8)(q10)[17]
241 f 84 choroid spindle 14 no no 46,XX[22]
242 f 47 choroid spindle 16 no no 46,XX,der(3)t(3;8)(q2?9;q11),der(6)add(6)(p?22)t(6;8)(q16;q?21),+der(6)add(6)(p?22)t(6;13)(q11;q11),-13,add(17)(p13)[10]
246 m 57 choroid epithelioid 15 no no 40-47,X,-Y,-3.?add(6)(q13),i(8)(q10),+i(8)(q10),+i(8)(q10)[2],+i(8)(q10)[1][cp3][3]
253 m 74 choroid epithelioid 19 yes yes 77-86,XXYY,i(1)(q10),+der(1)i(1)(q10)t(1;17)(q21;p12)or der(1)i(1)(q10)t(1;17)(q21;24)x3,-3[3],i(4)(p10),+i(4)(p10)[3],-6[3],i(6)(p10),i(8)(q10)x2,-9,-9,-10,add(11)(p14)x2,-13,-14[3],-15,-15,-16[3],add(20)(q13)x2[cp4][4]/79-86,XXYY,i(1)(q10),+i(1)(q10),+i(1)(q10)[6],+2[5],-3[5],-3[4],-4[4]i(4)(p10),+i(4)(p10)[7],-5[8],-6,i(6)(p10)[8],-7[3],+7[3],i(8)(q10)x2,-9,-10[8],-11[7],-12[6],-13[6],-14[5],-15[6],-15[3],-16[7],-17[3],+18[3],-19[3],add(20)(q13)x2,+mar[2][cp9][9]
254 f 74 choroid mixed 18 yes yes 45,XX,der(1)t(1;16)(p22;p11),-3,+i(8)(q10),-16[16]
256 m 40 choroid spindle 12 no no 46,XY,der(19)t(6;19)(p23;p13.3)[18]
257 m 87 choroid spindle 12 no no* 46,XY,der(8)t(8;18)(p12;q12),der(21)t(6;21)(p11;p11)[12]/46,XY,del(6)(q15q26),der(8)t(8;8)(p12;q12),der(21)t(6;21)(p11;p11)[3]
261 m 40 choroid spindle 9 no no 55,XY,+2,+add(5)(q12),+der(5;17)(q10;q10),del(6)(q12q27),+8,+8,+der(9)t(8;9)(q11;p12),+11,+20[16]
262 f 64 choroid epithelioid 13 yes yes 45-91,X,-X,-3,+i(8)(q10),inc.[6]/46,XX[8]
265 m 40 choroid spindle 13 no yes 46,XY,del(6)(q15q22)[2]/46,XY,del(6)(q15q22),add(14)(q32)[1]/ 46,XY,del(6)q15q22),der(17)t(7;17)(q11.2;p13)[5]/ 46,XY,del(6)(q15q22),add(14)(q32),der(17)t(7;17)(q11.2;p13)[8]
270 m 65 choroid spindle 14.5 yes yes 46,XY,add(6)(q21),add(7)(q21),?del(9)(p13p23),dup(10)(q26q23),del(11)(q22),add(14)(p11),add(19)(13.4)[1]/46,XY,add(6)(q21),add(7)(q21),?del(9)(p13p23),dup(10)(q26q23),del(11)(q22),add(14)(p11),add(19)(13.4),der922)t(8;22)9q21;p10)[13]/43,XY,add(6)(q21),add(7)(q21),add(8)(p11),?del(9)(p13p23),-10,dup(10)(q26q23),del(11)(q22),add(14)(p11),der(15;15)(q10;q10),add(19)(q13.4)[2]
271 f 55 choroid spindle 13 yes no 45,XX,-3,der(8)t(8;8)(p23;q13)[14]
272 f 52 choroid spindle 15 yes no* 46,XX,der(1)t(1;16)(p2?1;p11),-3,+(8)(q10),-16[16]
274 m 42 choroid spindle 17 no no 46,XY,del(11)(q2?2),der(18)t(6;18)(p21;q23),add(19)(p13.3)[4]/ 46,XY,add(9)(q34),del(11)(q2?2),der(18)t(6;18)(p21;q23),add(19)(p13.3)[19]
281 m 69 choroid spindle 16 no no 46,XY,der(7)t(6;7)(p22;p22)[20]
*Patients without metastases, death due to other causes


Colour figures
155
Chapter 1
Figure 1.
Schematic illustration of the eye on the left. Histological sections of uveal melanoma on the right; melanoma
located in the iris (A), ciliary body (B) and choroid (C).

156
Colour figures
Chapter 6
Figure 1B.
Summary of the most frequent DNA copy number changes detected by CGH in six familial uveal melanoma,
upper panel, and 15 sporadic uveal melanomas, lower panel. Vertical lines on the right side of the chromosome
represent gains and vertical lines on the left side of the chromosome indicate losses. Bold lines indicate high-
level amplifications.

Colour figures
15�
Chapter 6
Figure 1.
CGH analysis of Mel270
The green and red line represent, respectively, the upper and lower thresholds of the normal range. The
red line on the left of the ideogram represents the copy number decrease. Average expression profile of 9
metaphases.

158
Colour figures
A
RP11-95H16
RP11-208G16 RP11-255O19 RP11-41F5
RP11-88H10 RP11-229G6
B
Chapter 7
Figure 4.
FISH analysis of Mel270
A: representative results of dual color FISH on Mel270 cells, hybridised with a combination of a chromosome
3q probe (red) and a centromere 3 probe (Pa3.5) (#3) (green), except for probe RP11-95H16 (green) that was
combined with a 3pter probe (B47A2) (red). Panel A: 3pter probe and RP11-95H16; #3 and RP11-88H10; and
#3 and RP11-229G6.
B: representative results of dual color FISH on Mel270 cells, hybridised with a combination of a chromosome
3p probe (red) and a centromere 3 probe (Pa3.5) (#3) (green). Panel B: #3 and RP11-208G16, #3 and RP11-
255O19, and #3 and RP11-41F5.

Colour figures
159
A B C
Chapter 8
Figure 1.
Interphase FISH with the BAC-clones RPCI-11 62M23 for p73 in green and RPCI-11 53D15, located on 3q24
in red: A. P.7, B. P.13 and C. OCM-1.