time resolved measurements and - Eindhoven University of ...
Upload
independentCategory
view
1download
0
ORIGINAL PAPER
Time-resolved release of calcium from an epithelial cell monolayerduring mucin secretion
Sumitha Nair • Rohit Kashyap • Christian Laboisse •
Ulrich Hopfer • Miklos Gratzl
Received: 26 May 2010 / Accepted: 6 October 2010 / Published online: 26 October 2010
� European Biophysical Societies’ Association 2010
Abstract A significant amount of Ca2? is contained in
secretory mucin granules. Exchange of Ca2? for monova-
lent cations drives the process of mucin decondensation
and hydration after fusion of granules with the plasma
membrane. Here we report direct observation of calcium
secretion with a Ca2? ion-selective electrode (ISE) in
response to apical stimulation with ATP from HT29-
Cl.16E cells, a subclone of the human colonic cancer cell
line HT29. No increase in Ca2? level was seen for the sister
cell line Cl.19A, which lacks mucin granules, or for Cl.16E
cells after inhibition of granule fusion with wortmannin.
Further, the measured concentration was used to estimate
the time-resolved rate of release of Ca2? from the cell
monolayer, by use of a deconvolution-based method
developed previously (Nair and Gratzl in Anal Chem
77:2875–2881, 2005). The results argue that Ca2? release
by Cl.16E cells is associated specifically with mucin
secretion, i.e., that the measured Ca2? increase in the apical
solution is derived from granules after fusion and mucin
exocytosis. The Ca2? ISE in conjunction with deconvolu-
tion provides a minimally disturbing method for assessment
of Ca2? secretion rates. The release rates provide esti-
mates of exocytosis rates and, when combined with earlier
capacitance measurements, estimates of post-stimulation
endocytosis rates also.
Keywords HT29-Cl.16E � Ion selective electrode �Exocytosis � Endocytosis � Voltage clamp � Capacitance
Introduction
Mucus is an exocrine secretion that lubricates and protects
underlying epithelial cells of the various mucous mem-
branes of the body (Verdugo et al. 1987; Moniaux et al.
2001). Mucus secretions consist mainly of water, electro-
lytes, and carbohydrate-rich gel-forming mucin glycopro-
teins (Verdugo 1990). Overproduction of mucus is
characteristic of many respiratory diseases including
asthma, chronic obstructive pulmonary disease, and cystic
fibrosis (Rogers and Barnes 2006).
Mucins are stored in the apical portion of epithelial cells
inside mucin granules in a highly condensed matrix. On the
basis of video-enhanced microscopy it was thought that
secretory proteins are entrapped inside the granules in a
completely condensed and dehydrated core that was sur-
rounded by a fluid aqueous phase (Verdugo 1990). Recent
studies indicate that the mucin matrix inside the granule is
not completely condensed, but rather comprises a mucin
meshwork in a fluid phase in which the proteins and ions
can slowly diffuse through pores and interact with matrix
components (Perez-Vilar 2007). There is evidence that
specific protein-mediated interactions are also important
for intragranular organization of mucins in a condensed
Electronic supplementary material The online version of thisarticle (doi:10.1007/s00249-010-0636-5) contains supplementarymaterial, which is available to authorized users.
S. Nair � R. Kashyap � M. Gratzl (&)
Department of Biomedical Engineering, Case School
of Engineering, Case Western Reserve University,
Cleveland, OH 44106, USA
e-mail: [email protected]
C. Laboisse
Institut National de la Sante et de la Recherche Medicale 94-04,
Universite de Nantes, 44035 Nantes, France
U. Hopfer
Department of Physiology and Biophysics, School of Medicine,
Case Western Reserve University, Cleveland, OH 44106, USA
123
Eur Biophys J (2011) 40:165–174
DOI 10.1007/s00249-010-0636-5
matrix (Perez-Vilar et al. 2006). Storage of mucin in a
condensed state requires low pH and high concentrations of
divalent or polyvalent cations to shield the negative char-
ges of the polyanionic mucin chains (Verdugo 1990; Perez-
Vilar 2007).
Ca2? seems to be of major importance in charge
shielding, as indicated by significant amounts of calcium
found in secretory granules (Verdugo et al. 1987; Perez-
Vilar 2007; Perez-Vilar et al. 2006; Paz et al. 2003). It has
been proposed that loss of Ca2? after granule fusion drives
expansion of mucins into a polymer gel (Verdugo et al.
1987; Paz et al. 2003; Kuver et al. 2000). Granule fusion is
initiated by formation of a secretory pore that enlarges with
time. This would enable exchange of intragranular Ca2?
for monovalent cations from the extracellular space. This
process increases the Donnan potential of the polymer
matrix and thus would drive phase transition of mucins
from a condensed network into a hydrated, highly expan-
ded gel (Verdugo 1991). There is also evidence suggesting
exchange of Ca2? with K? during granule exocytosis
(Marszalek et al. 1997; Nguyen et al. 1998), triggering a
phase transition of the matrix.
Ca2? release from isolated granules and individual
goblet cells has been observed in real time by use of
optical techniques (Nguyen et al. 1998; Quesada et al.
2001). Here we report direct observation of calcium
secretion from HT29-Cl.16E cells, a subclone of the
human colonic cancer cell line HT29 that is known to
secrete mucins in response to apical purinergic stimula-
tion (Merlin et al. 1994). A Ca2? ion-selective electrode
(ISE) placed close to Cl.16E monolayers indicated a
significant increase in Ca2? concentration on stimulation
with ATP. There was no observable change in concen-
tration when granule fusion was inhibited by pretreatment
of cells with wortmannin, which prevents fusion by
inhibition of phosphoinositide 3-kinases. Similarly, ATP
addition did not elicit an increase in Ca2? concentration
at HT29-Cl.19A cells that contain no mucin granules.
These results indicate that the Ca2? increase at the Cl.16E
cells was associated specifically with mucin secretion and
the detected Ca2? came from granules after fusion and
exocytosis. Further, using the measured concentration we
obtained the time-resolved release rate of Ca2? from
Cl.16A monolayers by use of a deconvolution method
developed by two of the authors (Nair and Gratzl 2005).
The Ca2? release was found to be sustained over a ten-
minute period, in contrast with the previously observed
biphasic dynamics of Isc and Cl- secretion by HT29-
Cl.16E cells over the same duration (Nair et al. 2008). In
this work we also demonstrate how the measured Ca2?
release from the mucin granules can be analyzed, together
with earlier capacitance measurements (Bertrand et al.
1999), to estimate the rate of endocytosis post simulation.
Materials and methods
Materials
Dulbecco’s modified Eagle’s medium (DMEM), Ham’s
F12, and fetal bovine serum (FBS) were bought from
Gibco (Grand Island, NY, USA). Vitrogen is a product of
Celtrix Lab (Palo Alto, CA, USA). All chemicals for the
Ca2? ion-selective electrode were purchased from Fluka
(Ronkonkoma, NY, USA). ATP, Phorbol-12-myristate-13-
acetate (PMA) and other chemicals were bought from
Sigma Chemical (St Louis, MO, USA).
Cell culture
HT29-Cl.16E and HT29-Cl.19A cells were propagated in
Falcon culture flasks (25 cm2) in a humidified atmosphere
of 95% air and 5% CO2 at 37�C. The cells were fed every
day with DMEM supplemented with 10% heat-inactivated
FBS and 4 mM L-glutamine. The passage numbers for the
reported experiments were between 30–47 and 27–35 for
HT29-Cl.16E and HT29-Cl.19A cells, respectively.
The cells were grown on Millicell-CM porous culture
inserts (area: 0.6 cm2) coated with Vitrogen�. Cl.16E cells
were seeded at a density of 1.2 9 106 per filter and Cl.19A
at a density of 0.5 9 106 per filter. The cells became
visually confluent after one week and were used for secre-
tion studies 12–18 days after seeding. The cell monolayers
had resistances of 530 ± 30 (n = 12) and 440 ± 30
(n = 4) X cm2 for Cl.16E and Cl.19A cells, respectively.
Apparatus
Electrophysiology
An Ussing-type chamber (Analytical Bioinstrumentation,
Cleveland, OH, USA) constructed to accept Millicell-CM
inserts was used for transepithelial electrophysiology
measurements. The chamber was modified to accept four
electrodes for the voltage clamp (model 558-C-5; Bioen-
gineering Department, University of Iowa, Iowa City, IA,
USA) (two apical and two basal electrodes) and an ion-
selective electrode (ISE) and reference electrode in the
apical compartment as shown in Fig. 1. Figure 1. is not
drawn to scale; the current electrodes were placed as far
from the monolayer as possible to achieve uniform current
density. The current electrode is a platinum wire 5–10 mm
in length that was bent to form a coil-like arrangement to
achieve larger surface area than the voltage electrodes. An
electrode placed close to the cell monolayer will disturb
the electric field generated by the current flow emanating
from the cells. This will generate a voltage drop in the
medium directly under the ISE parallel to the monolayer
166 Eur Biophys J (2011) 40:165–174
123

and was estimated to be *0.2 mV as discussed in Online
Resource 1.
The chamber was grounded through the voltage clamp
setup, which used an apical reference electrode indepen-
dent of the ISE reference. Fluid resistance was compen-
sated for, by using a blank Millicell-CM insert. The
potential of the Ca2? ISE during measurements was
recorded with a high-input-impedance differential ampli-
fier (PHM 84, Radiometer, Cleveland, OH, USA). The
current output from the clamp and the voltage of the ISE
were digitized and stored in a computer. During the
experiment all solutions and the chamber were maintained
at 37�C in a plexiglass incubator.
Reference electrodes and Ca2? ion-selective electrode
The reference electrodes for the voltage clamp and for
the Ca2? ISE were each made of 18-gauge shrink Teflon
tubing (Small Parts, Miami Lakes, FL, USA). One end
of the tubing was sealed with a ceramic plug. The
electrode body was back-filled with internal filling.
A Ag|AgCl (d * 1 mm) wire was inserted into the
electrode and parafilm was used to seal the electrode
body and the wire together. Further details of the fab-
rication of the reference electrode can be found else-
where (Nair et al. 2008).
Secretion of Ca2? ions was monitored with a Ca2? ISE.
The electrode body was made from hard poly(vinyl chlo-
ride) (PVC) tubing (o.d. *1.5 mm); the Ca2?-selective
liquid membrane was constructed from a cocktail of (by
wt): 1% Ca2? ionophore ETH 129, 65% 2-nitrophenyl
octyl ether, 33% high-molecular-weight PVC, and 1% K?
tetrakis(4-chlorophenyl)borate, dissolved in tetrahydrofu-
ran. The membrane was deposited by dipping one end of
the PVC tubing into the cocktail. If the membrane was not
contiguous after 10 min of drying time the dipping step
was repeated. The electrode was then allowed to dry for
4–6 h before further processing. The electrode body was
filled with 0.1 M CaCl2 and an Ag|AgCl internal reference
electrode was inserted. Finally, the fully assembled Ca2?
ISE was conditioned overnight and calibrated in low-Cl-
and low-Ca2? Ringer solution before and after each
experiment. The data were least squares fit with the Nernst
equation. Sensitivity was verified in situ by addition of
known Ca2? concentrations to the apical compartment.
Electrode response was log–linear from 10-5 to
10-1 M with a close to theoretical (30.8 mV/decade) sen-
sitivity ranging between 29.5 and 30.7 mV/decade at 37�C.
Response time (90% of total change in potential) of the ISE
was less than 20 s. The electrodes were stable over a period
of 2 h with a mean potential drift of less than 1 mV/h.
Experimental procedures
Short-circuit current (Isc) and Ca2? ISE measurements
A monolayer of Cl.16E or Cl.19A cells on Millicell-CM
filter was placed in the Ussing-type chamber. The baso-
lateral compartment was perfused with normal Ringer
solution whereas the apical compartment was perfused
with low-Ca2? (60 lM)–low-Cl- (2.1 mM) Ringer solu-
tion. Normal Ringer solution contained: 114 mM NaCl,
4 mM KCl, 1.25 mM CaCl2, 1 mM MgCl2, 10 mM
HEPES, and 25 mM D-glucose. The low-Ca2?-low-Cl-
solution contained: 114 mM Na gluconate, 4 mM K glu-
conate, 60 lM CaCl2, 1 mM MgCl2, 10 mM HEPES, and
25 mM D-glucose. The pH of the solutions was adjusted to
7.3 ± 0.1 with NaOH. The Ca2? ion-selective electrode
was positioned *50 lm above the monolayer with a
micromanipulator under visual control by first gently
touching the monolayer with the electrode and then
retracting it. Before each experiment, the voltage output of
the clamp was adjusted to zero to compensate for any
asymmetry in the voltage-sensing electrodes. The trans-
epithelial potential was clamped to zero and the short-
circuit current (Isc) measured. Perfusion of the apical
chamber was stopped for a bolus of 1 mM ATP ?
50 nM PMA added to initiate secretion and during sub-
sequent measurements. Data were collected shortly before
addition of the secretagogue and for 9–10 min after addi-
tion. The inclusion of 50 nM PMA in the ATP solution
increased the Isc response in the monolayers used in this
apical compartment
Ib
ISE reference
basal compartment
I a Va
Vb
Ca2+ ISE
Fig. 1 Experimental arrangement to monitor Ca2? release that
accompanies mucin exocytosis in a confluent monolayer of
HT29.Cl.16E cells. A standard four-electrode setup is used for
voltage clamp: Ia and Ib are current passing platinum electrodes, and
Va and Vb are Ag/AgCl electrodes with liquid junctions on the apical
and basolateral sides. The apical side of the Ussing chamber
comprised two additional electrodes: a Ca2? ISE and a ISE reference
Eur Biophys J (2011) 40:165–174 167
123

study, presumably by partially activating protein kinase C
and thereby increasing the sensitivity of secretion to puri-
nergic stimulation; 50 nM PMA by itself had no effect on
the Isc.
The experiments described in this work were conducted
under conditions of low Cl- in the apical solution and in
the presence of PMA, so the conditions for Isc measure-
ment in these studies are the same as those in previous
work (Nair et al. 2008). This allows us to verify that
electrolyte secretion in these experiments is comparable to
that in previous studies (Nair et al. 2008) and that the
increase in calcium concentration in the apical compart-
ment is not linked to some mechanistic changes in the
electrolyte secretion pathways. The identical experimental
conditions also enable us to compare the dynamics of Isc
measured in the previous work and that obtained in this
work with the dynamics of Ca2? release that is measured.
The low apical Cl- solution increases the Cl- current
(Isc) and is commonly used in similar secretory experi-
ments with bronchial cells for the same purpose (Liu et al.
2007). In addition a robust Isc signal was desirable in these
experiments for timing of cell stimulation by agonists.
Estimation of a hypothetical basal-to-apical Ca2? flux
Asymmetric Ca2? on the two sides of the monolayer
could theoretically produce a diffusional basal-to-apical
flux of Ca2?. The maximum possible diffusional flux of
Ca2? through the paracellular pathway because of this
asymmetry was modeled as established previously (Nair
et al. 2008). The predicted theoretical ISE response to
such hypothetical flux was compared with the measured
ISE potentials. The measured changes were far greater
and different in dynamics both during the baseline and
stimulated period, suggesting that, even in the worst case,
hypothetical paracellular net movement of Ca2? cannot
explain the Ca2? flux measured during stimulation.
Back-calculation of secretion flux from measured
concentration data
Diffusion of the released Ca2? from the luminal surface
of the monolayer is essentially planar in nature (Nair and
Gratzl 2005). The measured concentration can thus be
expressed as a convolution of release rate (secretory flux)
at the cells with the impulse response function of planar
diffusion at the height of the ISE above the monolayer
(Nair and Gratzl 2005). Secretion flux of Ca2? is there-
fore obtained by deconvolution of mass transport from the
measured concentration. This operation was performed
using a novel deconvolution algorithm based on function
shape optimization (Nair and Gratzl 2005). Important
experimental conditions for the deconvolution are the
diffusion constant for Ca2? (0.79 9 10-5 cm2 s-1; from
Part and Lock 1983) and the distance of the ISE from the
cell monolayer (*50 lm). This distance of *50 lm is
5–7 times of the cellular diameter and is chosen to
average the signal from several cells while retaining
sufficient signal and time resolution to extract useful
information.
Results
The HT29-Cl.16E cell line secretes mucins and electrolytes
when stimulated by luminal ATP (Merlin et al. 1994, 1996;
Bertrand et al. 1999) and thus provides a model for iden-
tifying biological processes associated specifically with
mucin release from epithelia. The sister cell line HT29-
Cl.19A secretes electrolytes in response to stimulation but
lacks secretory granules (Merlin et al. 1996) and hence
serves as a control. The experimental arrangement used to
measure Ca2? efflux during mucin secretion comprised a
Ca2? ISE and a reference electrode in the apical com-
partment in addition to the voltage and current electrodes
used for short circuit current (Isc) measurements, as shown
in Fig. 1. The ISE is placed at a distance of *50 lm from
the cell monolayer with its reference electrode remotely
positioned. In the experiments reported here significant
secretion of Ca2? from mucin granules of Cl.16E cells was
observed. The level and time course of Ca2? secretion
provided time-resolved information on the degranulation
process and its dynamics.
Purinergic stimulation of a monolayer of Cl.16E cells
that contain mucin granules
Addition of 1 mM ATP ? 50 nM phorbol-12-myristate-
13-acetate (PMA) to the apical compartment of the Ussing
chamber led to an immediate increase in Isc (Fig. 2a, solid
line). After a lag of *1 min the Ca2? ISE potential also
began to increase (not shown), indicating an increase in
Ca2? concentration (Fig. 2b, solid line) *50 lm from the
cells. The average maximum potential change in response
to stimulation was 8.5 ± 3.5 mV (n = 8).
This implies an increase in Ca2? concentration of
53.5 ± 14.6 lM above the baseline level of 60 lM. The
Ca2? flux density at the cell monolayer, indicated as a solid
line in Fig. 2c, was computed by deconvolution of diffu-
sional mass transport from the measured concentration, as
briefly explained in the section ‘‘Back-calculation of
secretion flux from measured concentration data’’. Further
details of the deconvolution method can be found else-
where (Nair and Gratzl 2005). The data for Cl.16E cells
shown in Fig. 2 are from an experiment that is represen-
tative of experiments on eight separate filters.
168 Eur Biophys J (2011) 40:165–174
123
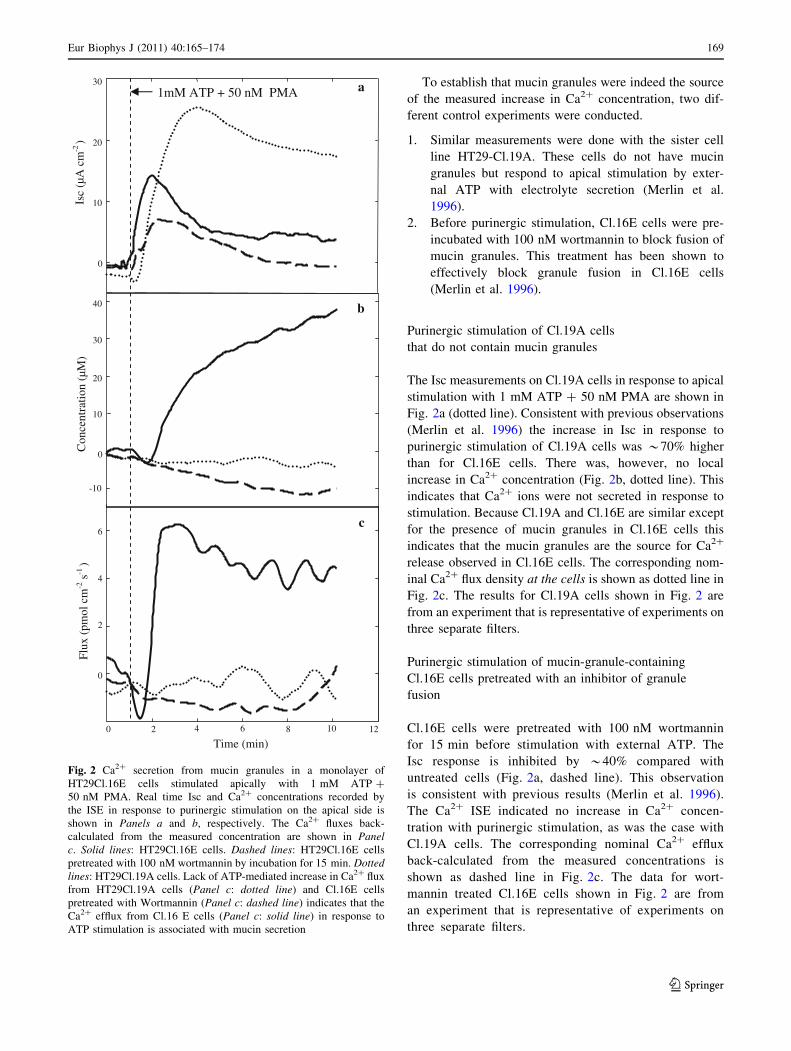
To establish that mucin granules were indeed the source
of the measured increase in Ca2? concentration, two dif-
ferent control experiments were conducted.
1. Similar measurements were done with the sister cell
line HT29-Cl.19A. These cells do not have mucin
granules but respond to apical stimulation by exter-
nal ATP with electrolyte secretion (Merlin et al.
1996).
2. Before purinergic stimulation, Cl.16E cells were pre-
incubated with 100 nM wortmannin to block fusion of
mucin granules. This treatment has been shown to
effectively block granule fusion in Cl.16E cells
(Merlin et al. 1996).
Purinergic stimulation of Cl.19A cells
that do not contain mucin granules
The Isc measurements on Cl.19A cells in response to apical
stimulation with 1 mM ATP ? 50 nM PMA are shown in
Fig. 2a (dotted line). Consistent with previous observations
(Merlin et al. 1996) the increase in Isc in response to
purinergic stimulation of Cl.19A cells was *70% higher
than for Cl.16E cells. There was, however, no local
increase in Ca2? concentration (Fig. 2b, dotted line). This
indicates that Ca2? ions were not secreted in response to
stimulation. Because Cl.19A and Cl.16E are similar except
for the presence of mucin granules in Cl.16E cells this
indicates that the mucin granules are the source for Ca2?
release observed in Cl.16E cells. The corresponding nom-
inal Ca2? flux density at the cells is shown as dotted line in
Fig. 2c. The results for Cl.19A cells shown in Fig. 2 are
from an experiment that is representative of experiments on
three separate filters.
Purinergic stimulation of mucin-granule-containing
Cl.16E cells pretreated with an inhibitor of granule
fusion
Cl.16E cells were pretreated with 100 nM wortmannin
for 15 min before stimulation with external ATP. The
Isc response is inhibited by *40% compared with
untreated cells (Fig. 2a, dashed line). This observation
is consistent with previous results (Merlin et al. 1996).
The Ca2? ISE indicated no increase in Ca2? concen-
tration with purinergic stimulation, as was the case with
Cl.19A cells. The corresponding nominal Ca2? efflux
back-calculated from the measured concentrations is
shown as dashed line in Fig. 2c. The data for wort-
mannin treated Cl.16E cells shown in Fig. 2 are from
an experiment that is representative of experiments on
three separate filters.
a
Time (min)
Flux
(pm
ol c
m-2
s-1
)
0 2 4 6 8 10 12
6
4
2
0
c
Isc
(µA
cm
-2)
0
10
20
30 1mM ATP + 50 nM PMA
b 40
Con
cent
ratio
n (µ
M)
0
20
30
10
-10
Fig. 2 Ca2? secretion from mucin granules in a monolayer of
HT29Cl.16E cells stimulated apically with 1 mM ATP ?
50 nM PMA. Real time Isc and Ca2? concentrations recorded by
the ISE in response to purinergic stimulation on the apical side is
shown in Panels a and b, respectively. The Ca2? fluxes back-
calculated from the measured concentration are shown in Panelc. Solid lines: HT29Cl.16E cells. Dashed lines: HT29Cl.16E cells
pretreated with 100 nM wortmannin by incubation for 15 min. Dottedlines: HT29Cl.19A cells. Lack of ATP-mediated increase in Ca2? flux
from HT29Cl.19A cells (Panel c: dotted line) and Cl.16E cells
pretreated with Wortmannin (Panel c: dashed line) indicates that the
Ca2? efflux from Cl.16 E cells (Panel c: solid line) in response to
ATP stimulation is associated with mucin secretion
Eur Biophys J (2011) 40:165–174 169
123
Discussion
Comparison of calcium secretion from Cl.16E cells,
Cl.19A cells, and Cl.16E cells pretreated
with wortmannin
The experiments with HT29 clones that differ in mucin
secretory capacity and with inhibitors of mucin secretion in
HT29 Cl.16E revealed large changes in the ratio of Ca2?
secretion to Isc, indicating that mucin granules are the
source of a local increase in Ca2? concentration when
Cl.16E cells are stimulated with apical ATP. Thus the
back-calculated Ca2? flux contains information about
exocytosis of mucin granules. Future work will be required
to determine with greater precision the delay of Ca2?
secretion relative to Isc and to determine the causes.
Causes could be technical (e.g., response time of electrode)
or biological (e.g., delay of granule fusion and release of
Ca2? secretion to Cl- secretion across the plasma
membrane).
Comparison of calcium secretion from Cl.16E cells
with Isc and previously measured chloride secretion
from the same cell line
It is noteworthy that the dynamics of Ca2? secretion is
different from the dynamics of Cl- secretion measured in
previous studies (Nair et al. 2008). The Cl- secretion more
closely follows the dynamics of the simultaneously mea-
sured Isc. This close coupling is expected as Cl- move-
ment through apical channels is associated with a
transepithelial current. Conversely a lag in Ca2? secretion
is consistent with granule fusion and release of intragran-
ular Ca2? which would not contribute to a transepithelial
current. Furthermore, only a part of cellular Cl- secretion,
namely the wortmannin-sensitive portion (*40% of Isc) is
associated with granule fusion and mucin exocytosis
(Merlin et al. 1996). Activation of Cl- channels in the
constitutive plasma membrane would be expected to
immediately contribute to Isc whereas contributions from
activated Cl- channels in the granule membrane would
have to wait for granule fusion to functionally become part
of the plasma membrane.
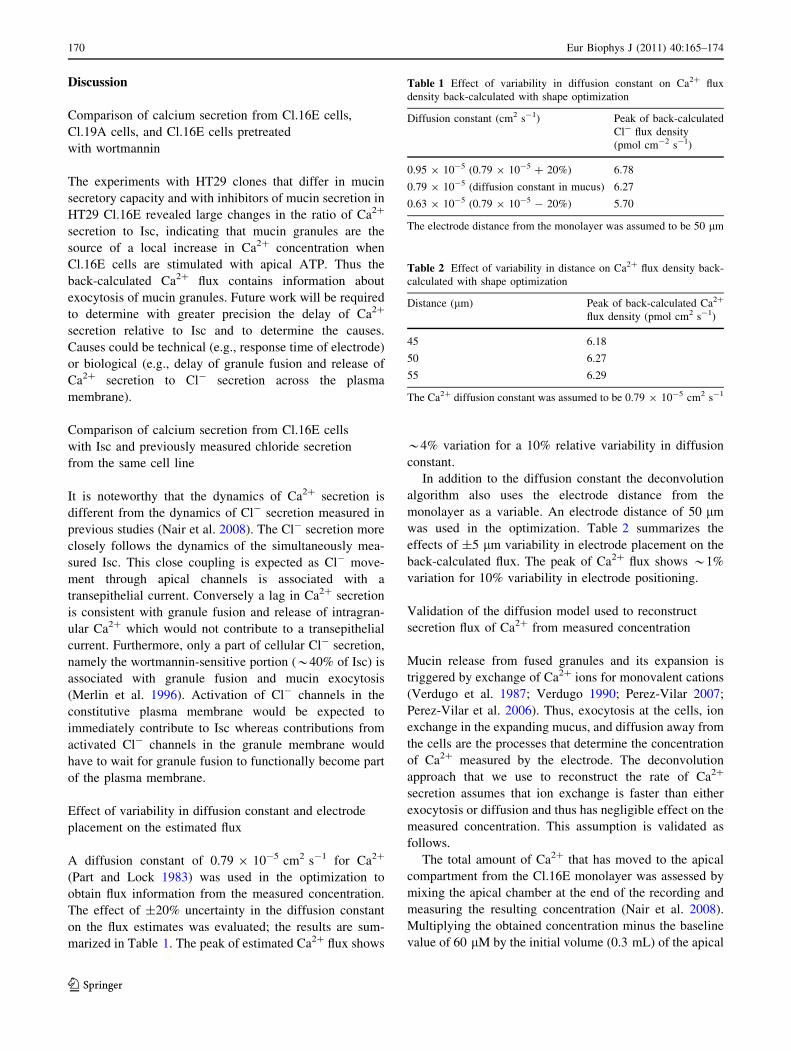
Effect of variability in diffusion constant and electrode
placement on the estimated flux
A diffusion constant of 0.79 9 10-5 cm2 s-1 for Ca2?
(Part and Lock 1983) was used in the optimization to
obtain flux information from the measured concentration.
The effect of ±20% uncertainty in the diffusion constant
on the flux estimates was evaluated; the results are sum-
marized in Table 1. The peak of estimated Ca2? flux shows
*4% variation for a 10% relative variability in diffusion
constant.
In addition to the diffusion constant the deconvolution
algorithm also uses the electrode distance from the
monolayer as a variable. An electrode distance of 50 lm
was used in the optimization. Table 2 summarizes the
effects of ±5 lm variability in electrode placement on the
back-calculated flux. The peak of Ca2? flux shows *1%
variation for 10% variability in electrode positioning.
Validation of the diffusion model used to reconstruct
secretion flux of Ca2? from measured concentration
Mucin release from fused granules and its expansion is
triggered by exchange of Ca2? ions for monovalent cations
(Verdugo et al. 1987; Verdugo 1990; Perez-Vilar 2007;
Perez-Vilar et al. 2006). Thus, exocytosis at the cells, ion
exchange in the expanding mucus, and diffusion away from
the cells are the processes that determine the concentration
of Ca2? measured by the electrode. The deconvolution
approach that we use to reconstruct the rate of Ca2?
secretion assumes that ion exchange is faster than either
exocytosis or diffusion and thus has negligible effect on the
measured concentration. This assumption is validated as
follows.
The total amount of Ca2? that has moved to the apical
compartment from the Cl.16E monolayer was assessed by
mixing the apical chamber at the end of the recording and
measuring the resulting concentration (Nair et al. 2008).
Multiplying the obtained concentration minus the baseline
value of 60 lM by the initial volume (0.3 mL) of the apical
Table 1 Effect of variability in diffusion constant on Ca2? flux
density back-calculated with shape optimization
Diffusion constant (cm2 s-1) Peak of back-calculated
Cl- flux density
(pmol cm-2 s-1)
0.95 9 10-5 (0.79 9 10-5 ? 20%) 6.78
0.79 9 10-5 (diffusion constant in mucus) 6.27
0.63 9 10-5 (0.79 9 10-5 - 20%) 5.70
The electrode distance from the monolayer was assumed to be 50 lm
Table 2 Effect of variability in distance on Ca2? flux density back-
calculated with shape optimization
Distance (lm) Peak of back-calculated Ca2?
flux density (pmol cm2 s-1)
45 6.18
50 6.27
55 6.29
The Ca2? diffusion constant was assumed to be 0.79 9 10-5 cm2 s-1
170 Eur Biophys J (2011) 40:165–174
123
medium and neglecting possible fluid secretion, the net
change in Ca2? content during the entire experiment could
be estimated. The total amount of secreted Ca2? thus
obtained was *1.77 ± 0.06 nmol per filter (filter
area = 0.6 cm2) over the measurement time of 10 min
(n = 8). This amount can also be estimated from the
integral of the computed flux and was found to be
*1.86 nmol per filter for the 10 min duration of the
experiment analyzed in Fig. 2. If ion exchange was slow
enough to significantly affect the measured concentration,
the total cumulative Ca2? efflux computed from continuous
ISE recording using a model based purely on diffusion
would differ from physical measurement of the total final
Ca2? increase by much more than 5%. This confirms that it
is diffusion of Ca2? from the cells to the sensor and not ion
exchange that is rate limiting once the granule contents are
exocytosed. Hence back-calculated Ca2? flux is directly
related to the exocytosis rate.
The good agreement between the total cumulative Ca2?
efflux computed from continuous recording of Ca2? con-
centrations and physical measurement of total Ca2?
released at the end of the experiment is indicative of the
robustness of the approach and validates the diffusion
constant and electrode distance from the monolayer used in
the optimization.
Dynamics of calcium secretion compared
with measured change in capacitance
Previously, the net increase in membrane surface area due
to purinergically stimulated mucin exocytosis in Cl.16E
cells was monitored by means of membrane capacitance
measurements (Bertrand et al. 1999). The change in
capacitance in response to stimulation with different levels
of ATP was measured together with Isc and DC resistance.
The dynamics and amplitude of Isc in response to
3 mM ATP are closest to those obtained in this work, so
the capacitance change in response to this stimulation was
therefore used for comparison with the Ca2? flux. We note
that there could be discrepancies because of possible var-
iability in the cultures, and the difference in ATP con-
centration used for stimulation. We nevertheless feel that it
is useful to analyze the back-calculated Ca2? flux on the
basis of the capacitance data to derive principles that could
be used to obtain greater insight into the process of
exocytosis.
The measured change in total capacitance in response to
stimulation contains information about both the basolateral
and apical capacitance, but only the latter is affected by
exocytosis. The apical capacitance can be obtained from
the measured total capacitance as described elsewhere
(Bertrand et al. 1999). It increases upon stimulation and
reaches a peak value after approximately 3 min. It then
undergoes rapid decay to approximately half of the peak
value by 10 min post stimulation. It takes *30 min for the
apical capacitance to return to its basal value.
The back-calculated secretion flux of Ca2?, as deter-
mined in this work, also reaches a peak within approx-
imately the same time frame as the apical capacitance
does. Ca2? flux then decreases to *70% of its peak
value *10 min after stimulation. Thus, Ca2? secretion
is likely to be sustained significantly longer than the
10-min duration of the experiments reported here. Its
decay, however, seems to be significantly slower than the
rate of decay in apical capacitance. This implies that
endocytosis is significant during secretion and therefore
its effect must be taken into account when interpreting
the findings.
The peak in apical capacitance indicates that endocy-
tosis rate also increases in response to stimulation but it
takes about 3 min for it to ‘‘catch up’’ with the rate of
exocytosis, because at the peak the two rates must be equal.
This is followed by a period when the rate of endocytosis is
higher than the rate at which membrane is added by exo-
cytosis. During this time both endocytosis and exocytosis
rates continue to remain higher than the basal rates. It takes
*30 min for the membrane surface area to return to its
basal value. Thirty minutes after stimulation the exocytosis
and endocytosis rates are once again equal, possibly
reaching basal levels.
Estimate of Ca2? concentration in mucin granules
of HT29.Cl.16E cells
Previously the peak in capacitance of the apical membrane
3 min after stimulation was estimated to correspond to
fusion of a minimum number of 42 and a maximum of 172
granules (1 lm in diameter) per goblet cell for a goblet cell
density of 800,000 cells cm-2 (Bertrand et al. 1999). The
back-calculated Ca2? flux added up to 3 min can be used as
an estimate of the amount of Ca2? that was released during
this period from the granules as a result of exocytosis. This
information can then be translated to Ca2? concentration in
a granule by use of Eq. (1):
½Ca2þ�granule ¼ 1�ðSgoblet�NT �VgranuleÞ
ZT
0
FluxCa2þdt ð1Þ
where t = 0 corresponds to the point of stimulation,
T = 3 min, Sgoblet (800,000 cells cm-2) is the goblet cell
density, NT (42 or 172) is total number of granule fusions in
time T (3 min) after stimulation, Vgranule (0.52 9 10-12 cc;
assuming spherical granules with diameter of 1 lm) is the
volume of a granule, and FluxCa2þ is the back-calculated
Ca2? secretion flux. The total amount of Ca2? released
*3 min after stimulation is 0.7 nmol cm-2.
Eur Biophys J (2011) 40:165–174 171
123
On the basis of Eq. (1), a capacitance peak that results
from fusion of 42 granules would correspond to an intra-
granular Ca2? concentration of 40 mM. If the capacitance
peak was the result of 172 granule fusions the intragranular
Ca2? concentration would be 10 mM.
The estimates of the number of granule fusions used in
these calculations were based on the measured ‘‘net’’
increase in apical capacitance which does not account for
concurrent endocytosis. Taking endocytosis into account
the number of granule fusions could be much higher than
the net capacitance increase would indicate. As represented
in Eq. (1), this would also translate into lower intragranular
Ca2? concentrations.
How low the estimate of intragranular Ca2? concentra-
tion can be will depend on the total number of granule
fusions over the measurement time period and the avail-
ability of granules per cell. An intragranular Ca2? con-
centration of 10 mM corresponds to 550 granule fusions
over the 10 min measurement time as estimated from Eq.
(1), for T = 10 min. The potential number of 1 lm
diameter granules in a typical goblet cell 30 lm in height
and 6–8 lm in diameter, where the granules occupy one-
fourth to one-third of the cell, was calculated to range from
410 to 960 (these estimates are adapted from the work done
by Davis et al. 1992). The dynamics of back-calculated flux
and the earlier capacitance measurements both point
towards significant granule fusion even 15–20 min after
stimulation. All of these, taken together, indicate that Ca2?
concentration inside the granule could be 10 mM or lower
when 60–80% or more of the available granule pool is
exocytosed. The calcium concentration inside mucin
granules is therefore estimated to range from 10 to
40 mM. This is in agreement with reported calcium con-
centrations inside zymogen granules (*15 mM; Raraty
et al. 2000) and secretory granules (from 1 to 200 mM;
Nicaise et al. 1992).
Equation (1) above uses goblet cell density and granule
diameter as variables and hence any variations in their
values will affect the concentration estimates as discussed
below. Equation (1) can be thought of as a simple algebraic
equation with an inverse relationship between goblet cell
density and calcium concentration inside the granule. It can
be easily derived that a 20% increase in goblet cell density
will reduce the estimate of calcium concentration by
16.7%. The estimate for calcium concentration will, on the
other hand, increase by 25% for a 20% decrease in goblet
cell density.
We also note that estimates of calcium concentration
inside the granule would differ significantly for even minor
variations in cell size and granule diameter. For example,
the possible number of 1.5 lm diameter granules for the
same goblet cell dimensions as described above would
range from 120 to 284. In this case the estimated Ca2?
concentration inside the granule will be closer to the upper
limit of 40 mM.
Reconstruction of endocytosis from measured Ca2?
flux and capacitance change
The increase in apical capacitance over the baseline (DCA)
in response to stimulation, obtained from the measured
total capacitance, indicates the net change in apical mem-
brane surface area. This is the difference between capaci-
tance because of addition of membrane surface by
exocytosis (Cexo) and that corresponding to membrane
surface removed by endocytosis (Cendo), as shown in
Eq. (2).
DCA ¼ Cexo � Cendo ð2Þ
In Eq. (2), DCA ¼ 1�
C�1T � C�1
B
� �� CbaselineA , where CT and
CB are the total capacitance and basolateral capacitance,
respectively, and CbaselineA is the baseline apical capacitance.
As explained above, the rate of exocytosis is what pre-
dominantly limits the rate of release of Ca2?. Hence the
back-calculated flux is directly proportional to the exocy-
tosis rate. Equation (2) can therefore be re-written in terms
of back-calculated flux as follows:
DCAðtÞ ¼ CexoðtÞ � CendoðtÞ
¼ kRt
0
FluxCa2þdt
,
½Ca2þ�granule � Vgranule
� �
� CendoðtÞ ð3Þ
In Eq. (3), k is the capacitance corresponding to the fusion
of a single granule, which was estimated to be 31fF
(Bertrand et al. 1999), and FluxCa2þ is the back-calculated
Ca2? secretion flux. Hence a median intragranular Ca2?
concentration of 25 mM was used in Eq. (4):
CendoðtÞ ¼ kRt
0
FluxCa2þdt
,
½Ca2þ�granule � Vgranule
� �
� DCAðtÞ ð4Þ
to reconstruct Cendo from back-calculated flux for a median
basolateral capacitance of 15 lF cm-2. Median basolateral
capacitance was determined from previously reported
(Bertrand et al. 1999) minimum and maximum estimates of
5 and 25 lF cm-2. The corresponding exocytosis, endo-
cytosis, and change in apical capacitance are shown in
Fig. 3. In Eqs. (3) and (4) t represents time and is a running
variable with a limit of 0–10 min (the entire measurement
period).
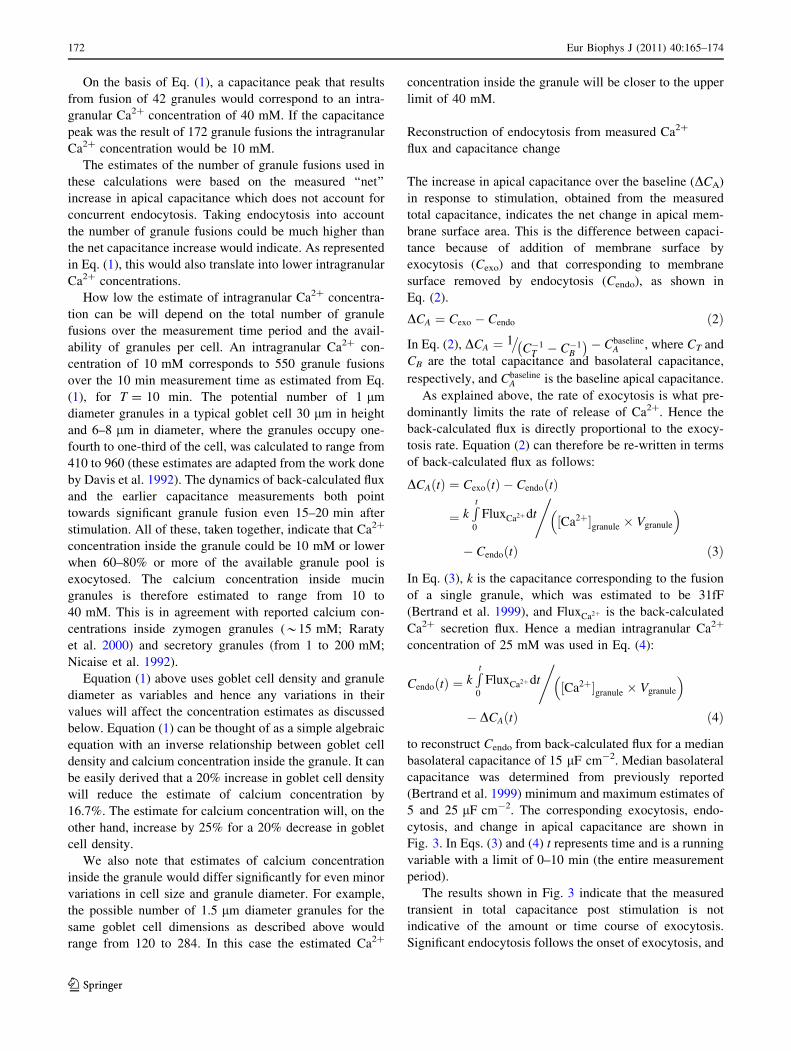
The results shown in Fig. 3 indicate that the measured
transient in total capacitance post stimulation is not
indicative of the amount or time course of exocytosis.
Significant endocytosis follows the onset of exocytosis, and
172 Eur Biophys J (2011) 40:165–174
123
degranulation and retrieval of the granule membrane con-
tinue at a rate that slowly decreases over a long time during
which apical capacitance decays significantly.
The basal endocytosis for the results shown in Fig. 3 is
*0.012 pFcell-1; endocytosis corresponding to the peak
of the apical capacitance is 0.9 pFcell-1. Basal endocytosis
and that corresponding to ATP stimulation in HT29.Cl.16E
cells are reported to range from 0.02–0.06 to 0.08–
0.33 pFcell-1, respectively. The results for endocytosis
reported by Bertrand et al. (2006) are not expressed as a
function of time and, therefore, cannot be directly com-
pared with the results presented in this work. It is however
noteworthy that the order of magnitude of endocytosis data
reported by Bertrand et al. are comparable with those
estimated in this work, despite the different methods used.
Conclusions
The experimental approach using an ion-selective elec-
trode for measuring Ca2? at the cells together with the
capability of translating the measured concentration into
flux have made it possible in this work to obtain the
dynamics of Ca2? release from mucin granules from an
intact epithelial cell monolayer in a physiologically rele-
vant Ussing chamber arrangement. The release rate of
Ca2? can be used to estimate the rate of degranulation.
Independent information on degranulation is contained in
the time course of measured total capacitance. This work
demonstrates how the back-calculated flux together with
capacitance data can be used to obtain information about
intragranular calcium content, and endocytosis in response
to stimulation.
The results presented in this work are the first quanti-
tative real time-data on Ca2? release from mucin granules
in a confluent epithelial cell monolayer. The method for
reconstructing the rates of concurrent exocytosis and
endocytosis using release rate and capacitance as two
pieces of independent information is also presented here
for the first time, and can find applications in other contexts
of cell physiology.
Acknowledgments The authors thank Mabintou Traore for per-
forming early feasibility studies. This work was supported by funds
from the National Institute of Health (Grant CA-61860 to MG), the
Cystic Fibrosis Foundation (grants HOPFER99PO to UH and G813 to
MG), and the Ohio Board of Regents Innovation Incentive Fellowship
award to SN.
References
Bertrand CA, Laboisse CL, Hopfer U (1999) Purinergic and
cholinergic agonists induce exocytosis from the same granule
pool in HT29-Cl.16E monolayers. Am J Physiol 276:C907–C914
Bertrand CA, Laboisse C, Hopfer U, Bridges RJ, Frizzell RA (2006)
Methods for detecting internalized, FM 1–43 stained particles in
epithelial cells and monolayers. Biophys J 91:3872–3883. doi:
10.1529/biophysj.106.086983
Davis CW, Dowell ML, Lethem M, Van Scott M (1992) Goblet cell
degranulation in isolated canine tracheal epithelium: response to
exogenous ATP, ADP, and adenosine. Am J Physiol 262:C1313–
C1323
Kuver R, Klinkspoor JH, Osborne WRA, Lee SP (2000) Mucous
granule exocytosis and CFTR expression in gallbladder epithe-
lium. Glycobiology 10:149–157
Liu X, Luo M, Zhang L, Ding W, Yan Z, Engelhardt JF (2007)
Bioelectric properties of chloride channels in human, pig, ferret,
and mouse airway epithelia. Am J Respir Cell Mol Biol
36(3):313–323. doi:10.1165/rcmb.2006-0286OC
2 0 4 6 8 10
Time (min)
1
2
3
4
5
6 ΔC
apac
itanc
e (µ
Fcm
-2)
Exocy
tosis
Endoc
ytos
is Apical Capacitance
0
12
Fig. 3 Change in apical capacitance together with capacitance
change that corresponds to exocytosis and endocytosis in response
to apical purinergic stimulation. The change in apical capacitance was
estimated from previously measured capacitance change in response
to stimulation (Bertrand et al. 1999). Back-calculated flux was
translated to capacitance added because of exocytosis, as shown in
Eq. (3). The earlier (Bertrand et al. 1999) capacitance measurements
were sparsely sampled with the shortest and longest time intervals
between measurements being 30 and 60 s, respectively. The ISE
measurements on the other hand were evenly sampled at 1-s intervals
throughout the 10 min measurement period. (Note: The 1 s sampling
rate that is used is much higher than that warranted by the 20 s
response time of the electrode alone. The higher response time is
justified by the fact that in order to estimate fluxes from the measured
concentration a deconvolution operation needs to be performed. We
have shown (Nair and Gratzl 2008) that to correctly reconstruct fluxes
from measured concentrations the Nyquist criterion for the impulse
response of diffusion must also be satisfied. The 1 s sampling rate that
is used is just sufficient to satisfy the Nyquist criterion for the impulse
response of diffusion.) Hence the apical capacitance data obtained
from the measured total capacitance had to be interpolated every 1 s
and smoothed using the Savitsky and Golay (1964) procedure before
use in Eq. (4), to estimate the capacitance removed because of
endocytosis. Interpolation and smoothing was done using ‘‘interp1’’
and ‘‘sgolay’’ functions, respectively, available in Matlab 7.0.4,
Release 14 (The Mathworks, Natick, MA, USA). A second-order
filter with a window length of seventy-five data points was used for
smoothing
Eur Biophys J (2011) 40:165–174 173
123
Marszalek PE, Farrell B, Verdugo P, Fernandez JM (1997) Kinetics
of release of serotonin from isolated secretory granules. II. Ion
exchange determines the diffusivity of serotonin. Biophys J
73:1169–1183
Merlin D, Augeron C, Tien XY, Guo X, Laboisse CL, Hopfer U
(1994) ATP- stimulated electrolyte and mucin secretion in the
human intestinal goblet cell line HT29-Cl.16E. J Membr Biol
137:137–149
Merlin D, Guo X, Martin K, Laboisse CL, Landis D, Dubyak G,
Hopfer U (1996) Recruitment of purinergically stimulated Cl-
channels from granule membrane to plasma membrane. Am J
Physiol 271:C612–C619
Moniaux N, Escande F, Porchet N, Aubert JP, Batra SK (2001)
Structural organization and classification of the human mucin
genes. Front Biosci 6:D1192–D1206
Nair S, Gratzl M (2005) Deconvolution of concentration recordings at
live cell preparations via shape error optimization. Anal Chem
77:2875–2881. doi:10.1021/ac048229a
Nair SP, Gratzl M (2008) Effects of sampling rate on the interpre-
tation of cellular transport measurements. Anal Chem
80:7684–7689. doi:10.1021/ac800842m
Nair S, Kashyap R, Laboisse CL, Hopfer U, Gratzl M (2008) Time
resolved secretion of chloride from a monolayer of mucin-
secreting epithelial cells. Eur Biophys J 37:411–419. doi:
10.1007/s00249-007-0226-3
Nguyen T, Chin WC, Verdugo P (1998) Role of Ca2?/K? ion
exchange in intracellular storage and release of mucin. Nature
395:908–912. doi:10.1038/27686
Nicaise G, Maggio K, Thirion S, Horoyan M, Keicher E (1992) The
calcium loading of secretory granules. A possible key event in
stimulus-secretion coupling. Biol Cell 75(2):89–99
Part P, Lock RA (1983) Diffusion of calcium, cadmium and mercury
in a mucous solution from rainbow trout. Comp Biochem
Physiol C 76:259–263
Paz HB, Tisdale AS, Danjo Y, Spurr-Michaud SJ, Argueso P, Gipson
IK (2003) The role of calcium in mucin packaging within goblet
cells. Exp Eye Res 77:69–75. doi:10.1016/S0014-4835(03)
00084-8
Perez-Vilar J (2007) Mucin granule intraluminal organization. Am J
Respir Cell Mol Biol 36:183–190. doi:10.1165/rcmb.2006-
0291TR
Perez-Vilar J, Mabolo R, McVaugh CT, Bertozzi CR, Boucher RC
(2006) Mucin granule intraluminal organization in living
mucous/goblet cells roles of protein post-translational modifica-
tions and secretion. J Biol Chem 281:4844–4855. doi:10.1074/
jbc.M510520200
Quesada I, Chin WC, Steed J, Campos-Bedolla P, Verdugo P (2001)
Mouse mast cell secretory granules can function as intracellular
ionic oscillators. Biophys J 80:2133–2139
Raraty M, Ward J, Erdemli G, Vaillant C, Neoptolemos JP, Sutton R,
Petersen OH (2000) Calcium-dependent enzyme activation and
vacuole formation in the apical granular region of pancreatic
acinar cells. PNAS 97(24):13126–13131
Rogers DF, Barnes PJ (2006) Treatment of airway mucus hypersecre-
tion. Ann Med 38:116–125. doi:10.1080/07853890600585795
Savitsky A, Golay MJE (1964) Smoothing and differentiation of data
by simplified least squares procedures. Anal Chem 36:1627–
1639. doi:10.1021/ac60214a047
Verdugo P (1990) Goblet cell secretion and mucogenesis. Ann Rev
Physiol 52:157–176. doi:10.1146/annurev.ph.52.030190.001105
Verdugo P (1991) Mucin exocytosis. Am Rev Respir Dis 144:S33–
S37
Verdugo P, Deyrup-Olsen I, Aitken M, Villalon M, Johnson D (1987)
Molecular mechanism of mucin secretion: I. The role of
intragranular charge shielding. J Dent Res 66:506–508. doi:
10.1177/00220345870660022001
174 Eur Biophys J (2011) 40:165–174
123
Copyright © 2022 FDOKUMEN