Size-dependent quantized double layer charging of monolayer-protected silver nanoparticles
7
This journal is © The Royal Society of Chemistry and the Centre National de la Recherche Scientifique 2014 New J. Chem., 2014, 38, 1761--1767 | 1761 Cite this: New J. Chem., 2014, 38, 1761 Size-dependent quantized double layer charging of monolayer-protected silver nanoparticles† Vijay Raman Chaudhari,* ab P. A. Hassan c and Santosh Krishna Haram b Size-dependent quantized double layer (QDL) charging of dodecanethiol monolayer-protected diffusing silver nanoparticles (MP-AgNPs) is reported. Multiple periodic peaks in the differential pulse voltammograms were observed for the MP-AgNPs in a size range of 2.7 nm to 5 nm and these are attributed to the QDL charging of monolayer-protected clusters. The potential difference between successive peaks decreases with an increase in the MP-AgNPs’ size. The potential of zero charge (E PZC ) as a function of size was determined from the intercept of a Z-plot, which shifted towards more negative potential with increasing size. Voltammetric measurements on smaller size MP-AgNPs (1.7 nm) did not show any QDL charging peaks due to the oxide layer associated with them. 1 Introduction Metal nanoparticles (NPs) have attracted immense research attention due to the size quantization effect (SQE) by which they show molecule-like behavior in the 1–2 nm size regime. 1 Moreover, their large surface-to-volume ratio leads to a sub- stantial contribution of surface electronic structure to the overall electronic properties. 2–4 Both these effects have opened up interesting possibilities for uses in biolabeling, 5 lumines- cence tagging, 6 catalysis, 7 electronic 8 and sensor 9 applications. NPs inherently capped with a monolayer of alkyl thiols/amines are also referred as ‘Monolayer Protected Clusters’ (MPCs). The sub-attofarad (10 18 farad) capacitance associated with MPCs leads to yet another interesting property, i.e. ‘coulombic stair- case’ and ‘coulombic blockade’ behavior, originally observed during tunneling experiments on an isolated NP. 10,11 A similar phenomenon is further realized through voltammetry on MPCs dispersed in polar solvents (diffusing electrodes) 12–14 and known as quantized double layer (QDL) charging. 15 Voltammetric measure- ments on MPCs are also carried out by immobilizing the NPs on the electrode surface. 16 As the mathematical modelling in voltam- metry is based on Fick’s diffusion law, the ‘diffusing electrode’ simplifies an interpretation of the results. Most of the knowledge in this field to date is based on Au-MPCs, due to their exceptional dispersibility and their solution stability. The gross understanding of QDL phenomena, how- ever, demands experiments on soluble noble metal MPCs other than gold. Efforts have been made for a few nanomaterials, viz. Ag, 16,17 Cu, 18 Rh, 13 Pd 19 and more recently for graphene quantum dots (GQD). 20 Interestingly, varied sizes of GQD show multiple redox behaviors corresponding to single electron charging. Unlike Au-MPCs, difficulties have been found in observing the QDL phenomenon with Ag-MPCs. 21 Similar limi- tations have also been reported for Cu-MPCs due to sponta- neous oxidation, which is facilitated in the lower size regime. 18 Except for Au-MPCs and GQD, the remaining reports discussed the QDL behavior for specific sizes only and significant under- standing requires detailed investigations for a wide size range. To our knowledge, there is only one report which dealt with QDL measurements on thiolate-protected Ag-MPCs of 2.1 nm in size. 17 A general observation about Ag-MPCs indicates that the presence of an oxide layer on the MPC core hampers the QDL response. The oxidation of AgNPs is more facile at smaller sizes due to the high surface energy. Therefore, it would be of immense interest to study this effect as a function of size, by which the contribution from silver oxide in the QDL measure- ments can be resolved. The voltammetric techniques are sensi- tive to the surface chemical composition, and thus can readily be used for this purpose. Here, we report size-dependent differential pulse voltam- metric (DPV) investigations on the dispersion of thiolate- protected silver nanoparticles. The predominant oxide phase in the smaller size regime is found to be responsible for the suppression of the QDL property. For the first time, the point of zero charge (E PZC ) as a function of size for silver nanoparticles is estimated through DPV. a Department of Nanoscience and Nanotechnology, University Institute of Chemical Technology, North Maharashtra University, Jalgaon – 425 001, India. E-mail: [email protected]; Tel: +91-257-2258420 b Department of Chemistry, Center for Nanoscience, University of Pune, Ganeshkhind, Pune – 411007, India c Chemistry Division, Bhabha Atomic Research Centre, Mumbai 400085, India † Electronic supplementary information (ESI) available: Fig. S1: thermogravi- metric analysis (TGA), Fig. S2: differential pulse voltammogram, and procedures for the synthesis and size selective separation of MP-AgNPs, and detailed phase analysis from XRD data. See DOI: 10.1039/c3nj01077e Received (in Montpellier, France) 10th September 2013, Accepted 21st January 2014 DOI: 10.1039/c3nj01077e www.rsc.org/njc NJC PAPER Published on 22 January 2014. Downloaded by University of Notre Dame on 08/04/2014 17:06:32. View Article Online View Journal | View Issue
-
Upload
independent -
Category
Documents
-
view
4 -
download
0
Transcript of Size-dependent quantized double layer charging of monolayer-protected silver nanoparticles

This journal is©The Royal Society of Chemistry and the Centre National de la Recherche Scientifique 2014 New J. Chem., 2014, 38, 1761--1767 | 1761
Cite this: NewJ.Chem., 2014,
38, 1761
Size-dependent quantized double layer chargingof monolayer-protected silver nanoparticles†
Vijay Raman Chaudhari,*ab P. A. Hassanc and Santosh Krishna Haramb
Size-dependent quantized double layer (QDL) charging of dodecanethiol monolayer-protected diffusing
silver nanoparticles (MP-AgNPs) is reported. Multiple periodic peaks in the differential pulse
voltammograms were observed for the MP-AgNPs in a size range of 2.7 nm to 5 nm and these are
attributed to the QDL charging of monolayer-protected clusters. The potential difference between
successive peaks decreases with an increase in the MP-AgNPs’ size. The potential of zero charge (EPZC)
as a function of size was determined from the intercept of a Z-plot, which shifted towards more
negative potential with increasing size. Voltammetric measurements on smaller size MP-AgNPs (1.7 nm)
did not show any QDL charging peaks due to the oxide layer associated with them.
1 Introduction
Metal nanoparticles (NPs) have attracted immense researchattention due to the size quantization effect (SQE) by whichthey show molecule-like behavior in the 1–2 nm size regime.1
Moreover, their large surface-to-volume ratio leads to a sub-stantial contribution of surface electronic structure to theoverall electronic properties.2–4 Both these effects have openedup interesting possibilities for uses in biolabeling,5 lumines-cence tagging,6 catalysis,7 electronic8 and sensor9 applications.NPs inherently capped with a monolayer of alkyl thiols/aminesare also referred as ‘Monolayer Protected Clusters’ (MPCs). Thesub-attofarad (10�18 farad) capacitance associated with MPCsleads to yet another interesting property, i.e. ‘coulombic stair-case’ and ‘coulombic blockade’ behavior, originally observedduring tunneling experiments on an isolated NP.10,11 A similarphenomenon is further realized through voltammetry on MPCsdispersed in polar solvents (diffusing electrodes)12–14 and known asquantized double layer (QDL) charging.15 Voltammetric measure-ments on MPCs are also carried out by immobilizing the NPs onthe electrode surface.16 As the mathematical modelling in voltam-metry is based on Fick’s diffusion law, the ‘diffusing electrode’simplifies an interpretation of the results.
Most of the knowledge in this field to date is based onAu-MPCs, due to their exceptional dispersibility and their solutionstability. The gross understanding of QDL phenomena, how-ever, demands experiments on soluble noble metal MPCs otherthan gold. Efforts have been made for a few nanomaterials,viz. Ag,16,17 Cu,18 Rh,13 Pd19 and more recently for graphenequantum dots (GQD).20 Interestingly, varied sizes of GQD showmultiple redox behaviors corresponding to single electroncharging. Unlike Au-MPCs, difficulties have been found inobserving the QDL phenomenon with Ag-MPCs.21 Similar limi-tations have also been reported for Cu-MPCs due to sponta-neous oxidation, which is facilitated in the lower size regime.18
Except for Au-MPCs and GQD, the remaining reports discussedthe QDL behavior for specific sizes only and significant under-standing requires detailed investigations for a wide size range.To our knowledge, there is only one report which dealt withQDL measurements on thiolate-protected Ag-MPCs of 2.1 nm insize.17 A general observation about Ag-MPCs indicates that thepresence of an oxide layer on the MPC core hampers the QDLresponse. The oxidation of AgNPs is more facile at smaller sizesdue to the high surface energy. Therefore, it would be ofimmense interest to study this effect as a function of size, bywhich the contribution from silver oxide in the QDL measure-ments can be resolved. The voltammetric techniques are sensi-tive to the surface chemical composition, and thus can readilybe used for this purpose.
Here, we report size-dependent differential pulse voltam-metric (DPV) investigations on the dispersion of thiolate-protected silver nanoparticles. The predominant oxide phasein the smaller size regime is found to be responsible for thesuppression of the QDL property. For the first time, the point ofzero charge (EPZC) as a function of size for silver nanoparticlesis estimated through DPV.
a Department of Nanoscience and Nanotechnology, University Institute of Chemical
Technology, North Maharashtra University, Jalgaon – 425 001, India.
E-mail: [email protected]; Tel: +91-257-2258420b Department of Chemistry, Center for Nanoscience, University of Pune,
Ganeshkhind, Pune – 411007, Indiac Chemistry Division, Bhabha Atomic Research Centre, Mumbai 400085, India
† Electronic supplementary information (ESI) available: Fig. S1: thermogravi-metric analysis (TGA), Fig. S2: differential pulse voltammogram, and proceduresfor the synthesis and size selective separation of MP-AgNPs, and detailed phaseanalysis from XRD data. See DOI: 10.1039/c3nj01077e
Received (in Montpellier, France)10th September 2013,Accepted 21st January 2014
DOI: 10.1039/c3nj01077e
www.rsc.org/njc
NJC
PAPER
Publ
ishe
d on
22
Janu
ary
2014
. Dow
nloa
ded
by U
nive
rsity
of
Not
re D
ame
on 0
8/04
/201
4 17
:06:
32.
View Article OnlineView Journal | View Issue
1762 | New J. Chem., 2014, 38, 1761--1767 This journal is©The Royal Society of Chemistry and the Centre National de la Recherche Scientifique 2014
2 Experimental section2.1 Materials
Silver nitrate, tetraoctylammonium bromide (TOAB), sodiumborohydride, dodecanethiol (DDT), toluene, acetone, ethanoland methanol were purchased from s. d. fine Chemicals, India.Tetrabutylammonium perchlorate (TBAP, Fluka) was re-crystallizedand vacuum dried at 80 1C. Dichloromethane (Merck, 99.9%) wasdistilled out and dried over 4 Å molecular sieves, prior to use.
2.2 Synthesis and characterization of MP-AgNPs
MP-AgNPs were synthesized and purified using the methodsuggested by Brust et al.22 The MP-AgNPs’ size was controlledby varying the ratio of Ag+ to DDT concentrations. The poly-dispersity in size distribution was controlled by the method ofsize selective precipitation (a detailed description is given in theESI†). All the samples were stored in a vacuum desiccator.
For routine characterization, UV-vis spectra were recordedusing a Shimadzu UV-1650PC spectrophotometer. For themolecular level understanding of the adsorption of thiol on theparticle surface, FTIR spectroscopic measurements were carriedout using a Shimadzu FTIR-8400 spectrophotometer with thediffused reflectance attachment. Vacuum-dried traces ofMP-AgNPs’ precipitate were subjected to thermal analyses fromroom temperature to 1000 1C in N2 atmosphere using aShimadzu DTG-60 with TA-60WS software.
Powder X-ray diffractograms (XRD) were recorded usingBruker, D8-Advance, X-ray diffractometer (Cu Ka, 40 kV and40 mA) between the 2y values 201 and 801, with a scan rate of1 s per step. X-ray photoelectron spectroscopic (XPS) measure-ments were carried out on MP-AgNPs, drop-cast on a siliconwafer, by using a VG MicroTech ESCA 3000 instrument at apressure Z 1 � 10�9 Torr. The survey scan and Ag 3d, C 1s andO 1s core-level spectra were recorded with Mg Ka radiation(photon energy = 1253.6 eV) at a pass energy of 20 eV and anelectron take-off angle of 501. The overall resolution wasE0.2 eV. The core-level binding energies (BE) were calibratedby using a carbon binding energy of 285 eV.
For the estimation of average particle size, low resolutiontransmission electron microscopy (TEM) images were recordedusing a JEOL 1200EX electron microscope, operated at 120 kV.The samples for the TEM measurements were prepared bydrop-casting the dispersions in dichloromethane onto acarbon-coated grid.
Electrochemical investigations were carried out with thehelp of an Autolab PGSTAT100 potentiostat/galvanostat in aPAR K0264 micro-cell kit assembly housed in a home-madeFaraday cage. The cell was fitted with a three electrode systemhaving a Pt disc (2 mm diameter), Pt wire, and Ag wire as theworking, counter, and quasi-reference electrodes, respectively.The Pt disc electrode was polished with 0.2 mm alumina, rinsedwith copious amounts of distilled water, cleaned by electro-chemical cycling in 0.1 M H2SO4, vacuum dried and at the endrinsed with dichloromethane, prior to use. The working electrodesurface was characterized by recording a cyclic voltammogram(CV) in 0.1 M H2SO4.23
Voltammetric measurements were carried out on a disper-sion of a weighed amount of MP-AgNPs in 5 mL of 0.1 M TBAPin dichloromethane. The measurements were performed in anargon atmosphere. The potential scale of voltammogramsrecorded using Ag wire as a quasi-reference electrode wasconverted to the NHE scale using the ferrocene/ferroceniumcouple as an internal standard. In brief, the correction factor(i.e. the difference between the peak potential of Fc/Fc+ recordedusing the Ag quasi-reference electrode and its reported potentialversus NHE) was applied to the potential scale of the recordedvoltammograms.
3 Results and discussion3.1 Preparation and characterization of MP-AgNPs
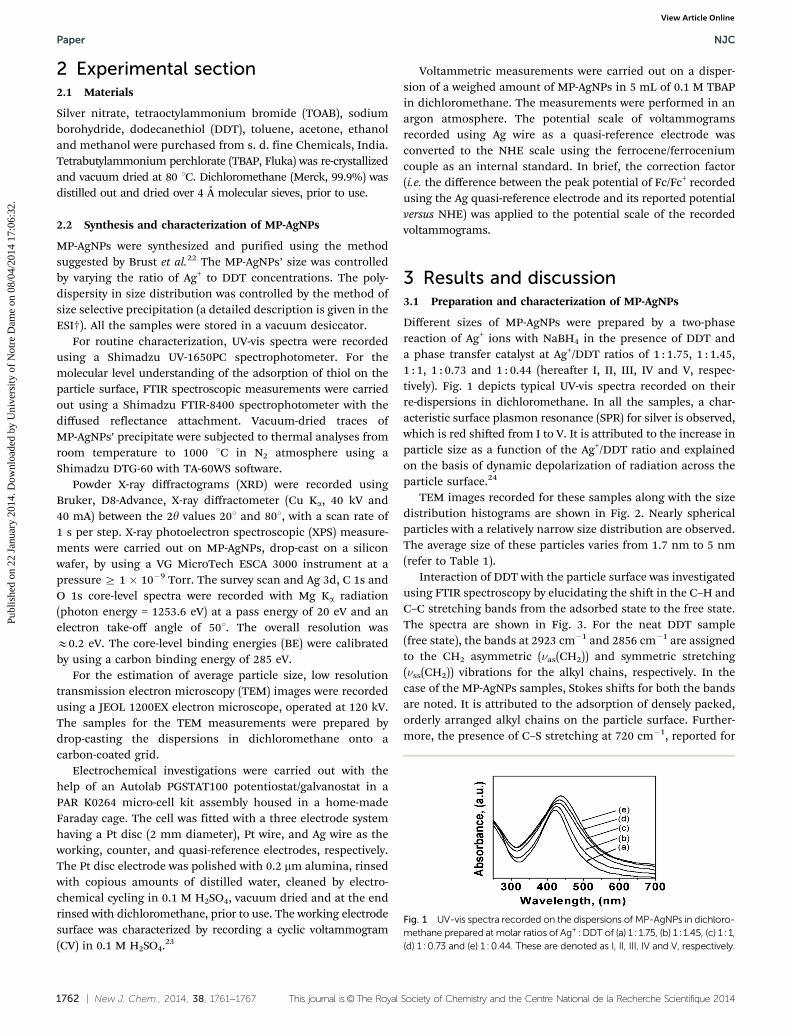
Different sizes of MP-AgNPs were prepared by a two-phasereaction of Ag+ ions with NaBH4 in the presence of DDT anda phase transfer catalyst at Ag+/DDT ratios of 1 : 1.75, 1 : 1.45,1 : 1, 1 : 0.73 and 1 : 0.44 (hereafter I, II, III, IV and V, respec-tively). Fig. 1 depicts typical UV-vis spectra recorded on theirre-dispersions in dichloromethane. In all the samples, a char-acteristic surface plasmon resonance (SPR) for silver is observed,which is red shifted from I to V. It is attributed to the increase inparticle size as a function of the Ag+/DDT ratio and explainedon the basis of dynamic depolarization of radiation across theparticle surface.24
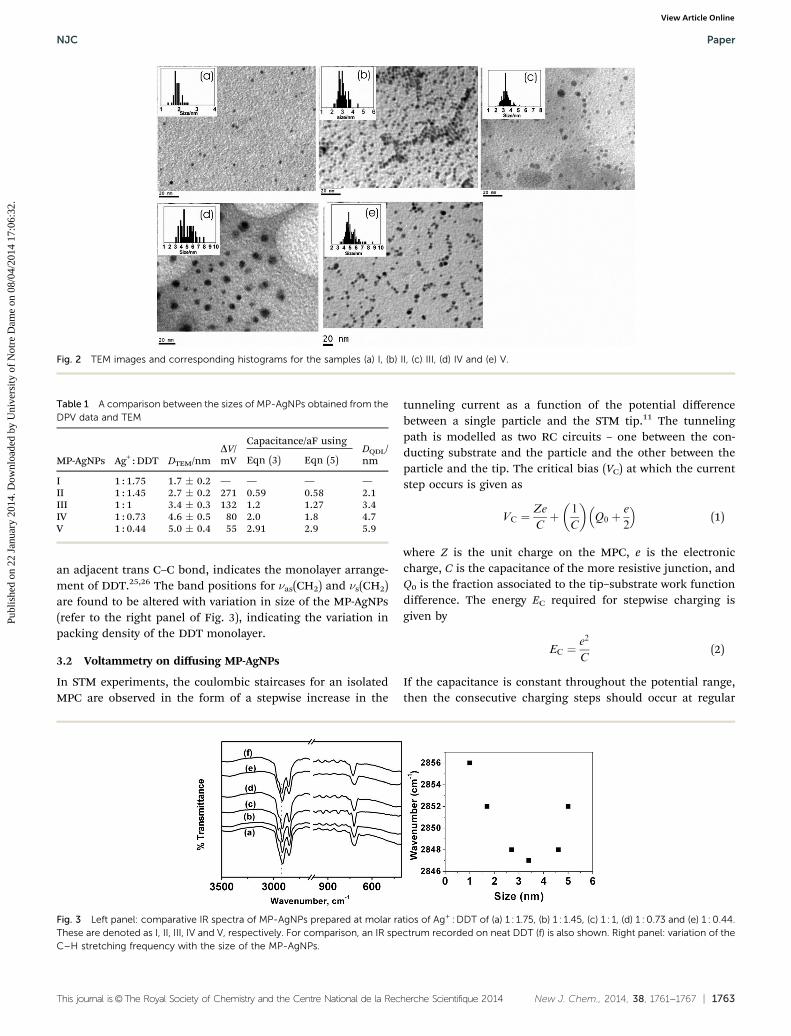
TEM images recorded for these samples along with the sizedistribution histograms are shown in Fig. 2. Nearly sphericalparticles with a relatively narrow size distribution are observed.The average size of these particles varies from 1.7 nm to 5 nm(refer to Table 1).
Interaction of DDT with the particle surface was investigatedusing FTIR spectroscopy by elucidating the shift in the C–H andC–C stretching bands from the adsorbed state to the free state.The spectra are shown in Fig. 3. For the neat DDT sample(free state), the bands at 2923 cm�1 and 2856 cm�1 are assignedto the CH2 asymmetric (nas(CH2)) and symmetric stretching(nss(CH2)) vibrations for the alkyl chains, respectively. In thecase of the MP-AgNPs samples, Stokes shifts for both the bandsare noted. It is attributed to the adsorption of densely packed,orderly arranged alkyl chains on the particle surface. Further-more, the presence of C–S stretching at 720 cm�1, reported for
Fig. 1 UV-vis spectra recorded on the dispersions of MP-AgNPs in dichloro-methane prepared at molar ratios of Ag+ : DDT of (a) 1 : 1.75, (b) 1 : 1.45, (c) 1 : 1,(d) 1 : 0.73 and (e) 1 : 0.44. These are denoted as I, II, III, IV and V, respectively.
Paper NJC
Publ
ishe
d on
22
Janu
ary
2014
. Dow
nloa
ded
by U
nive
rsity
of
Not
re D
ame
on 0
8/04
/201
4 17
:06:
32.
View Article Online
This journal is©The Royal Society of Chemistry and the Centre National de la Recherche Scientifique 2014 New J. Chem., 2014, 38, 1761--1767 | 1763
an adjacent trans C–C bond, indicates the monolayer arrange-ment of DDT.25,26 The band positions for nas(CH2) and ns(CH2)are found to be altered with variation in size of the MP-AgNPs(refer to the right panel of Fig. 3), indicating the variation inpacking density of the DDT monolayer.
3.2 Voltammetry on diffusing MP-AgNPs
In STM experiments, the coulombic staircases for an isolatedMPC are observed in the form of a stepwise increase in the
tunneling current as a function of the potential differencebetween a single particle and the STM tip.11 The tunnelingpath is modelled as two RC circuits – one between the con-ducting substrate and the particle and the other between theparticle and the tip. The critical bias (VC) at which the currentstep occurs is given as
VC ¼Ze
Cþ 1
C
� �Q0 þ
e
2
� �(1)
where Z is the unit charge on the MPC, e is the electroniccharge, C is the capacitance of the more resistive junction, andQ0 is the fraction associated to the tip–substrate work functiondifference. The energy EC required for stepwise charging isgiven by
EC ¼e2
C(2)
If the capacitance is constant throughout the potential range,then the consecutive charging steps should occur at regular
Fig. 2 TEM images and corresponding histograms for the samples (a) I, (b) II, (c) III, (d) IV and (e) V.
Table 1 A comparison between the sizes of MP-AgNPs obtained from theDPV data and TEM
MP-AgNPs Ag+ : DDT DTEM/nmDV/mV
Capacitance/aF usingDQDL/nmEqn (3) Eqn (5)
I 1 : 1.75 1.7 � 0.2 — — — —II 1 : 1.45 2.7 � 0.2 271 0.59 0.58 2.1III 1 : 1 3.4 � 0.3 132 1.2 1.27 3.4IV 1 : 0.73 4.6 � 0.5 80 2.0 1.8 4.7V 1 : 0.44 5.0 � 0.4 55 2.91 2.9 5.9
Fig. 3 Left panel: comparative IR spectra of MP-AgNPs prepared at molar ratios of Ag+ : DDT of (a) 1 : 1.75, (b) 1 : 1.45, (c) 1 : 1, (d) 1 : 0.73 and (e) 1 : 0.44.These are denoted as I, II, III, IV and V, respectively. For comparison, an IR spectrum recorded on neat DDT (f) is also shown. Right panel: variation of theC–H stretching frequency with the size of the MP-AgNPs.
NJC Paper
Publ
ishe
d on
22
Janu
ary
2014
. Dow
nloa
ded
by U
nive
rsity
of
Not
re D
ame
on 0
8/04
/201
4 17
:06:
32.
View Article Online
1764 | New J. Chem., 2014, 38, 1761--1767 This journal is©The Royal Society of Chemistry and the Centre National de la Recherche Scientifique 2014
voltage spacing, given by
DVC ¼e
C(3)
The coulombic staircase experiment can also be evidenced bycarrying out voltammetry on a dispersion of MPCs in a suitablesolvent.11 The MPCs arrive at and depart from the electrodesurface by the diffusion process. The charging current flowsdue to the electron transfer between the electrode and themulti-valent MPCs and is diffusion controlled. The peak heightin DPV will be governed by the Warburg impedance associatedmainly with diffusion.
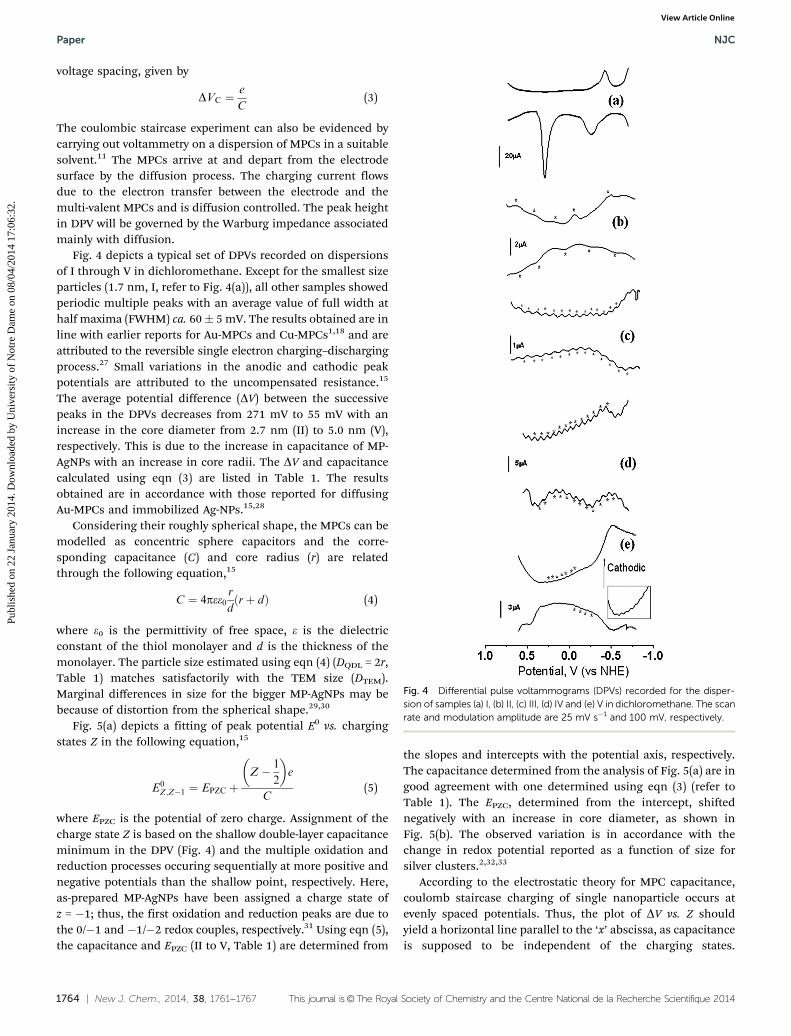
Fig. 4 depicts a typical set of DPVs recorded on dispersionsof I through V in dichloromethane. Except for the smallest sizeparticles (1.7 nm, I, refer to Fig. 4(a)), all other samples showedperiodic multiple peaks with an average value of full width athalf maxima (FWHM) ca. 60� 5 mV. The results obtained are inline with earlier reports for Au-MPCs and Cu-MPCs1,18 and areattributed to the reversible single electron charging–dischargingprocess.27 Small variations in the anodic and cathodic peakpotentials are attributed to the uncompensated resistance.15
The average potential difference (DV) between the successivepeaks in the DPVs decreases from 271 mV to 55 mV with anincrease in the core diameter from 2.7 nm (II) to 5.0 nm (V),respectively. This is due to the increase in capacitance of MP-AgNPs with an increase in core radii. The DV and capacitancecalculated using eqn (3) are listed in Table 1. The resultsobtained are in accordance with those reported for diffusingAu-MPCs and immobilized Ag-NPs.15,28
Considering their roughly spherical shape, the MPCs can bemodelled as concentric sphere capacitors and the corre-sponding capacitance (C) and core radius (r) are relatedthrough the following equation,15
C ¼ 4pee0r
dðrþ dÞ (4)
where e0 is the permittivity of free space, e is the dielectricconstant of the thiol monolayer and d is the thickness of themonolayer. The particle size estimated using eqn (4) (DQDL = 2r,Table 1) matches satisfactorily with the TEM size (DTEM).Marginal differences in size for the bigger MP-AgNPs may bebecause of distortion from the spherical shape.29,30
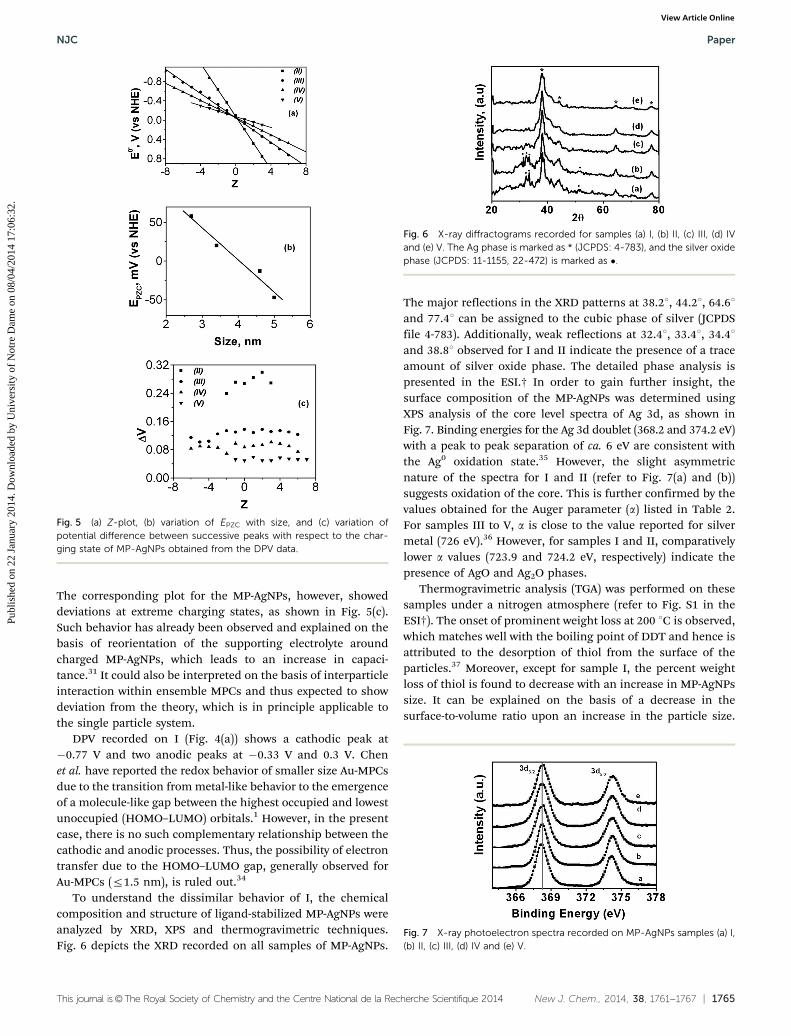
Fig. 5(a) depicts a fitting of peak potential E0 vs. chargingstates Z in the following equation,15
E0Z;Z�1 ¼ EPZC þ
Z � 1
2
� �e
C(5)
where EPZC is the potential of zero charge. Assignment of thecharge state Z is based on the shallow double-layer capacitanceminimum in the DPV (Fig. 4) and the multiple oxidation andreduction processes occuring sequentially at more positive andnegative potentials than the shallow point, respectively. Here,as-prepared MP-AgNPs have been assigned a charge state ofz = �1; thus, the first oxidation and reduction peaks are due tothe 0/�1 and �1/�2 redox couples, respectively.31 Using eqn (5),the capacitance and EPZC (II to V, Table 1) are determined from
the slopes and intercepts with the potential axis, respectively.The capacitance determined from the analysis of Fig. 5(a) are ingood agreement with one determined using eqn (3) (refer toTable 1). The EPZC, determined from the intercept, shiftednegatively with an increase in core diameter, as shown inFig. 5(b). The observed variation is in accordance with thechange in redox potential reported as a function of size forsilver clusters.2,32,33
According to the electrostatic theory for MPC capacitance,coulomb staircase charging of single nanoparticle occurs atevenly spaced potentials. Thus, the plot of DV vs. Z shouldyield a horizontal line parallel to the ‘x’ abscissa, as capacitanceis supposed to be independent of the charging states.
Fig. 4 Differential pulse voltammograms (DPVs) recorded for the disper-sion of samples (a) I, (b) II, (c) III, (d) IV and (e) V in dichloromethane. The scanrate and modulation amplitude are 25 mV s�1 and 100 mV, respectively.
Paper NJC
Publ
ishe
d on
22
Janu
ary
2014
. Dow
nloa
ded
by U
nive
rsity
of
Not
re D
ame
on 0
8/04
/201
4 17
:06:
32.
View Article Online
This journal is©The Royal Society of Chemistry and the Centre National de la Recherche Scientifique 2014 New J. Chem., 2014, 38, 1761--1767 | 1765
The corresponding plot for the MP-AgNPs, however, showeddeviations at extreme charging states, as shown in Fig. 5(c).Such behavior has already been observed and explained on thebasis of reorientation of the supporting electrolyte aroundcharged MP-AgNPs, which leads to an increase in capaci-tance.31 It could also be interpreted on the basis of interparticleinteraction within ensemble MPCs and thus expected to showdeviation from the theory, which is in principle applicable tothe single particle system.
DPV recorded on I (Fig. 4(a)) shows a cathodic peak at�0.77 V and two anodic peaks at �0.33 V and 0.3 V. Chenet al. have reported the redox behavior of smaller size Au-MPCsdue to the transition from metal-like behavior to the emergenceof a molecule-like gap between the highest occupied and lowestunoccupied (HOMO–LUMO) orbitals.1 However, in the presentcase, there is no such complementary relationship between thecathodic and anodic processes. Thus, the possibility of electrontransfer due to the HOMO–LUMO gap, generally observed forAu-MPCs (r1.5 nm), is ruled out.34
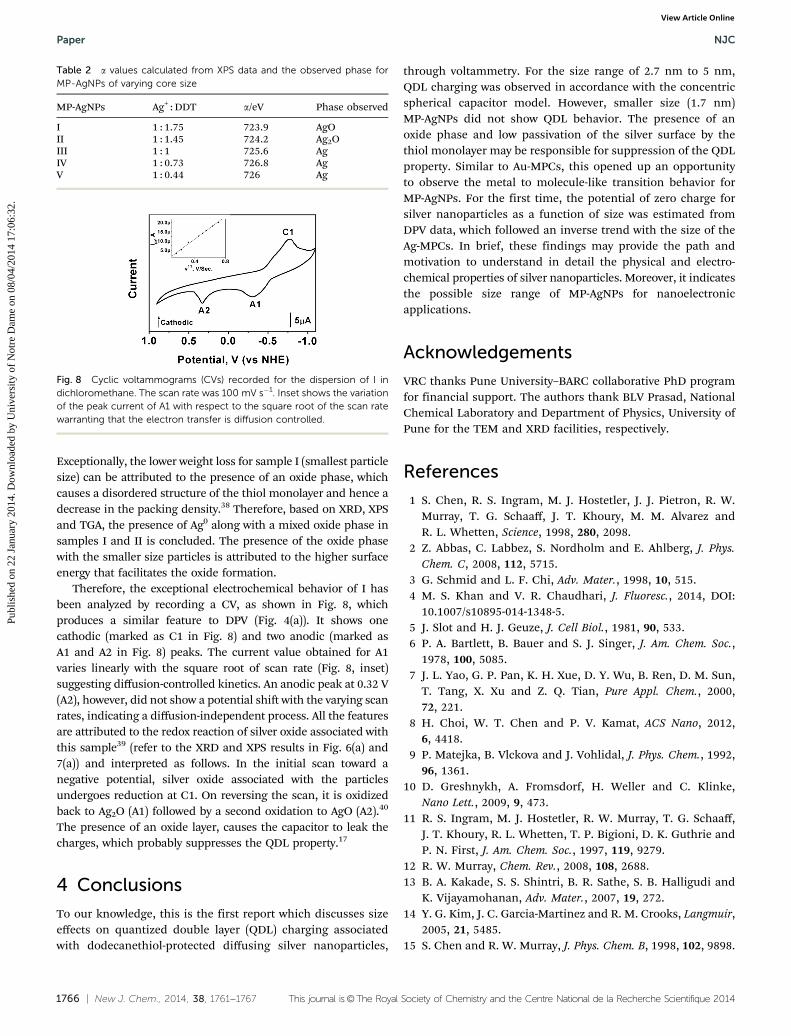
To understand the dissimilar behavior of I, the chemicalcomposition and structure of ligand-stabilized MP-AgNPs wereanalyzed by XRD, XPS and thermogravimetric techniques.Fig. 6 depicts the XRD recorded on all samples of MP-AgNPs.
The major reflections in the XRD patterns at 38.21, 44.21, 64.61and 77.41 can be assigned to the cubic phase of silver (JCPDSfile 4-783). Additionally, weak reflections at 32.41, 33.41, 34.41and 38.81 observed for I and II indicate the presence of a traceamount of silver oxide phase. The detailed phase analysis ispresented in the ESI.† In order to gain further insight, thesurface composition of the MP-AgNPs was determined usingXPS analysis of the core level spectra of Ag 3d, as shown inFig. 7. Binding energies for the Ag 3d doublet (368.2 and 374.2 eV)with a peak to peak separation of ca. 6 eV are consistent withthe Ag0 oxidation state.35 However, the slight asymmetricnature of the spectra for I and II (refer to Fig. 7(a) and (b))suggests oxidation of the core. This is further confirmed by thevalues obtained for the Auger parameter (a) listed in Table 2.For samples III to V, a is close to the value reported for silvermetal (726 eV).36 However, for samples I and II, comparativelylower a values (723.9 and 724.2 eV, respectively) indicate thepresence of AgO and Ag2O phases.
Thermogravimetric analysis (TGA) was performed on thesesamples under a nitrogen atmosphere (refer to Fig. S1 in theESI†). The onset of prominent weight loss at 200 1C is observed,which matches well with the boiling point of DDT and hence isattributed to the desorption of thiol from the surface of theparticles.37 Moreover, except for sample I, the percent weightloss of thiol is found to decrease with an increase in MP-AgNPssize. It can be explained on the basis of a decrease in thesurface-to-volume ratio upon an increase in the particle size.
Fig. 5 (a) Z-plot, (b) variation of EPZC with size, and (c) variation ofpotential difference between successive peaks with respect to the char-ging state of MP-AgNPs obtained from the DPV data.
Fig. 6 X-ray diffractograms recorded for samples (a) I, (b) II, (c) III, (d) IVand (e) V. The Ag phase is marked as * (JCPDS: 4-783), and the silver oxidephase (JCPDS: 11-1155, 22-472) is marked as �.
Fig. 7 X-ray photoelectron spectra recorded on MP-AgNPs samples (a) I,(b) II, (c) III, (d) IV and (e) V.
NJC Paper
Publ
ishe
d on
22
Janu
ary
2014
. Dow
nloa
ded
by U
nive
rsity
of
Not
re D
ame
on 0
8/04
/201
4 17
:06:
32.
View Article Online
1766 | New J. Chem., 2014, 38, 1761--1767 This journal is©The Royal Society of Chemistry and the Centre National de la Recherche Scientifique 2014
Exceptionally, the lower weight loss for sample I (smallest particlesize) can be attributed to the presence of an oxide phase, whichcauses a disordered structure of the thiol monolayer and hence adecrease in the packing density.38 Therefore, based on XRD, XPSand TGA, the presence of Ag0 along with a mixed oxide phase insamples I and II is concluded. The presence of the oxide phasewith the smaller size particles is attributed to the higher surfaceenergy that facilitates the oxide formation.
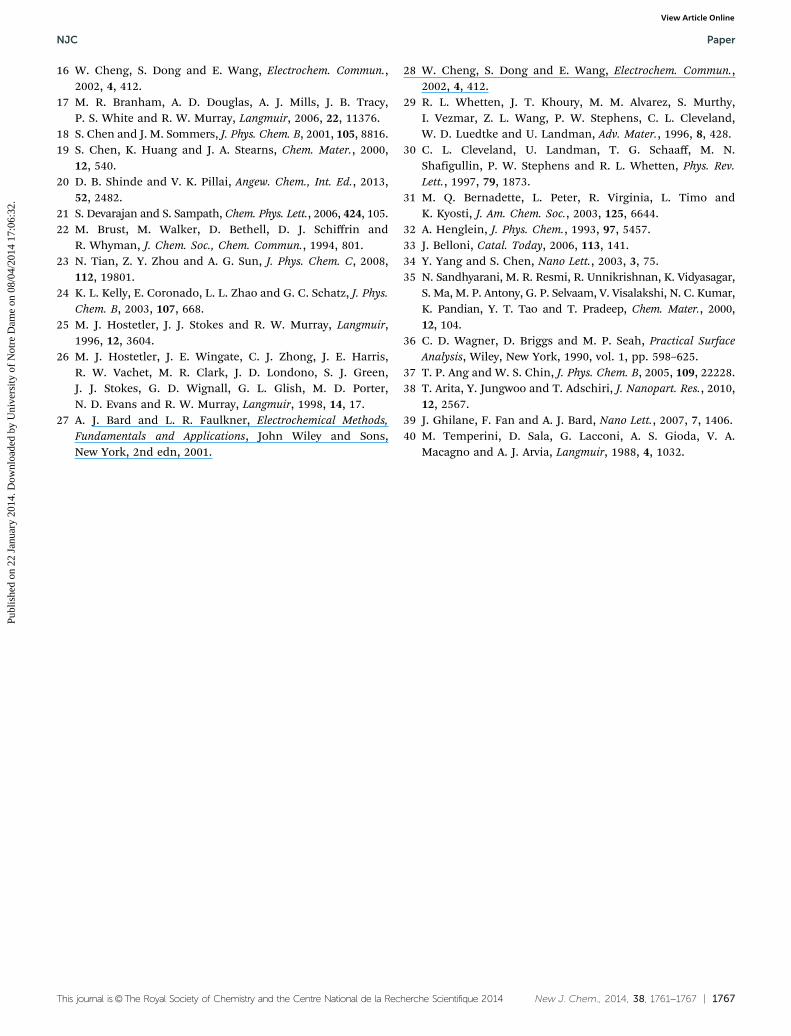
Therefore, the exceptional electrochemical behavior of I hasbeen analyzed by recording a CV, as shown in Fig. 8, whichproduces a similar feature to DPV (Fig. 4(a)). It shows onecathodic (marked as C1 in Fig. 8) and two anodic (marked asA1 and A2 in Fig. 8) peaks. The current value obtained for A1varies linearly with the square root of scan rate (Fig. 8, inset)suggesting diffusion-controlled kinetics. An anodic peak at 0.32 V(A2), however, did not show a potential shift with the varying scanrates, indicating a diffusion-independent process. All the featuresare attributed to the redox reaction of silver oxide associated withthis sample39 (refer to the XRD and XPS results in Fig. 6(a) and7(a)) and interpreted as follows. In the initial scan toward anegative potential, silver oxide associated with the particlesundergoes reduction at C1. On reversing the scan, it is oxidizedback to Ag2O (A1) followed by a second oxidation to AgO (A2).40
The presence of an oxide layer, causes the capacitor to leak thecharges, which probably suppresses the QDL property.17
4 Conclusions
To our knowledge, this is the first report which discusses sizeeffects on quantized double layer (QDL) charging associatedwith dodecanethiol-protected diffusing silver nanoparticles,
through voltammetry. For the size range of 2.7 nm to 5 nm,QDL charging was observed in accordance with the concentricspherical capacitor model. However, smaller size (1.7 nm)MP-AgNPs did not show QDL behavior. The presence of anoxide phase and low passivation of the silver surface by thethiol monolayer may be responsible for suppression of the QDLproperty. Similar to Au-MPCs, this opened up an opportunityto observe the metal to molecule-like transition behavior forMP-AgNPs. For the first time, the potential of zero charge forsilver nanoparticles as a function of size was estimated fromDPV data, which followed an inverse trend with the size of theAg-MPCs. In brief, these findings may provide the path andmotivation to understand in detail the physical and electro-chemical properties of silver nanoparticles. Moreover, it indicatesthe possible size range of MP-AgNPs for nanoelectronicapplications.
Acknowledgements
VRC thanks Pune University–BARC collaborative PhD programfor financial support. The authors thank BLV Prasad, NationalChemical Laboratory and Department of Physics, University ofPune for the TEM and XRD facilities, respectively.
References
1 S. Chen, R. S. Ingram, M. J. Hostetler, J. J. Pietron, R. W.Murray, T. G. Schaaff, J. T. Khoury, M. M. Alvarez andR. L. Whetten, Science, 1998, 280, 2098.
2 Z. Abbas, C. Labbez, S. Nordholm and E. Ahlberg, J. Phys.Chem. C, 2008, 112, 5715.
3 G. Schmid and L. F. Chi, Adv. Mater., 1998, 10, 515.4 M. S. Khan and V. R. Chaudhari, J. Fluoresc., 2014, DOI:
10.1007/s10895-014-1348-5.5 J. Slot and H. J. Geuze, J. Cell Biol., 1981, 90, 533.6 P. A. Bartlett, B. Bauer and S. J. Singer, J. Am. Chem. Soc.,
1978, 100, 5085.7 J. L. Yao, G. P. Pan, K. H. Xue, D. Y. Wu, B. Ren, D. M. Sun,
T. Tang, X. Xu and Z. Q. Tian, Pure Appl. Chem., 2000,72, 221.
8 H. Choi, W. T. Chen and P. V. Kamat, ACS Nano, 2012,6, 4418.
9 P. Matejka, B. Vlckova and J. Vohlidal, J. Phys. Chem., 1992,96, 1361.
10 D. Greshnykh, A. Fromsdorf, H. Weller and C. Klinke,Nano Lett., 2009, 9, 473.
11 R. S. Ingram, M. J. Hostetler, R. W. Murray, T. G. Schaaff,J. T. Khoury, R. L. Whetten, T. P. Bigioni, D. K. Guthrie andP. N. First, J. Am. Chem. Soc., 1997, 119, 9279.
12 R. W. Murray, Chem. Rev., 2008, 108, 2688.13 B. A. Kakade, S. S. Shintri, B. R. Sathe, S. B. Halligudi and
K. Vijayamohanan, Adv. Mater., 2007, 19, 272.14 Y. G. Kim, J. C. Garcia-Martinez and R. M. Crooks, Langmuir,
2005, 21, 5485.15 S. Chen and R. W. Murray, J. Phys. Chem. B, 1998, 102, 9898.
Table 2 a values calculated from XPS data and the observed phase forMP-AgNPs of varying core size
MP-AgNPs Ag+ : DDT a/eV Phase observed
I 1 : 1.75 723.9 AgOII 1 : 1.45 724.2 Ag2OIII 1 : 1 725.6 AgIV 1 : 0.73 726.8 AgV 1 : 0.44 726 Ag
Fig. 8 Cyclic voltammograms (CVs) recorded for the dispersion of I indichloromethane. The scan rate was 100 mV s�1. Inset shows the variationof the peak current of A1 with respect to the square root of the scan ratewarranting that the electron transfer is diffusion controlled.
Paper NJC
Publ
ishe
d on
22
Janu
ary
2014
. Dow
nloa
ded
by U
nive
rsity
of
Not
re D
ame
on 0
8/04
/201
4 17
:06:
32.
View Article Online
This journal is©The Royal Society of Chemistry and the Centre National de la Recherche Scientifique 2014 New J. Chem., 2014, 38, 1761--1767 | 1767
16 W. Cheng, S. Dong and E. Wang, Electrochem. Commun.,2002, 4, 412.
17 M. R. Branham, A. D. Douglas, A. J. Mills, J. B. Tracy,P. S. White and R. W. Murray, Langmuir, 2006, 22, 11376.
18 S. Chen and J. M. Sommers, J. Phys. Chem. B, 2001, 105, 8816.19 S. Chen, K. Huang and J. A. Stearns, Chem. Mater., 2000,
12, 540.20 D. B. Shinde and V. K. Pillai, Angew. Chem., Int. Ed., 2013,
52, 2482.21 S. Devarajan and S. Sampath, Chem. Phys. Lett., 2006, 424, 105.22 M. Brust, M. Walker, D. Bethell, D. J. Schiffrin and
R. Whyman, J. Chem. Soc., Chem. Commun., 1994, 801.23 N. Tian, Z. Y. Zhou and A. G. Sun, J. Phys. Chem. C, 2008,
112, 19801.24 K. L. Kelly, E. Coronado, L. L. Zhao and G. C. Schatz, J. Phys.
Chem. B, 2003, 107, 668.25 M. J. Hostetler, J. J. Stokes and R. W. Murray, Langmuir,
1996, 12, 3604.26 M. J. Hostetler, J. E. Wingate, C. J. Zhong, J. E. Harris,
R. W. Vachet, M. R. Clark, J. D. Londono, S. J. Green,J. J. Stokes, G. D. Wignall, G. L. Glish, M. D. Porter,N. D. Evans and R. W. Murray, Langmuir, 1998, 14, 17.
27 A. J. Bard and L. R. Faulkner, Electrochemical Methods,Fundamentals and Applications, John Wiley and Sons,New York, 2nd edn, 2001.
28 W. Cheng, S. Dong and E. Wang, Electrochem. Commun.,2002, 4, 412.
29 R. L. Whetten, J. T. Khoury, M. M. Alvarez, S. Murthy,I. Vezmar, Z. L. Wang, P. W. Stephens, C. L. Cleveland,W. D. Luedtke and U. Landman, Adv. Mater., 1996, 8, 428.
30 C. L. Cleveland, U. Landman, T. G. Schaaff, M. N.Shafigullin, P. W. Stephens and R. L. Whetten, Phys. Rev.Lett., 1997, 79, 1873.
31 M. Q. Bernadette, L. Peter, R. Virginia, L. Timo andK. Kyosti, J. Am. Chem. Soc., 2003, 125, 6644.
32 A. Henglein, J. Phys. Chem., 1993, 97, 5457.33 J. Belloni, Catal. Today, 2006, 113, 141.34 Y. Yang and S. Chen, Nano Lett., 2003, 3, 75.35 N. Sandhyarani, M. R. Resmi, R. Unnikrishnan, K. Vidyasagar,
S. Ma, M. P. Antony, G. P. Selvaam, V. Visalakshi, N. C. Kumar,K. Pandian, Y. T. Tao and T. Pradeep, Chem. Mater., 2000,12, 104.
36 C. D. Wagner, D. Briggs and M. P. Seah, Practical SurfaceAnalysis, Wiley, New York, 1990, vol. 1, pp. 598–625.
37 T. P. Ang and W. S. Chin, J. Phys. Chem. B, 2005, 109, 22228.38 T. Arita, Y. Jungwoo and T. Adschiri, J. Nanopart. Res., 2010,
12, 2567.39 J. Ghilane, F. Fan and A. J. Bard, Nano Lett., 2007, 7, 1406.40 M. Temperini, D. Sala, G. Lacconi, A. S. Gioda, V. A.
Macagno and A. J. Arvia, Langmuir, 1988, 4, 1032.
NJC Paper
Publ
ishe
d on
22
Janu
ary
2014
. Dow
nloa
ded
by U
nive
rsity
of
Not
re D
ame
on 0
8/04
/201
4 17
:06:
32.
View Article Online