Preliminary Results of the London Congestion Charging Scheme
18
10.1177/1087724X04268569 PUBLIC WORKS MANAGEMENT & POLICY / October 2004 Santos, Shaffer / LONDON CONGESTION CHARGING SCHEME PRELIMINARY RESULTS OF THE LONDON CONGESTION CHARGING SCHEME GEORGINA SANTOS University of Oxford BLAKE SHAFFER University of Cambridge On February 17, 2003, the London Congestion Charging Scheme came into effect. Preliminary results show a significant response to the £5 (U.S. $8) charge. Conges- tion over the first year decreased by 30%. Overall traffic levels within the charging zone fell by 16%. Speeds for car travel increased by more than 20%, and bus travel became more reliable. Elasticities of demand for trips by car with respect to gener- alized costs are estimated to be between –1.32 and –2.10. The average marginal congestion cost within the central zone is estimated at £1.65/vehicle-km (approxi- mately U.S. $2.58/vehicle-km). The net economic benefits of the Scheme for the first year were £50 million (U.S. $78 million) and the net revenues, £68 million (U.S. $106 million). Net revenues are mainly being used to improve public transport. Keywords: traffic congestion; London congestion charging; demand elasticities; congestion costs; road pricing G arrett Hardin’s (1968) Tragedy of the Commons depicts a classic example of the harmful effects of unabated negative externalities. In Hardin’s story, the villagers of a small Eng- lish town have equal and free access to a commons wherein they can place their animals. When making the decision to add a cow to the commons, a villager takes into account the animal’s own ability to graze and roam, but not its effect on others. This is the classic description of the so- called free-rider problem commonly associated with public goods. The modern version of Hardin’s story could easily depict drivers as, perhaps unflatteringly, the cows and roads in place of the commons. When a potential driver makes the decision to use private transport by comparing his or her marginal private costs and benefits, that driver typi- cally excludes from the analysis any external costs that his or her action of driving may impose on others. Arthur Pigou, a Cambridge economist, first identified this problem of “divergences between marginal social and private net products” in his book The Economics of Welfare (Pigou, 1920). To remedy this problem, Pigou proposed a tax or levy on drivers to ensure that their perceived private costs were consistent with the true social costs of driving. 164 Georgina Santos holds an M.Sc. in environmental and resource economics from University College London and a Ph.D. in economics from the University of Cam- bridge, United Kingdom, where she was most recently with the Department of Applied Economics. She is now a departmental lecturer in the Transport Studies Unit at the University of Oxford. Her interests include transport economics and policy and environmen- tal economics and policy. Blake Shaffer was previ- ously a part of the Faculty of Economics and Politics at the University of Cam- bridge, United Kingdom. AUTHORS’ NOTE: We are grateful to Jeremy Evans, Simon Burton, Charles Buckingham, Sharon Cartwright, Ruth Excell, and Karen Grayson from Transport for London, to Kevin Austin and Richard Tribe from the Greater London Authority, and to Georgina Osbourn from Trafficmaster PLC, for provision of data. We are also indebted to David Reams, Ken Small, and four anonymous referees for comments on an earlier draft. Any remaining errors are our sole responsibility. Support from the British Academy for Georgina Santos is gratefully acknowledged. Both authors were at the University of Cambridge when this article was written. PUBLIC WORKS MANAGEMENT & POLICY, Vol. 9 No. 2, October 2004 164-181 DOI: 10.1177/1087724X04268569 © 2004 Sage Publications
-
Upload
independent -
Category
Documents
-
view
2 -
download
0
Transcript of Preliminary Results of the London Congestion Charging Scheme

10.1177/1087724X04268569PUBLIC WORKS MANAGEMENT & POLICY / October 2004Santos, Shaffer / LONDON CONGESTION CHARGING SCHEME
PRELIMINARY RESULTS OF THE LONDONCONGESTION CHARGING SCHEME
GEORGINA SANTOSUniversity of Oxford
BLAKE SHAFFERUniversity of Cambridge
On February 17, 2003, the London Congestion Charging Scheme came into effect.Preliminary results show a significant response to the £5 (U.S. $8) charge. Conges-tion over the first year decreased by 30%. Overall traffic levels within the chargingzone fell by 16%. Speeds for car travel increased by more than 20%, and bus travelbecame more reliable. Elasticities of demand for trips by car with respect to gener-alized costs are estimated to be between –1.32 and –2.10. The average marginalcongestion cost within the central zone is estimated at £1.65/vehicle-km (approxi-mately U.S. $2.58/vehicle-km). The net economic benefits of the Scheme for the firstyear were £50 million (U.S. $78 million) and the net revenues, £68 million (U.S.$106 million). Net revenues are mainly being used to improve public transport.
Keywords: traffic congestion; London congestion charging; demand elasticities;congestion costs; road pricing
Garrett Hardin’s (1968) Tragedy of the Commons depicts a classic example of the harmfuleffects of unabated negative externalities. In Hardin’s story, the villagers of a small Eng-
lish town have equal and free access to a commons wherein they can place their animals. Whenmaking the decision to add a cow to the commons, a villager takes into account the animal’s ownability to graze and roam, but not its effect on others. This is the classic description of the so-called free-rider problem commonly associated with public goods.
The modern version of Hardin’s story could easily depict drivers as, perhaps unflatteringly,the cows and roads in place of the commons. When a potential driver makes the decision to useprivate transport by comparing his or her marginal private costs and benefits, that driver typi-cally excludes from the analysis any external costs that his or her action of driving may imposeon others. Arthur Pigou, a Cambridge economist, first identified this problem of “divergencesbetween marginal social and private net products” in his book The Economics of Welfare(Pigou, 1920). To remedy this problem, Pigou proposed a tax or levy on drivers to ensure thattheir perceived private costs were consistent with the true social costs of driving.
164
Georgina Santos holds anM.Sc. in environmental andresource economics fromUniversity College Londonand a Ph.D. in economicsfrom the University of Cam-bridge, United Kingdom,where she was most recentlywith the Department ofApplied Economics. She isnow a departmental lecturerin the Transport StudiesUnit at the University ofOxford. Her interestsinclude transport economicsand policy and environmen-tal economics and policy.
Blake Shaffer was previ-ously a part of the Facultyof Economics and Politics atthe University of Cam-bridge, United Kingdom.
AUTHORS’ NOTE: We are grateful to Jeremy Evans, Simon Burton, Charles Buckingham, SharonCartwright, Ruth Excell, and Karen Grayson from Transport for London, to Kevin Austin and RichardTribe from the Greater London Authority, and to Georgina Osbourn from Trafficmaster PLC, for provisionof data. We are also indebted to David Reams, Ken Small, and four anonymous referees for comments onan earlier draft. Any remaining errors are our sole responsibility. Support from the British Academy forGeorgina Santos is gratefully acknowledged. Both authors were at the University of Cambridge when thisarticle was written.
PUBLIC WORKS MANAGEMENT & POLICY, Vol. 9 No. 2, October 2004 164-181DOI: 10.1177/1087724X04268569© 2004 Sage Publications

The city of London has taken Pigou’s idea from theory to practice. Since February 17, 2003,motorists within the central London area must pay a £5 charge (approximately U.S. $8) for theright to drive or park within the zone. The charge differs from a true Pigouvian tax in that it is notequal to the marginal congestion cost (MCC). A charge equal to the MCC would vary with timeand location. Although technically the charge differs temporally, given that a license costs £5between 7:00 AM and 6:30 PM from Monday to Friday versus £0 at all other times, true marginalcost pricing (or Pigouvian taxation) would require more finely tuned spatial and temporal dif-ferences. Nevertheless, the London Congestion Charging Scheme is a dramatic step towardsinternalizing the externalities associated with driving.
This article analyzes some of the preliminary effects, as recently published by Transport forLondon (TfL, 2003a, 2003b, 2004). It presents the basic theory of optimal road pricing,describes the London Scheme and its preliminary results, which are then used to compute elas-ticities with respect to changes in generalized cost, as well as area marginal congestion costs. Itthen briefly touches on the costs and benefits of the Scheme, the use of revenues, and the poten-tial equity impacts. The prevailing elasticities, as shown by motorists’ responses to the Scheme,are higher than expected. This is probably because of the public transport system in London,which provides an alternative to the car. The calculated area MCC suggests that the £5 charge isa reasonable approximation to marginal cost pricing.
The Economics of Congestion Charging
Suboptimal levels of congestion are a result of drivers failing to take into account the effectthat their vehicle will have on others. This “neglected externality” means that drivers will oftenuse private vehicles when the net marginal social benefit of doing so is actually negative.
The optimal method to internalize externalities is marginal cost pricing, whose basics Pigou(1920) first proposed. In a seminal paper, Walters (1961) more fully developed the specificapplication of marginal cost pricing to a congested highway. His model is based on engineering-related speed-flow relationships on links to derive the optimal congestion charge. The formalderivations shown below follow Newbery (1990) and Nash (1997).
Assume a generalized travel cost/km function that consists of money costs (fuel, mainte-nance, etc.) and time costs:
g mb
s q= +
( )(1)
where g = generalized cost (pence/PCU-km), m = money cost (pence/PCU-km), b = value oftime (pence/PCU-hour), s = speed as a function of total flow (km/hour), and q = flow (PCU/hour).
PCU stands for passenger car unit, a measure of the relative disruption that different vehicletypes impose on the network. A car, for example, has a PCU rating of 1, whereas a light goodsvehicle has a PCU rating of 1.5, and so on. In the U.S. passenger car equivalents (PCE) are usedinstead. The meaning, however, is the same.
Total costs (in pence/km-hour) are:
C gq mqbq
s q= = +
( )(2)
and marginal costs are:
∂∂C
qm
b
s q
bq
qs q= + − ′
( ) [( )]( )
2
(3)
or more simply:
Santos, Shaffer / LONDON CONGESTION CHARGING SCHEME 165
∂∂C
qg
b
s qesq= +
( )(4)
where esq is the elasticity of speed with respect to flow.This last expression clearly identifies the marginal social costs as a function of marginal pri-
vate costs, g, plus an external cost term, the congestion externality. By way of a Pigouvian tax,an individual’s decision can be reconciled with the socially optimal choice. The tax in this case
would be equal tob
s qesq
( )per PCU-km.
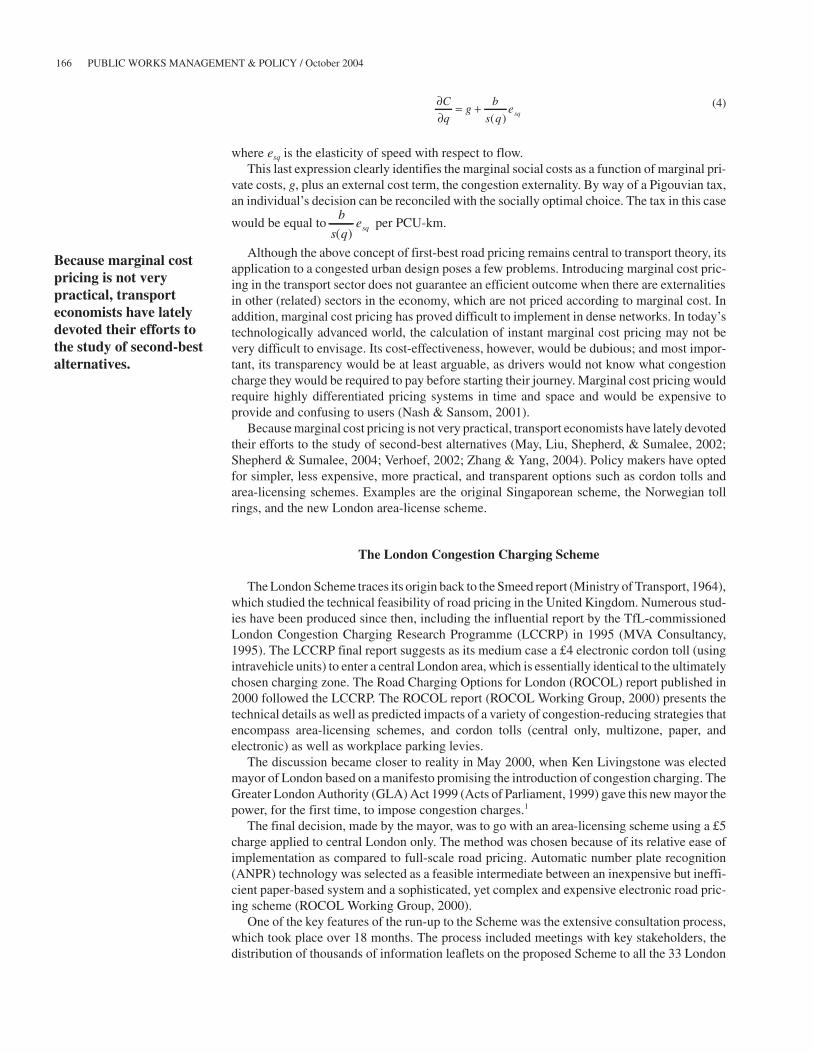
Although the above concept of first-best road pricing remains central to transport theory, itsapplication to a congested urban design poses a few problems. Introducing marginal cost pric-ing in the transport sector does not guarantee an efficient outcome when there are externalitiesin other (related) sectors in the economy, which are not priced according to marginal cost. Inaddition, marginal cost pricing has proved difficult to implement in dense networks. In today’stechnologically advanced world, the calculation of instant marginal cost pricing may not bevery difficult to envisage. Its cost-effectiveness, however, would be dubious; and most impor-tant, its transparency would be at least arguable, as drivers would not know what congestioncharge they would be required to pay before starting their journey. Marginal cost pricing wouldrequire highly differentiated pricing systems in time and space and would be expensive toprovide and confusing to users (Nash & Sansom, 2001).
Because marginal cost pricing is not very practical, transport economists have lately devotedtheir efforts to the study of second-best alternatives (May, Liu, Shepherd, & Sumalee, 2002;Shepherd & Sumalee, 2004; Verhoef, 2002; Zhang & Yang, 2004). Policy makers have optedfor simpler, less expensive, more practical, and transparent options such as cordon tolls andarea-licensing schemes. Examples are the original Singaporean scheme, the Norwegian tollrings, and the new London area-license scheme.
The London Congestion Charging Scheme
The London Scheme traces its origin back to the Smeed report (Ministry of Transport, 1964),which studied the technical feasibility of road pricing in the United Kingdom. Numerous stud-ies have been produced since then, including the influential report by the TfL-commissionedLondon Congestion Charging Research Programme (LCCRP) in 1995 (MVA Consultancy,1995). The LCCRP final report suggests as its medium case a £4 electronic cordon toll (usingintravehicle units) to enter a central London area, which is essentially identical to the ultimatelychosen charging zone. The Road Charging Options for London (ROCOL) report published in2000 followed the LCCRP. The ROCOL report (ROCOL Working Group, 2000) presents thetechnical details as well as predicted impacts of a variety of congestion-reducing strategies thatencompass area-licensing schemes, and cordon tolls (central only, multizone, paper, andelectronic) as well as workplace parking levies.
The discussion became closer to reality in May 2000, when Ken Livingstone was electedmayor of London based on a manifesto promising the introduction of congestion charging. TheGreater London Authority (GLA) Act 1999 (Acts of Parliament, 1999) gave this new mayor thepower, for the first time, to impose congestion charges.1
The final decision, made by the mayor, was to go with an area-licensing scheme using a £5charge applied to central London only. The method was chosen because of its relative ease ofimplementation as compared to full-scale road pricing. Automatic number plate recognition(ANPR) technology was selected as a feasible intermediate between an inexpensive but ineffi-cient paper-based system and a sophisticated, yet complex and expensive electronic road pric-ing scheme (ROCOL Working Group, 2000).
One of the key features of the run-up to the Scheme was the extensive consultation process,which took place over 18 months. The process included meetings with key stakeholders, thedistribution of thousands of information leaflets on the proposed Scheme to all the 33 London
166 PUBLIC WORKS MANAGEMENT & POLICY / October 2004
Because marginal costpricing is not verypractical, transporteconomists have latelydevoted their efforts tothe study of second-bestalternatives.

boroughs, and placement of newspaper and radio advertisements with details of the Scheme andinformation on how the public could participate in the consultation process. This consultationexercise increased the public acceptability of the Scheme.
HOW THE SCHEME OPERATES
Figure 1 shows the limit of the area where the charges apply, the Inner Ring Road, which runsalong Euston Road, Pentonville Road, City Road, Old Street, Commercial Street, Tower BridgeRoad, New Kent Road, Kennington Lane, Vauxhall Bridge Road, Park Lane, Edgware Road,and Marylebone Road. No charge is made for driving on the Inner Ring Road itself.
We can see from the figure that the charging area is relatively small. It only covers 21 km2 (8miles2), representing 1.3% of the total 1,579 km2 (617 miles2) of Greater London.
There are 174 entry-and-exit boundary points around the zone. Traffic signs make clear theexact location of the charging zone. A red symbol accompanies the signs on each lane of trafficat the entry points to the charging zone. The Scheme charges all cars driving into or within thezone, plus those parked in nonprivate spaces within the zone, regardless of movement. Essen-tially, one can consider the charge a “day pass” for use of central London’s roads. The ROCOLreport (2000) used a further scenario encompassing all of inner London and a differentiated-price scheme using both zones. Ultimately, it was thought that implementating the Scheme inthe somewhat more manageable smaller size of central London would be more suitable as a firststep, with the possibility of later expansion.
The applicable hours of the Scheme are 7:00 AM to 6:30 PM, Monday to Friday, excludingbank and public holidays. This is a slight departure from the ROCOL recommendation of 7:00AM to 7:00 PM. The decision to change the evening end-time was primarily a result of lobbyingby the entertainment community who argued that having the charge apply until 7:00 PM woulddamage the West End and discourage theatre-goers from coming downtown.
Santos, Shaffer / LONDON CONGESTION CHARGING SCHEME 167
The Scheme charges allcars driving into orwithin the zone, plusthose parked innonprivate spaceswithin the zone,regardless of movement.
Figure 1: Map of the Charging ZoneSOURCE: www.london.gov.uk/approot/mayor/congest/pdf/zone_map.pdfNOTE: Map reproduced with permission from Transport for London.

The ROCOL consultants analyzed scenarios of £2.50, £5, and £10 charges. They used statedpreference results from surveys as well as spatially detailed representations of road-trafficmovements to estimate changes in travel conditions due to the introduction of area licensing.They predicted reductions in car trips and vehicle-km driven in Central London of 20% to 23%(ROCOL Working Group, 2000, pp. 69-70). These predictions are not out of line with what hasactually happened. TfL (2004) reports reductions in vehicle-km driven within the chargingzone during charging hours of 15% for vehicles with four or more wheels between 2002 and2003. For potentially chargeable vehicles (cars, vans, and lorries) the reduction of vehicle-kmdriven has been 25%. When only cars are considered, vehicle-km driven have been reduced by34%.
Because of the unsophisticated nature of an area-licensing scheme, the system lacks the abil-ity to adequately charge differentiated prices temporally and spatially. Ultimately, the mayorsettled upon the £5 charge, deciding that it provided adequate incentive to achieve significantcongestion reduction but with less public backlash likely to be associated with a £10 charge.The heavy goods vehicle (HGV) charge, originally set at £15 (3 times the car charge), wasreduced to be the same as that for cars.
The Scheme allows for a variety of 90% to 100% discounts, as well as exemptions. A sum-mary is shown in Table 1.
168 PUBLIC WORKS MANAGEMENT & POLICY / October 2004
Table 1: Exemptions and Discounts
Discount/Status Category
Fully exempt Motorcycles, mopeds, and bicyclesEmergency vehiclesPublic service vehicles with nine or more seats licensed as busesVehicles used by (and for) disabled persons that are exempt from VEDLicensed London taxis and minicabs
100% discount withfree registration
Certain military vehiclesLocal government service vehicles (e.g., refuse trucks, street maintenance)Vehicles with nine or more seats not licensed as buses (e.g., community minibuses)
100% discount with a one-off £10 registration
Vehicles driven by (or for) individuals or institutions that are Blue Badge holdersa
100% discount with£10 registration
Alternative fuel vehicles—requires emission savings 40% above Euro IV standardsRoadside assistance vehicles (e.g., motoring organizations such as the Automobile
Association)
90% discount with£10 registration
Vehicles registered to residents of the central zone
SOURCE: Transport for London, Congestion Charging Web site: www.cclondon.com/exemptions.shtmlNOTE: VED: Vehicle excise duty.a. Blue Badges, which existed before the scheme was implemented, are special parking permits issued to people withdisabilities to allow them to park near shops, stations, and other facilities. The badge belongs to the person who is dis-abled who qualifies for it (who may or may not be a car driver) and can be used in any vehicle he or she is traveling in.
Table 2: Methods of Payment
Percentage (%)
Retail outlets 36Telephone 19Post < 1Internet 26SMS text messaging 19
SOURCE: Transport for London (2004, p. 30).NOTE: SMS = short message service.

Payments can be made by a variety of methods. These are shown in Table 2, along with theirshare of use during the first year.
The charge has to be paid in advance or on the day until 10:00 PM with late payment availablebetween 10:00 PM and 12:00 AM but with the charge rising to £10 (U.S. $16). Drivers can paythe charge daily, weekly, monthly, or yearly. It is at the drivers’ initiative to pay the charge.
Enforcement is undertaken with video cameras. There is a network of 203 camera sites, withthese located at every entrance and exit to the congestion-charging zone as well as inside thecharging zone. The cameras provide high-quality video signals to ANPR software, which readsand records each number plate with a 90% accuracy rate. At midnight, images of all of the vehi-cles that have been in the congestion-charging zone are checked against the vehicle registrationnumbers of vehicles for which congestion charges have been paid that day. The computer keepsthe registration numbers of vehicles for which these charges have not been paid. A manualcheck of each recorded image is then made, and a penalty charge notice of £80 (U.S. $126) isthen issued to the registered keeper of the vehicle. As with parking penalties, this amount isreduced to £40 (U.S. $63) for prompt payment within 14 days. Failure to pay the penalty chargewithin 28 days results in the penalty being increased to £120 (U.S. $190).
Preliminary Results of the London Scheme
In this section, we summarize the traffic impacts of the Scheme over the first year.
EFFECTS ON TRAFFIC
According to TfL (2003a, 2003b, 2004), the average travel speed in the charging zone in thefirst few months after the Scheme was implemented, was 17 km/hour (10.6 miles/hour), and thiscontinued over the first year. This number compares with the average speed precharging, whichwas 14 km/hour (8.7 miles/hour), as listed in the TfL first annual report (2003c, p. 52). Therehas therefore been a 21% increase in average travel speeds in the charging area.
TfL defines congestion as “the difference between the average network travel rate and theuncongested (free-flow) network travel rate in minutes per veh-km” (TfL, 2003a, p. 46). Theuncongested network travel rate of 1.9 minutes/km (approximately 32 km/hour) from TfL(2003a, p. 52), and pre- and postcharging average travel rates of 4.2 and 3.5 minutes/km respec-tively, show that congestion has decreased from 2.3 to 1.6 minutes/km. Note that the optimalamount of congestion is not zero congestion. Zero congestion would suggest an underuse ofroad space. On the other hand, TfL admits that there is an optimal level of congestion, which isachieved at the optimal level of traffic. However, it considers the optimal level of congestion dif-ficult to define and that is the reason why it defines congestion using free-flow time as the base(TfL, 2003a). Bearing this caveat in mind, we can conclude that congestion has been reduced by30.5%. This calculated value is roughly equal to the listed value in the Update of SchemeImpacts and Operations (TfL, 2004, point 1.8, p. 4) of 30%. Furthermore, it is in line, albeit atthe upper end, with expectations of congestion reduction of between 20% and 30%.
Traffic levels are a measure of the volume or number of vehicles entering or driving withincentral London. Compared to precharging conditions, the count of all cars entering the centralzone has decreased by 31%. Increases in incoming motorcycles (by 19%), taxis (by 19%), andbuses (by 16%) have partially offset the reduction in the number of cars. Traffic levels (all vehi-cles) inside the central zone have decreased by 15%, again roughly in line (but at the upper end)with TfL’s expectations of 10% to 15%.
Finally, travel times also show significant improvements. Travel times to central Londonfrom outer London, inner London, and central London have all decreased. A basket of 5,000journeys from all areas of greater London showed a reduction in travel times of 13% (TfL,2003a, point 2.4, p. 5).
A summary of the above results is shown in Table 3.
Santos, Shaffer / LONDON CONGESTION CHARGING SCHEME 169
There has thereforebeen a 21% increase inaverage travel speeds inthe charging area.

Because traffic traveling on the Inner Ring Road does not pay the congestion charge, TfLexpected that through traffic, with origin and destination outside the charging zone, wouldinstead divert and use the Inner Ring Road . This indeed happened and raised the total vehicle-km on the Inner Ring Road by 4% when compared with 2002 (TfL, 2004). However, improvedtraffic management arrangements were put in place on the Inner Ring Road before the Schemestarted, and this prevented an increase in congestion. For example, between 1 and 2 secondswere taken off green-light time on radial roads, which were anticipated would have less traffic,and added to green-light time on the Inner Ring Road. This made a sufficient difference to keepthe Ring Road operating satisfactorily with marginally lower levels of congestion, compared toprecharging conditions.
Trafficmaster PLC, a private company that provides real-time traffic information on majorroutes, began a study on February 17, 2003, to assess the commuting impacts of the Schemeoutside the zone. Although after 6 months of monitoring, average travel times recorded byTrafficmaster had increased on most routes, there were no constant patterns. Table 4 shows theaverage travel times (in minutes) and travel time changes for the first 7 months after the Schemestarted. We can see from the table that most routes had longer travel times. Table 5 comparessome examples of how travel time on some routes increased and decreased in comparison to thesame month the year before and shows no constant pattern of variation.
170 PUBLIC WORKS MANAGEMENT & POLICY / October 2004
Table 3: Preliminary Effects on Traffic
Precharging Postcharging Change (%)
Average speed 14 km/h 17 km/h +21Congestion 2.3 min/km 1.6 min/km –30.5Traffic levelsa
Incoming (cars only) 193,912 133,016 –31Incoming (noncars) 178,149 193,485 +9Inside central zone na na –16Travel times to central zoneFrom outer London 59 min 52 min –12From inner London 37 min 33 min –11From central London 38 min 35 min –8Basket of 5,000 journeys 47 min 41 min –13
Source: Transport for London (2003a, b).NOTE: na = nonapplicable.Precharging: spring 2002; Postcharging: spring 2003.a. Data supplied by Transport for London on request.
Table 4: Average Workday Travel Times Into London (Morning Peak)
Feb. to Sept. 2002 Feb. to Sept. 2003 ChangeRoute Orientation (min) (min) (%)
A1 Mill Hill to Islington N-NW 46 49 7A41 Mill Hill, Five Ways to Regent’s Park NW 36 38 6A40/M Denham to Marylebone W 62 61 -3A4 Langley, Slough to Talgarth Road W 57 57 1A30 Stanwell to Osterley W-SW 15 16 6A316 Sunbury Cross to Ravenscourt Park W-SW 40 41 2A3 Cobham to Clapham SW 50 62 25A23 Hooley to Brixton S 59 64 8A20 Swanley to Eltham SE 20 23 14A2/A102 Dartford to Blackwall Tunnel E-SE 39 44 14A12 Harold Wood to Blackwall Tunnel E-NE 66 72 9A10 Waltham Cross to Stoke Newington N 44 51 15
SOURCE: Trafficmaster PLC (data supplied on request).

The apparent contradiction between Tables 3 and 4 can be explained by the fact that Table 4measures travel times all the way up to and including the charging zone, where travel times havedecreased and therefore push the average down. Table 4, on the other hand, does not include anyroad inside the charging zone.
EFFECTS ON PUBLIC TRANSPORT
TfL predicted that approximately 20,000 individuals would switch from car travel to publictransport during the morning peak period as a result of the Scheme. Of this number, 5,000 wereexpected to use the Underground system; 14,000, the buses; and the remainder, rail systemwithout transfers to bus or Underground. It was also expected that the morning peak hour (8:00AM to 9:00 AM) increase would be of an additional 7,000 bus users (TfL, 2002b).
Although bus ridership increased in line with expectations, Underground travel did not.Underground usage across London and especially in central London decreased. The decrease inpassenger levels on the London Underground is probably linked to the slowdown of the econ-omy and the decrease in tourism in London, which, in turn, may be linked to the war in Iraq(TfL, 2003b). In addition, the Central Line was temporarily closed for almost 3 months follow-ing a derailment at Chancery Lane station in January.
Average bus speeds in the morning peak did not change too much, and it is difficult to estab-lish a pattern of variation. Although speeds on some route sections increased, speeds on othersdecreased (TfL, 2003b). On the other hand, additional time waited by passengers over andabove the route schedule decreased by 25% across Greater London and by more than 33% in theroutes serving the charging zone and the Inner Ring Road (TfL, 2003b, point 3.75). To accom-modate the increase in bus ridership, TfL increased the number of buses in the central zone by19% over the year previous to the introduction of the Scheme. Other improvements included theaddition of new routes, the switch of 10 major routes from single-deck to double-deck buses,and the addition of 18-metre ‘bendy’ buses on heavily traveled routes.
The provision of good public transport is a key part of implementing a fair pricing scheme.Without or with inferior public transport alternatives, a road pricing scheme is just a regressivetax on the middle and poor classes.2 With good public transport, road pricing is, to some degree,a luxury tax—without it, it is just a regressive tax. TfL’s increase in the bus service before and
Santos, Shaffer / LONDON CONGESTION CHARGING SCHEME 171
Although bus ridershipincreased in line withexpectations,Underground travel didnot.
Table 5: Examples of Nonconstant Patterns in Percentage Changes in Travel Times
April 2002 April 2003 Change May 2002 May 2003 ChangeRoute (min.) (min.) (%) (min.) (min.) (%)
A1 Mill Hill to Islington 50.1 51.7 3 55.4 53.9 –3A41 Mill Hill, Five Ways to
Regent’s Park 35.8 38.4 7 42 46.4 10A40/M Denham to Marylebone 65.4 68.9 5 62.6 58.7 –6A4 Langley, Slough to Talgarth Road 58.6 56.1 –4 64.4 59.7 –7A30 Stanwell to Osterley 16.5 17.5 6 14.8 17.7 20A316 Sunbury Cross to Ravenscourt
Park 42.9 39.7 –7 44.3 48.4 9A3 Cobham to Clapham 58.4 59.3 2 51.2 66 29A23 Hooley to Brixton 66 66.7 1 64.8 71.6 10A20 Swanley to Eltham 23 23.2 1 21.7 26 20A2/A102 Dartford to Blackwall
Tunnel 46.7 46.7 0 40.7 45.8 13A12 Harold Wood to Blackwall
Tunnel 72.5 70.7 –2 71.7 69.4 –3A10 Waltham Cross to Stoke
Newington 55.8 58.1 4 53.4 57 7
SOURCE: Trafficmaster PLC (data supplied on request).NOTE: Both months are within school term.

after the Scheme started is an example of changes that need to be part of the process to promotefair social outcomes.
EFFECTS ON OTHER TRANSPORT
TfL (2003b, point 3.64) estimates that 15% to 25% of the reduction in car use per chargingday is the result of car users switching to other modes of transport—such as car share, motorcy-cles, and bicycles—or making adaptations such as altering travel plans to avoid the charginghours or charging zone, and walking. Table 6 shows that the total counts of bicycles and motor-cycles going into the charging zone increased by 31% and 19%, respectively. The increases,higher than TfL’s expectations (2003b, point 3.38), are not surprising, given the fact that neitherof those vehicle categories pays the charge. Surprisingly enough, the number of powered two-wheelers (motorcycles and mopeds) and bicycles involved in accidents following the introduc-tion of the Scheme fell by 15% and 17%, respectively, when compared to the same period in2002 (TfL, 2003b, point 3.97). These results probably reflect the long-term trend of decliningaccidents in London rather than any feature linked to the Scheme.
Incoming taxis also increased by 19%, more than TfL expected (2003b, point 3.38). In addi-tion, the count of working vehicles, such as LGVs and HGVs, decreased.
Although when PCU ratings are taken into account the percentage changes change, the finalresults do not change too much, mainly as a consequence of traffic composition. Table 6 showschanges in vehicle counts and in PCU counts. It can, therefore, be concluded that the increase inthe use of buses, taxis, motorcycles, and bicycles does not jeopardize the reduction in overalltraffic, which has been larger than expected. Grounds to extend the charge to include other vehi-cle categories, as done in Singapore, seem absent.
Empirical Analysis
This section includes a calculation of the elasticity of demand for car trips with respect to thegeneralized cost of travel, as well as a calculation of the marginal cost of congestion within thecentral London zone. The results are then compared with estimates from the literature.
PRICE ELASTICITY OF DEMAND
An elasticity measures the percentage change in one variable with respect to a percentagechange in another. Herein it measures the responsiveness of demand for trips due to a change intravel costs. The generalized costs of travel include money costs and time costs, as defined inEquation 1.
To proceed with the calculations, it is necessary to determine the average generalized cost oftravel into central London. The U.K. Automobile Association provides detailed estimates ofmotoring costs (money costs) for cars, split out by fixed and variable costs (Automobile Associ-ation, 2003). The values depend on annual mileage (for fuel, maintenance) and cost of vehicle(financing, insurance, depreciation).
We had to make several assumptions in selecting the appropriate measure of motoring costs.Firstly, we chose the Automobile Association’s above-average cost of car category to reflect thefact that the average Londoner has a higher income than the national average (National Statis-tics, 2003). The cost of a car affects the fixed costs of insurance and financing. To attain per kmcosts, we used the average annual distance driven by a Londoner of 8,800 km (5,466 miles)(TfL, 2001, p. 2). The corresponding motoring costs for an average Londoner are thus roughly47.5 pence/km (U.S. $1.2/mile), of which 12.25 pence (U.S. $0.20 cents) are variable costs. Themotoring costs are presented in Table 7.
To calculate time costs, it is necessary to determine a value of travel time savings (VTTS).The Transport Economics Note (Department of the Environment, Transport, and the Regions,
172 PUBLIC WORKS MANAGEMENT & POLICY / October 2004

Tab
le 6
:V
ehic
le C
ount
s P
re-
and
Pos
tcha
rgin
g
Bus
&H
GV
sTo
tal
Peda
l and
Peda
l Cyc
les
Mot
orcy
cles
Car
sTa
xis
Coa
chL
GV
s&
Oth
er4+
Whe
els
Tota
lN
onca
rsM
otor
cycl
es
Spri
ng 2
002
inco
min
g13
,836
25,8
4019
3,91
255
,971
13,3
9353
,780
15,3
2933
2,38
637
2,06
217
8,14
939
,676
Spri
ng 2
002
outg
oing
11,3
4622
,940
192,
840
57,0
3613
,079
59,4
8716
,256
338,
697
372,
982
180,
143
34,2
85Sp
ring
200
2 to
tal
25,1
8148
,780
386,
752
113,
007
26,4
7211
3,26
731
,585
671,
083
745,
044
358,
292
73,9
61Sp
ring
200
3 in
com
ing
18,1
3130
,779
133,
016
66,8
3615
,518
48,7
4513
,476
277,
591
326,
501
193,
485
48,9
10Sp
ring
200
3 ou
tgoi
ng12
,535
25,4
2612
5,15
164
,917
15,7
3550
,660
14,4
0227
0,86
530
8,82
618
3,67
537
,961
Spri
ng 2
003
tota
l30
,666
56,2
0525
8,16
813
1,75
331
,253
99,4
0527
,878
548,
456
635,
328
377,
160
86,8
71C
hang
es (
%)
Inco
min
g ve
hicl
es31
19–3
119
16–9
–12
–16
–12
923
Out
goin
g ve
hicl
es10
11–3
514
20–1
5–1
1–2
0–1
72
11To
tal v
ehic
les
2215
–33
1718
–12
–12
–18
–15
517
PCU
rat
ings
0.2
0.5
11
2.5
1.5
2.5
Cha
nges
(%
)In
com
ing
PCU
s–1
4–1
33
21O
utgo
ing
PCU
s–1
7–1
6–1
11To
tal P
CU
s–1
6–1
51
16
SOU
RC
E: T
rans
port
for
Lon
don,
dat
a pr
ovid
ed o
n re
ques
t.N
OT
E: P
CU
= p
asse
nger
car
uni
ts, L
GV
s =
ligh
t goo
ds v
ehic
les,
HG
Vs
= h
eavy
goo
ds v
ehic
les.
173

2001) provides base figures and guidelines on how to estimate working and nonworking VTTS.Another source for VTTS in the United Kingdom is a report to the Department for Transport byMackie et al. (2003). This comprehensive report reexamines a substantial stated preference dataset used in an earlier investigation commissioned by the same department in 1994. In addition,the results are cross-referenced with those obtained from meta-analysis. Table 8 details some oftheir recommended estimates.
Although we computed the elasticity of demand following the Transport Economics Note(Department of the Environment, Transport, and the Regions, 2001) in the first instance, wealso used another set of values following the recommendations in Mackie et al. (2003). Themain difference between the two documents is that Mackie et al. (2003) recognize that althoughcommuting trips are nonworking they tend to have a slightly higher VTTS than shopping or lei-sure trips.3
To produce working and nonworking VTTS following the Transport Economics Note(Department of the Environment, Transport, and the Regions, 2001), we updated the values to2003 prices. We also increased the working value of time by 34%, to reflect the difference in theaverage earnings in London, as indicated in the New Earnings Survey 2003 (National Statistics,2003). We considered two categories of trips: working, as trips made in the course of work,excluding commuting, and nonworking. We estimated the working VTTS at 42.2 pence/minuteand the nonworking VTTS at 4.9 pence/min. TfL provided us with provisional data indicat-ing that 10% of car trips in London are business trips. The weighted VTTS we used was there-fore 8.6 pence/minute. Using the average car occupancy rate of 1.35 (TfL, 2002c, p. 19), thisamounts to 11.7 pence/PCU-minute. Other numbers needed to calculate the elasticities areshown in Table 9.
Using all this information, we computed the percentage change in generalized costs. We esti-mated elasticities of demand for trips by car with respect to changes in generalized costs includ-ing all vehicle costs as well as generalized costs including time costs and car running costs butexcluding fixed costs. For a change in travel demand, the appropriate statistic is the 31% reduc-
174 PUBLIC WORKS MANAGEMENT & POLICY / October 2004
Table 7: Motoring Costs
Standing Costs (£ Annual)
Road tax 160Insurance 448Cost of capital 412Depreciation 2080Standing costs total (pence/km) 35.2Running costs (pence/km)
Fuel 7.18Service: tires, parts, and labor 3.95Parking 1.13Running costs total (pence/km) 12.25Total costs (pence/km) 47.48
SOURCE: U.K. Automobile Association at www.theaa.com/allaboutcars/advice/advice_rcosts_home.html
Table 8: Estimates of the Value of Car Travel Time Savings at End of 1997 Values
Income Band Commuting (p/min) Other (p/min)
Below £17,500 3.6 4.6£17,500 to £35,000 5.9 5.9Above £35,000 8.6 7.1
SOURCE: Mackie et al. (2003).NOTE: p/min.: pence/minute.

tion in car travel entering the central zone. This statistic best represents the demand response ofthose who are not exempt from the charge, such as residents. Unfortunately it is not possible todetermine whether the reduction in demand for car trips is entirely the result of the charge or theresult of a combination of factors in addition to the charge, such as the economic slowdown.
Table 10 presents the results. The most relevant value in the short run is –1.32, as thatexcludes fixed costs from the calculations.
For the calculations following Mackie et al. (2003), we considered three categories of trips:working, commuting, and other. Of all trips made by car in London, 10% are for business pur-poses, 26% for commuting, and 64% for other purposes such as leisure, shopping, etc.4 Wederived the value of working time from the gross weekly earning in London indicated in theNew Earnings Survey 2003 (National Statistics, 2003). We took the VTTS for commuting andother purposes for different income levels from Mackie et al. (2003), updated them to 2003 val-ues, and calibrated them to the average salary in London. In this way, we estimated the averageVTTS at 32.9 pence/minute, 7.7 pence/minute, and 6.4 pence/minute for working, commut-ing, and other-purpose car trips, respectively. The weighted VTTS we used was therefore 9.4pence/min, equivalent to 12.7 pence/min, assuming a car occupancy rate of 1.35. Thus, weobtained elasticities of –2.5 and –1.6, very similar to –2.1 and –1.3 of Table 10.
Literature regarding elasticity of demand with respect to congestion charges is relativelyrare. In Singapore, however, where charges are revised regularly, there has been considerablescope for evaluating effects of price changes. Dodgson et al. (2002) summarize various studies
Santos, Shaffer / LONDON CONGESTION CHARGING SCHEME 175
Table 9: Details of an Average Trip by Car in London
Distance traveled per daya 23.4 kmTime traveled per day (precharging) 94 minTime savings per day (postcharging) 12 minVehicle costs 47.5 pence/kmRunning costs 12.3 pence/kmValue of time per car 11.7 pence/minAverage occupancy 1.35
a. Transport for London (2002a) concludes that the average car trip in London is 11.7 km (Table 7.1, p. 25) and two tripsper day are assumed in the current study.
Table 10: Elasticities of Demand for Car Trips With Respect to Costs
All GC GC Excluding Fixed Costs
Occupancy rate 1.35 1.35Average car trip (km) 11.7 11.7Number of trips per day 2 2VTTS per person (pence/min) 8.6 8.6Time per trip (min) 47 47Time savings per trip (min) 6 6Vehicle operating costs (pence/km) 47.5 12.3GC per day (£) 22.07 13.82Toll (£) 5.00 5.00Time benefits (£) 1.40 1.40Reliability benefitsa (£) .35 .35Change in GC (£) –3.25 –3.25Change in GC (%) –14.7 –23.5Change in Demand (%) 31 31Elasticity –2.1 –1.3
SOURCE: Own calculations with numbers from Tables 7 and 9.NOTE: Dodgson, Young, and van der Veer (2002) argue that reliability benefits are worth approximately 25% of timebenefits.a. VTTS = value of travel time savings.

for Singapore suggesting point elasticities in the order of –.12 to –.35 with respect to congestioncharges.
More commonly calculated are elasticities of demand with respect to fuel prices. Goodwin(1992) calculated short-run and long-run elasticities of –.16 and –.32, respectively. These num-bers are still considered standard values for the responsiveness of car travel demand withrespect to changes in fuel prices (Graham & Glaister, 2002).
As a general rule, the sensitivity of demand to generalized cost changes will broadly be equalto the fuel price elasticity divided by the fuel share of generalized cost (Dodgson et al., 2002,p. 28). For example, if fuel costs change by 10%, but the share of fuel costs in terms of total costsis only one fourth, then generalized costs have changed by only 2.5%. In heavily congestedLondon, where time costs have a much larger share of total costs, the share of fuel costs can beestimated at roughly 8% to 16%, with the higher range going to the running-costs-only scenar-ios. Therefore, Goodwin’s value of –.16 for short-run fuel price elasticity corresponds to a gen-eralized cost elasticity of between –1.3 and –2.1, exactly the values computed in Table 10.
These high elasticities in London are probably linked to the wide availability of public trans-port. In a region with poor public transport alternatives, we would expect to observe a lowerelasticity of demand for travel by car.
MARGINAL CONGESTION COST
As explained earlier, the MCC is equal to the value of time divided by speed, then multipliedby the elasticity of speed with respect to flow.
MCCb
s qesq=
( )(5)
This expression typically computes the MCC of vehicles on a given link. Here the sameexpression computes an “area MCC,” when traffic is assumed to be homogeneous within thesmall, congested central zone with disregard for link-versus-intersection differences.
The calculations within the central zone can thus be carried out assuming that speed withinthe zone has risen from 14 km/hour to 17 km/hour (21% increase) and total traffic levels, mea-sured in PCUs and including all vehicle types, have decreased by 15%, as indicated in Table 6.
The average VTTS within the central zone was estimated at 29.6 pence/PCU-minute at 2003prices. This value computes the precharging shares of traffic as implied by Table 6, their associ-ated PCU values and occupancy rates, and trip purposes as provided by TfL on request. Follow-ing the practice set for the London Congestion Charging Research Programme (MVA Consul-tancy, 1995 ) and for the ROCOL study (ROCOL Working Group, 2000) a single value of timewas used for all modes in the case of working time, and a single value of time was used for allperson types in the case of nonworking time.
Ordinarily, flow measures in terms of vehicles per hour on a link; however, in the context ofan urban setting, this link-based measurement is less applicable. Therefore, the use of trafficvolumes serves as a better proxy for flow in urban areas. Using this data, the implied area mar-ginal cost of congestion is:
MCC = × × =29 6 60
14
0 21
015186 5
. .
.. pence/PCU-km.
When converted to vehicle-km from PCU-km using an average PCU/vehicle rate of 1.13, thecalculated MCC is 165 pence/vehicle-km at 2003 prices. This calculated MCC value is higherthan the value computed by Sansom, Nash, Mackie, Shires, and Watkiss (2001), who by esti-mating speed-flow relationships for a variety of road settings, calculated a MCC of 86 pence/vehicle-km updated to 2003 prices in a major urban center such as London. The values we esti-mated here, however, rest on the latest data and empirical evidence and are therefore morereliable.
176 PUBLIC WORKS MANAGEMENT & POLICY / October 2004

The estimated area MCC of £1.65 illustrates that for the £5 congestion charge to reflect onaverage the congestion externality, an average vehicle would need to travel a distance of about 3km/day inside the charging zone, which is a reasonable expectation given that the zone has adiameter of roughly 5 km.
Costs and Benefits
The capital costs of the Scheme were approximately £200 million at 2003 prices, most ofwhich the central government provided.5 The annual operational costs and benefits are pre-sented in Table 11, as detailed in the Six Months On report (TfL, 2003b). The table suggests a netbenefit of around £50 million for the first year of operation.
A 5-year monitoring program has been set up, beginning 1 year before the start of chargingand ending 4 years after. It consists of more than 100 surveys and studies designed to measureand understand the impacts of the Scheme. Although 1 year into the Scheme may still be early todraw any conclusions, it is clear that the Scheme will have economic, social, and environmentalimpacts. The monitoring program is already assessing all these different aspects, and Transportfor London will produce annual reports describing and explaining them.
Westminster City Council conducted a survey to find out how businesses felt about the con-gestion charge. Of all the respondents, 68% have their businesses inside the charging zone, 44%are retailers, and 27% are bars and/or restaurants (Westminster City Council, 2003). Almost69% of the respondents feel the Scheme has had a negative impact on their business, 8% feel ithas had a positive impact, and 23% feel it has had no impact. Almost 28% of the respondents areconsidering relocating outside of the zone as a result of the charge.
During October and November 2003, TfL surveyed more than 700 businesses in and aroundthe charging zone. Concerns about the negative impact of the Scheme mainly came from theretail and leisure sectors, which reported a 2% reduction in sales for the first half of 2003 (TfL,2004). According to these sectors, the reasons for the decline in sales were economic and tour-ism factors, though congestion charging constituted about one fifth of the reported causes (TfL,2004).
TfL (2004) presents some preliminary evidence of the relationship between the reduction insales, tourism, and Underground patronage. The main conclusion is that retail sales and tourism
Santos, Shaffer / LONDON CONGESTION CHARGING SCHEME 177
The table suggests a netbenefit of around £50million for the first yearof operation.
Table 11: Preliminary Estimates of the Annual Costs and Benefits of the London Scheme (£ million at 2003prices)
Annual costsTransport for London administrative and other costs 5Scheme operation 90Additional bus costs 20Charge payer compliance costs 15Total 130
Annual benefitsTime savings to car and taxi occupants, business use 75Time savings to car and taxi occupants, private use 40Time savings to commercial vehicle occupants 20Time savings to bus passengers 20Reliability benefits to car, taxi, and commercial vehicle occupants 10Reliability benefits to bus passengers 10Vehicle fuel and operating savings 10Accident savings 15Disbenefit to car occupants transferring to public transport, and so on –20Total 180
SOURCE: Transport for London (2003b, Table 3).

numbers are strongly correlated and show a negative trend during the first months of 2003.Underground patronage during 2003 was 7% to 10% lower in the charging zone and 4% to 7%lower across the entire network when compared with 2002. When Underground travel is addedon to the analysis, the significant reductions in Underground travel during spring 2003 (reflect-ing not only lower tourism levels but also the Central line closure) coincide with the period ofnegative retail growth (TfL, 2004, p. 25). Although the exact impact cannot be quantified, a linkbetween the decline in Underground travel and in sales in the charging zone is clear. TheScheme encouraged the switch from the car to the Underground. A reduction in Undergroundtravel cannot be linked to the Scheme in any way.
A central area where the centers of government, law, business, finance, retail activity, andentertainment concentrate creates positive externalities. With businesses considering relocationin the long run, the benefits of the Scheme would be affected by losses in social welfare, mainlya result of the loss of these positive externalities. It is early to determine what the trend will be,and some more monitoring is needed before any conclusions can be drawn.
Use of Revenues
The mayor’s transport strategy (Greater London Authority [GLA], 2001), as well as conges-tion reduction, also includes objectives such as investing in the Underground, improving busservices, and integrating National Rail with other transport systems. The GLA Act 1999 (Actsof Parliament, 1999) ensures that revenues from charging schemes will be earmarked for themayor’s transport strategy projects for at least 10 years from their implementation date.
Transport investment in London has been inadequate since the mid 1980s and, therefore,unable to accommodate economic and demographic growth, resulting in high levels of conges-tion together with overcrowded and unreliable public transport (GLA, 2001, p. 23). The plan torevert the situation entails delivering the necessary additional public transport capacity and reli-ability in conjunction with demand management policies, such as congestion charging.
The Scheme raised £68 million in 2003/04 and is expected to raise £80 to £100 million infuture years for investment in transport.6 Transport improvements in London in 2003/04 totaled£82.8 million at 2003 prices (GLA, 2004, p. 51). The difference was covered with resources thatbecame available from other sources such as increased revenues from public transport.7 TfLconstantly monitors changes in revenues from the Scheme, as well as other incomes and expen-diture. It constantly adjusts the budget appropriately and makes reallocations where necessary.
The Mayor’s Annual Report (GLA, 2004, p. 51) gives details of the transport improvementscarried out in the period 2003/04. Of the £82.8 million, £62.8 million were allocated to bus net-work improvements (higher frequencies, additional routes, enhanced route supervision, andconversion to higher capacity routes); £10.5 million to road safety (research, engineeringworks, and education campaigns); £2 million to safer routes to schools, £6 million to walkingand cycling (strategic and local engineering schemes on all London’s roads as well as informa-tion campaigns); and £1.5 million to freight (measures to make the distribution of goods moresustainable).
A very important factor in the success of the Scheme is the revenues going back into thetransport sector. Londoners can see where the money is going. The integrated nature of TfLseems to be a positive example of the kind of coordination that may produce good social out-comes from a pricing scheme.
Equity Impacts
A regressive tax, by definition, takes a larger percentage of the income of low-income peoplethan of high-income people. Strictly speaking, a congestion charge is not a tax but is perceivedas a tax by the motoring public. According to the System of National Accounts 1993 (Commis-
178 PUBLIC WORKS MANAGEMENT & POLICY / October 2004
sion of the European Communities et al., 1993) taxes are “compulsory, unrequited payments”for which “the government provides nothing in return to the individual unit making the pay-ment, although governments may use the funds raised in taxes to provide goods or services toother units” (Point 8.43).
Although congestion charges are not taxes, they are still regressive in the sense that they donot vary with income (i.e., the charge paid by drivers is the same regardless of their income). Adaily toll of £5 to drive into central London, for example, represents a larger percentage of theincome of low-income people than of the income of high-income people.
In that sense the Scheme may be having perverse impacts on lower income groups. Althoughthe answer to this problem would be a switch to public transport, the necessary conditions ofreliability, safety, and frequency may have been met during the times of operation of the Schemebut not during other times, and this may pose a problem. For example, when low-income work-ers drive into the charging area at early hours in the morning (2:00 AM for some butchers) thecharge does not apply, yet they have to pay the charge when they finish work later in the morningand want to leave the zone to drive home. Public transport during the night is perceived as infre-quent, unsafe, or unreliable. These low-income workers have to choose between the inconve-nience of traveling by bus or paying the charge when they finish work. The 5-year monitoringprogram will assess any impacts on equity when more evidence becomes available.
The data on traffic counts presented in Table 6 combined with the occupancy rates given inthe London Travel Report 2002 (TfL, 2002b, Table 5.1, p.19) and in the Transport EconomicsNote (Department of the Environment, Transport, and the Regions, 2001, Table 2/3 imply that52% of all people traveling to or from the charging zone used buses before the Scheme wasintroduced. Taxi, pedal, and motorcycle use raises the total share of people that did not use achargeable mode of transport before the Scheme to 63.9%. These are winners, in the sense thatthey are enjoying lower congestion without paying a penny, and suffer no disutility from chang-ing mode. From a very conservative point of view, the remaining 36.1% would be losers. How-ever, those with very high values of time also have a net benefit after paying the congestioncharge. In addition, Table 1 gives a number of exemptions and discounts. The share of peopletravelling by car was reduced from 27% to 18%; thus 9% of the original car users have trans-ferred to some other mode or made alternative arrangements. The second part of Table 11 showsa disbenefit of £20 million for this group.
Conclusions
The preliminary results suggest that the London Scheme has so far succeeded in achievingthe stated congestion reduction targets. Traffic decreased by more than expected, which meansthat elasticities might have been underestimated prior to the implementation of the Scheme.Goodwin (2003) suggests that elasticities were revised down by a sort of so-called ratchet effectfrom one study to the next. Their authors probably wanted to be conservative and would choosethe lowest estimate. The fact that public transport in London was substantially improved beforethe Scheme started points to the rationale for these high elasticities of demand.
The calculated area MCC suggests that the £5 charge is a reasonable approximation to mar-ginal cost pricing.
The largest potential hurdle, the political one, is perhaps where the largest success has beenmade. Although economists have suggested for over 80 years that drivers should face the truesocial cost of their actions, it is inevitably a politically unpopular decision to implement anyform of charge on the act of driving. However, despite this there has been surprisingly little pub-lic backlash. The system is simple, feasible, and transparent, a key factor that accounts for itssuccess. Furthermore, the hypothecation of revenues, guaranteed by the Greater LondonAuthority Act 1999 (Acts of Parliament, 1999), and a lengthy consultation process before theScheme was introduced provided a feeling of trust to the public in knowing where their moneywould be spent. Surveys carried out by Market & Opinion Research International, an independ-
Santos, Shaffer / LONDON CONGESTION CHARGING SCHEME 179
The preliminary resultssuggest that the LondonScheme has so farsucceeded in achievingthe stated congestionreduction targets.

ently owned research company in the U.K., show that although only 50% of London residentssupport the Scheme, 73% think it has been effective at reducing congestion (Market & OpinionResearch International, 2003).
Public consultation on a revision to the mayor’s transport strategy began on February 16,2004 and lasted for 10 weeks. The revision would allow an extension of the charging zone toinclude parts of the City of Westminster, the Royal Borough of Kensington and Chelsea (GLA,2004, p. 52). This reform would double the size of the charging area, imply higher revenues, andthereby allow more investment in public transport.
In London, where traffic had returned to speeds of 100 years ago (TfL, 2002a) the costs ofcongestion were recognized as being too high and the public acknowledged that supply-sidemeasures do not work in themselves. The introduction of congestion charging to one of themajor cities of the world is perhaps a sign that the world is ready to shift road pricing from itstheoretical hideaway to a practical center stage.
Notes
1. The following year the Transport Act 2000 (Acts of Parliament, 2000) was passed, allowing for joint schemes,including ones involving London authorities, as long as the order has been submitted to and confirmed by the GreaterLondon Authority. This power to make joint local-London charging schemes does not limit any of the powers to intro-duce road-user charging in greater London given by the Greater London Authority Act 1999.
2. A brief discussion on the potential equity impacts of the Scheme is presented beginning on page 178.3. This is probably because of the potential penalty for arriving late.4. These figures were provided by TfL on request and are part of the London Area Transport Survey 2001, House-
hold Survey, Interim weighted data. They will be included in the London Travel Report 2003 when it is published.5. Information provided by TfL via e-mail.6. Even though net revenues were £69 million (U.S. $108 million), net economic benefits were £50 million (U.S.
$78 million).7. Information provided by GLA via e-mail, on request.
References
Acts of Parliament. (1999, November). Greater London Authority Act 1999 c. 29. London: Her Majesty’s StationeryOffice. Retrieved March 24, 2003, from www.hmso.gov.uk/acts/acts1999/19990029.htm
Acts of Parliament. (2000, December). Transport Act 2000 c. 38. London: Her Majesty’s Stationery Office.Automobile Association. (2003). Your guide to motoring costs. Retrieved July 2, 2003, from www.theaa.com/
allaboutcars/advice/advice_rcosts_home.htmlCommission of the European Communities, International Monetary Fund, Organisation for Economic Co-operation
and Development, United Nations, and World Bank. (1993). System of national accounts 1993. Brussels, Luxem-bourg, New York, Paris, Washington, DC: Author.
Department of the Environment, Transport, and the Regions. (2001, March). Transport economics note. Retrieved Octo-ber 27, 2003, from www.dft.gov.uk/stellent/groups/dft_transstrat/documents/page/dft_transstrat_504865.hcsp
Dodgson, J., Young, J., & van der Veer, J. (2002, February). Paying for road use (Technical report, A report to the Com-mission for Integrated Transport, National Economic Research Associates [NERA]). Retrieved March 1, 2003,from www.cfit.gov.uk/research/pfru/pdf/pfru-tech.pdf
Goodwin, P. (2003, October 29-31). The economic cost of congestion when road capacity is constrained: Lessons fromcongestion charging in London. CD-ROM 16th International Symposium on Theory and Practice in Transport Eco-nomics of the European Conference of Ministers of Transport, Budapest, Hungary.
Goodwin, P. B. (1992). A review of new demand elasticities with reference to short and long run effects to price changes.Journal of Transport Economics and Policy, 26(2), 155-169.
Graham, D., & Glaister, S. (2002). The demand for automobile fuel: A survey of elasticities. Journal of Transport Eco-nomics and Policy, 36(1), 1-25.
Greater London Authority. (2001) The mayor’s transport strategy. London: Greater London Authority. Available atwww.london.gov.uk/mayor/strategies/transport/trans_strat.jsp
Greater London Authority. (2004). The mayor’s annual report 2004. London: Greater London Authority. Available atwww.london.gov.uk/mayor/annual_report/docs/ann_rpt_2004.pdf
Hardin, G. (1968, December 13). The tragedy of the commons. Science, 162(3859), 1243-1248.Mackie, P., Wardman, M., Fowkes, A., Whelan, G., Nellthorp, J., & Bates, J. (2003). Values of travel time savings in the
UK: Summary report (Report to the Department of Transport, Institute for Transport Studies, University of Leeds).Available at www.its.leeds.ac.uk/working/downloads/VOTSummary.pdf
180 PUBLIC WORKS MANAGEMENT & POLICY / October 2004
Market & Opinion Research International. (2003, July 9). Poll and surveys archive: London mayor ratings. RetrievedNovember 4, 2003, from www.mori.com/polls/2003/gla-june.shtml
May, A. D., Liu, R., Shepherd, S. P., & Sumalee, A. (2002). The impact of cordon design on the performance of roadpricing schemes. Transport Policy, 9(3), 209-220.
Ministry of Transport. (1964). Road pricing: The economic and technical possibilities. London: Her Majesty’s Sta-tionery Office.
MVA Consultancy. (1995). The London Congestion Charging Research Programme: Final report. London: Her Maj-esty’s Stationery Office.
Nash, C. (1997). Transport externalities: Does monetary valuation make sense? In G. de Rus & C. Nash (Eds.), Recentdevelopments in transport economics (pp. 232-254). Aldershot, UK: Ashgate.
Nash, C., & Sansom, T. (2001). Pricing European transport systems. Journal of Transport Economics and Policy, 35(3),363-380.
National Statistics. (2003, October). New earnings survey 2003. Retrieved October 28, 2003, from www.statistics.gov.uk/pdfdir/nes1003.pdf
Newbery, D. M. (1990). Pricing and congestion: Economic principles relevant to pricing roads. Oxford Review of Eco-nomic Policy, 6(2), 22-38.
Pigou, A. C. (1920). The economics of welfare. London: Macmillan.ROCOL Working Group. (2000). Road charging options for London: A technical assessment. London: Her Majesty's
Stationary Office. Retrieved May 25, 2002, from www.hmso.gov.uk/acts/acts2000/20000038.htmSansom, T., Nash, C., Mackie, P., Shires, J., & Watkiss, P. (2001, July) Surface transport costs and charges: GB 1998
(Final report to the Department of Environment, Transport and the Regions, Institute for Transport Studies, Univer-sity of Leeds). Retrieved February 24, 2003, from www.its.leeds.ac.uk/projects/STCC/downloads/SurfaceTransportCostsReport.pdf
Shepherd, S. P., & Sumalee, A. (2004). A genetic algorithm based approach to optimal toll level and location problems.Networks and Spatial Economics, 4, 161-179.
Transport for London. (2001). Transport statistics for London 2001. Retrieved July 2, 2003, from www.tfl.gov.uk/tfl/pdfdocs/stats2001.pdf
Transport for London. (2002a). Congestion charging: The 11 key numbers. Retrieved February 24, 2003, www.tfl.gov.uk/tfl/cc_fact_sheet_key_numbers.shtml
Transport for London. (2002b). Congestion charging: Public transport improvements before. Retrieved March 24,2003, from www.tfl.gov.uk/tfl/cc_improve_pt_before.shtml
Transport for London. (2002c). London travel report 2002. Retrieved July 10, 2003, from www.tfl.gov.uk/tfl/reports_library_stats.shtml
Transport for London (2003a, June). Central London congestion charging scheme: Three months on. Retrieved June 25,2003, from www.tfl.gov.uk/tfl/pdfdocs/congestion_charging/cc-three-month-report.pdf
Transport for London. (2003b, October). Congestion charging: Six months on. Retrieved October 23, 2003, fromwww.tfl.gov.uk/tfl/downloads/pdf/congestion-charging/cc-6monthson.pdf
Transport for London (2003c, June). Impacts Monitoring Programme: First annual report. Retrieved June 25, 2003,from www.tfl.gov.uk/tfl/cc_monitoring.shtml
Transport for London. (2004), Congestion charging: Update on scheme impacts and operations. Available fromwww.tfl.gov.uk/tfl/downloads/pdf/congestion-charging/cc-12monthson.pdf
Verhoef, E. (2002). Second-best congestion pricing in general networks: Heuristic algorithms for finding second-bestoptimal toll levels and toll points. Transportation Research B, 36(8), 707-729.
Walters, A. (1961). The theory and measurement of private and social cost of highway congestion. Econometrica, 29(4),676-699.
Westminster City Council. (2003). Congestion charging: Business survey: Results of Congestion Charging Survey.Available from www.westminster.gov.uk/roadsandstreets/congestioncharging/business_form.cfm
Zhang, X., & Yang, H. (2004). The optimal cordon-based network congestion pricing problem. TransportationResearch B, 38, 517-537.
Santos, Shaffer / LONDON CONGESTION CHARGING SCHEME 181