Smart Charging Strategies and Technologies for Electric ...
186
SMART CHARGING STRATEGIES AND TECHNOLOGIES FOR ELECTRIC VEHICLES Simulation-based study to evaluate the effects of E-mobility smart charging strategies A CRITICAL REVIEW Led by Fraunhofer-Institute for Energy Economics and Energy System Technology IEE, Kassel In cooperation with
-
Upload
khangminh22 -
Category
Documents
-
view
19 -
download
0
Transcript of Smart Charging Strategies and Technologies for Electric ...

SMART CHARGING STRATEGIES AND TECHNOLOGIES FOR ELECTRIC VEHICLESSimulation-based study to evaluate the effects of E-mobility smart charging strategies
A CRITICAL REVIEW
Led by Fraunhofer-Institute for Energy Economics and Energy System Technology IEE, Kassel
In cooperation with


SMART CHARGING STRATEGIES AND TECHNOLOGIES FOR ELECTRIC VEHICLESSimulation-based study to evaluate the effects of E-mobility smart charging strategies
A CRITICAL REVIEW

Acknowledgement
This publication has been prepared by Fraunhofer-Institute for Energy Economics and Energy System Technology IEE,
Kassel in collaboration with Indian Institute of Technology, Bombay (IITB), Technical University of Denmark (DTU), and
Universidad Pontificia Comillas (IIT Comillas), and Deutsche Gesellschaft für Internationale Zusammenarbeit GmbH (GIZ)
India, as a part of the Nationally Determined Contributions - Transport Initiative for Asia (NDC-TIA) initiative. NDC-TIA
is implemented by a consortium of seven organizations led by GIZ and funded by the German Federal Ministry for the
Environment, Nature Conservation and Nuclear Safety (BMU) under its International Climate Initiative (IKI).
Authors:
IIT Bombay: Prof. Zakir Rather, Ms. Payal Vyankat Dahiwale, Ms. Dhanuja Lekshmi
Fraunhofer IEE: Mr. Andre Hartung
Contributors:
IIT Bombay: Mr. Soudipan Maity
Fraunhofer IEE: Dr. Ron Brandl
IIT Comillas: Prof. Pablo Frías
DTU: Prof. Qiuwei Wu
Advisors:
Fraunhofer IEE: Dr. Norbert Henze
Reviewers:
GIZ: Ms. Shweta Kalia, Ms. Sahana L, Mr. Sudhanshu Mishra, Mr. Sushovan Bej, Ms. Toni Zhimomi, Ms. Bhagyasree, Mr.
Kaustubh Arekar
Responsible:
Dr. Indradip Mitra
Country Coordinator for NDC-TIA India Component (GIZ)

Disclaimer
While care has been taken in the collection, analysis, and compilation of the data, Deutsche Gesellschaft für Internationale
Zusammenarbeit (GIZ) GmbH does not guarantee or warrant the accuracy, reliability, completeness, or currency of the
information in this publication. The mention of specific companies or certain projects/products does not imply that they
are endorsed or recommended by the members of this publication. The information provided is without warranty of any
kind. GIZ and the authors accept no liability whatsoever to any third party for any loss or damage arising from any
interpretation or use of the document or reliance on any views expressed herein.

Smart Charging Strategies and Technologies for Electric Vehicles Simulation-based study to evaluate the effects of E-mobility smart charging strategiesiv
v Smart Charging Strategies and Technologies for Electric Vehicles Simulation-based study to evaluate the effects of E-mobility smart charging strategies
CONT
ENTS
PART- A
Chapter 1: Introduction: Review of Smart Charging Strategies and technologies 11.1 About this Study 2
1.2 Aim of the Study 3
1.3 Objectives of the Study 4
1.4 About this Report 4
Chapter 2: Smart Charging of Electric Vehicles 52.1 Challenges with dumb charging 5
2.2 Key stakeholders involved in smart charging 6
2.3 Potential Benefit of Smart Charging 7
2.4 Levels of Smart Charging 9
Chapter 3: Smart Charging Technologies 113.1 Charger types and description of technologies for EV charging 11
3.2 Connectors 16
3.3 Relevant Standards 18
3.4 Communication protocols 21
3.5 Power Electronics 23
3.6 Smart Control functionalities 32
3.7 Comparison Framework of Commercially Available EV Chargers 34
3.8 Commercially available Smart Charging products and technologies 35
3.9 Commercially available charging stations 44
3.10 Smart Chargers in India and its capabilities 52
3.11 Smart EV Charging Projects 71
Chapter 4: Gap Analysis of Indian States EV Policies from Smart Charging Perspective 914.1 Interventions Required in Policies for Smart Charging,
Communication, and ICT 96
PART- B Technical review of various ev smart charging strategies 99
Chapter 5: Introduction to Smart charging approaches and strategies 101
Chapter 6: EV Charging Strategies Based on Control Architecture 1056.1 Centralized Control Based Strategy 105
6.2 Decentralized Control Based Strategy 111
6.3 Distributed Control Based Strategy 115
6.4 Hierarchical Control Based Strategy 119
6.5 Local Control Based Strategy 122

Smart Charging Strategies and Technologies for Electric Vehicles Simulation-based study to evaluate the effects of E-mobility smart charging strategiesvi
Chapter 7: Objective-Based Strategies 1277.1 EV Charging Coordination Under Feeder Capacity Constraints 129
7.2 Coordinated EV Charging and Distributed Generation Control in the
Distribution Network 130
Chapter 8: Smart Charging Strategies Based on Optimization Algorithms 133
Chapter 9: Artificial Intelligence/ Machine Learning-Based Charging Approach 135
Chapter 10: Price Based Coordination Methods 13710.1 Real-Time Pricing 137
10.2 Time of Use Tariff 138
10.3 Critical Peak Price 138
10.4 Peak Time Rebate 138
10.5 Dynamic Price-Based Coordination Methods 139
Chapter 11: Fleet Control Charging Strategy 141
Chapter 12: Charging Station Coordination 145
Chapter 13: Conclusion and Way Forward 149
References 151
Annexure I 161

vii Smart Charging Strategies and Technologies for Electric Vehicles Simulation-based study to evaluate the effects of E-mobility smart charging strategies
List of Figures
Figure 1: Usefulness of smart charging 8
Figure 2: Overview of the charging options and their typical charging capacities (Nationale Plattform Elektromobilität) 12
Figure 3: AC and DC conductive charging ecosystem 13
Figure 4: Block diagram of a galvanic isolated AC charging system 13
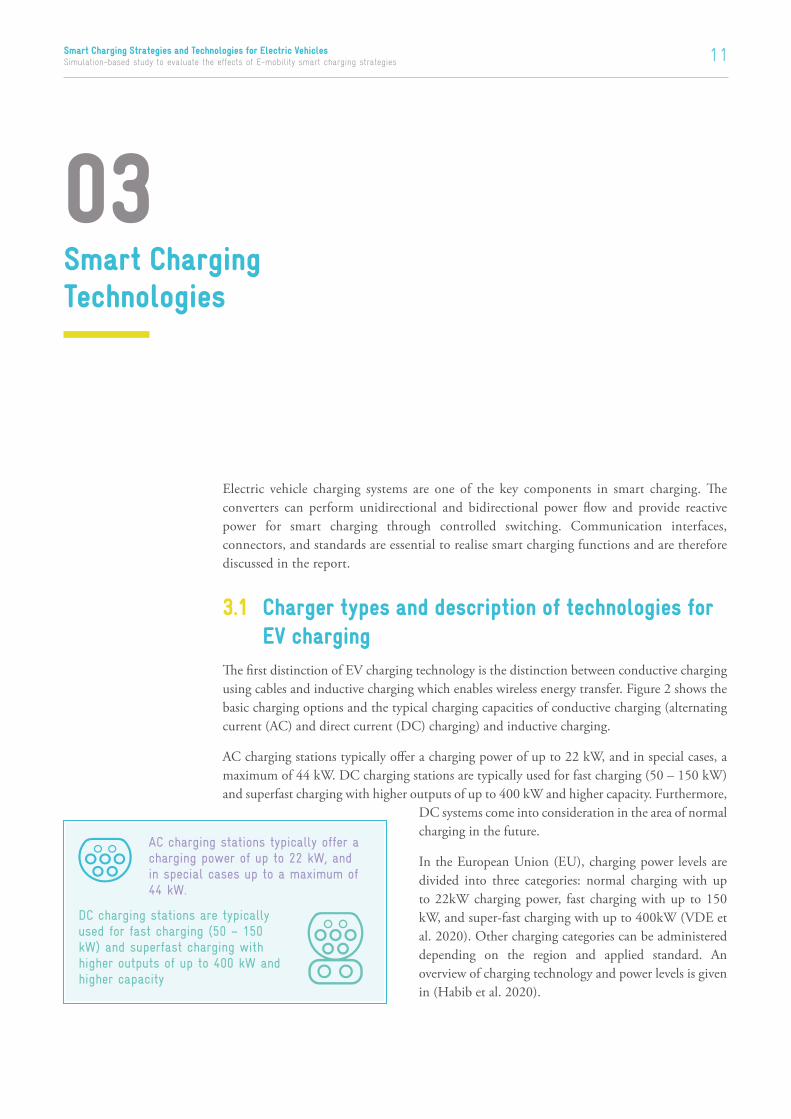
Figure 5: Block diagram of an AC charging system without galvanic isolation 14
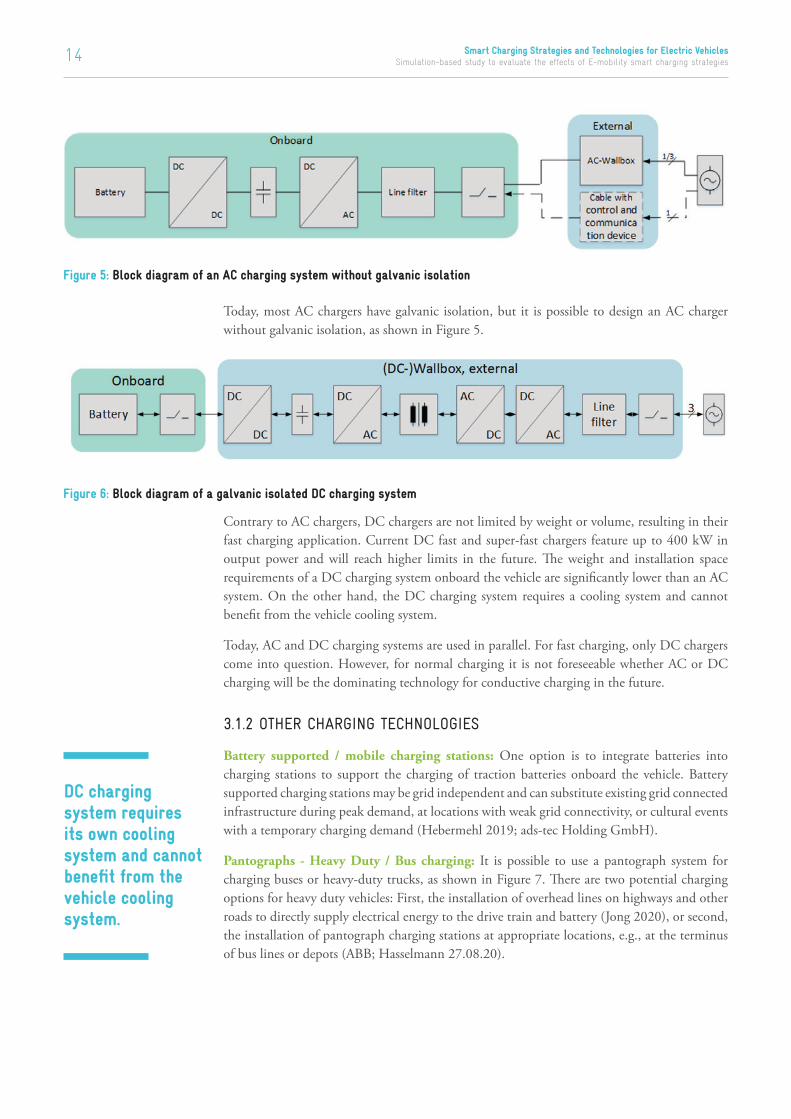
Figure 6: Block diagram of a galvanic isolated DC charging system 14
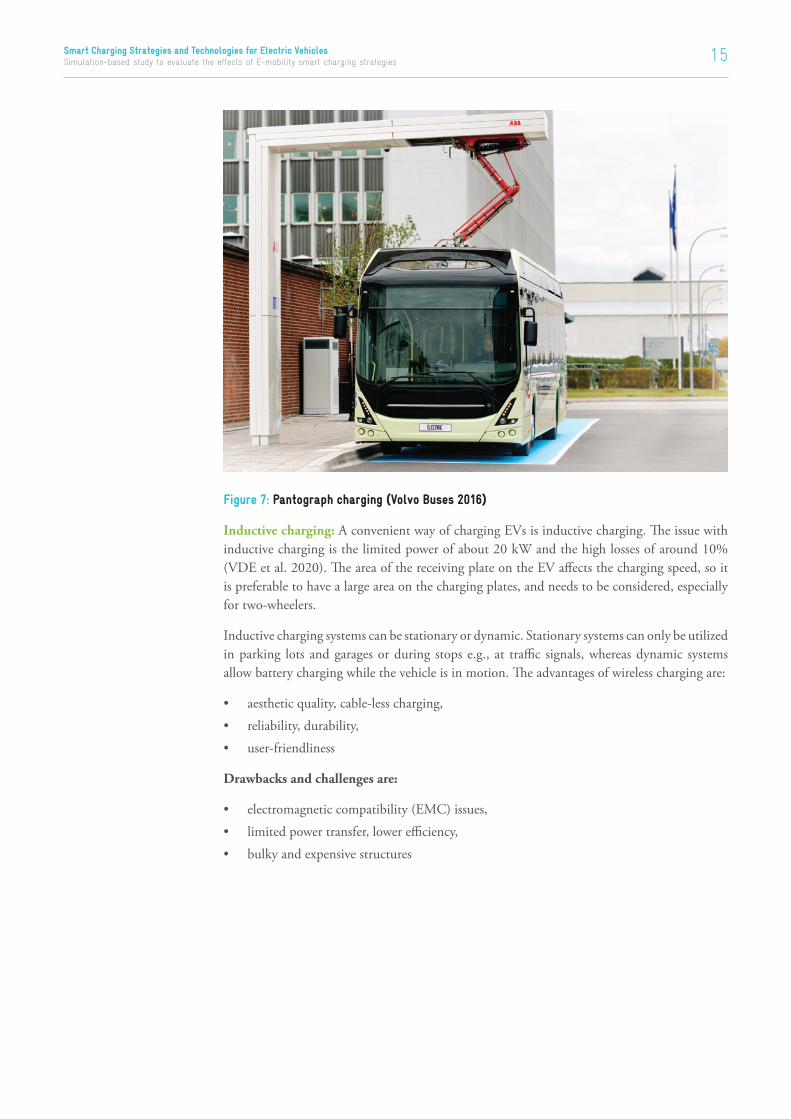
Figure 7: Pantograph charging (Volvo Buses 2016) 15
Figure 8: Type 1 AC charging connector 16
Figure 9: Type 2 AC charging connector 16
Figure 10: ChaDeMo DC charging connector 16
Figure 11: CCS-Combo 2 DC charging 16
Figure 12: Chaoji connector for high power DC charging 17
Figure 13: Wired charging and related standards of EVs (Nationale Plattform Elektromobilität) 18
Figure 14: Example for communication infrastructure in private households with possible communication protocols for different applications (Verband der Automobilindustrie 2020) 20
Figure 15: Diode Rectifier 23
Figure 16: Vienna Rectifier (Feng et al. 2019) 24
Figure 17: Active front end -B6 24
Figure 18: Three-phase neutral point clamped converter (Stolze et al. 2015) 24
Figure 19: T-Type Neutral Point Clamped Topologie (TNPC) 25
Figure 20: Half bridge with midpoint connection 25
Figure 21: H-Bridge 25
Figure 22: Totem Pole PFC (Firmansyah et al. 2010) 26
Figure 23: bidirectional 2-phase DC/DC converter 26
Figure 24: Flying Capacitor DC/DC converter 27
Figure 25: Full-Bridge DC/DC Converter (Habib et al. 2020) 27
Figure 26: Dual Active Bridge (DAB) (Habib et al. 2020) 28
Figure 27: Types of resonant converters a) Series resonant converter b) Parallel Resonant converter c) Series parallel resonant converter d) LLC converter e) L3C2 converter (Habib et al. 2020) 29
Figure 28: Full-bridge rectifier with a boost converter (Nguyen und Lee 2018) 30
Figure 29: Two stage three-phase charger with galvanic isolation (Habib et al. 2020) 30
Figure 30: Multifunctional bidirectional charging system (Jung 2016) 31
Figure 31: Multifunctional OBC proposed in (Nguyen und Lee 2018) 32
Figure 32: Different applications of the BEV traction battery 32
Figure 33: Technical parameters of chargers 35
Figure 34: Web view of SnapCharge platform (“Products | evmega,” n.d.) 36
Figure 35: Properties of JuiceNet platform (“JuiceNet: vehicle-to-grid cloud-based platform for grid balancing.,” n.d.). 37
Figure 36: Network components connected to Cloud energy car networking (Cloud, 1998) 39
Figure 37: Participants and properties of ChargePoint network (“ChargePoint Open Network | ChargePoint,” n.d.) 39
Figure 38: ChargePoint mobile application (“Get the ChargePoint App | ChargePoint,” n.d.). 40
Figure 39: EV JuiceNet mobile application (“emobility.enelx,” n.d.) 40
Figure 40: Dashboard of Charge Point ECO (“ChargePoint ECO,” n.d.) 41
Figure 41: EV site solution box (“EV Site Solution - EV Charging | Electric Vehicle Chargers | ABB,” n.d.) 41
Figure 42: Load management controller (“Products | evmega,” n.d.) 42
Figure 43: EV link load management system box (“Catalog 2020 Electric vehicle charging solutions | EVlink | Schneider Electric,” n.d.) 43
Figure 44: Dashboard of vCharM- charging station solutions (“vCharM | Charging Station Management System | Vector,” n.d.) 43

Smart Charging Strategies and Technologies for Electric Vehicles Simulation-based study to evaluate the effects of E-mobility smart charging strategiesviii
Figure 45: Approximate presence of different vehicle types in the project (“Powered-Up-Electric-Nation-Brochure.pdf,” n.d.) 71
Figure 46: Charging behaviour without and with incentivisation (“Powered-Up-Electric-Nation-Brochure.pdf,” n.d.) 73
Figure 47: System configuration in Parker project (“Parker_Final-report_v1.1_2019.pdf,” n.d.) 78
Figure 48: Requested and demanded power for providing frequency support service (“Parker_Final-report_v1.1_2019.pdf,” n.d. The project’s result in Figure 48 shows that the supply of requested power using V2G service from participating. 78
Figure 49: Scalability of the project in a different direction (“Parker_Final-report_v1.1_2019.pdf,” n.d.) 79
Figure 50: Project demonstration system (“UCLA Smart Grid Energy Research Center | SMERC,” n.d.) 80
Figure 51: Charge TO program smart charging provided by fleetCrama (Bauman et al., 2016) 83
Figure 52: FleetCrama’s fleet charging view (Bauman et al., 2016) 84
Figure 53: EV owners view of FleetCrama smart charging display (Bauman et al., 2016) 84
Figure 54: Charging without overnight charging schedule (weekdays) (Bauman et al., 2016) 85
Figure 55: EV charging load curtailment possibility for weekdays (Bauman et al., 2016) 85
Figure 56: EV charging load curtailment possibility for weekends (Bauman et al., 2016) 86
Figure 57: SOC Auto opt-out charging behaviour before and after incentives (Bauman et al., 2016) 86
Figure 58: Motivation for smart charging 102
Figure 59: Classification of Smart Charging Strategies based on different attributes 103
Figure 60: Centralized control strategy 106
Figure 61: Network architecture of low voltage distribution system (Hu et al., 2014) 108
Figure 62: Flowchart of the proposed method (Hu et al., 2014) 109
Figure 63: Spot price curve of a day (Hu et al., 2014) 109
Figure 64: Top: Aggregated energy demand of fleet operator 1 and 2, Bottom: Aggregated energy schedule of fleet operator 1 and 2 (Hu et al., 2014) 110
Figure 65: Comparison of fleet operator power with maximum power capacity (Hu et al., 2014) 110
Figure 66: Decentralized control strategy 111
Figure 67: Distributed control strategy 116
Figure 68: Proposed sub aggregator system with sub-aggregator (Malhotra et al., 2017) 116
Figure 69: Stepwise pictorial representation of proposed method (Malhotra et al., 2017) 117
Figure 70: Power tracking 400 Evs with specific plugging time (Malhotra et al., 2017) 118
Figure 71: Power tracking of 20000 EVs with heterogenous plugging time (Malhotra et al., 2017) 118
Figure 72: EV charging profile tracking (Malhotra et al., 2017) 118
Figure 73: Hierarchical centralised control 119
Figure 74: Hierarchical hybrid charging decision 120
Figure 75: Hierarchical centralised charging decision 120
Figure 76: Hierarchical decentralised control 121
Figure 77: Example of decentralised hierarchical control structure 122
Figure 78: Proposed RIW algorithm with FR and VR variants (Mobarak and Bauman, 2019) 123
Figure 79: RIW charging profile of one EV load (Mobarak and Bauman, 2019) 125
Figure 80: Long-range EV and short-range EV-simulated Monday load for 150 logged drivers (RIW-FR and RIW-VR charging strategies) (Mobarak and Bauman, 2019) 125
Figure 81: Charging load on transformer (Mobarak and Bauman, 2019) 126
Figure 82: Transformer ageing factor at different smart charging options (Mobarak and Bauman, 2019) 126
Figure 83: Smart charging strategies based on the control architecture 129
Figure 84: Optimization algorithms for smart charging 134
Figure 85: Objectives for fleet coordination 141
Figure 86: Methods for fleet coordination 142
Figure 87: Optimal assignment and charging scheduling (Clemente et al., 2014) 146
Figure 88: Charging coordination comparison (Yan et al., 2021) 147
Figure 89: Demonstration site of charging station (Lee et al., 2018) 148
Figure 90: Operator’s user interface (Lee et al., 2018) 148

ix Smart Charging Strategies and Technologies for Electric Vehicles Simulation-based study to evaluate the effects of E-mobility smart charging strategies
List of Tables
Table 1: List of Standards for EV charging 18Table 2: Grid friendly functions 33Table 3: Information availability on SnapCharge dashboard 36Table 4: Commercially available charging stations for AC and DC charging 45Table 5: Examples of commercially available onboard chargers 52Table 6: Capabilities of various connectors 52Table 7: Technical specifications and cost of commercially available EV chargers in India 54Table 8: Current and voltage ratings of Mode 1 68Table 9: Current and voltage ratings of Mode 2 68Table 10: Smart charging solutions available in India 70Table 11: Attributes for scaling the project in a different direction 78Table 12: Summary of smart charging related gaps in Indian state EV policies 93Table 13: Provisions related to smart charging 94Table 14: Evaluation of charging infrastructure in different central and state policies 95Table 15: List of reference papers in literature 140Table 16: Comparision of different charging strategy 143Table 17: Summary of fleet coordination based on implementation methods 143Table 18: Minimum requirement of the public charging station as per MoP-issued regulation for charging
infrastructure of electric vehicles 162Table 19: Issuing agency and role of nodal agencies 163Table 20: EV tariff structure in Delhi 163Table 21: Time-of-use (ToU) tariff structure of Delhi 164Table 22: EV tariff structure of Karnataka 164Table 23: EV tariff structure of Maharashtra 164Table 24: Tariff structure for LT charging station load in Maharashtra 164Table 25: Tariff structure for HT charging station load in Maharashtra 165Table 26: EV tariff structure of Andhra Pradesh 165Table 27: EV tariff structure of Kerala 165Table 28: Time-of-use tariff structure in Kerala 165Table 29: EV tariff structure of Uttar Pradesh 166Table 30: Time-of-use (ToU) tariff structure of Uttar Pradesh for summer months 166Table 31: Time-of-use (ToU) tariff structure of Uttar Pradesh for winter months 166Table 32: EV tariff structure of Gujarat 166Table 33: EV tariff structure of Madhya Pradesh 167Table 34: EV tariff structure of Telangana 167Table 35: Time-of-use (ToU) tariff structure of Telangana 167Table 36: EV tariff structure of Punjab 167Table 37: EV tariff structure of Bihar 168Table 38: EV tariff structure of Haryana 168Table 39: Technical specification of Bharat AC001 and DC001 168Table 40: Formats for data collection from DISCOMS 169Table 41: Electricity consumption information of charging station 170Table 42: Type, requirement, and compliance standard for retrofitting 170

Smart Charging Strategies and Technologies for Electric Vehicles Simulation-based study to evaluate the effects of E-mobility smart charging strategiesx
Abbreviations
2W Two-Wheeler
3W Three-Wheeler
4W Four-Wheeler
AC Alternating Current
ADR Automated Demand Response
AI Artificial Intelligence
ANPC Active Neutral Point Clamped
BEE Bureau of Energy Efficiency
BESS Battery Energy Storage System
BEV Battery Electric Vehicle
BIS Bureau of Indian Standards
BMS Battery Management System
BMUGerman Federal Ministry for the Environment, Nature Conservation and Nuclear Safety
CA Certificate Authority
CCS Combined Charging System
CEA Central Electricity Authority
CERC Central Electricity Regulatory Commission
ChaDeMo Charge de Move
CMS Central Management System
CNA Central Nodal Agency
CPO Charge Point Operator
CPP Critical Peak Price
CPU Central Processing Unit
DAB Dual Active Bridge
DC Direct Current
DER Distributed Energy Resources
DFEDR Dynamic Feasible Energy Demand Region
DFFR Dynamic firm frequency response
DHCP Dynamic Host Configuration Protocol
DISCOM Distribution Company / Operator
DL Deep Learning
DNO Distribution Network Operator
DPVFM Dynamic Price Vector Formation Model
DR Demand Response
DSO Distribution System Operator
DST Department of Science and Technology
DTU Technical University Denmark
EMC Electromagnetic Compatibility
eMIP e-Mobility Inter-operation Protocol
EMS Energy Management System
eMSP Electric Mobility Service Provider
EO Energy Operator
ESCOM Energy Supply Company
EV Electric Vehicle
EVSE Electric Vehicle Supply Equipment
EVSS EV Site Solution
FO Fleet Operator
G2V Grid-to-Vehicle
HAN Home Area Network
HEMS Home Energy Management System
HT High Tension
IC-CPD In-cable control and protection device
ICCT International Council on Clean Transportation
ICE Internal Combustion Engine
ICT Information and Communications Technology
IEC International Electrotechnical Commission
IEEEInstitute of Electrical and Electronics Engineer
IKI International Climate Initiative
ISO International Organization for standardization
ITF International Transport Forum
kVA/kVAh kilovolt-ampere/kilovolt-ampere hour
kW/kWh Kilowatt/kilowatt-hour
LAN Local Area Network
LT Low Tension
LVRT Low-Voltage-Ride-Through
MDP Mixed Discrete Programming
MILP Mixed-Integer Linear Programming
ML Machine Learning
MoP Ministry of Power
MOSFETMetal Oxide Semiconductor Field Effect Transistor
NDC-TIANationally Determined Contribution – Transport Initiative for Asia
NP Non-deterministic Polynomial Time
OCHP Open Clearing House Protocol
OCPI Open Charge Point Interface
OCPP Open Charge Point Protocol
OEMs Original Equipment Manufacturers

xi Smart Charging Strategies and Technologies for Electric Vehicles Simulation-based study to evaluate the effects of E-mobility smart charging strategies
OICP Open Inter-charge Protocol
OLEV Office for Low Emission Vehicles
OSCP Open Smart Charging Protocol
P2P Point to Point
PCS Public Charging Station
PEV Plug-in Electric Vehicle
PFC Power Factor Correction
PLC Power Line Carrier
POSOCO Power System Operation Corporation Limited
PRC Parallel Resonant Converter
PTR Peak Time Rebate
PV Photovoltaic
RCD Residual Current Device
RE Renewable Energy
REEV Range Extended Electric Vehicle
RFID Radio-frequency identification
RIW Random-in-Window
RIW-FR/RIW-VR
Random-in-Window-Fixed charging rate/ Random-in-Window- Variable charging rate
RTP Real-Time Price
SA Sub Aggregator
SAE Society of Automotive Engineers International
SERC State Electricity Regulatory Commission
SFFR Static Firm Frequency Response
SiC Silicon Carbide
SLDC State Load Dispatch Centre
SMERC Smart Grid Energy Research Centre
SMGW Smart Meter Gateway
SNA State Nodal Agency
SOC State of Charge
SPRC Series-Parallel Resonant Converter
SRC Series Resonant Converter
TCP Transmission Control Protocol
TNPC T-Type Neutral Point Clamped
TOU Time of Use
V2B Vehicle-to-Building
V2D Vehicle-to-Device
V2G Vehicle-to-Grid
V2GTP Vehicle to Grid Transport Protocol
V2H Vehicle-to-Home
V2V Vehicle-to-Vehicle
WPD Western Power Distribution
WPT Wireless Power Transfer
WRI World Resources Institute
XML Extensible Markup Language
ZCS Zero Current Switching
ZVS Zero Voltage Switching

Smart Charging Strategies and Technologies for Electric Vehicles Simulation-based study to evaluate the effects of E-mobility smart charging strategiesxii

1 Smart Charging Strategies and Technologies for Electric Vehicles Simulation-based study to evaluate the effects of E-mobility smart charging strategies
Electric Vehicles (EVs) are being rapidly integrated into the energy systems of many countries to reduce carbon emission from the mobility sector to help address the climatic issues, with ambitious goals of EV targets set at national/regional levels. More specifically, the push for EVs is driven by the global climate agenda established under the Paris Agreement to reduce carbon emissions across the world to address the growing global warming issue. Importantly, not only would a switch from combustion-engine vehicles to EVs lead to lower emissions, but EVs also create a lot less local air pollution. In addition, the deployment of EVs is also driven by national agendas to reduce oil demand and dependence on oil imports, and encouragement of a local EV manufacturing industry for job creation. On the other hand, EVs through several grid support services, are expected to support the grid, and help in accommodating higher renewable energy penetration while maintaining secure and stable grid operation. However, for an effective, efficient, economical, and reliable EV integration, a coordinated and optimal approach is required, considering all the relevant technical, policy and regulatory issues. EVs under an uncoordinated control strategy can introduce a range of challenges viz. increase in peak load, power line congestion, stressing power system equipment, and requirement of upgradation and reconfiguration. Hence, increasing EV adoption necessitates smart charging of the EV loads (Global EV Outlook 2020).
The registered number for electric vehicles in India is around 873,301 according to Government of India’s Vahan database as on 30 November 2021. By 2030 more than 30% of new vehicles are expected to be electric vehicles (Global EV Outlook 2020). India has over 250 million vehicles, and this fleet is dominated by 2-wheelers, accounting for around 78% of the total vehicles (Bhagwat et al., 2019). Amongst the different vehicle segments, public buses, taxi fleets, 2-wheelers, and three-wheelers are expected to be the first adopters of EVs. As the country is at an early stage of EV deployment, public charging infrastructure is still limited, however, expected to grow fast owing to EV integration target. In this regard,
01Introduction: Review of Smart Charging Strategies and technologies
By 2030 more than
30% of new vehicles are expected to be electric vehicles.2-wheelers,
accounting for
78% of the total vehicles

Smart Charging Strategies and Technologies for Electric Vehicles Simulation-based study to evaluate the effects of E-mobility smart charging strategies2
the Ministry of Power (MoP) has already identified nine major cities and twelve intercity routes as pilots to enable EV charging infrastructure. Similarly, several states have also started introducing policies to promote EV adoption and charging infrastructure deployment. Currently (as of September 2021) 21 states of India have final (18) or draft (3) EV policies in place.
The rapid growth in EV uptake required to achieve EV deployment targets of India will have to address two major challenges. The first challenge is ensuring the deployment of adequate charging infrastructure required to serve the needs of the growing number of EVs. The second challenge is the integration of the EVs into the power system in secure and stable manner. However, to accommodate higher EV penetration with least possible grid upgradation cost implications, smart charging will play a key role not only in managing high share of EVs, but also cater to a range of grid support services. Therefore, smart charging of EVs is necessary to effectively manage the charging demand with the available grid infrastructure and generation capabilities. Smart charging will play a crucial role in talking various goals, such as cost minimization, network loss minimization, congestion management, grid support and grid stability. The success of the EV revolution hinges primarily on the timely deployment of effective EV charging infrastructure
and smart charging strategies. However, at the same time, EV adoption is the main driver for the business case of EV charging infrastructure. Technical solutions for smart charging strategies, and policy and regulation matters, informed by a thorough understanding of the EV charging ecosystem, can offer solutions to this problem.
Although the e-mobility plan is developed at the central level, the onus largely lies on the state and union territory governments, which must develop and implement relevant policies, schemes and regulatory frameworks to enable the adoption of EVs and deployment of charging infrastructure in their respective states. Thus, considering India’s federal structure as well as the wide variance in the social-geographic and economic variances between states, a one-size fits all approach cannot be applied. The development of adequate charging and power system infrastructure to support the up-take of EVs would rest upon state-specific policy, regulatory measures, and effective implementation of such policy and regulatory interventions. Therefore, this study is focussed on global and national review of smart charging strategies, smart charging technology, pricing mechanism, consumer behaviour, and simulation based critical analysis of smart charging strategies with the main focus on the Indian EV ecosystem. The global review and the simulation-based studies will be used to derive comprehensive guidelines for adoption of smart charging strategies, policy and regulatory interventions, pricing mechanisms, fiscal and non-fiscal incentives, and consumer behaviour for Indian scenario that could be used by policymakers, regulators, Distribution Companies (DISCOMs), transmission system operators, OEMs, fleet operators, and other players in EV industry in India for effective and reliable integration of EVs with the existing grid.
1.1 About this StudyThe Nationally Determined Contributions – Transport Initiative for Asia (NDC-TIA) is a regional initiative funded by the International Climate Initiative (IKI) of the German Federal Ministry for the Environment, Nature Conservation and Nuclear Safety (BMU). It is a joint
The rapid growth in EV uptake required to achieve EV deployment targets of India will have to address two major challenges. The first challenge is ensuring the deployment of adequate charging infrastructure required to serve the needs of the growing number of EVs. The second challenge is the integration of the EVs into the power system in secure and stable manner.
3 Smart Charging Strategies and Technologies for Electric Vehicles Simulation-based study to evaluate the effects of E-mobility smart charging strategies
project of seven organizations and with the engagement of China, India, and Vietnam. The organizations partnering with Deutsche Gesellschaft für Internationale Zusammenarbeit GmbH (GIZ) on this project are World Resources Institute (WRI), International Council on Clean Transportation (ICCT), International Transport Forum (ITF), Agora Verkehrswende, Renewable Energy Policy Network for the 21st Century (REN21), and the Partnership on Sustainable, Low Carbon Transport (SLoCaT). For the India component of the project, the implementing partner is the National Institution for Transforming India (NITI Aayog).
Under the NDC-TIA India Component, the project “Simulation-based study to evaluate the effects of E-mobility smart charging strategies” is focused on relevant smart coordinated charging strategies that will need to be adopted in different scenarios and conditions in India. This project is carried out by consortium led by Fraunhofer Institute for Energy Economics and Energy System Technology IEE, Kassel (IEE) in collaboration with Indian Institute of Technology, Bombay (IITB), Technical University Denmark (DTU), and Universidad Pontificia Comillas (IIT Comillas).
This specific study focuses on EV smart charging strategies and approaches, related policy and regulatory measures, technical aspects, grid integration of EVs, and the way forward for smooth EV adaption in the Indian EV ecosystem. The study will use real life data to develop models of distribution feeders in India, implement charging and coordination algorithms using a robust open source simulation environment. The results of the analyses will act as a strong base in identifying gaps and refining scope of work for adoption of smart charging approaches at each necessary level/node of the EV ecosystem. The study based on a combination of desk research, simulation, regular workshops with the selected DISCOM(s), consultations with stakeholders, will be used to identify and recommend various smart charging interventions and guidelines that can be adopted for the use by regulators, policy makers, DISCOMs, and other stakeholders, and later adopted state-wide.
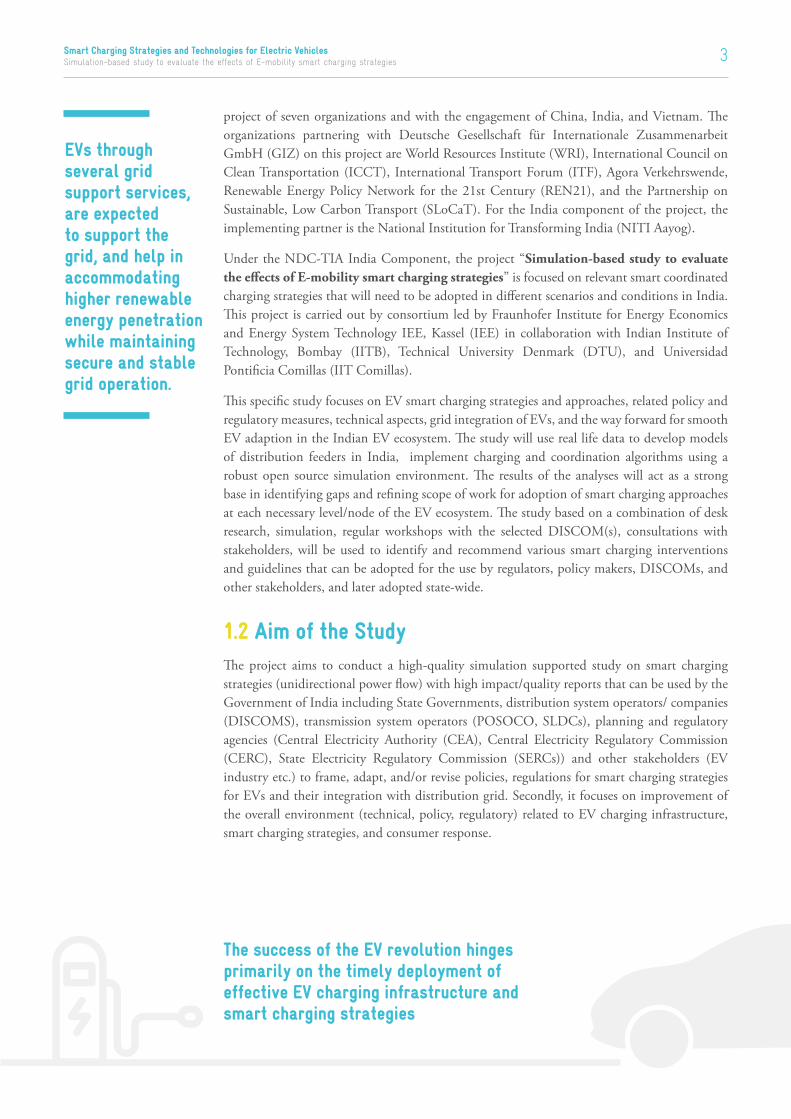
1.2 Aim of the StudyThe project aims to conduct a high-quality simulation supported study on smart charging strategies (unidirectional power flow) with high impact/quality reports that can be used by the Government of India including State Governments, distribution system operators/ companies (DISCOMS), transmission system operators (POSOCO, SLDCs), planning and regulatory agencies (Central Electricity Authority (CEA), Central Electricity Regulatory Commission (CERC), State Electricity Regulatory Commission (SERCs)) and other stakeholders (EV industry etc.) to frame, adapt, and/or revise policies, regulations for smart charging strategies for EVs and their integration with distribution grid. Secondly, it focuses on improvement of the overall environment (technical, policy, regulatory) related to EV charging infrastructure, smart charging strategies, and consumer response.
The success of the EV revolution hinges primarily on the timely deployment of effective EV charging infrastructure and smart charging strategies
EVs through several grid support services, are expected to support the grid, and help in accommodating higher renewable energy penetration while maintaining secure and stable grid operation.

Smart Charging Strategies and Technologies for Electric Vehicles Simulation-based study to evaluate the effects of E-mobility smart charging strategies4
A holistic framework will be developed to select key strategies for modelling the situations under a simulation environment leading to concrete recommendations for the stakeholders
1.3 Objectives of the StudyThis project conducts a detailed study based on critical global review on smart charging strategies, and simulation studies on an identified DISCOM network with a major thrust on the following focus points:
• A detailed and comprehensive global review of different smart charging strategies and coordination approaches for EV charging
• Structured framework for desired data collection from selected DISCOM(s) and other relevant sources along with data filtering and quality check
• Performing concrete simulations on smart charging strategies for EVs while considering different scenarios/use cases with the grid data provided by the DISCOM(s)
• Preparation of comprehensive and concrete guidelines for smart EV charging in India
• Conducting a detailed literature review on charging infrastructure and consumer response
1.4 About this ReportThis report is the first in the series of the overall study – “Simulation-based study to evaluate the effects of E-mobility smart charging strategies” outlining the concept of smart charging, smart charging technologies and related products & solutions, gaps in Indian regulations and policies from smart charging perspective, commercially available smart charging products and equipment, and case studies in the form of existing smart charging projects under Part A of the report. Part B of this report is dedicated to an exhaustive and critical review of various smart charging strategies and approaches.
This report sets the main context for the core objective of the overall project, which is to identify relevant smart charging and coordination strategies, appropriate policy and regulatory interventions, and way forward for seamless adoption of smart charging in Indian EV ecosystem. A holistic framework will be developed to select key strategies for modelling different scenarios under a simulation environment leading to concrete recommendations for the stakeholders. Moreover, chapter 3 of this report provides a comprehensive overview of smart charging technologies, smart chargers and related products, equipment, and commercially available chargers (along with specifications) in India, which can be useful for a wide set of stakeholders in the EV industry. Further, chapter 4 of this report provides a bird’s eye view about the smart charging scenario in India including incentives, gaps, and practical challenges. Lastly, a number of case studies / projects in smart EV charging are given in section 3.11 of chapter 3 to give a better understanding to the stakeholders about implementation of smart charging in Indian EV ecosystem.
5 Smart Charging Strategies and Technologies for Electric Vehicles Simulation-based study to evaluate the effects of E-mobility smart charging strategies
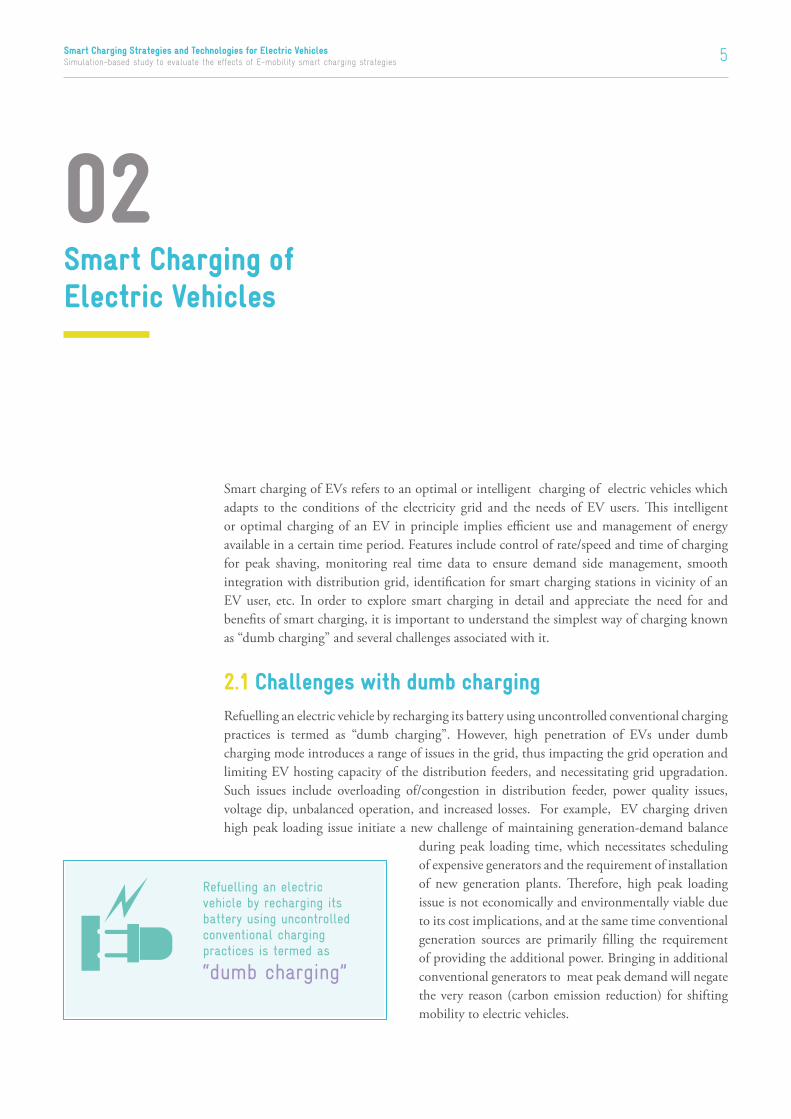
Smart charging of EVs refers to an optimal or intelligent charging of electric vehicles which adapts to the conditions of the electricity grid and the needs of EV users. This intelligent or optimal charging of an EV in principle implies efficient use and management of energy available in a certain time period. Features include control of rate/speed and time of charging for peak shaving, monitoring real time data to ensure demand side management, smooth integration with distribution grid, identification for smart charging stations in vicinity of an EV user, etc. In order to explore smart charging in detail and appreciate the need for and benefits of smart charging, it is important to understand the simplest way of charging known as “dumb charging” and several challenges associated with it.
2.1 Challenges with dumb charging Refuelling an electric vehicle by recharging its battery using uncontrolled conventional charging practices is termed as “dumb charging”. However, high penetration of EVs under dumb charging mode introduces a range of issues in the grid, thus impacting the grid operation and limiting EV hosting capacity of the distribution feeders, and necessitating grid upgradation. Such issues include overloading of/congestion in distribution feeder, power quality issues, voltage dip, unbalanced operation, and increased losses. For example, EV charging driven high peak loading issue initiate a new challenge of maintaining generation-demand balance
during peak loading time, which necessitates scheduling of expensive generators and the requirement of installation of new generation plants. Therefore, high peak loading issue is not economically and environmentally viable due to its cost implications, and at the same time conventional generation sources are primarily filling the requirement of providing the additional power. Bringing in additional conventional generators to meat peak demand will negate the very reason (carbon emission reduction) for shifting mobility to electric vehicles.
02Smart Charging of Electric Vehicles
Refuelling an electric vehicle by recharging its battery using uncontrolled conventional charging practices is termed as
“dumb charging”

Smart Charging Strategies and Technologies for Electric Vehicles Simulation-based study to evaluate the effects of E-mobility smart charging strategies6
Uncontrolled charging of EVs draws high power, which results in network overloading conditions. Network overloading includes overloading of equipment, faster aging of devices leading to frequent occurrence of faults and in extreme case may lead to system instability. Equipment stressing and faster aging results into requirement of major upgradation and reconfiguration. Therefore, to address the above mentioned limitations of dumb charging, smart charging can be utilised to optimally and intelligently charge EVs in a coordinated and controlled manner.
Smart charging not only mitigates the limitations of dumb charging, but it can also facilitate maximising the utilization of renewable generations, provided ancillary services support and backup storage. The objective of smart charging varies according to stakeholders and their requirements. Overall system cost minimization, load levelling and valley filling, maximization of RE utilization, and providing grid support services are the major objectives of a system operator. Minimisation of charging cost, maximization of satisfaction factor, and load levelling are the common objectives from EV owner’s perspective. Smart charging is performed using different strategies, which are the combination of information flow and decision taking ability between aggregator and EV owner. Based on the information flow and decision making, smart charging is categorized into different strategies and coordination approaches, which are described in detail under Part B of this report.
2.2 Key stakeholders involved in smart charging In smart charging, EV battery is charged considering all the decision parameters of the system and requirements of EV owner. An external entity or a person controls the charging and decides the schedule of charging complying the interests of EV owner and other stakeholders. In other words, smart charging is an action of externally controlling the EV charging for predefined objectives and constraints. As smart charging is externally controlled, it requires observability and communication between the entities. Since it will be practically challenging for a grid operator to monitor , manage and control all the EVs, EV aggregators act as interface between EVs and the grid operator. Roles of key stakeholders in smart charging adoption are mentioned below in detail.
2.2.1 GRID OPERATOR
Grid operator represents Distribution Network Operator (DNO) or Distribution System Operator (DSO) or Distribution Company (DISCOM) of a particular network. Grid operators are responsible for maintaining the continuity of electric supply. They control the power grid via communication within and neighbouring utilities. They are also responsible for restoring the supply in case of failure due to any natural disaster or fault conditions. Due to this reason, system operators are interested to maintain secure and stable grid operation.
2.2.2 EV OWNER
EV owner is a proprietor of EV who is responsible for taking the EV charging decisions. In EV smart charging study EV driver can also be address as EV owner because of having charging decision rights in some situations. The main objective of an EV owner/user is reduced cost of charging while meeting its commuting needs.
In smart charging, EV is charged considering all the decision parameters of the system and requirements of EV owner. An external entity or a person controls the charging and decides the schedule of charging complying the interests of EV owner.

7 Smart Charging Strategies and Technologies for Electric Vehicles Simulation-based study to evaluate the effects of E-mobility smart charging strategies
2.2.3 AGGREGATOR
EV aggregator is a third party between energy supplier i.e., system operator and energy consumer i.e., EV user/owner. In other words, it establishes an indirect connection by coordinating with EV and system operator by acting as a middle entity between EV owner and system operator. It cooperates with the stakeholders to fulfil their demand (or supply) requirements while respecting the supply (or demand) capability of another stakeholder. It collects information from both (viz, system operator and EV owner) and take suitable decision on EV charging considering the request and constraint from both the parties. From economic aspects aggregator gets financial returns from both stakeholders for providing the service and ease the charging process.
2.3 Potential Benefit of Smart Charging
2.3.1 POTENTIAL BENEFIT TO ELECTRIC GRID
Smart charging maintains the system parameters within the permissible limit while ensuring reliable supply to the customer. Some of the benefits of smart charging to the grid operator are mentioned below:
1. System stability and reliability
Smart charging maintains the grid stability by directly or indirectly managing the charging behaviour of EV load. Directly managing charging covers centralised decision taking strategies, whereas indirectly managing charging demand covers decentralised and distributed decision taking strategies. Moreover, hierarchical decision taking strategy also ensure grid stability by managing the charging load with combination of centralised and decentralised decision.
2. Reduce grid upgradation requirement
Smart charging through a coordinated manner can facilitate charging of more EVs compared to dumb/uncontrolled/uncoordinated charging, thereby effectively increasing EV hosting capacity of a distribution feeder. More importantly, at peak load condition, smart charging will not only be able to limit the peak load, but it can also help in peak shaving, hence reducing the need for grid upgradation.
3. Increased RE integration and reduced carbon emission
Grid with high percentage of generation mix from conventional generators are benefited in terms of carbon emission reduction as smart charging reduces the additional generation scheduling and encourages utilisation of renewable energy. Moreover, through smart charging, EVs can provide grid support services and help in accommodating higher RE penetration
4. Reduces overall cost of the system
Since Smart charging reduces the additional generation and infrastructure requirement, and thereby reduces the cost associated with additional expensive generators and establishing new infrastructure.
Smart charging not only mitigates the limitations of dumb charging, but it can also facilitate maximising the utilization of renewable generations, provided ancillary services support and backup storage.

Smart Charging Strategies and Technologies for Electric Vehicles Simulation-based study to evaluate the effects of E-mobility smart charging strategies8
2.3.2 POTENTIAL BENEFIT TO EV OWNER
EV owners benefit in terms of reduced charging cost and reliable electrical supply as a result of smart charging of EVs. In addition, EV owners indirectly are benefited through clean air and healthy environment because of low demand of additional generation and better utilisation of renewable energy generation.
2.3.3 POTENTIAL BENEFIT TO CHARGING STATION OPERATOR
Charging station owner/operator earns financial revenue from smart charging by providing the charging management services to EV owners and grid operators. In addition, electricity price hike at peak hour window and peak load duration generates an additional profit for the charging station owner/operator.
The broader landscape of smart charging benefits are shown in Figure 1.
Smart Charging
Renewable Integration
Congestion Management
Reduction of grid
reinforcement cost
Peak load reduction
Reliability Improvement
Flexibility Resource
Figure 1: Usefulness of smart charging
Some of the key factors that can enable deployment of smart charging include but not limited to:
(a) Charging infrastructure
(b) Defining clear roles and responsibilities of stakeholders
(c) Designing or strengthening regulations and policies
(d) Enabling Information and Communications Technology (ICT) control and communication protocols
(e) Strengthening the role of aggregators and system operators
(f ) Research and development in advancements in smart charging technologies
Smart charging in electric vehicle infrastructure in India is crucial from various perspectives, especially to manage EV load.

9 Smart Charging Strategies and Technologies for Electric Vehicles Simulation-based study to evaluate the effects of E-mobility smart charging strategies
2.4 Levels of Smart Charging The simplest form of incentive, which is generally termed as time-of-use pricing, encourages consumers to move their charging from peak to off-peak periods. More advanced smart charging approaches, such as direct control mechanisms, will be necessary as a long-term solution at higher penetration levels and for the delivery of close-to-real-time balancing and ancillary
services. Such mechanisms range from simply switching on and off the charging, to unidirectional control of vehicles (V1G) that allows for increasing or decreasing the rate of charging, to the technically challenging bidirectional vehicle-to-grid (V2G), which allows the EV to provide services to the grid in the discharge mode. In addition, vehicle-to-home (V2H) and vehicle-to-building (V2B) are forms of bidirectional charging where EVs are used as a residential back-up power supply during periods of power outage or for increasing self-consumption of energy produced on-site (demand charge avoidance). Further advanced level of charging would be with dynamic pricing and automated control, which is difficult to materialise without the support of policymakers and regulators. (Source: IRENA Innovation Outlook: Smart charging for electric vehicles, 2019)
Advanced smart charging approaches, such as direct control mechanisms, will be necessary as a long-term solution at higher penetration levels and for the delivery of close-to-real-time balancing and ancillary services.

Smart Charging Strategies and Technologies for Electric Vehicles Simulation-based study to evaluate the effects of E-mobility smart charging strategies10
AC charging stations typically offer
a charging power of up to 22 kW, in
individual cases up to a maximum
of 44 kW. DC charging stations are
typically used for fast charging (50
– 150 kW) and superfast charging
with higher outputs of up to 400kW.
11 Smart Charging Strategies and Technologies for Electric Vehicles Simulation-based study to evaluate the effects of E-mobility smart charging strategies
03Smart Charging Technologies
Electric vehicle charging systems are one of the key components in smart charging. The converters can perform unidirectional and bidirectional power flow and provide reactive power for smart charging through controlled switching. Communication interfaces, connectors, and standards are essential to realise smart charging functions and are therefore discussed in the report.
3.1 Charger types and description of technologies for EV charging
The first distinction of EV charging technology is the distinction between conductive charging using cables and inductive charging which enables wireless energy transfer. Figure 2 shows the basic charging options and the typical charging capacities of conductive charging (alternating current (AC) and direct current (DC) charging) and inductive charging.
AC charging stations typically offer a charging power of up to 22 kW, and in special cases, a maximum of 44 kW. DC charging stations are typically used for fast charging (50 – 150 kW) and superfast charging with higher outputs of up to 400 kW and higher capacity. Furthermore,
DC systems come into consideration in the area of normal charging in the future.
In the European Union (EU), charging power levels are divided into three categories: normal charging with up to 22kW charging power, fast charging with up to 150 kW, and super-fast charging with up to 400kW (VDE et al. 2020). Other charging categories can be administered depending on the region and applied standard. An overview of charging technology and power levels is given in (Habib et al. 2020).
AC charging stations typically offer a charging power of up to 22 kW, and in special cases up to a maximum of 44 kW.
DC charging stations are typically used for fast charging (50 – 150 kW) and superfast charging with higher outputs of up to 400 kW and higher capacity

Smart Charging Strategies and Technologies for Electric Vehicles Simulation-based study to evaluate the effects of E-mobility smart charging strategies12
Figure 2: Overview of the charging options and their typical charging capacities (Nationale Plattform Elektromobilität)
Conductive charging systems are further classified into four charging modes according to the IEC61851-1 standard, of which modes 2 to 4 are intended for passenger cars and commercial vehicles:
• Charging mode 2 describes charging at household and industrial sockets with a control and communication device in the cable.
• Charging mode 3 describes single-phase or three-phase charging with alternating current (AC) using a permanently installed charging station.
• Charging mode 4 describes charging with direct current (DC) at permanently installed charging stations.
Depending on the application (home charging, public charging, etc.), various communication options (see section 3.4 Communication protocols) and user interfaces are available for use. Charging stations usually indicate the status of the charging process with an illuminated indicator or display. Radio-frequency identification (RFID) technology is a common standard for access control. More sophisticated and expensive systems provide notifications and control of the charging plan and process via mobile phone apps. The vehicle usually provides information about the charging process via its infotainment system as well.
3.1.1 CONDUCTIVE CHARGING – AC AND DC CHARGING SYSTEMS
In this section a high level comparison of AC and DC charging systems is realized. More detailed explanations on circuit and component level are given in section 3.5 Power Electronics.
Primary and secondary coil
Type 2 Combo 2
ISO 15118 as basis for consistent communication for all charging technologies
Combo 2
Magnetic induction
3, 7 kw 3, 7 kw
11 kw
22 kw
44 kw50 kw
150 kw
400 kw
7, 4 kw11 kw
22 kw
AC Charging DC Charging
Wireless charging
Installing the power electronics in the vehicle results in stricter limits for weight and volume, which limits the charging power of an AC charging system.

13 Smart Charging Strategies and Technologies for Electric Vehicles Simulation-based study to evaluate the effects of E-mobility smart charging strategies
Figure 3 : AC and DC conductive charging ecosystem
The main distinguishing feature between AC and DC charging technology (as shown in Figure 4 - Figure 6) is the location of power electronics, which could be either within the charging station (so-called Wallbox) or within the vehicle (Onboard Charger) and therefore the energy transfer from the station to the vehicle is either through DC or AC current. Accordingly, it is necessary to distinguish between the components onboard the vehicle and in the Electric Vehicle Supply Equipment (EVSE).
Installing the power electronics in the vehicle results in stricter limits for weight and volume, which limits the charging power of an AC charging system. Therefore, AC charging systems are commonly used for normal charging systems (up to 22kW). The main part of the hardware cost is derivative of the onboard part of the system, which transfers the cost of the charging system from the infrastructure (as external devices) into the vehicle. Today, the investment cost for AC charging systems is much lower than for DC charging systems in an identical power class, likely due to economies of scale and availability or demand (Maur et al. 2020; Bünger et al. 2019), but may decrease in the future. A major advantage of an AC charger is that charging without an additional charging station is possible (charging mode 2). Another advantage is that the charger can be integrated into the already existing engine or battery cooling system without a dedicated cooling system. In addition, an onboard charger is required for Vehicle to Vehicle (V2V) and Vehicle to Device (V2D) functionalities.
Figure 4: Block diagram of a galvanic isolated AC charging system
AC- DC Converter
AC- DC Converter
AC- DC Converter
AC- DC Converter
On-board charging
Off-board charging
Power flow
Transmission corridor Transformer
EVSE
EVSE
Electric Vehicle
Electric Vehicle
Battery
Battery
Smart Charging Strategies and Technologies for Electric Vehicles Simulation-based study to evaluate the effects of E-mobility smart charging strategies14
Today, most AC chargers have galvanic isolation, but it is possible to design an AC charger without galvanic isolation, as shown in Figure 5.
Contrary to AC chargers, DC chargers are not limited by weight or volume, resulting in their fast charging application. Current DC fast and super-fast chargers feature up to 400 kW in output power and will reach higher limits in the future. The weight and installation space requirements of a DC charging system onboard the vehicle are significantly lower than an AC system. On the other hand, the DC charging system requires a cooling system and cannot benefit from the vehicle cooling system.
Today, AC and DC charging systems are used in parallel. For fast charging, only DC chargers come into question. However, for normal charging it is not foreseeable whether AC or DC charging will be the dominating technology for conductive charging in the future.
3.1.2 OTHER CHARGING TECHNOLOGIES
Battery supported / mobile charging stations: One option is to integrate batteries into charging stations to support the charging of traction batteries onboard the vehicle. Battery supported charging stations may be grid independent and can substitute existing grid connected infrastructure during peak demand, at locations with weak grid connectivity, or cultural events with a temporary charging demand (Hebermehl 2019; ads-tec Holding GmbH).
Pantographs - Heavy Duty / Bus charging: It is possible to use a pantograph system for charging buses or heavy-duty trucks, as shown in Figure 7. There are two potential charging options for heavy duty vehicles: First, the installation of overhead lines on highways and other roads to directly supply electrical energy to the drive train and battery (Jong 2020), or second, the installation of pantograph charging stations at appropriate locations, e.g., at the terminus of bus lines or depots (ABB; Hasselmann 27.08.20).
Figure 5: Block diagram of an AC charging system without galvanic isolation
Figure 6: Block diagram of a galvanic isolated DC charging system
DC charging system requires its own cooling system and cannot benefit from the vehicle cooling system.
15 Smart Charging Strategies and Technologies for Electric Vehicles Simulation-based study to evaluate the effects of E-mobility smart charging strategies
Figure 7: Pantograph charging (Volvo Buses 2016)
Inductive charging: A convenient way of charging EVs is inductive charging. The issue with inductive charging is the limited power of about 20 kW and the high losses of around 10% (VDE et al. 2020). The area of the receiving plate on the EV affects the charging speed, so it is preferable to have a large area on the charging plates, and needs to be considered, especially for two-wheelers.
Inductive charging systems can be stationary or dynamic. Stationary systems can only be utilized in parking lots and garages or during stops e.g., at traffic signals, whereas dynamic systems allow battery charging while the vehicle is in motion. The advantages of wireless charging are:
• aesthetic quality, cable-less charging,
• reliability, durability,
• user-friendliness
Drawbacks and challenges are:
• electromagnetic compatibility (EMC) issues,
• limited power transfer, lower efficiency,
• bulky and expensive structures

Smart Charging Strategies and Technologies for Electric Vehicles Simulation-based study to evaluate the effects of E-mobility smart charging strategies16
Inductive chargers are not broadly commercialized and employed as conductive ones.
Automatic conductive charging is as convenient as inductive charging but is not limited to power. It is possible to use an automated system (e.g. robot) to plug in a standard charging connector like a human or to insert a charging connector into the ground that functions similar to a pantograph (Continental Engineering Services).
Battery swapping is one way to avoid long charging stops for the customer. The only commercially available system today is realized by NIO Power Swap (NIO 2020). Battery swapping is a good option for two-wheelers like e-bikes, motor scooters or other light utility vehicles (Swobbee).
3.2 ConnectorsConnectors designed specifically for Battery Electric Vehicle (BEV) charging can be categorized into AC- and DC- charging connectors. Figure 8 - Figure 11 show the pin layout of various connectors.
3.2.1 AC-CHARGING CONNECTORS
Figure 8: Type 1 AC charging connector Figure 9: Type 2 AC charging connector
Type 1: Single phase charging with an output power of up to 7.4 kW (230V, 32A). Mainly used in North America and Asia, shown in Figure 8.
Type 2: Single or three phase charging with output power of up to 43 kW (230/400 V, 63A), shown in Figure 9. European AC-charging standard connector, is also used in China with the swapped positions of plug and socket.
3.2.2 DC-CHARGING CONNECTORS
Figure 10: ChaDeMo DC charging connector Figure 11: CCS-Combo 2 DC chargingconnector

17 Smart Charging Strategies and Technologies for Electric Vehicles Simulation-based study to evaluate the effects of E-mobility smart charging strategies
ChaDeMo: Japanese standard which supports up to 400kW (1000V) output power today. It is suitable for 400V and 800V battery systems and is given in Figure 10.
CCS-Combo 1/2: Combines type 1 or 2 sockets with two additional pins for DC charging, as shown in Figure 11. Supports output power of up to 350 kW with an output voltage range of 400 to 950 V. Mainly used in Europe and North America.
3.2.3 FUTURE DEVELOPMENT / OUTLOOK
Figure 12: Chaoji connector for high power DC charging
Chaoji/ChaDeMo 3.0: Chinese/Japanese cooperation for a new connector type (Figure 12) with up to 900kW output power under the GB/T and ChaDeMo standard announced in April 2020 (CHAdeMO Association 24.04.20).
CCS Megawatt charging: The CharIN association is working on the implementation of a connector for MW charging of trucks and busses which supports up to 3 MW output power (CharIN e. V. 13.10.20; Randall 11.7.19).

Smart Charging Strategies and Technologies for Electric Vehicles Simulation-based study to evaluate the effects of E-mobility smart charging strategies18
3.3 Relevant Standards
Standards for electric mobility are developed for different application areas by various organisations, e.g., IEC (International Electrotechnical Commission), ISO (International Organization for Standardisation), and SAE (Society of Automotive Engineers International). An overview of the ISO and IEC standards on conductive charging is shown in Figure 13. Other programs are also collaborating to develop standards for fast charging: The CharIN initiative promotes the CCS (Combined Charging System) standard and the CHAdeMO association coordinates the CHAdeMO standard.
Table 1: List of Standards for EV charging
Standard Title
ISO 6469 Electrically propelled road vehicles — Safety specifications
ISO 17409:2020 Electrically propelled road vehicles — Conductive power transfer — Safety requirements
ISO 26262 Road vehicles – Functional safety
ISO 15118 Road vehicles — Vehicle to grid communication interface
ISO 19363Electrically propelled road vehicles — Magnetic field wireless power transfer — Safety and interoperability
requirements
IEC 61851 Electric vehicle conductive charging system
IEC 60664 Insulation coordination for equipment within low-voltage systems
IEC 60990 Methods of measurement of touch current and protective conductor current
Figure 13: Wired charging and related standards of EVs (Nationale Plattform Elektromobilität)

19 Smart Charging Strategies and Technologies for Electric Vehicles Simulation-based study to evaluate the effects of E-mobility smart charging strategies
Standard Title
IEC 61000 Electromagnetic compatibility (EMC)
IEC 61508 Functional safety of electrical/electronic/programmable electronic safety-related systems
IEC 62196 Plugs, socket-outlets, vehicle connectors and vehicle inlets - Conductive charging of electric vehicles
IEC 61980 Electric vehicle wireless power transfer (WPT) systems
IEC 62752 In-cable control and protection device for mode 2 charging of electric road vehicles (IC-CPDs)
IEC 60364 Low-Voltage electrical installations
IEC 62913 Generic smart grid requirements
IEC 62660 Secondary lithium-ion cells for the propulsion of electric road vehicles
IEC 61850 Communication networks and systems for power utility automation (including EEBUS)
IEC 63119 Information exchange for electric vehicle charging roaming service
IEC 62893 Charging cables for electric vehicles of rated voltages up to and including 0,6/1 kV
ECE R100Uniform provisions concerning the approval of vehicles regarding specific requirements for the electric
power train
ECE R10 Electromagnetic compatibility (EMC)
SAE J1772 SAE Electric Vehicle and Plug in Hybrid Electric Vehicle Conductive Charge Coupler
SAE J2954 Wireless Power Transfer for Light-Duty Plug-in/Electric Vehicles and Alignment Methodology
SAE J2847 Communication Between Plug-In Vehicles and Off-Board DC Chargers
SAE J2183 60 V and 600 V Single-Core Cables
CHAdeMO
CHAdeMO is a DC charging standard for electric vehicles. It enables seamless communication between the
car and the charger. It is developed by the CHAdeMO Association, which is also tasked with certification
and ensuring compatibility between car and charger.
CCS Combined Charging System
GB/T 20234 Connection set for conductive charging of electric vehicles (China)
GB/T 18487 Electric vehicle conductive charging system (China)
GB/T 18384 Electrically propelled road vehicles-Safety specifications (China)
GB/T 27930Communication protocols between off-board conductive charger and battery management system for electric
vehicle(China)
OCPP Open Charge Point Protocol
EEBUS language for devices to communicate about energy
OpenADRThe OpenADR Alliance was created to standardize, automate, and simplify Demand Response (DR) and
Distributed Energy Resources (DER)

Smart Charging Strategies and Technologies for Electric Vehicles Simulation-based study to evaluate the effects of E-mobility smart charging strategies20
Several standards can be pertinent in each application area. Table 1 shows a list of common standards. The charging station for conductive charging is covered by IEC 61851, SAE J1772, and GB/T 18487 standards, while the plug, socket and cord are covered separately in the IEC 62196, SAE J1772, GB/T 20234, IEC 62893, SAE J2183, ChaDeMo, and CCS standards. Communication is also addressed in separate standards such as ISO15118, IEC 61851, SAE J2847, GB/T 27930, CCS, and ChaDeMo. Different standards can be applied for various communication applications like vehicle to charging station or charging station to charging station operator backend.
In addition to the standards addressing electric vehicle charging, national requirements for electrical installation must be met, e.g., VDE-AR-N-4100 in Germany. Several standards could be applied to
the components onboard EV, e.g., LV123 and LV124 for electric components and high-voltage components in automobiles.
An essential intention of such standards is the protection of humans. In this report, only some requirements for AC and DC charging systems are elaborated as an example. The IEC 61851-1 standard imposes several requirements for AC charging systems. One important requirement is installing a Residual Current Device (RCD) type B a with rated current of 30 mA or an RCD type A with an additional circuit to interrupt the supply for DC fault currents greater than 6 mA. Another requirement is that the voltage at touchable conducting parts must be lower than 60 V no later than one second after the supply is disconnected.
DC charging systems need to be compatible with an RCD type A according to IEC 61851-23. One second after disconnecting the supply, the voltage at touchable conducting parts must be lower than 60V or the charge between any contact must be lower than 50 µC.
Figure 14: Example for communication infrastructure in private households with possible communication protocols for different applications (Verband der Automobilindustrie 2020)
Different standards can be applied for different communication applications like vehicle to charging station or charging station to charging station operator backend.

21 Smart Charging Strategies and Technologies for Electric Vehicles Simulation-based study to evaluate the effects of E-mobility smart charging strategies
3.4 Communication protocols For a smart charging infrastructure, several communication paths must be covered. Figure 14 shows an exemplary overview of these channels for households with a charging station.
3.4.1 COMMUNICATION BETWEEN ELECTRIC VEHICLE AND CHARGING STATION: IEC 61851 AND ISO 15118
IEC 61851 allows basic information on the charging process to be exchanged based on analog communication between the vehicle and the charging station. The charging station uses the so-called duty cycle of a pulse width modulation (PWM) to signal the maximum supported current, among other things. The vehicle can transmit its current status via a resistance identifier, such as “Ready to charge” or “Ventilation required” (for charging processes in closed rooms/garages). The standard is implemented in all relevant charging stations and electric vehicles in Europe and represents the de-facto standard.
The ISO 15118 standard is based on IEC 61851 and supplements it with digital communication via Powerline. This makes it possible to exchange more complex information such as the vehicle’s charging status and battery capacity, tariffs, and charging schedules. The primary function enabled by the standard is so-called “smart charging”. For this purpose, charging capacity, charging time, energy costs, and billing modalities are transferred between the charging station and the EV, and the car is charged when energy is cheap. The Open Charge Point Protocol (OCPP) is provided for communication between the charging station and its operator. Furthermore, grid connection and long-term aspects of smart grids/use of BEVs as distributed storage are supported. A charging schedule is applied that takes into account available energy and the expected mobility demand. The charging process can be adjusted spontaneously. The communication is based on Transmission Control Protocol/Internet Protocol (TCP/IP), Dynamic Host Configuration Protocol (DHCP), and Programmable Logic Controller (PLC). The Vehicle-to-Grid Transport Protocol (V2GTP) is used as the communication control layer, while a minimalized XML protocol and so-called V2G messages are used on the presentation/application layer.
The main advantage for the driver is that the identification and billing processes are automatic, based on the plug-in and go (“Plug&Charge”). In principle, the user can choose when to drive off again and the system ensures the optimal charge depending on that information.
The security of the standard is based on Transport Layer Security (TLS) and the matching of digital certificates that originate from a Grid Root Certificate Authority (V2G Root CAs). There can be several of these, which can certify each other. Hubject and Penta Security, for example, are such V2G Root CAs.
IEC 61851 allows basic information on the charging process to be exchanged between the vehicle and the charging station on the basis of analog communication.
The Open Charge Point Protocol (OCPP) is provided for communication between charging station and charge station operator.

Smart Charging Strategies and Technologies for Electric Vehicles Simulation-based study to evaluate the effects of E-mobility smart charging strategies22
ISO 15118 is expected to become very important for public charging infrastructure in the coming years. However, a “retrofitting” of existing charging systems supporting IEC 61851 is not to be expected across the board. Therefore, both the standards will still be prevalent in the field for years to come.
3.4.2 COMMUNICATION BETWEEN CHARGING STATION AND IT BACKEND: OCPP, OSCP, IEEE 2030.5, OPENADR, EEBUS
The Open Charge Point Protocol (OCPP) is used to connect charging stations to the operator’s IT backend. There are various versions in circulation. Currently, the versions OCPP 1.5 and 1.6 (used by ebee, Mennekes, wallbe, etc.) are most frequently used. OCPP 1.6 defines two alternative transport channels and uses the technologies including Simple Object Access Protocol (SOAP) or JavaScript Object Notation (JSON) -Websockets. The upcoming version OCPP 2.0 is adapted to charging stations with ISO 15118 support but is not yet in use. The IEC 63110 standard is currently being developed as a competitor to OCPP.
The OSCP (Open Smart Charging Protocol) transmits forecasts of available capacity on the power system from the DSO (distribution system operator) to the Charge Point Operator (CPO). It can be used between the DSO and the CPO as well as between the CPO and the HEMS (Home Energy Management System) to transmit a 24-hour capacity forecast. OSCP uses OCPP for communication between the CPO and the local controller.
The IEEE 2030.5 standard (“Smart Energy Profile Protocol”) concerns the interface between smart grid and users. This standard enables energy management at the end-user, including demand response, load control, communication of prices, distributed generation, storage and EV, as well as other resources including water, gas, and steam. The standard defines mechanisms for message exchange and security features. It allows several possible architectures and usage models, including communication directly between prosumer and service provider, within a Home Area Network (HAN), and between service provider and aggregator. The standard uses several elements from its other counterparts as sources, including IEC 61986 and 61850, and uses RESTful services.
OpenADR (Automated Demand Response) was developed in 2009 by Lawrence Berkeley National Laboratory (USA) as a standard for automated load management. In 2010, the OpenADR Alliance was formed, which today sees the standard as an open, highly secure smart grid standard. OpenADR was deployed in California’s automatic load management programs starting in 2013. The standard is available in version 2.0 and allows the exchange of price signals, setpoints, and metered values between loads, electric storage, distributed generators, and EVs on the one hand, and energy providers and aggregators on the other.
EEBus is a communication interface for energy management on the Internet of Things. It was developed as part of the SmartWatts research project in the E-Energy funding program and is being further developed by the members of the EEBus Initiative e.V. association, which was founded in 2012. Members include various manufacturers of charging infrastructure, including Mennekes, ABB, and ebee. Historically, EEBus focuses strongly on communication between devices of private end customers (e.g., household appliances) and local energy management systems. It is vendor-independent and interoperable with various smart home standards, e.g., KNX or ZigBee. Further development takes place in so-called working groups, which develop standardized use cases. One of the working groups has the title “E-Mobility & Connected Car”. Since 2015, the VDA (German Association of the Automotive Industry) has also been a member of the EEBus initiative.
The OSCP (Open Smart Charging Protocol) transmits forecasts of capacity availability on the power system from the DSO (distribution system operator) to the Charge Point Operator (CPO).
The IEEE 2030.5 standard (“Smart Energy Profile Protocol”) concerns the interface between smart grid and users.

23 Smart Charging Strategies and Technologies for Electric Vehicles Simulation-based study to evaluate the effects of E-mobility smart charging strategies
3.4.3 COMMUNICATION BETWEEN CHARGING STATION AND E-MOBILITY SER-VICE PROVIDER (EMSP): OICP, OCPI, OCHP, EMIP
This type of interface is determined by de facto standards and technologies adopted by the eMSP.
The OICP (Open Intercharge Protocol) is published by Hubject and is used to exchange information between the Hubject eRoaming platform and Charge Point Operators (CPOs) or electric Mobility Service Providers (eMSP). The Hubject platform is positioned between the CPO and the eMSP. The standard enables authorization and dynamic pricing of charging processes. Communication is based on SOAP and Representational state transfer (REST).
OCPI (Open Charge Point Interface) is used to connect electric Mobility Service Providers (eMSP) and CPOs. It can be used in P2P as well as with hubs such as GIREVE and e-clearing.net. It enables authorization, CP status transmission, remote CP control, the transmission of charging details, and prices and tariffs.
OCHP stands for Open Clearing House Protocol. It is used to connect local (country-specific) charging networks via a clearing house. The clearing house (e.g., e-clearing.net) acts as a “neutral” intermediary, e.g., between CPOs and eMSPs.
The eMIP (eMobility Inter-operation Protocol) is used for data transmission between GIREVE, a French e-roaming platform, and CPOs, eMSPs as well as Data Aggregators. It is used to (i) support roaming of charging services through authorization and a clearing house API and (ii) allow access to a charging station database. eMIP allows CPOs, Data Aggregators (holding information about charging stations including locations) and eMSPs to access the so-called GIREVE platform. A CPO can, for example, verify the authorization of an end customer via the platform.
3.5 Power ElectronicsAs shown in the block diagrams in Figure 4 - Figure 6, two converters are in the charger. The first one realizes the grid connection, and the other one supplies the battery. This two-stage concept is typically used in on-board chargers.
In this section, various topologies are given for the two separated stages, and several implementation possibilities for the power electronics of complete chargers are presented.
3.5.1 GRID CONNECTION AC/DC CONVERTER
In principle, three categories of converters can be considered to realise a three-phase grid connection: unidirectional converters (with and without the ability to provide reactive power) and bidirectional converters. For all the categories, single and three phase topologies are feasible.
Unidirectional converter topologies
As shown in Figure 15, a diode rectifier is a simple and inexpensive option, which only realizes unidirectional power flow to the battery.
The standard is available in version 2.0 and allows the exchange of price signals, setpoints, and metered values between loads, electric storage, distributed generators, and electric vehicles on the one hand, and energy providers and aggregators on the other.
Figure 15: Diode Rectifier

Smart Charging Strategies and Technologies for Electric Vehicles Simulation-based study to evaluate the effects of E-mobility smart charging strategies24
Figure 16: Vienna Rectifier (Feng et al. 2019)
To provide reactive power, it is necessary to add power factor correction (PFC) to the diode rectifier or to use an active rectifier topology such as the Vienna rectifier shown in Figure 16. The Vienna rectifier is a three level rectifier which allows the reduction of the inductor size by increasing the switching frequency (Kolar und Drofenik 2000).
Bidirectional converters
Figure 17: Active front end -B6
To deliver the complete list of grid friendly functions (refer to Table 2), an active front end such as the B6 topology is required, enabling bidirectional power flow and displayed in Figure 17. Only six switches are required, which represents the easiest way to realize a bidirectional AC/DC converter.
Figure 18: Three-phase neutral point clamped converter (Stolze et al. 2015)

25 Smart Charging Strategies and Technologies for Electric Vehicles Simulation-based study to evaluate the effects of E-mobility smart charging strategies
Adapting coordinated control strategies for a three-level topology can help reduce the inductor size by reducing current ripples. Figure 18 shows the neutral point clamped converter. The additional advantage of this specific circuit is that the switches only need to withstand half of the DC voltage, which results in lower switching losses. On the other hand, the conduction losses increase. The topology uses controllable switches and diodes, so that an asymmetrical loss distribution occurs. For reducing the asymmetrical losses, the diodes in the topology are replaced with controlled switches, resulting in the Active Neutral Point Clamped Converter Topology (ANPC) (Habib et al. 2020). A drawback of the ANPC is the high number of active switches. A possible trade-off is the T-Type Neutral Point Clamped Topologies (TNPC). A single leg of the TNPC is displayed in Figure 19.
For the TNPC, four switches are necessary. The switches S1 and S2 need to block the full DC voltage while the other switches need to block only half of the DC voltage.
The preferable choice of the bidirectional topology depends on many factors: cost, weight and volume, desired switching frequency and efficiency, the complexity of the control circuitry, and more. Therefore, all the topologies might be applicable depending on the use case.
Single phase converters
For a unidirectional single-phase grid connection, a diode rectifier (with optional PFC) is suitable. To realize bidirectional power flow, the H-Bridge (Figure 21) is the first choice, and the half bridge (Figure 20) is probably an alternative which is currently under investigation at Fraunhofer IEE.
Figure 20: Half bridge with midpoint connection
Figure 21: H-Bridge
Figure 19: T-Type Neutral Point Clamped Topologie (TNPC)
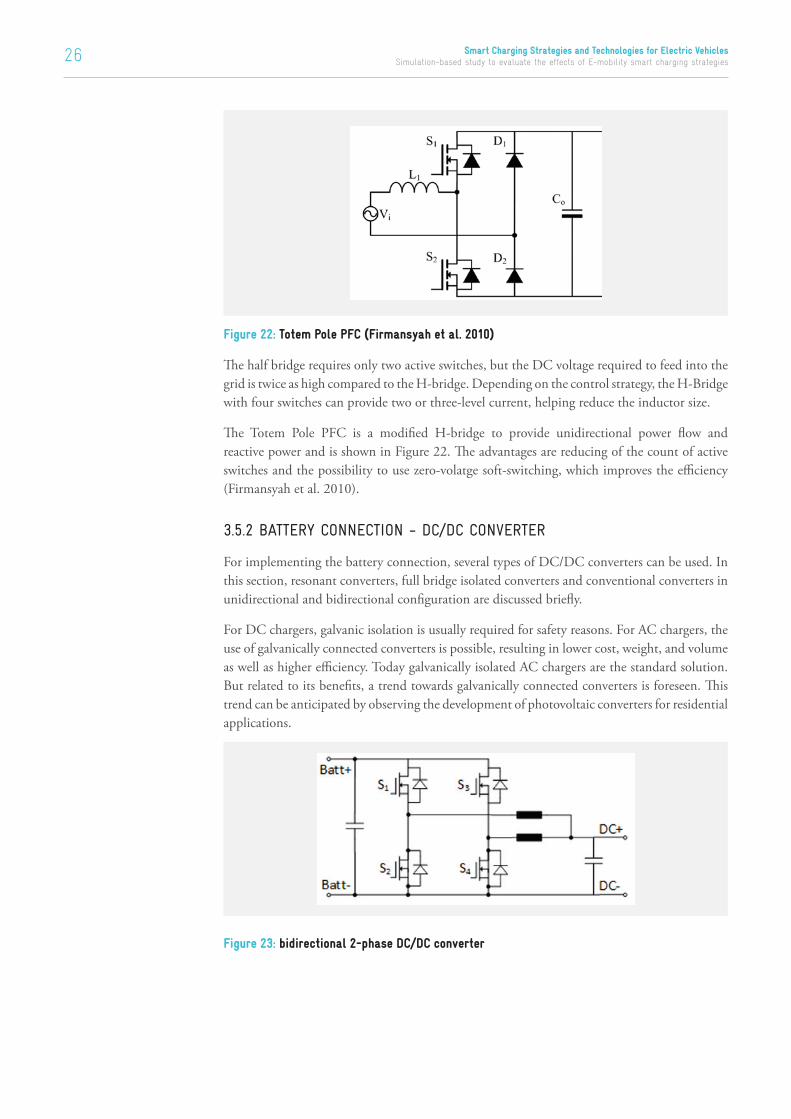
Smart Charging Strategies and Technologies for Electric Vehicles Simulation-based study to evaluate the effects of E-mobility smart charging strategies26
Figure 22: Totem Pole PFC (Firmansyah et al. 2010)
The half bridge requires only two active switches, but the DC voltage required to feed into the grid is twice as high compared to the H-bridge. Depending on the control strategy, the H-Bridge with four switches can provide two or three-level current, helping reduce the inductor size.
The Totem Pole PFC is a modified H-bridge to provide unidirectional power flow and reactive power and is shown in Figure 22. The advantages are reducing of the count of active switches and the possibility to use zero-volatge soft-switching, which improves the efficiency (Firmansyah et al. 2010).
3.5.2 BATTERY CONNECTION - DC/DC CONVERTER
For implementing the battery connection, several types of DC/DC converters can be used. In this section, resonant converters, full bridge isolated converters and conventional converters in unidirectional and bidirectional configuration are discussed briefly.
For DC chargers, galvanic isolation is usually required for safety reasons. For AC chargers, the use of galvanically connected converters is possible, resulting in lower cost, weight, and volume as well as higher efficiency. Today galvanically isolated AC chargers are the standard solution. But related to its benefits, a trend towards galvanically connected converters is foreseen. This trend can be anticipated by observing the development of photovoltaic converters for residential applications.
Figure 23: bidirectional 2-phase DC/DC converter
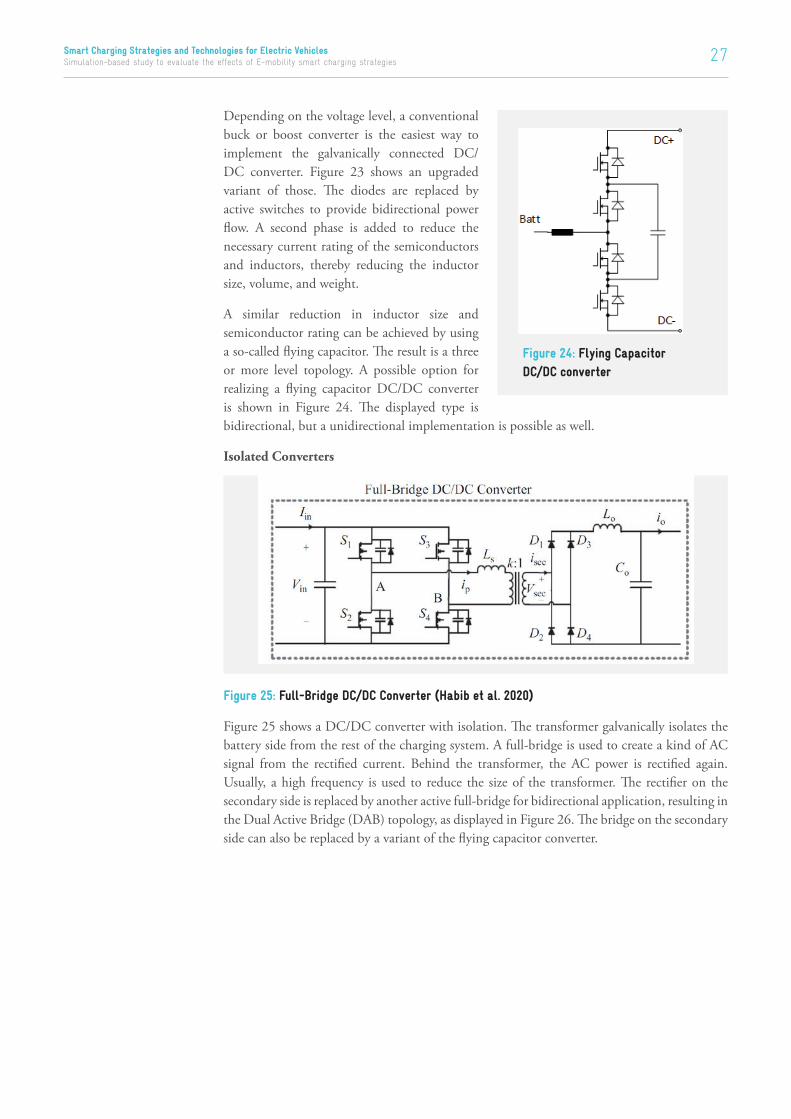
27 Smart Charging Strategies and Technologies for Electric Vehicles Simulation-based study to evaluate the effects of E-mobility smart charging strategies
Depending on the voltage level, a conventional buck or boost converter is the easiest way to implement the galvanically connected DC/DC converter. Figure 23 shows an upgraded variant of those. The diodes are replaced by active switches to provide bidirectional power flow. A second phase is added to reduce the necessary current rating of the semiconductors and inductors, thereby reducing the inductor size, volume, and weight.
A similar reduction in inductor size and semiconductor rating can be achieved by using a so-called flying capacitor. The result is a three or more level topology. A possible option for realizing a flying capacitor DC/DC converter is shown in Figure 24. The displayed type is bidirectional, but a unidirectional implementation is possible as well.
Isolated Converters
Figure 25: Full-Bridge DC/DC Converter (Habib et al. 2020)
Figure 25 shows a DC/DC converter with isolation. The transformer galvanically isolates the battery side from the rest of the charging system. A full-bridge is used to create a kind of AC signal from the rectified current. Behind the transformer, the AC power is rectified again. Usually, a high frequency is used to reduce the size of the transformer. The rectifier on the secondary side is replaced by another active full-bridge for bidirectional application, resulting in the Dual Active Bridge (DAB) topology, as displayed in Figure 26. The bridge on the secondary side can also be replaced by a variant of the flying capacitor converter.
Figure 24: Flying Capacitor DC/DC converter

Smart Charging Strategies and Technologies for Electric Vehicles Simulation-based study to evaluate the effects of E-mobility smart charging strategies28
Figure 26: Dual Active Bridge (DAB) (Habib et al. 2020)
Resonant Converters with Galvanic Isolation
Resonant converters are the suitable choice for reducing conduction losses, whereas soft-switching (Zero Voltage Switching – ZVS, Zero Current Switching – ZCS) reduces switching loss. So, the combination of resonant and soft-switching effectively reduces the overall losses. Different soft-switching resonant converters used for EV charging are given in Figure 27.
For reducing conduction losses, resonant converters are the suitable choice, whereas soft-switching (Zero Voltage Switching – ZVS, Zero Current Switching – ZCS) reduces switching loss.

29 Smart Charging Strategies and Technologies for Electric Vehicles Simulation-based study to evaluate the effects of E-mobility smart charging strategies
The Series Resonant Converter (SRC) has a series combination of an auxiliary inductor, capacitor, and network load. During the operation of SRC, the combination of L, C, and load acts as a voltage divider circuit. Modulation of the frequency of driving voltage changes the impedance of the resonant circuit. ZVS and ZCS both are applicable in SRC to reduce losses, thereby increasing efficiency (Habib et al. 2020). The Parallel Resonant Converter (PRC), a parallel combination of load and a resonant circuit is implemented in PRC, whereas the series inductor is placed with the load for impedance matching. The series-parallel resonant converter (SPRC) is a combination of series and parallel resonant converter and consists of an auxiliary inductor and two capacitors in series and parallel with an isolation transformer. This combined topology improves the characteristics of the converter in terms of control energy, output voltage regulation and sensitivity. SPRC has low circulating energy as compared to the PRC and is less sensitive to load variations. Other than this, traditional converters, LLC converters are popular in the EV charging domain. It can be implemented with a full-bridge or the requirement of EV charger design (Habib et al. 2020).
The constructional design of the resonant circuit is slightly different from the usual design. The inductor is placed in parallel with the magnetizing inductor, and a series combination of L and C is in series with the magnetizing inductor. In such a design, the series combination of L and C is responsible for higher frequencies, whereas series and parallel inductors are responsible for
Figure 27: Types of resonant converters a) Series resonant converter b) Parallel Resonant converter c) Series parallel resonant converter d) LLC converter e) L3C2 converter (Habib et al. 2020)

Smart Charging Strategies and Technologies for Electric Vehicles Simulation-based study to evaluate the effects of E-mobility smart charging strategies30
lower frequencies. It allows zero voltage and current switching that creates an appealing change in the operating region and characteristics of the charger compared to conventional converters. A new multi-resonant converter named L3C2 is introduced in the recent literature on EV charging applications. Increased inductor and capacitor combination allows operation over wider ranges and reduces noise in the output voltage.
3.5.3 SILICON VS. SILICON CARBIDE
For improving the efficiency of normal and fast chargers built from subunits, it is possible to replace silicon (Si) diodes and active switches with silicon carbide (SiC) devices. As an example, the Vienna rectifier is considered. Using SiC diodes instead of Si improves efficiency by about 0.8%. Replacing Si IGBTs with SiC MOSFETS increases efficiency by another 0.5% (Infineon Technologies AG 1.19). However, the cost of SiC devices is higher, but the cost difference has narrowed in recent years (Higgelke 18.10.20).
3.5.4 IMPLEMENTATION POSSIBILITIES
In this subsection, a selection of charger topologies will be displayed and discussed briefly.
Two Stage Charger
Figure 28: Full-bridge rectifier with a boost converter (Nguyen und Lee 2018)
Figure 28 shows a basic single phase charging system without galvanic isolation. As galvanic isolation is mandatory for offboard chargers, this topology is only suitable for onboard chargers. By substituting the diodes with active switches, a bidirectional topology is realized. For an offboard charging system, the boost converter could be changed to a galvanically isolated type (refer to Figure 29). For higher charging power, the grid connection is usually realized with three phases using, for example, the B6 topology, which is also displayed in Figure 29.
Figure 29: Two stage three-phase charger with galvanic isolation (Habib et al. 2020)
Using SiC diodes instead of Si improves efficiency by about 0.8%. Replacing Si IGBTs with SiC MOSFETS increases efficiency by another 0.5% (Infineon Technologies AG 1.19)

31 Smart Charging Strategies and Technologies for Electric Vehicles Simulation-based study to evaluate the effects of E-mobility smart charging strategies
Single Stage Charger
Single-stage chargers are possible to realize if low cost is the target. This charger type suffers from a limited conversion ratio, limiting their application in EV charging (Brenna et al.) and is therefore not discussed here.
Integrated Onboard Chargers
The concept of integration is based on reusing the drivetrain components, especially motor windings, and the inverter. This concept allows very high AC charging power with a low number of additional components. First commercial systems are available (Continental) but have not yet gone into large-scale production. A lot of topologies were proposed but they suffer from different drawbacks. Some require access to inaccessible areas of the motor windings or rearrangement of the windings. Another drawback is the higher complexity of the topology and increased stress on the components (Brenna et al.).
Multifunctional Onboard Chargers
The term ‘multifunctional’ is used in different charger concepts, two of which are described in this section: A charger with included low-voltage battery charger and a charger that combines different charging possibilities with as few components as possible.
Figure 30 shows an advanced multifunctional onboard charging system, which combines bidirectional AC charging for single and three phase charging with the possibility to use inductive charging. The concept, which was developed at Fraunhofer IEE, is proposed in (Jung 2016). The idea is to maximize flexibility in the choice of charging solution while adding as little weight and cost as possible.
Another possibility is to include the charger of the low voltage battery into the charging system of the traction battery and to share components to reduce weight, volume, and cost. A possible single-phase configuration is shown in Figure 31.
Figure 30: Multifunctional bidirectional charging system (Jung 2016)

Smart Charging Strategies and Technologies for Electric Vehicles Simulation-based study to evaluate the effects of E-mobility smart charging strategies32
3.6 Smart Control functionalities
The generally high parking time of vehicles of 23 hours on average (Arnold et al. 2015) makes it possible to consider the vehicle battery for other applications. In principle, it is also possible to feed electricity back into the grid for grid stability reasons or monetary gain.
Figure 32: Different applications of the BEV traction battery
The EV battery can be used in several ways, as shown in Figure 32 and explained below.
• Vehicle-to-home (V2H) systems enable intermediate storage of locally generated electric-ity (e.g., by photovoltaics) and temporary supply the building from the vehicle battery. Likewise, there is the possibility of exploiting time-variable purchase prices.
• Vehicle-to-Island (V2I) is the supply of electricity to a building from the vehicle battery when the grid connection is interrupted or unavailable, creating a microgrid. This enables the supply of electricity during technical snags in the power grid or disaster situations.
• Vehicle-to-grid (V2G) enables the provision of system services for the power grid. This includes controlled charging, energy recovery (BDWE 2017), reactive power for voltage control and active power for frequency control.
Figure 31: Multifunctional OBC proposed in (Nguyen und Lee 2018)

33 Smart Charging Strategies and Technologies for Electric Vehicles Simulation-based study to evaluate the effects of E-mobility smart charging strategies
• Controlled charging (V1G) enables the postponement of charging operations during periods of high grid utilization, the so-called “grid- and system-serving flexibility”. Control can take place via market incentives or intervention by the grid operator. For charging systems with rated power greater than 12 kVA, a control system in accordance with the German VDE-AR-N 4100 standard must be provided. With the assistance of local charging management, it is possible to increase the number of charging points for the same grid connection power and thus to operate more electric vehicles for the same grid connection fee.
• Vehicle-to-vehicle (V2V) systems allow a traction battery to be charged from the battery of another vehicle with the appropriate equipment.
• Vehicle-to-Device (V2D) makes it possible to supply electrical appliances intended to connect household or industrial sockets from the vehicle battery. Examples of application areas include supplying power tools, providing emergency power during disasters, or operating consumer electronics such as an electric grill in off-grid areas.
V2V, V2D and V2I functions have no direct relevance for the electric grid. Possible grid-friendly function within V1G and V2G concepts are collected in Table 2 to show the potential benefits for grid stability and cost reduction. The grid may also benefit from V2H functions. The benefit varies with the configuration of the V2H system, whether it is focused on maximizing the consumption of locally generated energy or on peak shaving.
3.6.1 GRID FRIENDLY FUNCTIONS
Table 2: Grid friendly functions
Grid friendly function BenefitNormative mandatory
Exemplary in Germany
Voltage stability
Low-Voltage-Ride-Through (LVRT)Withstand the system for voltage
dip condition for a limited time
Bidirectional systems
with MV access
Q(U)-characteristic Local voltage stability Yes
Power factor correction Controlled voltage stability Yes
Frequency stability
Active power limitation Power balance Yes
P(f)- characteristic Local frequency stability Yes
Active power feedback (V2G) Provision of operating reserve No
Grid quality
Unbalanced load / compensation Grid quality support No
Harmonics compensation Increase in grid quality No
Grid restart (after blackout) Security of supply No
Island detectionSafety shutdown in case of a
blackoutYes
V2V, V2D and V2I functions have no direct relevance for the electric grid.

Smart Charging Strategies and Technologies for Electric Vehicles Simulation-based study to evaluate the effects of E-mobility smart charging strategies34
3.7 Comparison Framework of Commercially Available EV Chargers
Comparison between EV chargers is based on various technical and economic parameters. The functionality of chargers, namely, fast and slow chargers and the applicable vehicle segments are also the major factors in EV charger comparison. Factors governing comparison between commercially available chargers are given below:
Output rating
Based on the maximum output power rating of the charger, charging can be differentiated into slow and fast charging. Chargers with lower output ratings have comparatively slower charging speed, and hence, charges with a high rating are implemented for fast charging.
Connector type
The connector type differentiates the chargers as a dumb or smart charger. Different connectors have different maximum ratings, which affects the speed and applicability of chargers. Smart connectors are primarily preferred in public charging stations to allow the active control of charging. Connectors also have different allowed modes and levels of charging, which also establishes charger comparison. Non-standardised connector designs restrict the scope of chargers. Adaptors that increase chargers’ interoperability with different vehicle inlet types are introduced in markets to mitigate this issue.
Efficiency
It is a deciding factor while adopting the charger and performing cost analysis for cost recovery and revenue generation.
Cost
Cost is the influencing and deciding factor in the comparison of EV chargers. Cost analysis and other technical specifications and applicability are essential for determining the best choice among commercially available chargers.
Applicability and Functionality
Based on applicability and functionality, EV chargers are compared. Chargers for a heavy-duty vehicle, quick chargers, and slow chargers are the various available EV chargers.
Vehicle categories
There are various categories of vehicles, namely, 2W, 3W, 4W, light commercial vehicles, and heavy-duty vehicles. Chargers can be compared based on the vehicle segment in which they are most applicable.
EV chargers are broadly classified into two categories: dumb charger and smart charger. Technical specification of an EV charger covers charger type, input and output rating of charger, connector type, number of connector guns, power factor, charger efficiency, level/mode of charging, and communication facilities. A discussion on the technical parameters of chargers is given in Annexure I.
Technical specification of an EV charger covers charger type, input and output rating of charger, connector type, number of connector guns, power factor, charger efficiency, level/mode of charging, and communication facilities.

35 Smart Charging Strategies and Technologies for Electric Vehicles Simulation-based study to evaluate the effects of E-mobility smart charging strategies
01
02
03
04
05
06
Technical Prameters of
Charger
Chargertype
Input Output rating of charger
Connectortype
Number of connector gun
Level/mode of charging
Communication
Figure 33: Technical parameters of chargers
3.8 Commercially available Smart Charging products and technologies
Considering tremendous potential benefits of smart charging, several EV smart charging products are already available in the market. These products can be categorized based on their applicability. The scope of applicability of products is network tools, optimisation solutions, charging stations or charging boxes. Network tools can again be classified into interactive communication tools or mobile applications for communication platforms.
Detail information on smart charging products based on applicability are mentioned below.
3.8.1 NETWORK TOOL
A network tool is defined as the tool used to connect to the communication network for indicating the charging request and other information on charging specifications, vehicle specification and authentication. Mobile applications and cloud-based platforms are ways of connecting and communicating with responsible charging entities.
3.8.1.1 PLATFORM
The platform interconnects various EV environment entities to perform computational or storage tasks easily and rapidly. Different platform products available for smart charging are given below:
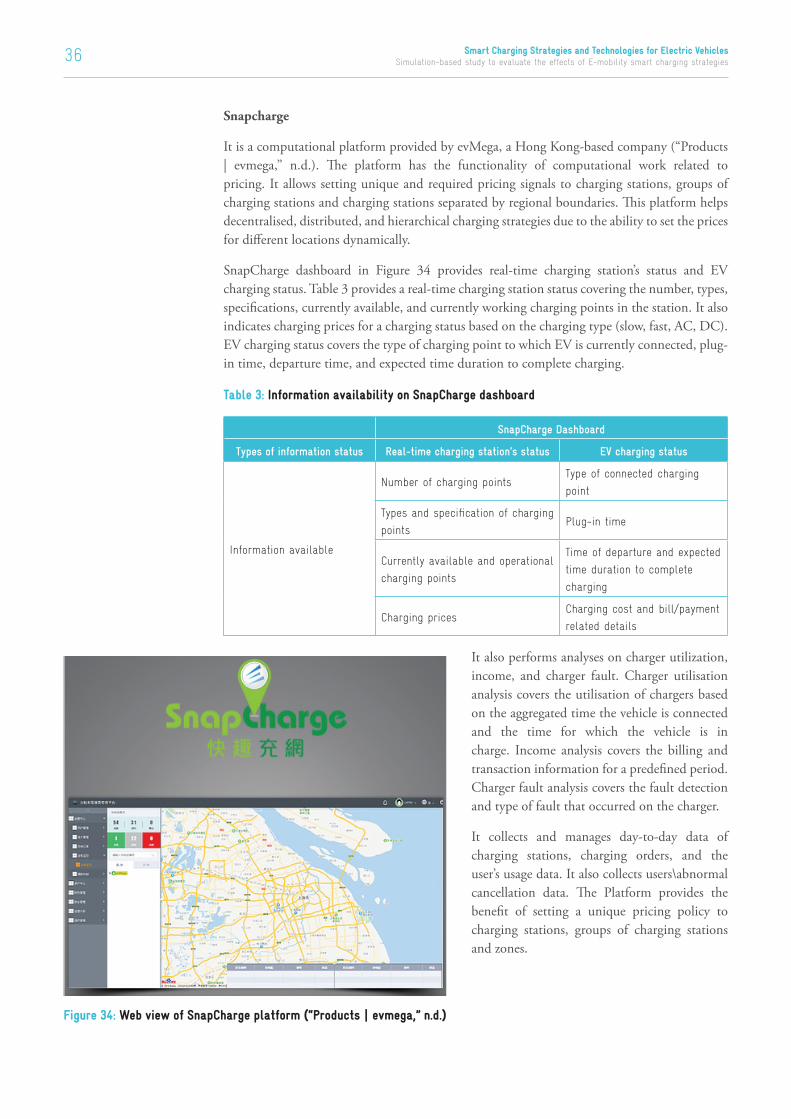
Smart Charging Strategies and Technologies for Electric Vehicles Simulation-based study to evaluate the effects of E-mobility smart charging strategies36
Snapcharge
It is a computational platform provided by evMega, a Hong Kong-based company (“Products | evmega,” n.d.). The platform has the functionality of computational work related to pricing. It allows setting unique and required pricing signals to charging stations, groups of charging stations and charging stations separated by regional boundaries. This platform helps decentralised, distributed, and hierarchical charging strategies due to the ability to set the prices for different locations dynamically.
SnapCharge dashboard in Figure 34 provides real-time charging station’s status and EV charging status. Table 3 provides a real-time charging station status covering the number, types, specifications, currently available, and currently working charging points in the station. It also indicates charging prices for a charging status based on the charging type (slow, fast, AC, DC). EV charging status covers the type of charging point to which EV is currently connected, plug-in time, departure time, and expected time duration to complete charging.
Table 3: Information availability on SnapCharge dashboard
SnapCharge Dashboard
Types of information status Real-time charging station’s status EV charging status
Information available
Number of charging pointsType of connected charging
point
Types and specification of charging
pointsPlug-in time
Currently available and operational
charging points
Time of departure and expected
time duration to complete
charging
Charging pricesCharging cost and bill/payment
related details
It also performs analyses on charger utilization, income, and charger fault. Charger utilisation analysis covers the utilisation of chargers based on the aggregated time the vehicle is connected and the time for which the vehicle is in charge. Income analysis covers the billing and transaction information for a predefined period. Charger fault analysis covers the fault detection and type of fault that occurred on the charger.
It collects and manages day-to-day data of charging stations, charging orders, and the user’s usage data. It also collects users\abnormal cancellation data. The Platform provides the benefit of setting a unique pricing policy to charging stations, groups of charging stations and zones.
Figure 34: Web view of SnapCharge platform (“Products | evmega,” n.d.)

37 Smart Charging Strategies and Technologies for Electric Vehicles Simulation-based study to evaluate the effects of E-mobility smart charging strategies
Juicenet Platform
JuiceNet platform in Figure 35 is provided by EnelX (“JuiceNet: vehicle-to-grid cloud-based platform for grid balancing.,” n.d.). It is a cloud-based EV load management and optimisation platform. Intelligent JuiceNet platform has patented communication and control. It actively manages the charging station’s demand using real-time input, charging pattern data, signals from grid operators, utilities, and aggregators. It uses an open API so that it can connect and control any Wi-Fi connected charging station. It coordinates the charging rate and timing of EV. It also provides flexibility to the EV user to override these automatically coordinated parameters during any emergency. JuiceNet offers the following functionalities:
Improving grid reliability
It controls the charging ramp rate and transformer loading, which improves the system’s reliability.
Cost-effective solution
It achieves maximum utilisation of system components and efficient utilisation of available power. It reduces the charging cost on each charging session and ultimately reduces the cost burden on customers by reducing the monthly electricity bill.
Reduce emissions and improve local air index
It ensures the maximum utilisation of available energy from conventional and RE generators that reduces the emission from conventional plants. Air quality at a location is also improved because of less conventional generation, more renewable utilisation and more EV adoption.
Reduce EVSE cost
EVSE is an EV supply equipment that supplies charging power to EV via charging point or charging station. JuiceNet platform promotes charging through grid participation incentives.
JuiceNet optimizes EV load and allows increased and efficient EV integration that supports cleaner and efficient transportation than gasoline-powered vehicles. JuiceNet platform is not limited to JuiceNet family products and charging stations, but it also provides its services to global EVSE manufacturers, utilities, and EV customers. It offers visible benefits for EV owners regarding reduced charging cost and indirect benefits for a cleaner environment. It also benefited the system operator and aggregator by maximizing the utilisation of existing equipment and infrastructure.
Charging Telemetry & Control
Control & Monitoring
Electric Grid Charging Stations User Devices
JuiceNet Cloud Platform
Responsive EV load
Figure 35: Properties of JuiceNet platform (“JuiceNet: vehicle-to-grid cloud-based platform for grid balancing.,” n.d.).

Smart Charging Strategies and Technologies for Electric Vehicles Simulation-based study to evaluate the effects of E-mobility smart charging strategies38
Attractive features of the JuiceNet platform are mentioned below:
Smart dispatch and API access
It provides charging control decisions in the form of charging rates. It dynamically changes as per the local grid conditions and grid constraints. This provides the capability of centralised control using the juiceNet platform. An electricity market-based algorithm considers customers’ requirements, choice, and schedule of EVSE as per the grid’s available power and other constraining parameters. The platform works on API and IT support utilities, system operators, aggregators, and EV users’ interfaces.
Model and data prediction
Predictive event modelling based on historical data of customer’s charging behaviour, grid capacity forecast, and electricity market capacity and behaviour is performed for smart charging. Virtual connection and networking of EVSEs perform load sharing. Remote data from EVSE in time-series format is collected and stored for prediction.
EV drivers experience
EV drivers maintain charging station control based on their communicated charging preferences, real-time charging rate, and time of used schedule. It also provides the option to the customer to override the control decision at any time. This interactive platform uses the customer’s charging history to provide notifications and alerts and allows users to earn cash rewards in selected regions via JuicePointProgram.
Cloud Energy Car Networking
Cloud energy car networking shown in Figure 36 is an important component in the EV network (Cloud, 1998). It’s a cloud-based networking platform and forms an energy internet constitute of EVs. The centralised grid centre and cloud centre has combined computational functionality of taking an optimal charging decision. Optimal charging signals to connected EVs or charging stations act as a charging guide and are visible over the service prompt. EV customers can realise the real-time energy transaction of smart charging stations. It also performs real-time charge settlement by connecting the grid centre and cloud network.
Information control center Office building
Power supply
Car networking
Power storageSelf-owned power
generation
Transaction center
Electric energy
wholesaling
Self-
owne
d pow
er
gene
ration
Internet surfacing by surplus
electric energy
Charg
ing
Datainteraction
Information exchange
Cloud center
Figure 36: Network components connected to Cloud energy car networking (Cloud, 1998)
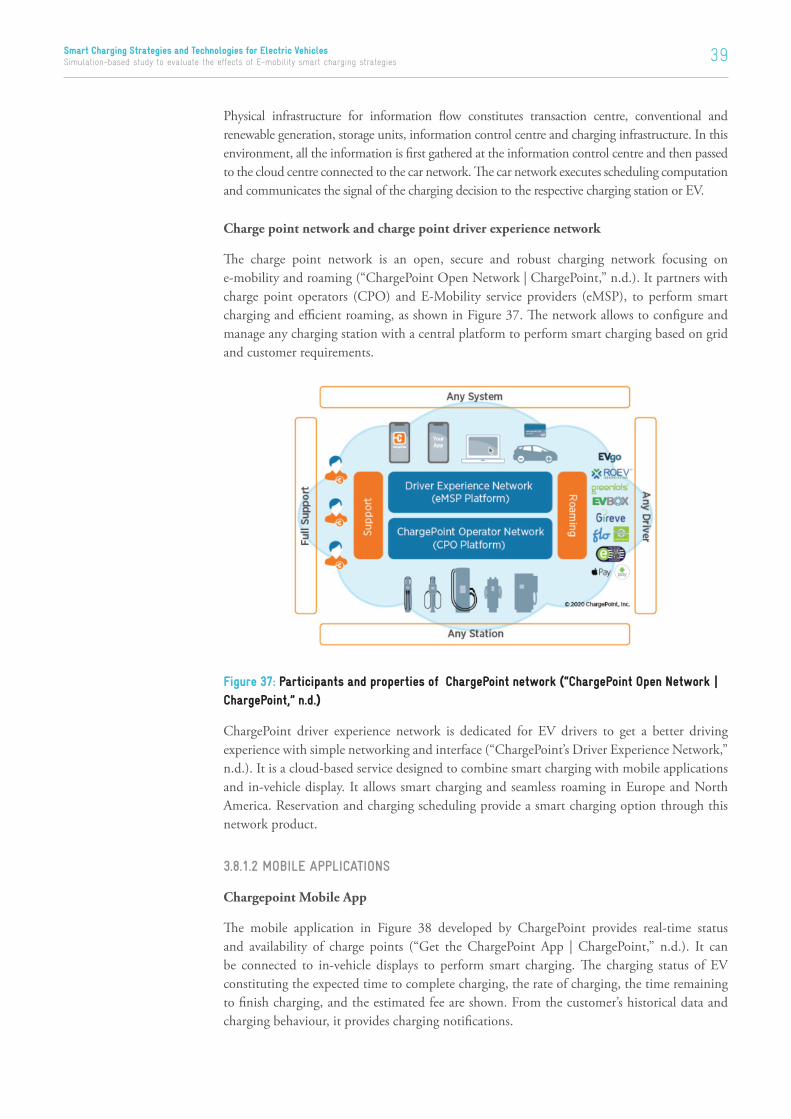
39 Smart Charging Strategies and Technologies for Electric Vehicles Simulation-based study to evaluate the effects of E-mobility smart charging strategies
Physical infrastructure for information flow constitutes transaction centre, conventional and renewable generation, storage units, information control centre and charging infrastructure. In this environment, all the information is first gathered at the information control centre and then passed to the cloud centre connected to the car network. The car network executes scheduling computation and communicates the signal of the charging decision to the respective charging station or EV.
Charge point network and charge point driver experience network
The charge point network is an open, secure and robust charging network focusing on e-mobility and roaming (“ChargePoint Open Network | ChargePoint,” n.d.). It partners with charge point operators (CPO) and E-Mobility service providers (eMSP), to perform smart charging and efficient roaming, as shown in Figure 37. The network allows to configure and manage any charging station with a central platform to perform smart charging based on grid and customer requirements.
Figure 37: Participants and properties of ChargePoint network (“ChargePoint Open Network | ChargePoint,” n.d.)
ChargePoint driver experience network is dedicated for EV drivers to get a better driving experience with simple networking and interface (“ChargePoint’s Driver Experience Network,” n.d.). It is a cloud-based service designed to combine smart charging with mobile applications and in-vehicle display. It allows smart charging and seamless roaming in Europe and North America. Reservation and charging scheduling provide a smart charging option through this network product.
3.8.1.2 MOBILE APPLICATIONS
Chargepoint Mobile App
The mobile application in Figure 38 developed by ChargePoint provides real-time status and availability of charge points (“Get the ChargePoint App | ChargePoint,” n.d.). It can be connected to in-vehicle displays to perform smart charging. The charging status of EV constituting the expected time to complete charging, the rate of charging, the time remaining to finish charging, and the estimated fee are shown. From the customer’s historical data and charging behaviour, it provides charging notifications.

Smart Charging Strategies and Technologies for Electric Vehicles Simulation-based study to evaluate the effects of E-mobility smart charging strategies40
It also provides information and notification regarding rush hours or popular timing based on behaviour analysis study on all connected EVs. It also provides a facility to manage RFID cards and transactions.
EV Juicenet App
EnelX provides a mobile application shown in Figure 39 to perform smart charging to reduce charging costs and indirectly support grid requirements. It provides an option of charge scheduling considering tariff structure. TOU structure is available as per the locational information provided in the app. TOU is a time-of-use price structure with different electricity prices according to the nature of demand (peak load, off-peak load). This interactive mobile application and web portal with charge scheduling saves the economic burden of the customer. In addition to the scheduling option, the app provides other options that cover technical and timely information about the current charging session (“emobility.enelx,” n.d.).
Tesla, BMW charging, NisanConnect, ev.energy, EVGO, Plugshare, Evmatch, etc., are some additional smart charging mobile applications used commercially.
3.8.2 OPTIMISATION SOLUTIONS
EV charging is an emerging business, and it is directly related to the electricity grid and electricity cost. It initiates the need for optimization in the EV environment to minimize the charging cost, maintain grid stability, and maximise available energy utilisation. Commercially available smart-charging optimization solutions are listed below:
3.8.2.1 CHARGEPOINT ECO
ChargePoint provides a smart charging optimization solution named ChargePoint ECO (“ChargePoint ECO,” n.d.) which facilitates users (industries, workplaces) to implement EV charging strategies as per business requirement. ChargePoint ECO has the capability of resource maximization and ecosystem integration. It optimizes the resources in real-time using available electrical capacity, available renewable energy, and battery storage. It optimistically determines the refueling need that used further to generate the charging schedule.
Figure 39: EV JuiceNet mobile application (“emobility.enelx,” n.d.)
Figure 38: ChargePoint mobile application (“Get the ChargePoint App | ChargePoint,” n.d.).

41 Smart Charging Strategies and Technologies for Electric Vehicles Simulation-based study to evaluate the effects of E-mobility smart charging strategies
It follows industry open protocols and standards that help in accurate optimization considering all possible EV infrastructure data. The optimizer’s dashboard shown in Figure 40 provides real-time charging information, which initiates various charging notifications for the customer. Customization of the optimizer is an attractive feature from the industry’s business requirement perspective. Firms with different objects such as cost minimization and/or ancillary services can use this product.
3.8.2.2 EV SITE SOLUTION (EVSS)
ABB Ltd. Provides an EV site solution defined as an optimization energy management solution for EV charging stations (“EV Site Solution - EV Charging | Electric Vehicle Chargers | ABB,” n.d.). It considers EVSE, solar, battery energy storage system (BESS), building automation, and grid while optimizing for a predefined objective. BESS are stacks of batteries to store the energy for later use. The primary optimization objective is to reduce charging costs and maximize charger utilization. It maintains grid parameters for growing EV charging demand by centralized energy monitoring and optimization. EVSS is beneficial for fleet control due to its capability of reducing cost and maximizing utilization of generation. Smart optimizer EVSS performs the optimization considering real-time site parameters and ensures EV charging allocation within the site’s capability. This capability of the EVSS solution box, shown in Figure 41, eliminates the requirement of costly grid upgrades. It is scalable and can adapt to any future scaling of site and EV population growth. It also provides flexibility in allowing the EVSS to optimize for other objective functions.
3.8.3 CONTROLLER
A load management controller is required in charging stations to manage energy distribution within the charging station. It coordinates power between the charging point of a charging station to maximize charging based on the real-time availability of power.
Figure 41: EV site solution box (“EV Site Solution - EV Charging | Electric Vehicle Chargers | ABB,” n.d.)
Figure 40: Dashboard of Charge Point ECO (“ChargePoint ECO,” n.d.)

Smart Charging Strategies and Technologies for Electric Vehicles Simulation-based study to evaluate the effects of E-mobility smart charging strategies42
3.8.3.1 LOAD MANAGEMENT CONTROLLER
evMega provides a load management controller shown in Figure 42 (“Products | evmega,” n.d.). It manages Level 1 and Level 2 charging load using different load management algorithms. Load management algorithms are classified as Grade 0, Grade 1, and Grade 2. Grade 0 is a queue management algorithm, whereas Grade 1 is a static load management algorithm. Grade 2 is a dynamic load management algorithm and performs real-time load management. The maximum allowed charger connections are 24 charger guns for 3-phase EVSE and 72 for 1-phase EVSE. It also supports clusters of chargers. For load management, it uses OCPP 1.6 open communication protocol. It can also connect using Wi-Fi or LAN for communication. It also has the feature of monitoring and displaying and uses RTU 485 Modbus for metering.
3.8.3.2 EVLINK LOAD MANAGEMENT SYSTEM
Schneider provides the EVlink series for EV charging products (“Catalog 2020 Electric vehicle charging solutions | EVlink | Schneider Electric,” n.d.). EVlink load management system in Figure 43 performs monitoring and control and maximizing of EV charging. It is performed in real-time, considering the available capability of charging stations or a building. It performs load management for cost minimization and efficiency maximization. The EVlink load management system’s primary function is to allocate power charging points and confirm centralization and availability to each charging point.
The management system is connected to charging points using LAN for internal communication. External communication is performed over Ethernet LAN or 3G/4G Modem and OCPP 1.6. It has an interactive user interface to allow remote start and stop of the charging session. The user also can reset and reboot the charging session. The dashboard provides the real-time charging status of each charging point and allows downloading of historical data. It manages up to 100 charging stations. With a decentralised and flexible architecture, the system can control up to 1000 charging stations in master/slave configuration. In decentralized and flexible architecture, it controls up to 1000 charging stations in master/slave configuration. The capacity of the number of charging points connected to the management system is dependent on the mode of operation (static and dynamic).
Master EVlink load management system (LMS) can manage 9 slave EVlink LMS and each slave EVlink can manage 100 charging stations. In fault situations, the management system manages load using two aspects as mentioned below:
• Already consumed energy
In limited power availability conditions or load shedding conditions, the management system interrupts supply to the systems in descending order of charging stations with more energy consumption starting from its charging sessions.
Figure 42: Load management controller (“Products | evmega,” n.d.)

43 Smart Charging Strategies and Technologies for Electric Vehicles Simulation-based study to evaluate the effects of E-mobility smart charging strategies
• Plug-in time
Management system interrupts the sup-ply to EVs based on highest plug-in time of vehicles and favours lastly arrived EV.
3.8.3.3 VCHARM-CHARGING STATION MANAGEMENT
It is a charging and load management software, a product of the company Vector (“vCharM | Charging Station Management System | Vector,” n.d.). It intelligently coordinates charging points within charging stations. It is supported with OCPP 1.6, so it can easily work with any charging station. This makes vCharM an independent product from charging station manufacturers. This product is available and applicable in different variants for residential charging stations, commercial charging stations, EV fleet, and charge point operators. It also possesses interoperability because of OCPP without any other adoption as per the charging station’s properties. The dashboard of vCharM shown in Figure 44 provides real-time optimization information.
Figure 44: Dashboard of vCharM- charging station solutions (“vCharM | Charging Station Management System | Vector,” n.d.)
3.9 Commercially available charging stationsIn this section a list of charging stations for AC and DC charging is provided. The market overview was presented as part of the PowerToDrive exhibition (PowerToDrive 2020). A comparison with the less extensive research of the Fraunhofer IEE showed, that this list is exhaustive with one constraints- the named companies are selling the products, however, they are not necessarily the manufacturer of the charging station. In addition, Table 4 provides some examples of available onboard chargers. The available information on onboard chargers is very limited, because the product is only sold to automotive OEMs.
Figure 43: EV link load management system box (“Catalog 2020 Electric vehicle charging solutions | EVlink | Schneider Electric,” n.d.)

Smart Charging Strategies and Technologies for Electric Vehicles Simulation-based study to evaluate the effects of E-mobility smart charging strategies44
Table 4: Commercially available charging stations for AC and DC charging
Company Product AC Power DC Power Phases Sockets | Plugs RemarksData Sheet | Information
chargeIT mobility GmbH
E-Bus charging station
44 kW – 3 type2 Input: 400V/63A, output: 3x230V/400V/63A
www.chargeit-mobility.com
Hypercharger 22 kW 75-300 kW 3 CCS, Chademo, type2
– www.chargeit-mobility.com
Libreo One 22 kW – 3 type2 Wall or ground mounted, input: 400V/50A, output: 230/400V up to 32 A
www.chargeit-mobility.com
Plug&play charging box
33 kW – 3 2xtype2 Wall or ground mounted, input: 400V/50A, output: 230/400V up to 32 A, each charging point max. 22 kW
www.chargeit-mobility.com
Wall box 11 kW, 22 kW – 3 type2 Wall or ground mounted, input: 400V/16A/32A, output: 3x230/400V max. 16A/32A
www.chargeit-mobility.com
ChargeX GmbH
Aqueduct 11, 22 kW – 3 type2 socket, optional with cable type2
Plug and play modular expandable up to 8 charging points
www.chargex.de
Compleo Charging Solutions GmbH
charging system FLEET (Basic, Advanced)
3.7, 11, 22 kW – 1, 3 charging cable (4m), type2 socket
Up to 60 charging points possible
www.compleo-cs.com
CITO 240 & 500 22 kW 24 kW, 50 kW
1, 3 Charging cable, 3 in 1: Typ 2 | CCS | CHA
AC & DC in one station www.compleo-cs.com
DAfi GmbHSmartfox Pro and Car Charger app
1.3 kW/4.3 kW – 1, 3 – – www.smartfox.at
Delta Electronics (Netherlands) B.V.
EV AC MAX charging station
7.4 kW, 11 kW, 22 kW
– 1, 3 type2 Input 230 VAC, 32 A or 400 VAC (3ph), 32A
emobility.delta-emea.com
UFC 200 kW 65 kW 200 kW 3 CCS, Chademo, type2
Up to 1,000 V DC, up to 4 EV, CCS: 400 A, Chademo: 125 A, type2: 32/63 A
emobility.delta-emea.com
Designwerk Products AG
Mobile DC fast charger MDC22-450
– 20.8 kW 3 CCS type2, CCS type1, GB/T, Chademo
At CEE16 und CEE32 sockets or type-2-charger (output: 60 A, 270-450 V), also as wall box
www.designwerk.com
Mobile DC fast charger MDC22-500
– 21 kW 3 CCS type2, CCS type1, GB/T (soon), Chademo
At CEE16 und CEE32 sockets or type-2-charger (output: 60 A, 250-500 V), also as wall box
www.designwerk.com
Mobile DC fast charger MDC44-450
– 41.5 kW 3 CCS type2, CCS type1, GB/T, Chademo
At CEE16 und CEE32 sockets or type-2-charger (output: 120 A, 270-450 V)
www.designwerk.com
Mobile DC fast charger MDC44-920
– 42 kW 3 CCS type2, CCS type1, GB/T (soon), Chademo
At CEE16, CEE32 and CEE63 sockets or type-2-charger (output: 120 A, 500-1,000V), also as wall box
www.designwerk.com
Mobile DC fast charger MDC88-450
– 83 kW 3 CCS type2, CCS type1, GB/T, Chademo
At CEE16 and CEE32 sockets or type-2-charger (output: 240 A, 270-450 V)
www.designwerk.com

45 Smart Charging Strategies and Technologies for Electric Vehicles Simulation-based study to evaluate the effects of E-mobility smart charging strategies
Company Product AC Power DC Power Phases Sockets | Plugs RemarksData Sheet | Information
DiniTech GmbHCharging cable NRGkick
22 kW – 3 – 400 VAC, 6-32 A www.nrgkick.com
E3/DC GmbHWall box easy connect
22 kW – 3 type2 Charging currents 16/32A, 230/400 Volt AC
www.e3dc.com
eeMobility GmbHeeBox – – – – Charge at the company
locationwww.ee-mobility.com
EGSCharging meter box – – – – Mobile testing device for
calibrating E charging stations
www.egs-metering.com
eLoaded GmbH
DC Cube – up to 420 kW – CCS, Chademo Liquid cooling, up to 4 EVs www.eloaded.eu
DC Wall – up to 140 kW – CCS, Chademo Liquid cooling, up to 4 EVs www.eloaded.eu
SupraCharger – up to 420 kW – CCS, Chademo Liquid cooling, up to 4 EVs www.eloaded.eu
Enercon GmbHFast charging system E-600
– 50-350 kW 3 CCS-Combo2, Chademo
400 VAC, up to 600 kW grid power connection
www.enercon.de
ENTRATEK GmbH
Power Arrow: AC charging station
2 x 22 kW – 3 2xtype2 – www.entratek.de
Power Bay: DC charging station
– 60, 120, 180 kW
– CCS, Chademo Modular and compact design
www.entratek.de
Power Capsule: DC wall box
– 30 kW, 60 kW – CCS/Chademo Wall or stand mounting possible, concept for DC destination charging
www.entratek.de
EVBoxWall box Elvi 3.7, 7.4,
11, 22 kW
– 3 type1, type2 – www.evbox.de
FastnedNew generation of fast charging stations
– 350 KW 3 AC, CCS, Chademo
– www.fastned.nl
Galaxy Energy GmbH
Charging station Slim/Ideal, wall box: Power
– – – Schuko, type2 – www.galaxy-energy.com
Greenpack mobile energy solutions GmbH
Swobbee – – – – Battery changing system for small electric vehicles and gardening tools
www.swobbee.de
Hager Group
Witty home 22 kW – 1, 3 type2, optional: Schuko
16/32A, optional RFID www.hager.de
Witty park 3.7-22 kW – 1, 3 2xtype2, 2xSchuko
16/32A, RFID www.hager.de
Heidelberger Druckmaschinen AG
Heidelberg Wallbox Energy Control
3.7-11 kW – 1, 2, 3 type2 cable 5 m cable, integrated load management, metal casing
wallbox.heidelberg.com
Heidelberg Wallbox Home Eco
3.7-11 kW – 1, 2, 3 type2 cable 3,5/5/7,5 m cable, metal casing
wallbox.heidelberg.com
HUBER+SUHNER AG
RADOX HPC200 – charging cable system for DC fast charging
– 80 to 200 kW – CCS2 Charging cable system for 1,000 V/200 A continuous charging with signal wires for DC metering
www.hubersuhner.com
RADOX HPC500 – charging cable system for DC high power charging
– 500 kW – CCS1, CCS2 Liquid-cooled charging cable system for 1,000 V/500 A continuous charging with signal wires for DC metering
www.hubersuhner.com

Smart Charging Strategies and Technologies for Electric Vehicles Simulation-based study to evaluate the effects of E-mobility smart charging strategies46
Company Product AC Power DC Power PhasesSockets | Plugs
RemarksData Sheet | Information
Ingeteam Power Technology, S.A.
Dynamic Load Management 2.0
2.3-22 kW
up to 400 kW amps per amp
1, 3 type1, type2, Chademo, CCS
Supplied as standard in the FUSION and RAPID models.
www.ingeteam.com
(DLM 2.0) for INGEREV FUSION
and RAPID
INGEREV FUSION STREET AND
2.3-22 kW
– 1, 3 Schuko, type1, type2
Maximum input current 64 A (32 A + 32 A)
www.ingeteam.com
FUSION WALL
INGEREV RAPID 50 ( Duo, Trio)
43.5 kW (Trio)
50 kW 3 type2, Chademo, CCS
1-3 EVs, Ethernet, WLAN, 3G, 50-500 VDC/125 A
www.ingeteam.com
INGEREV RAPID ST 200 & ST 400
– up to 200 kW &400 kW
3 Chademo, CCS
Charge current: 400A/500V or 200A/1000V for ST200 kW & 400A/1000V or 500A/500V * limited by the available CCS connectors
www.ingeteam.com
innogy eMobility Solutions GmbH
Charging station eStation BTC High Power Charger 200
– 150/350 kW
– CCS-2, Chademo
2 EVs: 150 kW each or 1 EV: 350 kW, power sharing if 2nd EV is connected (50 kW increments)
www.innogy-emobility.com
Charging station eStation smart/ smart RFID
2x22 kW – 3 type2 2 EV, smart phone App, RFID
www.innogy-emobility.com
Wall box eBox professional
3.7-22 kW
– 3 type2 Smart phone app, RFID, plug&charge, LAN, WiFi, bluetooth and mobile data network connectivity, innogy eOperate can be activated
www.innogy-emobility.com
Wall box eBox smart 3.7-22 kW
– 3 type2 smart phone app, WiFi, bluetooth, RFID
www.innogy-emobility.com
Wall box eBox touch 3.7-22 kW
– 3 type2 Smart phone app, RFID, plug&charge, LAN, WiFi, bluetooth and mobile data network connectivity, 5’’ touch screen, innogy eOperate can be activated
www.innogy-emobility.com
INTIS GmbH
INTIS WPT: commercial lorrys
– 20, 40 kW
3 induktiv, optional: Typ2, CCS, Chademo
48 V, 80 V or HV, up to 400 A charging
www.intis.de
INTIS WPT: inductive charging
– 11-50 kW
3 induktiv, optional: Typ2, CCS, Chademo
Multiple 50 kW modules for bigger trucks
www.intis.de
INTIS WPT: small power – 80-1,000 W
1, 3 induktiv For e-bikes, scooter, rollers, robots
www.intis.de

47 Smart Charging Strategies and Technologies for Electric Vehicles Simulation-based study to evaluate the effects of E-mobility smart charging strategies
Company Product AC Power DC Power PhasesSockets | Plugs
RemarksData Sheet | Information
Juice Technology AG
Accelerator PHASER 5.8 kW – 1 type1, type2
1-phase charging accelerator in combination with Booster 2, input (3-ph) 14.5 A, output (1-ph)
www.juice-technology.com
25 A, IEC 62752, 62196, 61851, EMC, RoHS, IP65
Charging station TOWER 2
11-22 kW
– 3 type2 All common billeting systems, NFC, RFID, optional 2 sockets, calibrated meter, Smart-Juice-Module
www.juice-technology.com
for load management, FI A-EV, IP54, IEC 62196, 61851-1, CE, EMC, RoHS
Charging station ULTRA – 75-300 kW
3 CCS2, CCS1,
RFID, NFC, credit cards, IP 54, EN61851-23, DIN 70121, ISO 15118, RFID system: ISO/
www.juice-technology.com
type2 socket, Chademo
IEC 14443A/B, ISO/IEC 15639, GSM/CDMA, T-Ethernet
Mobile station BOOSTER 2, Pro
1.4-22 kW
– 1, 3 type1, type2
Up to 32 A each phase, adapter set and mode 3, Pro version: adapter EV, IEC 62752,
www.juice-technology.com
62196, 61851, mode 2/3, EMC, RoHS, IP67, RCD DC 6 mA, AC/DC 30 mA
Mobile station DIRECTOR 2
– 22 kW 3 CCS 2, type2 socket, Chademo
IP 54, EN 61851-23, DIN 70121, ISO 15118, Combo 2, Chademo 0.9.1, Ethernet, GSM/ GPRS/UMTS or powerline
www.juice-technology.com
Wall box CHARGER 2 1.4-22 kW
– 1, 3 type1, type2
Calibrated meter, Smart-Juice-Module for load management, all common billeting systems (incl.
www.juice-technology.com
credit cards), IEC 62752, 62196, 61851 - mode 3, EMC, RoHS, IP65, RCD DC 6 mA, AC 30 mA

Smart Charging Strategies and Technologies for Electric Vehicles Simulation-based study to evaluate the effects of E-mobility smart charging strategies48
Company Product AC PowerDC Power
Phases Sockets | Plugs RemarksData Sheet | Information
KEBA AGKEBA KeContact P30 wall box
3.7-22 kW – 1, 3 type1, type2 MID-certified, Ethernet, RFID, WLAN, USB, OCPP
www.keba.com
Kreisel Electric GmbH & Co. KG
CHIMERO HPC&EES 22 kW 150 kW 3 type2, CCS – www.kreiselelectric.com
LappKabel U.I. Lapp GmbH
Charging plug Design and Heavy Duty (BMW)
7.4-22 kW – 3 – Fast charging cable Helix 20/32 A
www.lappkabel.de
MAHLE GmbH Corporate Startup chargeBIG
Scalable charging system 2.3-7.2 kW, 22 kW
– 1, 3 type2 Max. 36 charging points per system, one charging point up to 32 A single phase/ three phase, IP55, charging pillar and/or wall mount
www.chargebig.com
MENNEKES Elektro- technik GmbH & Co. KG (Distributor: Parkstrom)
Wall box Amtron, charging station Amedio, charging gear PowerTOPXtra
3.7, 11 or 22 kW
– 3 type1, type2 With charging App, software backend, conform with German Eichrecht
www.chargeupyourday.de
neoom group GmbH
BOOGIE 2 x 22 kW – 3 type2 – www.neoom.com
BOXX 22 kW – 3 type2 – www.neoom.com
WHIZZY 11 kW – 3 type2 – www.neoom.com
Nidec ASI s.p.a.Ultra Fast Charger – 160 kW – CCS, Chademo Grid power: only 50 kW www.nidec-
industrial.com
Phoenix Contact E-Mobility GmbH
Charging cables, charging sockets and charging controllers
up to 22 kW up to 500 kW
1, 3 type1,type2,CCS type1/type 2 and GB/TAC/DC
Scalable components for each application, adapted to performance and functionality
www.phoenixcontact.net
PION Technology AG
Charging station advancedPION
11, 22 kW – 3 type2 OCPP 1.6 or PION backend
www.pion-ag.com
Charging station publicPION
11, 22 kW – 3 type2 OCPP 1.6 www.pion-ag.com
Charging station purePION 11, 22 kW – 3 type2 No backend www.pion-ag.com
Charging station smartPION 11, 22 kW – 3 type2 OCPP 1.6 or PION backend
www.pion-ag.com
Wall box WAVEadvanced 11, 22 kW – 3 type2 OCPP 1.6 or PION backend
www.pion-ag.com
Wall box WAVEpure 3.7, 11, 22 kW – 3 type2 No backend www.pion-ag.com
PLUG’n CHARGE GmbH
Car park system Premium (3 charging points)
3.7, 11, 22 kW – 3 Typ2 400 VAC, RFID, Smart Meter, RS485
www.plugncharge.de
Charging station Basic Plus
3.7, 11, 22 kW – 3 Typ2 400 VAC, RFID, Smart Meter, RS485
www.plugncharge.de
Charging station Premium 3.7, 11, 22 kW – 3 Typ2 400 VAC, RFID, Smart Meter, RS485
www.plugncharge.de
E-Polly Basic Plus 3.7, 11, 22 kW – 3 Typ2 400 VAC, RFID, Smart Meter, RS485
www.plugncharge.de
E-Polly Premium 3.7, 11, 22 kW – 3 Typ2 400 VAC, RFID, Smart Meter, RS485
www.plugncharge.de
Ecar park system Basic Plus (3 charging points)
3.7, 11, 22 kW – 3 Typ2 400 VAC, RFID, Smart Meter, RS485
www.plugncharge.de
Wall box Basic Plus (cable or socket)
3.7, 11, 22 kW – 3 Typ2 400 VAC, RFID, Smart Meter, RS485
www.plugncharge.de
Wall box Premium Kabel 3.7, 11, 22 kW – 3 Typ2 400 VAC, RFID, Smart Meter, RS485
www.plugncharge.de

49 Smart Charging Strategies and Technologies for Electric Vehicles Simulation-based study to evaluate the effects of E-mobility smart charging strategies
Company Product AC PowerDC Power
PhasesSockets | Plugs
RemarksData Sheet | Information
PLUG’n CHARGE GmbH
Wall box Single Premium
3.7, 11, 22 kW – 3 Typ2 400 VAC, RFID, Smart Meter, RS485
www.plugncharge.de
Wall box Twin Premium
3.7, 11 kW – 3 Typ2 400 VAC, RFID, Smart Meter, RS485
www.plugncharge.de
Schneider Electric GmbH
EVlink DC wall box 22 kW up to 24 kW
3 CCS, Chademo, type2
CCS only or CCS + Chademo or CCS + Chademo + type2
www.schneider-electric.de
EVlink parking lot 2 22 kW – 3 2 x type2 or type2 + TE
Optional with Schuko socket instead of type2
www.schneider-electric.de
EVlink parking lot 3 22 kW – 3 2 x type2 Optional compliant with legal requirements (parking lot 3)
www.schneider-electric.de
EVlink wall box G3 3.7, 11, 22 kW – 1, 3 1 x type2 (optional cable with type1)
16/32A, optional with fixed cable 4.5 m
www.schneider-electric.de
EVlink wall box G4 3.7, 11, 22 kW – 1, 3 1 x type2 (optional cable with type1)
16/32A, optional with fixed cable 4.5 m
www.schneider-electric.de
Sedlbauer AG
E-Tower up to 2x22 kW – 3 Typ2 1 or 2 EVs www.sedlbauer.de
Juice Booster 2 (distributor)
22 kW – 3 EV: type2, grid: several adapters
– www.sedlbauer.de
SlimBox 3.7, 11, 22 kW – 3 type2 – www.sedlbauer.de
SlimBox E 3.7, 11, 22 kW – 3 type2, Schuko
Type2 or Schuko charging at same time
www.sedlbauer.de
Siemens AGWall box VersiCharge 4.6, 7.2, 22 kW – 1, 3 type1, type2 DC-FI integrated, IP56,
RFID readernew.siemens.com
SMA Solar Technology AG
EV Charger 7.4/22 1.3-7.4/22 kW – 1, 3 type2 With Sunny Home Manager and SMA Energy App
www.sma.de
SolarEdge Technologies GmbH
Solar inverter with integrated wall box
7.6, 9.6 kW – 1 – 32 A/40 A, with solar inverter HD wave
www.solaredge.com
sonnen GmbHsonnenCharger 22 kW – 1, 3 type2 With sonnenCommunity
or sonnenFlat onlywww.sonnen.de
SSL Energie GmbH
Pay-Charge 3.7-22 kW – 1, 3 type2 16/32A, socket wirh LED
www.ssl-energie.de
SP-Charge max. 22 kW – 1, 3 type2 Configurable current: 10A, 13A, 16A, 20A, 25A, 32A, 5 m cable with plug type2
www.ssl-energie.de
Stäubli Electrical Connectors GmbH
Automatic Rapid Charging Solution QCC
– up to 1,200 kW
3 customized Automatic charging of EVs (AGV, busses, trucks, boats etc.)
ec.staubli.com
StreetPlug B.V.
Charging station beyond street level
3.6 kW, 11 kW, 22 kW
– 1, 3 type2, Schuko
Load managemenr, charging via app, charging card or remote control
www.streetplug.nl
Tesla Motors Netherlands BV
Supercharger 145 kW – – own standard
480 VDC www.tesla.com

Smart Charging Strategies and Technologies for Electric Vehicles Simulation-based study to evaluate the effects of E-mobility smart charging strategies50
CompanyProduct AC Power DC
PowerPhases Sockets |
PlugsRemarks Data Sheet |
Information
ubitricity Gesell- schaft für verteilte Energiesysteme mbH
SimpleSocket Chelsea
3.7-4.6 kW – 1 type2 Polycarbonate, IP55 www.ubitricity.com
SimpleSocket P11 11 kW – 3 type2 Single or dual bollard with ram protection, integrated DC residual current device, load management capable
www.ubitricity.com
SimpleSocket W11
11 kW – 3 type2 Wall mounting inside and outside, Integrated DC residual current circuit breaker, load management capable
www.ubitricity.com
SmartCable 20A, single phase
4.6 kW – 1 type1, type2 Automatic authentification, charging cable with mobile metering function
www.ubitricity.com
SmartCable 20A, triple phase
13.8 kW – 3 type2 Automatic authentification, charging cable with mobile metering function
www.ubitricity.com
wallbe GmbH
Pro charger 3.7-22 kW – 1, 3 type2 or Schuko socket, optional: type1/type2 cable
230 VAC (16 A), 400 VAC (32 A)
www.wallbe.de
Wallbox Chargers SL
Commander 2 7.4 kW, 22 kW
– 1, 3 type1, type2 Connectivity: Wi-Fi/Ethernet/Bluetooth/3G/4G, RFID/App/PIN-Code identification, modular current from 6 A to 32 A
www.wallbox.com
Copper SB 7.4 kW, 11 kW, 22 kW
– 1, 3 type1, type2 Connectivity: Wi-Fi/Ethernet/Bluetooth/3G/4G, RFID and app identification
www.wallbox.com
Pulsar Plus 7.4 kW, 11 kW, 22 kW
– 1, 3 type1, type2 Connectivity: Wi-Fi/Bluetooth, App identification, modular current from 6 A to 32 A
www.wallbox.com
Quasar – 7.4 kW – CCS, Chademo
Bidirectional charger, modular current from 6 A to 16 A, connectivity: Wi-Fi/Ethernet/Bluetooth/3G/4G, RFID or app identification
www.wallbox.com

51 Smart Charging Strategies and Technologies for Electric Vehicles Simulation-based study to evaluate the effects of E-mobility smart charging strategies
CompanyProduct AC Power DC
PowerPhases Sockets |
PlugsRemarks Data Sheet |
Information
Walther-Werke Ferdinand Walther GmbH
ECOLECTRA 250 up to 22 kW – 3 type2 System capability, load management, one or two charging points, master/slave system solution, OCPP 1.6
www.walther-werke.de
ECOLECTRA 600 up to 22 kW – 3 type2 Standalone solution, optional One Touch-Display, OCPP 1.6
www.walther-werke.de
EVOLUTION 350 up to 22 kW – 3 type2 System capability, load management, master/slave system solution, OCPP 1.6
www.walther-werke.de
Wall box basicEVO
up to 11 kW – 1, 3 type2 Charging cable 5 m, Plug’n Charge
www.walther-werke.de
Wall box systemEvo
up to 22 kW – 1, 3 type2 One or two charging points, master/slave system solution, OCPP 1.6
www.walther-werke.de
Wall box varioEVO up to 11 kW – 1, 3 type2 Charging cable 5 m, Plug’n Charge, load management
www.walther-werke.de
Webasto Thermo & Comfort SE
Webasto Live 3.7-22 kW – 1, 3 type2 16/32A, 4,5 m & 7 m cable, ISO 15118 (PnC), OCPP 1.6, RFID-DESFire, EEBus, 4G embbedded Sim (eSim)
www.webasto-charging.com
Webasto Pure 3.7-22 kW – 1, 3 type2 16/32A, 4,5 m cable www.webasto-charging.com
Wirelane GmbH
Double pole 3.7-22 kW – 1, 3 type2 Eichrecht or MID certified, ISO 15118 ready, FI-Typ A, FI-Typ B per measuring current transformer
www.wirelane.com
Pillar or wall mounted
3.7-22 kW – 1, 3 type2 Eichrecht or MID certified, ISO 15118 ready, FI-Typ A, FI-Typ B per measuring current transformer
www.wirelane.com
Single pole 3.7-22 kW – 1, 3 type2 Eichrecht or MID certified, ISO 15118 ready, FI-Typ A, FI-Typ B per measuring current transformer
www.wirelane.com

Smart Charging Strategies and Technologies for Electric Vehicles Simulation-based study to evaluate the effects of E-mobility smart charging strategies52
Table 5: Examples of commercially available onboard chargers
Company Name Charging Power Type
Bosch Charger-converter7.2 kW (1-ph, 2-ph)11 kW (3-ph)
Charger with integrated Low-Voltage Battery DC/DC Converter
Brusa ON-Board Charger NLG664 22 kW (3-ph) Bidirectional, 400V battery
Brusa ON-Board Charger NLG667 22 kW (3-ph) Bidirectional, 800V battery
Innolectric On-Board Charger 22 kW (3-ph) DC charging included
Xepics XP Power+ 22 kW (3-ph) Galvanically isolated
3.10 Smart Chargers in India and its capabilities In India, smart charging is yet to be fully implemented because of the early transition stage and lower EV penetration percentage. However, to take care of the future requirements of EV charging, chargers are already smart enough to allow smart charging with power modulation. There are many smart chargers available from different manufacturers in India, as mentioned in Table 6. These smart chargers are identified based on the presence of a control pilot pin in the connector. India has adopted various connectors for AC and DC power transfer for EV charging. IEC 60309 is the AC connector with three pins without a control pin and hence, cannot perform smart charging using real dynamic power modulation. So, the charger with an IEC 60309 connector is not capable of executing smart charging. The IEC 62196 or Type 2 or Mennekes connector is also allowed per Indian charging standards, and it can perform smart charging. CHAdeMO, CCS, and GB/T are the DC connectors capable of executing smart charging. Table 5 presents the summary of connectors regarding the capability to perform smart charging.
Table 6: Capabilities of various connectors
Connector type Name of connector Capability to perform smart charging
ACIEC 60309 ❌
IEC 62196/type 2/Mennekes ✅
DC
CHAdeMO ✅
CCS ✅
GB/T 20234 ✅
❌: Dumb connector, ✅: Smart connector
These smart chargers can follow and implement dynamic variations in delivering power to the vehicle. It can vary the supply power to the EV by generating modulating power commands from the aggregator. This power modulation for smart charging is carried to maintain generation-demand balance in the system at every point in time. Smart charger facilitates the basic requirement of communication connectivity in a controlled charging scheme. Communication is established between smart chargers and other entities in the EV ecosystem by using different standards and protocols. The compatibility of chargers to OCPP and OSCP allows smart charging communication.
Chargers available in India are required to comply with the Ministry of Power (MoP) guidelines. To compliment the regulation, policies are providing incentives in purchasing EVs and chargers thus reducing the capital cost of the charger, as mentioned in Table 6. From the aspects of communication connectivity, all the smart chargers available in the market complies OCPP
India has adopted various connectors for AC and DC power transfer for EV charging

53 Smart Charging Strategies and Technologies for Electric Vehicles Simulation-based study to evaluate the effects of E-mobility smart charging strategies
1.5 and higher version, which will help in smarter communication and controlled charging in the near future. Chargers available in the market follow either Bharat AC001, DC001, or other charger protocols, such as CCS and CHAdeMO. In addition to this, the market has sufficient availability of types of connectors approved by the Ministry of Power in Charging Infrastructure Regulation.
By focusing on the availability of smart chargers, the Indian market has seen rising growth in the adoption of smart chargers compared to dumb chargers. In support of smart chargers, various smart applications like cloud-connected charging networks and mobile applications are also growing in the Indian EV ecosystem.
3.10.1 EV CHARGERS, TECHNICAL SPECIFICATIONS, AND MANUFACTURERS IN INDIAN MARKET
Table 6 provides the technical specifications and cost of dumb and smart chargers available in India. The table also includes information on charging station manufacturers and respective EV categories supported by the particular charger.
In India, smart charging is yet to be implemented with full capacity because of the early transition stage and lower EV penetration percentage.

Smart Charging Strategies and Technologies for Electric Vehicles Simulation-based study to evaluate the effects of E-mobility smart charging strategies54
Sr.
NoCh
arge
r M
anuf
actu
rer
Char
ger N
ame
Char
ger T
ype
Inpu
t Rat
ing
Outp
ut R
atin
gCo
nnec
tor
Type
s
No. o
f ch
argi
ng
gun
Com
mun
icat
ion
Effic
ienc
yCh
argi
ng
Type
1De
lta
India
“AC
Char
ger
Slim
II”
AC c
harg
er20
0-24
0V
Sing
le P
hase
Max
30A
200-
240V
Singl
e ph
ase
Max
30A
ICE6
2195
-2 Typ
e 1
Type
2
GB/T
: Sub
ject to
the
region
or co
untry
stan
dard
--
-Mod
e 1
2,3,4W
AC M
ini pl
usAC
cha
rger
200-
240V
Sing
le P
hase
Max
30A
200-
240V
Singl
e ph
ase
Max
30A
7.4k
W m
ax
1.IC
E621
96-2
Typ
e 1,
Type
2, G
B/T”
2.IC
E 62
196-
2, Typ
e 2
Sock
et
-3G
Wi-Fi for
rem
ote
acce
ss95
%Mod
e 1
89,200
/-2,3,4W
AC M
axAC
cha
rger
-EV
AAU 1
1.5-
19.2kW
EV
AAE
7.4,11
,22k
W
EVAA
G 7.4,11
,22k
W
1.SA
E SJ
1772
2.IC
E621
96-2
Typ
e 1, Typ
e 2, G
B/T”&
ICE6
2196
-2, T
ype
2 So
cket
&. ICE
6219
6-2,
Type
2 S
ocke
t with
sh
utte
r 3.GB
/T20
234-
1/2
-1.RF
ID a
nd ISO
151
18
auth
entic
ation
for us
er
man
agem
ent
2.et
hern
et, B
luet
ooth
LA
N C
ellu
lar
3.OC
PP c
ompl
ianc
e en
ables
back
end
sy
stem
int
egra
tion
up
grad
able to
OCPP
2.0
-Mod
e 2
Mod
e 3
1.30
Lakh
s/-
4W
DC (15
0DC
Ultra
-Fas
t EV
Ch
arge
r
CCS
+ CH
adem
o +
AC-
1.15
0 kW
DC
char
ging
ca
pacity in
tota
l, CC
S up
to
100
kW, C
HAd
eMO
up to
63
kW
2. 4
3 kW
cha
rging
point with
-T
ype
2 pl
ug, 2
2 kW
cha
rging
point with
Typ
e 2
sock
et.
CCS, C
HAd
eMO
and
Type
2
plug
1.2
DC
char
ging
po
ints
2.2
AC
char
ging
po
ints
Com
mun
icat
ion:
-Net
wor
k Co
nnec
tivity
: Et
hern
et,3G, G
PRS
-Pro
toco
l: OC
PP1.6
94%
Mod
e 4
1.50
Lak
h/-
4Whe
eler
, Bu
s
DC Q
uick
EV
char
ger
CCS+
CHad
emo
-15
0kW
-2
DC
Char
ging
po
int
Ethe
rnet
,3G, G
PRS
Prot
ocol
: OCP
P1.6
RFID
car
d re
ader
for
us
er a
uthe
nticat
ion
94%
Mod
e 4
19.55
Lakh
/-4-
W
heeler
, Bu
s
DC E
V Ch
arge
r GB
/TDC
-
120k
W-
-OC
PP/D
elta
Pro
prieta
ry
3G/4
G, W
i-Fi (Op
tiona
l)94
%Mod
e 4
--
DC W
all bo
x EV
ch
arge
r(C
CS a
nd
CHAd
eMO
com
plianc
e)
1.24
0-27
0vAC
, 50
Hz,
Sing
le
phas
e 2.48
0vAC
, 50
Hz,
Thre
e-ph
ase
3.20
8vAC
, th
ree
phas
e
1.DC
O/P
25k
W,200
-500
vDC,
65A
Max
2.50
-500
,60A
Max
, 25k
W
1.SA
E SJ
1772
2.CH
AdeM
O2
3G/4
G, E
ther
net
(Opt
iona
l)94
%Mod
e 4
1.26
Lakh
s/-
9.25
Lakh
s/-
for 25
kW
-
BHAR
AT D
C 00
1DC
Cha
rger
3 Ph
ase, 4
15
Vac, (37
3 ~
440
Vac)
15kW
,200
A M
axGB
/T 2
0234
.32
Char
ger &
Vehicle: C
AN
Com
mun
icat
ion
Char
ger &
CMS:
Prot
ocol
: OCP
P 1.6
(Ope
n Ch
arge
Point
Pr
otoc
ol) In
terfac
e Net
wor
k Co
nnec
tivity
: Et
hern
et, 2
G/3G
/4G, W
i-Fi (Op
tiona
l)
94%
Mod
e 4
2 La
kh/-
(1
5kW
) 4.50
Lak
h/-
(30k
W)
4- W
heeler
Tabl
e 7:
Tec
hnic
al s
peci
ficat
ions
and
cos
t of
com
mer
cial
ly a
vaila
ble
EV c
harg
ers
in In
dia

55 Smart Charging Strategies and Technologies for Electric Vehicles Simulation-based study to evaluate the effects of E-mobility smart charging strategies
Sr.
NoCh
arge
r M
anuf
actu
rer
Char
ger N
ame
Char
ger T
ype
Inpu
t Rat
ing
Outp
ut R
atin
gCo
nnec
tor
Type
s
No. o
f ch
argi
ng
gun
Com
mun
icat
ion
Effic
ienc
yCh
argi
ng
Type
DC C
harg
er c
ityDC
Cha
rger
-1.DC
50k
W, 2
.AC
22kW
, 50
-100
0vdc
, 125
A Max
,50-
1000
vdc, 1
25A
Max
, AC
22kW
,400
VAC
.32A
2.50
kW,50-
1000
vdc, 1
25A
Max
, 50-
1000
vdc, 1
25A
Max
3.DC
100
kW, 5
0-10
00vd
c,
125A
Max
,50-
1000
vdc, 2
00A
Max
,AC
22kW
,400
VAC
.32A
4.10
0kW
,50-
1000
vdc, 1
25A
Max
, 50-
1000
vdc, 2
00A
Max
1.CC
S .CHAd
eMO, IEC
62
196-
2.. T
ype
2 So
cket
2. C
CS 1
. CHAd
eMO
3.CC
S 2. C
HAd
eMO, IEC
62
196-
2.
3.Ty
pe 2
Soc
ket
4.CC
S 1. C
HAd
eMO
-RF
ID, c
redit ca
rd
and
ISO
1511
8 us
er
iden
tifica
tion
OCPP
and
net
wor
k co
nnec
tivity
ena
bles
sy
stem
int
egra
tion
>94%
Mod
e 3
Mod
e 4
-4-
W
heeler
, Bu
s
2Br
ight
blu
Bright
blu
Char
ger
AC C
harg
er22
0V@
32A,
50
Hz/
60Hz
7.2k
WTY
PE 2
-RF
ID, M
obile
app
licat
ion,
RFID
car
d type
144
4-
Mod
e 3
40,000
-1,00
000/
-2,3,4-
W
heeler
3Ae
idth
Te
chno
logies
E-URJ
ABh
arat
AC 0
013
Phas
e,
415
Vac
(374
~440
Vac)
230V
ac, 5
0Hz,
3.3K
W M
ax. p
er
Outp
utIE
C 60
309, (3
PIN
Fem
ale
Conn
ecto
r)3-
Port
Prot
ocol
: OCP
P Int
erfa
ce: E
ther
net
(2G
/3G/
4G o
ptiona
l)
--
--
IEC
6219
6AC
TYP
E-2
char
ger
-Up
to 4
0 kW
Max
Pow
er.
Releas
ing
soon
as
per th
e web
site
--
DCCC
S CO
MBO
2
TYPE
-10
kW-7
5kW
and
abo
ve-
-
TYPE
-DC
DC c
harg
er
CHAD
EMO
-10
kW-7
5kW
and
abo
ve.
--
4AB
B In
dia
Terra
AC w
all
box
AC Typ
e 1
Ty
pe 2
cha
rger
-Sing
le-p
hase
up
to
7.4k
W/3
2A
3Pha
sse
up to
22kW
/32A
UL
ratin
gs u
p to
7.7 k
W /
32
A
Type
2 s
ocke
t with
or
with
out sh
utte
r Ty
pe 1
or type
2 c
able.
The
cabl
e ca
n be
wra
pped
aro
und
the
char
ger
1out
put
1. O
CPP
1.6
2.RS
485/
P1 for
co
nnec
tion
to
ener
gy m
eter
3. W
i-Fi, E
ther
net
(RJ4
5), B
luet
ooth
, RS
485, 4
G / 3G
4. U
ser au
then
ticat
ion
thro
ugh
ABB
RFID
car
d (1
inc
lude
d) o
r ap
p
-Mod
e 2
1.30
Lak
h/-
2,3,4
Whe
eler

Smart Charging Strategies and Technologies for Electric Vehicles Simulation-based study to evaluate the effects of E-mobility smart charging strategies56
Sr.
NoCh
arge
r M
anuf
actu
rer
Char
ger N
ame
Char
ger T
ype
Inpu
t Rat
ing
Outp
ut R
atin
gCo
nnec
tor
Type
s
No. o
f ch
argi
ng
gun
Com
mun
icat
ion
Effic
ienc
yCh
argi
ng
Type
Terra
DC W
all
box
1.DC
Wallb
ox
24 k
W
IEC
vers
ion
2.DC
Wallb
ox
24 k
W
UL
vers
ion
1-ph
ase
3.DC
Wallb
ox
24 k
W
UL
vers
ion
3-ph
ase
DC c
harg
er 1
. Ty
pe 4
: CCS
2,
CHAd
eMO
2. Typ
e 4: C
CS
1, C
HAd
eMO
4. Typ
e 4: C
CS
1, C
HAd
eMO
Inpu
t Vo
ltag
e:
1. 3
-pha
se
400
V AC
+/-
10
%
2. 2
08 …
240
V
AC two-
wire
+/
- 10
%
3. 3
pha
se
480
V AC
+/-
10
%
Inpu
t Cu
rren
t: 1. 3
-pha
se,
40 A
2. 1
00 A
3. 3
pha
se,
40 A
1. 0
… 2
2.5
kW, 2
4 kW
(pe
ak)
2. 1
9.5
kW -
208
V, 2
2.5
kW
- 24
0 V
3. 0
… 2
2.5
kW, 2
4 kW
(pe
ak)
-1. S
tand
ard:
sing
le
outp
ut
CCS2
Op
tiona
l: du
al o
utpu
t CH
AdeM
O +
CCS
2 2. S
tand
ard:
sing
le
outp
ut
CCS1
O pt
iona
l: du
al o
utpu
t CH
AdeM
O +
CCS
1 3. S
tand
ard:
sing
le
outp
ut
CCS1
O pt
iona
l: du
al o
utpu
t CH
AdeM
O +
CCS
1
Com
mun
icat
ion
prot
ocol
: 1. O
CPP
1.5
/ 1.6
/ 2.0
2. O
CPP
1.5
/ 1.6
/ 2.0
3. O
CPP
1.5
/ 1.6
/ 2.0
Use
r Au
then
ticat
ion:
1. R
FID
(ISO
144
43 A
+
B to
par
t 4
and
ISO/
IEC
1569
3 Mifa
re, N
FC,
Calyps
o, U
ltra
light
, Pa
yPas
s, H
ID; a
nd
mor
e).
2. O
n-sc
reen
PIN
cod
e au
then
ticat
ion
3.Pl
ug &
cha
rge
(ISO
15
118)
95%
Mod
e 4
1.25
Lakh
/ -
Terra
DC fas
t ch
arge
r Te
rra
54
Terra
94
Terra
124
Te
rra
184
-AC
Inp
ut
Voltag
e 48
0Y / 2
77
VAC
+/-
10%
(6
0 Hz)
1. 5
0 kW
con
tinuo
us
2. 9
0 kW
con
tinuo
us
3.12
0 kW
or 60
kW
x 2
co
ntinuo
us
4. 1
80 k
W o
r 90
kW
x 2
co
ntinuo
us1.
DC O
/P V
olta
ge:
Tera
a 54
: CCS
-1: 2
00 -
500
VD
C CH
AdeM
O: 5
0 -
500
VDC
HV
vers
ion: 2
00 -
920
VDC
Fo
r re
st 3
CC
S-1: 1
50 -
920
VDC
CH
AdeM
O: 1
50 -
500
VDC
DC
O/P
Cur
rent
:-
Terra
54 -
125A
Fo
r re
st 3
:-
CCS-
1: 2
00 A
; CHAd
eMO: 2
00
A (1
25 A
opt
iona
l)
--
Char
ging
pro
toco
ls
:CCS
1, C
CS2
and
CHAd
eMO
1.2
RFID
sys
tem
: ISO
/IEC
14
443A
/B, I
SO/IEC
15
393, F
eliCa™
1, N
FC
read
er m
ode, M
ifare
, Ca
lyps
o, (op
tion: L
egic)
Net
wor
k co
nnec
tion
GSM/3
G/4G
mod
em;
10/1
00 B
ase-
T Et
hern
et
Com
mun
icat
ion: O
CPP
1.6
Core
and
Sm
art
Char
ging
Pro
files
; Au
toch
arge
via O
CPP
95%
Mod
e 4
7500
0/-
for
5kW
2,3,4
W
5In
degr
een
Tech
nolo
gies
Pv
t.Ltd
DC
Char
ger
--
15kW
-3-
Pin
--
Mod
e 4
7500
0/-
for
5kW
4W
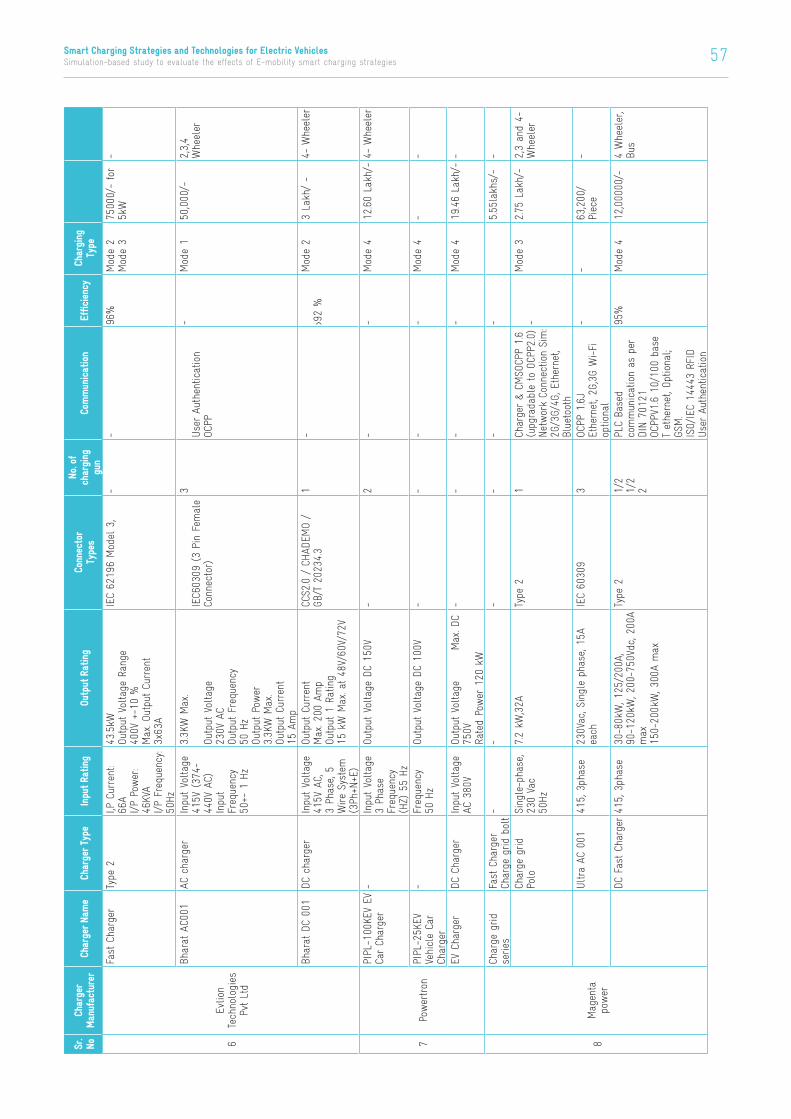
57 Smart Charging Strategies and Technologies for Electric Vehicles Simulation-based study to evaluate the effects of E-mobility smart charging strategies
Sr.
NoCh
arge
r M
anuf
actu
rer
Char
ger N
ame
Char
ger T
ype
Inpu
t Rat
ing
Outp
ut R
atin
gCo
nnec
tor
Type
s
No. o
f ch
argi
ng
gun
Com
mun
icat
ion
Effic
ienc
yCh
argi
ng
Type
6Ev
lion
Tech
nolo
gies
Pv
t Lt
d
Fast C
harg
erTy
pe 2
I,P C
urre
nt:
66A
I/P
Power
: 46
KVA
I/P
Freq
uenc
y:
50Hz
43.5kW
Ou
tput
Vol
tage
Ran
ge
400V
+-1
0 %
Max
. Out
put Cu
rren
t 3x
63A
IEC
6219
6 Mod
el 3
,-
-96
%Mod
e 2
Mod
e 3
7500
0/-
for
5kW
-
Bhar
at A
C001
AC c
harg
erIn
put Vo
ltag
e 41
5V (37
4-44
0V A
C)
Inpu
t Fr
eque
ncy
50+-
1 H
z
3.3K
W M
ax.
Outp
ut V
olta
ge
230V
AC
Outp
ut F
requ
ency
50
Hz
Outp
ut P
ower
3.3K
W M
ax.
Outp
ut C
urre
nt
15 A
mp
IEC6
0309
(3
Pin
Fem
ale
Conn
ecto
r)
3 Use
r Au
then
ticat
ion
OCPP
-Mod
e 1
50,000
/-2,3,4
Whe
eler
Bhar
at D
C 00
1DC
cha
rger
Inpu
t Vo
ltag
e 41
5V A
C,
3 Ph
ase, 5
W
ire S
yste
m
(3Ph
+N+E
)
Outp
ut C
urre
nt
Max
. 200
Am
p Ou
tput
1 R
ating
15 k
W M
ax. a
t 48
V/60
V/72
V
CCS2
.0 / C
HAD
EMO
/ GB
/T 2
0234
.31
->9
2 %
Mod
e 2
3 La
kh/ -
4- W
heeler
7Po
wer
tron
PIPL
-100
KEV
EV
Car Ch
arge
r-
Inpu
t Vo
ltag
e
3 Ph
ase
Freq
uenc
y (H
Z) 5
5 Hz
Outp
ut V
olta
ge D
C 15
0V-
2-
-Mod
e 4
12.60
Lakh
/-4-
Whe
eler
PIPL
-25K
EV
Vehicle
Car
Char
ger
-Fr
eque
ncy
50 H
zOu
tput
Vol
tage
DC
100V
--
--
Mod
e 4
--
EV C
harg
erDC
Cha
rger
Inpu
t Vo
ltag
e AC
380
VOu
tput
Vol
tage
Max
. DC
750V
Ra
ted
Power
120
kW
--
--
Mod
e 4
19.46
Lakh
/--
8Mag
enta
po
wer
Char
ge g
rid
serie
sFa
st C
harg
er
Char
ge g
rid b
olt-
--
--
-
5.55
lakh
s/-
-
Char
ge g
rid
Polo
Sing
le-p
hase
, 23
0 Va
c 50
Hz
7.2
kW,32A
Type
21
Char
ger &
CMSO
CPP
1.6
(upg
rada
ble
to O
CPP2
.0)
Net
wor
k Co
nnec
tion
Sim
: 2G
/3G/
4G, E
ther
net,
Blue
toot
h
-Mod
e 3
2.75
Lak
h/-
2,3
and
4-
Whe
eler
Ultra
AC
001
415, 3
phas
e23
0Vac
, Singl
e ph
ase, 1
5A
each
IEC
6030
93
OCPP
1.6J
Ethe
rnet
, 2G,3G
Wi-Fi
optio
nal
--
63,200
/ Piec
e-
DC F
ast Ch
arge
r41
5, 3
phas
e30
-80k
W, 1
25/2
00A,
90
-120
kW, 2
00-7
50Vd
c, 2
00A
max
15
0-20
0kW
, 300
A m
ax
Type
21/
2 1/
2 2
PLC
Base
d co
mm
unicat
ion
as p
er
DIN 7
0121
OC
PPV1
.6 1
0/10
0 ba
se
T et
hern
et, O
ptiona
l; GS
M.
ISO/
IEC
1444
3 RF
ID
Use
r Au
then
ticat
ion
95%
Mod
e 4
12,000
00/-
4 W
heeler
, Bu
s

Smart Charging Strategies and Technologies for Electric Vehicles Simulation-based study to evaluate the effects of E-mobility smart charging strategies58
Sr.
NoCh
arge
r M
anuf
actu
rer
Char
ger N
ame
Char
ger T
ype
Inpu
t Rat
ing
Outp
ut R
atin
gCo
nnec
tor
Type
s
No. o
f ch
argi
ng
gun
Com
mun
icat
ion
Effic
ienc
yCh
argi
ng
Type
9FO
RTUM
-DC
001
Cha
rger
-15
-20k
W-
--
-Mod
e 4
-2,3,4W
-DC
rap
id
char
ger
-50
kWCC
S/CH
AdeM
O-
--
Mod
e 4
-4-
W
10Ex
icom
Type
-2 A
C Ch
arge
r (C
ompa
ct)
AC Typ
e 2
char
ger
270V
ac3.3k
WIE
C621
96-2
, Typ
e 2
-OC
PP 1
.6J
com
plaint
IP
54 -
Des
igne
d fo
r indo
or o
r ou
tdoo
r ap
plicat
ions
-Mod
e 1
-Al
l Ty
pe 2
co
mpa
tible
ve
hicles
Type
-2 A
C Ch
arge
rAC
Typ
e 2
wallb
ox c
harg
er15
0-27
0Vac
3.3k
W, 7
.5kW
, 11k
W a
nd
22kW
IEC
6121
96-2
-Op
tiona
l RF
ID for
use
r au
then
ticat
ion
and
netw
ork
conn
ectiv
ity for
re
mot
e m
anag
emen
t, m
anag
ing
ener
gy c
osts
et
c.
OCPP
1.6J
com
plaint
IP
54 -
Des
igne
d fo
r indo
or o
r ou
tdoo
r ap
plicat
ions
-Mod
e 2
-Al
l Ty
pe 2
co
mpa
tible
ve
hicles
Mul
ti stan
dard
30
-200
kwCH
AdeM
O, C
CS
and
Type
2 A
C,34
0-52
0 Va
c1.22
kW
2.60
kW
3.60
kW
O/P
Voltag
e 1.34
0VAC
-520
VAC
2.20
0 -7
50 V
dc
3.20
0 –
750
Vdc
o/p
Curren
t 1.32
A
2.12
5A
3.12
5A
1.CH
AdeM
O 2
.CCS
T
3.Ty
pe 2
AC,
1.1x
AC
2.1x
DC
3.1x
DC
1.IS
O/IE
C 14
443A
RFI
D
base
d au
then
ticat
ion
2.10
/100
Bas
e-T
Ethe
rnet
, 4G/
3G m
odem
(o
ptiona
l)
--M
ode
3Mod
e 4
-Al
l type
s of
veh
icles
GB/T
30-
200k
wGB
/T w
ith
2023
4.3
com
plianc
e
-1.30
-80k
W
2.90
kW -
120
kW
3.15
0kW
- 2
00kW
O/
P Vo
ltag
e 20
0 –
750V
dc
O/P
Curren
t 1.25
A/20
0A
2.20
0A
3.20
0A
GB/T
with
202
34.3
com
plianc
e1.1
/ 2
DC
2.1
/ 2
DC
3.2
DC
1.IS
O/IE
C 14
443A
RFI
D
base
d au
then
ticat
ion
2.10
/100
Bas
e-T
Ethe
rnet
, 4G/
3G m
odem
(o
ptiona
l)
-Mod
e 4
-All t
ypes
of veh
icles,
from
en
try-lev
el
pass
enge
r ca
rs to
he
avy
commercial
vehicles
Quick
char
ger
-41
5Vac
6000
W a
bove
185
Vac
(6kW
sy
stem
) 90
00W
abo
ve 1
85Va
c (9
kW s
yste
m)
Outp
ut v
olta
ge, n
ominal
42
- 58
Vdc
Max
imum
out
put cu
rren
t 12
5A (6k
W s
yste
m) 18
7A
(9kW
sys
tem
)
SBS-
75X
Conn
ecto
r1
x DC
B/w E
VSE
& ve
hicle: C
AN b
ased
co
mm
unicat
ion
-Mod
e 4
-pa
ssen
ger
cars
, E-
ricks
haws,
E-Au
tos
Ultim
a 48
V/2k
W-
90 -
300
Vac
22A
(max
) 42
- 5
8Vdc
Plug
: SBS
-75X
3 pin
Indian
plu
gCA
N B
us~9
4%Mod
e 2
-E-
ric
ksha
ws,
E-au
tos
and
E-sc
oote
rs.

59 Smart Charging Strategies and Technologies for Electric Vehicles Simulation-based study to evaluate the effects of E-mobility smart charging strategies
Sr.
NoCh
arge
r M
anuf
actu
rer
Char
ger N
ame
Char
ger T
ype
Inpu
t Rat
ing
Outp
ut R
atin
gCo
nnec
tor
Type
s
No. o
f ch
argi
ng
gun
Com
mun
icat
ion
Effic
ienc
yCh
argi
ng
Type
Ultim
a 48
V/1.1k
W-
90 -
300
Vac
42 -
58V
dc
22A
(max
)Pl
ug: S
BS75
-X3
pin
Indian
plu
gCA
N B
usPe
ak 9
4%Mod
e2
-E-
ric
ksha
ws,
E-au
tos
and
E-sc
oote
rsBH
ARAT
EV
/15k
W/
20kW
GB/T
with
20
234.3
com
plianc
e
460V
ac15
kW (sing
le g
un) / 20
kW
(dou
ble
gun)
40
– 1
00Vd
c 20
0A
GB/T
with
202
34.3
com
plianc
e1/
2 D
C10
/100
Bas
e-T
Ethe
rnet
, 4G/
3G m
odem
(o
ptiona
l)
-Mod
e 4
1.30
Lak
h/
Unit
2W to
4W
11Pl
ugng
o-
BHAR
ATAC
-0
01AC
Cha
rger
Inpu
t Vo
ltag
e (A
C) 3
Pha
se
415
Vac(
374~
44
0Vac
) In
put
Freq
uenc
y 50
±1Hz
Outp
ut C
urre
nt
Max
. 15
Amp, p
er o
utpu
t Ou
tput
Rat
ing
230V
ac, 5
0Hz,
3.3K
W M
ax. p
er
outp
ut
IEC
6030
9, (3
Pin
Fem
ale
Conn
ecto
r)
3 Use
r Au
then
ticat
ion
OCPP
Ch
arge
r an
d CM
S Pr
otoc
ol: O
CPP
(Ope
n Ch
arge
Point
Pro
toco
l)
Inte
rfac
e: E
ther
net,
2G/3
G/4G
-Mod
e1
-2,3W
EVMDC
FCLV
-18
kW C
ombo
DC C
harg
erAC
Inp
ut
3 Ph
ase
4wire
, AC
380
~480
V (S
tand
ard)
AC
Inp
ut
0.99
Max
60
Vdc/
160A
@
each
out
put
Max
60
Vdc/
80A
@ea
ch o
utpu
t Max
23
0Vac
/16A
@
each
out
put
-2
Nos
of
SBX
175
4 Nos
of
SBX
75
3 Nos
of
Indu
stria
l Pl
ug
--
Mod
e 4
-4W
BHAR
ATDC
-0
01DC
Cha
rger
AC Inp
ut
3 Ph
ase,
415
Vac,
(374
~440
V)
AC O
utpu
t Po
wer
10
kW
/15
kW/5
@
40V/
60V/
72V
Max
. 200
AGB
/T 2
0234
.3-
Prot
ocol
: OCP
P 1.6
(Ope
n Ch
arge
Point
Pr
otoc
ol) In
terfac
e:
Ethe
rnet
, 2G/
3G/4
G
-Mod
e 4
-3,4W
DC 3
0 KW
- In
put Vo
ltag
e ≥
94%
In
put
Freq
uenc
y 50
Hz,
± 5H
z
DC O
utpu
t Vo
ltag
e Ra
ting
48V/
60V/
72V
DC
Power
Rat
ing
30kW
Outp
ut c
onne
ctor
with
GB
/T (Bh
arat
DC0
01)
2 B/
w E
VSE
and
Vehicle
Can
base
d co
mm
unicat
ion
as p
er
AIS
- 01
38-2
B/
w C
harg
er a
nd
Cent
ral Se
rver
OC
PP v
1.6
- 10
/100
- T
Et
hern
et (St
anda
rd)/
Optio
nal GS
M M
odel (4G
Fa
llbac
k 3G
)
-Mod
e 4
--

Smart Charging Strategies and Technologies for Electric Vehicles Simulation-based study to evaluate the effects of E-mobility smart charging strategies60
Sr.
NoCh
arge
r M
anuf
actu
rer
Char
ger N
ame
Char
ger T
ype
Inpu
t Rat
ing
Outp
ut R
atin
gCo
nnec
tor
Type
s
No. o
f ch
argi
ng
gun
Com
mun
icat
ion
Effic
ienc
yCh
argi
ng
Type
DC 5
0 KW
-In
put Vo
ltag
e Ra
nge
400
V +/
-10%
(5
0 Hz or
60
Hz)
Max
rat
ed
inpu
t cu
rren
t &
power
CJ
G, C
G:14
3 A,
98
kVA
--
-RF
ID S
yste
m: I
SO/IEC
14
443A
/B
ISO/
IEC
1539
3 Net
wor
k Co
nnec
tion
GSM / 3
G Mod
em
10/1
00 B
ase-
T Et
hern
et
IP54
GS
M / 3
G Mod
em
10/1
00 B
ase-
T Et
hern
et
-Mod
e 4
--
12En
sto
Hom
e Ch
arging
eF
iller
3x16
A IP
44
Type
2 Ty
pe o
f cu
rren
t: AC
, 50H
z
≤ 23
0 V
--
--
Mod
e1
--
Publ
ic C
harg
ing
- Nom
inal
cu
rren
t: 3x
32A
Ra
ted
voltag
e:
≤ 23
0 V
--
--
-Mod
e 2
-3,4W
Ensto
one
Type
2 -
sock
et
as a
defau
lt.
Mod
els
with
fix
ed Typ
e 2
3.6k
W (16
A)
or 7
.4kW
(3
2A)
-Mod
e 2
13Se
mac
onne
ct
- AC
cha
rger
J1
772
plug
s fo
r all EV
208/
240V
, ce
nter
gr
ound
ed,
60Hz su
pply
30A
max
imum
, 7.2k
W@
240V
ACSA
E J1
772
-Co
mm
ercial
CDM
A or
GP
RS c
ellu
lar ne
twor
k 12
8-bit AE
S En
cryp
tion
ISO
1569
3 (iC
LASS
), IS
O144
43 (MIFAR
E,
DESF
IRE)
-Mod
e 2
--
14Ze
vpoint
Com
mer
cial
ch
arge
rAC
cha
rger
400V
AC
50/6
0 Hz
22 K
W 3
2 A
(3 P
hase
)IE
C 62
196-
2, Typ
e II
-3G
(GP
RS) IS
O 14
443A
&
ISO
1569
3 5m
Cab
le
Type
2 F
emal
e Pl
ug
OCPP
1.6 (with
GSM
)
-Mod
e 2
--
DC C
harg
er-
-Up
to 3
50kW
--
--
Mod
e 4
--
15Ch
arge
myg
aadi
DC C
harg
er 7
5-15
0kW
DC c
harg
erCC
S1
AND
CCS2
-75
-150
kW
150-
1000
V-
-GS
M/C
DMA
mod
el
ISO/
IEC
1444
43A/
B IS
O/IE
C 15
693
DC P
roto
col St
anda
rd:
EN61
851-
23/
DIN70
121,IS
O 15
118
OCPP
1.6
-Mod
e 4
--
16Ve
rde
mob
ility
AC d
ual gu
nAC
cha
rger
Ty
pe 2
-3.3k
W-7
.4kW
per
out
put.
--
OCPP
1.6 o
ver GS
M/
WIF
I/sigf
ox
Dual
out
put with
a
rang
e Au
then
ticat
ion
using
APP
and
RFID
.
-Mod
e 2
--

61 Smart Charging Strategies and Technologies for Electric Vehicles Simulation-based study to evaluate the effects of E-mobility smart charging strategies
Sr.
NoCh
arge
r M
anuf
actu
rer
Char
ger N
ame
Char
ger T
ype
Inpu
t Rat
ing
Outp
ut R
atin
gCo
nnec
tor
Type
s
No. o
f ch
argi
ng
gun
Com
mun
icat
ion
Effic
ienc
yCh
argi
ng
Type
DC 5
0 KW
-In
put Vo
ltag
e Ra
nge
400
V +/
-10%
(5
0 Hz or
60
Hz)
Max
rat
ed
inpu
t cu
rren
t &
power
CJ
G, C
G:14
3 A,
98
kVA
--
-RF
ID S
yste
m: I
SO/IEC
14
443A
/B
ISO/
IEC
1539
3 Net
wor
k Co
nnec
tion
GSM / 3
G Mod
em
10/1
00 B
ase-
T Et
hern
et
IP54
GS
M / 3
G Mod
em
10/1
00 B
ase-
T Et
hern
et
-Mod
e 4
--
12En
sto
Hom
e Ch
arging
eF
iller
3x16
A IP
44
Type
2 Ty
pe o
f cu
rren
t: AC
, 50H
z
≤ 23
0 V
--
--
Mod
e1
--
Publ
ic C
harg
ing
- Nom
inal
cu
rren
t: 3x
32A
Ra
ted
voltag
e:
≤ 23
0 V
--
--
-Mod
e 2
-3,4W
Ensto
one
Type
2 -
sock
et
as a
defau
lt.
Mod
els
with
fix
ed Typ
e 2
3.6k
W (16
A)
or 7
.4kW
(3
2A)
-Mod
e 2
13Se
mac
onne
ct
- AC
cha
rger
J1
772
plug
s fo
r all EV
208/
240V
, ce
nter
gr
ound
ed,
60Hz su
pply
30A
max
imum
, 7.2k
W@
240V
ACSA
E J1
772
-Co
mm
ercial
CDM
A or
GP
RS c
ellu
lar ne
twor
k 12
8-bit AE
S En
cryp
tion
ISO
1569
3 (iC
LASS
), IS
O144
43 (MIFAR
E,
DESF
IRE)
-Mod
e 2
--
14Ze
vpoint
Com
mer
cial
ch
arge
rAC
cha
rger
400V
AC
50/6
0 Hz
22 K
W 3
2 A
(3 P
hase
)IE
C 62
196-
2, Typ
e II
-3G
(GP
RS) IS
O 14
443A
&
ISO
1569
3 5m
Cab
le
Type
2 F
emal
e Pl
ug
OCPP
1.6 (with
GSM
)
-Mod
e 2
--
DC C
harg
er-
-Up
to 3
50kW
--
--
Mod
e 4
--
15Ch
arge
myg
aadi
DC C
harg
er 7
5-15
0kW
DC c
harg
erCC
S1
AND
CCS2
-75
-150
kW
150-
1000
V-
-GS
M/C
DMA
mod
el
ISO/
IEC
1444
43A/
B IS
O/IE
C 15
693
DC P
roto
col St
anda
rd:
EN61
851-
23/
DIN70
121,IS
O 15
118
OCPP
1.6
-Mod
e 4
--
16Ve
rde
mob
ility
AC d
ual gu
nAC
cha
rger
Ty
pe 2
-3.3k
W-7
.4kW
per
out
put.
--
OCPP
1.6 o
ver GS
M/
WIF
I/sigf
ox
Dual
out
put with
a
rang
e Au
then
ticat
ion
using
APP
and
RFID
.
-Mod
e 2
--
Sr.
NoCh
arge
r M
anuf
actu
rer
Char
ger N
ame
Char
ger T
ype
Inpu
t Rat
ing
Outp
ut R
atin
gCo
nnec
tor
Type
s
No. o
f ch
argi
ng
gun
Com
mun
icat
ion
Effic
ienc
yCh
argi
ng
Type
Sing
le G
un A
C Ch
arge
rAC
Typ
e 2
char
ger
230
Vac
+ 10
% o
r -6
%,
50Hz
415
Vac
+ 10
% o
r -6
%
7.4k
W, 2
30 V
ac, M
ax 3
2A
22kW
, 415
Vac
, Max
32A
10
kW, E
ach
Outlet
230
Vac
, Max
15A
1. IEC
621
96-2
Mod
e 3,
Type
2
2.IE
C 60
309
1 1 3
1.Be
twee
n Ch
arge
r an
d Ve
hicle
Type
-2 A
s pe
r IE
C 61
851-
1 As
per
BEV
C-AC
0001
Sp
ecifi
catio
n 2.Be
twee
n Ch
arge
r an
d CM
S OC
PP v
1.6 o
r ab
ove
- 10
/100
Bas
t-T Et
hern
et
(Sta
ndar
d) o
r Op
tical
GS
M M
odem
(2G
/3G/
4G)
and
Wire
less
(Op
tiona
l
-Mod
e 2
Mod
e 3
65,000
/- for
4.5k
W
80,000
/- for
22
kW
1. 2
,3,4W
2.4W
3. 4
W
Bhar
at A
C 00
1AC
cha
rger
--
3out
put so
cket
-OC
PP 1
.6 o
ver GS
M/W
IFI
ARAI
com
plain
--
--
Hyb
rid A
C ch
arge
r
TYPE
2 A
C ch
arge
r-
-3
outp
ut o
f ra
nge
2*3.3k
W IEC
603
09-1
*-
OCPP
1.6 o
ver GS
M/W
IFI-
--
-
17Uzn
aka
Solu
tions
pvt.
Ltd
(AC
Type
-2 /
AC
002)
AC c
harg
er
-3.3k
W A
C-
-OC
PP. P
ro S
and
Pr
o M d
evices
can
be
conn
ecte
d fo
r OC
PP 1
.5
and
load
man
agem
ent
--
80,000
/-4-
Whe
eler
DC W
all bo
xDC
cha
rger
-
24 k
W
60 A
high
outp
ut c
urre
ntSing
le o
r du
al o
utlet:
CCS
and
CHAd
eMO
-OC
PP-
Mod
e4
8Lak
hs/-
4-W
heeler
TRON
X DC
To
wer
– 1
5 KW
DC c
harg
er-
15 k
W D
C ch
arging
20
0 A
high
out
put cu
rren
tSing
le o
utlet:
GB/T
-OC
PP 1
.6/2
.0
Capa
bilit
y fo
r re
mot
e se
rvices
-Mod
e4
-4-
Whe
eler
TRON
X DC
To
wer
– 5
0 KW
DC c
harg
er50
kW
DC
char
ging
12
5AMax
. ou
tput
cur
rent
Two
outlet
s su
ppor
ting
CCS2
co
mbo
and
CHAd
eMO
and
an
optio
nal AC
typ
e-2
conn
ecto
r.
--
OCPP
1.6/2
.0
Capa
bilit
y fo
r re
mot
e se
rvices
-Mod
e4
-El
ectric
cars
, pick
-up
truc
ks a
nd
minibus
esTR
ONX-
AC00
1AC
cha
rger
I/P
11kW
O/
P 10
kW-
--
-Mod
e1
70,000
/-Pl
ug-in
hybr
id
elec
tric
vehicles
18Tire
x
60kW
EVF
C CC
S CH
AdeM
O EV
Ch
arge
r
CCS, C
HAd
eMO,
AC
Typ
e 2
-DC
pow
er u
p to
60
kW, A
C po
wer
up
to 4
3 kV
A-
--
-Mod
e4
-4-
Whe
eler
DC c
harg
ing
Wall-m
ount
edDC
415
V20
KW
O/P
Voltag
e 40
V –
100V
Va
riabl
e
--
Com
mun
icat
ion
Inte
rfac
e CA
NAu
tom
atic
Char
ging
or
Man
ual
Char
ging
Op
tiona
l
Mod
e4
-El
ectric
cars, t
axis,
engine
ering
vehicles
an
d co
ache
s.AC
Cha
rging
EV M
ini
AC3
Phas
e,
5 W
ire A
C Sy
stem
(3P
h,
N, E
), 50
Hz
Nom
inal
I/P
vo
ltag
e: 3
Ph
ase, 4
15V
230
Vac, S
ingl
e Ph
ase, 1
5A
each
as
per IS
123
603
Inde
pend
ent Ch
arging
So
cket
s as
per
IEC
60
309
3Be
twee
n EV
SE a
nd
Serv
er O
CPP
1.6
and
high
er
Betw
een
EVSE
and
CMS
Ethe
rnet
(St
anda
rd),
3G
and
4G
-Mod
e1
-Ca
rs, t
axis,
truc
k,
bus
and
othe
r slow
ch
arging
.

Smart Charging Strategies and Technologies for Electric Vehicles Simulation-based study to evaluate the effects of E-mobility smart charging strategies62
Sr.
NoCh
arge
r M
anuf
actu
rer
Char
ger N
ame
Char
ger T
ype
Inpu
t Rat
ing
Outp
ut R
atin
gCo
nnec
tor
Type
s
No. o
f ch
argi
ng
gun
Com
mun
icat
ion
Effic
ienc
yCh
argi
ng
Type
19
Ampl
ify
Mob
ility
(Am
plify
clea
ntec
h so
lutio
n pr
ivat
e lim
ited)
AC V
-Cha
rge
AC20
8 –2
40
VAC, S
ingl
e Ph
ase, 3
0 A
(Max
)/41
5 VA
C Th
ree
Phas
e
208
–240
VAC
, Singl
e / Th
ree
Phas
e, 3
0 A
(Max
), 50
Hz,
3.3
KW to
22KW
IEC
6030
9 / IE
C 62
196(
Type
2)
5EV
SE to
VehicleJ
1772
co
mm
unicat
ion
/ Ty
pe
2Clo
ud C
onne
ctivity
2G
/ W
i-Fi(o
ptiona
l) O
ther
Bl
ueto
oth(
optio
nal)
OCPP
1.6/ 2.0
-Mod
e 2
90,000
/-4-
Whe
eler
BHAR
AT A
C 00
1AC
cha
rger
-20
8-24
0 V
AC,3.3kW
-3P
in-
-Mod
e1
42,500
/-2,3
and
4Whe
eler
POD
(Sm
art an
d Sim
ple
hom
e an
d co
mm
ercial
Ch
arging
)
AC c
harg
er 20
8 –2
40 V
AC,
Sing
le P
hase
, 15
A (Max
)
3.3
KW m
ax-
16A, 3
Pin
sock
et2G
/Wi-Fi B
luet
ooth
op
tiona
l-
Mod
e 1
1500
0/-
4-W
heeler
DC for
2,3
whe
eler
sDC
cha
rger
-0.75
to
2 KW
Mul
tiple C
onne
ctor
s-
--
--
2,3
whe
eler
sBh
arat
DC-
01DC
cha
rger
-10
to
15 K
WCo
mpa
tible w
ith G
B/T
-OC
PP 1
.6-
Mod
e4
-4-
Whe
eler
DC W
all
box
(Wall
mou
ntab
le
DC c
harg
ing
stat
ion)
DC c
harg
er-
Up
to 2
5 KW
CCS
/ CH
AdeM
O du
al-
RFID
rea
der
Clou
d co
nnec
tivity
OC
PP 1
.6
-Mod
e4
-4-
Whe
eler
DC
-Quick
(Rap
id
DC c
harg
ing
stat
ions
for
4-
whe
eler
s)
DC fas
t ch
arge
r-
60 to
120
KWGB
/T C
ompl
iant
-RF
ID R
eade
r Cl
oud
Conn
ectiv
ity
IP54
pro
tection
-Mod
e4
-4-
Whe
eler
DC U
ltra
fast
(S
uper
-fas
t ch
arging
for
4-
whe
eler
s an
d bu
ses)
)
DC u
ltra
fast
ch
arge
r-
150
KW
-Up
to 3
Co
nnec
tors
Confi
gura
ble
Grid
Ov
erlo
ad P
rote
ction
-Mod
e4
-4-
Whe
eler
an
d bu
ses

63 Smart Charging Strategies and Technologies for Electric Vehicles Simulation-based study to evaluate the effects of E-mobility smart charging strategiesSr
. No
Char
ger
Man
ufac
ture
rCh
arge
r Nam
eCh
arge
r Typ
eIn
put R
atin
gOu
tput
Rat
ing
Conn
ecto
rTy
pes
No. o
f ch
argi
ng
gun
Com
mun
icat
ion
Effic
ienc
yCh
argi
ng
Type
20
Okay
a Po
wer
(The
se
char
gers
are
ab
le to
char
ge
all El
ectric
Vehicles
of
IEC
6030
9 (B
hara
t Ac
001)
, IEC
62
196
- 2
(Typ
e 2
AC),
CCS
- 2,
CHAd
eMO
& GB
/T c
harg
ing
stan
dard
s co
mpl
ianc
e in A
C Ch
arge
r 23
0V o
r 41
5V a
nd in
DC C
harg
er
outp
ut
voltag
e up
to
750/
1000
V)
AC W
allb
ox
Char
ger
-23
0VAC
, 50H
z 41
5 Va
c+10
%
or -
6%,50
Hz
415
Vac+
10%
or
-6%
,50
Hz
7kW
,230
VAC
max
32
Amp
22kW
10
kW
IEC
6219
6, Typ
e 2
IEC
6030
91 1 3
Char
ger an
d Ve
hicle
Type
-2 A
sper
IEC
6185
1-
As p
er B
EVC-
AC00
01Sp
ecifi
catio
n Ch
arge
r an
d CM
S:-
OCPP
v 1
.6 o
r ab
ove
- 10
/100
Bas
e-T Et
hern
et
(Sta
ndar
d) o
r Op
tical
GS
M M
odem
(2G
/3G/
4G)
and
Wire
less
(Opt
iona
l
-Mod
e 2
75,000
/2,3,4-
W
heeler
AC W
allb
ox
Char
ger
AC C
harg
er41
5VAC
, 50H
z21
kW
,415
VAC
max
32
Amp
IEC
6219
6-2, M
ode
3 Ty
pe 2
1IE
C 62
196, IEC
618
51
OCPP
v 1
.6 o
r ab
ove
GSM a
nd w
ireless
op
tion
-Mod
e2
1000
00/-
-
Bhar
at A
C EV
Ch
arge
rAC
cha
rger
415V
AC, 5
0Hz
Each
out
let 23
0 VA
C m
ax 3
2 Am
p, 1
0kW
with
3 3
.3kW
IEC
603
09
sock
et3
As p
er B
EVC-
AC00
1 Sp
ecifi
catio
n OC
PPv
1.6
or a
bove
GS
M a
nd w
ireless
op
tion
-Mod
e2
5500
0/-
4-W
heeler
(C
ar)
Bhar
at D
C EV
Ch
arge
rDC
cha
rger
415V
AC, 5
0Hz
1)15
kW
40-1
00Vd
c m
ax
200A
mp
2)20
kW40
-100
Vdc
max
10
0Am
p 3)
30k
W, 4
0-10
0Vdc
max
20
0Am
p
GB/T
202
34.3
1) 1
2)
2
3) 2
Betw
een
EV C
harg
er
and
EV C
AN-b
ased
co
mm
unicat
ion
as p
er
AIS-
138
OCPP
v 1
.6 o
r ab
ove
GSM a
nd w
ireless
op
tion
-Mod
e 4
1.23
0000
for
15
kW
2.10
000
for
20kW
3..410
000
for 30
kW
-
DC W
allb
ox
Char
ger
DC c
harg
er41
5VAC
, 50H
z20
kW, 2
00-1
000V
dcCC
S-2/
CHad
eMO
1Be
twee
n EV
Cha
rger
an
d EV
IE
C 62
196, IEC
618
51
for CC
S-2
AND
JEVS
G1
05 for
CHad
eMO
OCPP
v 1
.6 o
r ab
ove
GSM a
nd w
ireless
op
tion
-Mod
e4
7500
00/-
for
CH
adMO
7000
00/-
for
CC
S2
4-W
heeler
(C
ar)
Sing
le G
un
Quick
DC
Char
ger
DC fas
t ch
arge
r41
5VAC
, 50H
z1)
40kW
, 200
-100
0Vdc
2)
60kW
, 200
-100
0Vdc
3)
80
kW, 2
00-1
000V
dc
CCS-
2/ C
Had
eMO
1) 1
2)
1
3) 1
Betw
een
EV C
harg
er
and
EV
IEC
6219
6, IEC
618
51
for CC
S-2
AND
JEVS
G1
05 for
CHad
eMO
OCPP
v 1
.6 o
r ab
ove
GSM a
nd w
ireless
op
tion
-Mod
e 4
1.11
0000
0 fo
r 40
kW,
CHed
eMO
1000
000
for
40kW
, CCS
2 2. 1
1500
00
for 60
kW
3. 1
3500
00
for 80
kW
4-W
heeler
(C
ar),
Buse
s

Smart Charging Strategies and Technologies for Electric Vehicles Simulation-based study to evaluate the effects of E-mobility smart charging strategies64
Sr.
NoCh
arge
r M
anuf
actu
rer
Char
ger N
ame
Char
ger T
ype
Inpu
t Rat
ing
Outp
ut R
atin
gCo
nnec
tor
Type
s
No. o
f ch
argi
ng
gun
Com
mun
icat
ion
Effic
ienc
yCh
argi
ng
Type
Dual
Gun
Fas
t DC
Cha
rger
DC C
harg
er41
5VAC
, 50H
z12
0kW
, 200
-100
0Vdc
CCS-
2/ C
Had
eMO
1Be
twee
n EV
Cha
rger
an
d EV
IE
C 62
196, IEC
618
51
for CC
S-2
AND
JEVS
G1
05 for
CHad
eMO
OCPP
v 1
.6 o
r ab
ove
GSM a
nd w
ireless
op
tion
-Mod
e 4
-4-
Whe
eler
(C
ar),
Buse
s
Com
bo 3
in
1 EV
Cha
rger
Com
bo Typ
e41
5VAC
, 50H
z1. D
C O/
P 1
60
kW 2
00-7
50
Vdc
2. D
C O/
P 2
6
0kW
200
-55
0Vdc
3. A
C O/
P3 2
2kW
AC
3Pha
se
1.CC
S 2
2. C
Had
eMO
3. Typ
e 2
4.IE
C 62
196
3Be
twee
n EV
Cha
rger
and
EV
, (PL
C) C
CS-2
, (CA
N)
CHad
eMO
and
Type
2 a
s pe
r IE
C 61
851
(1)
OCPP
v 1
.6 o
r ab
ove
GSM a
nd w
ireless
op
tion
-Mod
e 3
Mod
e 4
1150
000/
-fo
r CC
S24-
Whe
eler
(C
ar),
Buse
s
Com
bo 3
in
1 EV
Cha
rger
Com
bo Typ
e41
5VAC
, 50H
z1. D
C O/
P 2
6
0kW
200
-10
00Vd
c 2. A
C O/
P3 2
2kW
AC
3Pha
se
1.CC
S 2
2. C
Had
eMO
3. Typ
e 2
4.IE
C 62
196
3Be
twee
n EV
Cha
rger
and
EV
, (PL
C) C
CS-2
, (CA
N)
CHad
eMO
and
Type
2 a
s pe
r IE
C 61
851
(1)
OCPP
v 1
.6 o
r ab
ove
GSM a
nd w
ireless
op
tion
-Mod
e 3
Mod
e 3
Mod
e 4
1200
000/
- fo
r CC
S24-
Whe
eler
(C
ar),
Buse
s
Portab
le E
V Ch
arge
rAC
Cha
rger
230V
ac, 5
0Hz
230V
ac, 1
6Am
pTy
pe 2
IEC
621
961
Betw
een
EV a
nd c
harg
er
IEC
6219
6, IEC
618
51-
Mod
e 1
-Co
mpa
tible
with
typ
e 2
vehicle
21(V
olta
ic)
TVES
AS
Elec
tric
BHAR
AT A
C-
001
AC C
harg
er3P
hase
, 41
5VAC
(3
74~4
40VA
C),
50Hz
3.3K
W 1
5Ape
r Ou
tput
Sock
etIE
C603
09
(Thr
ee N
os. o
f So
cket
)3
RFID
or QR
Cod
e or
OT
P-ba
sed
char
ging
Au
then
ticat
ion
Char
ger &
CMSO
CP
P1.6J
Net
wor
k In
tern
et
(2G/
3G/4
G), G
SM,
Ethe
rnet
94%
Mod
e 1
44,000
/-2, 3
, 4-
whe
eler
BHAR
AT D
C-00
1DC
--
--
--
Mod
e 4
--
Type
2AC
Cha
rger
1 Ph
ase,
230
VAC
(195
~245
VAC)
, 50
Hz
3 Ph
ase,
415
VAC
(395
~440
VAC)
, 50
Hz
7.4
KW 2
30 V
AC, 3
2A
22 K
W41
5VAC
, 32
AEC
6219
6-2
IEC6
2196
-21 1
EV &
Cha
rger
CAN
Co
mm
unicat
ion
Char
ger &
CMSO
CPP
1.6J
Net
wor
kInt
erne
t (2
G/3G
/4G)
, GSM
, Et
hern
et, W
i-Fi
(Opt
iona
l)
94%
Mod
e 3
5900
0/-
4-W
heeler
DC W
allb
oxDC
3 Ph
ase,
415
VAC
(374
~440
VAC)
, 50
Hz
25 K
W
IEC
CCS
Com
bo 2
, 200
-500
Vd
c, 6
0A m
ax, 2
5KW
max
.(O
ptiona
l: SA
E DC
) Ou
tput
2 R
ating
CHAd
eMO,
50
-500
Vdc
, 60
A m
ax, 2
5 KW
max
, DIN
701
21
CCS2
& C
HAde
MO
(CE
& IEC
Complianc
e)-
EV &
Cha
rger
CAN
Co
mm
unicat
ion
Char
ger &
CMSO
CPP
1.6J
Net
wor
kInt
erne
t (2
G/3G
), GS
M, E
ther
net
92%/
Com
pliant
with
IEC
61
000
-3-1
2
Mod
e 4
5.90
Lak
h/
Piec
e4-
Whe
eler
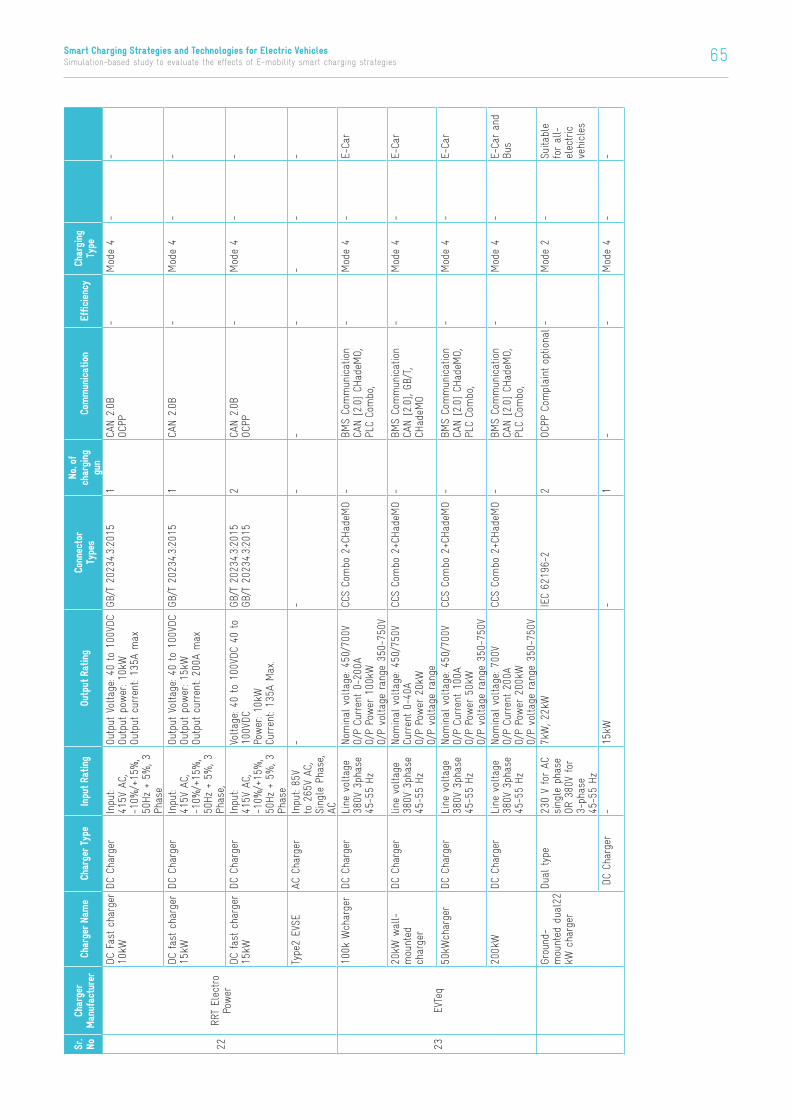
65 Smart Charging Strategies and Technologies for Electric Vehicles Simulation-based study to evaluate the effects of E-mobility smart charging strategies
Sr.
NoCh
arge
r M
anuf
actu
rer
Char
ger N
ame
Char
ger T
ype
Inpu
t Rat
ing
Outp
ut R
atin
gCo
nnec
tor
Type
s
No. o
f ch
argi
ng
gun
Com
mun
icat
ion
Effic
ienc
yCh
argi
ng
Type
22RR
T El
ectro
Power
DC F
ast ch
arge
r 10
kWDC
Cha
rger
Inpu
t: 41
5V A
C,
-10%
/+15
%,
50Hz +
5%, 3
Ph
ase
Outp
ut V
olta
ge: 4
0 to
100
VDC
Outp
ut p
ower
: 10k
W
Outp
ut c
urre
nt: 1
35A
max
GB/T
202
34.3:201
51
CAN 2
.0B
OCPP
-Mod
e 4
--
DC fas
t ch
arge
r 15
kWDC
Cha
rger
Inpu
t: 41
5V A
C,
-10%
/+15
%,
50Hz +
5%, 3
Ph
ase,
Outp
ut V
olta
ge: 4
0 to
100
VDC
Outp
ut p
ower
: 15k
W
Outp
ut c
urre
nt: 2
00A
max
GB/T
202
34.3:201
51
CAN 2
.0B
-Mod
e 4
--
DC fas
t ch
arge
r 15
kWDC
Cha
rger
Inpu
t: 41
5V A
C,
-10%
/+15
%,
50Hz +
5%, 3
Ph
ase
Voltag
e: 4
0 to
100
VDC
40 to
100V
DC
Power
: 10k
W
Curren
t: 13
5A M
ax.
GB/T
202
34.3:201
5
GB/T
202
34.3:201
52
CAN 2
.0B
OCPP
-Mod
e 4
--
Type
2 EV
SEAC
Cha
rger
Inpu
t: 85
V to
265
V AC
, Sing
le P
hase
, AC
--
--
--
--
23EV
Teq
100k
Wch
arge
rDC
Cha
rger
Line
vol
tage
38
0V 3
phas
e 45
-55
Hz
Nom
inal
vol
tage
: 450
/700
V O/
P Cu
rren
t 0-
200A
O/
P Po
wer
100
kW
O/P
voltag
e ra
nge
350-
750V
CCS
Com
bo 2
+CHad
eMO
-BM
S Co
mm
unicat
ion
CAN [2.0]
CHad
eMO,
PL
C Co
mbo
,
-Mod
e 4
-E-
Car
20kW
wall-
mou
nted
ch
arge
r
DC C
harg
erlin
e vo
ltag
e 38
0V 3
phas
e 45
-55
Hz
Nom
inal
vol
tage
: 450
/750
V Cu
rren
t 0-
40A
O/P
Power
20k
W
O/P
voltag
e ra
nge
CCS
Com
bo 2
+CHad
eMO
-BM
S Co
mm
unicat
ion
CAN [2.0]
, GB/
T,
CHad
eMO
-Mod
e 4
-E-
Car
50kW
char
ger
DC C
harg
erLine
vol
tage
38
0V 3
phas
e 45
-55
Hz
Nom
inal
vol
tage
: 450
/700
V O/
P Cu
rren
t 10
0A
O/P
Power
50k
W
O/P
voltag
e ra
nge
350-
750V
CCS
Com
bo 2
+CHad
eMO
-BM
S Co
mm
unicat
ion
CAN [2.0]
CHad
eMO,
PL
C Co
mbo
,
-Mod
e 4
-E-
Car
200k
WDC
Cha
rger
Line
vol
tage
38
0V 3
phas
e 45
-55
Hz
Nom
inal
vol
tage
: 700
V O/
P Cu
rren
t 20
0A
O/P
Power
200
kW
O/P
voltag
e ra
nge
350-
750V
CCS
Com
bo 2
+CHad
eMO
-BM
S Co
mm
unicat
ion
CAN [2.0]
CHad
eMO,
PL
C Co
mbo
,
-Mod
e 4
-E-
Car an
d Bu
s
Grou
nd-
mou
nted
dua
l22
kW c
harg
er
Dual
typ
e 23
0 V
for AC
sing
le p
hase
OR
380
V fo
r 3-
phas
e 45
-55
Hz
7kW
, 22k
WIE
C 62
196-
22
OCPP
Com
plaint
opt
iona
l-
Mod
e 2
-Su
itabl
e fo
r all-
elec
tric
vehicles
DC
Char
ger
-15
kW-
1-
-Mod
e 4
--

Smart Charging Strategies and Technologies for Electric Vehicles Simulation-based study to evaluate the effects of E-mobility smart charging strategies66
Sr.
NoCh
arge
r M
anuf
actu
rer
Char
ger N
ame
Char
ger T
ype
Inpu
t Rat
ing
Outp
ut R
atin
gCo
nnec
tor
Type
s
No. o
f ch
argi
ng
gun
Com
mun
icat
ion
Effic
ienc
yCh
argi
ng
Type
24P2
pow
er
Bhar
at A
C001
AC C
harg
er41
5V (+6
%
and
-10%
) as
pe
r IS
123
60,
50Hz,
±1.5Hz
Nom
inal
Out
put Vo
ltag
e 23
0Vac
IEC
6030
93
Prot
ocol
(EV
SE &
Ce
ntra
l Se
rver
) OC
PP
163
Betw
een
EVSE
and
CMS
Ethe
rnet
(St
anda
rd),
4G
Fall
Back
3G
(Opt
iona
l)
-Mod
e 1
-2,3
and
4-W
heeler
Bhar
at D
C001
-DC
Char
ger
3Ø, 4
15V
(+6%
and
-1
0%) as
per
IS
123
60
50Hz,
±1.5Hz
48V/
60V/
72VD
COu
tput
con
nector
with
GB/
T 20
234.3
Com
plianc
e
-Use
r Au
then
ticat
ion
ISO/
IEC
1444
3 A
RFID
fo
r us
er a
uthe
nticat
ion
B/w E
VSE
and
Vehicle
CAN-b
ased
co
mm
unicat
ion
as p
er
AIS1
38-2
B/
w c
harg
er a
nd
Cent
ral Se
rver
OCP
P v1
.6 –
10/
100
Base
-T
Ethe
rnet
(St
anda
rd) /
Optio
nal GS
M M
odem
(4
G Fa
llbac
k 3G
)
-Mod
e 4
-2,3
and
4-W
heeler
26Trinity
clean
Te
ch
--
--
--
--
--
-
27Ce
llerit
e Sy
stem
Pvt
Lt
d
--
--
--
--
-30
,000
/-
28Ba
ttre
Battre
RE
Char
ger
On/O
ff
Switc
hing
Plu
g un
it with
pow
er
cons
umpt
ion
mea
sure
men
t
220V
/ 50
Hz
AC 1
6A 3.3k
W3-
Pin
India/
Eur
ope
Com
patib
le3-
Pin
Power
So
cket
with
Neu
tral
Live
and
Gr
ound
Blue
toot
h 4.0, 2
.4Gh
z,
Wi-Fi
--
3000
/-2-
Whe
eler
29Tu
cker
Mot
or
Bhar
at E
V DC
00
1 -
IP54
--
200A
-2
Pin
--
Mod
e4
2.50
Lak
h/
Piec
e2,3
and
4-W
heeler
30Ki
rana
Cha
rzer
--
--
--
--
-10
,000
/-2,3,4
Whe
eler

67 Smart Charging Strategies and Technologies for Electric Vehicles Simulation-based study to evaluate the effects of E-mobility smart charging strategies
Sr.
NoCh
arge
r M
anuf
actu
rer
Char
ger N
ame
Char
ger T
ype
Inpu
t Rat
ing
Outp
ut R
atin
gCo
nnec
tor
Type
s
No. o
f ch
argi
ng
gun
Com
mun
icat
ion
Effic
ienc
yCh
argi
ng
Type
31EV
Fast
EVFA
ST L
iteAC
Ch
arge
rEC
-621
96-2
AC 2
30 V
(±
)15%
3.5
kW M
axTy
pe 2
, AC
Sing
le P
hase
,-
Betw
een
EV C
harg
er a
nd
EVTy
pe-2
AC
as P
er IEC
61
851-
1 Use
r Au
then
ticat
ion
RFID
--
29,500
/ Unit
2,4-
W
heeler
32Sh
reeji
Ente
rpris
e
AC C
harg
erAC
cha
rger
230v
,3.3K
W-7
.4KW
, 3-p
hase
Up
to
22KW
1-ph
ase
Type
2 c
able a
nd p
lug
Type
2 s
ocke
t with
sh
utte
r
-OC
PP 1
.6J
GSM, E
ther
net,
Wi-Fi
Auth
entic
ation
via
RFID
an
d AP
P
--
36,000
/ Piec
e-
33Ax
onify
Atom
AC
Wallb
ox
AXBO
X001
AC C
harg
er23
0V 1
-Ph
AC,
415V
3-P
h AC
3.3
kW, 7
.2 k
W...
22 k
WTy
pe2
AC (IE
C 62
196)
-3G
, 4G, E
ther
net
OCPP
1.6, 2
.0*
-Mod
e2
45,000
/-2,3,4
Whe
eler
Atom
Pub
lic A
C Ch
arge
rAC
Cha
rger
230V
1-P
h AC
, 41
5V 3
-Ph
AC3.3
kW, 7
.2 k
W...
22 k
WBh
arat
AC0
01, J
1772
, Ty
pe2
AC,
-OC
PP 1
.6, 2
.0*3
G, 4
G,
Ethe
rnet
-Mod
e2
-2,3,4
Whe
eler
Fast C
harg
erDC
Cha
rger
380-
480
V ac
3
o (5
0-60
Hz)
15 k
W, 3
0 kW
… 15
0 kW
Bhar
ath
CHAd
eMO, C
CS-
1 / 2, G
B/T
-OC
PP 1
.6, 2
.0*
3G, 4
G, E
ther
net
-Mod
e4
-all type
s of
electric
ve
hicles
34Su
ncov
En
ergy
Priv
ate
Lim
ited”
Com
bine
d Ch
arging
Sy
stem
Elec
tric C
ar
Char
ger
-15
-200
kW,
25-6
3 A
AC-D
C Ty
pe 2
2-
-Mod
e3
Mod
e4
3.25
Lak
h/
Unit
4-W
heeler
35Mas
sTec
hDC
Fas
t Ch
arge
rDC
Cha
rger
Thre
e Ph
ase
380-
440V
10-2
00kW
(GB/
T, CC
S, C
HAd
eMO)
-
≥95%
(L
oad:50
~ 10
0%)
Mod
e 4
3,98
000
- 5,00
000.00
Bus
and
4Whe
eler
AC C
harg
erAC
Typ
e 2
Sing
le p
hase
23
0V, 3
2 A
2kW
,32
A
to 4
3 kW
Type
21
--
Mod
e 2
70,000
/- for
2-
10kW
2,3,4
Whe
eler

Smart Charging Strategies and Technologies for Electric Vehicles Simulation-based study to evaluate the effects of E-mobility smart charging strategies68
3.10.2 EV CHARGING STANDARDS IN INDIA
IS 17017 part 1 is an Indian standard issued by the Bureau of Indian Standards in July 2018 (BIS, 2018). It provides the general requirement of EV supply equipment. It is applied to the charging station or EV supply equipment used to charge EV with rated input and output supply voltage of 1000 V AC and 1500 V DC. This standard covers the following aspects:
• Operating modes and characteristics of charging station
• Connection specification between EV and charging station
• Electrical safety requirements of charging station
The standard mentions all the definitions related to the EV charging system. The standard defines the charging station/EVSE of charging, types of charging cases based on the attachment status of charging cable, insulation, and its types. The functionality of various pins, conductors, and cables are briefed in the standard as well. The classification of charging stations based on input and output power supply, environmental condition, accessibility, mounting methods, and charging modes has been done. A charging station is also classified based on protection against electric shock.
Further discussion on charging modes and functions is provided below.
Mode 1
The EV is connected to a standard AC socket via a connector and cable assembly with a controlling contact pilot pin absent in the mode. A protective conductor should be connected between the plug and the vehicle connector. The current and voltage rating of Mode-1 in the single-phase and the three-phase condition is given in Table 7. Due to the absence of a control pilot pin, Mode-1 does not perform smart charging.
Table 8: Current and voltage ratings of Mode 1
Single-phase Three-Phase
Maximum voltage rating 240 V 415 V
Maximum current rating 16 A 16 A
Mode 2
In this mode, the EV is connected to the supply socket with cable and charger assembly constituting of control pilot pin that facilitates smart charging. Electric shock protection using a protective conductor is also enabled in this mode of charging. Mode-2 chargers are designed to be wall-mounted or to be placed in a shock-resistant enclosure. The current and voltage rating of Mode-2 charging is given in Table 8.
Table 9: Current and voltage ratings of Mode 2
Single-phase Three-Phase
Maximum voltage rating 240 V 415 V
Maximum current rating 32 A 32 A
Mode 3
In this charging mode, the EV is connected to AC supply equipment and is permanently connected to the supply network. The control pilot pin is present in Mode-3 charging, supporting smart charging via power modulation as per the system requirement.
IS 17017 part 1 is an Indian standard issued by the Bureau of Indian Standards in July 2018 (BIS, 2018). It provides the general requirement of EV supply equipment.

69 Smart Charging Strategies and Technologies for Electric Vehicles Simulation-based study to evaluate the effects of E-mobility smart charging strategies
Mode 4
In Mode-4, EV is connected to AC or DC supply network via DC charging station with control pilot pin. The charging station for Mode-4 charging should provide protective earthing to the vehicle connector.
There are some mandatory functionalities of Mode 2, 3, and 4 related to charging station operation.
• Continuous protective conductor checking
• Verification of proper connection between EV and EVSE
• Energization and de-energization of power supply
• Maintaining current within maximum limits
Any charging equipment with more than one charging gun should simultaneously and strictly perform the above functionality irrespective of other gun’s operation. While performing charging operations, continuity checking of protective conductors needs to be done.
In Mode-2, protection earthing between the in-cable control box and EV is checked regularly via the in-cable control box. In Mode-3 and Mode-4 charging, the charging station monitors the protective earthing connection between EV and charging station. In case of loss of continuity of protective earthing, i.e., opening a control pilot circuit for 100ms or incapability of verifying protective earthing for 3s, the supply to the EV should stop automatically.
IS 17017 part 1 standard also provides communication information between charging stations, EV, and management systems. Standard IS 17017 provides the necessary information on protection from electric shocks and other adverse conditions with the respective safety requirements and standards. Protection against electric shock covers protection against electric shock, fault protection, protective conductor, and residual current protection. In addition to this, safety requirement from signalling circuits, and isolation transformer is given.
Cable assembly requirements, conductive electric interface requirements, and charging station constructional requirements are also presented in detail. The conductive electric interface covers the requirements and rating of various connectors with the name of the respective standards. Cable requirement covers the electrical rating and dielectric withstand capacity of the cable, construction requirement, and cable management.
The dielectric withstand capability of the AC charging station is further divided into withstand voltage and impulse dielectric withstand voltage. AC withstand voltage should be applied for 1 min for 50Hz power frequency. In class I EVSE, (phase voltage+1200 V) RMS voltage should be used in common mode (circuit in relation with conductive part) and differential mode (electrically independent circuit and other conductive parts) as mentioned in 5.3.3.2 of IS 15382 part 1:2014. In class II EVSE, twice of (phase voltage +1200 V) RMS should be applied in common and differential mode as given in 5.3.3.2.3 of IS 15382 part 1: 2014. The impulse test for impulse dielectric withstands circuit is also given in IS 15382 part 1:2014.
Various tests like damp heat functional tests, operating temperature limit tests and mechanical strength tests with their respective standards are provided in IS 17017. Overloading protection of cable assembly should provide using a circuit breaker fuse or a combination of both. If the protection is designed with devices other than these, it has to trip within 1 min of current exceeding 1.3 times the rated current. In the case of short circuit protection, value should not exceed 75000 A2s and 80000 A2s for Mode-3 and Mode-3 (case C).

Smart Charging Strategies and Technologies for Electric Vehicles Simulation-based study to evaluate the effects of E-mobility smart charging strategies70
The standard mentions the necessary marking and instruction requirements of the charging station. The installation manual should completely mention the characteristics of the charging station. The user’s manual for an installed charging station should be provided to the user. It should include information related to adaptors, conversion adapters, and cord extension sets. The manufacturer should also provide durable marking on the equipment covering complete information, rating, manufacturing, dates and necessary information like protection type and insulation type. Durability test of this marking by rubbing the marks with a cloth soaked in water and petroleum sprit (separately) by hand for 15s is provided to check the charging station marks supplied by the manufacturer.
Detailed information about the general requirement, specifications and tests for AC and DC charging stations is provided in AIS-138 Part 1 and AIS-138 Part 2, respectively. Bharat AC001 and Bharat DC001 are two standard charging stations provided for the Indian charging scenario (DHI, 2017). Bharat AC 001 support AC charging with maximum current and power rating of 15 A and 3.3 kW.
The IEC 60309 connector has N: neutral, L: line, and G: ground pins. This standard allows charging three vehicles simultaneously from a three-phase AC supply. This is low power charging. Hence a specific communication standard between EV and EVSE is not specified in the standard. In contrast, communication between the EVSE and the central management system is defined as OCPP 1.5 and higher versions.
Bharat DC standard charger DC001 is defined for a maximum rating of 200A and 15kW (DHI, 2017). The output voltage can be 48V/60V/72V as per battery configuration. Communication between EV and EVSE is done using GB/T protocol over CAN bus communication. OCPP 1.5 and higher versions are adapted for communication between EVSE and the central management system.
Smart charging solution tools available in India include charging network providers and central management system providers. Table 9 mentions some of the smart charging solution providers in India.
Table 10: Smart charging solutions available in India
Sr. No Type of smart charging product
Organisation Explanation
1 Charging network provider Fortum India Provide charging solution on charge and drive platform
2 Charging network provider TATA Power Offers charging network for all types of location sites
3 Charging network provider Okaya power Provide operation and management system and monitoring system for transport and fleets
4 Management system provider BrightBlu Provide charging management software
5 Central management system provider
Numocity Provide CMS and IoT based solutions
6 Charging solution and network provider
Volttic Provide Ac-001 Dc-001 type of chargers and solutions using a mobile app
7 Charging network provider Chrage+Zone Provide customized charging solution
8 Charging network provider PlugNgo Provide charging network installation service and charging management solution
9 Charging network provider Tirex Provide IoT based cloud CMS and mobile app for home, public, and fleet control
Bharat AC001 and Bharat DC001 are two standard charging stations provided for the Indian charging scenario (DHI, 2017). Bharat AC 001 support AC charging with maximum current and power rating of 15 A and 3.3 kW.

71 Smart Charging Strategies and Technologies for Electric Vehicles Simulation-based study to evaluate the effects of E-mobility smart charging strategies
3.11 Smart EV Charging ProjectsSeveral smart charging projects have been conducted and demonstrated in different EV rich countries considering the promising benefits and capabilities of smart EV charging. Details on a list of such smart charging projects including the completed and ongoing projects, are described below.
3.11.1 ELECTRIC NATION SMART CHARGING PROJECT
• Time Duration: 2016-2019
• Location: United Kingdom
• Partners/ participants:
• Electricity distribution network operator: Western Power Distribution (Midland, South West, Wales)
• Technical expert and analysis and trial manager: EA technology
• Participant liaison and smart charge point installation and maintenance coordinator: Drive Electric
• Developing an EV load detection algorithm: Lucy Electric
• Project management: TRL (UK’s Transport Research Laboratory)
• Demand management system provider: Crowd Charge
• Demand management system provider: Green Flux
• 673 EV owners with domestic charging
• Aim: The project aims to demonstrate the effect of EV integration into a low-voltage distribution grid and investigate the feasibility of smart charging to mitigate the adverse effect of EV integration on the grid (“Powered-Up-Electric-Nation-Brochure.pdf,” n.d.).
• Methodology: The project implemented a time-of-use tariff structure to encourage EV owners to smartly charge their vehicles, keeping in mind grid capacity limitations. GreenFlux smart charging solution utilizes the time-of-use structure to incentivize EV users. Forty-five different vehicles participated in trials from 18 different manufacturers. The most common manufactures are BMW, Tesla, Mitsubishi, Nisan, and Mercedes-Benz. These vehicles belong to three categories of EVs: Battery Electric Vehicle (BEV), Plug-in Electric Vehicle (PEV), and Range Extended Electric Vehicle (REEV) (it has an additional small generator to charge the battery). Participating percentage of different types of vehicles in this project is shown in Figure 45.
Plug-in Hybrid (PHEV)
Range Extender (REX)
Electric only (BEV)
Vehicle type
Figure 45: Approximate presence of different vehicle types in the project (“Powered-Up-Electric-Nation-Brochure.pdf,” n.d.)

Smart Charging Strategies and Technologies for Electric Vehicles Simulation-based study to evaluate the effects of E-mobility smart charging strategies72
The project was divided into three phases to understand EV owners charging behaviour and its impact on the local grid.
Trial 1: Blind
This blind phase is when EV owners do not know about their vehicles’ limited charging due to restricted available supply. During the high demand and low grid power capacity, the participating EV has been given limited charging without informing the participants. During such scarcity of power supply, maximum demanded power allocation is not possible. Because of this, the participants have to be managed without noticing the change in the charging rate.
Trial 2: Interactive
In the interactive trial, participants are provided with mobile applications from CrowdCharge and Greenflux to indicate following day energy requirements.
• Participants using Greenflux mobile application can access the data whether their vehicle is being managed or not. They can also make their charging session a higher priority to opt-out from being managed by the charging session.
• The smart charging from the Greenflux application shows that the option of higher priority is availed in only 2-3% of charging events which shows that this feature is not being exploited by participants and used only in necessary circumstances.
• Participants using mobile applications from CrowdCharge has the provision of current SOC level and desired SOC level for next travel. It ensures a sufficient SOC level for the next trip.
Trial 3: Incentives
In the third trial, the second trial options are incentivized based on the energy usage of participants at different times of the day. In this trial, the second trial options are modified based on the time-of-use tariff structure to earn shopping vouchers. Again, both service providers have introduced different incentivization strategies, as given below.
• For participants using CrowdCharge, the app has the option that if the vehicle is needed for more travelling usage in a day, then charging will start with more costs; otherwise, it waits to start charging at an off-peak time with lower cost.
• The Greenflux app users get rewards based on time of use of energy and are provided with the options to charge regardless of price or action of shifting following low-price hours. They can choose smart charging and learn about their rewards in the app based on the options.
“GreenFLux uses the following options in the app:
• Optimize time (charge regardless of price),
• Minimize cost (charge in off-peak period only)
• Optimize time and cost (charging could begin during the shoulder period but would avoid the peak price charging)
Each participating group’s results show that the evening peak is disappeared and shifted as a sudden peak in off-peak night hours. The app results for participating EV owners’ charging behaviour at trial-1 and trial-3 (incentivized) are given in Figure 46, showing the shift of charging load from day-time to off-peak time.

73 Smart Charging Strategies and Technologies for Electric Vehicles Simulation-based study to evaluate the effects of E-mobility smart charging strategies
Figure 46: Charging behaviour without and with incentivisation (“Powered-Up-Electric-Nation-Brochure.pdf,” n.d.)
• Learning from Experience in the project: The most important learning is that flexibility in charging load is a possibility. However, without incentive, it needs more management to shift the evening peak. Time-of-use incentives and mobile apps make smart charging easy for EV owners that increase satisfaction.
• Conclusion: Project analysis concludes that the well-defined EV tariff structure involved with smart charging provides a cost-effective charging schedule for EV owners. It improves owners’ satisfaction and eliminates costly grid upgradation requirements.
Project analysis concludes that the well-defined EV tariff structure with smart charging provides a cost-effective charging schedule for EV owners. It improves owners’ satisfaction and eliminates costly grid upgradation requirement.

Smart Charging Strategies and Technologies for Electric Vehicles Simulation-based study to evaluate the effects of E-mobility smart charging strategies74
3.11.2 ELECTRIC NATION VEHICLE TO GRID PROJECT
• Duration of project: Jan 2020 to Jun 2022(Ongoing)
• Location: United Kingdom
• Partners/participants:
• Western Power Distribution (WPD) is the project Distribution Network Operator (DNO)
• CrowdCharge is leading the project
• DriveElectric is helping with the recruitment of trial participants
• EA Technology is modelling the network impact
• 100 EV owners
• Aim: Aim of the project is divided into objectives and are mentioned below (“Powered-Up-Electric-Nation-Brochure.pdf,” n.d.):
1. To study and explore the V2G smart charging impact on LV electricity network with actual end-users’ data.
2. To demonstrate V2G capability and manage the LV networks demand.
3. To examine the sophisticated dynamic bi-directional energy services based on vehicle battery storage from various energy suppliers and their impact on the LV infrastructure.
4. It also engages in recommendations of policy and commercial frameworks on V2G services.
• Benefit to EV participants and participating industries: The UK grid is focusing on low carbon technologies, and Electric Nation to Grid is one of the prime projects on the integration of EV in the grid. Increasing EVs have raised the power demand. This project manages the excess demand by charging the EV with smart charging in the local network.
Project contributes the following benefits to the consumer
• Participants will receive a V2G charger worth approximately £5,500 or 7637 USD to use for the duration of the trial and can own the charger with a transfer fee of £250 or 347 USD
• Active participants can earn rewards of up to the monetary value of £120 or 167 USD.
Benefits to Industry:
• DNOs can better understand V2G by involving up to five different energy suppliers in the project.
• It helps energy suppliers understand V2G energy services and their impact on DNO.
• The project develops a collaborative and cohesive market for all participants by showing the practical benefits of smart charging.
The project is currently in the participant recruitment and hardware installation phase, so the actual trial methodology and data are not available.
The UK grid is focusing on low carbon technologies and Electric Nation to Grid is one of the prime projects on integration of EV in the grid

75 Smart Charging Strategies and Technologies for Electric Vehicles Simulation-based study to evaluate the effects of E-mobility smart charging strategies
3.11.3 MILTON KEYNES COUNCIL: DOMESTIC ENERGY BALANCING EV CHARGING PROJECT
• Duration of Project: 2020 to 2022 (Ongoing)
• Location: Milton Keynes, Newport Pagnell, Olney
• Partners/participants:
• Milton Keynes Council
• Go Ultra Low Milton Keynes
• Office for low emission vehicle
• OLEV
• CrowdCharge
• 12 participants (V1G: 8, V2G: 4, stationary battery devices: 2)
• Aim of the Project: Through unidirectional smart charging (V1G) by controlling the charging power delivered, vehicle-to-grid charging (V2G), and home battery storage project tries to investigate the ways to balance the peaks of electricity use associated with charging electric vehicles at home (“Milton Keynes Council - Domestic Energy Balancing EV Charging Trial: V2G Hub | V2G Around the world,” n.d.).
The final aim is to use and manage these technologies to be available for EV owners to save money and reduce demand on electricity networks by balancing the load on the grid.
• Methodology: It will include pioneering technology for residential charging to perform intelligent bidirectional charging and discharging functionalities. This bidirectional charging will allow vehicle-to-grid and vehicle-to-home battery storage. The technology will exhibit V1G and V2G operations.
V1G:
• Only charges EV.
• It connects to the internet via home Wi-Fi.
• It has the advantage of cheap energy via dynamic pricing.
V2G:
• It includes the Bidirectional power flow, i.e., charging and discharging.
• It helps in balancing the local and global energy production and consumption considering the cost of electricity and greener energy.
Stationary Battery storage device:
• Larger internal or external wall mounted battery in the property.
• Preferable and beneficial to install alongside solar PV installations (to reduce early-evening peak).
Increasing EVs have raised the power demand. This project manages the excess demand by charging the EV with smart charging in the local network.

Smart Charging Strategies and Technologies for Electric Vehicles Simulation-based study to evaluate the effects of E-mobility smart charging strategies76
3.11.4 MY ELECTRIC AVENUE CHARGING PROJECT
• Duration of project: Jan 2013 and Dec 2015
• Location: United Kingdom
• Partners/Participants:
• EA technology
• Nissan
• Northern PowerGrid
• Ricardo
• Scottish and southern electricity networks
• Fleetdrive electric
• The University of Manchester
• Automotive comms
• Zero carbon futures
• De Montfort university
• 100 EV owners
• Aim: The project’s aim is divided into two categories: commercial and technical (Cross and Hartshorn, 2016).
• Technical aim:
• To understand the customer driving and EV charging habits and patterns.
• To trial the equipment implemented to mitigate the impact of EV charging.
• Commercial aim: To do all procurement related to the project by non-DNO (distribution network operator) to evaluate the extent to which third party involvement accelerates deployment for the project.
• Methodology: ESPRIT is an intelligent control box (hardware that can control the charging process) that is used for performing smart charging. It works on temporary load curtailment and monitors and controls the EV load of clusters of participating groups. It is capable of controlling and managing EV load on the local network during the stressed conditions of the grid. It has demand-side management capabilities to protect the grid from overloads.
• Learning from the project:
It was noted that approximately 70% of users charge their vehicle once a day
Externally controlling the charging does not affect the service experience of the customer
Low carbon technologies need to be promoted.
• Conclusion: Results and analysis conclude that the Esprit technology is successful in load curtailment at necessary events. The results also concludes that it prevents system overloading and eliminates the requirement of network upgrades.
Results and analysis conclude that the Esprit technology is successful in load curtailment at necessary events. It also concludes that it prevents system overloading and eliminates the requirement of network upgrade.

77 Smart Charging Strategies and Technologies for Electric Vehicles Simulation-based study to evaluate the effects of E-mobility smart charging strategies
3.11.5 THE PARKER PROJECT
• Duration of the project: August 2016 to July 2018.
• Location: Denmark
• Partners/Participants:
• DTU
• Nuvve
• Nissan
• Insero
• Enel X
• Groupe PSA
• Mitsubishi Corporation,
• Mitsubishi Motors Corporation
• Frederiksberg Forsyning
• 20EVs
• Aim: To demonstrate the EV’s capability for grid support operations. The project is aimed to provide frequency support services from the vehicle-to-grid and enhance the grid facilities with EVs. The project investigates grid scalability and reliability (“Parker_Final-report_v1.1_2019.pdf,” n.d.).
• Methodology: It performs frequency regulation services to the Danish grid. The configuration of the project network is shown in Figure 47.
Frequency response services from a cluster of EVs are divided into two sites.
• Test site:
• Denmark (Frederiksberg Forsyning V2G hub)
• 10 Nissan e-NV200 EVs and 10 Enel V2G chargers controlled by a Nuvve aggregator

Smart Charging Strategies and Technologies for Electric Vehicles Simulation-based study to evaluate the effects of E-mobility smart charging strategies78
Figure 47: System configuration in Parker project (“Parker_Final-report_v1.1_2019.pdf,” n.d.)
Figure 48: Requested and demanded power for providing frequency support service (“Parker_Final-report_v1.1_2019.pdf,” n.d. The project’s result in Figure 48 shows that the supply of requested power using V2G service from participating.
The project’s result in Figure 48 shows the supply of requested power using V2G service from participating.
The vehicle-to-grid operation is coupled with DC V2G chargers, and it demonstrates the possible scaling in seven different directions, as shown in Figure 49.
Table 11: Attributes for scaling the project in a different direction
Number ofCars
Services Duration
EV brand scaling Battery size scaling Scaling synchronous area
Information scaling

79 Smart Charging Strategies and Technologies for Electric Vehicles Simulation-based study to evaluate the effects of E-mobility smart charging strategies
The project is scaled in different directions, as shown in Figure 49. to capture realistic conditions.
The project’s experience: A lack of knowledge of EV owners is also an important factor to be considered while providing V2G as a grid support service.
1. Number of cars = 10+
2. Multiple servies = 3DK2 FCR-NDK1 FCR Primary RegulationDK1 - Secondary Regulation
6. Scrolling Synchronous AreasNardic gridContinental grid
3. Duration = 15 Days
(360 hours continuously operation)
4. Multiple car brands = 4
Nissan LeafNissan EvaliaMitsubishi OutlanderPSA iOn (1)PSA iOn (2)
7. Information gathering scaling
SYSVIEWFleetcarmaKuantic
5. Different battery sizes = 430 kWh24 kWh16 kWh12 kWh
(frederiksberg Forsyning)
Figure 49: Scalability of the project in a different direction (“Parker_Final-report_v1.1_2019.pdf,” n.d.)
• Conclusion: Results and analysis of the project conclude that V2G plays a significant role in grid support services. These services are in the form of active power support, reactive power support and integration of RE. Therefore, EV participants, DSO and TSO have revenue gain from V2G services. Battery degradation and lack of communication standardization are some of the technical challenges that need to be solved before implementing the framework on a large scale.
3.11.6 WINSMARTEV
• Duration of project: 1 October 2012 - 30 September 2016
• Location: University of California, Los Angeles
• Partners/Participants: University of California, Los Angeles (UCLA), Smart Grid Energy Research Centre (SMERC)
• Aim: This project aims to reduce energy costs and increase the stability of the local power system by managing the charging operations of EVs. It also demonstrates smart charging by remote monitoring and using WINSmartGRid (“UCLA Smart Grid Energy Research Center | SMERC,” n.d.).
• Methodology: It is a demonstration and R&D project under the collaboration of UCLA and SMERC for remote monitoring and control of EV charging through a smart communications network called WINSmartGrid™. The scope of research was to focus upon distributed storage technology and Ancillary Services. However, in addition to the above service, stochastic modelling of user behaviour is important.
Lack of EV owners’ knowledge is also an important factor while providing V2G as a grid support service.

Smart Charging Strategies and Technologies for Electric Vehicles Simulation-based study to evaluate the effects of E-mobility smart charging strategies80
A customized V2G box is provided to Los Angeles Water and Pump department to perform a constant 1 kW V2G power flow into the grid, and the demonstration setup is shown in Figure 50.
• Scope of research covers:
• Distributed storage: Distributed battery stores the energy and feeds it back to the grid at the required time.
• Load sharing control: In V2G operation, controlling load-sharing as per the EV rating is vital to avoid over and under-utilization.
• Ancillary services: The algorithm needs to be designed to provide ancillary service while keeping track of EV owners energy requirements.
• Conclusion: The project results and data provide various necessary directions for V2G services and load sharing to investigate and plan the large-scale roll-out of grid-integrated EVs in the region.
Figure 50: Project demonstration system (“UCLA Smart Grid Energy Research Center | SMERC,” n.d.)

81 Smart Charging Strategies and Technologies for Electric Vehicles Simulation-based study to evaluate the effects of E-mobility smart charging strategies
3.11.7 VEHICLE TO GRID DEMONSTRATION PROJECT
• Duration of Project: October 1, 2008 - December 31, 2010
• Location: University of Delaware Newark, Delaware, United States
• Partners/Participants:
• University of Delaware Newark
• AutoPort, Inc
• AC Propulsion
• 5 EVs
• Aim: The project aims to build, develop, and test vehicles with both Grid Integrated Vehicle (GIV) and V2G capabilities (Kempton et al., 2010).
• Methodology: Grid-integrated vehicles have built-in communication and control capabilities for simple and easy grid integrations. GIV is primarily designed as a transportation unit and has a low capacity of storage and charge-discharge capability. For building such a transportation specific and storage backup unit, the driving pattern is an essential factor. So, the project is focused on driving pattern analysis. A database of 500 vehicles with the one-second resolution is tracked for three years for driving pattern analysis.
• Topics covered under the R&D project:
• Analysis of US driving patterns
• Analysis of the market for EVs and V2G-capable EVs
• Development and testing of GIV components (in-car and in-EVSE)
• Interconnect law and policy
• Development and filing of patents
• Conclusion: Built 5 EVs with a 35kWh Li-ion battery with a maximum speed of 90mph. It has grid-integrated charge-discharge capacity at the rate of 19.2kW at 240AC voltage.
3.11.8 BLUE BIRD SCHOOL BUS PROJECT
• Duration of project: 2017-2020
• Location: California, US
• Partners/Participants:
• California Energy commission
• Con Edison
• NREL
• US Department of Energy and all others
• Six school buses
• Aim: The project’s objective is to demonstrate the V2G capability of school buses (“Blue Bird Introduces All-New Electric School Bus Solutions,” n.d.).
The project aims to build, develop, and test vehicle with both Grid Integrated Vehicle (GIV) and V2G capabilities

Smart Charging Strategies and Technologies for Electric Vehicles Simulation-based study to evaluate the effects of E-mobility smart charging strategies82
• Methodology: School buses are chosen wisely because school buses have fixed root and operation time that gives the exact energy demand for the travel. Additionally, school busses have adequate non-operating time (night, weekend, holidays and summer). Also, the batteries of school buses are sufficiently large to provide V2G services. The fixed energy demand, a large amount of non-operating, and adequate battery size promotes using school buses for the demonstration project. The primary model indicated that each bus might earn between 5000$ to 25000$ per year for providing grid support and executing the demonstration project.
The project is divided into two phases, viz, phase I and phase II.
Phase I:
In the first phase, six buses are retrofitted with the battery ratings as follows:
• 300 (Ah) lithium iron phosphate (LiFePO4) cells and each battery constitute 120 cells in the entire subsystem. So, the total capacity rating of the battery is 115 kilowatt-hours (kWh)
• For the V2G demonstration, two buses are provided with a bidirectional converter of 70kWh
Phase II:
Battery and inverter rating for demonstration in phase II is as follows:
• Up to a 155kWh battery (Lithium Nickel Manganese Cobalt Oxide battery);
• 150kWh bi-directional inverter
V2B/additional power delivery is also planned to be demonstrated in phase II.
• Conclusion of the project: The early stage of V2G is connected to several weaknesses and drawbacks, but there is a high potential for this technology (Lee et al., 2018). During summer, buses are not operational, so they can act as storage units and participate in V2G support that reduces the grid’s stress due to the high usage of air conditioners.
3.11.9 CHARGE TO PROJECT
• Project Duration: 1 Nov 2014 – Jan 2016
• Location: Toronto, Canada
• Participants/Partners:
• Ministry of Energy
• Toronto Hydro
• AddEnergies Technology
• FleetCrama
• AddEnergies
• 30 EV owner
• Aim: The project aims to demonstrate the feasibility of a system with an EV smart charging strategy and capture the limitations, EV load curtailment availability, and the response of EV owners to real load curtailments and incentive structure (Bauman et al., 2016).
Built 5 EVs with a 35kWh Li-ion battery with a maximum speed of 90mph. It has grid-integrated charge-discharge capacity at the rate of 19.2kW at 240AC voltage.

83 Smart Charging Strategies and Technologies for Electric Vehicles Simulation-based study to evaluate the effects of E-mobility smart charging strategies
Methodology: An EV local curtailment based smart charging is adopted to achieve the project objective. This smart curtailment considers three drivers’ preferences and grid conditions. For performing EV smart charging, FleetCrama’s connected car platform is used in the project. FleetCrama is a smart charging platform provider. It constitutes of four main components as follows:
FleetCrama data logger: It collects vehicle data by getting plugged into the vehicle’s diagnostic port and collects the battery state-of-charge (SOC), location coordinates, and charging/ power.
FleetCrama’s smart charging portal: It is a web portal where EV drivers provide driving preferences.
FleetCrama load management controller: It is a cloud-based controller that takes network information (maximum available power) and EV drivers’ preferences. Based on the data, an optimal curtailment schedule is fixed to satisfy the requirements of both stakeholders.
• Control pathway: It is a pathway to curtail the EV charging load on the charging station by connecting to the controller. In this project, two pathways are used: 1: AddEnergies Core and Level 2 EVSE 2. Tesla API for Tesla chargers permits FleetCrama load management controller to control charging of Tesla chargers.
Actual working and signal flow for smart charging using FleetCrama is shown in Figure 51.
Figure 51: Charge TO program smart charging provided by fleetCrama (Bauman et al., 2016)
Drivers’ preferences and grid data are taken using FleetCrama’s web portal to perform smart charging. The web portal has two different views as driver’s view and fleet charging view. Web portal view and functionalities are explained below and shown in Figure 52 and Figure 53.
The project’s objective is to demonstrate the V2G capability of school buses

Smart Charging Strategies and Technologies for Electric Vehicles Simulation-based study to evaluate the effects of E-mobility smart charging strategies84
Figure 52: FleetCrama’s fleet charging view (Bauman et al., 2016)
The driver’s view driver has three options to manage his charging and curtailment: 1) 24-hr opt-out point, which indicates that the driver is not ready to participate in smart chart charging via load curtailment; 2) Time Charge Is Needed (TCIN), indicates the controller that the battery must have got fully charged ; 3) SOC opt-out setting, using which the driver indicates to the controller to not perform load curtailment below specified SOC level.
In fleet charging view, the utility provides maximum available grid power value, at which auto curtailment of EV charging will start. This information is provided under the auto-curtailment threshold option. In addition to this option, it has a day load profile plot that gives information on the previous day’s load profile.
Figure 53: EV owners view of FleetCrama smart charging display (Bauman et al., 2016)

85 Smart Charging Strategies and Technologies for Electric Vehicles Simulation-based study to evaluate the effects of E-mobility smart charging strategies
Figure 54: Charging without overnight charging schedule (weekdays) (Bauman et al., 2016)
The charging data of EV drivers are collected for weekdays and weekends to understand the need and requirement of smart charging in terms of load curtailment. Overnight charging is not a focus of this project, so the EV charging of participants without scheduled overnight charging is captured and shown in Figure 54 for weekdays.
It shows that the available EV charging load need to be ready for curtailment during the evening time on weekdays and weekends. Therefore, the instantaneous load curtailment analysis is performed using driver’s preference data. This value shows that the capacity to shed EV charging load at the time of grid emergency and possible load shift reduces the local network’s peak load.
InstanteousEV load cuirtaliment = Total load - (EV charging under TCIN option + EV charging under 24hr opt out option)
Figure 55 and Figure 56 shows the averaged instantaneous load curtailment capacity per vehicle for weekdays and weekend, respectively.
Figure 55: EV charging load curtailment possibility for weekdays (Bauman et al., 2016)

Smart Charging Strategies and Technologies for Electric Vehicles Simulation-based study to evaluate the effects of E-mobility smart charging strategies86
Figure 56: EV charging load curtailment possibility for weekends (Bauman et al., 2016)
• The project has found two environmental benefits of smart charging:
– Improvement in renewable energy utilization
– Reduction in grid emissions.
The shift in EV charging load to the RE reach hours reduces over the generation of RE. In other words, it reduces the duck-curve phenomenon, which requires a high ramp-up rate during the evening peak period. The second benefit of grid reduction is achieved by reducing the added generation requirement by charging curtailment and EV load shift operation.
Up to this phase in the project, no incentives are provided to users for participating in smart charging. In the next phase, an incentivization of the participants is performed. These incentives are divided into three groups: 1) Control group, which will receive a fixed amount (40 USD) regardless of their smart charging option, 2) Count-up group, which allows participants to earn the rewards (starting from 0 USD) for lowering SOC opt-out setting, 3) Count-down group, in which the driver will lose the rewards (rewards starting from a fixed value of 50 USD) for higher SOC opt-out option setting. Figure 57 shows the pre-incentive and post incentive participants for different SOC opt-out ranges. It depicts that most participants used to set SOC threshold at 40-50% range before incentives. But after incentivizing, the majority of drivers go with the SOC settings of 0-9%.
0%-9% 10%-20% 20%-29%
SOC Auto Opt-Out Setting
30%-39% 40%-50%
Pre-Incentive Post-Incentive
2
12
1 1 1
4
2
10
3
Figure 57: SOC Auto opt-out charging behaviour before and after incentives (Bauman et al., 2016)

87 Smart Charging Strategies and Technologies for Electric Vehicles Simulation-based study to evaluate the effects of E-mobility smart charging strategies
• Findings and conclusion of the project: The project concludes that 70-80% of the charging load is shed at peak hours, but the algorithm ensures the battery will be fully charged for the next day’s first travel. Results also show that simple load curtailment and load shift allows smart charging to maintain grid constraints and reduce costly grid upgradation requirements. Incentivized smart charging improves load curtailment and increases instantaneous load curtailment capability.
• Experience from the project: The project’s main experience is that consideration of vehicle data before load curtailment is very important from the drivers’ point of view. Another learning from the project is that 24% of the participants do not wish for any compensation other than their vehicle’s data, and 44% wish for compensation below 20$/month. This shows that the value of threshold opt-out SOC and respective incentives are the main drivers in EV smart charging.
The project concludes that 70-80% of charging load is shed at peak hours, but the algorithm ensures the battery will be fully charged for the next day’s first travel.

Smart Charging Strategies and Technologies for Electric Vehicles Simulation-based study to evaluate the effects of E-mobility smart charging strategies88
3.10.10 LEICESTER CITY HALL OPERATION PILOT
• Duration of Project: 2017-2020
• Location: Leicester, U.K.
• Participants/partners:
• Hogeschool van Amsterdam: Jos Warmerdam
• Cenex Nederland: Esther van Bergen
• Aim: To demonstrate technical requirements and benefits of Vehicle to Building V2B technology (Bentley et al.,).
• Methodology: V2B is not implemented and investigated in the project because of the unavailability of required infrastructure and arbitrage cost exceeding the profit. In contrast, V2G, in the form of frequency regulation, receives an extra payment for frequency service.
The project decided to work on firm frequency response (FFR) because of the low-entry capacity requirement. FFR is available in two variants Dynamic firm frequency response (DFFR) and static firm frequency response (SFFR). The project participants agreed to respond to changes in frequency from 50 Hz to 49.7 Hz or 50.3 Hz and export energy for 30 minutes. The second type of response, DFFR, occurs at normal operating conditions. Participants of DFFR need to respond in 2 seconds to restore frequency to the optimal value of 50Hz. Ideally, this response should last for 10 seconds, but it goes until a few minutes in some cases. DFFR participants will be paid for ramp-up that happens by increasing energy import/vehicle charging and ramp-down by decreasing energy export/vehicle discharging.
A virtual carport is proposed with PV and EVs in the system due to the lack of equipment for V2B or V2G operation. It was investigated how EV charging matches available energy from the solar PV system. Simulation studies on virtual carports are performed from 1st to 29th March 2019.
The other aspect of the project is the detection of the charging behaviour of EVs using charging data. Here, clustering and decision tree algorithm is used for charging behaviour detection.
Learning from Experience:
• Background knowledge gathering is significant in the early phases of site selection and equipment setup.
• Consider extra costs and losses corresponding to equipment while deciding demonstrating system.
• Consider a realistic future scenario while choosing additional devices and pieces of equipment. The council has considered only Nissan Leaf fleets of 30 kWh battery or more for establishing a bidirectional vehicle-to-grid charger in this project.
• Check all necessary certifications of equipment and devices to avoid additional time delays.
• The most important learning is to first perform a cost analysis before starting to work on real projects.
Conclusion: DFFR - Dynamic Firm Frequency Response is profitable to perform after preferably considering battery degradation cost also.
The project participants agreed to respond to changes in frequency from 50 Hz to 49.7Hz or 50.3Hz and export energy for up to 30 minutes

89 Smart Charging Strategies and Technologies for Electric Vehicles Simulation-based study to evaluate the effects of E-mobility smart charging strategies

Smart Charging Strategies and Technologies for Electric Vehicles Simulation-based study to evaluate the effects of E-mobility smart charging strategies90
Though National Electric Mobility Mission Plan (NEMMP) 2020 laid down
the vision and roadmap for EV
penetration in India, the scheme could
not achieve the envisaged penetration
targets.

91 Smart Charging Strategies and Technologies for Electric Vehicles Simulation-based study to evaluate the effects of E-mobility smart charging strategies
AT CENTRAL LEVEL
Though National Electric Mobility Mission Plan (NEMMP) 2020 laid down the vision and roadmap for EV penetration in India, the scheme could not achieve the envisaged penetration targets. However, the various actions taken as per NEMMP guidelines has provided the kickstart for uptake of e-mobility and increased the awareness level among the consumers and industry players. There were several provisions enlisted under the policy, such as:
i. Permissive legislations: Legislations to permit usage of EVs in various areas.
ii. Operational regulations: Use of legislation framework and regulations focused on safety and emissions, vehicle performance standards, charging infrastructure standards, etc.
iii. Fiscal policy measures: Various trade-related guidelines for shaping the market, imports, and exports.
iv. Manufacturing policies: These are aimed at promoting EV investments. Specific policies are aimed at incentivizing EV manufacturing and early adoption through demand creation initiatives.
v. Schemes and pilot projects: To facilitate infrastructure developments.
vi. Research and development: Policies and guidelines to encourage R&D activities in the EV sector.
However, these provisions were not effectively implemented under the NEMMP scheme. After NEMMP, the Central Government launched the Faster Adoption and Manufacturing of (Hybrid &) Electric Vehicles in India (FAME) scheme in 2015 to enhance hybrid and EV technologies in India. The overall scheme (divided into two phases, I and II) is now proposed till FY24 (extended recently by the Central government by two years) to support the market development of EVs.
04Gap Analysis of Indian States EV Policies from Smart Charging Perspective
National Electric Mobility Mission Plan (NEMMP) 2020 laid down the vision and roadmap for EV penetration in India, the scheme could not achieve the envisaged penetration targets.

Smart Charging Strategies and Technologies for Electric Vehicles Simulation-based study to evaluate the effects of E-mobility smart charging strategies92
Although the FAME I scheme could not fully utilize the sanctioned funds, it has provided the steppingstone for the uptake of electric mobility in the Indian market. The scheme was successful in creating awareness and momentum for electric mobility in the market. FAME phase II was issued in March 2019, with an increased layout of INR 10,000 crore. with a two-year duration from FY 2019-20 to FY 21-22. This scheme is majorly aimed to leverage the buzz created by its first phase to create a platform for the e-mobility sector to flourish in the country. Some of the critical gaps in FAME II are listed below:
A. No incentive for vehicle scrappages/ Retro fitment allowance: FAME II provided incentives for new EV purchase only and does not provide any scrappage incentive to encourage ICE vehicle owners to exchange their vehicle for getting EVs. Also, it does not mention any retrofit allowance for converting existing ICE vehicles to EVs.
B. No mandate for EV adoption: There is no EV mandate provided under the FAME II scheme, which resulted in the following issues: (i) insufficient development of charging facilities, (ii) investment dilemma among vehicle manufacturers.
C. Absence of fee-bate concept: Conventional ICE-based automobiles are more comfortable for users since they have been in use over a long time. This inertia developed among the consumers restricts the transition to EVs. The absence of the fee-bate concept in the policy, which allows putting huge fees/penalty/cess/surcharge in using ICE vehicles, may restrict the EV adoption due to this reluctance of users to convert from ICE to EV.
D. Absence of subsidy for 4 W: FAME II provides subsidy only for public 4W and not for private 4 W, restricting the transition of ICE based cars to EV.
E. Requirement of re-certification: To be eligible for getting demand incentives, OEMs must undergo a re-certification process for conformity check to obtain a certificate of ‘FAME II India Phase II eligibility fulfilment’ from approved testing agencies in India. The requirement of this certificate each year to claim the subsidy creates unnecessary administrative issues for OEMs.
F. Requirement of Indigenous component: As per FAME II guidelines, OEMs must use a certain percentage of indigenous components to avail subsidy. There is a need for a well-developed supply chain of auto components to have many EVs on the road, the absence of which makes the requirement of indigenous components act as a barrier. This will cause issues in getting incentives and trigger an increase in prices of EVs if OEMs try to import such components to fulfil the requirement.
AT STATE LEVEL
Table 11 summarizes the gaps and implementation challenges in EV policies of different states. Each state has unique requirements and policy focus on smart charging, as described in this section

93 Smart Charging Strategies and Technologies for Electric Vehicles Simulation-based study to evaluate the effects of E-mobility smart charging strategies
Table 12: Summary of smart charging related gaps in Indian state EV policies1
Key Point DL WB KA OR MH AS AP KL BR UP GJ TN CH MP PB TL ML UK RJ
1Incentivses for public charging infrastructure
# × # × × × ×
2Mandate on DISCOMs for establishing charging infrastructure
× ~ ~ ~ × ~ ~ × ~ × × ~ × × ~
3Incentives for residential/workplace charging infrastructure
× × × × × × × × × × × × × ×
4Incentives for retrofitting of vehicles × × × × × × × × × × × × ×
5Purchase incentive for EVs × × × *
6Public awareness program × × × × × × × × ×
7Information on reimbursement of financial incentives
× × × × × × × × × × × ×
8 EV specific tariff × ×
9Land allocation/ concession for setting up the charging station
× × × × ×
10Focus on transitioning of government and public vehicles
× × × ×
11Provision of R&D
× × × × ×
1 ×: Key attribute is not addressed in respective state EV policy, : Key attribute is specified in the respective state EV policy, ~: DISCOM is not mandated but encouraged to invest in charging infrastructure, #: Provision for a capital subsidy for the cost of charger installation expenses to the selected Energy Operators * Incentives only for 3 wheelers
DL: Delhi, WB: West Bengal, KA: Karnataka, OR: Orissa, MH: Maharashtra, AS: Assam, AP: Andhra Pradesh, KL: Kerala, BR: Bihar, UP: Uttar Pradesh, GJ: Gujarat, TN: Tamil Nadu, CH: Chandigarh, MP: Madhya Pradesh, PB: Punjab, TL: Telangana, ML: Meghalaya, , UK: Uttarakhand, RJ: Rajasthan (Policy draft under final stage, and concept paper)

Smart Charging Strategies and Technologies for Electric Vehicles Simulation-based study to evaluate the effects of E-mobility smart charging strategies94
Table 13: Provisions related to smart charging
State Provision related to Smart Charging
Delhi
• Time-of-use special EV tariff is implemented for controlled charging
• To avail tariff concessions, chargers are expected to be connected to Central Management System with
relevant DISCOMs to facilitate smart charging
• The policy encourages the integration of RE generation. Energy Operator (EO) with captive RE generation
would be given power banking facilities with the DISCOMs in Delhi for one year
• EO are encouraged to accept payment via online modes such as mobile wallets, UPI, etc.
• Transport Department, Government of National Capital Territory of Delhi (GNCTD) shall be developing a
publicly-owned database of historical and real-time information of charging infrastructure
Karnataka • Time-of-use-based EV tariff structure is implemented
• Energy Supply Company (ESCOM) will examine the use of solar and low-cost renewable generation.
Maharashtra • ToU tariff structure applicable to public charging stations performs smart charging based on time of use.
Andhra Pradesh
• Allows third-party EV charging providers to set up renewable generation at their premises.
• Separate EV tariff based on peak and off-peak loading time is introduced.
• The policy stated that Andhra Pradesh Regulatory Commission would issue a regulation and tariff
structure for V2G power sale and ancillary support.
• Cloud charging features are encouraged to have digital payment, metering.
Kerala • Demand balancing in peak and off-peak hours using EV charging based on the time-of-use tariff
structure is introduced.
Bihar • Not mentioned
Uttar Pradesh • Uttar Pradesh Regulatory Commission is planning to introduce a special power tariff policy based on the
time-of-day sales of power for EVs.
Gujarat • As per the Gujarat Electricity Regulatory Commission (GERC) order, the tariff will apply to third-party-
owned EV charging stations.
Tamil Nadu
• EV charging service providers can install their own RE generation on their premises.
• Supply of renewable generation will be made available to charging stations at zero connection cost on a
preferential basis.
• TNERC will determine tariff for EV charging stations strictly less than 15% of the average supply cost.
Madhya Pradesh
• Energy Operator should accept charging payment via online modes as mobile wallet, UPI, etc.
• All charging stations should be linked to mobile applications to track, monitor, and record historical and
real-time data.
• Regulator commission of state will issue a tariff and regulation for V2G and ancillary support.
• Public charging stations should be synchronised and store data into a publicly owned database.
• Madhya Pradesh Urban Development and Housing Department (UDHD) has to create and maintain a
database of public charging infrastructure through DISCOMS.
• Net metering, digital transactions are encouraged via cloud-based charging features.
Punjab • The policy makes available the option of a time-of-day tariff if required in off-peak hours.
• Charging infrastructure operators using renewable generations are waived off from wheeling chargers.
Uttarakhand Not mentioned
Telangana
• Supply of renewable energy (solar roof-top) with net metering in own premises of charging station is
encouraged
• A special power tariff for EV charging stations will get applied.
Meghalaya • The state will provide attractive tariff for EV charging stations
While analysing the state EV policies from the viewpoint of smart charging, it was observed that the policies had specified some smart charging aspects, including communication and ICT technology. State-wise provisions related to smart charging is given in Table 13.

95 Smart Charging Strategies and Technologies for Electric Vehicles Simulation-based study to evaluate the effects of E-mobility smart charging strategies
State Provision related to Smart Charging
West Bengal
• A public owned big database will be developed to provide real-time information on charging infrastructure.
• Public charging points are synchronised and accessed freely from in-vehicle, mobile applications, and maps.
• UPI based online payment platform is introduced.
• Smart charging with V2G and integration of renewable energy generation will be explored.
Haryana • The policy encourages RE-based charging and swapping station
Chandigarh • Not mentioned
Odisha • OERC will issue a separate electricity tariff.
• Public charging stations will be encouraged to RE generation.
Table 14: Evaluation of charging infrastructure in different central and state policies
Not addressed4 Partially addressed3
Addressed up to reasonable extend2 Fully addressed1
Cent
re/S
tate
s
Com
mun
icat
ion
infras
truc
ture
Protocols/ Standards/
RegulationAg
greg
ate
smar
t
char
ging
Inf
rast
ruct
ure
with
CMS/
DIS
COM
Cond
ucive
elec
tricity
mar
ket
Inte
grat
ion
of
Rene
wab
le/d
istrib
uted
gene
ratio
n
Prov
ision
of o
nlin
e
paym
ent an
d ot
her
serv
ices
Adeq
uate
foc
us o
n
smar
t ch
argi
ng
Com
mer
cial
regu
latio
n
Tech
nica
l
regu
latio
n
Centre FAMEII 4 2 2 4 4 2 2 4
MOP: charging
guideline
4 2 1 4 2 4 2 4
CEA, DER
regulation
4 4 1 4 4 1 4 3
Delhi 3 1 3 2 2 2 1 2
Karnataka 4 1 3 3 1 2 4 3
Maharashtra 3 3 4 3 2 4 4 3
Andhra Pradesh 2 1 3 3 2 3 2 2
Kerala 4 1 4 3 3 4 4 3
Bihar 4 4 4 4 3 4 4 4
Uttar Pradesh 4 1 3 4 3 3 4 3
Gujarat 4 3 4 4 3 4 4 4
Tamil Nadu 4 1 2 4 3 2 4 3
Madhya Pradesh 3 1 3 3 3 2 2 2
Punjab 4 1 3 4 3 3 4 3
Uttarakhand 4 4 4 4 4 4 4 4
Telangana 4 1 3 4 3 3 4 3
Meghalaya 4 3 4 4 3 4 4 4
West Bengal 4 4 3 3 3 2 2 2
Haryana 4 4 3 4 3 4 4 4
Chandigarh 4 4 3 4 3 4 4 4
Odisha 4 3 3 4 3 3 4 3
*This analysis of state EV policies is conducted as of August 2021.

Smart Charging Strategies and Technologies for Electric Vehicles Simulation-based study to evaluate the effects of E-mobility smart charging strategies96
Analysis of the provisions related to smart charging in different state policies and the evaluation of charging infrastructure from the perspective of smart charging given in Table 13 and Table 14 depicts that the underdeveloped and incipient communication infrastructure and inadequate central management system infrastructure forms the major disparity between existing charging points and smart charging-enabled charging points. Immature regulation framework and conducive EV market to leverage the benefit of smart charging are other potential reasons for the lack of smart charging infrastructure. The overall state-wise policy modification requirement for smart charging, communication and ICT perspective is given below:
4.1 Interventions Required in Policies for Smart Charging, Communication, and ICT
1. DISCOMs should provide initial logistic support (viz, network information, access to required data, historical data of load, etc.) to implement a smart charging station.
2. Mandate Government offices/PSUs to establish smart charging stations in the respective region and offices.
3. Provide financial incentives and land support for establishing a smart charging station.
4. Subsidise the procurement of metering equipment, required software, and communication networks required for smart charging.
5. Issue reward points or green certificates to EV owners using the smart charging option and charging their vehicles for more than pre-set aggregated charging energy (kWh). Allow free parking at government parking spaces against green certificate and provide concession in electricity bill against reward points. It gives priority to government-owned public charging stations for eligible EVs.
6. Incentivise the solar PV installation and integration at home, society, public, and private charging stations.
7. Encourage local smart charging for using the locally controlled smart charging station by providing a small rebate on the monthly charging bills.
8. Mandate relevant agencies to create a complete package of required logistics, software, network service providers, and training material. If a charging station owner wishes to opt smart charging strategy, he could directly avail of this complete package and establish a smart charging station.
9. Provide special incentives for retrofitting older charging stations and fuelling stations with smart charging stations. Exempt the retrofitted stations from availing support provided in point 3.
10. R&D funds should be allotted for research in the field of Vehicle-to-Grid (V2G) integration for national transportation, EV, and grid scenario.
11. Run awareness programs to spread the benefits of EV, state’s EV policy, and smart charging in reducing electricity bills and environmental welfare.
12. Prioritise the approval, land allocation, and incentives to smart charging stations over dumb charging stations.
13. Mandate to establish and retrofit all the charging stations in government spaces and commercial, public charging stations to be smart, based on a time-of-use tariff.

97 Smart Charging Strategies and Technologies for Electric Vehicles Simulation-based study to evaluate the effects of E-mobility smart charging strategies
14. Allot incentives to purchase smart charging software and services such that it attracts the charging station operator.
15. Security standards should be structured or adopted from any standard organisation to safeguard the user’s, charging station’s, metering, and sensing equipment’s data to maintain users’ privacy and charging stations to avoid cyber threats on users or charging stations.
16. Communication network protection standards should clearly mention protecting the data while communicating over the network.
17. Investigation of vulnerable nodes in the system must be done regularly.
18. Grant R&D projects to investigate and develop modern information and communication technology (ICT) based integration and smart charging techniques for EV ecosystem in the presence of EV loads, smart grid, renewable generation, and digital billing.
19. Introduce smart charging and ToU incentive for residential EV customers. In this scheme, eligible customers will get an instant rebate of the appropriate amount for participating in this smart charging such that respective residential customers get a charge at a lower price as per time-of-use according to availability of cleaner and cheaper energy (Alternative Fuels Data Centre: Smart Charging and Time-of-Use (TOU) Incentives - Orange & Rockland Utilities (O&R)).
20. Allow private players to provide EV owners and fleet operators special offers for buying and participating in their smart charging using ToU or any other strategy.
21. Incentivise eligible EV customers for participating in various pilot projects and case studies in due course of time (Alternative Fuels Data Centre: Plug-In Electric Vehicle (PEV) Charging Study Incentive - Tacoma Public Utility (TPU)).


PART- B Technical review of various EV smart charging strategies

Smart Charging Strategies and Technologies for Electric Vehicles Simulation-based study to evaluate the effects of E-mobility smart charging strategies100
The charging strategy is selected based on the computational and communicational infrastructure. Computational infrastructure is related to arithmetic or logical processing units viz. CPUs and central processors whereas communicational infrastructure are the devices or networks used for communication of various needed information or data.

101 Smart Charging Strategies and Technologies for Electric Vehicles Simulation-based study to evaluate the effects of E-mobility smart charging strategies
EV smart charging is necessary to manage the charging demand with the available grid infrastructure and generation capabilities. It plays a vital role in achieving different objectives, such as cost minimization, loss minimization, congestion management, grid support and grid stability, depending on the type, preferences, and required infrastructural and computational capabilities of consumers. Designated charging strategies are mostly categorized based on the location of an EV charging station rather than the type of EVs in particular. The primary reason for using a smart strategy is that it provides an opportunity to use optimized charging considering grid parameters and the owner’s choice. Another reason for using these strategies is that the need for infrastructural upgradation can be reduced, delayed, and the cost for additional mandatory infrastructure upgradation can be recovered quickly. The electricity tariffs for EV charging are often based on time-of-use or dynamic pricing. Based on the pricing, the local charging strategy uses a time-of-use type of tariff, whereas the other strategies use dynamic or time-of-use tariffs.
EV charging particularly has three stakeholders: the system operator, the EV owner, and the aggregator defined in section 2.2 (Wang et al., 2016) in this report. The aggregator is a coordinator between the system operator and EV owner/user. Its role is to charge the EVs so that the
system operator can maintain the key operational network parameters within an allowable range, while optimising the charging cost for EV owners. Each stakeholder has its desired objectives, and smart charging is the way to find the best solution considering all requirements and constraints. Figure 58 provides a basic structure of smart charging strategies considering the stakeholders involved, smart charging objectives, strategies, and the location.
05Introduction to Smart charging approaches and strategies
The charging strategy is selected based on the computational and communicational infrastructure
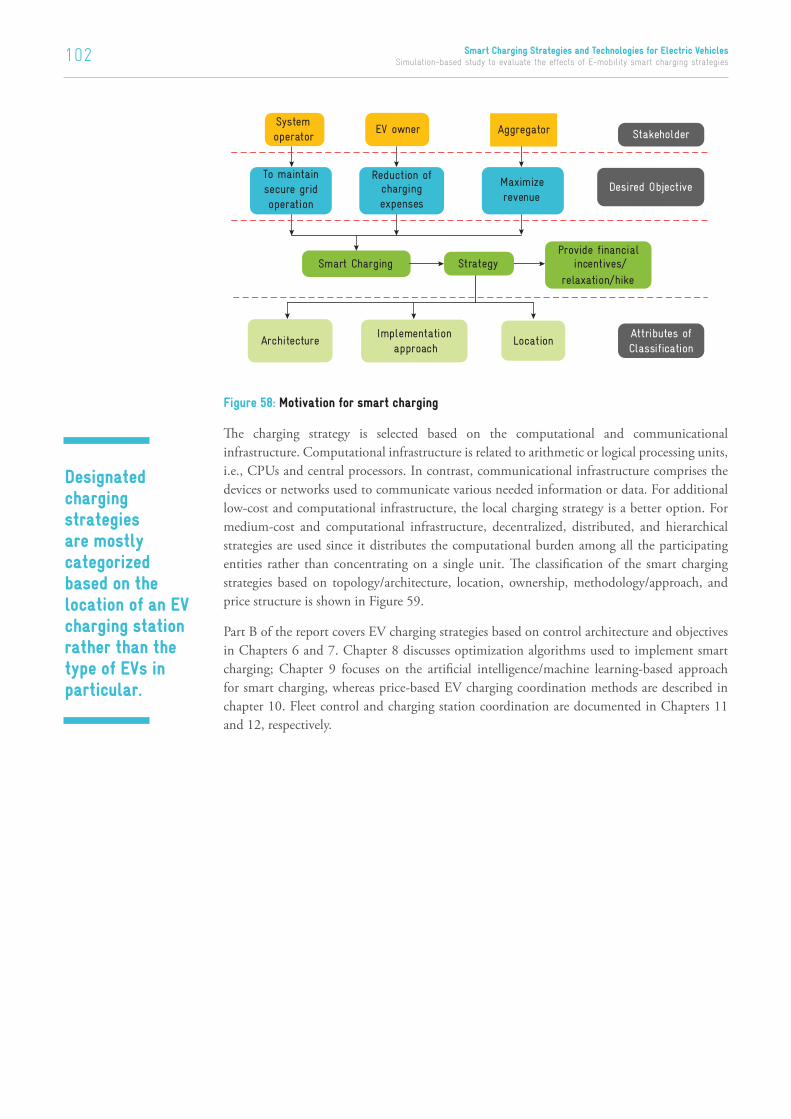
Smart Charging Strategies and Technologies for Electric Vehicles Simulation-based study to evaluate the effects of E-mobility smart charging strategies102
System operator
EV owner Aggregator
To maintainsecure gridoperation
Reduction ofchargingexpenses
Maximize revenue
Smart Charging Provide financial
incentives/relaxation/hike
ArchitectureImplementation
approachLocation
Stakeholder
Desired Objective
Attributes ofClassification
Strategy
Figure 58: Motivation for smart charging
The charging strategy is selected based on the computational and communicational infrastructure. Computational infrastructure is related to arithmetic or logical processing units, i.e., CPUs and central processors. In contrast, communicational infrastructure comprises the devices or networks used to communicate various needed information or data. For additional low-cost and computational infrastructure, the local charging strategy is a better option. For medium-cost and computational infrastructure, decentralized, distributed, and hierarchical strategies are used since it distributes the computational burden among all the participating entities rather than concentrating on a single unit. The classification of the smart charging strategies based on topology/architecture, location, ownership, methodology/approach, and price structure is shown in Figure 59.
Part B of the report covers EV charging strategies based on control architecture and objectives in Chapters 6 and 7. Chapter 8 discusses optimization algorithms used to implement smart charging; Chapter 9 focuses on the artificial intelligence/machine learning-based approach for smart charging, whereas price-based EV charging coordination methods are described in chapter 10. Fleet control and charging station coordination are documented in Chapters 11 and 12, respectively.
Designated charging strategies are mostly categorized based on the location of an EV charging station rather than the type of EVs in particular.

103 Smart Charging Strategies and Technologies for Electric Vehicles Simulation-based study to evaluate the effects of E-mobility smart charging strategies
Com
mer
cial
build
ing
Cent
raliz
ed
Line
ar
regr
ession
Decision
tree
sRa
ndom
fo
rest
Supp
ort se
ctor
m
achi
neK-
mea
ns
neig
hbor
K-m
eans
cl
uste
ring
Gaus
sian
m
ixtu
re m
odel
Kern
el d
ensity
ex
timat
or
Non
-coo
pera
tive
Coop
erat
ive
Supe
rvised
Uns
uper
vise
d
Wor
kpla
ceHig
hway
s
Dece
ntra
lized
Dist
ribu
ted
Hiera
rchi
cal
Loca
l Hom
eW
orkp
lace
Hig
hway
corrid
ors
Com
mer
cial
publ
ic s
pace
s (m
alls
, cha
rgin
g st
ation, b
us
depo
t, et
c.)
Privat
ePu
blic
EV S
mar
t Ch
argi
ng S
trat
egie
s
Loca
tion
Ower
ship
Met
hodo
logy
Price
mec
hani
smOb
ject
ive
Topo
logy
Com
mer
cial
build
ings
Hom
eBu
sde
pot
Dete
rmin
istiv
eHeu
rist
icGa
me
theo
ryAI
/ML/
DL
Rollin
g ho
rizo
n he
uristic
al
gorith
m
Sequ
entia
l qu
adra
tic
Prog
ram
min
g
Gene
ticAl
gorith
mPa
rticle
swar
m
optim
izat
ion
Artif
icia
l Im
mun
e Sy
stemTim
e of
use
Real
tim
eCr
itica
l pe
ak
pricin
gPe
ak reb
ate
Char
ging
cos
t m
inim
izat
ion
Load
lev
elin
gVo
ltag
e re
gula
tion
Max
imizat
ion
of
RE u
tilliz
ation
Aneillar
y su
ppor
t se
rice
sPo
wer
los
s re
duct
ion
Line
ar
Prog
ram
min
gQu
adra
tic
Prog
ram
min
gDy
nam
icPr
ogra
mm
ing
Mixed
int
eger
no
nlin
ear
prog
ram
min
g
Mixed
int
eger
lin
ear
prog
ram
min
g
Conv
esop
timizat
ion
Figu
re 5
9: C
lass
ifica
tion
of
Smar
t Ch
argi
ng S
trat
egie
s ba
sed
on d
iffer
ent
attr
ibut
es

Smart Charging Strategies and Technologies for Electric Vehicles Simulation-based study to evaluate the effects of E-mobility smart charging strategies104

105 Smart Charging Strategies and Technologies for Electric Vehicles Simulation-based study to evaluate the effects of E-mobility smart charging strategies
06EV Charging Strategies Based on Control Architecture
EV charging strategies can be categorized based on the control architecture of smart charging, which can be divided into five categories: centralized control, decentralized control, distributed control, hierarchical control, and local control. The network operator, aggregator, and EV owners are directly involved in almost all the strategies, except the local strategy where the EV user is primarily involved. The different control architecture schemes for smart EV charging are described below:
6.1 Centralized Control Based StrategyIn this strategy, the aggregator decides the pattern for EV charging within its contract by considering the system operator’s constraints and the charging energy requested by the EV owner. As shown in Figure 60, the information signal for the energy request from the owner flows from the EV owner to the aggregator (Nimalsiri et al., 2020). The aggregator’s role in the strategy is to maintain the system while fulfilling the energy demand of the EVs. All the charging decisions are taken by the aggregator, which entails the requirement of higher computational power. To quickly address the energy requirement of the EVs, the strategy requires high-bandwidth communication.
In all the EV charging strategies mentioned in Figure 59, the grid operator allots the charging capacity to an aggregator as per the charging requests from aggregators and available power supply. The decision signal always flows from grid operator to aggregator and information signal from aggregator to system operator. In the early developing stages of the EV ecosystem, the system operator plays the role of the aggregator due to the absence of an active aggregator.
In the early developing stages of EV ecosystem, system operator plays the role of aggregator due to the absence of an active aggregator.

Smart Charging Strategies and Technologies for Electric Vehicles Simulation-based study to evaluate the effects of E-mobility smart charging strategies106
Chapter 6. EV Charging Strategies Based on Control Architecture EV charging strategies can be categorized based on the control architecture of smart charging, which can
be divided into five different categories: centralized control, decentralized control, distributed control,
hierarchical control, and local control. The network operator, aggregator, and EV owners are directly
involved in almost all the strategies, except the local strategy where the EV user is primarily involved. The
different control architecture schemes for smart EV charging are described below:
6.1 Centralized Control Based Strategy In this strategy, the aggregator decides the pattern for EV charging within its contract by considering the
system operator's constraints and the charging energy requested by the EV owner. As shown in Figure 60,
the information signal for the energy request from the owner flows from the EV owner to the aggregator
(Nimalsiri et al., 2020). The aggregator's role in the strategy is to maintain the system while fulfilling the
energy demand of the EVs. All the charging decisions are taken by the aggregator, which entails the
requirement of higher computational power. To quickly address the energy requirement of the EVs, the
strategy requires high-bandwidth communication.
In all the EV charging strategies mentioned in Figure 59, grid operator allots the charging capacity to an
aggregator as per the charging requests from aggregators and available power supply. The decision signal
always flows from grid operator to aggregator and information signal from aggregator to system operator.
In the early developing stages of EV ecosystem, system operator plays the role of aggregator due to the
absence of an active aggregator.
EV
Aggregator
Information signal
Decision signalInformation signal
Figure 60: Centralized control strategy
Figure 60: Centralized control strategy
The controlling unit in the centralized control does not permit the plug-and-play mechanism, which might discourage the owners due to the lack of assurance on immediate starting of EV charging. The decentralized control architecture overcomes the issue of uncontrolled charging from the EV owner’s perspective. The advantages and disadvantages of centralized control architecture are listed below:
Advantage
Disadvantage
1. Facilitate direct control on global network constraints.
2. Find an optimal solution considering all the stakeholders.
3. Take care of faults and congestion in the system.
1. Affects the complete charging system if a fault occurs on the central unit.
2. Less flexible
3. Relatively low reliability
6.1.1 CENTRALIZED EV CHARGING COORDINATION
In this type of strategy, all EVs are coordinated via a central unit. The main objective of the aggregator as the central unit is to optimize the charging schedule and push the system towards a global optimum. In a central coordination scheme, all the participants are contractually bound to an aggregator. This central entity pursues to make the system achieve the global optimal value considering system constraints specified by the distribution system operator and individual EV owners. In this coordination strategy, the aggregator controls the value of the charging power. This optimal value of charging power varies based on the system constraints (Gonzalez Vaya and Andersson, 2012) and the cost of electricity (Gan et al., 2013). As mentioned in the following representative cases, the charging power depends greatly on the objective function and the associated constraints.
The objective function, in this case, can be the minimization of charging cost by considering the constraint of maximum available power from the system operator. The optimal solution of the problem schedules the lowest amount of charging power/energy at daytime and maximizes the amount of charging power/energy at night-time after the evening peak.
The objective function, in this case, can be charging cost minimization while considering the maximum utilization of renewable energy. The problem solution provides an optimal schedule for the maximum charging power during daytime when RE generation is higher (due to solar PV) and less charging power at night-time.
Case 1:
Case 2:
107 Smart Charging Strategies and Technologies for Electric Vehicles Simulation-based study to evaluate the effects of E-mobility smart charging strategies
The objective, in this case, can be minimization of the distribution transformer losses and its loading considering voltage profile and line loading as a constraint. The optimal solution, in this case, schedules the higher amount of charging power after the daytime peak and lower charging power for the peak load period. The same pattern of charging power is repeated in the evening time such that during the evening peak period, the charging power is low, and after the peak period ends, it is comparatively high.
From the above three example cases, it is clear that the central unit executes the optimization problem and schedules the EV charging in terms of varying values of charging power. It validates the fact that the central level EV coordination determines the optimal global solution. The optimal global solution in EV smart charging context is the best EV charging schedule that satisfies objective function and maintains constraint parameters within bounds. The central coordination among the EVs is performed in particular time slots, which varies in different networks. Centralized EV coordination is again classified based on the time of performing the optimization. Day-ahead optimization is the first type in that central unit that coordinates EVs a day before the actual scheduling. Based on day-ahead scheduling, the system operator can conveniently dispatch the power in a flexible manner. The second type is the real-time EV coordination which coordinates EVs considering the roaming of EVs and deviation of EVs from their schedule and uncertainty in the EV charging time.
The charging schedule is prepared based on network constraints and local parameters. For coordination of the EV charging at the central level, fast communication infrastructure is required. The central coordination for EV charging can be achieved through different methods, such as fuzzy control, model-predictive control, different optimization methods, and ML/AI/data-driven methods. Centralized EV coordination can further be differentiated based on the smart charging objective and optimization constraints. In the following subsection, the centralized control strategy is further described in detail.
6.1.2 CENTRALIZED CONGESTION MANAGEMENT
Distributed energy resources like EVs can potentially support and stress the grid during periods of peak demand. For example, suppose EV charging is not coordinated while considering grid constraints. In that case, there could be adverse impacts on the grid in terms of overloading the system and line congestion due to the peak overlap of residential and EV charging load. Coordinated EV charging as per grid requirement can support grid stability and avoid/minimise line congestion, thereby reducing the stress on the grid. In one of the coordinated charging strategies, EV charging is shifted to off-peak hours and energy-rich generation hours such that power flow through the lines does not violate the line thermal rating. Further details on congestion management are discussed in (Hu et al., 2014).
Case 3:
The central coordination for EV charging can be achieved through different methods, such as fuzzy control, model-predictive control, different optimization methods, and ML/AI/data-driven methods.

Smart Charging Strategies and Technologies for Electric Vehicles Simulation-based study to evaluate the effects of E-mobility smart charging strategies108
Figure 61: Network architecture of low voltage distribution system (Hu et al., 2014)
In (Hu et al., 2014), the coordination between distribution system operator (DSO) and fleet operator (FO) or aggregator has been used to handle the congestion issue. Distributed grid capacity market has been used for congestion management. Further, the study combines the day-ahead electricity market and the state of the distribution grid to minimize congestion in the system.
The network architecture used in the study is shown in Figure 61, where there is an established bidirectional information flow between the distribution market operator and the electricity spot market with the fleet operator or aggregators. FO and EVs are also connected through bidirectional information flow and unidirectional control flow from the former to the latter.
The market-based congestion approach uses costs associated with controlled power dispatch and the desired power. The objective function for congestion management is expressed as cost minimization between the cost of controlled power and the cost of required power, as shown in 0 1.
min , , − ,
Ck,i denotes the weight factor associated with the power difference. A higher Ck,i represents smaller power differences. Pk,i
E is Power requirements of EVs of each FO in each time slot. ~
k,iP E is the controlled power variable decided by considering the distribution capacity of the system at the respective time slot. The constraint condition for controlling the power within the distribution power capacity is given in 0 2.
, ≤ ( )
Pcap is the aggregated power capacity of fleet operators. The problem formulated above is convex in nature. Hence, it is transferred into Partial Lagrangian problem in 0 3, due to which the centralised problem is transformed into a decentralised format using shadow price of Langrangian multiplier γ(i).
= min , , − , + ( ) , − ( )
Coordinated EV charging as per grid requirement can support grid stability and avoid/minimise line congestion, thereby reducing the stress on the grid.

109 Smart Charging Strategies and Technologies for Electric Vehicles Simulation-based study to evaluate the effects of E-mobility smart charging strategies
This optimisation problem is solved using the sub-gradient method. The flowchart of the proposed method with shadow cost is shown in Figure 62. It shows that the initial value of the shadow price is zero, and the algorithm continues until the shadow price limits fall below zero. Based on the updated shadow price in each iteration, the charging profile is also updated.
Yes
No
Initial dataPredicted
hourly spot price
Energy requirement per EV per FOMarket price=predicated spot price+shadow price; shadow
price (initial)=0.
Aggregated charging plan generation of FOs
Subgradient method based distribution grid congestion management
Shadow price<0
End
Figure 62: Flowchart of the proposed method (Hu et al., 2014)
A case study is performed considering sixty householders connected to the feeder, out of which 60% of households have EVs integrated and connected with FO1 and FO2 (Hu et al., 2014). Figure 63 shows the spot price curve of a day that indicates that the electricity prices are low during morning hours compared to other times.
Figure 64 shows the energy schedule for charging FOs and the demand of 18 customers connected to FOs. It can be observed that the aggregated demand of individual FOs is concentrated in the daytime. It depicts that most of the charging is scheduled during the early morning because of low spot prices considering system capacities and eliminating line congestion.
Figure 63: Spot price curve of a day (Hu et al., 2014)
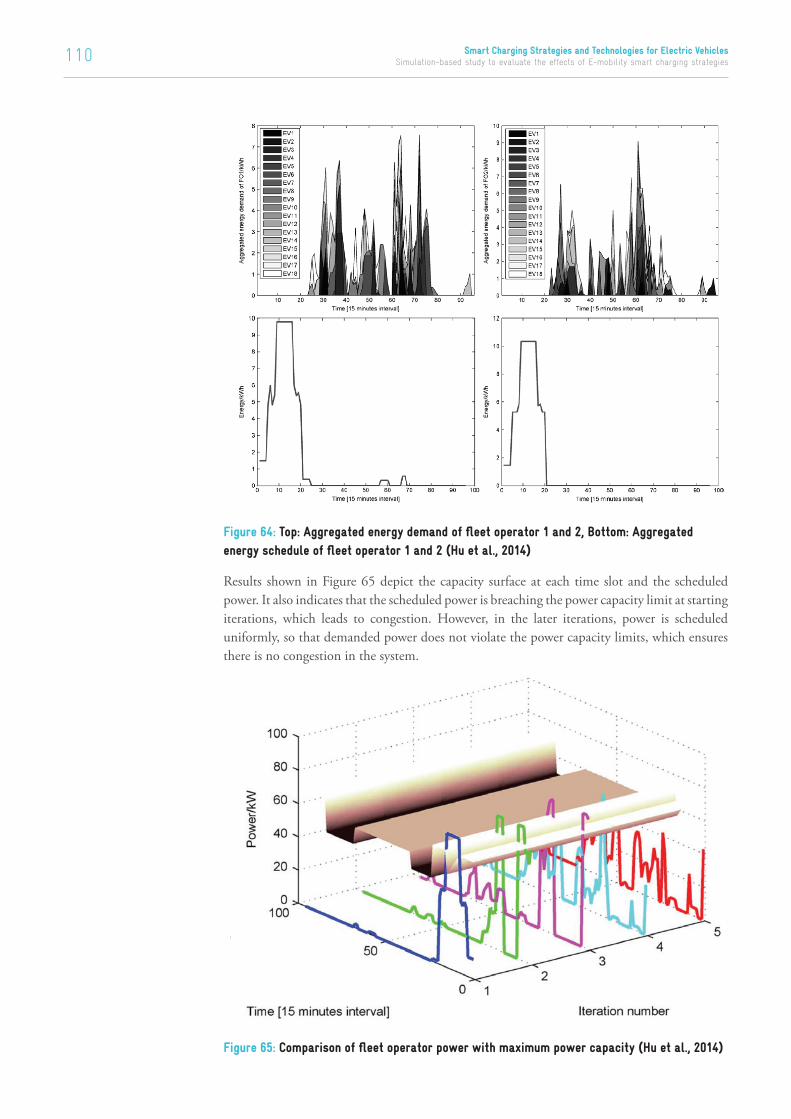
Smart Charging Strategies and Technologies for Electric Vehicles Simulation-based study to evaluate the effects of E-mobility smart charging strategies110
Figure 64: Top: Aggregated energy demand of fleet operator 1 and 2, Bottom: Aggregated energy schedule of fleet operator 1 and 2 (Hu et al., 2014)
Results shown in Figure 65 depict the capacity surface at each time slot and the scheduled power. It also indicates that the scheduled power is breaching the power capacity limit at starting iterations, which leads to congestion. However, in the later iterations, power is scheduled uniformly, so that demanded power does not violate the power capacity limits, which ensures there is no congestion in the system.
Figure 65: Comparison of fleet operator power with maximum power capacity (Hu et al., 2014)

111 Smart Charging Strategies and Technologies for Electric Vehicles Simulation-based study to evaluate the effects of E-mobility smart charging strategies
6.2 Decentralized Control Based Strategy In decentralized control architecture, the EV owners decide EV charging. Simultaneously, the aggregator/system operator indirectly tries to influence the decision of the EV owners by offering incentives, varying electricity prices, potential revenue etc. (Gan et al., 2013). As shown in Figure 66, the information signal carries the aggregator’s real-time prices dataset to control the EV charging indirectly. It requires less computational power because of the shift in the decision-making entity from the aggregator to the individual EV owner. This control architecture provides a plug-and-charge facility to the users, and it is relatively popular among EV customers. However, unlike the centralized control architecture, the decentralized charging approach does not guarantee the global optimum solution for the system.
Advantage
Disadvantage
1. It facilitates a simple plug and charge mechanism.
2. Charging system will continue working even if a fault occurs at the central level.
3. Relatively higher overall reliability.
1. Unable to accommodate network constraints in charging decisions.
2. It does not guarantee the optimal solution.
3. It does not allow direct control of charging power, which influences the system stability.
The limitation of system stability issue in the decentralized control is addressed in distributed control.
The limitation of system stability issue in the decentralized control is addressed in distributed control.
EV
Decision signal
AggregatorDecision signalInformation signal
Figure 66: Decentralized control strategy
6.2.1 Charging Coordination Via Non-Cooperative Games In practice, many EV participants try to adopt a strategy to maximize their profit by minimizing the
electricity cost. However, it does not guarantee the global minimal electricity cost compared to other
participants. Such non-cooperative strategy cannot maintain the grid requirement and may lead to grid
overloading. A game theory approach is introduced in (Yanni Wan et al., 2021), which considers this
adverse effect of an individual strategy setting and uses the information of all the participants' strategy to
find the global optimal solution. Based on the concept of considering an individual participant’s strategy in
the problems space, this game theory approach is divided into two methods.
The first approach is cooperative game theory. All participants decide their strategy mutually to reach the
optimal solution and for the system to reach the global optimal position. Once the global and optimal
strategy is defined, the system rests in the global state until the next move from any participant. In this
method, a deviation of one participant from its optimal strategy changes the global optimal.
The second approach is the non-cooperative game theory. In this case, every participant is free to decide its
strategy to obtain a personal profit. In addition to this, a participant considers the strategy of the other
players as well. As all the participants decide their strategy considering the other participants' strategy, the
system will reach a state of equilibrium called Nash equilibrium. At the Nash equilibrium point, a deviation
of any participants from its strategy does not affect the optimal solution of the system (Zhao et al., 2020).
The non-cooperative game theory approach exceedingly resembles the EV charging problem's actual nature
considering both EV charging problem strategies (Y. Wan et al., 2021).
Figure 66: Decentralized control strategy
6.2.1 CHARGING COORDINATION VIA NON-COOPERATIVE GAMES
In practice, many EV participants try to adopt a strategy to maximize their profit by minimizing the electricity cost. However, it does not guarantee the global minimal electricity cost compared to other participants. Such a non-cooperative strategy cannot maintain the grid requirement and may lead to grid overloading. A game theory approach is introduced in (Yanni Wan et al., 2021), which considers this adverse effect of an individual strategy setting and uses the information of all the participants’ strategies to find the global optimal solution. Based on the concept of considering an individual participant’s strategy in the problems space, this game theory approach is divided into two methods.
The first approach is cooperative game theory. All participants decide their strategy mutually to reach the optimal solution and for the system to reach the global optimal position. Once the global and optimal strategy is defined, the system rests in the global state until the next move from any participant. In this method, a deviation of one participant from its optimal strategy changes the global optimal.
It requires less computational power because of the shift in the decision-making entity from the aggregator to the individual EV owner.
Smart Charging Strategies and Technologies for Electric Vehicles Simulation-based study to evaluate the effects of E-mobility smart charging strategies112
The second approach is the non-cooperative game theory. In this case, every participant is free to decide its strategy to obtain a personal profit. In addition to this, a participant considers the strategy of the other players as well. As all the participants decide their strategy considering the other participants’ strategy, the system will reach a state of equilibrium known as Nash equilibrium. At the Nash equilibrium point, a deviation of any participants from its strategy does not affect the optimal solution of the system (Zhao et al., 2020).
The non-cooperative game theory approach exceedingly resembles the EV charging problem’s actual nature considering both EV charging problem strategies (Y. Wan et al., 2021).
In the actual EV charging problem space, EV owners are the participants. The aggregator is a controlling agent that tries to push the system towards a global optimal equilibrium point in both cooperative and non-cooperative approaches. The role of the aggregator is different in both methods. In the cooperative game theory approach, the aggregator’s role is to gather the information of an individual’s strategy and communicate them an optimal strategy, which will lead towards the global optimal solution (Shakerighadi et al., 2018). In the non-cooperative game approach, the aggregator tries to indirectly influence the participants’ strategy so that the system reaches the Nash equilibrium.
In a real charging scenario, participant’s behaviour varies all the time, so the non-cooperative approach is considered a preferable option (Tan and Wang, 2016), (Wan et al., 2020), (Zhao et al., 2020) to ensure that the behaviour of individual participant does not affect the equilibrium of the system. While deciding the actual strategy for EV charging, two scenarios, viz., a large EV population and infinite EV population, need to be taken into special attention to meet the ideal condition of the charging scenario. These conditions are modelled mathematically in the literature (Wan et al., 2020), (Zhao et al., 2020).
6.2.1.1 Decentralized Charging Coordination of Large EV Population
High networking and computation power are required in a centralized strategy that may have problems in gaining the acceptance of EV owners, so the decentralized strategy is majorly implemented in the literature (Zhao et al., 2020). Each player (EV) tries to minimize its own cost without cooperating with others in actual charging conditions. This scenario is modelled as a non-cooperative game problem. When players adopt the strategy without considering others’ strategies, the system will reach a suboptimal point. To find the optimal solution using a non-cooperative game, each player has to decide on its optimal strategy considering all the other players’ strategies. In this strategy, the decision for charging is taken by the EV. Hence, the non-cooperative decentralized charging strategy is applied.
Decentralized charging based on fixed prices or dynamic prices will not give an optimal solution. For making this decentralized charging an optimal solution, a non-cooperative game strategy is used as a local controller to find the optimal solution for a large EV population (Ma et al., 2016). In this approach, EV owners take charging decisions in a decentralized manner. An aggregator tries to influence the charging strategy of the participants and drag the system towards Nash equilibrium.
A decentralized non-cooperative game approach optimizes the system to achieve different stakeholders’ objectives. Cost minimization, valley filling, and load levelling are the main objectives achieved using the decentralized non-cooperative game theory approach. In some cases, utility plays the role of an aggregator. The influencing element in the decentralized non-cooperative game approach is electricity cost.
Decentralized charging based on fixed prices or dynamic prices will not give an optimal solution.
A decentralized non-cooperative game approach optimizes the system to achieve different stakeholders’ objectives.

113 Smart Charging Strategies and Technologies for Electric Vehicles Simulation-based study to evaluate the effects of E-mobility smart charging strategies
6.2.1.2 Decentralized Charging Coordination of Infinite EV Population System
As mentioned above, an individual EV updates its strategy considering the population’s average strategy by averaging all other participants’ strategies. In an ideal case, a control strategy should work for an infinite EV population. However, when infinite EVs are present in the system, the effect of an individual EV strategy on the average EV strategy will be negligible. This negligible change in average charging strategy due to deviation in any EV’s charging strategy will lead to no variation in the individual charging strategy. In such a situation, local optimal strategies control the Nash equilibrium when the local charging strategy equals the common average charging. The average of all the charging strategies is equal to the common charging strategy. From the first look at the non-cooperative algorithmic concept, it is apparent that it will be time-consuming because of the required updates. However, in the actual procedure of finding Nash equilibrium, simultaneous strategy update of individual Evs based on the average charging strategy of other Evs reduces execution time.
The following steps describe the approach of this particular decentralized non-cooperative approach:
1. Divide the infinite population into small groups and collect the information of the average strategy of the groups.
2. Individual EV in a group of ‘N’ EV implements the individual best strategy to find the optimal solution
3. Update the strategy of individual EV by the influence of the average strategy of the subpopulation group
4. Repeat steps 2 and 3 till the strategies stop updating
5. Repeat steps 2, 3, and 4 for all subpopulation groups successively.
For the application of a decentralized non-cooperative strategy for an infinite EV population, Nash equilibrium is iteratively computed. The individual EV charging strategies are allowed to update the best possible ones for the whole EV population’s behaviour. This procedure was applied successively to find the optimal NE (Yin et al., 2011).
In an ideal case, a control strategy should work for an infinite EV population. However, when infinite electric vehicles are present in the system, the effect of an individual EV strategy on the average EV strategy will be negligible.
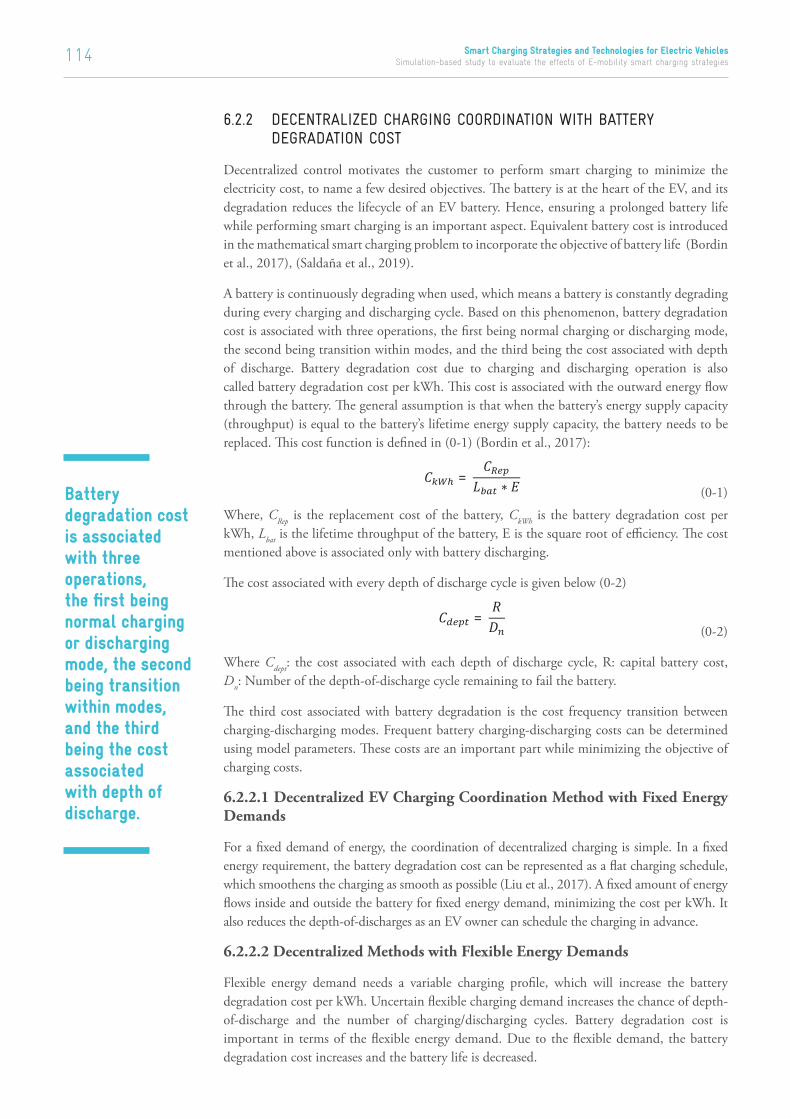
Smart Charging Strategies and Technologies for Electric Vehicles Simulation-based study to evaluate the effects of E-mobility smart charging strategies114
6.2.2 DECENTRALIZED CHARGING COORDINATION WITH BATTERY DEGRADATION COST
Decentralized control motivates the customer to perform smart charging to minimize the electricity cost, to name a few desired objectives. The battery is at the heart of the EV, and its degradation reduces the lifecycle of an EV battery. Hence, ensuring a prolonged battery life while performing smart charging is an important aspect. Equivalent battery cost is introduced in the mathematical smart charging problem to incorporate the objective of battery life (Bordin et al., 2017), (Saldaña et al., 2019).
A battery is continuously degrading when used, which means a battery is constantly degrading during every charging and discharging cycle. Based on this phenomenon, battery degradation cost is associated with three operations, the first being normal charging or discharging mode, the second being transition within modes, and the third being the cost associated with depth of discharge. Battery degradation cost due to charging and discharging operation is also called battery degradation cost per kWh. This cost is associated with the outward energy flow through the battery. The general assumption is that when the battery’s energy supply capacity (throughput) is equal to the battery’s lifetime energy supply capacity, the battery needs to be replaced. This cost function is defined in (0-1) (Bordin et al., 2017):
=∗
(0-1)
Where, CRep is the replacement cost of the battery, CkWh is the battery degradation cost per kWh, Lbat is the lifetime throughput of the battery, E is the square root of efficiency. The cost mentioned above is associated only with battery discharging.
The cost associated with every depth of discharge cycle is given below (0-2)
= (0-2)
Where Cdept: the cost associated with each depth of discharge cycle, R: capital battery cost, Dn: Number of the depth-of-discharge cycle remaining to fail the battery.
The third cost associated with battery degradation is the cost frequency transition between charging-discharging modes. Frequent battery charging-discharging costs can be determined using model parameters. These costs are an important part while minimizing the objective of charging costs.
6.2.2.1 Decentralized EV Charging Coordination Method with Fixed Energy Demands
For a fixed demand of energy, the coordination of decentralized charging is simple. In a fixed energy requirement, the battery degradation cost can be represented as a flat charging schedule, which smoothens the charging as smooth as possible (Liu et al., 2017). A fixed amount of energy flows inside and outside the battery for fixed energy demand, minimizing the cost per kWh. It also reduces the depth-of-discharges as an EV owner can schedule the charging in advance.
6.2.2.2 Decentralized Methods with Flexible Energy Demands
Flexible energy demand needs a variable charging profile, which will increase the battery degradation cost per kWh. Uncertain flexible charging demand increases the chance of depth-of-discharge and the number of charging/discharging cycles. Battery degradation cost is important in terms of the flexible energy demand. Due to the flexible demand, the battery degradation cost increases and the battery life is decreased.
Battery degradation cost is associated with three operations, the first being normal charging or discharging mode, the second being transition within modes, and the third being the cost associated with depth of discharge.

115 Smart Charging Strategies and Technologies for Electric Vehicles Simulation-based study to evaluate the effects of E-mobility smart charging strategies
A local controller is considered a better choice for minimizing battery degradation cost. A local strategy considers individual information of the battery and local network parameters, and it is easier for the controller to track the information of a single battery. In control strategies other than local strategy, it is challenging to consider and keep track of the battery degradation cost of the individual battery (Latifi et al., 2019).
6.2.3 DECENTRALIZED CHARGING AND DISCHARGING COORDINATION
As mentioned in the above section, the EV owner takes a charging decision in a decentralized manner, and the aggregator communicates the charging and discharging price to the EV owner (Wang et al., 2016). The EV owner also communicates the electricity demand to an aggregator. By considering the electricity charging demand, the aggregator updates the electricity cost in proportion to the charging demand and discharging requirement (Gan et al., 2013). To achieve charging-discharging coordination in this decentralized approach, the aggregator provides their respective prices. Aggregator reduces the charging cost when there is sufficient power available while complying with the other network constraints. When the system requires power from EVs, the aggregator increases the price for providing the energy. When the system does not require the discharging power from EV, the aggregator reduces the discharging cost. The aggregator indirectly pushes the EV owner to charge or discharge by increasing or decreasing the energy cost for charging and discharging while observing the individual profit from reduced and increased costs.
The studies reported in (Gonzalez Vaya and Andersson, 2012) (Xing et al., 2016) have used local controllers for charging and discharging in a decentralized mode. This decentralized local controller is used to solve specific problems like reducing load variation and load flattening. This is another decentralised control approach in which the local controller takes charging decisions and communicates them to the aggregator.
This type of local controller-based decentralized strategy coordinates EV charging and discharging according to the price signal provided by the aggregator and decision objective. Optimal coordination between charging and discharging using a local controller in a decentralized strategy reduces the computational burden of distributed computation at the individual EV owner level. In (Xing et al., 2016), the optimal load scheduling problem is formulated as Mixed Discrete Programming (MDP). MDP is used to solve optimization problems with both continuous and discrete variables present in the problem. This problem is an NP-hard problem, i.e., the problem is at least as hard as any NP (Non-deterministic polynomial-time) problem to solve. That is why an approximated MDP is formulated to solve the optimal charging-discharging coordination problem. The approximation of the MDP method uses the shape of the base demand curve at night that divide the time range for charging or discharging. The formulated problem is solved using an iterative water-falling mechanism implemented at the local controller to reduce computation burden (Xing et al., 2016). In such a decentralized strategy, only the customer’s decision for charging or discharging is communicated to the aggregator over bidirectional communication. So, the strategy maintains customers’ privacy.
6.3 Distributed Control Based Strategy Distributed control is the advanced version of decentralized control as the EV owners take the decisions in it. In contrast, the aggregators communicate among themselves, as shown in Figure 67, to find the optimal operating point considering the maintenance of system stability (Nimalsiri et al., 2020). This control benefits the system reliability as it continues charging operations if any fault occurs in the central unit.
A local controller is considered a better choice for minimizing battery degradation cost. A local strategy considers individual information of the battery and local network parameters, and it is easy for the controller to track the information of a single battery.

Smart Charging Strategies and Technologies for Electric Vehicles Simulation-based study to evaluate the effects of E-mobility smart charging strategies116
problem. This problem is an NP-hard problem i.e., the problem is at least hard problem in NP (Non-
deterministic polynomial-time) to solve, and that is why an approximated MDP is formulated to solve the
optimal charging-discharging coordination problem. The approximation of the MDP method uses the shape
of the base demand curve at night that divide the time range for charging or discharging. The formulated
problem is solved using an iterative water-falling mechanism implemented at the local controller to reduce
computation burden (Xing et al., 2016). In such a decentralized strategy, only the customer's decision for
charging or discharging is communicated to the aggregator over bidirectional communication. So, the
strategy maintains customer’s privacy.
6.3 Distributed Control Based Strategy The distributed control is the advanced version of decentralized control as the EV owners take the decisions.
In contrast, the aggregators communicate among themselves, as shown in Figure 67, to find the optimal
operating point considering the maintenance of system stability (Nimalsiri et al., 2020). This control
benefits the system reliability as it continues charging operations if any fault occurs in the central unit.
EV
Decision signal
EV
Information signal
Aggregator AggregatorDecision signalInformation signal
Figure 67: Distributed control strategy
Advantage:1. Improves system stability by establishing the communication between
aggregators.
2. It ensures plug and charge mechanism, which encourages participation of EV
customers in smart charging.
Disadvantage: 1. It does not allow to maintain system constraint limits directly at central
level.
Figure 67: Distributed control strategy
Advantage
Disadvantage
1. Improves system stability by establishing the communication between aggregators.
2. It ensures plug and charge mechanism, which encourages participation of EV customers in smart charging.
3. Relatively higher overall reliability.
1. It does not allow to maintain system constraint limits directly at central level.
6.3.1 DISTRIBUTED POWER PROFILE TRACKING FOR HETEROGENEOUS CHARGING OF ELECTRIC VEHICLES
(Malhotra et al., 2017) proposes a distributed strategy for tracking heterogeneous charging profiles. Heterogonous power profile tracking is possible with a centralised and hierarchical strategy as well. In a centralised and hierarchical strategy, a centralized aggregator is present who coordinates all the charging behaviour. In case the central aggregator fails, all EVs will become uncontrolled. For avoiding this, a distribution strategy is introduced, which eliminates the need for the central aggregator.
Instead of a central aggregator, sub-aggregators are virtually connected via communication links to track the heterogeneous charging. A conceptual diagram of sub aggregators in a distributed strategy is shown in Figure 68.
For problem formulation, the charging horizon is discretized into time slots of 15 minutes each. The number of EVs to be charged is given by N, the number of sub-aggregator (SA) is k, and the number of EV connected to k-th SA is denoted by N_k. The proposed strategy can maintain grid constraints and maximize users’ convenience.
Figure 68: Proposed sub aggregator system with sub-aggregator (Malhotra et al., 2017)

117 Smart Charging Strategies and Technologies for Electric Vehicles Simulation-based study to evaluate the effects of E-mobility smart charging strategies
The objective of this strategy given in 0-1 is to maximize the user’s convenience shown in the equation.
max = , , ,
subject to,
, , ≤
, , ≤
si,k is the binary charging variable for ith EV connected to k-th SA. Li,k is the rated power of the EV. Objective function J is the aggregated convenience of all EV users, whereas Ji,k is the convenience factor for individual EV per unit of power. So Ji,kLi,k is defined as the convenience of i-th EV. Pk given in 0-2 is the power limit for individual SA, whereas P indicated in 0-3 is the total power limit of the grid or system.
A User’s convenience Ji,k is calculated based on the desired and current SOC level of the EV, current and plug off time, and rated power value as shown in 0 4.
, = , − ,
, max (1, , − )
The convenience value indicates that the EV must reach to desired SOC level until plug off time.
The pictorial presentation of steps for distributed charging strategy is shown in Figure 69.
Figure 69: Stepwise pictorial representation of proposed method (Malhotra et al., 2017)
0-1
0-2
0-3
0-4

Smart Charging Strategies and Technologies for Electric Vehicles Simulation-based study to evaluate the effects of E-mobility smart charging strategies118
All EVs connected to respective SA send rated power and charging requests in terms of the convenience factor.
SA sort all EVs in decreasing order of their convenience factor. “Sort” is defined as the prioritization of EVs in decreasing order of convenience factor.
SA satisfies the power constraint applicable to individual SA. Therefore, it does not cause system stress on any SA.
Generate a histogram of convenience data provided by EVs.
In this step, the consensus among all SA is taken, which satisfies the global power constraint. It also indicates that the system will not get overloaded.
Individual SA decides on a threshold value of convenience factor. The EVs with convenience factor above the threshold value are allowed to charge
Threshold value is communicated to allowed EVs from respective SA, and EV decides the charging.
The study (Malhotra et al., 2017) considers 10 SA and 400EV per SA. In Case 1, the plug-in and plug-out times of EVs are taken as 9-11 hrs and 15-17 hrs. The result of Case 1 is shown in Figure 70; it shows the target profile is closely tracked, and power constraints are also maintained while charging. In Case 2, 20,000 EVs are considered to have a heterogeneous plug-in and off time. Results for Case 2 is shown in Figure 71.
Step 1:
Step 2:
Step 3:
Step 4:
Step 5:
Step 6:
Step 7:
Figure 70: Power tracking 400 Evs with specific plugging time (Malhotra et al., 2017)
Figure 71: Power tracking of 20000 EVs with heterogenous plugging time (Malhotra et al., 2017)
Figure 72 indicates the track of the charging profile. Targeted and proposed curves overlap at all EV penetration levels that validates the objective of the strategy.
Figure 72: EV charging profile tracking (Malhotra et al., 2017)

119 Smart Charging Strategies and Technologies for Electric Vehicles Simulation-based study to evaluate the effects of E-mobility smart charging strategies
6.4 Hierarchical Control Based Strategy The hierarchical control is divided into several layers as per the nature of problem space and types of participants. The architecture is divided into a central aggregator, subordinate layers of sub-aggregators, followed by EV owner layer (Nimalsiri et al., 2020). The control can again be sub-divided into several control strategies based on the decision-making authority, information signal flow, and required computation. It combines the benefit of centralized and decentralized strategies of directly controlling the charging and transferring the computational requirement for decision-making to the subordinate layer. Each layer of the architecture takes its own decision for achieving the desired objective without disturbing the other entities’ objective.
The hierarchical control architecture is classified into four types based on the decision signal flow below.
6.4.1 HIERARCHICAL CENTRALIZED CONTROL
The control architecture shown in Figure 73 is hierarchical, where the decisions are taken in a centralized manner. The decision is taken at the central aggregator level and passed on to the sub-aggregators. Sub-aggregator optimally fixes the charging schedule for the EVs.
followed by EV owner layer (Nimalsiri et al., 2020). The control can again be sub-divided into several
control strategies based on the decision-making authority, information signal flow, and required
computation. It combines the benefit of centralized and decentralized strategies of directly controlling the
charging and transferring the computational requirement for decision-making to the subordinate layer. Each
layer of the architecture takes its own decision for achieving the desired objective without disturbing the
other entities' objective.
The hierarchical control architecture is classified into four types based on the decision signal flow below.
6.4.1 Hierarchical Centralized Control The control architecture shown in Figure 73 is hierarchical, where the decisions are taken in a centralized
manner. The decision is taken at the central aggregator level and passed on to the sub-aggregators. Sub-
aggregator optimally fixes the charging schedule for the EVs.
EV
Sub-aggregator
Central Aggregator
Decision signal
Figure 73: Hierarchical centralised control
This control inherits the characteristics of centralized control and hierarchical control. High bandwidth
communication viz, Ethernet is recommended in this control architecture to mitigate the lag in the charging
decision signal.
Advantages:1. It considers the global network constraints.
2. It guarantees the optimal solution.
Disadvantage: 1. It is prone to halt the charging operation of the respective section if fault occur at the
central or sub aggregator level.
Figure 73: Hierarchical centralised control
This control inherits the characteristics of centralized control and hierarchical control. High bandwidth communication viz, Ethernet is recommended in this control architecture to mitigate the lag in the charging decision signal.
Advantage
Disadvantage
1. It considers the global network constraints.
2. It guarantees the optimal solution.
1. It is prone to halt the charging operation of the respective section if a fault occurs at the central or sub aggregator level.
6.4.2 HIERARCHICAL HYBRID CONTROL STRATEGY
It can again be classified into different types based on the decision signal flow. The first type, shown in Figure 74, has a hierarchical architecture and centralized decision-making at the central aggregators level and decentralized decision-making at the sub-aggregator and EVs level. In this control strategy, the central aggregator takes the charging decision considering network constraints and pass on to sub aggregators. Sub-aggregator has the information of the
The Hierarchical control is divided into a number of layers as per the nature of problem space and types of participants.

Smart Charging Strategies and Technologies for Electric Vehicles Simulation-based study to evaluate the effects of E-mobility smart charging strategies120
energy that it can deliver. At this stage, the sub-aggregator cannot dispatch the power according to availability because of decentralized decisions taken by the EVs. So, the sub-aggregator’s role is to limit the requested charging energy within the allotted value, and failure of this will lead to the sub-aggregator getting penalized. To maintain the allowable energy limits, the sub-aggregator alters the electricity prices to influence the charging behaviour of the customers.
6.4.2 Hierarchical Hybrid Control Strategy It can again be classified into different types based on the decision signal flow. The first type, shown in
Figure 74, has a hierarchical architecture and centralized decision-making at the central aggregators level
and decentralized decision-making at the sub-aggregator and EVs level. In this control strategy, the central
aggregator takes the charging decision considering network constraints and pass on to sub aggregators. Sub
aggregator has the information of the energy that it can deliver. At this stage, the sub aggregator cannot
dispatch the power according to the availability because of decentralized decisions taken by the EVs. So,
the sub aggregator's role is to limit the requested charging energy within the allotted value, and failure of
this will lead to the sub aggregator getting penalized. To maintain the allowable energy limits, the sub
aggregator alters the electricity prices to influence the charging behaviour of the customers.
Sub-aggregator
EV
Central Aggregator
Decision signal
Figure 74: Hierarchical hybrid charging decision
Advantage:1. EV owners have the option of plug and charge, which motivates them to participate in smart
charging. 2. It ensures the network constraints within limits by taking a centralized decision at the central
aggregator level.
Disadvantage: 1. Sub aggregator does not have direct control over the EV charging
The second type under this hierarchical hybrid control strategy is shown in Figure 75. In this type, the
decentralized decision-making occurs at the aggregators level, and the sub aggregator and EVs take the
centralized decision. The energy requested is optimally scheduled by the sub aggregator considering the
regional network constraints. The aggregated energy is then communicated to the central aggregator.
Figure 74: Hierarchical hybrid charging decision
Advantage
Disadvantage
1. EV owners have the option of plug and charge, which motivates them to participate in smart
2. It ensures the network constraints are within limits by taking a centralized decision at the central aggregator level.
1. Sub aggregator does not have direct control over the EV charging
The second type under this hierarchical hybrid control strategy is shown in Figure 75. In this type, decentralized decision-making occurs at the aggregators level, and the sub aggregator and EVs take the centralized decision. The energy requested is optimally scheduled by the sub aggregator considering the regional network constraints. The aggregated energy is then communicated to the central aggregator.
At this stage, the central aggregator tries to maintain the aggregated energy requested from each sub aggregator within systems limits by increasing the electricity prices.
At this stage, the central aggregator tries to maintain the aggregated energy requested from each sub
aggregator within systems limits by increasing the electricity prices.
EV
Sub-aggregator
Central Aggregator
Decision signal
Figure 75: Hierarchical centralised charging decision
Advantages: 1. It ensures the local optimal solution due to the centralized decision-making ability of sub-aggregator 2.
Regional network constraints are directly controlled and maintain within limits
Disadvantage: It does not ensure the global network parameters within the limit.
6.4.3 Hierarchical Decentralized Control In this hierarchical control architecture, the decisions are taken in a decentralized manner, as shown in
Figure 76. It allows decision-making at the EV level and passing of it to the sub aggregators. Sub-aggregator
again passes the aggregated decision signal in terms of required charging power to the central aggregator.
Figure 75: Hierarchical centralised charging decision

121 Smart Charging Strategies and Technologies for Electric Vehicles Simulation-based study to evaluate the effects of E-mobility smart charging strategies
Advantage
Disadvantage
1. It ensures the local optimal solution due to the centralized decision-making ability of sub-aggregator
2. Regional network constraints are directly controlled and maintained within limits
1. It does not ensure the global network parameters are within the limit.
6.4.3 HIERARCHICAL DECENTRALIZED CONTROL
In this hierarchical control architecture, the decisions are taken in a decentralized manner, as shown in Figure 76. It allows decision-making at the EV level and passing of it to the sub aggregators. Sub-aggregator again gives the aggregated decision signal in terms of required charging power to the central aggregator.
EV
Sub-aggregator
Central Aggregator
Decision signal
Figure 76: Hierarchhical decentralised control
It inherits the characteristics of decentralized control and hierarchical control. Low bandwidth
communication is recommended in this control architecture.
Advantage:1. It is not prone to the stoppage of charging operation of the system if a fault occurs
at the central or sub aggregator level.
Disadvantage: 1. The decision signal does not consider the global network constraint directly.
2. It does not guarantee the optimal solution.
6.4.3.1 Hierarchical Decentralized Charging Coordination Method As mentioned in the above section, a hierarchical charging strategy can be categorized based on the nature
of decision-making (centralized, decentralized). In a hierarchical decentralized coordination method, the
decision is taken at the EV owner level and communicated to the upper level. At the second level, based on
the decision-making ability, the strategy is divided into two categories. When the decision is taken by the
central aggregator and communicated to the sub aggregator, the strategy combines the benefit of both
centralized and decentralized strategy within the hierarchical strategy. When the sub aggregator
communicates the charging decision to the central aggregator, the strategy is fully decentralized, and the
charging is coordinated based on the hierarchical decentralized method (Zou et al., 2017).
Figure 73 to Figure 76 in this section shows different hierarchical strategies. The hierarchical decentralized
charging coordination can be understood further with the below given illustrative example:
Consider a network structure shown in Figure 77, which has a central aggregator at the topmost
hierarchical layer.
Figure 76: Hierarchical decentralised control
It inherits the characteristics of decentralized control and hierarchical control. Low-bandwidth communication is recommended in this control architecture.
Advantage
Disadvantage
1. It is not prone to the stoppage of charging operation of the system if a fault occurs at the central or sub aggregator level.
2. It guarantees the optimal solution.
1. The decision signal does not consider the global network constraint directly. It does not guarantee the optimal solution.
6.4.3.1 Hierarchical Decentralized Charging Coordination Method
As mentioned in the above section, a hierarchical charging strategy can be categorized based on the nature of decision-making (centralized, decentralized). In a hierarchical decentralized coordination method, the decision is taken at the EV owner level and communicated to the upper level. At the second level, based on the decision-making ability, the strategy is divided into two categories. When the decision is taken by the central aggregator and communicated to the sub aggregator, the strategy combines the benefit of both centralized and decentralized approaches within the hierarchical strategy. When the sub-aggregator communicates the charging decision to the central aggregator, the strategy is fully decentralized, and the charging is coordinated based on the hierarchical decentralized method (Zou et al., 2017).
In a hierarchical decentralized coordination method, the decision is taken at the EV owner level and communicated to the upper level.

Smart Charging Strategies and Technologies for Electric Vehicles Simulation-based study to evaluate the effects of E-mobility smart charging strategies122
Figure 73 to Figure 76 in this section shows different hierarchical strategies. The hierarchical decentralized charging coordination can be understood further with the below given illustrative example: • Consider a network structure shown in Figure 77, which has a central aggregator at the
topmost hierarchical layer. • A1 and A2 are the sub aggregators at the second layer, with one hundred and twenty EV
owners equally distributed between the two sub aggregators. The sub-aggregator’s objective is to make a profit.
• At time-stamp t_0, a total of 50 EVs distributed equally between A1 and A2 are connected to the charging stations.
• 40 out of the 50 EVs are considered to be charging at , which included 20 EVs charging at their maximum charging rate.
• In this case, the central aggregator’s objective is to maintain the delivered charging power within the capability of the system limits.
• At time t1, for each sub aggregator, 10 additional EVs are connected for charging (now each sub aggregator has 30 EVs charging).
• An increase in energy requests (due to an additional 20 EVs) is communicated to the central aggregator by A1 and A2.
A1 and A2 are the sub aggregators at the second layer, with one hundred and twenty EV owners
equally distributed between the two sub aggregators, and the sub-aggregator’s objective is to
make profit.
At time-stamp 𝑡𝑡0, total of 50 EVs distributed equally between A1 and A2 are connected to the
charging stations.
40 out of the 50 EVs are considered to be charging at 𝑡𝑡0, which included 20 EVs charging at
their maximum charging rate.
In this case, the central aggregator's objective is to maintain the delivered charging power
within the capability of the system limits.
At time 𝑡𝑡1, for each sub aggregator, 10 additional EVs are connected for charging (now each
sub aggregator is having 30 EVs charging).
An increase in energy request (due to additional 20 EVs) is communicated to the central
aggregator by A1 and A2.
EV1 2 60
Sub-aggregator
1 60
Central Aggregator
A1 A2
Figure 77: Example of decentralised hierarchical control structure
At time 𝑡𝑡1, the central aggregator increases the per unit charging electricity price by ‘ΔC’ value
so that the system remains within the allowed limits for the next time slot 𝑡𝑡2.
At 𝑡𝑡2, 10 more EVs are connected for charging under each of the sub aggregator. The additional
power demand due to newly added 20 EVs drive the grid to its power flow limits. To ensure the
system limits are not breached, the central aggregator aggressively increases the per unit
electricity prices by ‘2ΔC’ to influence the charging behaviour of EV owners in the upcoming
slots.
In each time slot, A1 and A2 increase their per unit electricity prices by ΔC1 and ΔC2.
Figure 77: Example of decentralised hierarchical control structure
At time t1, the central aggregator increases the per-unit charging electricity price by ‘ΔC’ value so that the system remains within the allowed limits for the next time slot t2.
At t2, 10 more EVs are connected for charging under each of the sub aggregators. The additional power demand due to the newly added 20 EVs drives the grid to its power flow limits. To ensure the system limits are not breached, the central aggregator aggressively increases the per-unit electricity prices by ‘2ΔC’ to influence the charging behaviour of EV owners in the upcoming slots.
In each time slot, A1 and A2 increase their per unit electricity prices by ΔC1 and ΔC2.
This illustrative example describes the working procedure of a hierarchical decentralized coordination strategy. The hierarchical decentralized control strategy is primarily adopted to maximize profit, RE utilization and minimize power losses in the distribution system.
6.5 Local Control Based Strategy In this strategy, only the EV owner is involved in maintaining local parameters and EV charging decisions. Local control only considers the local parameters, constraints, and pricing signals for making charging decisions (Kevin Mets et al., 2010). This control only deals with the limited local constraints and linear single objective function, so the computation power required is significantly less than other smart charging control strategies. The decision signal is found at the local control, so communication (except the price information) is not required in this type of control. This control strategy is mainly applicable to private charging stations and especially home charging points. Different advanced local controllers are proposed in the literature that effectively handles multiple objectives at the local level.
In this strategy, only the EV owner is involved in maintaining local parameters and EV charging decision. Local control only considers the local parameters, local constraints, and pricing signal for taking charging decision

123 Smart Charging Strategies and Technologies for Electric Vehicles Simulation-based study to evaluate the effects of E-mobility smart charging strategies
Advantage
Disadvantage
1. Simple and less expensive to implement.
2. Lowest computational efforts required as compared to other smart charging control strategies.
3. The best choice for home charging is a time-of-use tariff structure.
1. It is unable to consider and maintain network constraints.2. It does not reach the global optimal solution.
6.5.1 VEHICLE-DIRECTED SMART CHARGING STRATEGIES TO MITIGATE THE EFFECT OF LONG-RANGE EV CHARGING ON DISTRIBUTION TRANSFORMER AGING
The study in (Mobarak and Bauman, 2019) proposed a local strategy of vehicle-directed smart charging that individual EVs can use to charge more intelligently and thus lessen grid impact. Increased charging burden on the distribution transformer increases the transformer’s ageing rate. Centralized and decentralized strategies can handle the accelerated transformer ageing issue by directly optimizing the network’s and transformer’s constraint parameters and dynamic electricity price, respectively. In both the methods, communication and computational infrastructure are required. Apart from these methods, the charge right-away is another simple charging strategy; however, that results in a high peak load and adds to the electrical burden on the distribution transformer. To eliminate increased peak load and burden on distribution transformer, the user requires a control mechanism that adds to the overall cost and intelligently handles this issue.
The problem statement addressed in the study is to develop a random-in-window (RIW) strategy that allows random charging start times within a specific time window after the residential peak load.
Window Start Time = A (Fixed)
Window End Time = B (last time vehicle can start and be fully charge by the departure time D)
E = minimum of charging rate
Charging Rate = rand(6.6K-W, E)
Plug-in Time < B
Yes
Yes
No
No
A < B
Charge Start Time C = rand(A, B)
Change Start Time = B
Charge RIght Away (Change Start Time =
Plug-in Time)
Additional Step for RIW-FR
Additional Step for RIW-FR
Figure 78: Proposed RIW algorithm with FR and VR variants (Mobarak and Bauman, 2019)

Smart Charging Strategies and Technologies for Electric Vehicles Simulation-based study to evaluate the effects of E-mobility smart charging strategies124
The proposed strategy uses a random charging strategy in a specific time window. Two variants of this random in window strategy, viz, fixed and variable charging rate is introduced. The expected time window for random charging must start after the time of household peak load. Different charging strategies are considered in the paper to compare the results with other available charging strategies. Uncontrolled charging strategies, such as charge right-way and vehicle directed charging strategies, such as time-of-use, charge by departure, random charging with fixed charging rate, random charging with flexible charging rate and smart charging strategy, have been analyzed in the study (Mobarak and Bauman, 2019). Results from all these strategies are compared to choose the best strategy among previously available and proposed strategies.
The overall structure of the proposed strategy is shown in Figure 78, which requires two input time values. One input is value: the time after household peak, and the other is the departure time for the next day. As shown in Figure 78, the value of time after the household peak (A) is set into the strategy, ensuring the household and EV charging load peak should not overlap to further stress the grid.
In the next step, the user must define the departure time for the following day’s initial travel. It is used in determining the end of the random time window (B). The end of the random time value ensures that if any vehicle is attached at the end of the random time window, it will also be charged fully for the next travel.
Random charging is not allowed after time B to ensure the requested charging level. In the next case, when plug-in time is less than B, the decision condition between A and B will be checked, as shown in Figure 78. Then the only vehicle will get sufficient time to choose the charging time randomly and be ready for next day travel. If the value of A is greater than B, it exhibits that the household peak ceases after the end of the random time window, and straightway charging starts at time B. The algorithm’s adverse condition happens when a vehicle is connected outside the random time framework. In that case, charging will take place with right away charging. In this, vehicles will charge at a fixed charging rate of 6.6kW. Therefore, the strategy is called random in the window with a fixed charging rate (RIW-FR).
An extension of this strategy in terms of charging rate is addressed in the next strategy, known as RIW-variable charging rate (RIW-VR). According to the flowchart shown in Figure 78, at first, charging time is chosen randomly. The minimum charging rate required (E) is then determined to fully charge the EV for the first travel on the following day based on the available time difference between departure time and random charging time found in the previous step. The formula for finding E is given 0 1:
E = Battery Enery Required
ɳ x (Maximum Charging Duration D − C)
ɳ_obc: Efficiency of on-board charger
The proposed study is performed on 150 vehicles using the logged data of arrival, departure, and plug-in time. The results from the proposed strategy are compared with other strategies for 150 drivers and their logged data.
For studying the impact of variation in EV specification in terms of power, vehicles are differentiated as long-range (60kWh-battery) and short-range (20kWh-battery) vehicles.
0-1

125 Smart Charging Strategies and Technologies for Electric Vehicles Simulation-based study to evaluate the effects of E-mobility smart charging strategies
Figure 79: RIW charging profile of one EV load (Mobarak and Bauman, 2019)
Figure 79 shows that charging is started randomly between time window 10 p.m.-5 a.m. with a fixed charging rate of 6.6kW. It also indicates that charging after the household peak at 8 p.m. significantly reduces the stress on the system components.
Figure 80 depicts the household load profile without EV load and the entire household load with different types of EV. The resulting load curve for the RIW-FR method is shown in red. It shows that the off-peak time window is not fully utilized, and therefore, the load is not levelled throughout the off-peak time window. As shown in the green curve of Figure 80, this issue is addressed with a variable charging rate that tries to level the charging throughout the available charging window. From this, it is concluded that RIW-VR reduces more stress on the distribution transformer than RIW-FR.
Figure 80: Long-range EV and short-range EV-simulated Monday load for 150 logged drivers (RIW-FR and RIW-VR charging strategies) (Mobarak and Bauman, 2019)
Transformer loading at different charging strategies is shown in Figure 81. It shows that the charge-by-departure strategy has a high transformer loading, whereas the proposed RIW-VR is charged with comparatively less transformer loading. RIW-VR charged in a distributive manner through an off-peak charging window which reduces the transformer loading significantly.
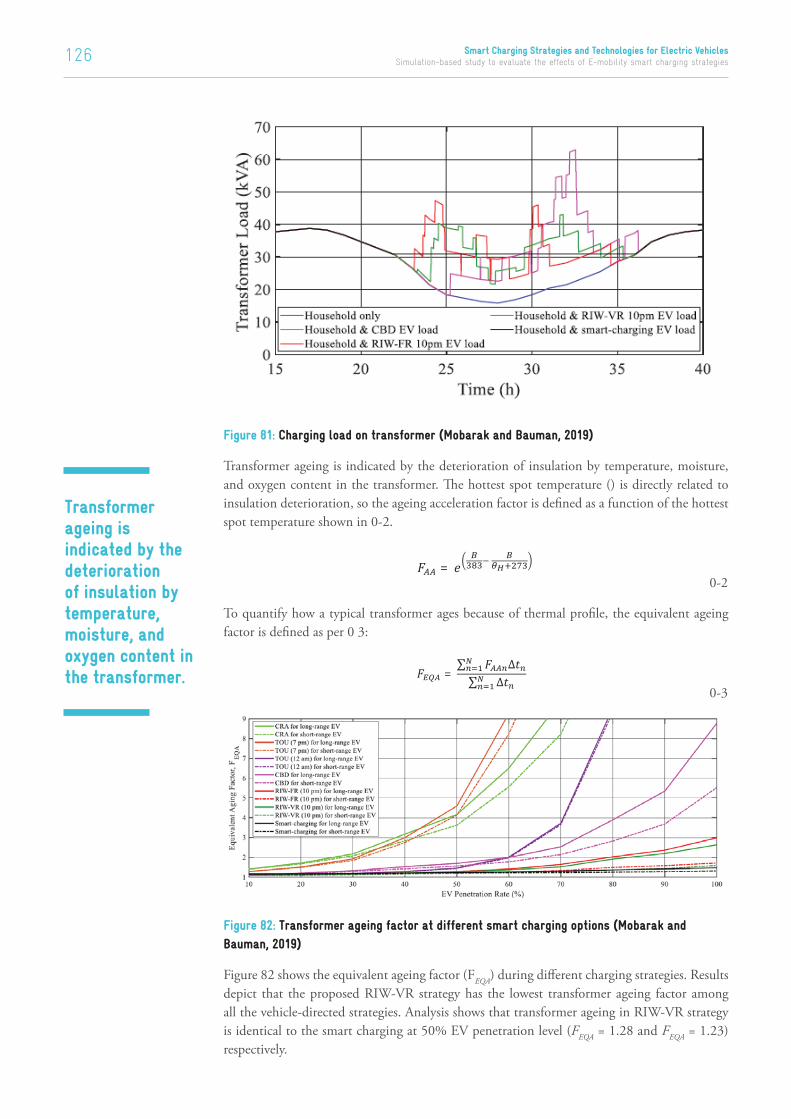
Smart Charging Strategies and Technologies for Electric Vehicles Simulation-based study to evaluate the effects of E-mobility smart charging strategies126
Figure 81: Charging load on transformer (Mobarak and Bauman, 2019)
Transformer ageing is indicated by the deterioration of insulation by temperature, moisture, and oxygen content in the transformer. The hottest spot temperature () is directly related to insulation deterioration, so the ageing acceleration factor is defined as a function of the hottest spot temperature shown in 0-2.
=
To quantify how a typical transformer ages because of thermal profile, the equivalent ageing factor is defined as per 0 3:
=∑ ∆∑ ∆
Figure 82: Transformer ageing factor at different smart charging options (Mobarak and Bauman, 2019)
Figure 82 shows the equivalent ageing factor (FEQA) during different charging strategies. Results depict that the proposed RIW-VR strategy has the lowest transformer ageing factor among all the vehicle-directed strategies. Analysis shows that transformer ageing in RIW-VR strategy is identical to the smart charging at 50% EV penetration level (FEQA = 1.28 and FEQA = 1.23) respectively.
0-2
0-3
Transformer ageing is indicated by the deterioration of insulation by temperature, moisture, and oxygen content in the transformer.

127 Smart Charging Strategies and Technologies for Electric Vehicles Simulation-based study to evaluate the effects of E-mobility smart charging strategies
07Objective-Based Strategies
The objective based strategies are applied to achieve predefined objectives based on the stakeholder’s perspective. From the system operator’s perspective, the fundamental objective is to maintain system stability by maintaining the network parameters within given limits. The centralized control strategy is considered the preferred choice to achieve system stability. The main objective of smart charging based on the EV owner’s perspective is to minimize the charging cost. The aggregator is appointed to coordinate between the system operator and EV, whose primary role is to schedule the EV charging such that the objectives of both stakeholders are achieved. In addition to the prime role of coordinating and maintaining both objectives, the aggregator has one more personal objective: to earn profit from the scheduled charging. The decentralized charging control architecture best suits making a profit by an aggregator. A decentralized control strategy is considered to elaborate more on the mechanism of earning a profit by an aggregator. In this strategy, the aggregator has a role in maintaining the system constraint. The EV demand needs to be reduced to maintain system constraints within limits, But the aggregator does not directly control the EV charging in the decentralized architecture.
For maintaining the constraint parameters, the aggregator increases the price of electricity for EV owners. The price difference between the electricity cost from DSO and electricity cost from the aggregator generates profit.
Some other objectives of smart charging are load flattening, an increase in RE utilization, and frequency regulation. Various objectives of smart charging strategies based on different stakeholders’ perspectives are given below.
Some other objectives of smart charging are load flattening, increase in renewable energy utilization, and frequency regulation
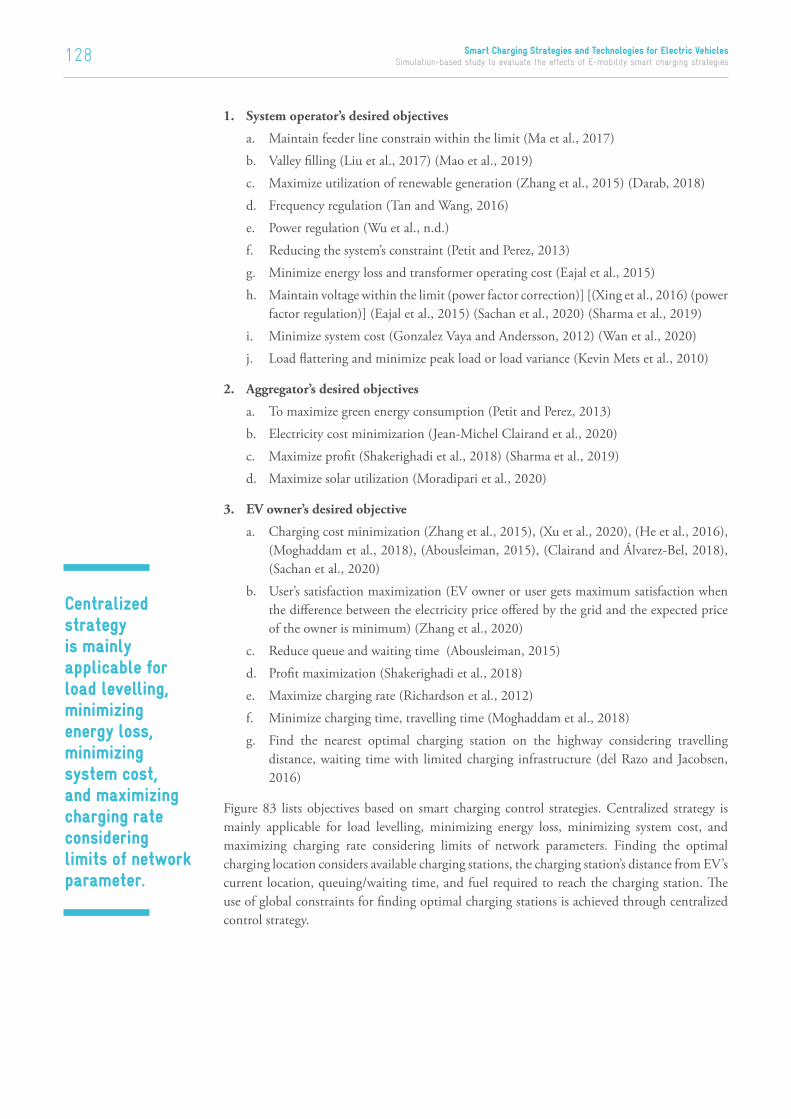
Smart Charging Strategies and Technologies for Electric Vehicles Simulation-based study to evaluate the effects of E-mobility smart charging strategies128
1. System operator’s desired objectives
a. Maintain feeder line constrain within the limit (Ma et al., 2017)
b. Valley filling (Liu et al., 2017) (Mao et al., 2019)
c. Maximize utilization of renewable generation (Zhang et al., 2015) (Darab, 2018)
d. Frequency regulation (Tan and Wang, 2016)
e. Power regulation (Wu et al., n.d.)
f. Reducing the system’s constraint (Petit and Perez, 2013)
g. Minimize energy loss and transformer operating cost (Eajal et al., 2015)
h. Maintain voltage within the limit (power factor correction)] [(Xing et al., 2016) (power factor regulation)] (Eajal et al., 2015) (Sachan et al., 2020) (Sharma et al., 2019)
i. Minimize system cost (Gonzalez Vaya and Andersson, 2012) (Wan et al., 2020)
j. Load flattering and minimize peak load or load variance (Kevin Mets et al., 2010)
2. Aggregator’s desired objectives
a. To maximize green energy consumption (Petit and Perez, 2013)
b. Electricity cost minimization (Jean-Michel Clairand et al., 2020)
c. Maximize profit (Shakerighadi et al., 2018) (Sharma et al., 2019)
d. Maximize solar utilization (Moradipari et al., 2020)
3. EV owner’s desired objective
a. Charging cost minimization (Zhang et al., 2015), (Xu et al., 2020), (He et al., 2016), (Moghaddam et al., 2018), (Abousleiman, 2015), (Clairand and Álvarez-Bel, 2018), (Sachan et al., 2020)
b. User’s satisfaction maximization (EV owner or user gets maximum satisfaction when the difference between the electricity price offered by the grid and the expected price of the owner is minimum) (Zhang et al., 2020)
c. Reduce queue and waiting time (Abousleiman, 2015)
d. Profit maximization (Shakerighadi et al., 2018)
e. Maximize charging rate (Richardson et al., 2012)
f. Minimize charging time, travelling time (Moghaddam et al., 2018)
g. Find the nearest optimal charging station on the highway considering travelling distance, waiting time with limited charging infrastructure (del Razo and Jacobsen, 2016)
Figure 83 lists objectives based on smart charging control strategies. Centralized strategy is mainly applicable for load levelling, minimizing energy loss, minimizing system cost, and maximizing charging rate considering limits of network parameters. Finding the optimal charging location considers available charging stations, the charging station’s distance from EV’s current location, queuing/waiting time, and fuel required to reach the charging station. The use of global constraints for finding optimal charging stations is achieved through centralized control strategy.
Centralized strategy is mainly applicable for load levelling, minimizing energy loss, minimizing system cost, and maximizing charging rate considering limits of network parameter.

129 Smart Charging Strategies and Technologies for Electric Vehicles Simulation-based study to evaluate the effects of E-mobility smart charging strategies
Control architecture based smart charging strategies
Decentralized Centralized Hierarchical
Architecture and approach
For load levelling (Mets et al., 2010)
For minimization of energy loss (Eajal et al., 2015)
For optimal charging point allocation (Moghaddam et al., 2018)
For considering battery voltage constraint (Morstyn et al., 2020)
Minimize system cost (Wan et al., 2020)
Maximize charging rate (Richardson et al., 2012)
Local
For tracking variety of charging power
required (Malhotra et al., 2017)
For frequency regulation (Tan and
Wang, 2016)
For profit maximization (Shakerighadi et al.,
2018)
For valley filling (Mao et al., 2019)
Achievable objectives
Minimizing battery degradation cost (Saldaña et al., 2019)
For supporting fixed energy demand (Liu et al., 2017)
For flexible energy demand (Malhotra et al., 2017)
For demand response (Darab, 2018)
For valley filling (Liu et al., 2017) (Mao et al., 2019)
For system cost and electricity consumption cost minimization (Clairand et al., 2018)
Minimize power loss (Eajal et al., 2015)
For Improving voltage profile (Eajal et al., 2015)
For minimizing line loading (Ma et al., 2017)
Maximum RE utilization (Zhang et al., 2015)
Distributed
Load flattering (Mets et al., 2010)
Maximize charging rate (Richardson et
al., 2012)
Finding optimal charging station a.(Moghaddam et al., 2018)
Figure 83: Smart charging strategies based on the control architecture
The decentralized control strategy is the favourable choice for the objectives directly related to the electricity cost. The list of objectives that work based on decentralized control is shown in Figure 83.
As mentioned above in this section, earning profit is one of the main objectives of the aggregator. The aggregator can quickly achieve this objective in hierarchical control architectures as the players are free to achieve their own objective in each level irrespective of the other players’ objectives. So, the profit maximization of aggregators is aligned with the hierarchical control strategy.
Figure 83 summarizes that the objectives depending on global constraints are achieved with centralized, decentralized/distributed or hierarchical strategies (Amjad et al., 2018). The objectives depending on local constraints, are realized with local strategy.
7.1 EV Charging Coordination Under Feeder Capacity Constraints
In EV charging coordination strategies, the feeder’s maximum allowed capability is the constraint parameter while performing EV charging. Considering feeder capability for charging optimization is an important parameter because the feeder overloading can potentially result in feeder tripping, leading to congestion of other lines. Because of this reason, EV charging is coordinated under consideration of the maximum feeder capacity. Feeder capacity constraints can be considered in two different ways while performing an optimization. The first option is by considering the thermal rating of the line. The second method of realizing the feeder constraint is by considering the amount of prespecified power flowing through the feeder, which can be calculated using load flow analysis or optimal load flow studies.
The decentralized control strategy is the favourable choice for the objectives directly related to the electricity cost.

Smart Charging Strategies and Technologies for Electric Vehicles Simulation-based study to evaluate the effects of E-mobility smart charging strategies130
Applying feeder capacity constraint is simple in a centralized method as all decisions are taken centrally by performing load flow analysis, and EV owners are not involved in charging decisions. The centralized mechanism is not very popular amongst customers as it does not facilitate the direct plug-and-charge mechanism. This reduces the customer’s degree of satisfaction, and people are less interested in such charging strategies.
Contrary to this, applying feeder constraint in a decentralized strategy is difficult because the EV owner takes the EV charging decision based on electricity price without considering any network constraints. Dynamic price variation by an aggregator cannot guarantee the optimal solution to maintain the feeder’s capacity constraint. The aggregator decides the variation in price signal by taking the information of load flow and power requests from the customers. However, this decentralized control strategy alone is not sufficient to maintain feeder capacity constraints, as a failure in maintaining capacity constraints from this approach may lead to system instability. So, another local control is also used in addition to decentralized control for arresting capacity constraints.
7.2 Coordinated EV Charging and Distributed Generation Control in the Distribution Network
The presence of EVs and distributed generators are complementary to each other. EV adoption will be successful only if there is enough energy available from renewable generators. On the other side, more distributed generators can be integrated into the system if a mechanism is available to neutralise the uncertainty in distributed generations. EVs are a well-suited and economical option for increasing RE penetration in the grid. This requires common and balanced coordination between the specific objectives of EV charging and distributed generation. High penetration of distributed generators may lead to a rise of the system voltage due to reverse power flow. On the other hand, high penetration of EV may lead to a drop in the system voltage. Using balanced coordination of EV charging and distributed generation, the system voltage stability is supported, and violations of limits are reduced.
Another encouraging parameter from the EV owner’s point of view is the reduced electricity cost when powered with RE generation. Thus, maximum energy usage from RE resources is necessary to make EVs a more sustainable alternative for gasoline-powered transportation. The points highlighted above encourages effective coordination between EV charging load and distributed generation. Coordination between EV charging and distributed generation can be performed using centralised, decentralised, hierarchical, distributed, and local strategy. The objective of all the strategies is to maximize the utilisation of RE generation. This objective is mathematically modelled to minimise the cost of electricity as RE is available at a relatively lower price. The detailed working of the strategies for coordination of EV charging and distributed generation is given below.
In centralised strategies, direct coordination happens by taking a centralised decision on the charging power. The objective is modelled as cost minimisation with the required grid safety constraints. The aggregator schedules maximum possible charging from RE each time, reducing the cost and increasing the customers’ satisfaction in both ways, viz, by minimising charging cost and maximum charging at the daytime (especially in solar PV generation). This objective is mainly adopted at the workplace charging station and public charging stations.
Using balanced coordination of EV charging and distributed generation, the system voltage stability is supported, and violations of limits are reduced.

131 Smart Charging Strategies and Technologies for Electric Vehicles Simulation-based study to evaluate the effects of E-mobility smart charging strategies
In decentralised strategies, the aggregator has information on the expected forecasted value of renewable generation. Using the knowledge of forecasted RE generation, the aggregator lowers the electricity prices during renewable energy generation rich hours. The coordination process between EV charging and RE generation is implemented by finding the effective price of electricity coming from conventional stations and RE generators and trying to minimise the total cost of EV charging (Clairand et al., 2017b). On the same strategy, distributed control communicates within aggregators and attempts to accommodate all the other aggregators’ RE. This pushes the system towards an optimal solution for maximum RE utilisation and minimizing the electricity cost. The distributed strategy provides a global optimal solution by scheduling the available renewable for EV charging at other locations.
Hierarchical strategy for coordinating EV and RE generation works in a combination of centralised and decentralised strategies. So, it can provide dual benefits of both the strategy in terms of direct control and customer satisfaction. Another highly adopted strategy for coordination between EV charging and RE generation is the local strategy. Local controllers optimally schedule the EV charging based on the availability of RE generation and cost minimisation. One more objective function is to implement the minimisation using energy from the grid and to utilise the maximum possible local RE generation. This strategy is mainly adopted among the population in the household and captive charging conditions.
The distributed strategy provides a global optimal solution by scheduling the available renewable for EV charging at other location.

Smart Charging Strategies and Technologies for Electric Vehicles Simulation-based study to evaluate the effects of E-mobility smart charging strategies132

133 Smart Charging Strategies and Technologies for Electric Vehicles Simulation-based study to evaluate the effects of E-mobility smart charging strategies
08Smart Charging Strategies Based on Optimization Algorithms
From the computational perspective, smart charging is an optimal solution of EV schedule considering various constraining parameters, which can be found out using several different established methods. Optimization methods, data-driven method, AI and ML-based methods, fuzzy method, model predictive control method are some approaches for finding optimal EV schedules while maintaining network constraints (Amjad et al., 2018). Within the scope of this report, the focus will be on optimization methods and game theory-based methods for smart charging. These methods need a large quantum of training data which, however, is available in limited quantity.
This data is sensitive to the location and its specific characteristics from where it is collected. The same training data will not help train any smart charging AI or ML-based model in some other parts of the world. Considering this limitation of AI and ML-based methods, the details of these approaches are not covered in detail. Figure 84 shows the optimization algorithms used for performing smart charging.
Optimisation algorithms work for specific constraints and optimization domains. Mostly linear optimisation algorithms are used to perform cost minimization considering basic network constraints such as operators maximum allowed power.
Optimization methods, data-driven method, AI and ML-based methods, fuzzy method, model predictive control method are some of the approaches for finding optimal EV schedules while maintaining network constraints
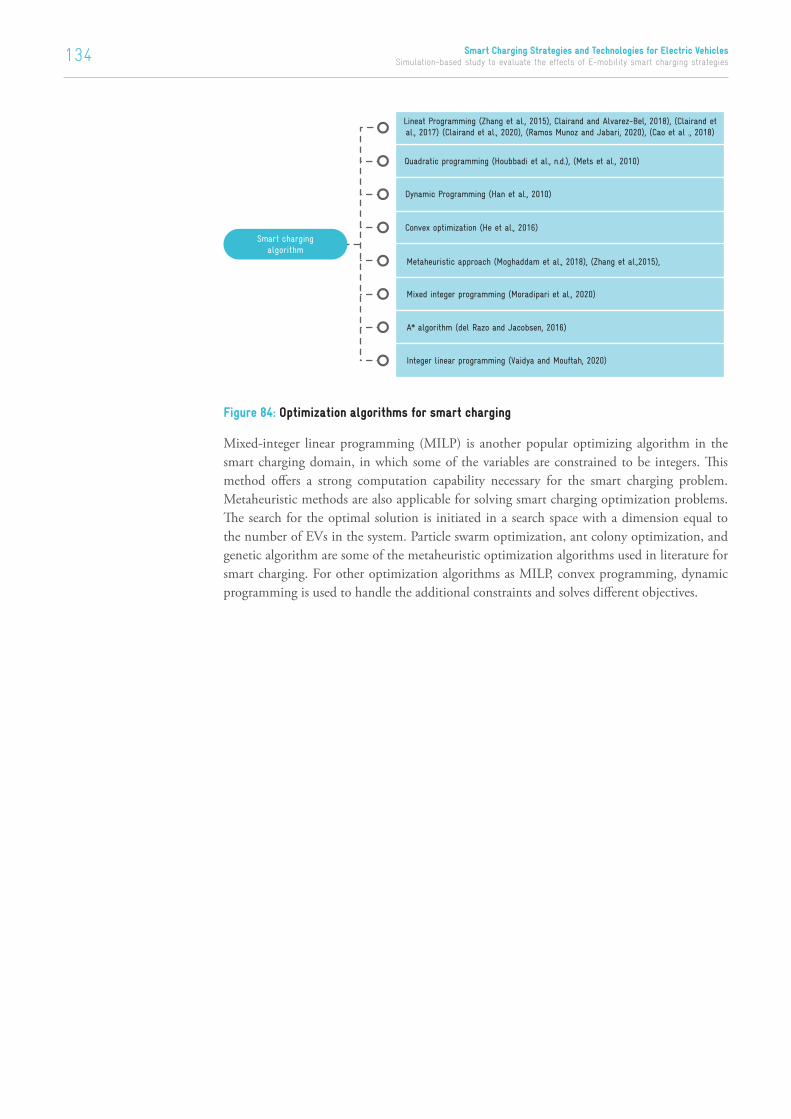
Smart Charging Strategies and Technologies for Electric Vehicles Simulation-based study to evaluate the effects of E-mobility smart charging strategies134
Quadratic programming (Houbbadi et al., n.d.), (Mets et al., 2010)
Dynamic Programming (Han et al., 2010)
Convex optimization (He et al., 2016)
Metaheuristic approach (Moghaddam et al., 2018), (Zhang et al.,2015),
Mixed integer programming (Moradipari et al., 2020)
A* algorithm (del Razo and Jacobsen, 2016)
Integer linear programming (Vaidya and Mouftah, 2020)
Smart charging algorithm
Lineat Programming (Zhang et al., 2015), Clairand and Alvarez-Bel, 2018), (Clairand et al., 2017) (Clairand et al., 2020), (Ramos Munoz and Jabari, 2020), (Cao et al ., 2018)
Figure 84: Optimization algorithms for smart charging
Mixed-integer linear programming (MILP) is another popular optimizing algorithm in the smart charging domain, in which some of the variables are constrained to be integers. This method offers a strong computation capability necessary for the smart charging problem. Metaheuristic methods are also applicable for solving smart charging optimization problems. The search for the optimal solution is initiated in a search space with a dimension equal to the number of EVs in the system. Particle swarm optimization, ant colony optimization, and genetic algorithm are some of the metaheuristic optimization algorithms used in literature for smart charging. For other optimization algorithms as MILP, convex programming, dynamic programming is used to handle the additional constraints and solves different objectives.

135 Smart Charging Strategies and Technologies for Electric Vehicles Simulation-based study to evaluate the effects of E-mobility smart charging strategies
09Artificial Intelligence/ Machine Learning-Based Charging Approach
In chapter 6 and chapter 8, EV charging and coordination are discussed based on control architecture and optimisation approach. Data-driven AI and ML-based solutions are another approach for scheduling and coordinating EV charging (Frendo et al., 2020). In this approach, models are built and trained to understand the behaviour and characteristic of participating entities with many scenarios with different participating entities. This training is performed using standard training sets or different scenarios generated in simulations. Based on the available training sets, the AI/ML-based strategy is categorised into supervised and unsupervised learning (Shahriar et al., 2020). There is limited labelled standard training data available. The available training data is also sensitive to geographical location, so the available training data is also not used to train the data for the model at any other geographically different place. Due to the scarcity of available training data unsupervised learning algorithm is the populator choice. In an unsupervised algorithm, unlabelled training data is used, and the results differentiate the EV charging behaviours from given input parameters. K-means clustering, Gaussian mixture model, Kernel density estimator are some of the methods used in literature for unsupervised learning. Linear regression model, decision tree, random forest, space vector machine are some supervised methods. When the input information is provided to the model, it predicts the change in the smart charging profile and provides the optimal charging power dispatch to EVs requesting it.
ML predictive models also depend on the quality of the data set used for training. The standard training data is taken from available EV charging projects for residential and non-residential charging. Based on the response variable to be predicted, the problem is called a regression
problem with a continuous predicted response variable. If the response variable is categorical, then the problem is classified as a categorical problem. Deep learning and reinforcement learning are more advanced ML algorithms that learn from mistakes and errors.
Due to the scarcity of available training data unsupervised learning algorithm is the populator choice.
Smart Charging Strategies and Technologies for Electric Vehicles Simulation-based study to evaluate the effects of E-mobility smart charging strategies136

137 Smart Charging Strategies and Technologies for Electric Vehicles Simulation-based study to evaluate the effects of E-mobility smart charging strategies
10Price Based Coordination Methods
Electricity price is categorized into fixed price and dynamic price based on time of use and energy demand. However, the fixed price is generally not effective for pricing. Hence, dynamic prices are adapted for pricing the EV based on coordination methods. The pricing schemes for dynamic electricity prices are divided as Real-time price (RTP), Time of use (TOU), Critical peak price (CPP), and Peak time rebate (PTR) (Zhang et al., 2020). Each of these pricing strategies is applied to influence the charging behaviour of customers indirectly. Details of EV coordination and price-based methods are provided below.
10.1 Real-Time PricingThe electricity cost is updated every time step as per the network’s requirement. If a flat price is applied for EV charging, that might create an uncertain peak at any time of the day as per customers charging behaviour. Updated prices as per various parameters are required in the EV charging system to avoid this undesirable peak load condition. Charging requests or charging demand, availability of energy, maximum allowable power limits, and available RE supply are the major reasons behind price variation. Some other constraints like feeder capacity line loading and transformer burden also indirectly affect the electricity prices. This real-time price variation allows the charging cost minimization objective to be performed in a real charging scenario.
Decentralized and distributed control strategies are majorly adopting real-time pricing mechanisms. In a decentralised real-time price coordination approach, the aggregator updates the price signal for the next time slot to control the EV charging as per the grid’s safety. Centralized strategy can use real-time pricing, but in this case, the aggregator is not varying
the price. Here, the aggregator is following the real-time prices from the pricing market. In practice, a centralized strategy does not require real-time pricing as the control parameter over EV charging. So, in many centralized case studies, the time-of-use time of tariff structure is generally used. Real-time pricing signal has one more important objective of demand response, which directly eliminates ancillary support requirement (Chen et al., 2017).
Real-time pricing signal has one more important objective of demand response, which directly eliminates ancillary support requirement

Smart Charging Strategies and Technologies for Electric Vehicles Simulation-based study to evaluate the effects of E-mobility smart charging strategies138
In (Chen et al., 2017), automatic demand response (ADR) is implemented with real-time pricing. The author used two models, namely, the Dynamic Price Vector Formation Model (DPVFM) and the Dynamic Feasible Energy Demand Region (DFEDR) for PV attached charging station for ADR. The comparative result for cost and voltage profile for proposed ADR using fuzzy C means and K means algorithm is highlighted in the paper.
10.2 Time of Use TariffThe time-of-use (TOU) tariff is defined as the fixed price allotted to time slots. These prices are published on an actual day of operation so that the customer can schedule the operation of appliances to reduce the electricity cost by shifting the flexible loads to a low price period. TOU tariff can perform smart charging without actually controlling the charging rates. It requires significantly less additional infrastructure and can give better results in terms of electricity cost. So, this tariff structure is globally used in many projects and locations. TOU indirectly facilitates increased RE utilization, reduced transformer loading and peak load but does not ensure an optimal solution and grid stability. It also allows load levelling or valley filling and cost minimization.
TOU tariff is used in centralized charging where the aggregator considers this tariff to optimize the charging to reach the desired objective. TOU tariff is not applicable in decentralized and distributed strategies because the concept behind this strategy is based on dynamically varying prices as per the requirement. TOU tariff significantly reduces the charging cost compared to uncontrolled charging. It allows cost minimization and smart charging in an uncontrolled EV environment. It can be applied to largest possible EV fleet since it does not require any additional infrastructure, communication, and computational power.
Moving TOU using Gaussian-model based clustering technique is described in (Newsham and Bowker, 2010). In this study, Gaussian model-based clustering technique is used to find the TOU duration. In (Yin et al., 2015), the regional TOU pricing model is introduced, categorizing the urban area into four different zones: industrial, commercial, office, and residential. The comparative analysis of peak valley difference and charging cost is carried for TOU and regional TOU tariff.
10.3 Critical Peak PriceCritical peak pricing works under the same TOU principle; the difference is that it is applied for a period of high demand. It is not decided on historical data, and rather forecasted data is used to apply and publish quickly. The electricity price is very high in CPP compared to TOU, so it is more effective than TOU for peak load reduction (Newsham and Bowker, 2010). For applying CPP, days are categorized into critical days and non-critical days using various methods, such as particle swarm optimization (PSO) and ML-based clustering techniques.
10.4 Peak Time RebateIn this tariff structure, the utility provides a rebate to the customer to limit consumption within a predefined limit (Dutta and Mitra, 2017). Customer views it as a gain. However, shifting load to off-peak time is considered a loss. The economic effectiveness of the scheme is dependent on the predefined critical baseline load as it requires development of precise baseline load (Newsham and Bowker, 2010).
This section has explained different types of strategies based on control architecture and major strategies in detail.
TOU tariff can perform smart charging without actually controlling the charging rates. It requires significantly less additional infrastructure and can give better results in terms of electricity cost.

139 Smart Charging Strategies and Technologies for Electric Vehicles Simulation-based study to evaluate the effects of E-mobility smart charging strategies
10.5 Dynamic Price-Based Coordination Methods Electricity charging price is classified into two categories time-of-use price and dynamic price. Dynamic price-based coordination is applied in combination with centralized, decentralized/distributed, and hierarchical strategies. Dynamic electricity prices mainly influence cost minimization, maximum RE utilization, and ancillary services as charging costs are the important constraint. In this method, the optimal charging solution is determined at every time slot as per the dynamically varying prices (Xu et al., 2020).
In a price-based coordination strategy, the zonal and regional prices coordinate and influence the EV’s charging behaviour. EV charging and time-of-charging are uncertain and random by nature, making it difficult for the operator to manage disordered charging requests. For tackling this issue of disordered charging, a price-based approach is used in the literature. In this price-based approach, the zonal price is calculated, which changes the customer’s charging behaviour with the grid requirements, customer requirements, and the benefit of all the parties involved.
The regional information about the number of EVs and charging stations is collected and processed to calculate the charging demand on the charging station per EV. This value highlights the status of charging infrastructure available at the regional level. According to this value, the zonal prices are optimally determined considering the profit maximization principle. Considering this price at the zonal level, TOU tariffs are published, encouraging customer participation in smart charging. TOU tariff increases the customer’s degree of satisfaction as it resembles a simple plug and charge mechanism. In the literature, the genetic algorithm has often been used to optimally find the zonal prices by considering all the constraints required for grid stability.
As a result of the dynamic priced based strategy, the peak-to-valley ratio is reduced compared to the mechanism without optimal pricing. This strategy formulates a multi-objective optimization problem to find an optimal point from the perspective of EV owners and grid operators. This multi-objective problem aims to maximise users benefit, maximise revenue from the grid, and minimise load fluctuation. While performing this optimal TOU tariff scheme, it is necessary to restrict the value of TOU to maintain its affordability by the EV owners. For this reason, an upper and lower bound of a pricing value is fixed for each time slot. The price bounds are changing based on the time of the day as peak time, valley time, and flat load time. Another restriction on the TOU price is the difference between the average value of the TOU tariff in a day and the average prices at flat load and valley load time. This difference should be less than the predefined threshold value to make the optimal time of use tariff affordable for EV owners.
An optimal price-based strategy can also lead to an uncertain peak in the system in valley time because of very low cost, which is not desirable. Hence, a threshold value is predefined to eliminate this possibility of uncertain peak demand at valley time. The difference between flat and peak load times should be less than this threshold value to arrest the uncertainty with high charging at valley hours.
10.5.1 Decentralized Dynamic Pricing Mechanism for Demand Response
To maintain generation-demand balance, demand response from the EV charging load is the preferred choice of system operators because of the shiftable nature of EV charging load. Electricity price is the only influencing parameter in performing demand response in the decentralized strategy. This leads to the decentralized dynamic pricing mechanism for demand response (Chen et al., 2017). In this mechanism, the aggregator dynamically varies the electricity prices when a demand-generation mismatch is present in the system. This dynamic price variation indirectly forces EV owners to reduce the demand. This action of aggregator invisibly performs demand response from EV charging load in a decentralized framework.
Dynamic electricity prices mainly influence cost minimization, maximum RE utilization, and ancillary services as charging cost are the important constraint.

Smart Charging Strategies and Technologies for Electric Vehicles Simulation-based study to evaluate the effects of E-mobility smart charging strategies140
In the demand response situation, some of the restrictions on the pricing signal variation are not applied to restrict the charging behaviour of the EVs aggressively. If these additional price constraints are not eliminated at the demand response time, it might not give the desired results in terms of demand response. As mentioned above, there are many restrictions on the value of the dynamic prices to make it affordable for the customer at normal operating conditions. These restrictions on dynamic price variations are the minimum and maximum price limits. The price difference between average prices that should be less than a threshold value is omitted in the demand response situation. In a decentralized strategy for demand response, the aggregator is free to set the prices in a grid safety situation; otherwise, it may lead to grid instability and grid collapse.
Detailed information on different strategies for smart charging, optimization approaches, and smart charging techniques available in the review papers format in literature are listed in Table 15.
Table 15: List of reference papers in literature
Topics covered Source
Optimization techniques and charging techniques and
charging approaches, and optimization based on the
objective function
(Amjad et al., 2018)
Provides the idea on EV for developing countries (Rajper and Albrecht, 2020)
Provides optimal charging strategies unwder a dynamic
pricing scheme
(Amin et al., 2020)
Described optimization algorithms for distributed control (Nimalsiri et al., 2020)
Survey-based on optimization algorithmic perspective is
presented
(Wang et al., 2016)
Interactive and intelligent smart charging is reviewed (Chan et al., 2014)
Machine learning-based smart charging approach is detailed,
focusing on unsupervised learning
(Shahriar et al., 2020)
Smart charging techniques for providing ancillary service,
considering battery degradation cost, are provided in detail.
(Saldaña et al., 2019)
Promising practices of smart charging globally is given in
details
(Hildermeier et al., 2019)
Smart charging strategy of electric vehicles in the presence
of photovoltaic and grid power is given.
(Fachrizal et al., 2020)2020

141 Smart Charging Strategies and Technologies for Electric Vehicles Simulation-based study to evaluate the effects of E-mobility smart charging strategies
11Fleet Control Charging Strategy
Fleet control is applicable to public/private passenger buses, logistic vehicle fleets, and heavy-duty commercial fleets. Its control and coordination are motivated for specific objectives, such as maximizing the EV charging during off-time, maximizing the RE utilization, and finding optimal coordination between charging sessions and travelling trips. Figure 85 shows the different objectives of fleet control. The centralised strategy is majorly used for fleet control as it can schedule the fleet charging based on different objectives.
In addition to system operators’ desired objectives mentioned above, it also helps achieve fleet operators’ desired objectives of planned trips with minimum energy at the coordinated lowest possible time. From the fleet operator’s perspective, the vehicle fleet should coordinate the charging such that it will not affect the travelling schedule of any vehicle in the fleet.
Fleets are charged in a coordinated manner by allocating appropriate charging stations on the route or bus depot. Charging the fleet at off-service time necessitates the need for coordinated control to reduce the extra burden on peak load due to fleet charging of the heavy-duty vehicle. For long-distance travel or a routine travel charging allocation over the travelling route, charging points are also essential to cover long distances and reduce the load on a single charging station.
Fleet coordination objectives
V2G Service (Karfopoulos et
al., 2016)
Congestion prevention
(Sundstrom and Binding, 2010)
Minimizing battery degradation (Moghaddass et al., 2019)
Maximum RE utilization
(Frendo et al., 2020)
Maintaining grid constrain (Hu et
al., 2014)
Minimize charging cost
(Hu et al., 2014)
Figure 85: Objectives for fleet coordination
Fleet control is applicable to public/private passenger buses, logistic vehicle fleets, and heavy-duty commercial fleets

Smart Charging Strategies and Technologies for Electric Vehicles Simulation-based study to evaluate the effects of E-mobility smart charging strategies142
Local RE integration at a fleet operated charging station is the best solution for cost minimization and system’s stress reduction. However, the strategy of integrating RE into the fleet operated charging station poses some issues in time coordination in between travelling time and RE availability. For example, suppose the charging station is energised from local solar PV. In that case, the RE generation will be available only in the daytime, but it is inconvenient for the fleet to charge during the day due to the travelling schedule.
This issue can be technically addressed by adding battery storage which will increase the charging station’s capital cost. So, smart charging in a coordinated manner is the best way to manage fleet charging with RE utilisation.
Fleet coordination is performed using different optimisation methods as linear, quadratic programming, mixed-integer linear programming, etc. Some control approaches such as droop-based control and fuzzy control are also used for fleet coordination. In addition to optimisation and controller-based approach, it is also being coordinated using a data-driven and machine-learning-based approach. Objectives, approaches for implementation and methods for fleet control and coordination are shown in Figure 85 and Figure 86.
The strategies described above have different associated attributes related to computation, communication, and cost. A comparison of different charging strategies based on various attributes is shown in Table 15, which shows that centralised strategy requires the highest cost investment, high bandwidth, and computation capabilities but low in flexibility and scalability. Table 16 summarises fleet coordination based on implementation methods mentioning objective functions, constraint parameters, and applications.
Fleet coordination based on techiniques
Quadratic optimization
(Moghaddass et al., 2019)
Linear optimization
(Hu et al., 2011)
Optimization
Mixed integer linear programming (Hu et al., 2014)
Multiagent Reinforcement learning (Silva et al., 2020)
Colored petri net controller (Kaur et al., 2016)
Spital and temporal coordination (Yu et al., 2015)
Data-driven fleet transition (Frendo et al., 2020)
Iterative algorithm (Karfopoulos et al., 2016)
Droop based control (Karfopoulos et al., 2016)
Fuzzy control (Wang et al., 2020)
Figure 86: Methods for fleet coordination

143 Smart Charging Strategies and Technologies for Electric Vehicles Simulation-based study to evaluate the effects of E-mobility smart charging strategies
Table 16: Comparision of different charging strategy
Higher Medium Low/less
Control Centralized Decentralized/
Distributed
Hierarchical Local
Implementation
efforts required
Communication
required
Adaptable with
large number of
EV’s
Cost required
Computational
burden
Table 17: Summary of fleet coordination based on implementation methods
Algorithm Objective Parameters Application in
EV charging
Reference
Mixed-integer
multi objective
optimisation
Power system objective
1. Minimize power
system cost
2. Minimize load
variation
Power system’s
parameters
1. Capacity limit of the
system operator
2. Cost of electricity
production
1. Minimise
charging
cost
2. Minimise
power
system
losses
3. Maximize
benefit from
providing
different
regulation
services
(Moghaddass
et al., 2019)
EV owner’s objective
1. EV owner’s
charging cost
2. Minimize difference
between desired
and effective SOC
5. Minimise travelling
distance to
charging station
6. Minimise waiting
time at charging
station
EV owner’s parameters
1. Minimum and
maximum required
SOC
2. Power consumption
of EV
3. Maximum charging
rate of battery
Charger and charging
station’s parameters
1. Maximum charging
rate of the charger
2. Selling electricity
price
Linear
programming
Minimise the charging
cost of the EV fleet
1. Predicted electricity
price
2. Predicted driving
pattern
Minimize
charging cost
(Hu et al.,
2011)
Projected
sub-gradient
method
Minimize cost
function (Congestion
minimisation)
1. Energy requirement
of fleet
2. Predicted price
signal
1. Maintain
feeder
capacity
constraint
2. Congestion
minimisation
(Hu et al.,
2014)

Smart Charging Strategies and Technologies for Electric Vehicles Simulation-based study to evaluate the effects of E-mobility smart charging strategies144
Algorithm Objective Parameters Application in
EV charging
Reference
Colored Petri
Net
Provide frequency
support
1. Battery capacity
2. Voltage battery
Provide
ancillary
services
(Kaur et al.,
2016)
Spatial and
temporal
coordination
Minimise load
variance
1. Charging load
power
1. Minimize
the charging
cost
2. Maximize
user’s
degree of
satisfaction
(Yu et al.,
2015)
Adaptive
droop control
Frequency support 1. Regulated dispatch
request signal
2. SOC
3. Battery current
1. Maintain
voltage
within limits
(Karfopoulos
et al., 2016)

145 Smart Charging Strategies and Technologies for Electric Vehicles Simulation-based study to evaluate the effects of E-mobility smart charging strategies
12Charging Station Coordination
Suitable coordination of charging stations within the network is necessary for optimal power-sharing within the charging station after optimal charging power allocation based on the grid’s available power capacity and EV’s energy requests at the network level. Optimal charging power coordination within charging station is determined by considering various objectives, such as profit maximization of charging station, delivery of requested power within parking time slots and avoidance of overloading of the station infrastructure. Charging station coordination requires a priority list of EV charging based on customer preference of smart charging, parking time and the difference between parking time and time required for charging with the maximum charging capacity. This prioritization helps coordinate charging stations as per the charging station operator’s and EV owner’s preferences. Optimal charging power allocation and vehicle-to-charging station coordination are combined to perform smart charging for an EV. The necessity and importance of charging point coordination are discussed using two example cases as described below.
In the G2V mode of operation, the aggregator will optimally allot charging power at every slot. After receiving the charging power signal, the charging station operator’s responsibility is to coordinate the allocated power within available charging points. This optimal charging point allocation considers the objective of maximum revenue generation, satisfying customers’ requirements based on the rating of EVSE and parking time allotted to the EVSE.
In V2G operation, the aggregator will generate a quantum of discharging power for an individual charging station. After receiving the allotted signal, the station operator’s responsibility is to coordinate the available EVs for discharging at that instant. This optimal discharging power allocation is decided based on the SOC level, battery specification, and the vehicle’s remaining parking time.
As reported in the literature, the studies on charging points coordination majorly use multilevel optimisation, where the first level is the optimal allocation of charging power to individual charging stations. The second level is optimal charging power allocation to individual charging points or EVSE within the charging station. These two
Case1:
Case2:
Charging station coordination requires a priority list of EV charging based on customer preference of smart charging, parking time and the difference between parking time and time required for charging with the maximum charging capacity.

Smart Charging Strategies and Technologies for Electric Vehicles Simulation-based study to evaluate the effects of E-mobility smart charging strategies146
operation levels are cyclic processes for performing smart charging of EV. The game theory approach applies to such multilevel optimisation since it allows each level to optimise the objective function of their specific interest. It resembles the actual performance of participants in EV charging space such that each EV has their own charging behaviour, and each EV owner wants to minimise the charging cost. Other optimisation algorithms and techniques, namely MILP, the fuzzy logic controller, is also available for such a multi-objective problem for charging points allocation.
In (Clemente et al., 2014), the authors have discussed the charging point allocation using mixed-integer linear programming. In the study, MILP is used for maximizing the user’s utility by minimizing the charging cost. The cost of charging for an individual EV constitutes four factors - total waiting time, fixed cost of charging station, the cost associated with the distance between EV and charging station, and penalty cost for incomplete charging. This cost function is minimized considering various constraints, such as the assignment of an individual EV to a single charging point, assignment to any facility (V2G) only if its SOC level is sufficient, the time required to reach the desired SOC, charging station’s capacity and completion of charging within the departure time. The study is performed with 50 vehicles and 5 charging stations with different charging points for 12 hours (48 slots with 15 minutes each slot).
Figure 87: Optimal assignment and charging scheduling (Clemente et al., 2014)
The results in Figure 87 shows the allocation of charging points within different charging station. The coloured boxes indicate the EV allotted to a specific charging slot and charging point.
The study reported in (Yan et al., 2021) focuses on allocating charging power to each EV connected to a charging point within the charging station. The non-cooperative game theory approach has been used to solve the utility function of each EV. The utility function of EV is defined as the combination of requested power and charging preference (slow, fast, superfast). The method allocates optimal power, satisfying customer requirements and utility functions of individual EVs using the non-cooperative Nash equilibrium method. This equilibrium establishment is performed using two methods: centralised and distributed. The centralised method needs information of all the users at the energy time slot. Hence, it is not suitable for users’ privacy and has less flexibility due to high concentric computational power requirements. In contrast, the distributed method is more secure in data privacy and more flexible due to distributed computation.
Charging station coordination requires a priority list of EV charging based on customer preference of smart charging, parking time and the difference between parking time and time required for charging with the maximum charging capacity.
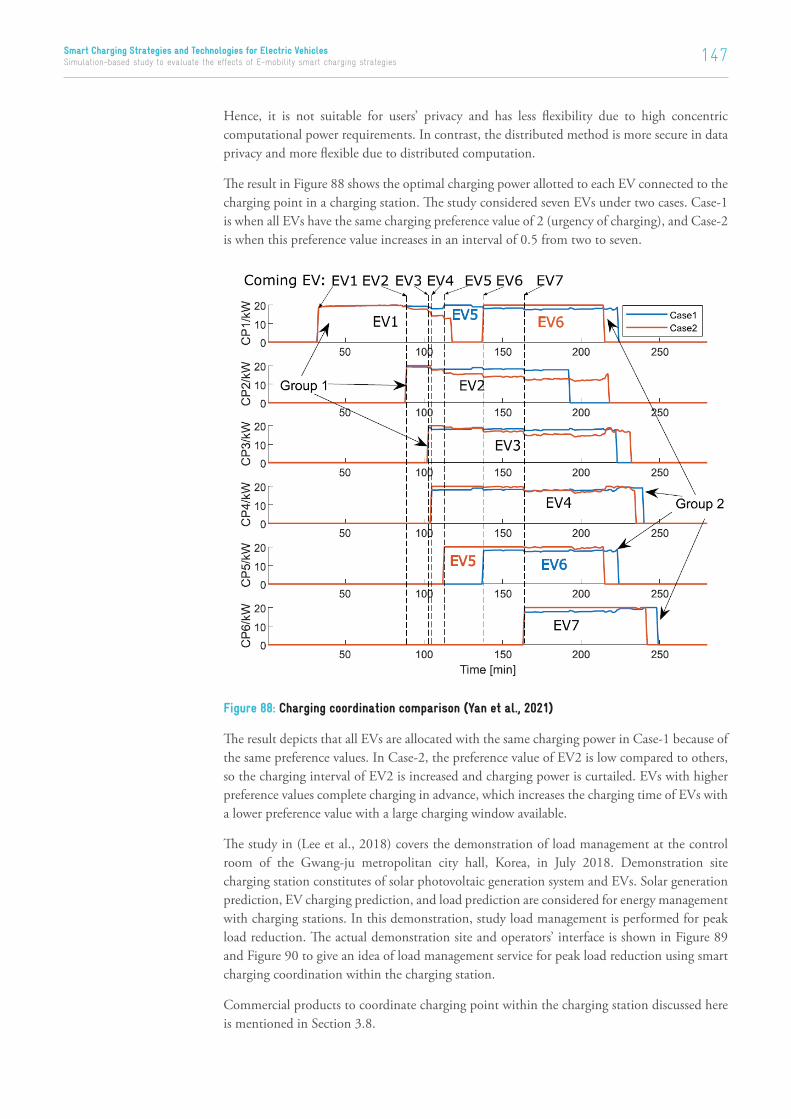
147 Smart Charging Strategies and Technologies for Electric Vehicles Simulation-based study to evaluate the effects of E-mobility smart charging strategies
Hence, it is not suitable for users’ privacy and has less flexibility due to high concentric computational power requirements. In contrast, the distributed method is more secure in data privacy and more flexible due to distributed computation.
The result in Figure 88 shows the optimal charging power allotted to each EV connected to the charging point in a charging station. The study considered seven EVs under two cases. Case-1 is when all EVs have the same charging preference value of 2 (urgency of charging), and Case-2 is when this preference value increases in an interval of 0.5 from two to seven.
Figure 88: Charging coordination comparison (Yan et al., 2021)
The result depicts that all EVs are allocated with the same charging power in Case-1 because of the same preference values. In Case-2, the preference value of EV2 is low compared to others, so the charging interval of EV2 is increased and charging power is curtailed. EVs with higher preference values complete charging in advance, which increases the charging time of EVs with a lower preference value with a large charging window available.
The study in (Lee et al., 2018) covers the demonstration of load management at the control room of the Gwang-ju metropolitan city hall, Korea, in July 2018. Demonstration site charging station constitutes of solar photovoltaic generation system and EVs. Solar generation prediction, EV charging prediction, and load prediction are considered for energy management with charging stations. In this demonstration, study load management is performed for peak load reduction. The actual demonstration site and operators’ interface is shown in Figure 89 and Figure 90 to give an idea of load management service for peak load reduction using smart charging coordination within the charging station.
Commercial products to coordinate charging point within the charging station discussed here is mentioned in Section 3.8.
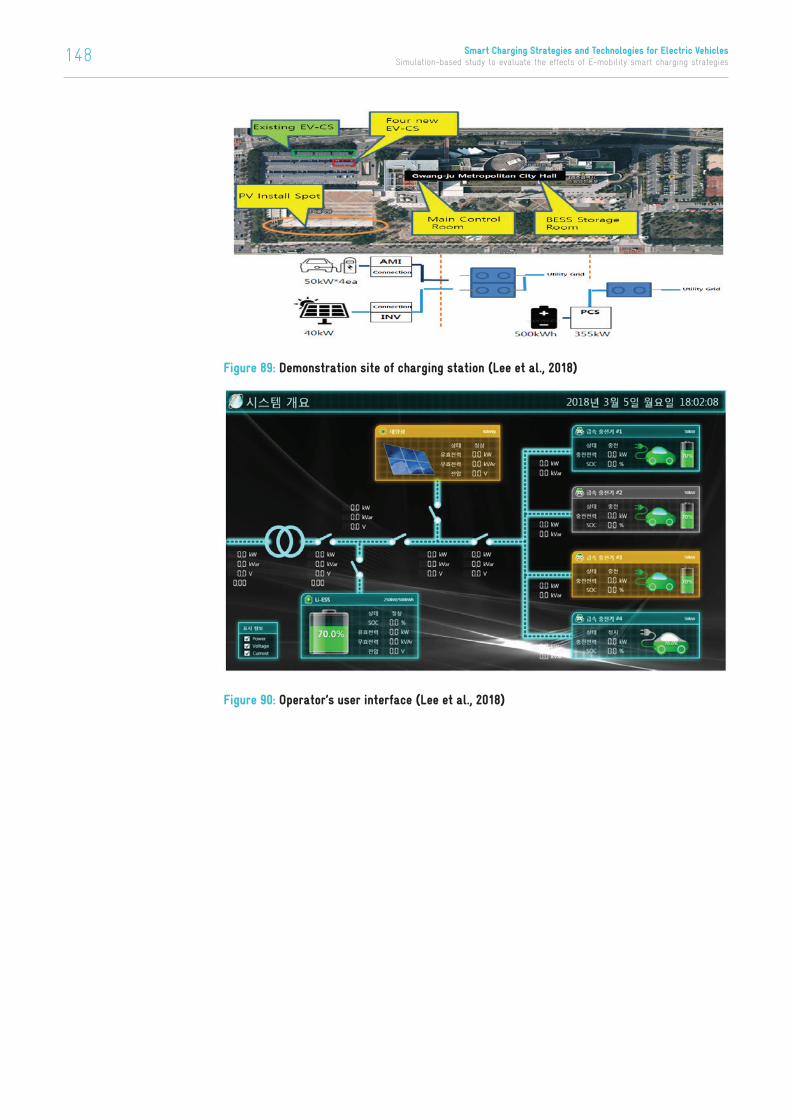
Smart Charging Strategies and Technologies for Electric Vehicles Simulation-based study to evaluate the effects of E-mobility smart charging strategies148
Figure 89: Demonstration site of charging station (Lee et al., 2018)
Figure 90: Operator’s user interface (Lee et al., 2018)

149 Smart Charging Strategies and Technologies for Electric Vehicles Simulation-based study to evaluate the effects of E-mobility smart charging strategies
13Conclusion and Way Forward
This report documents the overall landscape of smart charging including smart charging technology, smart charging strategies, smart charging solutions, and smart charging deployment projects. The international experience strongly suggests that smart charging is expected to play a key role in seamless adoption of EVs and charging infrastructure, open several avenues for grid support and grid management aspects, help in maximising RE utilisation, and cost effective EV management and grid operation. The next step includes the development of a robust framework for selecting key charging strategies and coordination approaches suitable to Indian context. The portfolio of these selected charging strategies will be used to conduct detailed grid modelling simulations using a reliable open source environment based on actual data from selected feeders in the distribution line of three cities in India. Load flow computations and state of the grid will be evaluated. Various test cases will be prepared and tested for different charging scenarios.
The large-scale deployment of electric vehicles can result in various protection related issues as the electrical characteristics of the distribution feeder will be altered depending on EV charging station distribution across the feeder and their charging behaviour. EV integration in the distribution feeder will affect the power flow pattern including reverse power flow, particularly in the presence of distributed energy sources. EVs can significantly influence the short circuit characteristics of a distribution feeder depending on the charging station capacity, charging strategy (slow/fast, controlled/uncontrolled), location and its response to a fault in the distribution feeder. Therefore, the next report will also investigate how EV integration can influence the short circuit aspects of a distribution feeder including the substation transformer, potential impact on existing protection coordination schemes considering balanced and unbalanced faults of different severity and duration. For instance, dynamic analysis involving short circuit/ fault analysis will be conducted.
The final report from this project will lay out set of comprehensive technical, policy and regulatory guidelines for smart charging of EVs in India for field implementation. The development of such guidelines would depend upon how accurately and precisely the best fit strategies, business models, tariff structures, infrastructure reinforcement, demand response, consumer behaviour, international best practices etc. have been understood and considered. The learnings from the current report and the subsequent report(s) will be utilized to have the set of holistic guidelines for smart charging adoption in Indian EV ecosystem.
The final report from this project will lay out set of comprehensive technical, policy and regulatory guidelines for smart charging of EVs in India for field implementation.

Smart Charging Strategies and Technologies for Electric Vehicles Simulation-based study to evaluate the effects of E-mobility smart charging strategies150

151 Smart Charging Strategies and Technologies for Electric Vehicles Simulation-based study to evaluate the effects of E-mobility smart charging strategies
References
ABB: Pantograph down for electric buses. Online verfügbar unter https://new.abb.com/ev-charging/products/pantograph-down, zuletzt geprüft am 18.03.21.
Abousleiman, R., 2015. Smart Charging: System Design and Implementation for Interaction Between Plug-in Electric Vehicles and the Power Grid. IEEE TRANSACTIONS ON TRANSPORTATION ELECTRIFICATION 1, 8.
ads-tec Holding GmbH: StoraXe® Mobile High Power Charger. Online verfügbar unter https://www.ads-tec.de/energy-storage/industrial-infrastructure/mobile-high-power-charger/storaxe-mobile-high-power-charger.html, zuletzt geprüft am 18.03.21.
Alternative Fuels Data Center: Plug-In Electric Vehicle (PEV) Charging Study Incentive - Tacoma Public Utility (TPU) (no date). Available at: https://afdc.energy.gov/laws/12383 (Accessed: 3 June 2021).
Alternative Fuels Data Center: Smart Charging and Time-of-Use (TOU) Incentives - Orange & Rockland Utilities (O&R) (no date). Available at: https://afdc.energy.gov/laws/12559 (Accessed: 3 June 2021).
Amin, A., Tareen, W.U.K., Usman, M., Ali, H., Bari, I., Horan, B., Mekhilef, S., Asif, M., Ahmed, S., Mahmood, A., 2020. A Review of Optimal Charging Strategy for Electric Vehicles under Dynamic Pricing Schemes in the Distribution Charging Network. Sustainability 12, 10160. https://doi.org/10.3390/su122310160
Amjad, M., Ahmad, A., Rehmani, M.H., Umer, T., 2018. A review of EVs charging: From the perspective of energy optimization, optimization approaches, and charging techniques. Transportation Research Part D: Transport and Environment 62, 386–417.
‘Andhra Pradesh Electric Mobility Policy 2018-23’ (2018). Industries & Commerce Department. Available at: https://evreporter.com/wp-content/uploads/2019/09/AP-Policy_final.pdf.
Andhra Pradesh and Electricity Regulatory Commission (2020) ‘Retail Supply Tariffs 2020-21’. Available at: https://www.apspdcl.in/pdf/RSTOrderFY202021.pdf.
Arnhem (2017) ‘EV Related Protocol Study’. Elaad NL. Available at: https://www.elaad.nl/uploads/files/EV_related_protocol_study_v1.1.pdf.
Arnold, Gunter; Brandl, Ron; Degner, Thomas; Gerhardt, Norman; Landau, Markus; Nestle, David et al. (2015): Intelligente Netzanbindung von Elektrofahrzeugen zur Erbringung von Systemdienstleistungen – INEES.
Bauman, J., Stevens, M.B., Hacikyan, S., Tremblay, L., Mallia, E., Mendes, C.J., 2016. Residential Smart-Charging Pilot Program in Toronto: Results of a Utility Controlled Charging Pilot. WEVJ 8, 531–542. https://doi.org/10.3390/wevj8020531
BDEW (2017): Konkretisierung des Ampelkonzepts im Verteilungsnetz.
BEE (no date) ‘Propelling Electric Vehicles in India: Technical study of Electric Vehicles and Charging Infrastructure’. Available at: https://beeindia.gov.in/sites/default/files/2019%20-%20EY%20to%20BEE%20-%20Technical%20study%20on%20EVs%20%26%20Charging%20Infrastructure.pdf.
Bentley, E., Putrus, G., Kotter, R., Marzband, M., Wang, Y., Das, R., n.d. Final report - Leicester City Hall Operational Pilot 60.
Bhagwat, P. C., Hadush, S. Y., & Bhagwat, S. (2019). Charging up India’s electric vehicles: Infrastructure deployment and power system integration. European University Institute.
‘Bihar Electric Vehicle Incentive Policy: Draft’ (2019). Available at: http://www.investbihar.co.in/Download/Draft_for_e_vechile.pdf.
Bihar Electricity Regulatory Commission (2020) ‘Tariff Order:Truing up for FY 2018-19,Annual Performance Review for FY 2019-20,Annual Revenue Requirement (ARR) and determination of Retail Tariff for FY 2020-21’. Available at: https://berc.co.in/images/pdf/tariff-order/TO-20-21-DISCOMS.pdf.
BIS (2018) IS 17017 Part 1: 2018 Electric Vehicle Conductive Charging System Part 1 General Requirements, Bureau of Indian standard. Available at: https://standardsbis.bsbedge.com/BIS_SearchStandard.aspx?Standard_Number=IS%2017017%20:%20Part%201&id=23427.
Blue Bird Introduces All-New Electric School Bus Solutions [WWW Document], n.d. URL https://www.blue-bird.com/about-us/press-releases/134-blue-bird-introduces-all-new-electric-school-bus-solutions (accessed 3.24.21).

Smart Charging Strategies and Technologies for Electric Vehicles Simulation-based study to evaluate the effects of E-mobility smart charging strategies152
Bordin, C., Anuta, H.O., Crossland, A., Gutierrez, I.L., Dent, C.J., Vigo, D., 2017. A linear programming approach for battery degradation analysis and optimization in offgrid power systems with solar energy integration. Renewable Energy 101, 417–430. https://doi.org/10.1016/j.renene.2016.08.066
Brenna, Morris; Foiadelli, Federica; Leone, Carola; Longo, Michela: Electric Vehicles Charging Technology Review and Optimal Size Estimation. In: Journal of Electrical Engineering & Technology.
Bünger, Ulrich; Nicolai, Steffen; Zerhusen, Jan; Monsalve, Cristian; Kharboutli, Samir; Michalski, Jan et al. (2019): Infrastrukturbedarf E Mobilität.
Catalog 2020 Electric vehicle charging solutions | EVlink | Schneider Electric, n.d.
CEA (2019) ‘Furnishing of Information on Public Charging Stations (PCS) for Electric Vehicle by DISCOMs to the Central Electricity Authority’. Available at: https://cea.nic.in/old/reports/others/planning/rpm/ev_discoms.pdf.
CEA (no date) Central Electricity Authority: Technical Standards for Connectivity of the Distributed Generation Resources (Amendment) Regulations, 2019. Available at: https://powermin.gov.in/sites/default/files/uploads/CEA_Technical_Standards_06_02_2019.pdf.
CHAdeMO Association (24.04.20): CHAdeMO 3.0 released: the first publication of ChaoJi, the new plug harmonised with China’s GB/T. Online verfügbar unter https://www.chademo.com/chademo-3-0-released/, zuletzt geprüft am 18.03.21.
Chan, C.C., Jian, L., Tu, D., 2014. Smart charging of electric vehicles – integration of energy and information. IET Electrical Systems in Transportation 4, 89–96. https://doi.org/10.1049/iet-est.2013.0025
‘Chandigarh EV Policy (draft)’ (2019). Available at: https://evreporter.com/chandigarh-ev-policy-2019/.
ChargePoint ECO [WWW Document], n.d. . ChargePoint. URL https://www.chargepoint.com/products/chargepoint-eco (accessed 3.23.21).
ChargePoint Open Network | ChargePoint [WWW Document], n.d. URL https://www.chargepoint.com/products/network/ (accessed 3.23.21).
ChargePoint’s Driver Experience Network [WWW Document], n.d. . ChargePoint. URL https://www.chargepoint.com/products/driver-experience-network (accessed 3.23.21).
‘Charging Infrastructure for Electric Vehicle: Revised Guideline and Standards, MoP, 2019’ (no date). Available at: https://powermin.gov.in/sites/default/files/uploads/Revised_MoP_Guidelines_01_10_2019.pdf (Accessed: 16 April 2021).
CharIN e. V. (13.10.20): The CharIN path to Megawatt Charging (MCS): Successful connector test event at NREL. Online verfügbar unter https://www.charinev.org/news/news-detail-2018/news/the-charin-path-to-megawatt-charging-mcs-successful-connector-test-event-at-nrel/, zuletzt geprüft am 18.03.21.
Chen, Q., Wang, F., Hodge, B., Zhang, J., Li, Z., Shafie-Khah, M., Catalão, J.P.S., 2017. Dynamic Price Vector Formation Model-Based Automatic Demand Response Strategy for PV-Assisted EV Charging Stations. IEEE Transactions on Smart Grid 8, 2903–2915. https://doi.org/10.1109/TSG.2017.2693121
Clairand, J., García, J.R., Bel, C.A., 2017a. Smart charging for an electric vehicle aggregator considering user tariff preference, in 2017 IEEE Power Energy Society Innovative Smart Grid Technologies Conference (ISGT). Presented at the 2017 IEEE Power Energy Society Innovative Smart Grid Technologies Conference (ISGT), pp. 1–5. https://doi.org/10.1109/ISGT.2017.8086068
Clairand, J., García, J.R., Bel, C.Á., Sarmiento, P.P., 2017b. A tariff system for electric vehicle smart charging to increase renewable energy sources use, in 2017 IEEE PES Innovative Smart Grid Technologies Conference - Latin America (ISGT Latin America). Presented at the 2017 IEEE PES Innovative Smart Grid Technologies Conference - Latin America (ISGT Latin America), pp. 1–6. https://doi.org/10.1109/ISGT-LA.2017.8126717
Clairand, J.-M., Álvarez-Bel, C., 2018. Smart Charging for Electric Vehicle Aggregators Considering Users’ Preferences 6, 12.
Clairand, J.-M., Rodríguez-García, J., Álvarez-Bel, C., 2020. Assessment of Technical and Economic Impacts of EV User Behavior on EV Aggregator Smart Charging. Journal of Modern Power Systems and Clean Energy 8, 356–366. https://doi.org/10.35833/MPCE.2018.000840
Clairand, J.-M., Rodríguez-García, J., Álvarez-Bel, C., 2018. Smart charging for electric vehicle aggregators considering users’ preferences. IEEE Access 6, 54624–54635.
Clairand, Jean-Michel, Rodr韌uez-Garc韌, J., 韌varez-Bel, C., 2020. Assessment of Technical and Economic Impacts of EV User Behavior on EV Aggregator Smart Charging. Journal of Modern Power Systems and Clean Energy 8, 356–366. https://doi.org/10.35833/MPCE.2018.000840

153 Smart Charging Strategies and Technologies for Electric Vehicles Simulation-based study to evaluate the effects of E-mobility smart charging strategies
Clemente, M., Fanti, M.P., Ukovich, W., 2014. Smart Management of Electric Vehicles Charging Operations: the Vehicle-to-Charging Station Assignment Problem. IFAC Proceedings Volumes, 19th IFAC World Congress 47, 918–923. https://doi.org/10.3182/20140824-6-ZA-1003.01061
Cloud, P.A., 1998. Product introduction, in: Engineering Procedures Handbook. Elsevier, pp. 10–18. https://doi.org/10.1016/B978-081551410-7.50006-4
Commerce and Transport Department (2021) ‘Odisha Electric Vehicle Policy 2021:Draft’. Available at: https://ct.odisha.gov.in/news/odisha-electric-vehicle-policy2021.
‘Concept paper on Regulatory Framework for Promoting Electric Vehicles and their Impact on the Grid’ (2020). Available at: https://www.rajras.in/wp-content/uploads/2020/06/Concept-Paper-on-EV-RERC.pdf.
Continental: AllCharge System. Online verfügbar unter https://www.continental-automotive.com/DE/Passenger-Cars/Technology-Trends/Electrification/Charging/AllCharge-System, zuletzt geprüft am 27.07.21.
Continental Engineering Services: CES Automated Conductive Charging System. Online verfügbar unter https://conti-engineering.com/technology-systems/systems-functions/automated-conductive-charging-system/, zuletzt geprüft am 18.03.21.
Cross, J.D., Hartshorn, R., 2016. My Electric Avenue: Integrating electric vehicles into the electrical networks, in 6th Hybrid and Electric Vehicles Conference (HEVC 2016). Presented at the 6th Hybrid and Electric Vehicles Conference (HEVC 2016), pp. 1–6. https://doi.org/10.1049/cp.2016.0972
Darab, P.-C., 2018. Strategies for Charging Electric Vehicles in Smart Grid, in 2018 International Conference and Exposition on Electrical And Power Engineering (EPE). Presented at the 2018 International Conference and Exposition on Electrical And Power Engineering (EPE), IEEE, Iasi, pp. 1019–1022. https://doi.org/10.1109/ICEPE.2018.8559743
del Razo, V., Jacobsen, H.-A., 2016. Smart Charging Schedules for Highway Travel With Electric Vehicles. IEEE Trans. Transp. Electrific. 2, 160–173. https://doi.org/10.1109/TTE.2016.2560524
‘Delhi Electric Vehicle Policy 2020, Govt. of National capital Territory of Delhi’ (2020). GOVERNMENT OF NATIONAL CAPITAL TERRITORY OF DELHI (TRANSPORT DEPARTMENT). Available at: https://transport.delhi.gov.in/sites/default/files/All-PDF/Delhi_Electric_Vehicles_Policy_2020.pdf.
Delhi Electricity Regulatory Commission (no date) ‘ELECTRICITY TARIFF SCHEDULE FOR FY 2020-21’. Available at: http://www.derc.gov.in/sites/default/files/Tariff%20Schedule%202020-21.pdf.
DHI (2015) ‘Notification: Scheme for Faster Adoption and Manufacturing of (Hybrid &) Electric Vehicle in India – FAME India’. Available at: https://smartnet.niua.org/sites/default/files/resources/gazette_notification_fame_india.pdf.
DHI (2017) ‘Standardization of protocol for charging structure’. Department of heavy Industry. Available at: https://dhi.nic.in/writereaddata/UploadFile/Standardization%20of%20protocol.pdf.
DHI (2019a) ‘FAME II India Scheme’. Available at: https://fame2.heavyindustry.gov.in/content/english/11_1_PolicyDocument.aspx.
DHI (2019b) ‘Notification: Scheme for Faster Adoption and Manufacturing of Electric Vehicle in India Phase II– (FAME India Phase II)’. Department of Heavy Industries, Ministry of Heavy Industries and Public Enterprises., GoI. Available at: https://dhi.nic.in/writereaddata/uploadfile/publicationnotificationfame%20ii%208march2019.pdf.
DHI (2019c) ‘Phased Manufacturing Program (PMP) for EV parts eligibility under FAME-II’. Available at: https://dhi.nic.in/writereaddata/fame/famedepository/6-E__didm_WriteReadData_userfiles_PMP%2029%20March%20(3).pdf.
DHI (2019d) ‘Phased Manufacturing program (PMP): indigenous Manufacturing of Electric Vehicle, assemblies/sub-assemblies, and part/sub-part/input of sub-assemblies”’. Available at: https://dhi.nic.in/writereaddata/fame/famedepository/1-pmp.pdf.
DHI (2020) ‘National Electric Mobility Mission Plan 2020’. Department of Heavy Industries, Ministry of Heavy Industries and Public Enterprises, GoI.
DHI DashBoard (no date). Available at: https://dash.heavyindustry.gov.in/ (Accessed: 3 June 2021).
Dutta, G., Mitra, K., 2017. A literature review on dynamic pricing of electricity. J Oper Res Soc 68, 1131–1145. https://doi.org/10.1057/s41274-016-0149-4

Smart Charging Strategies and Technologies for Electric Vehicles Simulation-based study to evaluate the effects of E-mobility smart charging strategies154
Eajal, A.A., Shaaban, M.F., El-Saadany, E.F., Ponnambalam, K., 2015. Fuzzy logic-based charging strategy for Electric Vehicles plugged into a smart grid, in: 2015 IEEE International Conference on Smart Energy Grid Engineering (SEGE). Presented at the 2015 IEEE International Conference on Smart Energy Grid Engineering (SEGE), IEEE, Oshawa, ON, Canada, pp. 1–6. https://doi.org/10.1109/SEGE.2015.7324606
‘Electric Vehicles – Energy Efficiency Services Limited’ (no date). Available at: https://eeslindia.org/en/electric-vehicles/ (Accessed: 4 June 2021).
E-Mobility | Bureau of Energy Efficiency (no date). Available at: https://beeindia.gov.in/content/e-mobility (Accessed: 4 June 2021).
emobility.enelx [WWW Document], n.d. URL https://docs-emobility.enelx.com/Videos/AppWalkthrough.html (accessed 4.8.21).
ETE connectivity (2016) ‘IEC 62196 Electric Vehicle Charge Connector Assembly (Type 2 for Mode 2 and 3)’. Available at: https://www.dalroad.com/wp-content/uploads/2016/08/Type-II-connector-product-spec.pdf.
EV Site Solution - EV Charging | Electric Vehicle Chargers | ABB [WWW Document], n.d. URL https://new.abb.com/ev-charging/ev-charging-infrastructure/ev-site-solution (accessed 3.23.21).
Fachrizal, R., Shepero, M., van der Meer, D., Munkhammar, J., Widén, J., 2020. Smart charging of electric vehicles considering photovoltaic power production and electricity consumption: A review. eTransportation 4, 100056. https://doi.org/10.1016/j.etran.2020.100056
Feng, Yu; Xing, Liu; Xinsong, Zhang; Zhihao, Zhu (2019): Model Predictive Virtual-Flux Control of Three-Phase Vienna Rectifier Without Voltage Sensors. In: IEEE Access (7).
Firmansyah, Eka; Tomioka, Satoshi; Abe, Seiya; Shoyama, Masahito; Ninomiya, Tamotsu (2010): An Interleaved Totem-Pole Power Factor Correction Converter. Online verfügbar unter https://www.researchgate.net/figure/Totem-pole-dual-boost-PFC-rectifier-8_fig5_45573039, zuletzt geprüft am 23.08.21.
Frendo, O., Graf, J., Gaertner, N., Stuckenschmidt, H., 2020. Data-driven smart charging for heterogeneous electric vehicle fleets. Energy and AI 1, 100007. https://doi.org/10.1016/j.egyai.2020.100007
Gan, L., Topcu, U., Low, S.H., 2013. Optimal decentralized protocol for electric vehicle charging. IEEE Transactions on Power Systems 28, 940–951. https://doi.org/10.1109/TPWRS.2012.2210288
Get the ChargePoint App | ChargePoint [WWW Document], n.d. URL https://www.chargepoint.com/drivers/mobile/ (accessed 3.23.21).
Global EV Outlook 2020, 2020. 276.
Gonzalez Vaya, M., Andersson, G., 2012. Centralized and decentralized approaches to smart charging of plug-in Vehicles, in: 2012 IEEE Power and Energy Society General Meeting. Presented at the 2012 IEEE Power & Energy Society General Meeting. New Energy Horizons - Opportunities and Challenges, IEEE, San Diego, CA, pp. 1–8. https://doi.org/10.1109/PESGM.2012.6344902
Government of Punjab (2019) ‘Punjab Electric Vehicle Policy: Draft’. Available at: https://www.transportpolicy.net/wp-content/uploads/2019/12/Punjab_Draft_EV_Policy_20191115.pdf.
‘Gujarat state Electric vehicle Policy’ (2019). Available at: https://wri-india.org/sites/default/files/3.D1_S1_Gujarat%20State%20EV%20Draft%20Policy_Akash%20Davda.pdf.
Habib, Salman; Khan, Muhammad Mansoor; Abbas, Farukh; Ali, Abdar; Faiz, Muhammad Talib; Ehsan, Farheen (2020): Contemporary Trends in Power Electronics Converters for Charging Solutions of Electric Vehicles. In: CSEE JOURNAL OF POWER AND ENERGY SYSTEMS (6).
Han, S., Han, S., Sezaki, K., 2010. Development of an Optimal Vehicle-to-Grid Aggregator for Frequency Regulation. IEEE Transactions on Smart Grid 1, 65–72. https://doi.org/10.1109/TSG.2010.2045163
Haryana Electricity Regulatory Commission (2020) ‘Distribution & Retail Supply Tariff approved by the Commission for the FY 2021-22’. Available at: https://herc.gov.in/WriteReadData/Pdf/DR20210401.pdf and https://herc.gov.in/WriteReadData/Pdf/D20201028.pdf.
Hasselmann, Jörn (27.08.20): BVG elektrifiziert die Linie 200. Online verfügbar unter https://www.tagesspiegel.de/berlin/geladen-wird-der-bus-per-pantograf-bvg-elektrifiziert-die-linie-200/26133720.html, zuletzt geprüft am 18.03.21.
He, T., Bai, Y., Zhu, J., 2016. Optimal charging strategy of electric vehicles customers in a smart electrical car park.

155 Smart Charging Strategies and Technologies for Electric Vehicles Simulation-based study to evaluate the effects of E-mobility smart charging strategies
Hebermehl, Gregor (2019): Betrieb mit MEB-Batterien. VW stellt mobile Ladesäule vor. Online verfügbar unter https://www.auto-motor-und-sport.de/tech-zukunft/alternative-antriebe/vw-mobile-ladesaeulen-2018/, zuletzt geprüft am 18.03.2021.
Higgelke, Ralf (18.10.20): Wie die Preise für Siliziumkarbid-Wafer schneller sinken. Dr. Peter Friedrichs, Infineon. Online verfügbar unter https://www.elektroniknet.de/halbleiter/leistungshalbleiter/wie-die-preise-fuer-siliziumkarbid-wafer-schneller-sinken.179463.html, zuletzt geprüft am 18.03.21.
Hildermeier, J., Kolokathis, C., Rosenow, J., Hogan, M., Wiese, C., Jahn, A., 2019. Smart EV Charging: A Global Review of Promising Practices. World Electric Vehicle Journal 10, 80. https://doi.org/10.3390/wevj10040080
Hu, J., You, S., Lind, M., Østergaard, J., 2014. Coordinated Charging of Electric Vehicles for Congestion Prevention in the Distribution Grid. IEEE Transactions on Smart Grid 5, 703–711. https://doi.org/10.1109/TSG.2013.2279007
Hu, J., You, S., Oestergaard, J., Lind, M., Wu, Q., 2011. Optimal Charging Schedule of an Electric Vehicle Fleet, in: 2011 46th International Universities’ Power Engineering Conference (UPEC). Presented at the 2011 46th International Universities’ Power Engineering Conference (UPEC), pp. 1–6.
IANS (2021) Karnataka govt amends electric vehicle policy to attract more investments. Available at: https://www.thenewsminute.com/article/karnataka-govt-amends-electric-vehicle-policy-attract-more-investments-149932.
IEC 60309 standard plugs and sockets (no date). Available at: https://www.plugsocketmuseum.nl/IEC60309_1.html.
Infineon Technologies AG (1.19): Tackling the challenges of electric vehicle fast charging.
Jong, Nicole de (2020): Im Oberleitungs-Lkw über die A1: Erstaunlich unspektakulär. Online verfügbar unter https://www.electrive.net/2020/09/13/im-oberleitungs-lkw-ueber-die-a1-erstaunlich-unspektakulaer, zuletzt geprüft am 18.03.21.
JuiceNet: vehicle-to-grid cloud-based platform for grid balancing. [WWW Document], n.d. URL https://evcharging.enelx.com/products/juicenet-software/juicenet (accessed 3.23.21).
Jung, Marco (2016): Optimiertes multifunktionales bidirektionales Ladegerät für Elektrofahrzeuge. Dissertation. Universität Hannover, Hannover.
Karfopoulos, E.L., Panourgias, K.A., Hatziargyriou, N.D., 2016. Distributed Coordination of Electric Vehicles providing V2G Regulation Services. IEEE Transactions on Power Systems 31, 2834–2846. https://doi.org/10.1109/TPWRS.2015.2472957
‘Karnataka Electric Vehicle & Energy storage Policy 2017’ (2017). Commerce & Industries department, Govt. of Karnataka. Available at: https://kum.karnataka.gov.in/KUM/PDFS/KEVESPPolicyInsidepagesfinal.pdf.
Karnataka Electricity Regulatory Commission (2020) ‘KARNATKA ELECTRICITY TARIFF - 2021’. Available at: https://bescom.karnataka.gov.in/storage/pdf-files/RA%20section/Tariff%20Order%202020%20Rates.pdf.
Kaur, K., Kumar, N., Singh, M., 2019. Coordinated Power Control of Electric Vehicles for Grid Frequency Support: MILP-Based Hierarchical Control Design. IEEE Transactions on Smart Grid 10, 3364–3373. https://doi.org/10.1109/TSG.2018.2825322
Kaur, K., Rana, R., Kumar, N., Singh, M., Mishra, S., 2016. A Colored Petri Net Based Frequency Support Scheme Using Fleet of Electric Vehicles in Smart Grid Environment. IEEE Transactions on Power Systems 31, 4638–4649. https://doi.org/10.1109/TPWRS.2016.2518743
Kempton, W., Gardner, M., Hidrue, M., Kamilev, F., Kamboj, S., Lilley, J., McGee, R., Parsons, G., Pearre, N., Trnka, K., 2010. Vehicle to Grid Demonstration Project. Univ. of Delaware, Newark, DE (United States). https://doi.org/10.2172/1053603
‘Kerala Electric Vehicle Policy’ (2019). Transport Department. Available at: https://mvd.kerala.gov.in/sites/default/files/Downloads/e_vehicle_policy_go_no24_19.pdf.
Kolar, J. W.; Drofenik, U. (2000): VIENNA Rectifier - Grundfunktion und Vergleich hochfrequent getakteter einund zweistufiger Dreiphasen-Pulsgleichrichtersysteme mit sinusfiirmiger Stromaufnahme.
Latifi, M., Rastegarnia, A., Khalili, A., Sanei, S., 2019. Agent-Based Decentralized Optimal Charging Strategy for Plug-in Electric Vehicles. IEEE Transactions on Industrial Electronics 66, 3668–3680. https://doi.org/10.1109/TIE.2018.2853609

Smart Charging Strategies and Technologies for Electric Vehicles Simulation-based study to evaluate the effects of E-mobility smart charging strategies156
Lee, H., Byeon, G., Kim, G., Kim, J., 2018. Electric Vehicle Charging Station Operation and Management Key Functions for Actual Demonstration Site, in: 2018 International Conference and Utility Exhibition on Green Energy for Sustainable Development (ICUE). Presented at the 2018 International Conference and Utility Exhibition on Green Energy for Sustainable Development (ICUE), pp. 1–6. https://doi.org/10.23919/ICUE-GESD.2018.8635646
Liu, M., Phanivong, P.K., Shi, Y., Callaway, D.S., 2017. Decentralized charging control of electric vehicles in residential distribution networks. IEEE Transactions on Control Systems Technology 27, 266–281.
Ma, Z., Yang, N., Zou, S., Shao, Y., 2017. Charging coordination of plug-in electric vehicles in distribution networks with capacity constrained feeder lines. IEEE Transactions on Control Systems Technology 26, 1917–1924.
Ma, Z., Zou, S., Ran, L., Shi, X., Hiskens, I.A., 2016. Efficient decentralized coordination of large-scale plug-in electric vehicle charging. Automatica 69, 35–47. https://doi.org/10.1016/j.automatica.2016.01.035
Madhya Gujarat Vij Company Limited (MGVCL) (2020) ‘Tariff Order, Truing up for FY 2018-19, and Determination of Tariff for FY 2020-21’. Available at: https://www.mgvcl.com/Upload/circulars/GERC%20Tariff%20Order%20dated%2031%2003%202020%20for%20MGVCL.pdf.
‘Madhya Pradesh Electric Vehicle Policy’ (2019). Available at: http://mpurban.gov.in/Uploaded%20Document/guidelines/1-MPEVP2019.pdf.
Madhya Pradesh Electricity Regulation Commission (2020) ‘Aggregate Revenue Requirement and Retail Supply Tariff Order for FY 2020-21’. Available at: http://www.mperc.in/Retail%20Supply%20Tariff%20Order%20for%20FY%202020-21.pdf
Maharashtra Electricity Regulatory Comission (2020a) ‘Case of Adani Electricity Mumbai Limited (Distribution Business) for Approval of Truing-up of FY 2017-18 and FY 2018-19, Provisional Truing-up for FY 2019-20 and Aggregate Revenue Requirement (ARR) and Multi-Year Tariff (MYT) for 4th Control Period from FY 2020-21 to FY 2024-25’. Available at: https://www.adanielectricity.com/-/media/Project/Electricity/Regulatory/Distribution_MYT_Order_FY_21_to_FY_25.pdf?la=en.
Maharashtra Electricity Regulatory Comission (2020b) ‘Muti-year Tariff order Period FY 2020-21 to FY 2024-25’. Available at: https://www.mahadiscom.in/consumer/wp-content/uploads/2020/03/Order-322-of-2019.pdf.
‘Maharashtra’s Electric Vehicle Policy’ (2018). Department of Industries, Energy, and Labour. Available at: https://www.msins.in/guidelines_docs/english/EV_Policy.pdf.
Malhotra, A., Binetti, G., Davoudi, A., Schizas, I.D., 2017. Distributed Power Profile Tracking for Heterogeneous Charging of Electric Vehicles. IEEE Trans. Smart Grid 8, 2090–2099. https://doi.org/10.1109/TSG.2016.2515616
Mao, L., Wang, C., Mengge, M., 2019. A Hierarchical Control Strategy for Electric Vehicle Coordinated Charging, in: 2019 IEEE 2nd International Conference on Electronic Information and Communication Technology (ICEICT). Presented at the 2019 IEEE 2nd International Conference on Electronic Information and Communication Technology (ICEICT), IEEE, Harbin, China, pp. 837–840. https://doi.org/10.1109/ICEICT.2019.8846443
Maur, Alex auf der; Brüggeshemke, Nils; Kutschera, Michael (2020): Lade-Report. Prognos.
‘Meghalaya Electric Vehicle Policy’ (2020). Available at: https://www.transportpolicy.net/wp-content/uploads/2019/09/Meghalaya_policy2021.pdf.
Mets, Kevin, Verschueren, T., Haerick, W., Develder, C., De Turck, F., 2010. Optimizing smart energy control strategies for plug-in hybrid electric vehicle charging, in: 2010 IEEE/IFIP Network Operations and Management Symposium Workshops. Presented at the 2010 IEEE/IFIP Network Operations and Management Symposium Workshops, IEEE, Osaka, Japan, pp. 293–299. https://doi.org/10.1109/NOMSW.2010.5486561
Mets, K., Verschueren, T., Haerick, W., Develder, C., Turck, F.D., 2010. Optimizing smart energy control strategies for plug-in hybrid electric vehicle charging, in: 2010 IEEE/IFIP Network Operations and Management Symposium Workshops. Presented at the 2010 IEEE/IFIP Network Operations and Management Symposium Workshops, pp. 293–299. https://doi.org/10.1109/NOMSW.2010.5486561
Milton Keynes Council - Domestic Energy Balancing EV Charging Trial: V2G Hub | V2G Around the world [WWW Document], n.d. URL https://www.v2g-hub.com/projects/milton-keynes-council-domestic-energy-balancing-ev-charging-trial/ (accessed 3.24.21).

157 Smart Charging Strategies and Technologies for Electric Vehicles Simulation-based study to evaluate the effects of E-mobility smart charging strategies
Mobarak, M.H., Bauman, J., 2019. Vehicle-Directed Smart Charging Strategies to Mitigate the Effect of Long-Range EV Charging on Distribution Transformer Aging. IEEE Trans. Transp. Electrific. 5, 1097–1111. https://doi.org/10.1109/TTE.2019.2946063
Moghaddam, Z., Ahmad, I., Habibi, D., Phung, Q.V., 2018. Smart Charging Strategy for Electric Vehicle Charging Stations. IEEE Trans. Transp. Electrific. 4, 76–88. https://doi.org/10.1109/TTE.2017.2753403
Moghaddass, R., Mohammed, O.A., Skordilis, E., Asfour, S., 2019. Smart Control of Fleets of Electric Vehicles in Smart and Connected Communities. IEEE Transactions on Smart Grid 10, 6883–6897. https://doi.org/10.1109/TSG.2019.2913587
MoHUA (2019) ‘Model Building Bye-Laws (MBBL - 2016) for Electric Vehicle Charging Infrastructure’. Available at: https://archive.pib.gov.in/documents/rlink/2019/feb/p201921501.pdf.
MoP (2019) ‘Charging Infrastructure for Electric Vehicle- Revised Guideline and Standard’. Available at: https://powermin.gov.in/sites/default/files/uploads/Revised_MoP_Guidelines_01_10_2019.pdf.
Moradipari, A., Tucker, N., Zhang, T., Cezar, G., Alizadeh, M., 2020. Mobility-Aware Smart Charging of Electric Bus Fleets, in: 2020 IEEE Power & Energy Society General Meeting (PESGM). Presented at the 2020 IEEE Power & Energy Society General Meeting (PESGM), IEEE, Montreal, QC, pp. 1–5. https://doi.org/10.1109/PESGM41954.2020.9281897
Morstyn, T., Crozier, C., Deakin, M., McCulloch, M.D., 2020. Conic optimization for electric vehicle station smart charging with battery voltage constraints. IEEE Transactions on Transportation Electrification 6, 478–487.
MoRTH (2017) ‘Incentivisation of Electric Vehicles and induction of EV in shared mobility and public transport operations’. Available at: https://www.morth.nic.in/sites/default/files/circulars_document/Incentivisation_of_Electric.pdf.
MoRTH (2018a) ‘Exemption to Battery Operated Transport Vehicles from Requirement of Permits’. Available at: https://morth.nic.in/sites/default/files/notifications_document/Notification_no_S_O_5333E_dated_18_10_2018_regarding_exemption_to_Battery_Operated_Transport_Vehicles_and_Transport_0.pdf.
MoRTH (2018b) Retro-Fitment of Electric Kit to Motor Vehicles. Available at: https://pib.gov.in/Pressreleaseshare.aspx?PRID=1542764.
MoRTH (2020) Sale of EVs without batteries. Available at: https://pib.gov.in/PressReleseDetailm.aspx?PRID=1645394#:~:text=MoRTH%20allows%20Sale%20and%20Registration%20of%20Electric%20Vehicles%20without%20batteries&text=The%20Ministry%20of%20Road%20Transport,vehicles%20without%20pre%2Dfitted%20batteries.
Nathan Rodriguez, E. L. (2016) ‘SCAM Electric Vehicle Charger’. Available at: https://www.ece.ucf.edu/seniordesign/sp2016fa2016/g23/SD2Finished.pdf.
Nationale Plattform Elektromobilität: The German Standardisation Roadmap Electric Mobility 2020. Online verfügbar unter https://www.dke.de/de/arbeitsfelder/mobility/normungs-roadmap-emobility-2020, zuletzt geprüft am 18.03.21.
Newsham, G.R., Bowker, B.G., 2010. The effect of utility time-varying pricing and load control strategies on residential summer peak electricity use: A review. Energy Policy, Large-scale wind power in electricity markets with Regular Papers 38, 3289–3296. https://doi.org/10.1016/j.enpol.2010.01.027
Nguyen, H. V.; Lee, D. (2018): Single-phase multifunctional onboard battery chargers with active power decoupling capability. In: Applied Power Electronics Conference and Exposition (APEC),
Nimalsiri, N.I., Mediwaththe, C.P., Ratnam, E.L., Shaw, M., Smith, D.B., Halgamuge, S.K., 2020. A Survey of Algorithms for Distributed Charging Control of Electric Vehicles in Smart Grid. IEEE Transactions on Intelligent Transportation Systems 21, 4497–4515. https://doi.org/10.1109/TITS.2019.2943620
NIO (2020): NIO stellt Batteriewechsel-Station 2.0 vor – hebt Akku-Tausch aufs nächste Level. Online verfügbar unter https://www.elektroauto-news.net/2021/nio-neue-batteriewechsel-station-akku-tausch-naechste-level, zuletzt geprüft am 18.03.21.
Parker_Final-report_v1.1_2019.pdf, n.d.
Petit, M., Perez, Y., 2013. Coordination of EV fleet charging with distributed generation to reduce constraints on distribution networks, in: 2013 World Electric Vehicle Symposium and Exhibition (EVS27). Presented at the 2013 World Electric Vehicle Symposium and Exhibition (EVS27), IEEE, Barcelona, Spain, pp. 1–9. https://doi.org/10.1109/EVS.2013.6914949

Smart Charging Strategies and Technologies for Electric Vehicles Simulation-based study to evaluate the effects of E-mobility smart charging strategies158
Power Department of West Bengal (2021) ‘Electric Vehicle Policy 2021’. Powered-Up-Electric-Nation-Brochure.pdf, n.d.
PowerToDrive (2020): Market Overview - Charging Systems - Solar Carports - Apps & Software. Hg. v. The Smarter E. Online verfügbar unter https://www.thesmartere.de/publikationen/marktuebersicht-ladesysteme, zuletzt geprüft am 21.07.21.
Products | evmega [WWW Document], n.d. URL https://www.evmega.com/products (accessed 3.23.21).
Punjab Electricity Regulation State Commission (2020) ‘Tariff Orders for FY 2020-21 for PSPCL & PSTCL’. Available at: http://pserc.gov.in/pages/salient%20features%20of%20Tariff%20Order%202020-21.pdf.
Rajper, S.Z., Albrecht, J., 2020. Prospects of Electric Vehicles in the Developing Countries: A Literature Review. Sustainability 12, 1906. https://doi.org/10.3390/su12051906
Ramos Muñoz, E., Jabbari, F., 2020. A decentralized, non-iterative smart protocol for workplace charging of battery electric vehicles. Applied Energy 272, 115187. https://doi.org/10.1016/j.apenergy.2020.115187
Randall, Chris (11.7.19): CharIN is working on truck charging with up to 3 MW. Online verfügbar unter https://www.electrive.com/2019/07/11/charin-is-working-on-truck-charging-with-up-to-3-mw/, zuletzt geprüft am 18.03.21.
Richardson, P., Flynn, D., Keane, A., 2012. Local Versus Centralized Charging Strategies for Electric Vehicles in Low Voltage Distribution Systems. IEEE Trans. Smart Grid 3, 1020–1028. https://doi.org/10.1109/TSG.2012.2185523
Sachan, S., Deb, S., Singh, S.N., 2020. Different charging infrastructures along with smart charging strategies for electric vehicles. Sustainable Cities and Society 60, 102238. https://doi.org/10.1016/j.scs.2020.102238
Saldaña, G., San Martin, J.I., Zamora, I., Asensio, F.J., Oñederra, O., 2019. Electric vehicle into the grid: Charging methodologies aimed at providing ancillary services considering battery degradation. Energies 12, 2443.
S. Das, B. T. (2020) ‘EV- A New Entrant to India’s Electricity Consumer-basket’. Alliance for an Energy Efficient Economy. Available at: https://shaktifoundation.in/wp-content/uploads/2020/08/Full-Report-A-New-Entrant-To-Indias-Electricity-Consumer-Basket.pdf.
Shahriar, S., Al-Ali, A.R., Osman, A.H., Dhou, S., Nijim, M., 2020. Machine Learning Approaches for EV Charging Behavior: A Review. IEEE Access 8, 168980–168993. https://doi.org/10.1109/ACCESS.2020.3023388
Shakerighadi, B., Anvari-Moghaddam, A., Ebrahimzadeh, E., Blaabjerg, F., Bak, C.L., 2018. A Hierarchical Game Theoretical Approach for Energy Management of Electric Vehicles and Charging Stations in Smart Grids. IEEE Access 6, 67223–67234. https://doi.org/10.1109/ACCESS.2018.2878903
Sharma, S., Jain, P., Bhakar, R., 2019. Grid-to-Vehicle Smart Charging Strategies for Electric Vehicles Aggregator: A Review and Outlook, in: 2019 8th International Conference on Power Systems (ICPS). Presented at the 2019 8th International Conference on Power Systems (ICPS), IEEE, Jaipur, India, pp. 1–6. https://doi.org/10.1109/ICPS48983.2019.9067551
Shubhranshu P. (2021) ‘Status quo analysis of various segments of electric mobility and low carbon passenger road transport in India’. Deutsche Gesellschaft für Internationale Zusammenarbeit (GIZ) GmbH, Germany. Available at: https://www.changing-transport.org/publication/electric-mobility-low-carbon-passenger-road-transport-india.
Silva, F.L.D., Nishida, C.E.H., Roijers, D.M., Costa, A.H.R., 2020. Coordination of Electric Vehicle Charging Through Multiagent Reinforcement Learning. IEEE Transactions on Smart Grid 11, 2347–2356. https://doi.org/10.1109/TSG.2019.2952331
Smart electric vehicle charging management for smart cities - Vaidya - 2020 - IET Smart Cities - Wiley Online Library [WWW Document], n.d. URL https://ietresearch.onlinelibrary.wiley.com/doi/10.1049/iet-smc.2019.0076 (accessed 3.23.21).
Statista (2020) Number of registered motor vehicles per 1,000 population across India from financial year 2001 to 2017. Available at: https://www.statista.com/statistics/665071/number-of-registered-motor-vehicles-india-by-population/.
Stolze, Peter; Karamanakos, Petros; Kennel, Ralph; Manias, Stefanos; Endisch, Christian (2015): Effective variable switching point predictive current control for ac low-voltage drives. In: International Journal of Control (88).

159 Smart Charging Strategies and Technologies for Electric Vehicles Simulation-based study to evaluate the effects of E-mobility smart charging strategies
Sundstrom, O., Binding, C., n.d. Optimization Methods to Plan the Charging of Electric Vehicle Fleets 6.
Swobbee: Die Akku-Wechselstation für die Mikromobilität. Online verfügbar unter https://swobbee.de/, zuletzt geprüft am 19.08.21.
‘Tamil Nadu Electric Vehicle Policy’ (2019). Available at: https://powermin.gov.in/sites/default/files/uploads/EV/Tamilnadu.pdf.
Tan, J., Wang, L., 2016. A game-theoretic framework for vehicle-to-grid frequency regulation considering smart charging mechanism. IEEE Transactions on Smart Grid 8, 2358–2369.
‘Telangana EV ESS policy 2020-2030’ (2020). Available at: https://tsredco.telangana.gov.in/Updates_2020/Telangana_EVES_policy_2020_30.pdf.
Telangana State Electricity Regulatory Commission (201AD) ‘Retail Supply Tariff Schedule for FY 2018-19’. Available at: https://tserc.gov.in/file_upload/uploads/Tariff%20Orders/Tariff%20Schedule/Tariff%20Schedule%20for%20FY2018-19.pdf.
Telangana State Electricity Regulatory Commission (no date) ‘Tariff for Electric Vehicle Charging Stations / Battery Swap for FY2018-19’. Available at: https://www.tssouthernpower.com/ShowProperty/CP_CM_REPO/Pages/Tariffs%20and%20Regulations/Tariffs/Tariff%20Schedule%20for%20%20EVs.
The Automotive Research Association Of India (2017) ‘AIS-138 Part-1: Electric Vehicle Conductive AC Charging System’. Available at: https://hmr.araiindia.com/Control/AIS/210201752832PMAIS138_Part1.pdf.
Transport Department (GoH)), G. of H. (2020) ‘Haryana Electric Vehicle Policy-Draft’. Available at: https://haryanatransport.gov.in/en/view/CIRCULAR%20NOTIFICATION?order=field_date_of_rti_notification_o&sort=desc (Accessed: 6 July 2021).
TU Delft (no date) ‘Electric car: Technology’. Available at: https://ocw.tudelft.nl/wp-content/uploads/eCARS2x_Lecture_Notes_L3-3.pdf.
UCLA Smart Grid Energy Research Center | SMERC [WWW Document], n.d. URL https://smartgrid.ucla.edu/projects_evgrid.html (accessed 3.24.21).
‘Uttar Pradesh Electric Vehicle Policy’ (2019). Available at: https://www.transportpolicy.net/wp-content/uploads/2019/10/Uttar_Pradesh_Draft_EV_Policy_2018.pdf.
Uttar Pradesh Electricity Regulation Commission (2019) ‘Tariff for Electric Vehicle Charging: Uttar Pradesh’. Available at: https://www.uperc.org/App_File/EV-pdf225201945734PM.pdf.
‘Uttarakhand Electric Vehicle Policy’ (2018). Available at: https://www.mycii.in/KmResourceApplication/61853.ElectricVehiclePolicyUttarakhand.pdf.
Vahan Dashboard (no date). Available at: https://vahan.parivahan.gov.in/vahan4dashboard/.
vCharM | Charging Station Management System | Vector [WWW Document], n.d. URL https://www.vector.com/int/en/products/products-a-z/software/vcharm-charging-station-management-system/ (accessed 3.24.21).
VDE; BDEW; DKE; ZVEH; ZVEI and (2020): Der Technische Leitfaden - Ladeinfrastruktur Elektromobilitä. Online verfügbar unter https://www.vde.com/resource/blob/988408/a2b8e484994d628b515b56376f809e28/technischer-leitfaden-ladeinfrastruktur-elektromobilitaet‐-version-3-data.pdf.
Verband der Automobilindustrie (2020): GridIntegration Architecture. Customer Energy Management System.
Volker Schwarzer, R. G. (2015) ‘Current State-of-the-Art of EV Chargers’. Available at: https://www.hnei.hawaii.edu/wp-content/uploads/Current-State-of-the-Art-EV-Chargers.pdf.
Volvo Buses (2016): Volvo and ABB inaugurate charging station for electric buses based on OppCharge. Online verfügbar unter https://www.volvobuses.com/en/news/2016/oct/volvo-abb-inaugurate-charging-station.html, zuletzt geprüft am 19.8.21.
Wan, Yanni, Qin, J., Li, F., Yu, X., Kang, Y., 2021. Game Theoretic-Based Distributed Charging Strategy for PEVs in a Smart Charging Station. IEEE Trans. Smart Grid 12, 538–547. https://doi.org/10.1109/TSG.2020.3020466
Wan, Y., Qin, J., Li, F., Yu, X., Kang, Y., 2021. Game Theoretic-Based Distributed Charging Strategy for PEVs in a Smart Charging Station. IEEE Transactions on Smart Grid 12, 538–547. https://doi.org/10.1109/TSG.2020.3020466
Wan, Y., Qin, J., Li, F., Yu, X., Kang, Y., 2020. Game Theoretic-Based Distributed Charging Strategy for PEVs in A Smart Charging Station. IEEE Transactions on Smart Grid.

Smart Charging Strategies and Technologies for Electric Vehicles Simulation-based study to evaluate the effects of E-mobility smart charging strategies160
Wang, Q., Liu, X., Du, J., Kong, F., 2016. Smart Charging for Electric Vehicles: A Survey From the Algorithmic Perspective. arXiv:1607.07298 [cs].
Wang, W., Chen, P., Zeng, D., Liu, J., 2020. Electric Vehicle Fleet Integration in a Virtual Power Plant With Large-Scale Wind Power. IEEE Transactions on Industry Applications 56, 5924–5931. https://doi.org/10.1109/TIA.2020.2993529
World’s Most Polluted Countries in 2020 - PM2.5 Ranking | AirVisual (no date). Available at: https://www.iqair.com/world-most-polluted-countries (Accessed: 3 June 2021).
Wu, Q., Nielsen, A.H., Cha, S.T., Andersen, P.B., n.d. Potential Analysis of Regulating Power from Electric Vehicle (EV) Integration in Denmark 8.
Xing, H., Fu, M., Lin, Z., Mou, Y., 2016. Decentralized Optimal Scheduling for Charging and Discharging of Plug-In Electric Vehicles in Smart Grids. IEEE Transactions on Power Systems 31, 4118–4127. https://doi.org/10.1109/TPWRS.2015.2507179
Xu, X., Niu, D., Li, Y., Sun, L., 2020. Optimal Pricing Strategy of Electric Vehicle Charging Station for Promoting Green Behavior Based on Time and Space Dimensions. Journal of Advanced Transportation 2020, e8890233. https://doi.org/10.1155/2020/8890233
Yan, D., Yin, H., Li, T., Ma, C., 2021. A Two-Stage Scheme for Both Power Allocation and EV Charging Coordination in A Grid Tied PV-Battery Charging Station. IEEE Transactions on Industrial Informatics 1–1. https://doi.org/10.1109/TII.2021.3054417
Yin, X., Ma, Z., Dong, L., 2011. Decentralized loading coordination for large-population plug-in electric vehicles and a few controllable bulk loads, in: 2011 50th IEEE Conference on Decision and Control and European Control Conference. Presented at the 2011 50th IEEE Conference on Decision and Control and European Control Conference, pp. 3092–3097. https://doi.org/10.1109/CDC.2011.6161037
Yin, Y., Zhou, M., Li, G., 2015. Dynamic decision model of critical peak pricing considering electric vehicles’ charging load, in: International Conference on Renewable Power Generation (RPG 2015). Presented at the International Conference on Renewable Power Generation (RPG 2015), pp. 1–6. https://doi.org/10.1049/cp.2015.0564
Yu, L., Zhao, T., Chen, Q., Zhang, J., 2015. Centralized bi-level spatial-temporal coordination charging strategy for area electric vehicles. CSEE Journal of Power and Energy Systems 1, 74–83. https://doi.org/10.17775/CSEEJPES.2015.00050
Zhang, Q., Hu, Y., Tan, W., Li, C., Ding, Z., 2020. Dynamic time-of-use pricing strategy for electric vehicle charging considering user satisfaction degree. Applied Sciences 10, 3247.
Zhang, W., Ge, W., Huang, M., Jiang, J., 2015. Optimal day-time charging strategies for electric vehicles considering photovoltaic power system and distribution grid constraints. Mathematical Problems in Engineering 2015.
Zhao, Z., Zhang, L., Yang, M., Chai, J., Li, S., 2020. Pricing for private charging pile sharing considering EV consumers based on non-cooperative game model. Journal of Cleaner Production 254, 120039. https://doi.org/10.1016/j.jclepro.2020.120039
Zou, S., Hiskens, I., Ma, Z., 2017. Decentralized Coordination of Controlled Loads and Transformers in a hierarchical structure**This work was supported by the International S&T Cooperation Program of China (ISTCP) through Grant 2015DFA61520, and the US National Science Foundation under Grant CNS-1238962. IFAC-PapersOnLine, 20th IFAC World Congress 50, 5560–5566. https://doi.org/10.1016/j.ifacol.2017.08.1099

161 Smart Charging Strategies and Technologies for Electric Vehicles Simulation-based study to evaluate the effects of E-mobility smart charging strategies
Annexure IAmendment: Technical Standards for Connectivity of the Distributed Generation Resources- 2013, Central Electricity Authority
• First Amendment- Feb 2019
This is associated with technical standards for Connectivity of the Distributed Generation Resources. The guidelines are issued for connectivity of EV charging station with the electricity system below 33 kV voltage level. The key provisions in the regulations are as follows:
◾ EV charging station operator needs to provide a reliable protection system to detect various faults and abnormal conditions and provide an appropriate means to isolate the faulty equipment or system automatically
◾ It would be the responsibility of the charging operator that fault in the EV charging infrastructure equipment or system does not affect the grid adversely.
◾ DISCOM should carry out an adequacy and stability study of the network before permitting connection with its electricity system.
◾ DISCOM to continuously measure and meter the harmonics with power quality meters complying with the provisions of IEC 61000-4-30 Class A
◾ The charging operator needs to install power quality meters and share the recorded data with the DISCOM
◾ DISCOM should periodically measure the voltage sag, swell, flicker, disruptions as per relevant IEC standard
• Second Amendment- June 2019
This amendment covers the Safety and Electric Supply Regulations, which laid down several safety provisions for EV charging infrastructure connected with the grid. The key provisions are as follows:
◾ All electric vehicle charging stations are required to protect against the overload of input supply and output supply fittings
◾ All electric vehicle charging points should have a socket-outlet of supply at least 800 millimetres above the finished ground level
◾ A suitable lightning protection system needs to be provided as per Indian Standards Code IS/ IEC 62305
◾ All residual current devices used to protect supplies to electric vehicles must be permanently marked to identify their function and the location of the charging station or socket outlet they protect.
◾ Each electric vehicle charging point needs to be supplied individually by a dedicated final sub-circuit protected by an overcurrent protective device complying with IEC 60947-2, IEC 60947-6-2 or the IEC 60269 standards, and the overcurrent protective device should be part of a switchboard.
◾ The enclosure of charging stations should be made of fire-retardant material with self-extinguishing property and free from Halogen
◾ Power supply cables used in charging stations or charging points should conform to IEC 62893-1 and its relevant parts.
◾ All apparatus of charging stations should have the insulation resistance value as stipulated in the relevant IEC 61851-1
◾ The charging station owner needs to establish and implement a safety assessment program for regular periodic assessment of the electrical safety of the charging station. Electrical inspectors and/or Chartered Electrical Safety Engineers are entrusted with the responsibility of testing and inspection of charging infrastructure
◾ The charging station owner needs to keep records of the results of every inspection, testing and periodic assessment and details of any issues observed during the assessment and any actions required to be taken concerning those issues.

Smart Charging Strategies and Technologies for Electric Vehicles Simulation-based study to evaluate the effects of E-mobility smart charging strategies162
◾ The safety provisions of all Alternating Current charging stations should be in accordance with IEC 61851-1, IEC 61851-21, and IEC 61851-22.
◾ The safety provisions of all Direct Current charging stations should be in accordance with IEC 61851-1, IEC 61851-21, IEC 61851-23, and IEC 61851- 24.
Charging Infrastructure for Electric Vehicle-Revised Guideline and Standard issued by MoP
Provisions mentioned in “Charging Infrastructure for electric vehicle-Revised Guideline and standard” issued by MoP is discussed below.
Mandatory Provisions:
◾ The regulation permits the installation of a private charging station at residences and workplaces. This will help to lower the issue of insufficient charging facilities for EV owners.
◾ The regulation allows any person or company to establish a charging station by adhering to all the technical, safety, and performance standards and protocols.
◾ The regulation suggests the DISCOMs to provide electricity connections to charging stations on a priority basis. In addition to this, the charging station can also procure electricity from any generating station through open access.
◾ Minimum requirement of public charging station (PCS) such that PCS must have at least one or more or any combination of charging points as stated in the regulation are given in Table 18.
Table 18: Minimum requirement of the public charging station as per MoP-issued regulation for charging infrastructure of electric vehicles
Charging type Sr. No Connector typeRated output voltage(V)
No. of connector
Vehicle type (W=Wheels)
Fast
1 CCS (min 50 KW) 200-750 or higher 1 4
2 CHAdeMO (min 50 KW) 200-500 1 4
3 Type 2 AC ( min 22 KW) 380-415 1 4W, 3W, 2W
Slow/ Moderate
4 Bharat DC-001( 15 KW) 48 1 4W, 3W, 2W
5 Bharat DC-001( 15 KW) 72 and higher 1 4W
6 Bharat AC-001( 10 KW) 230 3 4W, 3W, 2W
◾ Charging stations for 2W and 3W are free to install any of the above or any other type of charger.
◾ The above-mentioned infrastructure requirement is not compulsory for private, self, home, non-commercial charging stations, and company-owned internal fleet, but it must satisfy the technical and safety standards laid down by CEA.
◾ The charging station must tie up with at least one Network Service Provider to ensure remote and online booking, which will further help establish smart charging.
◾ The charging station must share data with DISCOM such that Central Nodal Agency (CNA) and State Nodal Agency (SNA) must have access to the data.
◾ An authorised agency must test electric vehicle charging equipment (EVSE) from time to time.
◾ The above-mentioned mandates regarding the number of charging points are not compulsory for private, non-commercial, and captive charging stations.
◾ Provision related to heavy-duty vehicles states that “at least two charging points with a minimum rating of 100 kW (200-750V or higher) with different charger type (CCS, CHAdeMO or any DST or BIS approved charger) with a single gun should be present”.
◾ About location and distance between charging stations, the regulation states, “at least one charging station should be established in a grid of 3 km x 3 km and at every 25 km on both sides of highway whereas there should be one charging station with the specified specification at every 100 km for long-range heavy-duty vehicles.”

163 Smart Charging Strategies and Technologies for Electric Vehicles Simulation-based study to evaluate the effects of E-mobility smart charging strategies
◾ The special commission should decide the tariff structure for EV charging. This tariff is applicable to separately metered public charging stations only. A domestic charging station must be billed using domestic tariff charges.
◾ The regulation states that if PCS is installed with government incentives, then state nodal agency/state agency will decide the celling of service charges levied by PCS.
Optional provisions:
◾ A transformer with related substation equipment and safety appliance should be installed.
◾ Appropriate civil work, cabling work, and electric safety shall be maintained.
The regulation includes the timeline for the roll-out of EV charging infrastructure in the nation. According to the mentioned timeline, Phase-1 (1-3 years) should cover all megacities with population greater that 40 lakh, important express ways, and highways connecting mega cities. In Phase-II (3-5 years), the state capitals, Union Territories headquarters and other important highways must be covered.
The central nodal agency is responsible for maintaining the appropriate mode of implementation. It works with state nodal agencies and other government bodies. The nodal agencies and their roles are presented in Table 19.
Table 19: Issuing agency and role of nodal agencies
Nodal agency Name of agency Purpose/Work of agency
Central Nodal Agency (CNA) Bureau of Energy Efficiency (BEE)
Finalize cities, highways, and expressways for priorities
State Nodal Agency (SNA) The state government is free to choose any PSU, Urban local body as a nodal agency.
To choose an implementation agency responsible for installa-tion, operation, and maintenance for a specified period of time.
EV tariff Regulations
• Delhi
The electricity tariff structure specified for EVs by the government of Delhi is tabulated below, compared with residential and commercial tariffs. Various states have defined specific demand charges along with their energy charges for EV consumers. Table 20 compares tariffs and demand charges for Delhi for different load categories (Delhi Electricity Regulatory Commission).
Table 20: EV tariff structure in Delhi
CategoryElectricity Tariff (FY 20)
Energy Charge Demand Charge
EV tariff`4.5/kWh (Supply at LT) and `4.0/ kVAh (Supply at HT)
Nil
Residential Tariff `3 to `8/ kWh `125 to `250/kW per month
Commercial Tariff `8.0/kVAh `250/kVA per month
Delhi government has implemented a Time-of-use tariff structure, as shown in Table 21 (Delhi Electricity Regulatory Commission). Time-of-use tariff-based charging is a smart charging strategy. It is a simple, less expensive, but effective smart charging method applicable to all commercial, public charging stations. Special electricity tariff is applicable to commercial captive and private charging stations connected to a central management system. This timely price-based smart charging is applicable at all the above-mentioned charging stations.

Smart Charging Strategies and Technologies for Electric Vehicles Simulation-based study to evaluate the effects of E-mobility smart charging strategies164
Table 21: Time-of-use (ToU) tariff structure of Delhi
Months Peak Hours (Hrs)Surcharge onEnergy Charges
Off-Peak Hours (Hrs)Rebate on Energy Charges
May - September 2020
1400– 1700
20% 04:00 – 10:00 20%2200 – 0100
• Karnataka
The EV tariff structure for Karnataka state is given in Table 22 (Karnataka Electricity Regulatory Commission, 2020):
Table 22: EV tariff structure of Karnataka
CategoryElectricity Tariff- 2021
Energy Charge Demand Charge
EV tariff `5.00/kWh `70/kW per month and `200/ kVA per month
Residential Tariff `4.00 to `8.05/ kWhFor first kW: `70/kW per month For every additional kW: `80 /kW
Commercial TariffFor 1 Lakhs unit: `7.35 /unitFor balance units: `7.65 /unit
`230/kVA per month
• Maharashtra
The EV electricity tariff, along with residential and commercial tariff structure for Maharashtra, is given in Table 23 (Maharashtra Electricity Regulatory Commission, 2020b):
Table 23: EV tariff structure of Maharashtra
CategoryElectricity Tariff (FY 20-21)
Energy Charge Demand Charge
EV tariff `5.06/kWh `70/kVA/ Month
Residential Tariff `3.46 to 11.71/kWh `100/kVA per month
Commercial Tariff `7.36/kW (LT) & `11.47/ kVAh (HT) `403 kW & `411/ kVA per month
Maharashtra has adopted a time-of-use tariff-based smart charging strategy. This smart charging strategy helps in addressing renewable intermittency and maximum utilization of clear and cheap generations. Time-of-use based tariff is divided into surcharge and rebate. The tariff is divided for LT load (up to 20kW) and HT (above 20 kW) load based on the sanctioned load value. In this tariff structure, surcharge and rebate are applied on fixed energy costs (Rs/kWh). The tariff structure for public LT and HT charging stations is given in Table 24 and Table 25 (Maharashtra Electricity Regulatory Commission, 2020a).
Table 24: Tariff structure for LT charging station load in Maharashtra
Consumption Slab (kWh)
Fixed Charge / Demand Charge
Wheeling Charge (Rs/kWh) Energy Charge (Rs/kWh)
All Units Rs. 70 per kVA 1.57 3.93
TOD Tariffs (in addition to above base Tariff) (FY 20-21)
Time Interval Energy charges (Rs/kWh)
0600 to 0900 hours 0.00
0900 to 1200 hours 0.50
1200 to 1800 hours 0.00
1800 to 2200 hours 1.00
2200 to 0600 hours -0.75

165 Smart Charging Strategies and Technologies for Electric Vehicles Simulation-based study to evaluate the effects of E-mobility smart charging strategies
Similarly, the tariff structure for HT EV charging and swapping stations is given below [1].
Table 25: Tariff structure for HT charging station load in Maharashtra
Consumption Slab (kVAh) Fixed Charge / Demand Charge
Wheeling Charge (Rs/kVAh)
Energy Charge (Rs/kVAh)
All Units Rs. 70 per kVA 0.70 4.61
TOD Tariffs (in addition to above base Tariff) (FY 20-21)
Time Interval Energy charges (Rs/kVAh)
0600 to 0900 hours 0.00
0900 to 1200 hours 0.50
1200 to 1800 hours 0.00
1800 to 2200 hours 1.00
2200 to 0600 hours -0.75
These ToU charges are applicable to commercial, public charging stations.
• Andhra Pradesh
The EV electricity tariff, along with residential and commercial tariff structure for the state of Andhra Pradesh, is given in Table 26 (Andhra Pradesh and Electricity Regulatory Commission, 2020):
Table 26: EV tariff structure of Andhra Pradesh
CategoryElectricity Tariff (FY 20)
Energy Charge Demand Charge
EV tariff `5/kWh (LT) and `5/kVAh (HT) Nil
Residential Tariff `1.45 to `9.05/kWh Nil
Commercial Tariff `5.4 to `10.15/ kVAh `55 to `75/kW per month
• Kerala
The EV tariff structure for the EV charging station is presented in Table 27.
Table 27: EV tariff structure of Kerala
Load type Connected loadFixed charges per demand 2020-21
Energy charges 2020-21(Rs/kWh)
LT
Connected load of and below 10 kW
200 4.50
Connected load above 10 kW and up to 20 kW
200 / kW 4.50
Connected load above 20 kW 500 /kVA 4.50
HT HT charging stations 315 (Rs/kVA) 5 (Rs/ kWh)
Time-of-use EV tariff structure for EV charging station is showed in Table 28.
Table 28: Time-of-use tariff structure in Kerala
Category 06:00-18:00 18:00-22:00 20:00-06:00
Energy Chargers 50% 100% 75%
Energy Chargers above 500 unit consumed 100% 120% 90%

Smart Charging Strategies and Technologies for Electric Vehicles Simulation-based study to evaluate the effects of E-mobility smart charging strategies166
• Uttar Pradesh
For Uttar Pradesh, the EV electricity tariff along with residential and commercial tariff structure is given in Table 29:
Table 29: EV tariff structure of Uttar Pradesh
CategoryElectricity Tariff (FY 19)
Energy Charge Demand Charge
EV tariff `5.9 to `7.7/ kWh Nil
Residential Tariff `3 to `6.5/ kWh `50 to `100/kW per month
Commercial Tariff `5 to `18/kWh `95 to `430/ kW per month
Summer Months (April to September) Hours % of Energy Charges
05:00 hr – 11:00 hr (-) 15%
11:00 hr – 17:00 hr 0%
17:00 hr – 23:00 hr (+) 15%
23:00 hr – 05:00 hr 0%
Table 30: Time-of-use (ToU) tariff structure of Uttar Pradesh for summer months
Time of use tariff structure for smart charging is given in Table 30 and Table 31 (Uttar Pradesh Electricity Regulation Commission, 2019). Uttar Pradesh has issued different ToU charges for summer and winter based on variable peak load timing.
Table 31: Time-of-use (ToU) tariff structure of Uttar Pradesh for winter months
Winter Months (October to March) Hours % of Energy Charges
05:00 hr – 11:00 hr 0%
11:00 hr – 17:00 hr 0%
17:00 hr – 23:00 hr (+) 15%
23:00 hr – 05:00 hr (-) 15%
• Gujarat
The EV electricity tariff, along with residential and commercial tariff structure for Gujarat, is given in Table 32 (Madhya Gujarat Vij Company Limited (MGVCL), 2020):
Table 32: EV tariff structure of Gujarat
CategoryElectricity Tariff (FY 20)
Energy Charge Demand Charge
EV tariff `4 to `4.1/ kWh• `25 per month per installation • `25 to `50 per kVA per month
Residential Tariff `3.05 to `5.2/ kWh `15 to `70 per month
Commercial Tariff `4.35 to `4.65/ kWh `50 to `195/ kW per month

167 Smart Charging Strategies and Technologies for Electric Vehicles Simulation-based study to evaluate the effects of E-mobility smart charging strategies
• Madhya Pradesh
The EV electricity tariff, along with residential and commercial tariff structure for Madhya Pradesh, is given in Table 33 (Madhya Pradesh Electricity Regulation Commission, 2020):
Table 33: EV tariff structure of Madhya Pradesh
CategoryElectricity Tariff (FY 20)
Energy Charge Demand Charge
EV tariff `5.9 to `6.0/kWh `100 per kVA to `120 per kVA of Billing Demand
Residential Tariff `3.25 to `6.65/ kWh `35 to `90 per connection
Commercial Tariff `6.1 to `8.5/kWh `55 to `260/ kW per month
• Telangana
For Telangana, the EV electricity tariff along with residential and commercial tariff structure is given in Table 34 (Telangana State Electricity Regulatory Commission, 2018-19):
Table 34: EV tariff structure of Telangana
CategoryElectricity Tariff (2018-19)
Energy Charge Demand Charge
EV tariff `6.00/kWh Nil
Residential Tariff `1.45 to `9.5/ kWh Nil
Commercial Tariff `5.3 to `12.0/ kVAh `50 to `60/kW per month
Special power tariff ToU structures for eligible charging stations are provided in Table 35 (Telangana State Electricity Regulatory Commission).
Table 35: Time-of-use (ToU) tariff structure of Telangana
Time interval Additional charges on energy price (Rs/kWh)
6 AM-10AM 7.00
6PM-10PM 7.00
10PM-6AM 6.00
• Punjab
For Punjab, the EV electricity tariff along with residential and commercial tariff structure is given in Table 36 (Punjab Electricity Regulation State Commission, 2020):
Table 36: EV tariff structure of Punjab
CategoryElectricity Tariff (FY 20)
Energy Charge Demand Charge
EV tariff `6/kVAh Nil
Residential Tariff `4.99 to `7.30/kWh `35/kW to `110/kVA per month
Commercial Tariff `6.35 to `7.29/ kWh `45/kW to `110/kVA per month

Smart Charging Strategies and Technologies for Electric Vehicles Simulation-based study to evaluate the effects of E-mobility smart charging strategies168
• Bihar
The EV electricity tariff, along with residential and commercial tariff structure in Bihar, is given in Table 37 (Bihar Electricity Regulatory Commission, 2020):
Table 37: EV tariff structure of Bihar
CategoryElectricity Tariff (FY 20)
Energy Charge Demand Charge
EV tariffSame tariff for EV as the respective category rate
Nil
Residential Tariff `6.15 to `8.60/ kWh `20 to `40/kW per month
Commercial Tariff `6.4 to `7.5/ kWh `30 to `180/ kW per month
• Haryana
The EV electricity tariff, along with the residential and commercial tariff structure of Haryana state, is given in Table 38 (Haryana Electricity Regulatory Commission, 2020):
Table 38: EV tariff structure of Haryana
CategoryElectricity Tariff (FY 20)
Energy Charge Demand Charge
EV tariff `5.58/kVAh or `6.2/kWh `100/kW per month
Residential Tariff `2.0 to `7.1/ kWh Nil
Commercial Tariff `6.65 to `7.35/ kVAh `160/kW-180/kW per month
Technical Specification of Bharat AC 001 and Bharat DC001
Specifications of Bharat AC 001 and DC 001 standards issued by CEA is given in Table 39 below.
Table 39: Technical specification of Bharat AC001 and DC001
Parameter Bharat AC001 Bharat DC001
General requirements
EVSE type & mode of charging AC EVSE & conductive charging
DC EVSE (Dual connector) & conductive charging
Input Parameters
Input voltage 3-phase, 415 V 3-phase, 415 V
Output parameter
No of output guns 3 2
Output voltage 1-phase, 230V 48V/60V/72V as per battery requirement
Maximum current 15 A 200 A
Connector IEC 60309One connector with GB/T 20234.3 and one yet to finalised
Limiting output current 16 A -
Isolation Class 1 and class 2 as per AIS 138(3.3.1 and 3.3.2) -
Environmental Require-ment
Ambient temperature 0-55 degree Celsius 0-55 degree Celsius
Ambient humidity 5-95% 5-95%

169 Smart Charging Strategies and Technologies for Electric Vehicles Simulation-based study to evaluate the effects of E-mobility smart charging strategies
Parameter Bharat AC001 Bharat DC001
Ambient Pressure 86-106 kpa 86-106 kpa
Storage temperature 0-60 degree Celsius 0-60 degree Celsius
Mechanical Require-ment
Cable security Physical locking mechanism
Mechanical stability Should withstand 20J
IP rating IP 54 IP 54
Cooling Air cooling Air cooling
Display Requirement
Start-stop switch Mandatory Mandatory
Emergency stop switch Present Present
Visual Indicator
Error indication, presence of input supply, charge process indication
Error indication, presence of input supply, charge process indication
Display size Minimum 3.5 inches, 720 x 480 pixel, touch screen and keypad
Minimum 3.5 inches, 720 x 480 pixel, TFT LCD screen touch screen and keypad
User authentication Mobile interface or user interface (as per OCPP)
Mobile interface or card reader (as per OCPP)
Payment requirement
Payment options BHIM/ Bharat QR/ UPI BHIM/ Bharat QR/ UPI
Communication re-quirement
Communication between EVSE and central server OCPP 1.5 or higher versions
EVSE- EV: CAN com-munication
EVSE-central management system:Ethernet /Wif-i/2G/3G/4G
EVSE-central server: OCPP 1.5 or higher
Furnishing Information of Public Charging Station to CEA
Formats for data collection from DISCOMS and charging stations are provided in Table 40 below.
Table 40: Formats for data collection from DISCOMS
DISCOMCircle or
Zone Station Name
Location Station type (self-service/
attendant)Address Latitude Longitude City State PIN
(1) (2) (3) (4) (5) (6) (7) (8) (9) (10)
Station Phone No.
Access type (Public/Private/ Captive/ Restricted)
Access time (24hr/8AM-10PM)
Payment mode (Cash/e-wal-let)
Commis-sioning date
OwnerConnec-tor type
No. of Level-1 EVSE
(11) (12) (13) (14) (15) (16) (17) (18)
No. of level-2 EVSE No. of DC fast charger AC input voltage DC output
(19) (20) (21) (22)
Information on the electricity consumption of charging stations collected by DISCOMs is collected in the format shown in Table 41.

Smart Charging Strategies and Technologies for Electric Vehicles Simulation-based study to evaluate the effects of E-mobility smart charging strategies170
Table 41: Electricity consumption information of charging station
DISCOM MonthNo. of charging sta-tion under DISCOM
No. of vehicle charged
Electricity consumption during month
(1) (2) (3) (4) (5)
Retrofitting of Hybrid Electric Vehicle
Retrofitting of various categories of hybrid vehicle systems with their compliance standards and requirements are given in Table 42 below.
Table 42: Type, requirement, and compliance standard for retrofitting
Sr. No.
Type of retrofitting Compliance standard
Requirement for retrofitting
1 Retrofitting of Hybrid Electric System Kit to vehicles of categories L, M and N having Gross Vehicle Weight not exceeding 3500 kg
Requirements stipulated in *AIS-123 (Part 1) should confirm
1. Retrofitting vehicle must follow Bharat stage-II or higher versions of emission norms.
2. It must belong to M1/M2/N1 with a weight less than 3500Kg.
3. Vehicle should be gasoline and diesel, not alternative fuelled and must not be retrofitted before.
2 Retrofitting of Hybrid Electric System Kit to vehicles of categories M and N having Gross Vehicle Weight exceeding 3500 kg
Requirements stipulated in *AIS-123 (Part 2) should confirm
1. Retrofitting vehicle must follow Bharat stage-II or higher ver-sions of emission norms.
2. It must belong to M1/M2/N1 with a weight greater than 3500Kg which is not retrofitted earlier.
3. It should not have a permit for carrying dangerous and hazardous goods defined in CMV rule 1989.
3 Conversion of motor vehicles for pure electric operation with the fitting of the Pure Electric Propulsion Kit by replacing the engine of Motor Vehicles of categories L, M, N
Requirements stipulated in *AIS-123 (Part 3) should confirm
-


Smart Charging Strategies and Technologies for Electric Vehicles Simulation-based study to evaluate the effects of E-mobility smart charging strategies172
Published by the Deutsche Gesellschaft für Internationale Zusammenarbeit (GIZ) GmbH
On the behalf of German Federal Ministry for the Environment, Nature Conservation and Nuclear Safety (BMU)
Registered offices Bonn and Eschborn NDC Transport Initiative for Asia (NDC-TIA) – India component GIZ Office B-5/2; Safdarjung Enclave New Delhi-110029 INDIA T +91 11 49495353 F +91 11 49495391 I http://www.giz.de/india
As of November 2021, New Delhi
Responsible: Dr. Indradip MitraCountry Coordinator for NDC-TIA India Component (GIZ)
Authors:IIT Bombay: Prof. Zakir Rather, Ms. Payal Vyankat Dahiwale, Ms. Dhanuja Lekshmi Fraunhofer IEE: Mr. Andre Hartungs
Contributors:IIT Bombay: Mr. Soudipan MaityFraunhofer IEE: Dr. Ron BrandlIIT Comillas: Prof. Pablo Frías DTU: Prof. Qiuwei Wu
Advisors:Fraunhofer IEE: Dr. Norbert Henze
Reviewers:GIZ: Ms. Shweta Kalia, Ms. Sahana L, Mr. Sudhanshu Mishra, Mr. Sushovan Bej, Ms. Toni Zhimomi, Ms. Bhagyasree, Mr. Kaustubh Arekar
Designer: Aspire Design, New Delhi
Photo credits/sources: Fraunhofer IEE, IIT Bombay