Implementing Battery Charging Features Using HX3 - Infineon ...
Upload
khangminh22Category
view
0download
0
Road User Charging: Acceptability and Effectiveness
by
Sittha Jaensirisak
Submitted in accordance with the requirements for the degree of
Doctor of Philosophy
LT
niversity of Leeds
Institute for Transport Studies
April 2002
The candidate confirrns that the work submitted is his own and that appropriate credit has been giveii where reference has been made to the work of others.

I
Acknowledgments
I would like to thank my supervisors, Prof. Tony May and Dr Mark Wardman, for their advice
and comments throughout this research. I would also like to thank them and ITS for supporting
my attendance at conferences, both in UK and abroad.
Special thanks are to Jo Guiver for discussions on not only the 'selfish and social' perspectives,
but also various issues in transport. Thanks are also due to Gerard Whelan for help in getting
started using the LIMDEP programme, and the random parameters logit model. I also would
like to thank Prof Andrew Daly for discussion on improvement of the mode choice model.
I am grateful to ITS for providing various short courses, and internal and external seminars,
relating to transport studies, and also to the University of Leeds for arranging many courses,
training in conducing research.
I have greatly benefited from the teaching experience offered by demonstration in transport
courses for Master and Undergaduate students, and am grateful to Dr Abigail Bristow, Dr Paul
Firming, Mr. Frank Montgomery and Dr Miles Tight for offering this opportunity.
Special thanks go to the government of Thailand and Ubon Ratchthani University for financial
support during my study. I consider myself very fortunate to have been given the chance to
study for a PhD. Needless to say, without this support I would have never been able to cope
with the tuition fees and the costs of living in UK.
Finally, I am deeply indebted to my wife, Sirirut, who has given me continuous encouragement
and full loving support, and has been patient through out the long difficult time. My personal
thanks also go to my family: mother, father, brother and sister, for moral support and
C11COUragei-rient throughOLIt the research and absence abroad.

11
Abstract
One of the major barriers to implementation of road user charging is how to design a scheme
that is simultaneously acceptable to the public and effective in achieving its objective. The aim
of this research was to study how road user charging can be designed to achieve acceptability
and effectiveness. Acceptability was reflected by voting behaviour, in which individuals were
asked whether they were willing to vote for charging schemes. Effectiveness in reducing
congestion was evaluated by mode switching of commuters. The research demonstrated the
effects of the system benefits (car and bus travel time reduction, environmental improvement
and revenue use) and the system features (charging levels, charging methods, charged times and
charged areas). It also investigated the impacts of personal characteristics and perceptions. The
research also examined the effect of selfish and social perspectives, reflected by the perceptions
of benefits to self and to society, on acceptability.
Paper based SP questionnaires were distributed to residents and employees in Leeds and I. ondon between November 2000 and March 2001. A total of 830 responses were received. The
analysis technique was based on random utility theory, which was used to formulate the
multinomial-logit based models. The standard logit model was used to demonstrate the overall
effects of variables for the whole sample. The segmentation model, based on the incremental factors, was used to identify the different effects for different groups of people. The random
parameters logit model was used to examine taste variations (heterogeneity) among individuals frorn unobserNl7ed factors, xvhich were unable to be captured by the segmentation model.
The study found that although more highly effective charging schemes (with higher levels of
charge) were less acceptable, while more highly acceptable schemes (with lower levels of
charge) were not substantially less effective. In other words, effective charging schemes were
not always unacceptable.
., \cceptability varies substantially across system characteristics. Acceptable road user charging
scliernes can be designed by limiting the area of charge to within the city centre and having a fixed char-c per day. Support would be increased significantly if the scheme was expected to bring substantial environmental improvement. Over 50% of people would vote for this scheme,
if the charging level is less than 0 per day in Leeds, and less than E7 per day in London.

III
Fffectiveness in reducing car use had a small variation across the factors. Overall, any charging
system is relatively effective in reducing car commuting. Even at El per day, over 20% of car
commuters in Leeds and about 30% in London would switch to non-car modes or uncharged
times. When the charge rises to E7 per day, the reductions would increase to around 40%. A
small number of non-car users would change to use cars because of car delayed-time reductions.
The acceptability and effectiveness can be improved by provision of clear information on the
principles and objectives of charging, on the severity of congestion and pollution, on the
adverse effects of car use, and on the effectiveness of road user charging in reducing the
problems. In addition, individuals need to be convinced that road user charging will provide benefits both to themselves and to society as a whole.
In brief, this research suggests that the relationship between acceptability and effectiveness of
road user charging schemes is not high. It is not simply the case that highly effective schemes
are less acceptable. Road user charging can be designed to achieve high acceptability and
effectiveness.
IV
Table of Contents
Ac know I edgements ..................................................................................................................
Abstract ................................................................................................................................... 11
Table of Contents ................................................................................................................... IV
List of Tables ........................................................................................................................... x
List of Figures ...................................................................................................................... xiii
Chapter I Introduction ......................................................................................................... 1
1.1 Background .............................................................................................................. I
1.2 Objectives and Methodology ................................................................................... 2
1.3 Outline of Thesis ..................................................................................................... 5
Chapter 2 Review of Road User Charging .......................................................................... 8
2.1 Introduction ............................................................................................................. 8
2.2 General Background of Road User Charging .......................................................... 8
2.2.1 Definitions and objectives .......................................................................... 8
2.2.2 Development history in transport planning ................................................ 9
2.3 Economic Background of Road User Charging .................................................... 10
2.4 Design of Road User Charging Schemes .............................................................. 13
2.4.1 General criteria of design .......................................................................... 13
2.4.2 Structure of road user charging system ..................................................... 14
2.5 Review of Acceptability ........................................................................................ 17
2.5.1 Acceptability of road user charging .......................................................... 17
I ý. " Factors affecting acceptability .................................................................. 19
2.5.3 Rcle\, ance of selfish and social perspectives to acceptability ................... 21
2.5.4 Ways to increase acceptance of road user charging .................................. 24
21.6 RcNic%\ of Effectiveness ........................................................................................ 25

V
2.6.1 Effects ofroad user charging .................................................................... 25
2.6.2 Experiences of implemented cases ........................................................... 29
2.6.3 Studies of pre-implementation cases ........................................................ 31
2.6.4 Demand elasticities ................................................................................... 33
2.7 Review of Relationship between Acceptability and Effectiveness ....................... 36
2.8 Summary and Implication for this Research ......................................................... 37
Chapter 3 Methodological Issues ....................................................................................... 39
3.1 Introduction ........................................................................................................... 39
3.2 Choosing the Method of Research ......................................................................... 39
3.3 Stated Preference (SP) Method .............................................................................. 42
3.3.1 Main features and process of design ......................................................... 42
3.3.2 Simulation test .......................................................................................... 44
3.3.3 Sources of error in SP data ....................................................................... 45
3.4 Analytical Issues .................................................................................................... 46
3.4.1 Random utility theory ............................................................................... 46
3.4.2 Conventional logit model .......................................................................... 47
3.4.3 Taste variation among individuals ............................................................ 48
3.4.4 Repeated measurements effect .................................................................. 50
3.5 Development of Utility Function for the Individuals' Perspectives ...................... 52
3.6 Summary ................................................................................................................ 53
Chapter 4 Survey Design and Data Collection ................................................................. 55
4.1 Introduction ........................................................................................................... 55
4.2 Survey Forrn .......................................................................................................... 55
4.3 Design of Stated Preference (SP) Exercises .......................................................... 56
-4.4 Presentation of SP Attributes ................................................................................. 59
4.4.1 Presentation of levels of charge ................................................................ 59
4.4.2 Presentation of travel time reduction ........................................................ 60
4.4.3 Presentation of environmental improvement ............................................ 62
4.4.4 Presentation of revenue allocation ............................................................ 63
vi
4.4.5 Presentation of systems features ...............................................................
64
4.5 Measurement of Behaviours .................................................................................. 64
4.5.1 Measurement of selfish and social perspective ......................................... 64
4.5.2 Measurement of acceptability ................................................................... 66
4.5.3 Measurement of effectiveness .................................................................. 67
4.6 Data Collection and Respondents' Characteristics ................................................ 68
4.6.1 Data collection process ............................................................................. 68
4.6.2 Problems in the data collection ................................................................. 68
4.6.3 Respondents' characteristics ..................................................................... 69
4.7 Conclusion ............................................................................................................. 71
Chapter 5 General Public Attitudes to Road User Charging .......................................... 73
5.1 Introduction ........................................................................................................... 73
5.2 Perception of Current Travel Situations ................................................................ 73
5.2.1 Current i ourney time ................................................................................. 74
5.2.2 Acceptability of current travel situations .................................................. 76
5.3 Perception of Transport Problems ......................................................................... 77
5.4 The Relationship between the Perceptions of the Problem and Current Travel Situation ............................................................................................................. 79
5.5 Perceptions of Effectiveness of Charging .............................................................. 80
5.6 General Comments from Respondents .................................................................. 83
5.7 Conclusions ........................................................................................................... 89
Chapter 6 Public Acceptability and System Characteristics ........................................... 90
6.1 Introduction ........................................................................................................... go
6.2 Acceptability Influenced by the System Characteristics ....................................... 91
6.3 Acceptability Variation among Groups of the Public ............................................ 94
0.4 Acceptability Variation aniong Individuals ......................................................... 102
6. ý Conclusions ......................................................................................................... 104

Vil
Chapter 7 Public Acceptability and Selfish and Social Perspectives ........................... 106
7.1 Introduction ......................................................................................................... 106
7.2 Selfish and Social Perspectives Affecting Acceptability ..................................... 106
7.2.1 Weights of selfish and social perspectives in overall respondents ......... 108
7.2.2 Weights of selfish and social perspectives variation among groups of the public ................................................................................................
109
7.2.3 Weights of selfish and social perspectives variation among individuals 113
7.3 1, actors Influencing Selfish and Social Perspectives ........................................... 117
7.3.1 Selfish and social perspectives relating to the charging characteristics.. 117
7.3.2 Selfish and social perspectives relating to personal characteristics and perceptions ............................................................................................. 121
7.4 Conclusions ......................................................................................................... 124
Chapter 8 Effectiveness of Road User Charging ............................................................ 126
8.1 Introduction ......................................................................................................... 126
8.2 Mode Choice Behaviour Influenced by the System Features .............................. 126
8.2.1 Initial model ............................................................................................ 127
8.2.2 Examining the initial model .................................................................... 130
8.2.3 Reasons of insignificance of the delayed-time reductions ...................... 132
8.2.4 Effects of car and bus travel times .......................................................... 134
8.2.5 Simulation test ........................................................................................ 137
8.2.6 Preferred model ...................................................................................... 140
8.3 Mode Choice Behaviour Variation among Groups of the Public ........................ 144
8.4 Mode Choice Behaviour Variation among Individuals ....................................... 147
8.5 Conclusions ......................................................................................................... 149
Chapter 9 Acceptability and Effectiveness ..................................................................... 151
9.1 Introduction ......................................................................................................... 151
9.2 Acceptability of Road User Charging Schemes .................................................. 151
9.2.1 Procedure for prediction of acceptance levels ........................................ 152

Vill
9.2.2 Predicted acceptance levels using the voting model of the charging system features .......................................................................................
154
9.2.3 Predicted acceptance levels using the voting model of the selfish and social perspectives .................................................................................
156
9.2.4 Discussions on the results of the predicted acceptance levels of charging systems .................................................................................... 158
9.2.5 Predicted acceptance levels for different groups of the public ............... 159
9.2.6 Predicted acceptance levels for car commuters ...................................... 161
9.3 Effectiveness of Road User Charging Schemes .................................................. 162
9.3.1 Procedure for prediction of car commuting reduction ............................ 162
9.3.2 Predicted car commuting reduction for different schemes ..................... 163
9.3.3 Predicted car commuting reduction in different groups of commuters.. 169
9.4 Acceptability and Effectiveness .......................................................................... 171
9.4.1 Acceptability and effectiveness among individuals ................................ 171
9.4.2 Acceptability and effectiveness among different charging schemes ...... 173
9.5 Design of Acceptable and Effective Charging Schemes ..................................... 177
9.6 Conclusions ......................................................................................................... 179
Chapter 10 Conclusions .................................................................................................... 180
10.1 Summary of Research ........................................................................................ 180
10.1.1 Research objectives .............................................................................. 180
10.1.2 Methodology ......................................................................................... 182
10.2 Main Findings and Policy Implications ............................................................. 183
10.2.1 General public attitudes ........................................................................ 183
10.2.2 Acceptability ......................................................................................... 183
10.2.3 Effectiveness ......................................................................................... 185
10.2.4 Design of acceptable and effective road user charging schemes .......... 187
10.2.5 Summary of the main findings .............................................................. 189
10.3 Suggestions of Further Research ....................................................................... 190

ix
References .......................................................................................................................... 193
Appendix A: An Example of the SP Questionnaires ..................................................... 208
Appendix B: Maps of Leeds and London Provided to Respondents ........................... 213
Appendix C: List of Papers Presented in Conferences ................................................. -716

x
List of Tables
I-able 2.1 Review of acceptability of road user charging in UK .......................................... 18
Table 2.1 Review of effectiveness of road user charging .................................................... 26
Table 4.1 Attributes and their levels in SP exercises I-4 (EX 1-4) in the main survey ..... 57
Table 4.2 Attributes and their levels in SP exercise 5 (EX 5) in the main survey ............... 58
Table 4.3 Review levels of charge used in previous studies ................................................ 60
Table 4.4 Characteristics of respondents from Leeds and London residents ....................... 70
Table 4.5 General perceptions of respondents from Leeds and London residents (% of respondents) ........................................................................................................
71
Table 5.1 Average joumey times (standard deviation) for work trips within Leeds and London ................................................................................................................ 74
Table 5.2 Average ratios of travel times (standard deviation) for work trips within Leeds and London .......................................................................................................... 75
Table 5.3 Average journey times (standard deviation) for non-work trips within Leeds
and London .......................................................................................................... 75
Fable 5.4 Average ratios of travel times (standard deviation) for non-work trips within Leeds and London ............................................................................................... 76
Table 5.5 Cross-tabulation between the perception of congestion and current situation ..... 80
Table 5.6 Cross-tabulation between the perception of pollution and current situation ........ 80
Table 5.7 Summary of comments from respondents (% of comments) ............................... 83
Table 5.8 Comments from Leeds and London residents by car and non-car users (% of comments) ........................................................................................................... 88
Table 6.1 Basic standard logit model of voting behaviour ................................................... 92
I Fable 6.2 Effects of segmentation in constant and coefficients of variables in the voting model ................................................................................................................... 97
Fable6.3 p"(c) ot'voting models segmented by personal characteristics and perceptions.. 98
Fable 0.4 Standard lognt model of voting behaviour segmented by personal characteristics and perceptions ..................................... ...................................... 99
Fable 6.5 Randorn parameters logit model of voting behaviour segmented by personal characteristics and perceptions .......................................................................... 103

xi
Table 7.1 Perceptions of benefits to self and to society by all observations ...................... 107
-fable 7.2 Standard logit model of voting behaviour as a function of selfish and social perspectives .......................................................................................................
108
Table 7.3 Standard logit model of voting behaviour as a function of selfish and social perspectives segmented by personal characteristics and perceptions ................
110
Table 7.4 Coefficients and ratios of the perceptions of benefits to self and society for different groups .................................................................................................
III
Fable 7.5 Initial random parameters logit model of voting behaviour as a function of selfish and social perspectives segmented by personal characteristics and perceptions ........................................................................................................ 114
Table 7.6 Preferred random parameters logit model of voting behaviour as a function of selfish and social perspectives segmented by personal characteristics and perceptions ........................................................................................................ 115
Table 7.7 Basic regression models of the perceptions of benefits to self and to society.... 118
Table 7.8 Segmentation regression models of the perceptions of benefits to self and to
society ............................................................................................................... 122
Table 8.1 Initial standard logit model of mode choice behaviour of car commuters ......... 128
Table 8.2 Proportion of mode choice in response to charging schemes ............................. 131
I'able 8.3 Standard logit model of mode choice behaviour of car commuters excluding sample which have low car delayed-time reductions (tj offered ...................... 133
Vable 8.4 Proportions of observations offered at least the time reduction needed for
compensating the charge by different values of time ........................................ 133
Table 8.5 Logit model of mode choice behaviour showing the effect of total travel time. 135
Table 8.6 Logit model of mode choice behaviour showing the effect of time difference between commuting by bus and car for car commuters .................................... 136
I Liblc 8.7 Simulation results from the synthetic responses ................................................ 139
Fable 8.8 Preferred standard logit model of mode choice behaviour of car commuters.... 142
Table 8.9 Values of time based on the sample enumeration approach by different ranges of i oumey distance ............................................................................................ 143
Table 8.10 Values of time based on the mean coefficients for different distance travelled 143
Table 8.11 Values of time based on the mean coefficients for different time ratio ............ 144
I Fable 8.1 -1 Preferred standard logit model of mode choice behaviour segmented by personal characteristics and perceptions ........................................................... 145
fable 8.1 ') Random parameters logit model of mode choice behaviour segmented by personal characteristics and perceptions ........................................................... 148

xii
'I able 9.1 Various road user charging systems ................................................................... 153
Table 9.2 Predicted acceptance lc%, cls of road user charging systems in Leeds by using the voting model of the system characteristics ..................................................
155
Table 9.3 Predicted acceptance levels of road user charging systems in London by using the voting model of the system characteristics ..................................................
155
Table 9.4 Predicted acceptance levels of road user charging systems in Leeds by using the voting model of the selfish and social perspectives .................................... 157
Table 9.5 Predicted acceptance levels of road user charging systems in London by using the voting model of the selfish and social perspectives .................................... 157
Table 9.6 Predicted acceptance levels of the base scenario for different personal characteristics by charging level (and % change from base) ............................ 159
'Fable 9.7 Predicted acceptance levels of the base scenario for different personal perceptions by charging level (and % change from base) ................................. 160
I I'Lible 9.8 Predicted acceptance levels of road user charging systems in car commuters in Leeds ................................................................................................................. 161
Table 9.9 Predicted acceptance levels of road user charging systems in car commuters in London .............................................................................................................. 162
Table 9.10 Predicted car commuting reduction for charging schemes in Leeds and London (and % change from EI charge) ........................................................... 164
Table 9.11 Arc elasticities with respect to the charge ......................................................... 167
Table 9.12 Linear elasticities with respect to the charge ..................................................... 168
Table 9.13 Predicted car commuting reduction of the base scenario for different personal perceptions by charging level (and % change from base) ................................. 170
Table 9.14 Voting and mode choice behaviour by different modes of commuting ............ 171
Table 9.15 Cramer's coefficients showing strength the relationship between acceptability and effectiveness ............................................................................................... 172
Fable 9.16 Summary of the effects on acceptability and effectiveness ............................... 177

xill
List of Figures
Figure 1.1 Conceptual framework for the study of acceptability and effectiveness .............. 3
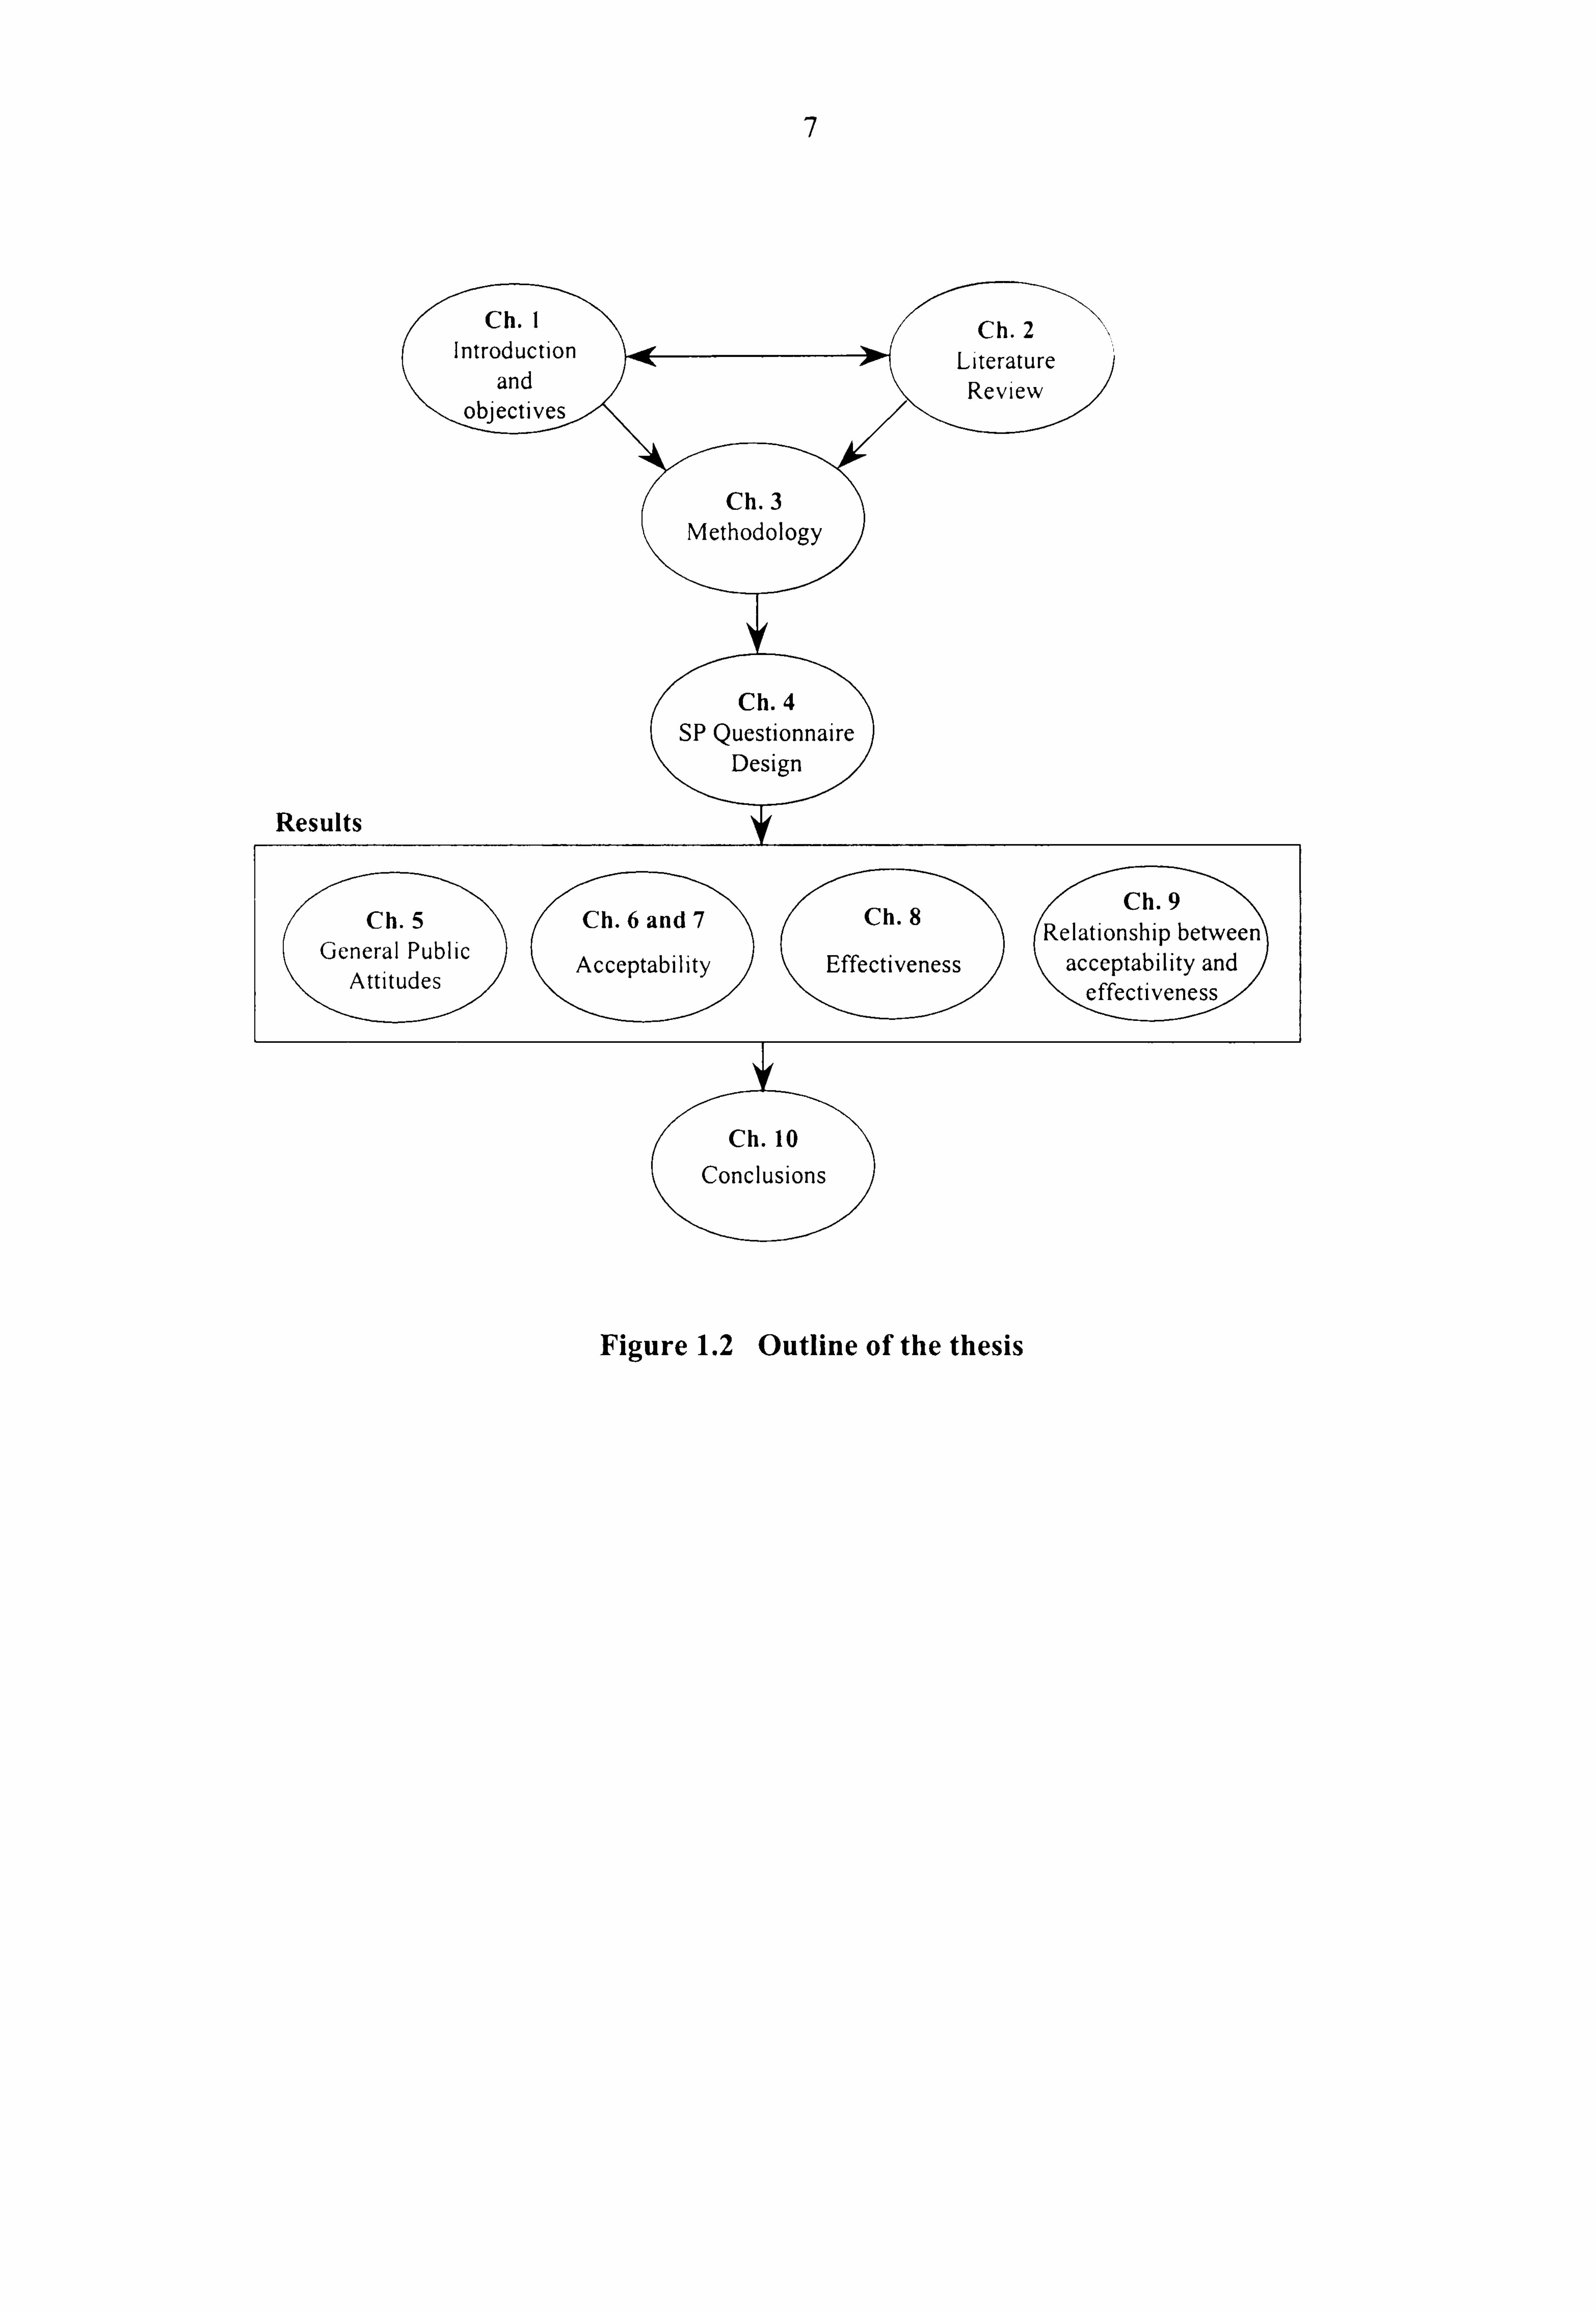
Figure 1.2 Outline of the thesis .............................................................................................. 7
Figure 2.1 The simple economics of road user charging ...................................................... II
Figure 5.1 Acceptability of current travel situations by car and non-car users .................... 76
Figure 5.2 Perceptions of congestion and pollution by all respondents ............................... 77
Figure 5.3 Perceptions of congestion in London and Leeds by non-car and car users ......... 78
Figure 5.4 Perceptions of pollution in London and Leeds by non-car and car users ........... 78
Figure 5.5 Perceptions of effectiveness of charging in reducing congestion and pollution by all respondents ............................................................................................. 81
Figure 5.6 Perceptions of effectiveness of charging in reducing congestion in London and Leeds by non-car and car users .................................................................. 82
Figure 5.7 Perceptions of effectiveness of charging in reducing pollution in London and Leeds by non-car and car users ......................................................................... 82
Figui, e 9.1 Predicted mode choices for charging within the Inner Ring Road of Leeds ..... 166
Figure 9.2 Predicted mode choices for charging within the Inner Ring Road of London.. 166
Figure 9.3 Comparing acceptability and effectiveness among charging schemes for car commuters in Leeds ........................................................................................ 175
Figure 9.4 Comparing acceptability and effectiveness among charging schemes for car commutes in London ...................................................................................... 175
Figui-e 9.5 Comparing acceptability and effectiveness among charging schemes for the general public in Leeds ................................................................................... 176
Figure 9.6 Comparing acceptability and effectiveness among charging schemes for the general public in London ................................................................................ 176

I
Chapter I
Introduction
1.1 Background
Generally, increasing car use leads to more problems; for example, increased congestion and damage to the environment, which in turn lead to a decrease in the quality of life. Therefore it has been suggested that car use should be controlled (Goodwin et al., 1991). One transport
policy to do this is road user charging. It has been widely suggested by transport economists and
planners for several years. The great interest in road user charging for various governments has
been mainly stimulated by the desire to find new sources of revenue for transport projects, and by the failure of alternative policies to cope with the growth of traffic congestion (Small and Gomez-Ibanez, 1998).
However, it is not readily acceptable to the public. Public acceptability is probably the greatest barrier to the implementation of road user charging (Jones, 1998). Even though during last ten
years there has been a great deal of research into how to increase the acceptance of road user
charging, there is still doubt about how to design the scheme to be acceptable and effective. A
fundamental question can be set as "... is it possible to design an urban road pricing scheme that
is both publicly/politically acceptable and effective at meeting policy objectives? " (Jones,
1998).
This is difficult to answer because it is not very clear how people will perceive the benefits and
respond to different road pricing systems. In general, the benefits of a road user charging
scheme are not appreciated by all individuals. People may feel they lose because of the charge (Small and Gomez-Ibanez, 1998). They may not want to pay for what was free (Giuliano, 1992;
Small, 1992). Many car users also see themselves as 'captive' to the charge and do not perceive
personal benefits (Giuliano, 1992). However, individuals are likely to be willing to pay for
things flicy NN ish to acquire (Jones, 1998). These considerations lead to a hypothesis that road
pricing would not be acceptable to the public, especially to car users who face the charges,
unless some benefits are perceived as either benefits to the individuals (self benefits) or
community benefits, or both. If pricing is to be introduced, car users will have to be convinced

2
that its benefits are worth paying for (Giuliano, 1994). In other words, people may vote for a
policy that makes them better off-, makes their lives easier, more comfortable and less stressed,
improves the environment: and makes the economy more efficient (Goodwin, 1997).
The features of a road user charging scheme are likely to directly influence individuals' travel
behaviour; through variations in charging levels, charging methods, charged periods of time and
charged areas. Some car users may respond to a charging system by paying and driving. Some
may respond by changing travel behaviour; for example, using another mode, changing their
route, changing time of travel and so on. Public acceptance of the system would relate to
whether they are satisfied with these responses. In summary, the details of the scheme: how
charging is administered and how the benefits are returned to the public, will affect both the
public's attitude towards the scheme and their behaviour.
In addition to charging system characteristics, acceptability is likely to be influenced by
individuals' preferences. Some people may not accept the policy because they lose benefits even though the public gain, On the other hand, some people may accept it because society as a
whole is better off. These perspectives may be called selfish and social perspectives, which
relate to perceptions of benefits to self and to society. These perspectives may deeply influence
individuals' propensity to accept and support the policy. For example, some people may be
willing to pay to preserve a service that benefits others or society as a whole (Bonsall et al., 1992).
1.2 Objectives and Methodology
The research aims to examine the impacts on acceptability and effectiveness, in order to help in the design process of road user charging schemes. It also investigates the relationship between
acceptability and effectiveness. The main research question is: how can road user charging
scheines be designed to be simultaneousljl acceptable to the public and effective in achieving
their objective? The conceptual framework of the study is illustrated in Figure 1.1.
I'herefore the objectives of study are to:
examine the effects of road user charging characteristics, benefits and system features,
on acccptability and effectiveness;
examine the Impacts of personal characteristics and percept' ions on acceptability and
effectiveness;
0 study the effects of selfish and social perspectives on acceptability. and

3
0 investigate whether acceptable systems are effective in reducing car use.
The four main factors examined include road user charging benefits, system features, personal
perceptions and socio-economic characteristics. The basis for these is established in Section 2.5.
Briefly the key characteristics considered are: (a) Benefits of road user charging include: car and bus travel time reduction, environmental improvement and revenue allocation. (b) System
features involve: level of charge, method of charge (fixed charge per day, time-based, distance-
based and delay-based), and time and area of charge. (c) Individual perceptions are related to
some hypotheses that:
When the public perceive their current travel situations as acceptable, it would be
difficult to encourage them to support charging schemes and change their behaviour.
When transport problems (congestion and pollution) are not perceived as serious, this is
a problem for introducing charging schemes.
When road user charging is not perceived as an effective solution in reducing the
problems, it is unlikely to be acceptable.
When individuals have a strong dislike of charging, road user charging would be
difficult for these people to accept.
(d) socio-economic characteristics include travel mode used, income, gender, age and household
location.
Socio- economic
characteristics
3 Selfish and social
perspectives
4
Acceptability
Effectiveness
Figure 1.1 Conceptual framework for the study of acceptability and effectiveness

4
Five hypotheses of the study are identified in Figure 1.1 and tested in data analysis:
(1) The four factors have direct effects on acceptability of road user charging (tested in Chapter 6).
(2) Acceptability is influenced by selfish and social perspectives (tested in Chapter 7).
(3) These perspectives are results of individuals' evaluations of the charging characteristics (tested in Chapter 7).
(4) The factors affect travel behavioural responses which influence effectiveness of road user
charging schemes in reducing car use (tested in Chapter 8).
(5) Acceptability has some relationship with car use reduction. Car commuters may not
accept the scheme if they have to change from using their car to other modes (low
acceptance, high effectiveness), On the other hand, they may accept it if they perceive
some benefits from paying without changing behaviour (high acceptance, low
effectiveness) (tested in Chapter 9).
To examine these hypotheses, the stated preference (SP) technique was used. The SP exercises
were designed and developed through a set of pilot surveys. Hypothetical charging scenarios
were presented to respondents, following by the questions to measure acceptability and behaviour responding to each scenario.
Acceptability was measured by voting behaviour, in which individuals were asked whether they
are willing to vote for charging schemes. Selfish and social perspectives were reflected by
perceptions of benefits to self and to society.
For evaluation of effectiveness of road use charging, it needs to be clear what is a main
obj . ective of the scheme. In this study, the main focus was for reducing car use. Effectiveness
was evaluated by mode switching of commuters responding to the scenarios. It was specific to
\ýork trips because mode choice is very much likely to depend on trip purposes, and the work
trip is seen as the most important for the majority of the public.
The SP data was analysed by using the standard logit model to demonstrate the overall effects for the whole sample. Then the segmentation analysis was applied to examine the effects of
personal characteristics and perceptions. Furthermore, the random parameters logit model was
used to examine taste variations among individuals from unobserved factors, which were unable
to be captured by the segmentation model. These models were developed for the voting behaviour and mode choice models, which were then used for predictions of levels of
acceptance and levels of car use reductions for different charging schemes.

5
In summary, in order to assess how to design road user charging schemes that are acceptable to
the public and effective in achieving their objective, this research examines not only the effects
of the charging systems characteristics, but also the effects of intrinsic moti\-ations of
individuals.
1.3 Outline of Thesis
The thesis is written in the order of the research process. A graphical presentation of the thesis's
outline is in Figure 1.2.
The first part, Chapters I to 3, explains the construction of the study's framework. This chapter, Chapter 1, presents the objectives and hypotheses, which were set up from the literature review
in Chapter 2. Then Chapter 3 introduces the SP technique, which was used in this study.
The second part of the research involves the design of SP questionnaire survey as shown in Chapter 4. The design and development of SP exercises, through four pilot surveys, is described. This chapter also explains the data collection process, and presents the sample
characteristics from Leeds and London.
The third part, Chapter 5 to 10, comprises the analysis of results and conclusions. Chapter 5
reports the data of current travel situations, such as journey time and delayed-time. It presents
results of the general perceptions including: the perception of the current situation, transport
problems (congestion and pollution), and effectiveness of road user charging in reducing the
problems. It also summarises general comments which respondents provided in space provided
in the questionnaire.
Chapter 6 demonstrates the direct effects of the charging system characteristics, and personal
characteristics and perceptions on acceptability. The voting behaviour model was developed for
predictions of acceptance levels of different road user charging schemes.
Chapter 7 demonstrates the indirect impacts on acceptability. It shows that acceptability is
hIAIN, influenced by the selfish and social perspectives. These perspectives are the results of
indiN-iduals' c%'aluations of the system characteristics, and are influenced by personal
characteristics and perceptions,

6
Chapter 8 demonstrates that effectiveness of road user charging Is affected by some charging
system features, and personal characteristics and perceptions. The effectiveness of charging
schemes is focused on levels of car commuting reduction. The mode choice model was developed for the predictions of car commuting reductions responding to different road user
charging schemes.
Chapter 9 illustrates the forecasts of acceptance levels of different groups of people for various
road user charging schemes. These results were created from the voting behaviour models in Chapters 6 and 7. This chapter also illustrates the forecasts of levels of car use reduction,
produced from the use of the modal choice model in Chapter 8. Then the relationships between
acceptability and effectiveness are demonstrated.
Finally, Chapter 10 draws together a summary of the research objectives and methodology, and the main findings on how to design acceptable and effective road user charging schemes. It also
provides some suggestions for further studies.
7
Ch. I Introduction
and
_objectives_
Ch. 2 Literature Review
Ch. 3 Methodology
Ch. 4 SP Questionnaire
Design
Results
Ch. 5 Ch. 6 and 7 Ch. 8 General Public Acceptability Effectiveness I
Attitudes
, ý_D Ch. 10
Conclusions
Figure 1.2 Outline of the thesis
Ch. 9 Relationship between
acceptability and 1--, effectiveness //

8
Chapter 2
Review of Road User Charging
2.1 Introduction
The objective of this chapter is to provide an overview of road user charging and a review of
relevant previous studies. It includes general background: definitions, objectives and development history in Section 2.2, and economic background in Section 2.3. The design of
road user charging schemes is presented in Section 2.4. Then Section 2.5 reviews previous
studies of acceptability of road user charging and the factors affecting acceptability towards
ways to improve it. Section 2.6 reviews its effectiveness from experiences of implemented
schemes and studies of pre-implementation places. Next, Section 2.7 presents a review of the
relationship between acceptability and effectiveness. Finally, Section 2.8 summarises some implications of the literature review for this study.
2.2 General Background of Road User Charging
This section provides an overview about road user charging. This includes definition and
objectives of the policy. Different terms have been used with the same or similar meaning as
road user charging. Different goals can be set for different schemes. The development history of
road user charging is also briefed in this section.
2.2.1 Definitions and objectives
Road pricing, in general, is a transport policy for charging motorists a fee for using their
vehicles \N,, ithin specific areas or on specific roads. The main concept of road pricing can be
defined in two ways by Jones and Hervik (1992). Firstly, by traffic engineers and transport
planners it refers to the imposition of direct charges on road use, with a variety of objectives. These are for managing travel demand in order to alleviate traffic congestion and to reduce the
cm-ironmental impacts from traffic, and for generating revenue to finance transport services and
infrastructure. 'Sccondly, by economists road pricing is referred to as the setting of pricing equal
to the di ft'Ci-crice bem, cen the social marginal cost and the marginal private cost of a journey. It
,,, ý, 111cam,, ofachieN-ing \\hat economists define to be optimal.

9
The ten-n road pricing has been used to cover any fiscal form of traffic restraint (Thompson,
1990) including both direct and indirect charges of road users (MInIstry of Transport, 1964;
Lewis, 1993). However, various terms have been used in parallel with the term road pncing, e. g.
road user charging and congestion charging (in UK) and congestion pricing (in USA), and the
specific terrns, e. g. road tolling, value pricing, variable pricing and peak period pricing.
In UK during 1990s, the term road user charging was widely used for specifying direct charge
schemes and formally used by the government, but since 2000 it has been called congestion
charging. In the USA, one particular form of road pricing called congestion pricing is only used for the objective of reducing congestion (Giuliano, 1992) by charging each motorist a fee that is
directly related to the amount of congestion he or she causes in using a road; as a result
motorists are encouraged to travel during less congested time, by less congested routes or by
alternative modes, or not to travel at all (Gomez-Ibanez and Small, 1994). The Transportation
Research Board (1994) also states that "congestion pricing would charge a premium to
motorists who wish to drive during peak travel periods through strategies that could include tolls on roads or bridges, fees to enter congested areas, or changes in the structure of parking
and transit pricing". The terms variable pricing and peak period pricing are sometimes used to
specify that a charge is varied by time of day, in order to shift demand from peak periods to off-
peak periods or other modes.
Road tolling is defined as road tolls or charges imposed by governments or private investors to
finance the construction of new roads and maintenance of old roads where the objective is to
maximise revenue (Luk and Chung, 1997). Value pricing was first introduced by the private
operators of the SR91 Express Lanes in California. The term is defined by the Institute of Transport Engineers (ITE, USA) as a "system of optional fees paid by drivers to gain access to
alternative road facilities providing a superior level of service and offering time saving
compared to the free facility" (cited in Orski, 1998). Road tolling and value pricing are slightly different from the concept of road pricing. They may charge motorists for financing the
construction costs or for providing better service, and may not be necessarily implemented on
congested roads.
2.2.2 Development history in transport planning
The concept of road pricing was initially mentioned in the middle of the 180, century (see
Section 2.3). In the UK, the Smeed Report (Ministry of Transport, 1964) was the first full
contribution of the theory of road pricing to policy implementation, which seemed to be a
catalyst of interest in road pricing studies. Subsequently, the first practical road pricing scheme
10
was applied in 1975 through the Area Licensing Scheme (ALS) in Singapore to reduce traffic
congestion. Another country, which has successfully implemented road pricing, Is Norway. Toll
rings were installed to raise revenue for transport projects around Bergen in 1986, Oslo in 1990,
and Trondheim in 1991. Many other countries are also interested in implementation of road
pricing. In 1985 an electronic road pricing was on trial in Hong Kong. In 1988 the Netherlands
Government developed a proposal for a road pricing implementation in the region called 'Randstad'. In 1991 the Swedish Government created a proposal for introducing tolls around Stockholm. In UK several local authorities, e. g. Bristol, Cambridge, Derby, Durham,
Edinburgh, Leeds, and London, are interested in road pricing since the central government gave
ncw powers to decide whether they want to implement road user charging and to provide them
to use the revenue for investment (DETR, 1998). The most recent proposal (GOL, 2000-, GLA,
200 1) was prepared for London. More details of these schemes including implemented and pre-
implemented cases are reported in Section 2.6.
In summary, so far the only successful implementations of urban road pricing are in Singapore,
which replaced the manual (ALS) system by an electronic road pricing system in 1998, and
Norway. Other countries are still studying road pricing and trying to gain support from the
public.
2.3 Economic Background of Road User Charging
Over 200 years ago Adam Smith (I 776a), a Scottish economist, already mentioned the
principles of efficient provision of 'public good' (e. g. roads, bridges, canals and harbours).
Smith argued that services should be paid for by those who benefit from them. Dupult (1844), a French engineer, by using a simple example of the imposition of a toll on a footbridge,
demonstrated efficiency of pricing, for which the benefit to users of the bridge was greater than
the revenue collected from the users.
A substantial studies of the economics of road user charging, based on the marginal pricing
concept pointed out by Marshall (1890), has been led by Pigou (1920) and Knight (1924). They
introduced the simple two-road example and argued that by imposing a toll-tax on a congested
road, total travel time \\'ould be reduced and encourage the more efficient use of road space, so
that society's \\-elfare \N, ould be enhanced. Walters (1954) clearly suggested that "motor taxation
should be levied so that the marginal private cost of vehicle operation is brought nearer to the
rriaroinal social costs and the degree of congestion on our roads is reduced". Vickrey (1955) also
stated that imii ginal cost should be concerned in an elaboration of any scheme of prices in order
to acliie\c the efficierit utilisation of facilities. However. this has not happened in practice. He
believed that in "no other major area are pricing practices so irrational, so out of date, and so
conducive to waste as in urban transportation" (Vickrey, 1963).
Since the cost rises as traffic speed falls, an extra cost is imposed on the average cost of all users
when an individual driver is added to a road network. The average cost is slightly higher than
before the individual joined, because of Increase of travel time and pressure from other vehicles. This concept was mentioned by Walters (1961), Beesley and Roth (1962) and the Smeed
Committee (Ministry of Transport, 1964).
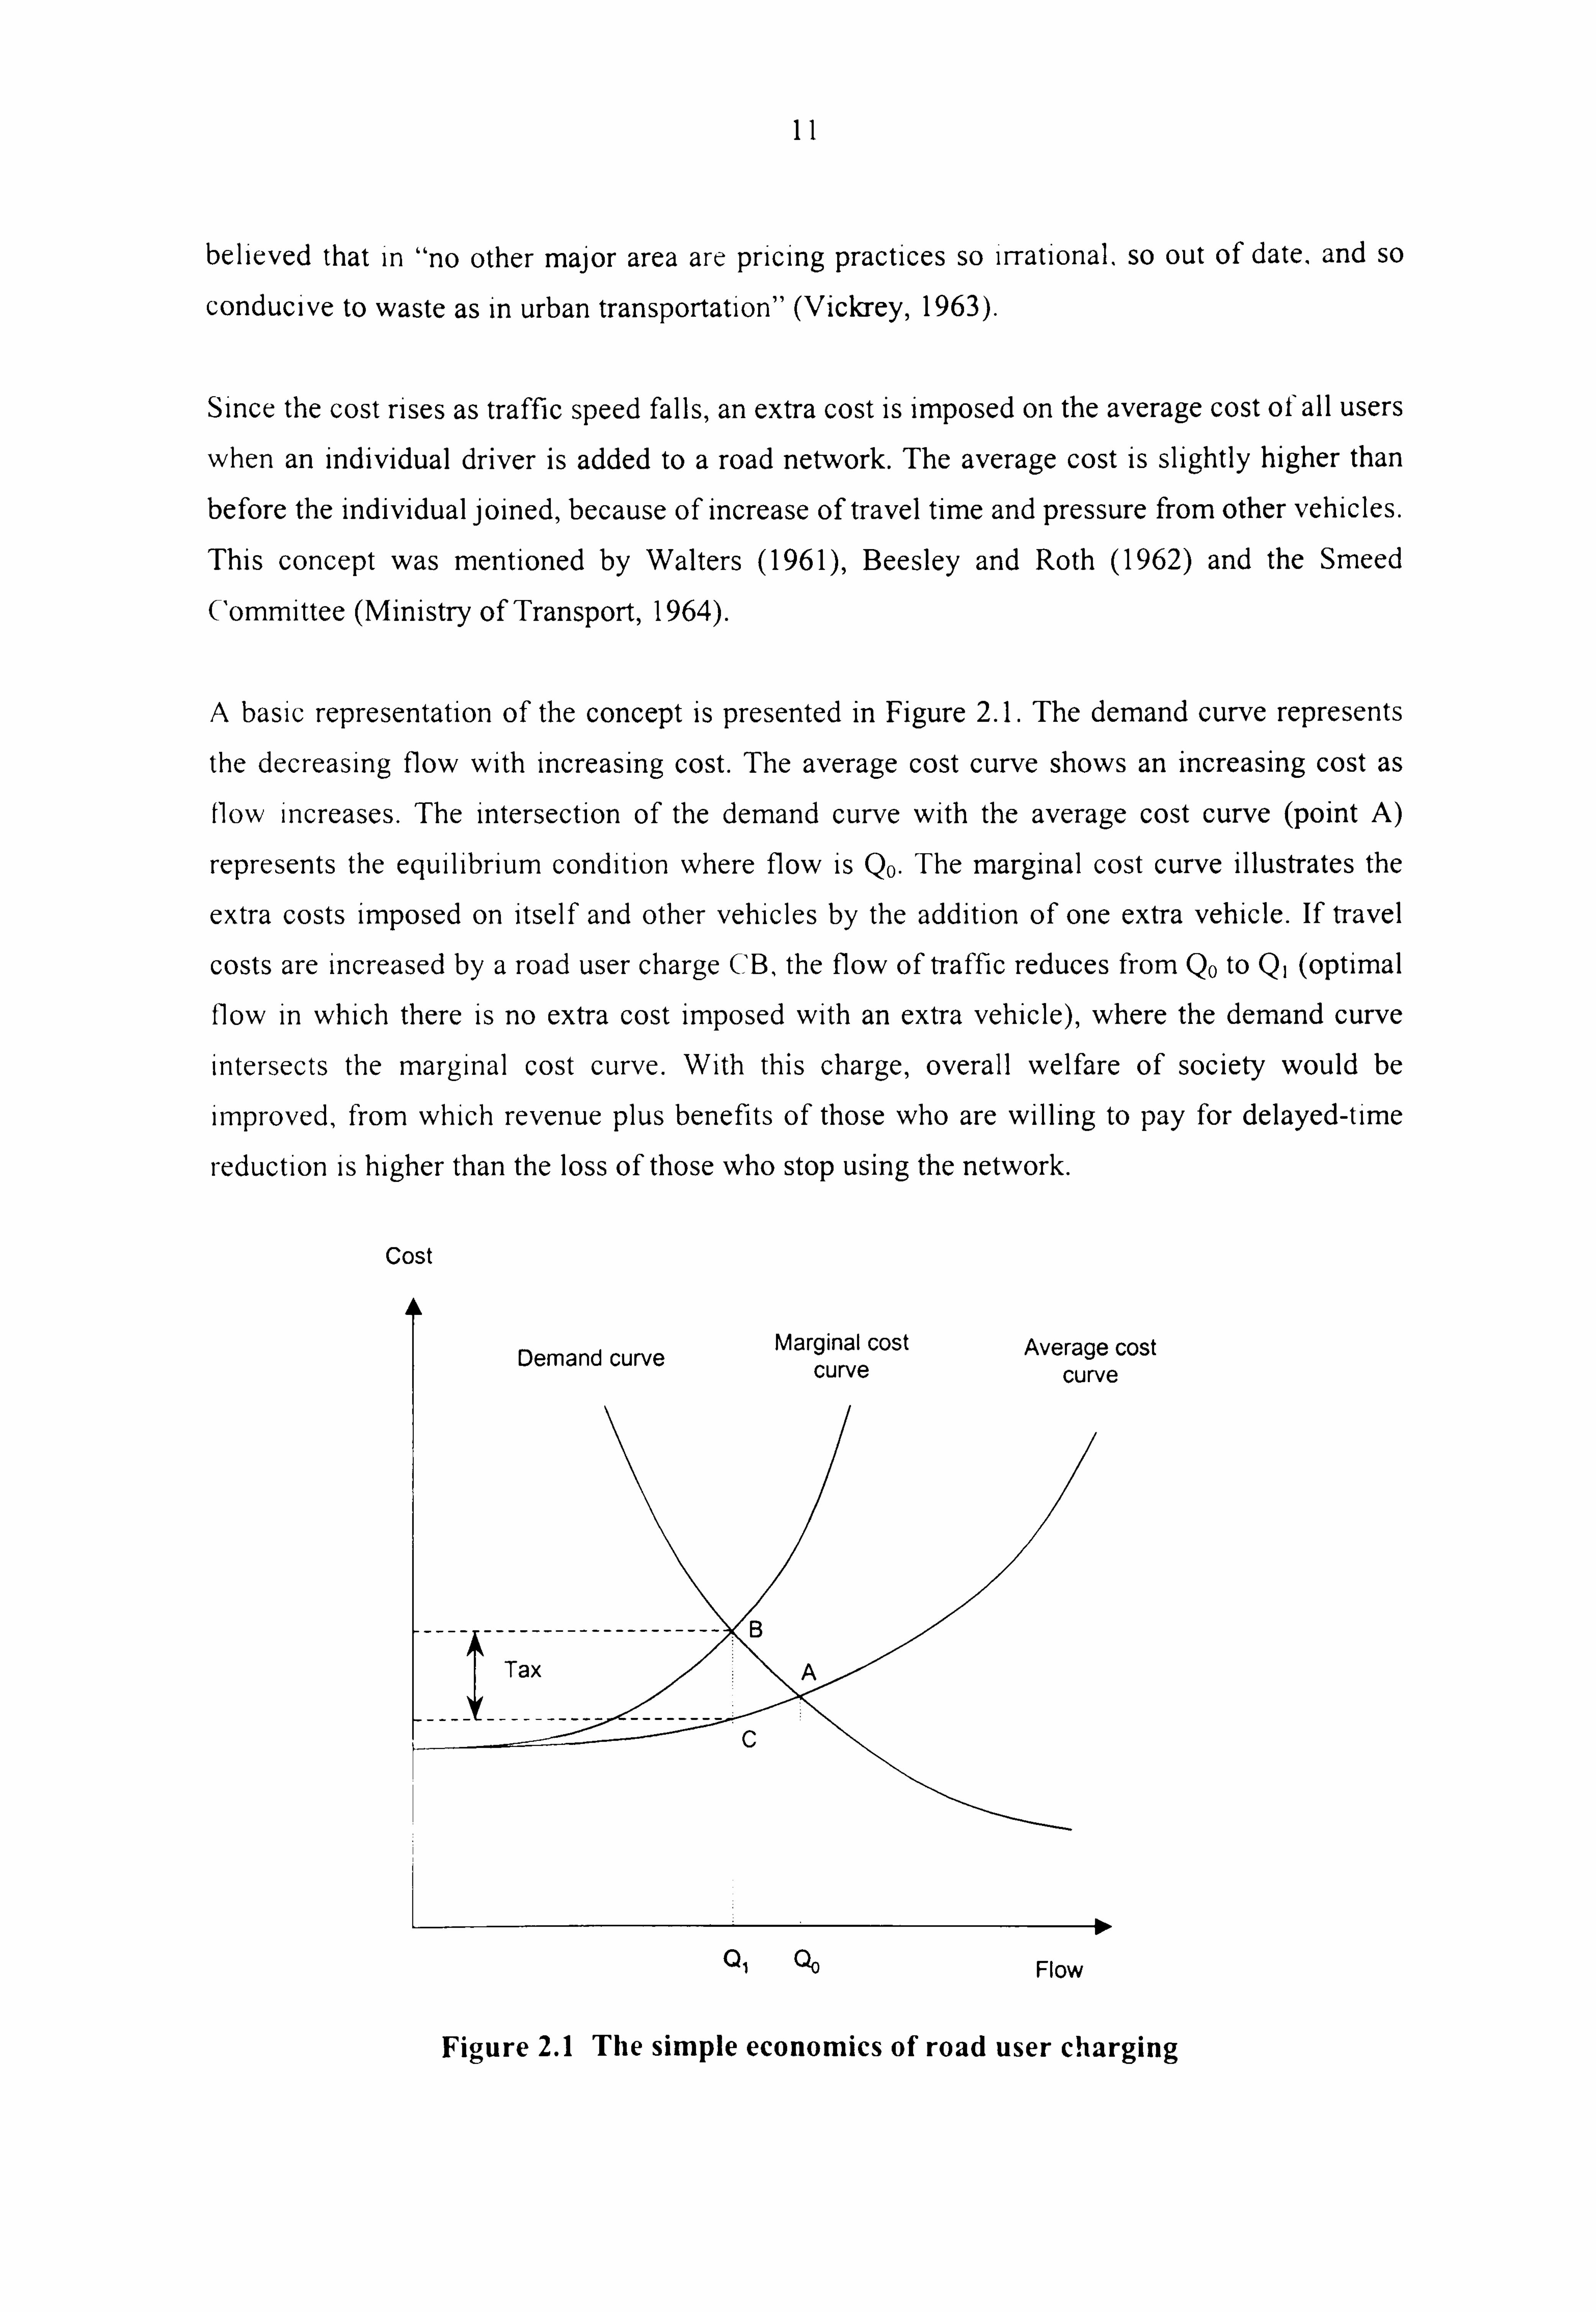
A basic representation of the concept is presented in Figure 2.1. The demand curve represents
the decreasing flow with increasing cost. The average cost curve shows an increasing cost as flow increases. The intersection of the demand curve with the average cost curve (point A)
represents the equilibrium condition where flow is Qo. The marginal cost curve illustrates the
extra costs imposed on itself and other vehicles by the addition of one extra vehicle. If travel
costs are increased by a road user charge CB, the flow of traffic reduces from Q0 to Q, (optimal
flow in which there is no extra cost imposed with an extra vehicle), where the demand curve
intersects the marginal cost curve. With this charge, overall welfare of society would be
improved, from which revenue plus benefits of those who are willing to pay for delayed-time
reduction is higher than the loss of those who stop using the network.
Cost
Demand curve Marginal cost Average cost
curve curve
Q, QO Flow
Figure 2.1 The simple economics of road user charging

12
The marginal cost function can be related to objectives of the charge. Firstly, if the objective is
concerned only with congestion, the marginal cost curve will Include the extra cost of delay,
which vehicles impose on each other. Secondly, the curve will be different, if the objective is
also concerned with other external costs e. g. air pollution, noise and accidents. Furthen-nore, in
the case of maximising revenue, the curve is not taken into account. The level of charge is dependent upon the elasticity of the traffic demand.
Following the development of the basic charging concept, various studies have contributed to
the economic theory of road pricing; for example, by Vickrey (1969), Walter (1987), Newbery
(1990), Small (1992), Verhoef (1996) and Hau (I 992a, 1998). The more recent development of the fundamental analysis involves the specification of demand and supply for congested
networks. One theory is that the average cost curve can be bent backward when demand exceeds the maximum capacity of the network and speed falls with flow (hypercongestion).
Nevertheless, there is still an on-going debated among researchers, who have still not agreed on the fundamental analysis.
Fhe initial analysis (see e. g. Hau, 1992a; Verhoef, 1999) used a static model with the flow-
based approach to explain the several points of intersection between the demand function and the backward-bending supply function. This supply function is derived from the relationship between average network speed and traffic flow for a given time period, in order to represent
performance of the network. This is based on an assumption that congestion on a network is
stable with continuous demand.
Fhe flo%\, -based approach is criticised by Hills and Gray (2000) who believe the backward-
bending curve of cost/flow over simplifies the actual traffic network, in which traffic flow
performs differently across different times and segments of network. By using a micro-
simulation approach, May et al. (2000) addressed the behavioural responses relating to the
spatial change (route choice) and the temporal change (departure time choice), whereas the costs
to users were measured by tracking individual vehicles through the network, not cutting them in
a gn-cii time period (as done for the performance curve).
Fhis issue \\, as investigated in detail based on micro-simulations in a DETR project 'Analysis of Congested Network' (2001) carried by ITS (University of Leeds), TORG (University of t7'
Nc\N, castle upon Tyne), John Bates' Services (Consultant) and TRL (Transport Research
l. aboratory). They demonstrated that the use of performance curves to estimate supply curves is
unreliable. and will generally overestimate the flow leN-els at which congestion charging is the

13
ply have first justified and underestimate its benefits. They claimed that "once demand and sup, been properly defined and the dynamic complexity of congestion properly represented I, na
model of a suitable specification, then the impact on supply/demand interaction of any change (whether in pricing, regulation or investment) could be analysed in the normal way ". However,
this has not been achieved. Some further interesting studies are suggested by the project, for
example exploration of dynamic rescheduling and route-choice behaviour, extension of
modelling to include vehicle-occupancy and other important behavioural responses (e. g. shifts
in mode, destination and frequency) to changes in trip costs, exploration of more complex
networks and the incorporation of different journey-purposes and multiple user-classes.
2.4 Design of Road User Charging Schemes
In this section, the design of road user charging systems is presented. This includes general
criteria of design and main structure of the systems.
2.4.1 General criteria of design
For the design of road user charging, although each city and country has its own constraints,
some general criteria should be considered (Ministry of Transport, 1964; Thompson, 1990; Hau,
1992a):
fiiirness, the charges should be perceived as fair by most travellers. This may involve basis of charge (e. g. based on quantity of road use), charged areas, time periods, and the
travellers who are charged;
simplicity, the charging system should be easy to understand by the public;
0 accuraci,, the charging system should always be accurate and be able to be verified by
users;
0 elif6rceinent, the system should be capable of protecting against fTaud and evasion;
prii, acy, the system should be designed to protect users' privacy;
9 flexibility, the system should be able to integrate with other systems, e. g. driver
information system and roadside information system, etc.,
0 technology, to achieve all above issues technologies should be appropriately applied.
These cover the four characteristics of a 'good' tax proposed by Smith (1776a) in his book 'The
Wealth of Nations', in which the obj . ectives of a good tax should be considered as equity,
certaintv. convenience and efficiency.

14
1ýurthermore, The High Level Group on Transport Infrastructure Charging (1998), convened by
the European Commission, in considering the general concept of charging, commented that -the
consequence of introducing the proposed charging systems should be to reduce rather than to
increase total transport related costs to the economy as a whole". This decrease of overall costs
could be achieved because the charge should increase efficiency of operation and use of
I. nfrastructure, and the 'external' costs which are incurred somewhere in the economy will be
paid directly by those who cause them.
2.4.2 Structure of road user charging system
Various road user charging features have been studied; for example, those reviewed by May et
al. (199 1), May (1992), Hau (I 992b), Lewis (1993), Gomez-Ibanez and Small (1994), and Small
and Gomez-Ibanez (1998). These show many practical features of road pricing. In addition to
setting objectives of the system, there are five key issues, which need to be addressed when designing a road pricing system (Jones, 1998):
" type of travel ler/vehic Ie to be charged;
" charged area;
" charged period;
" charging level;
" charging basis.
Type of travel ler/vehicle to be charged
To classify categories of travellers to be charged, the objectives of the scheme should be
specified. Jones (1998) suggests that exemption of some types of traveller or vehicle can be
made; for example: of pedestrians, cyclists and drivers of electric vehicles, when pollution
reduction is an objective of the scheme; of pedestrians, cyclists and public transport users, when
congestion reduction is an objective of the scheme; and of disabled drivers and goods vehicles,
according to 'need' to use vehicles. Moreover, occasional users, visitors, high occupancy
vehicle users and residents in the charged area should also be considered when designing the
system. However, designers of the system needs to be concerned that if residents in the charged
area were exempt from the charge, this is likely to affect the effectiveness of the scheme.
Charged area
I %, ideticc Crorn road pricing studies and implementation has shown various scales of
implcmentation that can be di\-ided into three (Decorla-Souza, 1993, Bhatt, 1993). Firstly,
single facility pricing (small scale) in\-ol\-es charging for use of a segment of motor-way or
.1 in USA, UK and France. Secondly, area-wide pricing (medium scale) involves bridge, e. o. IIII
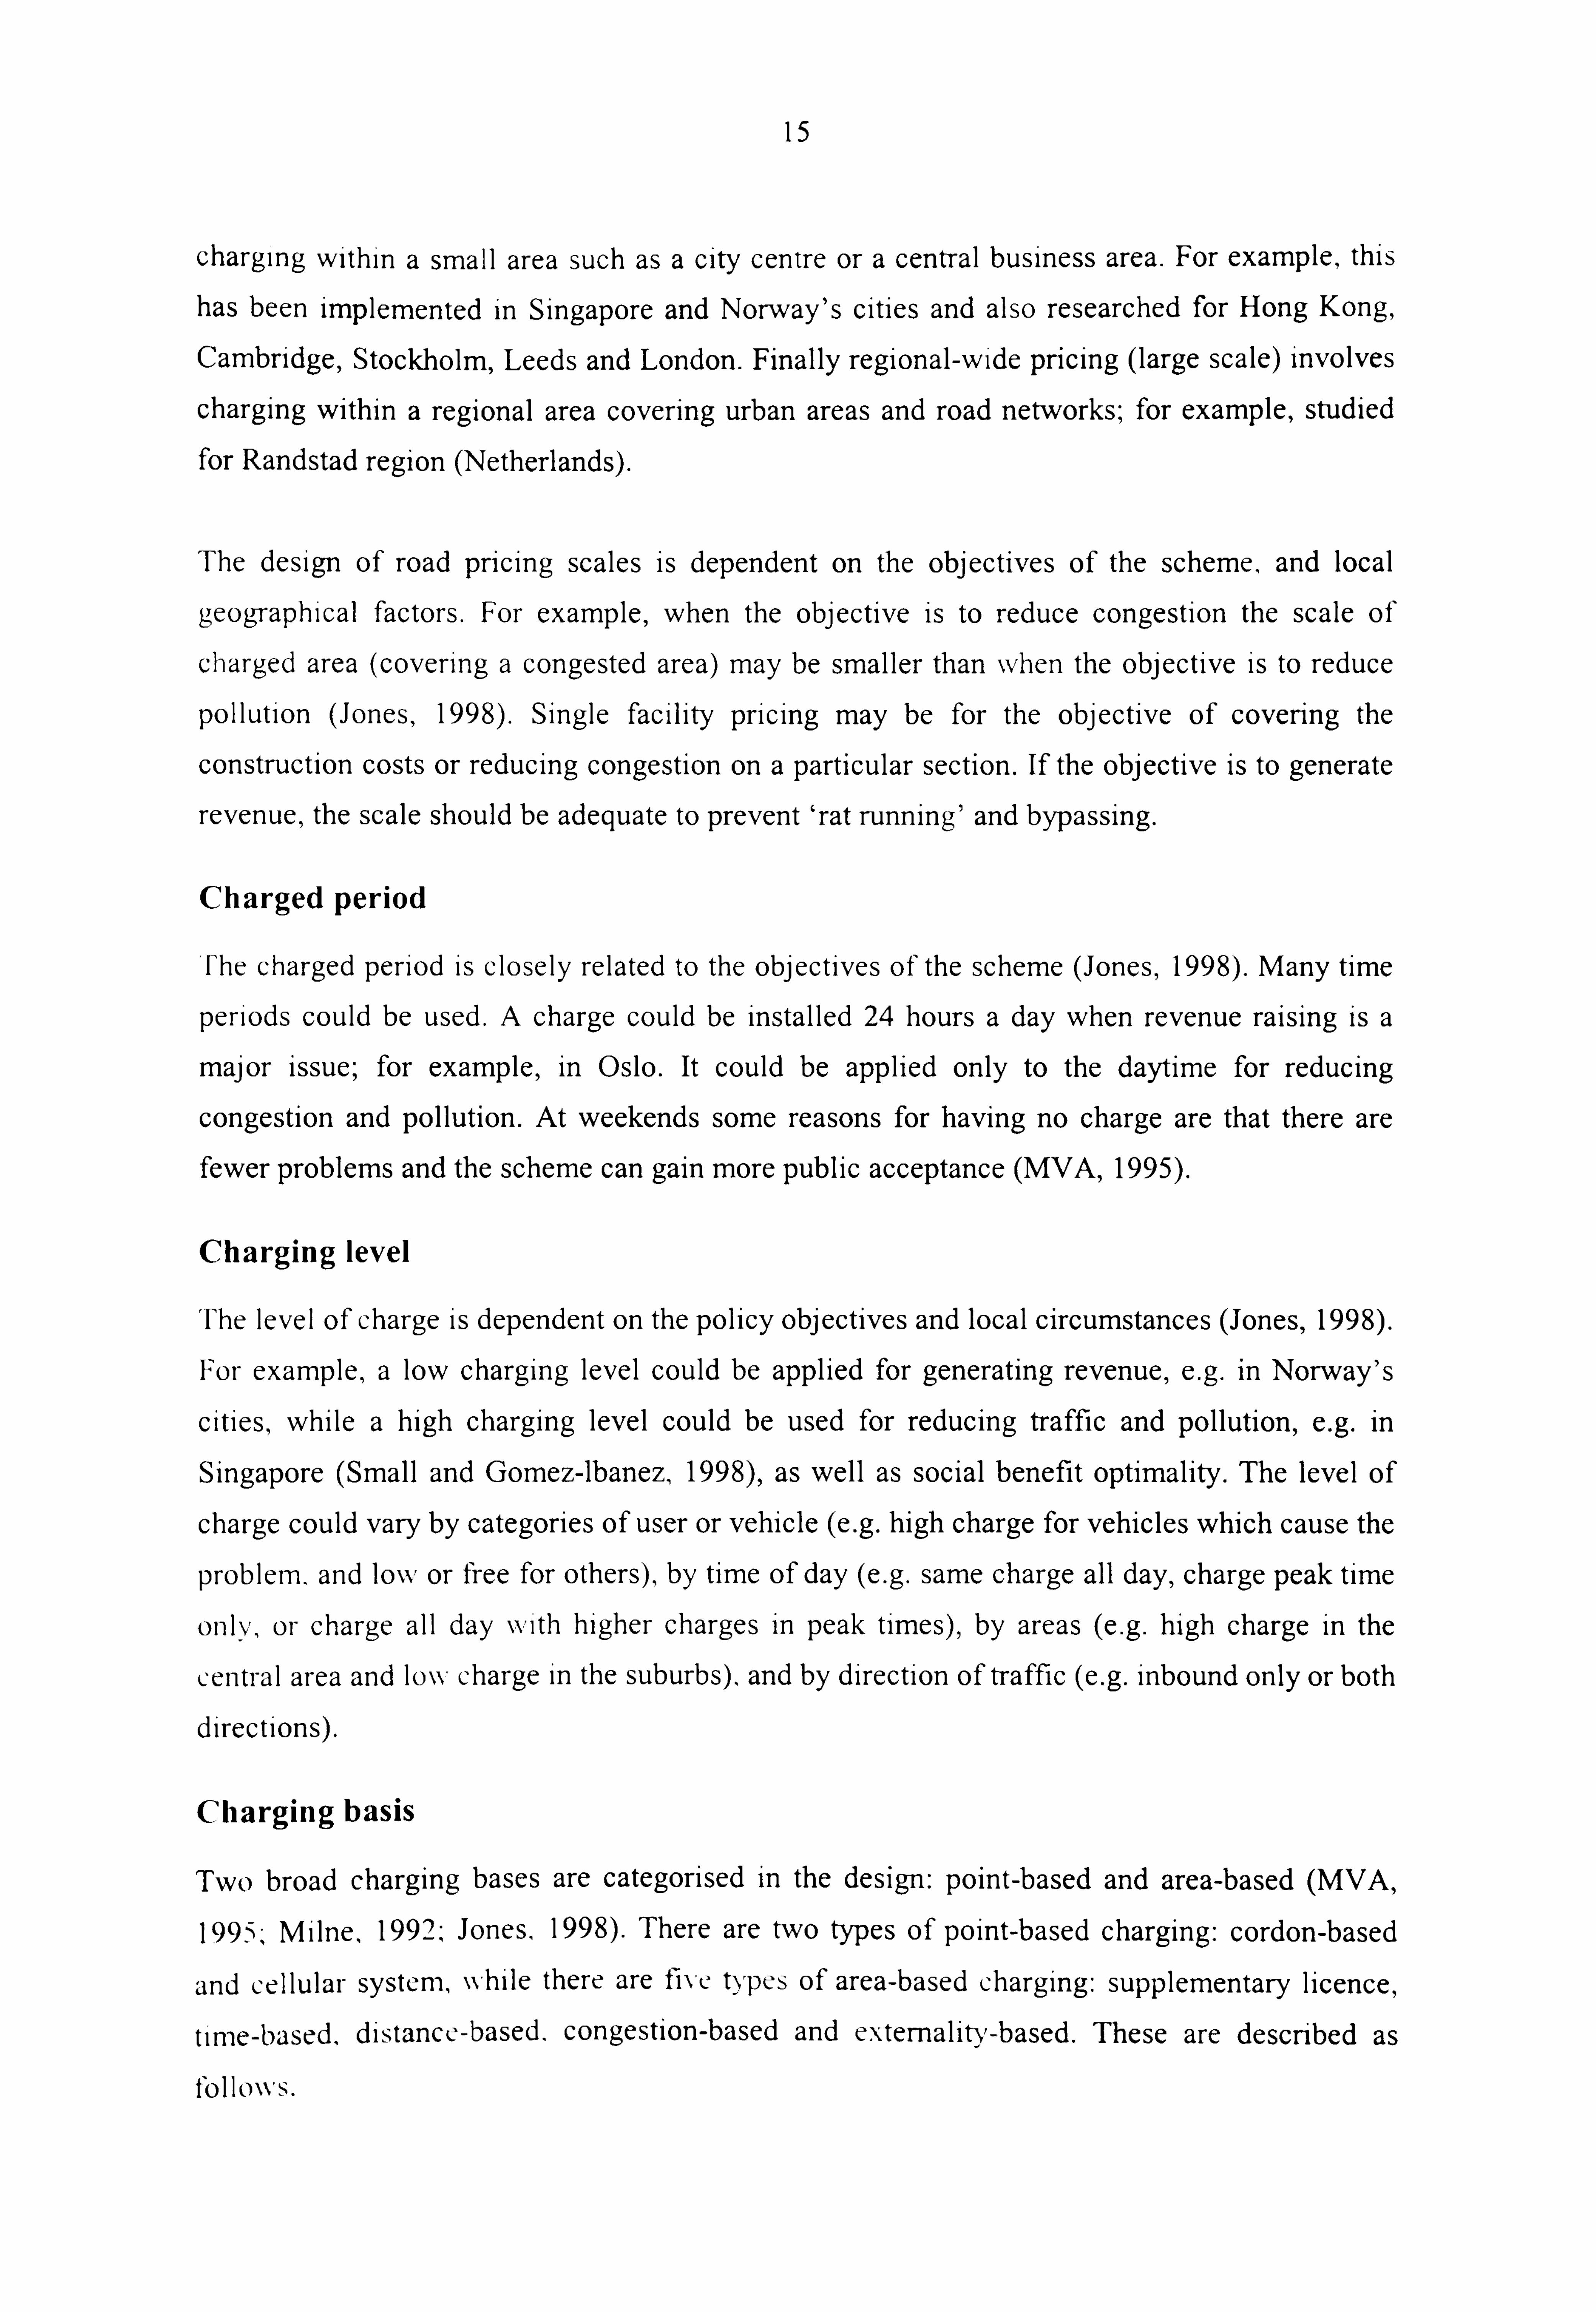
15
charging within a small area such as a city centre or a central business area. For example, this
has been implemented in Singapore and Norway's cities and also researched for Hong Kong,
Cambridge, Stockholm, Leeds and London. Finally regional-wide pricing (large scale) involves
charging within a regional area covering urban areas and road networks; for example, studied for Randstad region (Netherlands).
The design of road pricing scales is dependent on the objectives of the scheme, and local
geographical factors. For example, when the objective Is to reduce congestion the scale of
charged area (covering a congested area) may be smaller than when the objective is to reduce
pollution (Jones, 1998). Single facility pricing may be for the objective of covering the
construction costs or reducing congestion on a particular section. If the objective is to generate
revenue, the scale should be adequate to prevent 'rat running' and bypassing.
Charged period
Fhe charged period is closely related to the objectives of the scheme (Jones, 1998). Many time
periods could be used. A charge could be installed 24 hours a day when revenue raising is a
major issue; for example, in Oslo. It could be applied only to the daytime for reducing
congestion and pollution. At weekends some reasons for having no charge are that there are fewer problems and the scheme can gain more public acceptance (MVA, 1995).
Charging level
The level of charge is dependent on the policy objectives and local circumstances (Jones, 1998).
For example, a low charging level could be applied for generating revenue, e. g. in Norway's
cities, while a high charging level could be used for reducing traffic and pollution, e. g. in Singapore (Small and Gomez-Ibanez, 1998), as well as social benefit optimality. The level of
charge could vary by categories of user or vehicle (e. g. high charge for vehicles which cause the
problem, and loxv or free for others), by time of day (e. g. same charge all day, charge peak time
orily, or charge all day Nvith higher charges in peak times), by areas (e. g. high charge in the
central area and low charge in the suburbs), and by direction of traffic (e. g. inbound only or both
directions).
Charging basis
Two broad charging bases are categorised in the design: point-based and area-based (MVA,
1995, - Milne, 1992, Jones, 1998). There are two types of point-based charging: cordon-based
and cellular system, while there are five types of area-based charging: supplementary licence,
time-based, d istaric c -based, congestion-based and c xternal ity -based. These are descnbed as I ollow".

16
Firstly, for point-based charging, drivers are charged when entering specific areas, defined by a
,, ingle or series of boundaries. The charge is directly dependent on the number of boundary
crossings made by the vehicle (Milne, 1992). Two types of point-based charging: cordon-based
and cellular systems are suggested (MVA, 1995). Cordon-based systems involve one, two or
more boundary lines around a specified area, and sometimes with screen lines. For example,
single toll cordons have been implemented around three Norwegian cities. Cellular systems
include many cells; for example, a system of hexagonal cells, each with a radius of about a mile.
Secondly, for area-based charging, many types have been considered.
0A supplementary licence system requires a licence to be purchased for and displayed on any
vehicle used within a charged area (May, 1975). This system had been used in Singapore
since 1975, before being replacing by an automatic point-based charging system, electronic
road pricing (ER-P) in 1998 (see URL: www. Ita. gov. sg/erp/index. html). While the original Singapore scheme used manual enforcement, enforcement can now be achieved by video or digital camera studied for Leeds (Richards and Harrison, 1999) and London (GOL, 2000).
0 Distance-based charging involves a charge calculated from the distance travelled within a
charged area. This charging basis would be predictable based on route choice, and would
not lead to dangerous driving behaviour (Milne, 1992; MVA, 1995).
0 Time-based charging involves a charge calculated from the time spent travelling within a
charged area. This charging method is perceived by the public as a fair system (Thorpe and Jaensirisak, 1998). However, it leads to fast driving, which in turn may induce unsafe driving behaviour (Bonsall and Palmer, 1997).
0 Congestion-based (delay-based) charging is that vehicle users are charged when using their
% eliicles on a congested road in a charged area but they are not charged when the road is not
congested. For example in the study for Cambridge, a congested road is specified as being
when a vehicle using the road has four stops within 0.5 krn, or when the time taken to travel
any 0.5 krn is above three minutes (Oldridge, 1995). The delay-based charging is related to
congestion IeN-cls, so the charge tends to be difficult for users to predict. This regime also
may induce unsafe dri\'ina behaviour (Bonsall and Palmer, 1997).
17
Externality-based charging involves a charge linked directly to the negative Impact being
caused by the vehicle (Jones, 1998); for example, the charge could be related to exhaust
emissions from vehicles.
2.5 Review of Acceptability
This section reviews previous studies of acceptability of road user charging. This includes the
public attitudes in general from attitudinal surveys and the factors affecting acceptability. It also
explains how acceptability relates to individuals' selfish and social perspectives. Finally, it
presents a summary of general guidelines to improve acceptability.
2.5.1 Acceptability of road user charging
In psychology, it is stated that an attitude of a person is expressed by some degree of favour or disfavour (Eagle and Chainken, 1993). A number of studies in transport have used attitudinal
approaches for assessing acceptance of new transport policies and systems. Acceptance of a
system can be defined as the willingness to accept the proposed system (van der Loop and Veling, 1994).
Several attitudinal surveys towards road user charging have been carried out in the UK during
the last decade. The results are presented in Table 2.1.

18
Table 2.1 Review of acceptability of road user charging in UK
Case study I Source ý Year of I Results survey
Nationwide Jones(1991) 1991 30% support Taylor and 1993, 18% in favour of road pricing in city centre (1993) Brook (1998) 1995, 25% in favour of road pricing in city centre (1995)
1996 30% support charging motorists E2 for entering a city centre at peak time (1996)
Cf1T/MORl 2000 27% support (2000) Cf1T/MORl 2001 37% support
_(2QLL_ I
London NEDO (1991) 1991 43% acceptance Halcrow Fox and 1992 37% acceptance in car users Associates (1992) GOL (2000) 1999 53% of respondents agreed it was a "good thing"
30% of car users agreed it was a "good thing" (a daily charge of E5 for driving within Central London and E2.50 for Inner London)
ondon First 1999 76% support the system proposed by the London First F
(1999) (1999) (a E5 daily charge for cars, between 7arn and 7pm, inside the Inner Ring Road, with discount for resi
Other UK cities Cambridge Thorpe et al. 1994 34% acceptance of charging for car use within the city
(2000) centre (73% of respondents travelled into the city centre once a week or less)
Bristol Collis and 1996 32% acceptance Inwood ( 996)
Leeds Bonsall et al. 1997 30% thought that it would 'be a good idea to charge (1998) people for using roads at busy times of day'
Newcastle Thorpe et al. 1998 48% acceptance of charging for car use within the city upon Tyne (2000) centre (71% of respondents travelled into the city
centre once a week or less)
Leeds Schlag and Unknown 8%-16% support for different charging regimes: Schade(2000) distance-based pricing, congestion pricing and cordon pricing
]
Yo rk Schlag and Unknown 1 S. -23% support for different charging regimes: 10% I Schade(2000) I pricl g 1 I distance-based pricing, congestion pricing and cordon ng
The results show that public acceptability of road user charging in UK is generally low. Among
the surveys, the results are different. This is likely to be partly because of different groups of
sample. For example, for the surveys in Cambridge and Newcastle, acceptance is higher than
the other surveys outside London because there were high proportions of respondents who were less fi-equent (once a \N-eek or less) travelling into the charged area. In London, charging is more
acceptable than others, probably because of a high proportion of non-car users. GOL (2000)
reported that only 30% of car users felt that road pricing was a good thing, but 54% of the
whole sample did, when non-car user were included. The higher acceptance in London is also
possibly because there is higher congestion level than in other cities.
l1o%\evci-. the differences of levels of acceptance is likely to be mainly because there were different chargim, features presented and no iI inforination at all about charging system. For some

19
surveys, respondents were asked about attitudes to road user charging by a simple question
without presenting system character, st, c s. Although, the results are slightly different from each
other, with charges supported by about a third of respondents for the nationwide surveys and the
surveys in cities outside London: Bristol and Leeds (reported by Bonsall et al., 1998), they are different from the surveys for which some charging characteristics were presented, for example
the surveys in Leeds and York (reported by Schlag and Schade, 2000).
Different charging systems are also considerably different in levels of acceptance. For London
surveys in 1999, the results reported by the Government Office for London (GOL) show that a daily charge of E5 for driving within Central London and E2.50 for Inner London is supported by about a half of' the respondents (53%). In the same year, the survey by the London First
found that three quarters (76%) of respondents supported the presented scheme, which is a
charge of E5 per day for cars between 7am and 7pm, inside the Inner Ring Road, with a discount for residents (f 104 per annum without extra charge). This scheme is substantially more
acceptable than the charge proposed by GOL, possibly because of the smaller charged area and the discount for residents,
Furthermore, acceptability of congestion pricing in other countries is also generally low. As
reviewed by Luk and Chung (1997), support amongst the public is in the range of 15% and 50%, except in Singapore in which support is higher than 50%.
The lesson from Oslo shows that acceptance has increased over time after implementation, from
28'! /ý) responding positively in 1989 to 40% in 1995 (Odeck and Brathen, 1997), and then to 46%
111 1998 (Harsman et al., 2000). Moreover, the case of value pricing in California, which is
acceptable to the public, is interesting. The evidence suggests that people are willing to pay for
a better service, faster and more predictable trips, and do not oppose the scheme as long as they
have a free alternative route (Orski, 2000).
2.5.2 Factors affecting acceptability
Factors that are likely to directly affect acceptability of road user charging can be divided into
two main groups relating to characteristics of road pricing. These two factors can be controlled
in the process of road user charging design, in order to improve the acceptabilitY.
The first relates to benefits of the scheme, which may include journey time reduction,
environmental improvement and revenue generation. In other words, the scheme must make
clcai- \N, hat is the main objective, and meet public concerns. This was recommended from the
London congcstion charging study (Sheldon et al., 1993), the experiences of Oslo toll ring
20
(Odeck and Brathen, 1997) and the TransPrice project (Schlag and Schade, 2000). However, it
is uncertain that travel time reduction and environmental improvement are perceived by the
public to be worthwhile enough to compensate for the charge. Giuliano (1992) believed that in
the case of road pricing, individuals would not trade off between time and money (although
time has a monetary value in the economic theory), because charging is immediate and tangible
while time savings are not (Button, 1984). A result from Harrington et al. (2001) supported that
time saved is not significant in improving voting for congestion pncing.
In order to improve the public acceptance, many studies suggested that the revenue should be
used for improving public transport and/or reducing tax (e. g. Jones, 1991; Cf1T/MORI, 2000;
GOL, 2000; Thorpe et aL, 2000). For example, support for road pricing increased from 30% of
respondents to 57% supporting a package of road pricing with revenue raised to improve
alternatives (Jones, 199 1). Recent surveys by MORI in 2000 found that the 27% accepting road
pricing alone rose to 39% if revenue is invested in public transport, and to 41% if revenue is
used to reduce road and fuel taxes (Cf1T/MORI, 2000). In the 2001 survey, 37% supporting
charges for driving into city centre increased to 54%, if revenue was invested in public transport
(C'flT/MORI, 2001). However, no study indicates whether proportion of revenue use is
importance. Harrington et al. (2001) found that although the acceptance is related to tax
reduction, the variations of percentage of revenue used in this way were not significant. Furthermore revenue used in improving the environment is also rather highly supported by the
public (Stokes, 1996; Thorpe et al., 2000).
Secondly, acceptability is affected by scheme features including, e. g. the level of charge, the
method of charging, charged areas and the times of charging (Section 2.4.2). It was found that
complex systems such as time-based and delay-based charging may not be accepted (Sheldon et
al., 1993), and a system with a known charge is preferable over a system with an uncertain
charge (Bonsall and Cho, 1999). The results of TransPrice project (Schlag and Schade, 2000)
also showed variations in the acceptability for different methods of charge. In London, London
First (1999) found that a majority of people preferred charges in only Central London to charges
in larger areas, they also preferred changes between 7am-7pm to shorter or longer period
char es. and they thought that a charge at E5 per day for cars was acceptable. 9 z:: )
These findims are useful in the design of road user charging schemes. However, It has not been
clear 11o\N, people \talue the benefits and how acceptability varies across different combinations
of these systern features. More details need to be studied; for example, effects of each system feature and benefit on acceptability.

21
Moreover, acceptability relates to other factors, which are not in the design process. It involves
personal attitudes and perceptions; for example, attitudes to transport problems and the
perceived effectiveness of the scheme (van der Loop and Veling, 1994; Schlad and Toubel,
1997; Rietveld and Verhoef, 1998). People who perceive serious transport problems and
perceive charging as an effective solution tend to support road user charging schemes.
Acceptability is influenced by attitudes relating to the environment, the hazards of traffic and the car (Nilsson and Kuller, 2000). Those who are concerned about quality of the environment
and negative effects from traffic are likely to accept charging more easily than others. On the
contrary, those who have good images of cars tend to oppose charging. Some people use their
cars because they enjoy doing so, rather than through necessity-, this leads to resistance against
policies aimed at reducing car use (Steg and Tertoolen, 1999; Tertoolen et al., 1998).
Acceptability also involves psychological issues, for example perception of freedom and fairness (Baron, 1995; Jakobsson et al., 2000), concern on equity Issues (Giuliano, 1992,1994),
as well as the self and social interest of individuals (see the next section, 2.5.3). In addition to
personal benefits, people consider whether charging can provide benefits to different groups of
society equally.
Acceptability is likely to relate to personal characteristics and constraints, which may include
income, age, education, transport mode used, frequency of car use, the availability of alternative
modes, location of household and workplace, household type, and life style (Stokes and Taylor,
1995 -, Odeck and Brathen, 1997; Rietveld and Verhoef, 1998; Harrington et al., 200 1).
Furthermore, in general, road user charging is not acceptable to the public, for the simple reason
that sorrie people misunderstand the concept (Giuliano, 1992). For example, they respond that
road user charging is another form of taxation and they believe that they already pay a lot of
money to use cars.
2.5.3 Relevance of selfish and social perspectives to acceptability
In psychology, it is believed that people who hold positive attitudes tend to support the attitude
object, while people who hold negative attitudes tend to oppose the object (Eagle and Chaiken,
"). Howevei- in some contexts, such as public policies, individuals may have a conflict 199-)
between positive and negative attitudes In their mind for different perspectives. For example, if
action A has gn-eatei- utility for a person than action B but simultaneously action B makes society
better off, then the person may not al\\-ays choose action A; this means that the Nvell-being of
others must be guiding the individual's choice (DaNves, 1980). In other words, people may still

22
be willing to do something that does not directly benefit them, but benefits the community. This
concept is called 'Social Dilemmas' in which Dawes proposed two defining characteristics:
"(a) each individual receives a higher payoff for a socially defecting choice than for a
socially cooperative choice, no matter what the other individuals in society do, but
(b) all individuals are better off if all cooperate than if all defect. "
In politics, concern on individual impacts to and from other people may be a common issue for
living in society, as stated by Pitkin (198 1):
"Drawn in to public life by personal need, fear, ambition or interest, we are there forced to acknowledge the power of others and appeal to their standards, even as we try to get them to acknowledge our power and standards. We are forced to find or
create a common language of purposes and aspirations, not merely to clothe our
private outlook in public disguise, but to become aware ourselves of its public
meaning. We are forced ... to transform 'I want' into 'I am entitled to', a claim that
becomes negotiable by public standards. "
In political and social science, many papers in Mansbridge (1990) demonstrate a critical importance of motivations that go 'Beyond Self-Interest'. Mansbridge believed that:
"... when people think about what they want, they think about more than just their
narrow self-interest. When they define their own interests and when they act to
pursue those interests, they often give great weight both to their moral principles and
to the interests of others. "
In economics, there is a considerable literature suggesting that individuals' preferences are not derived only from their own well-being, but also of others. Smith (1776b) called this nature of humans "fellow-feeling pleasure" in 'The Theory of Moral Sentiments'. This concept was
generally called 'The Economics of Altruism' by Zamagni (1995).
Sen (1977), in 'Rational Fools', criticised the rational choice theory on the bas's that
individuals' preferences would be influenced not only by self-interest, but also by other
motivations: sympathy for other people and commitment, which involves counterpreferential
choice. Collard (1978) argued, in 'Altruism & Economy', that "human beings are not entirely
selfish even in their economic dealings", though "practically the whole of (neoclassical)
economic theory is built upon self-interested individuals maximising utility". However, he also

23
believed that altruistic feelings might be too weak to lead to action. Coleman (cited in Margolis,
'Selfishness, Altruism, and Rationality', 1982) also suggested that the classical economic theory, which always assumes that the individual will act as self-interest, is simply a
convenience, without theoretical foundation. He also stated that in many cases people do not
only vote for their own interest, but also for the interest of society. In other words, they attach
some weight to the interest of other people and take it into account (see section 3.3). These led
Frey (1997) to develop the crowding-out theory in 'Not Just for the Money', in which he
believed that all economic activities depend on both "extrinsic motivation" and "intrinsic
motivation".
In transport studies, selfish and social perspectives are considered in two areas as follows.
(a) Studying the effects on behavioural change. This attempts to assess the effects of the conflict between self and public interest on car use, for example studied by Steg and Vlek (1996),
Garling and Sandberg (1997) and Kitamura et al. (1999). They found that individuals hold
conflicting attitudes between positive and negative effects of car use on themselves and society,
which tend to underlie their behaviours on whether to travel by car. Van Vugt et al. (1995,
1996a, 1996b) and van Vugt (1996) studied the effects on mode choices between car and public
transport by dividing people into pro-self (individualist), who are primarily concerned with their
own well-being, and pro-social (co-operator), who are primarily concerned with the well-being
of society. Their experimental results show that the pro-social group would be more likely to
commute by public transport than the pro-self group.
(b) Studying the effects on individuals' valuations of transport schemes, which in turn affect
their decisions on whether or not to support the implementation. This examines the effects of
selfish and social perspectives at the individual level. For example, Bristow et al. (1991) studied
the effects on willingness to pay for preservation of local bus services. Hopkinson et al. (1992),
Hopkinson (1994), and Daniels and Hensher (2000) studied the effects of selfish and social
perspectives on individuals' valuations of road schemes. They found that individuals are likely
to have two different viewpoints for evaluating the schemes; one concerned their own benefits
and the other concerned benefits to society.
These studies confirm that people tend to hold two points of view (in their decision process) on
an issue, which particularly has effects on both themselves and society, before making a
decision to do something, e. g. travelling by a car, paying to preserve a service, and accepting or
supporting a scheme.

24
As with other public policies (or issues in which the public are involved), the selfish and social
perspectives are likely to influence individuals' propensity to accept and support road user
charging. The concept extends the point made by Giuliano (1992) in which individuals would
strongly oppose road pricing because they would not personally benefit from it. Rietveld and Verhoef (1998) and Rienstra et al. (1999) found that people have both individual and social
perceptions of transport problems which affect support for policy measures, and their concerns
about social issues would be more significant than about individual disutility. They believed
that people are not always guided by self-interest, but they also take a social perspective into
account.
Furthermore, as a separate issue, the concept of selfish and social perspectives can help to
explain another reason of unacceptability of road user charging in which people concern equity
of its impacts. This is because individuals often compare their rewards and costs with those of
others (Berkowitz, 1970). This may be a small problem for altruistic people. For example in an
extreme case, if A is very altruistic but B is egoistic, there would be perfect consensus in favour
of allocating almost all output to B and very little to A (Collard, 1978). In fact, this would be
seen as 'unfair' for selfish perspective. Therefore, if people in a society are concerned more
about benefit to society than about disbenefit to themselves, the equity problem may be less
important. (This issue was not examined in the study here).
2.5.4 Ways to increase acceptance of road user charging
Several ways have been suggested to increase acceptance of road user charging schemes from a
number of previous studies; for example: by Giuiano (1992), May (1992), Sheldon et al. (1993),
Ison (1995), TransPrice project (Schlag and Teubel, 1997; Schlag and Schade, 2000), Jones
(1998), Reltveld and Verhoef (1998), Whittles (1999), and PRIMA project (Gueller, 2000;
H a*rsman et al., 2000). These are useful in implementation of road user charging schemes. The
suggestions are summarised as follows.
Benefits and objectives need to meet the public concern. It is found that using the
scheme as a financial instrument is more easily to be acceptable than using it for
demand management.
Systenz characteristics need to be simple to understand for the public. A scheme would
also be preferable if the charge can be predicted.
Revenue allocation needs to meet the public preference. The most frequent suggestions
are using revenue to improve public transport and reduce tax.

25
L- quity issues need to be considered. This relates to the distribution of cost and benefits.
11' road user charging is perceived as unjust and unfair, acceptance will be difficult to
achieve. It must also not be perceived as a kind of punishment. This issue can be added
by revenue distribution.
9 Alternatives need to be available. This must be part of a policy package, which can
compensate those who cannot afford the charge, as well as contribute to perception of
freedom of choice.
0 Communication and marketing strategy can be of use to improve public understanding. It also can be used to create public awareness of the transport problems, and then to
enable a scheme to be perceived as effective solution.
2.6 Review of Effectiveness
This section reviews the effects of road user charging on overall traffic reduction, environmental
improvement, raising revenue and individual behaviour from previous studies. It also reviews
some experiences of implemented and pre-implementation cases of urban road pricing systems. Finally, this section reviews the previous research about demand elasticities with respect to road
user charging, as well as fuel price, parking charges and tolls.
2.6.1 Effects of road user charging
How the effectiveness of a road user charging is measured largely depends upon the objectives
of the scheme. Travel behavioural response is one of the indicators for reflecting the
effectiveness of traffic reduction. Many methods have been used to investigate behavioural
responses to road-pricing schemes before their implementation; for example: network
modelling, SP survey, attitude survey, driving simulator and field trials. The results are
surnmarised in Table 2.2.

26
Table 2.2 Review of studied effectiveness of road user charging Case Source Method Charging I Results I study level
I
Nationwide Taylor and Aftitudinal E2 entering city 35% give up or reduce significantly their reliance Brook 0 998) survey centre on cars London NEDO (1991) Attitudinal 50 p/hour 27% switch to public transport or un-charged
survey period MVA (1995) Modelling F-2 per crossing 8% reduction of total vehicle kilometres
22% reduction of total vehicle kilometres E8 per crossing
21 % increase in use of public transport LEX (1999)
Attitudinal F-3 per day 30% switch to public transport survey E6 per day 39% switch to public transport
GOL (2000) Attitudinal E5 per day 30% not by a licence (over half switch to public survey transport)
20% reduction in overall car trips within the central area
Modelling F-5 per day 30% reduction in home-based commuting trips
1 10-12% reduction in total traffic level Leeds Richards and Modelling E2 peak time 11 % overall traffic reduction within the city centre Harrison (1999) 1 ff peak 0
Bonsall et al. (1998)
Route El charge 74% "pay up and continue to travel", in turn 26% choice c within city are expected to travel in un-charged
simulator centre periods or by other modes May et al Stated EO. 50 25% car use reduction (1998) preference F-1.00 54% car use reduction
F-2.00 90% car use reduction Liverpool Stokes (1996) Attitudinal El per day Just under a quarter (of 456 car users) would
survey switch to public transport
E3 per day Just over a third (of 456 car users) would switch to public transport
Bristol 1 CONCERT-P I Modelling
I E2.5 - E4.5 15% reduction of car trips (1 ýý cordon Edinburgh Edinburgh City ng El per crossing 5% increase in use of public transport Council (2000)
1
E4 per crossing 15% increase in use of public transport Leicester Smith and Field trial E1.50 tolling 20% car use reduction Burton (1998) 7: 45-8.45am
E3.00 tolling 18-22% car use reduction 7: 45-8.45am E3.00 tolling 29% car use reduction 7: 00-10: 00am
Dublin O'Mahony et al. Average 6 4 22% trip reduction from suppression and switch to (2000) Field trial . Euro per trip public transport (responding to distance- and
time-based charging)
In charging systems, effects on overall traffic reduction can be expected. For example, transport
modelling studies indicated that a significant proportion of car users would transfer to bus or
change their time of travel to outside the charged time, if cordons around Central London were
implemented. The London Congestion Charging Research Programme (MVA, 1995) found that
an inboLind cliai-_, -,, c of . ý-" and E8 for Central London between 7am and 7pm would provide 8%

27
and 22% reductions of total vehicle kilometres, respectively. Among those who altered their behaviour. the greatest responses would be a switch to buses. At a charge of E8, a 16% increase
was predicted in the number of'bus passengers entering Central London in the morning peak
period, and 3% and 4% increases in rail and Underground passengers, respectively. The
modelling results from GOL (2000) are that car Journeys to/from within the central area would
reduce by 20% overall, and 30% for home-based commuting trips.
A 15% reduction in car use was predicted in Bristol with an all day cordon-based charge of E2.50-4.50 (CONCERT-P, 1998). For road pricing in Leeds, MVA consultancy (Richards and Harrison, 1999) found that a morning peak charge of E2 and an off-peak charge of El could
reduce overall traffic within the city centre by I I%. In the Dublin trial, based on distance and time-based charging, a significant reduction (22%) in the number of peak period trips was
expected from trip suppression and switching to alternatives (O'Mahony et al., 2000).
At the individual level, various responses to road pricing can be expected, mainly including:
mode switching, re-timing, re-routeing, re-locating, and trip frequency reduction. In UK,
attitude surveys have found that motorists would reduce car use if they were charged for
entering a city; most of them would switch to use public transport or change travel time. For
example, the British Social Attitudes surveys in 1996 found that 35% would give up or
significantly reduce their reliance on cars, if they were charged E2 each time they entered a city (Taylor and Brook, 1998). NEDO (199 1) claimed that if a charge of 50p per hour at peak times
were implemented in the centre of London, 27% of those who had travelled by car into the area
said they would avoid using their cars by switching to public transport (14%), using cars in off-
peak (10%) and not making the j ourney Q %).
LEX (1999) also reported that if a E3 daily charge were implemented within a city centre, 30%
of car commuters would change to use public transport, and 39% would switch at af6 daily
charge. Basing on the attitude survey, ROCOL (GOL, 2000) found that if a E5 daily area licence
\\ ci-c introduced within Central London between 7am and 7pm on weekdays, 30% of car users
said tlicy would not buy a licence. Over half of them would switch their modes of travel. In
I. eiccster, -'10-30",, ) were expected to switch from car to alternatives (Smith and Burton, 1998).
For the Edinburgh charging scheme, Edinburgh City Council (2000) reported that a city centre
cordon of fI and E4 would encourage an increase in the use of public transport by 5% and 15%,
respectiNýely.
Based on a stated preference study by May et al. (1998). 90% of car users would avoid using
their cars, if af2 cordon-based charge Nvas introduced in Leeds city centre between 7: 30am and

28
9: 30arn with a free park and ride service. Over half would change to travel in uncharged times,
and others would switch to use alternative modes or park and ride.
Moreover, it is believed that there are hierarchical levels of individuals' behavioural responses. Giuliano (1994) divided them into three levels. The first is that of household characteristics, how an individual can adapt personal and other members' activities. The second one is the
workplace, e. g. changing work schedules, or departure and arrival times. The final level is
switching to alternative transport modes.
Raux et al. (1998) reported two main responses. One is immediately conceivable changes e. g.
activity timetable changes, route changes, cancellations or postponement of some trips. The
other one is "extraordinary" adaptation, e. g. switching to public transport and changing job or home. These emphasise that individuals' last travel behavioural response is a change of transport mode. The results of a study by May et al. (1998) and Bonsall et al. (1998) supported that the theory that car users are much more likely to avoid the charge by considering alternative
routes and times rather than to changing mode. They reported that preferences for behavioural
changes were in order:
to take a different route,
to travel earlier (before charged time),
to travel later (after charged time),
to use park and ride (or walk),
to use public transport,
to use car share and to relocate.
Reduction of car use is not only dependent on the levels of charges, but also on trip purposes. The ROCOL (GOL, 2000) study showed that reduction of car use for work trips is higher than
the reduction for other purposes. Thorpe and Jaensirisak (1998) and Gdrling et al. (2000) also found that switching to public transport is the most likely choice for work trips. This is possibly because for each individual commuting trips are usually more frequent and less flexible to
change destinations than other trips, such as shopping and leisure trips; to avoid the charge car
usei-s %vould switch modes and times, rather than reduce numbers of trips or change destination.
Reduction of traffic and travel time on a network is also dependent on charging regimes. May
and Milne (2000) examined four charging systems based on cordons crossed, distance travelled,
time spent in travellMg and time spent in congesti I ion by using a SATURN application on the

29
Cambridge road network. They found that conge sti on -based pncing is the most effective in
increasing network speed. but less effective in reducing distance travelled because it encourages
use of longer routes and minor roads. They concluded that. overall, t1me-based charging
performs better than other systems on most indicators.
As a result of traffic reduction, pollution problems would be reduced. Daniel and Bekka (2000)
studied the effects of congestion pricing on emissions for the US highway network. Their results
confirmed that congestion pricing can produce environmental benefits: clean air and less energy
consumption. The US Environmental Protection Agency (EPA, 1997) also found that pricing
measures had an advantage of reducing congestion and emissions faster than building facilities
or changing vehicles.
Another major objective of road user charging is to generate revenue to finance other transport
projects. It was claimed that road user charging could create substantial revenue for the
goverriment. For example, the study of road pricing in Leeds found that the charge within the
Inner Ring Road between 6am-6pm on weekdays could generate an annual net revenue of E25
million, if the level of charge is E2 in the morning peak time and fI in the off-peak time
(Richards and Harrison, 1999). The London charging scheme of a E5 daily charge operating between 7am and 7pm on weekdays within Central London could raise E230m-f270m per year
net revenue (GOL, 2000).
In brief, the effects of urban road user charging systems are likely to relate to characteristics of
the system and local circumstances, e. g. congestion level and the availability of alternative
transport modes, in addition to personal adjustments. The following sections review, case-by-
case, previous studies from different countries on the effectiveness of road user charging
systems. The studies can be divided into two groups: implemented and pre-implementation
cases.
2.6.2 Experiences of implemented cases
In practice, currently, only two countries, Singapore and Norway, have successful introduced
urban road pricing measures. They have demonstrated different objectives and system designs.
. I'hus they have different effects on traffic and travel behaviour.
Singapore
Singapore was the first country to introduce urban road user charging. Initially, the objective
was to restrict traffic at peak periods into the Central Business District in order to alleviate
congestion. The svstem applied was called Area-Licensing Scheme (ALS), covering most of the

30
central area in peak morning hours. The system was paper-based, and enforcement was effected by observers posted at each of the 22 entrance-points to the Restricted Zone (over 5 kilometres
square). Each vehicle entering this zone had to display an area licence on windscreen.
As a result of the scheme, traffic volumes during the morning peak hours fell almost
immediately by 45% (against the goal 25-30%) and average speeds increased from 18 to 35
km/h (Holland and Watson, 1978). Though the ALS had achieved more than the target, it was
argued that the price of an ALS licence had been set too high; thus causing less than optimal use
of available road space in peak hours (Wilson, 1988; McCarthy and Tay, 1993).
In 1998 the ALS was replaced by Electronic Road Pricing (ERP) (Menon, 2000). The objective
of' the system was changed to improve travel speeds in the road network. Vehicles to pass through the area, during 7: 30am and 7: 00pm on weekdays and 7: 30am and 2: 00pm on Saturday,
must have an electronic In-vehicle Unit in which a smartcard with positive cash balance has
been inserted. The toll applying at the particular time when the vehicle passes under each of the
33 gantries is automatically deducted without the driver having to slow down. Prices applied
under ERP do not fluctuate directly with actual traffic volumes, but they are subject to maintain
traffic speeds of 45-65 km. /h on expressways and 20-30 krn/h on arterial roads. The tolls would be varied according to the average speed on the network.
Advantages of the ERP over ALS are mentioned as being that it is more efficient, flexible,
reliable and convenient, though with higher initial investment costs (Foo, 2000). From data one
year after the implementation, Luk (1999) by using the short-run price elasticities showed that
the scheme would be twice as effective as a petrol price increase in reducing car travel, but that
they \vere similar in inducing mode shift to public transport. It would appear that ERP was not
intended to force a transfer from cars to other modes, although some traffic reduction is
rneasured (Menon, 2000).
It should be noted from the experiences of Singapore that the road pricing scheme is successful
because the system is a part of a policy package, including e. g. substantial improvement of
public transport, high parking charge and additional registration fee, and vehicle quota system.
'S implement the 'stick' policies because there no political problem, the ingapore can easi I
,, o\ cri-iment is strong and people belie\, e in the government's policies. Moreover. surprisingly,
the rcstraint policies haNv rio maj . or negative side effect on economic growth; on the contrary,
the\ have generated substantial funds for the improvement of social welfare (Willoughby,
2001).

31
Norway
In Norway, three cities are implementing cordon pricing. Bergen was the first city to introduce the scheme in 1986, followed by Oslo In 1990 and Trondheim In 1991. The systems Involve
charging all vehicles entering the cities. In Bergen, the toll system operates between 6am and 10am on weekdays. In Oslo, it is 24-hours operation on both weekdays and weekends. In
Trondheim, the time of charge is between 6am-5pm, with discount after I Oam, on weekdays.
In these cases, the main objective of the toll rings was to raise revenue to finance road projects. The scheme was not designed to reduce traffic. Nevertheless, the experiences of the toll rings
suggest that although the demand management was not among the objectives of the schemes,
some impacts on travel behaviour and traffic volume were found. The results of before-and-after
survey showed that in Trondheim about 40% of the public indicated effects on their travel behaviour, e. g. changing mode, time, route, destination and frequency, on the contrary, in Oslo
and Bergen the impacts on travel behaviour were relatively small (Meland and Polak, 1993). In
terms of the number of trips in the toll periods, the inbound car trips decreased by 6-7% in Bergen, 8% in Oslo, and 10% in Trondheim (Larsen, 1995).
2.6.3 Studies of pre-implementation cases
Governments of some countries introduced proposals of urban road user charging schemes. Although the studies of the impacts of the schemes demonstrated that the design could achieve
their objectives, they have not yet been implemented, as presented below for example.
Hong Kong
The first Hong Kong pilot of Electronic Road Pricing System (RRP) was undertaken between
1983 and 1985. The system was based on the automatic toll collection, billing and enforcement. Three schemes with different levels of charge, number of zones and geographical coverage were
tested. Vehicles' owners would receive a bill with details of their use of the network at the end
of each month (see Catling and Harbord, 1985).
The effects of the schemes were predicted (by a traffic simulation model) to reduce total daily
car tnps by 9-130'o and peak-period trips by 20-24% (Harrison, 1986). Economic evaluation
found that net benefits of the schemes were satisfactory (Gomez-Ibanez and Small, 1994).
Ne\ ertheless. the schemes were not implemented. One of the main reasons was the public
concern about the potential intrusion of privacy by 'big brother', in addition to political and
economic problems (Hau, 1992b).

32
After the failure of the attempt, road pricing was studied again in the mid 1990S. This Involves
assessing the requirements for an ERP system in Hong Kong, as well as the public acceptability (Opiola, 1998). (So far no result has been found reported in academic publications. )
Netherlands
During the late 1980s, the Dutch government developed a road pricing proposal for the
Randstad region. This covers four big urban areas (over 2,000 square miles) including Amsterdam, Rotterdam, Hague and Utrecht. The objective was to manage travel demand and
raise revenue to finance transport project. The plan involved charging points every 10 km based
on EI peak-period charges and I Op off-peak period charges, by using SMART card technology
with infra-red or microwave communications (May et al., 1991). The scheme was expected to
reduce vehicle travel by 17% during peak hours (Small and Gomez-Ibanez, 1998). Nonetheless,
it was rejected in 1990 because of public concerns about technical feasibility, invasion of
privacy and prevention of traffic spilling over to local streets.
In 2001, new charging scheme was proposed by the Dutch Ministry of Transport, Public Work
and Work Management, in 'The National Traffic and Transport Plan' proving a vision for traffic
and transport in 2020 (see URL: www. minvenw. nl/nvvp). It included the mileage charge
scheme, in which private cars would be charged a per-kilometre fee for using their cars in the Randstad area. This was based on the principle "the more you drive the more you pay". The
charges will include environmental tax and vary with peak and off-peak periods. The scheme is
expected to introduced around 20 10, reduction of regular taxes. However, the experimental peak levies and pay-lanes will start in 2002, to investigate the effects of road pricing.
Stockholm
The road pricing system for Stockholm was proposed in 1991. The objective was primarily to
reduce air pollution, traffic noise and congestion. The charging system was based on pre-
purchased licences. The charge would have operated on weekdays by using E30 monthly cards
or f2.50 daily cards (May et al., 1991). These have been predicted to reduce traffic by 10% and 6-8%, respectively. However, in 1997 the proposal was suspended by the government because
of political problems and opposition by the business community (AhIstrand, 2001).
111 1999, Li ne\\ study of'road pricing for Stockholm was carried out by the Swedish Institute for
Fi-ans, port and Commun i cations Analysis (SIKA), a governmental agency. It was claimed that
i-oad pricing kNOLIld be able to i-educe the number of private cars struck in the morning peak
period bly 90-95%, compared to the current situations, and to decrease car traffic n the
Stockholn-i region betweeii 1998 and 2010 by 9% in the morning peak time (AhIstrand, 2001).

33
London
The first proposal for London road pricing was during the 1970s by the Greater London Council
(GLC). The charging system was 'supplementary licensing', in which every vehicle was
required to purchase a daily licence to drive in the Inner London area. These charges were
expected to reduce traffic substantially and to increase speeds by about 40% during peak period (May, 1975). However, the proposal was rejected by the GLC in 1975.
During the early 1990s, 'The London Congestion Charging Research Programme' was
sponsored by the Department of Transport in UK (MVA, 1995). The research studied various
charging systems. The simplest scheme was a single cordon charge around central London. The
most complex schemes involved three cordons and screen-lines. The levels of charges were different for each cordon and screen-line and time period. The study found that the charging
schemes were relatively effective in reducing car use. For example, for a single cordon charge
around central London at E8 per crossing, 22% reduction of total vehicle kilometres could be
expected, Nevertheless, the schemes were very much likely to be opposed by the public. At the
end the systems were postponed by the government.
In 1999, new legislation created the Greater London Authority (the first Mayor was elected in May 2000). The Mayor produced the 'Transport Strategy for London', which included
congestion charging (GLA, 2001). Charging schemes suggested were based on the 'Road
Charging Options for London' study, which was produced by an independent group of transport
professionals (called Review of Charging Options for London (ROCOL) Working Group) and
supported by Government Office for London (GOL, 2000).
The scheme was based on the area licence enforced by using digital cameras to check number
plats against the database. The E5 daily charge operated between 7am and 7pm on weekdays
within Central London would produce net economic benefits of E95m-EI60m per year. (The
effectiveness in traffic reduction are reported in Table 2.2) The survey by MORI (GOL, 2000)
f'ound that the scheme is supported by majority of the public, particularly when the revenue is
proposed to be used for public transport improvement (Section 2.5). The scheme is planned to
be introduced in the early 2003, according to the Transport Strategy for London (GLA, 2001)
and the announcement by the Mayor of London (Mr. Livingstone) on 26 February 2002.
2.6.4 Demand elasticities
I'his section reviews elasticities of road user charging from previous research. Although there
are a limited number of studies directly about road pricing, evidence about increases of fuel
34
price, parking charges and tolls is also reviewed as this, to some extent can be transferable to
indicate effects of road user charging
A study ofroad pricing in London by Halcrow Fox and Associates (1992) was based on a stated
preference survey in 1992. The scheme Involved car trips inside the M25 charged on a distance
basis. They reported that for 'radial' (travelling into the city centre) work journeys the
elasticities with respect to 5,15 and 35 p/mile (based on zero charge) are -0.11, -0.38 and -0.52, respectively. For 'orbital' (roughly parallel to the cordon) work trips, the elasticities with
respect to 5,15 and 35 p/mile (based on zero charge) are -0.06, -0.12 and -0.41, respectively. The higher values for radial journeys are because public transport provides a better alternative to
car users for these journeys than for orbital journeys.
The ROCOL study (GOL, 2000), based on a stated preference survey in London, found that
elasticities for home-based work (HBW) trips by area licence holders with respect to a f2.50
daily charge within the Inner Ring Road are -0.03 and -0.07 for high and low income groups,
respectively. The elasticities for a f10 charge are -0.09 and -0.27 for high and low income
groups, respectively. Based on the AREAL model (a strategic model developed by the
Government Office for London with the aim of evaluating the impacts of alternative charging
options in the Greater London area), ROCOL found that elasticities for work trips with respect to f 2.50 and f 10 charges are -0.17 and -0.27, respectively.
The elasticities for the low level of charge from the Halcrow Fox and Associates study are
somewhat similar to the value from the ROCOL study, but for the higher levels of charge they
are slightly higher (in absolute terms). This is probably because the areas of charge are different.
Charging schemes covering larger areas are likely to have higher impact than ones covering
small areas.
Comparing the studies in London to evidence of road pricing in Singapore and tolls In Norway
and USA, the elasticities are broadly similar. For the original area licensing scheme (ALS) in Singapore, Luk (1999) estimated that toll elasticities in reducing car travel varied between -0.19 to -0.58, with an average of -0.34, which is about twice as effective as petrol price increases.
I-IoN\ ever in inducing mode shifts Luk found that road pricing was as effective as petrol price
increases. After the replacement of the ALS with electrorn III ic road pricing (ERP) n 1998, Menon
(2000) reported that a short run elasticity of demand was between -0.12 and -0.35 for the
mornmo peak period. This is also rather similar to the experience in Norway, in which the t, elasticities \\ci-e -0-22 for the Oslo cordon and 4-45 for the Alesund toll station (Jones and
Hervik, 19921). In their review of toll increases on six bridges and two tunnels in New York,

35
Hirschman et al. (1995) found that the average elasticity of traffic volumes was -0- 10, with the
highest value -0.50.
Reviews of elasticities by Goodwin (1992) and Glaister and Graham (2000) found that the short
run elasticity of traffic levels with respect to petrol Price was -0.15, and the one for petrol
consumption was -0.30. This led the National Economic Research Associates (NERA, 2002) to
use elasticities of around -0.1 and -0.3 in their modelling process to predict traffic levels in
response to the charging scheme based on distances travelled and levels of congestion ("Paying
for Road Use" reported to the Commission for Integrated Transport in February 2002).
Although there is no evidence to confirm that the effects of petrol price and road user charging
are similar, they are unlikely to be substantially different. This is based on the assumption that
some people may be able to mitigate the effect of charges by switching to uncharged periods,
without reducing car use; on the other hand, they may drive more efficiently to mitigate the
impact of fuel price changes (NERA, 2002).
Although there is limited evidence of the impact of road pricing, Jong et al. (1999) suggested that area-based (or cordon-based) road pricing can be evaluated using parking charge
elasticities, because the price to be paid is a more or less fixed amount per trip, and does not
vary with distance travelled as does fuel price. They found that average parking charge elasticity for the number of trips in European countries is -0.10. However because many commuters may have free parking spaces provided, parking charge elasticity may be expected to be lower than
area-based pricing elasticity. Both elasticities could be similar, if those commuters with free
parking spaces provided had their area licence charge subsidised by their employers.
Jong et al. (1999) also claimed that the fuel price effect could be used for evaluating distance-
based charges. Nevertheless, the reviews of the impacts of fuel price increases on car traffic
appear to be broadly similar to the impacts of parking charge increases and road user charging. A recent review of evidence from European countries by Jong et al. (1999) and Jong and Gunn
(2001) i-eported that the fuel price elasticity of the number of car commuting trips was -0.20 in
the short run. A revie\\- of Australian evidence by Luk and Hepburn (1993) concluded that the
short-term elasticity of traffic levels with respect to fuel costs was -0-1. For a review of a
number of US cases, Lee (1998, cited in Dargay and Goodwin, 2000) found that the fuel price
elasticity was -0.16 in the short run.
36
2.7 Review of Relationship between Acceptability and Effectiveness
It is important for the implementation of any transport policy to know whether the policy is
simultaneously effective in achieving its objectives and acceptable to the public. A study on
-carrot' and 'stick' policies clearly found that 'sticks' are likely to be more effective at changing behaviour than 'carrots', but they are less popular (Pharoah, 1993; Stokes, 1996; Anderson et al, 1998).
In the case of road user charging, a number of researchers felt that road user charging is
effective in reducing car use but less acceptable to the public, for example they stated that:
"... there is a trade off between methods of road user charging which are less effective but more acceptable, and those which are more effective but less acceptable" (NEDO, 1991);
"Although many transport and planning professions are agreed that some form of
road pricing is likely to be the most effective and flexible way of coping with the
growth in urban traffic problems, it is clearly one of the least popular measures
among the public at large" (Jones, 199 1);
"... it can easily be shown that congestion pricing is the first-best solution for
efficiently dealing with congestion, this instrument cannot yet boost much public and
political support" (Emmerink et al, 1995);
"At this moment road pricing would appear to offer the best option for tackling the
problem and a powerful economic case can be made for its introduction, but the
evidence suggests it is the least popular option" (Ison, 1995);
"Charging entry into town centres was also seen as effective in reducing car
congestion, but \vas not popular" (LEX 1998);
"Urban road charges, which are rather unpopular, might induce a substantial minority
to give up or reduce significantly their reliance on cars" (Taylor and Brook, 1998);
"Travel demand management by road pricing is especially difficult, because prices
that \\ ould be effective are not accepted, and what is accepted Is not effect've"
(('Jueller. 20001).
LEEPý! );,, )',; ý 1 -, 'i-ýRARý

37
These opinions do not seem to be supported by the results from the attitudinal surveys in Cambridge and Newcastle by Jaenslrlsak (1998) and Thorpe et al. (2000). They examined the
public acceptability of packages of travel demand management measures and effectiveness of the packages in reducing frequency of car use into the city centre. They found that the
combination of road user charging and public transport improvement was more acceptable and
also more effective than other combinations (e. g. combinations between increased parking
charges and improving public transport, and between road user charging and increased parking
charges). However, the study involved the comparisons among packages of policies. It is still
not clear among different road user charging schemes whether more highly acceptable schemes
would be highly or less effective.
In general, it is agreed that there is a negative relationship between acceptability and
effectiveness of road user charging. However, this has not been focused on by any research so far in order to find out whether it is possible and how to make road user charging acceptable and
effective.
2.8 Summary and Implication for this Research
This chapter has presented general background and reviewed previous studies of road user
charging. Various terms relating to road user charging were explained. The development history
and economic background was summarised. The general criteria and the charging system leatures, which are important in the design, were described. More importantly, this chapter has
i-e\ lcýved previous studies on acceptability and effectiveness of road user charging. This led to
the study aims, objectives and conceptual framework (presented in Chapter 1).
The review of actual and studied cases of road user charging systems has demonstrated that It Is
not difficult to design effective systems to achieve objectives. Road pricing systems can be
designed to have significant impacts on travel behaviour, leading to less traffic and pollution. In
Adition, they would generate substantial revenue for improving alternative modes and road
networks. However, the impacts can be expected to depend directly on the system
characteristics of the system, e.,,. charging level, charging regime, charged area and charged
time. Thus, knowing the effects of these features on car users' travel behaviour would be useful
for the design of a road pricing scheme to achieve objectives.
One of the main problems and reasons why the studied charging systems have not been
III, p I ci-nented is that theý- are not widely acceptable by the public. Many researchers also agreed

38
that in general road user charging is effective, but less acceptable. Thus, the main aim of the
study here is to examine how to design acceptable and effective schemes.
The revie\Aý has also shown that acceptability and effectiveness are affected by the charging
sy, steni characteristics, and personal perceptions and characteristics. The system characteristics
include, for example delay-time reduction, revenue allocation, charging levels, charging
methods, charged areas and charged times. The personal perceptions and characteristics relate to
e. g. perceptions of transport problems, perceptions of effectiveness of charging, gender, income
and age. These factors were found to have influences on public attitudes and behaviour.
Nevertheless, it has not been clear how much these factors have impacts, relative to each other,
and how acceptability and effectiveness would be changed regarding to these factors.
Moreover, the research took the concept of self- and social-interest into account for explaining
acceptability of road user charging. The viewpoint concerning mainly on self interest is called
selfish perspective, on the other hand, concerning mainly on social interest may be called social
perspective. It can be assumed that utility of an individual for supporting a charging scheme
includes both self and social preferences. Different people are likely to have different weights l'or their preferences (see Section 3.5).

39
Chapter 3
Methodological Issues
3.1 Introduction
In Chapter 1, the objectives and hypotheses were presented, based on the literature review in Chapter 2. To achieve the objectives and test the hypotheses, the methodological process is set
as follows.
1. Constructing the framework of the study (Section 1.2) from the literature review (Chapter 2);
2. Specifying the method and analysis (Sections 3.2 - 3.5);
3. Designing the survey form and SP experiment. This involves an iterative process, in
which the questionnaire and SP experiment were tested and developed through a set of
pilot surveys until they were adequate for the use in the main data collection stage
(Sections 4.2 - 4.5);
4. Conducting data collection (Section 4.6);
5. Analysing the data (Chapters 5- 9);
Thc objective of this chapter is to introduce the stated preference (SP) technique and data
analysis method. Section 3.2 presents the reasons for choosing the SP method. Section 3.3
presents the SP method: its main features, design process and possible sources of error in SP
data. Then Section 3.4 explains the technique of SP data analysis, involving the random utility
theory and logit model. Finally, Section 3.5 presents the development of the utility function for
demonstrating the effects of the individuals' selfish and social perspectives.
3.2 Choosing the Method of Research
In order to achieve the objectives and test the hypotheses of the study (presented In Sectlon 1.2),
a rcscarch method used should be able:

40
a) to deal with various charging scenarios-, b) to measure public acceptability and behavioural responses;
C) to examine the effects of charging charactenstics (benefits and charging features);
d) to examine the effects of personal characteristics and perceptions;
e) to predict acceptability and behavioural. responses of different charging systems.
Revealed preference (RP) information, relating to actual preferences and behaviour, is
impossible to be used simply because there is no road user charging system in UK. A few
methods were considered including stated preference (SP) techniques, attitudinal surveys, and
activity-based approaches.
Stated preference (SP) techniques involve studying individuals' preference and behaviour in
rcsponding to hypothetical scenarios. These are characterised by important attributes which are likely to affect the preference and behaviour (further detail is explained in the next section). This method was considered as the most appropriate in which it could achieve all the criteria listed above.
Nonetheless, the SP techniques assume that people answer honestly what they think and will
attempt to do what they intend to do (although there are some possibilities of response biases;
discussed in Section 3.3.3). It might be suspected that people may not do (actual behaviour)
what they said (intention).
The assumption that intentions correspond closely with behaviour is supported by psychological
studies that have examined the relationship between behavioural intention and actual behaviour
(e. g. Fishbein and Ajzen, 1975; Ajzen and Fishbein, 1980; Ajzen, 1985,1988,1991; Conner
and Sparks, 1996; Gdrling et al., 1998). They found that the relationship is relatively high;
I. ndividuals tend to behave in accordance with their intentions. Although individuals' intentions
could change over time (the longer the time interval, the lower the relation between behaviour
and intention), aggregate intentions for a group of people are apt to be much more stable over
time than individuals' intentions (Ajzen and Fishbein, 1980). Furthermore, the strength of
relationship between intention and behaviour could be improved, if the behaviour is planned,
rather than habitual or impulsive (Gdrling et al., 1998).
In the study here, therefore, public acceptance and travel behavioural intentions measured were
reasonably reliable to represent actual behaviour, in which the intentions dealt Nvith individuals'

41
planned travel behaviour (for journeys to work), and the models developed were used to predict
acceptance and behaviour at the aggregate level.
The other concern for the use of SP methods in demand forecasting is related to imprecise
coefficients in estimated models, due to random error in SP responses. This is called the scale factor problem (see Wardman, 1991). This scale factor cannot be estimated separately from the
coefficients. The problem could be overcome by re-scaling the model using revealed preference (observed) data. Unfortunately, this is not available for this research. Nevertheless using the
random parameters logit model (Section 3.4.3), which allows the parameters vary across
individuals, should improve the coefficients, and in turn lead to more reliable prediction results.
The other methods considered have some drawbacks, as a result of which they were not suitable for this study. Conventional attitudinal surveys with descriptive statistic analyses can be used to
investigate general attitudes and responses to road user charging (e. g. in NEDO, 1991; Stokes,
1996; Taylor and Brook, 1998; Thorpe et al., 2000). The analyses are able to test what factors
(charging characteristics and socio-economic factors) influence the attitudes and behaviours
significantly. However, the analysis results do not explain the effects of road user charging
system characteristics in quantitative terms. Thus, they cannot be used to predict preferences
and behavioural responses to alternative charging schemes which are not presented to
respondents.
Activity-based approaches (see Jones, 1990, Ettema and Timmennans, 1997) can be used to
describe not only which responses individuals pursue, but also details of how each Individual
and his/her family change their travel times, routes and destinations. Data collection is usually based on a travel diary, which can provide a rich source of data. Data analysis can examine the
interactions among activities, times and spaces, from which individuals respond to a road user
charging scheme. Nevertheless, the data collection gathers a lot of information from each
respondent for one charging scenario, it is not appropriate to examine various charging systems
at the same time, and thus not possible to be used in forecasting behavioural responses to
different charging schemes. In addition, the methods are expensive to collect a large sample.
In brief, the different methods can be used for different purposes. Attitudinal surveys are used to
exan-iine factors aft , ectin(y attitudes and beha%,, ioural responses in general. Then these factors can
t, which are able to measure the effects of the factors in be e\amincd by using SP techniques, I
qL1ý111titati\'e terms. for which a main ad-v, antage is in predicting preferences and behaviours of
different combinations of charging characteristics. This is useful in designing acceptable and

42
eftective , chemes. Activity-based approaches are suitable to investigate further detail, e. g. how
people will respond to a designed charging system and why they choose the responses.
3.3 Stated Preference (SP) Method
In this section, an overview is given of SP methods covering: main features, design process and
sources of error in SP data. The technique for analysis of the SP data will be explained later in Section 3.4.
3.3.1 Main features and process of design
Stated preference (SP) methods are well known and widely used in transport studies. They are
especially useful for studying non-existing market situations, such as road pricing. They have
been used to evaluate the effects of relevant attributes of a system on individuals' responses and
provide forecasts of changes in demand and travel behaviour. The techniques are based on
individuals' preferences and/or behavioural responses elicited when facing a set of hypothetical
scenarios, set up by researchers. Good guidelines for SP experiment design can be found in
greater detail in Bradley (1988), Fowkes and Wardman (1988), Pearinain and Kroes (1990),
Hensher (1994), Louviere et al. (2000), and Louviere and Hensher (200 1).
Stated preference techniques are based on the presentation of hypothetical scenarios to
respondents. These scenarios need to be plausible and realistic for respondents. Each scenario
represents a package of different attributes. The design process of an SP experiment can be
summarised in four steps.
(a) Selectioii of a set of attributes. The characteristics of the hypothetical scenarios are
represented by attributes that influence preferences. Attributes can be selected from a
prelu-ninary survey (e. g. pilot survey or focus group) and a literature review of previous studies,
and can be included factors (e. g. road pricing characteristics as in this research) which are
interested by the researchers. For example, in mode choice studies SP exercises usually include
iii-vehicle time, out-ot'-vehicle time, cost and quality of transport modes as attributes for each
mode. In this study, the attributes include the benefits and system characteristics of road user
charging (see Chapter 4). I"
(b) Sjwcýfication oj' thc ininiber wid niagin'tude of attribute levels. As the number of the
specified attributes and their levels increases, the number of the combined scenarios (such as
fi-om a fi-actional t'actorial design) also increases. If there are too many attributes in an SP

43
cxercise, individuals may ignore some attributes to simplify the task (Fowkes and Wardman,
1988; Bates, 1998). Pearmain and Kroes (1990) suggested that in an exercise attributes should be limited at six or seven per alternative, and less if it includes unfamiliar variables. In order to keep a limited number of attributes, a set of separate SP designs is useful, in which at least one
common attribute (e. g. cost and time) is included in every exercise. This attribute(s) would
allow comparisons of relative preferences across all the attributes.
Furthermore, variations of attribute values across scenarios need to be large enough for
respondents to trade-off, otherwise they may be Ignored. This may be tested by the simulation
of responses (see Section 3.3.2), which allows the designer to improve the values of attributes before collecting real data. However, the simulation test cannot guarantee that the design will have no problems, particularly where there is a lack of previous information about magnitudes
and ratios of coefficients in the study (Tudela, 2000). The simulation also cannot test whether
individuals find the exercise realistic. At least one pilot survey is necessary; not only for testing
the design, but also for guiding how individuals respond to the survey as a whole (e. g. format,
questioning, presentation, survey conducting and response rate).
(c) Experimental design: combination of the attribute levels. Design of the hypothetical
scenarios is based on an experimental design, which is usually fractional factorial rather than
complete factorial. A complete factorial design is a design in which each level of each attribute
IIs combined with every level of all other attributes. In other words, it contains all possible
combinations of attribute levels. On the other hands, a great advantage of the fractional factorial
design is that the number of scenarios can be dramatically reduced from the full factorial design,
while it still ensures that the main effects of attributes are independent from the significant
interaction effects, so that the main effects can be estimated efficiently. For designing fractional
factorial experiments, the catalogue of experimental plans provided by Kocur et al. (1982) can
be employed.
(d) De. yign of response ineasurenient. Respondents are asked to state their preferences towards
each scenario by either ranking, rating or choosing. These responses are able to provide
information based on how individuals evaluate the attributes in the designed scenarios. A
ranking response requires respondents to order preferences of the hypothetical options
presented. This method has been rarely used. It may not correspond to what respondents face in
re, il life (Pearman and Kroes, 1990). It is also been questioned in terms of reliability (Ortuzar
arid Garrido, 1991 ). A rating response requires respondents to express their degree of preference
oil ýj scale (e. o. 5ý 10 or 100 point scale). This provides the richest form of data. Hoxvever.
binary choice data is the most realistic and simplest in making decisions, the simplest in data

44
analysis and use for prediction, and the most often used In SP studles. It requires respondents to
choose between usually two options.
In addition to the SP experiment, other components are also needed in a survey, e. g. questions
gathering individuals' actual travel situations, which are relevant to the study context, questions
about the attributes of existing choice alternatives, questions about attitudes to alternatives and
personal details (Bradley and Kroes, 1992). These additional data are useful in analysis of SP
data and explanation of the behavioural responses.
3.3.2 Simulation test
SP experimental designs may be tested by a simulation test (Fowkes and Wardman, 1988). This
would allow the design to be improved in specifying magnitude of attribute levels and
combining the levels, before being used in data collection. The simulation is based on the
discrete choice theory (Ben-Akiva and Lerman, 1985), in which the random utility is a function
of measurable utility and random error, E; (see Section 3.4).
The simulation mimics individual's choices from the measurable (known) utility function
(usually linear) of variables in SP experiment, a set of reasonable (known) coefficients (from
previous studies) of the variables and a random error. The known coefficients are usually based
on values of time, in which the coefficient of cost is set to one-, hence the coefficient of time is known. Following random utility theory, the error (E; ) is assumed to be Gumbel distributed, in \ý,, hich P-i = Ln[-Ln(i-(mdoin)] / k; where random number is generated between 0 and 1, and k
I. s ki-iown as the scale factor. k= 71 I(V6 - cy) ; where a is standard deviation of the error Ej (see
Ben-Akiva and Ler-man, 1985; Fowkes and Wardman, 1988; Tudela, 2000). The scale factor is deterinined by selecting a standard deviation of the error to give a Rho-squared about what we
expect. This is usually around 0.1 -
Synthetic responses are produced based on the assumption of utility maximisation in that option
i \\ ith respect to option j \vill be chosen if the utility of option i is higher. This process is
repeatcd many times to achieve a number of responses. These simulation responses are analysed
and then the estimated coefficients are compared with the adopted ones. A good design should
achieve a small difference. Simulation test should also check that standard errors (t ratios) are
acceptable and that they cannot be improved substantially by changing the design.

45
3.3.3 Sources of error in SP data
There are several sources of error in SP data that need to be considered when the SP techniques
are applied. The first and most important bias could be from the design and presentation used because these can give misleading results (Ampt et al., 1995; Bates, 1998; Widlert, 1998). A
major cause of this problem is that respondents tend to simplify the task and some factors may be ignored. This usually occurs in complex SP exercises. The design needs to be concerned
about number of attributes in an alternative, the number of alternatives presented to a
respondent, and how to present the attributes (for example, in percentage or absolute changes).
The other sources of error could be from unreliable data. The data error is due to 'wrong'
answers from respondents (see Bonsall, 1985; Wardman, 1987; Bonsall et al., 1992; Ampt et al., 1995; Swanson, 1998). The responses may be provided by intention for some reasons, such as
policy response bias (respondents may attempt to influence the policies studied), affirmation bias (respondents may adjust their response according to the aim of the study), habit or status-
quo bias (respondents may tend to choose the option which is close to the actual situation, or
which they are currently doing), and rationalisation bias (respondents may provide artificial
responses in order to rationalise their current behaviour).
The wrong answers may also be given unintentionally, for example through misunderstanding (respondents may not fully understand SP and/or they may be fatigued from doing the exercise),
unconstrained response bias (respondents may fail to consider all relevant constraints on their
choices), lexicographic answer (respondents may sort the alternatives according to the value of
one variable because they find the task too difficult or because one factor actually is more
important to them than the others), and ability to report behaviour (respondents may have some difficulties to answer about their likely behaviour).
All sources of error need to be carefully considered when designing the SP experiment.
DeN, elopments of the methodology (in Chapter 4) were needed before using the SP technique in
this study in ordcr to be sure that the design is appropriate to explain the public's preferences
and behaviours responding to road user charging. Furthermore, the error could naturally occur
fi-oni the SP data in model analysis including taste variations among individuals (heterogeneity;
accounted in this research) and repeated measurement (further discussed in Section 3.4).

46
3.4 Analytical Issues
This section presents a brief description of the SP data analysis based on the random utility
theory and logit model, which is explained in full in Ben-Akiva and Lerman (1985), Ortu-zar and Willumsen (1994), and the most recent and comprehensive details in Louviere, Hensher and Swait (2000). This method of analysis has been widely used in analysing and forecasting
economic consumer behaviour in a wide variety of applications, including marketing research,
travel demand, residential location choice, environmental economics and health economics. Moreover, this section also presents the current development of the analysis technique to cope
with taste variation among individuals and repeated measurement problem in SP data.
3.4.1 Random utility theory
An analytical method used for explaining choice behaviour is discrete choice analysis based on
the random utility theory (Domencich and McFadden, 1975). An individual's choice is assumed
to depend on 'utility' representing the satisfaction or benefits to the person from each
alternative. If individuals act rationally, they are assumed to always choose the option with the
highest utility to them. For example, if utility of alternative i is higher than utility of alternative
j, alternative i will be chosen. However, it is impossible for the analyst to know the precise
utility of each alternative, so the random utility (U) applied by the individual is broken down
into a measurable part (Vi) and a random part (E; j):
Ui=vi+. (Equation 3.1)
I'he measurable part (Vi) is a function of the measured attributes of the alternative and is
commonly specified as a linear function shown in Equation 3.2; whereOikare the parameters or
utility weights of the k attributes, Xik, for alternative i.
Vi "'ý -!: A
Oik -'Vik (Equation 3.2)
The random part (ci) reflects a non-measurable (unknown and/or unobservable to the analyst)
part, which comes from four distinct sources: unobserved attributes, unobserved taste vanations,
measurement errors, and model specification error (Manski cited in Ben-Akiva and Len-nan,
1985). The taste variation can be coped with by segmentation analysis and alternative specific
functions (see Section 3-4-3). However, other errors are still assumed to be in the single additive
element ci, with assumed known distribution.

47
3.4.2 Conventional logit model
Based on the random utility maximisation theory, an individual will choose alternative i rather than alternative j from a choice set C,, (n altematives available), if
U, > Uj fbr allj ; ýý IeC, (Equation 3.3)
From Equations 3.1 and 3.3, alternative i is chosen if
V, + ej > Vj + ýj (Equation 3.4)
The exact sizes of the random terms E are unknown because of uncertainty and complexity of human behaviour. They vary across alternatives and individuals. Therefore, a distribution for
them is assumed and only a choice probability of occurrence can be obtained, that:
Pi = Pr (V, + c, V, + c) for allj ýe ieC, (Equation 3.5)
Pi = Pr (V, - V, for allj -, - IeC, (Equation 3.6)
An assumption that the random term (6) is independently and identically distributed (11D) with a
Weibull (also called Gumbel) distribution leads to the derivation of the multinomial logit model
(MNL; Equation 3.7), in which the probability of choosing an alternative i (P) is that
(Domencich and McFedden, 1975):
j cc,, exp(V) (Equation 3.7) Pi = exp (vd / 4,
The estimation process of utility parameters (Oik) of the MNL model is widely based on the
maximum likelihood estimation. This estimator is based on the idea that the values of
parameters are most likely to occur for the observed sample. The utility parameters (Oik) can be
interpreted as an estimate of the weight of attributes in the utility function of alternative i. They
can be allowed to vary across the groups of the public, for example according to socio-
economic characteristics. and even N, ary across individuals as random parameters (described in
Scction 3.4.3).
As parameters estimated have associated standard error, a parameter is considered to be
sigWiificantly different from zero at the 95% confidence level when its corresponding t-ratio (the
ratio of the mean parameter to its standard error) has an absolute value greater than 1.96. Values

48
of t-ratio as low as 1.6 are sometimes accepted representing the 90% confidence level, if the
sign is correct and magnitude (e. g. Implied values) seems plausible.
The overall model goodness-of-fit is indicated by likelihood-ratio index, p', which is parallel to
the R" for a linear regression model. The P2 values between 0.2 and 0.4 are considered to
indicate an extremely good fit (Louviere et al., 2000). For SP studies, the values around 0.1 are typical. These results of the estimation process: values of parameters, their t-ratios and likelihood indexes can be estimated using available computer software programmes, for
example ALOGIT (Hague Consulting Group. 1995) and LIMDEP (Econometric Software,
1999).
3.4.3 Taste variation among individuals
In the random utility, one of the sources of the random error is from taste variations among
respondents (response heterogeneity). The standard logit model can cope with this variation, but
only with respect to observed factors (commonly socio-economic factors and trip
characteristics), by using segmentation analysis. However, this cannot handle unobserved or
purely randomly variables (Train, 1986). Instead, the random parameters logit model is used.
Segmentation analysis
Segmentation techniques are used to explore differences between personal characteristics of
respondents. This can be done by two methods. The first is by estimating separate models for
each group (for example, used in Preston and Wardman, 1991 and Accent and HCG, 1994).
With a small number of observations available for each segment, this technique would reduce
the significance of coefficients (MVA et al., 1987). It would estimate all coefficients separately
for every segment, even where some coefficients do not vary importantly across segments.
The second is by using incremental factors (MVA et al., 1987), as used in this study. The
incremental factors allow different marginal utilities across segments of the sample (for
example, used in Wardman et al., 1998). They can be specified as:
11-1
dA, Xik (Equation 3.8)
Wherc y. is an incremental factor for the kh attribute (Xk) and d is a dummy variable denoting ky
whether an observation is in yo' group of n groups in a category. If so, dky is equal to one,
otherwise zero. One of the groups in the category is arbitrarily chosen as the base. The

49
incremental effects for other groups are relative to this base. so only n- I dummy vanables are defined. The utility function of altemative i is:
n-I Vi = Zk Oik Xtk + 1:
/vy dkj Xik (Equation 3.9)
Y=j Thus, in Equation 3.9, the coefficient of the base group would beOik, and the coefficient Of Xik
for the yth group in the category would beOik + yy. This approach can indicate the sign and size
of any effect from the segmentation variable, provide its statistical significance, and can be
tested on the fit of different models, for example between the basic model and the segmentation
model or among the different segmentation models (Wardman et al., 1998).
In order to test the fit between the models, the likelihood ratio test is used given that the un-
segmented model is a special case of the segmented one. The test is that twice the difference
between the log likelihood values (LL) at convergence of the restricted and unrestricted models,
-2(LL(R)-LL(U)), is higher than a X2 critical value of the chi-square distribution with M degrees
of freedom. This degree of freedom is the number of extra parameters imposed on the model.
Random parameters logit model
One of the restrictions of the standard logit model is that the coefficients of the variables are
assumed to be the same for all people. Though the segmentation analysis allows different
coefficients for different groups of people, it is still assumed that different people with the same
observed characteristics have the same values of parameters. Thus, variation of tastes of
individuals (heterogeneity) may still be included. To deal with this problem, a random
parameters logit model can be used. This model allows coefficients of observed variables to
vary randomly across observations rather than being fixed. Some recent empirical studies can be
Cound in e. g. Bhat (1998a, 1998b), Revelt and Train (1998,1999), Train (1998), Brownstone
and Train (1999), McFadden and Train (2000), and Hensher (2001a, 2001b, 2001c).
In general, the model specification is the same as the standard logit model, except that one or
more coefficients (as Nvell as alternative-specific constants, ASCs) vary across the population
i-ather than bein,,,, fixed. The coefficients are commonly assumed to be either normally or log-
normally distributed. The selection of the distributions is still a major ongoing research area
since no one distribLition has all of the desirable behavioural properties; for example, with
normal distribution both positive and negative values are produced across the parameter
distribution, and \ý, ith the log-normal distribution the values are constrained to be one sign but
have a long tall of distribution that is behaviourally implausible for valuation (Hensher, 2001b).
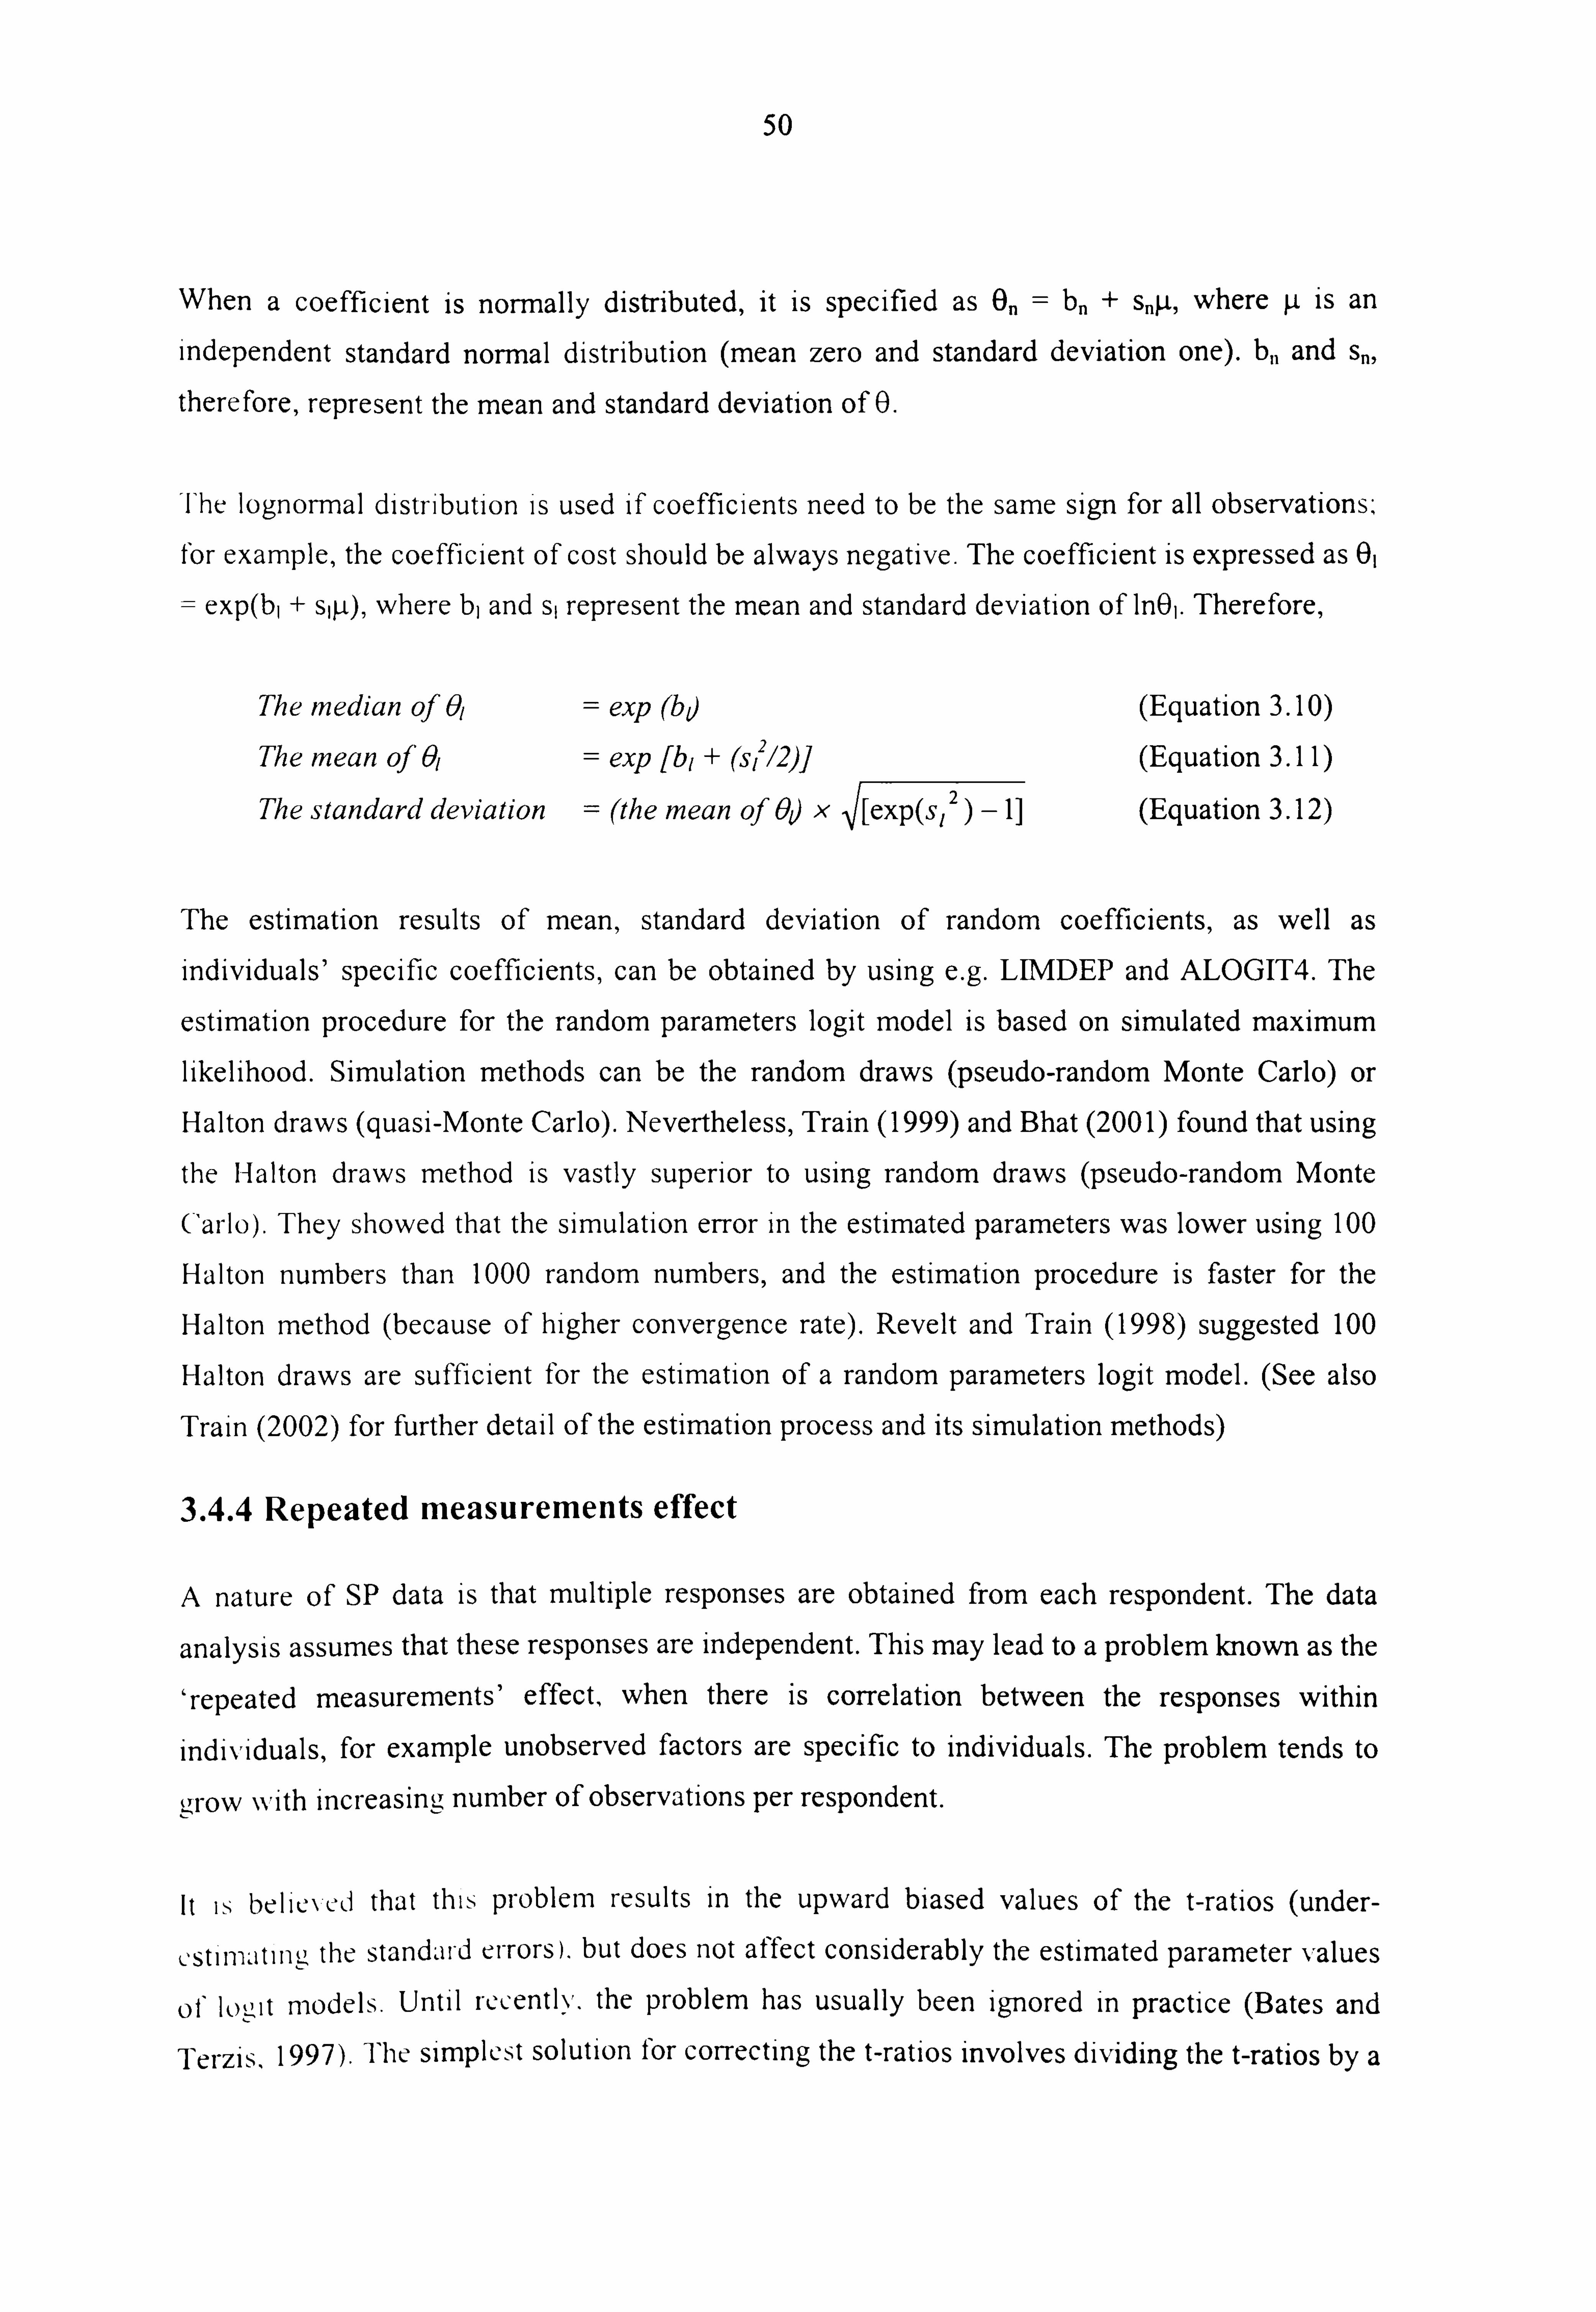
50
When a coefficient is normally distributed, it is specified as On= bn + S413 where ýi is an
independent standard normal distribution (mean zero and standard deviation one). b,, and s,,,
therefore, represent the mean and standard deviation of 0.
Fhe lognormal distribution is used if coefficients need to be the same sign for all observations, tI or example, the coefficient of cost should be always negative. The coefficient is expressed as 01
= exp(b, + sjýt), where b, and s, represent the mean and standard deviation of InOl. Therefore,
The median of 01 = exp (bd (Equation 3.10) (2
= exp [b, + Sl 12)] The mean of'Ol (Equation 3.11)
The standard deviation = (the mean of Od x I[exp(s, 2)-I] (Equation 3.12)
The estimation results of mean, standard deviation of random coefficients, as well as
individuals' specific coefficients, can be obtained by using e. g. UMDEP and ALOGIT4. The
estimation procedure for the random parameters logit model is based on simulated maximum likelihood. Simulation methods can be the random draws (pseudo-random Monte Carlo) or Halton draws (quasi-Monte Carlo). Nevertheless, Train (1999) and Bhat (200 1) found that using
the Halton draws method is vastly superior to using random draws (pseudo-random Monte
Cai-lo). They showed that the simulation error in the estimated parameters was lower using 100
Halton numbers than 1000 random numbers, and the estimation procedure is faster for the
Halton method (because of higher convergence rate). Revelt and Train (1998) suggested 100
Halton draws are sufficient for the estimation of a random parameters logit model. (See also Train (2002) for further detail of the estimation process and its simulation methods)
3.4.4 Repeated measurements effect
A nature of SP data is that multiple responses are obtained from each respondent. The data
analysis assumes that these responses are independent. This may lead to a problem known as the
crepeated measurements' effect, when there is correlation between the responses within
individuals, for example unobserved factors are specific to individuals. The problem tends to
grow \N, ith increasing number of observations per respondent.
it is belieNcd that this problern results in the upward biased values of the t-ratios (under-
ý2stl niitino the standai-d errors). but does not affect considerably the estimated parameter values
of logit models. Until recentlý,, the problem has usually been ignored in practice (Bates and
Terzis, 1997). The simplest solution for correcting the t-ratios involves dividing the t-ratios by a
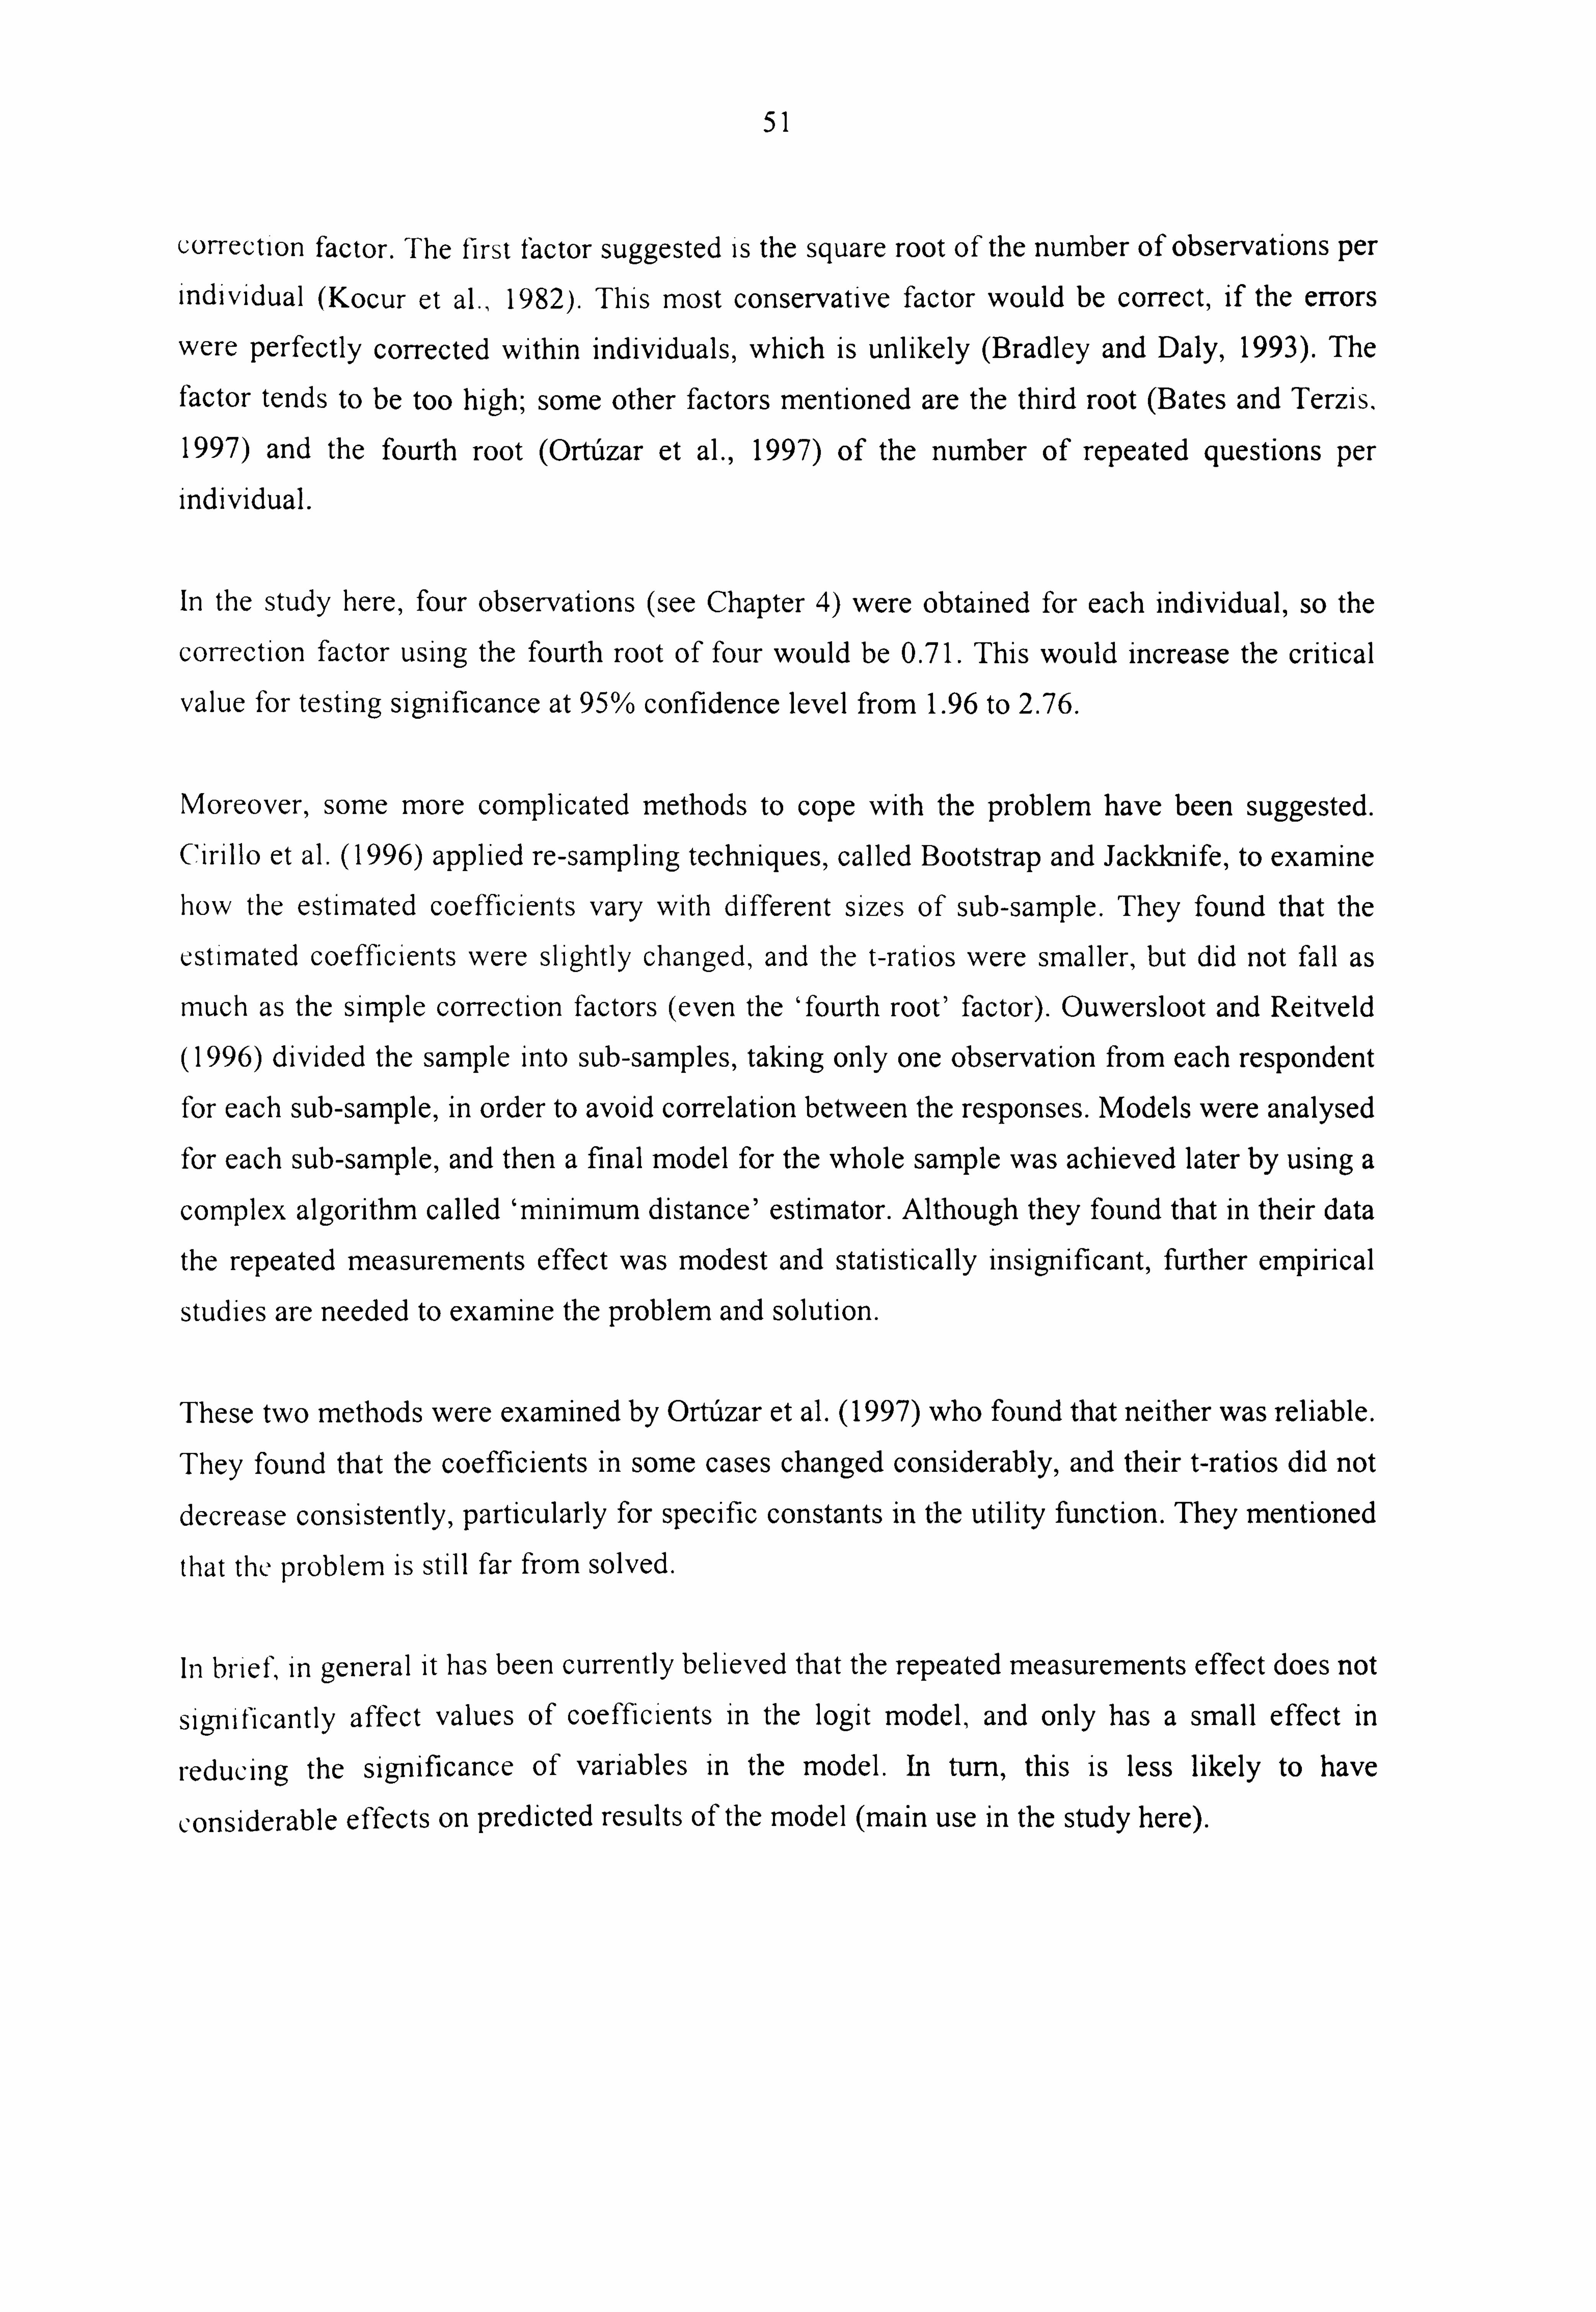
51
correction factor. The first factor suggested is the square root of the number of observations per
individual (Kocur et al., 1982). This most conservative factor would be correct, if the errors
were perfectly corrected within individuals, which is unlikely (Bradley and Daly, 1993). The
factor tends to be too high; some other factors mentioned are the third root (Bates and Terzis,
1997) and the fourth root (Ort-6zar et al., 1997) of the number of repeated questions per
individual.
In the study here, four observations (see Chapter 4) were obtained for each individual, so the
correction factor using the fourth root of four would be 0.71. This would increase the critical
value for testing significance at 95% confidence level from 1.96 to 2.76.
Moreover, some more complicated methods to cope with the problem have been suggested. Cirillo et al. (1996) applied re-sampling techniques, called Bootstrap and Jackknife, to examine how the estimated coefficients vary with different sizes of sub-sample. They found that the
estimated coefficients were slightly changed, and the t-ratios were smaller, but did not fall as
much as the simple correction factors (even the 'fourth root' factor). Ouwersloot and Reitveld
(1996) divided the sample into sub-samples, taking only one observation from each respondent for each sub-sample, in order to avoid correlation between the responses. Models were analysed for each sub-sample, and then a final model for the whole sample was achieved later by using a
complex algorithm called 'minimum distance' estimator. Although they found that in their data
the repeated measurements effect was modest and statistically insignificant, further empirical
studies are needed to examine the problem and solution.
These two methods were examined by Ort-dzar et al. (1997) who found that neither was reliable. They found that the coefficients in some cases changed considerably, and their t-ratios did not decrease consistently, particularly for specific constants in the utility function. They mentioned
that the problem is still far from solved.
In brief, in general it has been currently believed that the repeated measurements effect does not
significantly affect values of coefficients in the logit model, and only has a small effect in
reducing the significance of variables in the model. In turn, this is less likely to have
considerable effects on predicted results of the model (main use in the study here).

52
More recently, to deal with the repeated choices by each respondent, Train (2002) suggestsi that
ing constant over choice the coefficients should be treated as varying over people but bei
situations for each person (a random parameters loglt wIth repeated choices).
3.5 Development of Utility Function for the Individuals' Perspectives
I Fhe previous section has presented the analysis method for SP data, based on the random utility theory. The utility represents preference of an individual for a chosen option, according to its
attributes. The choice is based on an assumption that the individual maximises his/her own
utility. This almost implies that individuals' behaviour is motivated by self-interest. However,
the literature review in Section 2.5.3 suggests that it is also influenced by social-interest,
particularly on issues in which the public are involved. Hence, this section develops the utility function to measure the self and social preference.
Many studies argued that a utility function can contain both self- and social-interest
components. For example, Margolis (1982,1990) introduced the 'dual utilities' model: W=G/
S where W is the ratio (weight) between the value of group-interested and self-interested. S is the utility of self-interest and G is the utility of group-interest. The bigger the ratio for a person
is, the more likely the person will be to cooperate in group-interest.
Mueller (1986) suggested a framework to explain and predict decisions, such as voting. He
assumed that each individual maximises an objective function (0), which is a weighted sum of n
his/her utility (U) and the utilities of the other individuals (U). That is o, = u, + oy uj . If 0 j#i
1, an individual gives equal weight to the group's utility as to his/her utility. If 0=0, the
individual ignores the utility of others in his/her own objective function.
Hudson and Jones (1995), by expanding Mueller's concept, assumed that general attitudes to tax
and public expenditure (TAI) are determined by a weighted average of people's perceptions of
their own interests (TS') and their perceptions of public interest (TAP): TA9 =a TAP + (I -q). TA'.
The (x, lying between 0 and 1, can be considered to be a measure of 'altruism' and can be
unfortunately. the su,, gestion by Train (2002) has not been addressed by LIMDEP (a statistical analysis pý,,: ký,, -,, e) which \vas used to analysis the data in the study here, In addition, with a limit of time the
study did not c\anune the repeated nieasurernent effect. Nonetheless, with the four obser-vations per person the effect \\ as expected to be loý\
.
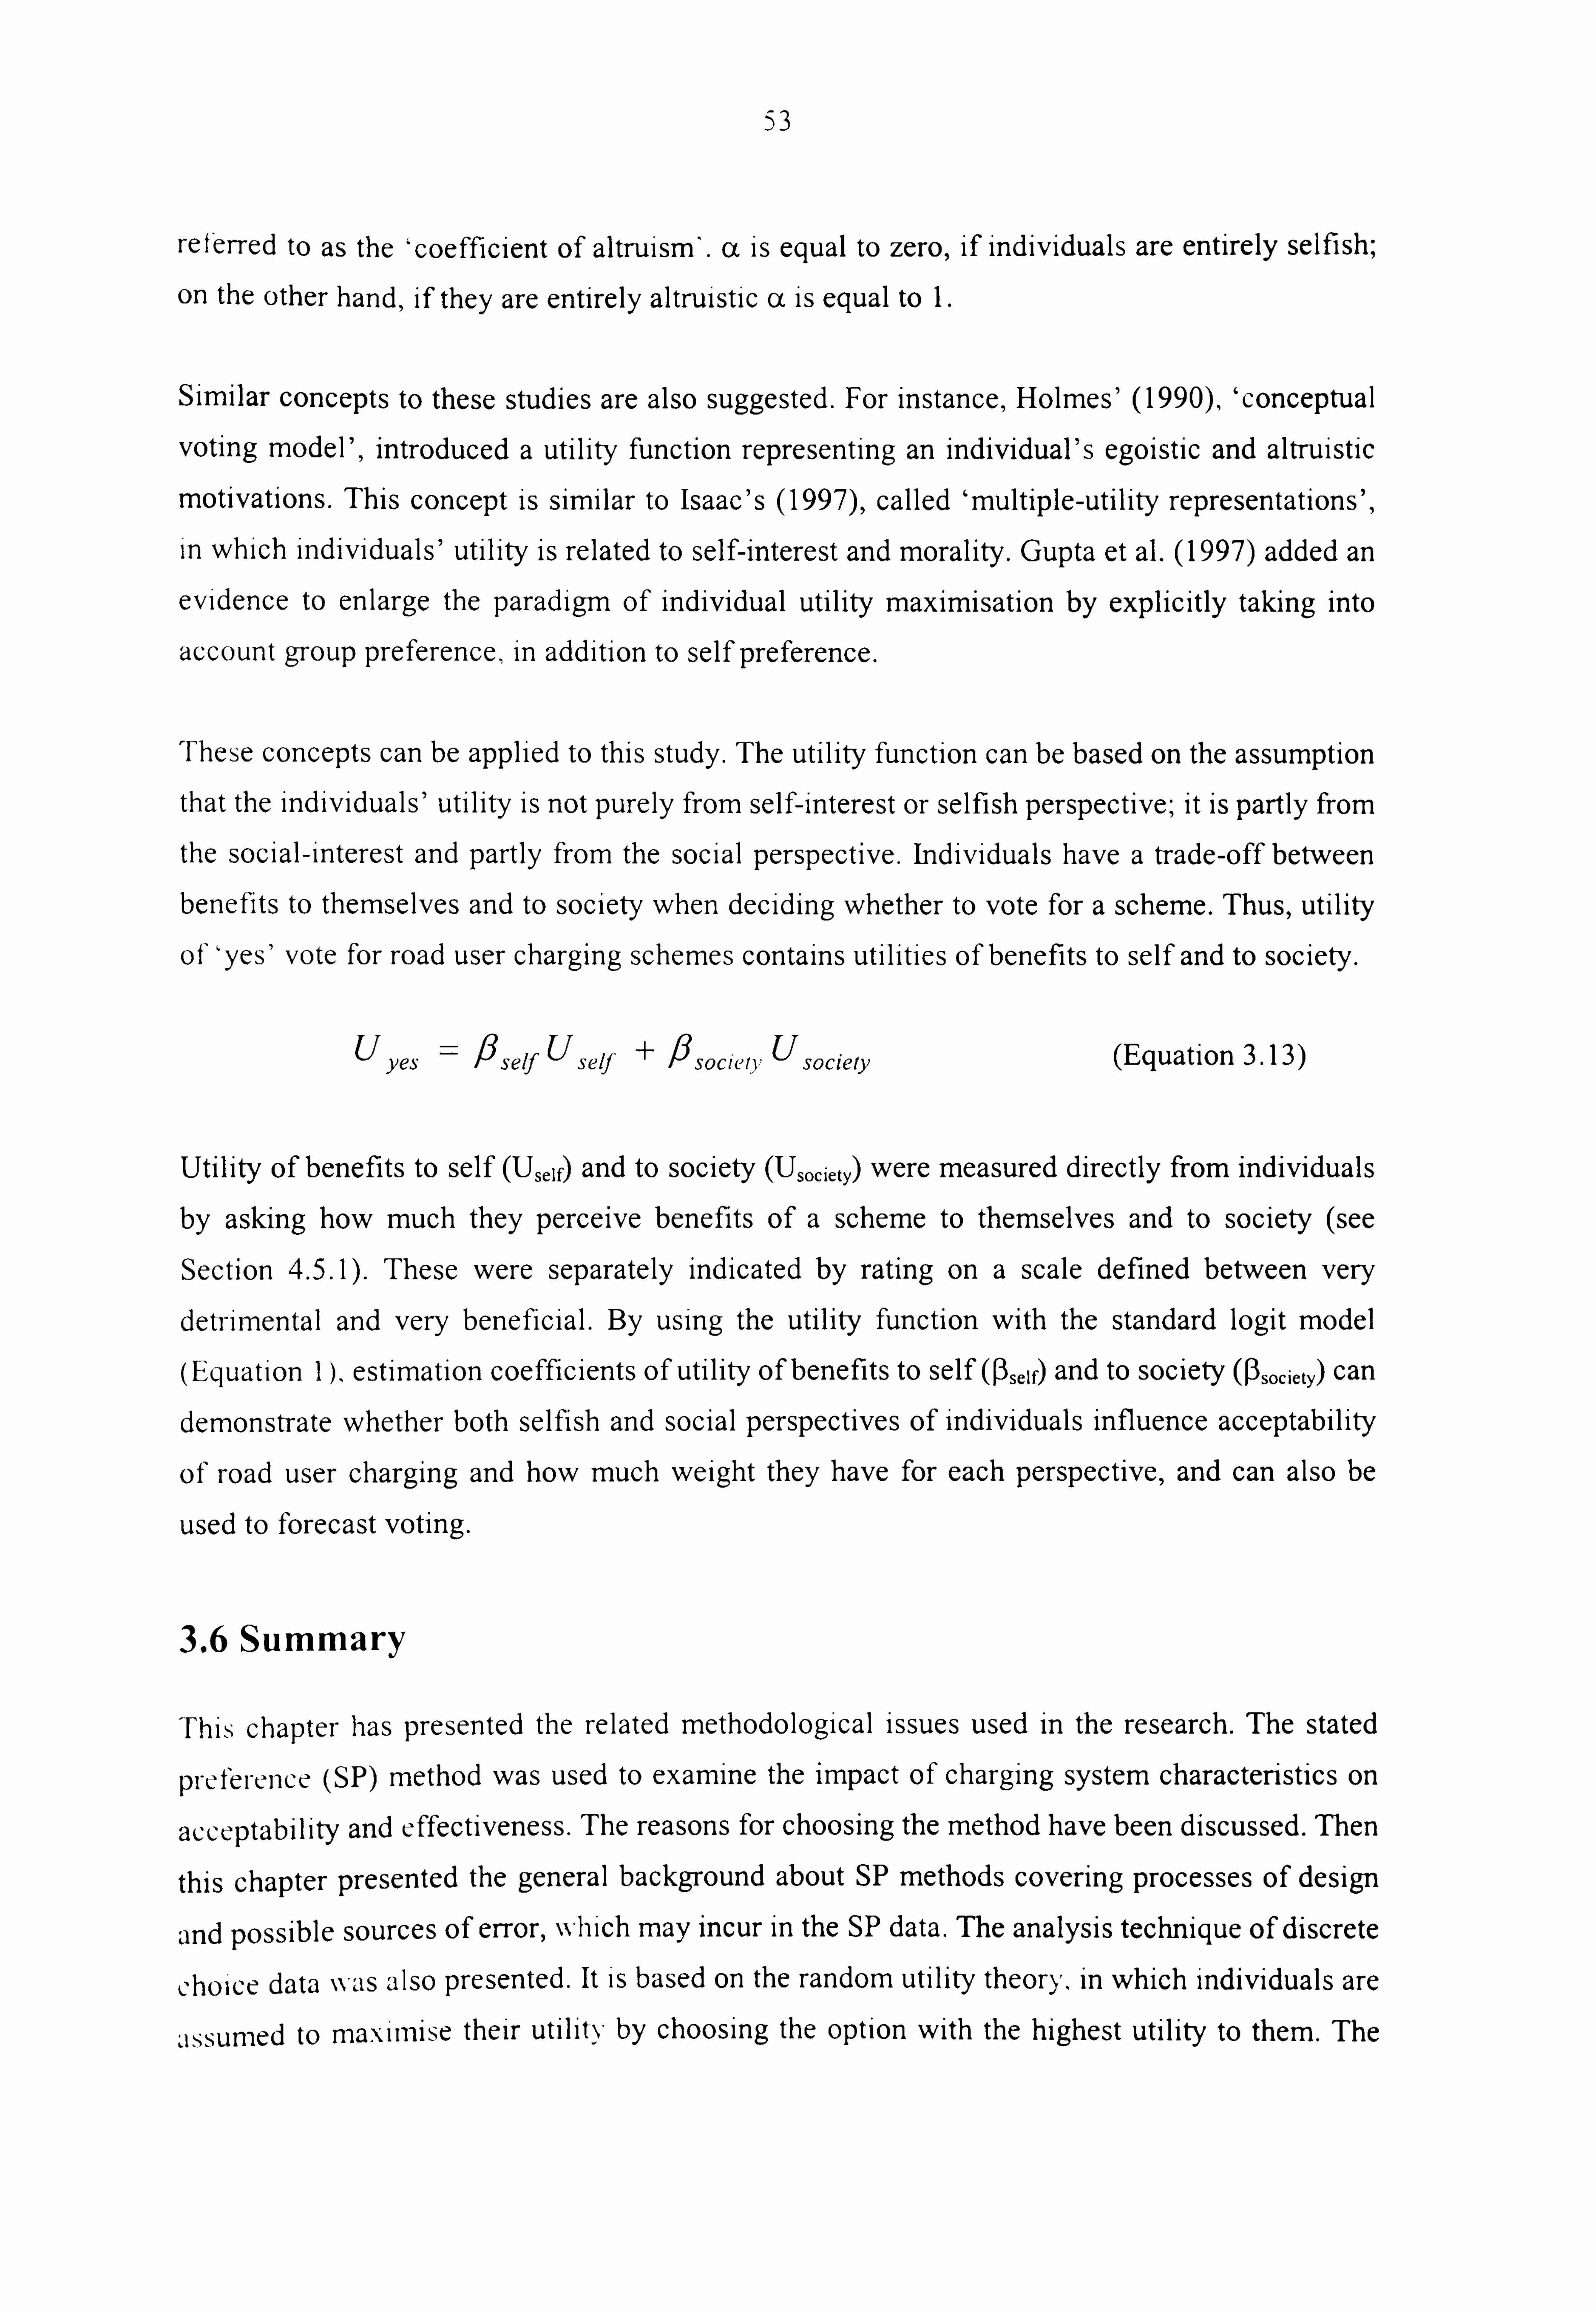
53
reterred to as the 'coefficient of altruism'. (x is equal to zero, if individuals are entirely selfish; on the other hand, if they are entirely altruistic (x is equal to I-
Similar concepts to these studies are also suggested. For instance, Holmes' (1990), 'conceptual
voting model', introduced a utility function representing an individual's egoistic and altruistic
motivations. This concept is similar to Isaac's (1997), called 'multiple-utility representations',
in which individuals' utility is related to self-interest and morality. Gupta et al. (1997) added an
evidence to enlarge the paradigm of individual utility maximisation by explicitly taking into
account group preference, in addition to self preference.
These concepts can be applied to this study. The utility function can be based on the assumption that the individuals' utility is not purely from self-interest or selfish perspective; it is partly from
the social-interest and partly from the social perspective. Individuals have a trade-off between
benefits to themselves and to society when deciding whether to vote for a scheme. Thus, utility
of 'yes' vote for road user charging schemes contains utilities of benefits to self and to society.
Uyes '-- fiseýf Uselj' + Psocieti, Usociety (Equation 3.13)
Utility of benefits to self(Uself) and to society (Usociety)were measured directly from individuals by asking how much they perceive benefits of a scheme to themselves and to society (see
Section 4.5.1). These were separately indicated by rating on a scale defined between very
detrimental and very beneficial. By using the utility function with the standard logit model
(Equation I ), estimation coefficients of utility of benefits to selfAelf) and to society(N. ciely)can demonstrate whether both selfish and social perspectives of individuals influence acceptability
of road user charging and how much weight they have for each perspective, and can also be
used to forecast voting.
3.6 Summary
This, chapter has presented the related methodological issues used in the research. The stated
preference (SP) method was used to examine the impact of charging system charactenstics on
acceptability and effectiveness. The reasons for choosing the method have been discussed. Then
this chapter presented the general background about SP methods covering processes of design
and possible sources of error, which may incur in the SP data. The analysis technique of discrete
choice data was also presented. It is based on the random utility theory, in which individuals are
assurned to maxiinise their utility by choosing the option with the highest utility to them. The

54
analysis method used is based on the logIt model. This Involves the standard logit model, in
which the overall effects of variables are demonstrated for all samples. The segmentation
model, based on incremental factors, is used to show different effects for different groups of
people. The random parameters logit model can be used to examine the taste variation among
individuals (heterogeneity), which is from unobserved sources and unable to be captured by the
segmentation of respondents. Finally, this chapter has reviewed the utility functions, which
included the effects of both self and social preferences, from various previous studies. This led
to the development of the utility of voting for charging schemes, which is the function of the
perceptions of benefits to self (from selfish perspective) and to society (from social perspective).

55
Chapter 4
Survey Design and Data Collection
4.1 Introduction
In the study, the SP technique was used (see Chapter 3). A paper-based SP questionnaire was designed and developed throughout a set of pilot studies. Four pilot surveys, varying in their
design of presentation and measurement, were undertaken. The first version of the questionnaire
and SP exercise was piloted in August 1999, with further pilots conducted in December 1999,
March 2000 and July 2000. The main purposes of the pilot studies were: to test the presentation
of SP attributes and levels; and to test the measurement of studied behaviours: acceptability,
selfish and social perspectives, and effectiveness of charging schemes. The final version of the
'SP questionnaire was used for the main survey conducted in Leeds and London during
November 2000 and March 2001.
In this chapter, the developments of the SP experiment and data collection are presented. Instead
of presenting details of each pilot survey, the development of the key elements: attributes, their
levels and behaviour measurements in the SP experiment are described. Section 4.2 presents the
characteristics of the survey form. Section 4.3 presents the design of the SP experiment,
involving the attributes and their levels used in the main survey. Section 4.4 explains the
development of presentation of the attributes. Then Section 4.5 explains the development of
measurement of the studied behaviours. Finally, Section 4.6 describes the main data collection
procedures and presents respondents' characteristics.
4.2 Survey Form
paper-based questionnaire was designed for the data collection. An example of the
(ILICStionnaire is shown in Appendix A. It contains four main parts. The first part was designed
for gathering general attitudes about transport problems and road user charging. The questions
were how scrious congestion and pollution is in the cities. Respondents could respond on a four-
I ions were whether they point scale: no problem, sh-ght, serious and very serious. The other quest'

56
think road user charging is effective in reducing congestion and pollution. Respondents can
answer yes or no. This part was also designed for gathering general information on travel to
work (for commuters only). The questions involved travel mode for work and non-work trips, frequency of work trips, journey time, cost and distance travelled to work.
The second part focused on work and non-work trips within the specified areas of charge. These
areas were within the Outer Ring Road of Leeds, and the North/South Circular Roads of London (a map was provided to each respondent with the questionnaire; shown in Appendix B).
Respondents were asked to provide their Journey travel time and delayed-time within the area for work trips and non-work trips when they travelled by car and bus. (Delayed-time was defined as "the time spent moving slowly or stopped in congested traffic, at traffic lights, or bus
stops. ") They were also asked whether they find their current travel situations acceptable.
The third part presented an SP exercise including hypothetical charging scenarios (see Section
4.3). Four scenarios were presented to each respondent, definition of road user charging was
given to respondents in which "road user charging involves drivers being charged a fee for
using their vehicles within specific areas (e. g. within the city centre), or on specific roads (e. g.
on motorways), in order to reduce congestion, improve the environment, and/or generate
revenue to be spent on transport projects and/or social projects". Following the charging
scenarios, three questions were posed which measured individuals' responses about selfish and
social perspectives, acceptability and mode choice (see details in Section 4.5).
The final part included some questions asking personal characteristics: gender, age, annual household income and number of cars in household. Furthermore, at the end of the
questi . onnaire an open space was provided for respondents to add any comments which they
had.
4.3 Design of Stated Preference (SP) Exercises
In the study, the two main key influences on acceptability (Section 1.2) in the design process are
the benefits and the system features of road user charging schemes. These were used as
attributes in the SP experiment. The benefits include: car travel time reduction, bus travel time
reduction, environmental improvement, and benefits from use of revenue. The system features
include: charging IcN'el, charging method, charged time period and charged area.
If all attributes were presented in one exercise, respondents might have ignored some attributes
becausc therc wcre too many variables to consider. To overcome the problem, separate designs

57
ttri ic were used. Five SP exercises %kýere designed. Each exercise contained four a butes: three bas'
attributes that were charge, car travel time reduction and bus travel time reduction, plus an
additional attribute.
0 Exercise 1: charge, car travel time reduction, bus travel time reduction and
environmental improvement.
9 Exercise 2: charge, car travel time reduction, bus travel time reduction and rei, etwe
allocation.
0 Exercise 3: charge, car travel time reduction, bus travel time reduction and charged
area.
0 Exercise 4: charge, car travel time reduction, bus travel time reduction and charged tinie
period.
Exercise 5: charge, car travel time reduction, bus travel time reduction and charging
method.
Levels of the SP attributes were developed through the four pilot surveys (see the next section, 4.4). The set of attribute levels presented in Table 4.1 and 4.2 was found to be satisfactory in the
pilots, and then was used in the main surveys (Jaensirisak, 2001).
Table 4.1 Attributes and their levels in SP exercises I-4 (EX 1-4) in the main survey
Attributes Levels 0 1 2 3
Basic attributes Charge E1 E3 E5 E7 Car delayed-time reduction A quarter A half Three quarters - Bus delayed-time reduction A quarter A half Three quarters - Additional attributes Environmental improvement (EX1) As now Slight Substantial - Revenue allocation to Public transport : tax reduction (EX2)
50 : 50 Public transport on y
Tax eduction only
-
Charqed area (EX3) Wide area2 Small area" Charged time (EX4) 7am - 7pm 7am -1 Oam
Note: 1. Attributes in each exercise are three basic attributes plus an additional attribute. 2. Wide and small areas are within the North/South Circular Roads and Inner Ring Road for London,
and the Outer Ring Road and Inner Ring Road for Leeds.

58
Table 4.2 Attributes and their levels in SP exercise 5 (EX 5) in the main surveý
Aftributes Levels 0 23
Charge levels (depended charging method) Fixed charge (per day) E3 E5 E7 Distance-based charge 10 ppmile 30 ppmile 60 ppmile 100 ppmile Time-based charge 2 ppmin
2 5 ppmin 8 ppmin 12 ppmin Delay-based charge 5 ppdm
3 15 ppdm 25 ppdrn 40 ppdm Car delayed-time reduction A quarter A half Three quarters Bus delayed-time reduction A quarter A half Three quarters
Note: 1. ppmile is pence per mille, 2. ppmin is pence per minute, 3. ppdm is pence per delayed-minute
For each SP exercise, the fractional factorial design (Section 3.3) was used for selecting a subset
of a full factorial design. Exercises 1-4 have 16 charging scenarios each based on four
attributes (charging, car and bus travel time reduction, and another additional attribute). In order to minimise effects of response fatigue, each respondent was presented only one SP exercise
with four charging scenarios (see an example in Appendix A). These were random out of 16
scenarios.
For exercise 5, there were three attributes (charging, and car and bus travel time reduction). Charging was based on a fixed daily charge (as in Exercises 1-4) and the three variable charge (distaiice-based, time-based and delay-based) which were defined in the questionnaire for
respondents as follows.
0 "Di stance -based charge is a charge related to the distwice spent travelling on roads
inside (but not including) the Outer Ring Road during 7am-7pm. "
0 "Time-based charge is a charge related to the time spent travelling on roads inside (but
not including) the Outer Ring Road during 7am-7pm. "
"Delay-based char, is a charge related to the dela ed-time spent travelling on roads 0oCY
inside (but not including) the Outer Ring Road during 7am-7pm. "
The SP exercise was separately designed for each method. Each method of charge has 16
scenarios, there were totally 64 scenarios (for four charging basis). For the variable charges,
respondents needed to estimate their daily charges based on their distance travelled, journey
tirric or delayed-time to, "from work. Only four charging scenarios were presented to each
respondents, in which mo scenarios were based on fixed daily charge and the other two
scenarios were based on one of the variable charges. Thus, each respondent needed to calculate
the charges for only t\,, -o scenarios (the same char, -, Ing method). The Iy were also asked to provide
the estimated charges.
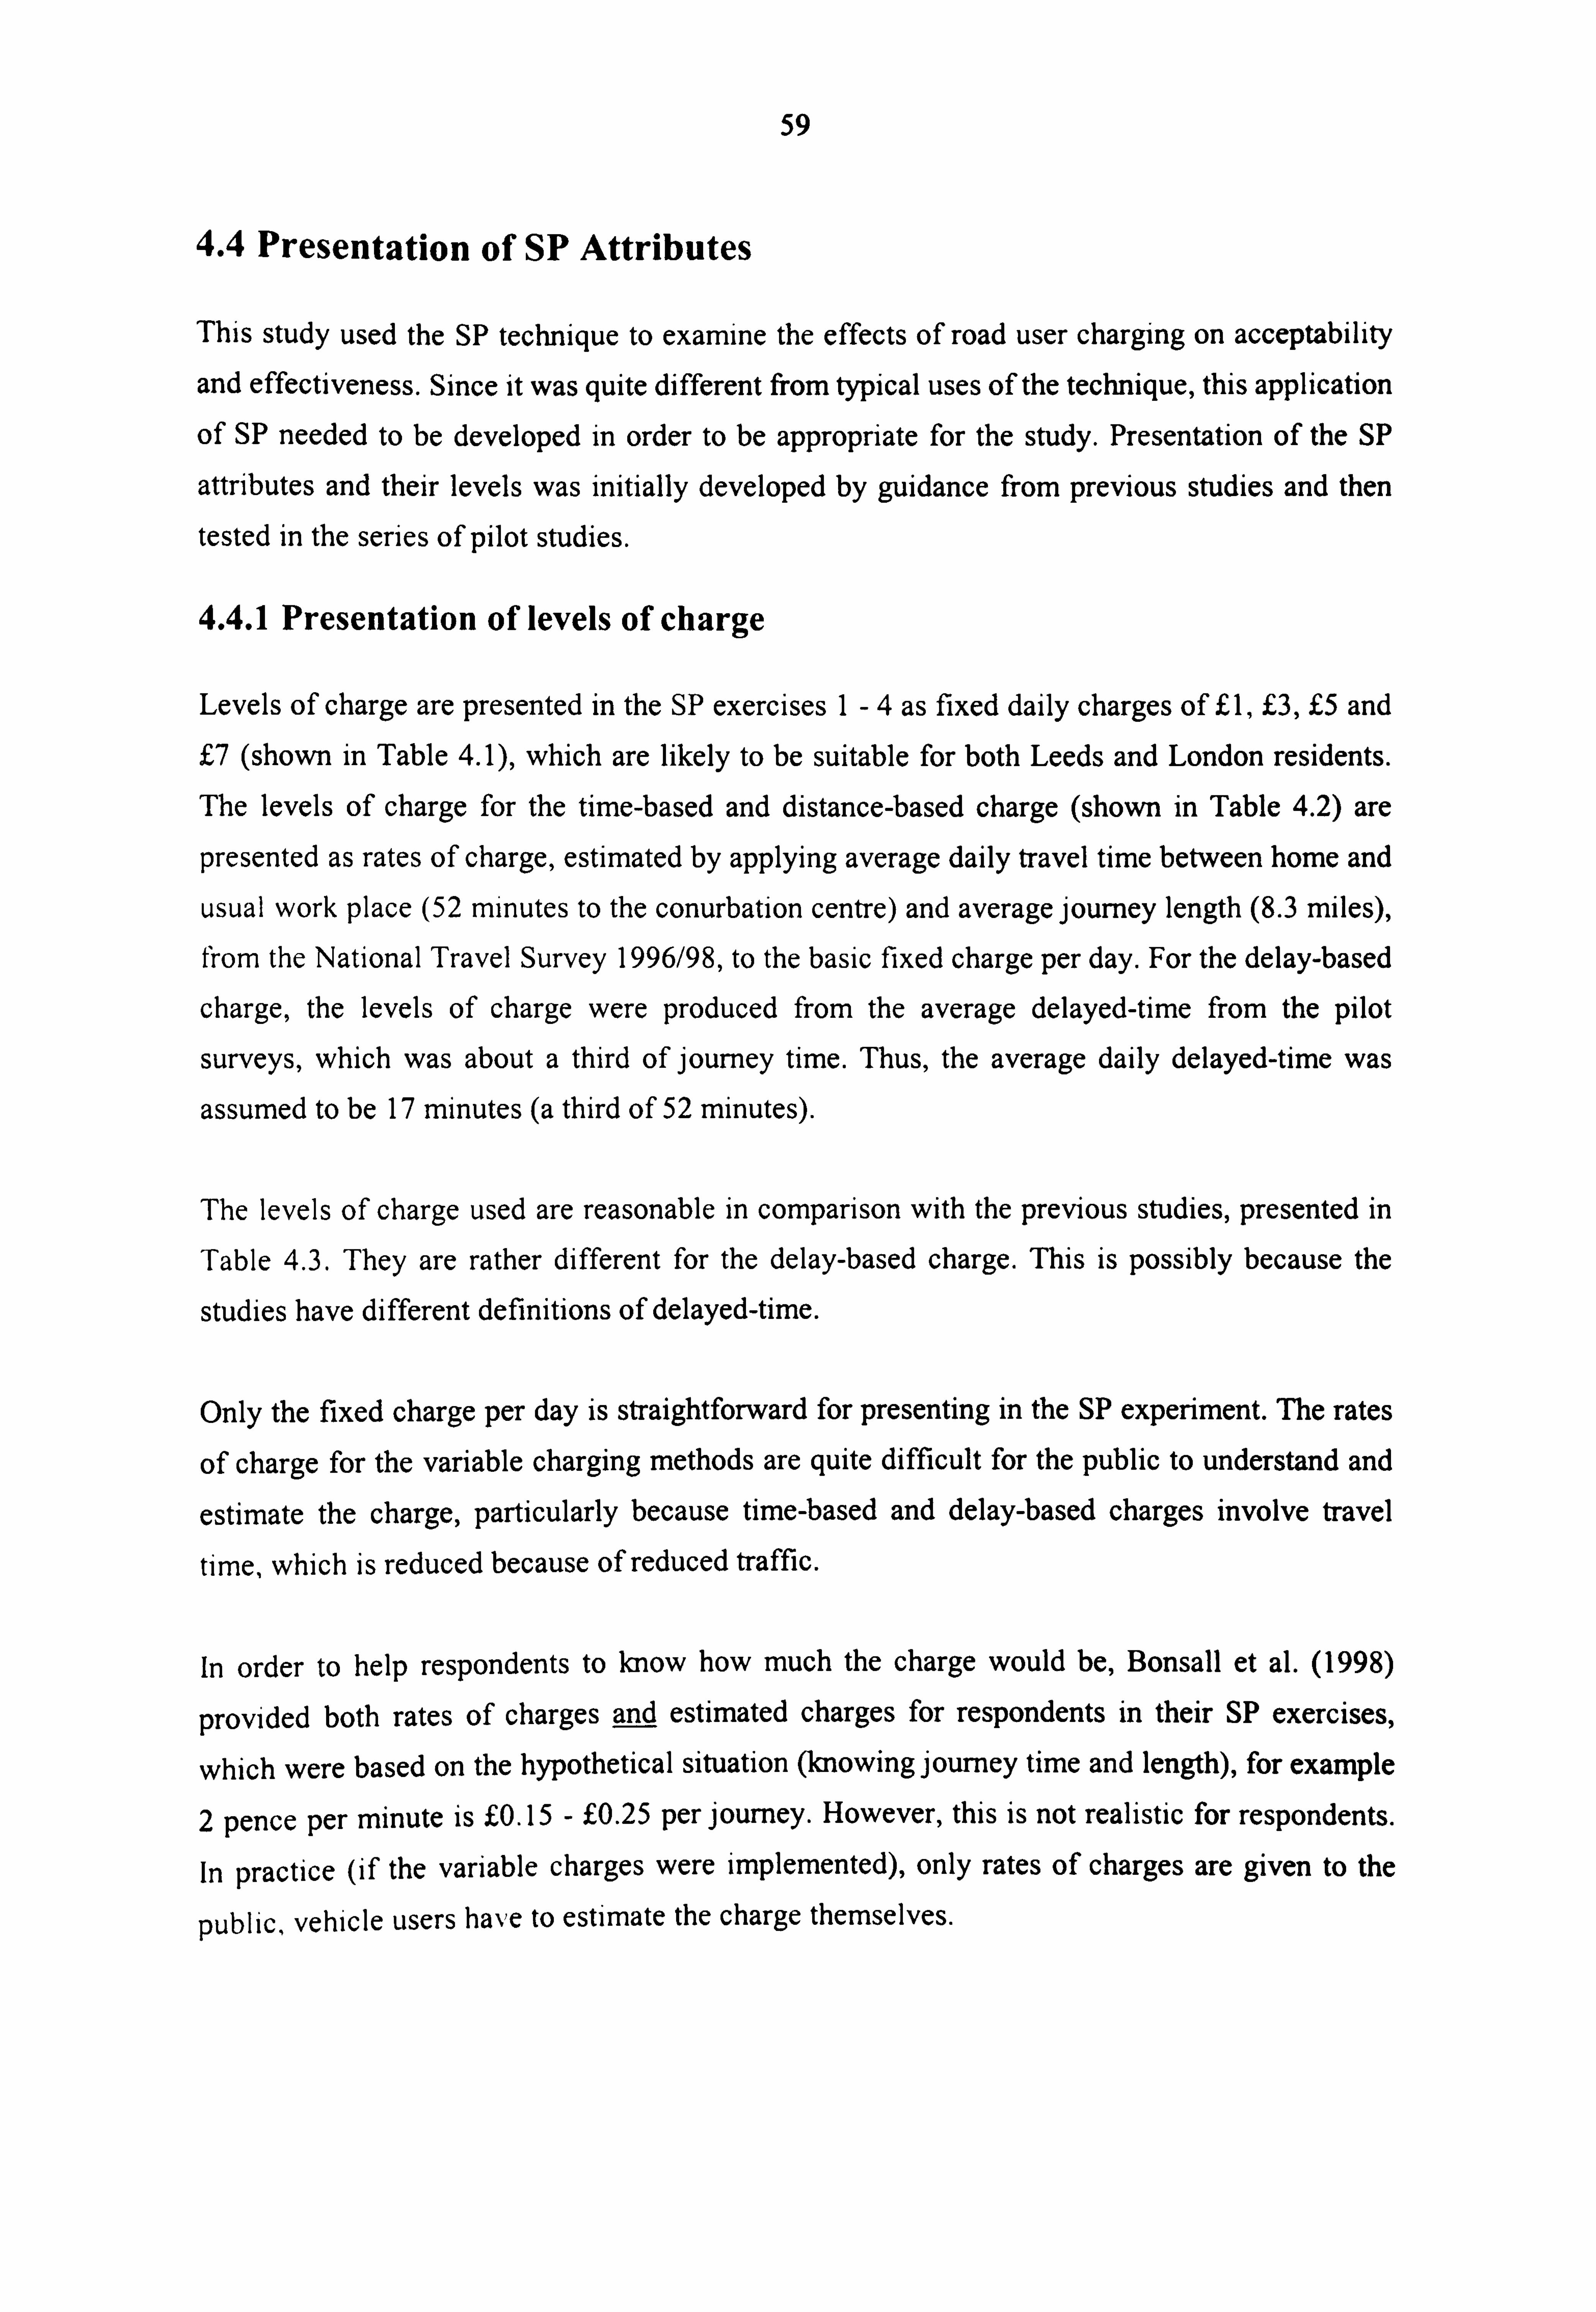
59
4.4 Presentation of SP Attributes
This study used the SP technique to examine the effects of road user charging on acceptability
and effectiveness. Since it was quite different from typical uses of the technique, this application
of SP needed to be developed in order to be appropriate for the study. Presentation of the SP
attributes and their levels was initially developed by guidance from previous studies and then
tested in the series of pilot studies.
4.4.1 Presentation of levels of charge
Levels of charge are presented in the SP exercises I-4 as fixed daily charges of f I, E3, E5 and 0 (shown in Table 4.1), which are likely to be suitable for both Leeds and London residents. The levels of charge for the time-based and distance-based charge (shown in Table 4.2) are
presented as rates of charge, estimated by applying average daily travel time between home and
usual work place (52 minutes to the conurbation centre) and average journey length (8.3 miles), from the National Travel Survey 1996/98, to the basic fixed charge per day. For the delay-based
charge, the levels of charge were produced from the average delayed-time from the pilot
surveys, which was about a third of journey time. Thus, the average daily delayed-time was
assumed to be 17 minutes (a third of 52 minutes).
The levels of charge used are reasonable in comparison with the previous studies, presented in
Table 4.3. They are rather different for the delay-based charge. This is possibly because the
studies have different definitions of delayed-time.
Only the fixed charge per day is straightforward for presenting in the SP experiment. The rates
of charge for the variable charging methods are quite difficult for the public to understand and
estimate the charge, particularly because time-based and delay-based charges involve travel
time, which is reduced because of reduced traffic.
In order to help respondents to know how much the charge would be, Bonsall et al. (1998)
provided both rates of charges and estimated charges for respondents in their SP exercises,
which were based on the hypothetical situation (knowing J ourney time and length), for example
2 pence per minute is M 15 - EO. 25 per journey. However, this is not realistic for respondents.
In practice (if the variable charges were implemented), only rates of charges are given to the
public, vehicle users have to estimate the charge themselves.

60
Table 4.3 Review levels of charge used in previous studies Source Study area Methods of charge
Cordon Fixed Time-based I Distance-based Delay-based (pence per (pence pe r (pence per
L (pence per (pence per
crossing) :
day) min. ) mile) delay min. )
This study Leeds and 100-700 2-12 10-100 5-40
London NEDO (1991) London - - 0.8-8 - - Sheldon et al . (1993) London 50-200 500 1.5-12 10-40 - Milne et al. Cambridge 10-100 - 5-21 16-64 60-600 (1993) Fowkes et al. London (1 993b) (Central) 100-800 - - - - Fowkes et al. Edinburgh 25-200 - - (1995)
MVA (1995) London 200-1000 - - 64-256 - (Central) Palmer and Bonsall Simulation - - 3-36 - 12-150 (1997) Ghali et al. Leeds and (1998) York 5-200 - 1-22 1.6-35 5-110
Cho (1998) Leeds 70-150 - 2-8 - 7-12 Richards and Harrison Leeds - 100-200 - -
1
(1999) 1 1 11 1 1
To make the SP exercise realistic, in this study, charging levels for each method were presented
as rates of charge, such as pence per minute, pence per delayed-minute or pence per mile depending on charging method, even though it would be quite difficult for them to work out the
charge. Fo check whether respondents understood the charging regimes and were able to
estimate the charge, they were asked how much they would be charged. The pilot surveys
showed that the majority of respondents were able to estimate their own charge. This was
probably because only two variable charging scenarios, which used the same method of charge,
were presented to each individual who received SP exercise 5.
4.4.2 Presentation of travel time reduction
In an SP exercise travel time changes are usually presented as absolute values. This is
inconvenient for a paper-based survey where travel time reductions in the SP exercise are based
on individuals' current travel time, because various sets of travel time and travel time change
need to be prepared for different travel circumstances, and it may still imply unrealistic
percentage changes for some respondents. Moreover. this requires much more time to distribute
the survey forms because of the need to check that each individual receives the appropriate
computer-based survey is very much more flexible in presenting suitable travel ti I ime
rcdLiction as absolute values for each individual. However, this study did not use this method
becaLISC it was costly, particularly when a number of respondents was needed for segmentation

61
analysis. Therefore, the study should consider whether it is appropriate to present travel time
reductions to respondents in other forms (e. g. percentage changes). rather than absolute changes.
In addition, another issue needed to be considered is whether time reductions (offered in the SP
exercises) should be related to times reduced in current travel time (free flow travel time plus delayed time) or only in delayed-time. (Delayed-time is defined as the time spent moving
slowly or stopped in congested traffic, at traffic lights, or bus stops. ) This is important since the free flow time and delayed-time have different values (see Wardman, 2001a). In practice, if a
charging scheme was introduced, the delayed-time reduction would be a direct benefit of the
charge, which in turn results in reduction of total travel time. Therefore, reduction in delayed-
time would be a more suitable measure for the study. This can also avoid unrealistic
presentation of travel time reduction, in which travel time reduction offered may be higher than delayed-time perceived by an individual.
In the pilot surveys, in order to get a suitable forrn of presentation of travel time reduction, different forms were designed to test: (a) whether proportionate changes could be used instead
of absolute changes, and (b) whether reduction of delayed-time was understandable by
respondents and could be used instead of reduction of travel time. There were three forms of
presentation: as absolute values (e. g. reduced by 10 minutes), percentage changes (e. g. reduced
by 20%), and descriptions of proportionate changes (e. g. reduced by a quarter).
For the percentage and proportionate changes, each fonn has only one set of SP exercises. The
percentage changes were presented in reductions of travel time, while the proportionate changes
were in reductions of delayed-time in which travel time reductions. For the absolute changes,
the study needed to provide a suitable survey form for each respondent. One set of travel time
reductions was designed for each range of current travel times, for example for those who travel
time 20-40,41-60,61-90 and over 90 minutes per day.
it %\ Lis quite difficult to decide which form of the travel time reductions was the best for
pi-escnting in the SP exercises because of the limited sample size. Overall, the results showed
that the description of proportionate changes in delayed-time (reduced by a quarter, a half and
three quarters) could be used for the main data collection because:
0 it presented realistic travel time reductions for everyone; (total travel time, for which
delaved-time was deducted from current travel time, would not be lower than free-flow
travel time)
62
0 it was convenient for data collection; (survey forms can be handed to people without
asking their current travel time)
0 it was more familiar to the public than the percentage change;
the model estimation results In the pilot studies using this approach showed no problem:
9 respondents seemed to understand delayed-time relatively well; most of them were able
to estimate their own delayed-time.
4.4.3 Presentation of environmental improvement
The presentation of environmental variables is one of the main difficulties of SP design. In
previous SP surveys, there are various methods to present the environmental change in SP
exercises. Firstly, the improvement is presented as categorical variables, such as 'slight' and
I significant' improvement (Thorpe and Hills (1992) studying preferences on road piricing
schemes). Secondly, it is introduced as percentage change in improvement, e. g. 50%
improvement, or in deterioration, e. g. 50% worse (Wardman et al. (1997) examining the
impacts on location decisions), or as percentage reduction, such as the pollution reduced by
20% (Sxlensminde (1999) investigating willingness to pay to reduce environmental problems). Thirdly, it is based on location specific descriptions that involve offering individuals different
levels of environmental quality by referring to a range of locations with which the respondents
would be familiar (Wardman et al., 1997), or by referring to different positions of respondents' households, e. g. noise levels varying due to distance from a source of the noise (Arsenio et al.
2000). Finally, it is presented in quantity of households affected, such as "number of households
nioderately to highly affected by traffic noise", or in amount of space lost expressed in "football
field equivalents" (Daniels and Hensher (2000) valuing environmental impacts of road projects).
The previous studies show that the presentation design depends on what the objective of the
study is, and how detailed the environmental valuation is. The design needs to bear in mind that
the more details presented the more complicated the survey to the respondent, and this may
affect valuations of the other variables. The last two methods of presentation (referring to
specific locations and referring to amount of measurable effects) are more likely to be suitable for great detail in the valuation of the environmental impact. The first two approaches
(categorical description and percentage charge) are simpler and easier to use in trading-off with
other variables.
In the pilot studies, therefore, the two simple forms of environmental improveiiient presentation
\\ci-c tested- percentaoe change and description ot improvement ('slight' and 'substantial'). t, as no problem for respondents in responding to the charging schemes presented. I

63
Nonetheless, in the main survey the description was used, because It was l1kely to be more
understandable for respondents than the percentage improvement, which Nvas in numerical
terms.
4.4.4 Presentation of revenue allocation
Suggestions for revenue allocation have been made by Goodwin (1989) and Small (1992).
Goodwin claimed that revenue of road pricing should be spent equally (a third each) for
improving public transport, including in general tax revenue (either to reduce taxes or to
increase social spend), and building and maintaining new road infrastructure. Small argued that
this spending was too much for road projects. He suggested slightly differently a revenue
allocation of one-third to reimburse to traveller, one-third to substitute general taxes and one- third to fund new transportation services (road network and public transport). However, it was
not quite clear why revenue should be split equally among these projects.
The effects of the revenue uses on public acceptability were studied by many attitude surveys (e. g. Jones, 1991 -, Nevin and Abbie, 1993; CflT/MORI, 2000; GOL, 2000; Thorpe et al., 2000).
I'hese found that acceptance of road user charging would be significantly improved when its
revenue was spent on either public transport improvement or tax reduction.
In an SP survey, Thorpe and Hills (1992) examined the effects of revenue use on acceptability by presenting levels of public transport investment as 'slight' and 'significant', and presenting levels of annual vehicle tax reduction as 'unchanged' and 'reduced'. These presentations are
simple and may be able to show some effects of revenue use on acceptability. However, it is difficult to know whether proportion of allocation of revenue to public transport and tax
reduction significantly influences acceptability.
Since it was quite clear that these revenue uses could improve acceptance, this study examined
\N,, hether proportions of revenue use are important. In the pilot surveys, the proportions were
ic transport : tax reduction' with three levels: '50: 50', presented as 'revenue allocation to publi II
'75: 25' and '25: 75'. In the other version the levels tested were '50: 50', 'public transport only'
and 'tax redUCtion only'. These were simpler than the first one for respondents to understand;
thus, theý, \,, tere used in the main survey to examine whether spending revenue on only
impi-o\-ing public transport or only reducing tax are significantly different in improvi IIII ing
acceptance from spending equally.
64
4.4.5 Presentation of systems features
System features: charging method, charged area and time, were unlikely to be a problem for
presentation in an SP exercise. Definitions of charging methods were given to respondents that
the charge was related to the distance, time or delayed-time spent travelling on the roads inside
the charged area (described in Section 4.3). To indicate the areas of charge, a map (shown in Appendix B) was provided for each respondent. Times of charge were presented as 7am-10am
and 7am-7pm. All these presentations were understandable for respondents, as shown by results from the pilot surveys.
4.5 Measurement of Behaviours
In the study, behavioural responses to the charging scenarios included: what they think about the schemes from their own and social preferences, whether individuals accept the schemes, and
whether they intend to change mode for j ourney to work. To measure these, a set of questions
was tested in the pilot surveys.
4.5.1 Measurement of selfish and social perspective
So far only a few studies in transport (see Section 2.5.3) have been involved with the self- and
social-interest at the individual level. They examined the effects of the individuals' perspectives
on travel behaviours and attitudes to transport projects. This study examined the individuals'
preferences as influences on acceptability of road user charging. This was based on a hypothesis
that people are not concerned only with benefits to themselves, but also benefits to society as a
whole. A major barrier of the study was that there was no consensus on how to set questions
that were able to distinguish selfish and social perspectives in each individual. The design for
measurement of these perspectives needs to be varied depending on the context and objective of the study.
For example, Bristow ct al. (1991) studied individuals' willingness to pay to preserve local bus
, services from three different aspects: (a) when respondents need to use the bus, (b) when
respondents are concerned for others in their household, and (c) when respondents are
concerned for the community as a whole. These can reflect personal preferences from self-
interest to social-interest.
Hopkinson (1994) studied the public attitudes to transport projects, e. g. road widening and
bypass building. I'lic attitudes were measured from two perspectiN, -es: personal and social. These
lll\, olN, c- (a) "benctit me personally as a resident", (b) "benefit me personally as a road user", (c)

65
"benefits to residents as a whole", (d) "benefits to road users as a whole". These can reflect
individuals' perceptions of benefits to themselves and to society, and also Individuals'
perspectives when they are in different positions, as users and residents.
Furthermore, Daniels and Hensher (2000) also studied the public valuation of environmental
impacts of road construction for the selfish and social perspectives by asking respondents: (a)
"from individual perspective... " and (b) "from community perspectives... ". They believed that
each individual has the two different perspectives, so these were asked directly of respondents.
In this study, a set of questions was designed to gather the individual's selfish and social
perspective, and was tested in the pilot surveys. Three versions of the questions were designed
to distinguish the two perspectives. In the first version, two questions used were:
0 "How acceptable do you think the charge situation would beforyourself9"
0 "How acceptable do you think the charge situation would befor society as a whole? "
Responses were provided on a 5-point scale, between very unacceptable and very acceptable. The majority of respondents answered the same to both the questions. This was possibly because the phrases 'for yourself and 'for society as a whole' were not very clear to the
respondents.
In the second version, the questions were:
0 "Fromyour point of view, would the situation be acceptable? "
9 "From the point of view of the well-being of society, would the situation be
acceptable'? "
Respondents can only respond 'yes' or 'no'. It appeared that respondents either were unable or had no option to differentiate the two perspectives since most respondents gave the same
answers for these two viewpoints.
In the last version, the questions were:
0 "How much do you find each situation would benefit yourself9"
0 "How much do you find each situation would benefit society? "

66
Respondents were asked to indicate their answers on an II -point scale, -5 to 5, defined bet-A-een
very detrimental and very beneficial. Overall, respondents seemed to easily distinguish their
attitudes; most of the respondents stated different perceptions between the two perspectives. This was possibly because the phrase 'benefit' was clearer than the previous questions and the
scale allowed a wider range of response options. Therefore, this version was used for the main data collection. The pilot studies also found reasonable results in that the average of the
perception of benefits to self was negative but to society was positive when rating was given by
car users; while both were positive when rating was given by non-car users. Correlation
between the two perspectives was quite low for car users, but high for non-car users.
4.5.2 Measurement of acceptability
Acceptance of road user charging has long been studied by attitudinal surveys. Many terms have
been used for reflecting the acceptability. The most direct one is 'acceptable' (used in NEDO,
199 1, Thorpe et al., 2000; Ison, 2000). Some other general terms are 'support/oppose' (in Jones,
1991,1995; LEX, 1998,1999; Taylor and Brook, 1998; CflT/MORI, 2000), 'in favour/against'
(in Seale, 1993; Taylor and Brook, 1998), 'goodibad thing' (in GOL, 2000). The other term,
which is direct and meaningful, is 'vote for' (in Jakobsson et al., 2000).
Though all these terms are clearly understandable, they are slightly different in some senses. For
example, some people might think it is good, but not vote for it because they do not want to
happen. Or some might vote for it (for some reason), even though they feel it is not good for
them. 'Acceptable', 'good' and 'in favour' can reveal general attitudes. 'Support' and 'vote for'
may imply more sense in tern-is of implementation support or political support. 'Vote for' also lets people become more involved in the decision-making process.
In the pilot surveys, there were attempts to use both terms 'acceptable' and 'vote for'. The first
was:
" Rqfich situation do you consider most acceptable?
Current situation or with-charging situation "
Fhe ,,, econd was:
-Wbich situation would vou i, otcjbr. "
Current situation or with-charging situation
67
Although both 'acceptable' and 'vote for' seemed to be understandable to respondents, 'vote for' was selected for use in the main survey because it was more a precise measure of whether
people would accept the schemes to implementation. The term 'acceptable' was rather too
general.
Furthermore, in some cases the choices offered (current situation and with-charging situation)
cannot provide clear information because a selected answer was compared to the other. For
example, if the current situation was unacceptable and the charging system was considered
more acceptable than the current one, it was not clear whether the charging system was
acceptable.
In order to make it simple for respondents, the final version of the measurement was:
"Wouldyou votefor situation A? (If'there was a local referendum) Yes or No "
This question was clearer and simpler than the previous ones in measuring whether individuals
accept and support the charging schemes to be implemented. Hence, it was used in the main
survey.
4.5.3 Measurement of effectiveness
In order to evaluate the effectiveness of road user charging schemes, the main objective of the
scheme needs to be specified, either for traffic relief, environmental improvement or revenue
generation. The study focused on car use reduction. To reflect this, car users' behavioural
responses to the schemes could be measured by their intention to reduce car use or to change
bcha\iour. For example, car users could be asked to indicate a number between 0-100
corresponding to their intended car use when facing charging schemes, where zero means no car
use at all and 100 means the same extent of car use as now (Jakobsson et al., 2000). This
rriethod is fairly crude. Car users can just indicate their overall level of car use, for whatever
purposes, but they may use different modes for different trips. Alternatively, car use reduction
can be measured by travel mode switching. Car users can be asked to indicate a behavioural
change by selecting from a presented set of choices, for example, including pay and drive, travel
earlier or later, change transport mode, move house and change job or destination. This
nicasurenient should be Used to allow car users to indicate the change for different trip purposes
because they are likely to change their behaviours in different ways for different trip purposes.
68
In this study, the SP exercises were designed to examine individuals' mode choice response to
the charging scenarios for their work trips. Respondents were offered four choices: car, car
earlier/later (travelling by car before and/or after the charged time), bus, and other (specified by
respondents). This question is straightforward. The results from the pilot studies indicated no
sign of a problem for respondents to answer the question.
4.6 Data Collection and Respondents' Characteristics
The main data collection was conducted in Leeds and London during November 2000 and March 2001 by self-completion questionnaires. In this section, the process of the data collection
is described, sample characteristics are presented, and problems found in the main data
collection are discussed.
4.6.1 Data collection process
The designed SP questionnaires were distributed to the public in general without identifying
specific groups. There were 830 respondents in Leeds and London in total. The sample was
collected from two sources: household surveys and employee surveys. The household survey forms were distributed by Royal Mail to residents' households inside and outside the Inner Ring
Roads of Leeds and London in selected postcode areas. Respondents replied by using freepost
envelopes provided. There were 572 respondents from Leeds (11.4% response rate) and 159
from London (3.2% response rate).
For the employee survey, several private companies and local government organisations in Leeds and London were contacted to ask for cooperation in distributing the questionnaires to
their staff. A few organisations agreed to help. Their staffs were given the self-completion
questionnaires. Respondents replied either by using freepost envelopes, or by collection within
their firms. There were 88 replies from Leeds (14.7% response rate) and II from London (6.5%
response rate).
4.6.2 Problems in the data collection
For the household survey, the low response rates particularly from London were probably due to
the survey method (self-completion) and its lack of personal contact. Another possible reason
as that the questionnaires were deliN ered by Royal Mail to every household in the selected
postcode areas, although some households had no occupants. It may also be because it was
clearly stated that the questionnaires N\ere carried out for a PhD research in the University of

69
Leeds, so people were less interested to complete the survey form, partIcularly In London. They
may believe that the results will not influence any change.
For the employee survey, most companies only cooperated in distributing the survey fonns to
their staff, but the response was dependent on their employees who can Individually reply by
using freepost envelopes provided. Thus, the response rates on average are just a little better
than the household survey. Some companies have no response at all, but some ha\, e over 50%
response rate. Moreover, the main problem of this survey was the difficulty to get cooperation from both private and public organisations. They may not see any benefit to themselves. On the
other hand, the survey may disturb their staff work.
The survey method, self-completion and mail-back questionnaire, was used because it was less
time and cost consuming than face-to-face interview, in order to achieve the same sample. Although, the response rates are low, it was less likely to have biases from non-responses, as long as the respondents' characteristics are not very far from the Census. It was also less likely
to have the policy bias from those who have strong attitudes against the policy, because it was
clear to respondents that the questionnaires were carried for university research.
4.6.3 Respondents' characteristics
There were 830 respondents in the sample, of which 660 were from Leeds and 170 were from
London. Sample characteristics are given in Table 4.4. There was a high proportion of car users froni Leeds, bLit a high proportion of non-car users from London, as expected. (Note that car
usci- is defined as those who usually use their cars for either work or non-work trips. )

70
Table 4.4 Characteristics of respondents from Leeds and London residents
Characteristics Leeds 660
London 170
Mode use Car* 522 (80%) 69 (41%) Bus 113 (17%) 47 (28%) Other mode 25 (4%) 54 (32%)
Gender Female 237 (36%) 79 (47%) Male 399 (61%) 83 (49%) No answer 24 (4%) 8 (5%)
Household income per annurn Less than E10,000 71 ( 11%) 19 (11%) f-10,000 - E19,999 111 (17%) 23 (14%) E20,000 - F-29,999 132 (20%) 31 (18%) F-30,000 - E39,999 80( 12%) 19 (11%) F-40,000 - F-49,999 58 (9%) 21 (12%) E50,000 - E59,999 36 (6%) 14 (8%) E60,000 or more 46 (7%) 20 (12%) No answer 126 (19%) 23 (14%)
Age 24 or below 8( 1%) 6 (4%) 25-34 77( 12%) 58 (34%) 35-44 137 (21%) 41 (24%) 45-54 174 (26%) 27 (16%) 55 or more 248 (38%) 31 (18%) No answer 16 (2%) 7 (4%)
Number of car in household 0 66( 10%) 68 (40%) 1 337 (51%) 79 (47%) 2 224 (34%) 11 (7%) 3 or more 22 (3%) 4 (2%) No answer 11 (2%) 8(5%)
* Note: car user is defined as those who usually use their cars for either work or non-work trips
The data of the 1991 Census for gender and age can be accessed. The distribution of the sample from London is slightly different from the census. The Leeds sample included a higher
proportion of men and a slightly higher proportion of respondents over 55 than expected from
the Census figures, in which men are 47.3% and the 55 or older age group are 34.3% of those
\\ ho are 18 or over.
Iii the questionnaire, respondents were asked to Indicate their general perceptions relating to:
current travel situation, transport problems (congestion and pollution) and effectiveness of
charging schemes in reducing the problems. They were also given space for comments. From
these comments, some respondents were identified to have a strong dIslIke of charging. This
inions mentioning that car users already pay enough, charging is not a solution, and includes opi IIIIII
no directly that they were aga nst the charge. The statIstIcal results of the percePtions some stati ,II

71
are shown in Table 4.5. Greater details of these perceptions are presented and d1scussed in the
next chapter.
Table 4.5 General perceptions of respondents from Leeds and London residents (% of respondents)
Perceptions I Leeds London
Perception of current travel situation Acceptable 372(56.4%) 56(32.9%) Not acceptable 177(26.8%) 72(42.4'o) No comments 111 (16.8%) 42(24.7%)
Perception of congestion problem No problem 8(1.2%) 1 (0.6%) Slight 135 (20.5%) 4(2.4%) Serious 377(57.1%) 62(36.5%) Very serious 134(20.3%) 102(60.0%) No comments 6(0.9%) 1 (0.6%)
Perception of pollution problem No problem 12(l. 8%) 0(0%) Slight 167(25.3%) 9(5.3%) Serious 359(54.4%) 67(39.4%) Very serious 111 (16.8%) 93 (54.7%) No comments 11 (1.7%) 1 (0.6%)
Perception of effectiveness in redu ing congestion Yes 225 (34.1%) 93(54.7%) No 407(61.7%) 72(42.4%) No comment 28(4.2%) 5(2.9%)
Perception of effectiveness in redu ing pollution Yes 221 (33.5%) 91 (53.5%) No 422(63.9%) 73(42.9%) No comment 17(2.6%) 6(3.5%)
Dislike o charging Strong dislike of charging 215 (32.6%) 19(11.2%)
4.7 Conclusion
This chapter has presented the process of survey development. The questionnaire and SP
exercises were designed and tested by a series of pilot surveys between August 1999 and July
2000. The last pilot survey showed that the designed questionnaire and SP exercises were
suitable for use in the main data collection. The main survey was conducted between November
2000 and March 2001 in Leeds and London by the household and employee surveys.
Fhroughout the pilot studies, many developments of the questionnaire and SP exercises were
produced. The formats of questionnaire and SP exercises were changed until they were the least
complicated for the public and Nvere still capable to of producing all the information needed in
the analyses. Attributes and their levels in the SP exercises were designed. Delayed-time was
proved to be understandable to respondents. Presentation of delayed-time reductions in terms of
pi-oportions (a quarter, a half and three quarters) was satisfactory and gave some advantages

72
over the presentations of travel time reduction in terms of absolute number and percentage
change. Selfish and social perspecti,,,, es were distinguished by public perceptions of benefits to
themselves and to society. Voting for the schemes was used for reflecting acceptability. Effectiveness was measured in terms of mode choice for travel to work.
Results of the data analyses are presented and discussed in the next five chapters, Chapters 5-
9. Chapter 5 looks at the descriptive analysis results about public's general attitudes to transport
problems and road user charging. In Chapter 6, voting behaviour is analysed to show how
acceptability is influenced by the system characteristics, as well as respondents' characteristics. Chapter 7 reports on the effects of selfish and social perspectives on acceptability. Chapter 8
investigates the effects on effectiveness. Then in Chapter 9, the relationship between
acceptability and effectiveness of the policy is examined.

73
Chapter 5
General Public Attitudes to Road User Charging
5.1 Introduction
fn chapter 4, the design of the questionnaire for the main data collection was described. It was designed for gathering three main elements of data:
0 general public attitudes to transport problems and road user charging;
0 individuals' current travel situations;
0 the SP data, which was analysed and is reported in the next three chapters.
Moreover, space was provided at end of the survey form for respondents to add their comments.
The objective of this chapter is to present and discuss the data about the general attitudes and
current travel situations. A summary of the comments is also provided. Although Table 4.5 has
presented the statistical results of the general attitudes, this chapter provides greater details.
Section 5.2 reports the perceptions of current travel arrangements, such as journey times,
delayed-time and the acceptability of the current situation. Section 5.3 describes the perceptions
of transport problems: congestion and pollution. Then, Section 5.4 demonstrates the relationship between the perception of the current travel situation and the perception of the problems. The
perceptions of effectiveness of road user charging in reducing the problems are presented in
Section 5.5, while Section 5.6 summarises the general comments from respondents, and
identifies respondents who have a strong dislike of charging. Section 5.7 ends the chapter with
conclusions about general public attitudes towards transport problems and road user charging.
5.2 Perception of Current Travel Situations
One of the main elements of the data from questionnaire is about individuals' current travel
arrangements \vithin the inner areas of Leeds and London. For Leeds, the area is specified as the
area inside the Outer Ring Road and for London as within the North/South Circular Roads
(shown in Appendix B). Respondents were asked to estimate their daily journey time and

74
delayed time within these areas, if they travelled or were to travel by car and bus for work and
non-work trips. They were also asked whether they found their current travel arrangements in
their city acceptable.
5.2.1 Current journey time
Average daily journey times to work per day for commuters in Leeds and London using their
current mode and assessed for the alternative mode are shown in Table 5.1. The average j ourney
times to work for both car and non-car users in London are higher than those in Leeds. This is
partly because in London people live further from work places than in Leeds (from the data,
average daily travel to and from work is 22.1 miles in London and 18.7 miles in Leeds). It is likely to be mainly because in London congestion is higheri.
In both cities, car users expected that their joumey time to work by bus would exceed car
j oumey time. Non-car users also believed that their j ourney time would be less if they travelled
by car, even in London. Perceived delayed-times are relatively large, particularly for bus.
Table 5.1 Average journey times (standard deviation) for work trips within Leeds and London
Sample Average car Average car Average bus erage bus journey time delayed-time journey time delayed-time
(mins. per day) (mins. per day) (mins. per day) (mins. per day) Leeds
Car users 35.6(26.1) 16.8(14.6) 69.3(44.2) 32.3(27.1) Non car users 51.1 (51.0) 25.7(21.5) 66.5(40.4) 29.6(26.4)
London Carus rs 83.8(87.1) 37.7(36.6) 150.2 (114.5) 68.7(72.0) Non car users 66.5(69.7) 35.0(32.2) 95.2(75.2) 47.1 (41.5
In order to see how perceptions of car and bus journeys differed, calculations were made for
each individual of the ratio of bus journey time to car j. ourney time, as well as the ratio of delayed-time to total J oumey time for both bus and car j ourneys. The average of these ratios for
work trips are reported in Table 5.2.
The average ratios of bus joumey time to car joumey time are relatively high for car users. In
Leeds, on average, i ourney time to work by bus is expected to be double that of the car J ourney,
and almost double in London. The difference between car and bus journey time for non-car
From the Transport Statistics Great Britain 2001, average time taken to travel between home and usual place of work is . 42 minutes in London and 25 minutes in West Yorkshire.

75
users is lower than for car users. This is probably because car users have less experience and
poorer perceptions of using the bus, so they are likely to overestimate bus journey times.
The average ratios of the delayed-times to j ourney times for car and bus are slightly different. In
Leeds, the ratios are similar between car and non-car users. In London, the ratios of delayed-
time to journey time are slightly higher for non-car users than for car users. For car users, the
delayed-times are perceived as almost a half of journey times, but over a half for non-car users.
Table 5.2 Average ratios of travel times (standard deviation) for work trips within Leeds and London
Sample Average ratio of bus Average ratio of car Average ratio of bus journey time to car delayed-time delayed-time
journey time to car jouE22y time to bus journey time Leeds
Car users 2.02(0.99) 0.42(0.24) 0.46(0.19) Non car users 1.66(1.01) 0.43(0.17) 0.46(0.28)
London Carus rs 1.87(0.92) 0.43(0.16) 0.48(0.24) Non car users 1.51 (0.69) 0.58(0.32) 0.55(0.29)
Average daily journey times for non-work trips perceived by both commuters and non-
commuters in Leeds and London are shown in Table 5.3. As with work trips, the average
journey times of non-work trips in London for both car and non-car users are higher than in Leeds. Car users expected that Joumeys by bus would be longer than by car. Non-car users also
thought that journeys by car would be quicker. Perceived car and bus delayed-times are
relatively large, particularly in London.
Table 5.3 Average journey times (standard deviation) for non-work trips within Leeds and London
Sample Average car Average car Average bus Average bus journey time delayed-time journey time delayed-time
(mins. per day) (mins. per day) (mins. per day) (mins. per day) Leeds
Car users 36.5(49.2) 14.4(15.5) 82.3(72.9) 29.3(35.9) Non car users 39.1 (39.8) 18.9(14.2) 76.8(93.9) 20.6(15.5)
London Car users 49.4(65.0) 25.5(21.2) 82.6(54.7) 43.8(29.7 ) I- Non car users 1 44.4 (48. ý) 32.9(28-2) 82.1 (57.0) 39.9 (32.3L
JI
Comparisons between car and bus j ourney times and between delayed-time and J ourney time for
non-work trips are presented in Table 5.4. The bus is still perceived as having longer joumeys
time than the car, particularly for car users in Leeds. In Leeds, the car and bus delayed-times,
compared to the journey times, are not as high as for work trips. The delayed-tImes of non-work
trips are perceived as only about a third of journey times. In London, the ratios for non-work

76
trips are slightly different from work trips, with non-work delayed-times about a half of journey
time.
Table 5.4 Average ratios of travel times (standard deviation) for non-work trips within Leeds and London
Sample Average ratio of bus Average ratio of car Average ratio of bus journey time to car delayed-time delayed-time
journey time to car journey time to bus journey time Leeds
Car users 1.93(1.33) 0.29(0.21) 0.36(0.22) Non car users 1.63(1.72) 0.35(0.16) 0.31 (0.17)
London Car users 1.52(0.71) 0.39(0.14) 0.51 (0.20) Non car users 1.53(0.96) 0.56(0.33) 0.51 (0.25)
5.2.2 Acceptability of current travel situations
Figure 5.1 shows the analysis of the answers to the question about attitudes towards the current
situation. Individuals were asked whether they found their current travel situation 'acceptable'
or 'unacceptable'.
From the whole sample, 52% replied that their current travel situation was acceptable and 30%
unacceptable (the others did not answer). However, there were differences between respondents
in Leeds and London, and between car and non-car users. In London, less than a third of non-car
users (27%) thought their current situation acceptable, while 40% of car users did. In Leeds, the
maj . ority of car users (60%) thought their current situation acceptable, and 42% of non-car users did.
"Do you find your current situation for yourjourneys acceptable? "
All
London Non cai users
Car user
Leeds Non cai users
Car users
Net acceptance
+22%
-21%
+5%
+3%
+26%
Figure 5.1 Acceptability of current travel situations by car and non-car users
11 Acceptable 0 Not acceptable

77
Overall, the current situation is more acceptable to car users than to non-car users, and to
respondents from Leeds than from London. Non-car users may not be satisfied with public transport services, as well as other non-car modes. fn London, transport problems of congestion
and pollution are likely to be perceived as more serious than In Leeds (see Section 5-3).
5.3 Perception of Transport Problems
In this section, the results are presented from questions asking respondents how serious they
perceive traffic congestion and pollution to be in their city. Responses were indicated separately for the level of congestion and pollution on a four-point scale: no problem, slight, serious and
very serious.
Overall, the majority saw the problems as 'serious' or 'very serious', 81% for congestion and
76%0 for pollution, with minorities rating them 'slight' and 'no problem', as shown in Figure
5.2. Correlation (Kendall's tau-b coefficient2) between the perceptions of the level of congestion
and pollution is moderate (0.64). This indicates that when respondents perceive one problem as
serious, they also tend to perceive the other as serious too.
"in your opinion, how serious a problem is traffic congestion (pollution) in Leeds (London)? "
No problem Slight El Serious Very serious
Pollution 1E/o 22% 51% 25%
Congestion El
7 I/c 53% 28%
Figure 5.2 Perceptions of congestion and pollution by all respondents
It was found that the perceptions of the transport problems ware different between respondents
who are from Leeds and from London, and between car and non-car users. Figure 5.3 shows the
2 Kendall's tall-b coefficient varies between -1 and +1 to indicate the strength and direction of relationship between two ordinal variables (Bryman and Cramer, 1997). Its Interpretation Is Identical to Pearson's I- coefficient, which is for interval data.

78
perception of congestion of car and non-car users in Leeds and London. Nearly all London
respondents, 97% of non-car users and 96% of car users, felt that congestion was serious or very serious. These figures are slightly lower for non-car users (89%) in Leeds, and lower (75%) for
car users in Leeds. Between these cities, although the proportions of perceiving ýserious' or ývery serious' in Leeds are not substantially different from in London, the proportions of 'very
serious' alone in London are very much higher than in Leeds.
"In your opinion, how serious a problem is traffic congestion in Leeds (London)? "
El No problem El Slight El Serious
London Non car users
El Very serious
Car users 2 -ý 1% 37% 1 59% 1
Leeds Non car users 11 1 0-/ý 58% 31%
Car users 1 23% 57% T-18-%-]
Figure 5.3 Perceptions of congestion in London and Leeds by non-car and car users
"in your opinion, how serious a problem is traffic pollution in Leeds (London)? "
El No problem El Slight El Serious 1: 1 Very serious
London Non car users 1 ýO 35% 1 63% 1
Car users
Leeds Non car users
Car users
12 =/o 44% 1 44%
I io%l 57% F 32%
30% 1 53% : [ýý
Figure 5.4 Perceptions ot'pollution in London and Leeds by non-car and car users

79
Figure 5.4 shows the perception of pollution for respondents in Leeds and London by car and
non-car users, which is quite similar to the perceptions of congestion. A very high proportion of
non-car users (98%) of London perceived pollution as serious or very serious. This proportion is
slightly lower for car users in London (88%) and non-car users in Leeds (89%). The perception
of pollution for car users in Leeds is relatively lower than the others. Two thirds of car users in Leeds thought pollution was serious or very serious, while a third felt that pollution in Leeds is
slight or no problem.
Other previous surveys also found similarly that the majority of public perceive congestion and
pollution as serious. From the British Social Attitudes survey in 1995,50% of respondents felt
that traffic congestion in towns and cities was very serious and 63% felt that exhaust fumes
from traffic is very serious (Taylor and Brook, 1998). In London, the survey by MORI in 2001
found that 74% perceived level of congestion was fairly or very poor, 51% did for motor vehicle
pollution, and 69% did for emission (CfIT/MORI, 2001).
In summary, this section demonstrated that the majority of people perceived congestion and
pollution as serious or very serious, as found in other surveys. These problems were perceived
as more serious by people in London than in Leeds, and by non-car users than car users.
5.4 The Relationship between the Perceptions of the Problem and Current Travel Situation
In Section 5.2.2, it was found that over half of respondents perceived that their current travel
situation is acceptable. However, Section 5.3 reported that over three quarters felt that in their
local area congestion and pollution problems are either serious or very serious. People who
reported their current situations as unacceptable could be expected to perceive congestion and
pollution as very serious than those who reported their current situation as acceptable.
Fablcs 5.5 and 5.6 present the degrees of the perceptions of congestion and pollution for
respondents \vho felt their current situation acceptable and unacceptable, as well as for all
respondents. Surprisingly, over a half of those who found their current situation acceptable
perceived problems as serious. For those who found their current situation unacceptable, there is higher proportion of people who perceived the problems as very senous than for those who found their current situation acceptable. In other words, although people \, ý-ho perceive the
problems as very serious tended to find their current situation unacceptable, the majority of
peopic who perceive the problems as serious felt their current situation acceptable.

80
The correlations (Cramer's V coefficient3) between the rating of their current travel situation
and the perceptions of the severity of the congestion problem (0.43) and pollution problems (0.29) are rather low. In addition to the perceptions of these problems. it is likely that there are
other factors affecting the perceptions of the current situation, e. g. journey time, reliability of journey time, road condition, public transport services, facilities of walking and cycling, etc.
Table 5.5 Cross-tabulation between the perception of congestion and current situation
Perception of Perception of current situation Total Congestion
k-Acceptable Not acceptable
No problem 9 0 9 (2.1%) (0.0%) (1.3%)
Slight 109 10 119 (25.8%) (4.0%) (17.8%)
Serious 237 109 346 (56.2%) (44.0%) (51.6%)
Very serious 67 129 196 (15.9%) (52.0%) (29.3%)
Total 422 248 670 (100%) (100%) 1 (1100%)
-JI
Table 5.6 Cross-tabulation between the perception of pollution and current situation Perception of Perception of current situation ý d Total Pollution --Acceptable Not accept-able-- No problem 11 1 12
(2.6%) (0.4%) (1.8%) Slight 123 24 149
(29.3%) (9.7%) (22.0%) Serious 212 130 342
(50.5%) (52.6%) (51.3%) Very serious 74 92 166
(17.6%) (37.2%) (24.9%) Total 420 247 667
(100%) (100%) 1 (100%)
5.5 Perceptions of Effectiveness of Charging
In this section. the results presented are from questions asking whether respondents agree that
ý: Iiarging \\OLI]d be effective in reducing congestion and pollution. Responses, either 'yes' or
no', were made for assessment of effectiveness in reducing congestion and pollution. The
results are presented in Figure 5.5.
3 Cranier's \7 coefficient varies between 0 and I to indicate the strength of relationship between two nonunal variables that have more than two categories (Bryn-ian and Cramer, 1997).
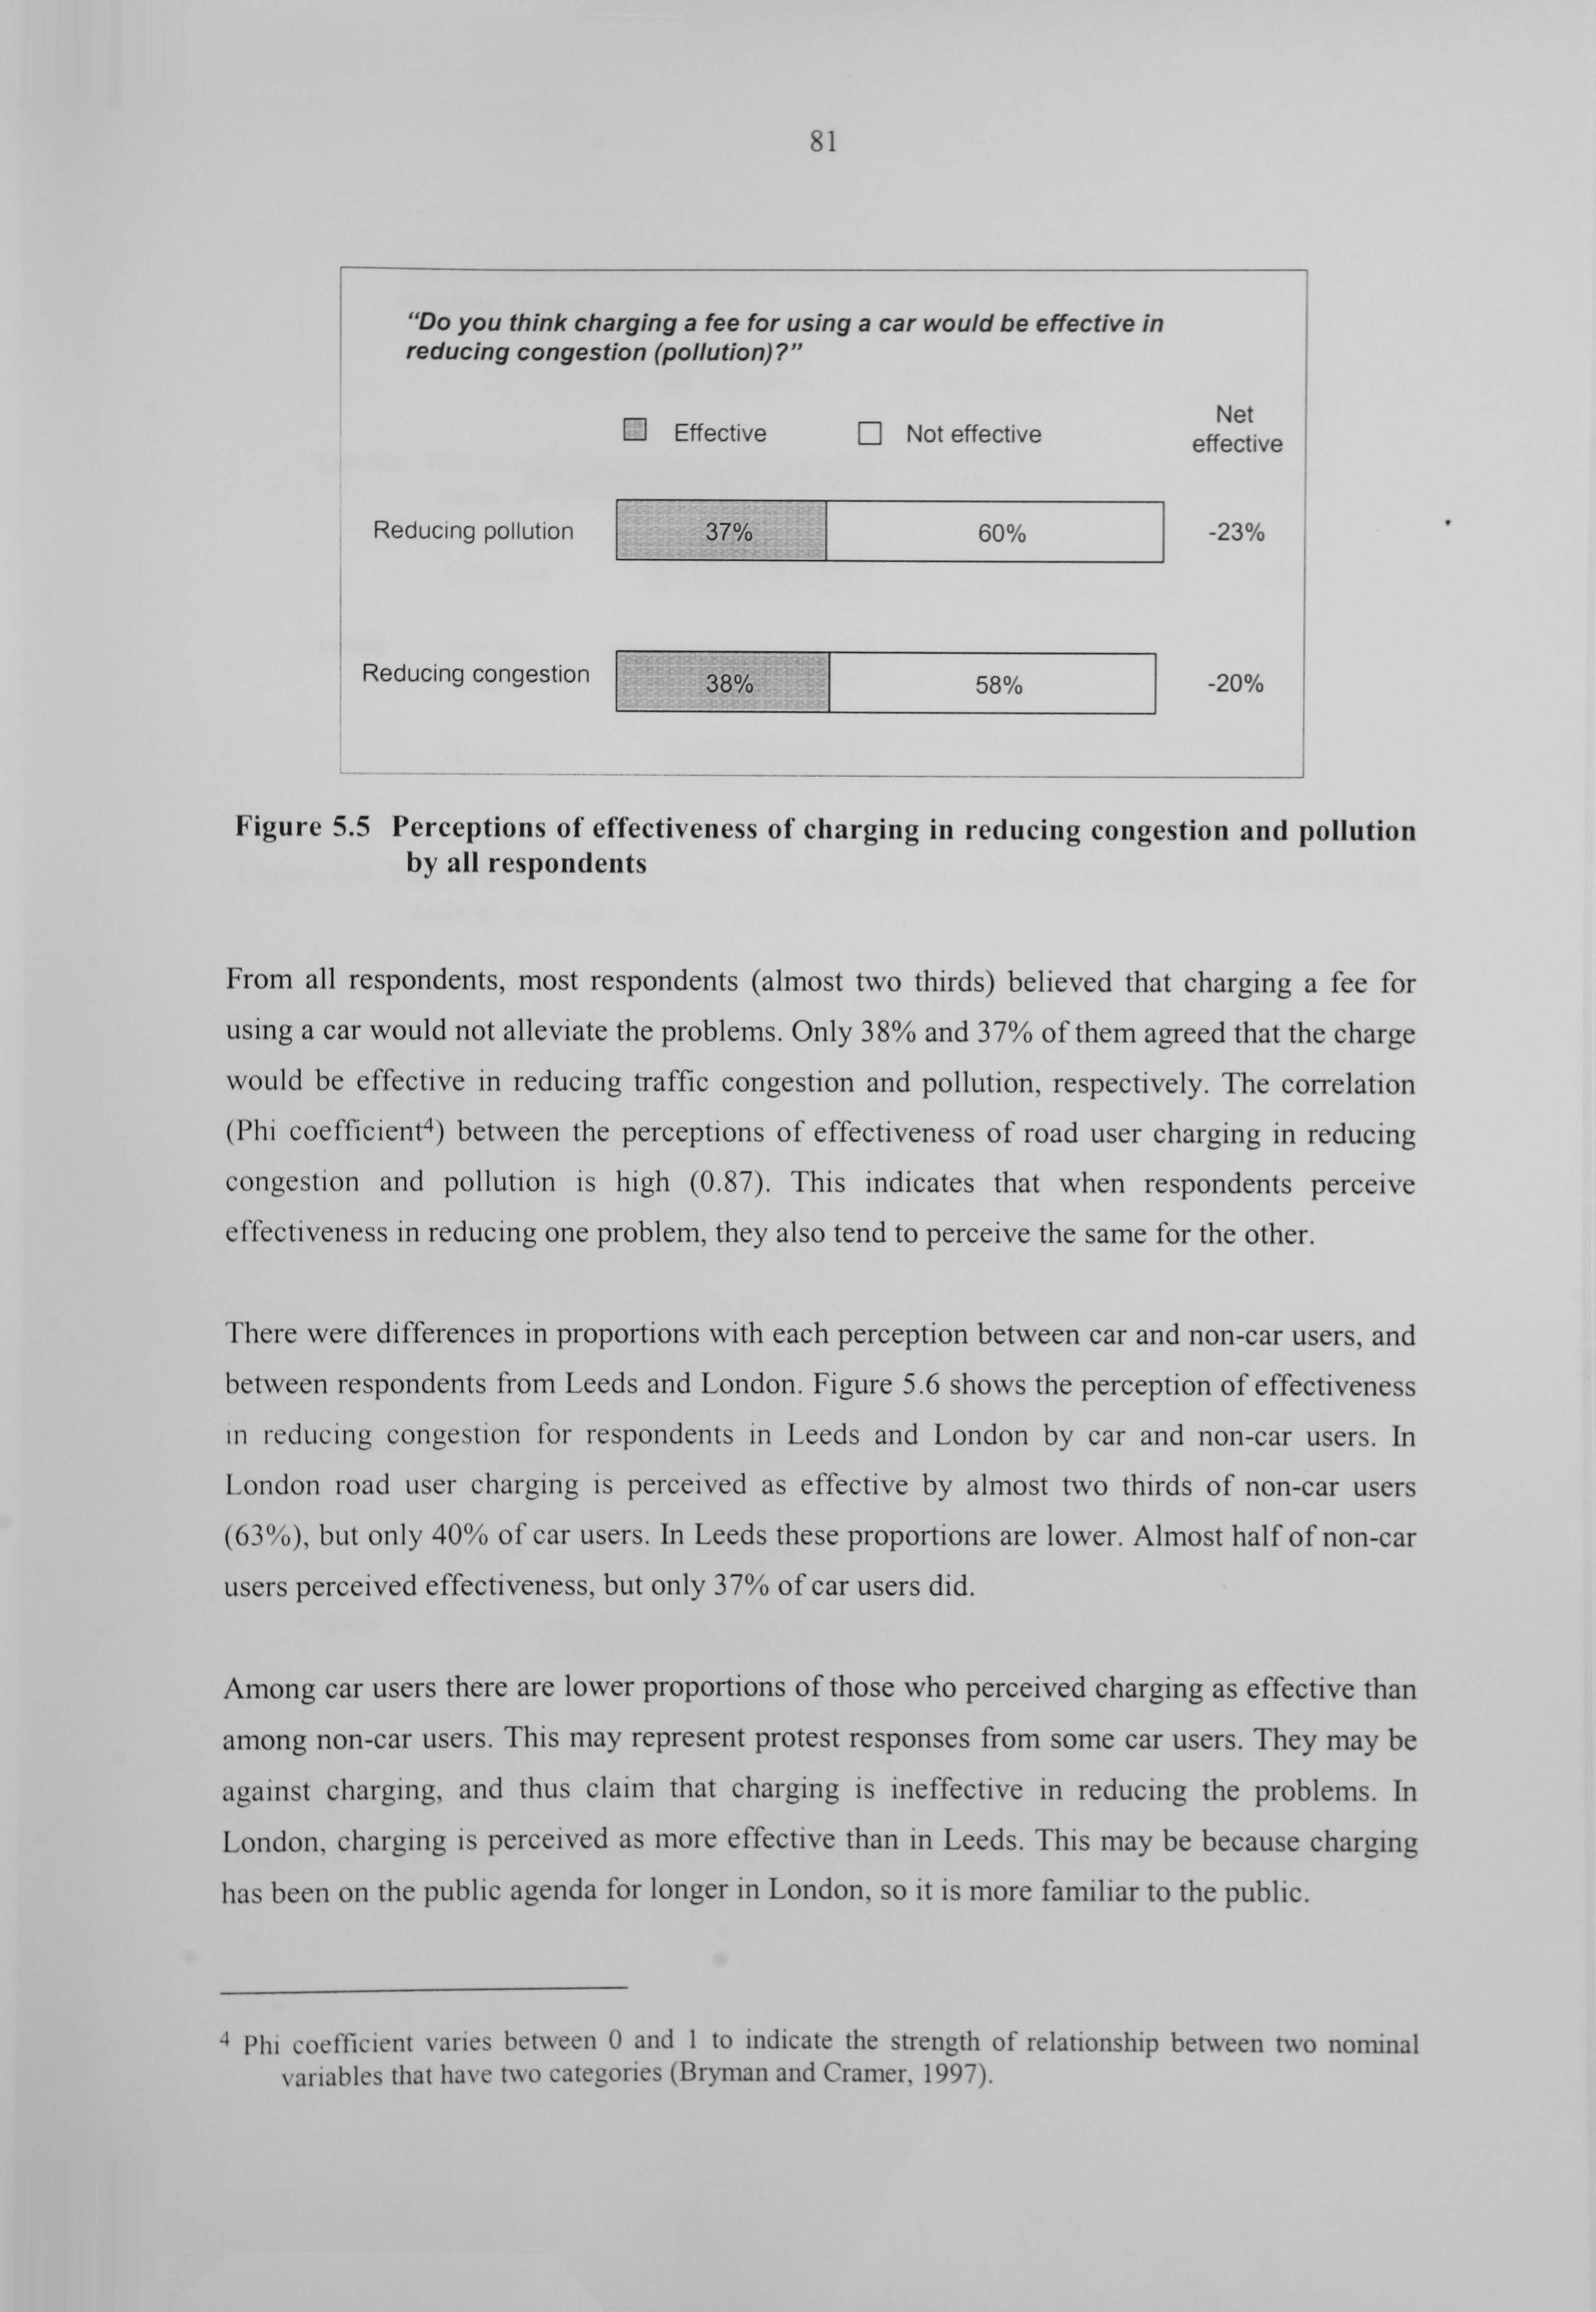
81
"Do you think charging a fee for using a car would be effective in reducing congestion (pollution)? "
Effective Not effective Net
effective
Reducing pollution 37% 60% -23%
Reducing congestion 38% 1
58% -20%
I ---- -
Figure 5.5 Perceptions of effectiveness of charging in reducing congestion and pollution by all respondents
From all respondents, most respondents (almost two thirds) believed that charging a fee for
using a car would not alleviate the problems. Only 38% and 37% of them agreed that the charge would be effective in reducing traffic congestion and pollution, respectively. The correlation (Phi coefficient4) between the perceptions of effectiveness of road user charging in reducing congestion and pollution is high (0.87). This indicates that when respondents perceive
effectiveness in reducing one problem, they also tend to perceive the same for the other.
There were differences in proportions with each perception between car and non-car users, and between respondents from Leeds and London. Figure 5.6 shows the perception of effectiveness
in reducing congestion for respondents in Leeds and London by car and non-car users. In
London road user charging is perceived as effective by almost two thirds of non-car users (63%), but only 40% of car users. In Leeds these proportions are lower. Almost half of non-car
users perceived effectiveness, but only 37% of car users did.
Among car users there are lower proportions of those who perceived charging as effective than
among non-car users. This may represent protest responses from some car users. They may be
against charging, and thus claim that charging is ineffective in reducing the problems. In
London, charging is perceived as more effective than in Leeds. This may be because charging has been on the public agenda for longer in London, so it is more familiar to the public.
4 Phi coefficient varies between 0 and I to indicate the strength of relationship between two nominal variables that have t,, N, -o categories (Bryman and Cramer, 1997).

82
"Do you think charging a fee for using a car would be effective in reducing congestion? "
El Effective
London Non car users
El Not effective Net
effectiveness
Car us(
Leeds Non ca users
Car us(
Figure 5.6 Perceptions of effectiveness of charging in reducing congestion in London and Leeds by non-car and car users
Figure 5.7 shows the perception of effectiveness in reducing pollution for car and non-car users
in Leeds and London. These results are quite similar to the results of the perceptions of
el'tcctiveness in reducing congestion.
"Do you think charging a fee for using a car would be effective in reducing pollution? "
1: 1 Effective 0 Not effective
London Non car 59% 37 users
Net
+22%
Car users 44% 53%
Leeds Non car 52% 48% +4% users
Car users 29% 68% -39%,
Figure 5.7 Perceptions of effectiveness of charging in reducing pollution in London and Leeds by non-car and car users
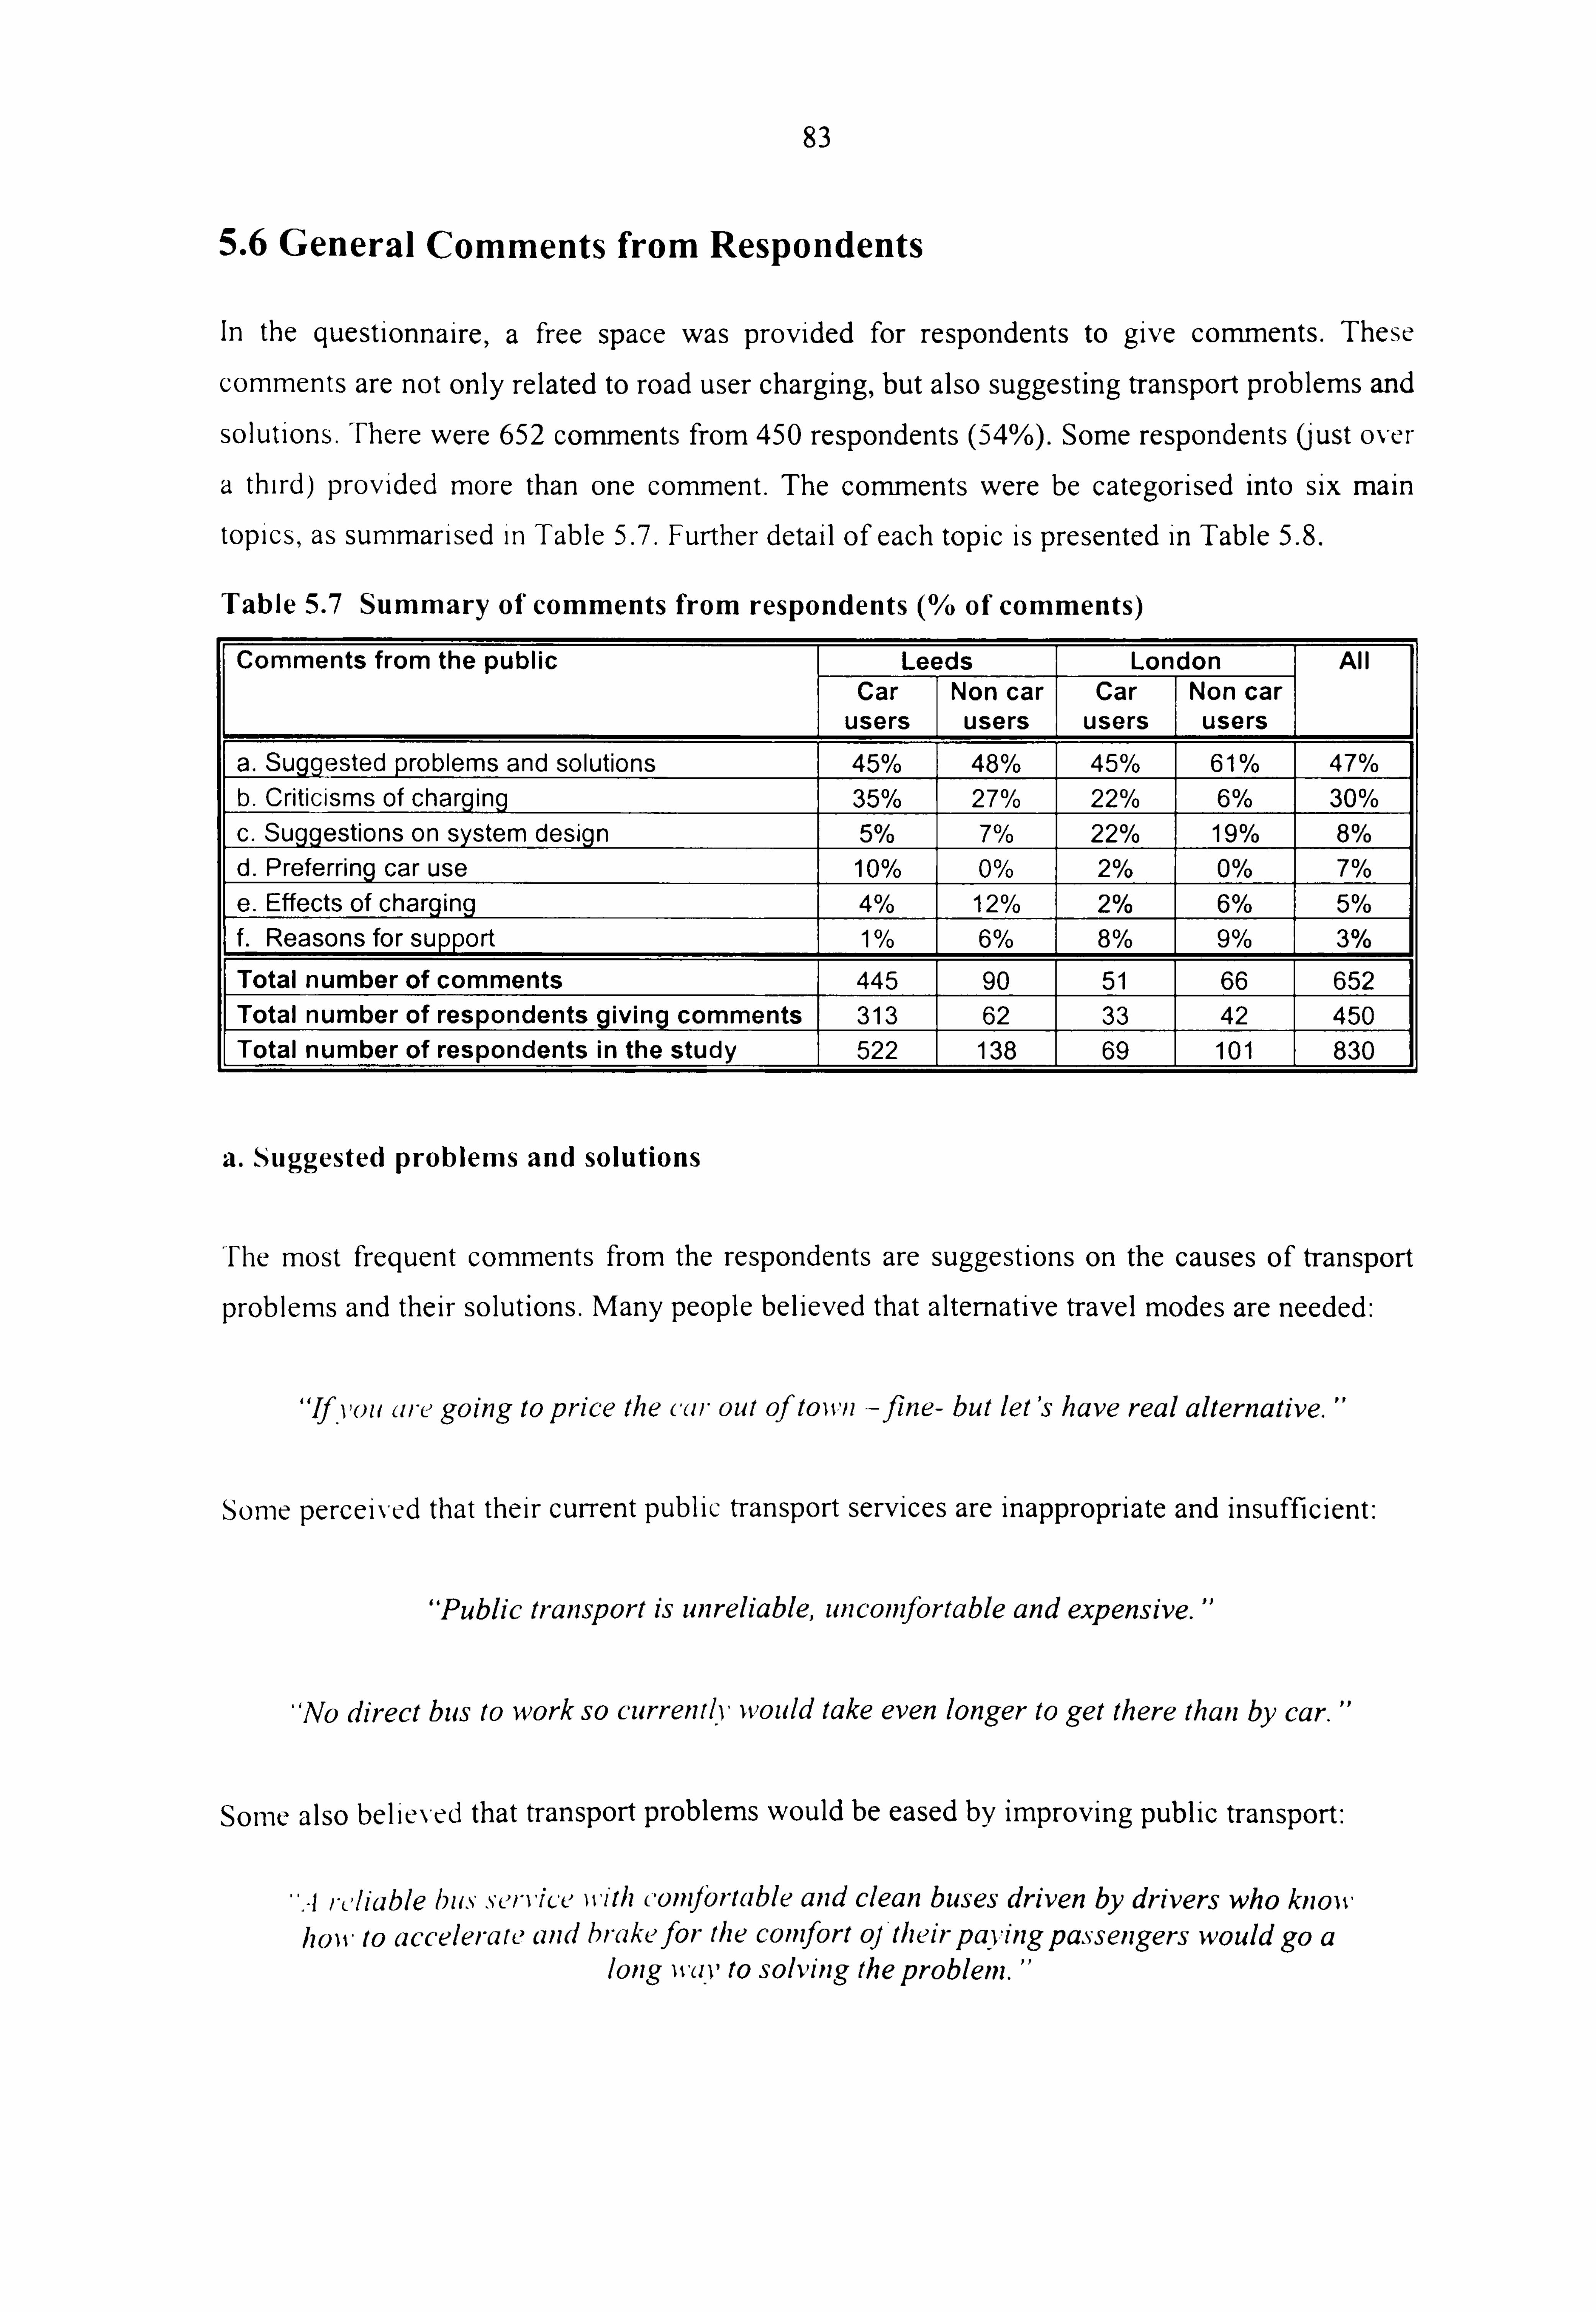
83
5.6 General Comments from Respondents
In the questionnaire, a free space was provided for respondents to give conu-nents. These
comments are not only related to road user charging, but also suggesting transport problems and
solutions. There were 652 comments from 450 respondents (54%). Some respondents Oust over
a third) provided more than one comment. The comments were be categorised into six main topics, as summarised in Table 5.7. Further detail of each topic is presented in Table 5.8.
Table 5.7 Summary ofcomments from respondents (% of comments)
Comments from the public eeds London All Car
users Non car users
Car users
Non car users
a. Suggested problems and solutions 45% 48% 45% 61% 47% b. Criticisms of charging 35% 27% 22% 6% 30% c. Suggestions on system design 5% 7% 22% 19% 8% d. Preferring car use 10% 0% 2% 0% 7% e. Effects of charging 4% 12% 2% 6% 5% f. Reasons for support 1% 6% 8% 9% 3%
Total number of comments 445 90 51 66 652 Total number of respondents giving comments 313 62 33 42 450 Total number of respondents in the study 522 138 69 101 830
a. Suggested problerns and solutions
The most frequent comments from the respondents are suggestions on the causes of transport
problems and their solutions. Many people believed that alternative travel modes are needed:
"Ifyou are going to price the car out of toii,, n -fine- but let's have real alternative. "
Some percei\-ed that their current public transport services are inapproprl*ate and insufficient:
"Public transport is unreliable, uncomfortable and expensive. "
"No direct bus to work so currentlY would take even longer to get there than by car. "
Some also believed that transport problems would be eased by improving public transport:
''A rcliable hus scrilce with coinfOrtable and clean buses driven by drivers who know how to accelerate and brakefor the comfort oj'theirpqvingpassengers would go a
long waY to solving the problem. "

84
it is not surprising that many people mentioned their need of alternatives. In attitudinal surveys,
public transport is always the most preferred solution of congestion for the public (e. g. Cullinane, 1992; Stokes and Taylor, 1995; CflT/MORI, 2000,2001). There are three possible
reasons behind these comments on public transport. Firstly, some people may really need
alternative modes. They would use public transport if services were satisfactory. Secondly,
some people may just attempt to justify their rejection of charging or excuse for using their car. Finally, some people may expect others to use alternatives and relieve the roads for them.
Some people felt that traffic congestion is partly because of parents escorting their children to
school:
" Volume of traffic shows a marked decrease during school holiday time, which indicates the number ofschool-run cars on the road during term time. "
Furthermore, a few comments suggested that congestion can be reduced by other policies, e. g.
enforcing the ban on cars on bus lanes, giving priority to pedestrians and cyclists, increasing
parking charges, banning cars from the city centre and so on.
b. Criticisms of charging
Many respondents believed that charging for using cars is not a solution for transport problems. They thought people will not stop using their car; they will do what they want:
"It would never happen, people won't change the habits of a lifetime even if the ultimate reward would befasterjourneys and less pollution. It's human nature. We
are utterly seUiish. "
"Pricing people out of car is not the way to go. "
One common reason for being anti-charging is that people felt that they already paid enough tax
for using a car, and road user charging was just another tax to raise revenue by the government.
Thus, they thought they should not pay any more for using a car.
"Ipay Road Tax, this would mean an extra tax. "
"I do not agree to any road user charging system in principle. Within Europe alone we have the highestfuel tax. "
"Motorists pay enough. "

85
'"y should Ipay morefor using roads? "
"I will not support any proposal that makes life inore difficult or costly. "
These people are unlikely to agree with the principle of charging, which requires them to pay
more for using cars. They may not understand the reasons why they should pay more.
Moreover, a few people also mentioned that charging is unfair for some groups of the public,
e, g. disabled people, those who use cars very little, those on low income and pensioners.
c. Suggestions on system design
Some respondents provided suggestions about charging system features, which they would like
to see. Some responses mentioned the benefits of charging: reducing pollution and spending the
revenue for improving public transport and reducing tax. Some respondents suggested levels of
charge and exemptions for specific groups e. g. high occupancy vehicles and residents in
charged areas.
"I think a charge will be a great way to get our pollution down. "
"We wouldprqfer a better environmentfor our children. -
"Benýfits would come through subsiding to bus companies that provide services from outside Leeds. "
"Using the revenue to createproper bike and bus lanes which cars cannotpark. "
d. Preferring car use
Some car users felt that the car is essential for their life. They would have some difficulties
\vithout cars. They need it for many purposes, e. g. journey to work, taking children to school
and going shopping, for which they may not prefer to use public transport.
''I I'L, have to accept that the car is the king and one's lifesole is geared to its use. "
''I am an essential car user. "

86
"The car i's a beautifulfreedom. "
"I have to drop my daughter off at nursery. "
These people are less likely to give up using cars. They are dependent upon their car. In turn
they may be less likely to accept any policy that make difficulty for car use.
e. Effects of charging
Some people felt that road user charging would have detrimental effects on others, e. g. on businesses, increasing public transport fares and increasing accidents. They were uncertain
about the indirect impacts of charging.
"If'it (road user charging) was introduced, it would have detrimental effects on my business. "
The schemes wilIjeopardise those business based in the city centre. "
It will drive away business andjobs. "
"Would buses have to pay thefares? If so busfares would increase. "
"The proposal i vould result in being congested on the Outer Ring Road. "
f. Reasons of support
Some respondents stated that they supported road user charging because something has to be
done and because they believe charging can tackle transport problems.
''I Fe have got to have a system of costing cars out of central town. "
"Please do something about traffic congestion and especially pollution, I worryfor mY, children's health. "
"I think a charge of any kind will be a great waY to get our pollution down and to stop roads being as built up with traffi

87
These suggest that in order to improve acceptance of road user charging, the public need to be
coný inced that charging is an effective solution in reducing transport problems, e. g. congestion
and pollution. Chapter 6 looks at whether those who perceive charging as an effective policV tend to accept road user schemes.
Summary
In summary, the comments can be put into three categories.
0 Firstly, those who suggested solutions to transport problems (Comments a; 47% of
comments);
Secondly, those who made suggestions about the design of charging systems and those
who gave reasons why they support charging (Comments c and f, 11% of comments). Their acceptance of charging systems was likely to depend on the benefits and
characteristics of the systems,
0 Finally, those who obj I ected to being made to pay more for using cars, those who were
concerned about the indirect effects of charging and those who had a high preference for car use (Comments b, d and e; 42% of comments). These people were likely to have
stronger feelings of dislike of charging than the first two groups and respondents who did not made any comments.
'rhe respondents who have a strong dislike of charging may be expected to have lower rates of
acceptance than other groups. They may also evaluate and respond to charging systems differently from others. These hypotheses are tested in the following chapters (Chapters 6-9).
In total 450 respondents (of 830,54.2%) provided comments in the open space provided. Of
these, 234 respondents (52.0% of those who provided comments and 28.2% of the total number
of respondents) criticised charging in principle and the detrimental effects of charging, or
showed a high preference for car travel.
The perception of strong dislike of charging Nvas examined whether it was related to the ituation, the perceptions of tra perception of current travel si II nsport problems, the perceptions of
cficctiveness. and personal characteristics. The results of the correlation analysis demonstrated
that the relationship \Nas very low (the Cramer'V coefficients are less than 0.2).

88
Table 5.8 Comments from Leeds and London residents by car and non-car users (% of comments)
Comments from the public Leeds London Car
users Non car
users Car
users Non car users
a. Sugge ted problems and solutions Alternatives are needed 22% 20% 18% 27% Current public transport is not good enough 10% 4% 10% 9% Public transport would solve transport problems 6% 10% 8% 6% Congestion is from school trips 2% 6% 6% 2% Current traffic network should be improved 2% - 2% - Buses make more congestion and pollution than cars 1% - There is less congestion and pollution 1% - More restriction for using or parking cars on bus lanes - - 8% Flexible working hours 1% 1% - - Increasing parking charging 1% - 2% Banning cars from city centre 4% - Priority for pedestrians and cyclists - 5% Encouraging car sharing 1% 2% Encouraging motorbike 3% Increasing road tax and fuel tax - 1%
b. Criticisms of charging Charging is not solution for transport problems 12% 11% 14% 5% Paying enough taxes already or just another tax 9% 3% 2% 2% Against charging or not willing to pay 6% - - - Concerns for disable people 2% 1% - Concerns for less frequent car users 2% 2% - Concerns for low income people 1% 2% - Concerns for pensioners 1% - Unfair 1% 4% Constraining personal freedom 1% -I - How does charging system work? 3% 2%
harging system is expensive to install and operate - 2%
c. Suggestions on system design Pollution has to be reduced 2% - - 3% Revenue should be spent on tax reduction 1% 2% - Revenue should be spent on public transport 1% 2% 4% 6% Combining with public transport improvement - 6% - Charging only on peak time 1% 1% - - Low level of charge - 3% - 3% High level of charge - - - 3% Charging only on solo drivers - 1% - 2% Discount for residents - - 6% - Exemption for residents - 4% -
F- Exemption for motorbikes - - 2% d. Preferring car use
-- Car is essential 9% 2% Charging is a punishme nt to car users i%
e. Effects of charging Affects business 3% 6% People will move out or avoid getting into charged areas 1% - - Charging will cause an increase of bus or taxis fares - 4% 2% 2% Charging will have some indirect effects to other groups 2% - 3% Charginq will cause more accidents - 2%
f. Reasons for support Aqree because something hs to be done - 8% 9% Aaree bec will tackle transport problems 1% 6% - -

89
5.7 Conclusions
This chapter has presented general public attitudes towards transport problems and their current
travel situations for car and non-car user in Leeds and London. These related to perceptions of
current travel situations, perceptions of transport problems (congestion and pollution), and
perception of effectiveness of charging.
Overall, most respondents perceived that congestion and pollution problems in their cities are
serious or very serious, particularly in London. However, many people still perceived their
current travel situations as acceptable. This perception is also likely to be influenced by other factors, not only the perceptions of congestion and pollution. Furthermore, the majority of car
users did not perceive that charging is an effective solution in reducing congestion and
pollution. On the other hand, it was perceived as an effective solution by a majority of non-car
users.
From the general comments, it was found that one main concern was about public transport and
alternatives. Many respondents felt that provision of alternative means of travel is currently not
sufficient and needs to be improved. Furthermore, some respondents who have a strong dislike
of charging were identified. They include those who criticised charging as a solution of
transport problems, those who objected to being made pay more for car use, those who were
concerned at the indirect effects of charging and those who had a high preference for car use. These respondents were assumed to be more opposed to charging than those who did not
provide any comments or who commented on other issues.
In the following three chapters, the perceptions and the strong dislike of charging were
examined to assess whether they influence acceptability and effectiveness of road user charging
schemes. This was based on the hypothesis that those who perceived their current travel
situations as unacceptable, who perceived the transport problems as serious, who perceived
charging as effective and who did not demonstrate a strong di I rging were more of cha
illing to support charging schemes and to reduce their car use than others.

90
Chapter 6
Public Acceptability and System Characteristics
6.1 Introduction
In this research, the questionnaire (described in Chapter 4) was designed to collect the data. This
included the general public's attitudes towards transport problems and road user charging (presented in Chapter 5), and the SP experiment to examine the impacts on acceptability and
effectiveness. The results of analyses of the SP data are presented in this chapter and Chapters 7
and 8.
The objective of this chapter is to test the first hypothesis presented in Chapter I (Figure I- 1), in
which acceptability of road user charging is influenced by the benefits and system features of the charging scheme, as well as personal characteristics and perceptions. The acceptability of
road user charging as influenced by these factors is presented. The logit model (Section 3.3) was
used for analysing the SP data. Acceptability was measured by whether respondents would vote for schemes. This directly measures whether people would support the schemes for
implementation (Section 4.5.1).
The results of voting behaviour based on the conventional logit model are shown in Section 6.2.
The basic model presented was estimated from all respondents from Leeds and London. Section
6.3 demonstrates the effects of personal characteristics and perceptions on the voting. This
explores the extent to which results differ among groups of the public. Section 6.4 examines
variation among individuals which is from unobserved sources and unable to be captured by the
segmentation of respondents according to socio-economi II is ic and trip characteri stics. This i
achieved through the use of the random parameters logit model. Section 6.5 ends the chapter
\vith conclusions about the acceptability of road user charging as affected by the system
characteristics, and personal perceptions and characteristics. A preferred voting model
developed will be used later in Chapter 9 to predict acceptance levels of different groups of
people for various road user charging schemes.

91
6.2 Acceptability Influenced by the System Characteristics
Voting behaviour was analysed using the standard log1t model (Section 3.4.2) in order to
explain the effects of the characteristics of road pricing systems. Hypothetical charging
scenarios were presented to respondents. For each scenario, they were asked whether they
would vote 'yes' or 'no' (Section 4.5). The utility function of vote 'yes' is set as a function of the alternative specific constant (ASC) and the system characteristics, whilst the utility function
of vote 'no' is zero, as follows:
Uy,, s = ASC + 01 (charge) + 02 (car delayed-time reduction) + 03 (bus delayed-time
reduction) + 04 (environmental improvement) + 05 (revenue allocation) + 06
(area of*charge) + 07 (time of charge) + 08 (method of charge)
UNO =0 (Equation 6.1)
ASC is included in order to allow for a preference effect for one alternative over the other, all
other things equal. This ensures that the model can replicate the observed market share, which is
often not equally split between options. In this case, the sign of ASC is expected to be negative because people are likely to dislike any charge regardless of the level that the charge takes.
Level of charge is in units of pence per day. Car and bus delayed-time reductions are measured
in minutes per day.
The remaining variables are categorical data, whose effects can be represented by dummy
variables, relative to a base scenario. If a variable has n categories, n-1 dummy variables would be used. The value given to the dummy variables is one if an observation corresponds with a
specific category, otherwise zero. Environmental change is represented by two dummy
variables- slight and substantial improvement. These would be based on the current situation 'as
iiow'. For the revenue use, there are two dummy variables: revenue allocated to public transport
(100%) and tax reduction (100%). These are compared with the base of equal (50: 50)
distribution. The dummy variable of area of charge is the small area; the base is the wide area. A
clummy variable of time of charge is the morning peak time (7am-10am), relative to the all day
basc (7ain-7pm). For method of charge, there are three dummy variables for distance-based,
time-based and delay-based charge, and the base method is the fixed charge per day.

92
Table 6.1 reports the coefficients and t-ratios of the variables in the utility function of 'yes' vote. The results were analysed from the combined data of the five SP exercises' - This included all 830 respondents from Leeds and London (sample characteristics were presented in Section 4.6).
I wo models were estimated. Model I includes all variables as shown in Equation 6.1. In Model
2, some coefficients which do not have significant effects on the voting are excluded. HoNvever
both models are similar.
Table 6.1 Basic standard logit model of voting behaviour
Variables Model 1 ý Model 2 Coeff icient (t-ratio) Coeff icient (t-ratio)
ASC - vote 'yes' -0.4577 (-4.5) -0.4371 (-4.6) Charge -0.0020 (-9.9) -0.0020 (-9.9) Car delayed-time reduction 0.0210 (5-8) 0.0210 (5.8) Bus delayed-time reduction -0.0031 (-1.7) -0.0031 (-1.7) Environmental improvement: based on as now
............................................................ ..... I I., ........................................................... .... . ....... ... ............ . .... .... ............. ......... ........... --- ............. . .................. . .... . ....... . ....................... ....................... ..... ............ .... ..... . ............... ... . ................. Environment: dummy.. for. slightl 1 ................... - .......................... . ... ............. .......... ..... .
y. im. p. roved ......... ....... -............... ..... ... -0.0.1.03 (-0... 1. )
......... ....... ............ ................... .... ............ I ........ ...... ........... .... . .............. Environment: dummy for substantially improved 0.6415 (3.7) 0.6190 (3.7) Revenue allocation: based on 50: 50
. . . . . . . . .. . . . ... ... .......... .... ... . ......... ... .. . .......... ........... ...... ........... . .... .. .... . I .................... -- ...................... I ................ ..., I ..... ...... . .. ....... . ................. . ......... ... .. .. ....... Revenue: dummy for. public transport.. only .......... I., ................ - ................... .I... ............................ I .......... .......................... .......
. . .. . . . . . . .............................. -- ......................
.. .. . .. . . . Revenue: dummy for tax reduction only 0.1694 (0.9) Area of charqe: based on wide area
.................... I. - -- ............................................ ... ..................................... ................................... . ......... ......................... ummy for small area Area: d 0.5610 (4.0) 0.5385 (4.0) . Time of charge: based on all day
................ ........ ............ ........ .......... ............ -- ........... . Time- dummy for peak time 0.1255 (0.9) Method of charge: based on fixed charge
... ....... .............. I ............. ............ et od: dummy distance-based . ... ......... . . 1.2713 (-3.8)
........ .... I ................... -1.2926 (-3.9) I .......... -1-1 . ........ I Method: dummy time-based
II....... ..... ...... ... ý. I ...... ................ ... . 0.8805 (-3.3) ............... I .............. .. -0.. 901.. 7. (-3.4).....
... ...... . .......... Method: dummy delay-based -0.6598 (-2.5) -0.6811 (-2.6) No. of observation 2887 2887
_ P2 with respect to constants 0.0498 0.0493 - Log likelihood at convergence -1636.9940 -1637.8406
Fhe results show that the ASC has negative sign, indicating that in general the charging system
is not acceptable to the public. Even at a very low level of charge, for example at lp per day, the
model predict that 39% would vote for the base scheme. This may be because some people disagree with the principle of the policy, so there are protest responses.
The le,,,, cl of charge has a significant negative effect on the acceptability, as expected. Road user
charoing systems would be less acceptable if the level of charge Increases. Its t-ratIO is very
model was analysed for data from each SP exercise. This found that the scales were similar for the constrained variables (charge and car and bus delayed-time reductions); it was appropriate to combine the models.

93
high, significant at even at 99% confidence level. It is the most precisely estimated effect in the
model.
With regard to the benefits of the system, car delayed-time reduction has a posItP, 'e significant
effect at 95% confidence level. When the charge increases by f 1, the decrease In the acceptance level can be compensated by 9.5 minutes per day of car delayed-time reduction, giving the value
of delayed-time equal to 10.5p per minute. This value is relatively close to the value of time
reviewed by Wardman2 (200 1 b).
The effect of bus delayed-time reduction was expected to be of positive sign, but was in practice
negative. This is possibly because some people, e. g. car users, may not accept that car use is
charged in order that bus journey time is reduced, in other words they may not accept reducing bus journey time reduction as a legitimate goal of car use charging and may not perceive any
personal benefits. Some may feel that reduction in bus times can only be achieved by limiting
car use and space; this would be detrimental to them. However, the effect is not significant at 95% confidence level.
Although the effect of a slight improvement in the environment does not significantly improve
acceptability, substantial improvement has a significant positive effect. This improvement is
valued as equal to 321p per day. This implies that, on average, people are willing to accept a
charge up to 32 1p per day if the environment is significantly improved.
The effects of using the revenue for public transport (100%) and tax reduction (100%) are not
significantly different from the effect of the base scenario in which revenue is equally allocated (50%: 50%). Although previous research found that revenue used both to improve public
transport and to help to reduce tax is significant in increasing acceptance levels (CfIT/MORI,
2000,2001 ), the result here shows that different proportions of use of revenue for public
transport improvement and tax reduction are not significantly different in affecting
acceptability. This is possibly because people have different opinions in using the revenue; there
is no consensus on a single use. The result is similar to a study in USA by Harrington et al.
(2001), who found that support for charging schemes does depend on tax rebate, but does not
var\, across percentages of revenue return.
2 Wardman (2001b) provides a model (formed by a meta-analysis from a large number of previous studies) for estimating UK values of time. Based on this model, the value of time is 6.8 p/rnin in year 2000 for
Commuters travelling 10 miles. The value of delayed-time is about 1.4 times higher than the value of time (Wardman, 1991,2001 a), so the %'alue of delayed-time should be around 9.5 p/n-un.

94
For other system features, small-area charges (within the Inner Ring Road) positively affect
public attitudes, compared to wide-area charges (within the Outer Ring Road for Leeds and the
North/South Circular Roads for London). This indicates that a charge in a small area is more
acceptable than a charge in a wide area. This is possibly because people feel that it is only the
city centre that is congested and there is no need to charge car use in the whole city. Some
people who can avoid travelling in the small area may also expect some benefits to themselves
without being charged.
For the effect of charged time, support for the morning peak-period (7am-10am) charge is not
significantly different from support for the all day (7am-7pm) charge. This may be because
most car commuters would find it difficult to avoid the charge in these time periods and non-car
users would find no difference between the times of charge.
The effects of the three variable charging methods have negative signs and significant differences from the effects of the fixed charge. This indicates that the fixed charge is the most
acceptable form of charging. This is probably because people prefer to know how much the
charge would be before travelling, as found by Bonsall and Cho (1999). Some people may be
concerned on safety for time-based and delay-based charges which tend to influence speeding,
in turn increasing risk of accidents, as found by Bonsall and Palmer (1997).
6.3 Acceptability Variation among Groups of the Public
In Section 6.2, the model was analysed for the whole sample. However, different groups of
people are likely to respond differently when they evaluate charging schemes (for example car
users are expected to be more opposed to the charging systems and also more sensitive to
increases of charging levels). To test this, segmentation analysis was applied on the basic model
in Table 6.1. Incremental effects (Section 3.4.3) for each group of respondents on the basic
e ft ccts xvcre estimated. Respondents Nvere segmented by personal characteristics (Table 4.4):
mode use, household income, age, gender and location. They were also categorised by personal
perceptions (Table 4.5) on: the current situation, congestion and pollution problem,
eftectiveness in reducing congestion and pollution, and the strong dislike of charging.
'rhe incremental tI actors, representing the differences among the segments, were applied in Fquation 0.1. Fhree models separately identified the potential effects in the ASC alone. in

95
coefficients of the charging system characteristics (Xd alone, and in both the ASC and
coefficients of the characteristics.
The effects in ASC
The differences between groups of respondents could appear in the constants of model; each
group has its own constant, indicating its specific preference, as shown In Equation 6.2. ASCb IS
a constant for a base group, while ASC is the incremental factor for a specific group y. The d, Y is the dummy variable to identify observations. If an observation is categorised as y, d, is one
and otherwise is zero. Therefore, ASC for the group y is ASCb+ ASCý,,
n-I UyEs = (A SCb +Y ASC, -. d,, ý+ LK Ok
. Xk (Equation 6.2)
The effects in coefficients of the charging system characteristics
Different groups of people also could have different coefficients for the variables representing the charging system characteristics (Xd. Each group has its own coefficients, indicating different degrees of sensitivity to the variables, as shown in Equation 6.3. The yy is the incremental factor for the specific group y. Thus, the coefficient of variableXkfor the group y is OK + y, This can be applied to every variable in the model.
n-1 U)
Es =A SC +ý IA Ok - Xk + yy .
dy .
Xk
Y=l
(Equation 6.3)
The effects in both the ASC and coefficients of the charging system characteristics
The third model combines the first two models together, in order to present the effects of
personal characteristics and perceptions in both the ASC and coefficients of the charging system
characteristics, as shown in Equation 6.4.
11-1 n-I ( fk Oik -
Xik + Y,. . dy . Xi k, (Equation 6.4) U),,
-, s ---: ýASG + AS(ýV. d, +I
Y=j
The first tN\,, o models (Equations 6.2 and 6.3) were used to estimate the potential effects for each
segment separately. Table 6.2 summaries the results of the model goodness-of-fit indexes (p 2).
The table also illustrates which incremental factors are significantly different (at least at 90%

96
ing ý: onfidence level) from a base group for each personal characteristic and perception, ndicati by 'V'. Between the two models for each segmentation, the results Indicate that the model
showing the effects in the constants is as good as the model showing the effects in the variables (p' are only slightly different). They show that the personal characteristics, except income, and the perceptions can help to improve the basic model in explanation of the voting behaviour (the
P2 increase from 0.0498 which is the P2 of the basic model). This demonstrates that, besides the
system characteristics, acceptability is also influenced by the personal characteristics and
perceptions, particularly mode use, the perceptions of the problems and the perceptions of the
effectiveness of the schemes (all of which provide a substantial increase in the p').
These models identified separately the potential effects of personal characteristics and
perceptions on voting, and distinguished separately the effects in the ASC and charging
characteristics. By using the combined model (Equation 6.4) the effects were presented in a
model. This was done step by step. First, only the significant effects of the personal
characteristics were included. Second, only the significant effects of the perceptions were
inclLided. Then all were combined. For each combination, three models were estimated. One
addressed the effects of segmentation in the constant and another one in the variables. The third
model dealt with both at the same time. This combined model is based on Equation 6.4, in
which the incremental factors are included for both the ASC and charging characteristics.

97
u 0
m *Z:
"C
44Dz
w
.M
CN C%4 LO NT CV) CO T-- C) co CII) U') c1r) T-
ICT 00
Iq rl- LO
LO LO
m fl-
co (D
C) C
00 04 Lf')
CN 00
C) C) 0 C) C) C) C) C) 6 6 6
zo o 6 C; C;
0 0) 0m \> \> \>
0 a)
(1) 2)
0 CY)
CD L- (L) Co
M. <0 .r (D I I I m C: >
.2
-
m c
W > (1) ct
U) E o
U. c 0
w
-6 co
in
-6 'o a) a) -- co >, E (J co = :3
z ýo
cu
U) ýý QD
(D 6
co CY)
U') CN
u CY) 00
00 Lo
" (. 0 LO
(D Itil
N ICT
T- Ict
T-
CY) C) co
LD (N (N 00
CD r-- C) a) LO
C) U ) C)
I, - C)
co C)
CD c1r) LO C: )
co C) a C) ci C; 0 C) 6 C; C; 4.0 :3
U cr w
\> \> \> \> 0z < LL
E E C:
0 2 0 cu Q. 2 co 0 cn co 0 0
U) :3 : t-_ U)
C: 0 CL 0) c
(1) c cm c
I L. U) r_ 0 c 4- U) Q)
L- 0
Q) >
(D 2 A-
2) cz
u 0
CL (D L- L-
0) c
=3 L) a) a) c L)
a m m
c 0) U
:3 0 U
0 0-
cn (L) Q)
tt-- o a) 0
0 0 0 0 0C 0 Q) ýd
m L)
CL c C:
0 c 0
0 c 0
0 c CL 0
- -rn c 0 Q)
E . c
cm E -0 . m 0 a) a c C) w a) 0u w c 0 4)
CL 0
T- 0 u
c < (L a- 0- a- ýo
a-
(J) (D
Jo
c 0 cu
c
W
E 0) (D
0
Y)
-C
(D
7a-) -. 0 >0
Cu o -0
C -0, tr-- c C a) 0E
0 -0
0)
U)
-C cu m
Co (1) , -o CD
M E
CO 7T)
.E CU
. 2) CL C/)
.5 co a) .r3. (n 0 (D 0) co -0
0 E
T-- 04
0) 0
z

98
Table 6.3 presents the p' of models when combining the effects of personal charactenstics and
perceptions. The combined models are very much better In explamIng the voting behavlour than
the basic model (indicating by substantial increases of the p2). The P2 of models combining the
personal perceptions are more than the P2 of models combining the personal characteristics,
indicating that the perceptions have more Influence on acceptabIlIty than the character, stIc s. The
models are even better when both are included. The results also demonstrate that the models in
which the incremental effects based on the constants and variables are better than those based
on either of them alone. In conclusion, the combined model reflecting the effects of both
personal characteristics and perceptions in both the constant and variables is the best (achieving
the highest p' at 0.2107). The likelihood ratio test (Section 3.4.3) also confirmed that this model
is significant better than the other combined models.
Table 6.3 P2(C) of voting models segmented by personal characteristics and perceptions
Combining the effects P2 (C)
Combining the Combining the Combining the effects in the effects in the effects in both the
ASC alone variables alone ASC and variables Combining the effects of
personal characteristics 0.1334 0.1338 0.1443
Combining the effects of 0.1590 0.1753 0.1894 personal perceptions
Combining the effects of both personal characteristics 0.1911 0.1952 0.2107 and perceptions
'Fable 6.4 presents the preferred model of voting behaviour segmented by personal
characteristics and perceptions. This model, which identifies sources of differences across the
respondents, is substantially better than the basic model in explanation of the voting behaviour
(shown in Table 6.1). This is indicated by the increase of p' from 0.0498 to 0.2107. The
likelihood ratio test (Section 3.4.3) was used to compare the segmentation model in Table 6.4
and the basic model in Table 6.1. The test is that twice the difference between the log likelihood
\ia]Lies of the models at convergence (for example for Model 1: 2[(-1074.1301) - (-1636.9940)]
- 1125.7) is higher than a X, 2 critical value of 18.5 for 7 degrees of freedom (the number of
parameters imposed on the basic model is restricted to being equal to zero under the null hypothesis), indicating that the segmentation model is statistically superior even at the 99%
confidence level.

99
Table 6.4 Standard logit model of voting behaviour segmented by personal characteristics and perceptions
Variables Model 1 Model 2 Coeff. (t-ratio) Co2! LLt-ratio)
ASC-base -1.0471 (-6.8) -1.0014 (-6.9) + incremental effects If individual is non car user 0.8363 (6.9) 0.8379 (7.0) if current situation is perceived as unacceptable 0.3837 (3.3) 0.3868 (3.4) If congestion is perceived as very serious 0.7089 (3.3) 0.7048 (3.3) If the scheme is perceived as effective in reducing congestion 0.5018 (2.3) 0.5024 (2.4) If individual has strong dislike of charging -0.5645 (-4.1) -0.5567 (-4.1)
Charge-base -0.0027 (-9.4) -0.0027 (-9.4) + incremental effects If age is 55 or over -0.0015 (-5.0) -0.0015 (-5.0) If pollution is perceived as very serious 0.0020 (7.7) 0.0020 (7.8)
Car delayed-time reduction 0.0120 (2.4) 0.0119 (2.4) Bus delayed-time reduction -0.0023 (-1.0) -0.0022 (-1.0) Environmental. improvement: based on as now Environment: dummy of slightly improved
.................... I ........... . .......... I .................... .......... ............ . ..... .......... ............. ................. .................... .............. ....... ..... . 0.0790 (0.3)
............... . .................. . ........... I ............... ....... .. . .......... .... -- ----- Environment: dummy of substantially improved 0.6721 (3. 0.6230 (2.9) Revenue allocation: based on 50: 50
-'* .......... .. *..... ........... ... - -- *"-.. ... ........ .............. * ** * ........... **............. .... ..... ..... ................ ......... .... ... venue: du. mmy, for.. public transport ..................................... .................. ........ ........ ............. .................................... . .... . ... ........ I ................... ........... ........... ......... -0.0473 -o.. 2
. ...... .. ................ .......................... .. (
.... ... ..... ...... ..... .... ..... . .... Revenue: dummy for tax reduction 0.2831 (1.2) Area of charge: based on wide area
...... ....... --- ................. ..... ....... ............... ................... - Area: dummy for small area 0.7507(4.2 0.7015 (4.1) Time o, f charge-. Pased-99 all, O. ay
. ... ... ............... -I.... --. 1.1 ............. .... ..... ... .. -.. .............. - Time: dummy for peak time 0.1975 (1.1) Method of charqe: based on fixed charge
......... . ..................... I ........................ 11 ............. ................ ..... I ......................... .......... . ....................... ................... ......... 11 ................... Method: dummy distance-based I ..... ........... 11,1 .................... 1- .................... ........... .................... -1.1508 ........... .......... ...............
(-3.0) ........ ........ . .... . .......... --- ------- - .... . ..... Method: dummy time-based
. ................. II..................... I ........... l.. 1974 (-3.4) ...... .............. . .... . ...... ........ . ........ .......... -1.2441... (-3.5)
..... -- .... . ...................... -. I Method: dummy delay-based -1.0617 (-3.4) -1.1077 (-3.5)
No. of observation 2277 2277
P2 with respect to constants 0.2107 0.2098 Log likelihood at convergence -1074.1301 -1075.3054
Two models were estimated. Model I includes all variables as shown in Equation 6.1. In Model
2, some coefficients which do not have significant effects on the voting are removed. However
both models are similar.
Fhe estimation model shows that the incremental effects of some segments are significant for
the alternative specific constant (ASC) and the charge. The incremental effects which were not
significant at the usual 95% confidence level were excluded from the model.
In model, the effects of the system characte istics shown are generally s1mllar In the segryientat oni
to their effects shown in the basic model. Moreover, the segmentation model also presents the
effects Of'personal characteristics and perceptions.

100
The model shows that the ASC has a negative effect. This indicates that in general charging is
not preferred by the public. However, the effects are different for different groups of
respondents. The incremental factors show that some people have a less negative attitude to the
charging systems, but some have a more negative attitude. The results reasonably demonstrate
that charging would be more acceptable to non-car users, who would not be charged. It is also
more acceptable to respondents who find their own current travel situation unacceptable, who
perceive the congestion problem as very serious, and who perceive the charging schemes as
effective in reducing congestion. These people would expect some benefits from the charging
schemes. However, as expected, charging is less acceptable to people who have a strong dislike
of charging, since they may oppose the principle of charging, as well as object to paying more for using their car.
Increasing charging levels would clearly have a negative effect on acceptability. However, some
groups have different sensitivities to the charges. At the same rate of increasing the charge,
when all other things are equal, those who are 55 or older are more averse to charging than
others, but those who perceive pollution as very serious are less sensitive. This means that in
order to retain the same acceptance level elderly people would need more compensation, but
people who perceive pollution as very serious need less than the others.
Acceptance levels would fall in elderly people more than in other groups, when the charge
increases. Most of them do not travel to work and have a higher proportion in the low income
group than other ages. Acceptance levels in people who perceive pollution as very serious are less sensitive to the charge than other people, possibly because they agree that the policy needs
to be implemented in order to reduce the problem.
Surprisingly, different groups of income have no different sensitivity to the charge, though ones
might expect that higher income people are less sensitive than lower income people. This may be the case only if higher income people expect higher benefits. However in the next chapter, Section 7.3.2, the result shows that there is no (significant) income effect on the perceptions of both personal and social benefits.
The rest of the charging system characteristics retain similar effects on voting as in the basic
model (discussed in Section 6.2). Only the effects among the variable charges on acceptability
are slightly different. This result does not confirm the results in the previous section in that
distance-based charges are the least acceptable. It is uncertain which method is the most
unacceptable, nevertheless, it is certain that they are all considerably less acceptable than fixed
charges.

101
Some factors: having car(s) in household, location of respondents household and perception of
effectiveness in reducing pollution do not show significant effects on the acceptability, though
their effects are significant in the separate segmentation models (shown in Table 6.2). This is because they correlate with the other factors, so that there are cross-effects. For example, having
car(s) in households show a significant effect in the separate model, but the effect is not
significant in the segmentation model. This is because most of those who have car(s) are car
users. Thus, the effect of having car(s) in the separate model is actually reflected by the effect of
mode use (the model segmented by mode use has higher P2 than the model segmented by having
car(s)). When they are combined in one model, only the effects of mode use are included (giving the best fit model). Similar to the other factors, there is also a high correlation between
mode use and location (high proportion of car users in Leeds, but low in London), and between
the perceptions of effectiveness in reducing congestion and pollution. Their effects on
acceptability can be expected to be similar.
Furthermore, the effects of some system characteristics (bus delayed-time reduction,
environmental improvement, area of charge and method of charge) are different among different
groups of people in the separate models (shown in Table 6.2). However, when the separate
effects in the ASC and in the variables are combined in the final model (in Table 6.4), the
effects on the variables are not significantly sensitive to the different personal characteristics
and perceptions. Only the effects in ACS are significant. This is because different groups are not different in evaluating the charging characteristics, but they are different in assessing charging
schemes in overall, indicated by the significant effects of the incremental factors of the ASC.
1,. xcept for the effect of charging levels, there are differences between the age groups and between the perceptions of congestion problem.
In sunu-nary, the results demonstrate that acceptability is clearly more influenced by personal
perceptions than personal characteristics. In addition to mode use and age, other personal
characteristics: location of respondents' household, gender and surprisingly even income do not have significant effects on acceptability. On the other hand, acceptability is highly influenced by
pet-sonal perceptions including: perception of current situation, perception of transport
problems, perception of effectiveness of charging and the strong dislike of charging. These
results are similar to the findings of Rienstra et al. (1999) in their study of the support for
transport policies in the Netherlands, and Schade and Schlag (2000) who examined the
acceptability of transport pricing in European cities (AFFORD Project), in which support for
channi-ig, is clearly intlueiiced by perceptions of problem and effectiveness, and to a lesser
extent by personal chai-actei-istics (including income).

102
6.4 Acceptability Variation among Individuals
In the previous section, variation of voting behaviour among respondents was addressed by the
segmentation analysis. Some sources of dIfferences from personal charactenstics and
perceptions were identified. The segmentation model in Table 6.4 was substantially improved from the basic standard logit model in Table 6.1. However, taste variation among individuals from unknown sources may still be included in the model.
To cope with this, the random parameters logit model is applied to the segmentation model. The
random parameters logit model allows coefficients to vary across individuals within the sample. Mean coefficients, assuming a normal distribution, and standard deviations of random
parameter distribution were estimated. The standard deviation is for indicating whether a
parameter significantly varies among respondents, (Greater details about the model are
explained in Section 3.4.3. )
However, all variables in model should not be treated as random. Ruud (1996) pointed out that
the random parameters logit model tends to be unstable when all parameters are allowed to vary. This led Revelt and Train (1998) and Hensher (2001c) to avoid the instability by fixing
coefficient of cost, while allowing the other coefficients vary. They chose to fix the cost
parameter because it is convenient for interpretation of the model, in which a value of time
would be distributed the same as the parameter of travel time.
The random parameters logit model (obtained from the LIN4DEP programme) is shown in Table
6.5. This model is based on the segmentation model, but explores variations of parameters
aci-oss indi\, iduals. The coefficient of the charge is fixed, while the others are random. Overall,
this model is not significantly different from the segmentation logit model in Table 6.4. The
goodness-of-fit index (p) increases slightly from 0.2107 to 0.2129. The likelihood ratio test
(Section 3.4.3) is that twice the difference between the log likelihood values of the models (5.9)
is not higher than aX2 critical value of 18.55 for 12 degrees of freedom, indicating that the
random parameters logit model is not statistically better than the segmentation model at even
the 90% confidence le\'el.

103
Table 6.5 Random parameters logit model of voting behaviour segmented by personal characteristics and perceptions (based on 100 Halton draws)
Variables Coeff. (t-ratio) Std. (t-rat! 2L ASC-base -1.2597 (-4.4) 0.9803 (1.6) + incremental effects If individual is non car user 0.9467 (5.8) - If current situation is perceived as unacceptable 0.4459 (3.11) - If congestion is perceived as very serious 0.7480 (2.9) - If the scheme is perceived as effective in reducing 0.5608 (2.2) - congestion if individual has strong dislike of charging -0.7534 (-2.4
Charge-base -0.0030 (-6.8) - + incremental effects If age is 55 or over -0.0017 (-4.5) - If pollution is perceived as very serious 0.0023 (6.0) -
Car delayed-time reduction 0.01438 (2.2) 0.0016 (0.1) Bus delayed-time reduction -0.0027 (-0.9) 0.0009 (0.1) Environmental. improvement. based on as now
......... . .. Environment: dummy.. of sl. ightly improved ............. I .................. II............................... ............ ....... ....... .... ............. --- ............. ............................. ........... ..... - ............ - -0.1206.. _(-O..
3) .......... ............................. ......... ........ .........
11,1522 (11.11) ý Environment: dummy of substantially improved 0.7906 (2.7) 0.1761 (0.3)
Revenue allocation: based on 50: 50 .................................................. ...... ..... I ................................... ........ ........ I ... .......................... ....... . . ....... . ... ..... ..................... .................. ........................ ............... . .......... ............ . ................ .... . I I II .... .. ..... ... .. .... . I Revenue: dummyj r p. ublic.. transport
........................... ................... ........................... . .... ...... -- ........... ........................ ........................................................ ......... ............. -0.3279 (-0.6) .......... ...................... . ......................... . ......... ....... ..... ...
l.. 6000 (11.74) ..... . ...................... Revenue: dummy for tax reduction 0.1674 (0.5) 1.2417 (1.3)
Area of charge: based on wide area ............ - .................. ..... ......................................................... ............. I. ................................................ ................... Area: dummy for small area 0.8474 (3.3) 0.7140 (0. §H
Time of charge: based on all. day ........ ................................ ....................... .......................... ....................................................................... Time: dummy for peak time 0.1669 (0.6) 0.6494 (0.8)
Method of charge-. . based on fixed charge
...... ... ... .................................................................... ... Method: dummy distance-based -1.5032 ý(-2.11. )
............. .... 0.. 8385 (0.6) ...... ....... ..................... I ............... .......... Method.: dummy tirrie-ba-se. d. -1.. 4-34115 (-3.0) 9.7.1-03 1..
...... ....... Method: dummy delay-based -1.3795 (-2.7) 0.7518 (0.7) No. of observation 2277 P2 with respect to constants 0.2129
ikelihood at convergence _L__ -1071.163
The results show that no standard deviations of the random parameters distributions are
significant at 95% confidence level, indicating that the parameters' coefficients do not vaiy
significantly across the individuals. Furthermore, the analysis also attempted to test whether
there is a taste variation in the charge parameter. When the charge parameter was allowed to
vary and the time parameter was fixed instead, the standard deviation of the charge parameter distribution was also not significant. Therefore, a significant taste variation among individuals
i ics was not found. The of the model in evaluating the charging characteristi II results for the cffects of the variables on acceptability is the same as of the segmentation model.
Ne\'erthcless, the standard deN, lation of distribution of the ASC is relatively high, compared to
its coefficient. The t-rat o of the standard deviation is also not very low, though it i IIIi is not
-significant at 95'/'o confidence level. The distribution of the ASC indicates that acceptability in

104
general is fairly different among individuals. Furthermore, the analyses also tested for the case
that only the ASC was allowed to vary and other parameters were fixed. It found that the results
were similar to the model reported in Table 6.5.
In addition, a log-non-nal distribution was applied to the coefficient of car delayed-time
reduction, which can be expected to be always positive. The results of its mean coefficient and
t-ratio retained similar as assumed to be normally distributed. Its standard deviation was even lower. Overall this model was similar to the model in Table 6.5.
In summary, the results of the model show that the taste variation among individuals is not
significant. By using the likelihood ratio test, it is found that the random parameters logit model
is also not significantly different from the segmentation model in Table 6.4. Therefore the
scgi-nentation model with fixed coefficients can be used in prediction of acceptance levels of
road user charging schemes (in Chapter 9).
6.5 Conclusions
This chapter has tested the hypothesis that the acceptability of road user charging is influenced by the benefits and system features of the charging scheme, as well as personal characteristics
and perceptions. The results presented are from the analyses of the SP data based on the logit
models. Not surprisingly, it was found that acceptability is highly sensitive to the level of
charge: the higher level of charge, the lower acceptance. However, this can be improved by
increasing the levels of environmental improvement and car delayed-time reduction. Bus
delayed-time reduction was found to have no significant influence on acceptability. Charge
within the city centre is more acceptable than in the wide area. A fixed charge also is
significantly more acceptable than the variable: distance-based, time-based, and delayed-based
charges. For time of charge, there is no difference between acceptability of the charge during
the morning peak-time and all day.
It was also found that personal characteristics have some effects on acceptability. Mode use has
a significant effect on acceptability; acceptance in car users is much less than in non-car users. Elderly people are highly sensitive to the charging level. However, other socio-economic
characteristics: gender and income, surprisingly, do not affect acceptabll'tY.
On the other hand, attitude to road user charging is highly affected by personal percept' ions.
Individuals tend to accept a charging scheme if they perceive their current travel situation as if congestion and pollution problems are regarded as being very senous, and if the unacceptable, 11

105
scheme is perceived to be et fective in reducing the problems. However, those who have a strong dislike of charging are, not surprisingly, more opposed to any charging scheme.
In brief, acceptable road user charging schemes can be designed by limiting the area of charge
within the city centre and basing It on a fixed charge per day. These schemes would be even
more supported by convincing the public that the scheme will provide substantial environmental
improvement and car delayed-time reduction. Moreover, acceptability could be influenced by
externality factors encouraging personal perceptions of congestion and pollution problems, and
perceptions of the effectiveness of road pricing in reducing the problems.
The preferred voting model developed in this chapter will be used later in Chapter 9 to predict
acceptance levels of different groups of people for various road user charging schemes. The
next chapter will present the influence of selfish and social perspectives on acceptability. These
perspectives are reflected by individuals' evaluations of their own and social benefits,
respectively.

106
Chapter 7
Public Acceptability and Selfish and Social Perspectives
7.1 Introduction
In Chapter 6, voting behaviour model was presented as a function of road user charging
characteristics. It demonstrated that acceptability is influenced by the system characteristics, as
well as personal characteristics and perceptions. The objective of this chapter is to test the
second hypothesis in Section 1.2 in which the influence of individuals' selfish and social
perspectives on acceptability are separated out. These two perspectives were reflected by the
perception of benefits to self and to society as a whole, respectively (described in Section 4.5.1).
The results are presented in Section 7.2.
This chapter also aims to test the hypothesis that the selfish and social perspectives are results of
I. i-idividuals' evaluations of the system characteristics and influenced by personal characteristics
ai-id perceptions, the third hypothesis in Section 1.2. The effects of the charging system
characteristics and personal characteristics on these perspectives and how the public differently
evaluate the system characteristics for their own benefits and social benefits are demonstrated in Section 7.3. Finally, conclusions on the selfish and social perspectives influencing acceptability
ofroad user charging are provided in Section 7.4.
7.2 Selfish and Social Perspectives Affecting Acceptability
This research studies the influence of individual preferences or interests, from both selfish and
social perspectives, on acceptability. Some people may not accept the policy because they lose
benefits even though the public gain. On the other hand, some people may accept it because
society as a NNhole is better off. These perspectives may influence individuals' propensity to
accept and support the policy (Section 2.5.3). These perspectives were represented by the
perception ot'benefits to self and to society. They were measured by the rating on an II -point
"Ca1c, -5 to 5 representing 'very detrimental' to *N, ery beneficial' (as described in Section 4.5.2),
rcsI)onding to the chargiiig scenarios presented.

107
On the II -point scale, it can be surnmarised that rating on the positive side (between I and 5)
means that the scheme is perceived as beneficial, on the negative side (between -1 and -5) It Is
perceived as detrimental, and zero is neither. The overall perceptions of benefits to self and to
society without taking into account the different system characteristics are demonstrated in Table 7.1. The results were analysed from 830 respondents in Leeds and London (sample
characteristics were presented in Section 4.6). Each individual was presented an SP exercise
with four charging scenarios.
Table 7.1 Perceptions of benefits to self and to society by all observations
Perception on road user charging
To self To society
Beneficial 30% 56% Neither 19% 15% Detrimental 51% 29%
Base: 2473 observations
The results show that over a half of the observations (56%) felt that road user charging is beneficial for society as a whole, but only less than a third (30%) perceived benefits to
themselves. The majority (70%) believed that the policy is either not beneficial or detrimental
fI or them. In general, the results demonstrate that although most respondents did not perceive benefits to themselves, they still believed that there would be some benefits to society. However, when respondents rated on the scales, there was some positive correlation (Kendall's
tau-b coefficientl = 0.45) between the perceptions of the benefits to self and to society. This
means that if a rating is high on one scale, it tends to be also high on the other. Nonetheless, the
correlation is not particularly high2.
In the remainder of this section, the effects of selfish and social perspectives on the acceptability
of road user charging are examined. This demonstrates how much each perspective influences
acceptability. There are three sub-sections. First the overall results are analysed from the whole
sample. The second shows the differences between groups of the public, according to socio-
Kendall's tau-b coefficient varies between -1 and +1 to indicate the strength and direction of relationship bemeen two ordinal variables (Bryman and Cramer, 1997). Its interpretation Is identical to Pearson's r coefficient, which is for interval data.
This is oood from the perspective of modelling, in which the separate effects of the selfish and social in a model (see Section 7.2.1). perspectives on voting are appropriate to be represented

108
ions among individuals economic characteristics and personal perceptions. Finally, taste variat'
are investigated.
7.2.1 Weights of selfish and social perspectives in overall respondents
The analysis, using the standard logit model, is based on the utility function developed in Section 3.5. The utility function of a 'yes' vote is expressed as a function of the perception of benefits to self and to society, while the utility of 'no' vote is equal to zero. The basic model,
without the effects of personal characteristics, is shown as Equation 7.1. The coefficients of
selfish (01) and social (02) perspectives indicate how much %veight people put on each
perspective when they decide to accept the charging schemes presented. The alternative specific
constant (ASC) represents effects of unknown factors, which are not included in the model. It
also allows the model to replicate the observed market share, in the case where the perceptions
of both benefits are zero and voting is not 50: 50 because of some protest responses.
UyEs = ASC + 01 (perception of benefits to selj) + 02 (perception of benefits to society)
UNO (Equation 7.1)
Table 7.2 reports the coefficients and t-ratios of the selfish and social perspectives in the utility tI unction of 'yes' vote (Equation 7.1). These results were analysed from the whole sample, 830
respondents in Leeds and London (see sample characteristics in Section 4.6).
The model goodness-of-fit index (p) is very high (0.3158) for the logit model; the model
explains the choices very well. The results demonstrate that the perceptions of the benefits to
self and to society have highly significant positive effects (at 99% confidence level) on the vote.
Table 7.2 Standard logit model of voting behaviour as a function of selfish and social perspectives
Variables Coefficient (!: 21! 2)_ Alternative specific constant (ASC) - Yes -1.0563 (-15.4) Perception of benefits to self _0.3452
(17.6) Perception of benefits to society 0.2554 (10.7) No. Observations 2440
-pT-'-- to constants 0.3158 Log likelihood at convergence -1030.562
coeffi,: ient ofthe perception ot'benctits to self is higher than the coefficient of perception of
benefits to society. The ratio of the coefficients of the selfish and social perspectives is 1.35.

109
This indicates that on average people perceived benefits to self as more important (35%) than
benefits to society, as expected. People \ýere required to pay for car use; they would expect direct benefits to them. Nevertheless, acceptability is not totally influenced by the perception of
personal benefits, but also the perception of social benefits.
The ASC representing unmeasured effects has a negative sign. This indicates that if individuals do not perceive any benefits to themselves and to society from a charging system (i. e. if the
perceptions were zero in the models), this system would attract support from less than 50% of
the voters (the utility of 'yes' vote is less than the utility of 'no' vote which is zero). More
precisely, the predicted 'yes' vote is 25.8%, calculated from the standard logit model: Pyes ý
e Uyes / (e Uyes +e Uno). In other words, without taking account of system features, road user
charging would be unacceptable to the majority of the public (three quarters), if the public did
not perceive any benefits to them or to society, and even if they did not perceive any detriments.
This is possibly because they disagreed with the principle of charging and provided protest
responses.
In order to make a charging system gain a vote up to 50%, the perception of benefits to self
needs to be 3.1 (1.0563/0.3452) out of a five-point positive scale if the perception of benefits to
society is zero. On the other hand, the perception of benefits to society has to be 4.1
(1.0563/0.2554) out of a five-point positive scale if the perception of benefit to self is zero.
7.2.2 Weights of selfish and social perspectives variation among groups of the public
The basic model was analysed for the whole sample. It is very likely that there are taste
variations between groups of respondents; for example car users and non-car users are likely to
have different weights for the perspectives. Segmentation analysis (Section 3.4.3) was applied
on the basic model in Table 7.2, in order to demonstrate whether different groups have different
\, N, clghts for the benefits to self and to society.
The analysis technique NN! as similarly used as in Chapter 6. The analysis began with analysing a
separate model for each segment in order to identify the potential sources of the differences
between groups. Incremental effects of variables and ASCs in the models were estimated. Then
only significant incremental effects Nvere taken forward to be included in a combined
segmentation model.

110
The results of the significant incremental effects for some groups of individuals are presented in
I able 7.3. This segmentation model identifies some sources of differences across the sample. Fhe explanatory power of the model is improved, in that the goodness-of-fit index increases from 0.3158 in the basic model to 0.3343. A likelihood ratio test (Section 3.4.3) was used to
compare the segmentation model in Table 7.3 and the basic model in Table 7.2. The test is that
twice the difference between the log likelihood values of the models (123.7) Is higher than a2
critical value of 16.8 for 6 degrees of freedom (the number of parameters' coefficients imposed
on the basic model is restricted to being equal to zero under the null hypothesis), indicating that
the segmentation model is statistically superior, at the 99% confidence level.
Table 7.3 Standard logit model of voting behaviour as a function of selfish and social perspectives segmented by personal characteristics and perceptions
Variables Coefficient (t-ratio) Alternative specific constant (ASC) - Yes -1.0015 (-14.1) Perception of benefits to self 0.3692 (12.5) + incremental effects
If bus user -0.3009 (-4.5) If female 0.1033 (2.4) If very serious pollution problem -0.1613 (-3.6)
Perception of benefits to society 0.2008 (6.4) + incremental effects
If bus user 0.3357 (4.9) If age 55 or over -0.1497 (-3.5) If very serious pollution problem 0.2096 (4.6)
No. Observations 2335 P2 with respect to constants 0.3343 Log likelihood at convergence -968.7055
Similar to the basic model, the coefficients of the perceptions demonstrate that both benefits to
self and society significantly influence acceptability. The ASC has a negative sign. This
indicates that a charging system would attract support from less than 50% of the voters, if
individuals do not perceive any benefits or disbenefits to themselves and to society. The
incremental effects are not significant in the ASC, only in the perceptions of benefits to self and
to society.
The incremental effects show that some groups of people have significantly different weights for their own benefits and social benefits from the others. The coefficients and their ratios for
different groups are surnmarised in Table 7.4. This was worked out fTom the coefficients in
Table 7.3 in which a coefficient for a particular group is equal to the base coefficient plus its
incremental effects.

Table 7.4 Coefficients and ratios of the perceptions of benefits to self and society for different groups
Perception of Perception of Ratio Segmentation benefits to self benefits to society
(1) (2) Base 0.3692 0.2008 1.84 Bus user 0.0683 0.5365 0.13 Female 0.4725 0.2008 2.35
ge 55 or older 0.3692 0.0511 7.23 Perceiving pollution as 0.2079 0.4104 0.51
I
very serious I I I
Fhe variation of the ratios between the perceptions of benefits to self and to society among the
groups of the public is very high. For the base group who are car and other mode (non-bus)
users, males, those younger than 55 and those who do not perceive pollution as very serious, their acceptability is influenced by both the perceptions of benefits to self and to society. However, their concern with their own benefits is almost twice as important as concern with
social benefits when they vote for a charging scheme, indicated by the ratio of the perceptions
of benefits to self and to society which is 1.84.
Bus users have just a little interest (0.3692 - 0.3009 = 0.0683) in the benefits to themselves,
which is very much lower than the self-interest of car users. However, they have relatively high
interest in benefits for society (0.2008 + 0.3357 = 0.5365), which is almost three times higher
than the social-interest of the base group. The ratio of the perceptions of benefits to self and to
society is very low. This suggests that acceptability of charging for bus users mainly depends on
whether they perceive benefits to society. They will hardly vote for a scheme if they are not
convinced that the scheme will provide benefits to society. This is possibly because they are not
required to pay for the charges, so they do not expect the charging schemes to offer direct
benefits to themselves. On the other hand, if the schemes provide benefits to society, they would
also be better off.
Surprisingly, the segmentation model did not find that there are significant differences between
the coefficients for car users and the other (non-bus) mode users. This seems to indicate that
those who usually travel by rail, xvalking, cycling and other modes (except bus users) are
concerned for their own benefits more than social benefits when they vote for a scheme, as with
car users. This may be because there is a small sample size of these users (10% of respondents),
so little confidence can be placed in the results.

112
In contrast with bus users, elderly people (55 and older) have very low concern for benefits to
society (0.0511). They are mainly interested in their own benefits, seven times more so than
social benefits. This is probably because most of them are pensioners. In the sample, most of
them do not travel to work and have lower income than other younger groups. They will vote For a scheme if they are convinced that they will be better off.
For females, although both selfish and social perspectives influenced on their voting as for
males, their self-interest was slightly larger than males' self-interest. Females' self-interest was
over double that of their social -interest.
Those who perceive pollution as a very serious problem are twice as interested in social benefits
as the base group. They weighed for their self-interest only half of their social -interest; on the
contrary, the base group weighed for their self-interest almost twice their social -interest. Those
who perceive pollution as very serious may be more aware of the problem to society. They are
more likely to vote for a scheme if society is better off, but less likely than others to vote for it
on the ground of its selfish benefits. This supports the finding in Chapter 6 in that charging
schemes are more acceptable to these people than others.
Although the effects of having a car in the household and the perception of congestion problem
are excluded from the model, there are also significant differences between respondents who have a car in their household and those who do not, and between those who perceive congestion
as serious and those who do not. These differences are represented by the effects of mode use
and the perception of pollution. This is because there are close correlations between having a
car(s) in household and mode use, and between the perception of congestion problem and of
pollution problem.
For other personal characteristics and perceptions: income, the location of respondents, the
perception of effectiveness and the strong dislike of charging, there is no significant difference
between different groups. To vote for a charging scheme, people are generally concerned for
their own benefits more than for social benefits. There is no evidence to suggest that people who
I iN e in 1--ondon, who perceive charging to be effective, who have a stronger dislike of charging
or wlio have higher incomes are any more likely to value social benefits more than their own
benefits than those who live in Leeds, perceive charging as ineffective, have a weaker dislike of
charging or have lower incomes.

113
7.2.3 Weights of selfish and social perspectives variation among individuals
The segmentation model showed that different groups of people have put different weights for
the benefits to themselves and to society. However, within each group taste variations among
individuals from unknown sources (In addition to the personal characteristics and perceptions)
may still be included. The random parameters logit model (Section 3.4.3), xvhich allows
coefficients to vary across individuals within the sample, is applied to the segmentation model
in Table 7.3.
In order to test whether there are taste variations among individuals in the coefficients of the
perceptions of benefits to self and to society, these coefficients are treated as random, allowing
coefficients to vary across individuals within the sample. The ASC in the model was treated as
non-random, because the model was unstable when all parameters were random.
In the random parameters logit model, coefficients of parameters are typically assumed to be
normally and log-normally distributed. When a coefficient is normally distributed, it is specified
as 0=b+ qt, where ýt is an independent standard normal distribution (mean zero and standard deviation one). b and s, therefore, represent the mean and standard deviation of 0. When a
coefficient needs to be the same sign for all observations, it is assumed to be log-normally
distributed. The coefficient is expressed as 01 = exp(b, + sipt), where b, and s, represent the mean
and standard deviation of In0j. (Greater detail of the random parameters logit model is explained
in Section 3.4.3. )
The results of the random parameters logit models (obtained from the LIMDEP programme) are
shown in Table 7.5. Two models are presented. In Model 1, both the random coefficients of the
perceptions of benefits to self and to society are treated as normally distributed. The standard deNiations of both coefficients are significant; the coefficients are likely to have taste variations
among individuals. The standard deviations are relatively high, compared to their means.
fn reality, both coefficients of the perceptions of benefits to self and to society should be of
posltl\, c sign. For the coefficient of the perception of benefits to self, 6% of the population are
of negative sign. For the coefficient of the perception of benefits to society, 21% of the
population are of negative sign. This large proportion of the 111 1 negative coefficients indicates that
the normal distribution is not appropriate for the coefficient of the perception of benefits to
society. The log-normal distribution, in which means that all individuals will have positive signs
for their coefficient, is more suitable.

114
Table 7.5 Initial random parameters logit model of voting behaviour as a function of selfish and social perspectives segmented by personal characteristics and perceptions (based on 100 Halton draws)
Variables Model 1* Mode l 2* Mode l 3* Coefficient I Std. Coefficient Std Coefficient Std.
(t-ratio) (t-ratio) (t-ratio (t-ratipj_ (t-ratio) (t-ratio) ASC - Yes -1.2980 (-9.5) - -1.2175 (-10.7) - -1.1735 (-10.0) - Perception of benefits 0.5795 (6.2) 0.3741 (3.2) 0.5664 (7.6) 0.4172 (5-1) -0.9022 (-5.6) 1.1190 (4.0) to self +If bus user -0.4917 (-4.2) - -0.4661 (-5.1) - -0.5199 (-4.7) - +If female 0.1544 (2.5) 0.1492 (2.6) 0.1337 (2.6) +If pollution perceived -0.2330 (-3.2) - -0.2153 (-3.3) - -0.1989 (-3.3) -
as very serious Perception of benefits 0.2938 (5.1) 0.3678 (2.9) -1.5613 (-5.1) 0.6973 (1.5) -1.6393 (-5.6) 0.6435 (1.3) to society +If bus user 0.4982 (4.5) - 0.4544 (5.2) - 0.5267 (4.9) - +If age 55 or over -0.2085 (-3.2) -0.1932 (-3.4) -0.1716 (-3.2) +If pollution perceived 0.2847 (4.0) 0.2585 (4.2) 0.2635 (4.4)
as very serious No. Observations 2335 2335 2335 p7 with respect to 0.3386 0.3376 0.3305 constants Log likelihood at
-962.4052 -963.9066 -968.7055 1
convergence I I1 - Model 1: both the random coefficients of the perceptions of benefits to self and to society are treated as
normally distributed Model 2: the coefficients of the perceptions of benefit to self and to society are treated as normally and
log-normally distributed, respectively Model 3: both the random coefficients of the perceptions of benefits to self and to society are treated as
log-non-nally distributed.
In Model 2, therefore, the coefficients of the perceptions of benefit to self and to society are
assumed to be normally and log-normally distributed, respectively. The standard deviation of
the coefficient of the selfish perspective is significant, but it is not significant for the coefficient
of the social perspective, indicating that only the selfish perspective parameter varies
significantly across individuals. However, Model 2 is not better than Model I (the P2 is slightly lower), in explaining the behaviour. When both coefficients were assumed to be log-normally
2 distributed, the results were even worse (the P falls), as shown in Model 3.
The results indicate that the variation of the social perspective in the population is not
sioiidicant. Only the variation of the selfish perspective is significant. This maybe the case that
individuals' self-interest is related to personal constraints, which are likely to vary from one to
, mother.
Hence, onk, the coefficient of the selfish perspective is allowed to be normally distributed. This
estimation model is shown in Table 7.6. This model is preferred over Models I and 2 in Table
7.5, since the p2 is higher than of both Models I and 2. By using the likelihood ratio test, the
model is significantly better than Model 2 at 95% confidence level. Although the model is not

115
significantly better than Model 1, its p2 is higher and also there is no problem with the large
proportion of the negative coefficients.
Table 7.6 Preferred random parameters logit model of voting behaviour as a function of selfish and social perspectives segmented by personal characteristics and perceptions (based on 100 Halton draws)
Variables Coefficient Std. (t-ratio) (t-ratio)
ASC - Yes -1.1981 (-11.5) - Perception of benefits to self 0.5730 (7.4) 0.4373 (4.8) + incremental effects
If bus user -0.4504 (-4.6) - If female 0.1399 (2.4) If pollution perceived as very serious -0.2231 (-3.4) -
Perception of benefits to society 0.2538 (6.0) - +I. ncremental effects
If bus user 0.4300 (5.0) - If age 55 or over -0.1890 (-3.5) - If pollution perceived as very serious 0.2533 (4.4)
No. Observations 2335 p2 with respect to constants 0.3393 Log likelihood at convergence -961.5086
Comparing the preferred random parameters logit model to the segmentation model in Table
7.3, the P2 increases from 0.3343 to 0.3393. The likelihood ratio test indicates that it is
significantly better at the 99% confidence level.
The model demonstrates that the standard deviation of the distribution for the coefficients of the
perceptions of benefits to self is significant. This standard deviation is relatively high, compared
whose sources to its coefficient. These confirm that there is a taste variation among III
cannot be identified, when they traded off between the benefits to themselves and to society.
On the average of all observations (based on the sample enumeration approach), the weight3 of
the benefits to self is 3.16 times higher than the weight of the benefits to society. In other words, benefits to self are perceived as more than three times as important as benefits to society.
Hudson and Jones (1995) found that, in determining overall attitudes to government spending in
public services, attitudes based on the public interest are more than twice as important as
attitudes based on self interest. It is likely that weights on the selfish and social perspectives are
dependent upon contexts of studies. For the government spending, the public may feel that it
This \\eight is the mean of individuals' weights, which is more appropriate than the weight of the mean coefficients from the basic model in Table 7.2.

116
should mainly benefit society as a whole, as well as they do not pay anything. For the case of
road user charging, car users were directly charged, so they would expect benefits to themselves
more than benefits to society.
The ratios of the weights on the selfish and social perspectives from the random parameters logit model are slightly changed from the ratios in the segmentation model in Table 7.4. The
interpretations of the results are the same as discussed in Section 7.2.2. Nevertheless, the
random parameters logit model is improved in providing more precise coefficient of the selfish
perspective for each individual. As it varies considerably among individuals, using the
individuals' specific coefficients would provide better results than using the fixed coefficients in
predicting levels of acceptance (in Chapter 9).
The random parameters logit model also shows that the mean coefficients are consistently higher than the fixed coefficients in the segmentation model in Table 7.3, which is based on the
standard logit model. This is because the random parameters logit model treats the variance in
parameters explicitly from the error term. The variance of the 'net' error in this model is smaller
than in the standard model. This causes the increase of the scale factoi-4 of coefficients. This
factor is a part of coefficients and cannot be estimated separately from coefficients (Section
3.4.2); thus, magnitudes of coefficients are increased.
Moreover, the ASC was also tested to assess whether its variation was significant. The ASC was
treated as random (with normal distribution), while the other parameters were fixed. Its standard deviation was insignificant, indicating that there is no taste variation in the ASC.
In summary, the results of the effects of selfish and social perspectives on acceptability have
sho\vri that, on average, benefits to self are perceived as three times more important than
bciicfits to society. However, for some groups such as bus users and those who perceive the
pollution problem as very serious, the social benefits are perceived as more important in their
decision of voting for a charging scheme. In addition to these known factors (personal
characteristics and perceptions), the variation of the weight on the benefits to self among
individuals from unknown factors is considerably high. Nevertheless, in general, it can be
concluded that the acceptability of road user charging is influenced by both selfish and social
perspectives. Before implementing a road user charging scheme, the public should be convinced
The scale factor (P) is related to the variance of the Gumbel distribution, in which P2=n2 /6CY2, where Cr
2 is variance of the error.

117
that the scheme will provide benefits to individuals and society as a whole, in order to achieve
acceptance.
The result extends a comment in Button (1984) that, "motonsts will oppose road pricing unless there are clearly perceived benefits". To achieve this, Button suggested "a longer term education
programme prior to any demonstration is necessary and needs to involve a consistent position
on the possible merits of road pricing being put forward by policy makers". However, almost two decades later, this is still proving difficult to achieve.
7.3 Factors Influencing Selfish and Social Perspectives
The previous section showed the effects of selfish and social perspectives on acceptability. This
section demonstrates how these perspectives are affected by the charging system characteristics
and personal characteristics.
7.3.1 Selfish and social perspectives relating to the charging characteristics
Two regression models were estimated for the perceptions of benefits to self and to society. These perceptions were treated as dependent variables in the regression models. The
independent variables included the charging benefits and system features.
The regression models were initially estimated by including a constant, fixed for a whole
sample (as typical), in both models. The model goodness-of-fit indexes (R 2) were very low (less
than 0.06). This is possibly because of high variation among respondents when they rated the
perceptions of benefits to self and to society on the scale. People are likely to base the degree of
their perceptions on their own evaluation. For example, different individuals evaluated the same
scenario quite differently on a scale. This leads to 'noise' in the model and hence the low R2
mcasure. The large error could affect the precision of the estimation results obtained.
To overcome this problem, the models reported in Table 7.7 allow a constant for each
individual. This represents the effects of unknown factors, which are different among
respondents, in addition to the effects of the charging system characteristics offered. The
constant for each individual allows for different individuals using different parts of the scale.
Fhe niodels can explain N, ariations \vithin individuals' ratings, and show how the ratings vary
ak2cording to chargin-g, systern t'catures from Ind'v'duals' base points. The R' of these models are
111"11 (0.8), indicating that the models explain the behaviour very well. Some coefficients
that have \, cry lo\\ t-ratios, are not excluded from the models. This is because even when they

118
wcr(: removed, the models A, ere not improved. in %\-hich the magnitudes of the remaining
coefficients were the same, and their t-ratios and R2 slightly increased (less than 0.1 for t-ratios
and less than 0.01 for R'-).
Table 7.7 Basic regression models of the perceptions of benefits to self and to society
Variables Benefits to self nefits to society Coeff. (t-ratio)
! Coeff. (t-r2ýý
Constant Mean -0.6478 0.6352 Standard deviation 3.11 2.95
Level of charge (p/day) . 0.0020 (-14.3) -0.0010 (-6.5) Car delayed-time reduction (mins. /day) 0.0109 (2.1) 0.0032 (0.6) Bus delayed-time reduction (mins. /day) -0.0012 (-0.4) 0.0040 (1.5) Environment base - as now
. .. . ........... .... ".., ...... .... Environment dummy - slight improved .......................................... ......... . ...
.................... ............. . .... ......... .................... ........ 0.1991 (1.2) .
......... - .......... . ...... ................... 0.5531 (3.4) . . . . . - -- - -- - - Environment dummy - substantial improved .............. ........ ................ ........ .. 0.5852 (3.6) _ . . . . . . -- - -- - - 1.5299 (9.4)
Revenue allocation base - 50%: 50% ..... ..... Revenue dummy allocated to public transport ........ ....... .....
-0.0966 (-0.6) .......................... I ............................... -0.5127. (-. 2.9)
Revenue dummy allocated to tax reduction 0.0682 (0.4) 0.1910 (1.1) Area of charge base - wide are.. a Area of charge dummy - small area 0.6820 (4.8) 0.3980 (2.7) Time of charge base - all day.
". I-- 1 1. -* * . --- ....... ................ ......... ............. ........... t ime of charge dummy - peak time 0.2060 (1.5) 0.1334 (0.9) Method of charge base - fixed
........ .................. I... ............................. ... ....... I ........ ........ .. I., ...... . ................................ I .......... . ...................... ............ ................. .......... ...... ............ ......... ............... ............. Method of charge dummy - distance-based ................................ ........... ................................. ........ - .............................................................
0.1007 ..................... ....... . .....
(0.3. ) ............. ...... *...... -0.1290 (-0.4)
..... ........ .. ......... ............ ............. I ............... .................. Method of . chaýq. e d. ummy.. - time-based
I ...................... . .... I...... ........... ...... ..... ....................... ........................................ . ........................................... . ... . .. 0.2398 . .................................. ... I ........... . ..
(0 9. ) . .................. -0.4662 (-1.7)
..... . .................... - ............. .................. . __ __ charge dummy - delay-based 0.2121 (0.8) 0.1067 (0.4) No. Observations 2709 2474 W 0.851 0.827
The basic model was estimated for the whole sample, without showing differences among
groups of people (as will be reported in Section 7.3.2). The constants in the models are varied
among respondents, so their means and standard deviations are shown. For the model of
perception of benefits to self, the average constant has a negative sign. This means that even
\\ lien the charging level is very low (close to zero) in the base charging system with no benefit,
this system is overall perceived as detrimental to self-interest. On the other hand, for the model
of the pei-ception of benefits to society, the average constant has a positive sign. Overall people
tend to believe that there are some benefits to society, even in the base system with no benefit
presented.
The level of charge has a significant negative effect for the perception of benefits to self-, as
expected, the higher the level of charge, the higher the detriment to self For the perception of
benefits to society, the effect of the charge is also significantly negative, but the negative effect igh as on the perception of benefits to self. In other words, the perception of benefits is not as hi I
119
to self is more sensitive to the charging level than the perception of benefits to society. This is because charging affects directly individuals' out-of-pocket money.
Car delayed-time reduction is positively significant in increasing the perceptions of benefits to
self. When the charge increases by El, the decrease in the perception of benefits to self can be
compensated by approximately 18 minutes per day of car delayed-time reduction (0.0020x 100/0.0 109), equal to 5.5p per minute of delayed-time saving. This value is rather low,
compared to the average value of time reviewed from many SP studied by Wardman5 (200 1 b).
It is because in this analysis respondents are from different trip purposes. The data is also likely
to include protest responses to charging schemes. Thus, the value of time is lower than it should be.
Car delayed-time reduction is insignificant in influencing the perception of benefits to society. This indicates that car delayed-time reduction is not perceived as a social benefit. It is seen more
as a personal benefit. This is possibly because when journey time falls, it may be perceived as
an impact on each individual. In turn, it is likely that when journey time increases, individuals
would perceive it more as detriment to themselves than to society.
In both models, the coefficients of bus delayed-time reduction are insignificant. This seems
surprisingly to indicate that the perceptions of benefits of road user charging are not influenced by bus delayed-time reduction. This is possibly because of the combined effects from car and
non-car users. Nevertheless, the effect of bus delayed-time reduction on the perceptions of benefits to society is almost significant. (This effect is discussed further for the segmentation
model in the next section, 7.3-2)
Slight improvement of the environment is not significant in improving the perception of benefits
to self, but it is significant in influencing the perception of benefits to society. Substantial
environmental improvement has a significant positive effect on both perceptions. This effect, as
expected, is higher in the perception of benefits to society than in the perception of benefits to
self, when everything else is the same. Respondents consider that environmental improvement
is more a social benefit than a personal benefit, as expected. The effect is equal to 293 pence per
Wardman (2001b) pro\, ides a model (formed by a meta-analysis from a large number of previous studies) for estimating UK values of time. Basing on this model, the value of time is 6.8 p/min in year 2000 for commuters tra\-elling 10 miles. The value of delayed-time is about 1.4 times higher than the value of time (Wardman, 1991,2001a), so the value of delayed-time should be around 9.5 p, nun.

120
day (0.5852/0.0020) for benefits to individuals, and 1530 pence per day for benefits to society (1-5299/0.0010). This value of substantial improvement of the environment is plausible for
personal benefits, but it seem to be very high for social benefits. However, it should be noted
that these values are purely from selfish and social perspectives. In reality, people are not totally
selfish or altruistic. Thus, a proper value should be between the two values. As shown in Section
6.2, the overall value of substantial environmental improvement is 321 pence per day. This is
close to the value from the selfish perspective because individuals are concerned with benefits
to themselves more than benefits to society, as found in Section 7.2.
For the proportion of revenue allocation, people did not perceive that all revenue allocated to
public transport or to tax reduction provided benefits to them significantly different from those
with the revenue allocated equally. For benefits to society, they perceived that the revenue
should be equally used for public transport and tax reduction or just tax reduction, surprisingly,
not just for public transport. This implies that the use of revenue for only public transport is not
perceived as a benefit to society as a whole.
A charge in the small area (inside the Inner Ring Road) is perceived as having significantly
greater benefits to self than a charge in the wide area. In other words, a charge in the wide area
is perceived as having more detrimental than a charge in the small area. This is possibly because
some people who can avoid travelling in the small area expect some benefits to themselves
without being charged. A charge in the small area is also perceived as having greater benefits to
society. However, it is considered more as a benefit to self than a benefit to society. Intei-estingly, people do not perceive that a charge in the wide area will provide more benefits to
'society than a charge in the small area. They may consider that the city centre is the main
problem area or that there are adverse effects of larger areas.
For the remaining variables, people did not think that the charges during morning peak time are different from the all day charge in providing benefits to them and to society. Nevertheless, the
positive effect of a charge during the peak time on the perception of benefits to self is almost
'significant, indicating that some people may expect some benefits to themselves by avoiding
tra\ elling in the peak period, although many people may not be able to do so.
The methods of charge: distance-based, time-based and delay-based were not perceived
significantly differently, at 95% confidence level, ftom the fixed charge. However, the
coefficient of the time-based charge is significant at 90% confidence level for the perception of
benefits to societ. N'. It is of negative sign, indicating that the time-based charging method is not better for society than the fixed daily charge. This may reflect concerns about safety, in which

121
time-based charge tends to influence speeding, in turn increasing nsk of accidents, as found by
Bonsall and Palmer (1997), and Palmer and Bonsall. (1997).
In summary, this section has reported the effects of the system characteristics on the selfish and
i ividuals do evaluate charging social perspectives. The regression models demonstrate that ind
schemes differently between the selfish and social perspectives. These perspectives are
influenced by level of charge, area of charge, car delayed-time reduction and environmental
improvement. The results confirm, as we expect, that the selfish perspective is more sensitive to
charge than the social perspective, car delayed-time reduction is perceived as a benefit to self
rather than a benefit to society, and environmental improvement is perceived more as a social benefit than a personal benefit.
7.3.2 Selfish and social perspectives relating to personal characteristics and perceptions
This section explores differences among groups of the public when they rated the perceptions of benefits to self and society. Segmentation analysis (Section 3.4.3) was applied on the basic
regression models in Table 7.7.
The results of the incremental effects, which are significant at 95% confidence level, from
personal characteristics and perceptions are reported in Table 7.8. The goodness-of-fit (R 2)
indexes increase slightly. Although, overall, the interpretations of the effects of the system
characteristics are similar to the basic regression models, the segmentation model includes the
iiicremental effects to demonstrate that different groups of people evaluate the charging system
characteristics differently. This relates to those who are non-car users, who are aged 55 or over,
who live in London, who perceive charging as effective in reducing congestion, who have a
strong dislike of charging, who perceive congestion as very serious, who are female, and who
perceive the current situation as unacceptable.
There are some aspects of the perception of benefits to self for which car and non-car users are
sigrilficantly different, as expected. This is because car users are directly affected by charging,
bLit non-car users are not. Interestingly, both car and non-car users perceive the effects of
charging systems on benefits to society similarly.
Non-car users are less sensitive to the charging level than car users. However. the impact of
charge on non-car users is not zero. though they are not di I reason is rectly charged. A possible
hCCLILISC they are concerned about some indirect effects, for example the effects on business and

122
increase of public transport fare (reported in Section 5.6). It may also be because they
sometimes use cars or others in the household use cars.
Table 7.8 Segmentation regression models of the perceptions of benefits to self and to society
Variables Benefits to self enefits to society Coeff. (t-ratio) Coeff. (t-ratio)
Constant Mean -0.4760 0.6926 Standard deviation 2.95 2.80
Level of charge (p/day) . 0.0035 (-15.3) -0.0014 (-5.2) " if non-car user 0.0013 (3.2) - " if age 55 or over 0.0012 (3.6) - " if London 0.0016 (4.7) 0.0008 (2.4) " if perceiving effectiveness in reducing congestion - 0.0008 (2.4) " if strong dislike charging - -0.0010 (-2.6)
Car delayed-time reduction (mins. /day) 0.0103 (1.9) 0.0022 (0.4) Bus delayed-time reduction (mins. /day) -0.0007 (-0.2) 0.0001 (0.0)
+ if non-car user 0.0144 (2.2) -
_+ if perceiving congestion as very serious - 0.0108 (1.
Environment base - as now .......... .......... ....... ... ... .. ............................ ............ .. ............................ ........................ ........... ........... ... .... .. .. . .. . . . . . .. . . .. . . .. . . .... . - .. .... ..... . .. . . ..... . .. ... .... .... . . .. ... . ..... . ....... ............... . . . . I . II . . . . . . . . . . .. ... . . .I . .... . . Environment dummy - slight improved ....... . .. .. .. . . . .... . .. ... - . ... . . ..... ... .. 0.1814 (1.1) . . .. ........ -. . . . . . . .. . 0.2572 (1.2)
+ if current situation perceived unacceptable I., ..................... I ............ ..................................... ........... ......... .......... . ........... ..................................... .... .................. . ......... - ..... - ------- -. - ......... .........
0.9129 ....... . ............................... ..., -- ---------- Environment dummy - substantial improved 0.3801 (2.1) 0.9542 (3.7)
" if non-car user 0.8585 (2.4) - " if female - 1.1565 (3.2) " if current situation perceived as unacceptable 0.7753 (2.0)
Revenue allocation base - 50%: 50% ............................................ . .................... ...... .................... - ............ . ... ........... . . . .. .......... .............. ....... .. _-- ...................... ................. .. ......................... ........ . ..... ... ........ I ..... ..................................................... I. . . .. . . evenue dummy allocated to public transport
....... ... ... I .... ................................................. ......... I ..................................... ............. .................................................... I .............................. .. -0.1282 (-0.7) ....... . ................... ......... . ... ......... I .................. ............. -0.. 4897 (-2.8)
......................... II.. . ......... Revenue dummy allocated to tax reduction 0.0574 (0.3) 0.1717 (1.0) Area of charqe base - wide area Area of charge dummy - small area 0.8052 (4.9) 0.3607 (2.5)
+ if non-car user -0.7703 (-2.4) - Time of charge base - all day
.... ..... ............. ..................... ..... . ............ Time of charge dummy - peak time 0.1929 (1.4) 0.1016 (0.7) Method of charqe base - fixed
........... ........... .. -.......... ........... ..... ................ et od of charqe dummy - distance-based .................. -0.0004 (0.0) -0.1288 (-0.
................. ............... . .... ........ Method of charge dummy - time-based ............ ........... .......
0.0948 (0.4) ... ......... . ....................... .. --........... ............. ... -0.5659 (-2.1
...... . .......... Method of charge dummy - delay-based 0.2038 (0.8) 0.0992 (0.4)
No. Observations 2662 2323 R2 0.855 0.839
Non-car users perceive bus delayed-time reduction significantly differently from car users for a
benefit to self. Bus delayed-time reduction is seen as a personal benefit for non-car users.
However, as with car users, non-car users do not perceive bus delayed-time reduction as a
benefit to society. They just see it as a benefit to the individual. For car users, bus delayed-time
reduction is not perceived as a personal benefit. This supports the reason given in Chapter 6 in
that car users do not perceive that reductions of bus delayed-time will make them better off, so
ýicccptability is not significantly influenced by the reduction.

123
Non-car users also perceive more benefit from substantial improvement of the environment to
themselves than car users. This is possibly because they are closer to environmental problems than car uscrý, e. g. waiting for bus, walking and cycling. As reported in Section 5.3, non-car
users perceive pollution as more serious than car users. Non-car users also cause fewer
environmental problems. They are likely to be more environmentally concerned. In contrast, car
users may find it more difficult to be concerned about the environment because it is not easy to
reconcile attitudes with behaviour.
For area of charge, non-car users evaluate benefits from a charge in the small area very much differently from car users. Non-car users do not perceive benefits to themselves differently
between a charge in the small and wide area. This is reasonable since different areas of charge have no different effect on them. This is contrary to the effect on car users, in which different
boundaries of charged area mean the difference in being charged or not.
Moreover, among other groups of the public there are also some differences in the effects of
charging system features. Respondents who are 55 or older are less sensitive to the charge than
younger respondents in their perceptions of benefits to self This is possibly because they travel less often (two third of these respondents are non-commuters), so their personal benefits are less
affected. However, in Chapter 6, it was found that acceptability of those who are 55 or older is
more sensitive to a charge than others. This means that elderly people are more opposed to
charging, not because their personal benefits are more affected by the charge than others, but
because of something else (which cannot be explained in more detail by this study).
Respondents who live in London are also less sensitive to the charge than those who live in Leeds both for the perception of benefits to self and for the perception of benefits to society. This is unlikely to be because those who live in London are richer. In the sample characteristics
(in Table 4.4), the distribution of income groups in London and Leeds are quite similar. The
difference may be because road user charging is expected in London more than in Leeds.
Congestion and pollution problems are perceived as more serious by people in London than in
1, ceds (sce Chapter 5). Thus, charging would be expected to bring more benefits.
People who belic\, e that charging would be effective in reduc, i ive to ing congestion are less sensit'
the charge in their perception of benefits to society than others. Their perception of benefits to
society does not fall as much as those Nvho do not believe in the effectiveness, when the charge
increases. This implies that they perceive some benefits to society more than others, so there are
124
less protest responses. This helps to explain why charging is more acceptable to those people
who perceive charging as effective (the result in Chapter 6).
For the perception of benefits to society those who strongly dislike charging are more highly
,, ensitive to the charge than others, but for the perception of benefits to self, they are similar to
others. They are likely to disagree with the principle of charging and tend to be against charging because they see no or little benefit to society, while other people perceive some beriefits to
society.
Females perceive substantial environmental improvement to be a much larger social benefit than
males do, For respondents who find their current travel situation unacceptable, not only the
substantial improvement but also the slight improvement in the environment is significantly
important on the perception of benefits to society. This is partly because most of these people
perceive that pollution in their city is either serious or very serious (reported in Section 5.3).
Finally, those, who perceive the congestion problem in their city as very serious, valued bus
delayed-time reduction as relatively different (significant at 90% confidence level) from others f'or the perception of benefits to society. They may expect bus delayed-time reduction to help to
reduce congestion, which would be of benefit society overall. However, for the perception of benefit to self, the effect bus delayed-time reduction is not significant. This is because the effect
of bus delayed-time reduction for non-car users is already distinguished from the others who are
car users. Thus, those who perceive congestion as very serious are also car users, which do not feel that bus delayed-time reduction benefit them.
7.4 Conclusions
This chapter has tested the hypothesis that acceptability of road user charging is influenced by
individuals' selfish and social perspectives. These were reflected by the perceptions of benefits
to self and to society. The results from the analyses of the SP data based on the logit models
confirmed that the perceptions of benefits to both self and society highly affect acceptability. Overall benefits to self are more important to individuals than benefits to society. In particular,
elderly people and females are highly aware of their own benefits from charging schemes when
making decisions whether to vote for a charging scheme. In contrast, the results are different for
bus users and for those %vho perceive pollution problem as very senous in their city. They are
more concerned for benefits to society as a whole than their own. Nevertheless, it can be
concluded that road uscr charging Nvould not be acceptable the publi inced that ic are not convi
charging will provide benefits to them and to society as a whole. I

125
I his chapter has also examined the extent to which perceptions of benefits to self and to society
are influenced by the system characteristics, as well as, by personal charactenstics and
perceptions. The regression model showed the effects of some system charactenstics on the
perspectives. Individuals do evaluate charging schemes differently between the selfish and
social perspectives. Increasing the charging level would reduce the perceptions of benefits to
self more than to society. Car delayed-time reduction and environmental improvement
significantly contribute to the perceptions of benefits. Car delayed-time reduction is perceived
more as a benefit to self than to society. In contrast, individuals regard environmental
improvement as more of a social benefit than as a personal benefit. A charge within the Inner
Ring Road of Leeds and London is perceived as providing more benefits to self than a charge in
the wider area. This is possibly because some people who are able to avoid travelling in the area
are expecting to benefit from traffic reduction to themselves without being charged.
Furthermore, different groups of people evaluate charging schemes differently from both selfish
and social perspectives. Car and non-car users are obviously different, particularly in the
valuation of personal benefits. The perception of benefits to society is more affected by personal
perceptions, including the perception of the current travel situation, the perceptions of
congestion and pollution, the perception of charging as effective in reducing the problems and
the strong dislike of charging, than by personal characteristics.
In brief, while increasing the charge could reduce the perceptions of both benefits to self and to
society, improving the environment and limiting the charge within the Inner Ring Road (a small
area) could improve them. Furthermore, the perceptions of benefits to society can be influenced
by provision of clear infori-nation on the severity of transport problems, and on the effectiveness
of road user charging in reducing the problems. These suggestions, which are similar to the
findings from the direct voting model in Chapter 6, can increase the perceptions of benefits to
self and to society, which in turn will improve acceptability of charging schemes.
The models developed in this chapter will be used later in Chapter 9 to predict acceptance levels
for \-arious road user charging schemes, in comparison with the prediction results by the model
de\ cloped in Chapter 6.

126
Chapter 8
Effectiveness of Road User Charging
8.1 Introduction
In the previous two chapters, Chapters 6 and 7, the acceptability of road user charging schemes
as influenced by system characteristics, personal characteristics and perceptions, and the
individuals' selfish and social perspectives were discussed. The objective of this chapter is to
examine the charging scheme's effectiveness as affected by the charging system features and the personal characteristics of respondents (the fourth hypothesis in Section 1.2).
In order to evaluate effectiveness of road user charging schemes, this study focuses on a main
objective of the policy which aims to reduce congestion by influencing travel mode switching. The SP exercises were designed to examine mode choice response for work trips since
individuals are likely to change their behaviour in different ways for different trip purposes. Car
commuters' mode choice responses to the charging schemes were measured by their intention to
change from using car to other modes (Section 4.5.3).
In this chapter, the results of the mode choice behaviour based on the standard logit model are
shown in Section 8.2. The basic model presented was estimated on all respondents from Leeds
and London. The effects of personal characteristics on the mode choice are presented in Section
8.3, in order to explore the differences among groups of the public. Section 8.4 examines heterogeneity in the sample. This is achieved through the use of the random parameters logit
model. Finally, conclusions on effectiveness are made in Section 8.5.
8.2 Mode Choice Behaviour Influenced by the System Features
This , section presents the development of the mode choice behaviour model. This demonstrates
the effccts ofthe charging system features, regardless of respondents' characteristics. The model
\\ ýis analysed from 358 respondents who are car commuters from Leeds and London. The initial
model, reported in Scction S. 2.1. surprisingly found that car delayed-time reduction is not
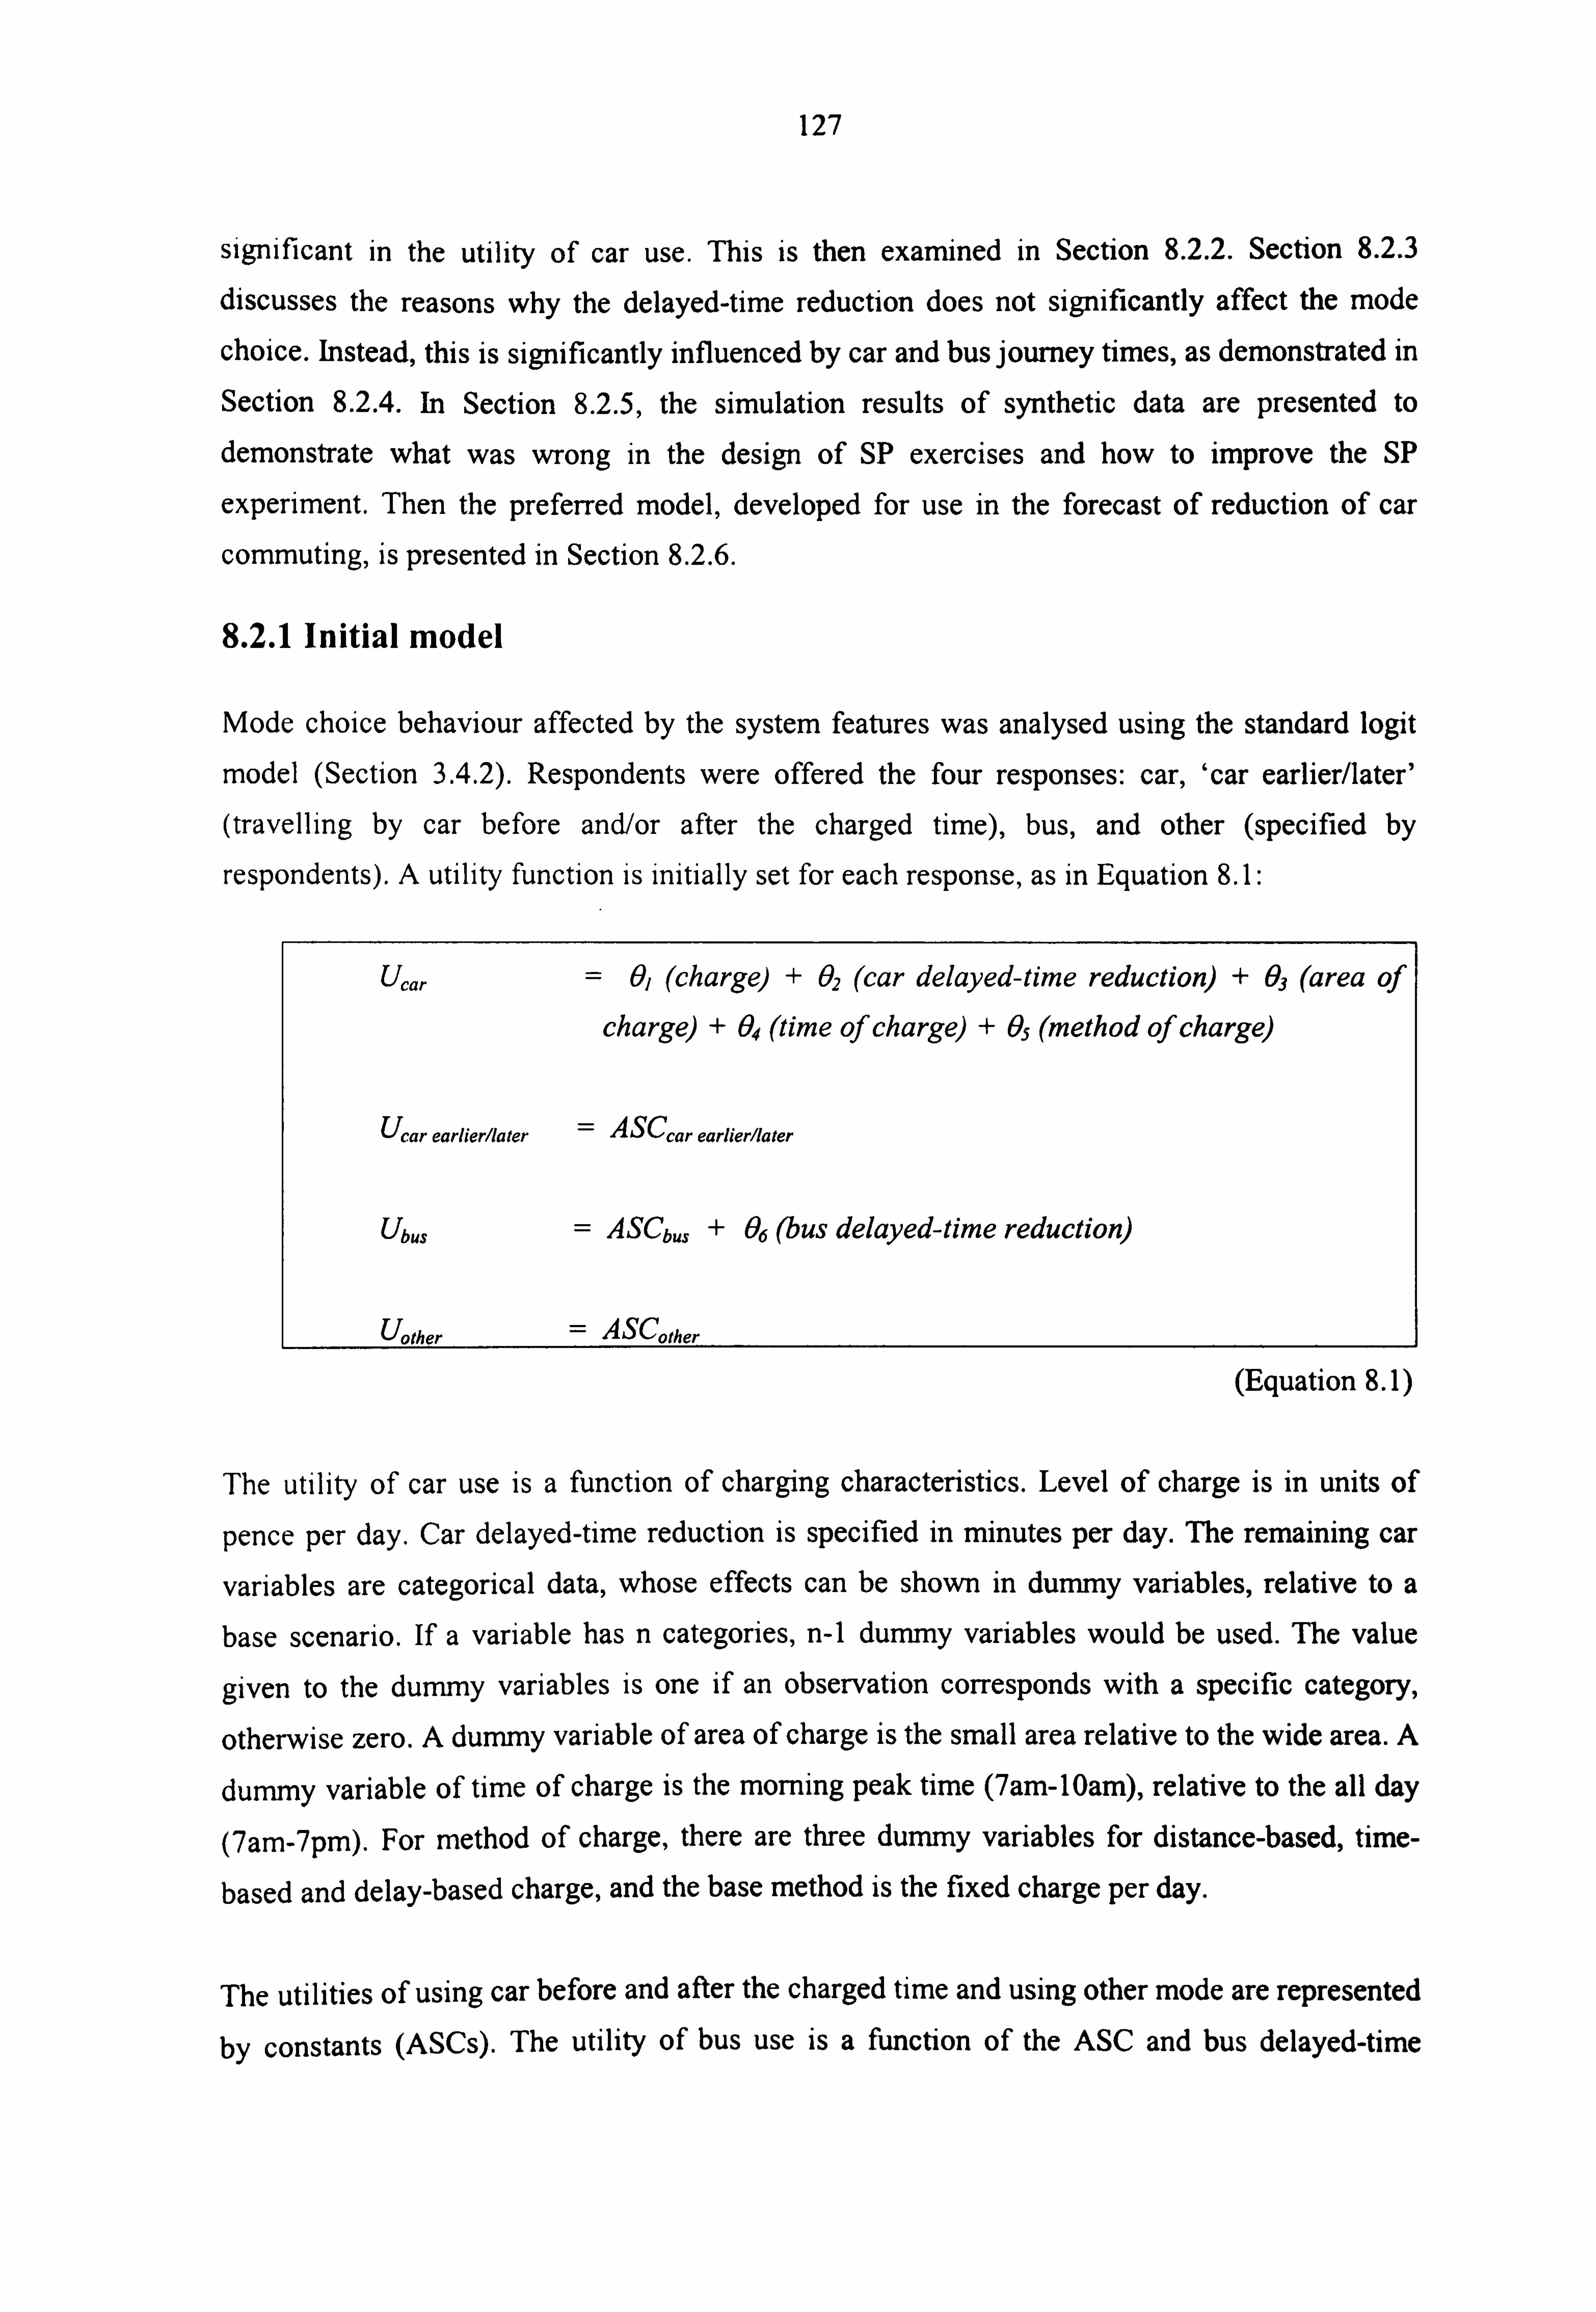
127
significant in the utility of car use. This is then examined In Section 8.2.2. Section 8.2.3
discusses the reasons why the delayed-time reduction does not significantly affect the mode
choice. Instead, this is significantly influenced by car and bus journey times, as demonstrated in Section 8.2.4. In Section 8.2.5, the simulation results of synthetic data are presented to demonstrate what was wrong in the design of SP exercises and how to improve the SP
experiment. Then the preferred model, developed for use in the forecast of reduction of car
commuting, is presented in Section 8.2.6.
8.2.1 Initial model
Mode choice behaviour affected by the system features was analysed using the standard logit
model (Section 3.4.2). Respondents were offered the four responses: car, 'car earlier/later' (travelling by car before and/or after the charged time), bus, and other (specified by
respondents). A utility function is initially set for each response, as in Equation 8.1:
Ucar = 0/ (charge) + 02 (car delayed-time reduction) + 03 (area of I
charge) + 04(time of charge) + 05 (method of charge)
Ucar earlier1later = ASCcar earlier1later
Ubus = ASCb,,, + 06(bus delayed-time reduction)
Uother = ASC,
(Equation 8.1)
The utility of car use is a function of charging characteristics. Level of charge is in units of
pence per day. Car delayed-time reduction is specified in minutes per day. The remaining car
variables are categorical data, whose effects can be shown in dummy variables, relative to a base scenario. If a variable has n categories, n-1 dummy variables would be used. The value
given to the dummy variables is one if an observation corresponds with a specific category,
otherwise zero. A dummy variable of area of charge is the small area relative to the wide area. A
dummy variable of time of charge is the morning peak time (7am-10am), relative to the all day
(7am-7pm). For method of charge, there are three dummy variables for distance-based, time-
based and delay-based charge, and the base method is the fixed charge per day.
The utilities Of using car before and after the charged time and using other mode are represented
by constants (ASCs). The utility of bus use is a function of the ASC and bus delayed-time

128
reduction, which is in units of minutes per day. The ASCs of these alternatives represent
unmeasured effects, which were not collected from respondents, e. g. petrol. cost, flexibility of
choosing departure time, bus fare, and quality of bus and other mode services.
Some variables: time and method of charge in the SP exercises are not included in the mode
choice model because they do not have significant effects on the behaviour. The parameters for
the ený'ironmental improvement and revenue allocation are also excluded because they do not
influence mode choice behaviour.
For the basic model, without including the effects of personal characteristics, the ASCs,
coefficients and their t-ratios are reported in Table 8.1. The results were analysed from the data
of the SP exercises (Section 4.3). The sample included 358 car commuters in Leeds (325
respondents) and London (33 respondents). The model discussed below is the average of the
sample.
Table 8.1 Initial standard logit model of mode choice behaviour of car commuters
Variables l Coefficient (t-ratio) Utility of car use
Charge (p/day) -0.0016 (4.2) Car delayed-time reduction (mins. /day) 0.0080 (0.7) Area of charqe base - wide area Area of charge dummy - small area ý. 6165 1.8)
Utility of car use earlierliater ASC-car use earlier/later -3.0927 (-13.2)
Utility of bus use ASC-bus -2.6570 (-10.5) Bus delay time reduction (mins. /day) -Q. 0 115 L- 1.3)
Utility of other mode use ASC-other -3.7258 (-1j. 1 I_ No. of observation 926
p2 with respect to constant 0.0230 Log likelihood at convergence -592.6981
Each respondent was presented with four charging scenarios. It was found that over half of the
respondents (56%) always chose to use car. Some respondents (21%) switched mode when the
attributes of the scenarios Nvere changed. Almost a quarter (23%) always chose one of the non-
car choices (either car earlier/later, bus or other).
Those who always chose an alternative mode prefer to avoid the charge by changing travel
nlode cven at ýI per day. Theý' were able to access an alternative mode. Most of them (57%)
ak\ays chose *car earl lei-'later'. Some chose to travel by bus, while the remaining

129
rý: spondents (29%) preferred other modes, e. g. rail, walking and cycling. These commuters were
unlikely to trade-off between the charges and time reductions. Therefore, these respondents
were excluded from the model analyses.
ýor the utility function of car use, the estimation results show that car users are significantly
affected by the level of charge (at 99% confidence level). Its coefficient Is of negative sign, as
expected, indicating that the proportion of car users would fall if the level of charge increases. Car delayed-time reduction is not significant in affecting the mode switching. This is contrary to
expectations and will be examined and discussed later in this section.
The small area (within the Inner Ring Roads) of charge has a positive sign, indicating that it has
less effect in reducing car use than the wider area (within the Leeds Outer Ring Road and London North/South Circular Roads). This effect of the small area charge is significant at 90%
confidence level and is equal to the charge at 385p per day. In other words, the charge in the
small area needs to be 385p per day higher than the charge in the wide area, in order to have the
same effect in reducing car use.
The morning peak-time charge does not influence mode choice differently, compared to its base
scenario, the all day charge. This may be because it is difficult for commuters to avoid travelling during the peak time. Thus, there is no significant difference between the peak-time and all day
charge,
Me effects of the variable charging methods (distance-, time- and delayed-based) also are not
significantly different from the effect of fixed charge. For each individual, when the charges are
equal, different methods of charges do not influence mode choice behaviour differently. In a
charging system individuals may not be concerned with the basis of the charge in their mode
choice decision. They may solely consider how much they would be charged (the amount of
charge). Hence, the effects of different charging methods were excluded from the model. Ho\vever, at the aggregate level, May and Milne (2000) found that different charging regimes liave different effects on overall time travelled, distance travelled and route choice.
In the utility function of bus use, the effect of bus delayed-time reduction is not significant,
indicating that the bus time reduction cannot encourage car users to travel by bus. This may
imply that there is an element of non -compensatory behaviour. Car commuters are satisfied with
their cars, so reductions in bus delaYed-times have little effect on thei I iour. ir mode choice behavi
I 1()NN c,, -cj- car commuters can be priced out of their car to bus or other modes.

130
The ASCs in the utility functions of 'car earlier/later'. bus use and the other mode use are highly
significant. Vhey have negative signs. This indicates that these three choices are not preferable for car commuters. They still want to travel by car. The least preferred choice is the change to
use other mode, followed by ýcar earlier/later'. Bus use is the most preferred among them. Bus
is able to compete (having equal mode split) with car if the charge is 1661p per day, 1933p per day for 'car earlier/later' and 2329p per day for the other modes. These values are very high, in
order to reduce the proportion of car use to be equal to the other choices. For example, when
using the model to predict the mode choices, at the 1661p per day charge the mode choices for
car and bus were equal at 33%, and the remaining mode shares were car earlier/later and other
modes.
The model results indicate that car commuters very much prefer car to other modes. They are
affected only by the charge in their decision to switch from using the car to other modes. Car
delayed-time reduction is not perceived as adequate to compensate the charge. Bus delayed-time
reduction also does not help in encouraging the use of bus.
8.2.2 Examining the initial model
Next, these results are investigated in detail using the individual responses in the SP exercises to
examine why mode choice is not significantly sensitive to car and bus delayed-time reductions. Table 8.2 demonstrates the proportions of mode choice for each of the hypothetical charging
scenarios. The three basic attributes varied in the SP exercises are the charge, and the car and bus delayed-time reductions. The other attributes in the SP exercises are not taken into account
in Table 8.2.
There are eight sets of charging scenarios. Each set has four scenarios presented to each
individual. The proportions of mode choice are from 262 car commuters who provided mode
choices responding to all four scenarios. Respondents who did not respond to all four scenarios
were excluded.
In each set of four scenarios there are two scenarios which have the same level of charge. It can be seen that between these the proportions of mode choice do not vary in response to changes in
the car and bus delayed-time reductions. For example, between scenarios 2a and 2b, at fI daily
charge car delayed-time reduction increases from 50% to 75, %, but the proportion of car use falls fi-orn 77.4% to 74.211', 'o. Between scenarios 4c and 4d. at 0 daily charge car delayed-time
0 but the proportion of car use remains at 42.5%. These are redliction increLASCS fro", /0 to I
sirnilar to the cases bet\\-ccn scenarlos 5c and 5d, 6b and 6c, 7a and 7b, and 8c and 8d. These

131
demonstrate that the levels of charge are the same but the increases of car delayed-tIme
reductions do not influence more car use. This is also similar to the effects of increasing the bus
delayed-time reductions, which does not appreciably influence the use of bus. For example, between scenarios Ic and I d, 2a and 2b, 4c and 4d, and 8c and 8d, bus delayed-time reduction
increases but the proportion of mode choice does not change. On the other hand, reductions of
the proportions of car use are clearly found when comparing scenanos where the level of charge
increases. This demonstrates the significant effect of the charge.
Table 8.2 Proportion of mode choice in response to charging schemes Charging characteristics Mode choice
No. Charge Car Bus Car Car Bus Other Number delayed- delayed- earlier/ modes in sample
time time later reduction reduction .
1
la F- 1 50% 75% 22 2 2 2 28 (78.6%) (7.1%) (7.1%) (7.1%)
1b E5 25% 50% 19 2 4 3 (67.9%) (7.1%) (14.3%) (10.7%)
1c U 50% 50% 19 2 4 3 (67.9%) (7.1%) (14.3%) (10.7%)
1d F7 50% 75% 19 2 4 3 ý67.9%) (7.1%) (14.3%) (10.7%)
2a f- 1 50% 25% 24 4 1 2 31 (77.4%) (12.9%) (3.2%) (6.5%)
2b Ei 75% 50% 23 4 1 3 (74.2%) (12.9%) (3.2%) (9.7%)
2c E3 25% 75% 18 5 4 4 (58.1%) (16.1%) (12.9%) (12.9%)
2d E5 50% 75% 17 6 4 4 (54.8%) (19.4%) (12.9%) 12.9%)
3a E1 25% 75% 24 6 2 0 32 (75.0%) (18.6%) (6.3%) (0.0%)
3b D 50% 50% 20 9 1 2 (62.5%) (28.1%) (3.1%) (6.3%)
3c E3 50% 75% 20 8 2 2 (62.5%) (25.0%) (6.3%) (6.3%)
3d E5 75% 75% 18 9 3 2 (56.3%) (28.1%)
. (9.4%) (6.3%)
4a E3 75% 25% 23 12 2 3 40 (57.5%) (30.0%) (5.0%) (7.5%)
4b f 5 50% 25% 18 13 6 3 - (45.0%) (32.5%) (15.0%) (7.5%)
4c U 25% 25% 17 14 6 3 (42.5%) (35.0%) (15.0%) (7.5%)
4d 75% 75% 17 14 6 3 (42.5%) (35.0%) (15.0%) (7.5%)
5a El 50% 75% 22 7 2 5 (61.1%) (19.4%) (5.6%) (13.9%
5b E5 25% 50% 18 9 4 5 (50.0%) (25.0%) (11.1%) (13.9%)
5c E7 50% 50% 17 6 6 7 (47.2%) (16.7%) (16.7%) (19.4%)
5d 75% 75% 16 6 7 1 7 (44.4%)
_(16.7%) (19.4%) (1 9.4%)
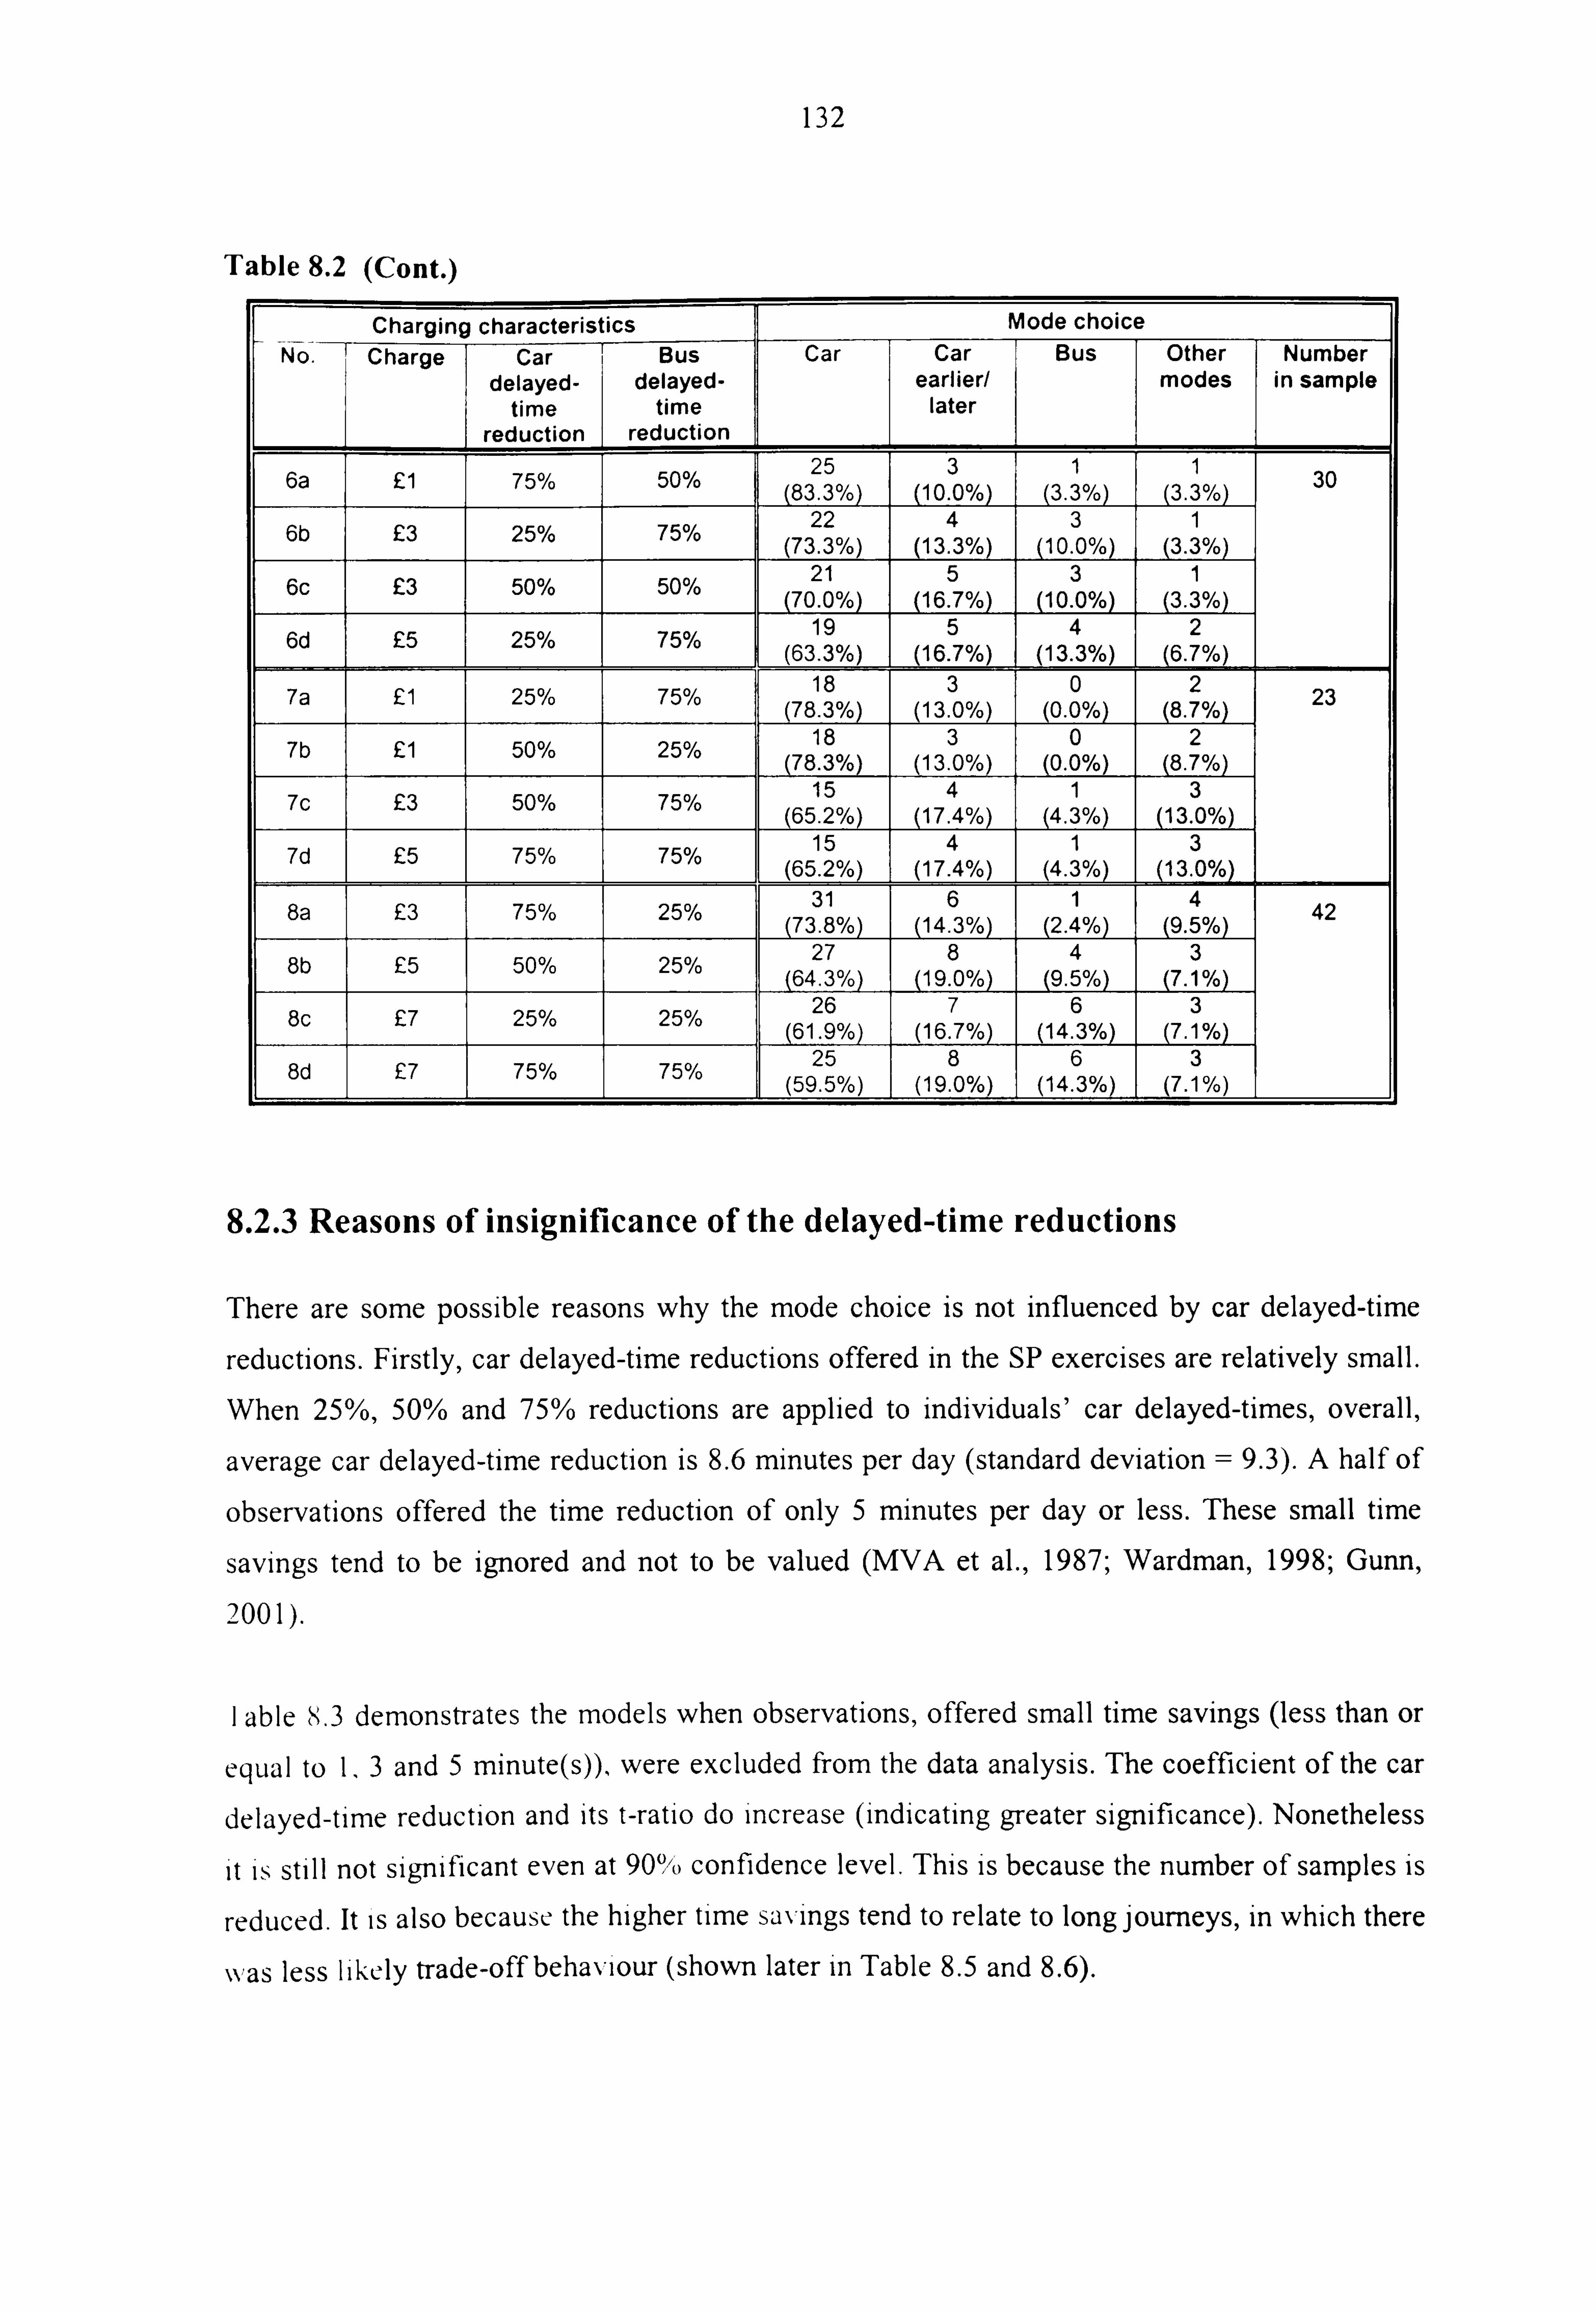
132
Table 8.2 (Cont. )
Charging characteristics Mode choice No. Charge Car Bus Car Car Bus Other Number
delayed- delayed- earlier/ modes in sample time time later
reduction reduction
6a El 75% 50% 25 3 1 1 30 (83.3%) (10.0%) (3.3%) (3.3%)
6b E3 25% 75% 22 4 3 1 (73.3%) (13.3%) (10.0%) (3.3%)
6c E3 50% 50% 21 5 3 1 (70.0%) (16.7%) (10.0%) (3.3%)
6d F5 25% 75% 19 5 4 2 (63.3%) (16.7%) (13.3%) (6.7%)
7a E1 25% 75% 18 3 0 2 23 (78.3%) (13.0%) (0.0%) (8.7%)
7b El 50% 25% 18 3 0 2 (78.3%) (13.0%) (0.0%) (8.7%)
7c E3 50% 75% 15 4 1 3 (65.2%) (17.4%) (4.3%) (13.0%)
7d E5 75% 75% 15 4 1 3 (65.2%) (17.4%) (4.3%) (13.0%)
8a F 3 75% 25% 31 6 1 4 42 - (73.8%) (14.3%) (2.4%) (9.5%)
8b E5 50% 25% 27 8 4 3 (64.3%) (19.0%) (9.5%) (7.1%)
8c E7 25% 25% 26 7 6 3 (61.9%) (16.7%) (14.3%) (7.1%)
8d U 75% 75% 25 8 6 3 1 1 (59.5%) (19.0%) (14.3%) 1 (7.1%)
8.2.3 Reasons of insignificance of the delayed-time reductions
There are some possible reasons why the mode choice is not influenced by car delayed-time
reductions. Firstly, car delayed-time reductions offered in the SP exercises are relatively small. When 25%, 50% and 75% reductions are applied to individuals' car delayed-times, overall,
average car delayed-time reduction is 8.6 minutes per day (standard deviation = 9.3). A half of
observations offered the time reduction of only 5 minutes per day or less. These small time
savings tend to be ignored and not to be valued (MVA et al., 1987; Wardman, 1998; Gunn,
2001).
I able 8.3 demonstrates the models when observations, offered small time savings (less than or
equal to 1,3 and 5 minute(s)), were excluded from the data analysis. The coefficient of the car
delayed-time reduction and its t-ratio do increase (indicating greater significance). Nonetheless
it is still not significant even at 90% confidence level. This is because the number of samples is
reduced. It is also because the higher time savings tend to relate to long joumeys, in which there
%vas less likely trade-off behaviour (shown later in Table 8.5 and 8.6).
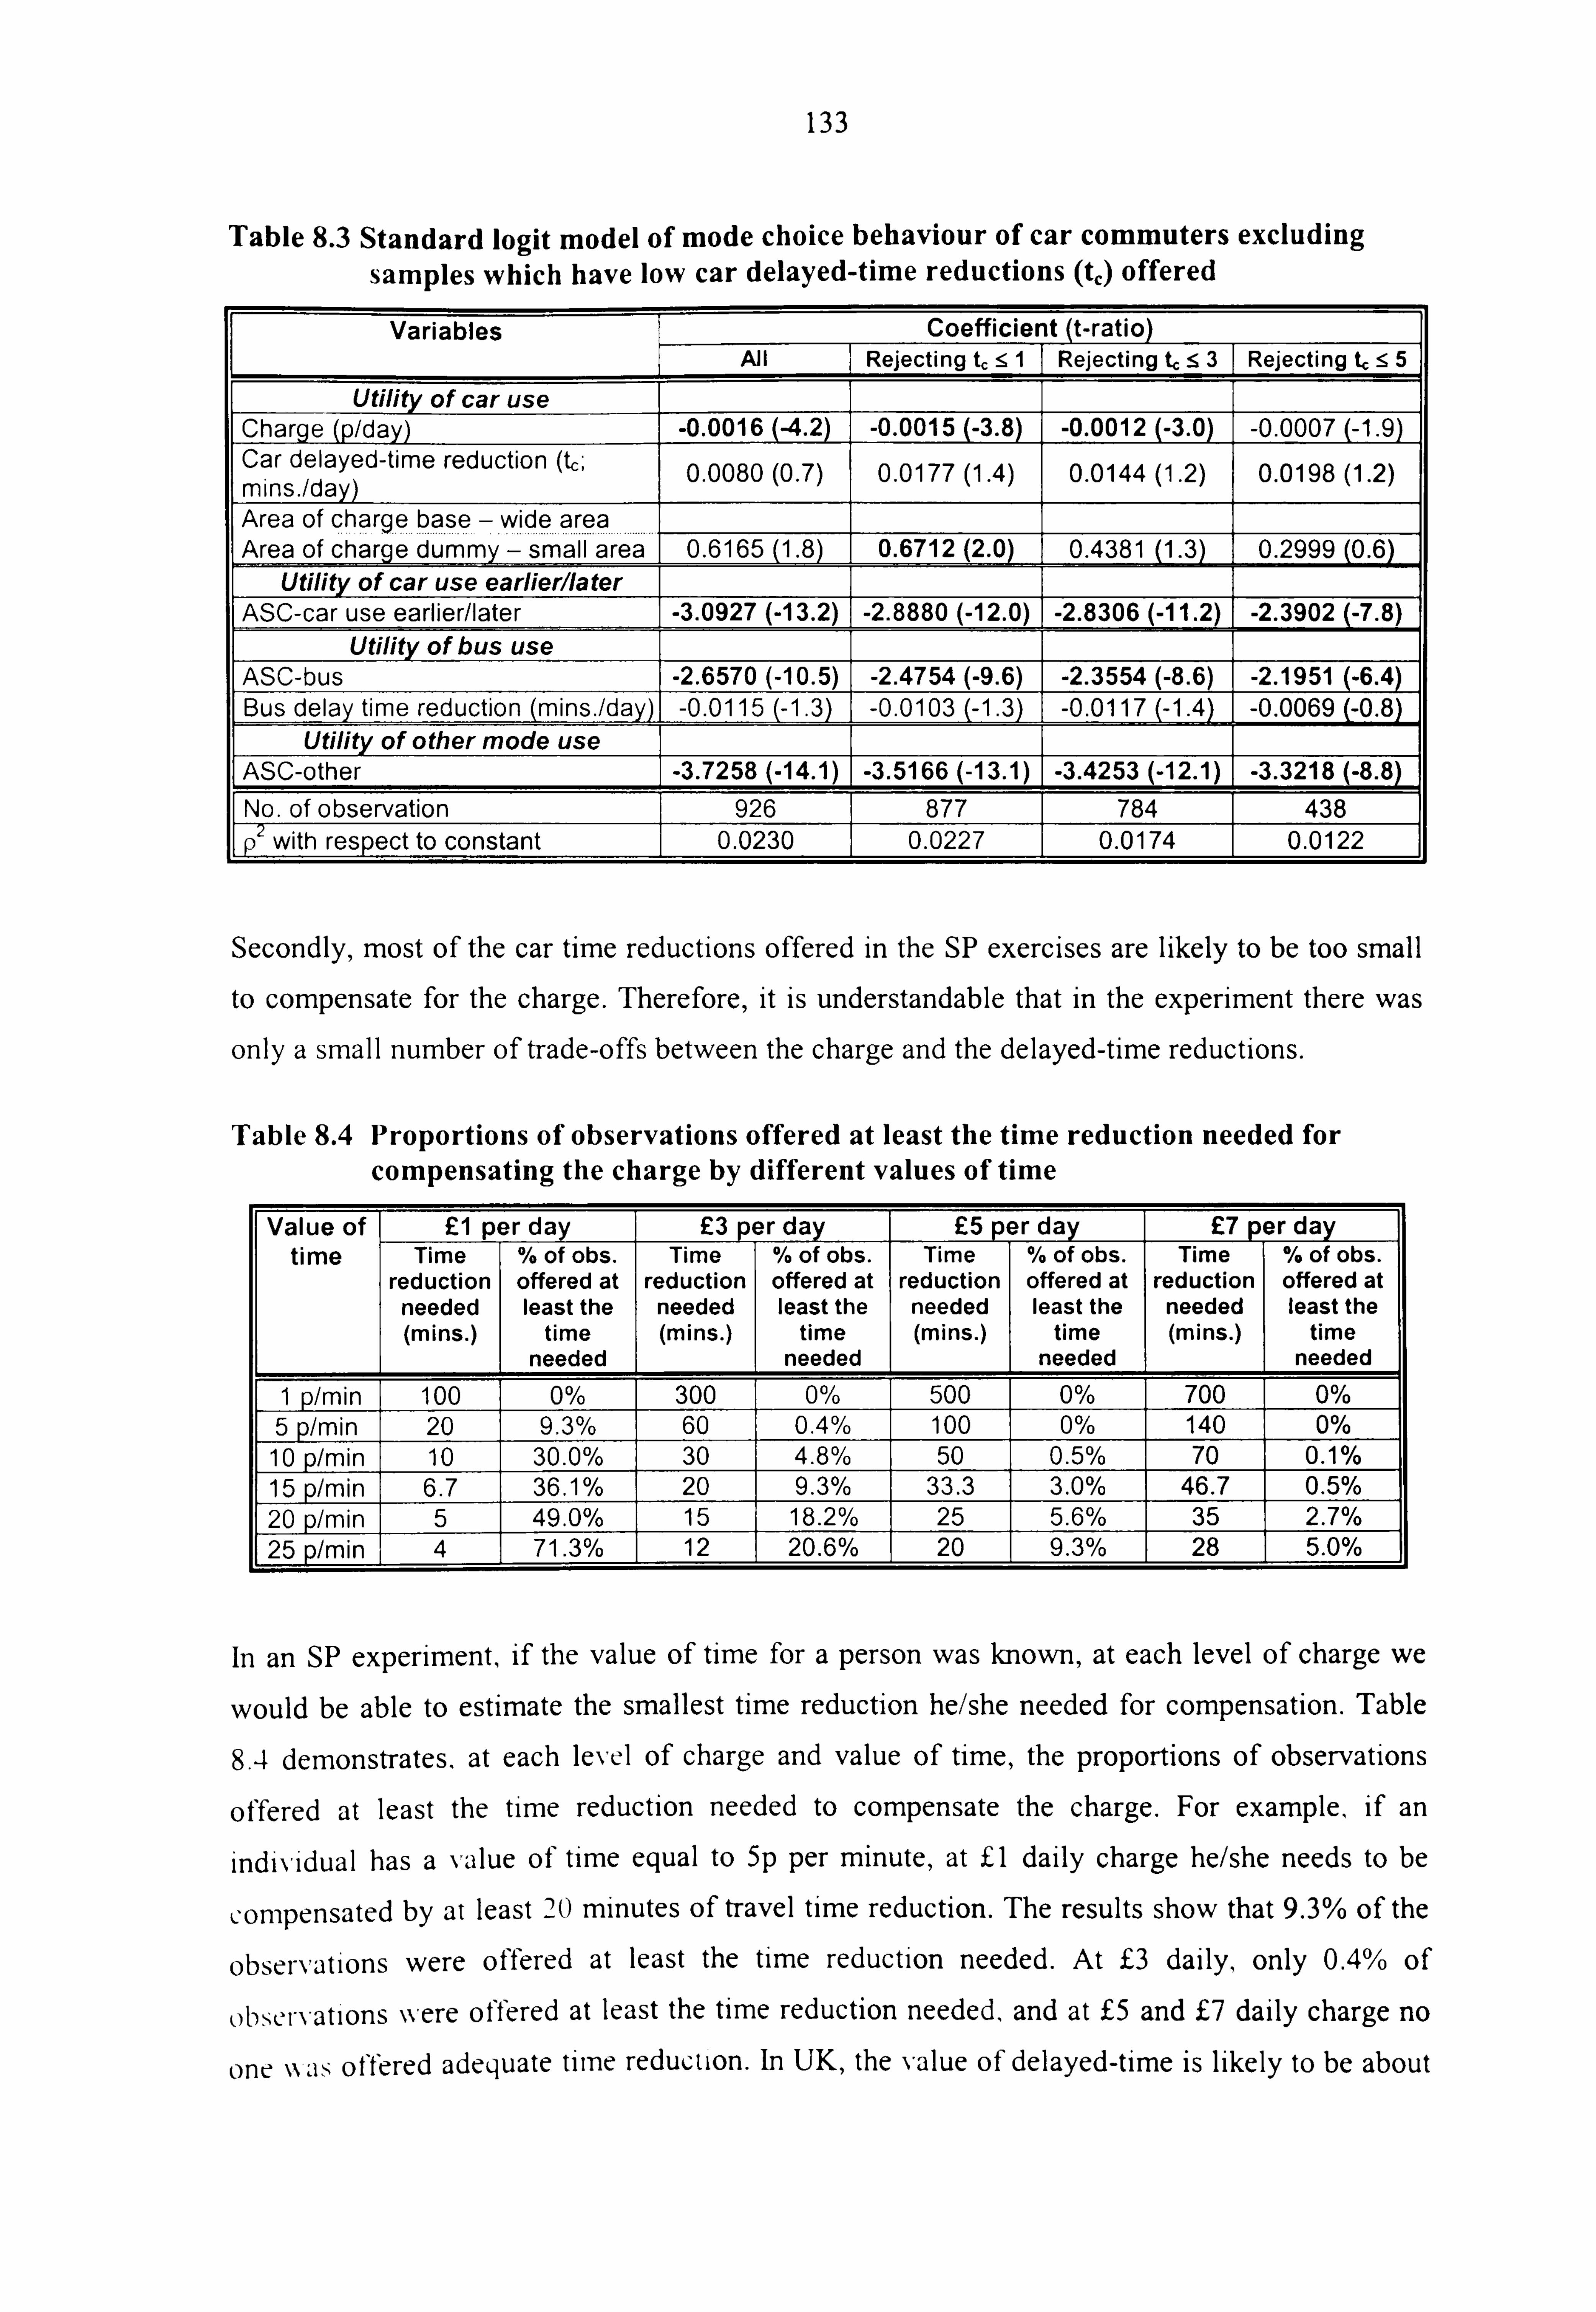
133
Table 8.3 Standard logit model of mode choice behaviour of car commuters excluding samples which have low car delayed-time reductions (tj offered
Variables Coefficient (t-ratio) All Rejecting t,::! 9 II Rejecting t, :53 1 Rejecting 1ý: 5 5
Utility of car use Charge (p/day) -0.0016 (4.2) -0.0015 (-3.8) -0.0012 (-3.0) -0.0007 (-1.9) Car delayed-time reduction (tc; mins. /day) 0.0080 (0.7) 0.0177 (1.4) 0.0144 (1.2) 0.0198 (1.2)
Area of charge base - wide area Area of Charge dummy
- small area 0.6165 (1.8) 0.6712 (2.0) 0.4381 (1.3) 0.2999 (0.6) Utility of car use earlierliater
ASC-car use earlier/later -3.0927 (-13.2) -2.8880 (-12.0) -2.8306 (-11.2) -2.3902 (-7.8) Utility of bus use
ASC-bus -2.6570 (-10.5) -2.4754 (-9.6) -2.3554 (-8.6) -2.1951 (-6.4) Bus delay time reduction (mins. /day) -0.0115 (-1.3) -0.0103 (-1.3) -0.0117 (-1.4) -0.0069 (-0.8)
Utility of other mode use I I ASC-other -3.7258 (-14.1) -3.5166 (-13.1) -3.4253 (-12.1) -3.3218(- No. of observation 926 877 784 438 p2 with respect to constant 0.0230 0.0227 0.0174 0.0122
Secondly, most of the car time reductions offered in the SP exercises are likely to be too small to compensate for the charge. Therefore, it is understandable that in the experiment there was
only a small number of trade-offs between the charge and the delayed-time reductions.
Table 8.4 Proportions of observations offered at least the time reduction needed for compensating the charge by different values of time
Value of El per day E3 pr day E5 pr day E7 per day time Time
reduction needed (mins. )
% of obs. offered at leastthe
time needed
Time reduction needed (mins. )
,
% of obs. offered at leastthe
time needed I
Time reduction needed (mins. )
% of obs. offered at leastthe
time needed I
Time reduction needed (mins. )
% of obs. offered at leastthe
time needed
1 p/min 100 0% 300 0% 500 0% 700 0% 5 p/min 20 9.3% 60 0.4% 100 0% 140 0% 10 p/min 10 30.0% 30 4.8% 50 0.5% 70 0.1% 15 p min 6.7 36.1% 20 9.3% 33.3 3.0% 46.7 0.5% 20 p/min 5 49.0% 15 18.2% 25 5.6% 35 2.7% 25 p/min 4 71.3% 12 20.6% 20 9.3% 28 5.0%
In an SP experiment, if the value of time for a person was known, at each level of charge we
would be able to estimate the smallest time reduction he/she needed for compensation. Table
8.4 demonstrates. at each level of charge and value of time, the proportions of observations
offered at least the time reduction needed to compensate the charge. For example, if an
individual has a value of time equal to 5p per minute, at El daily charge he/she needs to be
compensated by at least 20 minutes of travel time reduction. The results show that 9.3% of the
observations were offered at least the time reduction needed. At 0 daily, only 0.4% of
observations were offered at least the time reduction needed, and at f5 and 0 daily charge no
one \N as offered adequate tirne reduction. In UK, the value of delayed-time is likely to be about

134
10p per minute (discussed in Section 8.2.3). The results in Table 8.4 indicate that at 10p per
minute only a small number of observations were offered travel time reductions sufficiently to
trade off the charge over E3 per day
Thirdly, in addition to the small bus delayed- time reductions offered, it is also possibly because
for some people bus delayed-time may be less important, compared to other features of bus
services. Some important attributes, for example fare, frequency, reliability and punctuality,
were not made better. Other research (e. g. Stokes, 1996; CflT/MOFJ, 2001) found that the
public consider improving these features of bus services as more important than reducing travel
time, in making bus more attractive. In the SP experiment, individuals' responses were based on their own current situations and experiences of bus use.
Fourthly, car commuters may not find that the delayed-time reductions are believable. The small
reductions offered in the SP experiment may be close to day-to-day variations of their travel
time, for example because of travel in different times of day and on different roads or because of
random variations in traffic condition.
Finally, another reason for the insignificance of delayed-time reduction is that some people may
not like the presentation method of the reductions, which uses proportionate changes. This is as f'Ound by Widlert (1998), in which results may be different between SP experiments with and
without customisation of attributes into absolute valuesI. He also mentioned that between the
two presentations, price coefficients are not significantly different, but the time coefficient in the custornised fonn is significant higher; hence, this leads to higher value of time.
8.2.4 Effects of car and bus travel times
For the above reasons, the mode choice behaviour was not influenced by the delayed-time
i-eductions offered. Instead, the mode choice behaviour is likely to be influenced by total travel
time (current travel time - time reduction) and travel time difference between bus and car (total
bus travel time - total car travel time).
Fhe effects ofthe total car travel time are shown in Table 8.5. (The utility functions are similar
to the model in Table S. 1, but the total travel times are included instead of the time reductions. )
In the research the difference between SP experiments with and without custo isation of ti I nu i ime reduction presented was little known when the SP exercises Nvere designed. Although both forms were tested in the pilot studies, the problem Nvas not found because of the small sample.

135
The analyses were produced for the all car commuter sample, those whose total travel time is 40
minutes per day or less, and those whose total travel time is higher than 40 minutes per day.
Table 8.5 Logit model of mode choice behaviour showing the effect of total travel time
Variables Coefficient (t-rati )
All Total car travel time !ý 40 mins/day
Total car travel time > 40 mins/day
Utility of car use Charge (p/day) -0.0017 (-4.7) -0.0027 (-5.9) -0.0014 (-2.2) Total car travel time (mins. /day) 0.0122 (2.7) -0.0354 (-3.1) 0.0225 (2.3) Area of charqe base - wide area Area of charge dummy - small area 0.6165 (1.8) 0.7409 (2.0) 0.5873 (0.5)
Utility of car use earlierllater ASC-car use earlier/later -2.8061 (-11.8) -4.4528 (-11.1) -1.7753(
Utility of bus use ASC-bus -2.5758 (-10.8) -3.8028 (-9.0) -1.9363 (-3.9) Total bus travel time (mins. /day) -0.0006 (-0.3) -0.0088 (-1.2) 0.0016 (0.4)
Utility of other mode use [ASC-othe
-3.4347 (-12.9) -4.8803 (-11.8) -3.7212 (-4.4)
No. of ob ervation 926 708 218
p2 with respect to constant 0.0287 0.0515 0.0419 Log likelihood at convergence -587.2396 -463.2937 - 109.3 1_ýl
In the overall model, the coefficient of the total car travel time is positive. This is implausible in that long Journey times are preferable to shorter journey times. However, the effect is different
between the short and long travel times. For the short journey (total travel time less than or
equal to 40 minutes), the effect of car travel time is negative. Utility of car use falls when total
time increases. For long journeys (total travel time more than 40 minutes), it is likely that bus
services may be poor, e. g. less frequency. Car commuters would prefer to use their car, even
when car travel time increases.
Flie coefficient of total bus travel time is not significant, indicating that car commuters are not likely to consider bus travel time in their mode choice. Alternatively, they may already consider bus travel time in comparison to car travel time. As reported in Section 5.2.1, the average bus
journey time to work inside the inner areas of Leeds and London is about double the average car
journey time. Since the bus time reductions are small, there is still a big difference between car
and bus journey time for car commuters. For most respondents, journey to work by bus is still
much longer than by car. Only V/'O of the observations were offered bus journey time less than
cal-joumey time.
Table 8.6 shows the effect of time difference between commuting by bus and by car (Total bus
travel time -- Total car travel time). On average, for the whole sample, the coefficient of the time

136
difference has a significantly positive sign, as expected; greater the travel time difference
between bus and car, the more preference for use of the car.
The different ranges of the travel time difference are considered to have an effect. This is because it is expected that when bus travel time is very much longer than car traý'el time, bus
tends to be less frequent and/or have a long access walk time. Car would be preferable to bus,
and car commuters may not be concerned about the time difference. Thus, in addition to the
overall model, three separate models are estimated for: (a) bus travel time is less than 1.5 times longer than car travel time, (b) bus travel time is 1.5 times but less than twice as long, and (c)
bus travel time is twice as long or more.
Table 8.6 Logit model of mode choice behaviour showing the effect of time difference between commuting by bus and car for car commuters
Variables Coefficient (t-ratio) All Ratio of bus
and car travel time < 1.5
1.5: ý Ratio of bus and car
travel time <2
Ratio of bus and car travel
time ý! 2 Utility of car use
Charge (p/day) -0.0017 (-4.4) -0.0028 (-3.9) -0.0017 (-3.5) -0.0014 (-1.9) Time difference between commuting by bus and by car (mins. /day) 0.0137 (3.3) 0.0235 (1.8) 0.0267 (3.0) 0.0014 (0.3)
Area of charge ýp " §e 7,, w* iq
-" Pre
*a Area of charge dumMy - small area 0.5986 (1.8) 0.2577 (0.4) 1.1085 (1.8) 0.2414 (0.4) Utility of car use earlierllater
ASC-car use earlier/later -2.8501 (-12.6) -3.5991 (-8.4) -2.4650 (-9.0) -3.0629 (-7.4) Utility of bus use
ASC-bus -2.6540 (-12.1) -2.9750 (-7.7) -2.1466 (-8.6) -3.6225 (-8.0) Utility of other mode use I
ASC-other -3.4787 (-13.9) 1 -3.7422 (-8.5) -3.8513 (-8.6) -3.5425 (-7.9)
No. of observation 926 268 327 331
P' with respect to constant 0.0306 0.0528 0.0445 0.0110 Log likelihood at convergence -588.1252 -185.1926 -209.1267 -180.4326
When the ratio of bus travel time to car travel time is less than 1.5 times, the effect of charge is
i-clatively high. The charge has a high effect on influencing car commuters to change travel
mode. The effect of the travel time difference is also relatively high, although it is significant at 90`0 confidence level (probably because of the small number of samples). This is possibly because for the loxv ratio, buses are more acceptable than for the higher ratio, and car users are
more likelv to switch from car to bus.
When the ratio is between 1.5 and 2, the effect of charge is less than for the lower ratios. The
effect of time difference is slightly different from the one for the lower ratios. It is significant at
95% confidence level.

137
When the ratio of bus travel time to car travel time is equal or more than 2. travel by buses Is
very slow, compared to travel by cars. The effect of charge is relatively lov,,, and significant
only at 90% confidence level. Charge has less effect on influencing mode switch. The effect of time difference is very low. As mentioned earlier, this is because there was less likely to be a trade-off between the charge and travel time. Buses are likely to be unacceptable. Car is much
more preferable than bus, or other modes.
The overall model demonstrates that when the time difference between bus and car increases. the utility of car use will increase; car use is more preferable. The model provides a reasonable
value of time equal to 8.1p per minute, which is close to the value reviewed in Wardman
(2001b), (discussed in Section 8.2.3). This model is considerably better in explaining the mode
choice behaviour than the models including the delayed-time reduction and total travel time. Nevertheless, the three separate models show that when the ratio of bus travel time to car travel
time increases the effect of the time difference and charge tends to fall. This is taken into
account later in developing a preferred model in Section 8.2.6.
Moreover, the ASCs for 'car earlier/later', bus and other modes are highly significantly
negative, indicating that these alternatives have difficulty in competing with car, unless the
charge is high. They represent unmeasured factors, which influence mode choice and cannot be
included in the experiment. For example, some car commuters may have restrictions on the
alternative choices available. Some cannot change to travel before or after the charge. Some
may have no other alternatives e. g. rail. For some commuters destinations may be too far to
consider walking and cycling as options. Some may have long walking distance to access bus
stops and/or less frequent bus service.
8.2.5 Simulation test
In order to improve the SP experiment to evaluate the value of delayed-time reduction, the
experiment should increase the variations of delayed-time reduction. It is not appropnate to do
this by directly increasing the reduction to more than 75% of delayed-time. The hypothetical
can be done by scenarios may be unrealistic to respondents. On the other hand, II ing
rnore congestion in the SP experiment (presenting respondents with a congested network Nvhen
tliere i,, rio road tiser chan, ii,, )- the level of the delayed time to be reduced.
Althougli it \vas too late for this study to collect new data set, a simulation test (Section 3.3.2)
\\as used to demonstrate that increase of' the delayed-time reduction \vas able to improve the

138
results of the mode choice model. Synthetic data was created from know utility weights. It
considered only two choices: car and bus.
Ucar = ASCcar + 81. charge + 82 . car delayed-time reduction + el
Ubus 83 . bus delayed-time reduction + c2
The utility of car use is a function of ASC (indicating preference of car over bus), charge, car delayed-time reduction and error. The utility of bus use is a function of bus delayed-time
reduction and error. The utilities of car and bus use were generated for each observation, when
the ASC and coefficients were given and other parameters were known. The synthetic response
was dependent on which choice has higher utility.
The charges offered to respondents in the SP experiment were used. The car and bus delayed-
time reduction were based on the data collected from each observation, so sample size of the
simulation responses is equal to the actual data. The random errors were estimated from
&= Ln[ -Ln(random nuinber)] /A; where random number is generated between 0 and 1, and k is known as the scale factor 7r I(V6 - (7) ;a is standard deviation of the error Ej. This is
based on the Gumbel distribution of the error (see Chapter 3).
The simulation was tested for the values of car delayed-time reduction 5 and 10 p/min and the
values of bus delayed-time reduction I and 5 p/min. In the calculation of the utilities, the initial
coefficient of the charge was assumed to be equal to -1, and the coefficients of car and bus
delayed-time reductions were 10,5 and 1, when the values of time were assumed to be 10,5 and I p/min. The coefficient of bus time is likely to be lower than the coefficient of car time; the
value of bus time is expected to be lower than the value of car time. This is because for car users
car is more preferred than bus-, they tend to keep using their cars. To them car time reduction is likely to be more important than bus time reduction. (This aspect is different from the case
revic\\ed by Wardman (2001b) in that car users have higher values of bus time than car time,
because the disutility of a unit of bus time is higher than for car time. )
For each value of time, two sets of synthetic responses were created. One has proportion of
choosing car about 60%, and the other 80% (covering the proportion of car use in the data
collected from Leeds and London). These were achieved by varying the ASC-car: the higher the
ASC, the higher car use. The standard deviation was varied in the estimation of the random
error to obtain the goodness-of-fit index (P) close to the one in the data analysis in Table 8.1
(p2 = 0.023).

139
Thc model results analysed from the synthetic responses are shown in Table 8.7. Using the time
reductions offered in the SP experiment, at the values of car delayed-time 5 p/min and bus
delayed-time I p/min, the results are quite close to the model (Table 8.1) analysed from the
actual responses. The coefficient of car delayed-time reduction is far from the significance at 95% confidence level. At the value of car delayed-time 10 p/min, the coefficient is about
significant. When values of both car and bus delayed-time are 5 p/min, the coefficients of car
and bus delayed-time are significant.
When using twice the delayed-time reductions for each individual of these in the SP experiment, the coefficient of car delayed-time reduction becomes more significant, ever at the value of car delayed-time of 5 p/min. The goodness-of-fit indexes also increase. These results demonstrate
that the SP experiment would be likely to be improved, if respondents had been offered higher
variations of delayed-time reductions.
Table 8.7 Simulation results from the synthetic responses
Assump tion for creating synthet ic data Mod el results from analysin the synthetic data Assumed Standard Initial % of P2 ASC-car Coeff. of Coeff. of Coeff. of value of deviation ASC-car car use charge car bus delayed- delayed- delayed-
time time time reduction reduction
Using car and bus d layed-time reductions offered to respon dents 5 p/min 500 60% 0.0277 0.6631 -0.0016 0.0106 -0.0001 for car 800 (5.3) (-6.5) (1.4) (0.0) 1 p/min 1200 81% 0 0215 1.716 -0.0013 0.0085 -0.0037 for bus . (10.8) (4.6) (0.8) (-1.0)
10 p/min 500 61% 0393 0 1.034 -0.0019 0.0178 0.0038 for car 800 . (7.9) (-7.7) (2.2) (1.4) 1 p/min 1100 80% 0 0446 2.122 -0.0021 0.0219 0.0041 for bus . (12.5) (-7.0) (2.1) (1.3) 5 p/min 700 61% 0.0322 1.163 -0.0015 0.0159 0.0113 for car 800 (8.8) (-6.1) (2.0) (3.9) 5 p/min 1300 79% 0.0310 2.013 -0.0016 0.0199 0.0089 for bus (12.5) (-5.4) (2.0) (3.0)
Using twice car and bus delayed-time re ductions offered to espondents 5 p/min 500 60% 0.0864 0.7514 -0.0014 0.0094 0.0014 for car 800 (6.0) (-6.0) (2.3) (1.0) 1 p/min 1100 79% 0.0597 1.705 -0.0014 0.0098 0.0017 for bus (11.2) (-5.0) (2.0) (1.1)
10 p/min 500 62% 0.0960 0.8254 -0.0017 0.0148 0.0008 for car (6.4) (-7.0) (3.4) (0.6) 800 1 p/min 1100 0.0730 1.658 -0.0017 0.0130 0.0014 for bus (10.4) (-5.9) (2.4) (0.7) 5 p/min 800 61% 0.0455 1.314 -0.0017 0.0066 0.0084 for car 0 (10.4) (-7.3) (4.5) (4.4) 80 5 p/min 1400 80% 0.0527 I 2.382 ýj -0.0018 0.0074 0.0073 F for bus (14.6) (-6.3) (5.1) (4.9)

140
8.2.6 Preferred model
The objective of this section is to develop the mode choice behaviour model, in order to use it in forecasting reduction of car commuting for different charging systems. The initial models, in Section 8.2.1, demonstrated that car use is much more preferable for car commuters than other
modes, though charging would be able to affect mode switch. In the SP experiment, the car and bus delayed-time reductions offered have small variations. Some of the reductions offered were
too small to trade-off with the charge. Thus, in the model, car and bus delayed-time reductions
were not significant affecting mode choice. However, based on the model in Table 8.6, utility of
car use is significantly affected by the travel time difference between bus and car. Furthermore
it is also shown that the coefficients of the charge and time difference are also related to the
relationship between the amounts of bus and car travel time (the ratio of bus and car travel
time).
Therefore, the utility functions for the four responses are set as Equation 8.2. The functional 1ý1 . form, (Time ratio) , is included in the utility function of car use, in order to allow the
coefficients of the charge and time difference to vary with the time ratio, which is the ratio of bus to car travel time. Since the magnitudes of the effects of the time ratio are unknown, A. was
achieved from trials (to get the best 'fit' model). In the sample, bus travel times of most
observations (94%) are higher than car travel times; most time ratios are higher than one. Thus,
? ý, can be expected to be negative because the coefficients of the charge and time difference have
been found to decrease when the time ratio increases (as shown in Table 8.6). This means that
\\,, hen the proportion of bus and car travel time is very high, the mode choice is less sensitive to
the charge and time difference. Commuters would tend to keep using their car. On the other
hand, when the ratio is small, the mode choice is highly sensitive to the charge and time
difference. For example, at the same amount of time difference 20 minutes, when bus and car
travel times are 120 and 100 minutes (lower time ratio) mode switch would be higher than when
the tra\, e] time are 40 and 20 minutes (higher time ratio). Therefore, there are likely to be
mteraction effects between the time difference and the time ratio, and between charge and the
time ratio.
It should be noted that the coefficients 01 and 02 in Equation 8.2 are estimated for the whole
function of [Charge. (Time ratio)'ý'] and [(Tb,,, - Tcar). (Time ratio) )-2 . (Distance)'], respectively.
For each individual, the coefficients of charge and time difference (Tbus-Tcar) are dependent on
the individuals' time ratio and travel distance. Hence, individuals' coefficients of the charge and
time difference are [0/. (Time ratio)"'] and [0jime ratioY-2. (Distance)'], respectively.

141
Ucar 01 [(Charge). (Time ratio) A, ]
* 02 [ (Timebus - Timecad -
(Time ratio), I,. (Distance/]
* 03 (Area of charge) * 04 (Time of charge) * 05 (Method of charge)
Where: Time ratio = Bus travel time Car travel time
Ucar earlier1later = ASccar
earlierllaler
Ubus = ASCbu,
Uother = ASC,
(Equation 8.2)
Moreover, in empirical studies reviewed by Wardman (200 1 a, 200 1 b), time savings on longer
distance journeys are more highly valued. This Is because of fatigue, boredom and discomfort of long journeys. It may also be because for longer distance journeys there are higher opportunity
cost of time travelled and more pressures on the total time budget than for shorter distance
journeys. Hence, in order to allow the value of time to increase with journey distance, the
function of distance, (Distance)', is included in the utility of car.
The utility of car use also includes other charging system characteristics: area of charge, time of
charge and method of charge. The utilities of alternatives are the alternative specific constants
(ASCs), indicating preference of each option compared to preference of car use.
In addition, journey distance may also have an effect on the ASCs, in which a longer journey
distance may have higher disutility of alternatives than a shorter distance. However when the ASCs were allowed to vaiy with the distance, the model was not improved.
The estimation results of the coefficients and their t-ratios are shown in Table 8.8. Four models
are presented. Model I does not include the effects of the time ratio and distance. Model 2
constrains the effect of the time ratio on charge and time difference to be the same, with no
distance effect. This model achieves the best fit when X, = X2= -0.5. Model 3 allows different
effects of the time ratio on charge and time difference, with no distance effect. The best-fit
model is where X, and X2 are equal to -0.2 and -0.7, respectively. This model is slightly better

142
than model 2. The last model, Model 4, includes the effect of distance2. The distance elasticity (y) on the value of time for car taken from Wardman (2001b) is 0.259. This model is superior in
explaining the mode choice behaviour. This is indicated by the increase of P2 to 0.0402. It is
also pointed out by the increase of t-ratios, showing that the coefficients are more precise. On
average, all models indicate reasonable values of time, approximately 8-9p per minute.
Table 8.8 Preferred standard logit model of mode choice behaviour of car commuters Variables Coefficie t (t-ratio)
Model 1 X, =0 X2= 0
y=0
Model 2 ki = -0.5 X2 = -0.5
y=0
Model 3 ki = -0.2 X2 = -0.7
y=0
Model 4 X, = -0.2 X2 = -0.7 y=0.259
Utility of car use Charge . (Time ratio) -0.0017 (-4.4) -0.0020 (-4.6) -0.0019 (4.7) -0.0021 (-5.9) (Tbus
- Tcar) . (Time ratio) X2.
(Distance)y 0.0137 (3.3) 0.0161 (2.9) 0.0222 (3.4) 0.0119 (4.5) Area of charqe base - wide area
........................... ................................................................................... .... --- ................ Area of charge dummy - small area .... ............................................ ..... .... ..... 0.5986 (1.8) ......... .............. 0.5639 (1.8) ..... ................. ............. .... 0.5809 (1.7) ............... 0.7592 (2.1) Utility of car use earlierllater
ASC-car use earlier/later -2.8501 (-1 -2.8656 (-12.9) -2.8812 (-13.0) -2.9378 (-15.6) Utility of bus use 77ý
ASC-bus 1-2.6540 (-12.1) -2.6695 (-12.4) -2.6851 (-12.5) -2.7355 (-15.3) Utility of other mode use F - 1 -
-SC-other A 1-3.4387 (-13.9) 1-3.4942 (-13.8)1 -3.5098 (-13.9) -3.5325 (-15.9) No. of observation 926 926 926 894 p2 with respect to constant 0.0306 0.0322 0.0329 0.0402 Log likelihood at convergence -588.1252 -587.1360 -586.6898 -566.8784 Mean of value of time 8.06 8.05 8.79* 8.40*
* Value of time is the average of individuals' values of time (the sample enumeration approach)
Hic rcsults demonstrate that the utility of car use is influenced by the charge and the difference
bet\\, een bus and car travel time. When the charge increases, car use preference will fall, but
\N,, hen the time difference increases, car use ývill be more preferred. In addition, mode choice is
affected by time ratio of bus travel time to car travel time. The lower the ratio, the more
opportunity for bus to compete with car. Car use preference also relates to individuals' travel
di stance. For long distance j ourneys, cars are more preferred than for short j oumeys.
The effects of the remaining factors are similar to the results in Table 8.1. Car is much more
preferable than other modes for commuting. This is indicated by the high negative effect of
ASCs. The small area of charge is of positive sign, compared to the wide area. Charges in the
\vide area would generate less car use than in the small area. The other variables: time of charge
I-lic trial and error method was unable to achieve a best-fit model because the p' did not converge to an optimal value. Mus the distance effect has to be transferred from other studies.

143
and method of charge are not significant in influencing the use of car (as discussed in Section
8.1).
'I able 8.9 reports the values of time for different ranges of journey distance. These values were
estimated by using the sample enumeration approach, in which the average value of time was
achieved from the mean of individuals' values of time. Each individual value of time was the
ratio of the individual's time and charge coefficients, which was dependent on his/her time ratio
of bus to car and j oumey distance. The average value of time for the whole sample is 8.4 p/min.
Table 8.9 Values of time based on the sample enumeration approach for different ranges of journey distance
Distance (miles travelled per day)7
Value of time
_(j2/min)
Standard error
0-5 5.5 0.19 5-10 7.4 0.16 10-15 8.1 0.22 15-20 9.1 0.25 20-50 10.6 0.29 50+ 13.8 0.54
Average 8.4 0.15
Table 8.10 reports the values of time for different distances. These values are the ratios of the
mean coefficients of time and charge (in Model 4 Table 8.8), when the time ratio is 2. From the
whole sample, the average of daily commuting distance is 19.0 miles per day (std. 21.6) and the
average time ratio is 1.96 (std. 0.71). When the distance is 20 miles and the time ratio is 2, the
value is 8.7 p/min, which is close to the value achieved from the appropriate mean of
individuals' values of time (although it is not necessary that the mean of ratios is equal to the
ratio of the means).
Table 8.10 Values of time based on the mean coefficients for different distances travelled
Distance (miles travelled per day)
Time ratio of bus to car
Value of time (p/min)
Value of time from Wardman (2001b)
(p/min) 2 2.0 4.8 4.6 5 2.0 6.1 5.9 10 2.0 7.3 7.0 15 2.0 8.1 7.8 20 2.0 8.7 8.4 25 2.0 9.2 8.9 50 2.0 11.0 13.8

144
Although this study does not aim mainly to estimate value of time, the value of time achieved from the mode choice model should be plausible. The value of time can be checked with the
review of the UK values of time by Wardman (1998,2001a, 2001b).
Fhe values for different journey distances are close to the UK values of time, calculated from
the model developed by Wardman (2001b), in 2000 for car commuters in non south-east areas. It should be noted that the values from the study in Table 8.10 were averages for Leeds and London sample (with only 10% from London). (In the south-east area, Wardman found that the
value of time is 16% higher. ) The value of time for 50 miles travelled is rather different from
Wardman's value because it is outside the range of the sample (90% of respondents travelled
less than 40 miles).
Table 8.11 reports the values of time for different time ratios of bus to car, estimated from the
ratios of the coefficients of time to charge (in Model 4 Table 8.8). The lower time ratios have
higher values of time than the higher time ratios. For the lower ratios, car commuters are more likely to switch mode. On the other hand, for the higher ratios they tend to keep using car and less consider on the charge and time. When the ratio increases, the effect of charge on mode
chai-ige falls but the effect of time falls more rapidly (see Table 8.6). Thus the value of time decreases.
Table 8.11 Values of time based on the mean coefficients by different time ratio
Distance (miles tray2ýýr day)
Time ratio of bus to car
Value of time (p/min)
20 1.0 12.3 20 1.2 11.2 20 1.4 10.4 20 1.6 9.7 20 1.8 9.2 20 2.0 8.7 20 2.5 7.8 20 3.0 7.1
8.3 Mode Choice Behaviour Variation among Groups of the Public
The preferred basic model, in the previous section, demonstrates the average effects of the
cliar, ging systems fi-om the whole sample. It is likely that different groups of people respond
differently to charging systems. For example, some groups may be more sensitive to the charge
and time than others. Some may have different preferences for other modes. To examine this
eftect, the segmentation analysis (Section 3.4.3) was applied on the preferred model, Model 4 in
Table 8.8. Respondents were segmented by personal characteristics: household annual income,
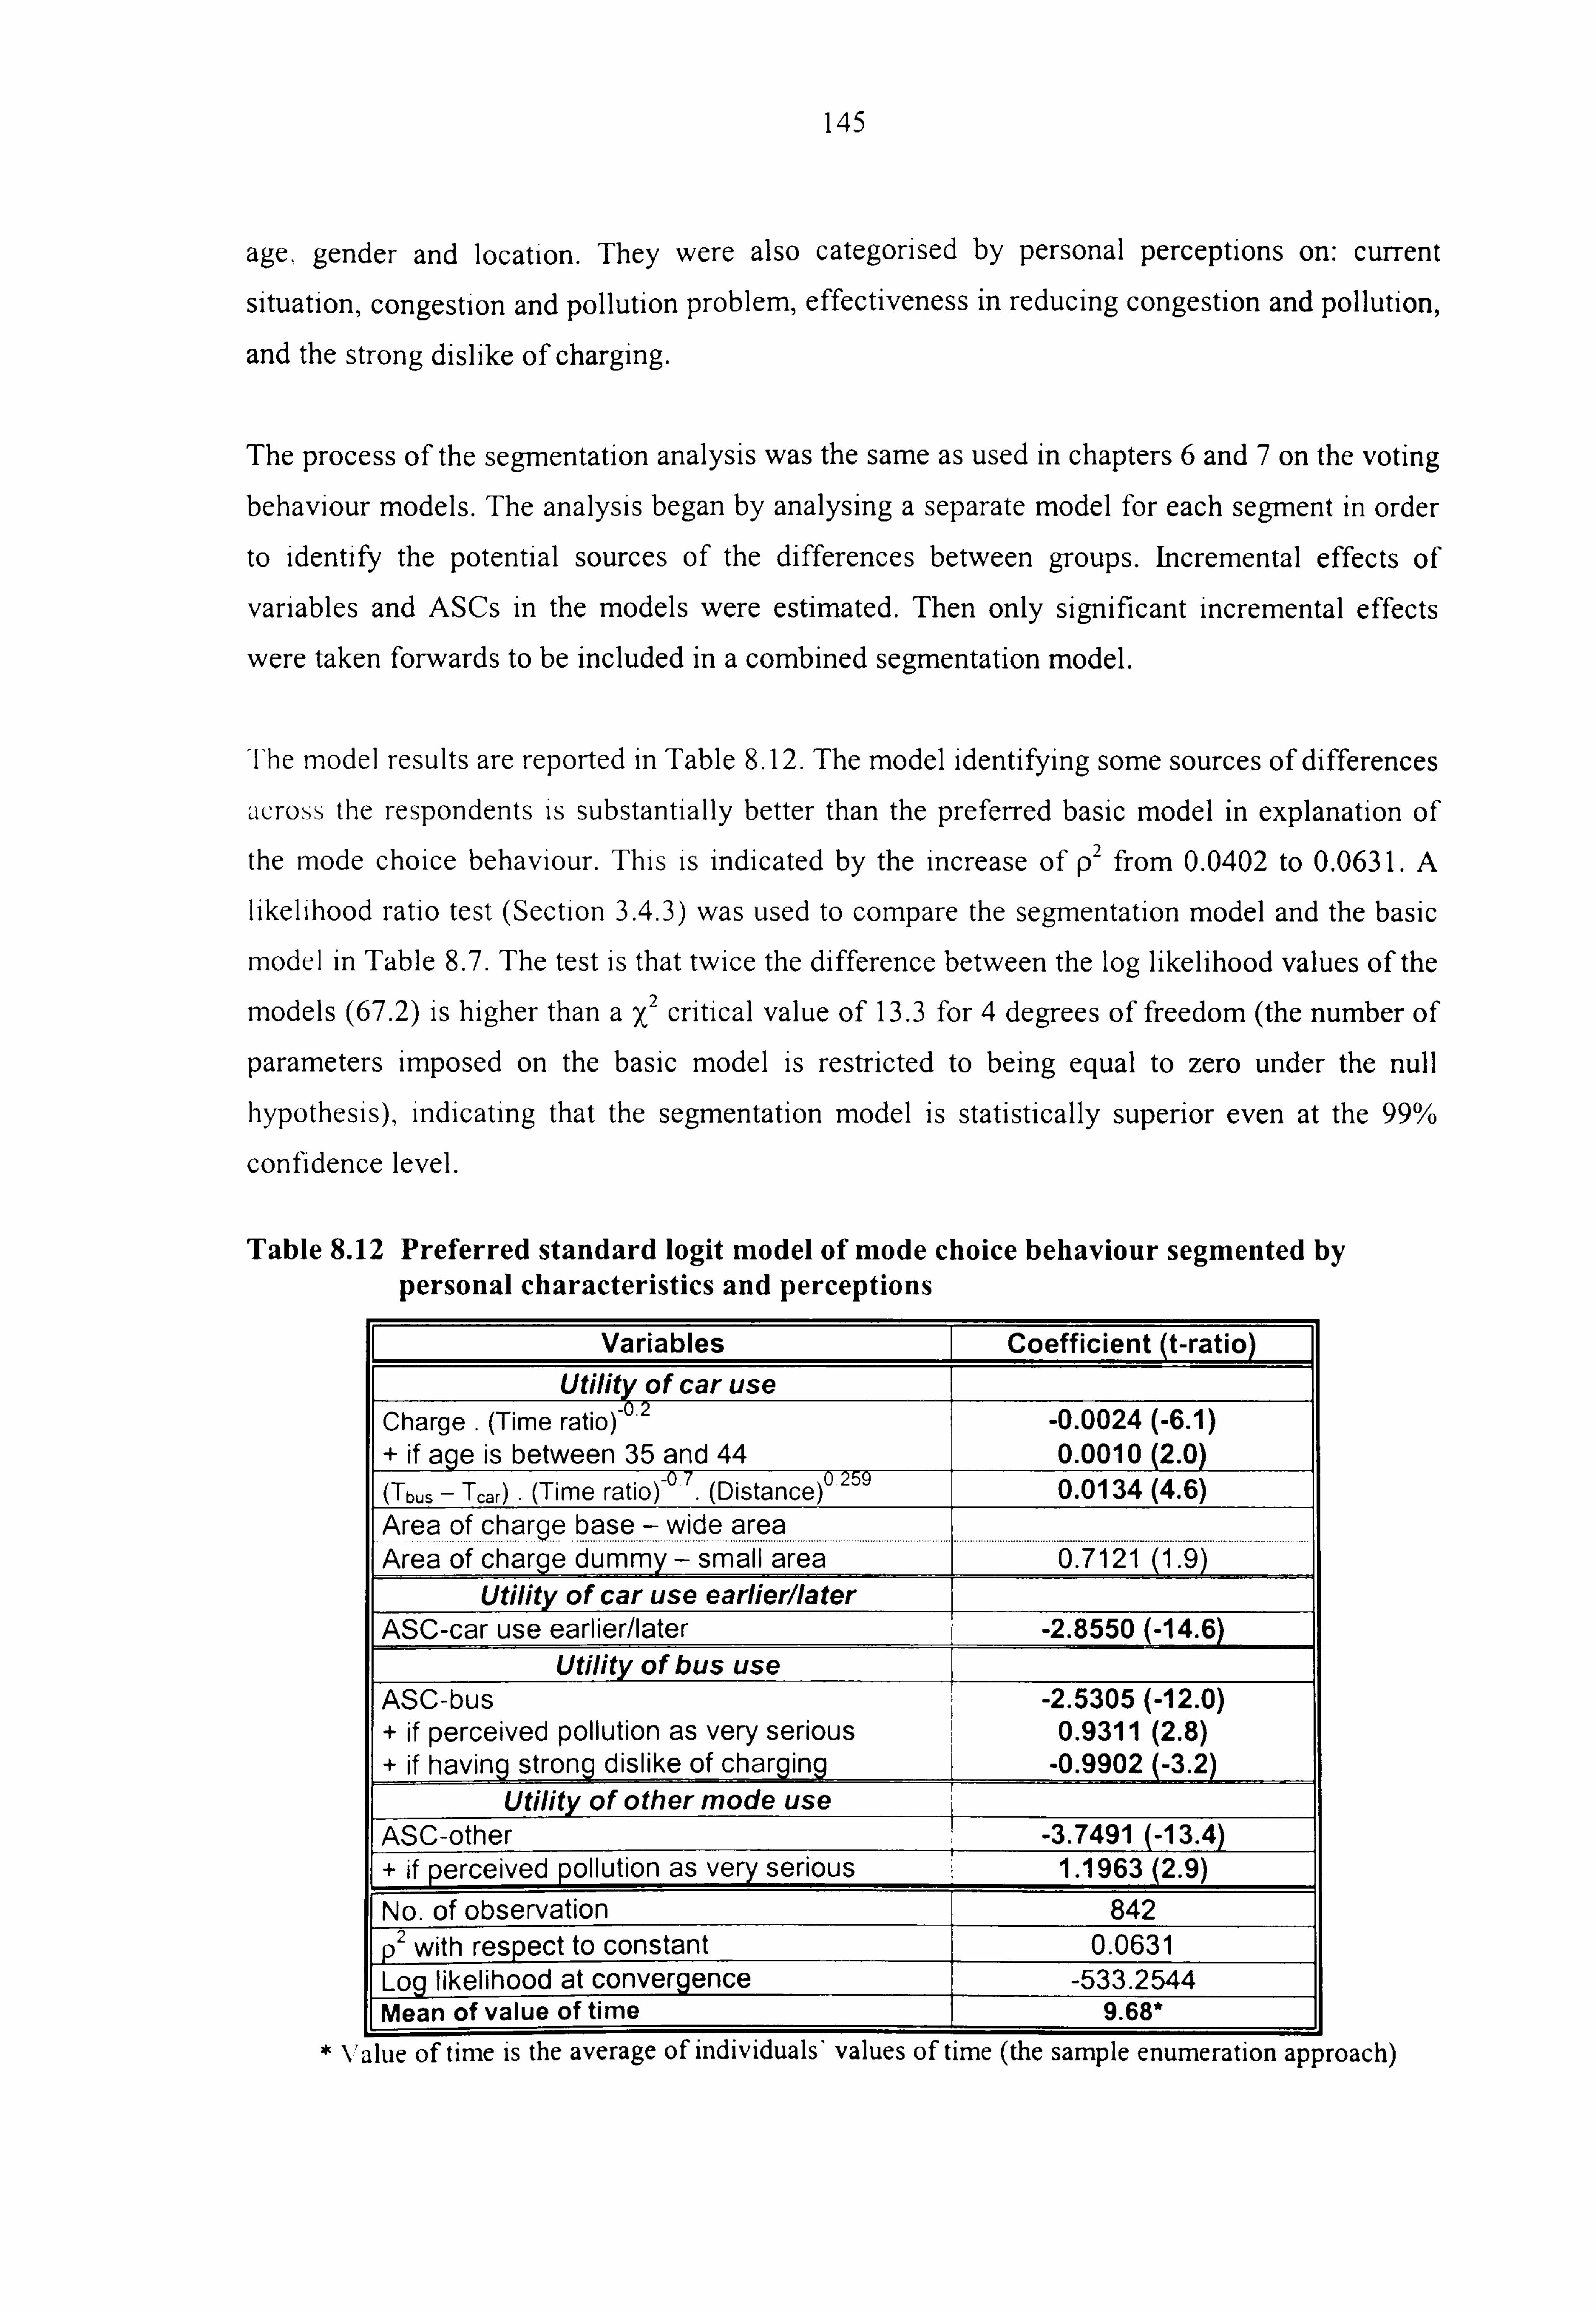
145
age, gender and location. They were also categorised by personal perceptions on: current
situation, congestion and pollution problem, effectiveness in reducing congestion and pollution,
and the strong dislike of charging.
The process of the segmentation analysis was the same as used In chapters 6 and 7 on the voting behaviour models. The analysis began by analysing a separate model for each segment in order to identify the potential sources of the differences between groups. Incremental effects of
variables and ASCs in the models were estimated. Then only significant incremental effects
were taken forwards to be included in a combined segmentation model.
The model results are reported in Table 8.12. The model identifYing some sources of differences
across the respondents is substantially better than the preferred basic model in explanation of the mode choice behaviour. This is indicated by the increase of p' from 0.0402 to 0.0631. A
likelihood ratio test (Section 3.4.3) was used to compare the segmentation model and the basic
model in Table 8.7. The test is that twice the difference between the log likelihood values of the X2 models (67.2) is higher than a, critical value of 13.3 for 4 degrees of freedom (the number of
parameters imposed on the basic model is restricted to being equal to zero under the null hypothesis), indicating that the segmentation model is statistically superior even at the 99%
confidence level.
Table 8.12 Preferred standard logit model of mode choice behaviour segmented by personal characteristics and perceptions
Variables Coefficient (t-ratio) UUNY of car use
Charge .
(Time ratio)-u, 2
+ if age is between 35 and 44 -0.0024 (-6.1) 0.0010 (2.0)
(Tbus- Tcar) . (Time ratio)-()
7. (Distance)
0.259 0.0134 (4.6)
Areaof. coarqe býasie. 7 yvioe aý ýa . -I.. Area of charge dumLny_::: small area -. - ................................................ - ............. ... . 0.7121 (1.9) Utility of car use earlierllater
ASC-car use earlier/later -2.8550 (-14.6) Utility of bus use
ASC-bus + if perceived pollution as very serious + if having strong dislike of charging
-2.5305 (-12.0) 0.9311 (2.8)
. 0.9902 (-3.2) Utility of other mode use
ASC-other . 3.7491 (-13.4) + if perceived pollution as very serious 1.1963 (2.9) No. of observation 842
02 with respect to constant 0.0631 Log likelihood at convergence -533.2544 Mean of value of time 9.68*
* Value of time is the average of individuals' values of time (the sample enumeration approach)

146
The results demonstrate that the incremental effects of some segments are significant for the
ASCs and the charge. Some groups have different preference of alternatives, compared to cars,
and some are differently sensitive to the charge. The incremental effects which were not
significant have been excluded from the model.
some groups of car commuters are differently sensitive to the charge. The incremental factors
of the charge show that car conu-nuters whose age is between 35 and 44 are less sensjtjý, e to
charges than other age groups (implying higher value of time). In this group, there is a higher
proportion of high income people than other groups. Over a half have annual household income
over E40,000. They are also in a middle age of working; they may need their car for work and/or
view the car as a status symbol. Between income groups, the effects of the charge and time are
not significantly different. Between respondents in Leeds and in London, there is also no
significant difference, possibly because of the small number of car commuter respondents from
London (only 10%).
Furthermore, the value of time is estimated using the sample enumeration approach, in which
overall value of time is the average of individuals' values. The average value of time is 9.68
p/min, which is slightly higher than the values reported in the previous section.
The ASCs of alternatives are highly negatively significant, as expected, indicating that in
general car is much more preferable than other modes or changing travel time. Interestingly,
those who perceive the pollution problem as very serious have more preference for bus and
other non-car modes than the other people. This result is similar to the study by van Vugt et al.
(I 996a) who found that people who perceive a large impact of cars on environmental pollution
have less preference for car. Golob and Hensher (1998) also noted that those who are concerned
with pollution have an intention to reduce car use, and the attitudinal survey by LEX (1999)
found that the public perceive public transport as environmentally ffiendly but car as
environmental damaging. These results support Gdrling et al. (2000) who claim that pro-
environmental behaviour intention is related to awareness of consequences.
For those who have a strong dislike of charging, car use is much more preferred than bus use.
Fhev are likely to perceive very poor services of bus or unavailability for them. This is possibly
a i-cason for their lower acceptance of charging systems than other people (see Chapters 6 and
7).

147
8.4 Mode Choice Behaviour Variation among Individuals
In the previous section, the segmentation model (Table 8.12) addressed some differences in the
effects of the system features between the groups of car commuters. However, for the
segmentation model based on the standard logit model, the coefficients of variables were
assumed to be the same for all individuals in specific groups. This section examines whether
there is a taste variation among individuals from unknown sources, in addition to the personal
characteristics and perceptions. This is explored through the use of the random parameters logit
model (Section 3.4.3), which is applied to the segmentation model.
Furthermore, in the case of different types of alternatives, the mode choice model includes the
constants (ASCs) to represent unmeasured attributes. Bates and Terzis (1997) pointed out that
bias in coefficients (also in the value of time) may occur when some characteristics of choice
are omitted and represented by a single constant, particularly if there are substantial variations
of the constant among individuals. This can be examined by the random parameters logit model.
The model allows the coefficients to vary across individuals within the sample. To avoid an
unstable model (when all parameters are allowed to vary), at least one variable should be fixed
(Ruud, 1996). In the analysis based on Equation 8.2, the coefficient of the charge function (0/)
is not allowed to vary across individuals (the value of time would be distributed as the
coefficient of time). The coefficient of the charged area was also fixed because the initial
analysis found that it was insignificant. The remaining coefficients: time difference function and ASCs are allowed to vary. Mean coefficients and standard deviations of the random parameters
were estimated by LIMIDEP programme. The standard deviation is for indicating whether a
parameter significantly varies among respondents.
Two random parameters logit models are presented in Table 8.13. In Model 1, the random
coefficients are assumed to be normally distributed. This found that the coefficients of the time
difference function (Q, ) for some observations (9.7/6) have negative sign. This is not plausible,
it should be positiNýe because when travel time of bus gets worse than for car (the time
difference increases) car will be more preferred, as discussed in Section 8.2.3. The negative sign
arises because of the nature of the normal distribution. In Model 2, the 0, is assumed to be log-
normally distributed, for which the coefficient is always positive, while the others are still
normally distributed.

148
I able 8.13 Random parameters logit model of mode choice behaviour segmented by personal characteristics and perceptions (based on 100 Halton draws)
Variables Model I Model 2 Coeff. (t-ratio) I Std. (t-ratio) Coeff. (t-ratio) I Std. (t-ratio)
Utility of car use Charge
. (Time ratio) -0,2
+ if age is between 35 and 44 -0.0054 (-3.3) 0.0015 (2.0) -
-0.0049 (-3.6) 0.0015 (2.0) -
(Tbus- T, -07.0.259 ,,,
) . (Time ratio) (Distance) 0.0213 (2.6) 0.0164 (1.9) -4.3767 (-6.8) 1.1470 (1.4) Area of charge base - wide area Area of charoe dummy - small area 0.7784 (1.3) - 0.7548 (1.6) -
Utility of car use earlierliater ASC-car use earlier/later -12.8340 (-1.8) 7.8687 (1.6) -9.0691 (-2.4) 5.2980 (2.0)
Utility of bus use ASC-bus " if perceived pollution as very serious " if having strong dislike of charging
-4.2908 (-3.4) 1.2729 (2.3)
-1.3726 (-2.6)
1.4236 (1.4)
- -
-3.7923 (-3.5) 1.1805 (2.0)
-1.230 (-2.5)
0.9763 (0.8)
- -
ility of other mode use ASC-other -8.4808 (-1.6) 3.4288 (1.1) -6.6831 (-2.7) 2.3212 (1.5) + if perceived pollution as very serious 2.2743 (1.5) - 1.7508 (2.1) No. of observation 842 842
2 p with respect to constant 0.0803 0.0777 Log likelihood at convergence -523.4506 -524.9307 _ Mean of value of time 1 6.49* 1 8.12*
* Value of time is the average of individuals' values of time (the sample enumeration approach)
The goodness-of-fit indexes (P) for Models I and 2 are 0.0803 and 0.0777, respectively. These
inci-case from 0.0631 in the segmentation model in Table 8.12. A likelihood ratio test (Section
3.4.3) was used to compare the random parameters logit models and the segmentation model. The test found that both random parameters logit models are statistically improved from the
segmentation model at the 99% confidence level, in turn they are better than the basic model in
Table 8.8.
Between these two models, the goodness-of-fit indexes are slightly different. Nevertheless, the
model 2 is more preferred because the t-ratios are higher than In Model I (providing more
precise coefficients), particularly for the coefficient of the time difference function. This
indicates that the log-normal distribution is more appropriate than the normal distribution.
It should be noted that in Model 2, for the log-normal distfibution3, the mean coefficient
(-4.3-67) and standard deviation (1.1470) of the time function represent the mean and standard
When the parameter is assumed as log-normal distributed, the coefficient is expressed as 0= exp(b-'-s[l), 2/
Micre b and s represent the mean and standard deviation of InO. The mean of 0= exp[b+(si , 2)]. I[CXP(S 2
The standard deviation = (tile mean of 0) x\

149
deviation of InO2. Thus the 02 is 0.0243 and its standard deviation is 0.0401, (see also Section 3.4.3, Equation 3.11 and 3.12).
The results show that only the standard deviation of the constant of car earlier/later is
significant. The standard deviations of the other random parameter distributions are not
significant at the usual 95% confidence level, indicating that the parameters' coefficients do not
significantly vary across individuals. However, the standard deviations are relatively high,
compared to their coefficients, and the t-ratios are not very small (potentially increased with higher sample size). In order to achieve more precise predictions of mode choice, the
individuals' coefficients should be used. (The specific coefficients for each individual can be
achieved from LIMDEP. )
Furthen-nore, the values of time were also estimated from using the individuals' coefficients based on the sample enumeration approach. In Model I the value of time overall is 6.49 p/min,
which is slightly lower than the review by Wardman (discussed in Section 8.2.3). In Model 2,
the value of time is 8.12 p/min, which is close to the UK value of time. This is another reason for suggesting that Model 2, in which the coefficient 02 is log-normally distributed, is better
than Model 1, and is the most suitable to be used further for the prediction of mode choice in
Chapter 9.
8.5 Conclusions
This chapter has tested the hypothesis that the effectiveness of road user charging, focusing on
the reduction of car commuting, depends on the benefits and system features of the charging
schemes, as well as personal characteristics and perceptions. The SP experiment presented the
designed hypothetical charging scenarios to respondents in Leeds and London. The results of
mode choice behaviour were from the analyses of the SP data based on the logit model.
In the initial analysis, it was found that car and bus delayed-time reductions up to 75% of
current delayed-time presented in the experiment were too small to compensate the charge. Only
a small proportion of the observations provided appropriate trade-offs between the charge and
time reduction. The time reductions seemed to be ignored by respondents in their choice mode for j ourneys to work.
The further development of the model found that the mode choice behaviour is better to be
explained by travel time difference and time ratio of bus travel time to car travel time, and travel
distance. The higher time difference, the more preferred is car use. In addition to the absolute

150
time difterence, the time ratio allo\, N, s the model to represent the amounts of bus and car travel
time. -Fhe higher the ratio, the fewer respondents considered bus as a choice. The model
estimated the plausible value oftime around 8-9 p/min, which is close to the review of UK
value of time. The model also allows the value of time to increase with increase of travel distance, and to decrease with increase of time ratio of bus to car travel time.
The results demonstrated that car use is very much preferable to car commuters than other
modes. Increasing level of charge would reduce travel to work by car. The effect of charges in the small area (Inner Ring Road) in reducing car use are less than in the wide area. The effects
of other system characteristics: charged time and the variable methods of charge are not
significant in reducing car use.
Moreover, car use is also influenced by some personal characteristics and perceptions. Those
\\, hose age is between 35 and 44 (high proportion of high income people) are less sensitive to
the charge. They have a higher value of time than others. Those who perceived the pollution
problem as very serious are more likely to switch to bus or other non-car mode than others. In
contrast, those who having a strong dislike of charging perceive that bus is very poor, compared to car.
In briet', as expected, effectiveness of road user charging schemes in reducing travel to work by
car can be increased by increasing level of charge. Interestingly, those car conunuters who
perceive the pollution problem as very serious in their city are less dependent on their car than
the others. They tend to reduce their car use for travelling to work before the others. The results
of predicted car commuting reductions and mode choice elasticities with regard to charging, derived from the use of the model developed in this chapter, are presented in Chapter 9.

151
Chapter 9
Acceptability and Effectiveness
9.1 Introduction
The previous three chapters presented the modelling development from the SP data. In Chapters
6 and 7, the results of acceptability influenced by the charging system characteristics, personal
perceptions and characteristics, and the individuals' selfish and social perspectives, were discussed. The voting behaviour models were developed to predict acceptance levels of
charging schemes. For the first voting model, in Chapter 6, acceptability is affected directly by
the system characteristics and personal perceptions and characteristics. For the alternative
voting model, in Chapter 7, these factors were assumed to influence the acceptability through
the selfish and social perspectives. Chapter 8 reported the results of mode choice for car
commuters influenced by the charging systems. The mode choice behaviour model was developed to predict proportions of car commuting reduction in charging schemes.
The objective of this chapter is to demonstrate the use of the developed models to forecast
behaviour. In Section 9.2, the voting models are used to predict acceptance levels of road user
charging schemes. In Section 9.3, the mode choice behaviour model was used to predict car
commuting reductions. Then in Section 9.4, the relationships between acceptability and
effectiveness of the road user charging schemes are discussed. In Section 9.5, suggestions for
how to design acceptable and effective schemes are presented. Finally, Section 9.6 provides
conclusions.
9.2 Acceptability of Road User Charging Schemes
In the study, acceptability of road user charging is reflected by the voting behaviour, that is
whether indiN, iduals vote for the charging schemes presented in the SP experiment (Chapter 4).
The aim of this section is to report the results for the predicted acceptance levels of different
ro, id user charging schernes and for different groups of the public. This is based on the

152
assumption that the schemes would be acceptable, when they were supported by at least 50% of
voters.
The voting behaviour models developed in Chapters 6 and 7 are used to forecast the acceptance levels. The direct voting model from Chapter 6 is based on the logit model, In which the utility
is a function of the charging system characteristics. The indirect voting model in Chapter 7 is
also based on the logit model, but the utility is a function of the selfish and social perspectives. These perspectives are based on regression models of the charging system characteristics.
In this section, both direct and indirect models are used to forecast levels of charging schemes. Differences in the predicted results are discussed. The direct model is preferred and then used for the prediction of acceptance levels for different groups of the public.
9.2.1 Procedure for prediction of acceptance levels
The forecasting procedure is based on the sample enumeration approach. This is suitable for
forecasting the effects of policies that impact differently on various groups of the public (Ben-
Akiva and Lerman, 1985; Bradley and Kroes, 1992). Choice probabilities (Equation 3.7) of
acceptance are obtained from the preferred voting behaviour model for each respondent. These
probabilities are influenced by the system characteristics, as well as the personal characteristics
and perceptions. The predicted acceptance level for the whole sample is an average of the
probabilities of the 830 respondents. The predicted acceptance level for each group of the public is an average of the probabilities of the people in the group.
For the direct voting model, the individuals' choice probabilities can be estimated by using the
preferred utility function of 'yes' vote. This is a function of the system characteristics and
personal characteristics and perceptions (the model in Table 6.4), while the utility of 'no' vote is
zero. It was found that acceptability is highly sensitive to the level of charge. However, it can be
improved by increasing the levels of environmental improvement and car delayed-time
reduction. A charge within the city centre is more acceptable than in the wide area. A fixed
charge also is significantly more acceptable than the vanable: distance-based, time-based, and
delayed-based charges.
For the indirect voting model, the individuals' choice probabilities can be estimated by using the
utility function of 'yes' vote, which is the function of the perceptions of benefits to self and to
society, reflecting the selfish and social perspectives (the model in Table 7.6), and the utility of
4no' vote is zero. The results confirm that acceptability is influenced by both selfish and social

153
perspectives. Furthermore, these perspectives are related to the system characteristics, and
personal characteristics and perceptions (the regression models in Table 7.8).
In order to demonstrate different levels of acceptance in different groups of the public, a base
charging scenario is set as follows.
0 Fixed charge per day;
0 Within the Outer Ring Road for Leeds and the North/'South Circular Roads for London
(the wide area in the model),
9 Between 7am - 7pm;
0 No car and bus delayed-time reduction;
9 No environmental improvement (as now).
Various scenarios of charging systems are set as shown in Table 9.1, to demonstrate variation of
acceptance levels across the systems. The other system features: times of charge and revenue
allocations, which are not significant in affecting acceptability, are not varied across the
schemes.
Table 9.1 Various road user charging systems
P§ýo Effects of Car delayed-time Environmental Area of Method of I I reduction improvement charge charge
1 Base 0 As now Wide Fixed charge 2 Area of charge 0 As now Small Fixed charge 3 Environmental 0 Substantial Small Fixed charge improvement 4 10 Substantial Small Fixed charge
- 5 Car delayed- 20 Substantial Small Fixed charge time reduction - 6 30 Substantial Small Fixed charge 30 Substantial Small I Distance-based
8 Method of 30 Substantial Small Time-based char e 1 g 9 30 Substantial Small Delay-based
The different systems are presented as scenarios 1-9 showing the cumulative effects of the
svstern features. Scenario I is the base charging system, in which charging is within the Outer
Ring Road of Leeds and the North/South Circular Roads of London (the wide charged area) between 7am and 7pm, but with no car and bus delayed-time reduction or environmental
ios 2 and 3 show the effects of the charge in the small areas and of the improvement. Scenari I
environmental improvement, respectively. Scenarios 4-6 show the II impacts of different car
delayed-time reductions. Scenarios 7-9 demonstrate the effects of different methods of
charging. The prediction results (from the direct and indirect voting model) of these scenanos
1-ýJnoe Of IeNcls ofchýir, _, e are presented in the next two sections, Sections 9.2.2- and 9.2.3. Z71 -

154
These illustrate a wide range of acceptance levels across the charging scenarios, rather than a
single general acceptance as presented in many attitudinal studies.
9.2.2 Predicted acceptance levels using the voting model of the charging system features
In Chapter 6, Sections 6.2 - 6.4 examined the acceptability of road user charging as influenced by the system characteristics, and personal characteristics and perceptions, using the standard logit model, segmentation model and random parameters logit model. The standard logit model
showed the effects of the charging system characteristics. The segmentation presented greater details in the differences between groups of people, categorised by their personal characteristics
and perceptions. The random parameters logit model identified whether taste variation across
individuals is significant.
It was found that the segmentation model (Table 6.4) is very much better than the standard
model (Table 6.1) in explaining the voting behaviour. It showed that different groups of the
public are different in evaluating charging systems. The random parameters logit model (Table
6.5) demonstrated that there is no significant taste variation across individuals. The random
parameters logit models were not significantly better than the segmentation model. This means the segmentation model is suitable to predict acceptance levels of charging systems.
By using the segmentation model, the prediction results of each charging scenario in Table 9.1
for a range of levels of charge are presented in Table 9.2 for people in Leeds and in Table 9.3
tI or people in London.
In e\, ery scenario, not surprisingly, the higher the charging level, the lower the acceptability. Voting for scenario 2 shows that the system will be dramatically more acceptable when it covers
the area inside the Inner Ring Road (small charged area), compared to the charge within the
I. ceds Outer Ring Road and London North/South Circular Roads (wide charged area) in
scenario 1. Voting for scenario 3 shows a further substantial increase of acceptance when the
en\*ironi-nent is substantially improved. Scenarios 4-6 show a small effect of an increase in car
delayed-time reduction in improving the acceptance levels, compared to scenario 3. By
comparing scenarios 7-9 to scenario 6, the results demonstrate that fixed charges are
significantly more acceptable than distance-based, time-based and delay-based charges. There
are slightly different acceptance IeN, els for these variable charges. Very low acceptance can be
expected when these methods of charge are applied in a wide area and with no environmental

155
improvement. Overall, the results demonstrate that acceptability varies considerably across the
charging system characteristics.
Table 9.2 Predicted acceptance levels of road user charging systems in Leeds by using the voting model of the system characteristics
Level of 1 2 3 4 15 6 71 8 19
charge B Area of Environmental Car delayed-time reduction Method of charge (per day) ase charge improvement 10 mins ý 20 mins 1 30 mins Dis. Time I Delay
El 30.6% 46.1% 60.8% 63.4% 65.8% 68.2% 43.5% 42.5% 45.5% E2 25.7% 39.9% 54.4% 57.0% 59.6% 62.1% 37.4% 36.5% 39.3% E3 21.4% 34.2% 48.0% 50.6% 53.2% 55.7% 31.9% 31.1% 33.6% F_ 5 14.9% 24.6% 36.2% 38.5% 40.9% 43.3% 22.8% 22.2% 24.2% E7 10.5% 17.7% 26.8% 28.6% 30.6% 32.6% 16.4% 15.9% 17.4%
Note: shadings are made on the schemes which are voted for by more than 50% of the public
Table 9.3 Predicted acceptance levels of road user charging systems in London by using the voting model of the system characteristics
Level of 1 2 3 41516 71819 charge
d Ba Area of Environmental Car delayed-time reduction Method of charge (per ay) se charge improvement 10 mins 20 mins 30 mins Dis. Time I Delay
53.8% 69.2% 80.4% 82.0% 83.6% 85.0% 67.0% 66.1% 68.7% E2 49.7% 65.4% 77.2% 79.0% 80.7% 82.3% 63.0% 62.1% 64.8% E3 45.8% 61.4% 73.8% 75.7% 77.5% 79.3% 59.0% 58.1% 60.8% E5 38.8% 53.6% 66.4% 68.5% 70.5% 72.5% 51.3% 50.4% 53.1%
IL U 33.1% 46.6% 59.0% 61.1% 63.2% 65.3% 1 44.4% 43.6% 146.1%
Note: shadings are made on the schemes which are voted for by more than 50% of the public
In Leeds, options for designing acceptable schemes are limited. The only scheme that would
achieve over 50% acceptance would be a fixed charge of less than 0 per day, within the Inner
Ring Road with substantial environmental improvement. In London, many more options are
available, even variable charging methods based on distance, time and delay could be used. Level of charge can be set at up to E5 per day, even for the variable charging methods. It can be
C per day if the public believe that the environment will be substantially Improved. However,
the systems need to be within the Inner Ring Road.
I'he results Indicate that any charging is more acceptable in London than in Leeds, though the
segmentation analysis (in Chapter 6) found that there is no significant difference in evaluating
the charging system characteristics between people who live in Leeds and in London. The
difference of the acceptance levels is because they are different in the distributions of sample
characteristics and perceptions (shown in Section 4.6), which evaluate the charging schemes
differently. For example, in Leeds the proportion of car users Is higher, but the proportions of

156
those who perceive the transport problems as very serious and perceive the effectiveness are lower than in London. The acceptance levels for these different groups of people are presented
in Section 9.3.
9.2.3 Predicted acceptance levels using the voting model of the selfish and social perspectives
In Chapter 7, Section 7.2 examined the effects of the selfish and social perspectives on
acceptability. These perspectives were reflected by the perceptions of benefits to self and to
society. Three models were developed. The standard logit model was estimated with the utility
of voting behaviour as the function of the selfish and social perspectives (Table 7.2). The results
showed that both perspectives highly influence acceptability. People would vote for charging
schemes if they perceived benefits to themselves and to society. In general, benefits to self were
perceived as of more importance than benefits to society. The segmentation model (Table 7.3)
explored the differences among groups of the public. Different groups had different weights for
the benefits to self and to society. The random parameters logit model (Table 7.6) examined the
differences across individuals. This showed that the taste variation in the population is
significant. Among these models, the random parameters logit model was the most superior in
explaining the behaviour, so it was preferred for use to predict levels of acceptance through the
perceptions of benefits to self and society.
Section 7.3 examined how much the charging system characteristics affect the perceptions of benefits to self and to society. The regression model (Table 7.8) was estimated in order to
demonstrate the effects of the charging systems characteristics, and personal characteristics and
perceptions on the perceptions of benefits to self and society. It was found that different groups
of people value the charging benefits and features differently. This model can be used to predict
the degree of perceptions of benefits to self and to society for each individual, responding to
charging systems.
Therefore, by using the regression models of the perceptions of benefits (Table 7-8) and the
logit model of voting behaviour (Table 7.6), forecasts of acceptance levels for different road
Liser charging systems can be achieved. The forecasting procedure is based on the sample
enumeration approach (Section 9.2.1). To each charging system, degrees of perceptions of
benefits to self and society for each individual are produced by the regression models. Then,
choice probabilities of acceptance are obtained for each respondent by the logit model, in which
its utility is a function of the perceptions of benefits to self and society. The predicted
acceptance level of the system for the whole sample is an average of the probabilities of the 830

157
respondents. The prediction results of the charging scenarios set in Table 9.1 for a range of levels of charge are presented in Table 9.4 for people in Leeds and in Table 9.5 for people in London.
Table 9.4 Predicted acceptance levels of road user charging systems in Leeds by using the voting model of the selfish and social perspectives
Level of 1 2 3 4 151 6 71 81 9 charge
d Base Area of Environmental Car delayed-time reduction Method of charge (per ay) charge improvement 10 mins 1 20 mins 1 30 mins Dis. Time I Delay
El 27.4% 33.0% 42.0% 42.8% 43.6% 44.4% 43.9% 42.8% 46.1%
E2 25.4% 30.8% 39.6% 40.3% 41.1% 41.8% 41.3% 40.3% 43.6%
E3 23.6% 28.6% 37.2% 37.9% 38.6% 39.4% 38.9% 37.8% 41.0%
E5 20.3% 24.7% 32.7% 33.4% 34.1% 34.7% 34.3% 33.2% 36.3%
U 1 17.4% 1 21.3% 28.7% 29.3% 29.9% 30.5% 30.1% 29.0% 31.9%
Table 9.5 Predicted acceptance levels of road user charging systems in London by using the voting model of the selfish and social perspectives
Level of 1 2 3 4 151 6 71 81 9 charge
B Area of Environmental Car delayed-time reduction Method of charge (per day) ase charge improvement 10 mins 1 20 rninsý - 30 rnins Dis. Time I Delay
El 47.3% 52.8% 70.5% 71.1% 71.7% 72.3% 71.6% 69.5% 73.8%
E2 46.6% 52.0% 69.8% 70.4% 71.0% 71.6% 70.9% 68.8% 73.1%
E3 45.8% 51.2% 69.1% 69.7% 70.3% 70.9% 70.2% 68.0% 72.4%
E5 44.3% 49.5% 67.7% 68.3% 68.9% 69.5% 68.8% 66.6% 71.0%
E7 42.8% 1 47.9% 66.2% 66.8% 67.4% 1 68.0% 1 67.3% 65.1% 69.6%
Note: shadings are made on the schemes which are voted for by more than 50% of the public
The charging schemes in London are more acceptable than in Leeds (because they are different
in the distribution of sample). In Leeds, the acceptance level would be close to 50%, if charging
were at EI per day, within the Inner Ring Road with substantial environmental improvement. In
London, with this system feature the acceptance level is over 70%. Even when level of charge is
increased up to C per day, the acceptance level is still over 60%.
Overall, the figures demonstrate that acceptability varies across the charging system
characteristics. The effects of these factors are the same as shown in Tables 9.2 and 9.3, in
\\ hich the results are predicted from the direct voting model. Increasing charge would reduce
acceptance levels. On the other hand, these would be increased by limiting charges to the city
centre and improving the environment substantially. Variable charges are less acceptable than
fixed charges. However, the effects of these system characteristics predicted from the indirect
voting model are relatively smaller than the effects predicted from the direct voting model. This
is discussed in the following section, 9.2.4.

158
9.2.4 Discussions on the results of the predicted acceptance levels of charging systems
In Sections 9.2.2 and 9.2.3, the levels of acceptance for Leeds and London were predicted from
different models. One was from the direct voting model, in which the system characteristics
influenced acceptability directly. The other one was from the indirect voting model, in which the system characteristics affected acceptability through the selfish and social perspectiý-es. The
prediction results were different. The effects in the indirect model were smaller compared to the direct model:
0 Acceptance is less sensitive to the level of charge, particularly in London;
The effects of the small area charge and substantial environmental improvement
increase acceptance significantly, but these effects are smaller;
0 The effect of the variable charging methods is very small. Acceptance of these methods
are not significant different from the fixed charges in the indirect model, but the results from the direct model show that they are much less acceptable.
These are firstly because of errors of model prediction. The indirect voting model forecasted the
acceptability through the perceptions of benefits to self and to society. The regression models
were used to estimate the degrees of the perceptions of the benefits for each individual. Then the
logit model with utility as the function of the perceptions was used to estimate the acceptance levels. The error in the indirect voting model was likely to be more than in the direct model,
which only involved one step in the prediction. In the indirect mode, error of the forecast could have occurred in the regression model. In a logit model, if there is more error, its coefficients (in
ternis ol'absolute values) will be lower. Hence, the effects of variables would be less than they
should be.
Moreover, the difference is likely to be because in the indirect voting model the effects of
system characteristics on voting are less likely to transfer totally tluough the perceptions of
benefits to self and to society, when respondents were asked to express their degrees of the
perceptions of the benefits. For example, (a) the effect of disagreement with the principle of
chargino may be taken into account less in the expression of the perceptions of benefits than in
the voting. (b) For some people who cannot avoid the charge in the small area, their perceptions
of benefits to self from charging in the small and in the wide area may not be different.
Nevertheless theý' may vote for a charge in the small area because they support the charge only
Nvithin the congested area. Hence the effects of the small area on voting in the direct model

159
would be higher than in the indirect model. (c) With the same amount of charging, dIfferent
charging methods are unlikely to generate different perceptions of benefits. On the other hand.
in the voting people may prefer fixed charges to variable charges.
I-rom these reasons, therefore, the predicted acceptance levels from the direct voting model are likely to be more reliable than the indirect model. Unfortunately, the results cannot be compared
with the reviewed acceptability from previous studies in Section 2.5.1. This is because the
previous studies presented little or no information about charging system characteristics to
respondents. However, the study here presented the various schemes and the results show that different charging schemes are considerably different in their acceptability.
9.2.5 Predicted acceptance levels for different groups of the public
To demonstrate different levels of acceptance among different groups of the public, the base
charging scenario is used. This system is based on the fixed daily charge within the wide areas (Leeds Outer Ring Road and London North/South Circular Roads) between 7am-7pm, with no car and bus delayed-time reduction and no environmental improvement. The sample enumeration approach is used in the prediction procedure (Section 9.2.1). The predicted
acceptance level in each group is an average of individuals' choice probabilities of 'yes' vote in
the group, These are predicted from the direct voting model.
Table 9.6 demonstrates the effect of charges on the acceptance levels of the base scenario for
different groups of people. These involve the different attitudes between mode users and between age groups, which are significantly different in the voting model. It can be seen that levels of charges have a very large impact on acceptability for every group. When the level of
charge is increased, the level of acceptance is dramatically decreased.
Table 9.6 Predicted acceptance levels of the base scenario for different personal characteristics by charging level (and % change from base)
Charging Non-car level All Car users Age < 55 Age ; -> 55 (per day) users
f: 1 35.0% 27.2% 56.2% 36.8% 31.5% (base) 30.2% 22.5% 51.0% 32.7% 25.3% E2 P3.7%) (-17.3%) (-9.3%) (-10.9%) (-19.9%) 26.0% 18.6% 46.0% 29.0% 20.1% E3 (-25.6%) (-31.6%) (-18.1%) (-21.2%) (-36.2%) 19.4% 12.8% 37.2% 22.9% 12.5% E5 (44.6%) (-52.9%) (-33.8%) (-37.8%) (-60.3%) 14.7% 9.0% 30.4% 18.3% 7.9%
1
f- 7 11
1 (-58.0%) 1 (-66.9 0) 1 (-45.9%) 1 (-50.3%) (-74.9%)
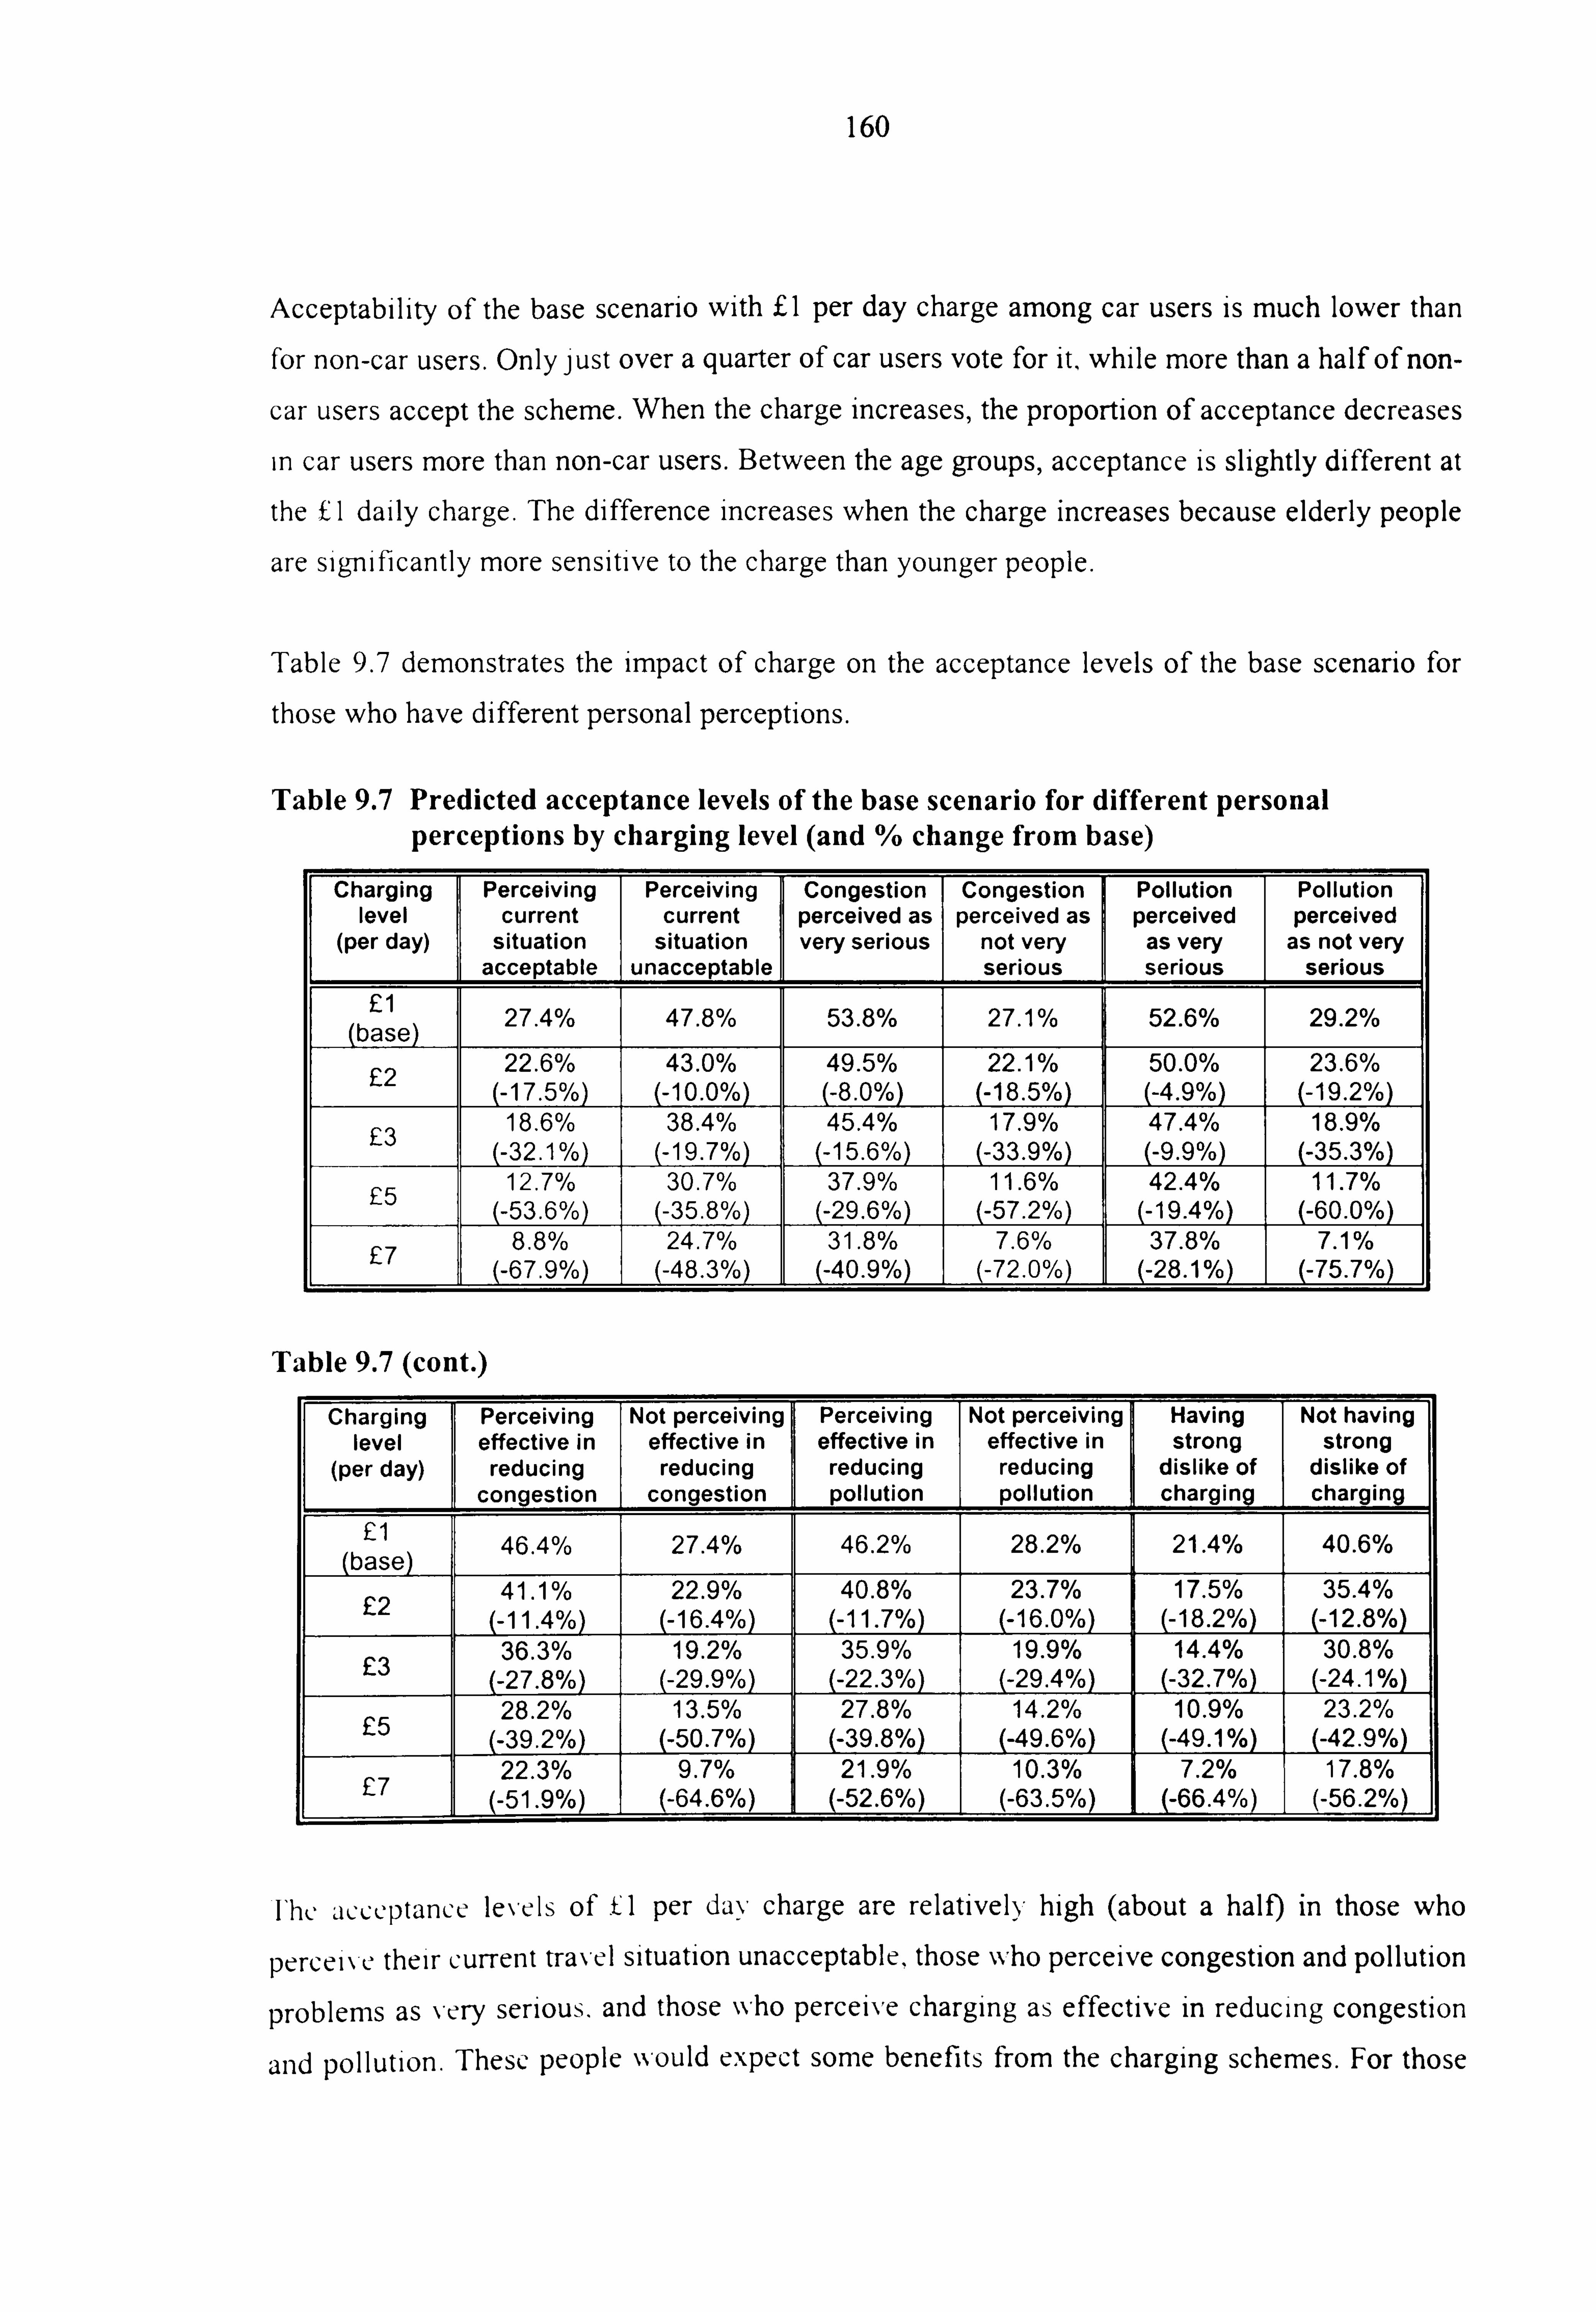
160
Acceptability of the base scenario with fI per day charge among car users is much lower than for non-car users. Only just over a quarter of car users vote for it, while more than a half of non-
car users accept the scheme. When the charge increases, the proportion of acceptance decreases
in car users more than non-car users. Between the age groups, acceptance is slightly different at
the fI daily charge. The difference increases when the charge increases because elderly people
are significantly more sensitive to the charge than younger people.
Table 9.7 demonstrates the impact of charge on the acceptance levels of the base scenario for
those who have different personal perceptions.
Table 9.7 Predicted acceptance levels of the base scenario for different personal perceptions by charging level (and % change from base)
Charging Perceiving Perceiving Congestion Congestion Pollution Pollution level current current perceived as perceived as perceived perceived
(per day) situation situation very serious not very as very as not very acceptable unacceptable serious serious serious
El 27.4% 47.8% 53.8% 27.1% 52.6% 29.2% (base) 22 6% 43 0% 49.5% 22.1% 50.0% 23.6% E2 . 17.5 %) . (-10.0%) (-8.0%) 5%) (4.9%) (-19.2%) 18.6% 38.4% 45.4% 17.9% 47.4% 18.9% E3 (-32.1%) (-19.7%) (-1 5.6%)_ (-33.9%) (-9.9%)- (-35.3%) 12.7% 30.7% 37.9% 11.6% 42.4% 11.7%
f5 (-53.6%) (-35.8%) (-29.6%) (-57.2%) (-19.4%) (-60.0%) 8.8% 24.71//(o 31.8% 7.60/( 0 37.8% 7.1% f- 7 (-67.9%)
__i 0/0
__(-48.3%) 1 (-40.9%) ý
-- -72.0%) L--J- (-28.1%) (-Zý-7% ----L-
I
Table 9.7 (cont. )
Charging Perceiving Not perceiving Perceiving Not perceiving Having Not having level effective in effective in effective in effective in strong strong
(per day) reducing reducing reducing reducing dislike of dislike of congestion congestion pollution pollution charging charging
El 46.4% 27.4% 46.2% 28.2% 21.4% 40.6% (base)
41.1% 22.9% 40.8% 23.7% 17.5% 35.4% E2 (-11.4%) (-16. %) (-11.7%) (-16.0%) (-18.2%) (-12.8%)
36.3% 19.2% 35.9% 19.9% 14.4% 30.8% E3 (-27.8%) (-29.9%) (-22.3%) (-29.4%) (-32.7%) (-24.1%)
28.2% 13.5% 27.8% 14.2% 10.9% 23.2% E5 (-39.2%) (-50.7%) (-39.8%) -49.6%) (-49.1 %) "-42.9%)
22.3% 9.7% 21.9% 10.3% 7.2% 17.8% E7 (-51.9%) (-64.6%) (-52.6%) (-63.5%) (-66.4%) (-56.2no
Fhe acceptance levels of tl per day charge are relativelY high (about a halo in those who
percei% c their current tra\-el situation unacceptable, those who perceive congestion and pollution
problems as \-ery serious. and those who perceive charging as effective in reducing congestion
and pollution. Thesc people would expect some benefits from the charging schemes. For those

161
who do not have these perceptions, the acceptance levels are lower (about a quarter for afI
charge and lower for higher charges). In other words, road user charging would be more
acceptable if it is proposed in a place where the current travel situation is not acceptable to the
public, people perceive congestion and pollution as very serious, and people perceive charging
as effective in reducing the problems. On the contrary, it would be difficult to gain support, if people strongly dislike charging (e. g. those who object to being made pay more for car use, who are concerned with the indirect effects of charging, and who have a high preference for car use).
These differences of acceptance between the characteristics and perceptions lead to the different levels of acceptance in Leeds and London (presented in Section 9.2.2). Between respondents from Leeds and London, though the results from the model analysis (Section 6.3) found that there is no significant difference in evaluating the charging schemes, they are different in their distribution of sample characteristics (Section 4.6) and perceptions (Chapter 5). For example, in Leeds the proportion of car users is higher, but the proportions of those who perceive the
transport problems as very serious and perceive the charging system as effective are lower than
in London. These cause the results of lower level of acceptance in Leeds.
9.2.6 Predicted acceptance levels for car commuters
This section focuses on only acceptance of car commuters. These results are used later in Section 9.4.2 to examine the relationship between acceptability and effectiveness in reducing
car commuting, to see whether acceptable schemes for car commuters are effective.
Tables 9.8 and 9.9 present the predicted acceptance levels of the charging schemes (set in Table
9.1) for car commuters in Leeds and London. These results were estimated from the direct
\ ot ing mode 1.
Table 9.8 Predicted acceptance levels of road user charging systems in car commuters in Leeds
Level of 1 2 3 4 1516 71819
charge Area of Environmental Car delayed-time reduction Method of charge (per day) Base
charge improvement 10 mins 1 20 mins 1 30 mins Dis. Time I Deiay
El 25.7% 40.9% 56.3% 59.0% 61.7% 64.3% 38.3% 37.3% 40.3%
E2 21.4% 35.2% 50.1% 52.9% 55.6% 58.3% 32.7% 31.8% 34.6%
E3 17.7% 29.9% 44.0% 46.7% 49.5% 52.2% 27.7% 26.9% 29.4%
E5 12.0% 21.2% 32.9% 35.5% 37.7% 40.3% 1 19.5% 18.8% 1 20.7%
E7 8.2% 1 14.8% 1 23.8% 1 25.8% 1 27.8% 29.9% -- [13.6% 13.1% _
14.5% Lý4.51/o
Note: shadings are made on the schemes which are voted for by more than 50% of the publIc

162
Table 9.9 Predicted acceptance levels of road user charging systems in car commuters in London
Level of 1 2 3 41516 71819 charge
B Area of Environmental Car delayed-time reduction Method of charge (per day) ase charge I improvement 10 mins ' 20 rnins 30 mins Dis. Time ý Delaý,
El 38.1% 55.1% 69.4% 71.7% 73.9% 76.0% 52.4% 51.4% 54.4% F-2 33.6% 50.0% 64.7% 67.1% 69.4% 71.7% 47.3% 46.3% 49.3% F- 3 29.6% 45.1% 59.7% 62.2% 64.6% 67.0% 42.5% 41.5% 44.4% E5 22.9% ý 36.2% 49.9% 52.4% 54.9% 1 57.3% ý 34 . 0% 1 33.1% 35.7% 11
U 18.1% 1 29.2% 41.2% 43.5% 45.8% 1 48.1% 1 27.2% 1 26.5% L2! 8. _7/o
]I
Note: shadings are made on the schemes which are voted for by more than 50% of the public
As expected, in car commuters the acceptance levels for every charging scheme are lower than
for the public overall, shown in Tables 9.2 and 9.3. The results demonstrate that the effects of the system features on acceptability in car commuters are similar to the effects overall.
Acceptance falls when the charge increases and when variable methods of charge are used
instead of the fixed charge, but it increases significantly when the area of charge is limited to the
small area and the system provides substantial environmental improvement. Car delayed-time
reduction helps slightly in increasing the acceptance.
9.3 Effectiveness of Road User Charging Schemes
Fhis section illustrates the results of the assessment of effectiveness of different road user
charging schemes and the effectiveness for different groups of car commuters. This is shown by
the proportions of car commuting reduction that are estimated from the mode choice behaviour
model developed in Chapter 8.
9.3.1 Procedure for prediction of car commuting reduction
In Chapter 8, Sections 8.2 - 8.4 developed the mode choice behaviour models. The random
parameters logit model in Table 8.13, Model 2, was the most superior and appropriate to use to
predict car use for journey to work, and in turn to predict car-commuting reduction. In the
prediction, the model was based on individuals' specific coefficients of the random parameters.
Bus and car travel time (in terms of the time difference and ratio) and travel distance were based
oi-i each individual's Current travel circumstances. Bus and car delayed-time reductions were
considered not to InflUence mode choice (see Section 8.2).
The model was developed from respondents who were car commuters. The choice probabilities
of car, car earlier/later, bus and other were estimated from the mode choice model for each
respondent. The sample, which was used to develop the model, excluded the respondents who

163
always chose a 'non-car' mode: either car earlier/later, bus or other. (Car earlierilater was
considered as 'non-car' because commuters change their travel time to use car in uncharged
periods. ) Those who always chose a non-car mode were not likely to trade-off among attributes
of the options. They were able to access an alternative and did not change, regardless of the
charging characteristics. However in the prediction of mode choice, they were included. Their
choice probabilities of the mode they chose were equal to one, while the choice probabilities of
car and other mode use were zero.
Similar to the prediction of acceptance level, the forecasting procedure of mode choice was based on the sample enumeration approach. The choice probabilities (Equation 3.7) of car and
other options were obtained from the mode choice behaviour model for each respondent. The
predicted proportion of each option for the whole sample was an average of the probabilities of
every car commuter, and the prediction for each group of car commuters was an average of the
probabilities of the people in the group (categorised by personal perceptions and
characteristics).
In the prediction process, with zero charge the model predicted the proportion of car use as
slightly less than 100%, 96.4% in Leeds and 98.4% in London. Clearly, these figures should be
100% because all respondents travelled to work by car. Thus the predicted proportions of car
use for other levels of charge needed to be adjusted by multiplying the results by 1.037
( 100/96.4) for Leeds and by 1.0 16 (100/98.4) for London.
9.3.2 Predicted car commuting reduction for different schemes
The base charging scenario, charging scenario I in Table 9.1, is used to demonstrate the levels
of car commuting reduction. This system is based on the fixed daily charge within the wide
(Leeds Outer Ring Road and London North/South Circular Roads) between 7am-7pm,
ith no car and bus delayed-time reduction. The analysis (in Chapter 8) found that only the
level of charge and area of charge affect the mode choice significantly. Other changes of the
system characteristics would not help in increasing effectiveness. Thus, car commuting
reduction is predicted for another charging system, which is within the small area. This scenario
is charging scenario 2 in Table 9.1.
The predicted results of car conunuting reduction in Leeds and London for different levels of
c harge are shown in Table 9.10.

164
Table 9.10 Predicted car commuting reduction for charging schemes in Leeds and London (and % change from il charge)
Level of Leeds London charge Base*
Base + the Base* Base + the (per day) small area small area
Ei 23.8% 22.2% 31.3% 30.4%
25.0% 22.9% 31.9% 30.8% E2 (5.0%) (3.2%) (1.9%) (1.3%)
E3 26.6% 24.0% 32.9% 31.3% (11.8%) (8.1%) (5.1%) (3.0%)
E5 30.9% 26.9% 36.1% 33.0% (29.8%) (21.1%) (15.3%) (8.6%)
E7 37.3% 31.4% 41.1% 36.3% (56.7%) (41.4%) (31.3%) (19.4%)
Base scheme is a fixed charge within the wide area between 7am-7pm with no delayed-time reduction
Not surprisingly, the results demonstrate that the car use reduction increases when the charge
increases. The car use reduction for charges in the small area is slightly lower than in the wide
area. Overall, any charging system is relatively effective in reducing car commuting. Even for
the daily El charge within the city centres, almost 22% of car commuters in Leeds and 30% in London will switch to non-car modes or without-charged time. When the charge increases to 0
per day, the car use reduction increases further to 31% in Leeds and 36% in London.
Fhe reductions are relatively high at EI charge because they are included those car commuters
who always chose a non-car option in response to charging in the SP experiment (as mentioned
in Section 9.3.1). In responding to charging systems, they preferred to avoid the charge by
changing to travel in un-charged times or use alternative modes. There were 21% and 24% of
respondents from Leeds and London, respectively. About a half of them were able to change to
use car before and after the charged time.
Between Leeds and London, although the model in Chapter 8 has shown that there is no ditTerence, charging systems in London are more effective in reducing car commuting than in
Leeds. This is because in London there are more people perceiving pollution and congestion
problems as very serious (who are more likely to reduce car use) and fewer people having the
strong dislike of charging (who are less likely to reduce car use) (see Section 9.3.3). However
the additional reduction from an increase of charges in Leeds is more than in London. This is
because the reductions of car conunuting in London are higher at f1 (base charging level) and
also InclUde higher proportion of the samples who always chose a 'non-car' mode. (This is also
reflected in the charge elasticities, presented later in this section).

165
I- igures 9.1 and 9.2 illustrate the predicted mode choices for different levels of charges %ý'ithin
the Inner Ring Roads of Leeds and London (which are considerably more acceptable than
within the wider area, as demonstrated in Section 9.2.6; but slightly less effective then the wider
areas). The proportions of the car commuting reductions are presented in greater detail. They
include those who change to use car in the un-charged period, to use bus, or to use other means
e. g. rail, walking and cycling.
In Leeds, the scheme can reduce car commuting by 22% with the charge of EI per day, and by
up to 31% with the charge of C per day. Over half of the reductions are because commuters
change to use car before and/or after the charged period. The others switch to bus or others
means of travel. The proportions of car earlier/later and other (non-bus) change slightly, when the charges increase. This is likely to be because of personal constraints; for example whether they have flexible travel time, whether they have alternatives (non-bus) available and whether their destinations are within walking distance. Those who have these options would choose them, even at the low charge. On the other hand, those who do not have the options would be
most likely to switch to use bus, which usually service widely, when the charge increases.
In London, the car use reduction rises from 30% to 36%, when the charge varies from El to 0
per day. The proportions of car commuters switching to other modes (non-bus) are high (15%),
compared to the total reductions of car use; most of them use the underground. As in Leeds, the
pi-oportions changing travel time (15%) are about a half of the car use reductions. The further
i-eductions, when the charges increase, are from switching to use buses.

166
100% ..... .....
90% .... ..... .... ..... .... ..... 80% ..... ....
70%
60%
50%
40% .. 30% ... .....
20% 5% 6%, y
00 0
10% 13% 13%
]
14%
0% E2 E3 E5 F- 7
Level of charge (per day)
Car earlier/later F-I Bus M Other E] Car
Figure 9.1 Predicted mode choices for charging within the Inner Ring Road of Leeds
100% .. ..... 7.
90% ..... ........ ......... ..... .... .......... ..... .... .....
80%
70% ..... : " . -: 67%
. 04 ., .... : 10 YO 0 ........ ...... 60%
50%
. 40% ..... .... .... ..... ..... 15%
30% 15%
15% 15% 15%
6% 20%
[ ]F IE
10% 15% 0/, 15 6 1 5% 15% 15%
0% F- 1 E2 F- 3 F- 5 F- 7
Level of charge (per day)
M Car earlier/later M Bus M Other E] Car
Figure 9.2 Predicted mode choices for charging within the Inner Ring Road of London

167
These predicted car commuting reductions are broadly similar to the results from previous
studies (reviewed in Section 2.6.1). However, the results cannot be directly compared among the studies. Some issues need to be considered. Firstly there are different units of measurement
ofeffectiveness. Based on the modelling results, reductions of car use are presented in terms of numbers of trips, traffic volume and vehicle kilometres. The results from attitudinal surveys and field trials are similar to the ones from stated preference surveys, which measure mode choice
responses, Secondly, there are different system features. Nevertheless it is possible to compare
among the studies for the same levels of charge, because other features are likely to be less
important. Finally, there are different trip purposes. The previous studies involve all trip
purposes, but the study here is focused on only commuting trips. Reductions of commuting bý,
cars are likely to be slightly higher than overall reductions, because work trips are usually more frequent (more charged) than other trips.
Mode choice elasticity with respect to increasing charges
'rhe results of the effectiveness of charging can also be compared to previous studies in terms of demand elasticities with respect to increasing costs of car use (e. g. road pricing, tolling, parking
charges and fuel price). From the predictions of car use, using the mode choice model developed in Chapter 8, demand elasticity can be calculated to indicate the percentage change in the car use in response to a 1% change in the charge, other factors constant (for example, charge
elasticity of car use is -0.1, indicating a 0.1% reduction of car use as a result of 1% increase of charge). Mode choice elasticities for different charging levels are reported in Table 9.11.
Table 9.11 Arc elasticities' with respect to the charge
Changes of Leeds London thelevelof
charge (per day)
Base* Base + the small area
Base* Base + the small area
El - E2 -0.02 -0.01 -0.01 -0.01 U- E3 -0.05 -0.03 -0.04 -0.02 E3 - E4 -0.09 -0.06 -0.07 -0.04 E4 - E5 -0.16 -0.10 -0.13 -0.07 E5 - E6 -0.24 -0.16 -0.20 -0.12 E6 -U -0.36 -0.23 -0.30 -0.18
Base scheme is a fixed charge within the wide area between 7am-7prn with no delayed- time reduction
, 11( lnolem(md2 /demand, )
The arc elasticit) is defined as il (TRRL, 1980). In( charge, / clicirge, )

168
Fhe results demonstrate that the elasticities vary between -0.01 and -0.36. These are different
among different charging ranges, between charged areas and between Leeds and London. For different charging ranges, it is clear that the higher the levels of charge, the higher effect of charge increases.
Between the charged areas, the elasticities of charges in the small area are lower than in the
wide area. This is because the smaller area affects fewer car commuters. The elasticity of charge
increases in London are slightly lower than in Leeds (as discussed earlier in this section).
It can be recognised that the charge elasticities are sensitive to the initial level of charge. The
elasticities, presented in Table 9.12, are derived from the demands of car use at different levels
of charge, compared to no charge (the arc elasticity cannot be calculated for an initial of charge of zero), in order to make them comparable to the previous studies (reviewed in Section 2.6.4).
Table 9.12 Linear elastiCitieS2 with respect to the charge
Changes of Leeds London the level of
charge L (per day)
Base* Base + the small area
Base* Base + the small area
EO - Ei -0.14 -0.13 -0.19 -0.18 EO - E2 -0.14 -0.13 -0.19 -0.19 EO -0 -0.15 -0.14 -0.20 -0.19
- E5 -0.18 -0.16 -0.22 -0.20 EO - E7 -0.23 -0-19 -0.26 -0.23
Base scheme is a fixed charge within the wide area between 7am-7pm with no delayed- time reduction
Overall, charging schemes in London are more effective in reducing car use than in Leeds,
because in London there are a higher proportion of car users switch to other travel means at EI
charges. The wider area has a larger effect on car use than the smaller area. The higher the
levels ot'charge, the higher impacts on car use.
(demand2 - demand, I
(demand2 + demand, 2 The linear elasticity is defined as 771inear =21
(charge92 - charge, - (charge-, + charge, 2 which is ,,, enerally close to the arc elasticity (TRRL 1980). The linear elasticity is sometimes also c, illed arc elasticity (e. g. in Halcrow Fox and Associates, 1992: Fowkes et al., 1993a; Luk and Hepburn, 1993).

169
The estimated elasticities are reasonable, compared to previous studies of road user charging. Particularly, the values for London appear to match relatively well with the results of the ROCOL study (GOL, 2000); elasticities for work trips with respect to E2.50 and flO charge are
-0.17 and -0.27, respectively. They also broadly similar to the values transferred from the
evidences of increases of fuel price, parking charges and tolls, which the elasticities are between
-0.1 and -0.2 (reviewed in Section 2.6.4).
It should be noted that some elasticities, reviewed in Section 2.6.4, involve aggregate demand
elasticities, while the values in Tables 9.11 and 9.12 are derived from the disaggregate mode
choice model. Ourn and Waters H (2000) argued that mode choice elasticities tend to be lower
than ordinary demand elasticities in terms of absolute values because they do not take into
account of the effect of price change on aggregate volume of traffic, but only the split between
modes. They suggested that in order to produce regular demand elasticities, the discrete choice
study must include non-travellers in the dataset, as the choice of not making a trip is one of the
options facing users. This recommendation was taken into account in the study here, in which the proportions of car commuting reductions included those who always chose not to travel by
cars, and in the SP experiment respondents were able to state not making trip (e. g. by work at home, etc. ), if they wished.
The plausible elasticities are another confirmation that the developed mode choice model is
appropriate for use in the predictions of the car use reductions (in addition to the confirmation by the similar values of time achieved by this study and from the review of the UK values of
time, as presented in Section 8.2.3).
9.3.3 Predicted car commuting reduction in different groups of commuters
This section demonstrates the levels of car use reduction for different groups of commuters for
the base charging scenario. The predicted car commuting reduction in each group is the average
of individuals' choice probabilities of non-car in the group. This prediction procedure is
explained in Section 9.3.1.
Table 9.13 demonstrates the effects of charges on the mode choice behaviour for car commuters
who have different perceptions of the transport problems and a strong dislike of charging, as
well as the difference between age groups, which are the factors that show significant effects in
the mode choice model in chapter 8.

170
Table 9.13 Predicted car commuting reduction of the base scenario for different personal perceptions by charging level (and % change from base)
Charging All Pollution Pollution Perceiving Not perceiving level perceived as perceived as effective in effective in
(per day) very serious not very reducing reducing serious congestion congestion
El 24.4% 28.7% 23.0% 32 0% 22.3% (base) .
E2 25.4% 30.6% 24.0% 33.3% 23.5% (4.7%) (6.7%) (4.5%)
. 9%) (5.1%)
E3 26.9% 33.0% 25.4% 34.8% 24.9% (10.6%) (14.8%) (10.3%) (8.9%) (11.5%
E5 31.3% 39.5% 29.4% 39.4% 29.1% (28.5%) (37.4%) (27.8%) (23.0%) 30.4%)
f 7 37.6% 48.1% 35.4% 46.4% 35.3% I - (54.5%) (67. ý%L_ (53.8%) (45.1%) (5ý. `I%L_
Table 9.13 (cont. )
Charging Having Not having Age 35 - 44 Other ages level strong dislike strong dislike
(per day) of charging of charging f- 1
22.6% 25.2% 25.8% 23.5% (base)
E2 23.7% 26.6% 26.4% 24.8% (4.6%) (5.3%) (2.4%) 8%) 24 8% 28.2% 27.2% 26.6%
E3 . (9.6%) (11.9%) (5.6%) (13.3%) 27.8% 31.1% 29.4% 31.7%
E5 (22.8%) (23.5%) (13.9%) (35.0%) 32.4% 40.6% 32.5% 39.3%
E7 (42.9%) (60.9%) (26.3%) (67.3%)
The results show that for car commuters who perceive pollution as very serious, car use is
reduced more than for the other groups. (This result can be expected to be similar for the effects
ofthe perceptions of congestion problems, due to the high correlation. ) For those who have the
strong dislike of charge, charging is less effective in reducing car use. (The differences between
the perceptions were discussed in Section 8.3).
At LI daily charge, the effect of charging on those whose age is between 34 and 44 is slightly
higher than those in the other age groups. However, when the charge increases, car commuting
in the other age groups decreases faster. Car commuters aged between 34 and 44 are likely to be
more dependent on their car than the others (discussed in Section 8.3).
The differences of the effectiveness of charging between the perceptions lead to the higher level
of effectiveness in London than in Leeds (presented in Section 9.3.2), in which in London there
are higher proportions of people perceiving pollution and congestion as very serious and lower
proportion of people who have a strong dislike of charging.

171
In brief, Section 9.3 has demonstrated the effectiveness of different charging schemes, which is mainly dependent on levels of charge and areas of charge. It has also illustrated the effectiveness on different groups of car commuters.
9.4 Acceptability and Effectiveness
Sections 9.2 and 9.3 presented the prediction results of acceptability and effectiveness of road user charging schemes separately. The objective of this section is to draw conclusions about the
relationship between the acceptability and effectiveness. It examines the arguments by many researchers that road user charging is effective but less acceptable (see Section 2.7). This led to the fifth hypothesis in Section 1.2 that those who do not accept charging may be forced to
change from using their car to other modes (low acceptance, high effectiveness), and on the
other hand those who are able to continue use a car in charging systems may support the
systems (high acceptance, low effectiveness).
This section examines the relationship at disaggregate (individual) and aggregate levels. At the disaggregate level, individuals are analysed to see whether those who vote for charging schemes
tend to keep travelling by cars, and those who vote against the schemes are forced to switch
travel means. At the aggregate level, charging schemes are assessed to see whether acceptable
schemes are less effective, and unacceptable ones are more effective.
9.4.1 Acceptability and effectiveness among individuals
In the SP experiment (Chapter 4), the commuters were asked whether they would vote for the
presented charging schemes and what mode they would use for travelling to work. The overall
results of the voting and mode choice, regardless of the system characteristics, are demonstrated
in Table 9.14, in order to show the weak relationship between voting and mode choice at the
individual level.
Table 9.14 Voting and mode choice behaviour by different modes of commuting
Mode choice Car commuters (1314 observations)
Bus commuters (404 observations)
Other mode commuters (376 obs afions
'Yes' vote 235 (17.9%)
'No' vote 1079 (82.1 %)
'Yes' vote) 214 (53.0%
ý 'No'vote
190(47.0%)
'Yes' vote 170(45.2%)
'No' vote 206 8%)
Car 155 (66.0%L 680(63.0%) 2(0.9%) 5(2.6%) 12(7.1%) 10(4.9%)
Car earlier/later 33 (14.09,0) 206(19.1%) 4(l. 9%) 8(4.2%) 3 (1. %) 12(5.8%)
Bus 22(9.4%) 98(9.1%) 203(94.9%) 170(89.5%) 37 (21.8%) 27 (13.1% L
Others 25(10.6%) 95(8.8%) 5 (2.3%) 7 (3 7'o) 118 (69.4%) 157(76.2%)

172
For car commuters who have direct effects from charging, less than one fifth of the observations (17.9%) voted for the charging schemes, while the majority voted against them. The mode choices between those who vote for and against are relatively similar. About two thirds pre ferred to pay the charges to keep using their cars. The remaining responses chose to travel to
work by car in the un-charged times, by bus or by other alternatives.
For bus commuters, charging systems are relatively highly acceptable; over half voted for the
schemes. Most of them, either voting 'yes' or 'no, preferred not to change mode of travel. A
small number switched to other means.
For other mode commuters, although acceptance of charging systems is not as high as for bus
commuters, it is considerably higher than for car commuters. Between those voting 'yes' and 'no', mode choices are relatively similar, as found for car and bus commuters. About three
quarters of responses did not change mode of travel to work. Some switched to use buses,
possibly as a result of bus delayed-time reductions. A small number changed to use cars. This
would help charging systems to remain being effective in reducing car use. Many car users switch to non car modes, but small numbers of non car users will switch to using cars.
Moreover, Table 9.15 reports the strength of the relationship between voting and mode choice, based on the Cramer's V coefficientS3. These are reported separately for different modes used. The results are also divided for all samples and samples from Leeds and London.
Table 9.15 Cramer's coefficients showing strength of the relationship between acceptability and effectiveness
Sample Commuters Car user Bus user Other mode user
All 0.05 0.11 0.16 Leeds 0.06 0.11 0.26 London 0.16 0.26 0.16
The results demonstrate that the relationship overall is very low in both Leeds and London, and for all mode users, particularly for car users, indicating the weak relationship between
Cramer's V coefficient varies between 0 and I to indicate the strength of relationship between tv. -o nonunal variables that have more than two categories (Bryman and Cramer, 1997).

173
acceptability and effectiveness in commuters. This rejects the hypothesis that those ývho accept
charging would still use their car.
9.4.2 Acceptability and effectiveness among different charging schemes
At the aggregate level, the relationships between acceptability and effectiveness for different
charging systems in Leeds and London are illustrated in Figures 9.3-9.6. In Figures 9.3 and 9.4,
the acceptability is for only car commuters, while in Figures 9.5 and 9.6 acceptability is for the
public in general, including commuters and non commuters for all modes (whose opinions
would also be taken into account, if there was a referendum). (Note that in the figures the origin for the levels of effectiveness is not zero. )
The acceptability is presented in terins of the proportions of people who vote for the schemes (predicted from the voting model developed in Chapter 6 and presented in Tables 9.2 and 9.3
for the general public and Tables 9.8 and 9.9 for car commuters). The effectiveness is presented
in terms of the proportions of car commuting reductions (predicted from the mode choice model developed in Chapter 8 and presented in Tables 9.10). The results show the acceptability and
effectiveness of four charging scenarios:
Base: the base scenario, a fixed charge within the wide area (the Leeds Outer Ring Road
and London North/South Circular Roads) between 7am-7pin with no delayed-time
reduction;
0 Base + Small area: the base scenario but within the small area (the Inner Ring Roads of
Leeds and London);
0 Base + Small area + Subst. Env. Imp.: the base scenarlo but wIthIn the small area with
substantial environmental improvement;
0 Base +I "ariable charge: the base scenario but the charge based on a variable charge4
(either distance-based, time-based or delay-based).
The results demonstrate that effectiveness of charging is mainly affected by levels of charges:
the car use reductions increase when charges increase. Nevertheless, the effectiveness \'aries
moderatelv betNNeenl. 22', ', o and 37% reductions in Leeds and between 30% and 40% reductions in
4 The different effects of different charging methods are small (see Chapters 6,7 and 8), thus the results presented in this section are average effects of the three methods.

174
London. The different areas of charge also have a small effect on the reductions, which in the
small area are slightly lower than in the wider area.
On the other hand, acceptability of the schemes is highly affected by the levels of charge, areas
ot'charge. substantial environmental improvement and methods of charge. The acceptability for
the public in general varies substantially between 4% and 60% in Leeds, and between 16% and 80% in London. The acceptability for car commuters in Leeds (Figure 9.3) is slightly lower than for the public in general (Figure 9.5) because there are a small proportion of non car users. On
the contrary, in London the acceptability for car commuters (Figure 9.4) is moderately lower
than for the overall proportion (Figure 9.6) because there are a high proportion of non-car users.
For each charging scheme, there is some relationship between acceptability and effectiveness
with regard to charging levels; the higher the effectiveness, the less the acceptance. However,
among the schemes, when the charging levels are equal, effectiveness is slightly different but
acceptability is considerably different.
The figures in both Leeds and London do not support the belief in the relationship between
acceptability and effectiveness by many researchers (reviewed in Section 2.7), in which highly
cffective charging schemes are less acceptable, and less effective schemes are highly acceptable. In fact, overall, every charging system is relatively effective, but they can be highly or less
acceptable depending on charging system characteristics. Even with a charge at El per day, for
example, over 20% of car commuters in Leeds would switch to un-charged times or other
modes (see Figure 9.5). If the charge was based on a variable charge within the Outer Ring
Road, it would be acceptable to only 14% of the public. If the charge was fixed per day within
the Inner Ring Road and the environment was substantially improved, the system would be
supported by 60% of the public.
In London, the road user charging scheme, proposed by the Review of Charging Options for
London (ROCOL) Working Group to the Mayor of London, is based on the E5 daily charge
operated between 7am and 7pm within Central London (GOL, 2000). The results from the study
here demonstrate that the scheme would be acceptable to the majority of the public and effectiVe
in reduce car commuting. Figure 9.6 shows that it could reduce car travel to work by 33%, and
ý: oLdd be acceptable to -541',, o of the public. This result is very similar to ROCOL's findings; that
the -scheme can reduce car use by 300,,, and that 53% of the public agreed that it was a 'good
thing' (rc% ie%N-ed in Chapter 2). If the en,,, ironment was substantially improved, the acceptance
would increase to 00" o-

175
E f f e c
50%
40%
JE7 CIL7
30% E5 __E5_
E3 E2
20% -, 0%
r- -
10%
(Base)
(Base + Small area)
(Base + Pmall area + Subst. Env. Imp. )
E7 F-7
E5 f: 5
El
E3 ,,, *E3
0 $"_ E2 E2 E2 E2 E2
El El El
20% 30% 40% 50% 60% 70% 80% 90%
Acceptability
___Base: Fixed charge within the wide area between 7am-7pm with no del time reduction
Figure 9.3 Comparing acceptability and effectiveneSS5 among charging schemes for car commuters in Leeds
50% 7-- 1 (Base + Variable charge)
(Base) (Base + Small area) E (Bise Small area + Subst. Env. Imp. ) f E7 f 40%
e E7 E7 c E5 E5 t E5 E5
M E2
E3 E2 2 El
E3 E2
El V 30% e In e S S
20% 0% 10% 20% 30% 40% 50% 60% 70% 80%
I Acceptability
Base: Fixed charge within the wide area between 7am-7pm with no delayed-time reduction
Figure 9.4 Comparing acceptability and effectivenesss among charging schemes for car commutes in London
(Base + Variable charge)
90%
The acceptability is presented in terms of the proportions of people who vote for the schemes. The
effectiveness is presented in terms of the proportions of car commuting reductions.

176
50% -
(Base + Variable charge)
E (Base) f
f 40%
e (Base + Small area)
c (Base + Small area + Subst. Env. Imp. ) tI
7 E5 V 30% E5
T- e E: 5 5 n0 e E2 f3 E E2 F- 2 E2 S F- fl El El S
20% T7 ----7-- -- T-
0% 10% 20% 30% 40% 50% 60% 70% 80% 90%
Acceptability Base: Fixed charge within the wide area between 7am-7pm with no delayed-time reduction
Figure 9.5 Comparing acceptability and effectiveness among charging schemes for the general public in Leeds
50%
(Base Variable charge) (Base) (Base + Small area) EI (Base + Small area Subst. Env. Imp. ) f
f 40%
e E7 c E5 E5 t F-5
E3 rf--55
f3 E3 U F_ 3 22 E1 E2 1 Z2 F2 El 2 V 30% Ef
e n e S S
------- -- ------- 20% - ---------
0% 10% 20% 30% 40% 50% 60% 70% 80% 90% Acceptability
Base: Fixed charge within thewide area between 7am-7pm with no delayed-time reduction
Figure 9.6 Comparing acceptabilitv and effectiveness among charging schemes for the general public in London

177
9.5 Design of Acceptable and Effective Charging Schemes
This final section provides some suggestions on the design of acceptable and effective charging
schemes. These are drawn together from the findings in Chapters 6,7,8 and the previous
section in this chapter. The effects of the system characteristics and personal characteristics and perceptions on acceptability and effectiveness are surnmarised in Table 9.16.
Table 9.16 Summary of the effects on acceptability and effectiveness System Effects on Personal characteristics Effects on characteristics
ýAcceptability Effective n_e_ssd
ý
and perception Acceptability Effectiveness
Level of charge ++ Mode used (non-car) ++ N/A Environmental
++ 0 People in London 0 0 improvement (subst. ) (compared to in Leeds) Proportion of revenue Perceiving current used to PT and Tax 0 0
situation as unacceptable ++ 0
reduction Car delayed-time
+ 0 Perceiving congestion and ++ + reduction (T) pollution as very serious
Bus delayed-time Perceiving charging as
reduction 0 0 effective in reducing the ++ 0
problems Area of charge ++ - Strong dislike of charging - (small)
Age 55 or over 0 Ti f h 0 0 me o c arge
Age 34-44 0 - Metho o charge Gend r 0 0 (fixed charge compared ++ 0
Income 0 0 to variable charges) I
Note: 0 -> insignificant effect, - and + -> small effect,
-- and ++ --> high effect, --- and +++ -> very high effect.
Level of charge has a conflicting effect on acceptability and effectiveness. When it is increased,
acceptance of charging schemes falls substantially, but their effectiveness in reducing car use
increases. For area of charge, acceptance increases when charges are limited within city centre,
conipared to area-\vide, but the effectiveness falls slightly.
Although other system characteristics also influence acceptability, they do not significantly
affect effectiveness. Fixed daily charge is very much more acceptable than variable charges
based on distance, time and delayed-time. But these methods are not significantly better in
influencing car commuting reduction. Different times of charge, peak-time only and all day, do
not have different effects on either acceptability or effectiveness.
Intercstingly, there is no conflicting effect of the personal perceptions on acceptability and
cffectiveness. Those people who perceive very serious transport problems tend to willingness to

178
accept charging and also to reduce car use. On the other hand, those who have a strong dislIke
ofcharging are less supportive of charging schemes and less likely to reduce car use.
Between those who live in Leeds and London, the results from the model analysis found that
they are not significantly different in evaluating charging characteristics In their decision of
voting and mode choice. However, the predicted results demonstrated that charging systems are
more acceptable and effective in London than in Leeds. This is because in London there are higher proportions of people perceiving pollution and congestion as very serious, perceiving
effectiveness of charging and perceiving the current situation as unacceptable.
To achieve success in implementation of road user charging, the design is concerned with its
acceptability and effectiveness, as stated in the main research question: how can road user
charging schemes be designed to be simultaneously acceptable to the public and effective in
achieving their objective'?
Over 50% of the public would vote for a scheme and at least 20% in Leeds and 30% in London
of those commuting by car would expect their car use to be reduced (see Figures 9.5 and 9.6), if
" the environment was improved substantially;
" the scheme was based on a fixed daily charge-,
" the area of charge was within the city centre;
" the level of daily charge was less than f3 in Leeds, and less than 0 in London.
Acceptability varies substantially across different charging characteristics, but effectiveness as
measured by reduction of car use has small variations. The design should be mainly focused on
achieving acceptability because any charging scheme is relatively effective in reducing car use
(Section 9.4.2). This allows some flexibility in the design to achieve another objective of road
Liser charging which is for generating revenue. The level of charge can by selected by trading-
off between acceptance and revenue.
Moreover, acceptability and effectiveness can be improved by influencing the individuals'
perceptions of transport problems and effectiveness of the scheme. The public should be
ciwouraged to understand how serious transport problems are in damaging the society. Direct
influciices on the perccption-,; of benefits to self and to societý, (the selfish and social
perspectives) would also help (Chapter 7).

179
9.6 Conclusions
This chapter has demonstrated the predictions of acceptance and car commuting reduction,
responding to different charging systems, and for different groups of the public. The results
illustrated that acceptability varies substantially across individuals and system characteristics,
while effectiveness in reducing car use has a small variation across the factors.
This chapter has also investigated the relationship between acceptability and effectiveness. It is
interestingly found that in the groups of those who perceive transport problems (congestion and
pollution) as very serious, for which acceptance Is high, car use reduction is also high.
At the aggregate level, although more highly effective charging schemes (with higher levels of
charge) are less acceptable, more highly acceptable schemes (with lower levels of charge) are
not substantially less effective. Even at a fl. per day charge, over 20% of car commuters in Leeds and 30% in London would be expected to switch to non-car modes or not to use a car at the charged time.
The design of road user charging schemes should be mainly concerned with their acceptability, because any charging scheme is likely to be effective in reducing car use. Acceptable road user
charging schemes can be designed by limiting the area of charge to within the city centre and basing it on a fixed daily charge. Support would be significantly increased if the scheme was
perceiý, 'ed to bring substantial environmental improvement. Over 50% of people would vote for
such a scheme, if the charging level is less than E3 per day in Leeds, and f7 per day in London.
The public are highly concerned with improvement of the environment. This suggests that road
user charging would be more acceptable, if its revenue was used in improving the environment. As found by Stokes (1996), support for using the revenue in environmental improvement is as high as in public transport. Thorpe et al. (2000) found that the revenue spent in improving the
enN, ironment is a second preference, following improving public transport.
Moreover, increasing acceptance of road user charging schemes can be influenced not only by
the design of charging system characteristics, but also by provision of clear information on the
severity of congestion and pollution, and on the effectiveness of road user charging in reducing
the problems. In addition, they need to be convinced that road user charging will provide
beiiefits to both themselves and society as a whole.

180
Chapter 10
Conclusions
10.1 Summary of Research
This final chapter aims to provide a summary and conclusion for the research, which has been
reported in the previous nine chapters. Chapter I presented the objectives of the research and the framework of the study. Chapter 2 reviewed road user charging and previous studies, which led
to the requirements for the study. Chapter 3 provided background about the stated preference (SP) technique, which was used as a tool to achieve the objectives. In Chapter 4, the development of the SP questionnaire was presented.
In Chapters 5-9, the results of the data analyses were reported. Chapter 5 demonstrated the
general public attitudes to the transport problem and road user charging. In Chapters 6 and 7,
acceptability influenced by the system characteristics and the individuals' perspectives (selfish
and social perspectives) was presented in the voting behaviour models. In Chapter 8, the
impacts of the charging characteristics, as well as the personal characteristics and perceptions,
on car commuters' mode choice behaviour were presented in the mode choice models. In
Chapter 9, the predicted results of acceptability and effectiveness of charging schemes from the
voting and mode choice models were illustrated. It also presented the relationship between
acceptability and effectiveness and suggested how to design acceptable and effective schemes.
The i-ei-i-iainder of this section provides a summary of the research objectives and methodology.
Section 10.2 summarises the findingsl from the research and their implications. Finally, Section
10.3 suggests ideas for further research.
10.1.1 Research objectives
The revie\v of previous studies (in Chapter 2) clearly showed that road user charging can be
designed to mana. ge travel demand effectively in urban areas, in order to reduce congestion and
I Some findings from the research Nvere presented in conferences (listed in Appendix

181
pollution, and raise revenue to finance transport and public services. This is also confinned by
the long experiences from the systems in Singapore and Norway.
Many countries have been interested in the implementation of urban road user charging. Apart
from Singapore and Norway, nowhere else has succeeded in introducing urban charging
schemes. The major obstruction is whether road user charging can be acceptable and effective (Jones, 1998). Many researchers concluded that in general road user charging is highly
effective, but less acceptable to the public.
The aim of this research was to examine the impact on acceptability and effectiveness, in order to help in the design process of road user charging schemes. The main research question was (Chapter 1):
How can road user charging schemes be designed to be simultaneously
acceptable to the public and effective in achieving their objective?
fn order to answer the question, the study examined the effects of various factors on
acceptability and effectiveness (reviewed in Chapter 2). This involved investigating the effects
of road user charging characteristics, which included the benefits (delayed-time reduction,
environmental improvement and revenue allocation) and the charging features (charging levels,
charging methods, charged area and charged time). This allowed the research to arrive at
measures of different degrees of acceptability and effectiveness for various charging schemes.
The research also investigated the impacts of personal characteristics and perceptions. The
personal characteristics related to transport mode used, income, age, gender, perception of
current travel situation, perception of transport problems (congestion and pollution), perception
of effectiveness of charging in reducing the problems and the level of dislike of charging. It then
demonstrated different levels of acceptance and effectiveness among different groups of the
public.
Furthermore, it examined the influence of individuals' selfish perspective (primarily concerned
with their own well-being) and social perspective (primarily concerned with well-being of
society) on acceptability. This was based on a hypothesis that people are not concerned only
with benefits to themselN, es, but also benefits to society as a whole.
I mally. it examined the argument by many researchers that road user charging is effective but
less acceptable, and also MNýestigated how to design acceptable and effective road user charging
schemes,

182
10.1.2 Methodology
The stated preference (SP) method was used to examine the impacts of charging sý'stem
characteristics on acceptability and effectiveness. The reasons for choosing the method (discussed in Section 3.2) were mainly that it can explain the effects of relevant factors on
preference and behaviour in quantitative terms, and provide results which can be used for
predictions.
The design and development of the paper-based SP questionnaire (presented in Chapter 4) was
carried out through four pilot surveys between August 1999 and July 2000. The main survey
was conducted between November 2000 and March 2001 in Leeds and London by household
and employee surveys. There were 830 respondents in the sample, of whom 660 were from
Leeds and 170 from London. The SP exercises presented a set of hypothetical charging
scenarios to respondents. For each scenario, questions were asked to measure the studied issues,
including acceptability, effectiveness, and the selfish and social perspectives.
Acceptability was reflected by voting behaviour, in which individuals were asked whether they
were willing to vote for charging schemes. Selfish and social perspectives were reflected by the
perceptions of benefits to self and to society. Effectiveness in reducing congestion was
evaluated by mode switching of commuters responding to the scenarios. This was concentrated
only on work trips because mode choice is very much likely to depend on trip purpose, and the
work trip is seen as the most important for the majority of the public.
The analysis technique was based on random utility theory, in which individuals were assumed
to maximise their utility by choosing the option with the highest preference or utility to them.
This was used to fon-nulate the multinomial-logit based model of voting and mode choice. The
model involved three different forms of model analyses. The standard logit model was used to
demonstrate the overall effects of variables for the whole sample. The segmentation model,
based on the incremental factors, was used to identify different effects for different groups of
people. The random parameters logit model was used to examine the taste variation among
indi\-iduals (heterogeneity), which was from unobserved sources and unable to be captured by
the segmentation of respondents. These three models were estimated for both the voting
beha\, iour and mode choice behaviour. Then, the preferred models were used to predict the
le-v, els of acceptance and the levels of effectiveness for different charging schemes.

183
10.2 Main Findings and Policy Implications
The main findings of the research relate to the effects on acceptability and effectiveness, and the
suggestions on how to design acceptable and effective road user charging schemes. These
involve both the charging system characteristics and the intrinsic influences on individuals. The
effects of these factors are sun-imarised in the previous chapter (in Table 9.16).
10.2.1 General public attitudes
Overall, most respondents perceived that congestion and pollution problems in their cities are
serious or very serious, particularly in London. However, many people still perceived their
current travel situations as acceptable. This perception is also likely to be influenced by other factors, not only the perceptions of congestion and pollution. Furthermore, the majority of car
users did not perceive that charging is an effective solution in reducing congestion and
pollution, but it was perceived as such by a majority of non-car users.
From the general comments provided by respondents in a free space, it was found that one main
concern was about public transport and alternatives. Many respondents felt that the provision of
alternative means of travel is currently not sufficient and needs to be improved. The other frequent comments were about scepticisms, of road user charging. Many respondents did not think that charging is a solution for transport problems or that they should pay more for using
their cars.
10.2.2 Acceptability
Effects of the system characteristics on acceptability
The study found that acceptability of road user charging is influenced by the benefits and
system features of the charging scheme. It is highly sensitive to the level of charge: the higher
the level of charge, the lower acceptance, as expected. However, the levels of acceptance can be
considerably increased, when the environment is substantially improved through road pricing.
Car delayed-time reduction also has some effects in increasing acceptance. Bus delayed-time
reduction was found to have no significant influence on acceptability. Other attributes of bus
services, such as reliability, punctuality, convenience and availability, are likely to be more
important than just the delayed-time reduction. Charges within the city centre are much more
acceptable than in a wider area. Fixed daily charges are significantly more acceptable than
variable charges: distance-based, time-based, and delayed-based charges. People prefer a simple
system in which the charge is known before travelling. For time of charge, there is no difference
in acceptability between the charge during the morning peak-time and all day. For the use of
revenue, there is no significantly different effect among revenue allocation to public transport
184
improvement only, to tax reduction only, and to public transport improvement and tax reduction equally. Although, previous studies (reviewed in Section 2.5) found that spending on public transport improvement and tax reduction can increase acceptability, it is likely that there is no consensus among people about the proportions of spending.
Effects of the personal characteristics and perceptions on acceptability
For personal characteristics, mode used has a significant effect on acceptability; acceptance
among car users is much less than among non-car users. Elderly people are more sensitive to
increases of charging levels than others. However, other personal characteristics: gender, location and income, surprisingly, do not influence acceptability. Moreover, acceptability is highly affected by personal perceptions. Individuals tend to accept a charging scheme, if they
perceive their current travel situation as unacceptable, perceive congestion and pollution
problems as very serious, or perceive charging schemes as effective in reducing the problems. On the contrary, charging schemes attract less support from those who have a strong dislike of
charging (e. g. those who complained that they should not pay more for using cars, those who
were concerned about indirect effects of charging and those who highly preferred to use cars; discussed in Section 5.6).
Moreover, it was found that every charging system in London is more acceptable than in Leeds.
This is because in London there is a higher proportion of non-car users, and higher proportions
of people perceive their travel situation as unacceptable, perceive very serious transport
problems, and perceive charging schemes to be effective.
Effects of the selfish and social perspectives on acceptability
It was found that acceptability is highly sensitive to the individuals' perceptions of the overall benefits of charging schemes to themselves (from a selfish perspective) and to society as a
whole (from a social perspective). In other words, individuals are not concerned only about the
benefits to themselves, but also partly about the benefits to their community. Each individual
has his/her own weight for trading-off between these perspectives when they vote for a scheme.
Furthermore, it was found that individuals evaluate charging schemes differently between the
selfish and social perspectives. These perspectives are affected by the system characteristics.
The selfish perspective is mainly influenced by the level of charge, while the social perspective
is mainly affected by the environmental improvement. The perspectives are also influenced by
personal characteristics and perceptions. Different groups of people evaluate charging schemes
differently. The selfish perspective is clearly different between car and non-car users. The
perceptions of benefits to society are more affected by personal perceptions, including

185
perception of current travel situation, perception of congestion, perception of char-ging as
effective in reducing congestion and the level of dislike of charging, rather than personal
characteristics.
Design of acceptable schemes
Acceptable road user charging schemes can be designed by limiting the area of charge to within the city centre and having a fixed charge per day. Support would be increased significantly if the scheme was promised to bring substantial environmental improvement. Over 50% of people
would vote for this scheme, if the charging level is less than E3 per day in Leeds, and up to f7
per day in London. Moreover, acceptability could be influenced by providing clear information
on the severity of congestion and pollution, and on the effectiveness of road user charging in
reducing the problems, and by emphasising both personal and social benefits.
The study results illustrated that acceptability varies substantially across different systems. This
implies that acceptance levels of any transport policy could be changed from very low to very high, depending on its system features (particularly its level of charge). One cannot say that the
policy is acceptable to, for example, a third of the public without mentioning the system
characteristics. In studies of acceptability, respondents should not be simply asked whether they
support or oppose a policy without being provided with some information of main
characteristics of system.
10.2.3 Effectiveness
Effects of the system characteristics on effectiveness
In order to evaluate effectiveness of road user charging schemes, this study focused on a main
objective of the policy which is to reduce congestion by influencing travel mode switching. This
was evaluated by mode choice of commuters responding to the charging schemes.
It was found that the car and bus delayed-time reductions of up to 75% of individuals' current
delayed-time presented in the experiment were too small to compensate for the charge and
liciice to influence the mode choice behaviour of car commuters. The time reductions were
ignored by respondents in their decisions on choosing mode for journeys to work. Instead, the
mode choice behaviour was influenced by the travel time difference and ratio between bus and
car, and travel distance. When the charge increases, car use preference will fall, but Nvhen the
time difference and ratio increase, car use will be more preferred. Car use preference also relates
I journeys, cars are more preferred than for short to individuals' travel distance. For long distance
j. oumeys. The model estimated a plausible average value of time at 8.12 p/mIn, which Is close to

186
the review of UK value of time, and the demand elasticities for work trips are around -0.15 and
-0.20 for a charge within the Inner Ring Road of Leeds and London, respectively.
Although car use is very much more preferable to car commuters than other modes, increasing the level of charge would reduce travel to work by car. The effect of charges in the small area (Inner Ring Road) on reducing car use are less than in the wider area. The other system
characteristics: different charged times and different methods of charge are not significantly different in reducing car use for the journey to work.
1, urthermore, the study found that most commuters who do not use a car do not change their
travel modes in responding to charging schemes. This would help to keep road user charging
schemes effective, in that while car users switch to non-car modes, non-car users do not change to using cars.
Effects of the personal characteristics and perceptions on effectiveness
In addition to the charging characteristics, some personal characteristics and perceptions also
influence car use. Those aged between 35-44 (including a high proportion of high income
people) are less sensitive to the charge. They have a higher value of time than others. On the
other hand, those who perceived pollution problems as very serious are more likely to switch to bus or other non-car modes than others. They tend to have pro-environmental behaviour. In
contrast, those, who have a strong dislike of charging or perceive that bus is very poor
compared to the car, are more dependent on their cars. In turn, this may be a reason for having a
strong dislike of charging.
These differences among individuals' perceptions lead to a higher level of effectiveness in London than in Leeds. This is because in London there are more people perceiving pollution
and congestion problems as very serious and fewer people having a strong dislike of charging.
Design of effective schemes
Not surprisingly, the research found that the car use reduction increases when the charge
increases. The car use reduction for charges in the small area is slightly lower than in the wide
area. However overall any charging system is relatively effective in reducing car commuting.
Even Lit fI per day, over 20% of car commuters in Leeds and about 30% in London would
.,, witch to non-car modes or uncharged times. When the charge rises to f7 per day, the
reductions would increase to around 40%. About half of the reductions are through car use
change to travel in uncharged times. Others would switch to alterriative modes. Small number of
iion-car users would change to using cars because of car delayed-time reductions. Furthermore,

187
road user charging would be more effective in reducing car use, if people perceived that
pollution problems are very serious.
10.2.4 Design of acceptable and effective road user charging schemes
To achieve success in implementation of road user charging, the design is concerned with its acceptability and effectiveness, as stated in the main research question: how can road user charging schemes be designed to be simultaneously acceptable to the public and effective in achieving their objective?
The research examined the relationship between acceptability and effectiveness in reducing car
use. This was based on the sample who were car commuters. Many researchers believe that road
user charging is effective, but less acceptable. This may imply that highly acceptable charging
schemes are less effective, while less acceptable schemes are highly effective. However, this is
not totally correct. Although more highly effective charging schemes (with higher levels of
charge) are less acceptable, more highly acceptable schemes (with lower levels of charge) are
not substantially less effective. In other words, effective charging schemes are not always
unacceptable. Even at a tl per daý, charge, over 20% of car commuters in Leeds and 30% in
London would be expected to switch to non-car modes or not to use cars during the charged
period. This charge can be designed to achieve support from the majority of the public.
The study found that acceptability varies substantially across system characteristics, while
effectiveness in reducing car use has a small variation across the factors (see Figures 9.5 and 9.6). The acceptance levels of charging schemes would be considerably increased if the area of
charge was limited to the city centre and if the environment was substantially improved. The
effectiveness drops just a little with the small area of charge and has no effect from the
em'Ironmental improvement. For example, for car commuters in Leeds, at a El daily charge
\vithin the Inner Ring Road and with substantially environmental improvement, the acceptance leN, el is relatively high (56%), but it falls dramatically when the charge increases. At a0 daily
charge, acceptance level is rather low (24%). On the other hand, the effectiveness at afI daily
chai-ge is relatively high (22% reduction of car commuting), and it rises slightly when the
chai-oc increases.
]Fherefore, the design of road user charging schemes should be mainly concerned with their
acceptability, because any charging scheme is likely to be effective in reducing car use. In other
words, charging schemes that are acceptable are also effective. Over 50% of the public would
\, ote for a scheme and at least a quarter of those commuting by car would expect to reduce their
car use, if-

188
" the environment was improved substantially;
" the scheme was based on a fixed daily charge;
" the area of charge was within the city centre;
" the level of daily charge was less than 0 in Leeds, and less than V in London.
The suggested scheme is likely to achieve both acceptability and effectiveness. Nevertheless, if a charging scheme was designed for charging within the city centre with a low level of charge, it
may be difficult to achieve substantial environmental improvement. It should be clear to the
public how the environment will be enhanced (this leads to further research; see Section 10.3).
A programme for the environmental improvement may need to be proposed with charging
schemes.
Since acceptability can be improved considerably by improving the environment substantially, this implies that the public awareness of the environment is relative high. This suggests that if
some revenue from charging schemes was promised for use in the environment programme,
acceptability is likely to be increased. This extends a typical suggestion that revenue from road
user charging should be used to finance public transport improvement and to lower taxes.
Acceptance of road user charging schemes and its effectiveness in reducing car use can be
influenced not only by the design of charging system characteristics, but also by provision of
clear information on the severity of congestion and pollution, and on the effectiveness of road
user charging in reducing the problems. In addition, individuals need to be convinced that road
user charging will provide benefits both to themselves and to society as a whole.
To induce these perceptions, intrinsic instruments (e. g. education programmes and awareness
campaigns) are useful. They are likely to be able to improve acceptability of charging schemes.
They may also motivate car users to be aware about the negative effects of car use on
themselves and society, which in turn lead them to reduce their car use.
In brief, this research suggests that road user charging schemes can be designed to achieve
acceptability and effectiveness in reduce car use by choosing appropriate charging features and
offering sufficient benefits. This design can be seen as involving extrinsic incentives, based on
pricing mechanism and compensation, which are successful at some levels. Furthermore, the
acceptability and effectiveness can be enhanced by intrinsic motivations on individuals'
perceptions. People should feel themselves involved as parts of the problems and solutions.
They should understand why they should support the schemes and why they should reduce their
car use.
189
10.2.5 Summary of the main findings
The relationship between acceptability and effectiveness of road user charging schemes is
not high. It is not simply the case that highly effective schemes are less acceptable. Acceptance levels of effective schemes can vary from low to high. It is possible to design
road user charging schemes to achieve acceptability and effectiveness simultaneously. The charging system characteristics have high effects on acceptability, but small effects on
effectiveness. Although acceptability falls substantially when the charge increases, it
improves considerably where the charged area is limited within city centre and the
environment is substantially amended. Effectiveness in reducing car use increases
moderately when the charged increases. It is slightly different between charges in a city
centre and a wider area. Nevertheless, from any charging scheme, some car use reduction
can be expected, even afI daily charge.
Acceptability and effectiveness is also influenced by some personal characteristics (mode
used and age). More interestingly and importantly, acceptability and effectiveness are
motivated by personal perceptions (perceptions of current travel situations, congestion and
pollution, effectiveness of charging in reducing the problems and strong dislike of
charging). Acceptability and effectiveness can be improved by provision of clear information on the principles and objectives of charging, on the severity of congestion and
pollution, on the adverse effects of car use, and on the effectiveness of road user charging.
Each individual has different perspectives in evaluating charging schemes on whether or
not to support them. One is concerned primarily with benefits to self (called selfish
perspective). The other is concerned mainly with benefits to society (called social
perspective). Each individual has his/her own weights for these two perspectives. Overall,
benefits to self are considered as more important than benefits to society, in contrast to bus
users and individuals who are highly aware of the pollution problem. Hence, to improve the
acceptability, the public need to be convinced that road user charging will provide both
personal and social benefits. In general, this indicates that utility of an individual
(particularly from a public policy), is not only maximised based upon what a person gain
personally, but also upon whether society as a whole will be better off.
Acceptance levels vary substantially across different system characteristics. They could be
changed from very low to very high. Attitudinal studies (for any policy) should not ask
individuals' attitudes without providing some information on the main features of systems.

190
10.3 Suggestions of Further Research
This research has examined the impacts of charging system characteristics and individuals'
characteristics and perceptions on acceptability and effectiveness. It has also suggested how to design charging schemes which are simultaneously acceptable and effective. Nevertheless, some further research would be useful for the design.
Firstly, it is interesting to study in greater detail the acceptability and behavioural responses. Using the SP method, the study cannot get into deep details of the effects of each factor and the
reasons behind those effects. For example, it has not been possible to determine why bus delayed-time reduction has no significant effect on acceptability, why there are no significantly different effects between different proportions of revenue used for public transport improvement
and tax reduction and between different charged times, how to achieve substantial environmental improvement, how the environment is desired by the public, and whether the
revenue used in improving the environment is important in increasing acceptance. These studies will require qualitative research.
By using the activity-based approaches (Jones, 1990; Ettema and Timmermans, 1997), further details of behavioural responses to charging schemes can also be examined, for example how departure time and route choice change, how individuals' schedules change, how interactions between activities of individuals and other members in their households are, and what the
constraints of each individual and his/her family on behavioural responses are.
Further research should also examine one of the findings from this research in that effectiveness
of afI daily charge in reducing car commuting is relatively high, but when the charge increases
the reduction only increases slights, compared to the initial reduction. This implies that the
small charging level filters out some car users who are not willing to pay for any charge and have alternative options available, while the remainder who want to keep using their cars are
much less price sensitive. To some extent, this is similar to the evidence from Singapore, in
which the elasticity for the first implemented congestion tolls in 1975 is much higher than the
elasticities for the toll changes in following years (see Luk, 1999).
Secondly, it would be useful to examine the effects of combinations of road user charging with
other policies on acceptability and effectiveness. When road user charging is combined with
other transport policies, acceptability and effectiveness is likely to be different from those for
road user charging alone. This needs further research to examine how acceptability and
effectiveness of packages of policies changes; for example, when road user charging is

191
combined with improving public transport, raising or reducing parking charges, and raising or reducing petrol taxes. The study should be able to identify the package of policies which is the most acceptable and effective.
Thirdly, in addition to uses of transport policies (extrinsic instruments) as solutions to transport problems, we should investigate intrinsic instruments to motivate individuals to support policies which are effective, and to cooperate in reducing causes of problems (e. g. car use). Although some approaches have been used to reduce car use and address environmental concerns, such as travel awareness campaigns and travel blending programme (see Curtis and Headicar, 1997; Stradling et al., 2000; Rose and Ampt, 2001), for the case of road user charging some programmes are also needed to help in improving acceptability and effectiveness. This should involve programmes that are able to help the public to understand the principle and need of charging.
Finally, we may also need to study in deeper detail the political problems. It is not clear why politicians in both central and local governments make decisions not to introduce road user charging. It is unlikely to be just simply related to public acceptability. In the case of cordon
pricing in Norway, public acceptance was relatively low (less than a third of people) before the
scheme was in place (Odeck and Brathen, 1997), but the government was able to implement it.
In the case of London, the current mayor has planned to implement a congestion charging
scheme in 2003 (GAL, 200 1). Results of the attitude surveys found that the scheme is supported by over half of people in London; even more (about two thirds) support it if revenue is used for
improving public transport (GOL, 2000). Nevertheless, it is still in doubt whether the scheme
will be introduced. Though these are not strong evidences, they imply that in addition to public
acceptability something else obstructs the implementation of road user charging.
A political problem was mentioned by Robinson (2000) who studied the politics of transport.
He argued that in the UK transport policy change and the formation of policy proposals have
been constrained by policy imperatives of the state which attempt to maintain its commitment to
high levels of freedom, mobility and economic activity. This has created considerable instability
in the agenda setting process. The government tries to solve transport problems, but does not
want to challenge the structural imperatives. The problem of road user charging is that it is
incompatible with the imperatives.
Further research should investigate whether there are different perspectives between
government (who decide which policies should be implemented) and transport planners (who

192
suggest which policies are able to solve transport problems). This may help to understand why
road pricing recommended by transport planners is not easily implemented.
193
References
Accent Marketing and Research and Hague Consulting Group (1994), Willingness of Motonygy Users to Pay Tolls, Prepared for Department of Transport, UK.
AhIstrand, 1. (2001), "The politics and economics of transport investment and pricing in Stockholm", Journal of Transport Economics and PoILCY, 32(3), 437-485.
Ajzen, 1. (1985), "From intentions to actions: a theory of planned behavior", in J. Kuhland and J. Bechman (eds. ), Action-Control: From Coggpitions to Behavior, Springer-Verlag, USA.
Aj zen, 1. (1988), Attitudes, Personality, and Behavior, Open University Press, UK.
Ajzen, 1. (1991), "The theory of planned behaviour", Organizational Behaviour and Human Decision Process, 50,179-211.
zen, I. an M. Fishbein (1980), Understanding Attitudes and Predicting Social Behavior, Prentice-Hall, USA.
Ampt, E., J. Swanson and D. Pearmain (1995), "Stated preference: too much difference'? "I Proceedings 23rd European Transport Forum: Seminar E, 73-88, PTRC, UK.
Anderson, M., J. Meaton, C. Potter and A. Rogers (1998), "Greener transport towns: public acceptable, privately resisted? ", in Transport Policy and the Environment, edited by D. Banister (1998), E&FN SPON, UK.
Arsenio, E., A. L. Bristow and M. Wardman (2000), "An innovative stated preference computer survey model for valuing noise impacts from road traffic", Proceedings of European Tranmoij Conference: Seminar E 67-80, PTRC, UK.
Baron, J. (1995), "Blind justice: fairness to groups and the do-no-harm principle", Journal of Behavioral Decision Making, 8,71-83.
Bates, J. (1998), "Reflections on stated preference: theory and practice", in J. Ortum, D. Hensher and S. Jara-Diaz (eds. ), Travel Behaviour Research: Updating the State of Play, Chapter 6, pp. 89-103, Pergamon, UK.
Bates, J. and G. Terzis (1997), "Stated preference and the 'ecological fallacy"', ProceedinLs 25th European Transport Forum: Seminar F, 155-169.
Beesley, M. E. and G. J. Roth (1962), "Restraint of traffic in congested areas", The Town Planning Review, 33(3), Reprinted in 1963 by Department of Applied Economics, University of Cambridge (Reprint Series No. 195).
Ben-Akiva, M. and S. R. Lerman (1985), Discrete Choice Analysis: Theory and Application to Travel Demand, MIT Press, USA.

194
Berkowitz, L. (1970), "The self, selfishness, and altruism", In J. Macaulay and L. Berkovitz (eds. ), Altruism and Helping Behavior, 142-15 1, Academic Press, New York.
Bhat, C. R. (1998a), "Accommodating variations in responsiveness to level-of-service measures in travel model choice modeling", Transportation Research A, 32(7), 495-507.
Bhat, C. R. (I 998b), "Accommodating flexible substitution patterns in multi-dimensional choice modelling: formulation and application to travel mode and departure time choice", Transportation Research B, 32(7), 455-466.
Bhat, C. R. (2001), "Quasi-random maximum simulated likelihood estimation of the mixed multinomial logit model", Transportation Research B, 35,677-693.
Bhatt, K. (1993), "Implementing congestion pricing: winners and losers", ITE Journal, 63(12), 33-37.
Bonsall, P. (1985), "Transfer price data - its definition, collection and use", in E. S. Ampt. A. J. Richardson and W. Brog (eds. ), New Survey Methods in Transport, VNU Science Press, Netherlands.
Bonsall, P., M. Wardman, C. Nash, and P. Hopkinson (1992), "Development of a survey instrument to measure subjective valuations of non-use benefits of local public transport services", in E. S. Ampt, AT Richardson and A. H. Meyburg (eds. ), Selected Reading's in Transport Survey Methodology, Eucalyptus Press, AUS.
Bonsall, P. W. and I. Palmer (1997), "Do time-based road-user charges induces nsk-taking? - Results from a driving simulator", Traffic Engineering and Controls, 38(4), 200-204.
Bonsall, P., H-J. Cho, I. Palmer and N. Thorpe (1998), "Experiments to determine drivers' response to road user charges", Proceedings of European Transport Conference: Seminar D, PTRC, UK.
Bonsall, P. and HA. Cho (1999) Travellers' response to uncertainty: the particular case of drivers' response to imprecisely known tolls and charges, Proceedings of Euroj2ean Tranvo Conference: Seminar E UK.
Bradley, M. (1988), "Realism and adaptation in designing hypothetical travel choice concepts", Journal of Transport Economics and Policy, 22(l), 121-137.
Bradley, M. A. and E. P. Kroes (1992), "Forecasting issues in stated preference survey research", in E. S. Ampt, AT Richardson and A. H. Meyburg (eds. ), Selected Readings in Transport Survey Methodology, Eucalyptus Press, AUS.
Bradley, M. and A. J. Daly (1993), "New analysis issues in stated preference research", Proceedings 21 st PTRC Summer Annual Meeting, PTRC, UK.
Bristow, A. L., P. G. Hopkinson, C. A. Nash and A Wardman (1991), Evaluation of the use and non-use benefits of public transport, Report No. 1: Development of survey methodology, Working Paper 309, Institute for Transport Studies, University of Leeds, UK.
Brownstone, D. and K. Train (1999), "Forecasting new product penetration with flexible
substitution patterns", Journal of Econometrics, 89(1-2), 109-129.

195
Bryman, A. and D. Cramer (1997), Quantitative Data Analysis, Routledge, UK.
Button, K. J. (1984), "Road pricing - an outside's View of American experiences", Transpqrt Reviews, 4(l), 73-98.
Catling, 1. and B. Harbord (1985), "Electronic road pricing in Hong Kong: 2. technology", Traffic Engineering and Control, 608-615.
CfIT/MORI (2000), The QfIT Report: Public Attitudes to Transport in England, Commission for Integrated Transport, UK. (available from www. cfit. gov. uk).
CflT/MORI (2001), The CfIT Report 2001: Public Attitudes to Transport in England, Commission for Integrated Transport, UK. (available from www. cfit. gov. uk).
Cho, H. J. (1998), Route Choice Responses to Various Road User Charges and Traffic Information, PhD Thesis, Institute for Transport Studies, University of Leeds, unpublished.
Cirillo, C., A, Daly and K. Lindveld (2000), "Eliminating bias due to the measurements in problem in SP data", in Ortuzar, J. de D. (ed. ), Stated Preference Modelling Technigues, PTRC, UK.
Collard, D. (1978), Altruism and Economy: a Study in Non-selfish Economics, Martin Robertson, UK.
Collis, H. and H. Inwood (1996), "Attitudes to road pricing in the Bristol area", Traffic Engineering and Control, 37(10), 580-584.
CONCERT-P Project (1998), Pricing & Restraint Strategies: Guidelines for European Policy Development, Deliverable 6: Guidelines for European Policy Development v. 1.0.
Conner, M. and P. Sparks (1996), "The theory of planned behaviour and health behaviours", in M. Conner and P. Norman (eds. ), Predicting Health Behaviour, Open University Press, UK.
Cullinane, S. (1992), "Attitudes towards the car in the U. K.: some implications for policies on congestion and the environment", Transport Research A, 26(4), 291-301.
Curtis, C. and P. Headicar (1997), "Targeting travel awareness campaigns: which individuals are more likely to switch from car to other transport for the journey to work? ", Transport policy, 4(l), 57-65.
Daniel, J. I. and K. Bekka (2000), "The environmental impact of highway congestion piecing", Journal of Urban Economics, 47,180-215.
Daniels, R. F. and D. A. Hensher (2000), "ValuatIon of environmental impacts of transport projects: the challenge of self-interest proximity", Journal of Transport Economics and Policy, 34,189-214.
Dargay, J. and P. Goodwin (2000), Changing Pnces: a Dypiamic Analysis of the Role of Pricing ing Ltd, UK. in Travel Behaviour and Transport Policy, Landor Publishi
Dawes, R. M. (1980), "Social dilemmas", Annual Review of Psychology, 31,169-193.

196
Decorlar-Souza, P. (1993), "Congestion pricing: issues and opportunities", ITE Journal, 63(12), 27-32.
DETR (1998), Breaking the Logjam: the Government's consultation paper on fighting traffic congestion and pollution through road user and workplace parking charges, Department of Environment, Transport and the Regions, U. K.
DETR project 'Analysis of Congested Network' (2001), carried by ITS (University of Leeds), TORG (University of Newcastle upon Tyne), John Bates' Services (Consultant) and TRL (Transport Research Laboratory), unpublished.
Domencich, T. A. and D. McFadden (1975), Urban Travel Demand: A Behavioural Analysis, North-Holland, Amsterdam.
Dupult, J. (1844), On the measurement of the utility of public works", Annual des Ponts et Chaussees, 2ed series, Vol. 8, translated by R. H. Barback, International Economic Papers, 2, 83-110,1952. Reprinted in D. Munby (ed. ), Transport: Selected Reading, Penguin Books, London, 1968.
Eagle, A. H. and S. Chaiken (1993), The Psychology of Attitudes, Harcourt Brace Jovanovich, USA.
Econometric Software (1999), LIMDEP 7.0 for Windows, Econometric Software Inc., New York.
Edinburgh City Council (2000), New Transport Initiative: Technical Report on Phase 1.
Emmerink, R. H. M., P. Nijkamp and P. Rietveld (1995), "Is congestion pricing a first-best strategy in transport policy? a critical review of arguments", Environment and Planning B: Planning and DesigLi, 22(5), 5 81-602.
EPA (1997), Opportunities to Improve Air Qualily through Transportation Pricing Programs, U. S. Environmental Protection Agency, Washington (available from http: //www. epa. gov/oms/market/pricing. pdf).
Ettema, D. F. and H. J. P. Timmermans (eds. )(1997), Activity-Based Approaches to Travel Analysis, Elsevier Science, UK.
Fishbein, M. and I. Ajzen (1975), Belief, Attitude, Intention and Behavior: An Introduction to Theory and Research, Addison-Wesley, USA.
Foo, T. S. (2000), "An advanced demand management instrument in urban transport: electronic road pricing in Singapore", Cities, 17(l), 33-45.
Fowkes, A. S. and M. Wardman (1988), "Design of stated preference travel choice experiments with special reference to taste variation", Journal of Transport Economics and Policy 22(l), 27- 44.
Fowkes, A. S., N. Sherwood and C. A. Nash (1993a), Segmentation of the Travel Market in London: Estimates of Elasticities and Values of Travel Time, Working Paper 345, Institute for Transport Studies, University of Leeds.

197
Fowkes, A. S., D. Milne, C. A. Nash and A. D. May (I 993b), The Distributional Impacts of Road Charging Scheme for London, Working Paper 400, Institute for Transport Studies, University of Leeds.
Fowkes, A. S., A. L. Bristow, P. W. Bonsall and A. D. May (1995), The Qptimisation of Integrated Urban Transport Strategies: Tests Based on Edinburgh, Working Paper 425, Institute for Transport Studies, University of Leeds.
Frey, B. (1997), Not Just for the Money: an Economic Theory of Personal Motivation, Edward Elgar Publishing, Cheltenham, UK.
Garling, T. and L. Sandberg (1997), "A commons-dilemma approach to households' intentions to change their travel behaviour", in P. Stopher and M. Lee-Gosselin (eds. ), Understanding Travel Behaviour in an Era of Change, Pergamon, UK.
Gdrling, T., R. Gillholm and A. Gdrling (1998), "Reintroducing attitude theory in travel behaviour research". Transportation, 25,129-146.
Gdrling, T., A. Gdrling, and A. Johansson (2000), "Household choices of car-use reduction measures ", Transportation Research Part A, 34(5), 309-320.
Ghali, M. O., M. J. Smith, A. D. May and D. Milne (1998), "The implications of alternative road pricing systems for transport and for the equity road", Proceedings of European Transport Conference: Seminar C, PTRC, 243-254, PTRC, UK.
Giuliano, G. (1992), "An assessment of the political acceptability of congestion pricing", Transportation, 19,335-358.
Giuliano, G. (1994), "Equity and fairness considerations of congestion pricing", Curbing Gridlock: Peak-Period Fees to Relieve Traffic Congestion, Special Report 242, Volume 2, Transportation Research Board, National Research Council, USA.
GLA (2001), The Major's Transport Strategy, Greater London Authority (GLA), UK (available from www. london. gov. uk/mayor/strategies/transport/index. htm).
Glaister, S. and D. Graham (2000), The Effect of Fuel Prices of Motorists, AA Motoring Policy Unit and the United Kingdom Petroleum Industry Association, UK.
GOL (2000), Road Charging Qptions for London: a Technical Assessment, ROCOL Report, Government Office for London, UK. (available from www. go-london. gov. uk).
Golob, T. F. and D. A. Hensher (1998), "Greenhouse gas emissions and Australian commuters' attitudes and behavior concerning abatement poll I Research D, 3(l), 1-18.
icies and personal involvement", TranMortation
Gomez-Ibanez, J. A. and K. A. Small (1994), "Road pricing for congestion management: A
survey of international practice", NCHRP SyLithesis 210, National Cooperative Highway Research Program.
Goodwin, P. B. (1989), "The rule of three: a possible solution to the political problem of competing objectives for road-user pricing", Traffic Engineering and Controls, 30(10), 495-497.
198
Goodwin, P. B. (1992), "A review of new demand elasticities with special reference to short and long run effect of price changes", Journal of Transport Economics and PolLcy, 26(2), 155-169.
Goodwin, P. B. (1997), Solving Congestion, Inaugural lecture for the professorship of transport policy University College London, 23rd October 1997 (available from http: //www. ucl. ac. uk/transport-studies/tsu/pbginau. htm).
Goodwin, P. B., S. Hallett, F. Kenny and G. Stokes (1991), Traiisport - the Nem" Realism, Transport Studies Unit, University of Oxford.
Gueller, P. (2000), Surveys, Interviews and Media Analysis - Structure, Questionnaires and Results, Deliverable 2 of the PRIMA project (available from www. certu. fr/intemat/peuro/prima/prima. htm).
Gunn, H. (2001), "Spatial and temporal transferability of relationships between travel demand, trip cost and travel time", Transportation Research Part E, 37,163-189.
Gupta, D. K., C. R. Hofstetter and T. F. Buss (1997), "Group utility in the micro motivation of collective action: the case of membership in the AARP", Journal of Economic Behavior & Organization, 32,301-320.
Hague Consulting Group (1995), ALOGIT Users' Guide: Version 3.8, Netherlands.
Halcrow Fox and Associates (1992), Road Pricing in London: Review and Specification of Demand Model Elasticities, prepared for The UK Department of Transport, UK.
Harrington, W., A. J. Krupnick and A. Alberim (2001), "Overcoming public aversion to congestion pricing", Transportation Research Part A, 35,93-111.
Harrison, B. (1986), Electronic road pricing in Hong Kong: 3. estimating and evaluating the effects, Traffic Engineering and Control, 13-18.
Harsn-ian, B., S. Pddam and B. Wijkmark (2000), Ways and Means to Increase the Acceptance of Urban Road Pricing, Deliverable 4 of the PRIMA prOJect (available from
\, \, \N,, %N,. certu. fr/intemat/peuro/prima/prima. htm).
Hau, T. D. (1992a), Economic Fundamentals of Road Pricing: a Diagrammatic Analysis, World Bank working paper WPS 1070 (available from http: //www. worldbank. orgihtml/fpd/transport/publicat/pub_tran. htm, Report No. TWU I).
Hau. T. D. (1992b), Congestion Charging Mechanisms for Roads: an Evaluation of Current Practice. World Bank working paper WPS 1071 (Available from http: /, \\, \%ý\%-. \%, oi-ldbank. org/html/fpd/transport/publicat/pub_tran. htm, Report No. TWU2).
Hau, T. D. (1998), "Congestion pricing and road investment", in K. J. Button and E. T. Verhoef (eds. ), Road Pricing, Traffic Congestion and the Environment, Edward Elgar, USA.
Hensher, D. (1994), "Stated preference analysis of travel choice: The state of practice", Transportation, 21,107-133.
Hensher. D. A. (2001 a), "The sensitivitN, of the valuation of travel time savings to the spek: ification ofunobserN, ed effected". Transportation Research Part E, 37,129-142.

199
Hensher, D. A. (2001b), "The valuation of commuter travel time savings for car drivers: evaluating alternation model specifications", Transportation, 28,101-118.
Hensher, D. A. (2001 C), "Measurement of the valuation of travel time savings", Journal of Transport Economics and PolLcy (Special issues in Honour of Michael Beesley), 35(l), 71-98.
High Level Group on Transport Infrastructure Charging (1998), Final Report on Pricing Principles, available from http: //transport-pricing. net.
Hills, P. and P. Gray (2000), "Characterisation of congestion on an urban road network subject to road-use pricing -a fundamental review", Proceedings of IATBA 2000, the 9" International Association for Travel Behaviour Conference at Gold Coast, Queensland, Australia, 2-6 July 2000.
Hirschman, I., C. McKnight, J. Pucher, R. E. Paaswell and J. Berechman (1995), "Bridge and tunnel toll elasticities in New York: some recent evidence", Transportation, 22(2), 97-113.
Holland, E. P. and P. L. Watson (1978), "Traffic restraint in Singapore", Traffic Engineering and Control, 19(l).
Holmes, T. (1990), "Self-interest, altruism, and health-risk reduction: an economic analysis of voting behavior", Land Economics, 66(2), 140-149.
Hopkinson, P. G. (1994), The Social Valuation of Road Schemes, Working Paper 363, Institute for Transport Studies, University of Leeds, UK.
Hopkinson, P. G., C. A. Nash and N. Sheehy (1992), "How much do people value the environment? ", Transportation, 19,97-115.
Hudson, J and P. Jones (1995), "The importance of the 'ethical voter': an estimate of ; altruism"', in S. Zamagni (ed. ), The Economics of Altruism, Edward Elgar Publishing Limited, UK.
Isaac, A. G. (1997), "Morality, maximization, and economic behavior", 5outhern Economic Journal, 63,559-570.
Ison, S. (1995), "Acceptance road pricing: a three step process", Proceedings of Transportation Research Forum, Chicago, 19-20 Oct 1995.
Ison, S. (2000), "Local authority and academic attitudes to urban road pricing: a UK
perspective", Transport Policy, 7(4), 269-277.
Jaensirisak, S. (1998), The Impact of Travel Demand Management on Car-use, MSc Thesis, University of Newcastle upon Tyne, Unpublished.
Jaensirisak, S. (2001), "Public valuation of road user charging: selfish and social perspective", presented at the 33dUTSG Annual Conference, Transport Studies Unit, University of Oxford, UK, 3-5 January 2001, also published in Traffic Engineering and Control, 42(7), 221-225.
Jakobsson, C., S. Fujii and T. Gdrling (2000), "Determinants of private car users' acceptance of road pricing", Transport Policy, 7,153-158.

200
Jones, P. (ed. )(1990), Developments in DyLiamic and Activily-Based Approaches to Travel Analysis, Aldershot, UK.
Jones, P. (199 1), "Gaining public support for road pricing through a package approach", Traffic Engineering and Control, 32(4), 194-196.
Jones, P. (1995), "Road pricing: the public viewpoint", in B. Johansson and L. Mattson (eds. ), Road Pricing: Theory, Einpirical Assessment and Policy, Kluwer Academic Publishers, USA.
Jones, P. (1998), "Urban road pricing: public acceptability and barriers to implementation", in K. J. Button and E. T. Verhoef (eds. ), Road Pricing, Traffic Congestion and the Environment, Edward Elgar, USA.
Jones, P. and A. Hervik (1992), "Restraining car traffic in European cities: an emerging role for road pricing", Transportation Research A, 26(2), 133-145.
Jong, G. de, L. Biggiero, P. Coppola, H. F. Gunn, R. Dohmen, 0. Tegge, A. de Palma, E. de Villemeur, H. Duchateau and S. Gayda (1999), Elasticity Handbook: Elasticities for Prototypical Contexts, Hague Consulting Group (available for www. hcg. nl/projects/trace).
Jong, G. de and H. Gunn (2001), "Recent evidence on car cost and time elasticities of travel demand in Europe", Journal of Transport Economics and Poligy, 35(2), 137-160.
Kitamura, R., S. Nakayama and T. Yamamoto (1999), "Self-reinforcing motorization: can travel management take us out of the social trap? ", Transport Policy, 6(3), 135-145.
Knight, F. H. (1924), "Some fallacies in the interpretation of social cost", Quarterly Journal of Economics, 38,582-606.
Kocur, G., T. Adeler, W. Hyman and B. Aunet (1982), Guide to Forecasting Travel Demand
with Direct Utility Assessment, Technical Report, US Department of Transportation, USA.
Larsen, 0.1. (1995), "The toll cordons in Norway: an overview", Journal of Transport Geography, 3(3), 187-197.
Lewis, N. C. (1993), Road Pricing: Theoly and Practice, Thomas Telford, UK.
LEX Service (1998), The 1998 Lex Report on Motoring: Driving for the Future, UK.
LEX Service (1999), The 1999 Lex Report on Motoring: the Authoritative Research on the Attitudes and Behaviour of Britain's Motorists, UK.
London First (1999), Transport Initiative - Road User Charging -A PrOROsal for Central
London, London First, UK.
Louviere, J. J., D. A. Hensher and J. D. Swait (2000), Stated Choice Methods: Analysis and AD12lication, Cambridge University Press, UK.
Louviere JT and D. A. Hensher (2001), "Combining sources of preference data", in Hensher
(ed. ), Travel Behaviour Research: the Leading Edg-e, Pergamon, UK.
Luk, J. (1999), "Electronic road pricing in Singapore", Road & Transport Research, 8(4), 28-40.

201
Luk, J. and S. Hepburn (1993), New Review of Australian Travel Demand Elasticities, Research Report (ARR 249), ARRB Transport Research Ltd, Australia.
Luk, J. and E. Chung (1997), Public Acceptance and Technologies for Road PrigLnz, Research Report (ARR 307), ARRB Transport Research Ltd, Australia.
Mansbridge, JT (1990), Beyond Self-Interest, University of Chicago Press, USA.
Margolis, H. (1982), Selfishness, Altruism, and Rationalily: A Theory of Social Choice, Cambridge University Press, UK.
Margolis, H. (1990), "Dual utilities and rational choice", in J. J. Mansbridge (ed), Beyond Self- Interest, University of Chicago Press, USA.
Marshall, A. (1890), Principles of Economics, MacMillan, UK.
May, A. D. (1975), "Supplement licensing: an evaluation", Traffic Engineering and Control, 16(4).
May, A. D. (1992), "Road pricing: an international perspective", Transportation, 19(4), 313-333.
May, A. D., P. G. Hopkinson, N. W. Marler and N. Sherwood (1991), Road Pricing: the Potential for Comparative Monitoring: A Report to the London Planning Adviso[y Committee, Working Paper 329, Institute for Transport Studies, University of Leeds.
May, A. D., P. W. Bonsall and P. J. Hills (1998), "The impacts of different road user charging systems", in Proceedings of the International Conference on Transportation into the Next Millennium, Nanyang Technological University, Singapore, 9-11 September 1998.
May, A. D. and D. S. Milne (2000), "Effects of alternative road pricing systems on network performance", Transportation Research Part A, 34(6), 407-430.
May, A. D., S. P. Shepherd and J. J. Bates (2000), "Supply curves for urban road networks", Journal of Transport Economics and Policy, 34(3).
McCarthy, P. and R. Tay (1993), "Economic efficiency VS traffic restraint: a note on Singapore's Area License Scheme", Journal of Urban Economics, 34,96-100.
McFadden, D. and K. Train (2000), "Mixed MNL models for discrete response", Journal of Applied Econometrics, 15(5), 447-470.
Meland, S. and J. Polak (1993), "Impact of the Trondheim toll ring on travel behaviour: some preliminary findings", Proceedings 21st PTRC Summer Annual Meeting: Seminar F. 103-115.
Menon, A. P. G. (2000), "EPR in Singapore-a perspective one year on", Traffic Engineering and Control, 41(2), 40-44.
Milne, D. (1992), Pricing Methods, Working Paper 405, Institute for Transport Studies, University of Leeds.
Milne, D., A. D. May and D. Van Vliet (1993), Modelling the Network Effects of Road User Charging: Results from a SATURN SLild University of Leeds.
ý, Working Paper 411, Institute for Transport Studies,

202
Ministry of Transport (1964), Road Pricing: The Economic and Technical Possibilities, HMSO: London.
Mueller, D. C. (1986), 6'Rational egoism versus adaptive egoism as fundamental postulate for a descriptive theory of human behavior", Public Choice, 51,3-23.
MVA (1995), The London Congestion Charging Research Programme: Principal Find*ngs The MVA Consultancy, HMSO: London.
MVA, Institute for Transport Studies University of Leeds and Transport Studies Unit University of Oxford (1987), The Value of Travel Time Savings, Policy Journals, UK.
NEDO (199 1), A Road User Charge? Londoners' View, National Economic Development Office, UK.
NERA (2002), Paying for Road Use: Technical Report, a report to the CoMMIssion for Integrated Transport (CflT), National Economic Research Associates (NERA), UK (available from www. cfit. gov. uk).
Nevin, M. and L. Abbie (1993), "What price roads? Practical issues in the introduction of road- user charges in historic cities in the UK", Transport Polic , l(l), 68-73.
Newbery, D. M. (1990), "Pricing and congestion: economic principles relevant to pricing roads", Oxford Review of Economic Pqlicy, 6,22-3 8.
Nilsson, M. and R. Kuller (2000), "Travel behaviour and environmental concern", Transportation Research Part D, 5,211-234.
O'Mahony, M., D. Geraghty and 1. Humphreys (2000), "Distance and time based road pricing trial in Dublin", Transportation, 27,269-283.
Odeck, J. and S. Brathen (1997), "On public attitudes toward implementation of toll roads - the case of Oslo toll ring", Transport Polic , 4(2), 73-83.
Oldridge, B. (1995), "Congestion metering in Cambridge City, United Kingdom", in B. Johansson and L. Mattson (eds. ), Road pricing: Theoly, Efl2pirical Assessment and Policy, Kluwer Academic Publishers, USA.
Opiola, J. (1998), "Mobility - the role of the private motor car electronic road pricing in Hong Kong", in Proceedings of the International Conference on Transportation into the Next Millennium, Nanyang Technological University, Singapore, 9-11 September 1998.
Orski, C. (1998), "Value pricing: paying a premium for congestion-free travel", Traffic Technology International, Aug/Sept 1998,37-38.
Orski, C. (2000), "Paying for the use of roads that offer a premium level of service", Innovation Briefs, 11 (3), May/June 2000.
Ortuzar, J. de D. and R. A. Garrido (199 1), "Rank, rate or choice? an evaluation of SP methods in Santiago", Proceedings 19th PTRC Summer Annual Meeting: Seminar G 301-312.
Ortuzar, J. de D. and L. G. Willumsen (1994), Modelling Transport, Jolm Wiley & Sons, Second Edition, UK.

203
Ortuzar, J. de D., D. A. Roncagliolo and U. C. Velarde (1997), "Interactions and independence mi stated preference modelling", Proceedings 24th European Transport Forum: Seminar F 143- 154, PTRC, UK.
Ourn, T. H. and W. G. Waters H (2000), "Transport demand elasticities", in D. A. Hensher and K. J. Button (eds. ), Handbook of Transport Modelling, Pergamon, UK.
Ouwersloot, H. and P. Rietveld (1996), "Stated choice experiments with repeated observations", Journal of Tranýport Economics and Policy, 30,203-212.
Palmer, I. A. and P. W. Bonsall (1997), Estimating the Impact of Time-based Road User Charges on Risk Taking by Drivers, Working Paper 493, Institute for Transport Studies, University of Leeds.
Pean-nain, D., and E. Kroes (1990), Stated Preference Techniques: a Guide to Practice, Steer Davies Gleave and Hague Group, UK.
Pharoah, T. (1993), "Breaking the habit of lifestyle: scenarios for less car use", Proceedings 21 st PTRC Summer Annual Meeting: Seminar A, UK.
Pigou, A. C. (1920), Wealth and Welfare, MacMillan, UK.
Pitkin, H. F. (198 1), "Justice: on relating private and public", Political Theo[y, 9(3), 327-352.
Preston, J. and M. Wardman (199 1), Forecasting Motorists Long Term Behaviour in the Greater Nottingham Area, Working Paper 322, Institute for Transport Studies, University of Leeds.
Raux, C., 0. Andan and C. Godinot (1998), "The simulation of behaviour in a nonexperienced future: the case of urben road pricing", in J. Ortuzar, D. Hensher and S. Jara-Diaz (eds. ), Travel Behaviour Research: Updating the State of Play, Chapter 5,67-86, Pergamon, UK.
Revelt, D. and K. Train (1998), "Mixed logit with repeated choices: households' choices of appliance efficiency level", Review of Economics and Statistics, 80(4), 647-657.
Revelt, D. and K. Train (1999), "Customer-specific taste parameters and mixed logit", working paper, Department of Economics, University of California, Berkeley (http: //elsa. berkeley. edu/-train).
Richards, M. and B. Harrison (1999), Road Pricing in Leeds, MVA, U. K.
Rietueld, P. and E. T. Verhoef (1998), "Social feasibility of policies to reduce externalities in transport", in K. J. Button and E. T. Verhoef (eds. ), Road Pricing, Traffic Congestion and the Environment, Edward Elgar, USA.
Rienstra, S. A., P. Rietveld and E. T. Verhoef (1999), "The social support for transport measures in passenger transport, a statistics analysis for the Netherlands", Transportation Research Part D, 4,181-200.
Robinson, N. (2000), The Politics of Agenda Setting: the Car and the Shaping of Public PoliM Ashgate, UK.
Rose, G. and E. Ampt (2001), "Travel blending: an Australian travel awareness initiative", Transportation Research Part D, 6(2), 95-110.

204
Ruud, P. (1996), "Approximation and simulation of the multmornial probit model: an analysis of covariance and matrix estimation", working paper, Department of Economics, University of California at Berkeley (http: //elsa. berkeley. edu/-ruud).
Swlensminde, K. (1999), "Stated choice valuation of urban traffic air pollution and noise", Transportation Research Part D, 4,13-27.
Schade, J. and B. Schlag, (2000), Acceptability of Urban Transport Pricing, VATT Research Projects 72, Helsinki.
Schlag, B. and U. Teubel (1997), "Public acceptability of transport pricing", IATSS Research 21(2), 134-142.
Schlag, B. and J. Schade (2000), "Public acceptability of traffic demand management and pricing measures in Europe", Traffic Engineering and Control, 41(8), 314-318.
Seale, K. (1993), "Attitudes of politicians in London to road pricing", Proceedings 21st PTRC Summer Annual Meeting: Seminar F, 117-128, PTRC, UK.
Sen, A. K. (1977), -Rational fool: a critIque of the behavloral foundations of economic theory", Philosophy and Public Affairs, 6,317-344.
Sheldon, R., A Scott and P. Jones (1993), "London congestion charging: exploratory social research among London residents", Proceedings 21 st PTRC Summer Annual Meeting: Seminar L 129-145.
Small, K. A. (1992), "Using the revenues from congestion pricing", Transportation, 19,359-38 1.
Small, K. A. and J. A. Gomez-Ibanez (1998), "Road pricing for congestion management: the transition from theory to policy", in K. J. Button and E. T. Verhoef (eds. ), Road Pricing. Traffic Congestion and the Environment, Edward Elgar, USA.
Smith, A. (1776a), The Wealth of the Nations, with an introduction by A. S. Skinner (1974), Penguin Book, UK.
Smith, A. (I 776b), The Theory of Moral Sentiments, edited by D. D. Rapheal and A. L. Macfie (1976), Clarendon Press, UK.
Smith, J. C. and R. S. Burton (1998), "Initial findings from the Leicester environmental road tolling scheme", paper presented at the 9" International Conference on Road Transp Information & Control, IEE, 21-23 April 1998, London.
Steg, I. and C. Vlek (1996), "Car use as a social dilemma: conditions for behaviour change in
reducing the use of motor vehicles", Proceedings 24th European Transport Forum: Seminar C PTRC, UK.
Steg, L. and G. Tertoolen (1999), "Affective motives for car use", Proceedings of European
Transp Drt Confe -ence: Seminar B, 13 -27, PTRC, UK.
Stokes, G. (1996), "Getting car commuters onto public transport -a Survey in Merseyside",
Proceedings 24 1 EurDpeai Transport Forum: Seminar F, PTRC, UK.

205
Stokes, G. and B. Taylor (1995), "The public acceptability of sustainable transport policies: finding from the British Social Attitudes survey", Proceedings 23rd European Transport Forum: Seminar C, 69-83, PTRC, UK.
Stradling, S. G., M. L. Meadows and S. Beatty (2000), "Helping drivers out of their cars: integrating transport policy and social psychology for sustainable change", Traneort Policy, 7(l), 207-215.
Swanson, J. (1998), "Factors affecting the validity of stated preference", Proceedings o European Transport Conference: Seminar D, Volume 1,1- 16, PTRC, UK.
Taylor, B. and L. Brook (1998), "Public attitudes to transport issues: finding from the british social attitudes surveys", in D. Banister (ed. ), Transport Policy and the Environment, E&FN SPON, UK.
Tertoolen, G., D. V. Kreveld and B. Verstraten (1998), "Psychological resistance against attempts to reduce private car use", Transportation Research A, 32(3), 171-181.
Thompson, A. (1990), "Road user charging: the current state of technology", Traffic Engineering and Control, 31 (10).
Thorpe, N. and P. J. Hill (1992), "Public Attitudes to Road-Use Pricing: A report of a Norwegian Case-Study", TORG Research Report No. 82, University of Newcastle upon Tyne.
Thorpe, N. and S. Jaensirisak (1998), "Public acceptance of travel demand management measures", paper presented at the International Symposium on Travel Demand Management, 8- 10 July 1998, University of Newcastle upon Tyne, U. K.
Thrope, N., P. Hills and S. Jaensirisak (2000), "Public attitudes to TDM measures: a comparative study", Transl2ort Polic , 7(4), 243-257.
Train, K. E. (1986), Qualitative Choice Analysis: Thegy, Econometrics, and Application to Automobile Demand, MIT Press, USA.
Train, K. E. (1998), "Recreation demand models with taste differences over people", Land Economics, 74(2), 230-239.
Train, K. E. (1999), "Halton sequences for mixed logit", working paper, Department of Economics, University of California, Berkeley (http: //elsa-berkeley. edu/-train).
Train, K. E. (2002), Discrete Choice Methods with Simulation, Cambridge University Press, UK.
Transportation Research Broad (1994), Curbing Gridlock: Peak-Period Fees to Relieve Traffic Conggstion, Special Report 242, Volume 1, National Research Council, USA.
TRRL (1980), The Demand for Public TranWort, Transport and Road Research Laboratory (TRRL), UK.
Tudela, A. (2000), "Simulation as a necessary step In the design of stated preference experiments", Proc pedi as of European Transport Conference: Seminar F, 81-9 1, PTRC, UK.

206
Van der Loop, J. T. A. and I. H. Veling (1994), "Developments in the acceptance of the transport structure plan by the Dutch population and how to increase the acceptance of measures? ", Proceedings 22nd PTRC Summer Annual Meeting: Seminar D, 125-134.
Van Vugt, M. 0 996), Social Dilemmas and Transportation Decisions, University of Southampton, UK.
Van Vugt, M., R. M. Meertens and P. A. M. van Lange (1995), "Car versus public transportation? The role of social value orientations in a real-life social dilemma", Journal of Applied Social Psychology, 25,258-278.
Van Vugt, M., P. A. M. van Lange and R. M. Meertens (1996a), "Commuting by car or public transportation? A social dilemma analysis of travel mode judgements", European Journal of Social Psychology, 26,373-395.
Van Vugt, M., P. A. M. van Lange, R. M. Meertens and J. A. Joireman (I 996b), "How a structural solution to a real-world social dilemma failed: a field experiment on the first carpool lane in Europe", Social Psychology Quarterly, 4,364-374.
Verhoef, E. T. (1996), The Economics of Regulating Road Transport, Edward Elgar, Cheltenham.
Verhoef, E. (1999), "Time, speeds, flows and densities in static models of road traffic congestion and congestion pricing", Regional Science and Urban Economics, 29(3), 341-369.
VickTey, W. (1955), "Some implications of marginal cost pricing for public utilities", American Economic Review, 45,605-620.
Vickrey, W. (1963), "Pricing and resource allocation in transportation and public utilities", American Economic Review, 53(2), 452465.
VickTey, W. (1969), "Congestion theory and transport investment", American Economic Review, 59(2), 251-260.
Walters, A. (1954), "Track costs and motor taxation", Journal of Industrial Economics, 2(2), 135-146.
Walters, A. (1961), "The theory and measurement of private and social cost of highway
congestion", Econometrica, 29(4), 676-699.
Walters, A. (1987), "Congestion", in J. Eatwell, M. Milgate and P. Newman (eds. ), The New Palgrave: a Dictionaly of Economics, Macmillan Press, London.
Wardman, A (1987), An Evaluation of the Use of Stated Preference and Transfer Price Data in Forecasting the Demand for Travel, PhD Thesis, Institute for Transport Studies, University of Leeds, Unpublished.
Wardman, A (1991), "Stated preference methods and travel demand forecasting: an
examination of scale factor problem", Transportation Research, 25A, 79-89.
Wardman, M. (1998), "The value of travel time: a review of British evidence", Journal of TranspDrt Economics and Policy, 32(3), 285-316.

207
Wardman, M. (2001a), "A review of British evidence on time and service quality valuations", TranVortation Research Part E, 37,107-128.
Wardman, M. (2001b), Public Transport Values of Time, Working Paper 564, Institute for Transport Studies, University of Leeds.
Wardman, M., A. Bristow and F. Hodgson (1997), "Valuations of noise, air quality and accessibility: evidence for households and business", Proceedings 25th European Transport Forum: Seminar C, 451-463, PTRC, UK.
Wardman, M., P. W. Bonsall and J. D. Shires (1998), "Driver response to variable message signs: stated preference investigation", Transportation Research Part C, 5(6), 389405.
Whittles, M. J. (1999), Urban Road Pricing: the Public and Political Acceptability, PhD Thesis, Institute for Transport Studies, University of Leeds, Unpublished.
Widlert, S. (1998) "Stated preference studies: the design affects the results", in J. Ortuzar, D. Hensher and S. Jara-Diaz (eds. ), Travel Behaviour Research: Updating the State of Play, Chapter 7, pp. 105 -12 1, Pergamon, UK.
Willoughby, C. (2001), "Singapore's motorization policies 1969-2000", TranMort Policy, 8, 125-139.
Wilson, P. W. (1988), "Welfare effects of congestion pricing in Singapore", TranVortation, 15(3), 191-210.
Zamagni, S. (ed. )(I 995), The Economics of Altruism, Edward Elgar Publishing Limited, UK.

208
Appendix A
An Example of the SP Questionnaires

0 (). 4 209
'
Ir 5
Institutefor Transport Studies University of LeedsO*
Survey of Transport Problems and Solutions
This is an opportunity to put your views forward about transport problems and solutions in Leeds, whatever transport you use. Please answer the following questions and return the questionnaire in the freepost envelope provided. If you have any queries please contact me, Sittha Jaensirisak, (0113) 233-6613, e-mail: sj*aensir@its. leeds. ac. uk.
* I! Rrt 1: In your opinion,
how serious a problem is traffic congestion in Leeds?
[71 No problem CD Slight [71 Serious [7] Very Serious
how serious a problem is traffic pollution (air and noise) in Leeds'?
[71 No problem o Slight 7 Serious [7) Very Serious
Do you think charging a fee for using a car would be effective in reducing congestion'. ) r7Yes r7 No
Do you think charging a fee for using a car would be effective in reducing traffic pollution'., [7] Yes 7 No
How do you normally travel for non-work journeys (mode most frequently used)?
[71 Car 0 Bus D Rail 0 Walking M Cycling D Other (please specify)
Ifyou currently do not work, please go to Part 2 Section 2 on the next page
If you currently work, please continue
How do you normally travel to work (mode most frequently used)?
(7) Car [71 Bus El Rail [71 Walking M Cycling
0 How many days a week do you noniially travel to work in this way?
Please estimate your travel time and cost of your daily return 0ournev to work
0 Ho\\ long do \ OU normally take to tra\ el to and from work each daO
How many n-ules do you travel to and from work per day?
Ho%N much do youi- Nvoi-k journeys cost per day?
For car Journeys, how much of the total daily cost is parking'? t
Other (please specifv)
days a week
hours_ rrunutes
rrules
p
p

"5 14
re 12
00
u
kw (U
00
. um
cn
0.4
Z
;Z
Z
Z
210
"0
ýc 9
75
0
"Ci
z
"e u zi
=e
"C ý :: i -1
&IN 0
'4) il cn i :31 :3
CL
; oi :2
1.2
lI'l 1!
.Q !ý1
&W 4)
J: O
"Ci r-
ce Q) 0u
0 4) ro 0
, Z, "0
-0 u :Jm
0
u cu
0
rI
E
(I) I-
o
Q ID
. JD IZ
CD u
"Ci
ýQ
"0
ce :i -0 U
4-4 .0 0
rA
ce cu
cs
ell tu ti
"0
"Ci u tz. CL 0
0
0 0 E
10
"0
ýo
"0
-0 u
15 10
0
Q cn
r.
.Z
"Ci
"0 u e 110
0
(I
E
0 I-
00
V
n i- I,
o.
4_ c. .- . -
0
I-
0
0 . -
. -
.I".
C
;4 ýi u .0
4
10 m 0
b. 2"
5 ýo 0
>
:J 44 ;e
42
"Ci
9
i *. 0 Gn
>
>
>
Z ,0
1
10
Z) ý,
5
.0
W
+. j :i el 40
10 ce
M"o
Z0 $ý I--
40 u
.4 .4 4)
"a .0
"0 0
0 ý:
cu 4)
.. a >
=a
CIO r-
t4 sg "a
.EE
CIO

211
(A
0
03
of
-0
0 U
Cq* u
C'- .
. oi 1 Z:
.M
Ici
io-
.
-Z
r.
+
I
--Z
ýt
-Z
;: 2
kn kr) V) kr) ++++
+++
++ -4-
C) C) C) C)
CN r'l C-4
-0 1! Iý111
kf) +
-0
+++
+ +i ++
clý CN C14 C14 +++
++++ ;m
C> C)
Cý4 C-4 C-4
- cn i Clf) ! cn ! rf)
Z
,g . 14
k« "
(X _c im m
-0 Q) tu
%. 0 im.
CI .i E
'7d
CA trl (I ý tý6
IIC.,
7= 7=
El D 11 11
m cl m m Q)
u
03
D D 11 11
u U u
-< M ý., =
64
cla
t, . Cd
Z: 7
0000
D D El El
0 .1

212
Part, 4: Please give the following details about yourself
Gender: [I Female [71 Male
Age: 0 under 24 M 25 to 34 0 35 to 44 (73 45 to 54 0 55 or over
Total household annual income (before deduction of tax and National Insurance):
[71 Less than E 10,000 per annum ED f 10,000 to f 19,999 per annum
(: ] E20,000 to E29,999 per annum [7 f 30,000 to f 39,999 per annum
[71 E40,000 to E49,999 per annum [71 f 50,000 to C59,999 per annurn
[I E60,000 or more per annum 71 do not wish to answer
Number of cars in your household:
7 No car [71 1 car [7 2 cars El 3 or more cars
If you have any comments, please write them in them space below
Thank you very much for your help Please return the questionnaire in the freepost envelope provided

213
Appendix B
Maps of Leeds and London Provided to Respondents

214
'2 &

215
C14
4 CN <
c1li
fc I 1,, ýVj
ýM 1ý IW( Z- - 0, -- = Z: (1) 000 LLJ (43
Clq %
h- z :0c
41 >ý cc C% ; -, :L
CA cC
E. c ! C: ca. CN o LO
02= C) co E cc: LL. cz r77 m
CCU I :::
a Li C) 0
0
m f- Pý a)
%- . cm ýý . 2: ' t. 0 %. -
cz -C -mx -0
<, Z3 : =, CV C14 C14 a) (u
<a0. ýý 2 c co < -C "I co CL >. :3 13 0
0 P., ý0m
C14
Ca . 21
co E co Cl) cu -C C1.4
CN o V- CL) c: o lul E <00 Em .-- L- fil "D L- CN ce Is
0 4- 0 cn
-C a 'A
m rN
.. I--, \
e-. ) E rq E Li
co -\ Cýl (D J 10 c
1ýa cn CA 0 co (D 0 C114
-E It =. a " .. M ýR 6zu < C;
42) 1ý1. - Cl)
m E Ln 0 01 CLOLV 0 V, ,u 'n C) v- OPV= u< a) C: czý ui
ýP_ -ý2 CýL vo cc ýý cc w I- m _I_- L)
LO z9
4- m Do
.
ý:.
.; 113 z
L) zL z1v C
002E3 0 Lo C: V) p, 23 c
0 a) 0ýý ý0 Cýý z
fn -r V) ?; r "0
ý 4ý 4E c-4 rN CD (n CL m< I. - rMc A1000 EV0 -C c Ln %I- J. cu. - 10 ; h- a: (Z) L- L- .I
Z ý: M
4-d
(D o -6
-- ,fM. U. (n
0 Q) c
V) ? C) -M M ;E- -2 ., r < 16- c 0m
0o
0 0
cn C 0 00m0 cW0z
cw- (L) 1 --ýT V5 "D (D 0 rl)
m el r4)
lr, ý, (o
p 7E -d -0
-Z: <I
cc 1? 1 ýA
cl
Lin W, E ý9,0 ý2 (1) :c
ý7
0
LA- z U, ) c-, (N
216
Appendix C
List of Papers Presented in Conferences
Jaensirisak, S. (2001 a), "Public valuation of road user charging: selfish and social perspective", presented at the 33" UTSG Annual Conference, 3-5 January 2001, Transport Studies Unit, University of Oxford, UK.
Jaensirisak, S. (2001b), "Public valuation of road user charging: selfish and social perspectivell, Traffic Engineering and Control, 42(7), 221-225.
Jaensirisak, S. (2002), "Public acceptability of road user charging schemes based on voting behaviour model", paper presented at the 34h UTSG Annual Conference, 3-5 January 2002, Transport Research Institute, Napier University, Edinburgh, UK.
Jaensirisak, S., A. D. May and M. Wardman (2001a), "Acceptability of road user charging: sensitivity to system characteristics and individuals' perspectives", paper presented at the THINK-UP Workshop Series, on 'Policy Factors and Mobility Prediction: Transport Planning & Modelling', 21-22 May 2001, ICCR, Vienna, Austria.
Jaensirisak, S., A. D. May and M. Wardman (2001b), "Effects of road pricing systems on acceptability", paper presented at the EASTSTI Conference, 24-27 October 2001, Hanoi, Vietnam.
Jaensirisak, S., A. D. May and M. Wardman (2002a), "Acceptability of road user charging influenced by system characteristics and individuals' perspectives", paper prepared to present at the MC ICAM Conference on 'Acceptabilily of Transport Pricing Strategies', 23-24 May 2002, Dresden, Germany.
Jaensirisak, S., A. D. May and M. Wardman (2002b), "Designing acceptable and effective road user charging schemes", Traffic Engineering and Control, July 2002 (forthcoming).
Jaensirisak, S., A. D. May and M. Wardman (2002c), "Acceptability and effectiveness of road user charging", paper prepared to present at the European Transport Conference, 9-11 September 2002, PTRC, Cambridge, UK.
Jaensirisak, S., A. D. May and M. Wardman (2002d), "Designing acceptable and effective road user charging schemes", paper prepared to present at the international conference on 'Seamless & Sustainable Transpo ', 25-27 November 2002, Singapore.
Copyright © 2022 FDOKUMEN