Fast-Charging Technologies, Topologies and Standards
94
E.ON Energy Research Center Series Fast-Charging Technologies, Topologies and Standards Sven Kalker, Benedict Mortimer, Bettina Schäfer, Ilka Schoeneberger, Marco Stieneker, Wilbert Rey Tarnate, Stefanie Wolff, Rik W. De Doncker, Reinhard Madlener, Antonello Monti, Dirk Uwe Sauer Volume 10, Issue 1
-
Upload
khangminh22 -
Category
Documents
-
view
0 -
download
0
Transcript of Fast-Charging Technologies, Topologies and Standards
E.ON Energy Research Center Series
Fast-Charging Technologies, Topologies and Standards
Sven Kalker, Benedict Mortimer, Bettina Schäfer, Ilka Schoeneberger, Marco Stieneker, Wilbert Rey Tarnate, Stefanie Wolff, Rik W. De Doncker, Reinhard Madlener, Antonello Monti, Dirk Uwe Sauer
Volume 10, Issue 1

Fast-Charging Technologies, Topologies and Standards
Sven Kalker, Benedict Mortimer, Bettina Schäfer, Ilka Schoeneberger, Marco Stieneker, Wilbert Rey Tarnate, Stefanie Wolff, Rik W. De Doncker, Reinhard Madlener, Antonello Monti, Dirk Uwe Sauer
Volume 10, Issue 1

Contents
1 Executive Summary 1
2 Introduction 3
3 Economic, Policy and Market Regulation Aspects 53.1 Introduction . . . . . . . . . . . . . . . . . . . . . . . . . . . . . . . . . . . . 53.2 State of the Art of EVs and Charging Infrastructure in Germany . . . . . . . 63.3 Legislative and Regulatory Framework of Fast-Charging Infrastructure in
Germany . . . . . . . . . . . . . . . . . . . . . . . . . . . . . . . . . . . . . . 153.4 Sociopolitical Situation . . . . . . . . . . . . . . . . . . . . . . . . . . . . . . 213.5 Stakeholder Analysis . . . . . . . . . . . . . . . . . . . . . . . . . . . . . . . 233.6 Business Models . . . . . . . . . . . . . . . . . . . . . . . . . . . . . . . . . . 28
4 Fast-Charging Technologies 304.1 Fast-Charging Stations (DC) Connected to the AC Grid . . . . . . . . . . . 31
4.1.1 AC-DC Converter . . . . . . . . . . . . . . . . . . . . . . . . . . . . . 314.1.2 DC-DC Converter . . . . . . . . . . . . . . . . . . . . . . . . . . . . . 344.1.3 Wide-bandgap Semiconductors . . . . . . . . . . . . . . . . . . . . . 364.1.4 Galvanic Isolation . . . . . . . . . . . . . . . . . . . . . . . . . . . . . 36
4.2 Wired Charging . . . . . . . . . . . . . . . . . . . . . . . . . . . . . . . . . . 374.2.1 Onboard Charging . . . . . . . . . . . . . . . . . . . . . . . . . . . . 384.2.2 Offboard Charging . . . . . . . . . . . . . . . . . . . . . . . . . . . . 40
4.3 Wireless Charging . . . . . . . . . . . . . . . . . . . . . . . . . . . . . . . . . 434.3.1 Stationary Charging . . . . . . . . . . . . . . . . . . . . . . . . . . . 444.3.2 Road-Embedded Charging . . . . . . . . . . . . . . . . . . . . . . . . 44
5 Battery Technology 455.1 EV Charging Characteristics . . . . . . . . . . . . . . . . . . . . . . . . . . . 465.2 Power Oriented Design . . . . . . . . . . . . . . . . . . . . . . . . . . . . . . 505.3 Thermal Management Challenges and Risk of Accelerated Aging . . . . . . . 545.4 Stationary storage systems for grid support at fast-charging spots . . . . . . 58
6 Grid Integration of Future Fast-Charging Infrastructure 606.1 Background . . . . . . . . . . . . . . . . . . . . . . . . . . . . . . . . . . . . 606.2 Grid Impacts of Fast-Charging . . . . . . . . . . . . . . . . . . . . . . . . . . 60
6.2.1 Reduced Power Quality . . . . . . . . . . . . . . . . . . . . . . . . . . 616.2.2 Voltage Drops . . . . . . . . . . . . . . . . . . . . . . . . . . . . . . . 626.2.3 Loading Issues . . . . . . . . . . . . . . . . . . . . . . . . . . . . . . . 62
i
Contents ii
6.3 Solutions and Opportunities in Fast-Charging . . . . . . . . . . . . . . . . . 626.3.1 Load Management . . . . . . . . . . . . . . . . . . . . . . . . . . . . 636.3.2 Actors and Interfaces . . . . . . . . . . . . . . . . . . . . . . . . . . . 64
6.4 Supporting Smart-Grid Functions . . . . . . . . . . . . . . . . . . . . . . . . 666.4.1 Forecasting the Demand for Fast-Charging . . . . . . . . . . . . . . . 666.4.2 Ancillary Services by Fast-Charging Stations . . . . . . . . . . . . . . 676.4.3 Stationary Storage Systems for Grid Support at Fast-charging Spots . 676.4.4 Data-Driven Services . . . . . . . . . . . . . . . . . . . . . . . . . . . 68
6.5 DC-Grid Integration of Fast-Charging Stations . . . . . . . . . . . . . . . . . 706.5.1 DC-Grid Connection . . . . . . . . . . . . . . . . . . . . . . . . . . . 706.5.2 DC-Grid Integration . . . . . . . . . . . . . . . . . . . . . . . . . . . 70
7 Conclusion 73
8 Future Research Directions 75
1 Executive Summary
The project "Fast-Charging Technologies, Topologies and Standards", which is kindly sup-ported by the E.ON ERC gGmbH, has four main foci: First, the economic policy andmarket regulations of fast-charging applications are addressed. Fast-charging is definedand discussed along four dimensions: regulation, location, charging time and duration, andbattery size. The present and near-future dynamics of the diffusion of innovation regardingthe electrification in the German automotive market are investigated for EV models, EVbattery sizes, and the co-evolving EV charging infrastructure. Socio-political aspects arescrutinized by a stakeholder analysis, the results of which provides important insights forfast-charging business models. Overall, we conclude that there is still a lot of uncertainty, forexample regarding the diffusion dynamics and market shares of the various battery models,but also the willingness to pay for fast-charging services and the preferred payments schemesof potential customer groups in the evolving mass market.Second, a state-of-the-art review of fast-charging technologies and current research activitiesis presented. The focus is on power-electronic conversion technologies, which is the keytechnology for fast-charging applications. Beginning with the generalized charging system,all kinds of possible fast-charging manifestations, such as wired onboard and offbard chargers,as well as wireless stationary and road-embedded charging systems, are discussed. Further,the potential DC-based integration of renewable energy sources and battery storage systemsis investigated. Different white spots at the component level as well as the system levelare identified. New materials could lead to higher efficiency, lower volume, and in the endcheaper components. DC grid structures can help to integrate multiple fast-charging stationsinto the energy system.Since the EV batteries also play a mayor role in fast-charging applications they will beaddressed in a third focus area. State of the art lithium battery cells for EVs are, in general,suitable for fast-charging. It depends on the cell technology, cell shape and the pack designwhether high thermal impact result from fast-charging or not. The battery cooling system isone major design aspect to avoid high temperatures at the cell surface. The battery packdesign is different for each car manufacturer and as well is the cooling strategy. The powerrate that can be applied on battery pack level depends on the installed capacity and thepack voltage. To estimate the load on cell level it is essential to know the cell nominalcapacity and the battery pack topology, because this gives insight about the current levelwhich is applied to each individual cell. The question about battery aging that is related tofast-charging, it is important to look into detail into the use profiles, especially the batterytemperatures and the cell current rates.The last focus area is the grid integration of fast-charging stations. Emerging problems arepresented, as well as future grid integration possibilities using a DC underlay infrastructure.The uncoordinated operation of fast-charging infrastructures will create voltage-drop and
1

1 Executive Summary 2
loading problems in the grid. In this regard, E-mobility and power system actors need controlsystems that will influence or control the power demand of fast-charging stations. Thesecontrol systems will allow fast-charging stations to utilize their energy storage systems inmanaging the grid voltage and maintaining the balance of supply and demand. The controlsystems will also enhance grid flexibility and align the operation of fast-charging stationswith the integration of renewable energy systems. Further studies are recommended, to havesuch control systems in place. These studies will explore the use of energy storage systemsinside the stations, improvements in demand forecasting, data-driven services, and use ofDC grids.
2 Introduction
Due to depleting fossil fuel reserves, the environmental impact of combustion engine vehicles(ICEV) such as noise and fine-dust pollution as well as CO2 emissions, the demand forelectric vehicles (EVs) increases steadily. The market share of EVs in Germany in 2016 was0.8 % (in total 34,000 EVs) and is today doubled to 1.6 % (54,500 EVs) [60] [6]. In early2017, the German government announced that the aim to have 1 million EVs by 2020 isnot realistic anymore, the government declared in 2018 that it will nonetheless still stickto this target. Furthermore, by 2030 6 million EVs are expected to drive on German roadsaccording to this vision. However, the market share of EVs is still marginal.Market entry barriers prevent a rapid ramp-up of EVs. Besides high investment costs, oneimportant barrier is the phenomenon of range anxiety – the fear of driving one’s EV forlonger distances without being able to recharge it [45]. A reason for this current state are thecomparatively short achievable driving distances of EVs and a missing extensive recharginginfrastructure. Therefore, a powerful and comprehensive charging network that also includesfast-charging is crucial for the rapid diffusion of EVs in Europe. The process of fully chargingEV batteries in a very short time period is called fast-charging.The increasing number of EVs put high requirements on the electrical infrastructure. If weconsider a worst case consumption of 25 kWh/100 km per EV with an average mileage of12.000 km per year and one million EVs by 2020 in total, the additional amount of electricalenergy needed can roughly be calculated to 3 TWh. This is about 0.6 % of the Germanelectrical energy consumption of 2015 (5525 TWh). This simple calculation example makesclear that the additional amount of energy plays only a minor role. However, the additionalenergy has to be generated using renewable energy sources in order to fully unfold theecological and economic advantages of EVs. Instead of energy, the challenge is the provisionof high (peak) power in terms of charging infrastructure. For example, the minimum powerto charge a 40 kWh EV in 15 min to 80 % State of Charge (SOC) without considering lossescan be calculated as:
Pmin = CBat · SOCtcharge,max
= 40 kWh · 0.815 min = 132 kW. (2.1)
In the following, fast-charging points are defined from a technical and socio-economicperspective on four aspects. These aspects will be picked up by the different workingpackages later on. Firstly, according to the relevant norms, standards and directives [27], [48],[8], [38], every DC or AC charging station with a charging power of at least 22 kW is consideredas a fast-charging station. Secondly, the location of charging points – private, public orsemi-public – predetermines the dominating charging technology and hence the preferredrecharging time with respect to consumer needs and wants. Furthermore, the question onhow fast-charging stations can provide ancillary services, through load management and the
3
2 Introduction 4
use of energy storage systems, will be addressed.At private households, the charging power is usually limited due to the restricted capabilitiesof the low voltage grids. Depending on the number and density of fast-charging points atpublic or semi-public places, the (peak) power can easily reach several Megawatts. This willstress the low and medium-voltage grids and can further lead to an overload of cables andtransformers. In order to prevent this, measures have to be taken by means of intelligentcharging stations. A battery storage system can be integrated for peak-shaving operationand ancillary grid services can be offered by the charging station.Thirdly, the battery size also predetermines the time it takes to recharge an EV fully. Thus,according to this aspect, it depends on the specific battery installed in the EV and theavailable charging power at the station. We will discuss battery size by taking the averagebattery size of the German EV market leader into account.The battery size is closely related to the fourth and last aspect: From a consumer perspective,the predominant decision-relevant aspects are the time and costs it takes to recharge.
3 Economic, Policy and Market RegulationAspects
3.1 Introduction
This section provides an overview of major questions to be tackled in the context of fast-charging infrastructure: including socio-economic, regulatory, policy, and technical issues. Inin section 1, we introduce fast-charging points from a socio-economic perspective along fourdimensions:Firstly, we define fast-charging points according to EU Directive 2014/94/EU [38], whichstipulates that a high power recharging point allows for a transfer of electricity to an elec-tric vehicle at > 22 kW. The German e-vehicle charging infrastructure funding directive(Förderrichtlinie Ladeinfrastruktur für Elektrofahrzeuge in Deutschland [9]) as well as thecharging station legislation and its amendment (Ladesäulenverordnung, LSV [12, 14, 16]) setthe corresponding standards at the German national level.Secondly, the location of charging points – private, public or semi-public – predeterminesthe dominating charging technology and hence the recharging time with respect to consumerneeds and wants. On the one hand, a typical family is usually not in need of recharging theirEV within 10 minutes but might nevertheless still want to be able to do it. On the otherhand, a public charging point along the motorway should offer a short recharging time andavoid long waiting times. Furthermore, we are going to tackle the question at which of theselocations vehicle-to-grid (V2G) services can be most useful and economically viable.Thirdly, the battery size also predetermines the time it takes to recharge an EV. Thus,according to this dimension, the recharging time cannot be set in general, but also dependson the specific battery installed in the EV, i.e. the EV topology. Here, a consumer-friendlymeasure is to indicate the recharging time in km/min.Fourthly, the battery size is closely related to the following dimension: From a consumerperspective, the predominant decision-relevant aspects are the time and costs it takes torecharge. In addition to the dominant decision variables, we also look at comfort withregard to alternative charging typologies (conductive, inductive, and robot charging) andthe willingness to pay for these options.In the following, we elaborate these four dimensions in detail since they pave the ground fora stakeholder analysis aimed at pointing out risks, expectations, fears and the respectivestrategies of important actors (Table 2). Cooperation of actors and agreeing on standards is aprerequisite for a successful transformation of the transportation sector towards sustainability.Hence, the government and regulators play a crucial role in setting the required standards atthe right point in time. Setting them too early could prevent finding an appropriate technicalsolution, and a push of immature technology might cause lock-ins to inferior technology.
5
3 Economic, Policy and Market Regulation Aspects 6
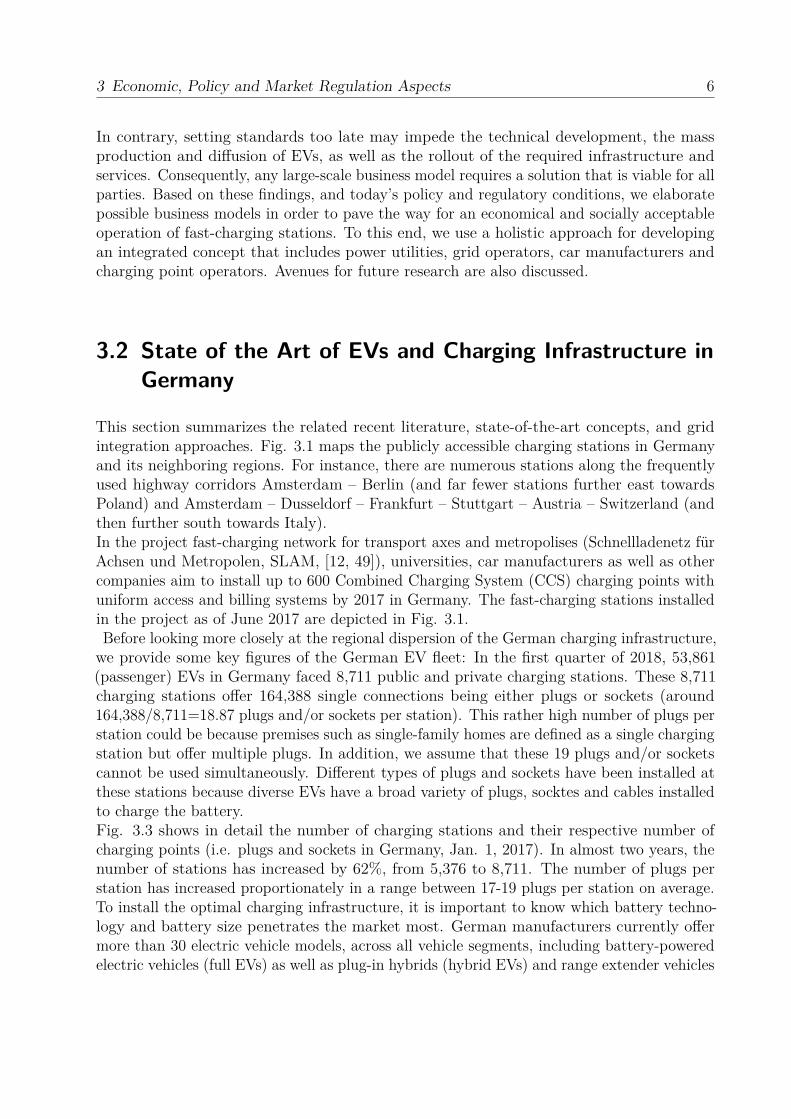
In contrary, setting standards too late may impede the technical development, the massproduction and diffusion of EVs, as well as the rollout of the required infrastructure andservices. Consequently, any large-scale business model requires a solution that is viable for allparties. Based on these findings, and today’s policy and regulatory conditions, we elaboratepossible business models in order to pave the way for an economical and socially acceptableoperation of fast-charging stations. To this end, we use a holistic approach for developingan integrated concept that includes power utilities, grid operators, car manufacturers andcharging point operators. Avenues for future research are also discussed.
3.2 State of the Art of EVs and Charging Infrastructure inGermany
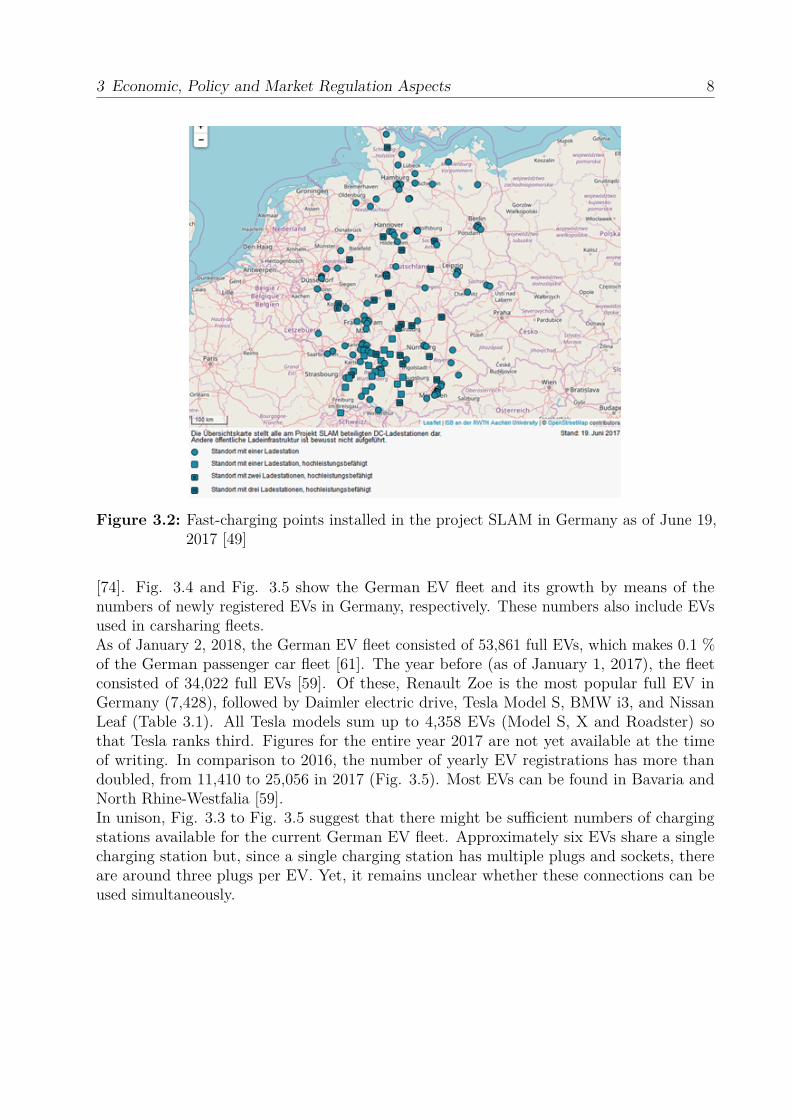
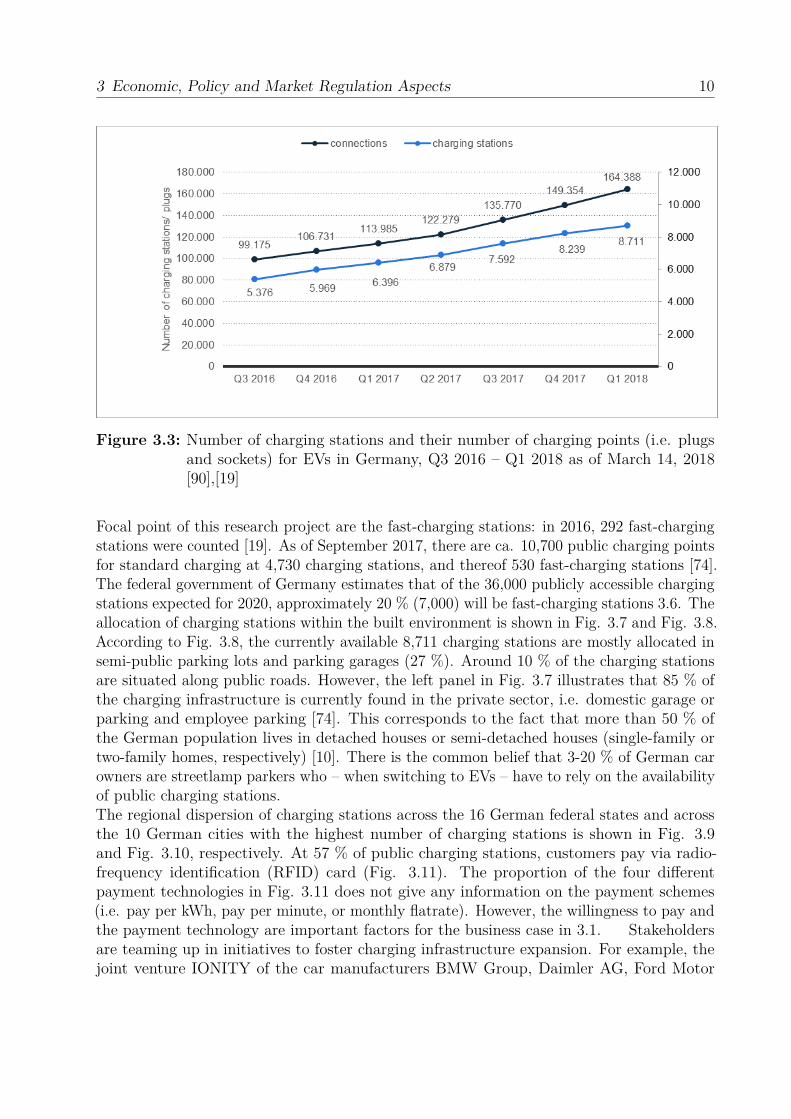
This section summarizes the related recent literature, state-of-the-art concepts, and gridintegration approaches. Fig. 3.1 maps the publicly accessible charging stations in Germanyand its neighboring regions. For instance, there are numerous stations along the frequentlyused highway corridors Amsterdam – Berlin (and far fewer stations further east towardsPoland) and Amsterdam – Dusseldorf – Frankfurt – Stuttgart – Austria – Switzerland (andthen further south towards Italy).In the project fast-charging network for transport axes and metropolises (Schnellladenetz fürAchsen und Metropolen, SLAM, [12, 49]), universities, car manufacturers as well as othercompanies aim to install up to 600 Combined Charging System (CCS) charging points withuniform access and billing systems by 2017 in Germany. The fast-charging stations installedin the project as of June 2017 are depicted in Fig. 3.1.Before looking more closely at the regional dispersion of the German charging infrastructure,we provide some key figures of the German EV fleet: In the first quarter of 2018, 53,861(passenger) EVs in Germany faced 8,711 public and private charging stations. These 8,711charging stations offer 164,388 single connections being either plugs or sockets (around164,388/8,711=18.87 plugs and/or sockets per station). This rather high number of plugs perstation could be because premises such as single-family homes are defined as a single chargingstation but offer multiple plugs. In addition, we assume that these 19 plugs and/or socketscannot be used simultaneously. Different types of plugs and sockets have been installed atthese stations because diverse EVs have a broad variety of plugs, socktes and cables installedto charge the battery.Fig. 3.3 shows in detail the number of charging stations and their respective number ofcharging points (i.e. plugs and sockets in Germany, Jan. 1, 2017). In almost two years, thenumber of stations has increased by 62%, from 5,376 to 8,711. The number of plugs perstation has increased proportionately in a range between 17-19 plugs per station on average.To install the optimal charging infrastructure, it is important to know which battery techno-logy and battery size penetrates the market most. German manufacturers currently offermore than 30 electric vehicle models, across all vehicle segments, including battery-poweredelectric vehicles (full EVs) as well as plug-in hybrids (hybrid EVs) and range extender vehicles

3 Economic, Policy and Market Regulation Aspects 7
Figure 3.1: Public charging points in Germany as of March 2018 [19]
3 Economic, Policy and Market Regulation Aspects 8
Figure 3.2: Fast-charging points installed in the project SLAM in Germany as of June 19,2017 [49]
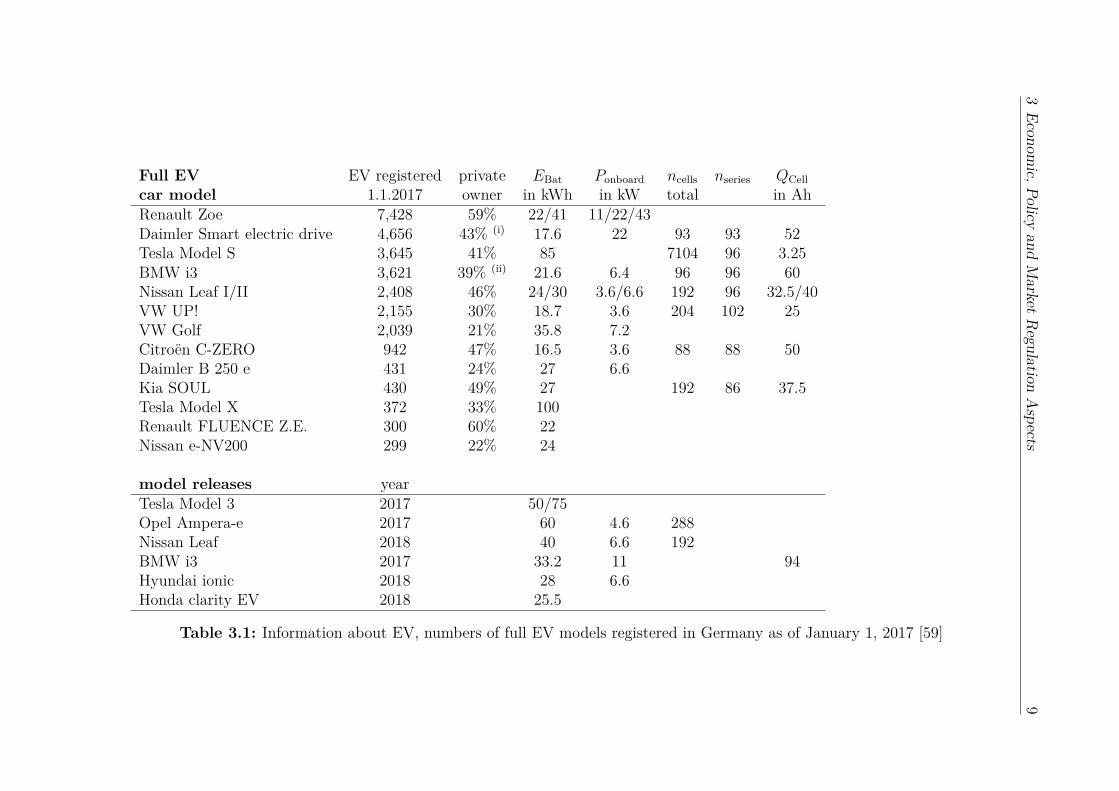
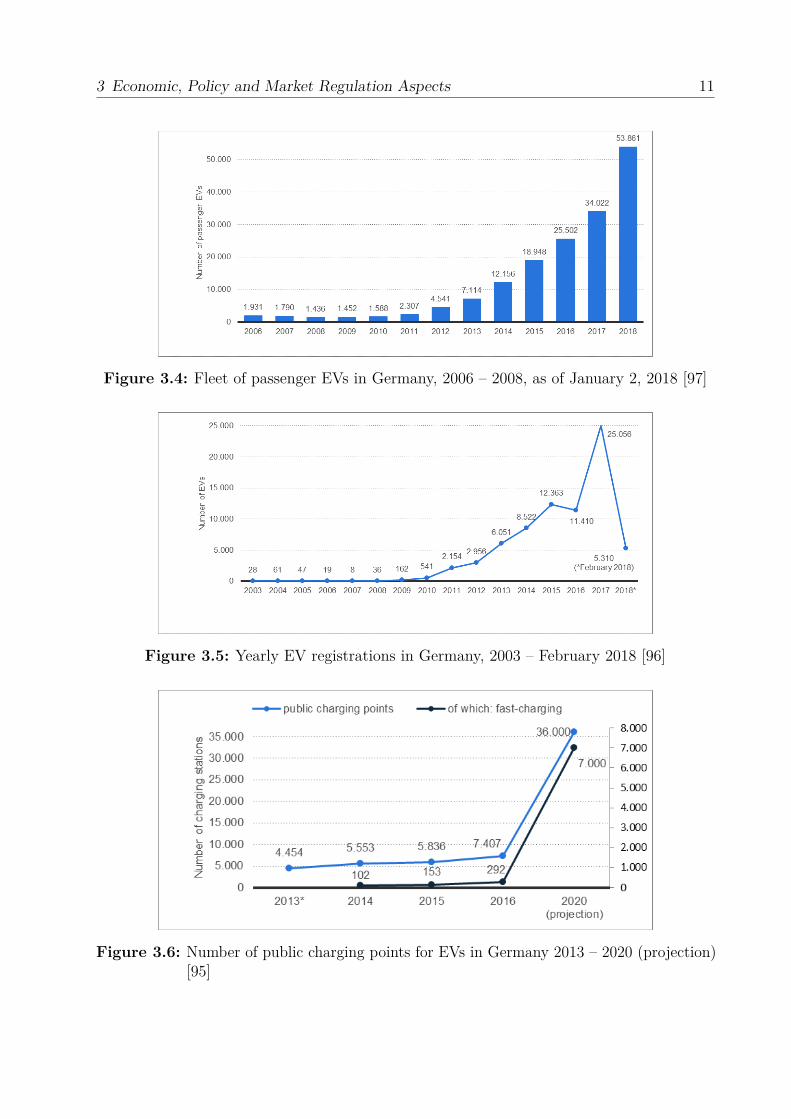
[74]. Fig. 3.4 and Fig. 3.5 show the German EV fleet and its growth by means of thenumbers of newly registered EVs in Germany, respectively. These numbers also include EVsused in carsharing fleets.As of January 2, 2018, the German EV fleet consisted of 53,861 full EVs, which makes 0.1 %of the German passenger car fleet [61]. The year before (as of January 1, 2017), the fleetconsisted of 34,022 full EVs [59]. Of these, Renault Zoe is the most popular full EV inGermany (7,428), followed by Daimler electric drive, Tesla Model S, BMW i3, and NissanLeaf (Table 3.1). All Tesla models sum up to 4,358 EVs (Model S, X and Roadster) sothat Tesla ranks third. Figures for the entire year 2017 are not yet available at the timeof writing. In comparison to 2016, the number of yearly EV registrations has more thandoubled, from 11,410 to 25,056 in 2017 (Fig. 3.5). Most EVs can be found in Bavaria andNorth Rhine-Westfalia [59].In unison, Fig. 3.3 to Fig. 3.5 suggest that there might be sufficient numbers of chargingstations available for the current German EV fleet. Approximately six EVs share a singlecharging station but, since a single charging station has multiple plugs and sockets, thereare around three plugs per EV. Yet, it remains unclear whether these connections can beused simultaneously.
3Econom
ic,Policyand
Market
Regulation
Aspects
9
Full EV EV registered private EBat Ponboard ncells nseries QCellcar model 1.1.2017 owner in kWh in kW total in AhRenault Zoe 7,428 59% 22/41 11/22/43Daimler Smart electric drive 4,656 43% (i) 17.6 22 93 93 52Tesla Model S 3,645 41% 85 7104 96 3.25BMW i3 3,621 39% (ii) 21.6 6.4 96 96 60Nissan Leaf I/II 2,408 46% 24/30 3.6/6.6 192 96 32.5/40VW UP! 2,155 30% 18.7 3.6 204 102 25VW Golf 2,039 21% 35.8 7.2Citroën C-ZERO 942 47% 16.5 3.6 88 88 50Daimler B 250 e 431 24% 27 6.6Kia SOUL 430 49% 27 192 86 37.5Tesla Model X 372 33% 100Renault FLUENCE Z.E. 300 60% 22Nissan e-NV200 299 22% 24
model releases yearTesla Model 3 2017 50/75Opel Ampera-e 2017 60 4.6 288Nissan Leaf 2018 40 6.6 192BMW i3 2017 33.2 11 94Hyundai ionic 2018 28 6.6Honda clarity EV 2018 25.5
Table 3.1: Information about EV, numbers of full EV models registered in Germany as of January 1, 2017 [59]
3 Economic, Policy and Market Regulation Aspects 10
Figure 3.3: Number of charging stations and their number of charging points (i.e. plugsand sockets) for EVs in Germany, Q3 2016 – Q1 2018 as of March 14, 2018[90],[19]
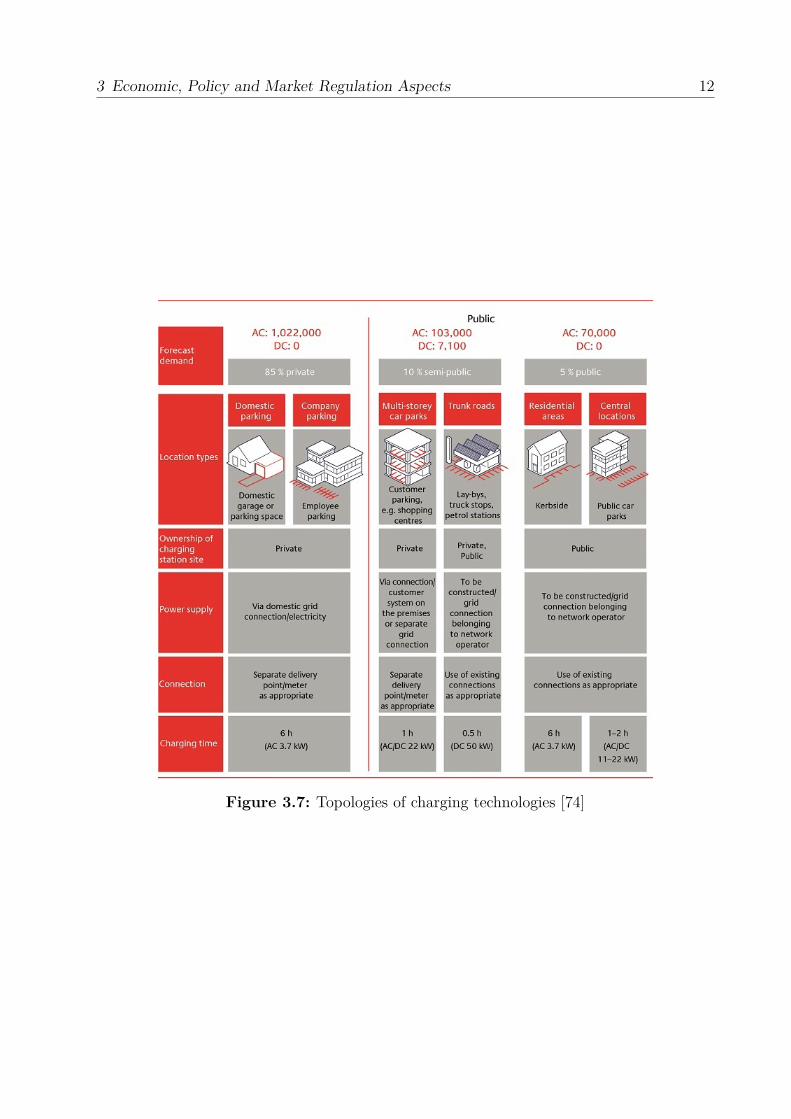
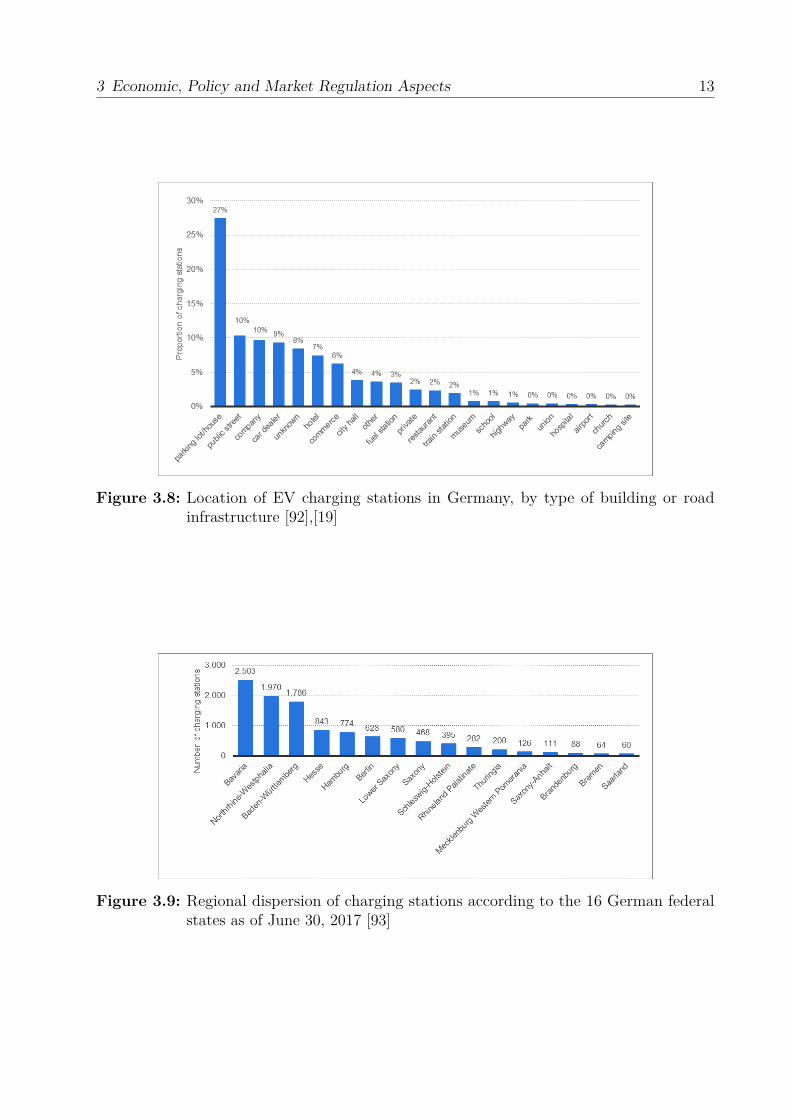
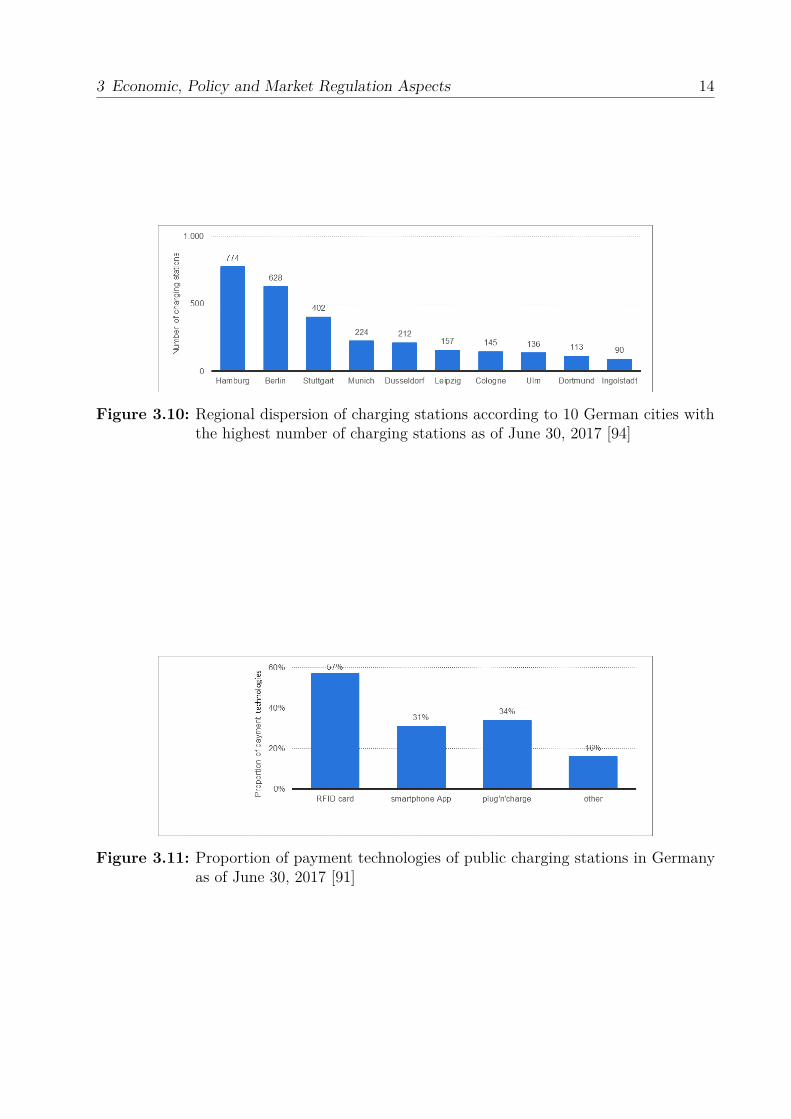
Focal point of this research project are the fast-charging stations: in 2016, 292 fast-chargingstations were counted [19]. As of September 2017, there are ca. 10,700 public charging pointsfor standard charging at 4,730 charging stations, and thereof 530 fast-charging stations [74].The federal government of Germany estimates that of the 36,000 publicly accessible chargingstations expected for 2020, approximately 20 % (7,000) will be fast-charging stations 3.6. Theallocation of charging stations within the built environment is shown in Fig. 3.7 and Fig. 3.8.According to Fig. 3.8, the currently available 8,711 charging stations are mostly allocated insemi-public parking lots and parking garages (27 %). Around 10 % of the charging stationsare situated along public roads. However, the left panel in Fig. 3.7 illustrates that 85 % ofthe charging infrastructure is currently found in the private sector, i.e. domestic garage orparking and employee parking [74]. This corresponds to the fact that more than 50 % ofthe German population lives in detached houses or semi-detached houses (single-family ortwo-family homes, respectively) [10]. There is the common belief that 3-20 % of German carowners are streetlamp parkers who – when switching to EVs – have to rely on the availabilityof public charging stations.The regional dispersion of charging stations across the 16 German federal states and acrossthe 10 German cities with the highest number of charging stations is shown in Fig. 3.9and Fig. 3.10, respectively. At 57 % of public charging stations, customers pay via radio-frequency identification (RFID) card (Fig. 3.11). The proportion of the four differentpayment technologies in Fig. 3.11 does not give any information on the payment schemes(i.e. pay per kWh, pay per minute, or monthly flatrate). However, the willingness to pay andthe payment technology are important factors for the business case in 3.1. Stakeholdersare teaming up in initiatives to foster charging infrastructure expansion. For example, thejoint venture IONITY of the car manufacturers BMW Group, Daimler AG, Ford Motor
3 Economic, Policy and Market Regulation Aspects 11
Figure 3.4: Fleet of passenger EVs in Germany, 2006 – 2008, as of January 2, 2018 [97]
Figure 3.5: Yearly EV registrations in Germany, 2003 – February 2018 [96]
Figure 3.6: Number of public charging points for EVs in Germany 2013 – 2020 (projection)[95]
3 Economic, Policy and Market Regulation Aspects 12
Figure 3.7: Topologies of charging technologies [74]
3 Economic, Policy and Market Regulation Aspects 13
Figure 3.8: Location of EV charging stations in Germany, by type of building or roadinfrastructure [92],[19]
Figure 3.9: Regional dispersion of charging stations according to the 16 German federalstates as of June 30, 2017 [93]
3 Economic, Policy and Market Regulation Aspects 14
Figure 3.10: Regional dispersion of charging stations according to 10 German cities withthe highest number of charging stations as of June 30, 2017 [94]
Figure 3.11: Proportion of payment technologies of public charging stations in Germanyas of June 30, 2017 [91]
3 Economic, Policy and Market Regulation Aspects 15
Company and the Volkswagen Group with its brand Audi and Porsche. IONITY plans toinstall 400 charging stations (350 kW) within 18 European countries until 2020. With these,they create a pan-European high-power charging (HPC) network [52]. IONITY, in turn,teams up with Shell, the Austrian oil and gas company OMV, the German service stationchain Tank & Rast, and the convenience chain store Circle K to secure regional coverage atmajor thoroughfares. More than 50 % of the 400 planned spots are already covered.Tank & Rast, in turn, also teamed up with Innogy to establish a fast-charging networkon German highways [50]. In the logistics sector, StreetScooter, a German commercialEV manufacturer within Deutsche Post DHL Group, also teamed up with Innogy on theB2B-level to install charging points at postal distribution centers [51]. Likewise, E.ONand CLEVER, an electric mobility service provider founded in 2009 by energy companiesSEAS-NVE and SE, cooperate to install an ultra-fast-charging network of 180 stations with2-6 charging points each (150 kW, with the possibility to upgrade to 350 kW). The stationswill be placed every 120-180 km along motorways in seven European countries (Germany,France, Norway, Sweden, the UK, Italy and Denmark). In a second wave, they plan to install400 ultra-fast-charging stations [32].In addition to strategic, vertical and horizontal cooperations on the B2B-level, also privateinvestors plan to install fast-charging stations in Germany, e.g. 24 charging stations with350 kW, which means full charging in a few minutes and no or only short waiting times atoccupied stations [41].Recent literature highlights the most pressing aspects. For instance, [17] consider enablersof fast-charging and conclude that early planning and increased coordination is needed. Incontrast, [108] find heterogeneous choice behavior of customers of fast-charging stations.
3.3 Legislative and Regulatory Framework ofFast-Charging Infrastructure in Germany
This section begins with the legislative and regulatory framework of e-mobility in generaland proceeds with a comprehensive overview of the legislative and regulatory framework offast-charging infrastructure in particular, thus allowing to address policy needs and marketregulation issues.The superordinate legislative body is the European Union. The EU strives to create asingle transport market for Europe. Smart, green and integrated transport plays a keyrole in the vision of Europe 2020, supported by the allocation of €6.3 bn of subsidies [39].Therefore, the aforementioned EU Directive 2014/94/EU (i.e. high power recharging points> 22 kW) dictates to EU member countries to design National Strategy Frameworks [38].In Germany, the National Strategy Framework was formulated as early as 2011 with theGovernment’s Development Mobility Program (Regierungsprogramm Entwicklungsmobilität[15]). In this program, the federal government reaffirms its support for e-mobility in Germanyand formulates the goal of becoming the lead market and lead provider in the field ofe-mobility.
3 Economic, Policy and Market Regulation Aspects 16
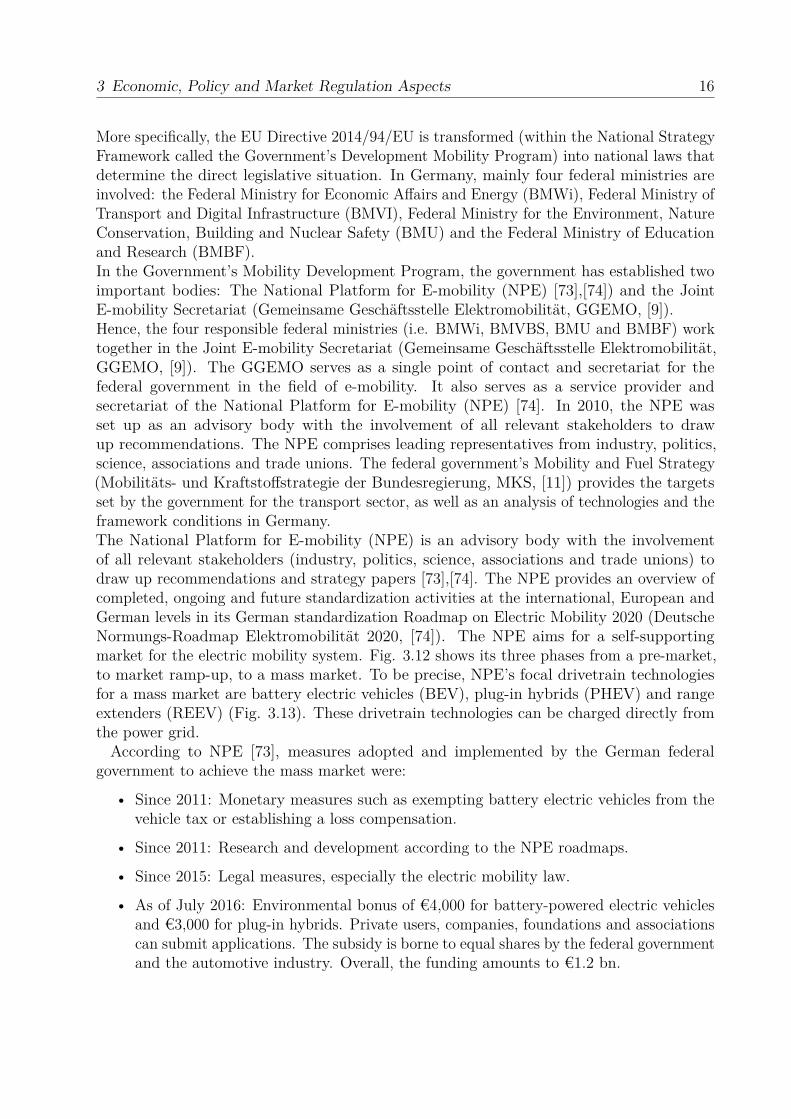
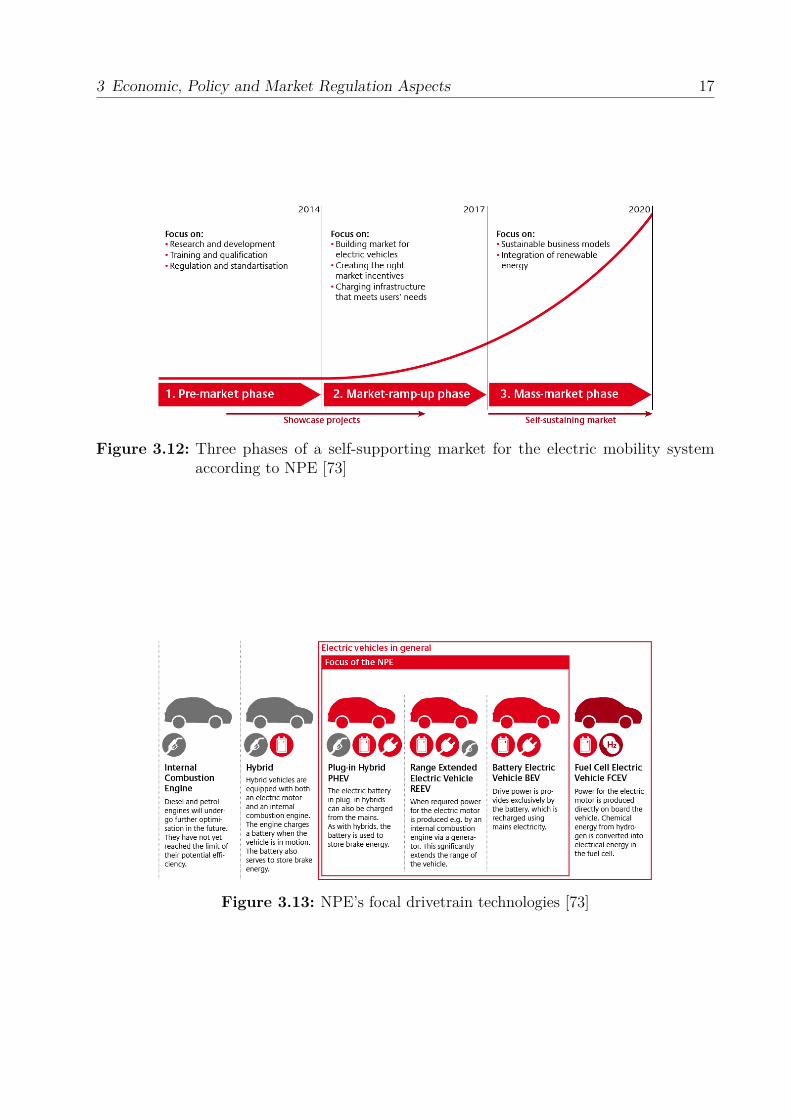
More specifically, the EU Directive 2014/94/EU is transformed (within the National StrategyFramework called the Government’s Development Mobility Program) into national laws thatdetermine the direct legislative situation. In Germany, mainly four federal ministries areinvolved: the Federal Ministry for Economic Affairs and Energy (BMWi), Federal Ministry ofTransport and Digital Infrastructure (BMVI), Federal Ministry for the Environment, NatureConservation, Building and Nuclear Safety (BMU) and the Federal Ministry of Educationand Research (BMBF).In the Government’s Mobility Development Program, the government has established twoimportant bodies: The National Platform for E-mobility (NPE) [73],[74]) and the JointE-mobility Secretariat (Gemeinsame Geschäftsstelle Elektromobilität, GGEMO, [9]).Hence, the four responsible federal ministries (i.e. BMWi, BMVBS, BMU and BMBF) worktogether in the Joint E-mobility Secretariat (Gemeinsame Geschäftsstelle Elektromobilität,GGEMO, [9]). The GGEMO serves as a single point of contact and secretariat for thefederal government in the field of e-mobility. It also serves as a service provider andsecretariat of the National Platform for E-mobility (NPE) [74]. In 2010, the NPE wasset up as an advisory body with the involvement of all relevant stakeholders to drawup recommendations. The NPE comprises leading representatives from industry, politics,science, associations and trade unions. The federal government’s Mobility and Fuel Strategy(Mobilitäts- und Kraftstoffstrategie der Bundesregierung, MKS, [11]) provides the targetsset by the government for the transport sector, as well as an analysis of technologies and theframework conditions in Germany.The National Platform for E-mobility (NPE) is an advisory body with the involvementof all relevant stakeholders (industry, politics, science, associations and trade unions) todraw up recommendations and strategy papers [73],[74]. The NPE provides an overview ofcompleted, ongoing and future standardization activities at the international, European andGerman levels in its German standardization Roadmap on Electric Mobility 2020 (DeutscheNormungs-Roadmap Elektromobilität 2020, [74]). The NPE aims for a self-supportingmarket for the electric mobility system. Fig. 3.12 shows its three phases from a pre-market,to market ramp-up, to a mass market. To be precise, NPE’s focal drivetrain technologiesfor a mass market are battery electric vehicles (BEV), plug-in hybrids (PHEV) and rangeextenders (REEV) (Fig. 3.13). These drivetrain technologies can be charged directly fromthe power grid.According to NPE [73], measures adopted and implemented by the German federal
government to achieve the mass market were:
• Since 2011: Monetary measures such as exempting battery electric vehicles from thevehicle tax or establishing a loss compensation.
• Since 2011: Research and development according to the NPE roadmaps.
• Since 2015: Legal measures, especially the electric mobility law.
• As of July 2016: Environmental bonus of €4,000 for battery-powered electric vehiclesand €3,000 for plug-in hybrids. Private users, companies, foundations and associationscan submit applications. The subsidy is borne to equal shares by the federal governmentand the automotive industry. Overall, the funding amounts to €1.2 bn.
3 Economic, Policy and Market Regulation Aspects 17
Figure 3.12: Three phases of a self-supporting market for the electric mobility systemaccording to NPE [73]
Figure 3.13: NPE’s focal drivetrain technologies [73]
3 Economic, Policy and Market Regulation Aspects 18
• Until 2017: Public procurement program. Replacement of 20 % of the public fleetswith electric vehicles.
• Until the end of 2020: €300 million worth of public investment in a publicly accessiblecharging infrastructure.
From 2017 until 2020, the NPE recommends the following accompanying measures:
• Continuing research and development with new focus areas; ensuring federal fundingof €360 million p.a. from 2017 to 2020.
• Supporting business decisions for a long-term integrated cell and battery production inGermany.
• Implementing the adopted public funding scheme for a publicly accessible charginginfrastructure until the end of 2020 and ensuring its supplementation through privateinvestment by means of a joint investment program of €550 million.
• Establishing and improving legal framework conditions, for instance, in tenancy andcommon-hold property law (regarding the installation of private charging points or thedesignation of parking spaces with the according charging infrastructure) or for theconstruction of railway stations or council housing.
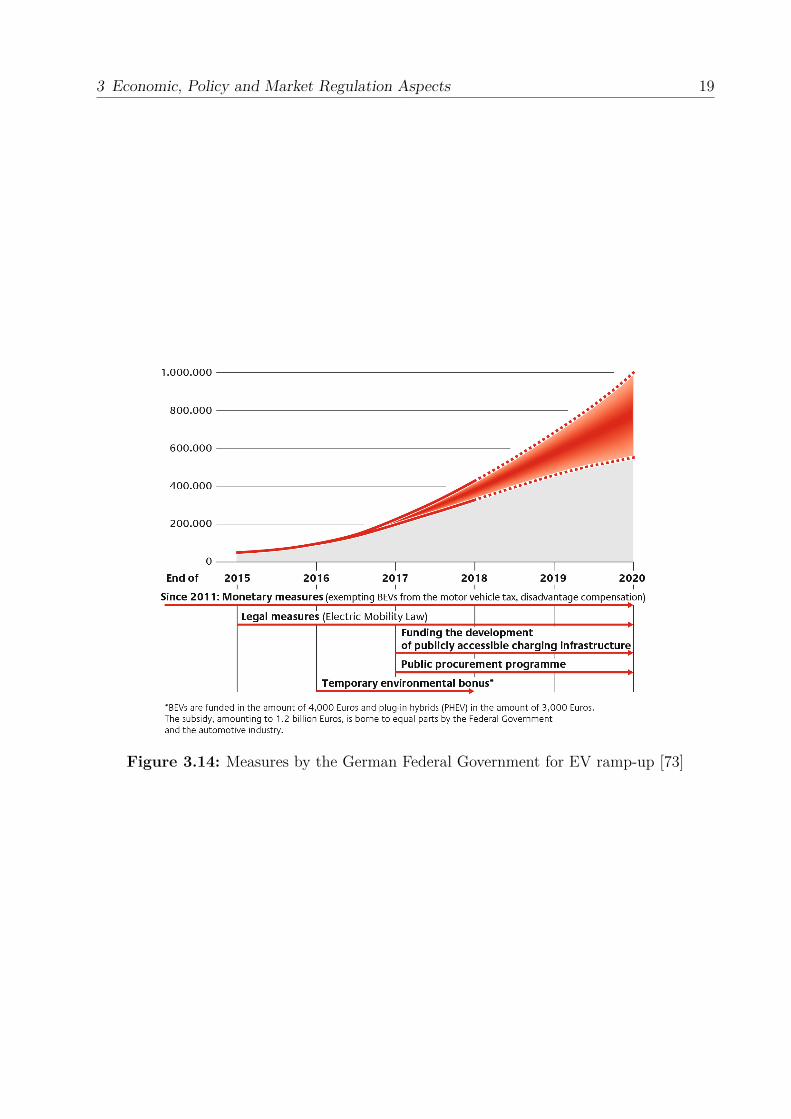
The NPE states that the aforementioned package of measures will help to create a leadingmarket where the goal of one million EVs by 2020 can still be achieved, as depicted in Fig.3.14 [73]. Yet, in light of uncertainties such as the development of the oil price, it is advisableto observe the further market ramp-up and, if necessary, adapt the funding accordingly. Thenext paragraphs give an overview on how the buildup of charging infrastructure is organizedin the EU in general, and in Germany in particular. Thus, it focuses on the policies andmarket regulation issues of fast-charging infrastructure for EVs in Germany.On the EU level, the development of charging infrastructure is regulated by EU Directive2014/94/EU [38], which envisages the deployment of an alternative fuels infrastructure(AFI) and, furthermore, seeks to address the standardization of charging points’ technicalspecifications. The directive further specifies minimum requirements for the establishment ofthe infrastructure for alternative fuels, to be implemented by the member states throughNational Strategy Frameworks. In doing so, the EU points towards a single market.In Germany, the implementation of the Directive 2014/94/EU (i.e. high power rechargingpoints > 22 kW) with regard to the requirements for connector standards for chargingelectric vehicles is regulated in the charging station legislation (Ladesäulenverordnung, LSV,[14],[12],[16]. Compliance with these standards is usually a prerequisite for receiving subsi-dies.The important legislative measures regarding the set-up of fast-charging infrastructure inGermany so far are threefold. The BMVI has issued an E-mobility Funding Directive(Förderrichtlinie Elektromobilität, [13]) as well as a charging infrastructure funding directive(Förderrichtlinie Ladeinfrastruktur für Elektrofahrzeuge in Deutschland [8]). Third, theBMWi has issued the aforementioned charging station legislation (Ladesäulenverordnung,LSV, [14],[12],[16]).All three support, among other things, the promotion of charging infrastructure, which is
3 Economic, Policy and Market Regulation Aspects 19
Figure 3.14: Measures by the German Federal Government for EV ramp-up [73]
3 Economic, Policy and Market Regulation Aspects 20
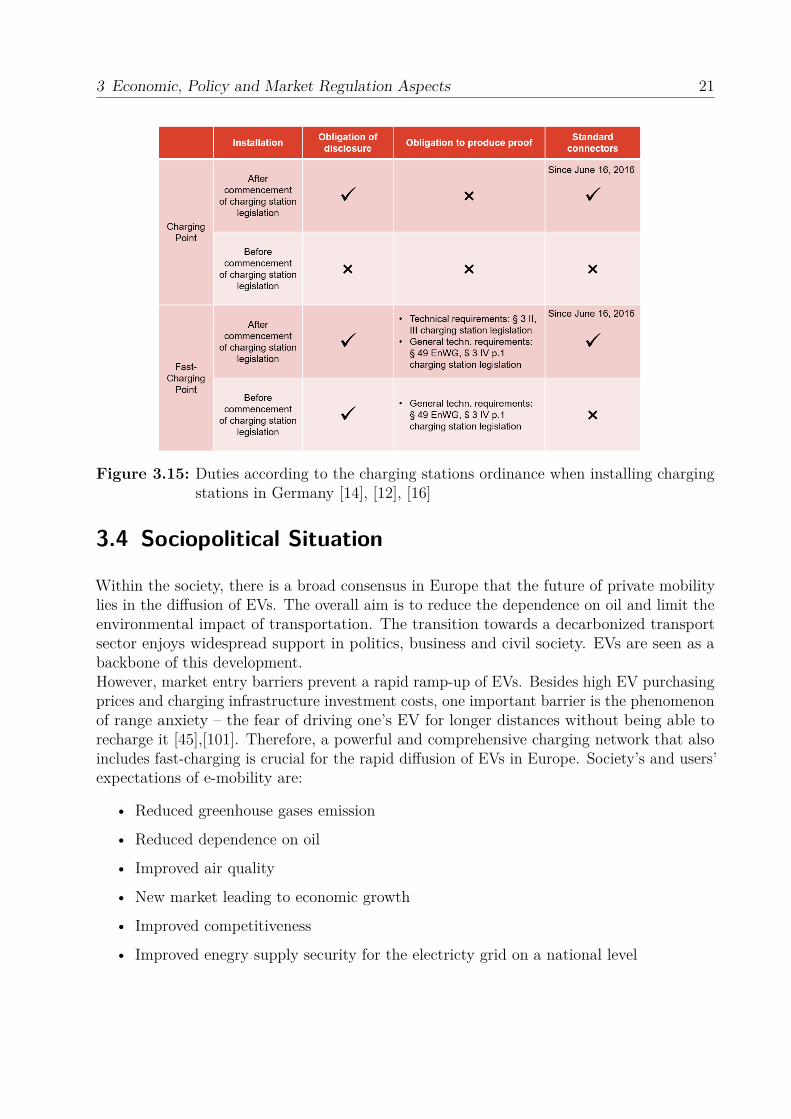
needed to increase the number of electric vehicles. Their aim is to create an interconnectionof vehicles to the electric grid and to combine this objective with the deployment of renewableenergies for the transport sector at a local level.First, the E-mobility Funding Directive [13] aims at improving the mobility sector in generalin terms of energy efficiency and environmental friendliness. It sets the ground for limitingoil dependency, creating an e-mobility lead market in Germany, and future mobility and fuelstrategies. It supports the promotion of charging infrastructure which is needed to increasethe number of electric vehicles. The directive aims to create an interconnection of vehicles tothe electric grid and to combine this objective with the development of renewable energiesfor the transport sector at the local level.Second, the charging infrastructure funding directive [8] paves the ground for the concreteexpansion of the charging infrastructure. The funding directive aims to support the ramp-upof electric vehicles by establishing a comprehensive, demand-driven and user-friendly char-ging network. The focus is on fast-charging infrastructure (> 22 kW), but it also supportsnormal charging infrastructure. Funding of €300 million is available for the construction ofpublicly accessible infrastructure, which will be awarded through calls for tenders. The mostimportant criterion is the lowest production costs per kW. Technological specifications applyaccording to ISO/IEC 15118, the minimum operating time by the operator is set to six years,electricity from renewable sources should be used and it should be accessible 24/7. Furthertechnological minimum specifications are regulated within the charging station legislation(Ladesäulenverordnung, LSV, [14],[12],[16]).Third, the charging station legislation (Ladesäulenverordnung, LSV, [14],[12],[16]) sets man-datory standards for the installation of charging points to ensure security and interoperability.Fig. 3.15 shows the difference in duties when installing charging stations in Germany accor-ding to the charging station legislation [14],[12],[16].To sum up, all directives, regulations and research publications highlight the relevance ofuniform norms, standards and regulations because uniform standards open up the market,ensure interoperability and provide investment security.
3 Economic, Policy and Market Regulation Aspects 21
Figure 3.15: Duties according to the charging stations ordinance when installing chargingstations in Germany [14], [12], [16]
3.4 Sociopolitical Situation
Within the society, there is a broad consensus in Europe that the future of private mobilitylies in the diffusion of EVs. The overall aim is to reduce the dependence on oil and limit theenvironmental impact of transportation. The transition towards a decarbonized transportsector enjoys widespread support in politics, business and civil society. EVs are seen as abackbone of this development.However, market entry barriers prevent a rapid ramp-up of EVs. Besides high EV purchasingprices and charging infrastructure investment costs, one important barrier is the phenomenonof range anxiety – the fear of driving one’s EV for longer distances without being able torecharge it [45],[101]. Therefore, a powerful and comprehensive charging network that alsoincludes fast-charging is crucial for the rapid diffusion of EVs in Europe. Society’s and users’expectations of e-mobility are:
• Reduced greenhouse gases emission
• Reduced dependence on oil
• Improved air quality
• New market leading to economic growth
• Improved competitiveness
• Improved enegry supply security for the electricty grid on a national level

3 Economic, Policy and Market Regulation Aspects 22
To the users, several aspects remain unclear:
• EV purchase prices remain too high: Even though the operating costs of EVs are farless than those of internal combustion engine vehicles (ICEVs), most car users solelyaccount for the higher EV purchase prices of EVs in comparison to ICEVs.
• How to ensure that the electricity used for recharging the EVs is in fact from renewableenergy sources?
• How to find an available and unoccupied charging station?
• How fast can I charge at home? And how many neighbors can charge at the same time?This opens up the perspective of energy equality and fairness: If I install fast-chargingcapacity at my house, maybe my neighbor cannot install fast-charging as well. Whatcould be the policies and regulations?
There is broad political support for EVs on almost all stakeholder levels; stakeholders areaware of the following challenges:
• Range anxiety
• Business models for charging
• Establishment of universal standards
• Charging behavior
• Cooperation of central players
Power utilities
Grid operator/s
Car manufacturer/s
Charging point operator/s
Customers
Politics
Thus, e-mobility and the installation of fast-charging infrastructure require a holistic approach,as outlined by means of a stakeholder analysis in the next section.

3 Economic, Policy and Market Regulation Aspects 23
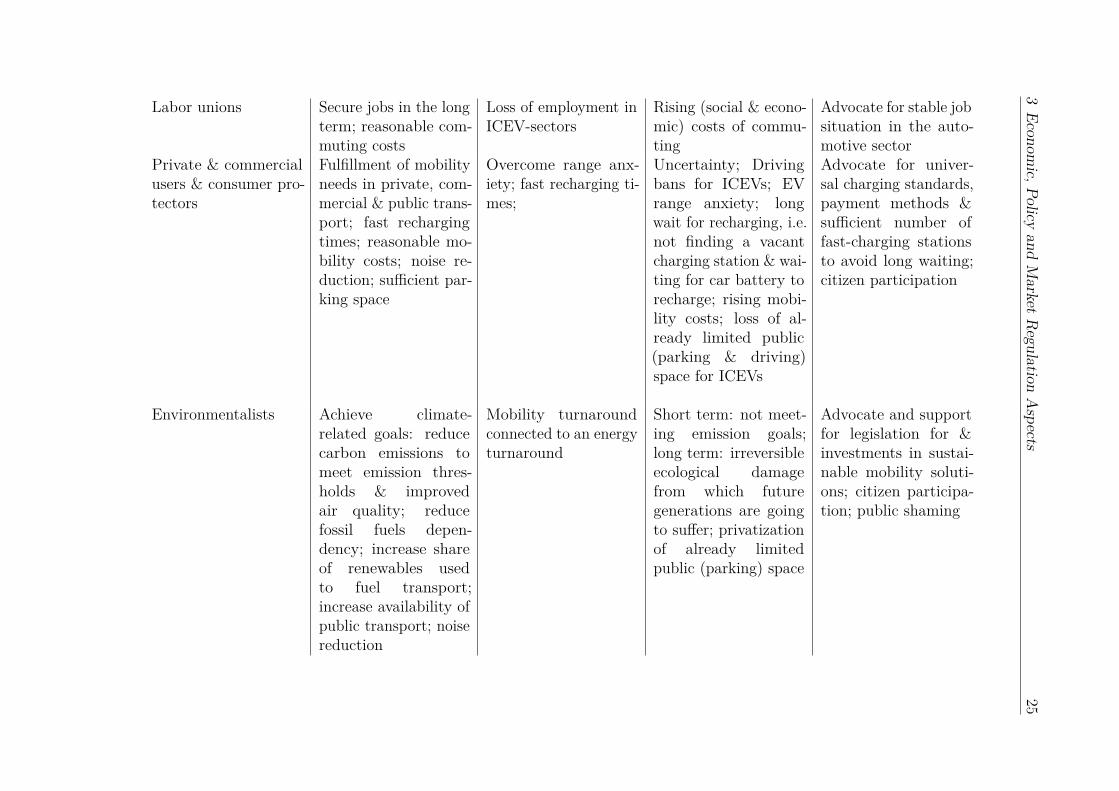
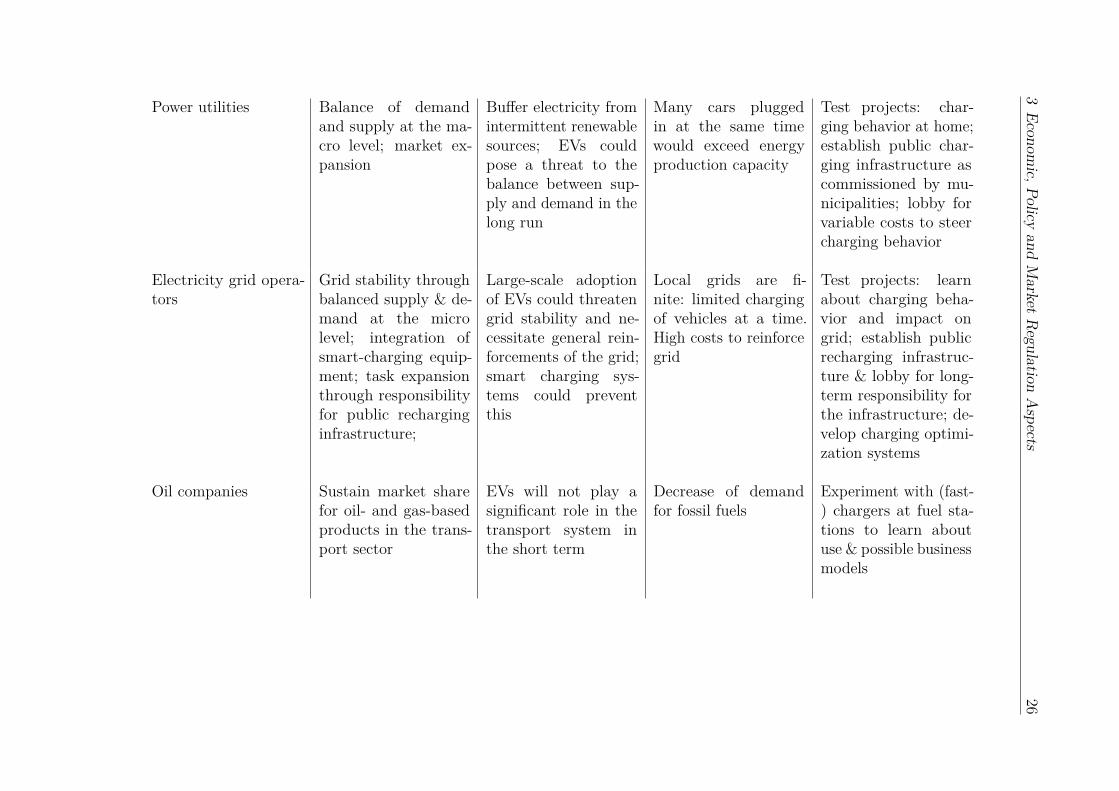
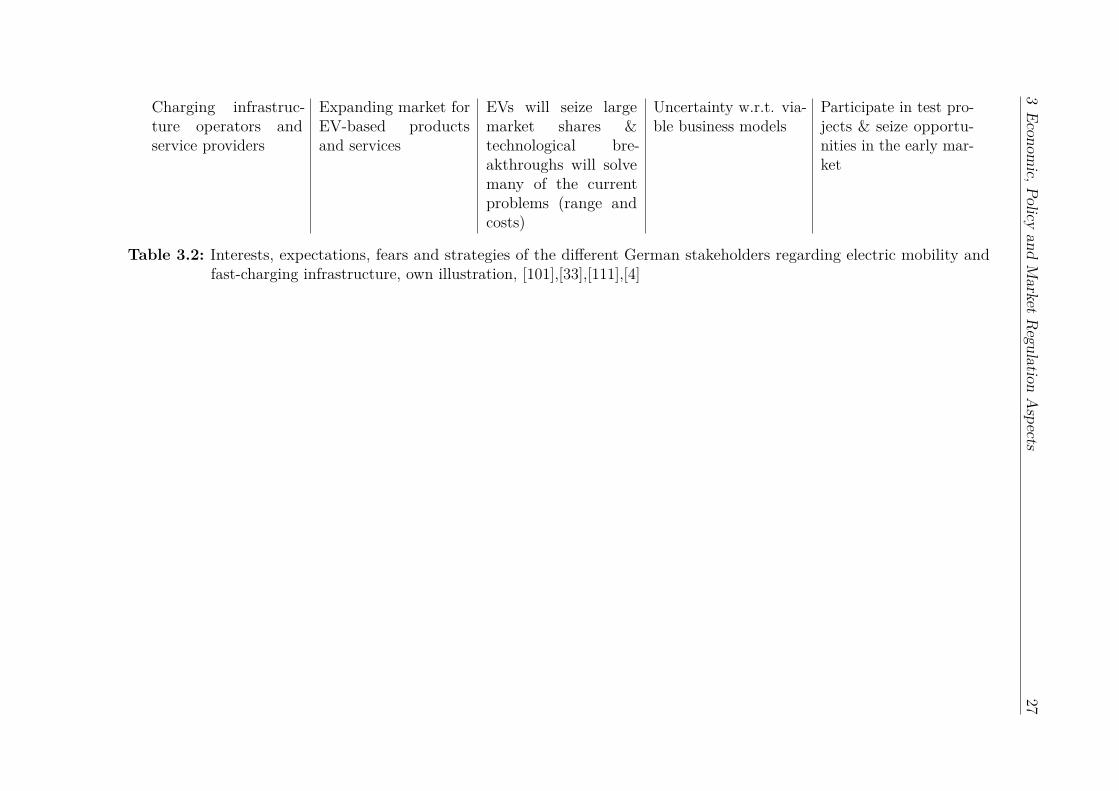
3.5 Stakeholder Analysis
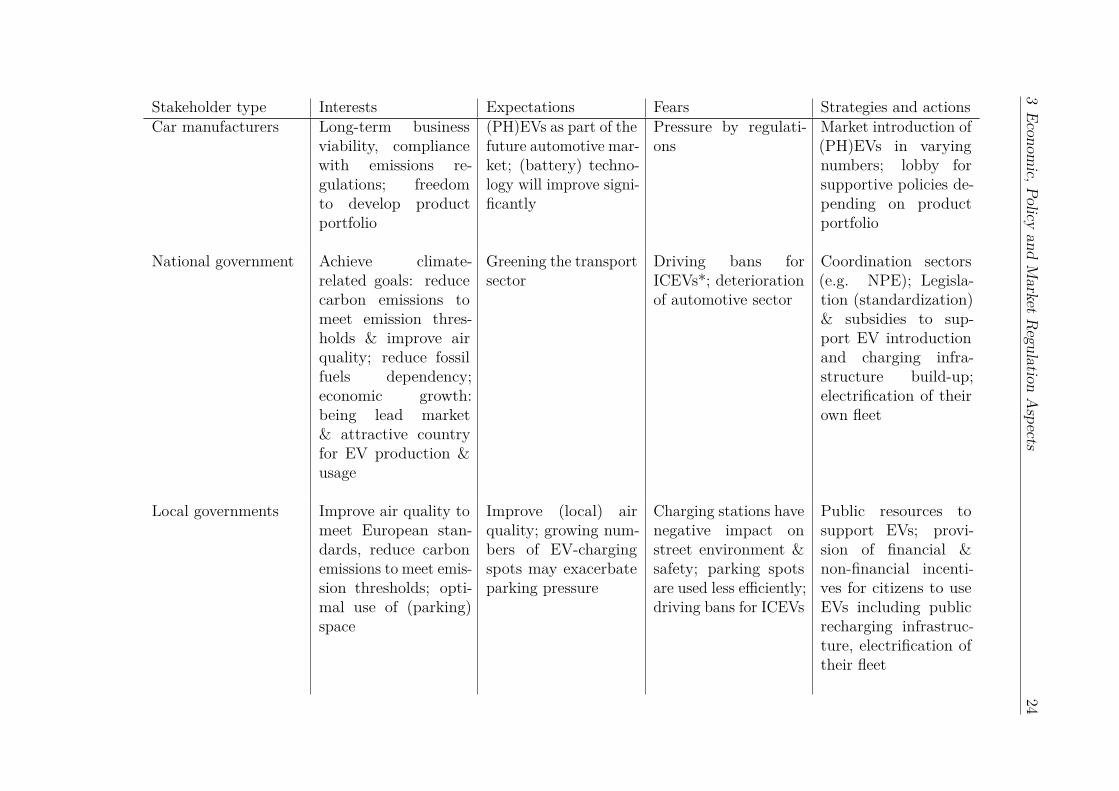
There is a broad consensus in Europe that the future of private mobility lies in the diffusion ofEVs. The overall aim is to reduce the dependence on oil and to limit the environmental impactof transportation. The transition to a decarbonized transport sector enjoys widespreadsupport in politics, business and civil society. Yet, these stakeholders do not share commonobjectives. Our questions are: What do the diverse actors actually want? Are therecontradictory strategies? For that reason, we conducted a stakeholder analysis within a timehorizon from now to the next three to five years. Table 3.2 shows the results of the stakeholderanalysis in a stakeholder matrix. Our ten main stakeholders distilled from recent literatureare car manufacturers, national and local governments, labor unions, private and commercialusers as well as consumer rights associations, environmentalists, power utilities, electricitygrid operators, oil companies, charging infrastructure operators and service providers.To conclude, a broad support for EVs on almost all stakeholder levels is needed, right fromthe start; politicians are aware of the current and upcoming challenges. Cooperation amonga broad set of stakeholders is needed in order to produce affordable vehicles, as well as todevelop an early market and the necessary recharging infrastructure. The required directionof development seems to be straightforward.
3Econom
ic,Policyand
Market
Regulation
Aspects
24Stakeholder type Interests Expectations Fears Strategies and actionsCar manufacturers Long-term business
viability, compliancewith emissions re-gulations; freedomto develop productportfolio
(PH)EVs as part of thefuture automotive mar-ket; (battery) techno-logy will improve signi-ficantly
Pressure by regulati-ons
Market introduction of(PH)EVs in varyingnumbers; lobby forsupportive policies de-pending on productportfolio
National government Achieve climate-related goals: reducecarbon emissions tomeet emission thres-holds & improve airquality; reduce fossilfuels dependency;economic growth:being lead market& attractive countryfor EV production &usage
Greening the transportsector
Driving bans forICEVs*; deteriorationof automotive sector
Coordination sectors(e.g. NPE); Legisla-tion (standardization)& subsidies to sup-port EV introductionand charging infra-structure build-up;electrification of theirown fleet
Local governments Improve air quality tomeet European stan-dards, reduce carbonemissions to meet emis-sion thresholds; opti-mal use of (parking)space
Improve (local) airquality; growing num-bers of EV-chargingspots may exacerbateparking pressure
Charging stations havenegative impact onstreet environment &safety; parking spotsare used less efficiently;driving bans for ICEVs
Public resources tosupport EVs; provi-sion of financial &non-financial incenti-ves for citizens to useEVs including publicrecharging infrastruc-ture, electrification oftheir fleet
3Econom
ic,Policyand
Market
Regulation
Aspects
25Labor unions Secure jobs in the long
term; reasonable com-muting costs
Loss of employment inICEV-sectors
Rising (social & econo-mic) costs of commu-ting
Advocate for stable jobsituation in the auto-motive sector
Private & commercialusers & consumer pro-tectors
Fulfillment of mobilityneeds in private, com-mercial & public trans-port; fast rechargingtimes; reasonable mo-bility costs; noise re-duction; sufficient par-king space
Overcome range anx-iety; fast recharging ti-mes;
Uncertainty; Drivingbans for ICEVs; EVrange anxiety; longwait for recharging, i.e.not finding a vacantcharging station & wai-ting for car battery torecharge; rising mobi-lity costs; loss of al-ready limited public(parking & driving)space for ICEVs
Advocate for univer-sal charging standards,payment methods &sufficient number offast-charging stationsto avoid long waiting;citizen participation
Environmentalists Achieve climate-related goals: reducecarbon emissions tomeet emission thres-holds & improvedair quality; reducefossil fuels depen-dency; increase shareof renewables usedto fuel transport;increase availability ofpublic transport; noisereduction
Mobility turnaroundconnected to an energyturnaround
Short term: not meet-ing emission goals;long term: irreversibleecological damagefrom which futuregenerations are goingto suffer; privatizationof already limitedpublic (parking) space
Advocate and supportfor legislation for &investments in sustai-nable mobility soluti-ons; citizen participa-tion; public shaming
3Econom
ic,Policyand
Market
Regulation
Aspects
26Power utilities Balance of demand
and supply at the ma-cro level; market ex-pansion
Buffer electricity fromintermittent renewablesources; EVs couldpose a threat to thebalance between sup-ply and demand in thelong run
Many cars pluggedin at the same timewould exceed energyproduction capacity
Test projects: char-ging behavior at home;establish public char-ging infrastructure ascommissioned by mu-nicipalities; lobby forvariable costs to steercharging behavior
Electricity grid opera-tors
Grid stability throughbalanced supply & de-mand at the microlevel; integration ofsmart-charging equip-ment; task expansionthrough responsibilityfor public recharginginfrastructure;
Large-scale adoptionof EVs could threatengrid stability and ne-cessitate general rein-forcements of the grid;smart charging sys-tems could preventthis
Local grids are fi-nite: limited chargingof vehicles at a time.High costs to reinforcegrid
Test projects: learnabout charging beha-vior and impact ongrid; establish publicrecharging infrastruc-ture & lobby for long-term responsibility forthe infrastructure; de-velop charging optimi-zation systems
Oil companies Sustain market sharefor oil- and gas-basedproducts in the trans-port sector
EVs will not play asignificant role in thetransport system inthe short term
Decrease of demandfor fossil fuels
Experiment with (fast-) chargers at fuel sta-tions to learn aboutuse & possible businessmodels
3Econom
ic,Policyand
Market
Regulation
Aspects
27Charging infrastruc-ture operators andservice providers
Expanding market forEV-based productsand services
EVs will seize largemarket shares &technological bre-akthroughs will solvemany of the currentproblems (range andcosts)
Uncertainty w.r.t. via-ble business models
Participate in test pro-jects & seize opportu-nities in the early mar-ket
Table 3.2: Interests, expectations, fears and strategies of the different German stakeholders regarding electric mobility andfast-charging infrastructure, own illustration, [101],[33],[111],[4]
3 Economic, Policy and Market Regulation Aspects 28
3.6 Business Models
There exist only a few major studies on EV (fast-) charging infrastructure business modelsup to now. For instance, [66] developed a methodology to assess EV-charging infrastructurebusiness models using a similar definition of location of charging as in our study. [84]determine the economics behind fast-charging infrastructure as of 2011 EV penetration rates.For viable fast-charging business models, several types of information need to be known.Influencing factors regarding economic viability are:
• Installation costs (costs of stations themselves, cables)
• Land costs
• Service life
• Necessity for grid enforcement (peak expansion costs)
• Energy price
• Operating costs
• EV market penetration
• Integration of actors into power grid
• Maintenance costs (ca. 10 % of investment costs)
• Risk analysis (vandalism, destruction)
• Battery aging, battery technologies as well as battery sizes of EVs sold the most orthat will most likely penetrate the market
• Costs of on- and off-board components and battery components
• Revenue streams are influenced by tariffs, capacity and occupancy rates
• Income streams from V2G
Regarding pricing strategies, the following aspects need to be considered:
• Willingness to pay for charging EV (ca. €5/100 km are the costs for fueling ICEV)
• Payment schemes (pay per kWh, monthly flatrate, or pay per minute with or withoutthe time the EV is simply parked and not charged, i.e. pure parking time)
• Tariff to be around 32 €-ct/kWh according to [84]
• Charging strategies [67]
• Other benefits by compound effects (marketing, sales of other products)
Moreover, general conditions such as
• Politics of natural resource
3 Economic, Policy and Market Regulation Aspects 29
• International developments (e.g. the role of China [71])
• Recycling
• Expectation management
• Environment and climate protection
• Safety management
• Other business models
• Further training of entrepreneurs and employees
• Close and early coordination between stakeholders
• Definition of norms and standards
should be considered.It becomes clear that this relates to the subdiscipline (economics of) diffusion of technologicalinnovation. Moreover, a regional mapping will be necessary to find out where fast-chargingstations will make most sense and how many EVs are registered where. [84] provide a holisticapproach to the economics of fast-charging. Yet, their definition of fast-charging stems from2012 and future investment costs are difficult to assess.The incumbent charging station operators in Germany have opted for the first-moveradvantage of securing the most popular and thus profit-yielding spots. The learning curvesare yet unknown; the question remains whether charging technologies (conductive(wired),inductive(wireless), robot charging) and topologies will become sufficiently cheaper in thenext three to five years. The second-movers probably opt for lower costs. In addition, theidentification of a profitable value chain within the business model of charging stations hasbeen tedious, even for power utilities. Vertical integration (i.e. the cooperation of servicestation chains and power utilities) has been one way of creating a value stack that servesprofit goals. The questions remain what needs to be done to establish a fast-charging network.A first approach to a solution could comprise the following elements:
• Batteries can be charged at low costs with energy during off-peak periods, and canthen feed power back into the grid during peak periods
• Mobility guarantee: When purchasing an EV, the occasional use of internal combustionengine vehicles could be offered for longer journeys
• Integration of charging pool information into navigation
• Holistic approach: Not only look at charging stations but at vehicle together withbattery as well as infrastructure service and system service which integrates EVs intothe electric grid [58]
• The formation of a sharing economy with autonomous EVs.
4 Fast-Charging Technologies
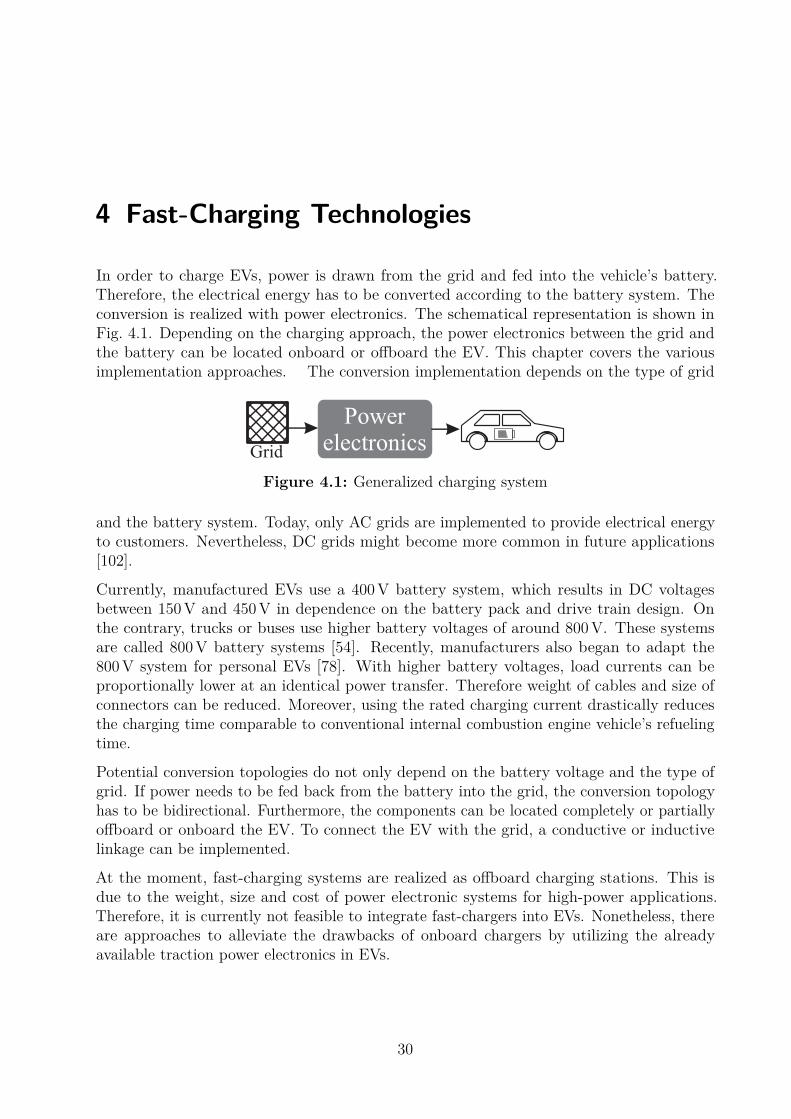
In order to charge EVs, power is drawn from the grid and fed into the vehicle’s battery.Therefore, the electrical energy has to be converted according to the battery system. Theconversion is realized with power electronics. The schematical representation is shown inFig. 4.1. Depending on the charging approach, the power electronics between the grid andthe battery can be located onboard or offboard the EV. This chapter covers the variousimplementation approaches. The conversion implementation depends on the type of grid
Powerelectronics Grid
Figure 4.1: Generalized charging system
and the battery system. Today, only AC grids are implemented to provide electrical energyto customers. Nevertheless, DC grids might become more common in future applications[102].
Currently, manufactured EVs use a 400 V battery system, which results in DC voltagesbetween 150 V and 450 V in dependence on the battery pack and drive train design. Onthe contrary, trucks or buses use higher battery voltages of around 800 V. These systemsare called 800 V battery systems [54]. Recently, manufacturers also began to adapt the800 V system for personal EVs [78]. With higher battery voltages, load currents can beproportionally lower at an identical power transfer. Therefore weight of cables and size ofconnectors can be reduced. Moreover, using the rated charging current drastically reducesthe charging time comparable to conventional internal combustion engine vehicle’s refuelingtime.
Potential conversion topologies do not only depend on the battery voltage and the type ofgrid. If power needs to be fed back from the battery into the grid, the conversion topologyhas to be bidirectional. Furthermore, the components can be located completely or partiallyoffboard or onboard the EV. To connect the EV with the grid, a conductive or inductivelinkage can be implemented.
At the moment, fast-charging systems are realized as offboard charging stations. This isdue to the weight, size and cost of power electronic systems for high-power applications.Therefore, it is currently not feasible to integrate fast-chargers into EVs. Nonetheless, thereare approaches to alleviate the drawbacks of onboard chargers by utilizing the alreadyavailable traction power electronics in EVs.
30
4 Fast-Charging Technologies 31
In this chapter, different conversion topologies are presented. Besides the current state-of-the-art, also future topologies are shown. Since fast-charging applications are considered,only topologies with a nominal transferable power of at least 22 kW are covered according tochapter 2.
4.1 Fast-Charging Stations (DC) Connected to the ACGrid
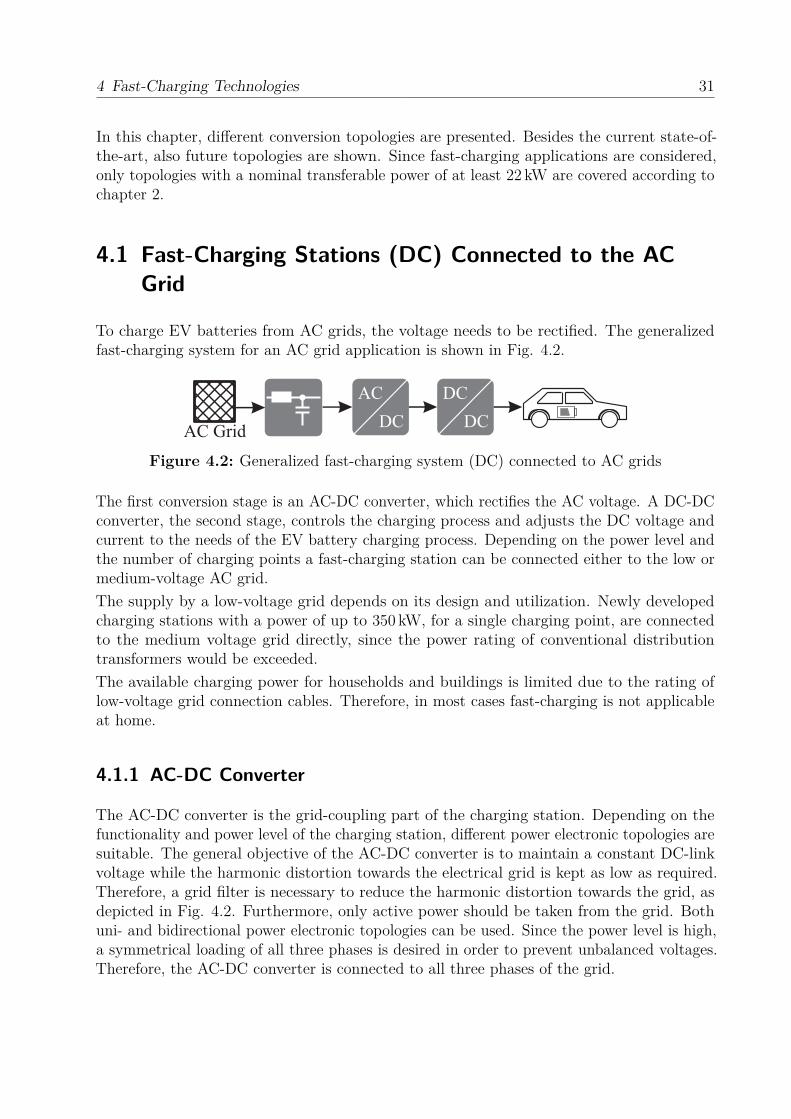
To charge EV batteries from AC grids, the voltage needs to be rectified. The generalizedfast-charging system for an AC grid application is shown in Fig. 4.2.
AC GridDC
AC
DC
DC
Figure 4.2: Generalized fast-charging system (DC) connected to AC grids
The first conversion stage is an AC-DC converter, which rectifies the AC voltage. A DC-DCconverter, the second stage, controls the charging process and adjusts the DC voltage andcurrent to the needs of the EV battery charging process. Depending on the power level andthe number of charging points a fast-charging station can be connected either to the low ormedium-voltage AC grid.The supply by a low-voltage grid depends on its design and utilization. Newly developedcharging stations with a power of up to 350 kW, for a single charging point, are connectedto the medium voltage grid directly, since the power rating of conventional distributiontransformers would be exceeded.The available charging power for households and buildings is limited due to the rating oflow-voltage grid connection cables. Therefore, in most cases fast-charging is not applicableat home.
4.1.1 AC-DC Converter
The AC-DC converter is the grid-coupling part of the charging station. Depending on thefunctionality and power level of the charging station, different power electronic topologies aresuitable. The general objective of the AC-DC converter is to maintain a constant DC-linkvoltage while the harmonic distortion towards the electrical grid is kept as low as required.Therefore, a grid filter is necessary to reduce the harmonic distortion towards the grid, asdepicted in Fig. 4.2. Furthermore, only active power should be taken from the grid. Bothuni- and bidirectional power electronic topologies can be used. Since the power level is high,a symmetrical loading of all three phases is desired in order to prevent unbalanced voltages.Therefore, the AC-DC converter is connected to all three phases of the grid.
4 Fast-Charging Technologies 32
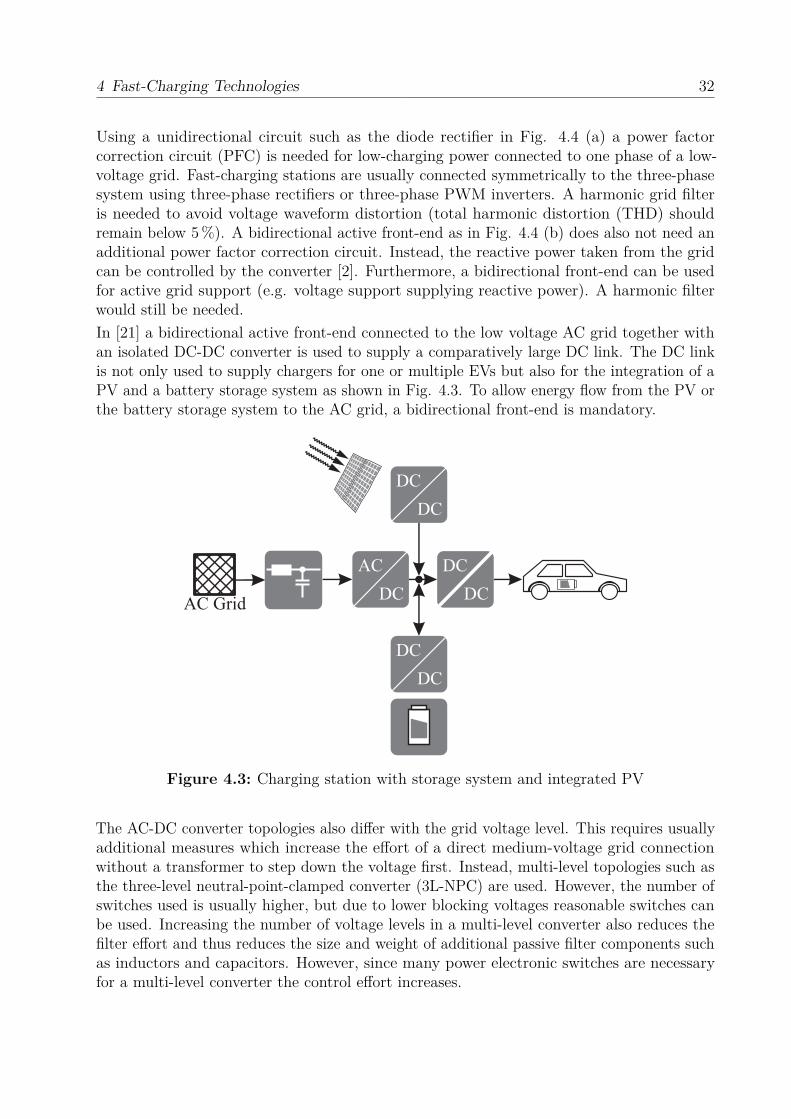
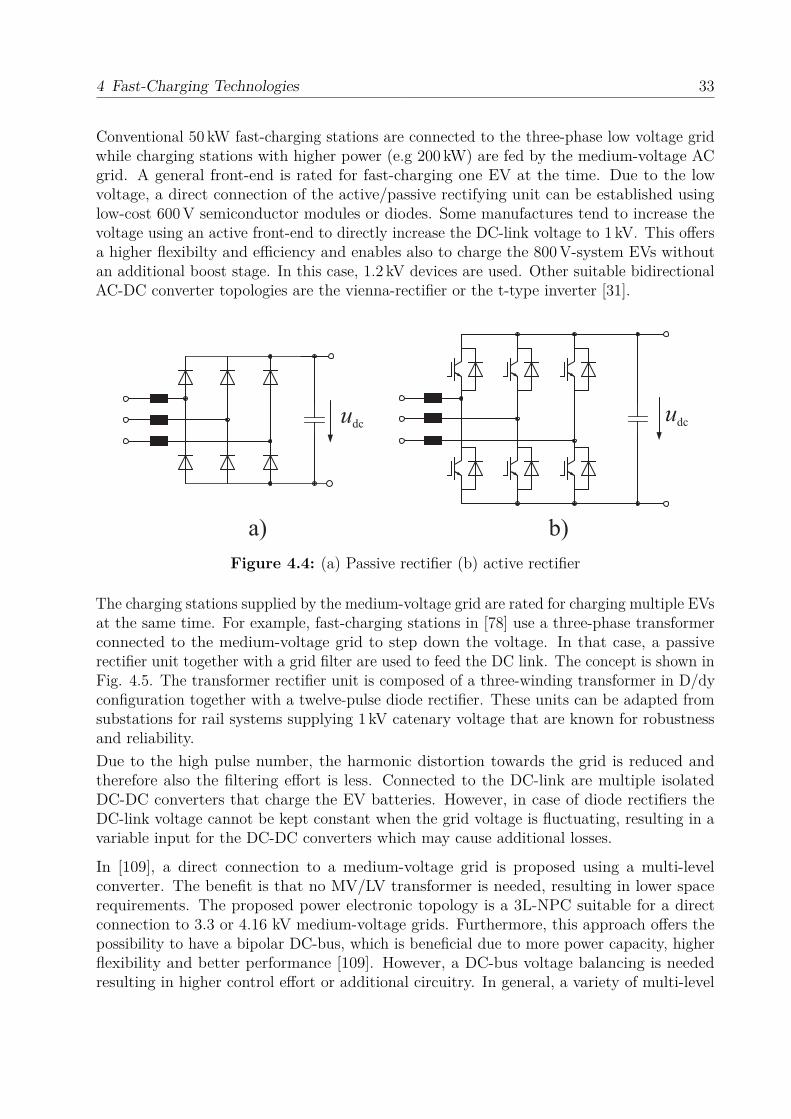
Using a unidirectional circuit such as the diode rectifier in Fig. 4.4 (a) a power factorcorrection circuit (PFC) is needed for low-charging power connected to one phase of a low-voltage grid. Fast-charging stations are usually connected symmetrically to the three-phasesystem using three-phase rectifiers or three-phase PWM inverters. A harmonic grid filteris needed to avoid voltage waveform distortion (total harmonic distortion (THD) shouldremain below 5 %). A bidirectional active front-end as in Fig. 4.4 (b) does also not need anadditional power factor correction circuit. Instead, the reactive power taken from the gridcan be controlled by the converter [2]. Furthermore, a bidirectional front-end can be usedfor active grid support (e.g. voltage support supplying reactive power). A harmonic filterwould still be needed.In [21] a bidirectional active front-end connected to the low voltage AC grid together withan isolated DC-DC converter is used to supply a comparatively large DC link. The DC linkis not only used to supply chargers for one or multiple EVs but also for the integration of aPV and a battery storage system as shown in Fig. 4.3. To allow energy flow from the PV orthe battery storage system to the AC grid, a bidirectional front-end is mandatory.
AC GridDC
AC DC
DC
DC
DC
DC
DC
Figure 4.3: Charging station with storage system and integrated PV
The AC-DC converter topologies also differ with the grid voltage level. This requires usuallyadditional measures which increase the effort of a direct medium-voltage grid connectionwithout a transformer to step down the voltage first. Instead, multi-level topologies such asthe three-level neutral-point-clamped converter (3L-NPC) are used. However, the number ofswitches used is usually higher, but due to lower blocking voltages reasonable switches canbe used. Increasing the number of voltage levels in a multi-level converter also reduces thefilter effort and thus reduces the size and weight of additional passive filter components suchas inductors and capacitors. However, since many power electronic switches are necessaryfor a multi-level converter the control effort increases.
4 Fast-Charging Technologies 33
Conventional 50 kW fast-charging stations are connected to the three-phase low voltage gridwhile charging stations with higher power (e.g 200 kW) are fed by the medium-voltage ACgrid. A general front-end is rated for fast-charging one EV at the time. Due to the lowvoltage, a direct connection of the active/passive rectifying unit can be established usinglow-cost 600 V semiconductor modules or diodes. Some manufactures tend to increase thevoltage using an active front-end to directly increase the DC-link voltage to 1 kV. This offersa higher flexibilty and efficiency and enables also to charge the 800 V-system EVs withoutan additional boost stage. In this case, 1.2 kV devices are used. Other suitable bidirectionalAC-DC converter topologies are the vienna-rectifier or the t-type inverter [31].
udcudc
a) b)
Figure 4.4: (a) Passive rectifier (b) active rectifier
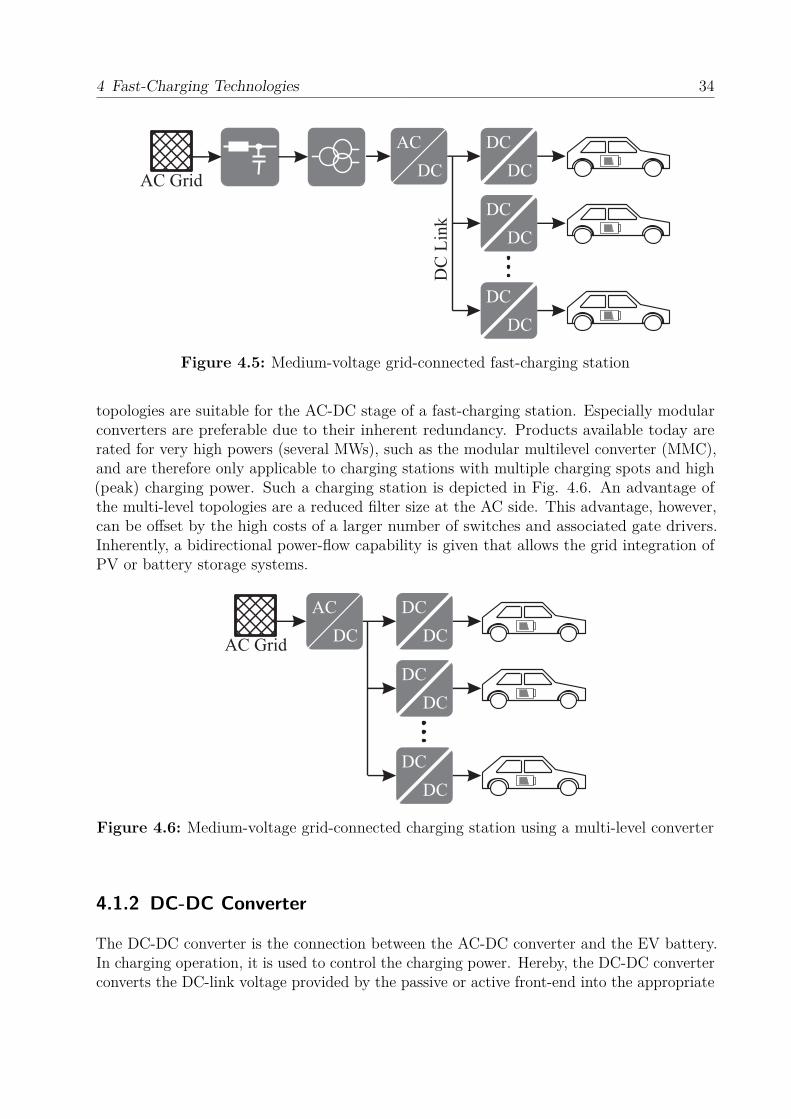
The charging stations supplied by the medium-voltage grid are rated for charging multiple EVsat the same time. For example, fast-charging stations in [78] use a three-phase transformerconnected to the medium-voltage grid to step down the voltage. In that case, a passiverectifier unit together with a grid filter are used to feed the DC link. The concept is shown inFig. 4.5. The transformer rectifier unit is composed of a three-winding transformer in D/dyconfiguration together with a twelve-pulse diode rectifier. These units can be adapted fromsubstations for rail systems supplying 1 kV catenary voltage that are known for robustnessand reliability.Due to the high pulse number, the harmonic distortion towards the grid is reduced andtherefore also the filtering effort is less. Connected to the DC-link are multiple isolatedDC-DC converters that charge the EV batteries. However, in case of diode rectifiers theDC-link voltage cannot be kept constant when the grid voltage is fluctuating, resulting in avariable input for the DC-DC converters which may cause additional losses.
In [109], a direct connection to a medium-voltage grid is proposed using a multi-levelconverter. The benefit is that no MV/LV transformer is needed, resulting in lower spacerequirements. The proposed power electronic topology is a 3L-NPC suitable for a directconnection to 3.3 or 4.16 kV medium-voltage grids. Furthermore, this approach offers thepossibility to have a bipolar DC-bus, which is beneficial due to more power capacity, higherflexibility and better performance [109]. However, a DC-bus voltage balancing is neededresulting in higher control effort or additional circuitry. In general, a variety of multi-level
4 Fast-Charging Technologies 34
AC GridDC
AC DC
DC
DC
DC
DC
DC
DC
Lin
k
Figure 4.5: Medium-voltage grid-connected fast-charging station
topologies are suitable for the AC-DC stage of a fast-charging station. Especially modularconverters are preferable due to their inherent redundancy. Products available today arerated for very high powers (several MWs), such as the modular multilevel converter (MMC),and are therefore only applicable to charging stations with multiple charging spots and high(peak) charging power. Such a charging station is depicted in Fig. 4.6. An advantage ofthe multi-level topologies are a reduced filter size at the AC side. This advantage, however,can be offset by the high costs of a larger number of switches and associated gate drivers.Inherently, a bidirectional power-flow capability is given that allows the grid integration ofPV or battery storage systems.
AC GridDC
AC DC
DC
DC
DC
DC
DC
Figure 4.6: Medium-voltage grid-connected charging station using a multi-level converter
4.1.2 DC-DC Converter
The DC-DC converter is the connection between the AC-DC converter and the EV battery.In charging operation, it is used to control the charging power. Hereby, the DC-DC converterconverts the DC-link voltage provided by the passive or active front-end into the appropriate
4 Fast-Charging Technologies 35
voltage for the EV battery. There are many converter topologies available fulfilling differentrequirements and having unlike advantages and disadvantages. Different topologies canprovide uni- or bidirectional power flow. Galvanic isolation between the grid and the vehiclecan be provided by isolated DC-DC converter topologies. Isolated converters may allow theremoval of the grid-connected transformer [56].
i2
U2C2
S2,1
S2,2
S2,3
S2,4
S2,5
S2,6
U1 C1
i1
S1,1
S1,2
S1,3
S1,4
S1,5
S1,6
i1,u
i1,v i1,w
u1,u u2,u
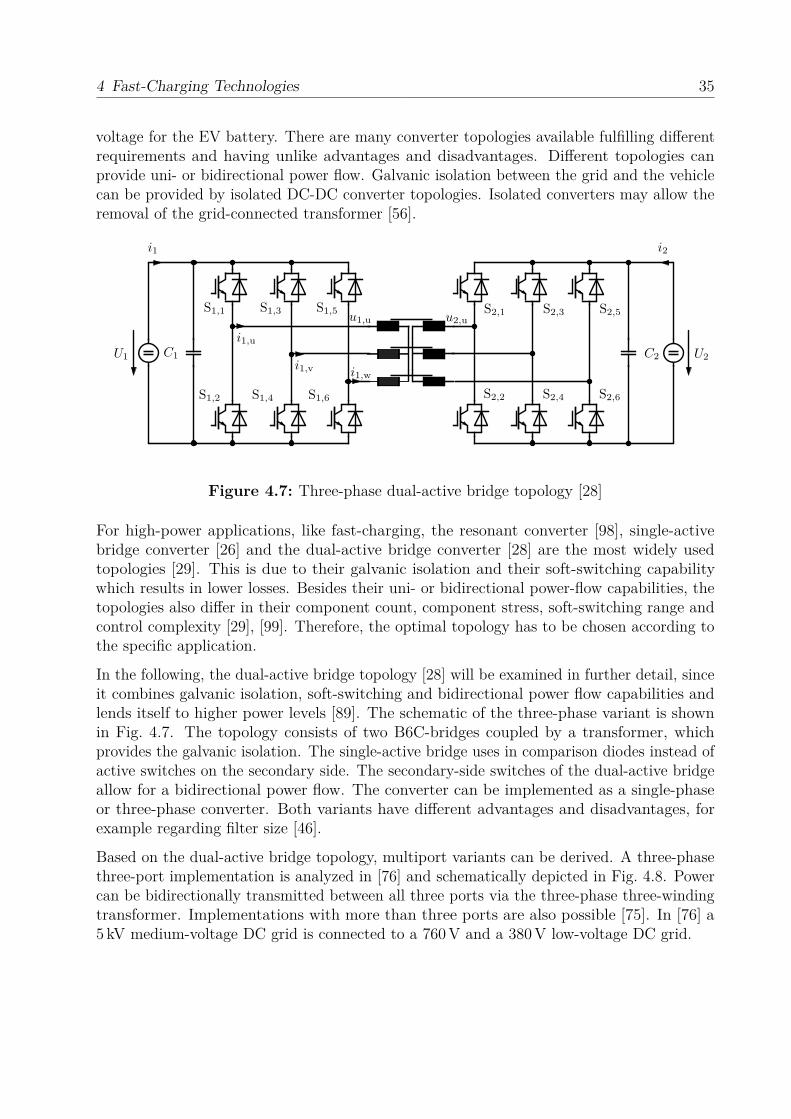
Figure 4.7: Three-phase dual-active bridge topology [28]
For high-power applications, like fast-charging, the resonant converter [98], single-activebridge converter [26] and the dual-active bridge converter [28] are the most widely usedtopologies [29]. This is due to their galvanic isolation and their soft-switching capabilitywhich results in lower losses. Besides their uni- or bidirectional power-flow capabilities, thetopologies also differ in their component count, component stress, soft-switching range andcontrol complexity [29], [99]. Therefore, the optimal topology has to be chosen according tothe specific application.
In the following, the dual-active bridge topology [28] will be examined in further detail, sinceit combines galvanic isolation, soft-switching and bidirectional power flow capabilities andlends itself to higher power levels [89]. The schematic of the three-phase variant is shownin Fig. 4.7. The topology consists of two B6C-bridges coupled by a transformer, whichprovides the galvanic isolation. The single-active bridge uses in comparison diodes instead ofactive switches on the secondary side. The secondary-side switches of the dual-active bridgeallow for a bidirectional power flow. The converter can be implemented as a single-phaseor three-phase converter. Both variants have different advantages and disadvantages, forexample regarding filter size [46].
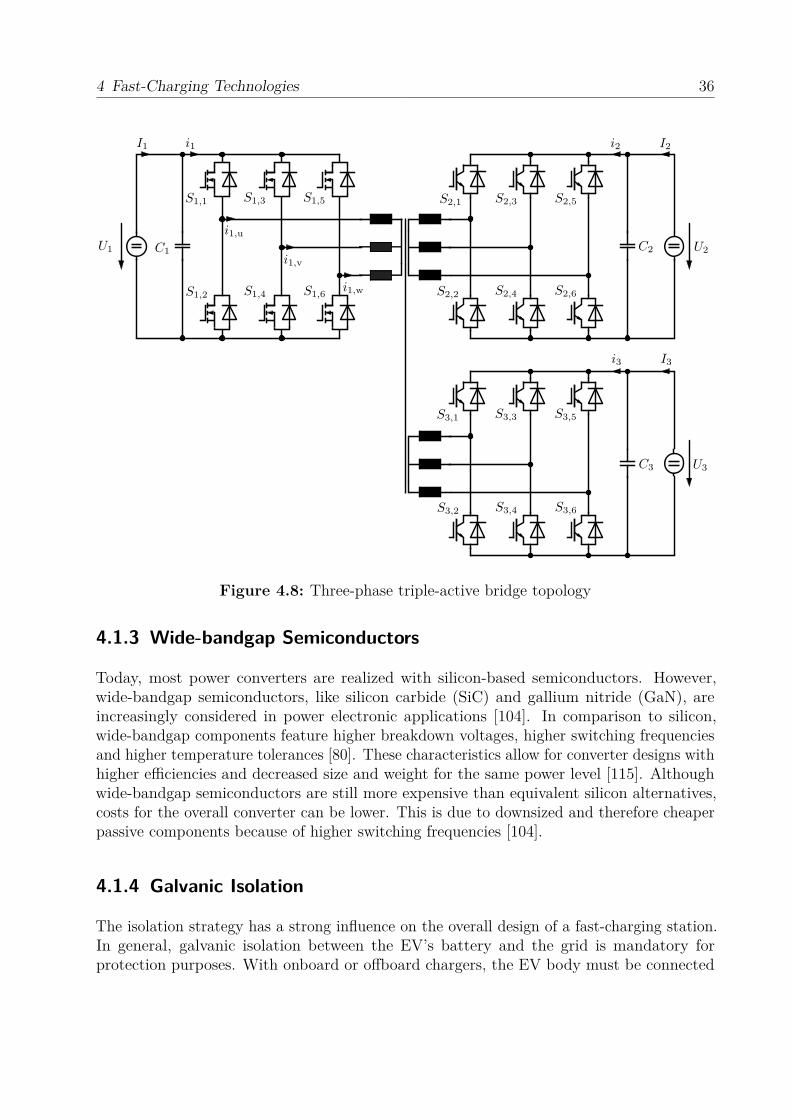
Based on the dual-active bridge topology, multiport variants can be derived. A three-phasethree-port implementation is analyzed in [76] and schematically depicted in Fig. 4.8. Powercan be bidirectionally transmitted between all three ports via the three-phase three-windingtransformer. Implementations with more than three ports are also possible [75]. In [76] a5 kV medium-voltage DC grid is connected to a 760 V and a 380 V low-voltage DC grid.
4 Fast-Charging Technologies 36
U1
U3
I3
U2
I2I1
C1
S1,1 S1,3 S1,5
S1,2 S1,4 S1,6
i1,u
i1,v
i1,w
S2,1 S2,3 S2,5
S2,2 S2,4 S2,6
C2
S3,1 S3,3 S3,5
S3,2 S3,4 S3,6
C3
i1 i2
i3
Figure 4.8: Three-phase triple-active bridge topology
4.1.3 Wide-bandgap Semiconductors
Today, most power converters are realized with silicon-based semiconductors. However,wide-bandgap semiconductors, like silicon carbide (SiC) and gallium nitride (GaN), areincreasingly considered in power electronic applications [104]. In comparison to silicon,wide-bandgap components feature higher breakdown voltages, higher switching frequenciesand higher temperature tolerances [80]. These characteristics allow for converter designs withhigher efficiencies and decreased size and weight for the same power level [115]. Althoughwide-bandgap semiconductors are still more expensive than equivalent silicon alternatives,costs for the overall converter can be lower. This is due to downsized and therefore cheaperpassive components because of higher switching frequencies [104].
4.1.4 Galvanic Isolation
The isolation strategy has a strong influence on the overall design of a fast-charging station.In general, galvanic isolation between the EV’s battery and the grid is mandatory forprotection purposes. With onboard or offboard chargers, the EV body must be connected
4 Fast-Charging Technologies 37
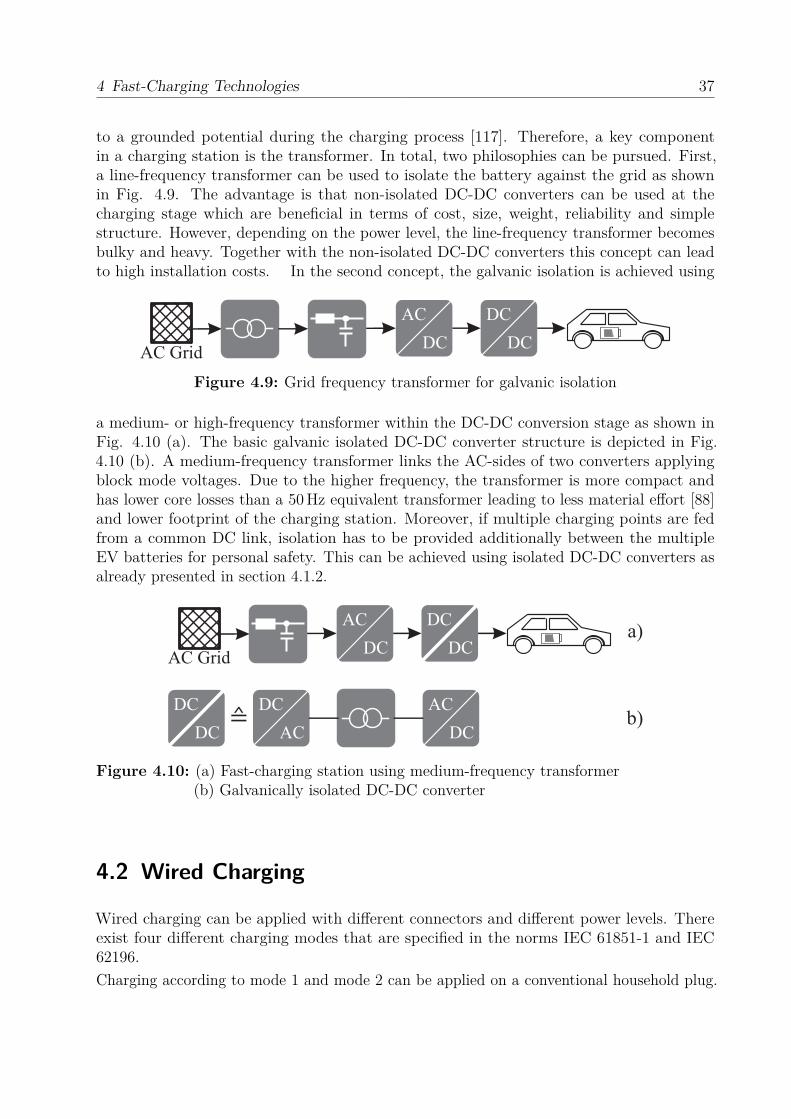
to a grounded potential during the charging process [117]. Therefore, a key componentin a charging station is the transformer. In total, two philosophies can be pursued. First,a line-frequency transformer can be used to isolate the battery against the grid as shownin Fig. 4.9. The advantage is that non-isolated DC-DC converters can be used at thecharging stage which are beneficial in terms of cost, size, weight, reliability and simplestructure. However, depending on the power level, the line-frequency transformer becomesbulky and heavy. Together with the non-isolated DC-DC converters this concept can leadto high installation costs. In the second concept, the galvanic isolation is achieved using
AC GridDC
AC
DC
DC
Figure 4.9: Grid frequency transformer for galvanic isolation
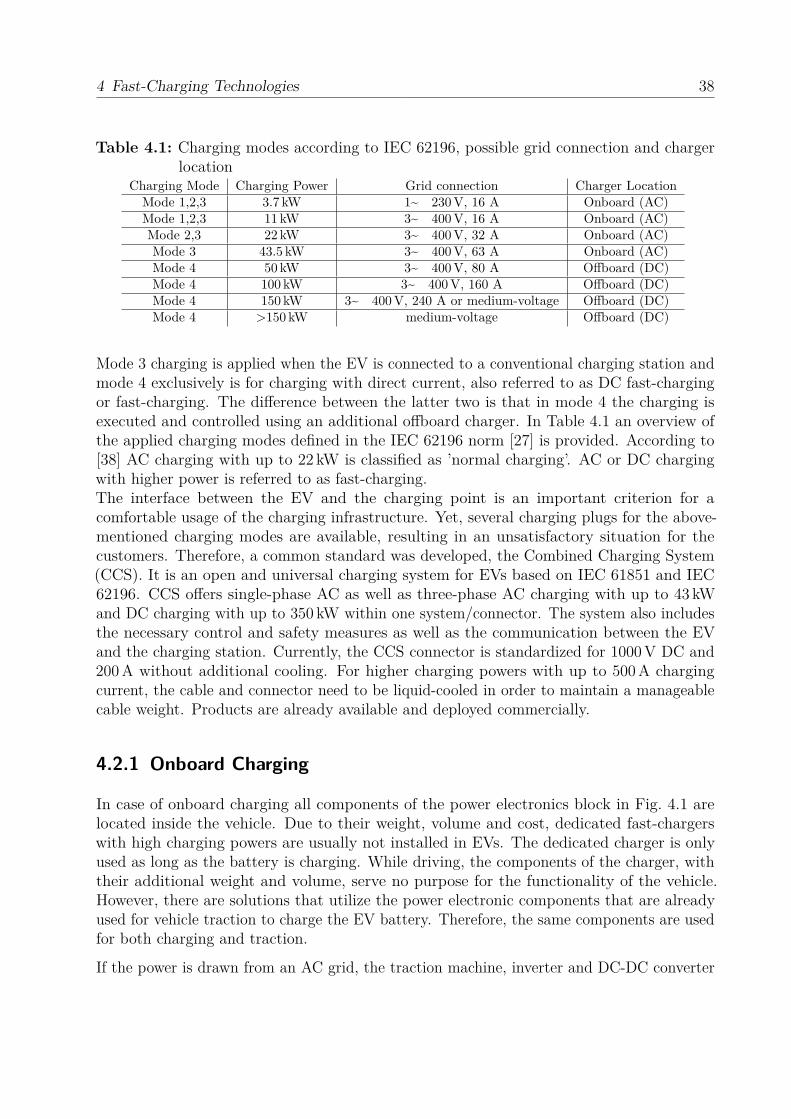
a medium- or high-frequency transformer within the DC-DC conversion stage as shown inFig. 4.10 (a). The basic galvanic isolated DC-DC converter structure is depicted in Fig.4.10 (b). A medium-frequency transformer links the AC-sides of two converters applyingblock mode voltages. Due to the higher frequency, the transformer is more compact andhas lower core losses than a 50 Hz equivalent transformer leading to less material effort [88]and lower footprint of the charging station. Moreover, if multiple charging points are fedfrom a common DC link, isolation has to be provided additionally between the multipleEV batteries for personal safety. This can be achieved using isolated DC-DC converters asalready presented in section 4.1.2.
AC GridDC
AC DC
DC
≙DC
DC AC
DC
DC
AC
a)
b)
Figure 4.10: (a) Fast-charging station using medium-frequency transformer(b) Galvanically isolated DC-DC converter
4.2 Wired Charging
Wired charging can be applied with different connectors and different power levels. Thereexist four different charging modes that are specified in the norms IEC 61851-1 and IEC62196.Charging according to mode 1 and mode 2 can be applied on a conventional household plug.
4 Fast-Charging Technologies 38
Table 4.1: Charging modes according to IEC 62196, possible grid connection and chargerlocation
Charging Mode Charging Power Grid connection Charger LocationMode 1,2,3 3.7 kW 1~ 230 V, 16 A Onboard (AC)Mode 1,2,3 11 kW 3~ 400 V, 16 A Onboard (AC)Mode 2,3 22 kW 3~ 400 V, 32 A Onboard (AC)Mode 3 43.5 kW 3~ 400 V, 63 A Onboard (AC)Mode 4 50 kW 3~ 400 V, 80 A Offboard (DC)Mode 4 100 kW 3~ 400 V, 160 A Offboard (DC)Mode 4 150 kW 3~ 400 V, 240 A or medium-voltage Offboard (DC)Mode 4 >150 kW medium-voltage Offboard (DC)
Mode 3 charging is applied when the EV is connected to a conventional charging station andmode 4 exclusively is for charging with direct current, also referred to as DC fast-chargingor fast-charging. The difference between the latter two is that in mode 4 the charging isexecuted and controlled using an additional offboard charger. In Table 4.1 an overview ofthe applied charging modes defined in the IEC 62196 norm [27] is provided. According to[38] AC charging with up to 22 kW is classified as ’normal charging’. AC or DC chargingwith higher power is referred to as fast-charging.The interface between the EV and the charging point is an important criterion for acomfortable usage of the charging infrastructure. Yet, several charging plugs for the above-mentioned charging modes are available, resulting in an unsatisfactory situation for thecustomers. Therefore, a common standard was developed, the Combined Charging System(CCS). It is an open and universal charging system for EVs based on IEC 61851 and IEC62196. CCS offers single-phase AC as well as three-phase AC charging with up to 43 kWand DC charging with up to 350 kW within one system/connector. The system also includesthe necessary control and safety measures as well as the communication between the EVand the charging station. Currently, the CCS connector is standardized for 1000 V DC and200 A without additional cooling. For higher charging powers with up to 500 A chargingcurrent, the cable and connector need to be liquid-cooled in order to maintain a manageablecable weight. Products are already available and deployed commercially.
4.2.1 Onboard Charging
In case of onboard charging all components of the power electronics block in Fig. 4.1 arelocated inside the vehicle. Due to their weight, volume and cost, dedicated fast-chargerswith high charging powers are usually not installed in EVs. The dedicated charger is onlyused as long as the battery is charging. While driving, the components of the charger, withtheir additional weight and volume, serve no purpose for the functionality of the vehicle.However, there are solutions that utilize the power electronic components that are alreadyused for vehicle traction to charge the EV battery. Therefore, the same components are usedfor both charging and traction.
If the power is drawn from an AC grid, the traction machine, inverter and DC-DC converter
4 Fast-Charging Technologies 39
DC
AC
DC
DC
AC Grid
vehicle drive train
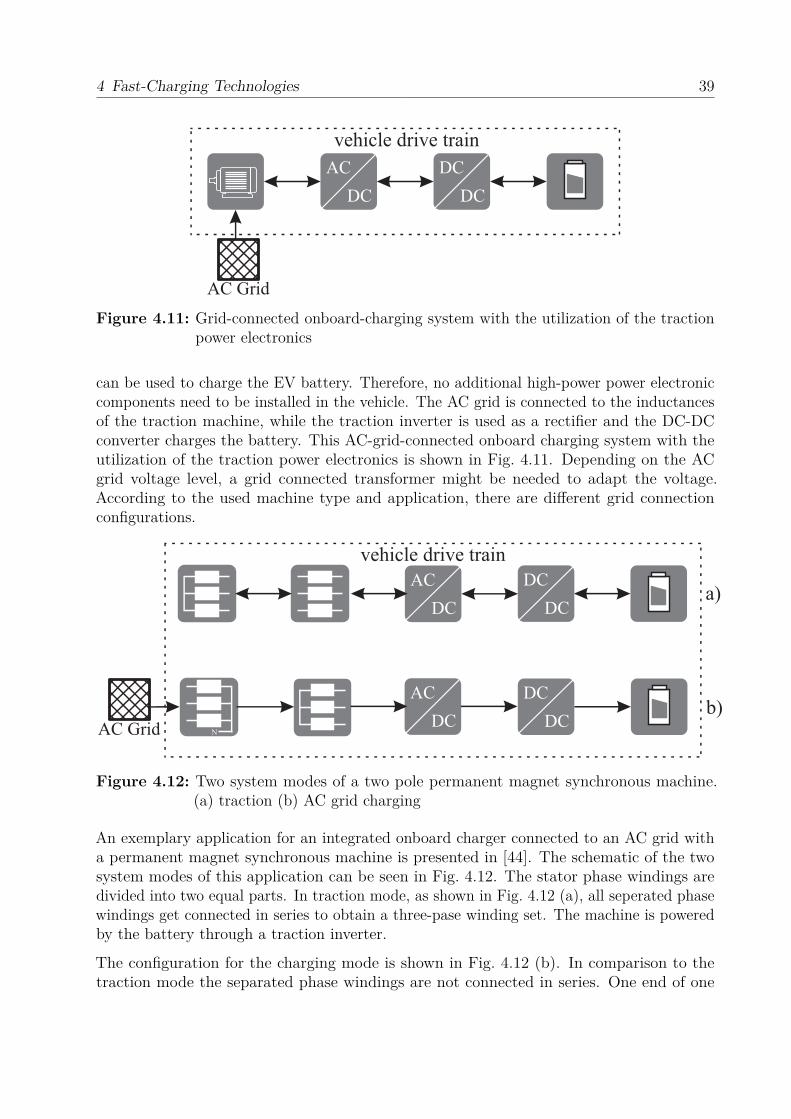
Figure 4.11: Grid-connected onboard-charging system with the utilization of the tractionpower electronics
can be used to charge the EV battery. Therefore, no additional high-power power electroniccomponents need to be installed in the vehicle. The AC grid is connected to the inductancesof the traction machine, while the traction inverter is used as a rectifier and the DC-DCconverter charges the battery. This AC-grid-connected onboard charging system with theutilization of the traction power electronics is shown in Fig. 4.11. Depending on the ACgrid voltage level, a grid connected transformer might be needed to adapt the voltage.According to the used machine type and application, there are different grid connectionconfigurations.
DC
AC
NAC Grid
a)
b)DC
AC
DC
DC
DC
DC
vehicle drive train
Figure 4.12: Two system modes of a two pole permanent magnet synchronous machine.(a) traction (b) AC grid charging
An exemplary application for an integrated onboard charger connected to an AC grid witha permanent magnet synchronous machine is presented in [44]. The schematic of the twosystem modes of this application can be seen in Fig. 4.12. The stator phase windings aredivided into two equal parts. In traction mode, as shown in Fig. 4.12 (a), all seperated phasewindings get connected in series to obtain a three-pase winding set. The machine is poweredby the battery through a traction inverter.
The configuration for the charging mode is shown in Fig. 4.12 (b). In comparison to thetraction mode the separated phase windings are not connected in series. One end of one
4 Fast-Charging Technologies 40
winding set gets connected to the grid while the remaining winding set ends get connectedin triangular configuration. The machine rotates with synchronous grid speed wherebyvoltages get induced in the inverter-side windings. During charging, the transmission systemis separated from the AC machine with a clutch. Other solutions prevent the machine fromrotating by locking the rotor in place.
The power rating of an integrated onboard charger for AC grids is mainly limited by thethermal limitation of the machine [44]. In case of the presented charger with the split-windingAC motor, around half the nominal machine power can be transferred. The fast-chargingcapability of integrated onboard chargers are therefore limited and application-dependent.
DC
AC
DC
DC
DC Grid
vehicle drive train
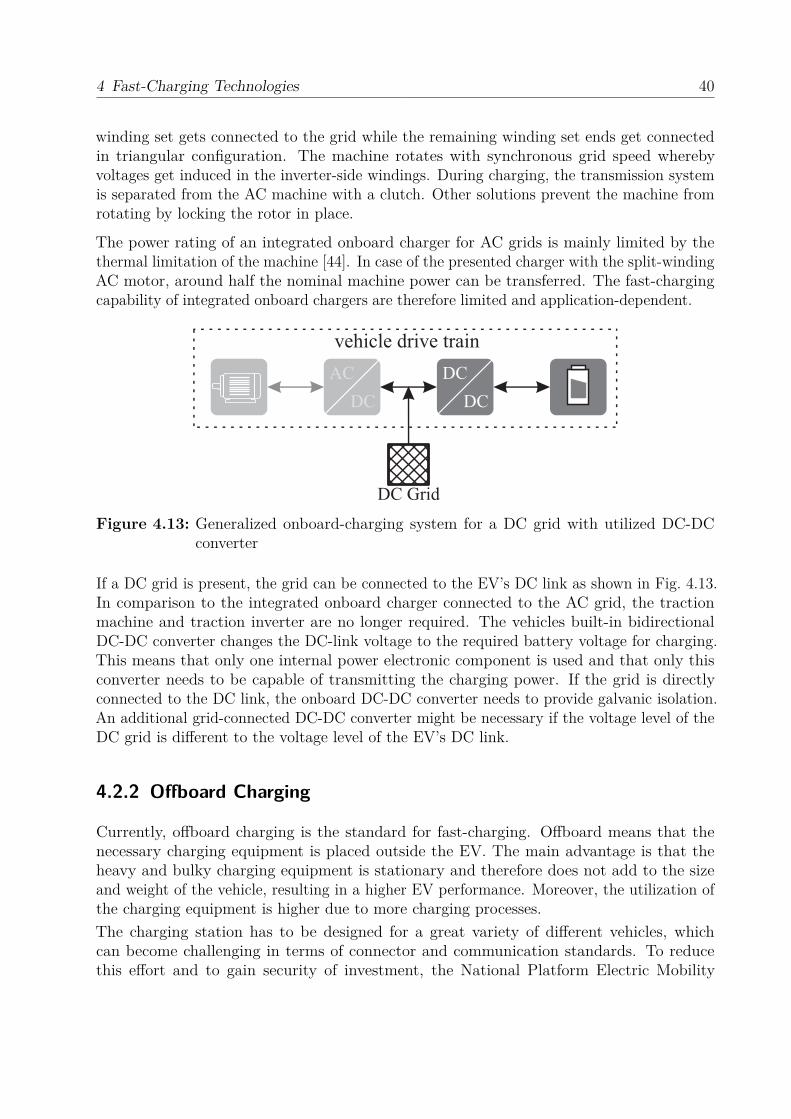
Figure 4.13: Generalized onboard-charging system for a DC grid with utilized DC-DCconverter
If a DC grid is present, the grid can be connected to the EV’s DC link as shown in Fig. 4.13.In comparison to the integrated onboard charger connected to the AC grid, the tractionmachine and traction inverter are no longer required. The vehicles built-in bidirectionalDC-DC converter changes the DC-link voltage to the required battery voltage for charging.This means that only one internal power electronic component is used and that only thisconverter needs to be capable of transmitting the charging power. If the grid is directlyconnected to the DC link, the onboard DC-DC converter needs to provide galvanic isolation.An additional grid-connected DC-DC converter might be necessary if the voltage level of theDC grid is different to the voltage level of the EV’s DC link.
4.2.2 Offboard Charging
Currently, offboard charging is the standard for fast-charging. Offboard means that thenecessary charging equipment is placed outside the EV. The main advantage is that theheavy and bulky charging equipment is stationary and therefore does not add to the sizeand weight of the vehicle, resulting in a higher EV performance. Moreover, the utilization ofthe charging equipment is higher due to more charging processes.The charging station has to be designed for a great variety of different vehicles, whichcan become challenging in terms of connector and communication standards. To reducethis effort and to gain security of investment, the National Platform Electric Mobility
4 Fast-Charging Technologies 41
recommends the application of the developed and standardized Combined Charging System(See: 4.2) extensively. Furthermore, the charger has to be designed for a large chargingvoltage variation to cope with different kind of EV battery configurations, since the chargingunit is connected to the battery directly. As fast-charging represents a larger power rangebetween 22 kW and 400 kW perspectively, a bidirectional power flow capability of the fast-charging station may not be feasible for every power level. Considering a charging power of22 kW at home, a vehicle-to-grid operation may be advantageous. While the predominantpurpose of fast-charging at highways is the range extension, discharging the battery withvery high power does not seem to be expedient. However, the business models for the usageof bidirectional power flows have to be investigated and may be advantageous in specificapplications, since high-power offboard chargers are intensive in investment costs. Therefore,a high utilization is needed to achieve cost efficiency. Also the environmental impact of thefast-charging station should be noted. Compared to integrated EV chargers the size andweight of fast-charging stations is usually higher, since space requirements are less demanding.If additional transformers are needed, e.g. for medium-voltage grid connection the spacerequirement is increased. For high charging power a water-cooling system is needed, sinceair cooling is no longer sufficient. Also the plugs have to be water-cooled to cope with veryhigh charging currents. The additional cooling effort is, therefore the main cause for noiseradiation.
4.2.2.1 Modularity
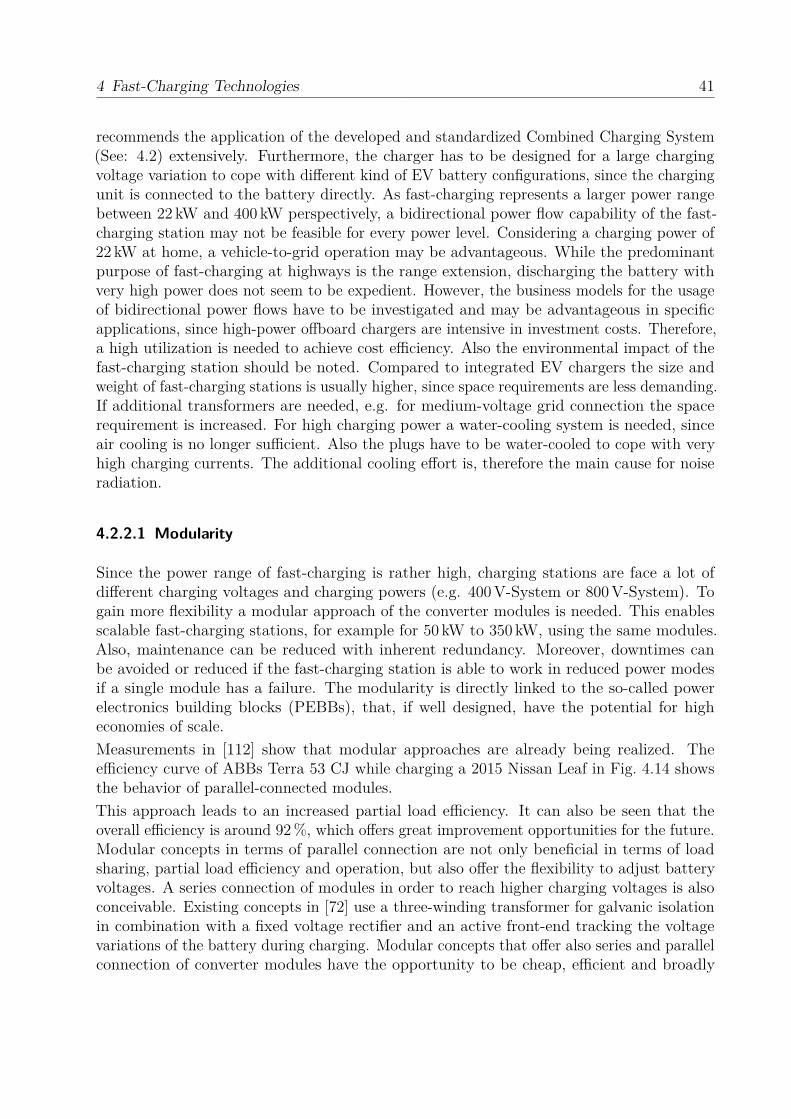
Since the power range of fast-charging is rather high, charging stations are face a lot ofdifferent charging voltages and charging powers (e.g. 400 V-System or 800 V-System). Togain more flexibility a modular approach of the converter modules is needed. This enablesscalable fast-charging stations, for example for 50 kW to 350 kW, using the same modules.Also, maintenance can be reduced with inherent redundancy. Moreover, downtimes canbe avoided or reduced if the fast-charging station is able to work in reduced power modesif a single module has a failure. The modularity is directly linked to the so-called powerelectronics building blocks (PEBBs), that, if well designed, have the potential for higheconomies of scale.Measurements in [112] show that modular approaches are already being realized. Theefficiency curve of ABBs Terra 53 CJ while charging a 2015 Nissan Leaf in Fig. 4.14 showsthe behavior of parallel-connected modules.This approach leads to an increased partial load efficiency. It can also be seen that theoverall efficiency is around 92 %, which offers great improvement opportunities for the future.Modular concepts in terms of parallel connection are not only beneficial in terms of loadsharing, partial load efficiency and operation, but also offer the flexibility to adjust batteryvoltages. A series connection of modules in order to reach higher charging voltages is alsoconceivable. Existing concepts in [72] use a three-winding transformer for galvanic isolationin combination with a fixed voltage rectifier and an active front-end tracking the voltagevariations of the battery during charging. Modular concepts that offer also series and parallelconnection of converter modules have the opportunity to be cheap, efficient and broadly
4 Fast-Charging Technologies 42
applicable and should therefore be investigated more deeply in the future.
Figure 4.14: System efficiency measurements of ABB Terra 53 CJ [112]
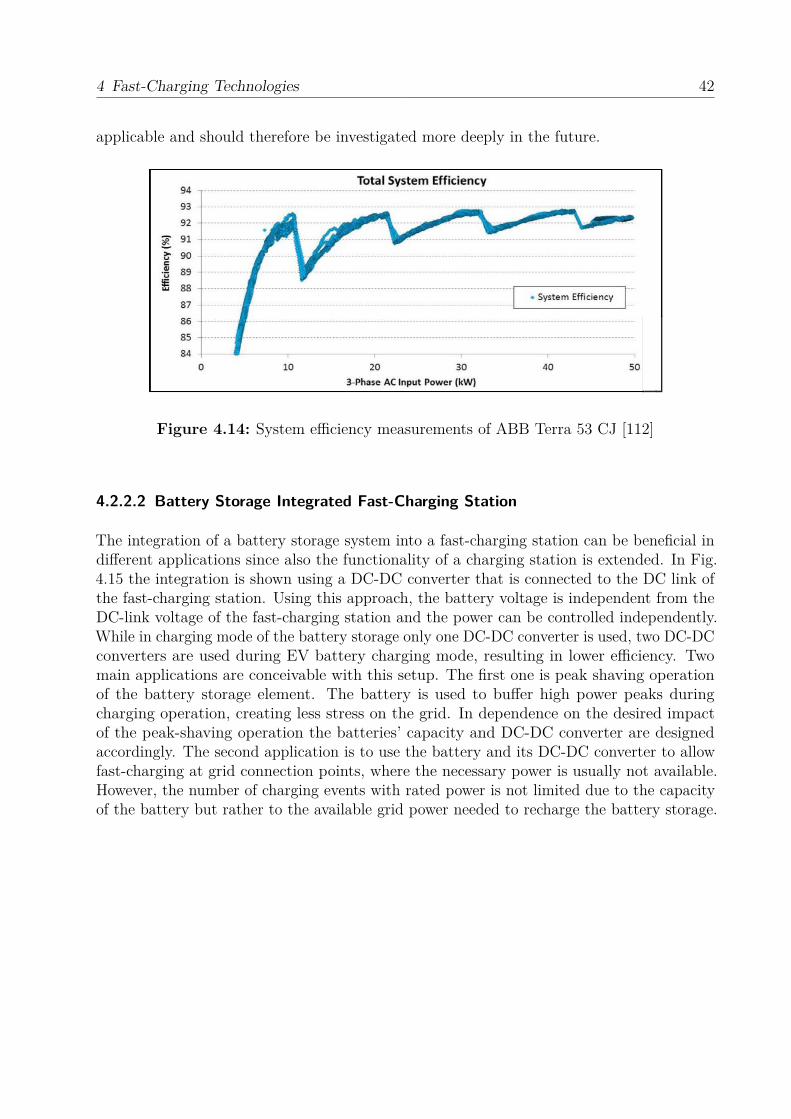
4.2.2.2 Battery Storage Integrated Fast-Charging Station
The integration of a battery storage system into a fast-charging station can be beneficial indifferent applications since also the functionality of a charging station is extended. In Fig.4.15 the integration is shown using a DC-DC converter that is connected to the DC link ofthe fast-charging station. Using this approach, the battery voltage is independent from theDC-link voltage of the fast-charging station and the power can be controlled independently.While in charging mode of the battery storage only one DC-DC converter is used, two DC-DCconverters are used during EV battery charging mode, resulting in lower efficiency. Twomain applications are conceivable with this setup. The first one is peak shaving operationof the battery storage element. The battery is used to buffer high power peaks duringcharging operation, creating less stress on the grid. In dependence on the desired impactof the peak-shaving operation the batteries’ capacity and DC-DC converter are designedaccordingly. The second application is to use the battery and its DC-DC converter to allowfast-charging at grid connection points, where the necessary power is usually not available.However, the number of charging events with rated power is not limited due to the capacityof the battery but rather to the available grid power needed to recharge the battery storage.
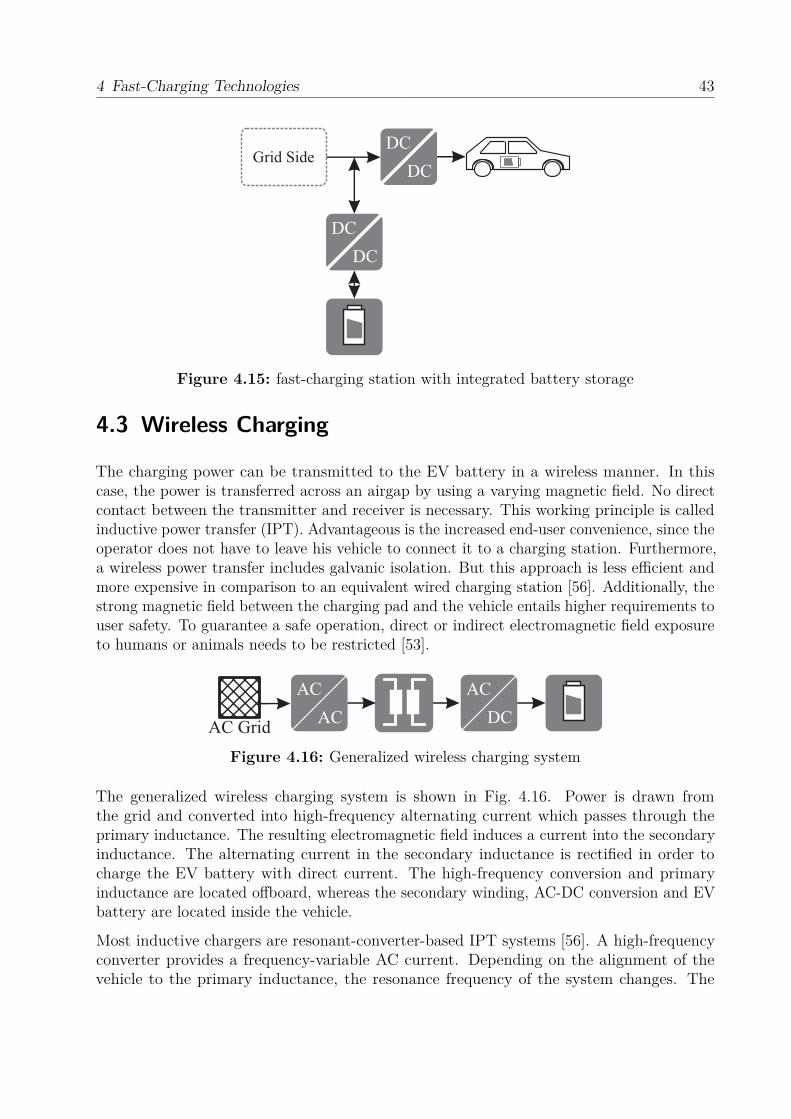
4 Fast-Charging Technologies 43
DC
DC
DC
DC
Grid Side
Figure 4.15: fast-charging station with integrated battery storage
4.3 Wireless Charging
The charging power can be transmitted to the EV battery in a wireless manner. In thiscase, the power is transferred across an airgap by using a varying magnetic field. No directcontact between the transmitter and receiver is necessary. This working principle is calledinductive power transfer (IPT). Advantageous is the increased end-user convenience, since theoperator does not have to leave his vehicle to connect it to a charging station. Furthermore,a wireless power transfer includes galvanic isolation. But this approach is less efficient andmore expensive in comparison to an equivalent wired charging station [56]. Additionally, thestrong magnetic field between the charging pad and the vehicle entails higher requirements touser safety. To guarantee a safe operation, direct or indirect electromagnetic field exposureto humans or animals needs to be restricted [53].
AC GridAC
AC
DC
AC
Figure 4.16: Generalized wireless charging system
The generalized wireless charging system is shown in Fig. 4.16. Power is drawn fromthe grid and converted into high-frequency alternating current which passes through theprimary inductance. The resulting electromagnetic field induces a current into the secondaryinductance. The alternating current in the secondary inductance is rectified in order tocharge the EV battery with direct current. The high-frequency conversion and primaryinductance are located offboard, whereas the secondary winding, AC-DC conversion and EVbattery are located inside the vehicle.
Most inductive chargers are resonant-converter-based IPT systems [56]. A high-frequencyconverter provides a frequency-variable AC current. Depending on the alignment of thevehicle to the primary inductance, the resonance frequency of the system changes. The
4 Fast-Charging Technologies 44
operating frequency has to be adapted to the resonance frequency in order to maximizethe power transfer. This is especially necessary in an on-route situation where vehicles arecharged while driving. Due to high speeds and lateral misalignment the vehicle alignmentchanges quickly.
4.3.1 Stationary Charging
The stationary application of wireless charging is similar to the aforementioned wired chargingsystems. Users need to park their electric vehicles in specific charging spots with a compatiblewireless charging system. Unlike at wired charging stations, users do not necessarily need toleave their vehicles to start the charging process. The positioning of the vehicle in relation tothe charging station might influence the efficiency though. The coupling is dependent on theoverlapping area of the primary coil of the station and the secondary coil of the vehicle.
Depending on the application, the transferable power varies between 0.5 W and 50 kW withairgaps of 1-150 mm [7]. Fast-charging, as defined in chapter 2, is therefore possible withwireless charging stations. As an example, a 30 kW IPT charging station with a maximumefficiency of 92 % is presented in [68].
4.3.2 Road-Embedded Charging
Road-embedded inductive charging allows EVs to be charged while moving. The primary coilis embedded into the pavement, while the secondary coil is located inside the vehicle. Road-embedded inductive charging could be an alternative to fast-charging stations. Furthermore,battery sizes can be reduced, since the battery can be charged continuously.
Besides the advantages, there are several disadvantages or rather challenges of this technology.There are high acquisition, installation and maintenance costs, since primary transducershave to be installed in long stretches of roadbed. The airgap between pavement and vehicleunderbody can be large which worsens coupling. Lateral misalignment places higher demandson the transducers to capture vertical and horizontal components of the magnetic field [36].In general, the efficiency of on-route inductive charging is significantly lower and costs arehigher than for stationary equivalents.
5 Battery Technology
Nearly all battery systems for EVs are based on lithium technology. In many cells a compoundmaterial of nickel, manganese and cobalt (NMC) is used. How are batteries involved intothe charging process? The battery has to store the electro-chemical energy and supply thisenergy later on to the EV’s drive train.
What does fast-charging mean for the battery? First of all, fast-charging means high chargingpower, the demarcation of the characteristics is found in chapter 2. Recent developmentsshow that the number of infrastructure installations with high charging powers of up to400 kW is increasing. Nowadays there are very few cars in Germany that can receive thosehigh powers. And in the close future there will be only few cars that really need a fullrecharge in few minutes. But from the view of the car owner, it will be the relevant aspectfor the decision to buy an electric car or not, that a very fast recharge is possible. Fromthe manufacturer’s view it is mor likely to sell a car with a wide band of options where tocharge and how fast, at home, at supermarkets, at work and as well at highways.
For EV battery systems there are more than one question to be answered: what effect doesfast-charging have on EV battery performance and lifetime? Is the design of the cell and thepack adequate? Is the lifetime of the pack affected when high charging power is applied?There is the need to analyse more detailed questions. Therefore, this chapter is arrangedaround the following questions:
1. How long does a charging process take? What battery sizes are we talking about? Anoverview of battery sizes and charging rates in recent EV is given and their impacts oncharging duration are discussed. See chapter 5.1.
2. Do we need battery cells with increased power rating? Or do we need battery packswith increased power rating? A short introduction into design questions are given. Seechapter 5.2.
3. Thermal management is challenging, not only when the aforementioned aspects of celldesign and pack design are being accounted for. Thermal management could influencethe impact of fast-charging on battery aging by decreasing battery temperature. Weshow the main aging mechanisms and their impact on battery capacity losses. Seechapter 5.3.
4. A short overview of advantages and disadvantages of battery storage systems used forlocal grid support is given. See chapter 6.4.3.
45
5 Battery Technology 46
5.1 EV Charging Characteristics
Charging rates for fast-charging are referring to limitations of the electric infrastructure andare always described by its power level. The charging power level is going to be referred to asPCharge. But since on the battery level the differentiation is more demanding, it is especiallynecessary to look at charging current rates that are applied to the cells.
The duration of charging is determined by the charging power and the energy amount to berecharged, the available energy of the battery pack in most EVs is less than the installedamount. That’s because cell manufacturers slightly decrease the operating window of cellvoltage in order to avoid high voltage levels that could lead to accelerated aging, but thistopic is going to be addressed in chapter 5.3.
A list of currently available EVs and information about batteries is summed up and shownin Table 3.1. For those EV the available energy is going to be addressed by EBat. Thebattery systems have a nominal pack voltage playing a role during charging that is going tobe addressed by UBat. The battery pack consists of a total number of cells ncells, containingthe number of nseries cells that is connected in series. Battery cell capacity is addressed byQCell.
Before the charging process starts with applying the charging current, both communicationunits (EV and EVSE side) regulate the maximum charging power for the following chargingprocess. It is then set to the highest common level which then leads to the fastest possiblecharging process with PCharge. The charging current IBat,SOC inside the battery pack isderived from the charging power and battery pack voltage and is calculated by the followingequation:
IBat,SOC = PCharge
UBat,SOC. (5.1)
The battery pack voltage UBat,SOC changes with the battery state of charge (SOC) becausethe current is decreasing with higher SOC during a charging process with constant power.For simplicity, the current rates in the following chapter are calculated with the nominalbattery pack voltage UBat. The maximal charging current rate can vary in the range of 30%from nominal values.
In the next step the current during charging is compared with the information of cell rating.The current on cell level ICell depends on the number of parallel connections of cells nparallel.
ICell = IBat
nparallel(5.2)
Cell rating is mostly given by its one hour constant charging current (1C) for a cell with thecapacity QCell and is either calculated using current and capacity of the cell or adequatelyusing power and energy of the battery pack:
Crate = ICell · 1 hQCell
= PCharge · 1 hEBat
. (5.3)
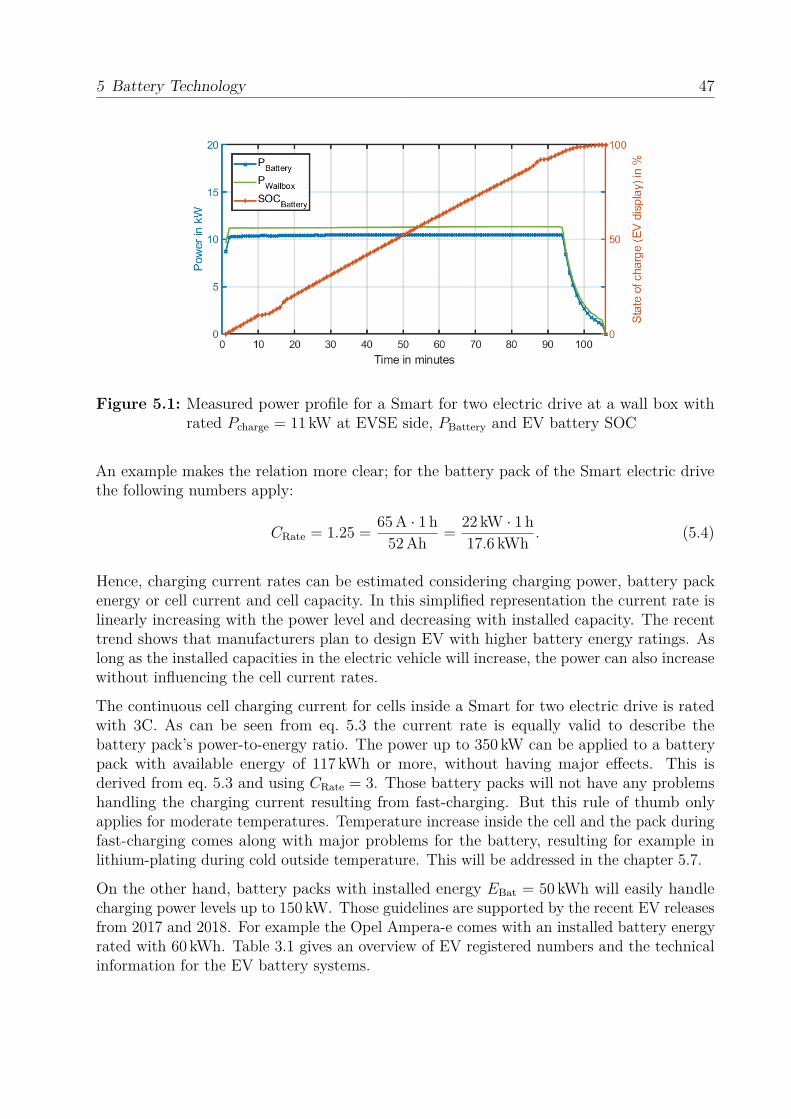
5 Battery Technology 47
Figure 5.1: Measured power profile for a Smart for two electric drive at a wall box withrated Pcharge = 11 kW at EVSE side, PBattery and EV battery SOC
An example makes the relation more clear; for the battery pack of the Smart electric drivethe following numbers apply:
CRate = 1.25 = 65 A · 1 h52 Ah = 22 kW · 1 h
17.6 kWh . (5.4)
Hence, charging current rates can be estimated considering charging power, battery packenergy or cell current and cell capacity. In this simplified representation the current rate islinearly increasing with the power level and decreasing with installed capacity. The recenttrend shows that manufacturers plan to design EV with higher battery energy ratings. Aslong as the installed capacities in the electric vehicle will increase, the power can also increasewithout influencing the cell current rates.
The continuous cell charging current for cells inside a Smart for two electric drive is ratedwith 3C. As can be seen from eq. 5.3 the current rate is equally valid to describe thebattery pack’s power-to-energy ratio. The power up to 350 kW can be applied to a batterypack with available energy of 117 kWh or more, without having major effects. This isderived from eq. 5.3 and using CRate = 3. Those battery packs will not have any problemshandling the charging current resulting from fast-charging. But this rule of thumb onlyapplies for moderate temperatures. Temperature increase inside the cell and the pack duringfast-charging comes along with major problems for the battery, resulting for example inlithium-plating during cold outside temperature. This will be addressed in the chapter 5.7.
On the other hand, battery packs with installed energy EBat = 50 kWh will easily handlecharging power levels up to 150 kW. Those guidelines are supported by the recent EV releasesfrom 2017 and 2018. For example the Opel Ampera-e comes with an installed battery energyrated with 60 kWh. Table 3.1 gives an overview of EV registered numbers and the technicalinformation for the EV battery systems.
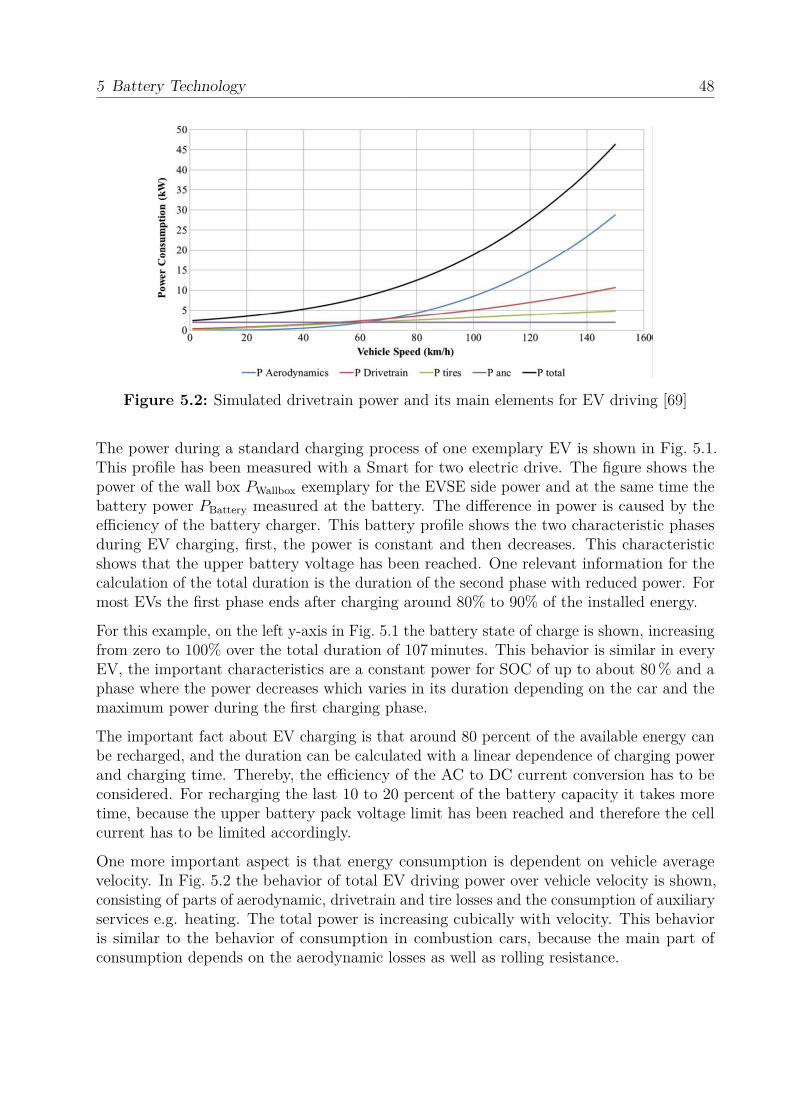
5 Battery Technology 48
Figure 5.2: Simulated drivetrain power and its main elements for EV driving [69]
The power during a standard charging process of one exemplary EV is shown in Fig. 5.1.This profile has been measured with a Smart for two electric drive. The figure shows thepower of the wall box PWallbox exemplary for the EVSE side power and at the same time thebattery power PBattery measured at the battery. The difference in power is caused by theefficiency of the battery charger. This battery profile shows the two characteristic phasesduring EV charging, first, the power is constant and then decreases. This characteristicshows that the upper battery voltage has been reached. One relevant information for thecalculation of the total duration is the duration of the second phase with reduced power. Formost EVs the first phase ends after charging around 80% to 90% of the installed energy.
For this example, on the left y-axis in Fig. 5.1 the battery state of charge is shown, increasingfrom zero to 100% over the total duration of 107 minutes. This behavior is similar in everyEV, the important characteristics are a constant power for SOC of up to about 80 % and aphase where the power decreases which varies in its duration depending on the car and themaximum power during the first charging phase.
The important fact about EV charging is that around 80 percent of the available energy canbe recharged, and the duration can be calculated with a linear dependence of charging powerand charging time. Thereby, the efficiency of the AC to DC current conversion has to beconsidered. For recharging the last 10 to 20 percent of the battery capacity it takes moretime, because the upper battery pack voltage limit has been reached and therefore the cellcurrent has to be limited accordingly.
One more important aspect is that energy consumption is dependent on vehicle averagevelocity. In Fig. 5.2 the behavior of total EV driving power over vehicle velocity is shown,consisting of parts of aerodynamic, drivetrain and tire losses and the consumption of auxiliaryservices e.g. heating. The total power is increasing cubically with velocity. This behavioris similar to the behavior of consumption in combustion cars, because the main part ofconsumption depends on the aerodynamic losses as well as rolling resistance.
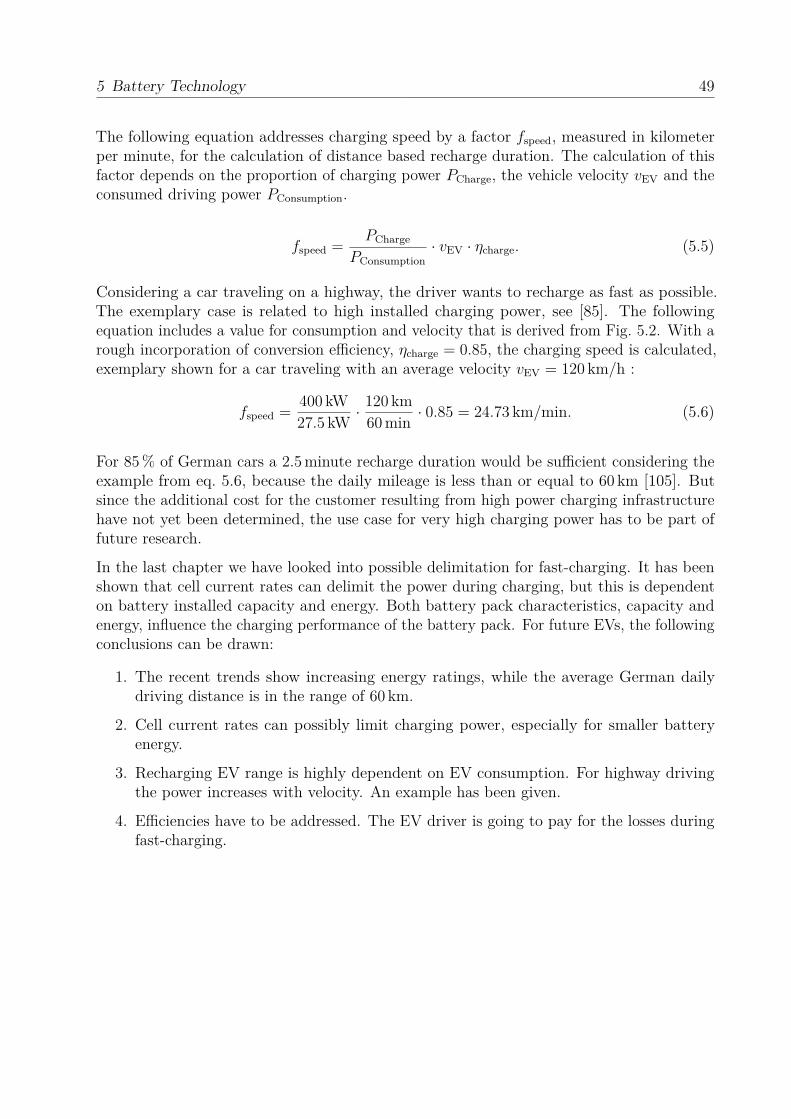
5 Battery Technology 49
The following equation addresses charging speed by a factor fspeed, measured in kilometerper minute, for the calculation of distance based recharge duration. The calculation of thisfactor depends on the proportion of charging power PCharge, the vehicle velocity vEV and theconsumed driving power PConsumption.
fspeed = PCharge
PConsumption· vEV · ηcharge. (5.5)
Considering a car traveling on a highway, the driver wants to recharge as fast as possible.The exemplary case is related to high installed charging power, see [85]. The followingequation includes a value for consumption and velocity that is derived from Fig. 5.2. With arough incorporation of conversion efficiency, ηcharge = 0.85, the charging speed is calculated,exemplary shown for a car traveling with an average velocity vEV = 120 km/h :
fspeed = 400 kW27.5 kW · 120 km
60 min · 0.85 = 24.73 km/min. (5.6)
For 85 % of German cars a 2.5 minute recharge duration would be sufficient considering theexample from eq. 5.6, because the daily mileage is less than or equal to 60 km [105]. Butsince the additional cost for the customer resulting from high power charging infrastructurehave not yet been determined, the use case for very high charging power has to be part offuture research.
In the last chapter we have looked into possible delimitation for fast-charging. It has beenshown that cell current rates can delimit the power during charging, but this is dependenton battery installed capacity and energy. Both battery pack characteristics, capacity andenergy, influence the charging performance of the battery pack. For future EVs, the followingconclusions can be drawn:
1. The recent trends show increasing energy ratings, while the average German dailydriving distance is in the range of 60 km.
2. Cell current rates can possibly limit charging power, especially for smaller batteryenergy.
3. Recharging EV range is highly dependent on EV consumption. For highway drivingthe power increases with velocity. An example has been given.
4. Efficiencies have to be addressed. The EV driver is going to pay for the losses duringfast-charging.
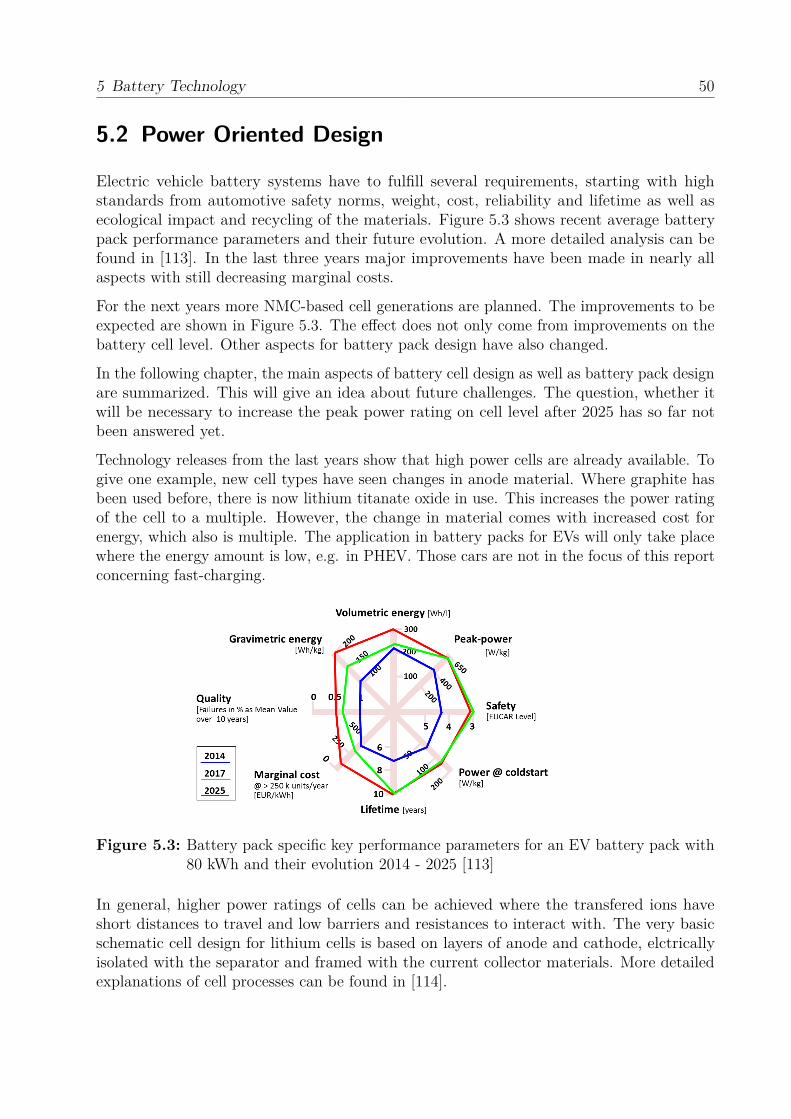
5 Battery Technology 50
5.2 Power Oriented Design
Electric vehicle battery systems have to fulfill several requirements, starting with highstandards from automotive safety norms, weight, cost, reliability and lifetime as well asecological impact and recycling of the materials. Figure 5.3 shows recent average batterypack performance parameters and their future evolution. A more detailed analysis can befound in [113]. In the last three years major improvements have been made in nearly allaspects with still decreasing marginal costs.
For the next years more NMC-based cell generations are planned. The improvements to beexpected are shown in Figure 5.3. The effect does not only come from improvements on thebattery cell level. Other aspects for battery pack design have also changed.
In the following chapter, the main aspects of battery cell design as well as battery pack designare summarized. This will give an idea about future challenges. The question, whether itwill be necessary to increase the peak power rating on cell level after 2025 has so far notbeen answered yet.
Technology releases from the last years show that high power cells are already available. Togive one example, new cell types have seen changes in anode material. Where graphite hasbeen used before, there is now lithium titanate oxide in use. This increases the power ratingof the cell to a multiple. However, the change in material comes with increased cost forenergy, which also is multiple. The application in battery packs for EVs will only take placewhere the energy amount is low, e.g. in PHEV. Those cars are not in the focus of this reportconcerning fast-charging.
Figure 5.3: Battery pack specific key performance parameters for an EV battery pack with80 kWh and their evolution 2014 - 2025 [113]
In general, higher power ratings of cells can be achieved where the transfered ions haveshort distances to travel and low barriers and resistances to interact with. The very basicschematic cell design for lithium cells is based on layers of anode and cathode, elctricallyisolated with the separator and framed with the current collector materials. More detailedexplanations of cell processes can be found in [114].
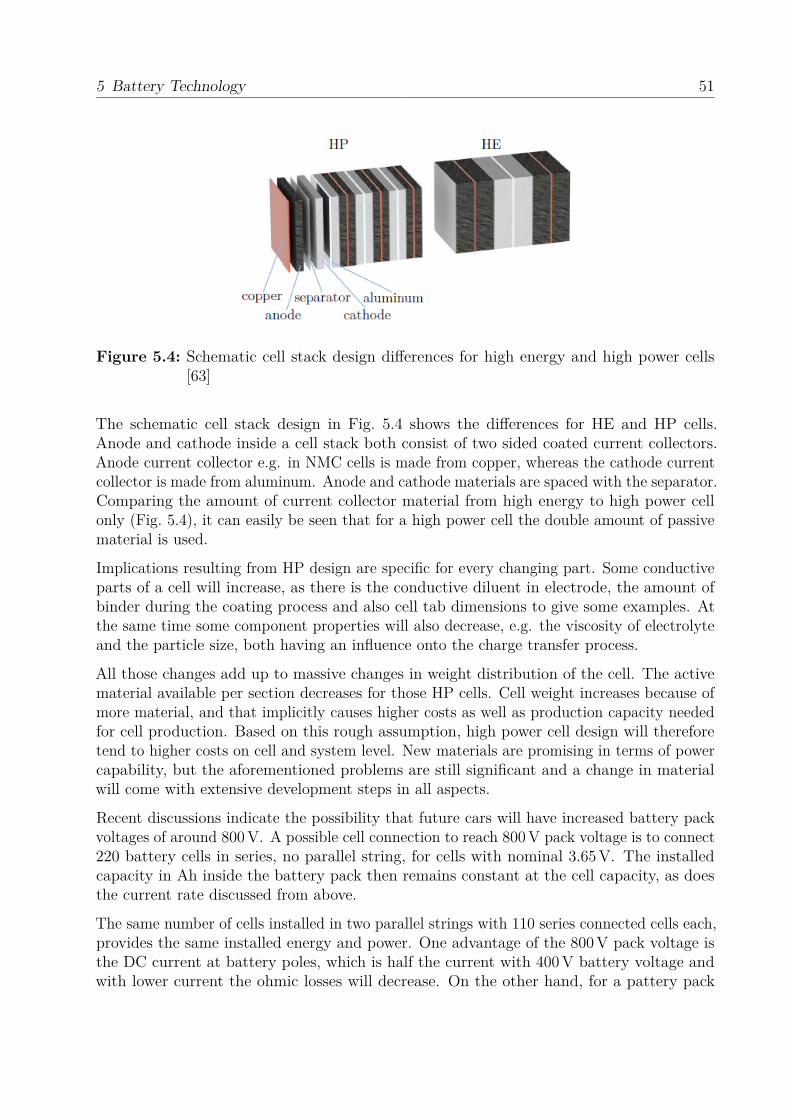
5 Battery Technology 51
Figure 5.4: Schematic cell stack design differences for high energy and high power cells[63]
The schematic cell stack design in Fig. 5.4 shows the differences for HE and HP cells.Anode and cathode inside a cell stack both consist of two sided coated current collectors.Anode current collector e.g. in NMC cells is made from copper, whereas the cathode currentcollector is made from aluminum. Anode and cathode materials are spaced with the separator.Comparing the amount of current collector material from high energy to high power cellonly (Fig. 5.4), it can easily be seen that for a high power cell the double amount of passivematerial is used.
Implications resulting from HP design are specific for every changing part. Some conductiveparts of a cell will increase, as there is the conductive diluent in electrode, the amount ofbinder during the coating process and also cell tab dimensions to give some examples. Atthe same time some component properties will also decrease, e.g. the viscosity of electrolyteand the particle size, both having an influence onto the charge transfer process.
All those changes add up to massive changes in weight distribution of the cell. The activematerial available per section decreases for those HP cells. Cell weight increases because ofmore material, and that implicitly causes higher costs as well as production capacity neededfor cell production. Based on this rough assumption, high power cell design will thereforetend to higher costs on cell and system level. New materials are promising in terms of powercapability, but the aforementioned problems are still significant and a change in materialwill come with extensive development steps in all aspects.
Recent discussions indicate the possibility that future cars will have increased battery packvoltages of around 800 V. A possible cell connection to reach 800 V pack voltage is to connect220 battery cells in series, no parallel string, for cells with nominal 3.65 V. The installedcapacity in Ah inside the battery pack then remains constant at the cell capacity, as doesthe current rate discussed from above.
The same number of cells installed in two parallel strings with 110 series connected cells each,provides the same installed energy and power. One advantage of the 800 V pack voltage isthe DC current at battery poles, which is half the current with 400 V battery voltage andwith lower current the ohmic losses will decrease. On the other hand, for a pattery pack
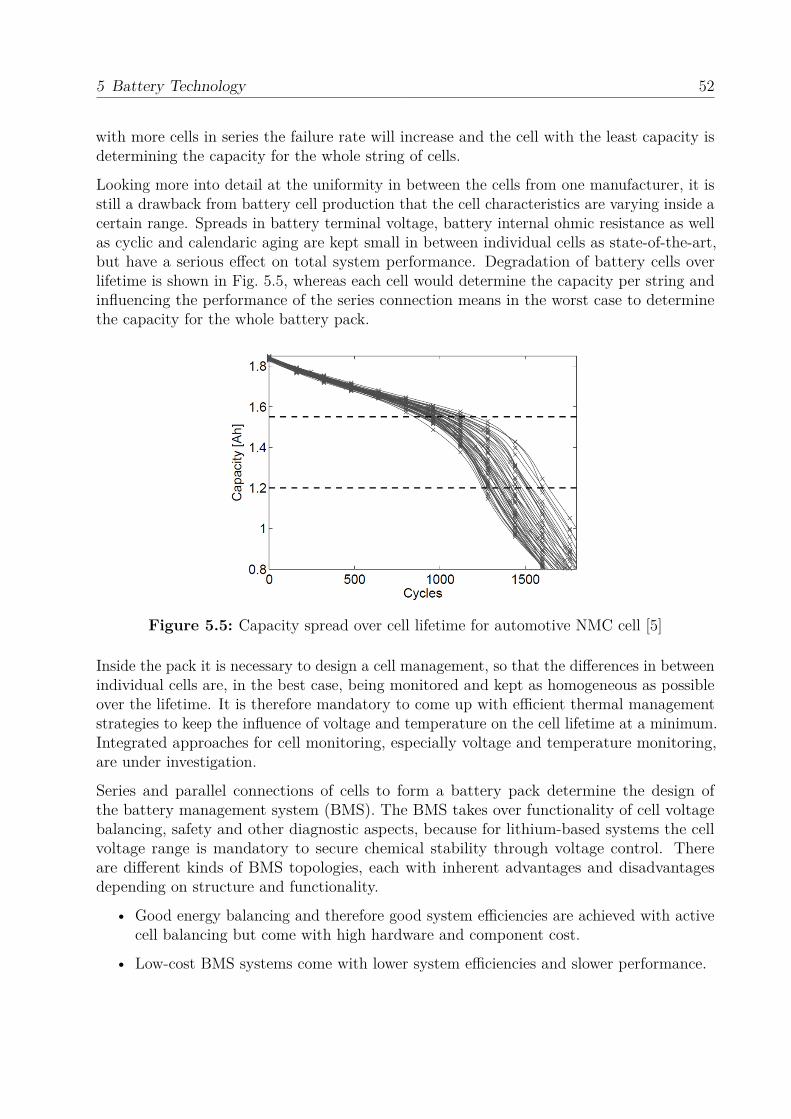
5 Battery Technology 52
with more cells in series the failure rate will increase and the cell with the least capacity isdetermining the capacity for the whole string of cells.
Looking more into detail at the uniformity in between the cells from one manufacturer, it isstill a drawback from battery cell production that the cell characteristics are varying inside acertain range. Spreads in battery terminal voltage, battery internal ohmic resistance as wellas cyclic and calendaric aging are kept small in between individual cells as state-of-the-art,but have a serious effect on total system performance. Degradation of battery cells overlifetime is shown in Fig. 5.5, whereas each cell would determine the capacity per string andinfluencing the performance of the series connection means in the worst case to determinethe capacity for the whole battery pack.
Figure 5.5: Capacity spread over cell lifetime for automotive NMC cell [5]
Inside the pack it is necessary to design a cell management, so that the differences in betweenindividual cells are, in the best case, being monitored and kept as homogeneous as possibleover the lifetime. It is therefore mandatory to come up with efficient thermal managementstrategies to keep the influence of voltage and temperature on the cell lifetime at a minimum.Integrated approaches for cell monitoring, especially voltage and temperature monitoring,are under investigation.
Series and parallel connections of cells to form a battery pack determine the design ofthe battery management system (BMS). The BMS takes over functionality of cell voltagebalancing, safety and other diagnostic aspects, because for lithium-based systems the cellvoltage range is mandatory to secure chemical stability through voltage control. Thereare different kinds of BMS topologies, each with inherent advantages and disadvantagesdepending on structure and functionality.
• Good energy balancing and therefore good system efficiencies are achieved with activecell balancing but come with high hardware and component cost.
• Low-cost BMS systems come with lower system efficiencies and slower performance.
5 Battery Technology 53
As the spread over the cell characteristics becomes wider over lifetime, the required quality ofthe cell production process is high. Integrated improvement on the cell level during productionprocess is also under continuous development. The cell formation process and end-of-linediagnostics have also been improved. Thermal management and cooling system design is stilla major topic in research. Summing up, battery pack design to ensure performance at highervoltage levels is both influenced by cell production management and system management.
Concluding, it is important to emphasize the following four aspects for future EVs:
• Higher pack voltages, as a consequence of more cells in series, have an impact on systemreliability and demand higher management effort. The increasing battery voltage is notonly an issue of more weight and more cost. Further research topics should emphasizethe influence of production process effects on reliability and system performance.
• Modular and hybrid pack design, maybe under consideration of 60 V contact voltageto decrease safety requirements, is under ongoing investigation. The results will havean influence on battery production cost.
• Battery pack design is always a trade-off between requirements and cosst. Improvingbattery technology is also a question of joint requirements for the cells and theirassembly into modules, as well as the power electronics needed for battery managementas well as the battery charger. So far the power rating of battery cells are sufficient toprovide the technical requirements of fast-charging.
• Battery cell rating has reached a very high level of energy density, lifetime, and, atthe same time, decreased marginal component costs. It is also important to match theavailable cells to the applications where they are satisfactory. This is always the casewhere cars have to drive short daily distances.
5 Battery Technology 54
5.3 Thermal Management Challenges and Risk ofAccelerated Aging
Conversion of energy always produces losses in the form of heat that needs to be managedand drained. The requirements for thermal management during EV charging apply forboth the EV and EVSE side. In the case of charging as fast as possible, it is relevant toaddress the losses that occur during the charging process, because the losses are the originfor temperature increase on the component level. For reasons of thermal stability as wellas component lifetime the temperatures have to be delimited. Another aspect is that theenergy losses during energy conversion have to be provided from the grid side, and also paidfor most possibly from the EV owner.
Thermal management inside battery packs of recently sold EVs is so far handled differently.There are cars with only forced air cooling inside the battery pack as well as more complexthermal management strategies including liquid cooling. The more complex strategies dependon additional cooling systems that consist of components such as pipes, pumps and valvesas part of the control to regulate the cooling liquid. For higher power levels, such will benecessary for every EV battery pack to adapt the thermal management to active coolingbased on liquids.
On the battery cell level there are losses to be expected, occuring due to Joule heating,electrode reactions and entropic heat generation. One worst case found in literature describes3 W losses during a charging process of a 9 Wh cell with the current rate of 2C describedin [86]. The temperature increase is described to be δT = 30 K on the cell surface in atemperature chamber.
But the cell-specific temperature behavior has to be determined for each cell separately,differences are contingent upon cell shape, material composition as well as the design of cellaggregation into modules.
Stating own assumptions here, automotive battery systems perform in a range from 7 % up to12 % losses for charging with cell current rates of 5C. Based on those assumptions, a simplecalculation shows the impact on charging power. According to those assumptions, the lossesduring the fast-charging process with 400 kW range from 25 kW to 42 kW. Reconsideringthe result from eq. 5.6, that in 10 minutes 290 km range can be recharged, and taking intoaccount the thermal losses: with worst case battery system efficiency of 88% the chargedrange decreases to 25.6 km/min. For a 290 km range now 11.3 minutes charging duration isnecessary and in this example 9 kWh heat is generated. This could approx. lead to a 50 Kto 70 K temperature increase inside the battery pack without cooling.
Why is it important to have an efficient thermal management inside the battery pack? Cellaging is increasing exponentially with higher cell temperatures. The measurement resultsshown in Fig. 5.6 taken from [83] have been carried out from cell storage tests at differentstates of charge and temperatures over the test duration. The cell capacity is normalizedto initial cell capacity and it is decreasing over storage time. The important factor is thenegative influence of higher cell temperature that can be seen easily, because the remaining
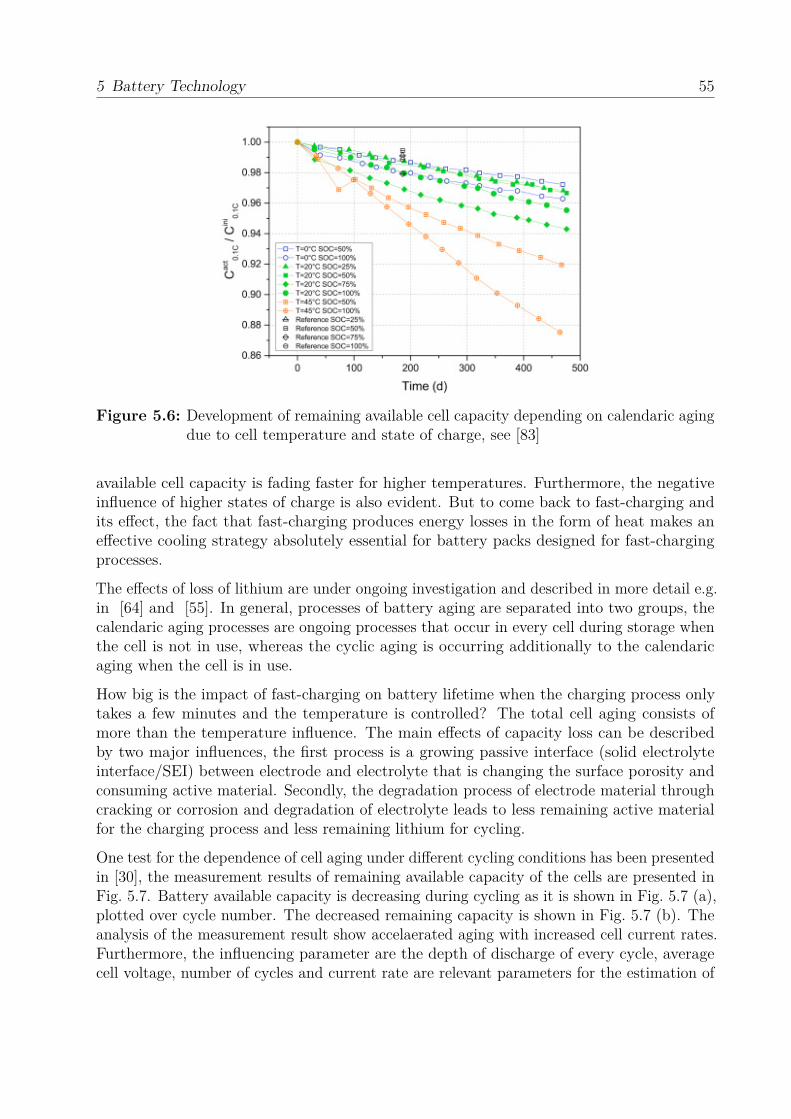
5 Battery Technology 55
Figure 5.6: Development of remaining available cell capacity depending on calendaric agingdue to cell temperature and state of charge, see [83]
available cell capacity is fading faster for higher temperatures. Furthermore, the negativeinfluence of higher states of charge is also evident. But to come back to fast-charging andits effect, the fact that fast-charging produces energy losses in the form of heat makes aneffective cooling strategy absolutely essential for battery packs designed for fast-chargingprocesses.
The effects of loss of lithium are under ongoing investigation and described in more detail e.g.in [64] and [55]. In general, processes of battery aging are separated into two groups, thecalendaric aging processes are ongoing processes that occur in every cell during storage whenthe cell is not in use, whereas the cyclic aging is occurring additionally to the calendaricaging when the cell is in use.
How big is the impact of fast-charging on battery lifetime when the charging process onlytakes a few minutes and the temperature is controlled? The total cell aging consists ofmore than the temperature influence. The main effects of capacity loss can be describedby two major influences, the first process is a growing passive interface (solid electrolyteinterface/SEI) between electrode and electrolyte that is changing the surface porosity andconsuming active material. Secondly, the degradation process of electrode material throughcracking or corrosion and degradation of electrolyte leads to less remaining active materialfor the charging process and less remaining lithium for cycling.
One test for the dependence of cell aging under different cycling conditions has been presentedin [30], the measurement results of remaining available capacity of the cells are presented inFig. 5.7. Battery available capacity is decreasing during cycling as it is shown in Fig. 5.7 (a),plotted over cycle number. The decreased remaining capacity is shown in Fig. 5.7 (b). Theanalysis of the measurement result show accelaerated aging with increased cell current rates.Furthermore, the influencing parameter are the depth of discharge of every cycle, averagecell voltage, number of cycles and current rate are relevant parameters for the estimation of
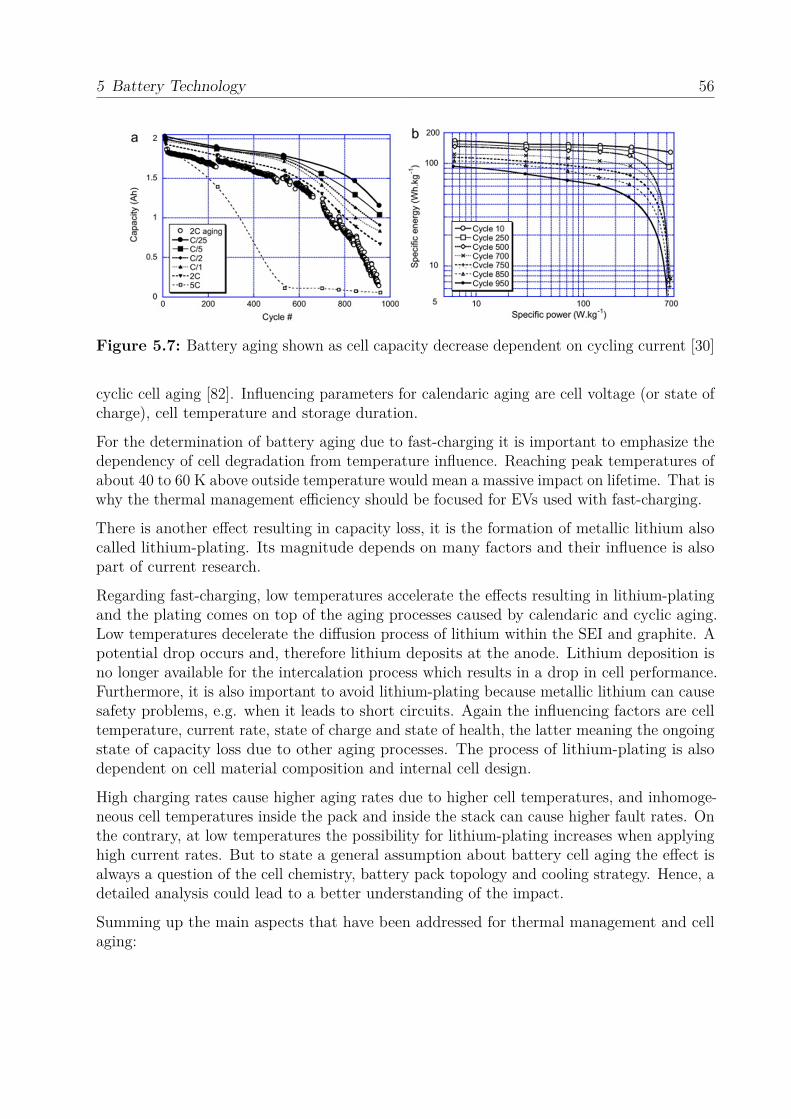
5 Battery Technology 56
Figure 5.7: Battery aging shown as cell capacity decrease dependent on cycling current [30]
cyclic cell aging [82]. Influencing parameters for calendaric aging are cell voltage (or state ofcharge), cell temperature and storage duration.
For the determination of battery aging due to fast-charging it is important to emphasize thedependency of cell degradation from temperature influence. Reaching peak temperatures ofabout 40 to 60 K above outside temperature would mean a massive impact on lifetime. That iswhy the thermal management efficiency should be focused for EVs used with fast-charging.
There is another effect resulting in capacity loss, it is the formation of metallic lithium alsocalled lithium-plating. Its magnitude depends on many factors and their influence is alsopart of current research.
Regarding fast-charging, low temperatures accelerate the effects resulting in lithium-platingand the plating comes on top of the aging processes caused by calendaric and cyclic aging.Low temperatures decelerate the diffusion process of lithium within the SEI and graphite. Apotential drop occurs and, therefore lithium deposits at the anode. Lithium deposition isno longer available for the intercalation process which results in a drop in cell performance.Furthermore, it is also important to avoid lithium-plating because metallic lithium can causesafety problems, e.g. when it leads to short circuits. Again the influencing factors are celltemperature, current rate, state of charge and state of health, the latter meaning the ongoingstate of capacity loss due to other aging processes. The process of lithium-plating is alsodependent on cell material composition and internal cell design.
High charging rates cause higher aging rates due to higher cell temperatures, and inhomoge-neous cell temperatures inside the pack and inside the stack can cause higher fault rates. Onthe contrary, at low temperatures the possibility for lithium-plating increases when applyinghigh current rates. But to state a general assumption about battery cell aging the effect isalways a question of the cell chemistry, battery pack topology and cooling strategy. Hence, adetailed analysis could lead to a better understanding of the impact.
Summing up the main aspects that have been addressed for thermal management and cellaging:

5 Battery Technology 57
• Cycling current rate has an impact on cell aging as well as inner cell temperatures thatincrease during the charging process.
• Thermal management is absolutely necessary and its effort together with its influenceon total process efficiency has to be addressed.
• High charging power under low temperatures can cause severe damage caused bylithium-plating.
5 Battery Technology 58
5.4 Stationary storage systems for grid support atfast-charging spots
What is the most broadcasted idea about stationary storage installations at fast-chargingspots? The storage is supposed to help buffering power peaks occurring when many EVswill charge at the same time at one spot. To talk about peak power, it is important to havein mind that a peak is referred to when the amplitude of power is much higher than itsaverage.
Problems with grid stability occur when the grid connection, represented by its transformersubstation and the feed lines or cables, is rated too low for the new requirements of fast-charging. Grid enhancement is the first action to consider to provide the higher ratings forfast-charging. The estimation of cost for grid enhancement is difficult and highly dependenton the boundary conditions of the installtion location. A list of the associated costs forcontractor labor and material can be found in [87]. The connection of EVSE to electricalservice with different length of the lines and the amount of labor and earthwork operationsare two major cost drivers mentioned in this report. The ballpark investment cost rangefrom e10000 to e40000 per EVSE unit and the installation cost per unit range from e4000to e51000 in the year 2015. Additional to the capital investment the operational cost haveto be considered.
The costs for the installation of a storage unit has to compete with the cost for theenhancement of the grid. Based on own assumptions, the total system cost for stationarystorage systems are in the range of 100e /kW to 250e /kW for power rating and 300e /kWhto 600e /kWh for energy. From the aforementioned example, creating a storage system for51000e to be competitive with grid enhancement, one installed system with average cost forpower of 200e /kW and average cost for energy of 500e /kWh could have 150 kW installedpower and 40 kWh installed energy, which is not sufficient to fully provide one fast-chargingprocess for a future EV.
In comparison to grid enhancement, storage systems inherently have one advantage, whichis the possibility of shifting energy over time. The storage system is able to store energyduring low-cost or low-demand times and provide the power additionally to grid power intimes of high demand. The time-shifting possibility can save electricity costs, when thereare time-dependent prices. Another option is to store energy generated by renewable energysources and therefore to save electricity costs. Another major aspect when talking aboutpeak powers resulting from EV is to save yearly costs due to power pricing charged by theenergy provider. But this can only apply when the peak power is reduced significantly.Assuming a high number of EVs beeing charged at the same time, there will be no real peakdue to the characteristic constant power charging profile for EVs that has been shown inFig. 5.1.
Because of the short lifetime of storage units in comparison with cables and transformers, itis only a viable short-term solution to install a stationary storage system, because on thelong term it will economically be always more attractive to improve cables and transformers.Battery storage systems can help to supply short-term demand management, they can be

5 Battery Technology 59
used to provide system-relevant grid services e.g. primary control. The role of batterystorage systems within the German Energiewende has been analyzed in [37], and it wasstated that storage systems should be one out of many elements for system operators duringthe transformation of the German energy system to avoid grid expansion.
6 Grid Integration of Future Fast-ChargingInfrastructure
6.1 Background
This chapter represents a review of the considerations and requirements to integrate fast-charging infrastructures into the future electric grids. More specifically, discussed in thischapter are the following:
• The impacts of fast-charging infrastructures on the grid
• The possible smart-grid solutions for providing future fast-charging services
The review presented in this chapter aims at giving the reader an overview and an understan-ding of the effects of the fast-charging infrastructures in the grid. The review also gives thereader an overview of the steps for allowing the system to provide the service of fast-charging.Uncoordinated fast-charging could result in a non-economic or in an unstable operation ofthe grid. Thus, system operators need methods and systems that will stabilize and optimizegrid operations.
The rise of future fast-charging stations or infrastructures is expected to overlap with theincreasing use of energy storage systems (ESS) and renewable energy sources (RES). Fast-charging stations can even be considered as a type of ESS since electric vehicles (EVs) storeenergy in the vehicle’s battery and possibly give energy back to the power grid. Therefore, itis expected that the grid integration of fast-charging stations will be coordinated and alignedwith the grid integration of RES and ESS.
6.2 Grid Impacts of Fast-Charging
Several studies have shown that fast-charging could be detrimental to the grid operation interms of power quality, steady-state voltage, and loading levels [70] [43] [3] [118].
60
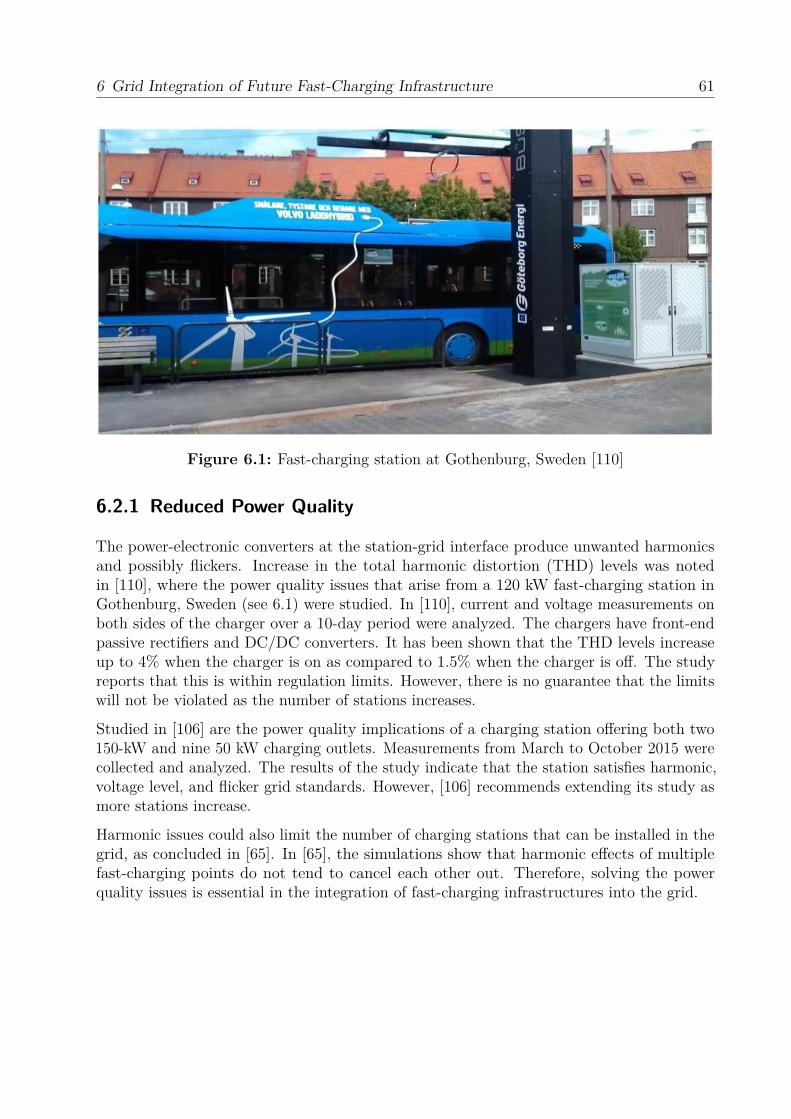
6 Grid Integration of Future Fast-Charging Infrastructure 61
Figure 6.1: Fast-charging station at Gothenburg, Sweden [110]
6.2.1 Reduced Power Quality
The power-electronic converters at the station-grid interface produce unwanted harmonicsand possibly flickers. Increase in the total harmonic distortion (THD) levels was notedin [110], where the power quality issues that arise from a 120 kW fast-charging station inGothenburg, Sweden (see 6.1) were studied. In [110], current and voltage measurements onboth sides of the charger over a 10-day period were analyzed. The chargers have front-endpassive rectifiers and DC/DC converters. It has been shown that the THD levels increaseup to 4% when the charger is on as compared to 1.5% when the charger is off. The studyreports that this is within regulation limits. However, there is no guarantee that the limitswill not be violated as the number of stations increases.
Studied in [106] are the power quality implications of a charging station offering both two150-kW and nine 50 kW charging outlets. Measurements from March to October 2015 werecollected and analyzed. The results of the study indicate that the station satisfies harmonic,voltage level, and flicker grid standards. However, [106] recommends extending its study asmore stations increase.
Harmonic issues could also limit the number of charging stations that can be installed in thegrid, as concluded in [65]. In [65], the simulations show that harmonic effects of multiplefast-charging points do not tend to cancel each other out. Therefore, solving the powerquality issues is essential in the integration of fast-charging infrastructures into the grid.
6 Grid Integration of Future Fast-Charging Infrastructure 62
6.2.2 Voltage Drops
The integration of fast-charging stations could also lead to problems in the steady-statevoltages within the grid [70] [43] [20]. Supplying the high-power consumption of fast-chargingstations from the grid results in large currents, which in turn could result in large voltagedrops. The amount of voltage drop does not only depend on the grid currents, but it alsodepends on the location of the charging station relative to the source. The farther thesource and station are apart, the higher voltage drop is expected, unless the charging stationprovides enough reactive power. This is supported by the results and conclusions in [20],where the voltage loss on a typical 0.4 kV feeder is analyzed. The results in [20] show thatthe voltage can drop as far as to 4.5% below with a total load of 15 kW over a distance of 2km. The results also show that the voltage drops to lower values for higher charging loads.
The review suggests that the research in the integration of fast-charging stations shouldconsider the following:
1. Installing charging stations closer to energy sources
2. Using RES and ESS that are closer to or located at the station
3. Having the charging stations supply reactive power – this is a possible ancillary servicethat can help in voltage control.
6.2.3 Loading Issues
The fast-charging station’s high power demand can result in overloading of the transformersin the network [24]. If not overloaded, the transformers or lines might be operated outsidetheir economic loading range. Loading the transformers outside the economic range willreduce their lifespan and increase system losses and costs. For example, it is reported thatdue to EV charging, the Sacramento Municipality Utility District in California needed toreplace 17% of its transformers [47].
6.3 Solutions and Opportunities in Fast-Charging
The previous section shows that fast-charging stations, if not controlled appropriately, canworsen the grid’s performance. The stations’ high-power demand and the power-electronicinterfaces lead to power quality, voltage drop, and overloading problems. These problemswill limit the future integration of fast-charging stations unless proper control systems areused.
To address the reduction of power quality in the grid, fast-charging stations could use arange of specific converter topologies (e.g., active rectifiers) to reduce their contributionto harmonics. More details regarding converter topologies for fast-charging stations areprovided in Chapter 4 of this report. Meanwhile, the remainder of this chapter focuses on
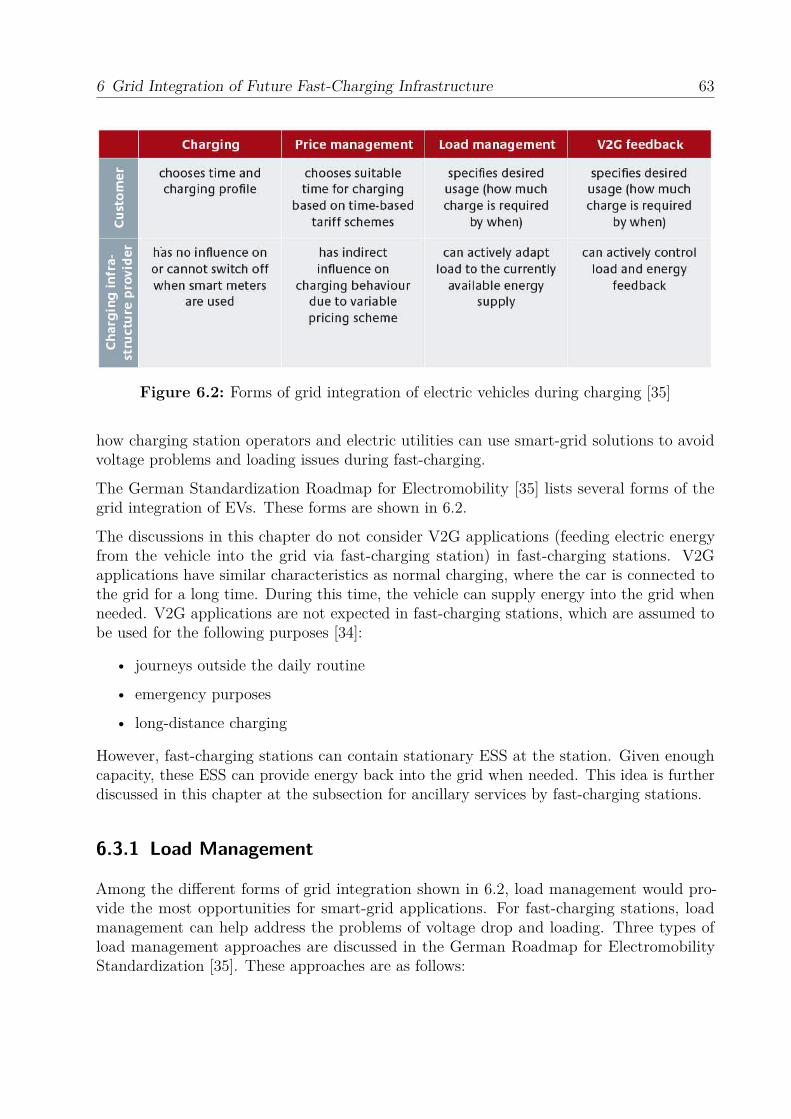
6 Grid Integration of Future Fast-Charging Infrastructure 63
Figure 6.2: Forms of grid integration of electric vehicles during charging [35]
how charging station operators and electric utilities can use smart-grid solutions to avoidvoltage problems and loading issues during fast-charging.
The German Standardization Roadmap for Electromobility [35] lists several forms of thegrid integration of EVs. These forms are shown in 6.2.
The discussions in this chapter do not consider V2G applications (feeding electric energyfrom the vehicle into the grid via fast-charging station) in fast-charging stations. V2Gapplications have similar characteristics as normal charging, where the car is connected tothe grid for a long time. During this time, the vehicle can supply energy into the grid whenneeded. V2G applications are not expected in fast-charging stations, which are assumed tobe used for the following purposes [34]:
• journeys outside the daily routine
• emergency purposes
• long-distance charging
However, fast-charging stations can contain stationary ESS at the station. Given enoughcapacity, these ESS can provide energy back into the grid when needed. This idea is furtherdiscussed in this chapter at the subsection for ancillary services by fast-charging stations.
6.3.1 Load Management
Among the different forms of grid integration shown in 6.2, load management would pro-vide the most opportunities for smart-grid applications. For fast-charging stations, loadmanagement can help address the problems of voltage drop and loading. Three types ofload management approaches are discussed in the German Roadmap for ElectromobilityStandardization [35]. These approaches are as follows:
6 Grid Integration of Future Fast-Charging Infrastructure 64
• Demand response charging – where the users react to the broadcasted price signals.The idea here is to motivate users to charge their cars during non-peak hours. Thereby,reducing the required power ratings of supply equipment. However, power systemand charging station operators need to avoid rebound effects, where more users thanoptimal/allowed simultaneously start charging their EVs due to low prices [57].
• Smart charging – where the car and the charging infrastructure operator negotiate thecharging station’s demand and duration of the charging process.
• Operator-controlled Charging – where the operator directly controls the chargingstation’s power demand.
In addition to alleviating or eliminating the problems voltage, loading, and efficiency problemsin the grid, the goals of load management include the following [57]:
• Allow the integration of RES in the system
• Enable grid management to enhance flexibility, which is the systems ability to respondto changes in the demand and supply [23]
• Enable the grid to find and apply cost-effective solutions
• Improve the charging process in terms of efficiency and the number of charged vehicles
• Provide consumer convenience
6.3.2 Actors and Interfaces
Future load management systems will deal with highly fluctuating demand and supply. Thesesystems will need actors, communication links, and information infrastructures to gatherdata and implement control strategies. Fig. 6.3, from the standardization document fromCEN and CENELEC ([57]), shows the role model diagram of a charging station and itsassociated actors.
It is expected that the operation of fast-charging stations, or EV-charging in general, willentail a lot of data exchanges. These exchanges require data security and provisions regardingdata privacy. Communication links must meet specific requirements. As an example, ensuringsafety during fast-charging requires communication with high reliability and low latencybetween the vehicle and the offboard charger [57].
Fig. 6.3 further shows the E-mobility and power system actors that will play a role in theintegration of fast-charging stations. These actors, or their equivalents, need to be presentto facilitate the operation of the charging infrastructure and its interfaces between the usersand the electricity grid. Regarding the user interfaces to the charging network, the GermanNational Platform for Electric Mobility (NPE) recommends both mobile telephony-basedsolutions (e.g. smartphone apps) and card-reading services for DC fast-charging [34].
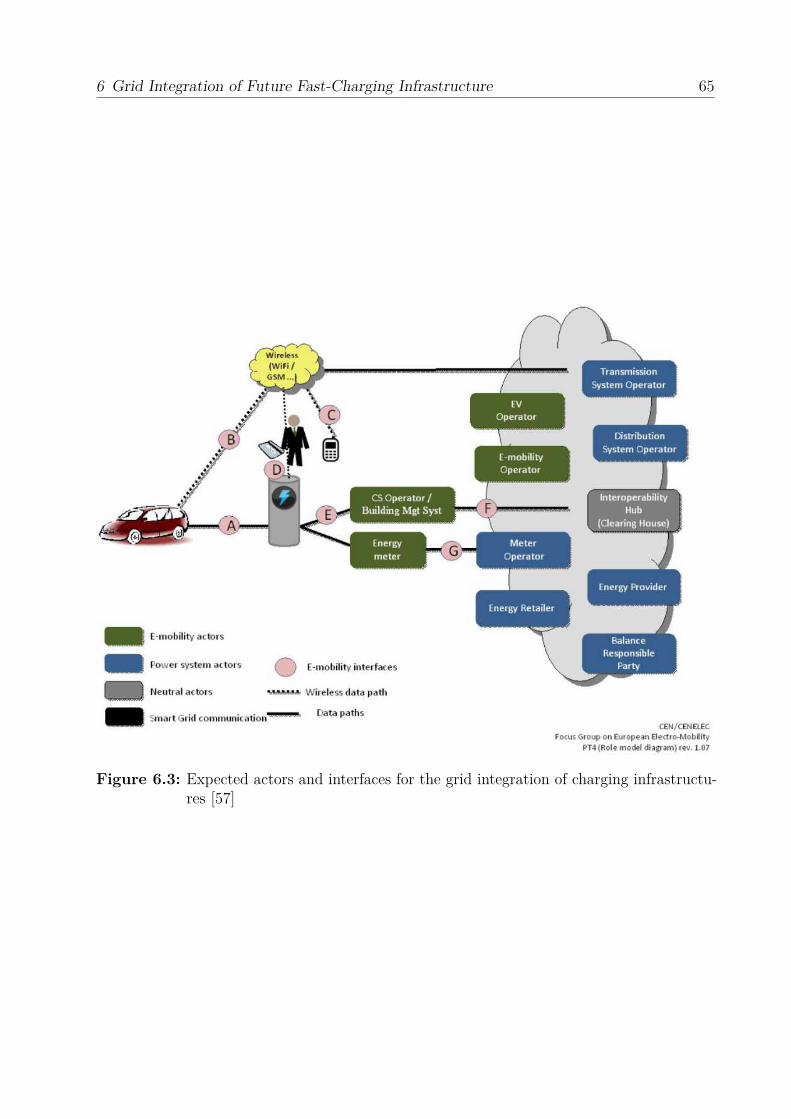
6 Grid Integration of Future Fast-Charging Infrastructure 65
Figure 6.3: Expected actors and interfaces for the grid integration of charging infrastructu-res [57]
6 Grid Integration of Future Fast-Charging Infrastructure 66
6.4 Supporting Smart-Grid Functions
Several automated functions must be in place for power system and e-mobility actors to 1)provide fast-charging without compromising stable grid operation, and 2) achieve the othergoals of load management (e.g., integrate RES integration, provide grid flexibility). Thesefunctions include:
• Forecasting algorithms for the demand for fast-charging
• Ancillary services through fast-charging stations
• Data-driven services for the operations of fast-charging stations
6.4.1 Forecasting the Demand for Fast-Charging
Different types of energy resources (conventional power plants, RES, ESS, virtual powerplants) have to be allocated for fast-charging and other loads in the grid. Therefore, tooptimize the allocation, the operators must have an idea of how much power will be demandedfrom the fast-charging stations. In [70], the demand from the grid was forecasted throughassumptions in the number and types of EVs in use, the energy consumption per vehicle andmobility diagrams (number of trips through different hours of the day). In [40], the case ofmotorway fast-charging stations was studied, wherein the vehicles are charged in a matter ofminutes. It considers the number of charging points needed to keep the customer waitingtime acceptable. It also examines the possibility of an automated system that replaces thebattery of the vehicle with a charged battery. Here, the station does not charge the batteryof the vehicle. Instead, the station replaces the battery with a charged one within minutes.It is a possible option if there are enough batteries in the system. Planners and operatorsmay also opt to use probabilistic forecasting methods, as in [25], to forecast the demand.
The use of transportation models in forecasting the power demand for fast-charging outlinesthe following additional requirements:
• the EV driving characteristics in the extended range
• the day-to-day variation of the EV driving range
• the proportion of stations using fast-charging stations, which can depend on the housingpatterns, driving patterns, and electricity rates
• the possible weather impacts on the performance of EV batteries
• the number of EV owners with no home chargers
The relationship between home and fast-charging should also be investigated. In manystudies, it is assumed that EV users will charge their vehicles at home, and use fast-chargingas range extenders. However, the conclusions in [77] show that EV users may substitutefast-charging for home charging, even for additional costs. The study in [77] looked ataround 1 million fast-charging sessions from EVgo from January 2014 to October 2016. The
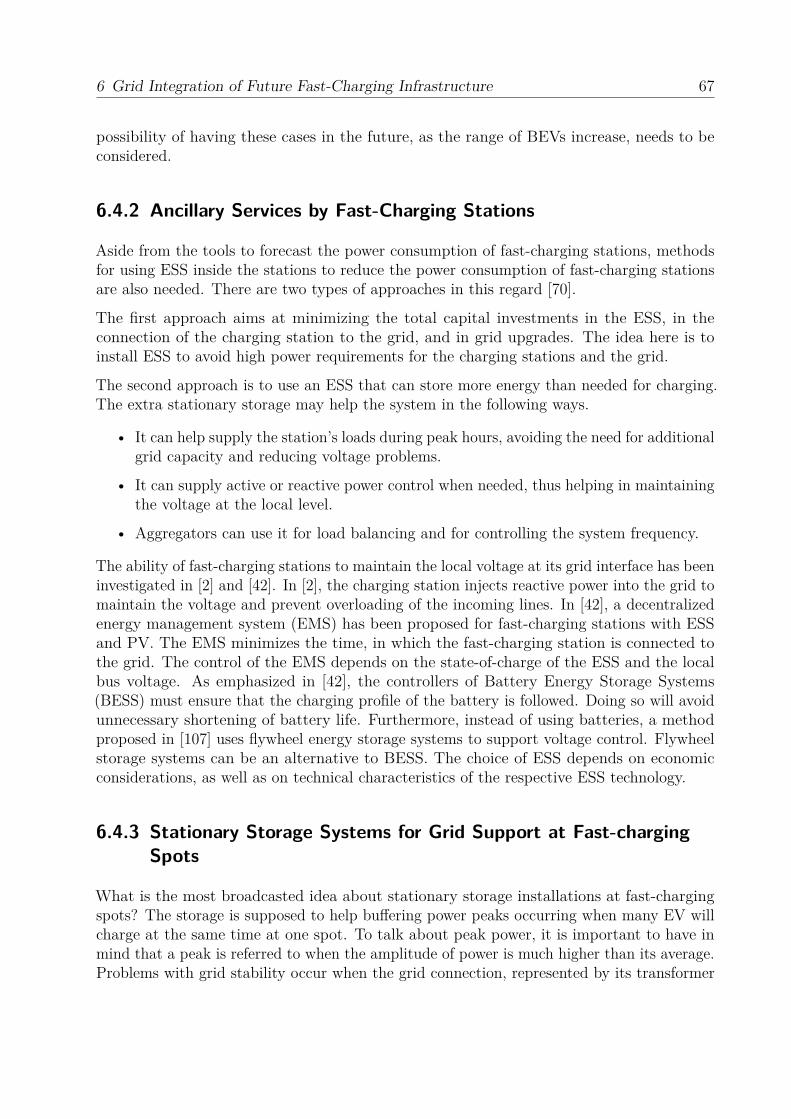
6 Grid Integration of Future Fast-Charging Infrastructure 67
possibility of having these cases in the future, as the range of BEVs increase, needs to beconsidered.
6.4.2 Ancillary Services by Fast-Charging Stations
Aside from the tools to forecast the power consumption of fast-charging stations, methodsfor using ESS inside the stations to reduce the power consumption of fast-charging stationsare also needed. There are two types of approaches in this regard [70].
The first approach aims at minimizing the total capital investments in the ESS, in theconnection of the charging station to the grid, and in grid upgrades. The idea here is toinstall ESS to avoid high power requirements for the charging stations and the grid.
The second approach is to use an ESS that can store more energy than needed for charging.The extra stationary storage may help the system in the following ways.
• It can help supply the station’s loads during peak hours, avoiding the need for additionalgrid capacity and reducing voltage problems.
• It can supply active or reactive power control when needed, thus helping in maintainingthe voltage at the local level.
• Aggregators can use it for load balancing and for controlling the system frequency.
The ability of fast-charging stations to maintain the local voltage at its grid interface has beeninvestigated in [2] and [42]. In [2], the charging station injects reactive power into the grid tomaintain the voltage and prevent overloading of the incoming lines. In [42], a decentralizedenergy management system (EMS) has been proposed for fast-charging stations with ESSand PV. The EMS minimizes the time, in which the fast-charging station is connected tothe grid. The control of the EMS depends on the state-of-charge of the ESS and the localbus voltage. As emphasized in [42], the controllers of Battery Energy Storage Systems(BESS) must ensure that the charging profile of the battery is followed. Doing so will avoidunnecessary shortening of battery life. Furthermore, instead of using batteries, a methodproposed in [107] uses flywheel energy storage systems to support voltage control. Flywheelstorage systems can be an alternative to BESS. The choice of ESS depends on economicconsiderations, as well as on technical characteristics of the respective ESS technology.
6.4.3 Stationary Storage Systems for Grid Support at Fast-chargingSpots
What is the most broadcasted idea about stationary storage installations at fast-chargingspots? The storage is supposed to help buffering power peaks occurring when many EV willcharge at the same time at one spot. To talk about peak power, it is important to have inmind that a peak is referred to when the amplitude of power is much higher than its average.Problems with grid stability occur when the grid connection, represented by its transformer
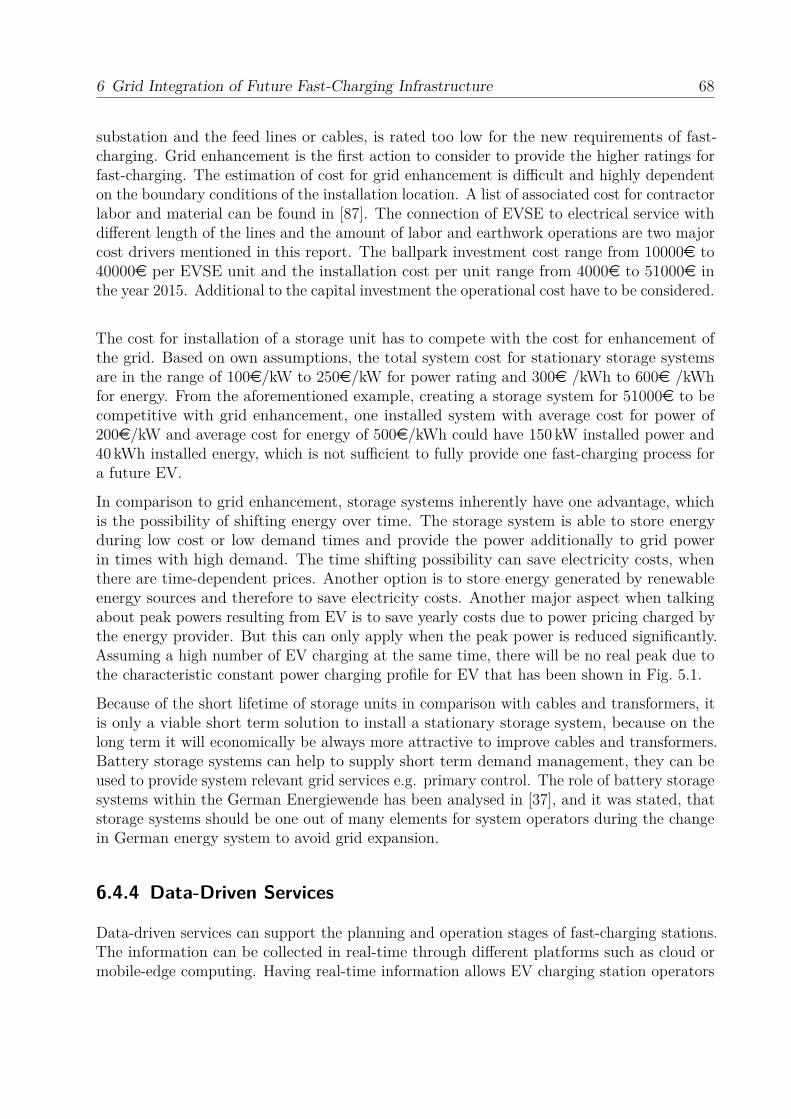
6 Grid Integration of Future Fast-Charging Infrastructure 68
substation and the feed lines or cables, is rated too low for the new requirements of fast-charging. Grid enhancement is the first action to consider to provide the higher ratings forfast-charging. The estimation of cost for grid enhancement is difficult and highly dependenton the boundary conditions of the installation location. A list of associated cost for contractorlabor and material can be found in [87]. The connection of EVSE to electrical service withdifferent length of the lines and the amount of labor and earthwork operations are two majorcost drivers mentioned in this report. The ballpark investment cost range from 10000e to40000e per EVSE unit and the installation cost per unit range from 4000e to 51000e inthe year 2015. Additional to the capital investment the operational cost have to be considered.
The cost for installation of a storage unit has to compete with the cost for enhancement ofthe grid. Based on own assumptions, the total system cost for stationary storage systemsare in the range of 100e/kW to 250e/kW for power rating and 300e /kWh to 600e /kWhfor energy. From the aforementioned example, creating a storage system for 51000e to becompetitive with grid enhancement, one installed system with average cost for power of200e/kW and average cost for energy of 500e/kWh could have 150 kW installed power and40 kWh installed energy, which is not sufficient to fully provide one fast-charging process fora future EV.
In comparison to grid enhancement, storage systems inherently have one advantage, whichis the possibility of shifting energy over time. The storage system is able to store energyduring low cost or low demand times and provide the power additionally to grid powerin times with high demand. The time shifting possibility can save electricity costs, whenthere are time-dependent prices. Another option is to store energy generated by renewableenergy sources and therefore to save electricity costs. Another major aspect when talkingabout peak powers resulting from EV is to save yearly costs due to power pricing charged bythe energy provider. But this can only apply when the peak power is reduced significantly.Assuming a high number of EV charging at the same time, there will be no real peak due tothe characteristic constant power charging profile for EV that has been shown in Fig. 5.1.
Because of the short lifetime of storage units in comparison with cables and transformers, itis only a viable short term solution to install a stationary storage system, because on thelong term it will economically be always more attractive to improve cables and transformers.Battery storage systems can help to supply short term demand management, they can beused to provide system relevant grid services e.g. primary control. The role of battery storagesystems within the German Energiewende has been analysed in [37], and it was stated, thatstorage systems should be one out of many elements for system operators during the changein German energy system to avoid grid expansion.
6.4.4 Data-Driven Services
Data-driven services can support the planning and operation stages of fast-charging stations.The information can be collected in real-time through different platforms such as cloud ormobile-edge computing. Having real-time information allows EV charging station operators
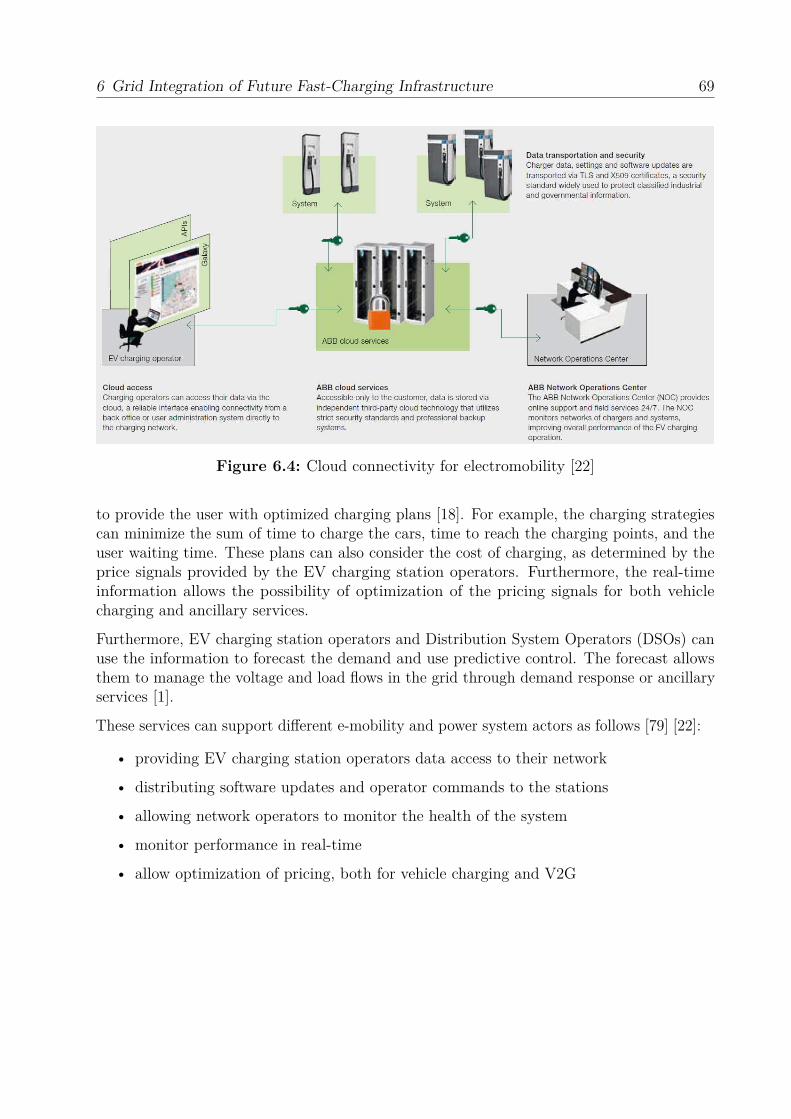
6 Grid Integration of Future Fast-Charging Infrastructure 69
Figure 6.4: Cloud connectivity for electromobility [22]
to provide the user with optimized charging plans [18]. For example, the charging strategiescan minimize the sum of time to charge the cars, time to reach the charging points, and theuser waiting time. These plans can also consider the cost of charging, as determined by theprice signals provided by the EV charging station operators. Furthermore, the real-timeinformation allows the possibility of optimization of the pricing signals for both vehiclecharging and ancillary services.
Furthermore, EV charging station operators and Distribution System Operators (DSOs) canuse the information to forecast the demand and use predictive control. The forecast allowsthem to manage the voltage and load flows in the grid through demand response or ancillaryservices [1].
These services can support different e-mobility and power system actors as follows [79] [22]:
• providing EV charging station operators data access to their network
• distributing software updates and operator commands to the stations
• allowing network operators to monitor the health of the system
• monitor performance in real-time
• allow optimization of pricing, both for vehicle charging and V2G
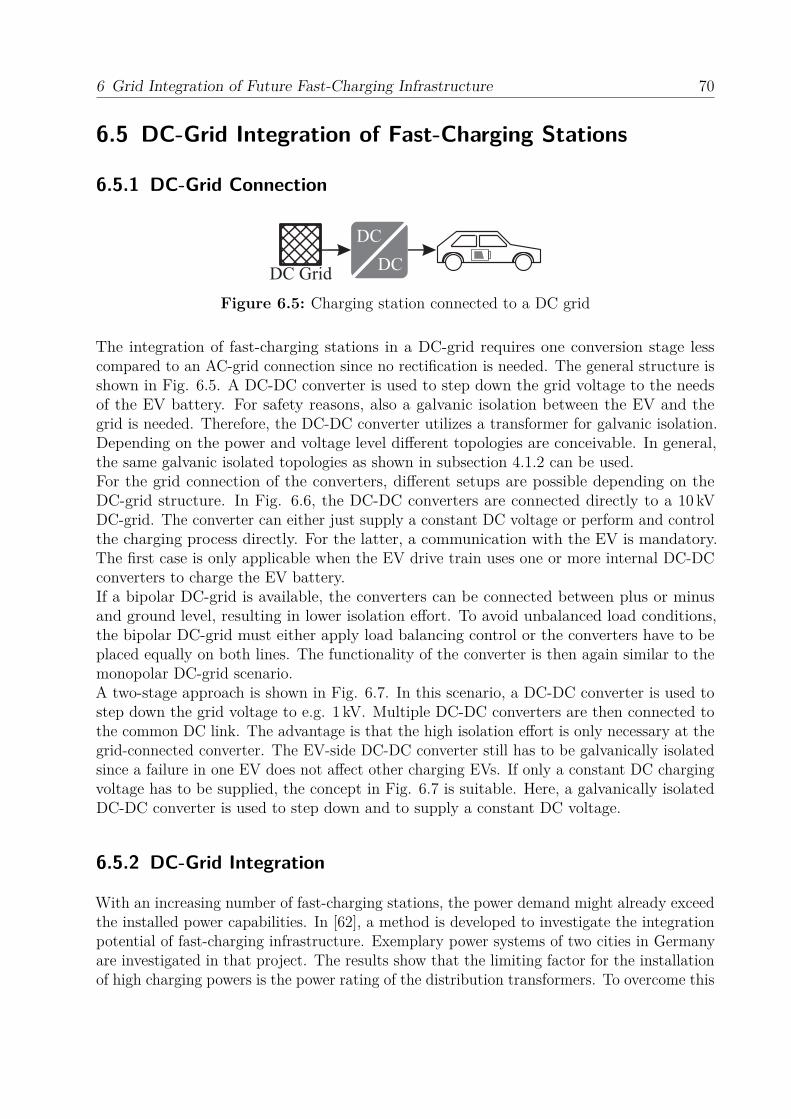
6 Grid Integration of Future Fast-Charging Infrastructure 70
6.5 DC-Grid Integration of Fast-Charging Stations
6.5.1 DC-Grid Connection
DC Grid
DC
DC
Figure 6.5: Charging station connected to a DC grid
The integration of fast-charging stations in a DC-grid requires one conversion stage lesscompared to an AC-grid connection since no rectification is needed. The general structure isshown in Fig. 6.5. A DC-DC converter is used to step down the grid voltage to the needsof the EV battery. For safety reasons, also a galvanic isolation between the EV and thegrid is needed. Therefore, the DC-DC converter utilizes a transformer for galvanic isolation.Depending on the power and voltage level different topologies are conceivable. In general,the same galvanic isolated topologies as shown in subsection 4.1.2 can be used.For the grid connection of the converters, different setups are possible depending on theDC-grid structure. In Fig. 6.6, the DC-DC converters are connected directly to a 10 kVDC-grid. The converter can either just supply a constant DC voltage or perform and controlthe charging process directly. For the latter, a communication with the EV is mandatory.The first case is only applicable when the EV drive train uses one or more internal DC-DCconverters to charge the EV battery.If a bipolar DC-grid is available, the converters can be connected between plus or minusand ground level, resulting in lower isolation effort. To avoid unbalanced load conditions,the bipolar DC-grid must either apply load balancing control or the converters have to beplaced equally on both lines. The functionality of the converter is then again similar to themonopolar DC-grid scenario.A two-stage approach is shown in Fig. 6.7. In this scenario, a DC-DC converter is used tostep down the grid voltage to e.g. 1 kV. Multiple DC-DC converters are then connected tothe common DC link. The advantage is that the high isolation effort is only necessary at thegrid-connected converter. The EV-side DC-DC converter still has to be galvanically isolatedsince a failure in one EV does not affect other charging EVs. If only a constant DC chargingvoltage has to be supplied, the concept in Fig. 6.7 is suitable. Here, a galvanically isolatedDC-DC converter is used to step down and to supply a constant DC voltage.
6.5.2 DC-Grid Integration
With an increasing number of fast-charging stations, the power demand might already exceedthe installed power capabilities. In [62], a method is developed to investigate the integrationpotential of fast-charging infrastructure. Exemplary power systems of two cities in Germanyare investigated in that project. The results show that the limiting factor for the installationof high charging powers is the power rating of the distribution transformers. To overcome this
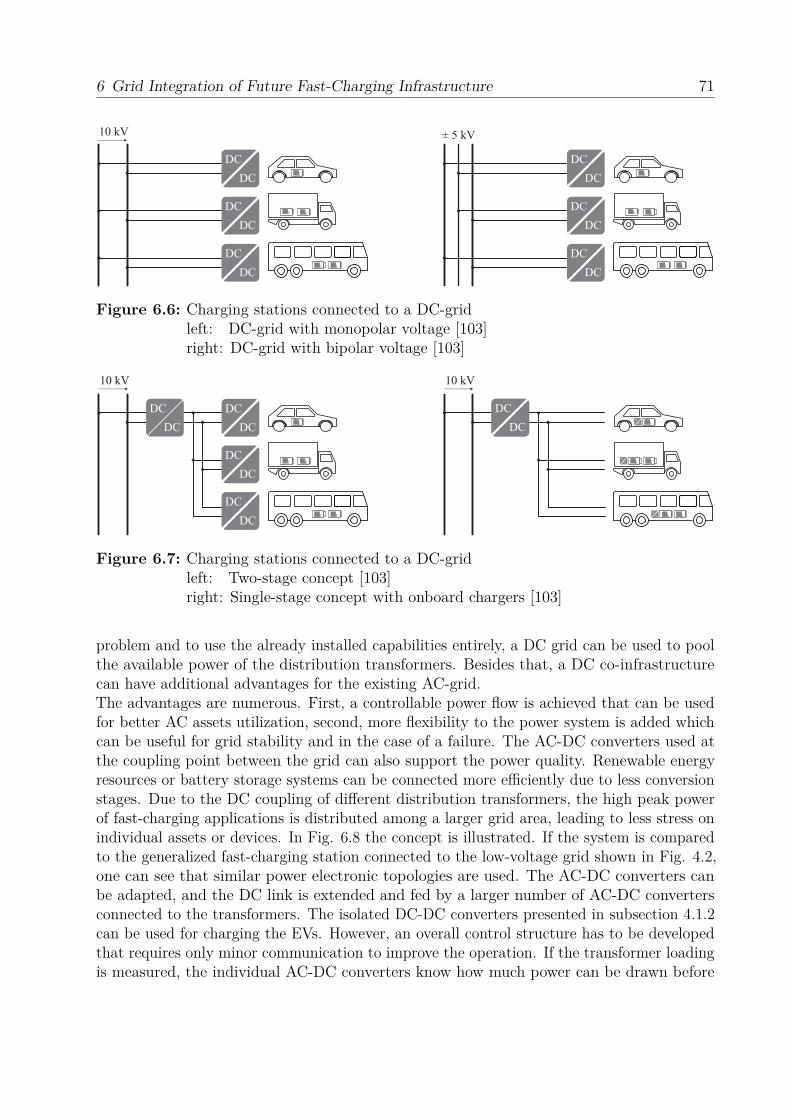
6 Grid Integration of Future Fast-Charging Infrastructure 71
DC
DC
DC
DC
DC
DC
10 kV
DC
DC
DC
DC
DC
DC
± 5 kV
Figure 6.6: Charging stations connected to a DC-gridleft: DC-grid with monopolar voltage [103]right: DC-grid with bipolar voltage [103]
DC
DC
DC
DC
DC
DC
DC
DC
10 kV
DC
DC
DC
DC
10 kV
DC
DC
DC
DC
DC
DC
Figure 6.7: Charging stations connected to a DC-gridleft: Two-stage concept [103]right: Single-stage concept with onboard chargers [103]
problem and to use the already installed capabilities entirely, a DC grid can be used to poolthe available power of the distribution transformers. Besides that, a DC co-infrastructurecan have additional advantages for the existing AC-grid.The advantages are numerous. First, a controllable power flow is achieved that can be usedfor better AC assets utilization, second, more flexibility to the power system is added whichcan be useful for grid stability and in the case of a failure. The AC-DC converters used atthe coupling point between the grid can also support the power quality. Renewable energyresources or battery storage systems can be connected more efficiently due to less conversionstages. Due to the DC coupling of different distribution transformers, the high peak powerof fast-charging applications is distributed among a larger grid area, leading to less stress onindividual assets or devices. In Fig. 6.8 the concept is illustrated. If the system is comparedto the generalized fast-charging station connected to the low-voltage grid shown in Fig. 4.2,one can see that similar power electronic topologies are used. The AC-DC converters canbe adapted, and the DC link is extended and fed by a larger number of AC-DC convertersconnected to the transformers. The isolated DC-DC converters presented in subsection 4.1.2can be used for charging the EVs. However, an overall control structure has to be developedthat requires only minor communication to improve the operation. If the transformer loadingis measured, the individual AC-DC converters know how much power can be drawn before
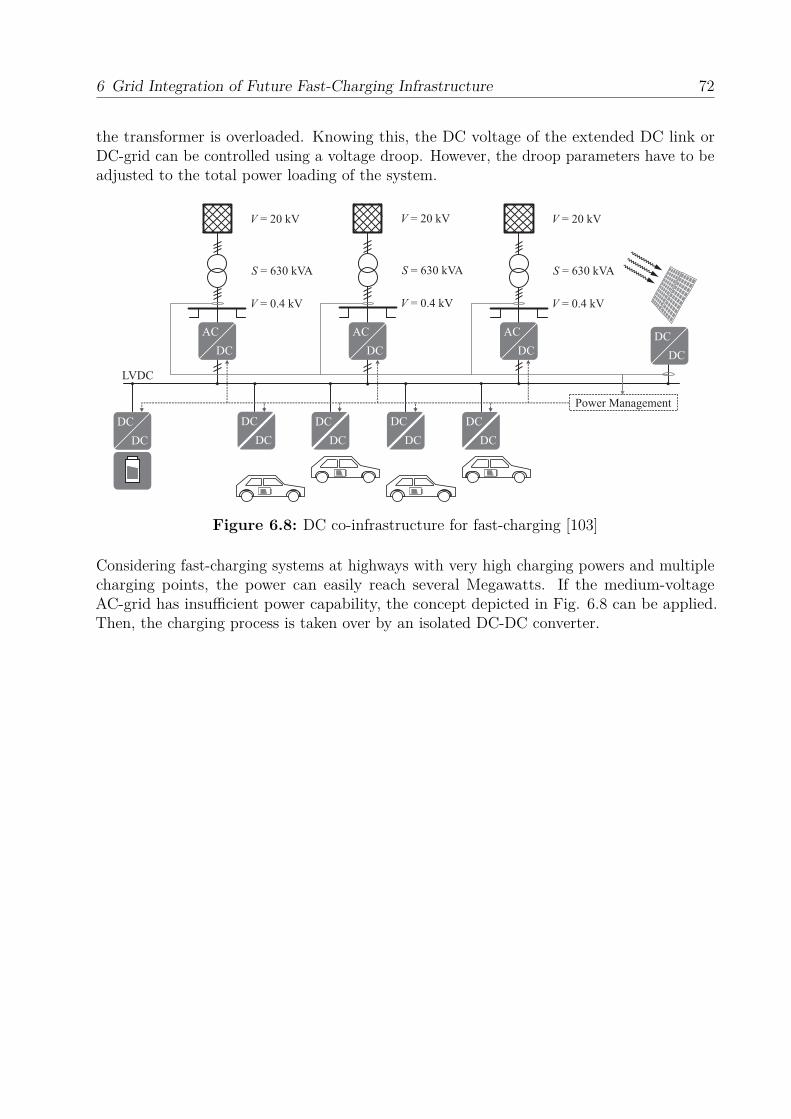
6 Grid Integration of Future Fast-Charging Infrastructure 72
the transformer is overloaded. Knowing this, the DC voltage of the extended DC link orDC-grid can be controlled using a voltage droop. However, the droop parameters have to beadjusted to the total power loading of the system.
S = 630 kVA
V = 20 kV
DC
AC
V = 0.4 kV
S = 630 kVA
V = 20 kV
DC
AC
V = 0.4 kV
S = 630 kVA
V = 20 kV
DC
AC
V = 0.4 kV
DC
DC
DC
DC
Power Management
DC
DC
DC
DC
DC
DC
DC
DC
LVDC
Figure 6.8: DC co-infrastructure for fast-charging [103]
Considering fast-charging systems at highways with very high charging powers and multiplecharging points, the power can easily reach several Megawatts. If the medium-voltageAC-grid has insufficient power capability, the concept depicted in Fig. 6.8 can be applied.Then, the charging process is taken over by an isolated DC-DC converter.
7 Conclusion
Economic, Policy and Market Regulation Aspects
We introduce fast-charging from a socio-economic perspective on four dimensions: Firstly, wedefine fast-charging points according to EU Directive 2014/94/EU (> 22 kW) [38]. Secondly,the location of charging points – private, public or semi-public – predetermines the dominatingcharging technology and hence the recharging time with respect to consumer needs andwants. Thirdly, the battery size also predetermines the time it takes to recharge an EV.Fourthly, the battery size; from a consumer perspective, the predominant decision-relevantaspects are the time and costs it takes to recharge.As stated in [66], e-mobility is “a complex ecosystem, where different actors create a networkof interactions and collaborate to create a positive business case.”As the projection in Fig. 3.6 shows, out of 36,000 public charging stations expected inGermany in 2020, approximately 20 % (7,000) are expected to be fast-charging stations. Inorder to reach or even exceed this figure, stakeholders on all levels need to agree on commonobjectives, as our stakeholder analysis showed.Further, the four responsible German federal ministries – BMWi, BMVBS, BMU and BMBF– should work more closely together, not only in the form of the Joint E-mobility Secretariat(Gemeinsame Geschäftsstelle Elektromobilität, GGEMO, [9]).
Fast-Charging Technologies
Fast-charging stations offer the solution to dispel the range anxiety of customers and, therefore,could be the enabling technology for a large diffusion of EVs. The power electronics withinthe offboard charging stations and onboard chargers are the key technology. With the use ofnew materials and devices, onboard chargers can be built more efficiently with less volumeand weight. Furthermore, offboard charging stations can be built with lower footprintsand less cooling effort and higher efficiency. Further, modular PEBB concepts allow aflexible and scalable realization of fast-charging stations, and hence reduced installationand maintenance costs due to high economies of scale and inbuilt redundancy. In addition,different charging station concepts can be applied that even allow the integration of storagesystems and renewable energy sources in the grid. Today, onboard chargers deliver up to22 kW of charging power, while offboard fast-charging stations offer perspectively up to350 kW of charging power.
73
7 Conclusion 74
Battery Technology
It is very important to learn more about the interaction between fast-charging and EV sales.Maybe, on the one hand fast-charging can play a role as an enabling technology for EV salesin the coming period as it may increase drivers’ acceptance. But, on the other hand, it isimportant to determine whether the use cases for high charging levels are required. That isgoing to be also a question whether it is paid for. In the end, the total cost of the car isthe decision-relevant value for EV buyers, but charging is an additional service coming withcosts on top. When fast-charging stations are installed at highway stations, it is necessaryto arrange responsibilities for the costs of a possible enhancement of the grid connection.
Grid Integration of Future Fast-Charging Infrastructure
Based on a literature review, the primary grid impacts of fast-charging stations found arereduced power quality, increased voltage drops, and excessive or non-economic loading oftransformers. These problems need to be solved to allow the connection of more fast-chargingstations into the grid in the future. Load management is a form of grid integration thataddresses voltage and loading problems. Load management needs automated functions for(1) demand forecasting, (2) ancillary services (e.g., participation in voltage control, energymanagement, VPP), and (3) data-driven services for operators and customers. An additionalbenefit, load management also helps align the grid-integration of fast-charging infrastructureswith the integration of renewable energy resources. In addition to load management, DCunderlay infrastructures can also help in the integration of plenty of fast-charging stationsinto the AC-grid while addressing issues in grid flexibility, loading, and power quality.
8 Future Research Directions
Economic, Policy and Market Regulation Aspects
For an optimal installation strategy of charging infrastructure for e-cars, it is importantto know which battery type penetrates the market most in the coming years. In addition,the question remains unclear what the economic dimension of standards and norms are.Could there be dangers of ill-defined standards? Or are there dangers of implementingstandards and norms too early or too late? The questions remain what needs to be doneon all stakeholder levels in order to establish a fast-charging network. This relates to thediffusion of innovation perspective. Thus, further steps regarding a better understanding ofthe diffusion dynamics of fast-charging networks are to analyze the
• occupancy rate of incumbent charging stations
• dependencies between (fast-) charging stations and the number of registered EVs
• diffusion path dynamics of battery types
• economic dimension of standards and norms
• dangers of implementing standards and norms too early or too late
• overlapping interests of stakeholders in order to create cooperation on all stakeholderlevels
• possible market designs [81]
• investment needs and costs
• energy policy and market regulation issues
• business models for fast-charging infrastructures:
– willingness to pay and preferred payment schemes of future customers
• alternative concepts to integrate the charging infrastructure into the grid:
focus on the interconnection of different distribution transformers
– possibility to use EVs in the capacity market for grid stabilization, using e-vehiclesas part of a VPP
– integration of battery energy storage systems and renewables
75
8 Future Research Directions 76
Since e-mobility and the concomitant (fast-) charging infrastructure are still unknown tolarge population groups, further examinations could make use of experiments and surveysfor determining e.g. the willingness to pay and the preferred payments schemes of futurecustomers. Methodologies such as cost-benefit analyses and scenario analyses assess theimpact of e-mobility on the conventional ICEV mobility sector. The approach by [84]from 2012 could be applied to more recent data and under the consideration of 2020 EVpenetration rates.In addition, possible follow-up projects could include an econometric analysis of dependenciesbetween (fast-) charging stations and the number of EVs registered, using GPS data ofcharging points available from chargmap.org [19] and car registrations statistics [59],[90].As a result of further research, it will be able to develop avenues for diverse actors andstakeholders (e.g., car manufacturer, grid operators, charging point operators, fuel stations).
Fast-Charging Technologies
With growing battery sizes and an demand for short charging times, future fast-chargingpower electronic systems need to provide the increasing power. The power electronics shouldbe highly efficient, have high power densities while being economically reasonable.
Converters using wide-bandgap semiconductors, like silicon carbide (SiC) and gallium nitride(GaN), have the potential for higher efficiencies, decreased size and weight [115] and reducedcost [104] in comparison to conventional solutions.
In order to supply power that exceeds the low-voltage-grid capabilities, fast-charging stationscan be connected to medium-voltage AC or DC-grids. Today, multilevel topologies withan increased number of components are used in this high-voltage application [109]. In thefuture, conventional two-level topologies using wide-bandgap semiconductors might be used.This is possible due to the higher breakdown voltages of wide-bandgap materials.
However, there is still a lot of research needed. Not only the different device characteristics,but also the impact on passive components will have to be examined [116] in more depth.
With so-called modular power electronic building blocks (PEBBs) [100], fast-charging stationscan be scaled both in voltage and power by connecting the modules in series and in parallel.Since the individual modules can be used in a variety of applications, there is a potentialfor high economies of scale. By using an intelligent load distribution between the modules,the partial load efficiency can be increased. Furthermore, maintenance and redundancy ofmodularly built power electronic systems is increased, since a single defective module doesnot stop the operation and can be easily swapped.
In the future, DC distribution grids might become more common [102]. This will impactthe power electronic topologies used in fast chargers. Fast-charging stations connected tothe DC-grid need no rectification stage and therefore can be more energy-efficient, cheaper,and smaller. Not only the stations themselves, but also the distribution between them canbecome more energy-efficient. Multiport DC-DC converters can connect multiple DC-grids
8 Future Research Directions 77
and consumers with different voltage levels [75]. These converters might allow a flexible andefficient power distribution between different fast-charging stations and EVs.
Battery Technology
The evaluation of fast-charging processes from the car owner’s view has to account for thepossible impact of fast charging on battery aging. The following aspects have to be addressedto generate a better understanding of the role of batteries, from the view of the customer,the operator of the infrastructure operator, as well as the cell manufacturer.
• Investigation of battery use profiles within the specified application
• Development of battery lifetime prediction model
• Battery lifetime depending on battery technology, fast-charging and consumer behaviorin EV
• Battery lifetime depending on battery technology and demand profile in stationaryapplication
On top of the technical questions regarding battery aging, the losses during the chargingprocess have to be addressed as well, because future business models have to include thecost for energy, power level provision and grid connection as well as for the losses.
Grid Integration of Future Fast-Charging Infrastructure
Continued research regarding the grid integration of fast-charging stations will help to betterunderstand how different smart-grid functions or technologies can be used to avoid thenegative effects on the grid performance and to achieve the goals of load management (e.g.,alignment with the integration of RES, improving grid flexibility, cost reductions). In thisregard, this section lists several research questions that may guide the reader in the definingof new research or business opportunities in the integration: From the perspective of theforecasting methods for the fast-charging demand, the research questions would include thefollowing:
• How to improve the accuracy of transportation/forecasting models using energy con-sumption profiles across multiple fast-charging stations?
• How will the price signals affect the consumer behavior and the demand for fastcharging?
Furthermore, the following are some of the questions that further research in the area ofancillary services would aim to answer:
• How to coordinate the use of the distributed ESS located fast-charging stations forprimary and secondary voltage control?

8 Future Research Directions 78
• How will fast-charging stations affect dynamic grid stability – the ability to go back tonormal operation after small (e.g., switching) disturbances?
• How to coordinate and optimize the operation of fast-charging stations with the RESand other ESS in the system?
• How can fast-charging stations participate in technical and commercial virtual powerplants (VPP) and help the frequency control at the system?
Also, below are some possible research questions regarding the use of data-driven servicesfor the grid integration of fast-charging stations:
• How to incorporate the charging plans into the ancillary services of the fast-chargingstation, and vice versa?
• How should deviations from the charging plans be communicated to e-mobility andpower system actors to allow appropriate response?
• How to improve the forecasting of the demand for fast-charging using the data comingfrom traffic measurements?
Last but not the least, the following are the research question regarding the use of DC-gridsin the grid integration of fast-charging stations.
• What is the impact of fast-charging stations on the DC-grid?
• How can the load flow be controlled with only minor communication needs?
Bibliography
[1] ABB drives the expansion of e-mobility fast charging infrastructure in Germany. Sept.2017.
[2] Ahmadi, M.; Mithulananthan, N., and Sharma, R. ‘Dynamic load control at a bi-directional DC fast charging station for PEVs in weak AC grids’. In: Power andEnergy Engineering Conference (APPEEC), 2015 IEEE PES Asia-Pacific. IEEE.2015, pp. 1–5.
[3] Akhavan-Rezai, E.; Shaaban, M.; El-Saadany, E., and Zidan, A. ‘Uncoordinatedcharging impacts of electric vehicles on electric distribution grids: Normal and fastcharging comparison’. In: Power and Energy Society General Meeting, 2012 IEEE.IEEE. 2012, pp. 1–7.
[4] Bakker, S.; Maat, K., and van Wee, B. ‘Stakeholders interests, expectations, andstrategies regarding the development and implementation of electric vehicles: Thecase of the Netherlands’. In: Transportation Research Part A: Policy and Practice 66(2014), pp. 52–64.
[5] Baumhöfer, T. ‘Statistische Betrachtung experimenteller Alterungsuntersuchungen anLithium-Ionen-Batterien’. Zugl.: Aachen, Techn. Hochsch., Diss., 2014. PhD thesis.Aachen, 2015, VI, 157 S. : Ill., graph. Darst.
[6] Bratzel, S. and Tellermann, R. AutomotiveINNOVATIONS Studie 2017. Center ofAutomotive Management, 2017.
[7] Budhia, M.; Covic, G. A.; Boys, J. T., and Huang, C. Y. ‘Development and evaluationof single sided flux couplers for contactless electric vehicle charging’. In: 2011 IEEEEnergy Conversion Congress and Exposition. Sept. 2011, pp. 614–621.
[8] Bundeministerium für Verkehr und digitale Infrastruktur. ‘Förderrichtlinie Ladeinfra-struktur für Elektrofahrzeuge in Deutschland’. In: (2017).
[9] Bundeministerium für Verkehr und digitale Infrastruktur. Gemeinsame Geschaefts-stelle Elektromobilität (GGEMO): Joint Electromobility Secretariat. 2018.
[10] Bundesinstitut fuer Bau-, Stadt- und Raumforschung. Indikatoren und Karten zurRaum- und Stadtentwicklung (INKAR). 2018.
[11] Bundesministerium fuer Verkehr, Bau und Stadtentwicklung. Die Mobilitaets- undKraftstoffstrategie der Bundesregierung (MKS): Energie auf neuen Wegen. 2011.
[12] Bundesministerium fuer Wirtschaft und Energie. Verordnung über technische Minde-stanforderungen an den sicheren und interoperablen Aufbau und Betrieb von öffentlichzugänglichen Ladepunkten für Elektromobile: Ladesäulenverordnung – LSV. 2016.
79
BIBLIOGRAPHY 80
[13] Bundesministerium für Verkehr und digitale Infrastruktur. Förderrichtlinie Elektro-mobilität des BMVI vom 05.12.2017. 2017.
[14] Bundesministerium für Wirtschaft und Technologie. Erste Verordnung zur Änderungder Ladesäulenverordnung. 2017.
[15] Bundesministerium für Wirtschaft und Technologie; Bundesministerium für Verkehr,Bau und Stadtentwicklung; Bundesministerium für Umwelt; Naturschutz und Reaktor-sicherheit, and Bundesministerium für Bildung und Forschung. RegierungsprogrammElektromobilität. 2011.
[16] Bundesnetzagentur. Aneige von Ladepunkten: Ladesäulenverordnung. 2017.[17] Burnham, A. et al. ‘Enabling fast charging – Infrastructure and economic considerati-
ons’. In: Journal of Power Sources 367 (2017), pp. 237–249.[18] Cao, Y.; Song, H.; Kaiwartya, O.; Zhou, B.; Zhuang, Y.; Cao, Y., and Zhang, X.
‘Mobile Edge Computing for Big-Data-Enabled Electric Vehicle Charging’. In: IEEECommunications Magazine 56.3 (2018), pp. 150–156.
[19] Chargemap.com. Public charging points in Germany. 2018.[20] Chen, W. and Guo, C. L. ‘The Impact of fast charging for EVs on Distribution System’.
In: Advanced Materials Research. Vol. 1070. Trans Tech Publ. 2015, pp. 1664–1667.[21] Christen, D.; Jauch, F., and Biel, J. ‘Ultra-fast charging station for electric vehicles
with integrated split grid storage’. In: 2015 17th European Conference on PowerElectronics and Applications (EPE’15 ECCE-Europe). Sept. 2015, pp. 1–11.
[22] Cloud Controlled Charging, Sept. 2017.[23] Cochran, J. et al. Flexibility in 21st century power systems. Tech. rep. National
Renewable Energy Laboratory (NREL), 2014.[24] Commission, I. C. et al. Initiative on Plug-in Electric Vehicles, Commonwealth Edison
Company, Initial Assessment of the Impact of the Introduction of Plug-in ElectricVehicles on the Distribution System. 2010.
[25] Daina, N.; Sivakumar, A., and Polak, J. W. ‘Modelling electric vehicles use: a surveyon the methods’. In: Renewable and Sustainable Energy Reviews 68 (2017), pp. 447–460.
[26] Demetriades, G. D. Evaluation of different topologies for high-power dc-dc converters.NR 20140805. 2001.
[27] DIN. DIN EN 62196 - Stecker, Steckdosen, Fahrzeugkupplungen und Fahrzeugstecker- Konduktives Laden von Elektrofahrzeugen.
[28] Doncker, R. W. A. A. D.; Divan, D. M., and Kheraluwala, M. H. ‘A three-phasesoft-switched high-power-density DC/DC converter for high-power applications’. In:IEEE Transactions on Industry Applications 27.1 (Jan. 1991), pp. 63–73.
[29] Du, Y.; Lukic, S.; Jacobson, B., and Huang, A. ‘Review of high power isolated bi-directional DC-DC converters for PHEV/EV DC charging infrastructure’. In: 2011IEEE Energy Conversion Congress and Exposition. Sept. 2011, pp. 553–560.
BIBLIOGRAPHY 81
[30] Dubarry, M.; Truchot, C.; Liaw, B. Y.; Gering, K.; Sazhin, S.; Jamison, D., andMichelbacher, C. ‘Evaluation of commercial lithium-ion cells based on compositepositive electrode for plug-in hybrid electric vehicle applications. Part II. Degradationmechanism under 2C cycle aging’. In: Journal of Power Sources 196.23 (2011),pp. 10336–10343.
[31] Dusmez, S.; Cook, A., and Khaligh, A. ‘Comprehensive analysis of high quality powerconverters for level 3 off-board chargers’. In: 2011 IEEE Vehicle Power and PropulsionConference. Sept. 2011, pp. 1–10.
[32] E.ON SE. E.ON and CLEVER are creating an electric highway from Norway to Italy.[33] Egbue, O. and Long, S. ‘Barriers to widespread adoption of electric vehicles: An
analysis of consumer attitudes and perceptions’. In: Energy Policy 48 (2012), pp. 717–729.
[34] Electric Mobility (NPE), G. N. P. f. Charging Infrastructure for Electric Vehicles inGermany - Progress Report and Recommendations 2015. Nov. 2015.
[35] Elektromobilität, N. P. The German Standardization Roadmap for Electromobility-Version 1.0. 1. 2012.
[36] Elliott, G. A. J.; Raabe, S.; Covic, G. A., and Boys, J. T. ‘Multiphase Pickups forLarge Lateral Tolerance Contactless Power-Transfer Systems’. In: IEEE Transactionson Industrial Electronics 57.5 (May 2010), pp. 1590–1598.
[37] Energiewende, A. Stromspeicher in der Energiewende. May 2014.[38] Europäische Union (EU). Richtlinie 2014/94/EU des Europäischen Parlaments und
des Rates vom 22. Oktober 2014 über den Aufbau der Infrastruktur für alternativeKraftstoffe. EUR-Lex. Oct. 2014.
[39] European Commission. Horizon 2020 - Smart, Green and Integrated Transport. 2018.[40] Farkas, C.; Szűcs, G., and Prikler, L. ‘Grid impacts of twin EV fast charging stations
placed alongside a motorway’. In: Energy (IYCE), 2013 4th International YouthConference on. IEEE. 2013, pp. 1–6.
[41] Freytag, B. ‘Ein Schwabe baut die größte Elektrotankstelle der Welt’. In: FrankfurterAllgeimeine Zeitung (Aug. 2017).
[42] Garcia-Trivino, P.; Fernandez-Ramirez, L. M.; Torreglosa, J. P., and Jurado, F.‘Control of electric vehicles fast charging station supplied by PV energy storagesystem grid’. In: Energy Conference (ENERGYCON), 2016 IEEE International.IEEE. 2016, pp. 1–6.
[43] Habib, S.; Khan, M. M.; Hashmi, K.; Ali, M., and Tang, H. ‘A Comparative Study ofElectric Vehicles Concerning Charging Infrastructure and Power Levels’. In: Frontiersof Information Technology (FIT), 2017 International Conference on. IEEE. 2017,pp. 327–332.
[44] Haghbin, S.; Lundmark, S.; Alakula, M., and Carlson, O. ‘An Isolated High-PowerIntegrated Charger in Electrified-Vehicle Applications’. In: IEEE Transactions onVehicular Technology 60.9 (Nov. 2011), pp. 4115–4126.
BIBLIOGRAPHY 82
[45] Harrison, G. and Thiel, C. ‘An exploratory policy analysis of electric vehicle salescompetition and sensitivity to infrastructure in Europe’. In: Technological Forecastingand Social Change 114 (2017), pp. 165–178.
[46] Hoek, H. v.; Neubert, M.; Kroeber, A., and Doncker, R. W. D. ‘Comparison of a single-phase and a three-phase dual active bridge with low-voltage, high-current output’.In: 2012 International Conference on Renewable Energy Research and Applications(ICRERA). Nov. 2012, pp. 1–6.
[47] IDTechEx. EV clustered charging can be problematic for electrical utilities. Sept. 2017.[48] ‘IEEE Standard Technical Specifications of a DC Quick Charger for Use with Electric
Vehicles’. In: IEEE Std 2030.1.1-2015 (Feb. 2016), pp. 1–97.[49] ika – Institut für Kraftfahrzeuge at RWTH Aachen University. SLAM: Schnellla-
denetz für Achsen und Metropolen: Übersichtskarte Schnellladenetz für Achsen undMetropolen (SLAM). 2017.
[50] innogy SE. E-Autos an Raststätten laden: Ein E-Mobility-Projekt mit Tank & Rast.2017.
[51] innogy SE. Streetscooter der Deutschen Post tanken Grün: Ein E-Mobility-Projektmit DHL. 2018.
[52] IONITY. Joint Venture der Automobilhersteller BMW Group, Daimler AG, FordMotor Company sowie des Volkswagen Konzerns mit Audi und Porsche. 2018.
[53] Jiang, H.; Brazis, P.; Tabaddor, M., and Bablo, J. ‘Safety considerations of wirelesscharger for electric vehicles’. In: 2012 IEEE Symposium on Product ComplianceEngineering Proceedings. Nov. 2012, pp. 1–6.
[54] Jung, C. ‘Power Up with 800-V Systems: The benefits of upgrading voltage powerfor battery-electric passenger vehicles’. In: IEEE Electrification Magazine 5.1 (Mar.2017), pp. 53–58.
[55] Käbitz, S. ‘Untersuchung der Alterung von Lithium-Ionen-Batterien mittels Elek-troanalytik und elektrochemischer Impedanzspektroskopie’. Veröffentlicht auf demPublikationsserver der RWTH Aachen University; Rheinisch-Westfälische Technis-che Hochschule Aachen, Diss., 2016. Dissertation. Aachen: Rheinisch-WestfälischeTechnische Hochschule Aachen, 2016, p. 258.
[56] Khaligh, A. and Dusmez, S. ‘Comprehensive Topological Analysis of Conductive andInductive Charging Solutions for Plug-In Electric Vehicles’. In: IEEE Transactionson Vehicular Technology 61.8 (Oct. 2012), pp. 3475–3489.
[57] Khan, A. R.; Mahmood, A.; Safdar, A.; Khan, Z. A., and Khan, N. A. ‘Load forecasting,dynamic pricing and DSM in smart grid: A review’. In: Renewable and SustainableEnergy Reviews 54 (2016), pp. 1311–1322.
[58] Kley, F.; Lerch, C., and Dallinger, D. ‘New business models for electric cars—Aholistic approach’. In: Energy Policy 39.6 (2011), pp. 3392–3403.
[59] Kraftfahrtbundesamt. Fahrzeugzulassungen: Bestand an Personenkraftwagen am 1.Januar 2017 nach Herstellern, Handelsnamen und ausgewählten Merkmalen. 2017.
BIBLIOGRAPHY 83
[60] Kraftfahrtbundesamt. Jahresbilanz des Fahrzeugbestandes am 1. Januar 2018. 2018.[61] Kraftfahrtbundesamt. Personenkraftwagen am 1. Januar 2018 nach ausgewählten
Merkmalen. 2018.[62] Kurth, M.; Gödde, M.; Schnettler, A.; Probst, A., and Pieper, D. ‘Determination of
the integration and influencing potential of rapid-charging systems for electric vehiclesin distribution grids’. In: 1st E-Mobility Power System Integration Symposium. 2017.
[63] Lehner, S. ‘Reliability assessment of lithium-ion battery systems with special emphasison cell performance distribution’. Dissertation, RWTH Aachen University, 2016.Dissertation. Aachen: RWTH Aachen University, 2017, ix, 184 Seiten : Illustrationen,Diagramme.
[64] Lewerenz, M.; Warnecke, A., and Sauer, D. U. ‘Post-mortem analysis on LiFePO4|Graphitecells describing the evolution & composition of covering layer on anode and theirimpact on cell performance’. In: Journal of Power Sources 369 (2017), pp. 122–132.
[65] Lucas, A.; Bonavitacola, F.; Kotsakis, E., and Fulli, G. ‘Grid harmonic impact ofmultiple electric vehicle fast charging’. In: Electric Power Systems Research 127(2015), pp. 13–21.
[66] Madina, C.; Zamora, I., and Zabala, E. ‘Methodology for assessing electric vehiclecharging infrastructure business models’. In: Energy Policy 89 (2016), pp. 284–293.
[67] Madlener, R.; Marano, V., and Veneri, O. ‘Vehicle Electrification: Main Concepts,Energy Management, and Impact of Charging Strategies’. In: Technologies andapplications for smart charging of electric and plug-in hybrid vehicles. Ed. by Veneri,O. Cham: Springer, 2017.
[68] Madzharov, N. D. and Tonchev, A. T. ‘Inductive High Power Transfer Technologiesfor Electric Vehicles’. In: Journal of Electrical Engineering 65.2 (2014), pp. 125–128.
[69] Marmaras, C.; Xydas, E., and Cipcigan, L. ‘Simulation of electric vehicle driverbehaviour in road transport and electric power networks’. In: Transportation ResearchPart C: Emerging Technologies 80 (2017), pp. 239–256.
[70] Mauri, G. and Valsecchi, A. ‘Fast charging stations for electric vehicle: The impact onthe MV distribution grids of the Milan metropolitan area’. In: Energy Conference andExhibition (ENERGYCON), 2012 IEEE International. IEEE. 2012, pp. 1055–1059.
[71] McKinsey & Company. Dynamics in the global electric-vehicle market. 2017.[72] Müller-Hellmann, A. and Schmitz, M. ‘Überlegungen zu zukünftigen Batteriebus-
Systemen’. In: Der Nahverkehr 9 (Sept. 2016).[73] Nationale Plattform Elektromobilität. Background: Find more about motivation and
goals. 2018.[74] Nationale Plattform Elektromobilität. Die Deutsche Normungs-Roadmap Elektromo-
bilität 2020.
BIBLIOGRAPHY 84
[75] Neubert, M.; Engel, S. P.; Gottschlich, J., and Doncker, R. W. D. ‘Dynamic powercontrol of three-phase multiport active bridge DC-DC converters for interconnection offuture DC-grids’. In: 2017 IEEE 12th International Conference on Power Electronicsand Drive Systems (PEDS). Dec. 2017, pp. 639–646.
[76] Neubert, M.; Gorodnichev, A.; Gottschlich, J., and Doncker, R. W. D. ‘Performanceanalysis of a triple-active bridge converter for interconnection of future dc-grids’. In:2016 IEEE Energy Conversion Congress and Exposition (ECCE). Sept. 2016, pp. 1–8.
[77] Nicholas, M.; Tal, G., and Ji, W. ‘Lessons from In-Use Fast Charging Data: Why AreDrivers Staying Close to Home’. In: Inst. Transp. Stud (2017).
[78] Reber, V. ‘New Possibilities with 800-Volt Charging’. In: Porsche Engineering MA-GAZINE (2017).
[79] Saqib, M.; Hussain, M. M.; Alam, M. S.; Beg, M. S., and Sawant, A. ‘Smart ElectricVehicle Charging Through Cloud Monitoring and Management’. In: Technology andEconomics of Smart Grids and Sustainable Energy 2.1 (2017), p. 18.
[80] Sarlioglu, B.; Han, D.; Noppakunkajorn, J., and Ogale, A. ‘Application engineeringof wide bandgap semiconductors’. In: ECS Transactions 58.4 (2013), pp. 399–411.
[81] Schill, W.-P. ‘Electric vehicles in imperfect electricity markets: The case of Germany’.In: Energy Policy 39.10 (2011), pp. 6178–6189.
[82] Schmalstieg, J.; Käbitz, S.; Ecker, M., and Sauer, D. ‘A holistic aging model forLi(NiMnCo)O2 based 18650 lithium-ion batteries’. In: 257 (July 2014), pp. 325–334.
[83] Schmitt, J.; Maheshwari, A.; Heck, M.; Lux, S., and Vetter, M. ‘Impedance changeand capacity fade of lithium nickel manganese cobalt oxide-based batteries duringcalendar aging’. In: Journal of Power Sources 353 (2017), pp. 183–194.
[84] Schroeder, A. and Traber, T. ‘The economics of fast charging infrastructure for electricvehicles’. In: Energy Policy 43 (2012), pp. 136–144.
[85] Schwierz, P. Weltpremiere: 800-Volt-Ladepark von Porsche in Berlin. 2017. url:https://www.electrive.net/2017/07/14/weltpremiere-800-volt-ladepark-von-porsche-in-berlin/.
[86] Shahid, S. and Agelin-Chaab, M. ‘Analysis of Cooling Effectiveness and TemperatureUniformity in a Battery Pack for Cylindrical Batteries’. In: Energies 10.8 (2017).
[87] Smith, M. and Castellano, J. ‘Costs associated with non-residential electric vehi-cle supply equipment’. In: Prepared by New West Technologies, LLC for the U.S.Department of Energy Vehicle Technologies Office (Nov. 2015).
[88] Soltau, N.; Stagge, H.; Doncker, R. W. D., and Apeldoorn, O. ‘Development anddemonstration of a medium-voltage high-power DC-DC converter for DC distributionsystems’. In: 2014 IEEE 5th International Symposium on Power Electronics forDistributed Generation Systems (PEDG). June 2014, pp. 1–8.
[89] Soltau, N.; Lenke, R. U., and Doncker, R. W. d. High-Power DC-DC Converter.Vol. 5,5. E.ON Energy Research Center series. Zweitveröffentlicht auf dem Publi-kationsserver der RWTH Aachen University 2016. Aachen: E.ON Energy ResearchCenter, RWTH Aachen Univ., 2014, 86 S.
BIBLIOGRAPHY 85
[90] Statista - Das Statistik-Portal. Anzahl der Ladestationen und der Anschlüsse fürElektrofahrzeuge in Deutschland im Zeitraum 3. Quartal 2016 bis 1. Quartal 2018(Stand: 14. März 2018). 2018.
[91] Statista - Das Statistik-Portal. Verteilung der Abrechnungssysteme öffentlicher La-desäulen fuer Elektrofahrzeuge in Deutschland (Stand: 30. Juni 2017). 2018.
[92] Statista - Das Statistik-Portal. Verteilung der Ladestationen fuer Elektrofahrzeuge inDeutschland nach Stationstyp (Stand: 01. Maerz 2018): ChargeMap.com. 2018.
[93] Statista - Das Statistik-Portal und Bundesverband der Energie- und Wasserwirtschafte. V. Anzahl der öffentlichen Ladestationen für Elektrofahrzeuge in den deutschenBundesländern (Stand: 30. Juni 2017). 2018.
[94] Statista - Das Statistik-Portal und Bundesverband der Energie- und Wasserwirtschafte. V. Städte in Deutschland mit der höchsten Anzahl an öffentlichen Ladepunkten fürElektrofahrzeuge (Stand: 30. Juni 2017). 2018.
[95] Statista - Das Statistik-Portal, Handelsblatt. Anzahl der öffentlich zugänglichenLadepunkte für Elektrofahrzeuge in Deutschland in den Jahren 2013 bis 2020. 2018.
[96] Statista - Das Statistik-Portal, Kraftfahrtbundesamt. Anzahl der Neuzulassungen vonElektroautos in Deutschland von 2003 bis Februar 2018. 2018.
[97] Statista - Das Statistik-Portal, Kraftfahrtbundesamt (KBA) & Aral. Anzahl derElektroautos in Deutschland von 2006 bis 2018. 2018.
[98] Steigerwald, R. L. ‘A comparison of half-bridge resonant converter topologies’. In:1987 2nd IEEE Applied Power Electronics Conference and Exposition. Mar. 1987,pp. 135–144.
[99] Steigerwald, R.; De Doncker, R., and Kheraluwala, H. ‘A comparison of high-powerDC-DC soft-switched converter topologies’. In: 32 (Oct. 1996), pp. 1139–1145.
[100] Steimer, P. K. ‘Power electronics building blocks - a platform-based approach topower electronics’. In: 2003 IEEE Power Engineering Society General Meeting (IEEECat. No.03CH37491). Vol. 3. July 2003, 1360–1365 Vol. 3.
[101] Steinhilber, S.; Wells, P., and Thankappan, S. ‘Socio-technical inertia: Understandingthe barriers to electric vehicles’. In: Energy Policy 60 (2013), pp. 531–539.
[102] Stieneker, M. and Doncker, R. W. D. ‘Medium-voltage DC distribution grids inurban areas’. In: 2016 IEEE 7th International Symposium on Power Electronics forDistributed Generation Systems (PEDG). June 2016, pp. 1–7.
[103] Stieneker, M.; J., M. B.; Arne, H., and W., D. D. R. ‘MVDC Distribution Grids forElectric Vehicle Fast-Charging Infrastructure’.
[104] Stippich, A. et al. ‘Key components of modular propulsion systems for next generationelectric vehicles’. In: CPSS Transactions on Power Electronics and Applications 2.4(Dec. 2017), pp. 249–258.
[105] Streit, T.; Chlond, B.; Weiß, C., and Vortisch, P. Deutsches Mobilitätspanel (MOP) –Wissenschaftliche Begleitung und Auswertungen Bericht. Jan. 2015.
BIBLIOGRAPHY 86
[106] Su, C.-L.; Yu, J.-T.; Chin, H.-M., and Kuo, C.-L. ‘Evaluation of power-quality fieldmeasurements of an electric bus charging station using remote monitoring systems’.In: Compatibility, Power Electronics and Power Engineering (CPE-POWERENG),2016 10th International Conference on. IEEE. 2016, pp. 58–63.
[107] Sun, B.; Dragičević, T.; Freijedo, F. D.; Vasquez, J. C., and Guerrero, J. M. ‘Acontrol algorithm for electric vehicle fast charging stations equipped with flywheelenergy storage systems’. In: IEEE Transactions on Power Electronics 31.9 (2016),pp. 6674–6685.
[108] Sun, X.-H.; Yamamoto, T., and Morikawa, T. ‘Fast-charging station choice behavioramong battery electric vehicle users’. In: Transportation Research Part D: Transportand Environment 46 (2016), pp. 26–39.
[109] Tan, L.; Wu, B., and Rivera, S. ‘A bipolar-DC-bus EV fast charging station withintrinsic DC-bus voltages equalization and minimized voltage ripples’. In: IECON2015 - 41st Annual Conference of the IEEE Industrial Electronics Society. Nov. 2015,pp. 002190–002195.
[110] Thiringer, T. and Haghbin, S. ‘Power Quality Issues of a Battery Fast ChargingStation for a Fully-Electric Public Transport System in Gothenburg City’. In: Batteries1.1 (2015), pp. 22–33.
[111] Vassileva, I. and Madlener, R. ‘Perceptions and Adoption of Evs for Private Useand Policy Lessons Learned’. In: Technologies and applications for smart charging ofelectric and plug-in hybrid vehicles. Ed. by Veneri, O. Cham: Springer, 2017.
[112] Vehicles, I. N. L. E. S. Ã. DC Fast Charger Fact Sheet: ABB Terra 53 CJ charging a2015 Nissan Leaf. June 2016.
[113] Weber, T. et al. Roadmap integrierte Zell- und Batterieproduktion. Jan. 2016.[114] Weydanz, W. and Jossen, A. Moderne Akkumulatoren richtig einsetzen. Jan. 2006.[115] Wienhausen, A. H.; Sewergin, A.; Engel, S. P., and Doncker, R. W. D. ‘Highly efficient
power inductors for high-frequency wide-bandgap power converters’. In: 2017 IEEE12th International Conference on Power Electronics and Drive Systems (PEDS). Dec.2017, pp. 442–447.
[116] Wienhausen, A. H. and Kranzer, D. ‘1 MHz Resonant DC/DC-Converter Using600 V Gallium Nitride (GaN) Power Transistors’. In: Silicon Carbide and RelatedMaterials 2012. Vol. 740. Materials Science Forum. Trans Tech Publications, Mar.2013, pp. 1123–1127.
[117] Yilmaz, M. and Krein, P. T. ‘Review of Battery Charger Topologies, ChargingPower Levels, and Infrastructure for Plug-In Electric and Hybrid Vehicles’. In: IEEETransactions on Power Electronics 28.5 (May 2013), pp. 2151–2169.
[118] Yunus, K.; De La Parra, H. Z., and Reza, M. ‘Distribution grid impact of plug-inelectric vehicles charging at fast charging stations using stochastic charging model’.In: Power Electronics and Applications (EPE 2011), Proceedings of the 2011-14thEuropean Conference on. IEEE. 2011, pp. 1–11.


E.ON Energy Research Center Series
ISSN: 1868-7415First Edition: Aachen, May 2018
E.ON Energy Research Center, RWTH Aachen University
Mathieustraße 1052074 AachenGermany
T +49 (0)241 80 49667F +49 (0)241 80 [email protected]