THÈSE / DISSERTATION
215
UNIVERSITÉ DE STRASBOURG ÉCOLE DOCTORALE DES SCIENCES DE LA VIE ET DE LA SANTÉ Architecture et Réactivité de l’ARN – UPR 9002 du CNRS et / und UNIVERSITÄT LEIPZIG FAKULTÄT FÜR BIOWISSENSCHAFTEN, PHARMAZIE UND PSYCHOLOGIE THÈSE / DISSERTATION présentée par / vorgelegt von Tina MÜLLER (ép. JÜHLING) soutenue le / verteidigt am 14.12.2016 pour obtenir le grade de Docteur de l’université de Strasbourg (Dr.) zur Erlangung des akademischen Grades Doctor rerum naturalium (Dr. rer. nat.) Discipline/Spécialité : Aspects moléculaires et cellulaires de la biologie im Fachgebiet : Biochemie ARNt « manchots » structure, fonctionnalité et évolution THÈSE co-dirigée par: Prof. FLORENTZ Catherine Professeur, IBMC, Université de Strasbourg Prof. MÖRL Mario Professeur, Institut de Biochimie, Université de Leipzig RAPPORTEURS : Prof. LAYER Gunhild Professeur, Institut de Biochimie, Université de Leipzig Prof. CHIHADE Joseph Professeur, Department of Chemistry, Carleton College AUTRES MEMBRES DU JURY : Prof. GIEGÉ Philippe Directeur de recherche, IBMP, Université de Strasbourg
-
Upload
khangminh22 -
Category
Documents
-
view
0 -
download
0
Transcript of THÈSE / DISSERTATION
UNIVERSITÉ DE STRASBOURG ÉCOLE DOCTORALE DES SCIENCES DE LA VIE ET DE LA SANTÉ
Architecture et Réactivité de l’ARN – UPR 9002 du CNRS
et / und
UNIVERSITÄT LEIPZIG FAKULTÄT FÜR BIOWISSENSCHAFTEN, PHARMAZIE UND PSYCHOLOGIE
THÈSE / DISSERTATION présentée par / vorgelegt von
Tina MÜLLER (ép. JÜHLING)
soutenue le / verteidigt am 14.12.2016
pour obtenir le grade de Docteur de l’université de Strasbourg (Dr.) zur Erlangung des akademischen Grades Doctor rerum naturalium (Dr. rer. nat.)
Discipline/Spécialité : Aspects moléculaires et cellulaires de la biologie im Fachgebiet : Biochemie
ARNt « manchots » structure, fonctionnalité et évolution
THÈSE co-dirigée par: Prof. FLORENTZ Catherine Professeur, IBMC, Université de Strasbourg Prof. MÖRL Mario Professeur, Institut de Biochimie, Université de Leipzig
RAPPORTEURS : Prof. LAYER Gunhild Professeur, Institut de Biochimie, Université de Leipzig Prof. CHIHADE Joseph Professeur, Department of Chemistry, Carleton College
AUTRES MEMBRES DU JURY : Prof. GIEGÉ Philippe Directeur de recherche, IBMP, Université de Strasbourg
Structure, function and evolution
of armless mitochondrial tRNAs
Der Fakultät für Biowissenschaften, Pharmazie und Psychologie
der Universität Leipzig
und / et
École Doctorale des Sciences de la Vie et de la Santé
Architecture et Réactivité de l’ARN – UPR 9002 du CNRS
Université de Strasbourg
eingereichte
D I S S E R T A T I O N / T H È S E
zur Erlangung des akademischen Grades / pour obtenir le grade de
DOCTOR RERUM NATURALIUM (Dr. rer. nat.)
und / et
DOCTEUR DE L’UNIVERSITÉ DE STRASBOURG (Dr.)
im Fachgebiet / Discipline-Specialité
Biochemie / Aspects Moléculaire et Cellulaires de la Biologie
vorgelegt von / présentée par Frau Master of Science
Tina Jühling (geb. Müller)
Geboren am / née le 25.07.1988 in Haldensleben
Leipzig, den 10.10.2016

Le présent travail a été réalisé du 01/10/2013 au 30/04/2015 dans le groupe de Prof. Dr. Mario Mörl à l'Institut de biochimie, Faculté de Biosciences, pharmacie et de psychologie, Université de Leipzig, et du 01/05/2015 au 31/12/2016, dans le groupe de Prof. Dr. Catherine Florentz à l’IBMC/CNRS UPR9002 de l’Université de Strasbourg. Die vorliegende Arbeit wurde vom 01.10.2013 bis zum 30.04.2015 in der Arbeitsgruppe von Prof. Dr. Mario Morl am Institut fur Biochemie der Fakultat fur Biowissenschaften, Pharmazie und Psychologie der Universität Leipzig, sowie vom 01.05.2015 bis zum 31.12.2016 in der Arbeitsgruppe von Prof. Dr. Catherine Florentz am IBMC/CNRS UPR9002 der Universität Strasbourg angefertigt.

Nothing in life is to be feared, it is only to be understood. Marie Curie (7 November 1867 – 4 July 1934)


Acknowledgments It is a great pleasure for me to thank all those who have directly or indirectly
contributed to this work during the last three years.
First of all, I want to thank the jury members Prof. Gunhild Layer (Institut für
Biochmie, Universität Leipzig), Prof. Joseph Chihade (Carleton College, Northfield,
Minnesota), and Prof. Philippe Giegé (IBMP, Université de Strasbourg), for their
interest in my work and its evaluation.
Foremost, I want to express my sincere gratitude to my two thesis directors Prof.
Catherine Florentz and Prof. Mario Mörl for sharing the responsibility of my joint PhD
project. I am very grateful for your trust and support over the past three years. I would
like to thank you, Catherine, for the opportunity to join your group again, five years after
I finished my Bachelor thesis in your team. Then as now, I spent a wonderful time in
your group and had benefit a lot from your immense knowledge and guidance during my
research and writing of this thesis. I also want to thank you, Mario, for the heartily
admission in your team during my time in Leipzig. I appreciated very much the
continuous support during the course of my PhD study as well as your patience,
motivation, and enthusiasm for my project.
I want to express my deepest gratitude to my advisor Dr. Joern Pütz, for his great
support during my several stays at Strasbourg that started already during the French-
German Bachelor program. Thanks to you, I spent a wonderful time as an Erasmus
student in Strasbourg, and discovered the interesting world of tRNAs during my
internship and Bachelor thesis. I thank you for all the help and support that you spent to
establish this “Cotutelle de thèse”. I am very grateful that you always had an open ear for
my little and big problems. Your comforting and encouraging words motivated me a lot.
Thank you for all!

I also acknowledge Dr. Heike Betat and Dr. Marie Sissler, for their conscientious
guidance, support, valuable help, and for all the encouragements during the last three
years. Thank you very much for answering my numerous questions, for your helpful
advises and stimulating discussions.
In addition, I would like to thank Prof. Jens Wöhnert, Dr. Elke Duchardt-Ferner, and
Dr. Claude Sauter for their collaboration and help to determine the structures of
armless tRNAs.
I want to say “Danke”, “merci” and “thank you” to all my colleagues in Leipzig and
Strasbourg. Thanks to you, working together in the laboratories has been a lot of fun. I
will never forget our common barbecues, hiking trips, bocha games, and drinking
evenings. Thank you Agnes, Anette, Bernard, Christian, Claude, Elena, Felix, Gesine,
Karoline, Maja, Marie, Loukmane, Oliver, Oscar, Pablo, Paul, Raphael, Rebecca,
Sandra, Sonja, Tobias, and Ulrike for a great atmosphere and a wonderful time.
I want especially thank my parents Sigrid and Fritz Muller for their endless love and
moral, and of course, for their financial support. You supported me always when I
needed your help, consoled me when I was sad, and got excited when I was happy. To
say it shortly, you have always been there for me.
To my love Frank, I want to say that you delight my life. I am very grateful that you have
accompanied me through the ups and downs of this work, and that you always stayed on
my side. Without your contribution to the discovery of armless tRNAs, this thesis work
might have not arisen. I am so glad to spend my life with you and love you
wholeheartedly.
Last but not least, I want to thank all my friends in Leipzig and Strasbourg, who directly
or indirectly helped me to complete this thesis, especially Alexis for my daily “lab
dance”, and Caro, Maja, Anne-So and Red for having enriched my life outside the lab.

1
Bibliographic references and abstract
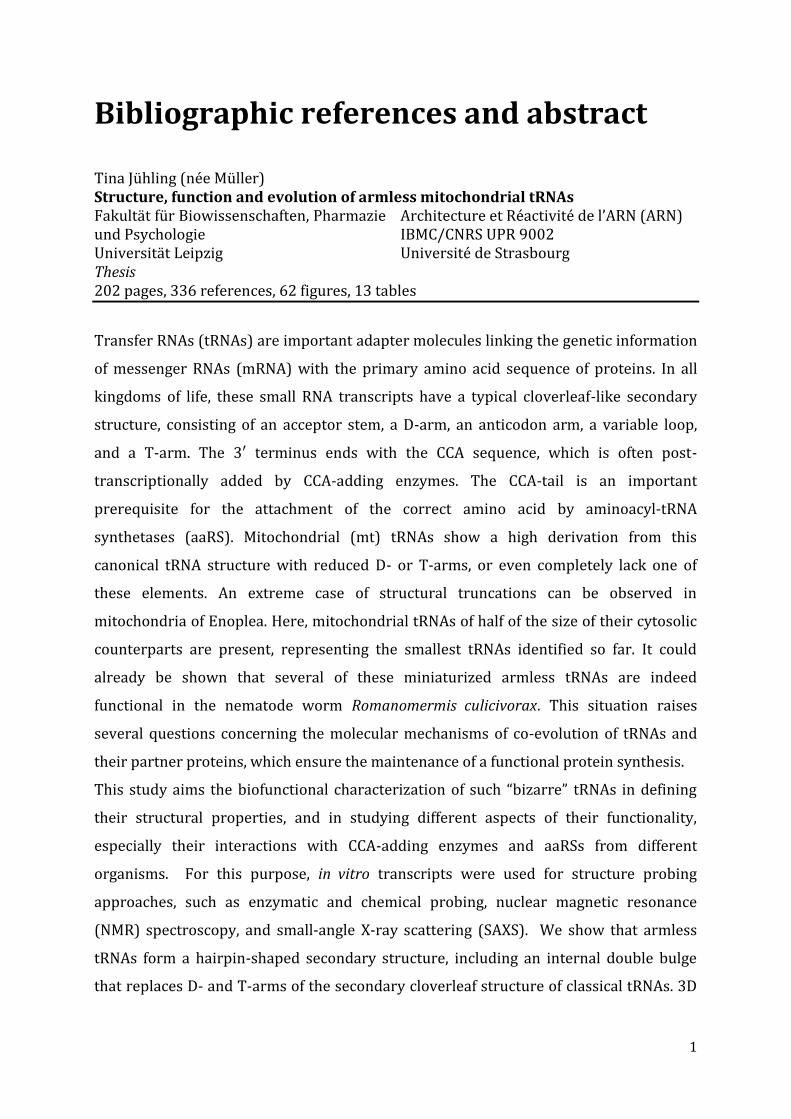
Tina Jühling (née Müller) Structure, function and evolution of armless mitochondrial tRNAs Fakultät für Biowissenschaften, Pharmazie und Psychologie Universität Leipzig
Architecture et Réactivité de l’ARN (ARN) IBMC/CNRS UPR 9002 Université de Strasbourg
Thesis 202 pages, 336 references, 62 figures, 13 tables
Transfer RNAs (tRNAs) are important adapter molecules linking the genetic information
of messenger RNAs (mRNA) with the primary amino acid sequence of proteins. In all
kingdoms of life, these small RNA transcripts have a typical cloverleaf-like secondary
structure, consisting of an acceptor stem, a D-arm, an anticodon arm, a variable loop,
and a T-arm. The 3′ terminus ends with the CCA sequence, which is often post-
transcriptionally added by CCA-adding enzymes. The CCA-tail is an important
prerequisite for the attachment of the correct amino acid by aminoacyl-tRNA
synthetases (aaRS). Mitochondrial (mt) tRNAs show a high derivation from this
canonical tRNA structure with reduced D- or T-arms, or even completely lack one of
these elements. An extreme case of structural truncations can be observed in
mitochondria of Enoplea. Here, mitochondrial tRNAs of half of the size of their cytosolic
counterparts are present, representing the smallest tRNAs identified so far. It could
already be shown that several of these miniaturized armless tRNAs are indeed
functional in the nematode worm Romanomermis culicivorax. This situation raises
several questions concerning the molecular mechanisms of co-evolution of tRNAs and
their partner proteins, which ensure the maintenance of a functional protein synthesis.
This study aims the biofunctional characterization of such “bizarre” tRNAs in defining
their structural properties, and in studying different aspects of their functionality,
especially their interactions with CCA-adding enzymes and aaRSs from different
organisms. For this purpose, in vitro transcripts were used for structure probing
approaches, such as enzymatic and chemical probing, nuclear magnetic resonance
(NMR) spectroscopy, and small-angle X-ray scattering (SAXS). We show that armless
tRNAs form a hairpin-shaped secondary structure, including an internal double bulge
that replaces D- and T-arms of the secondary cloverleaf structure of classical tRNAs. 3D

2
structures are characterized by a high intrinsic flexibility, which probably allows to
compensate structural reduction.
The Rcu CCA-adding enzyme and mt ArgRS coding sequences have been identified, and
were cloned for the first time. Recombinant proteins have been studied for their
interaction with armless and cytosolic tRNAs in CCA-incorporations assays, and
aminoacylation assays. We demonstrate that armless mt tRNAs represent functional
molecules for CCA-incorporation, indicating adaptations of CCA-adding enzymes to
armless tRNAs without losing their ability to recognize cytosolic tRNAs. Initial tests
could not demonstrate aminoacylation activity of the Rcu mt ArgRS. However, the mt
ArgRS from R. culicivorax exhibits a structural particularity because it lacks an
important domain that normally recognizes the elbow region of tRNAs that is no longer
present in armless tRNAs due to the missing D-and T-arm. This suggests a co-evolution
event of both partner molecules.
3
Abbreviations A: Adenine A: Ampere aaRS: aminoacyl-tRNA synthetase APS: Ammonium persulfate ArgRS: Arginyl-tRNA synthetase ATP: Adenosine triphosphate bp: base pair BSA: Bovine Serum Albumin C: Cytosine CaCl2: Calcium chloride cDNA: complementary DNA CTP: Cytidine triphosphate Cyt: cytosolic Da: Dalton ddH2O: double-distilled water DMSO: Dimethyl sulfoxide DNA: Desoxyribonucleic acid dNTPs: Desoxyribonucleotide DTT: Dithiothreitol E. coli (Eco): Escherichia coli EDTA: Ethylenediaminetetraacetic acid EF-Tu: Elongation factor thermo unstable EtOH: Ethanol G: Guanine GTP: Guanosine triphosphate HDV: Hepatitis Delta Virus HEPES: Hydroxyethylpiperazineethanesulfonic acid HH: hammerhead H. sapiens (Hsa): Homo sapiens IEC: Ion exchange chromatography IPTG: Isopropyl β-D-1-thiogalactopyranoside KCl: Potassium chloride L: liter LB: Lysogeny broth medium mRNA: messenger RNA mt: mitochondrial MTS: mitochondrial targeting sequence MgCl2: Magnesium chloride
NaAc: Sodium acetate NaCl: Sodium chloride Ni-NTA: Nickel Nitrilotriacetic acid nt: nucleotide OD600: optic density at 600 nm ORF: open reading frame PAA: Polyacrylamide PAGE: Polyacrylamide gel electrophoresis PCR: Polymerase chain reaction PEG: Polyethylene glycol pI: isoelectric point PNK: Polynukleotidkinase R. culicivorax (Rcu): Romanomermis culicivorax RNA: Ribonucleic acid rRNA: ribosomal RNA S. cerevisiae (Sce): Saccharomyces cerevisiae SDS: Sodium dodecyl sulfate SEC: Size Exclusion Chromatography SOB: super optimal broth medium T: Thymine Taq: Thermus aquaticus TBE: Tris-Borat-EDTA TCA: Trichloroacetic acid TEMED: N,N,N’,N’- Tetramethylethane-diamine TIPP: thermostable inorganic Pyrophosphatase Tm: melting temperature Tris: Trishydroxymethylaminomethane tRNA: transfer RNA TTP: Thymidine triphosphate U: Uracile UTP: Uridine triphosphate UTR: untranslated region v/v: volume to volume ratio wt: wild-type w/v: weight to volume ratio
Amino acids were abbreviated as recommended by the IUPAC-IUB Joint Commission on Biochemical Nomenclature (1984). Units were used as specified in the IUPAC compendium of Chemical Terminology. Furthermore, commonly used abbreviations have been used.

4
5
Contents
INTRODUCTION ................................................................................................................ 9 1. Exploring the RNA world: From origins of life to contemporary RNA ............................................... 10
1.1. Once up one a time - The early RNA world ............................................................................................. 10 1.2. Non-coding RNAs in the modern RNA world ......................................................................................... 12
2. Transfer RNAs : canonical structure, structural evolution and origin .............................................. 15 2.1. Cytosolic tRNAs ....................................................................................................................................................... 15 2.2. Mitochondrial tRNAs ........................................................................................................................................... 17 2.3. Armless mitochondrial tRNAs ........................................................................................................................ 22 2.4. tRNA-derived fragments (tRFs) - a novel class of small RNAs ..................................................... 24 2.5. Evolution and origin of tRNAs ........................................................................................................................ 26
3. tRNA biogenesis and function .................................................................................................................................... 26 3.1. From primary transcripts to functional tRNA molecules .............................................................. 27
4. Structure and function of CCA-adding enzymes .............................................................................................. 34 5. Structure and function of aminoacyl-tRNA synthetases............................................................................. 40 6. Objectives of the study ................................................................................................................................................... 43
6.1. Structural characterization of armless mitochondrial tRNAs .................................................... 43 6.2. Functional study of armless tRNA maturation and aminoacylation ....................................... 44
MATERIAL & METHODS ................................................................................................... 45 7. Material ................................................................................................................................................................................... 46
7.1. Sources for chemicals.......................................................................................................................................... 46 7.2. Kits ................................................................................................................................................................................. 46 7.3. Enzymes and tRNAs .............................................................................................................................................. 46 7.4. Cell material .............................................................................................................................................................. 47 7.5. Bacterial strains and plasmids ...................................................................................................................... 48 7.6. Primers ........................................................................................................................................................................ 48 7.7. Media, buffers and solutions ........................................................................................................................... 50 7.8. Software and databases ..................................................................................................................................... 56
8. Methods ................................................................................................................................................................................... 58 8.1. General nucleic acid methods ........................................................................................................................ 58
8.1.1. Measurement of DNA and RNA concentrations .................................................................................... 58 8.1.2. Extraction and precipitation of DNA and RNA ...................................................................................... 58 8.1.3. DNA sequencing .................................................................................................................................................. 58
8.2. DNA manipulation ................................................................................................................................................. 59 8.2.1. PCR Methods ......................................................................................................................................................... 59 8.2.2. Cloning of DNA fragments .............................................................................................................................. 61 8.2.3. Plasmid purification for cloning and sequencing ................................................................................. 61 8.2.4. Restriction analysis of DNA............................................................................................................................ 62 8.2.5. Agarose gel electrophoresis ........................................................................................................................... 62
8.3. RNA manipulation ................................................................................................................................................. 62 8.3.1. RNA preparation from R. culicivorax ......................................................................................................... 62 8.3.2. mRNA purification from total RNA ............................................................................................................. 63 8.3.3. 5’-Rapid amplification of cDNA ends (RACE)......................................................................................... 63
8.4. tRNA manipulation ............................................................................................................................................... 64 8.4.1. Construction of tRNA transcription templates ...................................................................................... 64 8.4.2. In vitro Transcription ........................................................................................................................................ 66 8.4.3. Separation of RNA via denaturing PAGE and detection .................................................................... 67 8.4.4. Extraction of RNA from denaturing polyacrylamide gels ................................................................. 67 8.4.5. 3’–end dephosphorylation ............................................................................................................................. 67 8.4.6. 5’-end labeling of tRNAs .................................................................................................................................. 68
8.5. Determination of tRNA structures ............................................................................................................... 68 8.5.1. Native polyacrylamid-gelelectrophoresis (native PAGE) ................................................................. 68 8.5.2. Enzymatic analysis ............................................................................................................................................. 68 8.5.3. In-line Probing ..................................................................................................................................................... 69 8.5.4. Alkaline Hydrolysis ............................................................................................................................................ 69
6
8.5.5. Nuclear magnetic resonance (NMR) spectroscopy ............................................................................. 70 8.5.6. Small angle X-ray scattering (SAXS) ........................................................................................................... 70
8.6. E. coli culture and transformation ............................................................................................................... 72 8.6.1. Plating ...................................................................................................................................................................... 72 8.6.2. Liquid Cultures .................................................................................................................................................... 72 8.6.3. Storage ..................................................................................................................................................................... 72 8.6.4. Chemical transformation of E. coli .............................................................................................................. 72 8.6.5. Transformation by electroporation of E. coli ......................................................................................... 73 8.6.6. Expression of recombinant proteins in E. coli ....................................................................................... 73
8.7. Handling of S. cerevisiae .................................................................................................................................... 74 8.7.1. Gene construct ..................................................................................................................................................... 74 8.7.2. Transfection of S. cerevisiae ........................................................................................................................... 74 8.7.3. Protein overexpression in S. cerevisiae ..................................................................................................... 74
8.8. In vitro translation ................................................................................................................................................ 75 8.9. Protein Methods ..................................................................................................................................................... 75
8.9.1. Purification of Rcu CCA-adding enzyme ................................................................................................... 75 8.9.2. Purification of Rcu mt ArgRS ......................................................................................................................... 77 8.9.3. Protein Separation in SDS-polyacrylamide gel electrophoresis .................................................... 78 8.9.4. Western blot analysis ....................................................................................................................................... 78
8.10. Protein Activity assays ....................................................................................................................................... 78 8.10.1. CCA-incorporation assay ........................................................................................................................... 78 8.10.2. Aminoacylation assay ................................................................................................................................. 79
RESULTS ......................................................................................................................... 81
CHAPTER 1: Genomic analysis of the nematode worm R. culicivorax .......................................................... 82 9. Analysis of mitochondrial small and large rRNA in R. culicivorax........................................................ 84
CHAPTER 2: Structural characterization of armless mt tRNAs ....................................................................... 86 10. Primary sequence analysis of armless mt tRNA genes................................................................................ 86 11. Construction of DNA templates and in vitro transcription of tRNAs without ................................ 90 3’-CCA-end ......................................................................................................................................................................................... 90 12. Structural analysis of armless mitochondrial tRNAs ................................................................................... 92
12.1. Analysis of RNA conformation by native PAGE .................................................................................... 92 12.2. Secondary structure analysis by enzymatic probing ....................................................................... 93 12.3. Secondary structure analysis by in-line probing ................................................................................ 97 12.4. tRNA structure analysis by NMR ................................................................................................................ 100
12.4.1. Effect of temperature and Mg2+ to the proton spectra of mt tRNAArg ................................. 100 12.1.1. Effect of temperature and Mg2+ to the proton spectra of mt tRNAIle ................................... 101
12.2. tRNA structure analysis by SAXS ............................................................................................................... 103 12.2.1. Separation by chromatography ........................................................................................................... 103 12.2.2. SAXS data collection ................................................................................................................................. 104 12.2.3. The Guinier plot .......................................................................................................................................... 105 12.2.4. The pair-distance distribution function .......................................................................................... 106 12.2.5. 3D modeling ................................................................................................................................................. 108
13. Discussion ........................................................................................................................................................................... 110 13.1. Structural characteristics of in vitro transcribed mt tRNAArg and mt tRNAIle .................. 110 13.2. Stability of armless mt tRNAs ...................................................................................................................... 114 13.3. Evolution of armless mt tRNAs ................................................................................................................... 115
CHAPTER 3: Structural and functional characterization of the mt CCA-adding enzyme from R. culicivorax ........................................................................................................................................................................ 118
13. Sequence alignment and comparison of CCA-adding enzymes ........................................................... 119 14. Cloning, expression and purification of the recombinant CCA-adding enzyme ........................ 121
14.1. Expression in S. cerevisiae ............................................................................................................................. 122 14.2. In vitro protein translation ........................................................................................................................... 122 14.3. Expression in E. coli BL21 (DE3) ................................................................................................................ 123 14.4. Expression in E. coli Rosetta-gami 2 ........................................................................................................ 125
7
14.5. Expression in E. coli Arctic Express (DE3)............................................................................................ 126 15. Activity test of the recombinant CCA-adding enzyme from R. culicivorax .................................... 127 16. Discussion ........................................................................................................................................................................... 130
16.1. Preparation of mt CCA-adding enzyme from R. culicivorax ....................................................... 130 16.2. Functional characterization of CCA-adding enzymes .................................................................... 131 16.3. Structural characterization of Rcu CCA adding enzyme in an evolutionary context .. 133
CHAPTER 4: Structural and functional characterization of the mitochondrial arginyl-tRNA synthetase from R. culicivorax ................................................................................................................................. 135
17. Identification of mitochondrial ArgRS from R. culicivorax and sequence comparison ........ 136 18. Cloning, expression and purification of Rcu mt ArgRS ............................................................................. 140
18.1. Cloning of different ArgRS variants ......................................................................................................... 140 18.2. Expression of FL, P24, V30, G36 in E. coli .............................................................................................. 142 18.3. Expression of D16, C25, D28, and S29 in E. coli ................................................................................. 143 18.4. Purification of Rcu ArgRS variants D16 and S29 .............................................................................. 144
19. Aminoacylation assays ................................................................................................................................................ 145 20. Discussion ........................................................................................................................................................................... 149
20.1. Identification and preparation of Rcu mt ArgRS .............................................................................. 149 20.2. Functional characterization of Eco, Sce and Rcu (S29) ArgRS interacting with armless mt tRNAArg ................................................................................................................................................................................. 150 20.3. Co-evolution of Rcu mt ArgRS and armless tRNAs .......................................................................... 153
CONCLUSION & PERSPECTIVES ...................................................................................... 155 21. The role of tRNAs in the RNA world ............................................................................................................... 156
21.1. Do armless tRNAs exist in vivo? .................................................................................................................. 157 21.2. Do armless tRNAs fold into classical structures? ............................................................................. 157 21.1. Are armless tRNAs biological relevant? ................................................................................................ 158 21.3. Did evolutionary adaptation take place? ............................................................................................. 159 21.1. Do armless tRNAs fulfill alternative functions? ................................................................................ 160
22. General conclusion and perspectives ........................................................................................................... 161
RÉSUMÉ & ZUSAMMENFASSUNG .................................................................................. 163
LIST OF FIGURES ............................................................................................................ 180
LIST OF TABLES ............................................................................................................. 181
REFERENCES ................................................................................................................. 183
CURRICULUM VITAE ...................................................................................................... 203
EIGENSTÄNDIGKEITSERKLÄRUNG .................................................................................. 205

8

9
INTRODUCTION
10
1. Exploring the RNA world: From origins of life to contemporary RNA
Scientists have always wondered about the origin of life, and many theories have been
developed. Certainly, no simple and clear answer can be given on this issue yet. Today, it
is believed that ribonucleic acids (RNA) arose very early in evolution, and that they
belong to the oldest molecules on Earth (Alberts B, Johnson A, Lewis J, et al., 2002;
Robertson and Joyce, 2012). RNAs have long been underestimated. First, they have been
perceived just as a blueprint of deoxyribonucleic acid (DNA) that allows the formation of
proteins by encoding the genetic information (Crick, 1968). But due to intensive studies,
we have a better understanding about RNAs now. It is nowadays known that RNAs are
versatile molecules that fulfill multiple roles in living cells. Beside its role as a key
component of protein biosynthesis (e.g., in the forms of mRNA, tRNA, and rRNA) (Lodish
H, Berk A, Zipursky SL, et al., 2000), it can act as enzymes (Doherty and Doudna, 2001),
occupy different sub-cellular structures (Nevo-Dinur et al., 2012), regulate the splicing
machinery (Konarska and Query, 2005), and control gene expression through a variety
of mechanisms (Cannell et al., 2008). Interestingly, there is increasing evidence that RNA
encoded genetic information long before DNA, and has played a crucial role in the early
evolution of life on Earth (Gilbert, 1986; Orgel, 1968). Our present knowledge about
RNA can be told from two perspectives that belong to two different worlds. One is the
“primordial RNA world” in which RNA functioned at once as information storage and
biocatalyst, long before the arising of DNA, and secondly the “contemporary RNA world”
in which mRNA, long non-coding RNA, and small non-coding RNA (e.g., tRNA, siRNA,
miRNA, and a variety of other RNAs) play a central role (Robertson and Joyce, 2012;
Eddy, 2001).
1.1. Once up one a time - The early RNA world
Since the discovery of the DNA structure by Watson and Crick in 1953 (Watson and
Crick, 1953), DNA and proteins have been described as dominant macromolecules in the
living cell, while RNA was thought to act only as a supporting tool to create proteins
from the DNA templates (Crick, 1968). Today, we know that the expression of genetic
information requires a highly complex machinery. The question is, how did this
machinery arise? One theory is that an RNA world existed on Earth before modern cells
arose. The term early or primordial “RNA world” was first used by W. Gilbert in 1986 to
describe the hypothesis that RNA may have evolutionarily predated DNA and proteins
11
(Gilbert, 1986). This hypothesis is based on the breakthrough discovery of catalytic RNA
that can serve not only as a genetic information carrier, but also as a catalyst that could
have originally carried out both, catalysis and replication (Cech, 1986). RNA molecules
that possess catalytic activity are called “ribozymes”, a composition of “RNA” and
“enzyme” (Joyce, 1996). A ribozyme with self-splicing activity was first discovered by T.
Cech in the cilated protozoa Tetrahymena thermophile, where a self-splicing RNA was
found inside an intron of an mRNA transcript that can remove itself from the transcript
(Cech, 1986). Another catalytic RNA was identified by S. Altman and colleagues, who
were studying the bacterial ribonuclease-P complex in Escherichia coli, where the RNA
content of the enzyme is responsible for the cleavage of the phosphodiester bond of
immature pre-tRNAs (Guerrier-Takada et al., 1983). T. Cech and S. Altman were honored
in 1989 with the Nobel Prize in chemistry for their "discovery of catalytic properties of
RNA."
A further interesting example of a ribozyme are ribosomes because their catalytic site is
composed exclusively of RNA that catalyzes specifically peptide bond formation. This
was confirmed with the deciphering of the 3D structure of the ribosome in 2000 (Ban et
al., 2000; Schluenzen et al., 2000; Yusupov et al., 2001). These findings revealed
important insights into reaction mechanisms and evolution because it was shown that
protein enzymes would not have been necessarily needed to catalyze the synthesis of
new RNA at the beginning of evolution. Additionally, many critical cofactors, e.g., ATP,
Acetyl-CoA, and NADH, are either nucleotides or related to them, and many components
of the cell are composed partially or entirely of RNA and represent remnants of the RNA
world (Cech, 2012; Yarus, 2011). Thus it seems likely that an RNA world existed initially
at the beginning of the evolution of life, while DNA and proteins appeared later (Gilbert,
1986). The next question is, why and how did then proteins and DNA arise from a RNA
world? Probably RNA could bind and arrange activated amino acids based on an RNA
template as it is the case inside the ribosomal core. That would lead to first proteins
with a faster and more efficient enzymatic activity, replacing the role of RNA. Finally,
DNA could have appeared by reverse transcription from an RNA molecule, and thus
could have taken over the role of information storage due to its increased stability
(Alberts B, Johnson A, Lewis J, et al., 2002).
The RNA world hypothesis is widely accepted today, and the chicken and egg problem
seems to be solved for the question about what was first, DNA or protein (Cech, 2012;
12
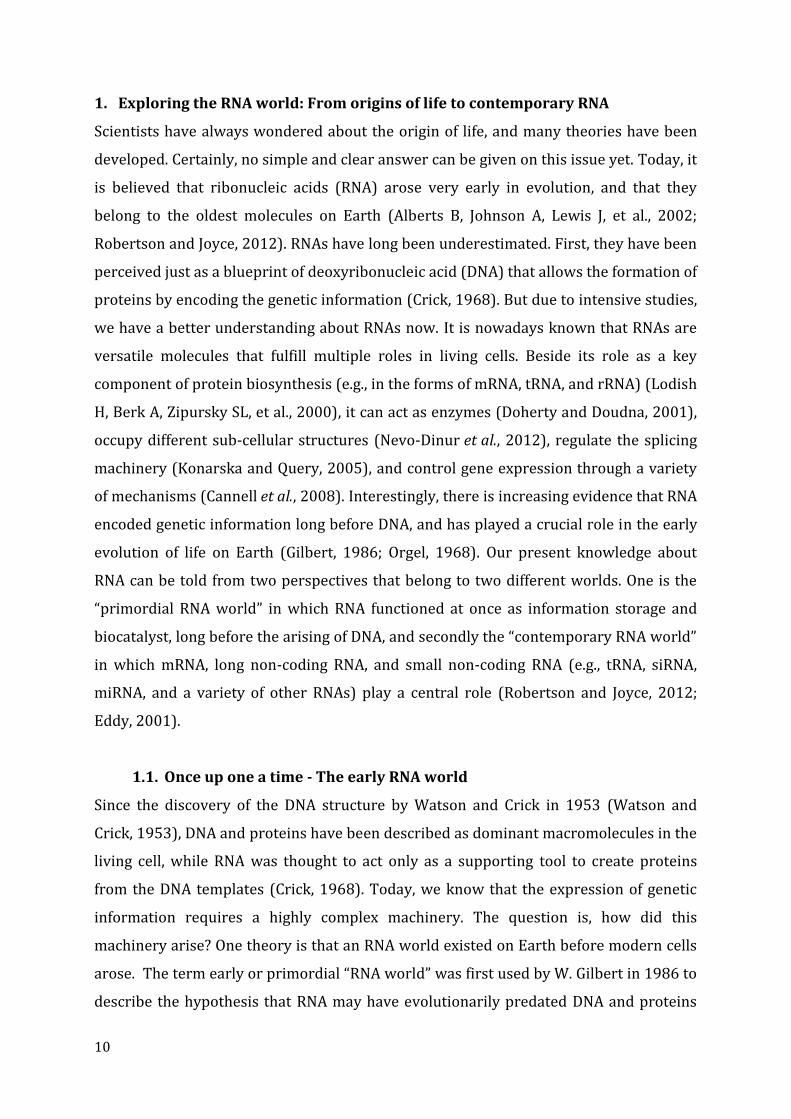
Lehman, 2010). A summary of probable events during the evolution of the “early RNA
world” as presented by Cech is given in Figure 1.
While coding RNAs have an important role as a physical intermediate during the
translation of DNA into protein, also RNA molecules that do not encode proteins, so-
called non-coding RNAs (ncRNAs), were shown to be indispensable for many cellular
processes (Mattick and Makunin, 2006). The analysis of genomic, transcriptomic and
proteomic data revealed, that almost the entire genomic DNA is transcriptionally active
in eukaryotes, but only 5 to 15 % are actually translated into proteins, whereas the vast
majority of active DNA was found to be transcribed into functional ncRNAs (The
ENDCODE project consortium, 2012). During the last decades, the understanding of the
diversity and the role of ncRNAs has considerably expanded. A multitude of ncRNAs are
known to play key roles in a number of biological processes required for cell viability
and function in both, prokaryotes and eukaryotes (Mattick and Makunin, 2006; Cao,
2014).
Figure 1: RNA world model. An RNA world model for the successive appearance of RNA, proteins and DNA during the evolution of life on Earth (modified from Cech, 2012).
1.2. Non-coding RNAs in the modern RNA world
The best known representatives of ncRNAs are likely to be transfer RNAs (tRNA) and
ribosomal RNAs (rRNA). Both play a decisive role in the translation of genetic
information into proteins. In 1955, Francis Crick was the first that pronounced an
“adapter hypothesis”. He predicted an adaptor molecule that mediates the translation of
genetic information, encoded in DNA or RNA, into the sequence of amino acid of proteins
(Crick, 1955). This “adapter hypothesis” was convincingly confirmed by the discovery of
tRNA molecules in 1956, and its adapter function in the course of the translation process
(Zamecnik et al., 1956). During the 1950s, RNA was also found to be a structural
component of ribosomes (Palade, 1955). Because neither tRNA nor rRNA carries
instructions for specific proteins, they are referred to as ncRNAs.
Besides rRNAs and tRNAs, a large number of other ncRNAs exist in eukaryotic and
prokaryotic cells. They can be grouped into long and small ncRNAs. These molecules
13
own a variety of important functions, and it is supposed that many of them have not
been validated for their function yet (Wilusz et al., 2009; Mattick and Makunin, 2006). Of
particular interest for this work is the very diverse group of small regulatory RNAs
(sRNAs). This group has been classified into a number of sub-categories, such as small
nuclear RNAs (snRNA), small nucleolar RNAs (snoRNA), small interfering RNAs (siRNA),
micro RNAs (miRNA) (Mattick and Makunin, 2005). They are involved in many cellular
processes like translation, RNA splicing, DNA replication, or in gene regulation. A
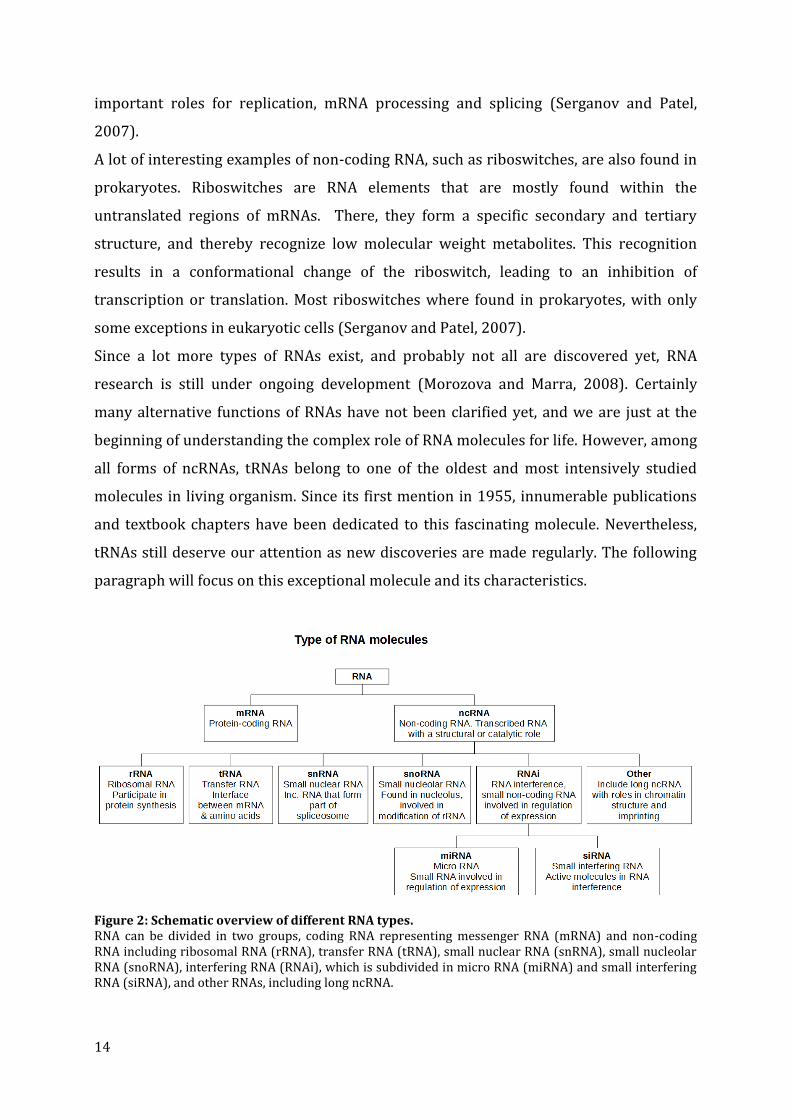
summary of all known types of ncRNAs is given in Figure 2.
snRNA are involved in splicing of RNA exons, and play therefore a critical role in gene
regulation. The most abundant molecules of this group are U1, U2, U5 and U4/U6, which
are found inside the nucleus. They are involved in the splicing of pre-mRNAs, a crucial
step during the maturation of mRNAs (Valadkhan and Gunawardane, 2013). snoRNAs
are mostly found inside the nucleolus, where they are involved in the processing and
modification of ribosomal RNAs. snoRNAs are associated with proteins in a complex,
called small nucleolar ribonucleoprotein particle (snoRNP). The modifications
introduced by one of the two classes of snoRNAs (i.e., S/D box or H/ACA box families)
are either methylations or pseudouridylation of specific nucleosides in immature rRNAs,
which are essential for the function of the ribosome during translation (Kiss, 2002).
Micro RNAs are a class of small RNA molecules (between 22 to 26 nt long), which bind to
complementary mRNAs. They often regulate gene expression by an inhibition of
translation. Initially, miRNAs were found in the nematode Caenorhabditis elegans, but
have been later identified in a wide variety of other species (e.g. in flies, mice, and
humans) (He and Hannon, 2004).
siRNA are single or double stranded RNA molecules that are 20 bp to 25 bp long, and are
formed by cleavage of large double-stranded RNA molecules. siRNAs are expressed in
various cell types, often with the aim to destroy foreign RNA after an infection with an
RNA virus. Furthermore, siRNA play a role in gene regulation via post transcriptional
gene silencing through determining selectivity (McManus and Sharp, 2002). Beyond
that, miRNA and siRNA are used as a major scientific tool to inhibit the expression of
specific genes in cells during in vivo and in vitro experiments (Divan, 2013).
As mentioned above, another group of RNAs with catalytic activity are commonly
referred to as ribozymes. In addition to their role for the origin of life, they play
14
important roles for replication, mRNA processing and splicing (Serganov and Patel,
2007).
A lot of interesting examples of non-coding RNA, such as riboswitches, are also found in
prokaryotes. Riboswitches are RNA elements that are mostly found within the
untranslated regions of mRNAs. There, they form a specific secondary and tertiary
structure, and thereby recognize low molecular weight metabolites. This recognition
results in a conformational change of the riboswitch, leading to an inhibition of
transcription or translation. Most riboswitches where found in prokaryotes, with only
some exceptions in eukaryotic cells (Serganov and Patel, 2007).
Since a lot more types of RNAs exist, and probably not all are discovered yet, RNA
research is still under ongoing development (Morozova and Marra, 2008). Certainly
many alternative functions of RNAs have not been clarified yet, and we are just at the
beginning of understanding the complex role of RNA molecules for life. However, among
all forms of ncRNAs, tRNAs belong to one of the oldest and most intensively studied
molecules in living organism. Since its first mention in 1955, innumerable publications
and textbook chapters have been dedicated to this fascinating molecule. Nevertheless,
tRNAs still deserve our attention as new discoveries are made regularly. The following
paragraph will focus on this exceptional molecule and its characteristics.
Figure 2: Schematic overview of different RNA types. RNA can be divided in two groups, coding RNA representing messenger RNA (mRNA) and non-coding RNA including ribosomal RNA (rRNA), transfer RNA (tRNA), small nuclear RNA (snRNA), small nucleolar RNA (snoRNA), interfering RNA (RNAi), which is subdivided in micro RNA (miRNA) and small interfering RNA (siRNA), and other RNAs, including long ncRNA.
15
2. Transfer RNAs : canonical structure, structural evolution and origin
In principle, protein bio-synthesis follows the same procedure in all kingdoms of life.
This fact is already an indication that the protein synthesis system has been developed
early in evolution (Noller, 2012). An mRNA transcript is always translated in 5’3’
direction, one codon (i.e., a triplet of three nucleotides) after another. Thereby, the
protein is synthesized sequentially by a chemical linkage of amino acids, one after
another. tRNAs recognize only the corresponding codons by Watson-Crick base pairing
that encode for the amino acids that they carry. Therefore, they represent an adapter
molecule that serves as a physical link that translates mRNA information into amino acid
sequences of proteins (Crick, 1970).
Today, in the era of large scale-genomics, a huge number of complete genome sequences
are available from 3,316 Bacteria, 202 Archaea, 179 Eukaryote, 6,149 organelles and
4,026 Viruses (October 2016; https://www.ebi.ac.uk/genomes/). Despite their
relatively short nucleotide sequences, a large diversity of gene structures and RNA
secondary structures of pre- and mature tRNAs have been discovered in the three
domains of life so far (Fujishima and Kanai, 2014).
The following paragraph will highlight the characteristic properties of cytosolic,
mitochondrial tRNAs and tRNA-derived fragments.
2.1. Cytosolic tRNAs
Cytosolic tRNAs possess a highly conserved structure and are therefore called classical
or canonical tRNAs (Giegé et al., 2012). tRNAs are composed of approximately 75 - 100
nucleotides with a universal CCA-3’ terminus (Jühling et al., 2009). Although each tRNA
molecule has a unique nucleotide sequence, the general secondary and tertiary
structures are very similar to each other. The first 3D structure of a tRNA was obtained
from yeast tRNAPhe, and was solved by X-ray crystallography (Robertus et al., 1974; Kim
et al., 1974). Therefore, the crystal structure of the tRNAPhe is often used as a standard
reference model for the 3D structure of canonical tRNAs.
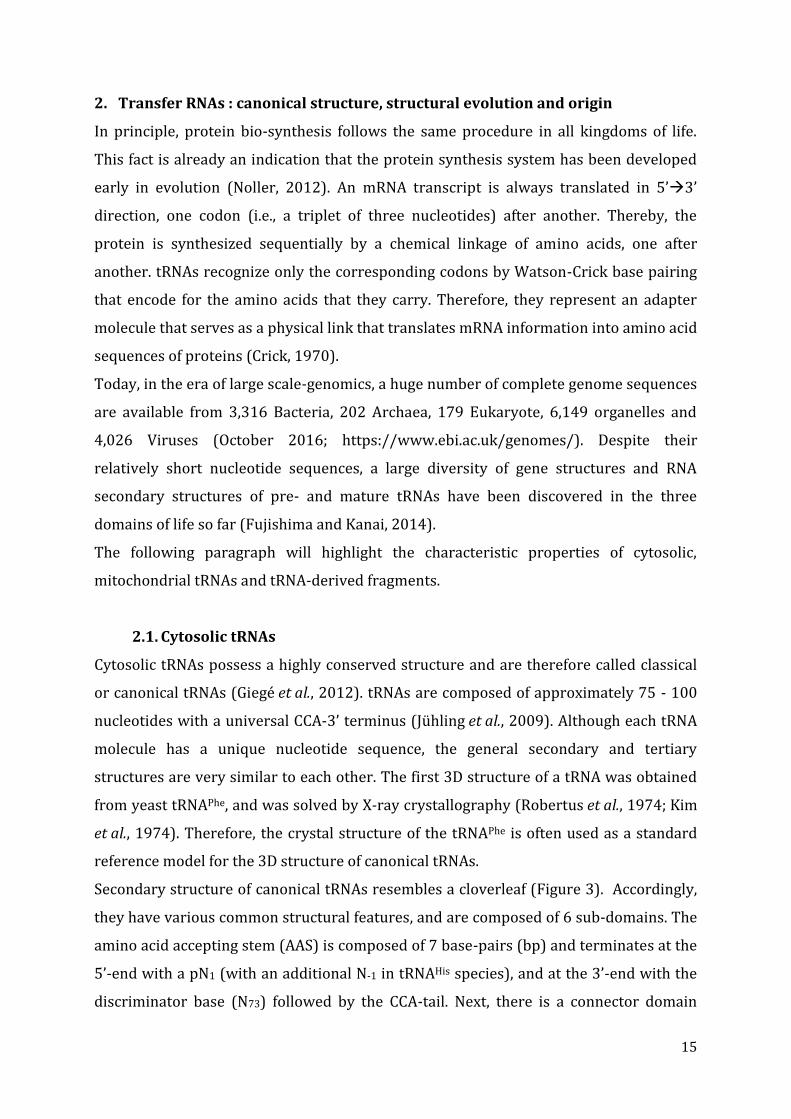
Secondary structure of canonical tRNAs resembles a cloverleaf (Figure 3). Accordingly,
they have various common structural features, and are composed of 6 sub-domains. The
amino acid accepting stem (AAS) is composed of 7 base-pairs (bp) and terminates at the
5’-end with a pN1 (with an additional N-1 in tRNAHis species), and at the 3’-end with the
discriminator base (N73) followed by the CCA-tail. Next, there is a connector domain
16
with 2 nt (U8, N9), followed by the D-stem and loop (DSL) (N10-N25), a 4 bp stem ending
in a loop of 7 to 11 nt. This loop often contains the name-giving modified base
dihydrouridine, and a sequence of the conserved residues A14, R15, and G18G19. The
anticodon stem and loop (ASL) (N27-N43), consists of a 5 bp stem and a 7 nt loop
containing U33 and the anticodon triplet N34, N35, N36. The fifth domain is a variable
region of normally 4 to 24 nt (N44- N48). Finally, all tRNAs contain a T-stem and loop
(TSL) (N49-N65) with a 5 bp stem and a 7 nt loop containing the sequence T54Ψ55C56
where Ψ is pseudouridine (Giegé et al., 2012).
The tertiary structures of several tRNAs (∼25 PDB entries of free tRNA molecules, and
∼150 PDB entries in complex with interaction partner) were solved by crystallography
or NMR spectroscopy. The shape of the three-dimensional structure of tRNAs resembles
an upside down letter “L” (Figure 3). This universal structure is the result of two-by-two
coaxial stacking of the helices formed by the stems. Although variations in the angle
formed by the two branches are recognized, the overall tertiary structure of all tRNA
molecules is rather conserved. Thereby, the tertiary interaction network maintains and
stabilizes the L-shape structure of canonical tRNAs. It requires the participation of 12
phylogenetically conserved and semiconserved residues (U8, Y12, A14, R15, G18, G19,
R20, R23, Y48, Ψ55, C56, and R57), and is associated with long range tertiary
interactions found in the elbow of the molecule (Giegé et al., 2012).
Figure 3: Secondary and tertiary structure of canonical tRNAs. 2D cloverleaf and 3D L-shape structure of canonical tRNAs. The amino acid acceptor stem (AAS), yellow; D-stem loop (DSL), green; anticodon stem loop (ASL), blue; T-stem loop (TSL), orange are highlighted in the two structures with the same color code (modified from Giegé et al., 2012).
17
Many functional tRNAs contain a variety of chemically modified nucleosides. Nowadays
more than 100 of such modified nucleosides have been identified (Machnicka et al.,
2013; Grosjean, 2015). Often these modifications are deaminated or methylated
derivatives of the four nucleotides adenine (A), cytosine (C), guanine (G) and uracil (U),
which are formed by specific modification enzymes (Bjork and Hagervall, 2014).
However, the variety of modifications is huge, and may differentially affect the tRNA
structure and/or function (Jackman and Alfonzo, 2013)
The different types of modifications can be subdivided into three main categories
(Machnicka et al., 2013). The first group comprises all modified nucleosides for which
both, position and identity, are conserved in the majority of tRNA species, such as
dihydrouridine (D) in the D-loop or 5-methyluridine (m5U) and pseudouridine (Ψ) in
the TΨC-loop. Modified residues for which only the position, but not necessarily the
identity of modification is conserved, correspond to the second category. It contains
uridines and purines found at positions 34 and 37 of the anticodon loop, respectively,
that undergo by far the largest diversity of post-transcriptional modifications (Gustilo et
al., 2008). Often these hyper-modified nucleotides ensure correct decoding at the
wobble position (position 43), or play roles in maintaining the reading frame (position
37) (El Yacoubi et al., 2012). The third group comprises all other modified nucleotides
that consist usually of simple chemical alterations, such as methylation of the base or the
ribose, or isomeric derivatives. Modified residues of the third class are found at unique
positions of only a limited group of tRNA species (Machnicka et al., 2013).
Most of these modifications are crucial for a correct folding and the stability of tRNA
molecules (Motorin and Helm, 2010). They play an important role for the functionality
of a variety of cellular processes, for example by modulating interactions with other
cellular macromolecules such as amino-acyl tRNA synthetases and translation factors
(Giegé and Lapointe, 2009), or by ensuring the accurate decoding of mRNAs at the
ribosome (Duechler et al., 2016).
2.2. Mitochondrial tRNAs
So far, most attention was dedicated to the function, structure, and evolution of classical
tRNAs. Nonetheless, in eukaryotes, tRNAs are not only present in the nucleus but also in
organelles such as chloroplasts and mitochondria. Mitochondria encode a specific set of
mitochondrial tRNAs (mt tRNA) in their own genome, and possess therefore an
18
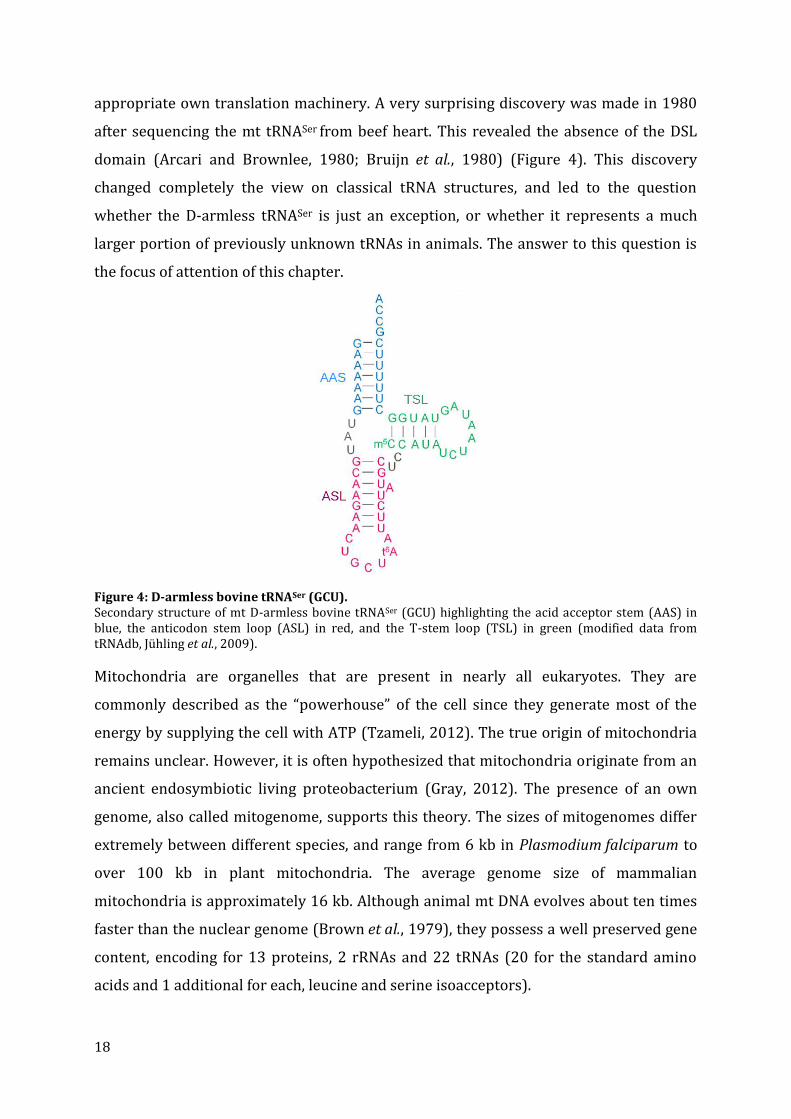
appropriate own translation machinery. A very surprising discovery was made in 1980
after sequencing the mt tRNASer from beef heart. This revealed the absence of the DSL
domain (Arcari and Brownlee, 1980; Bruijn et al., 1980) (Figure 4). This discovery
changed completely the view on classical tRNA structures, and led to the question
whether the D-armless tRNASer is just an exception, or whether it represents a much
larger portion of previously unknown tRNAs in animals. The answer to this question is
the focus of attention of this chapter.
Figure 4: D-armless bovine tRNASer (GCU). Secondary structure of mt D-armless bovine tRNASer (GCU) highlighting the acid acceptor stem (AAS) in blue, the anticodon stem loop (ASL) in red, and the T-stem loop (TSL) in green (modified data from tRNAdb, Jühling et al., 2009).
Mitochondria are organelles that are present in nearly all eukaryotes. They are
commonly described as the “powerhouse” of the cell since they generate most of the
energy by supplying the cell with ATP (Tzameli, 2012). The true origin of mitochondria
remains unclear. However, it is often hypothesized that mitochondria originate from an
ancient endosymbiotic living proteobacterium (Gray, 2012). The presence of an own
genome, also called mitogenome, supports this theory. The sizes of mitogenomes differ
extremely between different species, and range from 6 kb in Plasmodium falciparum to
over 100 kb in plant mitochondria. The average genome size of mammalian
mitochondria is approximately 16 kb. Although animal mt DNA evolves about ten times
faster than the nuclear genome (Brown et al., 1979), they possess a well preserved gene
content, encoding for 13 proteins, 2 rRNAs and 22 tRNAs (20 for the standard amino
acids and 1 additional for each, leucine and serine isoacceptors).
19
The high amount of mt DNA copies in a cell (varies between 100 and 100,000 copies
depending on cell type (Reznik et al., 2016)) and its small size makes the mt genome
favorable for sequence analysis. Next-generation sequencing (NGS) techniques and
improved bioinformatics tools have made it quick, easy and cheap to sequence and
assemble entire mitochondrial genomes from almost any eukaryotic species (Smith,
2016). Today, more than 6,000 mitogenomes are sequenced and the subject of large-
scale comparative studies (Smith, 2016).
Initial sequencing studies and further computational analysis of mitochondria led to the
discovery that, in contrast to cytoplasmic tRNAs, mitochondrial tRNAs show non-
canonical structural features with various deviations, such as reduced size, or length
variations in D-and T-loops (Wolstenholme et al., 1987). It turned out that the above
mentioned D-arm loss of tRNASer is not only an exception in bovine mitochondria, but is
represented in most metazoans. However, the D-armless tRNASer is the biggest
structural exception in animal mitochondria, while mostly all other tRNAs still occupy a
cloverleaf-like structure.
Interestingly, already in the 1980s, a complete set of truncated mitochondrial tRNAs was
found in the nematode worms Caenorhabditis elegans and Ascaris suum. 20 of the 22 mt
tRNAs are T-armless, while both serine tRNAs lack the D-arm. It could be shown that
these truncated tRNAs are indeed functional (Okimoto and Wolstenholme, 1990). Some
other bizarre tRNAs with reduced size (lacking the T-arm) could also be identified in
some Mollusca (Yamazaki et al., 1997) and Arthropoda (Masta, 2000).
The increasing number of genomics data, and the potential of the existence of more
unusual tRNA genes require efficient tRNA annotation tools. Classical annotation tools
(e.g., tRNAscan-SE) are based on searching for the above mentioned conserved signature
motifs of canonical tRNAs that are absent in mt tRNAs (Lowe and Eddy, 1997; Laslett
and Canback, 2004; Kinouchi and Kurokawa, 2006). Thus, these approaches are highly
sensitive for canonical tRNAs and report only few false positive hits in the nuclear
genome, but are unsuitable for the detection of mt tRNA genes because of their
miscellaneous structural deviations.
20
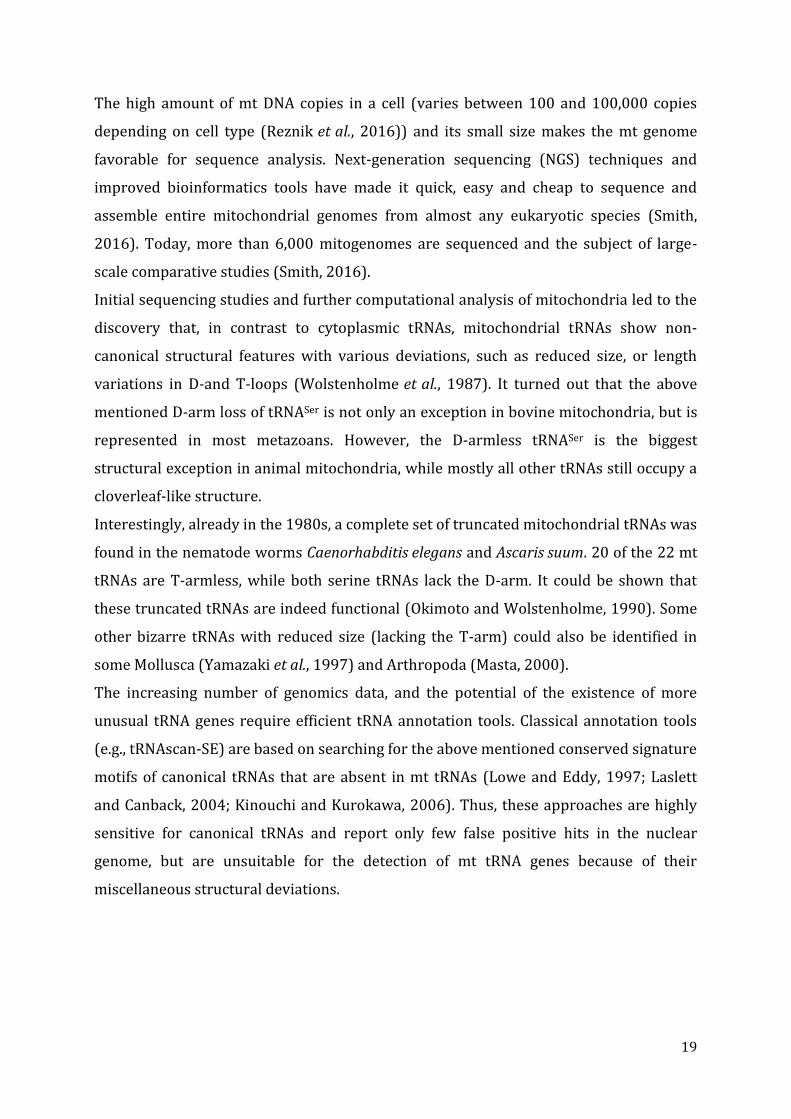
Figure 5: Secondary and tertiary structure of truncated mt tRNAMet in A. suum. (A) Secondary structure of T-arm-lacking tRNAMet in A. suum highlighting the amino acid acceptor stem (AAS) in blue, the D-stem loop (DSL) in yellow the anticodon stem loop (ASL) in red, and the TV-replacement loop in black. (B) L-shape model of the same tRNA (adapted from Watanabe et al., 2014).
In 2012, Jühling et al. developed a specialized bioinformatics tool called MiTFi
(Mitochondrial tRNA Finder) for the detection of any bizarre tRNA gene (Jühling et al.,
2012a). About 1,800 metazoan mitochondrial genomes within a wide range of different
taxonomic groups were investigated in this analysis, resulting in a global view on the
level of degeneracy of mitochondrial encoded tRNAs in metazoan through the
identification of a wide range of exceptional tRNA structures (Jühling et al., 2012a). A
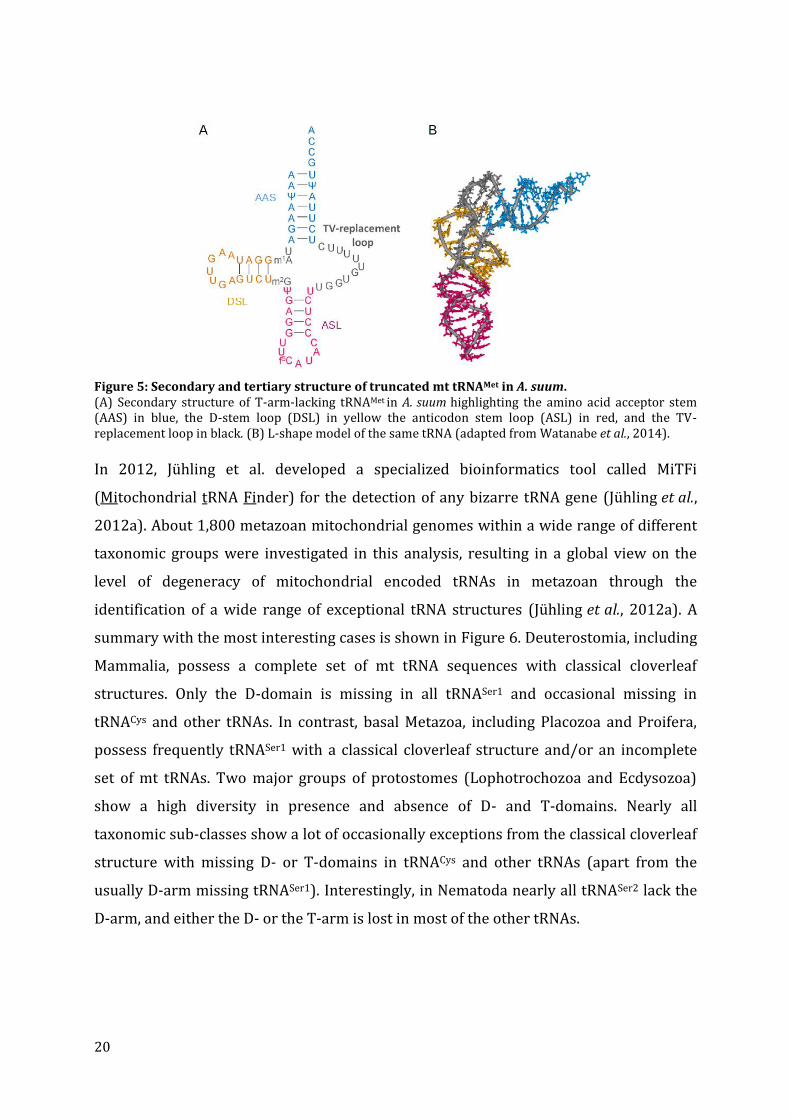
summary with the most interesting cases is shown in Figure 6. Deuterostomia, including
Mammalia, possess a complete set of mt tRNA sequences with classical cloverleaf
structures. Only the D-domain is missing in all tRNASer1 and occasional missing in
tRNACys and other tRNAs. In contrast, basal Metazoa, including Placozoa and Proifera,
possess frequently tRNASer1 with a classical cloverleaf structure and/or an incomplete
set of mt tRNAs. Two major groups of protostomes (Lophotrochozoa and Ecdysozoa)
show a high diversity in presence and absence of D- and T-domains. Nearly all
taxonomic sub-classes show a lot of occasionally exceptions from the classical cloverleaf
structure with missing D- or T-domains in tRNACys and other tRNAs (apart from the
usually D-arm missing tRNASer1). Interestingly, in Nematoda nearly all tRNASer2 lack the
D-arm, and either the D- or the T-arm is lost in most of the other tRNAs.
21
Figure 6: Exceptional structures of mt tRNA genes and loss of tRNA genes in different taxonomic groups. ‘○’ indicates occasional events, ‘+’ frequent (>50%) events and ‘#’ highlights taxa that all share the same abnormality. The ‘Ser1’ column summarizes tRNASer1 genes exceptionally featuring the classical cloverleaf (‘Cl’) or commonly lost the D-domain (‘D’). Columns ‘Ser2’, ‘Cys’ and ‘others’ indicate tRNA genes that lost the D-domain (‘D’), the T-domain (‘T’) or both domains (‘D/T’). The ‘missing’ column summarizes where it was not possible to find a complete set of 22 tRNA genes within the genomes. The most interesting group for this study, the Nematodes, are highlighted in red (modified from Jühling et al., 2012a).
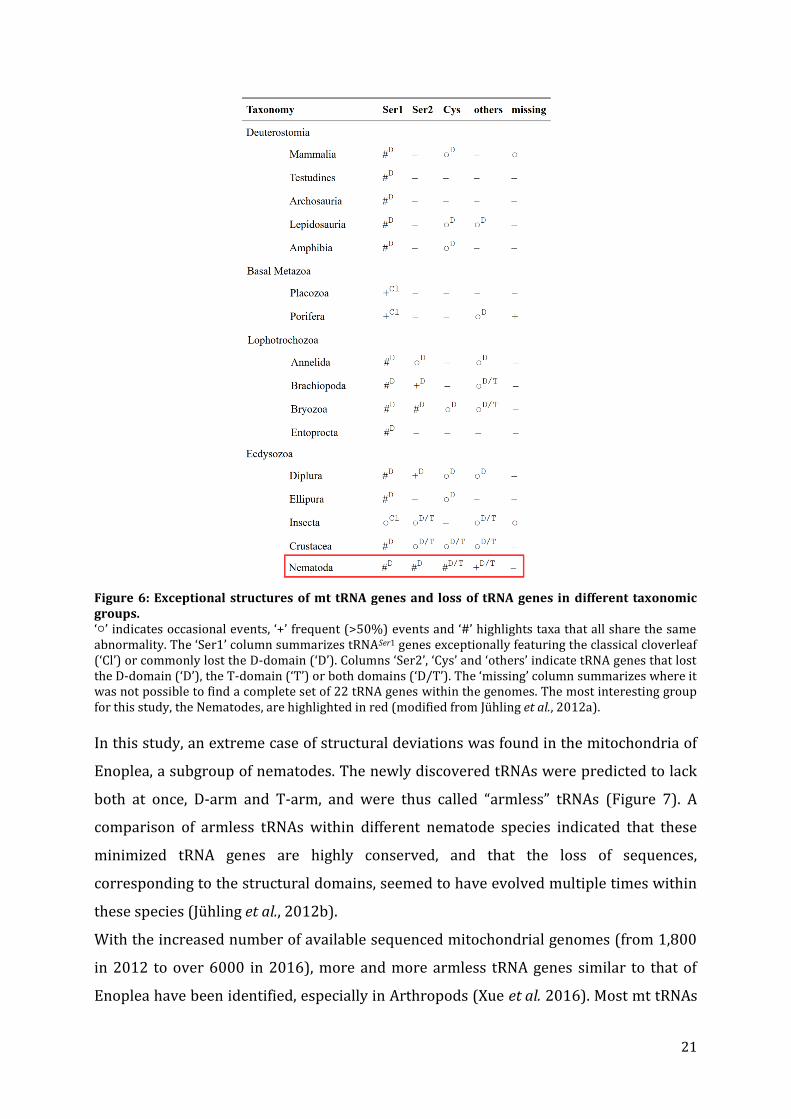
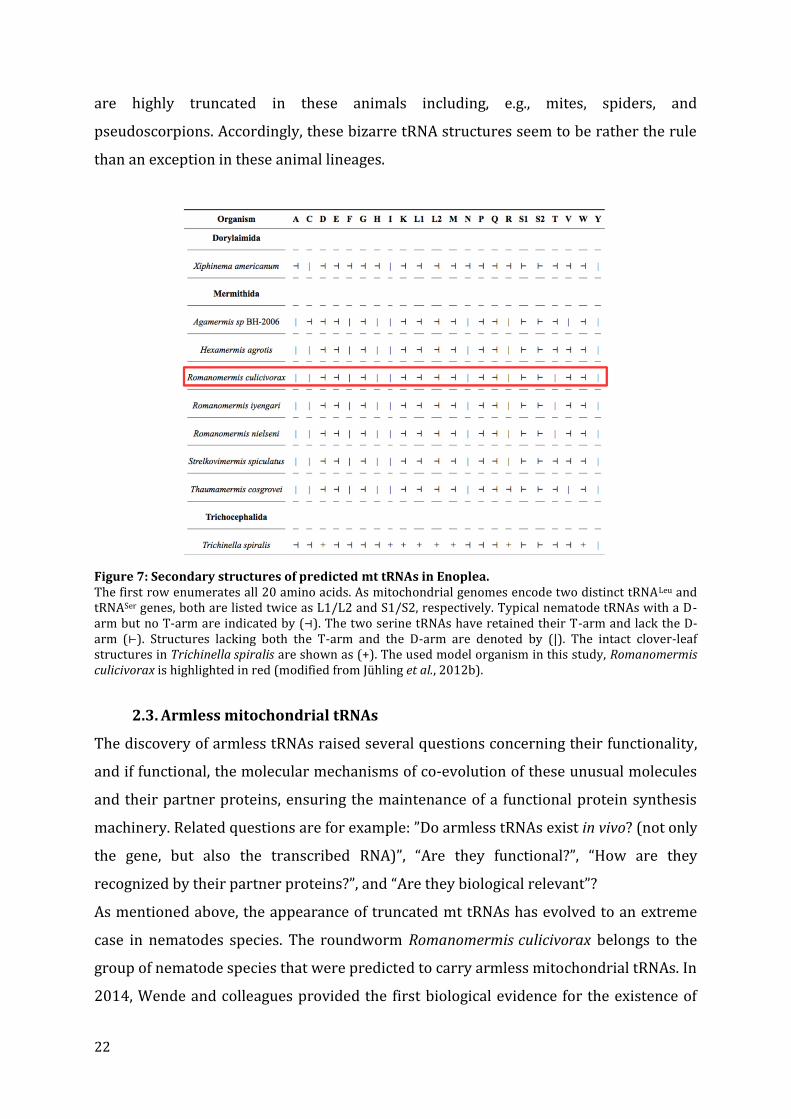
In this study, an extreme case of structural deviations was found in the mitochondria of
Enoplea, a subgroup of nematodes. The newly discovered tRNAs were predicted to lack
both at once, D-arm and T-arm, and were thus called “armless” tRNAs (Figure 7). A
comparison of armless tRNAs within different nematode species indicated that these
minimized tRNA genes are highly conserved, and that the loss of sequences,
corresponding to the structural domains, seemed to have evolved multiple times within
these species (Jühling et al., 2012b).
With the increased number of available sequenced mitochondrial genomes (from 1,800
in 2012 to over 6000 in 2016), more and more armless tRNA genes similar to that of
Enoplea have been identified, especially in Arthropods (Xue et al. 2016). Most mt tRNAs
22
are highly truncated in these animals including, e.g., mites, spiders, and
pseudoscorpions. Accordingly, these bizarre tRNA structures seem to be rather the rule
than an exception in these animal lineages.
Figure 7: Secondary structures of predicted mt tRNAs in Enoplea. The first row enumerates all 20 amino acids. As mitochondrial genomes encode two distinct tRNALeu and tRNASer genes, both are listed twice as L1/L2 and S1/S2, respectively. Typical nematode tRNAs with a D-arm but no T-arm are indicated by (⊣). The two serine tRNAs have retained their T-arm and lack the D-arm (⊢). Structures lacking both the T-arm and the D-arm are denoted by (|). The intact clover-leaf structures in Trichinella spiralis are shown as (+). The used model organism in this study, Romanomermis culicivorax is highlighted in red (modified from Jühling et al., 2012b).
2.3. Armless mitochondrial tRNAs
The discovery of armless tRNAs raised several questions concerning their functionality,
and if functional, the molecular mechanisms of co-evolution of these unusual molecules
and their partner proteins, ensuring the maintenance of a functional protein synthesis
machinery. Related questions are for example: ”Do armless tRNAs exist in vivo? (not only
the gene, but also the transcribed RNA)”, “Are they functional?”, “How are they
recognized by their partner proteins?”, and “Are they biological relevant”?
As mentioned above, the appearance of truncated mt tRNAs has evolved to an extreme
case in nematodes species. The roundworm Romanomermis culicivorax belongs to the
group of nematode species that were predicted to carry armless mitochondrial tRNAs. In
2014, Wende and colleagues provided the first biological evidence for the existence of
23
armless tRNAs by sequencing RNA extracts from this worm (Wende et al., 2014). A first
hint for the functionality of these bizarre tRNA was the presence of a CCA-tail in each
identified transcript at the 3’ end. Because this sequence is not encoded in the genome, it
has to be post-transcriptionally added by a CCA-adding enzyme. By consequence, the
CCA-addition event exists in vivo in the nematode worm, and armless tRNAs are
processed at this essential maturation step. Thus, the first question concerning the
existence of the RNA expression of the gene, and its possible functionality could be
positively considered for at least a subgroup of tRNAs.
The study presented here was designated to continue the work presented by S. Wende
and colleagues, in order to characterize armless tRNAs from a structural, functional and
evolutionary point of view. Therefore, two specific cases where chosen, i.e., tRNAArg and
tRNAIle from R. culicivorax, for performing a more profound investigation. The reasons
for these choices are the following. First, the complete sequences as proposed by
(Jühling et al., 2012b) could be confirmed for both tRNAs by sequencing of RNA extracts.
Second, tRNAArg and tRNAIle belong with a length of only 45 nt and 50 nt (including CCA-
tail), respectively, to the shortest tRNAs ever described, and are thus highly interesting
study objects. Third, tRNAArg was chosen because aminoacylation studies of the human
mt arginyl-tRNA synthetase are in progress at the host laboratory in Strasbourg. This
offered the possibility to establish a comparative study between different mitochondrial
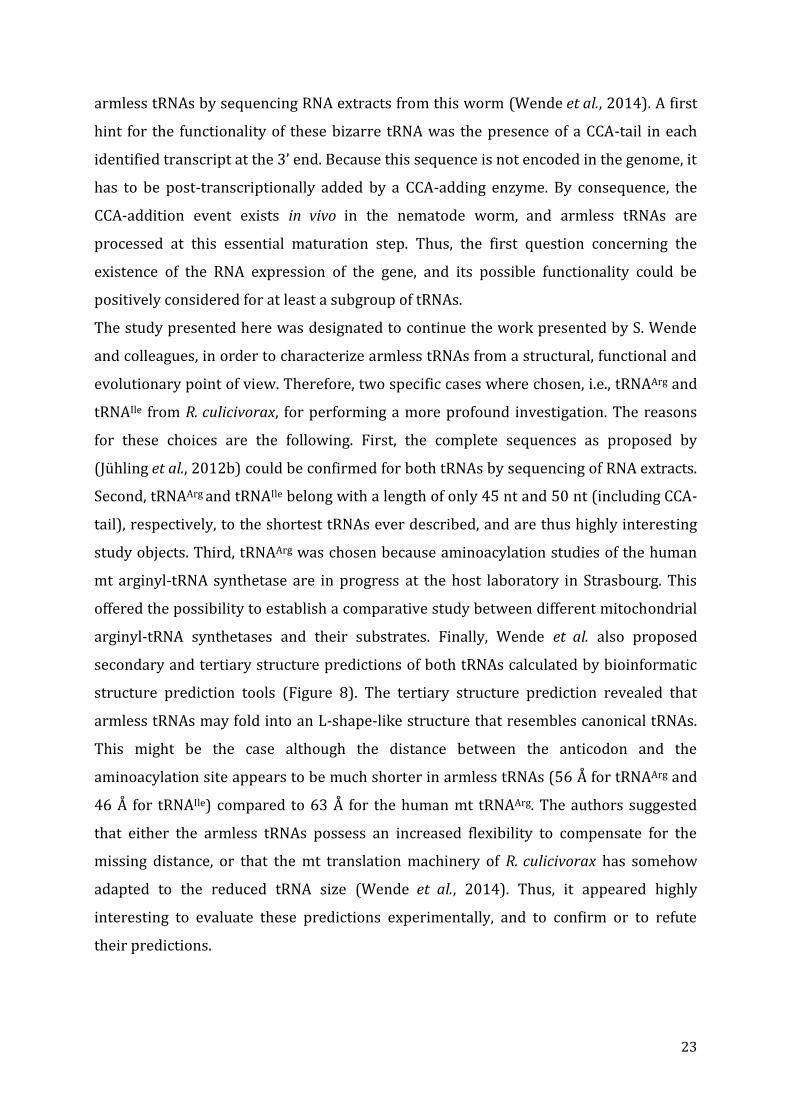
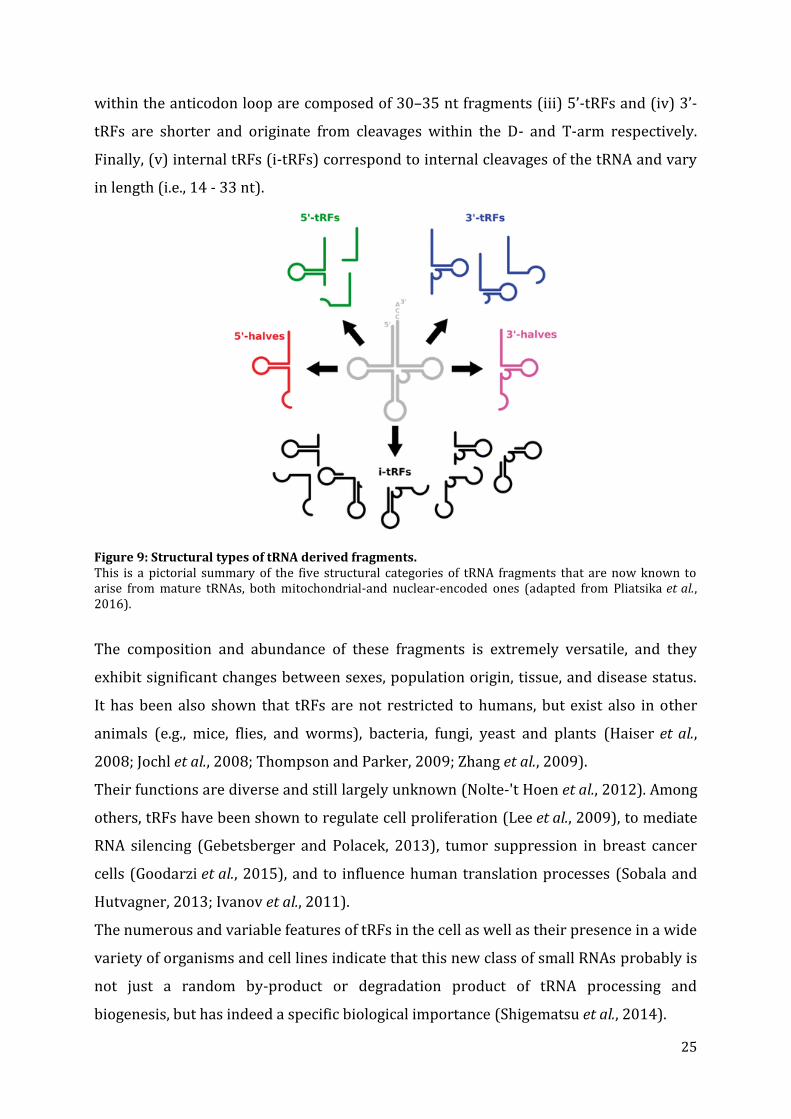
arginyl-tRNA synthetases and their substrates. Finally, Wende et al. also proposed
secondary and tertiary structure predictions of both tRNAs calculated by bioinformatic
structure prediction tools (Figure 8). The tertiary structure prediction revealed that
armless tRNAs may fold into an L-shape-like structure that resembles canonical tRNAs.
This might be the case although the distance between the anticodon and the
aminoacylation site appears to be much shorter in armless tRNAs (56 Å for tRNAArg and
46 Å for tRNAIle) compared to 63 Å for the human mt tRNAArg. The authors suggested
that either the armless tRNAs possess an increased flexibility to compensate for the
missing distance, or that the mt translation machinery of R. culicivorax has somehow
adapted to the reduced tRNA size (Wende et al., 2014). Thus, it appeared highly
interesting to evaluate these predictions experimentally, and to confirm or to refute
their predictions.
24
Figure 8: Structure prediction of mt tRNAArg and mt tRNAIle from R. culicivorax. In the secondary structure models, the truncations of D- and T-arms are visible, leading to replacement bulges. The anticodon is highlighted red, and the CCA-end green. The predicted 3D structures resemble the standard L-shape of canonical tRNAs, even if acceptor- and anticodon stems show considerable deviations in distance (modified from Wende et al., 2014).
2.4. tRNA-derived fragments (tRFs) - a novel class of small RNAs
The development of next-generation sequencing methods led to a dramatic progress in
our understanding of the cellular transcriptome, revealing the existence of many
different functional small non-coding RNAs. A novel class of such small RNAs, which is
distinct from miRNAs an siRNAs, has been discovered recently by several research
groups (reviewed in (Sobala and Hutvagner, 2011). These molecules result from
enzymatic cleavage of mature tRNAs or precursor tRNA transcripts, and are referred to
as tRNA-derived fragments (tRFs) (Kumar et al., 2015). tRFs arise from cytosolic as well
as mitochondrial tRNA templates (Pliatsika et al., 2016), and are processed by several
tRNA-specific nucleases such as Dicer (Cole et al., 2009), ELAC2 (Lee et al., 2009), RNase
Z, RNase P (Diebel et al., 2016) or Angiogenin (Yamasaki et al., 2009). To date, it has
been reported that expression of tRFs is regulated by cellular stresses (Emara et al.,
2010), cell proliferation (Lee et al., 2009), or hormone stimulation (Honda et al., 2015).
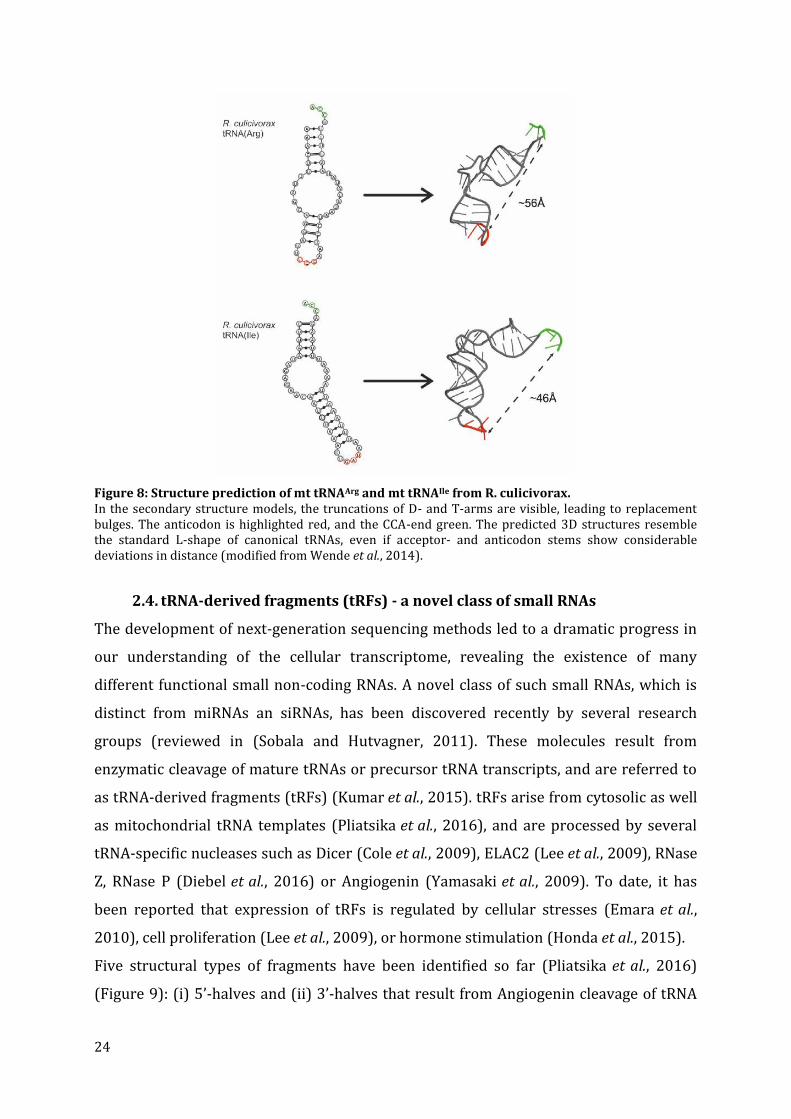
Five structural types of fragments have been identified so far (Pliatsika et al., 2016)
(Figure 9): (i) 5’-halves and (ii) 3’-halves that result from Angiogenin cleavage of tRNA
25
within the anticodon loop are composed of 30–35 nt fragments (iii) 5’-tRFs and (iv) 3’-
tRFs are shorter and originate from cleavages within the D- and T-arm respectively.
Finally, (v) internal tRFs (i-tRFs) correspond to internal cleavages of the tRNA and vary
in length (i.e., 14 - 33 nt).
Figure 9: Structural types of tRNA derived fragments. This is a pictorial summary of the five structural categories of tRNA fragments that are now known to arise from mature tRNAs, both mitochondrial-and nuclear-encoded ones (adapted from Pliatsika et al., 2016).
The composition and abundance of these fragments is extremely versatile, and they
exhibit significant changes between sexes, population origin, tissue, and disease status.
It has been also shown that tRFs are not restricted to humans, but exist also in other
animals (e.g., mice, flies, and worms), bacteria, fungi, yeast and plants (Haiser et al.,
2008; Jochl et al., 2008; Thompson and Parker, 2009; Zhang et al., 2009).
Their functions are diverse and still largely unknown (Nolte-'t Hoen et al., 2012). Among
others, tRFs have been shown to regulate cell proliferation (Lee et al., 2009), to mediate
RNA silencing (Gebetsberger and Polacek, 2013), tumor suppression in breast cancer
cells (Goodarzi et al., 2015), and to influence human translation processes (Sobala and
Hutvagner, 2013; Ivanov et al., 2011).
The numerous and variable features of tRFs in the cell as well as their presence in a wide
variety of organisms and cell lines indicate that this new class of small RNAs probably is
not just a random by-product or degradation product of tRNA processing and
biogenesis, but has indeed a specific biological importance (Shigematsu et al., 2014).
26
2.5. Evolution and origin of tRNAs
It is still unclear from where tRNA molecules originated, and how they got involved in
the context of protein synthesis. Several evolutionary models have been proposed for
the origin and evolution of tRNAs (Weiner and Maizels, 1999; Widmann et al., 2005; Sun
and Caetano-Anolles, 2008).
Since secondary structures are very similar for tRNAs, one hypothesis is, that tRNA
genes arose through gene duplication. One gene that encoded an original tRNA got
duplicated, and the two copies developed independently, so that ultimately tRNA
molecules emerged with different amino acid specificities. This process was repeated
several times during evolution (LaRue et al., 1981; Di Giulio, 1995).
In contrast, Weiner and Maizels have introduced a Genomic tag Hypothesis, which
suggests that tRNAs have evolved independently from two structural and functional
units, (Weiner and Maizels, 1999). While one unit ("top half") includes the acceptor arm
and the TΨC-arm, the other "bottom half" includes the D-arm and the anticodon arm.
The "upper" unit could first have been evolved as a 3'-terminal genomic tag that marked
single stranded RNA genomes for replication in a primordial RNA world as proposed by
(Gilbert, 1986). Later, with the beginning of protein synthesis, the "lower" unit could
have developed separately (Weiner and Maizels, 1999).
However, it is still unclear from where tRNAs originated, and an ongoing debate is still in
process in the field of tRNA evolution (Weiner and Maizels, 1999; Widmann et al., 2005;
Sun and Caetano-Anolles, 2008; Randau and Soll, 2008; Di Giulio, 2012).
3. tRNA biogenesis and function
The biosynthesis of tRNAs comprises multiple processing steps. After its initial
transcription, the tRNA transcript is processed and several modifications are performed,
including the removal of its 5’ leader and 3’ trailer, splicing of introns (if present), CCA-
tail addition, and multiple modifications of nucleotide residues. Finally, every mature
tRNA is aminoacylated, i.e., the proper amino acid is added to the CCA-tail at its 3' end.
Modified and aminoacylated tRNA may than be used in translation. for the synthesis of
proteins (Hopper and Phizicky, 2003). After the delivery of the amino acid to the
ribosome, uncharged tRNAs may be aminoacylated again, or marked for degradation by
adding a second CCA triplet to its 3' end (Wilusz et al., 2011).
27
Beside the transcription and processing of cytosolic tRNAs, tRNA biosynthesis takes also
place in organelles (e.g., mitochondria and chloroplasts) (Hopper et al., 2010). Since
processing enzymes are coded in the nucleus, and expressed in the cytosol, they have to
be imported into the organelles (Alberts B, Johnson A, Lewis J, et al., 2002). The overall
function of tRNAs as well as their processing, modification, charging and translation
remain the same inside organelles. However, some peculiarities regarding structures
and mechanisms can be observed for proteins that are dedicated to organelles. One
interest of this thesis is concentrated on direct mitochondrial tRNA-interacting proteins.
The following paragraph will described the main steps of tRNA biogenesis in detail, and
thereby also compare cytosolic tRNA processing enzymes (such as RNase P, RNase Z,
CCA-adding enzyme) and other partner molecules in translation (such as aminoacyl-
tRNA synthetases, elongation factors and ribosomes) with those from mitochondrial and
bacterial origins.
3.1. From primary transcripts to functional tRNA molecules
tRNA transcription
The biosynthesis of nuclear encoded tRNAs starts with their transcription by the RNA
polymerase III (Pol III) (Roeder and Rutter, 1969). Pol III is primarily guided by two
transcription factors, i.e., TFIIIC and TFIIIB that recognize two internal promoter
sequences (block A and B). The A-block and B-block are part of the D- and T-stems
(Asin-Cayuela and Gustafsson, 2007) and loops, respectively (White, 2011).
The human mitogenome is transcribed by a specialized machinery that includes a
monomeric RNA polymerase, the mitochondrial transcription factor A, and a
mitochondrial transcription factor B homolog (Asin-Cayuela and Gustafsson, 2007). The
human mitogenome is transcribed into three polycistronic RNA molecules, which is then
processed and split into individual tRNA and RNA molecules (Ojala et al., 1981). This
mode of RNA processing is known as the “tRNA punctuation model” (Asin-Cayuela and
Gustafsson, 2007). In general, pre-tRNA transcription products contain additional 5’ and
3’ RNA sequences, and in some cases tRNA precursors contain an intron in the anticodon
arm, which have to be spliced out during processing of the tRNA (Abelson et al., 1998).
28
5’- and 3’-end maturation
The ribonuclease P (RNase P) cleaves 5’-leader sequences of tRNA precursors (Altman,
2000). This ribozyme is a ubiquitous endoribonuclease, found in Archaea, Bacteria and
Eukaryotes. Interestingly, RNase P is usually a ribozyme composed of a catalytic active
RNA chain and at least one protein (Evans et al., 2006). The crystal structure of bacterial
and eukaryotic RNase P confirmed the location of the active site in the RNA part (Reiter
et al., 2010). Surprisingly, in mitochondria and chloroplasts of various animals and
plants another type of RNase P exist. This other type is a proteinous enzymes and
termed PRORP for “protein-only RNase P” (Holzmann et al., 2008; Gobert et al., 2010).
Its counterpart, the endonuclease RNase Z removes the 3’-trailer of primary transcripts,
and leaves a 3’-hydroxy group at the tRNA end (Ceballos and Vioque, 2007). In
eukaryotes two different forms of RNase Z exist, i.e., a long form (RNase ZL) and a short
form (RNase ZS). RNase ZS is localized in the cytosol, whereas the human RNase ZL was
found in both, mitochondria and nucleus (Rossmanith, 2011). Some pre-tRNAs contain
introns. These are either removed by several tRNA-splicing exonucleases, or are self-
splicing group I introns in bacteria and in higher eukaryote organelles (Tocchini-
Valentini et al., 2009).
CCA-incorporation
In all three domains of life, mature tRNAs contain a CCA-sequence at their 3’-end to
allow the correct attachment of the appropriate amino acid. These three bases are
usually not encoded in the tRNA gene in eukaryotes, but have to be post-
transcriptionally added during the processing of the pre-tRNA transcript (Yue et al.,
1996). The enzyme responsible for this process is a [ATP(CTP):tRNA
nucleotidyltransferase] (CCA-adding enzyme, or a CC- and A-adding enzyme) (Tomita et
al., 2004; Neuenfeldt et al., 2008). Thereby, the CCA-addition is performed in a highly
specific, template independent manner (Xiong and Steitz, 2006). In some bacteria, e.g.,
E. coli, tRNA genes encode already the CCA sequence. Nevertheless, even in these
organisms the CCA-enzyme is important because it functions as a repair enzyme for
tRNAs with an incomplete CCA triplet (Zhu and Deutscher, 1987). One main interest of
this work is the characterization of the CCA-adding enzyme of the nematode R.
culicivorax (Chapter 3). Therefore, section 4 is dedicated to a more accurate description
of the structural specificities and the features of this interesting enzyme.
29
tRNA modifications
Mature tRNAs can contain up to 10 % bases that are different from the usual 4 bases, i.e.,
adenine (A), guanine (G), cytosine (C) and uracil (U). These bases are modified by
specific tRNA modification enzymes during the processing of the transcript (Jackman
and Alfonzo, 2013). To date, more than more than 160 modification enzymes have been
identified (Grosjean, 2015). tRNA modification enzymes can be divided into two groups.
The first group ensures a stabilization of the tRNA structure, and is thus independent
from the presence of the L-shaped tertiary structure. These modifications concern often
nucleotides of the acceptor and the TΨC arm (Grosjean et al., 1995). Modifications in
these domains comprise mainly methylated nucleotides, pseudouridines, or
dihydrouridines (Helm, 2006). The enzymes belonging to the second group, however,
are dependent on tRNA secondary and tertiary structures. These modifications are
mainly found in the anticodon arm and the D-arm (Grosjean et al., 1995). Many of these
enzymes can modify both, cytosolic and mt tRNAs. This group, for example, includes
(guanine- N1)-methyltransferase (Trm5p) and Pseudouridylat synthase 1 (PUS1)
(Fernandez-Vizarra et al., 2007; Lee et al., 2007). However, some are mitochondrial
specific enzymes, e.g., 2-Thiouridylase 1 (MTU1) is responsible for the formation of 5-
Taurinomethyl-2-thiouridine (τm5s2U) at the anticodon wobble position of
mitochondrial mt tRNALys (Umeda et al., 2005).
Aminoacylation
The aminoacylation reaction is catalyzed by specific aminoacyl-tRNA synthetases
(aaRS). In contrast to RNase P, RNase Z, or the CCA-adding enzyme that are all able to
recognize different tRNAs, each aaRS recognizes specifically its cognate tRNA or family
of tRNA isoacceptors, and esterifies the tRNA 3’-end with the specific amino acid. The
aminoacylation reaction consists of a two-step reaction including the formation of an
aminoacyl-adenylate intermediate, followed by the transfer of the activated aminoacyl
group to either the 2′- or 3′-OH of their cognate tRNAs (Ibba and Soll, 2000).
The eukaryotic nuclear genome encodes two or three distinct sets of aaRSs. One set is
specific for cytosolic, mitochondrial or chloroplastic translation. The sets can be
distinguished by their sequences (Berglund et al., 2009).
Experimental characterization of the mammalian mt aminoacylation systems is still at
the beginning, which is probably due to the limited number of recombinant mammalian
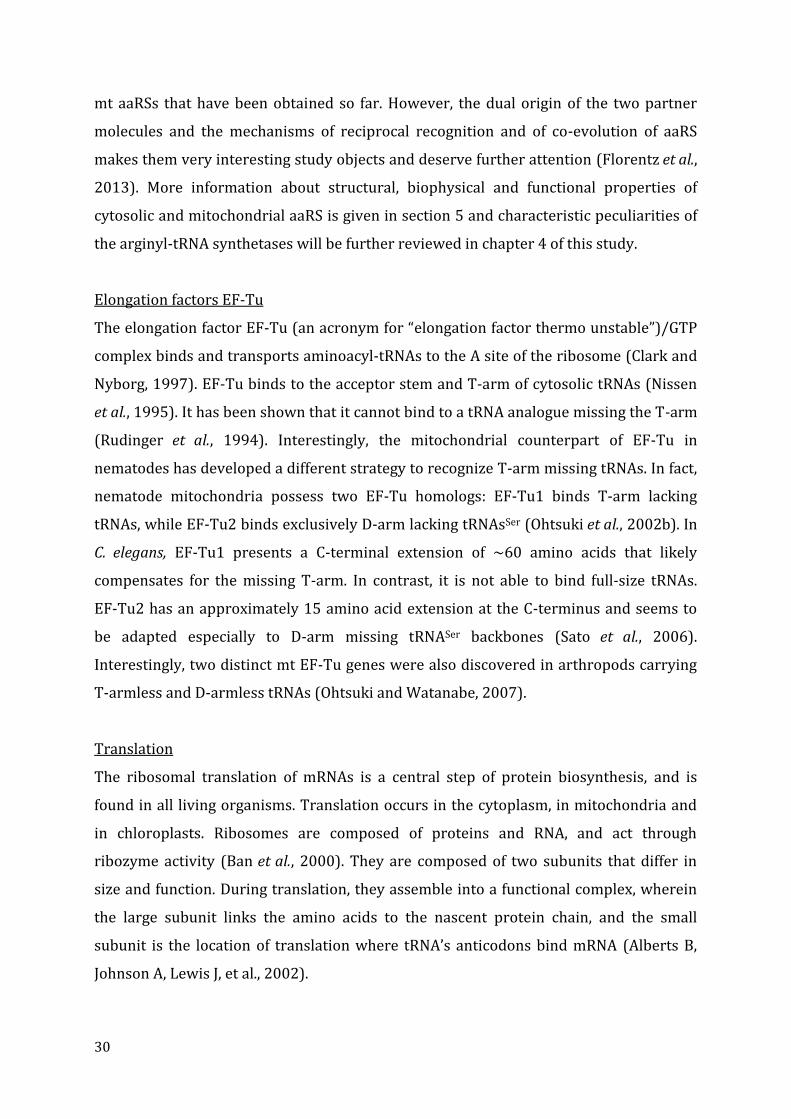
30
mt aaRSs that have been obtained so far. However, the dual origin of the two partner
molecules and the mechanisms of reciprocal recognition and of co-evolution of aaRS
makes them very interesting study objects and deserve further attention (Florentz et al.,
2013). More information about structural, biophysical and functional properties of
cytosolic and mitochondrial aaRS is given in section 5 and characteristic peculiarities of
the arginyl-tRNA synthetases will be further reviewed in chapter 4 of this study.
Elongation factors EF-Tu
The elongation factor EF-Tu (an acronym for “elongation factor thermo unstable”)/GTP
complex binds and transports aminoacyl-tRNAs to the A site of the ribosome (Clark and
Nyborg, 1997). EF-Tu binds to the acceptor stem and T-arm of cytosolic tRNAs (Nissen
et al., 1995). It has been shown that it cannot bind to a tRNA analogue missing the T-arm
(Rudinger et al., 1994). Interestingly, the mitochondrial counterpart of EF-Tu in
nematodes has developed a different strategy to recognize T-arm missing tRNAs. In fact,
nematode mitochondria possess two EF-Tu homologs: EF-Tu1 binds T-arm lacking
tRNAs, while EF-Tu2 binds exclusively D-arm lacking tRNAsSer (Ohtsuki et al., 2002b). In
C. elegans, EF-Tu1 presents a C-terminal extension of ~60 amino acids that likely
compensates for the missing T-arm. In contrast, it is not able to bind full-size tRNAs.
EF-Tu2 has an approximately 15 amino acid extension at the C-terminus and seems to
be adapted especially to D-arm missing tRNASer backbones (Sato et al., 2006).
Interestingly, two distinct mt EF-Tu genes were also discovered in arthropods carrying
T-armless and D-armless tRNAs (Ohtsuki and Watanabe, 2007).
Translation
The ribosomal translation of mRNAs is a central step of protein biosynthesis, and is
found in all living organisms. Translation occurs in the cytoplasm, in mitochondria and
in chloroplasts. Ribosomes are composed of proteins and RNA, and act through
ribozyme activity (Ban et al., 2000). They are composed of two subunits that differ in
size and function. During translation, they assemble into a functional complex, wherein
the large subunit links the amino acids to the nascent protein chain, and the small
subunit is the location of translation where tRNA’s anticodons bind mRNA (Alberts B,
Johnson A, Lewis J, et al., 2002).
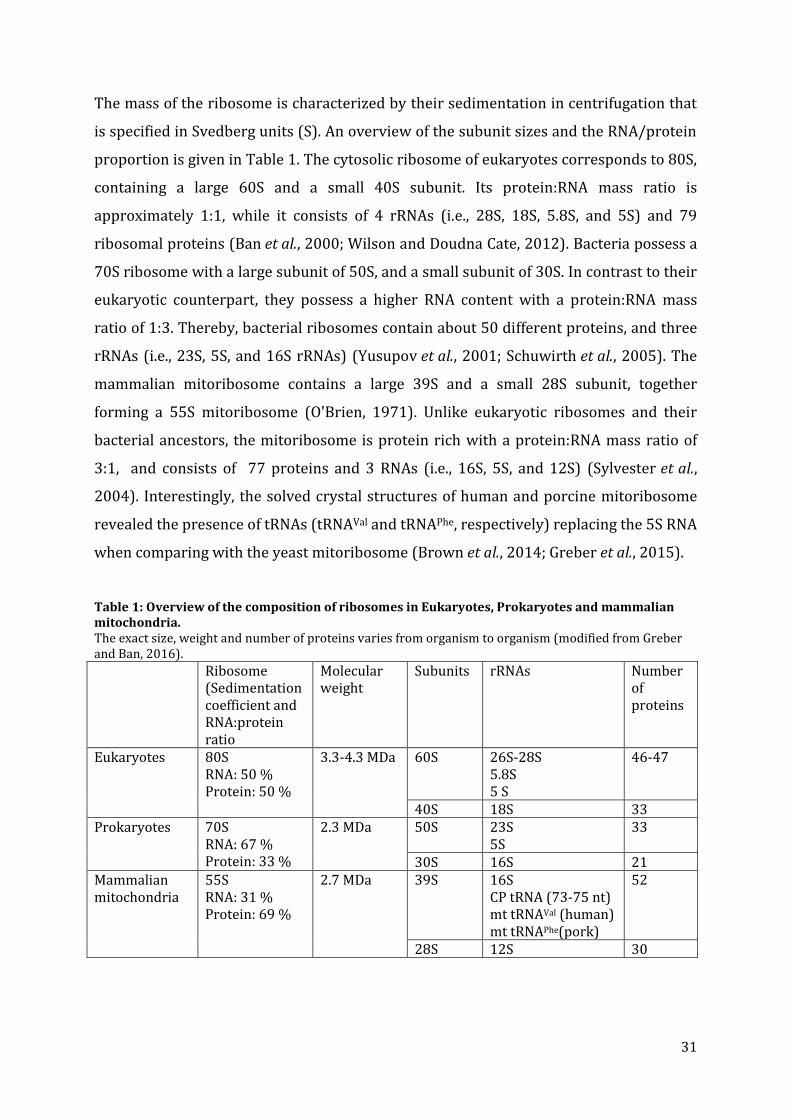
31
The mass of the ribosome is characterized by their sedimentation in centrifugation that
is specified in Svedberg units (S). An overview of the subunit sizes and the RNA/protein
proportion is given in Table 1. The cytosolic ribosome of eukaryotes corresponds to 80S,
containing a large 60S and a small 40S subunit. Its protein:RNA mass ratio is
approximately 1:1, while it consists of 4 rRNAs (i.e., 28S, 18S, 5.8S, and 5S) and 79
ribosomal proteins (Ban et al., 2000; Wilson and Doudna Cate, 2012). Bacteria possess a
70S ribosome with a large subunit of 50S, and a small subunit of 30S. In contrast to their
eukaryotic counterpart, they possess a higher RNA content with a protein:RNA mass
ratio of 1:3. Thereby, bacterial ribosomes contain about 50 different proteins, and three
rRNAs (i.e., 23S, 5S, and 16S rRNAs) (Yusupov et al., 2001; Schuwirth et al., 2005). The
mammalian mitoribosome contains a large 39S and a small 28S subunit, together
forming a 55S mitoribosome (O'Brien, 1971). Unlike eukaryotic ribosomes and their
bacterial ancestors, the mitoribosome is protein rich with a protein:RNA mass ratio of
3:1, and consists of 77 proteins and 3 RNAs (i.e., 16S, 5S, and 12S) (Sylvester et al.,
2004). Interestingly, the solved crystal structures of human and porcine mitoribosome
revealed the presence of tRNAs (tRNAVal and tRNAPhe, respectively) replacing the 5S RNA
when comparing with the yeast mitoribosome (Brown et al., 2014; Greber et al., 2015).
Table 1: Overview of the composition of ribosomes in Eukaryotes, Prokaryotes and mammalian mitochondria. The exact size, weight and number of proteins varies from organism to organism (modified from Greber and Ban, 2016). Ribosome
(Sedimentation coefficient and RNA:protein ratio
Molecular weight
Subunits rRNAs Number of proteins
Eukaryotes 80S RNA: 50 % Protein: 50 %
3.3-4.3 MDa 60S 26S-28S 5.8S 5 S
46-47
40S 18S 33 Prokaryotes 70S
RNA: 67 % Protein: 33 %
2.3 MDa 50S 23S 5S
33
30S 16S 21 Mammalian mitochondria
55S RNA: 31 % Protein: 69 %
2.7 MDa 39S 16S CP tRNA (73-75 nt) mt tRNAVal (human) mt tRNAPhe(pork)
52
28S 12S 30
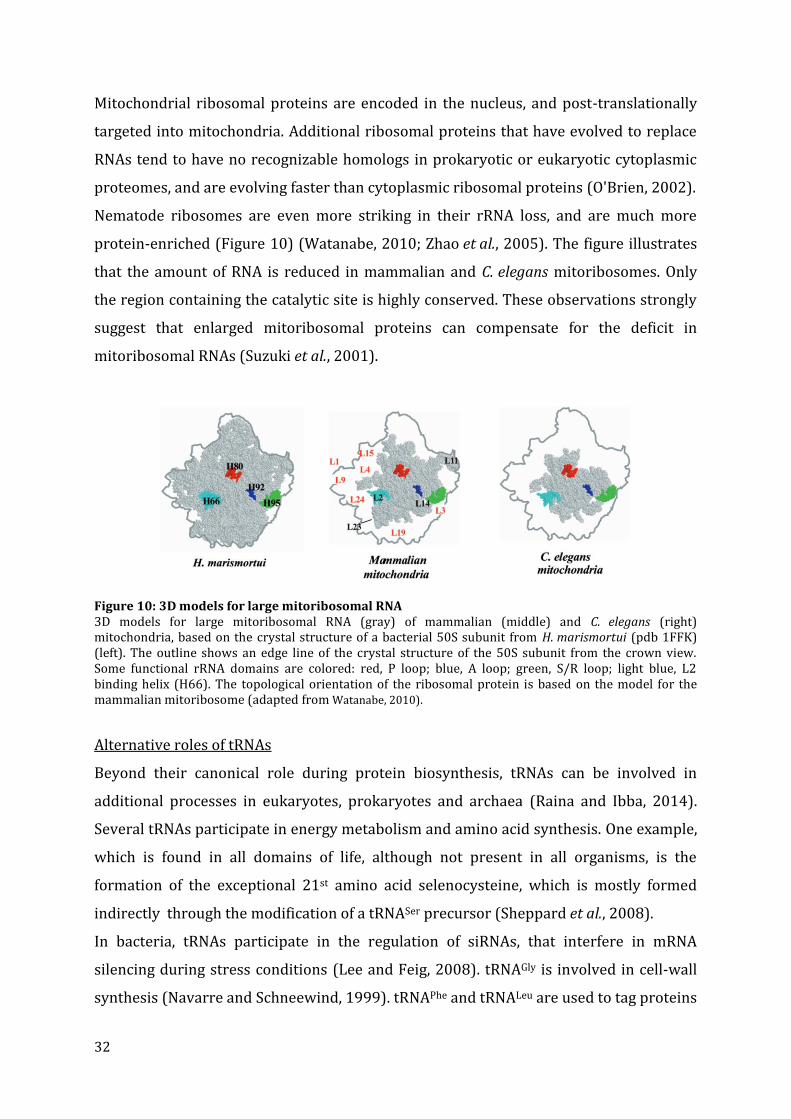
32
Mitochondrial ribosomal proteins are encoded in the nucleus, and post-translationally
targeted into mitochondria. Additional ribosomal proteins that have evolved to replace
RNAs tend to have no recognizable homologs in prokaryotic or eukaryotic cytoplasmic
proteomes, and are evolving faster than cytoplasmic ribosomal proteins (O'Brien, 2002).
Nematode ribosomes are even more striking in their rRNA loss, and are much more
protein-enriched (Figure 10) (Watanabe, 2010; Zhao et al., 2005). The figure illustrates
that the amount of RNA is reduced in mammalian and C. elegans mitoribosomes. Only
the region containing the catalytic site is highly conserved. These observations strongly
suggest that enlarged mitoribosomal proteins can compensate for the deficit in
mitoribosomal RNAs (Suzuki et al., 2001).
Figure 10: 3D models for large mitoribosomal RNA 3D models for large mitoribosomal RNA (gray) of mammalian (middle) and C. elegans (right) mitochondria, based on the crystal structure of a bacterial 50S subunit from H. marismortui (pdb 1FFK) (left). The outline shows an edge line of the crystal structure of the 50S subunit from the crown view. Some functional rRNA domains are colored: red, P loop; blue, A loop; green, S/R loop; light blue, L2 binding helix (H66). The topological orientation of the ribosomal protein is based on the model for the mammalian mitoribosome (adapted from Watanabe, 2010).
Alternative roles of tRNAs
Beyond their canonical role during protein biosynthesis, tRNAs can be involved in
additional processes in eukaryotes, prokaryotes and archaea (Raina and Ibba, 2014).
Several tRNAs participate in energy metabolism and amino acid synthesis. One example,
which is found in all domains of life, although not present in all organisms, is the
formation of the exceptional 21st amino acid selenocysteine, which is mostly formed
indirectly through the modification of a tRNASer precursor (Sheppard et al., 2008).
In bacteria, tRNAs participate in the regulation of siRNAs, that interfere in mRNA
silencing during stress conditions (Lee and Feig, 2008). tRNAGly is involved in cell-wall
synthesis (Navarre and Schneewind, 1999). tRNAPhe and tRNALeu are used to tag proteins
33
with Phe and Leu for degradation, while tRNALys and tRNAAla are involved in remodeling
membrane lipids (Roy and Ibba, 2008).
In eukaryotes, it has been shown that tRNAGlu takes part in the chlorophyll and heme
biosynthesis (Jahn et al., 1992). tRNAArg is used for N-terminal arginylation of proteins,
thus effecting cell motility, and it may contribute to cardiovascular development and
angiogenesis (Karakozova et al., 2006). Furthermore, specific cytosolic tRNAs are
involved in the initiation of reverse transcription in retroviruses (Miller et al., 2014). Mt
tRNAs can interfere with a cytochrome c-mediated apoptotic pathway, and promote cell
survival (Hou and Yang, 2013). One should also not neglect the emerging role of tRNA
derived fragments that are known to be present in various organisms of all kingdoms of
life, where they perform crucial and diverse functions, e.g., in the regulation of
translation or stress responses (Nolte-'t Hoen et al., 2012; Shigematsu et al., 2014;
Pliatsika et al., 2016). A schematic overview about tRNA biogenesis and function is
represented in Figure 11.
Figure 11: tRNA biogenesis and function The 5'-sequence is removed by RNase P, whereas the 3'-end is removed by RNase Z. The CCA nucleotide sequence is added by CCA-adding enzymes at the 3’-end of tRNAs. Modification enzymes modify the tRNA. tRNA fragments (tRFs) result through the cleavage of exonucleases or cleavage enzymes. Aminoacyl-tRNA synthetases are specialized for one tRNA family and transfer the cognate amino acid to the tRNA. Finally, aminoacyl-tRNAs are delivered to the ribosome by elongation factor (EF-Tu) where they participate in protein synthesis. Despite their fundamental role in translation, mature tRNAs can fulfill additional functions. Maturation and processing steps marked in green are performed by enzymes that recognize all tRNA families, while aminoacylation and modification (red) are mostly performed by specialized enzymes.
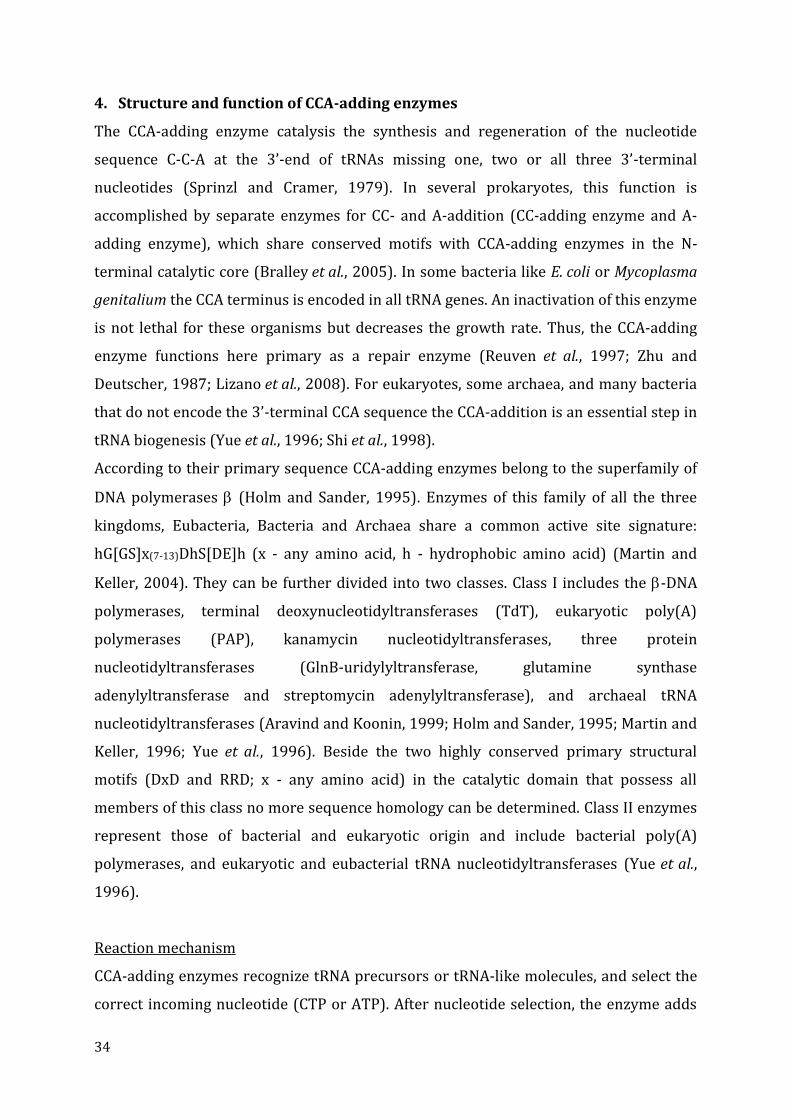
34
4. Structure and function of CCA-adding enzymes
The CCA-adding enzyme catalysis the synthesis and regeneration of the nucleotide
sequence C-C-A at the 3’-end of tRNAs missing one, two or all three 3’-terminal
nucleotides (Sprinzl and Cramer, 1979). In several prokaryotes, this function is
accomplished by separate enzymes for CC- and A-addition (CC-adding enzyme and A-
adding enzyme), which share conserved motifs with CCA-adding enzymes in the N-
terminal catalytic core (Bralley et al., 2005). In some bacteria like E. coli or Mycoplasma
genitalium the CCA terminus is encoded in all tRNA genes. An inactivation of this enzyme
is not lethal for these organisms but decreases the growth rate. Thus, the CCA-adding
enzyme functions here primary as a repair enzyme (Reuven et al., 1997; Zhu and
Deutscher, 1987; Lizano et al., 2008). For eukaryotes, some archaea, and many bacteria
that do not encode the 3’-terminal CCA sequence the CCA-addition is an essential step in
tRNA biogenesis (Yue et al., 1996; Shi et al., 1998).
According to their primary sequence CCA-adding enzymes belong to the superfamily of
DNA polymerases (Holm and Sander, 1995). Enzymes of this family of all the three
kingdoms, Eubacteria, Bacteria and Archaea share a common active site signature:
hG[GS]x(7-13)DhS[DE]h (x - any amino acid, h - hydrophobic amino acid) (Martin and
Keller, 2004). They can be further divided into two classes. Class I includes the -DNA
polymerases, terminal deoxynucleotidyltransferases (TdT), eukaryotic poly(A)
polymerases (PAP), kanamycin nucleotidyltransferases, three protein
nucleotidyltransferases (GlnB-uridylyltransferase, glutamine synthase
adenylyltransferase and streptomycin adenylyltransferase), and archaeal tRNA
nucleotidyltransferases (Aravind and Koonin, 1999; Holm and Sander, 1995; Martin and
Keller, 1996; Yue et al., 1996). Beside the two highly conserved primary structural
motifs (DxD and RRD; x - any amino acid) in the catalytic domain that possess all
members of this class no more sequence homology can be determined. Class II enzymes
represent those of bacterial and eukaryotic origin and include bacterial poly(A)
polymerases, and eukaryotic and eubacterial tRNA nucleotidyltransferases (Yue et al.,
1996).
Reaction mechanism
CCA-adding enzymes recognize tRNA precursors or tRNA-like molecules, and select the
correct incoming nucleotide (CTP or ATP). After nucleotide selection, the enzyme adds
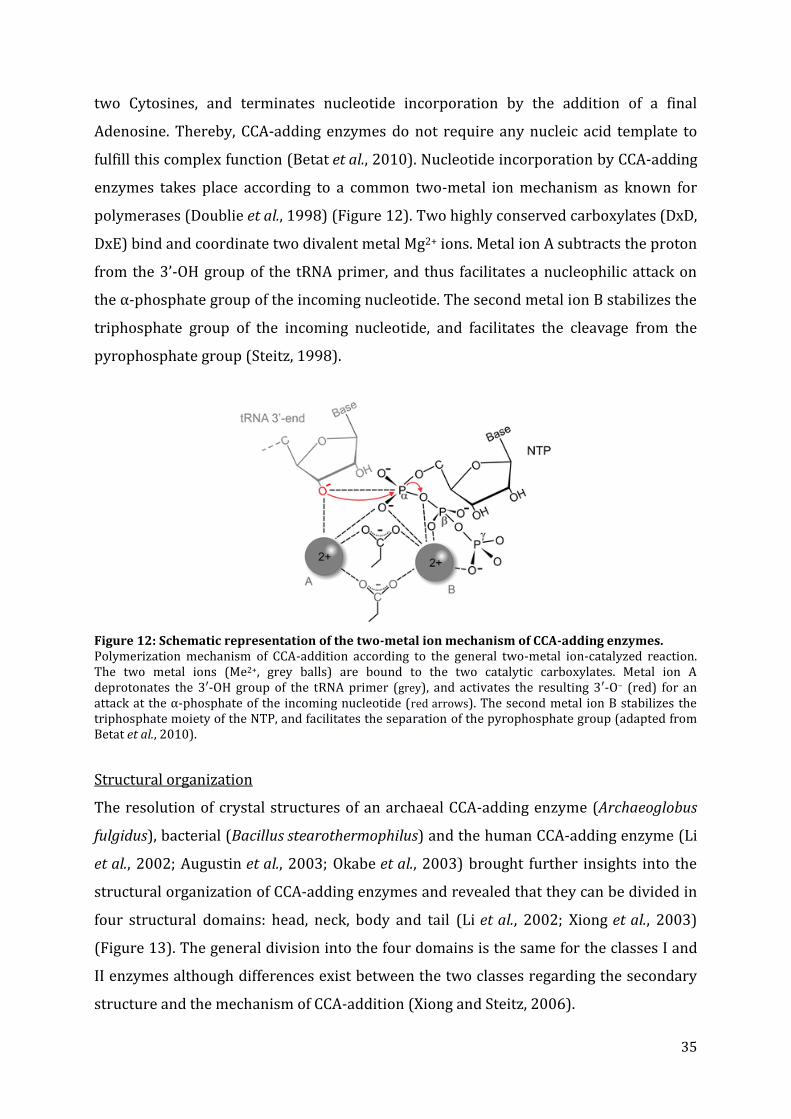
35
two Cytosines, and terminates nucleotide incorporation by the addition of a final
Adenosine. Thereby, CCA-adding enzymes do not require any nucleic acid template to
fulfill this complex function (Betat et al., 2010). Nucleotide incorporation by CCA-adding
enzymes takes place according to a common two-metal ion mechanism as known for
polymerases (Doublie et al., 1998) (Figure 12). Two highly conserved carboxylates (DxD,
DxE) bind and coordinate two divalent metal Mg2+ ions. Metal ion A subtracts the proton
from the 3’-OH group of the tRNA primer, and thus facilitates a nucleophilic attack on
the α-phosphate group of the incoming nucleotide. The second metal ion B stabilizes the
triphosphate group of the incoming nucleotide, and facilitates the cleavage from the
pyrophosphate group (Steitz, 1998).
Figure 12: Schematic representation of the two-metal ion mechanism of CCA-adding enzymes. Polymerization mechanism of CCA-addition according to the general two-metal ion-catalyzed reaction. The two metal ions (Me2+, grey balls) are bound to the two catalytic carboxylates. Metal ion A deprotonates the 3′-OH group of the tRNA primer (grey), and activates the resulting 3′-O− (red) for an attack at the α-phosphate of the incoming nucleotide (red arrows). The second metal ion B stabilizes the triphosphate moiety of the NTP, and facilitates the separation of the pyrophosphate group (adapted from Betat et al., 2010).
Structural organization
The resolution of crystal structures of an archaeal CCA-adding enzyme (Archaeoglobus
fulgidus), bacterial (Bacillus stearothermophilus) and the human CCA-adding enzyme (Li
et al., 2002; Augustin et al., 2003; Okabe et al., 2003) brought further insights into the
structural organization of CCA-adding enzymes and revealed that they can be divided in
four structural domains: head, neck, body and tail (Li et al., 2002; Xiong et al., 2003)
(Figure 13). The general division into the four domains is the same for the classes I and
II enzymes although differences exist between the two classes regarding the secondary
structure and the mechanism of CCA-addition (Xiong and Steitz, 2006).
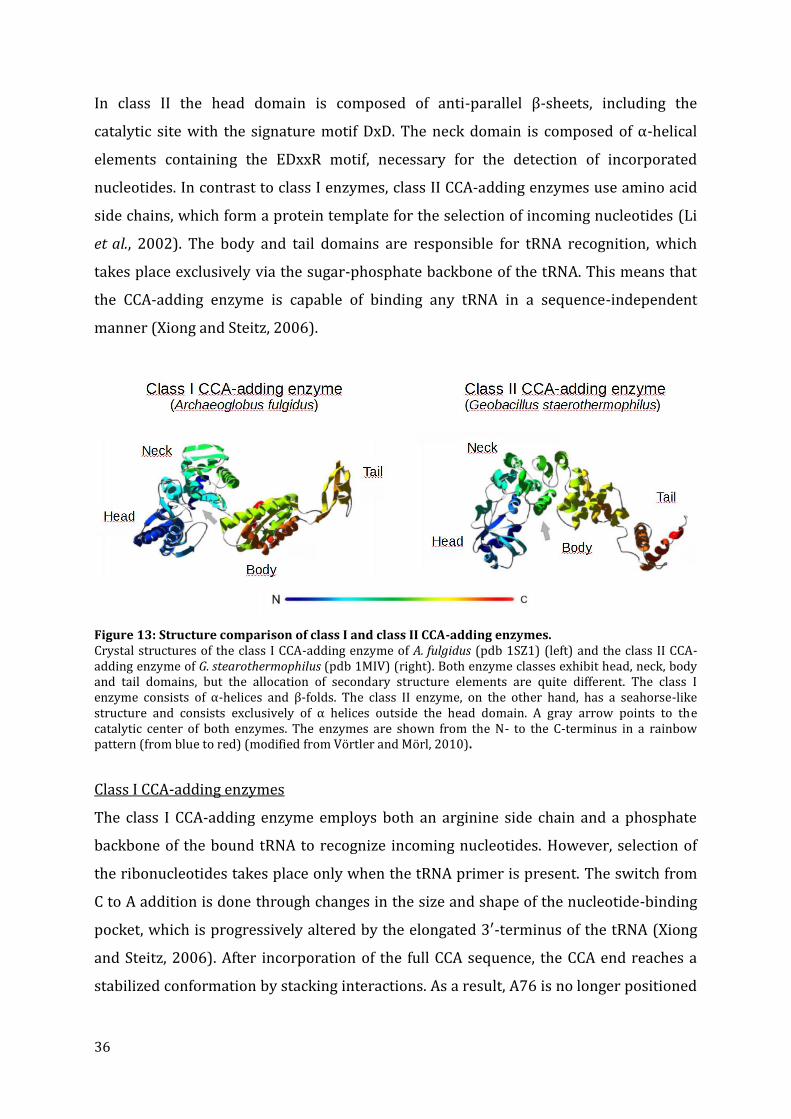
36
In class II the head domain is composed of anti-parallel β-sheets, including the
catalytic site with the signature motif DxD. The neck domain is composed of α-helical
elements containing the EDxxR motif, necessary for the detection of incorporated
nucleotides. In contrast to class I enzymes, class II CCA-adding enzymes use amino acid
side chains, which form a protein template for the selection of incoming nucleotides (Li
et al., 2002). The body and tail domains are responsible for tRNA recognition, which
takes place exclusively via the sugar-phosphate backbone of the tRNA. This means that
the CCA-adding enzyme is capable of binding any tRNA in a sequence-independent
manner (Xiong and Steitz, 2006).
Figure 13: Structure comparison of class I and class II CCA-adding enzymes. Crystal structures of the class I CCA-adding enzyme of A. fulgidus (pdb 1SZ1) (left) and the class II CCA-adding enzyme of G. stearothermophilus (pdb 1MIV) (right). Both enzyme classes exhibit head, neck, body and tail domains, but the allocation of secondary structure elements are quite different. The class I enzyme consists of α-helices and β-folds. The class II enzyme, on the other hand, has a seahorse-like structure and consists exclusively of α helices outside the head domain. A gray arrow points to the catalytic center of both enzymes. The enzymes are shown from the N- to the C-terminus in a rainbow pattern (from blue to red) (modified from Vörtler and Mörl, 2010).
Class I CCA-adding enzymes
The class I CCA-adding enzyme employs both an arginine side chain and a phosphate
backbone of the bound tRNA to recognize incoming nucleotides. However, selection of
the ribonucleotides takes place only when the tRNA primer is present. The switch from
C to A addition is done through changes in the size and shape of the nucleotide-binding
pocket, which is progressively altered by the elongated 3′-terminus of the tRNA (Xiong
and Steitz, 2006). After incorporation of the full CCA sequence, the CCA end reaches a
stabilized conformation by stacking interactions. As a result, A76 is no longer positioned
37
in the primer binding site and no further additions are performed (Martin and Keller,
2007; Xiong and Steitz, 2006).
Figure 14: Nucleotide binding pocket of class I CCA-adding enzymes. A highly conserved arginine (green) and the phosphate groups of the tRNA backbone (gray) form specific hydrogen bonds to the bound nucleotides CTP and ATP (red). The collaboration of both protein and tRNA is responsible for an efficient and accurate templating during CCA-addition. The crystal structure originates from the A. fulgidus CCA-adding enzyme (pdb 1SZ1) (adapted from Betat et al. 2010).
Class II CCA-adding enzymes
All members of class II nucleotidyltransferases possess a highly conserved 25 kDa N-
terminal region that includes characteristic active site signature motifs A-E. Motif A
represents the common signature motif of nucleotidyltransferases of the β-superfamily
and contains the conserved amino acids GGxVRD and DxD, which are essential for the
metal ion catalysis (Steitz et al., 1994). Motif B consists of the amino acids DxxRRD,
which are important for the discrimination between NTPs and dNTPs (Li et al., 2002). A
recent study revealed that motif C (Dx(3,4)Gx(9)R) contributes to the switch in nucleotide
specificity during polymerization (Ernst et al., 2015). The neck domain contains motif D,
which consists of the amino acids EDxxR and plays a crucial role for nucleotide substrate
specificity. It represents therefore an amino-acid based template for nucleotide selection
(Li et al., 2002). Less is known about motif E. It is described as a stabilizing element
between the individual domains of the enzyme. Another important structural element is
referred to as a flexible loop due to its high flexibility and missing conserved signature.
This element is essential for the terminal A incorporation (Neuenfeldt et al., 2008).
The C-terminal part is involved in the binding of the tRNA. Interestingly, this domain
exhibits a high degree of variation and shows no sequence conservation when
comparing CCA-adding enzymes (Yue et al., 1996; Betat et al., 2004).
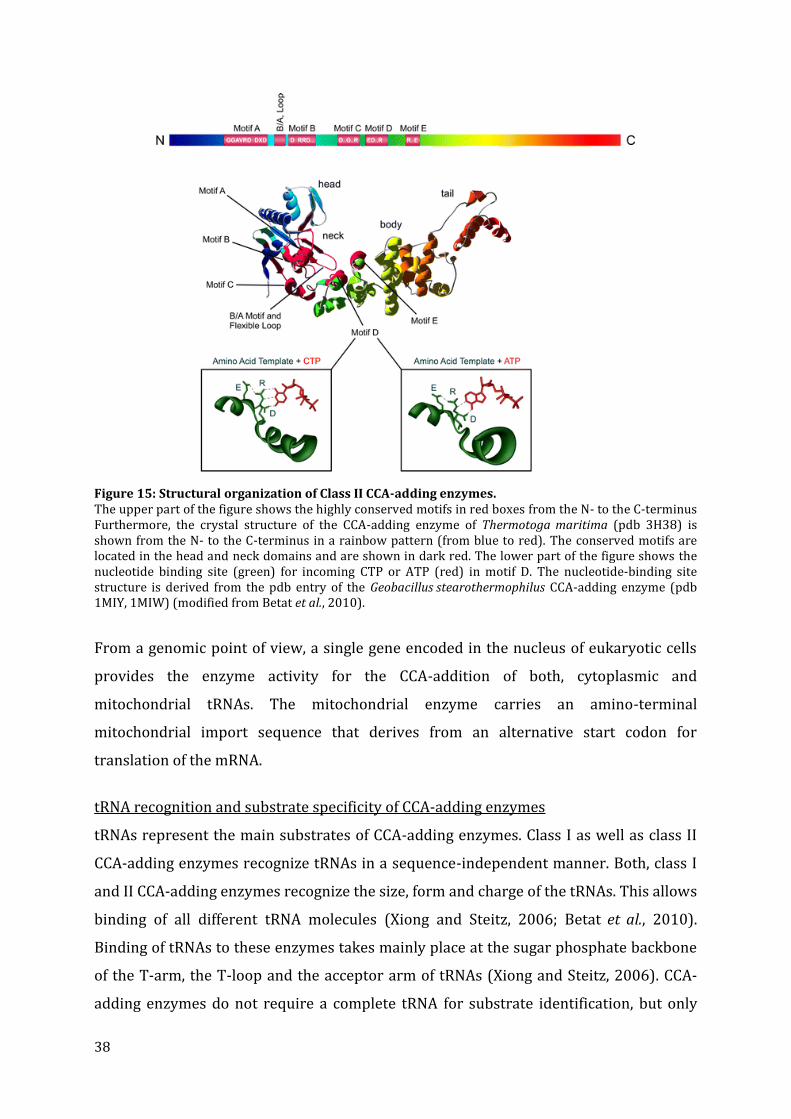
38
Figure 15: Structural organization of Class II CCA-adding enzymes. The upper part of the figure shows the highly conserved motifs in red boxes from the N- to the C-terminus Furthermore, the crystal structure of the CCA-adding enzyme of Thermotoga maritima (pdb 3H38) is shown from the N- to the C-terminus in a rainbow pattern (from blue to red). The conserved motifs are located in the head and neck domains and are shown in dark red. The lower part of the figure shows the nucleotide binding site (green) for incoming CTP or ATP (red) in motif D. The nucleotide-binding site structure is derived from the pdb entry of the Geobacillus stearothermophilus CCA-adding enzyme (pdb 1MIY, 1MIW) (modified from Betat et al., 2010).
From a genomic point of view, a single gene encoded in the nucleus of eukaryotic cells
provides the enzyme activity for the CCA-addition of both, cytoplasmic and
mitochondrial tRNAs. The mitochondrial enzyme carries an amino-terminal
mitochondrial import sequence that derives from an alternative start codon for
translation of the mRNA.
tRNA recognition and substrate specificity of CCA-adding enzymes
tRNAs represent the main substrates of CCA-adding enzymes. Class I as well as class II
CCA-adding enzymes recognize tRNAs in a sequence-independent manner. Both, class I
and II CCA-adding enzymes recognize the size, form and charge of the tRNAs. This allows
binding of all different tRNA molecules (Xiong and Steitz, 2006; Betat et al., 2010).
Binding of tRNAs to these enzymes takes mainly place at the sugar phosphate backbone
of the T-arm, the T-loop and the acceptor arm of tRNAs (Xiong and Steitz, 2006). CCA-
adding enzymes do not require a complete tRNA for substrate identification, but only
39
the upper half of the L-shaped structure. Therefore, tRNA minihelices consisting of
acceptor and T-arm of CCA-adding enzymes are also recognized as substrates (Li et al.,
1997; Dupasquier et al., 2008; Lizano et al., 2008).
It has been shown that enzymes from various organisms strictly recognize the elbow
region of tRNAs formed by conserved D- and T-loops. However, many mammalian mt
tRNAs lack of consensus sequences in both loops, or even miss one of the loops
completely. In 2001, Nagaike and colleagues demonstrated that the human mt CCA-
adding enzyme is capable to repair cytosolic tRNAs, human mt tRNAs as well as non-
cognate nematode mt tRNAs that lack the T-arm. Its bacterial counterpart, in contrast,
was only poorly able to process mt tRNAs, which indicates an adaptation of
mitochondrial CCA-adding enzymes to the unusual structure of mt tRNAs (Nagaike et al.,
2001).
Alternative substrates for CCA addition are often tRNA-like molecules or hairpin
structures imitating the upper half of tRNA structures. Indeed, alternative non-tRNA-like
molecules have been shown to be appropriate substrates for CCA-addition. For example,
the 3'-terminal RNA structure in the tobacco mosaic virus resembles a tRNA structure,
which is recognized by both, E. coli and S. cerevisiae CCA-adding enzymes (Hegg et al.,
1990). Furthermore, CCA nucleotides are post-transcriptional added to the mRNA of
rps12 in Zea mays (Williams et al., 2000). And 65% of mature human spliceosomal U2
snRNAs carry a 3'-CCA sequence, where at least the terminal A has been added post-
transcriptionally. Structure of the 3'-stem of U2 snRNAs resemble a tRNA minihelix (Cho
et al., 2002). The substrate requirements for the human CCA-adding enzyme were
studied more in detail and revealed that transcripts lacking a tRNA-like 3′-end are also
accepted for CCA addition and that the discriminator position in tRNAs, which is
normally an identity element for aminoacyl-tRNA synthetases, has a great impact on
CCA incorporation (Wende et al., 2015). All these examples emphasize the diversity of
alternative substrates of CCA-adding enzymes. However, the biological relevance of
these alternative substrates for CCA addition is still unclear.
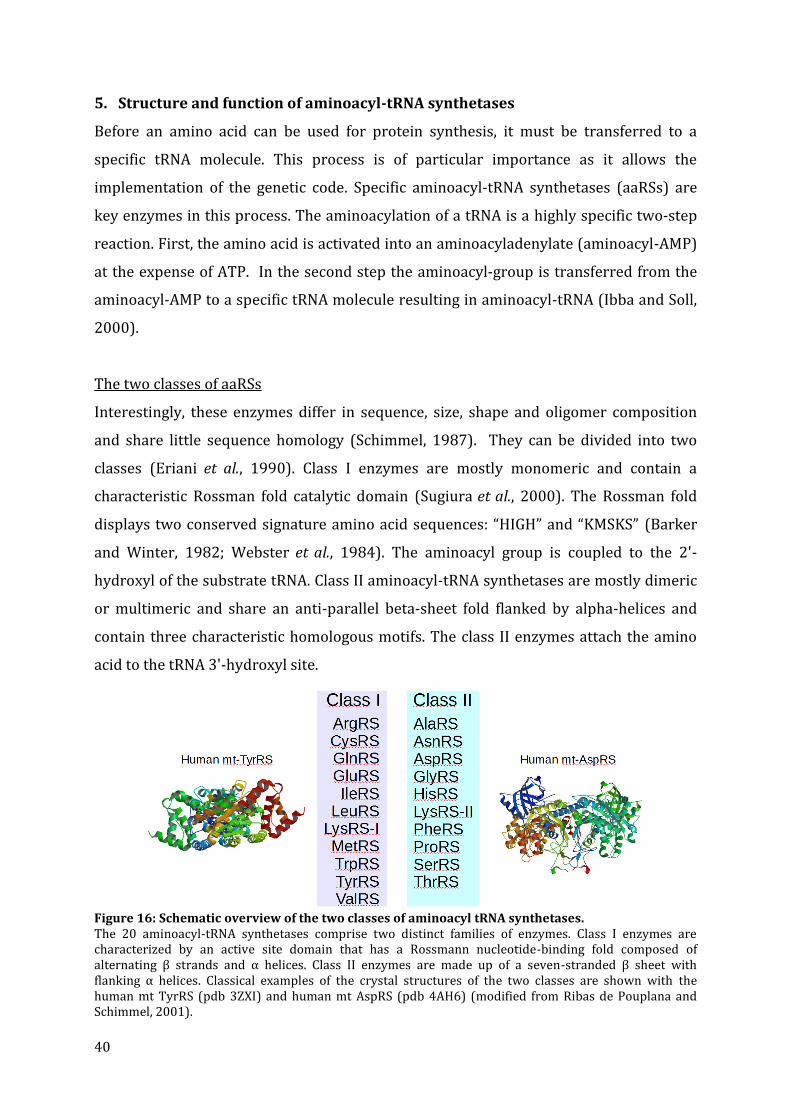
40
5. Structure and function of aminoacyl-tRNA synthetases
Before an amino acid can be used for protein synthesis, it must be transferred to a
specific tRNA molecule. This process is of particular importance as it allows the
implementation of the genetic code. Specific aminoacyl-tRNA synthetases (aaRSs) are
key enzymes in this process. The aminoacylation of a tRNA is a highly specific two-step
reaction. First, the amino acid is activated into an aminoacyladenylate (aminoacyl-AMP)
at the expense of ATP. In the second step the aminoacyl-group is transferred from the
aminoacyl-AMP to a specific tRNA molecule resulting in aminoacyl-tRNA (Ibba and Soll,
2000).
The two classes of aaRSs
Interestingly, these enzymes differ in sequence, size, shape and oligomer composition
and share little sequence homology (Schimmel, 1987). They can be divided into two
classes (Eriani et al., 1990). Class I enzymes are mostly monomeric and contain a
characteristic Rossman fold catalytic domain (Sugiura et al., 2000). The Rossman fold
displays two conserved signature amino acid sequences: “HIGH” and “KMSKS” (Barker
and Winter, 1982; Webster et al., 1984). The aminoacyl group is coupled to the 2'-
hydroxyl of the substrate tRNA. Class II aminoacyl-tRNA synthetases are mostly dimeric
or multimeric and share an anti-parallel beta-sheet fold flanked by alpha-helices and
contain three characteristic homologous motifs. The class II enzymes attach the amino
acid to the tRNA 3'-hydroxyl site.
Figure 16: Schematic overview of the two classes of aminoacyl tRNA synthetases. The 20 aminoacyl-tRNA synthetases comprise two distinct families of enzymes. Class I enzymes are characterized by an active site domain that has a Rossmann nucleotide-binding fold composed of alternating β strands and α helices. Class II enzymes are made up of a seven-stranded β sheet with flanking α helices. Classical examples of the crystal structures of the two classes are shown with the human mt TyrRS (pdb 3ZXI) and human mt AspRS (pdb 4AH6) (modified from Ribas de Pouplana and Schimmel, 2001).
41
Many efforts have been brought over decades, towards understanding of the recognition
code of tRNAs by aminoacyl-tRNA synthetases. This “second genetic code” is crucial for
the accuracy of translation since it allows a specific amino-acid to be linked precisely
and exclusively to the corresponding tRNA (Beuning and Musier-Forsyth, 1999; Giegé
and Eriani, 2001).
tRNA recognition and specific “identity elements” have been deciphered for each aaRS in
E. coli and S. cervisiae and have been partially determined for other organisms, e.g.,
T. thermophilus, C. elegans, A. thaliana and H. sapiens (McClain, 1993; Beuning and
Musier-Forsyth, 1999; Giegé et al., 2012). Most aaRSs recognize their cognate tRNAs
through direct interactions with the anticodon and acceptor stem regions (Rich and
Schimmel, 1977; Giegé et al., 1998). But also other structural regions or even concrete
nucleotides can represent additional tRNA identity elements such as the variable loop
region of tRNASer (Lenhard 1999), the tRNA elbow of tRNALeu and tRNAVal (Du, 2003;
Fukai et al., 2000), single nucleotides such as the discriminator base at position 73 (Pütz
et al., 1991), base pairs like G3:U70 in tRNAAla (Chihade et al., 1998) or even chemically
modified bases for example in the anticodon loop of E. coli tRNAs specific for Ile, Glu and
Lys (Giegé et al., 1998).
Mitochondrial aaRSs
Usually mitochondria do not encode any aaRSs in their own genome. All aaRS that are
needed for mitochondrial translation, are encoded in the nuclear genome, and imported
into mitochondria. Mt aaRSs are translated in the cytosol, and imported into
mitochondria, thanks to a MTS, which is cleaved during the import process. The
identification of a MTS is still challenging since sequence lengths and amino acid
compositions are not conserved (Gakh et al., 2002; Chacinska et al., 2009).
In mammals, cytosolic and mitochondrial synthetases are usually encoded by two
different genes. The only exceptions are LysRS and GlyRS, which are encoded by the
same gene. The protein, which is dedicated to mitochondria is generated by either
alternative splicing (Tolkunova et al., 2000) or by processing from alternative
translation start site (Mudge et al., 1998). A different exception represent GlnRS, as no
mitochondrial homolog could been identified in mammalian genomes so far, indicating
the existence of an alternative pathway for tRNAGln formation (Nagao et al., 2009;
Frechin et al., 2009; Bullwinkle and Ibba, 2014).
42
Mammalian mitochondrial aaRSs tend to show size and structural homology to their
corresponding enzymes from the three domains of life. They exhibit classical signature
motifs for amino acid specificity, and specific signature motifs either for class I, or for
class II aaRS (Bonnefond et al., 2005). The oligomeric state of mt aaRSs is generally the
same as that of the cytosolic aaRSs. However, two exceptions exist, which concern mt
GlyRS and mt PheRS. Mt GlyRS is dimeric like other eukaryotic cytosolic enzymes, while
a heterotetrameric form is present in most bacteria (Tang and Huang, 2005). PheRS
appears as a monomer in mitochondria, and thus not as a classical tetramer (Klipcan et
al., 2008).
The evolutionary origin of mt aaRSs has been investigated intensively, but still remains
obscure. Phylogenetic analysis revealed that many mt aaRS originate from bacteria, but
are not closely related to any known α-proteobacterial ancestor, suggesting that various
horizontal gene transfer events took place during evolution (Brindefalk et al., 2007).
A first comprehensive analysis of mt aaRS was performed in 2005, which was based on
an annotation of a full set of mt aaRSs and presented a functional characterization of the
mt AspRS and mt TyrRS (Bonnefond et al., 2005). Results have been validated then also
for several other mt enzymes. Interestingly, some mt aaRSs show slower enzymatic
activity compared to their cytosolic or E. coli homologs (Bullard et al., 1999; Bullard et
al., 2000).
Nowadays, crystal structures of human mt TyrRS (Bonnefond et al., 2007), mt PheRS
(Klipcan et al., 2012), mt AspRS (Neuenfeldt et al., 2013), bovine mt SerRS (Chimnaronk
et al., 2005), and yeast mt ThrRS (Holman et al., 2016) have been solved. Although mt
enzymes exhibit similar architectures when compared to their prokaryotic homologs,
they can be distinguished by more electropositive surface potentials, or by enlarged
grooves for tRNA accommodation. This indicates an adaptation to degenerated mt
tRNAs (Neuenfeldt et al., 2013).
Following the endosymbiotic theory on the origin of mitochondria, it should be possible
that mt aaRSs may have preserved the ability to aminoacylate prokaryotic tRNAs, and
vice versa. Indeed, it has been shown that bovine mt extracts efficiently aminoacylate
eubacterial tRNAs, whereas prokaryotic enzymes are unable to aminoacylate bovine mt
tRNAs (Kumazawa et al., 1991). In another study, cross aminoacylation of human mt and
cytosolic extracts from HeLa cell has been compared. It could be shown that 12 mt aaRSs
were able to aminoacylate corresponding cytosolic tRNAs, whereas several cytosolic

43
aaRSs were not capable to efficiently charge mt tRNAs (Lynch and Attardi, 1976). LeuRS
and LysRS activities of human mt placenta extracts were capable to charge both, E. coli
and yeast cytosolic total tRNAs, but LysRSs from E. coli and yeast cytoplasm could not
charge human mt tRNAs (Ibba et al., 2009). These examples illustrate the higher
capability of mt aaRSs to recognize cytosolic tRNAs than that of cytosolic aaRSs to
recognize mt tRNAs. Rare cases of cross reactivities between both, cytosolic and mt
enzymes, may be correlated to sequence homologies and/or similar structural features
of mt and cytosolic tRNAs (Suzuki et al., 2011).
This study focused especially on mt arginyl-tRNA synthetases because a cognate tRNAArg
from R. culicivorax was one of the tRNAs, which was also further characterized. A
detailed description and characterization of classical arginyl-tRNA synthetases is
presented in Chapter 4 of the results part.
6. Objectives of the study
This study aims the functional characterization of armless tRNAs in defining their
structural properties and studying different aspects of their functionality, especially
their interaction with CCA-adding enzymes and with the cognate aminoacyl-tRNA
synthetase. For this study we chose to characterize the armless tRNAArg and tRNAIle from
R. culicivorax. The objectives of this work are divided into two parts
6.1. Structural characterization of armless mitochondrial tRNAs
Our goal is to understand into which structures the unusual transcripts do fold. All
known translational systems require tRNA molecules that fold into an L-shaped tertiary
structure on the basis of a cloverleaf-like secondary structure. The L-shaped 3D
structure is the requirement for functional activities including to be substrate and/or
interactor with the macromolecules involved in translation. The armless tRNAs from
R. culicivorax mitochondria, however, show such a strong deviation from regular
structures in terms of size, of nucleotide content and cloverleaf folding, that on a
theoretically basis they would not fold into a conventional three-dimensional tRNA
structure. The aim of this project is to describe the actual structural features of these
transcripts as a prerequisite for understanding the interplay between the tRNAs and
their processing enzymes. For this purpose in vitro transcripts are used in structure
44
probing approaches, such as enzymatic and chemical probing. We will also use nuclear
magnetic resonance (NMR) spectroscopy, and small-angle X-ray scattering (SAXS) to
study the intramolecular interactions in armless tRNAs. These approaches will provide
details about the tRNA size and shape at the 3D level and will also allow for comparison
with classical tRNAs.
The elucidation of structural and functional properties of armless tRNAs will help to
verify if the smallest known tRNA is compatible with life and will give further insights to
possible co-evolutional processes between armless tRNA and partner proteins.
6.2. Functional study of armless tRNA maturation and aminoacylation
CCA-adding enzyme and the mitochondrial arginyl-tRNA synthetase from R. culicivorax
will be used for functional analysis. In general, one CCA-adding enzyme recognizes two
different sets of tRNAs (cytosolic and mitochondrial), while the mitochondrial
aminoacyl-tRNA synthetases are specialized enzymes exclusively adapted to
mitochondrial tRNAs. The gene sequence of both enzymes have yet to be identified and
confirmed by PCR and sequencing methods, as the genome annotation of this particular
nematode worm became only recently available and is still incompletely annotated,
especially for the arginyl-tRNA synthetase. The identified gene sequences will be cloned
and the corresponding proteins expressed in order to identify their functional
properties in regard to armless tRNAs. For this purpose, CCA-incorporation assays and
aminoacylation assays will be performed with the respective protein using in vitro
transcribed armless tRNAs as substrate. The properties of these enzymes will be
compared with those of homologous enzymes of human mitochondria and E. coli,
respectively, already or in the process to be characterized in the two host laboratories.
Enzymes that recognize tRNAs can be divided into two groups, based on their range of
recognition. Proteins like CCA-adding enzymes, EF-Tus, and ribosomes need to
recognize the full variety of all tRNA molecules in an organism, and possess therefore a
broad substrate spectrum. On the other hand, the range of recognition of each aaRS is
restricted to only one or a few tRNAs that all bind the same amino acid. To cover both
groups, one representative protein from each group has been chosen for functional and
structural characterization in this study.
45
MATERIAL & METHODS
46
7. Material
Chemicals, kits, enzymes, cell material, bacterial strains, plasmids, DNA primers, media,
buffers and solution as well as software used in this study are listed in the following
paragraphs.
7.1. Sources for chemicals
Unless otherwise mentioned, all chemicals used in this study were purchased in
the highest quality available from the following companies AppliChem (Darmstadt), Carl
Roth (Karlsruhe), Sigma-Aldrich (Munich), and Merck (Darmstadt).
7.2. Kits
The following table (Table 2) contains the kits used in this study.
Table 2: Kits
Product Source BigDye® Terminator 1.1 Cycle Sequencing Kit CloneJETTM PCR Cloning Kit GeneJETTM Gel Extraction Kit GeneJETTM PCR Purification Kit GeneJETTM Plasmid Miniprep Kit GeneEluteTM mRNA Miniprep Kit NucleoSpin® plasmid RACE DNA Purification System TOPO® TA Cloning® Kit Wizard® SV Gel and PCR clean-up System
GE Healthcare Thermo Scientific Thermo Scientific Thermo Scientific Thermo Scientific Sigma-Aldrich Macherey-Nagel Life Technologies Life Technologies Promega
7.3. Enzymes and tRNAs
The commercially available enzymes used in this study are listed in Table 3, and non-
commercial enzymes are listed in Table 4. The utilized tRNA material is listed in Table 5.
Table 3: Commercial enzymes
Enzyme Source BamHI DpnI EcoRV HindIII NcoI XbaI Pfu DNA polymerase
New England Biolabs New England Biolabs New England Biolabs New England Biolabs Thermo Scientific Thermo Scientific Fermentas and Thermo Scientific

47
Phusion High Fidelity DNA Polymerase RevertAid Reverse Transcriptase Nuclease S1 Ribonuclease V1 Ribonuclease T1 T4 DNA ligase T4-PNK T4 RNA ligase I Terminal deoxynucleotidyl transferase (TdT) Thermostable inorganic pyrophosphatase (TIPP)
Thermo Scientific Thermo Scientific Fermentas Applied Biosystems Applied Biosystems New England Biolabs New England Biolabs and Thermo Scientific New England Biolabs Invitrogen New England Biolabs
Table 4: Non-commercial enzymes
Enzyme Source Taq DNA polymerase T7 RNA polymerase H. sapiens CCA-adding enzyme E. coli CCA-adding enzyme R. culicivorax CCA-adding enzyme E. coli mt arginyl-tRNA synthetase S. cerevisiae mt arginyl-tRNA synthetase R. culicivorax mt arginyl-tRNA synthetase
In house preparation In house preparation In house preparation In house preparation This study Provided by S. X. Lin (Laval University, Canada) Provided by G. Eriani (University of Strasbourg) This study
Table 5: tRNAs
tRNAs Source Total E. coli tRNA Total yeast tRNA R. culicivorax mt tRNAArg R. culicivorax mt tRNAArg_CCA R. culicivorax mt tRNAIle
R. culicivorax mt tRNAIle_CCA
Sigma-Aldrich G. Eriani (University of Strasbourg) C. Lorenz (University of Leipzig) This study This study This study
7.4. Cell material
Living Romanomermis culicivorax worm material was provided by Edward G. Platzer
(University of California, Riverside). The nematodes were snap-frozen using liquid
nitrogen and stored at -80°C. Saccharomyces cerevisiae strains AH109 and Y187 were
used in this study (Table 6).

48
Table 6: S. cerevisiae strains
Strain Genotype Source or reference AH109 Y187
MATα, trp 1-901, leu2-3, 112, ura 3-52, his3-200, gal4Δ, gal80Δ, LYS2: GAL1UAS-GAL1TATA-HIS3, GAL2UAS-GAL2TATA-ADE2, URA3: MEL1UAS-MEL1TATA-LacZ MATα, ura3-52, his3-200, ade2-101, trp1-901, leu2-3, 112, gal4Δ, met–, gal80Δ, MEL1, RA3::GAL1UAS-GAL1TATA-lacZ
Clontech Clontech
7.5. Bacterial strains and plasmids
Bacterial strains and plasmid used in this study are listed in Table 7 and Table 8.
Table 7: Bacterial strains
E. coli strain Genotype Source or reference Top10 F- mcrA Δ(mrr-hsdRMS-mcrBC) φ80lacZΔM15
ΔlacX74 recA1 araD139 Δ(ara-leu)7697 galU galK rpsL (StrR) endA1 nupG
Invitrogen
BL21(DE3) F- ompT hsdSB (rB- mB-) gal dcm (DE3) Novagen RosettaTM2 F- ompT hsdSB(rB- mB-) gal dcm (DE3) pRARE2
(CamR) Novagen
Arctic ExpressTM(DE3) F– ompT hsdS(rB– mB–) dcm+ Tetr gal λ(DE3) endA Hte [cpn10 cpn60 Gentr]
Agilent Technologies
Table 8: Plasmids
Plasmid Source or reference Used for cloning of tRNA genes
pCR®2.1-TOPO Invitrogen
Used for cloning of protein genes pET28a Novagen pTrcHisA Invitrogen pUCIDT IDT pDEST Invitrogen pJJH378 Provided by A. Brüser (University of Leipzig)
7.6. Primers
DNA primer used in this study were acquired from Biomers and Sigma and are listed in
Table 9. The numbering used in the laboratory is given as well as the name, sequence in
5’ to 3’ direction, and the purpose of each primer. Small letters indicate restriction sites.
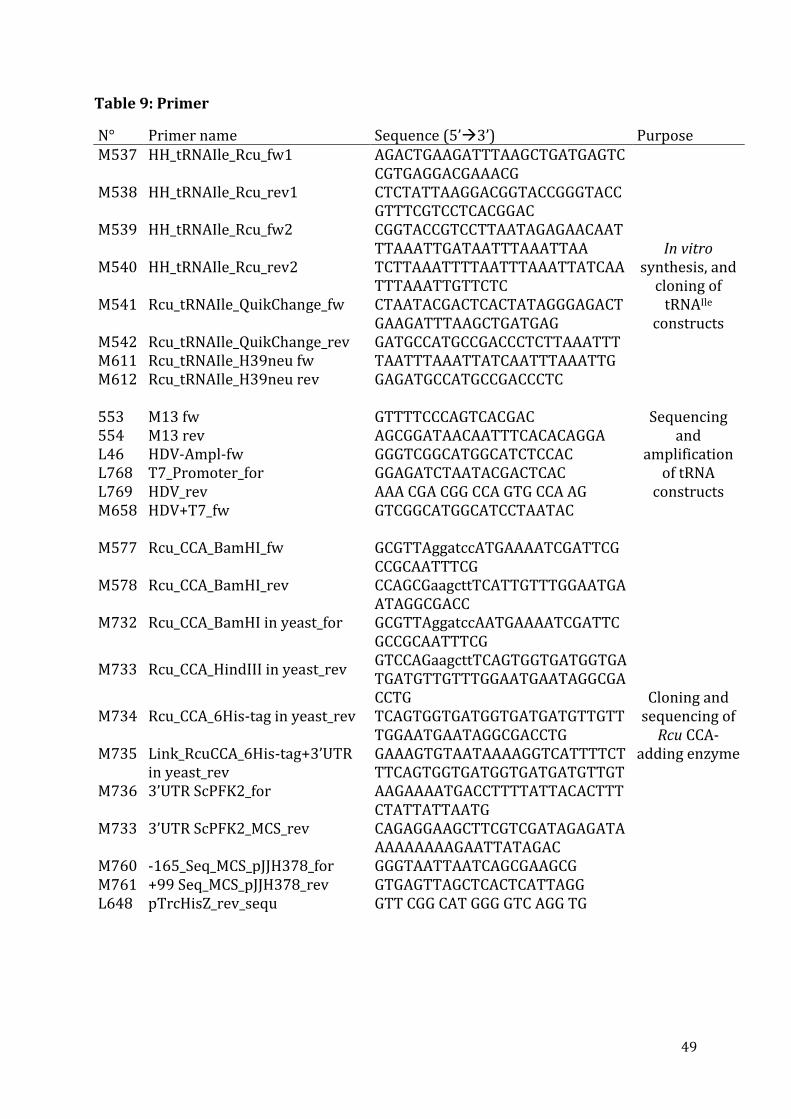
49
Table 9: Primer
N° Primer name Sequence (5’3’) Purpose M537
HH_tRNAIle_Rcu_fw1
AGACTGAAGATTTAAGCTGATGAGTCCGTGAGGACGAAACG
In vitro synthesis, and
cloning of tRNAIle
constructs
M538
HH_tRNAIle_Rcu_rev1
CTCTATTAAGGACGGTACCGGGTACCGTTTCGTCCTCACGGAC
M539
HH_tRNAIle_Rcu_fw2
CGGTACCGTCCTTAATAGAGAACAATTTAAATTGATAATTTAAATTAA
M540
HH_tRNAIle_Rcu_rev2
TCTTAAATTTTAATTTAAATTATCAATTTAAATTGTTCTC
M541
Rcu_tRNAIle_QuikChange_fw
CTAATACGACTCACTATAGGGAGACTGAAGATTTAAGCTGATGAG
M542 M611
Rcu_tRNAIle_QuikChange_rev Rcu_tRNAIle_H39neu fw
GATGCCATGCCGACCCTCTTAAATTTTAATTTAAATTATCAATTTAAATTG
M612 Rcu_tRNAIle_H39neu rev GAGATGCCATGCCGACCCTC 553 M13 fw GTTTTCCCAGTCACGAC Sequencing
and amplification
of tRNA constructs
554 M13 rev AGCGGATAACAATTTCACACAGGA L46 HDV-Ampl-fw GGGTCGGCATGGCATCTCCAC L768 T7_Promoter_for GGAGATCTAATACGACTCAC L769 HDV_rev AAA CGA CGG CCA GTG CCA AG M658 HDV+T7_fw GTCGGCATGGCATCCTAATAC M577
Rcu_CCA_BamHI_fw
GCGTTAggatccATGAAAATCGATTCGCCGCAATTTCG
Cloning and sequencing of
Rcu CCA-adding enzyme
M578
Rcu_CCA_BamHI_rev
CCAGCGaagcttTCATTGTTTGGAATGAATAGGCGACC
M732
Rcu_CCA_BamHI in yeast_for
GCGTTAggatccAATGAAAATCGATTCGCCGCAATTTCG
M733
Rcu_CCA_HindIII in yeast_rev
GTCCAGaagcttTCAGTGGTGATGGTGATGATGTTGTTTGGAATGAATAGGCGACCTG
M734
Rcu_CCA_6His-tag in yeast_rev
TCAGTGGTGATGGTGATGATGTTGTTTGGAATGAATAGGCGACCTG
M735
Link_RcuCCA_6His-tag+3’UTR in yeast_rev
GAAAGTGTAATAAAAGGTCATTTTCTTTCAGTGGTGATGGTGATGATGTTGT
M736
3’UTR ScPFK2_for
AAGAAAATGACCTTTTATTACACTTTCTATTATTAATG
M733
3’UTR ScPFK2_MCS_rev
CAGAGGAAGCTTCGTCGATAGAGATAAAAAAAAAGAATTATAGAC
M760 -165_Seq_MCS_pJJH378_for GGGTAATTAATCAGCGAAGCG M761 +99 Seq_MCS_pJJH378_rev GTGAGTTAGCTCACTCATTAGG L648
pTrcHisZ_rev_sequ
GTT CGG CAT GGG GTC AGG TG
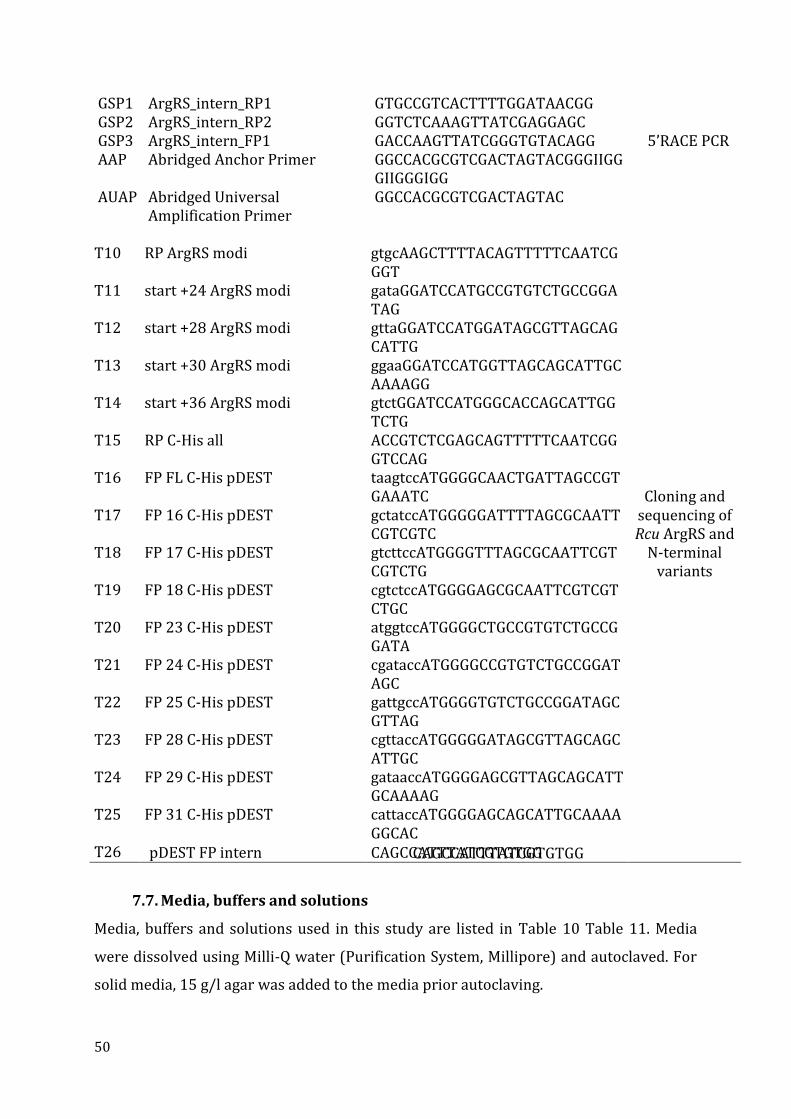
50
GSP1 ArgRS_intern_RP1 GTGCCGTCACTTTTGGATAACGG GSP2 GSP3 AAP AUAP
ArgRS_intern_RP2 ArgRS_intern_FP1 Abridged Anchor Primer Abridged Universal Amplification Primer
GGTCTCAAAGTTATCGAGGAGC GACCAAGTTATCGGGTGTACAGG GGCCACGCGTCGACTAGTACGGGIIGGGIIGGGIGG GGCCACGCGTCGACTAGTAC
5’RACE PCR
T10 RP ArgRS modi gtgcAAGCTTTTACAGTTTTTCAATCGGGT
Cloning and sequencing of Rcu ArgRS and
N-terminal variants
T11 start +24 ArgRS modi gataGGATCCATGCCGTGTCTGCCGGATAG
T12 start +28 ArgRS modi gttaGGATCCATGGATAGCGTTAGCAGCATTG
T13 start +30 ArgRS modi ggaaGGATCCATGGTTAGCAGCATTGCAAAAGG
T14 start +36 ArgRS modi gtctGGATCCATGGGCACCAGCATTGGTCTG
T15 RP C-His all ACCGTCTCGAGCAGTTTTTCAATCGGGTCCAG
T16 FP FL C-His pDEST taagtccATGGGGCAACTGATTAGCCGTGAAATC
T17 FP 16 C-His pDEST gctatccATGGGGGATTTTAGCGCAATTCGTCGTC
T18 FP 17 C-His pDEST gtcttccATGGGGTTTAGCGCAATTCGTCGTCTG
T19 FP 18 C-His pDEST cgtctccATGGGGAGCGCAATTCGTCGTCTGC
T20 FP 23 C-His pDEST atggtccATGGGGCTGCCGTGTCTGCCGGATA
T21 FP 24 C-His pDEST cgataccATGGGGCCGTGTCTGCCGGATAGC
T22 FP 25 C-His pDEST gattgccATGGGGTGTCTGCCGGATAGCGTTAG
T23 FP 28 C-His pDEST cgttaccATGGGGGATAGCGTTAGCAGCATTGC
T24 FP 29 C-His pDEST gataaccATGGGGAGCGTTAGCAGCATTGCAAAAG
T25 FP 31 C-His pDEST cattaccATGGGGAGCAGCATTGCAAAAGGCAC
T26 pDEST FP intern CAGCCATTTATCGTGTGG
CAGCCATTTATCGTGTGG
7.7. Media, buffers and solutions
Media, buffers and solutions used in this study are listed in Table 10 Table 11. Media
were dissolved using Milli-Q water (Purification System, Millipore) and autoclaved. For
solid media, 15 g/l agar was added to the media prior autoclaving.
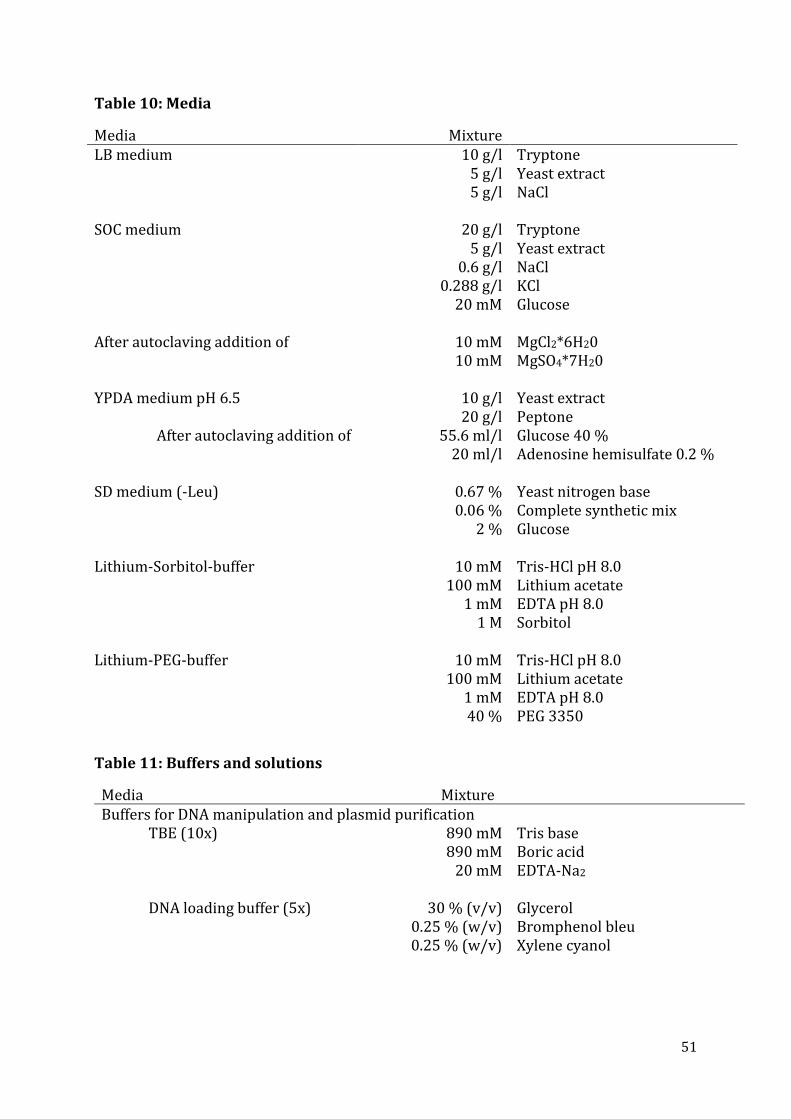
51
Table 10: Media
Media Mixture LB medium
10 g/l 5 g/l 5 g/l
Tryptone Yeast extract NaCl
SOC medium After autoclaving addition of
20 g/l 5 g/l
0.6 g/l 0.288 g/l
20 mM
10 mM 10 mM
Tryptone Yeast extract NaCl KCl Glucose MgCl2*6H20 MgSO4*7H20
YPDA medium pH 6.5
After autoclaving addition of
10 g/l 20 g/l
55.6 ml/l 20 ml/l
Yeast extract Peptone Glucose 40 % Adenosine hemisulfate 0.2 %
SD medium (-Leu) 0.67 % 0.06 %
2 %
Yeast nitrogen base Complete synthetic mix Glucose
Lithium-Sorbitol-buffer 10 mM 100 mM
1 mM 1 M
Tris-HCl pH 8.0 Lithium acetate EDTA pH 8.0 Sorbitol
Lithium-PEG-buffer 10 mM 100 mM
1 mM 40 %
Tris-HCl pH 8.0 Lithium acetate EDTA pH 8.0 PEG 3350
Table 11: Buffers and solutions
Media Mixture Buffers for DNA manipulation and plasmid purification
TBE (10x)
890 mM 890 mM
20 mM
Tris base Boric acid EDTA-Na2
DNA loading buffer (5x) 30 % (v/v) 0.25 % (w/v) 0.25 % (w/v)
Glycerol Bromphenol bleu Xylene cyanol
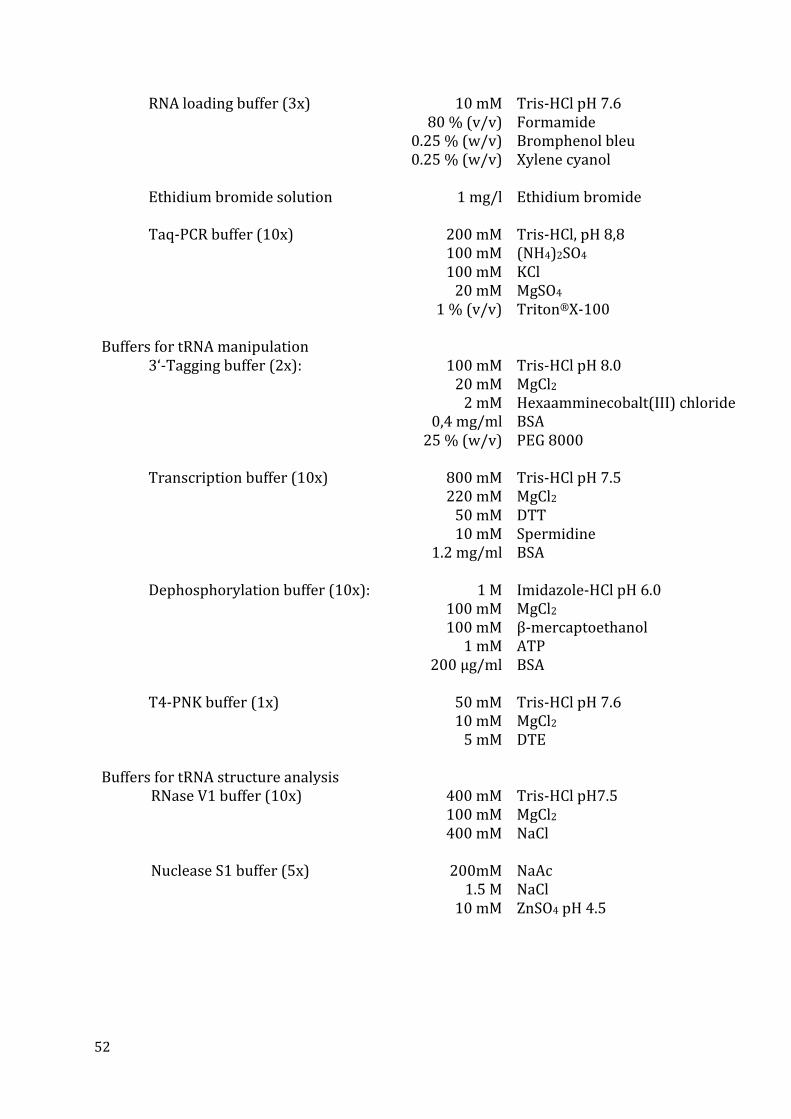
52
RNA loading buffer (3x) 10 mM 80 % (v/v)
0.25 % (w/v) 0.25 % (w/v)
Tris-HCl pH 7.6 Formamide Bromphenol bleu Xylene cyanol
Ethidium bromide solution 1 mg/l Ethidium bromide
Taq-PCR buffer (10x) 200 mM 100 mM 100 mM
20 mM 1 % (v/v)
Tris-HCl, pH 8,8 (NH4)2SO4 KCl MgSO4 Triton®X-100
Buffers for tRNA manipulation
3‘-Tagging buffer (2x): 100 mM 20 mM
2 mM 0,4 mg/ml
25 % (w/v)
Tris-HCl pH 8.0 MgCl2 Hexaamminecobalt(III) chloride BSA PEG 8000
Transcription buffer (10x) 800 mM 220 mM
50 mM 10 mM
1.2 mg/ml
Tris-HCl pH 7.5 MgCl2 DTT Spermidine BSA
Dephosphorylation buffer (10x): 1 M 100 mM 100 mM
1 mM 200 µg/ml
Imidazole-HCl pH 6.0 MgCl2 β-mercaptoethanol ATP BSA
T4-PNK buffer (1x) 50 mM 10 mM
5 mM
Tris-HCl pH 7.6 MgCl2 DTE
Buffers for tRNA structure analysis
RNase V1 buffer (10x) 400 mM 100 mM 400 mM
Tris-HCl pH7.5 MgCl2 NaCl
Nuclease S1 buffer (5x) 200mM 1.5 M
10 mM
NaAc NaCl ZnSO4 pH 4.5
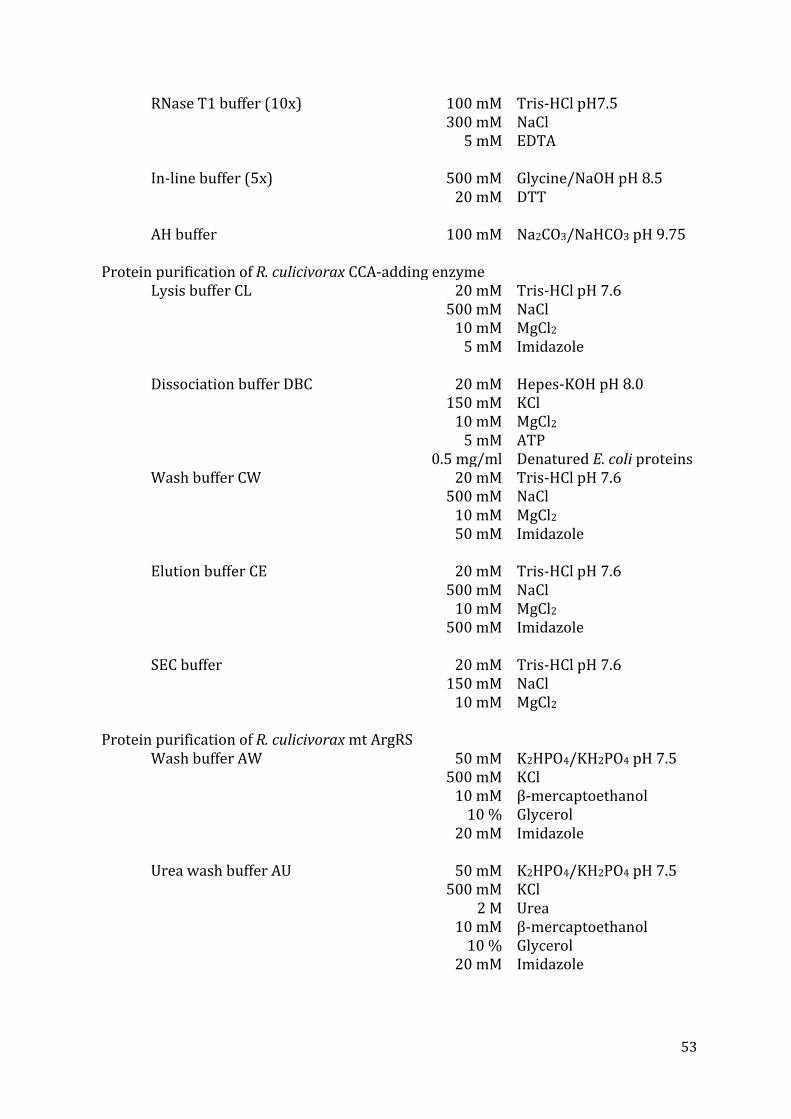
53
RNase T1 buffer (10x) 100 mM 300 mM
5 mM
Tris-HCl pH7.5 NaCl EDTA
In-line buffer (5x) 500 mM 20 mM
Glycine/NaOH pH 8.5 DTT
AH buffer 100 mM Na2CO3/NaHCO3 pH 9.75 Protein purification of R. culicivorax CCA-adding enzyme
Lysis buffer CL 20 mM 500 mM
10 mM 5 mM
Tris-HCl pH 7.6 NaCl MgCl2
Imidazole
Dissociation buffer DBC 20 mM 150 mM
10 mM 5 mM
0.5 mg/ml
Hepes-KOH pH 8.0 KCl MgCl2 ATP Denatured E. coli proteins
Wash buffer CW 20 mM 500 mM
10 mM 50 mM
Tris-HCl pH 7.6 NaCl MgCl2
Imidazole
Elution buffer CE 20 mM 500 mM
10 mM 500 mM
Tris-HCl pH 7.6 NaCl MgCl2
Imidazole
SEC buffer 20 mM 150 mM
10 mM
Tris-HCl pH 7.6 NaCl MgCl2
Protein purification of R. culicivorax mt ArgRS
Wash buffer AW 50 mM 500 mM
10 mM 10 %
20 mM
K2HPO4/KH2PO4 pH 7.5 KCl β-mercaptoethanol Glycerol Imidazole
Urea wash buffer AU 50 mM 500 mM
2 M 10 mM
10 % 20 mM
K2HPO4/KH2PO4 pH 7.5 KCl Urea β-mercaptoethanol Glycerol Imidazole
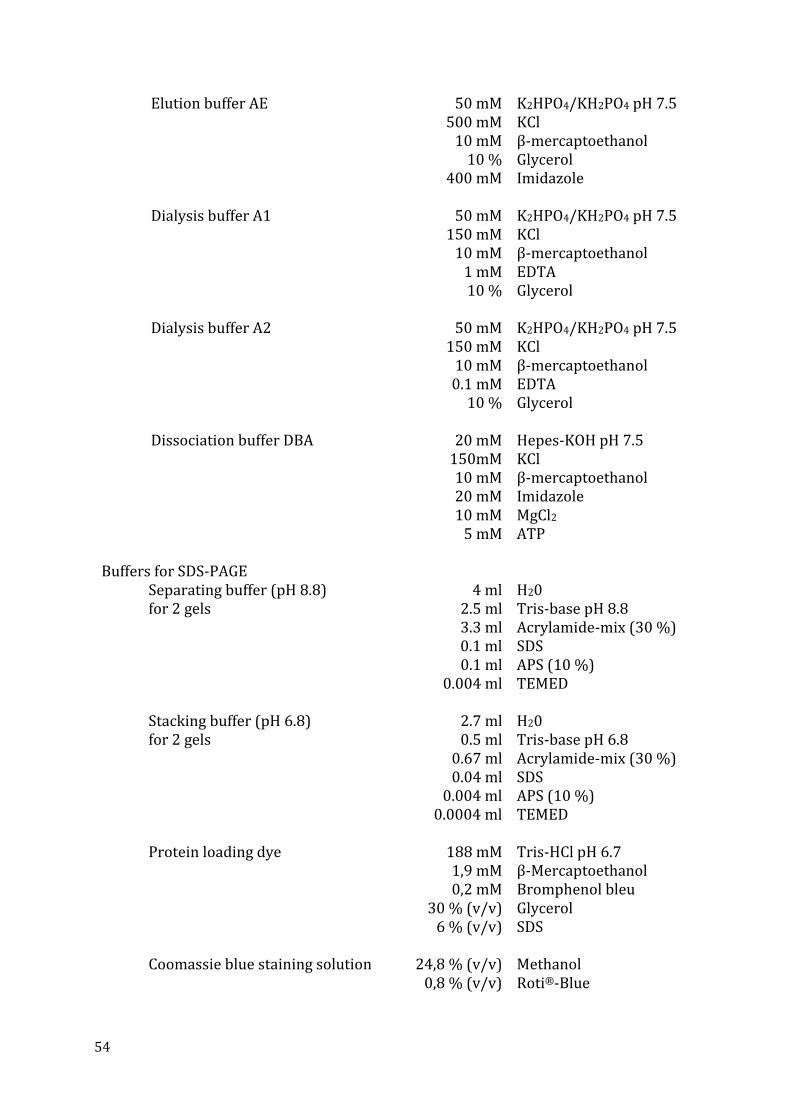
54
Elution buffer AE 50 mM 500 mM
10 mM 10 %
400 mM
K2HPO4/KH2PO4 pH 7.5 KCl β-mercaptoethanol Glycerol Imidazole
Dialysis buffer A1 50 mM 150 mM
10 mM 1 mM 10 %
K2HPO4/KH2PO4 pH 7.5 KCl β-mercaptoethanol EDTA Glycerol
Dialysis buffer A2 50 mM 150 mM
10 mM 0.1 mM
10 %
K2HPO4/KH2PO4 pH 7.5 KCl β-mercaptoethanol EDTA Glycerol
Dissociation buffer DBA 20 mM 150mM 10 mM 20 mM 10 mM
5 mM
Hepes-KOH pH 7.5 KCl β-mercaptoethanol Imidazole MgCl2 ATP
Buffers for SDS-PAGE
Separating buffer (pH 8.8) for 2 gels
4 ml 2.5 ml 3.3 ml 0.1 ml 0.1 ml
0.004 ml
H20 Tris-base pH 8.8 Acrylamide-mix (30 %) SDS APS (10 %) TEMED
Stacking buffer (pH 6.8) for 2 gels
2.7 ml 0.5 ml
0.67 ml 0.04 ml
0.004 ml 0.0004 ml
H20 Tris-base pH 6.8 Acrylamide-mix (30 %) SDS APS (10 %) TEMED
Protein loading dye
188 mM 1,9 mM 0,2 mM
30 % (v/v) 6 % (v/v)
Tris-HCl pH 6.7 β-Mercaptoethanol Bromphenol bleu Glycerol SDS
Coomassie blue staining solution
24,8 % (v/v) 0,8 % (v/v)
Methanol Roti®-Blue
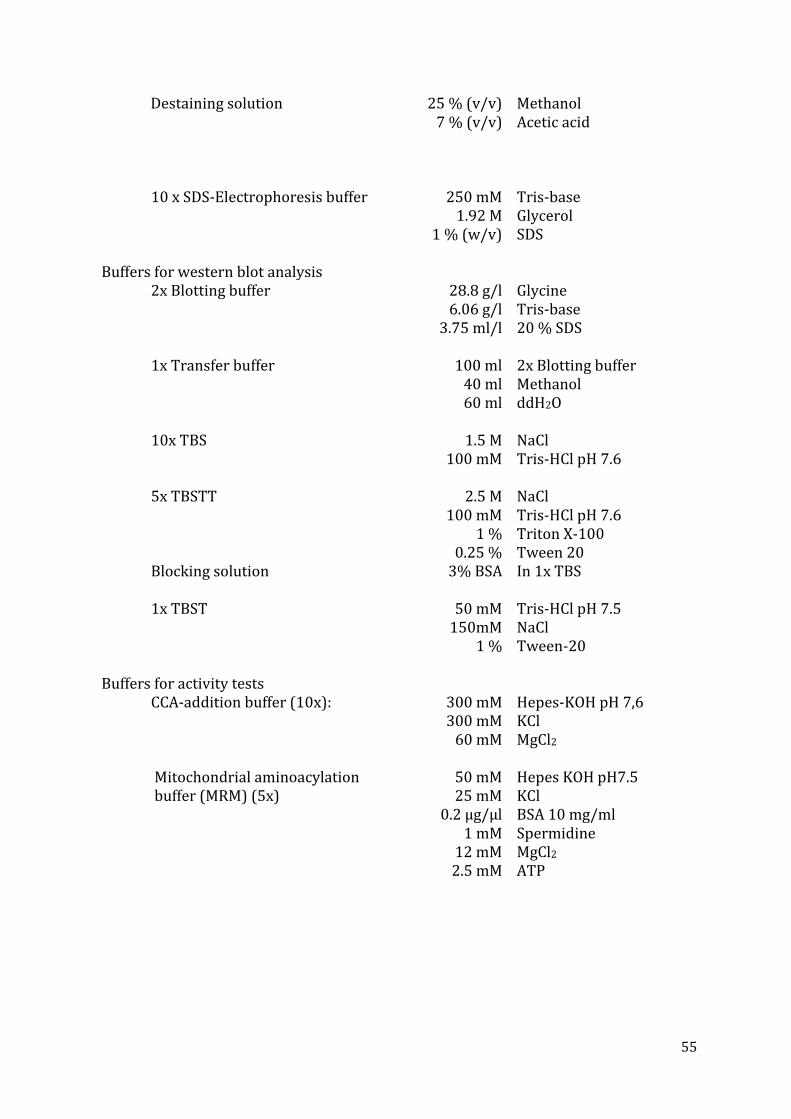
55
Destaining solution 25 % (v/v) 7 % (v/v)
Methanol Acetic acid
10 x SDS-Electrophoresis buffer
250 mM 1.92 M
1 % (w/v)
Tris-base Glycerol SDS
Buffers for western blot analysis 2x Blotting buffer 28.8 g/l
6.06 g/l 3.75 ml/l
Glycine Tris-base 20 % SDS
1x Transfer buffer 100 ml 40 ml 60 ml
2x Blotting buffer Methanol ddH2O
10x TBS 1.5 M 100 mM
NaCl Tris-HCl pH 7.6
5x TBSTT 2.5 M 100 mM
1 % 0.25 %
NaCl Tris-HCl pH 7.6 Triton X-100 Tween 20
Blocking solution 3% BSA In 1x TBS
1x TBST 50 mM 150mM
1 %
Tris-HCl pH 7.5 NaCl Tween-20
Buffers for activity tests
CCA-addition buffer (10x):
300 mM 300 mM
60 mM
Hepes-KOH pH 7,6 KCl MgCl2
Mitochondrial aminoacylation buffer (MRM) (5x)
50 mM 25 mM
0.2 µg/µl 1 mM
12 mM 2.5 mM
Hepes KOH pH7.5 KCl BSA 10 mg/ml Spermidine MgCl2 ATP
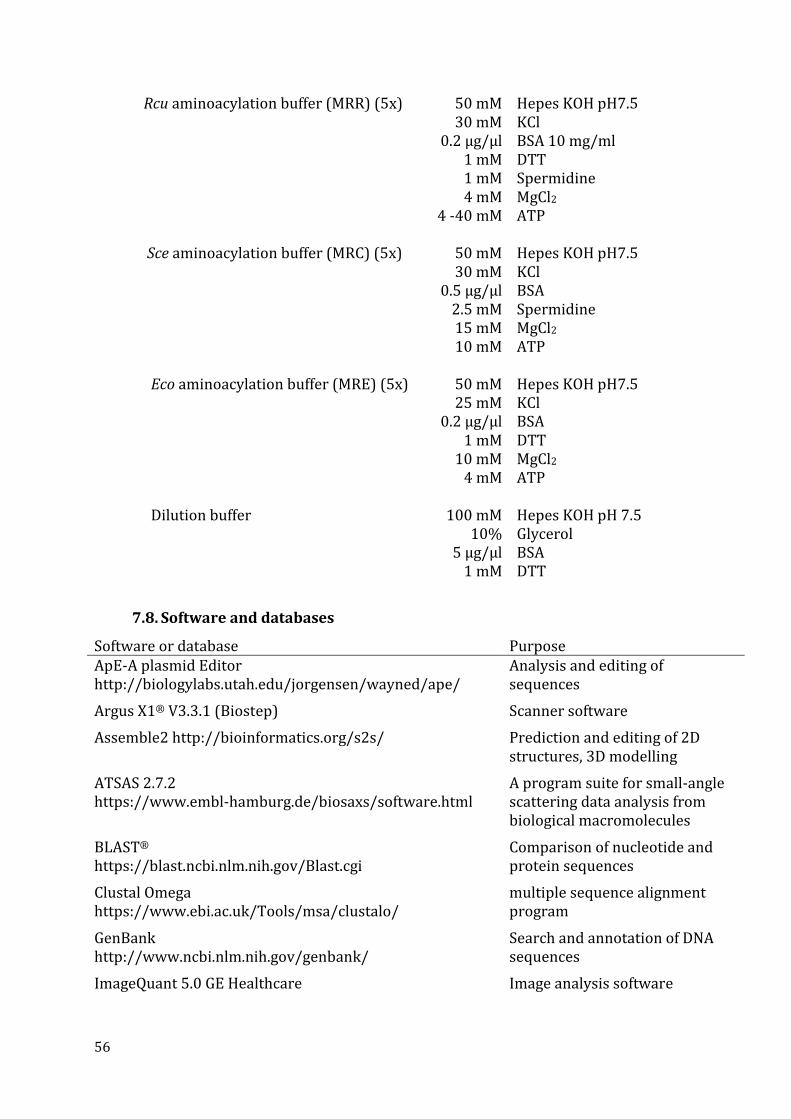
56
Rcu aminoacylation buffer (MRR) (5x) 50 mM 30 mM
0.2 µg/µl 1 mM 1 mM 4 mM
4 -40 mM
Hepes KOH pH7.5 KCl BSA 10 mg/ml DTT Spermidine MgCl2 ATP
Sce aminoacylation buffer (MRC) (5x) 50 mM 30 mM
0.5 µg/µl 2.5 mM 15 mM 10 mM
Hepes KOH pH7.5 KCl BSA Spermidine MgCl2 ATP
Eco aminoacylation buffer (MRE) (5x) 50 mM 25 mM
0.2 µg/µl 1 mM
10 mM 4 mM
Hepes KOH pH7.5 KCl BSA DTT MgCl2 ATP
Dilution buffer 100 mM
10% 5 µg/µl
1 mM
Hepes KOH pH 7.5 Glycerol BSA DTT
7.8. Software and databases
Software or database Purpose ApE-A plasmid Editor http://biologylabs.utah.edu/jorgensen/wayned/ape/
Analysis and editing of sequences
Argus X1® V3.3.1 (Biostep) Scanner software
Assemble2 http://bioinformatics.org/s2s/ Prediction and editing of 2D structures, 3D modelling
ATSAS 2.7.2 https://www.embl-hamburg.de/biosaxs/software.html
A program suite for small-angle scattering data analysis from biological macromolecules
BLAST® https://blast.ncbi.nlm.nih.gov/Blast.cgi
Clustal Omega https://www.ebi.ac.uk/Tools/msa/clustalo/
Comparison of nucleotide and protein sequences
multiple sequence alignment program
GenBank http://www.ncbi.nlm.nih.gov/genbank/
Search and annotation of DNA sequences
ImageQuant 5.0 GE Healthcare Image analysis software
57
I-TASSER http://zhanglab.ccmb.med.umich.edu/I-TASSER/
Prediction of protein 3D structure
Lasergene 6 DNASTAR Analysis of DNA sequences
MITOPROT https://ihg.gsf.de/ihg/mitoprot.html
Prediction of mitochondrial targeting sequences
MitoFates http://mitf.cbrc.jp/MitoFates/cgi-bin/top.cgi
Prediction of mitochondrial targeting sequences
Mfold 3.2 http://mfold.rna.albany.edu/?q=mfold
Prediction of RNA secondary and tertiary structure
OligoCalculator http://mcb.berkeley.edu/labs/krantz/tools/oligocalc.html
Calculation of oligonucleotide statistics
ProtParam http://web.expasy.org/protparam/
Computation of protein statistics
PyMOL Schrödinger (Portland, USA) 3D modelling of protein sequences
RNAfold http://rna.tbi.univie.ac.at/cgi-bin/RNAfold.cgi
Prediction of RNA secondary structure
tRNAdb / mitotRNAdb http://trnadb.bioinf.uni-leipzig.de/
Search, annotation and comparison of tRNA genes and structures
58
8. Methods
8.1. General nucleic acid methods
8.1.1. Measurement of DNA and RNA concentrations
DNA and RNA concentrations were estimated by measuring the absorbance at 260 nm
and 280 nm using a NanoDrop®ND-1000 or NanoDrop®ND-2000 spectrophotometer
(both Thermo Scientific) according to the manufacturer’s instructions.
8.1.2. Extraction and precipitation of DNA and RNA
DNA and RNA fragments were purified using the phenol-chloroform extraction method
(Sambrook et al., 1989). A reaction volume of 200 µl was added to 200 µl of a
phenol:chloroform:isoamyl alcohol (25:24:1) mix, vortexed, and centrifuged (3 min,
6000 rpm). The aqueous upper phase was transferred to a new reaction tube and
treated with 200 µl chloroform, vortexed and centrifuged (3 min, 6000 rpm). After
centrifugation the aqueous upper phase was transferred to a new reaction tube and the
nucleic acids were precipitated by the addition of sodium acetate to 0.3 M final
concentration and 2 volume of absolute ethanol. Occasionally, glycogen (1 µg/ml) was
added to the reaction as a carrier to increase the efficiency of the precipitation. The
solution was incubated 30 min at -20°C or 10 min at -80°C and afterwards centrifuged at
14.000 rpm for at least 20 min at 4°C. The nucleic acid pellet was washed with 70 %
ethanol and resuspended after drying in ddH2O. Alternatively, the nucleic acid was
stored as an alcohol precipitate for several months at -80°C.
PCR products were also purified using the GeneJETTM PCR Purification Kit (Thermo
Scientific), or were extracted from the gel using the GeneJETTM Gel Extraction Kit
(Thermo Scientific). All purifications steps were carried out according to the
manufacturer's instructions.
8.1.3. DNA sequencing
Sequencing of PCR products and plasmid DNA was carried out using the chain
termination method (Sanger et al., 1977). For this purpose, the BigDye® Terminator
Cycle Sequencing Kit 1.1 was used according to the manufacturer's instructions.
Sequencing was performed on an ABI Prism 3730-sequencing unit (Amersham
59
Pharmacia Biotech) at the Max Planck Institute for Evolutionary Anthropology in
Leipzig. In Strasbourg, DNA samples are sequenced using the sequencing service from
GATC Biotech.
8.2. DNA manipulation
Standard methods were used for plasmid isolation, restriction enzyme digestion,
ligation, transformation, and agarose gel electrophoresis (Sambrook et al., 1989). A
schematic representation of the different PCR methods used in this study is shown in
Figure.
8.2.1. PCR Methods
Amplification PCR
The polymerase chain reaction (PCR) allows a specific in vitro amplification of DNA
fragments. A standard PCR consists of 50 µl reaction volume and contains the following
components: 10-50 ng DNA template, 0.4 µM Primers, 0.2 mM dNTP 1x Pfu or Taq
reaction buffer and between 2.5 U and 5 U Pfu or Taq DNA Polymerase. The reaction was
carried out according to the following temperature-time diagram:
Initial denaturation 95°C 5 min
Denaturation 95°C 1 min
Annealing 54°C - 64°C 1 min 30 x
Elongation 68/72°C 30 sec – 2 min
Final elongation 68/72°C 5 min
Storage 10 °C ∞
The annealing temperature was set to 2°C below the melting temperature (TM) of the
two primers. This temperature was calculated using the web tool “Oligo Calculator”.
Calculated elongation temperatures were appropriate for the used DNA polymerase:
68°C for Pfu, and 72°C for Taq DNA polymerase. All reactions were performed in a
Robocycler® (Stratagene), a MJ TM thermal cycler (Biorad), or a C-1000 TouchTM thermal
cycler (Biorad).
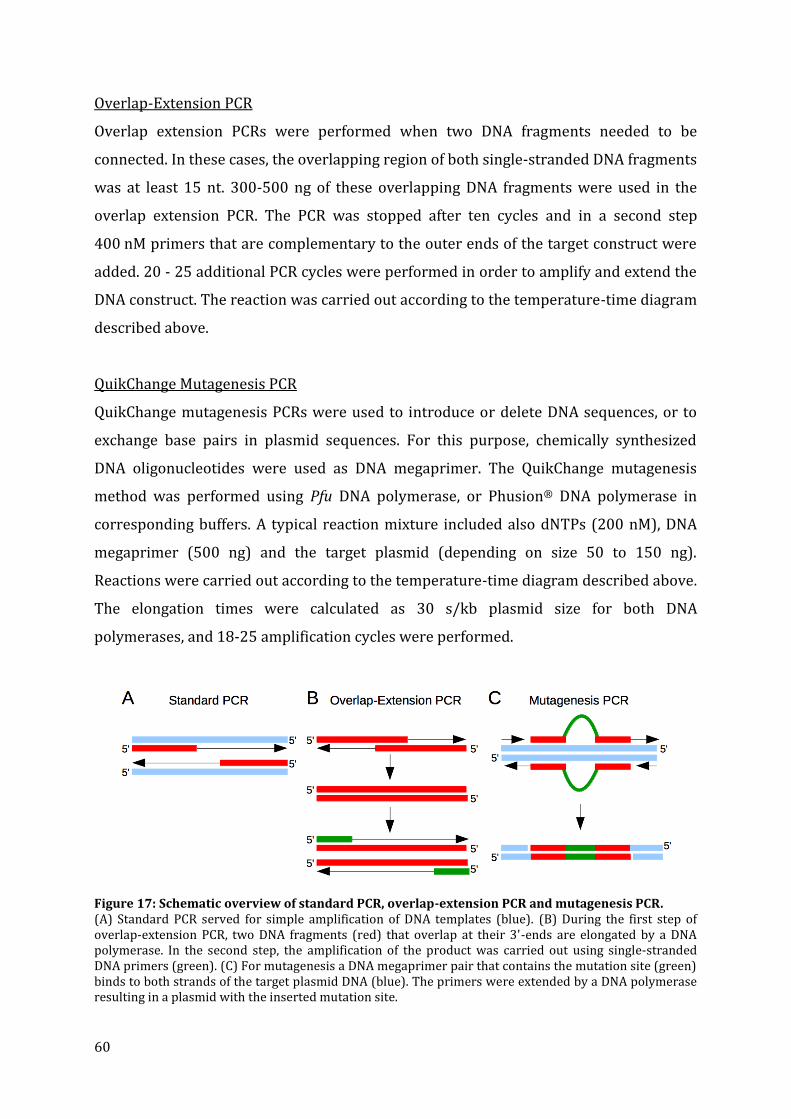
60
Overlap-Extension PCR
Overlap extension PCRs were performed when two DNA fragments needed to be
connected. In these cases, the overlapping region of both single-stranded DNA fragments
was at least 15 nt. 300-500 ng of these overlapping DNA fragments were used in the
overlap extension PCR. The PCR was stopped after ten cycles and in a second step
400 nM primers that are complementary to the outer ends of the target construct were
added. 20 - 25 additional PCR cycles were performed in order to amplify and extend the
DNA construct. The reaction was carried out according to the temperature-time diagram
described above.
QuikChange Mutagenesis PCR
QuikChange mutagenesis PCRs were used to introduce or delete DNA sequences, or to
exchange base pairs in plasmid sequences. For this purpose, chemically synthesized
DNA oligonucleotides were used as DNA megaprimer. The QuikChange mutagenesis
method was performed using Pfu DNA polymerase, or Phusion® DNA polymerase in
corresponding buffers. A typical reaction mixture included also dNTPs (200 nM), DNA
megaprimer (500 ng) and the target plasmid (depending on size 50 to 150 ng).
Reactions were carried out according to the temperature-time diagram described above.
The elongation times were calculated as 30 s/kb plasmid size for both DNA
polymerases, and 18-25 amplification cycles were performed.
Figure 17: Schematic overview of standard PCR, overlap-extension PCR and mutagenesis PCR. (A) Standard PCR served for simple amplification of DNA templates (blue). (B) During the first step of overlap-extension PCR, two DNA fragments (red) that overlap at their 3'-ends are elongated by a DNA polymerase. In the second step, the amplification of the product was carried out using single-stranded DNA primers (green). (C) For mutagenesis a DNA megaprimer pair that contains the mutation site (green) binds to both strands of the target plasmid DNA (blue). The primers were extended by a DNA polymerase resulting in a plasmid with the inserted mutation site.
61
Colony PCR
Colony PCR is an easy way to rapidly screen positive clones. For this purpose, a single
bacterial colony was picked using a sterile pipet tip, dissolved in 10 µl ddH2O, and
incubated at 95°C for 10 min. 5 µl of this cell suspension were then used for a standard
amplification PCR.
8.2.2. Cloning of DNA fragments
Standard Ligation
DNA fragments obtained by restriction digestion were inserted into the corresponding
vector through ligation. For this purpose, the vector and DNA insert were treated with
the same restriction endonucleases. About 50 ng of the vector was mixed with the DNA
fragment in a molar ratio of 1:3 or 1:5. The ligation was carried out in a final volume of
20 μl for 10-20 min at room temperature or at 16°C for 16 h. A typical reaction
contained 1x DNA ligation buffer and the corresponding amount of vector, as well as the
insert DNA and 40 units of T4 DNA ligase.
Blunt end cloning
The CloneJetTM PCR Cloning Kit (Thermo Scientific) was used according to the
manufacturer to clone DNA fragments obtained by standard or overlap-extension PCR
into a plasmid.
TA cloning
The efficient and ligation independent cloning of (unpurified) PCR products into the
pCR®2.1-TOPO vector was carried out using the TOPO TA Cloning® kit (Invitrogen)
according to the manufacturer. Only PCR products generated by Taq DNA polymerase
are suitable for this cloning method because of the necessity of 3'-dA overhangs
produced by the Taq DNA polymerase.
8.2.3. Plasmid purification for cloning and sequencing
Plasmids were purified from a bacterial culture grown overnight at 37°C using the
QIAprep Spin Miniprep kit (Qiagen) or the GeneJETTM Plasmid Miniprep Kit (Thermo
Scientific), following the manufacturer’s instructions. The quantity and quality of the
plasmid DNA was determined as described in section 8.1.1.
62
8.2.4. Restriction analysis of DNA
The restriction of plasmid DNA or PCR products was carried out using restriction
enzymes (New England Biolabs) according to the manufacturer’s instructions. A typical
100 µl reaction mixture contained 500-2000 ng of PCR product or 250-500 ng of
plasmid DNA, 1x restriction buffer, and 10 U/μl restriction enzyme. The digestion
mixture was incubated at 37°C for 3h. The restriction was verified with analytical
agarose gel electrophoresis, followed by purification as described in section 8.1.2.
8.2.5. Agarose gel electrophoresis
Analytical or preparative agarose gels were used for the separation of DNA molecules.
The routine analysis of DNA molecules of 100 to 5.000 base pairs in size was done by
electrophoresis on 1% to 2 % agarose gels (according to the expected DNA size) with 1x
TBE as running buffer. The samples were loaded with 1x DNA loading buffer and a DNA
ladder (2 log or 50 bp DNA ladder from New England Biolabs) was applied adjacent to
the samples in order to verify the fragment sizes. The electrophoresis was carried out at
90 V for 60 min. The agarose gels contained 0.5 μg/ml ethidium bromide or 1x Gel Red
solution in order to allow visualization of the DNA fragments under UV light at 254 nm.
8.3. RNA manipulation
8.3.1. RNA preparation from R. culicivorax
Total RNA from R. culicivorax was recovered using the guanidine thiocyanate method
from (Chomczynski and Sacchi, 1987). 100 mg cell material was treated with 1 mL
TRIZOL®, and lysed using Precellys® ceramic beads with a diameter of 1.4 mm in a
FastPrep®-24 homogenizer twice for 40 s at 6 m/s. The mixture was then centrifuged for
30 min at 16,000 g and 4°C. The upper phase was transferred to a new reaction tube and
300 µl chloroform were added and mixed. The mixture was centrifuged at 16,000 g for 5
min at 4°C. The upper phase was removed and ethanol precipitation (see section 8.1.2)
was performed. The pellet was taken up in 250 µl water.
63
8.3.2. mRNA purification from total RNA
The GenEluteTM mRNA Miniprep Kit (Sigma-Aldrich) was used for the isolation of
polyadenylated mRNA from previously prepared total RNA according to the
manufacturer's instructions.
8.3.3. 5’-Rapid amplification of cDNA ends (RACE)
A 5’-RACE DNA purification system kit (Invitrogen) was used for the analysis of the 5'-
ends of the R. culicivorax ArgRS mRNA according to manufacturer's instructions. Total
RNA and mRNA from R. culicivorax was prepared as described above, and served as
templates for cDNA production. First strand cDNA synthesis was primed using a gene-
specific antisense oligonucleotide (GSP1). Following cDNA synthesis using SuperScript II
RT, the mRNA template was degraded by digestion with a supplemented RNase mix. The
first strand product was purified from unincorporated dNTPs and GSP1. TdT (Terminal
deoxynucleotidyl transferase) was used to add a poly C-tail to the 3' ends of the cDNA.
The tailed cDNA was then amplified by standard PCR using a nested gene-specific
primer (GSP2), which anneals 3' to GSP1; and an Abridged Anchor Primer (AAP), which
permits amplification from the homopolymeric tail. This allows amplification of
unknown sequences between the GSP2 and the 5'-end of the RNA template.
Reamplification of the PCR product can be performed using an Abridged Universal
Amplification Primer (AUAP) and GSP2 or a nested GSP. The amplified PCR product was
introduced by TA-cloning into the pCR®2.1-TOPO plasmid, and sequenced.
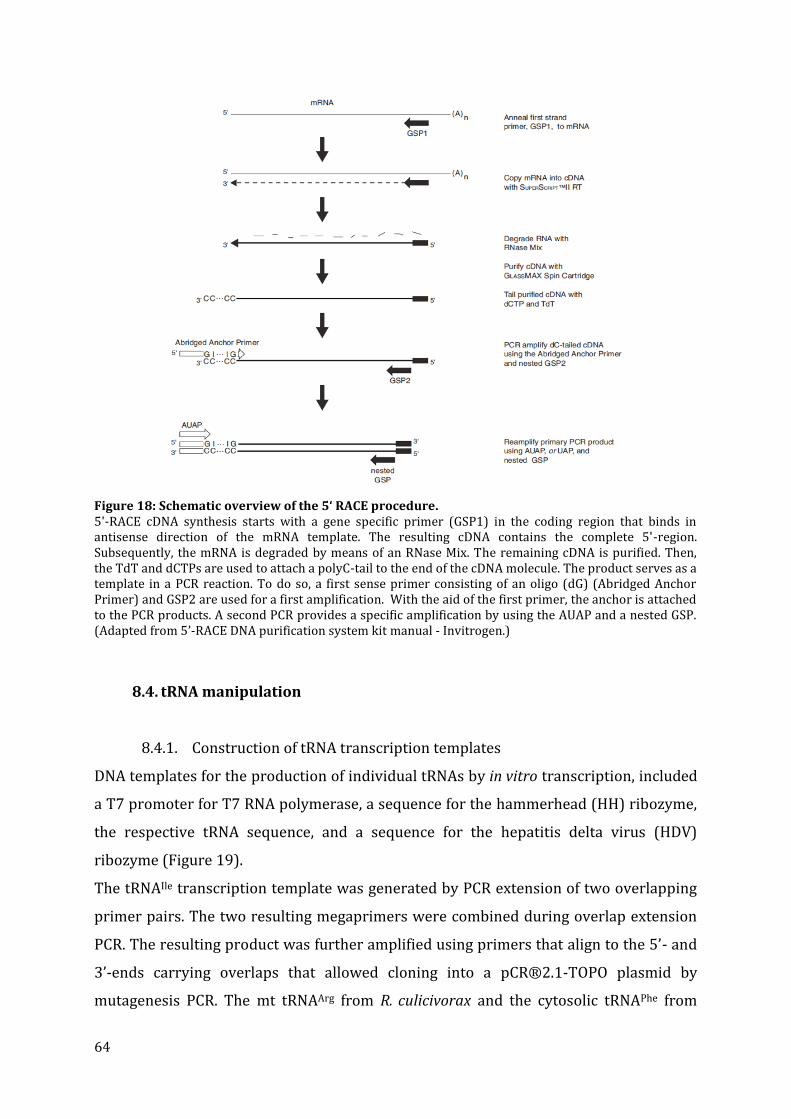
64
Figure 18: Schematic overview of the 5‘ RACE procedure. 5'-RACE cDNA synthesis starts with a gene specific primer (GSP1) in the coding region that binds in antisense direction of the mRNA template. The resulting cDNA contains the complete 5'-region. Subsequently, the mRNA is degraded by means of an RNase Mix. The remaining cDNA is purified. Then, the TdT and dCTPs are used to attach a polyC-tail to the end of the cDNA molecule. The product serves as a template in a PCR reaction. To do so, a first sense primer consisting of an oligo (dG) (Abridged Anchor Primer) and GSP2 are used for a first amplification. With the aid of the first primer, the anchor is attached to the PCR products. A second PCR provides a specific amplification by using the AUAP and a nested GSP. (Adapted from 5’-RACE DNA purification system kit manual - Invitrogen.)
8.4. tRNA manipulation
8.4.1. Construction of tRNA transcription templates
DNA templates for the production of individual tRNAs by in vitro transcription, included
a T7 promoter for T7 RNA polymerase, a sequence for the hammerhead (HH) ribozyme,
the respective tRNA sequence, and a sequence for the hepatitis delta virus (HDV)
ribozyme (Figure 19).
The tRNAIle transcription template was generated by PCR extension of two overlapping
primer pairs. The two resulting megaprimers were combined during overlap extension
PCR. The resulting product was further amplified using primers that align to the 5’- and
3’-ends carrying overlaps that allowed cloning into a pCR®2.1-TOPO plasmid by
mutagenesis PCR. The mt tRNAArg from R. culicivorax and the cytosolic tRNAPhe from
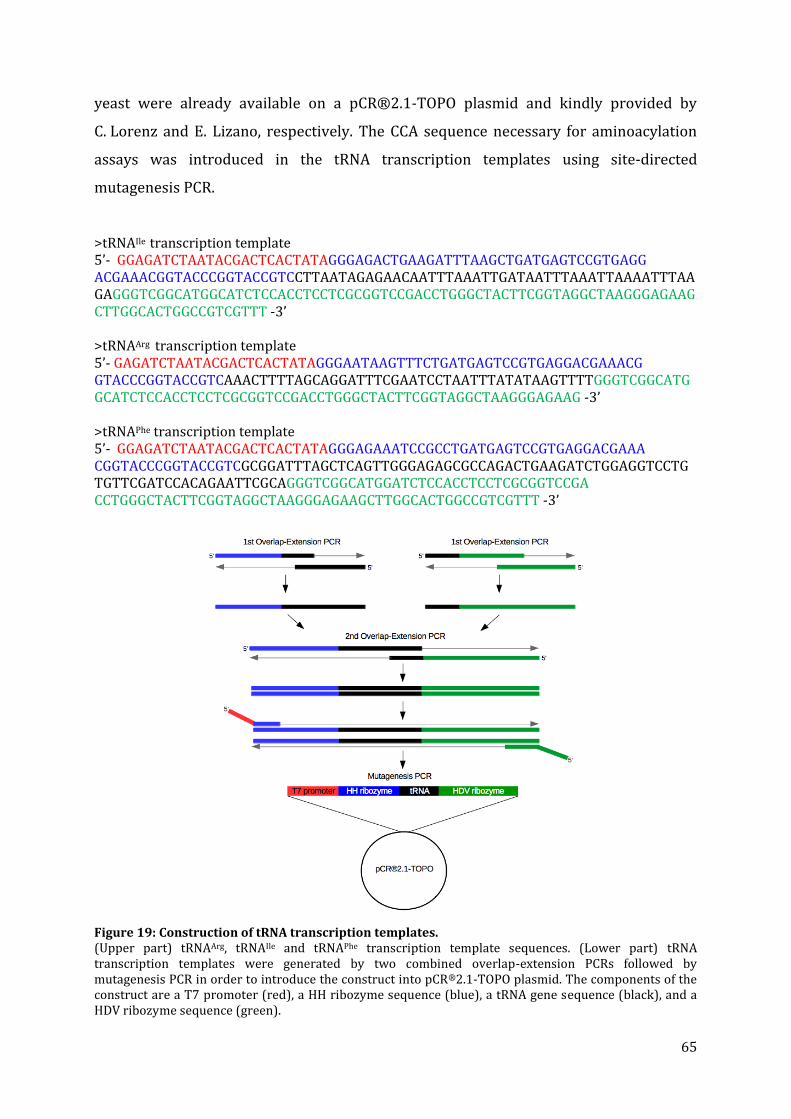
65
yeast were already available on a pCR®2.1-TOPO plasmid and kindly provided by
C. Lorenz and E. Lizano, respectively. The CCA sequence necessary for aminoacylation
assays was introduced in the tRNA transcription templates using site-directed
mutagenesis PCR.
>tRNAIle transcription template 5’- GGAGATCTAATACGACTCACTATAGGGAGACTGAAGATTTAAGCTGATGAGTCCGTGAGG ACGAAACGGTACCCGGTACCGTCCTTAATAGAGAACAATTTAAATTGATAATTTAAATTAAAATTTAAGAGGGTCGGCATGGCATCTCCACCTCCTCGCGGTCCGACCTGGGCTACTTCGGTAGGCTAAGGGAGAAGCTTGGCACTGGCCGTCGTTT -3’ >tRNAArg transcription template 5’- GAGATCTAATACGACTCACTATAGGGAATAAGTTTCTGATGAGTCCGTGAGGACGAAACG GTACCCGGTACCGTCAAACTTTTAGCAGGATTTCGAATCCTAATTTATATAAGTTTTGGGTCGGCATGGCATCTCCACCTCCTCGCGGTCCGACCTGGGCTACTTCGGTAGGCTAAGGGAGAAG -3’ >tRNAPhe transcription template 5’- GGAGATCTAATACGACTCACTATAGGGAGAAATCCGCCTGATGAGTCCGTGAGGACGAAA CGGTACCCGGTACCGTCGCGGATTTAGCTCAGTTGGGAGAGCGCCAGACTGAAGATCTGGAGGTCCTGTGTTCGATCCACAGAATTCGCAGGGTCGGCATGGATCTCCACCTCCTCGCGGTCCGA CCTGGGCTACTTCGGTAGGCTAAGGGAGAAGCTTGGCACTGGCCGTCGTTT -3’
Figure 19: Construction of tRNA transcription templates. (Upper part) tRNAArg, tRNAIle and tRNAPhe transcription template sequences. (Lower part) tRNA transcription templates were generated by two combined overlap-extension PCRs followed by mutagenesis PCR in order to introduce the construct into pCR®2.1-TOPO plasmid. The components of the construct are a T7 promoter (red), a HH ribozyme sequence (blue), a tRNA gene sequence (black), and a HDV ribozyme sequence (green).
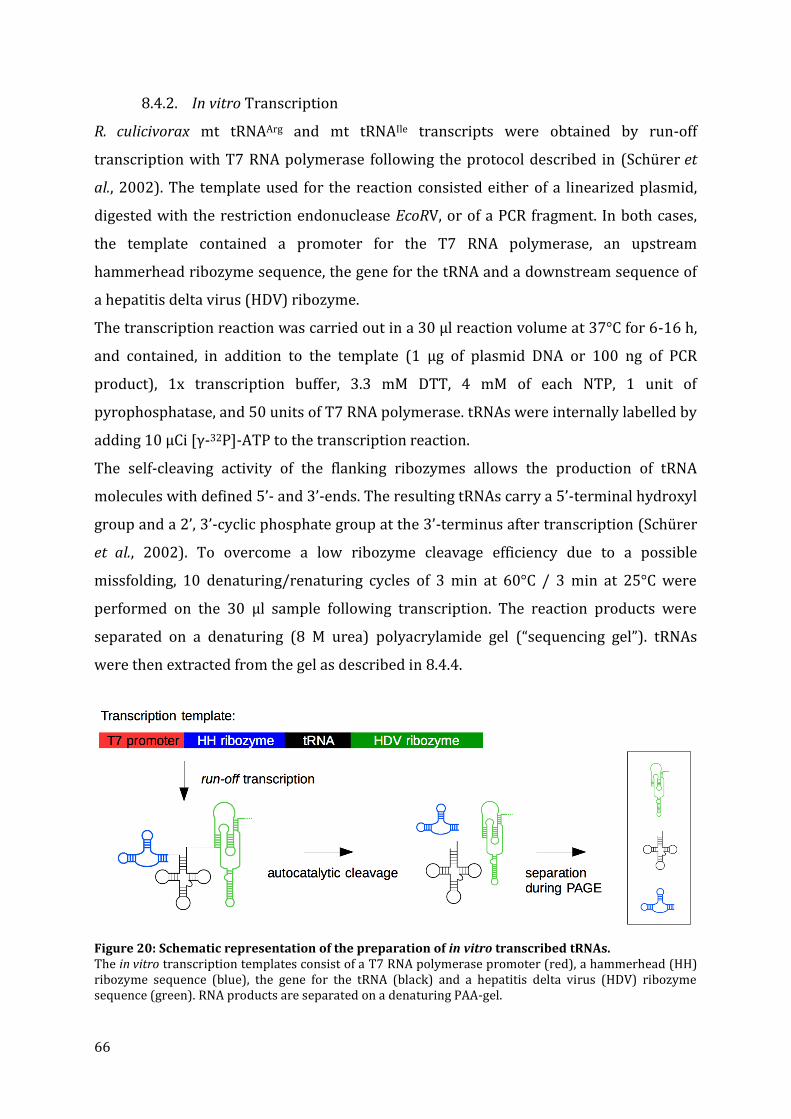
66
8.4.2. In vitro Transcription
R. culicivorax mt tRNAArg and mt tRNAIle transcripts were obtained by run-off
transcription with T7 RNA polymerase following the protocol described in (Schürer et
al., 2002). The template used for the reaction consisted either of a linearized plasmid,
digested with the restriction endonuclease EcoRV, or of a PCR fragment. In both cases,
the template contained a promoter for the T7 RNA polymerase, an upstream
hammerhead ribozyme sequence, the gene for the tRNA and a downstream sequence of
a hepatitis delta virus (HDV) ribozyme.
The transcription reaction was carried out in a 30 µl reaction volume at 37°C for 6-16 h,
and contained, in addition to the template (1 µg of plasmid DNA or 100 ng of PCR
product), 1x transcription buffer, 3.3 mM DTT, 4 mM of each NTP, 1 unit of
pyrophosphatase, and 50 units of T7 RNA polymerase. tRNAs were internally labelled by
adding 10 µCi [γ-32P]-ATP to the transcription reaction.
The self-cleaving activity of the flanking ribozymes allows the production of tRNA
molecules with defined 5’- and 3’-ends. The resulting tRNAs carry a 5’-terminal hydroxyl
group and a 2’, 3’-cyclic phosphate group at the 3’-terminus after transcription (Schürer
et al., 2002). To overcome a low ribozyme cleavage efficiency due to a possible
missfolding, 10 denaturing/renaturing cycles of 3 min at 60°C / 3 min at 25°C were
performed on the 30 µl sample following transcription. The reaction products were
separated on a denaturing (8 M urea) polyacrylamide gel (“sequencing gel”). tRNAs
were then extracted from the gel as described in 8.4.4.
Figure 20: Schematic representation of the preparation of in vitro transcribed tRNAs. The in vitro transcription templates consist of a T7 RNA polymerase promoter (red), a hammerhead (HH) ribozyme sequence (blue), the gene for the tRNA (black) and a hepatitis delta virus (HDV) ribozyme sequence (green). RNA products are separated on a denaturing PAA-gel.
67
8.4.3. Separation of RNA via denaturing PAGE and detection
The preparative separation of RNA was carried out by gel electrophoresis in a 10 %,
12.5 % or 15 % denaturing polyacrylamide gel (8 M urea in 100 mM Tris‐Borate, 2 mM
EDTA, pH 8.3). The samples were completed with 5 µl RNA loading buffer and
electrophoresis was performed in vertical chambers at 20-40 W with 1x TBE as running
buffer until the xylene cyanol reached the lower part of the gel. Radiolabeled RNA was
subsequently detected by autoradiography. For this purpose, the gel located on a glass
plate was wrapped in a polyethylene film, on which a phosphor screen was placed. The
exposure was carried out in a cassette overnight at 4°C. The visualization of RNA bands
was performed with a Phosphor imager (Storm 860TM Optical Scanner or Typhoon
Scanner). The position of non-labelled RNA bands was determined by UV shadowing.
For this purpose, the gel was transferred onto white paper. The nucleic acid bands were
visible as a shadow upon irradiation with UV light of 254 nm.
8.4.4. Extraction of RNA from denaturing polyacrylamide gels
tRNA-bands of interest were excised from gel with a sterile scalpel, and placed into an
Eppendorf tube. RNA was eluted by overnight incubation in 400 μl ddH2O at 4°C under
shaking. After recovery of the supernatant, RNA was precipitated with ethanol.
8.4.5. 3’–end dephosphorylation
The co-transcriptional self-cleavage of the terminal HDV ribozyme cassette results in a
2’,3’-cyclic phosphate at the 3’-end of the tRNA transcripts. The 3’-terminal
cyclophosphate was removed by the phosphatase activity of T4 PNK (polynucleotide
kinase). A 3’–end dephosphorylation reaction was carried out in a 50 µl volume
incubation for 6 h at 37°C. The reaction mixture contained up to 500 pmol of RNA,
10 units of T4 PNK and 1x dephosphorylation buffer. The efficiency of the reaction was
verified by running a sub-sample on a 10 % polyacrylamide denaturing gel. The removal
of the phosphate group leads to a reduced net charge, which results in a lower
electrophoretic mobility of the dephosphorylated tRNAs as compared to the untreated
tRNAs. Once dephosphorylation was completed, tRNAs were purified by phenol-
chloroform extraction followed by ethanol precipitation.
68
8.4.6. 5’-end labeling of tRNAs
5'-end labeling of tRNAs was performed in a 30 µl reaction with PNK buffer A (50 mM
glycine-NaOH pH 8.5, 2 mM DTT), 1.5 µg BSA, 6.7 mM DTT, 10 µCi [γ-32P]-ATP, 10 units
T4 polynucleotide kinase, and 10 µg RNA (extracted from PAA gel). The reaction mixture
was incubated at 37°C for one hour. The separation of RNA was performed in 10 %
denaturing PAGE followed by the isolation from gel.
8.5. Determination of tRNA structures
8.5.1. Native polyacrylamid-gelelectrophoresis (native PAGE)
Native polyacrylamide gels electrophoresis was performed to elucidate the
conformation of tRNA transcripts. 5 µl of native RNA loading dye was added to the
purified tRNA samples. Separation was performed in a 15 % native polyacrylamide gel
with 0.5x TBE as running buffer at 4°C. Detection was performed by autoradiography.
8.5.2. Enzymatic analysis
Ribonuclease V1 cleavage
Ribonuclease V1 (RNase V1) from Naja oxiana was used to detect paired nucleotides in
tRNA structures. Prior to use, tRNAs were denaturated 2 min at 65 °C, and then cooled
down to room temperature. The reaction mixture (20 µl) was prepared on ice in RNase
V1 reaction buffer in the presence of 1 µg of total tRNA from E. coli, 0.005 U RNase V1
and 40 pmol of 5´-labeled tRNA. The reaction was carried out at 5°C, 15°C, or 37°C for 5
minutes. The reaction was stopped with the addition of 5 µl RNA loading dye, and
immediately frozen at -20°C. Reaction products were separated on 15 % denaturing PAA
gel.
Nuclease S1 cleavage
Nuclease S1 from Aspergillus oryzae catalyzes the nonspecific endonucleolytic cleavage
of single-stranded DNA and RNA at phosphodiester bonds. The catalysis requires the
presence of zinc ions. Prior to use, tRNAs were denaturated 2 min at 65 °C, and then
cooled down to room temperature. 20 µl of a reaction mixture contained 1x nuclease S1
reaction buffer, 1 µg of total tRNA from E. coli, 40 pmol of 5´-labeled tRNA, and 5 U
nuclease S1. The reaction was incubated at 5°C, 15°C, or 37°C for 5 minutes. The

69
reaction was stopped with the addition of 5 µl RNA loading dye, and immediately frozen
at -20°C. Reaction products were separated on 15 % denaturing PAA gel.
Ribonuclease T1 cleavage
Ribonuclease T1 (RNase T1) from Aspergillus oryzae cleaves single-stranded RNA
downstream (3’ side) of guanine residues. A typical reaction mixture (10 µl) contained
1x RNase T1 reaction buffer, 1 µg of total tRNA from E. coli, 40 pmol labeled tRNA and
5 U RNase T1. The reaction mixture was incubated at 5°C, 15°C, or 37°C for 5 minutes,
stopped with the addition of 5 µl RNA loading dye, and immediately frozen at -20°C.
Reaction products were separated on 15 % denaturing PAA gel.
8.5.3. In-line probing
In-line probing assays rely on non-enzymatic self-cleavage of RNA under mild alkaline
conditio (Regulski and Breaker, 2008) Intrinsic higher reactivity of phosphodiester
bonds in single-stranded domains are linked to higher flexibility of RNA chains as
compared to double-stranded or higher-ordered domains. 40 pmol of 5’-labeled tRNA
were incubated in a 10 µl volume containing 1x in-line probing buffer, and 1 µg of total
tRNA from E. coli. The reaction was incubated at room temperature. 2 µl samples were
taken after 15 h, 24 h, and 40 h. 5 µl of RNA loading dye were added to stop the reaction.
Separation and analysis of reaction products were performed on 15 % denaturing PAA
gel.
8.5.4. Alkaline hydrolysis
Radioactively labeled tRNA molecules were hydrolyzed in a strong alkaline environment
to generate a systematic (but still statistic) cleavage at each phosphodiester bond. Co-
migration of the cleavage fragments on denaturing gels enables an assignment of the
reaction products generated by enzymatic and chemical cleavages. The reaction leads to
a “ladder” as the RNA is cleaved after each nucleotide. The reaction was carried out at
90°C for two minutes in a 10 µl reaction volume containing a strongly alkaline buffer,
1 µg total tRNA from E. coli, and 40 pmol of 5'-labeled RNA. The reaction was stopped
with the addition of 5 µl RNA loading dye. The analysis of the hydrolysis products was
carried out on 15 % denaturing PAA gel.
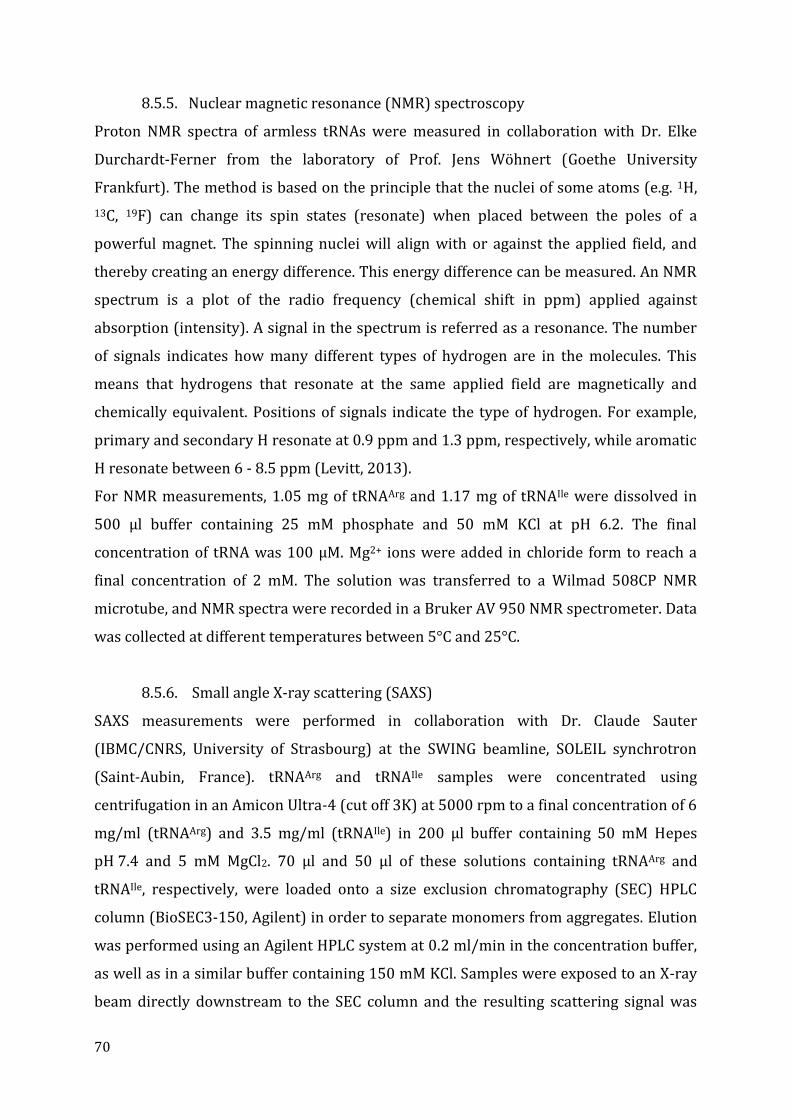
70
8.5.5. Nuclear magnetic resonance (NMR) spectroscopy
Proton NMR spectra of armless tRNAs were measured in collaboration with Dr. Elke
Durchardt-Ferner from the laboratory of Prof. Jens Wöhnert (Goethe University
Frankfurt). The method is based on the principle that the nuclei of some atoms (e.g. 1H,
13C, 19F) can change its spin states (resonate) when placed between the poles of a
powerful magnet. The spinning nuclei will align with or against the applied field, and
thereby creating an energy difference. This energy difference can be measured. An NMR
spectrum is a plot of the radio frequency (chemical shift in ppm) applied against
absorption (intensity). A signal in the spectrum is referred as a resonance. The number
of signals indicates how many different types of hydrogen are in the molecules. This
means that hydrogens that resonate at the same applied field are magnetically and
chemically equivalent. Positions of signals indicate the type of hydrogen. For example,
primary and secondary H resonate at 0.9 ppm and 1.3 ppm, respectively, while aromatic
H resonate between 6 - 8.5 ppm (Levitt, 2013).
For NMR measurements, 1.05 mg of tRNAArg and 1.17 mg of tRNAIle were dissolved in
500 µl buffer containing 25 mM phosphate and 50 mM KCl at pH 6.2. The final
concentration of tRNA was 100 µM. Mg2+ ions were added in chloride form to reach a
final concentration of 2 mM. The solution was transferred to a Wilmad 508CP NMR
microtube, and NMR spectra were recorded in a Bruker AV 950 NMR spectrometer. Data
was collected at different temperatures between 5°C and 25°C.
8.5.6. Small angle X-ray scattering (SAXS)
SAXS measurements were performed in collaboration with Dr. Claude Sauter
(IBMC/CNRS, University of Strasbourg) at the SWING beamline, SOLEIL synchrotron
(Saint-Aubin, France). tRNAArg and tRNAIle samples were concentrated using
centrifugation in an Amicon Ultra-4 (cut off 3K) at 5000 rpm to a final concentration of 6
mg/ml (tRNAArg) and 3.5 mg/ml (tRNAIle) in 200 µl buffer containing 50 mM Hepes
pH 7.4 and 5 mM MgCl2. 70 µl and 50 µl of these solutions containing tRNAArg and
tRNAIle, respectively, were loaded onto a size exclusion chromatography (SEC) HPLC
column (BioSEC3-150, Agilent) in order to separate monomers from aggregates. Elution
was performed using an Agilent HPLC system at 0.2 ml/min in the concentration buffer,
as well as in a similar buffer containing 150 mM KCl. Samples were exposed to an X-ray
beam directly downstream to the SEC column and the resulting scattering signal was
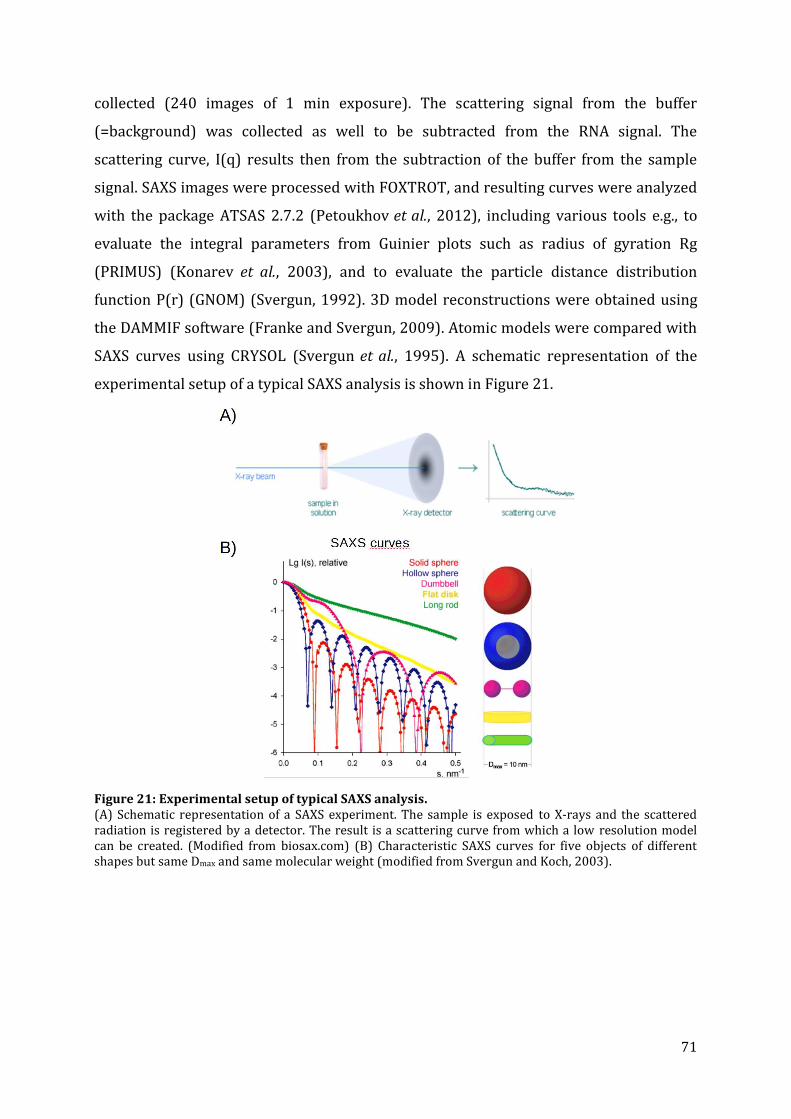
71
collected (240 images of 1 min exposure). The scattering signal from the buffer
(=background) was collected as well to be subtracted from the RNA signal. The
scattering curve, I(q) results then from the subtraction of the buffer from the sample
signal. SAXS images were processed with FOXTROT, and resulting curves were analyzed
with the package ATSAS 2.7.2 (Petoukhov et al., 2012), including various tools e.g., to
evaluate the integral parameters from Guinier plots such as radius of gyration Rg
(PRIMUS) (Konarev et al., 2003), and to evaluate the particle distance distribution
function P(r) (GNOM) (Svergun, 1992). 3D model reconstructions were obtained using
the DAMMIF software (Franke and Svergun, 2009). Atomic models were compared with
SAXS curves using CRYSOL (Svergun et al., 1995). A schematic representation of the
experimental setup of a typical SAXS analysis is shown in Figure 21.
Figure 21: Experimental setup of typical SAXS analysis. (A) Schematic representation of a SAXS experiment. The sample is exposed to X-rays and the scattered radiation is registered by a detector. The result is a scattering curve from which a low resolution model can be created. (Modified from biosax.com) (B) Characteristic SAXS curves for five objects of different shapes but same Dmax and same molecular weight (modified from Svergun and Koch, 2003).
72
8.6. E. coli culture and transformation
8.6.1. Plating
To cultivate E. coli, LB-agar plates supplemented with the necessary corresponding
antibiotics were used and inoculated with transformation products, or with bacteria
stored in glycerol. The plates were incubated overnight at 37°C.
8.6.2. Liquid cultures
Incubation of E. coli in liquid cultures was usually performed at 37°C and shaking at
200 rpm. A pre-culture was grown overnight in a volume of 5 ml LB from a single colony.
Main cultures were incubated for several hours until the desired optical density was
reached. The growing temperature for main cultures varied between 13 °C and 37°C,
and was adapted to the corresponding E. coli strain used for protein expression (see
section 8.6.6).
8.6.3. Storage
LB agar plates were stored at 4°C for 3-5 days. Liquid cultures (1 ml) were stored under
glycerol (40 % final concentration) at -80°C.
8.6.4. Chemical transformation of E. coli
Chemically competent E. coli cells were prepared following the calcium chloride method
described by (Sambrook et al., 1989) aliquoted and stored at -80°C. Up to 50 ng of
purified plasmid (or the ligation mixture, see section 8.2.2) was directly used for
transformation of competent Top10 E. coli cells. 10 μl of plasmid solution or ligation
mixture were added to 200 μl of competent cells and gently mixed. The cells were
incubated on ice for 20 min. Afterwards, a heat shock was performed for 30 sec at 42°C
in a water bath followed by incubation on ice for 3 min. 800 μl of SOC medium was
added, and the cells were incubated at 37°C for 1 h under shaking. Finally, 100 μl cells
were plated on LB plates with the appropriate antibiotic for the resistance gene present
on the transferred plasmid. LB plates were incubated at 37°C overnight.
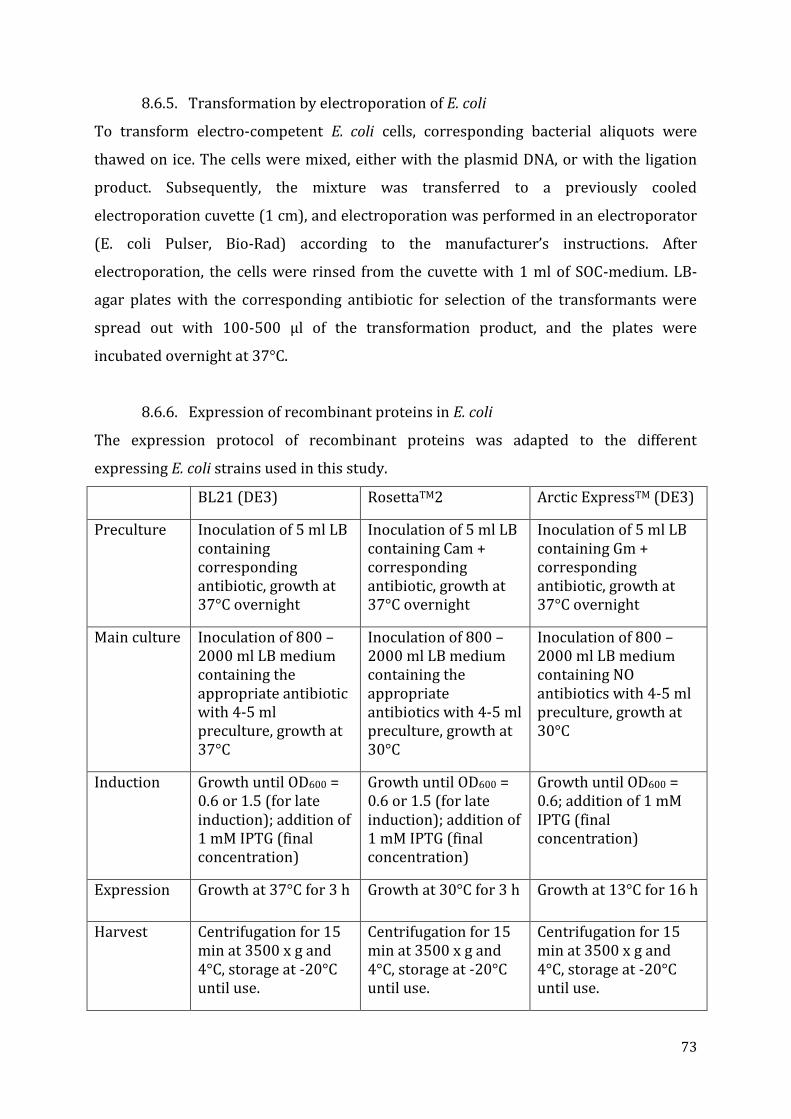
73
8.6.5. Transformation by electroporation of E. coli
To transform electro-competent E. coli cells, corresponding bacterial aliquots were
thawed on ice. The cells were mixed, either with the plasmid DNA, or with the ligation
product. Subsequently, the mixture was transferred to a previously cooled
electroporation cuvette (1 cm), and electroporation was performed in an electroporator
(E. coli Pulser, Bio-Rad) according to the manufacturer’s instructions. After
electroporation, the cells were rinsed from the cuvette with 1 ml of SOC-medium. LB-
agar plates with the corresponding antibiotic for selection of the transformants were
spread out with 100-500 μl of the transformation product, and the plates were
incubated overnight at 37°C.
8.6.6. Expression of recombinant proteins in E. coli
The expression protocol of recombinant proteins was adapted to the different
expressing E. coli strains used in this study.
BL21 (DE3) RosettaTM2 Arctic ExpressTM (DE3)
Preculture Inoculation of 5 ml LB containing corresponding antibiotic, growth at 37°C overnight
Inoculation of 5 ml LB containing Cam + corresponding antibiotic, growth at 37°C overnight
Inoculation of 5 ml LB containing Gm + corresponding antibiotic, growth at 37°C overnight
Main culture Inoculation of 800 – 2000 ml LB medium containing the appropriate antibiotic with 4-5 ml preculture, growth at 37°C
Inoculation of 800 – 2000 ml LB medium containing the appropriate antibiotics with 4-5 ml preculture, growth at 30°C
Inoculation of 800 – 2000 ml LB medium containing NO antibiotics with 4-5 ml preculture, growth at 30°C
Induction Growth until OD600 = 0.6 or 1.5 (for late induction); addition of 1 mM IPTG (final concentration)
Growth until OD600 = 0.6 or 1.5 (for late induction); addition of 1 mM IPTG (final concentration)
Growth until OD600 = 0.6; addition of 1 mM IPTG (final concentration)
Expression Growth at 37°C for 3 h Growth at 30°C for 3 h Growth at 13°C for 16 h
Harvest Centrifugation for 15 min at 3500 x g and 4°C, storage at -20°C until use.
Centrifugation for 15 min at 3500 x g and 4°C, storage at -20°C until use.
Centrifugation for 15 min at 3500 x g and 4°C, storage at -20°C until use.
74
8.7. Handling of S. cerevisiae
8.7.1. Gene construct
For expression in yeast the plasmid pJJH378 (kindly provided by A. Brüser, University of
Leipzig) was used. The plasmid contains an inducible Gal promoter and the gene
sequence of a phosphofructokinase subunit (PFK2), which was removed by BamHI and
HindIII digestion and replaced by the Rcu CCA-adding gene sequence equally digested by
BamHI and HindIII. The gene construct contained still the 3’ untranslated region (UTR)
of the PFK2 gene (about 100 nt after the N-terminal 6xHis-tag and stop codon) to allow a
successful termination of translation.
8.7.2. Transfection of S. cerevisiae
S. cerevisiae strain AH109 and Y187 were transfected with pJJH378 plasmid containing
the Rcu CCA-adding enzyme coding sequence. Cells were thawed on ice, and 1 µl of
plasmid (100-200 ng/µl) and 150 µl of LiPEG were added. The cell suspension was
vortexed, and incubated for 20 min at room temperature. 17.5 µl DMSO was added, and
the solution was shortly vortexed before the heat shock treatment was performed at
42°C for 15 min. Cells were centrifuged at 2000 rpm for 2 min, and the supernatant was
removed. The cell pellet was re-suspended in 100 µl H2O, and plated on SD(-Leu) agar
plates. Agar plates were incubated at 30°C together with a bowl filled with H2O. Cell
growth was verified after 3-4 days.
8.7.3. Protein overexpression in S. cerevisiae
A preculture of the S. cerevisiae AH109 or Y187 strain was used to inoculate 5 ml of SD
selection medium (-Leu), and incubated overnight with shaking at 180 rpm at 30°C.
Overnight cultures were vortexed for 0.5–1 min to disperse cell clumps. 50 ml aliquots
of YPDA medium were inoculated with the preculture to a final OD600 of 0.001. The
culture was incubated overnight until an OD600 = 2 was reached. Cells were centrifuged
at 400 rpm for 20 min. Protein expression was induced by the addition of the same
YPDA medium volume supplemented with 2 % galactose. Cells were harvested after
growth of 24 h (OD600 = 15) by centrifugation at 4000 rpm for 20 min at 4°C. The cell
pellet was stored at -20°C.
75
8.8. In vitro translation
The Easy Express® Protein Synthesis Kit from Qiagen was used for in vitro synthesis of
the Rcu CCA-adding enzyme following the manufacturer's instructions.
8.9. Protein Methods
8.9.1. Purification of Rcu CCA-adding enzyme
Gene construct
The CCA-adding enzyme coding sequenced was available with a N-terminal 6xHis-tag
sequence in the pET28b vector (kindly provided by O. Götze), and was cloned in this
study into a pTrcHis A plasmid, also with N-terminal 6xHis-tag sequence. Protein
expression in the pET system was controlled by a T7 promoter, and therefore
appropriate for E. coli (DE3) strains that express T7 RNA polymerase, and are controlled
by a Lac regulatory construct. In contrast, protein expression on pTrcHis vectors was
directly under the control of a trc promoter. The expression is induced for both
constructs by the addition of IPTG. The resulting proteins have a molecular weight of
53 kDa and a theoretical pI of 8.5 or 7 for the recombinant protein translated from
pET28b or pTrcHis A vector, respectively.
Affinitychromatography via ÄKTA
The cell pellet obtained from overexpression (section 8.6.6) was thawed on ice and
resuspended in 5 ml binding buffer. The cell suspension was mixed with 5 g
Zirconia/Silica beads and lysed with a FastPrep®-24 homogenizer for 30 s at 6 m/s. The
supernatant was separated from the cell pellet by centrifugation at 42,000 rpm for 40
min. The protein solution was further clarified from particles by filtering through a 0.22
µm syringe filter. The lysate was diluted 1:2 with binding buffer and loaded onto a His
Spin Trap column, which was equilibrated in lysis buffer CL. The column was washed
with 40 ml of dissociation buffer DBC (1 ml/min), followed by 20 ml of wash buffer CW
(2 ml/min). The protein was eluted with 15 ml elution buffer CE in 1 ml fractions
(1 ml/min).
76
Affinity chromatography via Batch-method
The cell pellet obtained from overexpression (section 8.6.6) was thawed on ice and
resuspended in 5 ml lysis buffer CL. The cell suspension was mixed with 5 g
Zirconia/Silica beads and lysed with a FastPrep®-24 homogenizer for 30 s at 6 m/s. The
supernatant was separated from the cell pellet by centrifugation at 42,000 rpm for 40
min. The protein solution was further clarified from particles by filtering through a 0.22
µm syringe filter. The lysate was diluted 1:2 with lysis buffer CL containing denatured
E. coli proteins (0.1 mg/ml final concentration). 2 ml of Ni-NTA slurry (1 ml bed volume)
were pipetted into a 15 ml tube and briefly centrifuged. The supernatant was removed
and 2 ml of lysis buffer CL were added. After centrifugation the supernatant was
removed. 8 ml of cell lysate were added to the matrix and gently mixed by shaking (200
rpm on a rotary shaker at 4°C for 60 min). The mixture was centrifuged and washed 2
times with 2.5 ml washing buffer CW. All centrifugation steps were carried out for 2 min
at 1000 rpm. The whole procedure was performed in a cooling room at 4 °C.
The lysate-Ni-NTA mixture was loaded onto a column with the bottom outlet capped.
The bottom cap was removed and the flow-through was collected for SDS-PAGE
analysis. The column was washed twice with 2 ml dissociation buffer DBC, followed by
two wash steps with 2 ml wash buffer CW. All wash fractions were collected. The protein
was eluted 4 times with 1 ml elution buffer CE. The eluate was collected in 4 tubes and
analyzed together with the other fractions by SDS-PAGE.
Size-exclusion chromatography
Size-exclusion chromatography (SEC) was performed to separate the Rcu CCA-adding
enzyme from remaining protein contaminations and to remove imidazole from elution
buffer. A HiLoad 16/60 Superdex 75 pg column (1 column volume = 120 mL) was
equilibrated with 250 ml SEC buffer. Subsequently, 2 ml of the elution fractions
(obtained from affinity chromatography) were injected. The elution was performed in
0.5 ml fractions, and the elution fractions were stored until use at 4°C.
Concentration and storage
Before the concentration procedure was performed, the absorbance and concentration
of the protein solution was determined at OD280 (NanoDrop) using the theoretical
extinction coefficient (ε = 43047). The protein containing fractions were transferred into
77
a dialysis membrane tube (cut off 30 kDa) and directly put onto a bed of high molecular
weight polyethyleneglycol (PEG) 20,000 chips (e.g. 10 g per 5 ml). Incubation time (in
general 1 h) was adapted, if necessary, to reach the favored volume reduction. Samples
with Rcu CCA-adding enzyme were either stored in SEC-buffer at 4°C or were
supplemented with 40 % (v/v) glycerol and stored at -20°C.
8.9.2. Purification of Rcu mt ArgRS
Gene construct
The coding sequence of the full length Rcu mt ArgRS and its variants were cloned with a
C-terminal 6xHis-tag in pET28a vector under the control of an inducible T7 promoter. A
codon optimized full length gene sequence for expression in E. coli was generated and
synthesized using the IDT services. Additionally, codon modified variants were cloned
into the pDEST vector with an N-terminal 6xHis-tag and were also under the control of
an inducible T7 promoter. The different protein variants varied in the length of their N-
terminal sequence. They were transferred into different E. coli strains, and expressed as
mentioned in section 8.6.6.
Affinity chromatography
After cultivation and recombinant protein expression, cells were harvested by
centrifugation and resuspended in 30 ml of buffer AW. Two protease inhibitor tablets
(Roche) were added. Cell lysis was performed by sonication on ice 8 times for 10 sec at
120 V with a pause of 30 sec between each sonication step. The cell suspension was
centrifuged at 35,000 g for 40 min at 4°C. The supernatant was loaded onto a 5 ml
NiNTA resin column (QIAGEN), which was equilibrated in buffer AW. Afterwards the
column was washed with 40 ml urea wash buffer AU (1 ml/min), followed by 20 ml
dissociation buffer DBA (1 ml/min) and 20 ml wash buffer AW (2 ml/min). The protein
was eluted using 15 ml elution buffer AE in 1 ml fractions (1 ml/min).
Dialysis and Concentration
Fractions containing the Rcu ArgRS were pooled and dialyzed against 500 ml dialysis
buffer A1 overnight. The buffer was exchanged by fresh buffer A1 and dialysis was
continued for 2 h. In a final dialysis step, the buffer was replaced by 500 ml dialysis
buffer A2 and the protein was dialyzed additional 2h. The protein solution was
78
concentrated by means of centrifugation using Amicon® Ultra-4 (cut-off: 30 kDa) at
5000 x g. The protein concentration was determined at OD280 (NanoDrop) using the
theoretical extinction coefficient of Rcu ArgRS (ε = 39100).
8.9.3. Protein Separation in SDS-polyacrylamide gel electrophoresis
The separation of proteins, depending on their size was performed as described in
(Sambrook et al., 1989) on a SDS-polyacrylamide gels. The gels contained a 10 %
resolving gel solution (pH 8.8) and a 4 % stacking gel solution (pH 6.8). Protein samples
were mixed with 5x protein loading buffer and boiled at 95°C for 5 min. Samples were
then briefly centrifuged and loaded onto the gel. Electrophoresis was performed with 1x
TGS as running buffer at 100 V and 180 V for the stacking and resolving gels,
respectively. To visualize the protein bands, the gel was stained with SDS-staining
solution for at least 30 min, and then washed with destaining buffer.
8.9.4. Western blot analysis
The Trans-blot Turbo Transfer System from Biorad was used for the detection of His-
tagged proteins. Samples were prepared as described in 8.9.3 and separated on a Mini-
Precast Gel (Biorad) at 200 V. The transfer to the membrane was performed following
the manufacturer’s instructions. For immuno detection, the PVDF membrane was
blocked with 5 % milk in 1x TBST for 30 min. Incubation with the HRP-conjugated
primary Anti-His antibody (abcam) (diluted 1:10,000 in 1x TBST + 1% milk) was
performed at 4°C overnight. After incubation, the membrane was washed three times
with 1% TBST, and briefly dried on Whatman paper. The Pierce ECL Western Blotting
Substrate 1 and 2 (Thermo Scientific) were mixed at a 1:1 ratio and added to the
membrane. After incubation of 1 minute excess reagent is drained. The membrane was
covered in a clear plastic wrap and exposed to X-ray film.
8.10. Protein aectctivity assays
8.10.1. CCA-incorporation assay
An assay contained 1x CCA reaction buffer, 1 mM NTPs, 4 pmol of radioactively labeled
tRNA and 50 ng of enzyme. The reaction was incubated between 30 min and 2h at 30 °C
in a final volume of 10 μl. The reaction was stopped by precipitating the RNA with
79
ethanol/0.3 M NaAc and centrifugation at 14,000 rpm for 20 min at 4°C. The
precipitated RNA pellet was directly resuspended in RNA loading buffer and then
separated on denaturing PAA gels. The reaction products were visualized using
autoradiography.
8.10.2. Aminoacylation assay
Before starting the aminoacylation reaction the in vitro synthesized tRNAs were
denatured for 1 min at 60 °C and then slowly renatured at room temperature (at least
min 4 min) to improve the correct refolding of tRNAs. An assay contained between 27
and 40 pmol tRNA, 500 µM arginine and 25 µM radioactively labeled 3H L-arginine
(40 ci/mmol), and 1x reaction buffer. The aminoacylation reaction mixture was
equilibrated to 25 °C before the addition of enzyme to a final volume of 50 µl. Aliquots of
10 µl were removed at varying time points and spotted onto Whatman 3MM papers
whetted with 5% TCA. These papers were placed immediately in a cold 5 % TCA
solution for 10 min. The TCA solution precipitates the tRNA. Free amino acids remain in
the solution. The papers are washed 2 times with 5% TCA and then dehydrated by
rinsing with ethanol. The dried papers were put in counting vessels containing 2.5 ml of
scintillation liquid (Ecoscint 0TM, National diagnostics). The radioactivity corresponding
to amino acid charged to the tRNA, fixed on the paper, was measured in a scintillizer
(LS6500, Beckmann Coulter) for 1 min per assay.
However, there were indications that the arginyl-tRNA synthetases used in this study
was sensitive to the ratio ATP/Mg2+ in the reaction buffer. So the reaction buffer was
adjusted for each of the synthetases. MRE and MRC buffer was used for E. coli and for
S. cerevisiae ArgRS respectively. For R. culicivorax ArgRS MMR buffer with varying Mg2+
concentration was used.

80
81
RESULTS
82
CHAPTER 1: Genomic analysis of the nematode worm R. culicivorax
Romanomermis culicivorax is a nematode roundworm. The phylum Nematoda consists of
two classes: Chromadorea, which include, e.g., Caenorhabditis elegans and Ascaris suum,
and Enoplea, which include, e.g., Trichinella spiralis and R. culicivorax (Schiffer et al.,
2013) (Figure 22). R. culicivorax inhabits freshwater environments like ponds and lakes.
While its original habitat is situated in the United States, particularly in Louisiana,
Florida, and Utah, humans have distributed the species around the world (Levy R et al.,
1979).
R. culicivorax is an obligatory endoparasite and penetrates a broad range of mosquito
species. Its body is long and narrow, with a whitish color. Its body size ranges from 5 up
to 25 mm. R. culicivorax undergoes four molts during the first 3-6 weeks while it grows
up from the first instar larvae stadium to an adult. During this time, the infective
preparasite stage hatches from eggs as a second-stage larva, and swims freely in fresh
water until it finds a host, i.e., a mosquito larvae (e.g. different Aedes and Anopheles
species). Upon successful contact, the preparasite attaches to the mosquito larvae by
means of a stylet, and enters the hemocoel through a hole cut into the host’s cuticle. The
parasite then matures inside the host during the following 7-8 days. Afterwards, the
postparasitic stage emerges by rupturing a hole in the host’s cuticle through simple
mechanical pressure, which is always lethal for the host. After its emergence, the free-
living larvae molts again, and finally reaches the adults stage, and thereby sexual
maturity. After mating in fresh water and laying eggs, the parasitic life cycle restarts
again (Shamseldean and Platzer, 1989).
As mentioned above, R. culicivorax can infest different mosquito species, which are
transmitters of major infectious diseases, e.g., malaria and dengue. It has been shown
that R. culicivorax can infest Anopheles and larvae of other species under laboratory as
well as under natural conditions (Kobylinski et al., 2012). Malaria is a highly infectious
disease caused by parasites belonging to the Plasmodium type, and is commonly
transmitted by the bite of an infected female Anopheles mosquito. Therefore,
R. culicivorax is of considerable interest because of its potential to be used as a
biological remedy against these insect’s pest (Petersen and Chapman, 1979;
Kamareddine, 2012). Even if R. culicivorax would be able to theoretically reduce the
prevalence of malaria within the human population, the effectiveness of this parasite to
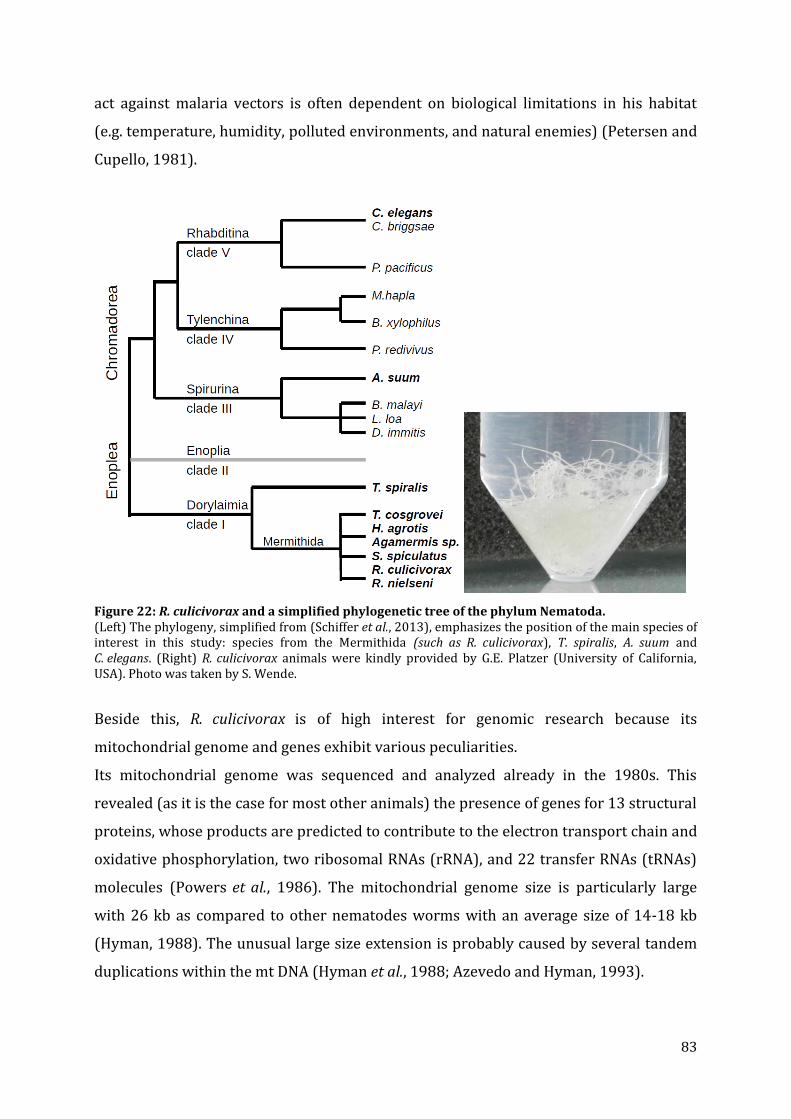
83
act against malaria vectors is often dependent on biological limitations in his habitat
(e.g. temperature, humidity, polluted environments, and natural enemies) (Petersen and
Cupello, 1981).
Figure 22: R. culicivorax and a simplified phylogenetic tree of the phylum Nematoda. (Left) The phylogeny, simplified from (Schiffer et al., 2013), emphasizes the position of the main species of interest in this study: species from the Mermithida (such as R. culicivorax), T. spiralis, A. suum and C. elegans. (Right) R. culicivorax animals were kindly provided by G.E. Platzer (University of California, USA). Photo was taken by S. Wende.
Beside this, R. culicivorax is of high interest for genomic research because its
mitochondrial genome and genes exhibit various peculiarities.
Its mitochondrial genome was sequenced and analyzed already in the 1980s. This
revealed (as it is the case for most other animals) the presence of genes for 13 structural
proteins, whose products are predicted to contribute to the electron transport chain and
oxidative phosphorylation, two ribosomal RNAs (rRNA), and 22 transfer RNAs (tRNAs)
molecules (Powers et al., 1986). The mitochondrial genome size is particularly large
with 26 kb as compared to other nematodes worms with an average size of 14-18 kb
(Hyman, 1988). The unusual large size extension is probably caused by several tandem
duplications within the mt DNA (Hyman et al., 1988; Azevedo and Hyman, 1993).
84
In contrast to former genome annotations, a recently updated version annotated mt
tRNA genes with an extremely reduced size. Throughout the 22 mt tRNA genes, 11
correspond to D-armless tRNAs, 2 correspond to T-armless tRNAs, and 9 correspond to
tRNAs missing both arms (Jühling et al., 2012b). It appears that tRNAArg and tRNAIle
belong to those that miss both arms. Chapter 2 focuses on the structural properties of
these tRNAs, which are one of the main interests of this study.
9. Analysis of mitochondrial small and large rRNA in R. culicivorax
The discovery of shortened tRNA genes in Nematodes in general, led to the presumption
that the mitochondrial translation machineries of these parasitic worms could differ
considerably from that in plants or mammals. In fact, not only tRNAs but also other
ncRNA genes are of shorter size. Indeed, the rRNA components of nematode
mitoribosomes are among the smallest characterized thus far, indicating that some of
the nematode mt ribosomal proteins are likely to be recruited to compensate for the
reduced size of the mt rRNAs during evolution (Okimoto and Wolstenholme, 1990;
Okimoto et al., 1992; Okimoto et al., 1994; Suzuki et al., 2001). Thus, it is of high interest
whether reduced rRNAs are also present in the mitoribosome of R. culicivorax. Both
genes, coding for the small and large rRNA, were compared herein to those from C.
elegans, representing the shortest rRNAs identified so far. Additionally, they were
compared to human mt rRNA genes, which serve as a reference. Thereby, the estimation
of rRNA gene sizes was based on the annotations that are available at the NCBI database
(www.ncbi.nlm.nih.gov).
This analysis revealed that both annotated rRNAs of R. culicivorax are shorter than these
of C. elegans. The large rRNA is with 839 nt more than 100 nt shorter than this of
C. elegans (953 nt). The length of the small rRNA is with 662 nt slightly shorter
compared to its counterpart in C. elegans (697 nt). Both mt rRNA genes from both
nematodes are significantly shorter than those from human mitochondria, which are of
954 nt and 1,559 nt for the small and large rRNA gene, respectively (see Table 12 for a
detailed overview). We hypothesize that the reduction in size of the mitochondrial RNA
content (for tRNA and rRNA sequences) in R. culicivorax is potentially correlated to an
increased protein content in the mitoribosome as it was shown for other mammals
(Okimoto et al., 1992; Wolstenholme et al., 1994; Suzuki et al., 2001). However, this
hypothesis has still to be verified for R. culicivorax.
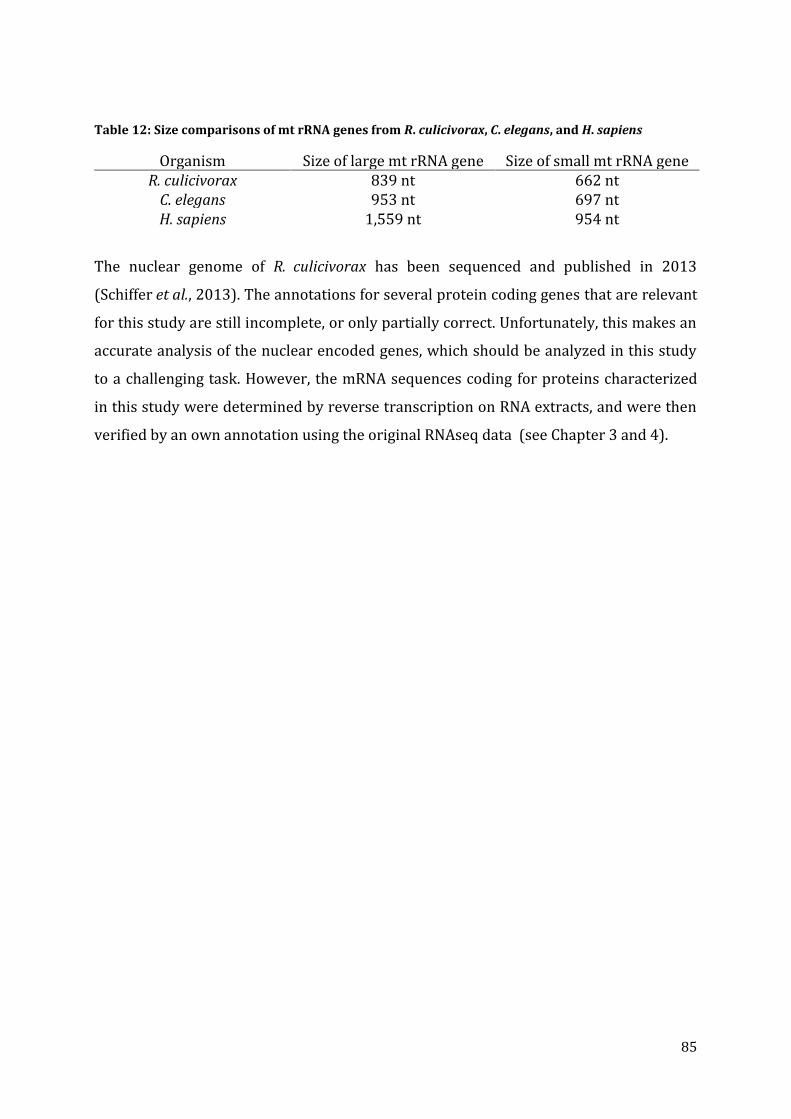
85
Table 12: Size comparisons of mt rRNA genes from R. culicivorax, C. elegans, and H. sapiens
Organism Size of large mt rRNA gene Size of small mt rRNA gene R. culicivorax 839 nt 662 nt
C. elegans 953 nt 697 nt H. sapiens 1,559 nt 954 nt
The nuclear genome of R. culicivorax has been sequenced and published in 2013
(Schiffer et al., 2013). The annotations for several protein coding genes that are relevant
for this study are still incomplete, or only partially correct. Unfortunately, this makes an
accurate analysis of the nuclear encoded genes, which should be analyzed in this study
to a challenging task. However, the mRNA sequences coding for proteins characterized
in this study were determined by reverse transcription on RNA extracts, and were then
verified by an own annotation using the original RNAseq data (see Chapter 3 and 4).
86
CHAPTER 2: Structural characterization of armless mt tRNAs
This chapter is dedicated to the structural investigation of armless mitochondrial tRNAs
of the nematode R. culicivorax, with special regards to tRNAArg and tRNAIle. This study
continues the work of Frank Jühling and Sandra Wende about the bioinformatic
prediction of truncated tRNAs, and the initials hints for their biological existence
(Jühling et al., 2012b; Wende et al., 2014).
In the following paragraphs a comparative tRNA gene analysis is presented and in a
second part the secondary and tertiary structure of armless tRNAs are identified using
enzymatic and chemical probing as well as biophysical methods such as nuclear
magnetic resonance (NMR) spectroscopy and small angle X-ray scattering (SAXS).
10. Primary sequence analysis of armless mt tRNA genes
In order to obtain a better structural overview of these extremely truncated tRNAs,
alignments were built containing a variety of tRNAArg or tRNAIle genes from different
organisms. The comparisons is based on alignments presented in 2012 by Jühling and
colleagues for all mt tRNA genes of several nematode worms of the Mermithidae family (i.e.
Romanomermis nielseni, Hexamermis agrotis, Strelkovimermis spiculatus, Thaumamermis
cosgrovei, and Agamermis sp. BH-2006) that are closely related to R. culicivorax (Jühling et
al., 2012b). Here we focus especially on the tRNAArg and tRNAIle, while the peculiarities of
both tRNAs are highlighted through a comparison with several other mitochondrial and
cytosolic tRNA gene sequences. These alignments that are presented below include
therefore also mt tRNA sequences of nematodes that are more distantly related, e.g.,
Caenorhabditis elegans, Ascaris suum, and Trichinella spiralis. Furthermore, the annotated
mt tRNAArg and tRNAIle genes of some arthropods, more precisely, of two mites (Pireneitega
taishanensis and Dermatophagoides farina), a spider (Tetragnatha nitens), and a
pseudoscorpion (Paratemnoides elongates) are included into this alignment. In addition, a
typical human mt tRNA is added as a reference for typical metazoan mt tRNAs. Moreover,
cytosolic tRNAs of classical model organisms, such as C. elegans, Homo sapiens,
Saccharomyces cerevisiae, and Escherichia coli were added to complete the comparative
analysis between cytosolic, mitochondrial and armless tRNAs. The complete overview of
all tRNAs showing the different gene sequences and their alignments with each other are
shown in Figure 23. It can be clearly seen that the nucleotide composition of each tRNA
differs strongly from one organism to another. Only anticodons of tRNAs of similar
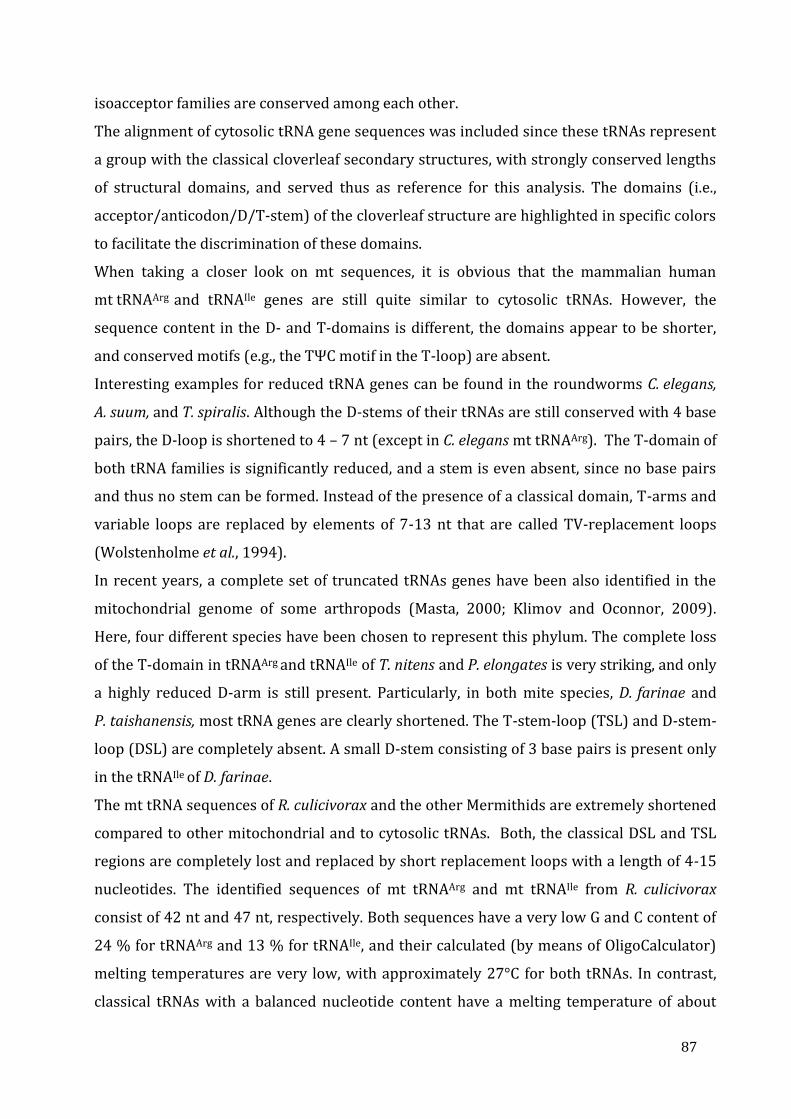
87
isoacceptor families are conserved among each other.
The alignment of cytosolic tRNA gene sequences was included since these tRNAs represent
a group with the classical cloverleaf secondary structures, with strongly conserved lengths
of structural domains, and served thus as reference for this analysis. The domains (i.e.,
acceptor/anticodon/D/T-stem) of the cloverleaf structure are highlighted in specific colors
to facilitate the discrimination of these domains.
When taking a closer look on mt sequences, it is obvious that the mammalian human
mt tRNAArg and tRNAIle genes are still quite similar to cytosolic tRNAs. However, the
sequence content in the D- and T-domains is different, the domains appear to be shorter,
and conserved motifs (e.g., the TΨC motif in the T-loop) are absent.
Interesting examples for reduced tRNA genes can be found in the roundworms C. elegans,
A. suum, and T. spiralis. Although the D-stems of their tRNAs are still conserved with 4 base
pairs, the D-loop is shortened to 4 – 7 nt (except in C. elegans mt tRNAArg). The T-domain of
both tRNA families is significantly reduced, and a stem is even absent, since no base pairs
and thus no stem can be formed. Instead of the presence of a classical domain, T-arms and
variable loops are replaced by elements of 7-13 nt that are called TV-replacement loops
(Wolstenholme et al., 1994).
In recent years, a complete set of truncated tRNAs genes have been also identified in the
mitochondrial genome of some arthropods (Masta, 2000; Klimov and Oconnor, 2009).
Here, four different species have been chosen to represent this phylum. The complete loss
of the T-domain in tRNAArg and tRNAIle of T. nitens and P. elongates is very striking, and only
a highly reduced D-arm is still present. Particularly, in both mite species, D. farinae and
P. taishanensis, most tRNA genes are clearly shortened. The T-stem-loop (TSL) and D-stem-
loop (DSL) are completely absent. A small D-stem consisting of 3 base pairs is present only
in the tRNAIle of D. farinae.
The mt tRNA sequences of R. culicivorax and the other Mermithids are extremely shortened
compared to other mitochondrial and to cytosolic tRNAs. Both, the classical DSL and TSL
regions are completely lost and replaced by short replacement loops with a length of 4-15
nucleotides. The identified sequences of mt tRNAArg and mt tRNAIle from R. culicivorax
consist of 42 nt and 47 nt, respectively. Both sequences have a very low G and C content of
24 % for tRNAArg and 13 % for tRNAIle, and their calculated (by means of OligoCalculator)
melting temperatures are very low, with approximately 27°C for both tRNAs. In contrast,
classical tRNAs with a balanced nucleotide content have a melting temperature of about
88
75°C and mitochondrial tRNAs from higher eukaryotes exhibit a melting temperature of
about 55°C (Yokogawa et al., 2010). Interestingly, the optimal range of temperature for the
development of R. culicivorax is 21°C-33°C (Platzer, 2007). Thus, it is possible that armless
tRNAs are stabilized by base modifications or other (so far unknown) factors.
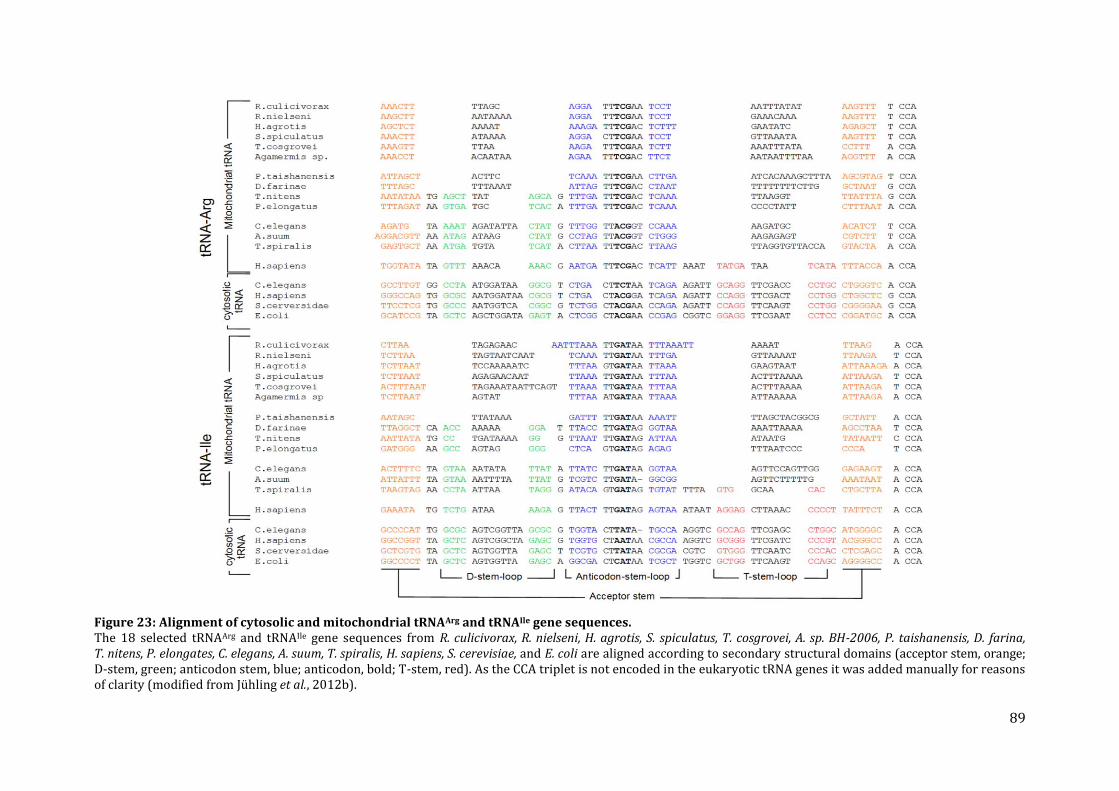
89
Figure 23: Alignment of cytosolic and mitochondrial tRNAArg and tRNAIle gene sequences. The 18 selected tRNAArg and tRNAIle gene sequences from R. culicivorax, R. nielseni, H. agrotis, S. spiculatus, T. cosgrovei, A. sp. BH-2006, P. taishanensis, D. farina, T. nitens, P. elongates, C. elegans, A. suum, T. spiralis, H. sapiens, S. cerevisiae, and E. coli are aligned according to secondary structural domains (acceptor stem, orange; D-stem, green; anticodon stem, blue; anticodon, bold; T-stem, red). As the CCA triplet is not encoded in the eukaryotic tRNA genes it was added manually for reasons of clarity (modified from Jühling et al., 2012b).

90
11. Construction of DNA templates and in vitro transcription of tRNAs without
3’-CCA-end
In order to elucidate the secondary and tertiary structures of both armless tRNAs, these
molecules were produced by in vitro transcription. The tRNA gene containing plasmids or
PCR products that served as template for in vitro transcription were synthesized and
cloned into a pCR®2.1-TOPO vector following the protocol described in section 8.4.1.
Therein, the sequence encoding the tRNA gene, flanked upstream by a hammerhead-
ribozyme sequence and downstream by a HDV-ribozyme sequence, is located
downstream of a T7 promoter. While the T7 promoter ensures the binding of the T7 RNA
polymerase and defines the transcription start, both ribozymes self-cleave
autocatalytically after transcription and make thus sure that produced tRNA molecules
possess homogeneous 5`- and 3`-ends (Schürer et al., 2002). Transcription and the
following purification of the transcript was performed as described in section 8.4.2. The
overall quality of the RNA preparations was assessed by electrophoresis on a denaturing
12.5 % PAA-gel. This method allows first evaluation about RNA quantities. A typical result
of RNA migration using a denaturing gel system is shown in Figure 24 A. In this example,
the RNA was internally radioactively labeled with α-32P-ATP. The resulting bands
represent tRNA molecules (tRNAPhe from yeast in lane 1 as control, mt tRNAIle in lane 2
and mt tRNAArg in lane 3) as well as the RNA molecules corresponding to the cleaved
hammerhead ribozyme and HDV-ribozyme, respectively, are all clearly identifiable. The
ribozymes have different sizes, because their nucleotide sequences have been adapted to
the corresponding tRNA sequences to ensure an exact cleavage of the specific tRNA ends,
and to facilitate the size discrimination between RNA products. Bands corresponding to
RNA products of larger size probably represent transcription products in which the
ribozyme cleavage did not occur. These bands are very weak and can be neglected. The
released tRNAs were excised from the gel and purified. The yield from a typical 30 µl
reaction volume of transcription was about 300 pmol of tRNA molecules. The yeast
cytosolic tRNAPhe was prepared as a positive control for the transcription procedure, and
served later as an activity control for the CCA-incorporation assays.
The tRNA gene transcription product carries a 5’-hydroxyl group, which can be converted
to a radioactively labeled 5’-phosphate. This property required for structure probing
assays. At the 3’-end, a 2’, 3’-cyclic phosphate group is generated during the ribozyme
cleavage, which has to be removed by dephosphorylation with T4 PNK if the tRNA is used
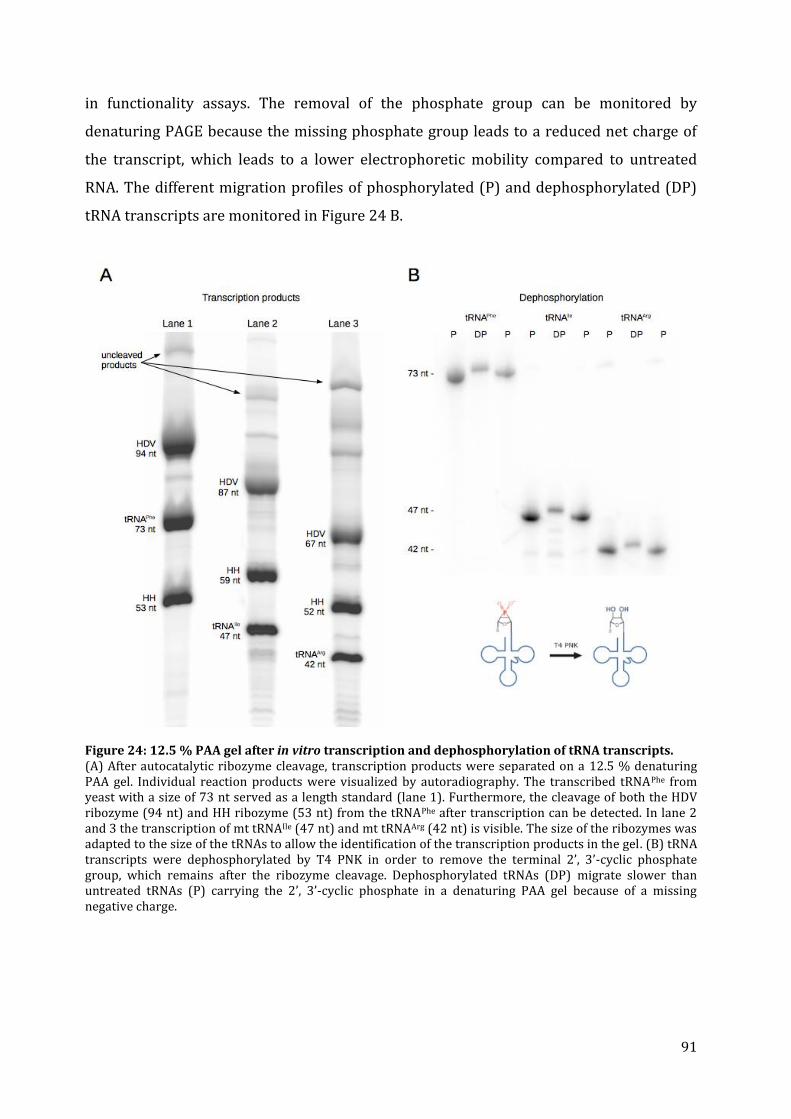
91
in functionality assays. The removal of the phosphate group can be monitored by
denaturing PAGE because the missing phosphate group leads to a reduced net charge of
the transcript, which leads to a lower electrophoretic mobility compared to untreated
RNA. The different migration profiles of phosphorylated (P) and dephosphorylated (DP)
tRNA transcripts are monitored in Figure 24 B.
Figure 24: 12.5 % PAA gel after in vitro transcription and dephosphorylation of tRNA transcripts. (A) After autocatalytic ribozyme cleavage, transcription products were separated on a 12.5 % denaturing PAA gel. Individual reaction products were visualized by autoradiography. The transcribed tRNAPhe from yeast with a size of 73 nt served as a length standard (lane 1). Furthermore, the cleavage of both the HDV ribozyme (94 nt) and HH ribozyme (53 nt) from the tRNAPhe after transcription can be detected. In lane 2 and 3 the transcription of mt tRNAIle (47 nt) and mt tRNAArg (42 nt) is visible. The size of the ribozymes was adapted to the size of the tRNAs to allow the identification of the transcription products in the gel. (B) tRNA transcripts were dephosphorylated by T4 PNK in order to remove the terminal 2’, 3’-cyclic phosphate group, which remains after the ribozyme cleavage. Dephosphorylated tRNAs (DP) migrate slower than untreated tRNAs (P) carrying the 2’, 3’-cyclic phosphate in a denaturing PAA gel because of a missing negative charge.
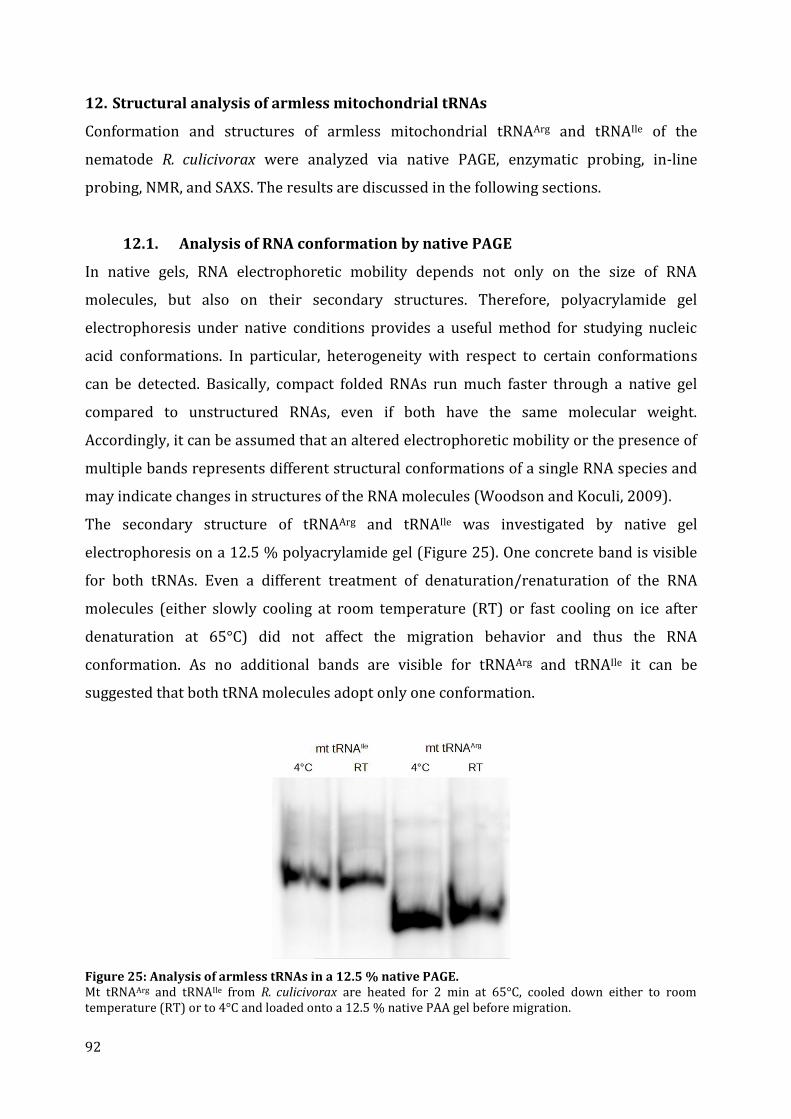
92
12. Structural analysis of armless mitochondrial tRNAs
Conformation and structures of armless mitochondrial tRNAArg and tRNAIle of the
nematode R. culicivorax were analyzed via native PAGE, enzymatic probing, in-line
probing, NMR, and SAXS. The results are discussed in the following sections.
12.1. Analysis of RNA conformation by native PAGE
In native gels, RNA electrophoretic mobility depends not only on the size of RNA
molecules, but also on their secondary structures. Therefore, polyacrylamide gel
electrophoresis under native conditions provides a useful method for studying nucleic
acid conformations. In particular, heterogeneity with respect to certain conformations
can be detected. Basically, compact folded RNAs run much faster through a native gel
compared to unstructured RNAs, even if both have the same molecular weight.
Accordingly, it can be assumed that an altered electrophoretic mobility or the presence of
multiple bands represents different structural conformations of a single RNA species and
may indicate changes in structures of the RNA molecules (Woodson and Koculi, 2009).
The secondary structure of tRNAArg and tRNAIle was investigated by native gel
electrophoresis on a 12.5 % polyacrylamide gel (Figure 25). One concrete band is visible
for both tRNAs. Even a different treatment of denaturation/renaturation of the RNA
molecules (either slowly cooling at room temperature (RT) or fast cooling on ice after
denaturation at 65°C) did not affect the migration behavior and thus the RNA
conformation. As no additional bands are visible for tRNAArg and tRNAIle it can be
suggested that both tRNA molecules adopt only one conformation.
Figure 25: Analysis of armless tRNAs in a 12.5 % native PAGE. Mt tRNAArg and tRNAIle from R. culicivorax are heated for 2 min at 65°C, cooled down either to room temperature (RT) or to 4°C and loaded onto a 12.5 % native PAA gel before migration.
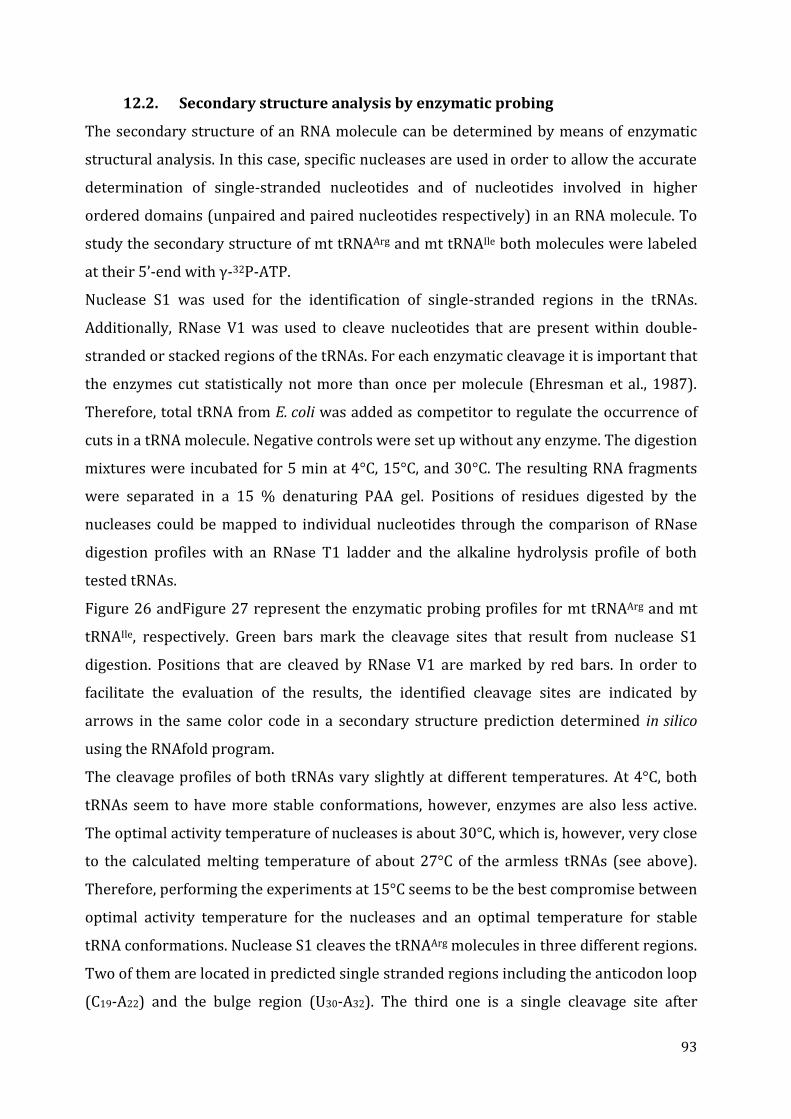
93
12.2. Secondary structure analysis by enzymatic probing
The secondary structure of an RNA molecule can be determined by means of enzymatic
structural analysis. In this case, specific nucleases are used in order to allow the accurate
determination of single-stranded nucleotides and of nucleotides involved in higher
ordered domains (unpaired and paired nucleotides respectively) in an RNA molecule. To
study the secondary structure of mt tRNAArg and mt tRNAIle both molecules were labeled
at their 5’-end with γ-32P-ATP.
Nuclease S1 was used for the identification of single-stranded regions in the tRNAs.
Additionally, RNase V1 was used to cleave nucleotides that are present within double-
stranded or stacked regions of the tRNAs. For each enzymatic cleavage it is important that
the enzymes cut statistically not more than once per molecule (Ehresman et al., 1987).
Therefore, total tRNA from E. coli was added as competitor to regulate the occurrence of
cuts in a tRNA molecule. Negative controls were set up without any enzyme. The digestion
mixtures were incubated for 5 min at 4°C, 15°C, and 30°C. The resulting RNA fragments
were separated in a 15 % denaturing PAA gel. Positions of residues digested by the
nucleases could be mapped to individual nucleotides through the comparison of RNase
digestion profiles with an RNase T1 ladder and the alkaline hydrolysis profile of both
tested tRNAs.
Figure 26 andFigure 27 represent the enzymatic probing profiles for mt tRNAArg and mt
tRNAIle, respectively. Green bars mark the cleavage sites that result from nuclease S1
digestion. Positions that are cleaved by RNase V1 are marked by red bars. In order to
facilitate the evaluation of the results, the identified cleavage sites are indicated by
arrows in the same color code in a secondary structure prediction determined in silico
using the RNAfold program.
The cleavage profiles of both tRNAs vary slightly at different temperatures. At 4°C, both
tRNAs seem to have more stable conformations, however, enzymes are also less active.
The optimal activity temperature of nucleases is about 30°C, which is, however, very close
to the calculated melting temperature of about 27°C of the armless tRNAs (see above).
Therefore, performing the experiments at 15°C seems to be the best compromise between
optimal activity temperature for the nucleases and an optimal temperature for stable
tRNA conformations. Nuclease S1 cleaves the tRNAArg molecules in three different regions.
Two of them are located in predicted single stranded regions including the anticodon loop
(C19-A22) and the bulge region (U30-A32). The third one is a single cleavage site after
94
position A2, which is localized in the acceptor stem. Apparently, RNase V1 cuts
significantly at several positions. Some are located in the predicted double stranded
regions like the anticodon stem (G13/G14 and C24-U26) and the acceptor stem (A37/G38).
Surprisingly, some cleavages took place in bulge regions, i.e., such as in position U6-A8 and
A27. Since the U6-A8 region contains many U nucleotides, and is located opposite of A27,
internal interactions may be formed in the bulge, which could have been recognized by
RNase V1. Control incubations performed under the same conditions in absence of
nuclease S1 and RNase V1 and T1 confirm that no degradation of tRNA molecules took
already place.
The results of the enzymatic probing analysis of mt tRNAArg indicate that nuclease S1 is
preferentially active in predicted single-stranded region (anticodon loop and bulge),
while RNase V1 cuts preferentially in stem regions (anticodon and acceptor stem), except
for one region, which is located in the bulge. Since not every region in the mt tRNAArg
molecules could be determined structurally by enzymatic probing, further investigation
using more sensitive methods were necessary (see the following sections).
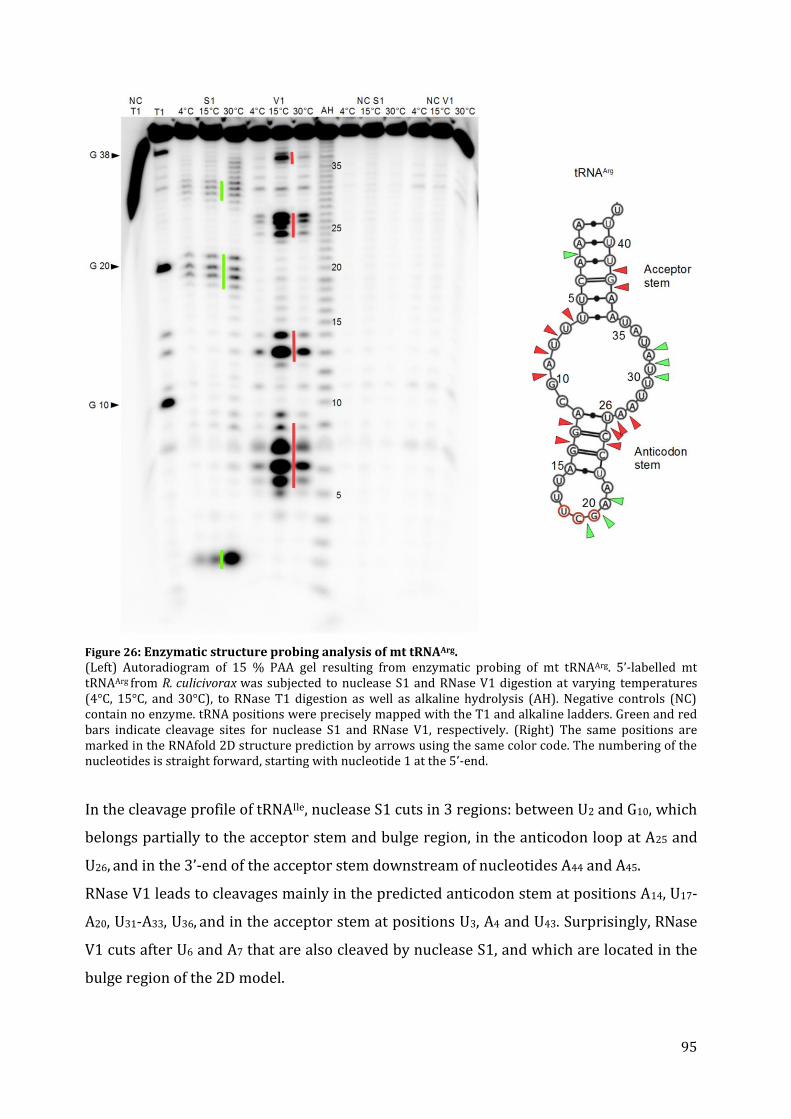
95
Figure 26: Enzymatic structure probing analysis of mt tRNAArg. (Left) Autoradiogram of 15 % PAA gel resulting from enzymatic probing of mt tRNAArg. 5’-labelled mt tRNAArg from R. culicivorax was subjected to nuclease S1 and RNase V1 digestion at varying temperatures (4°C, 15°C, and 30°C), to RNase T1 digestion as well as alkaline hydrolysis (AH). Negative controls (NC) contain no enzyme. tRNA positions were precisely mapped with the T1 and alkaline ladders. Green and red bars indicate cleavage sites for nuclease S1 and RNase V1, respectively. (Right) The same positions are marked in the RNAfold 2D structure prediction by arrows using the same color code. The numbering of the nucleotides is straight forward, starting with nucleotide 1 at the 5’-end.
In the cleavage profile of tRNAIle, nuclease S1 cuts in 3 regions: between U2 and G10, which
belongs partially to the acceptor stem and bulge region, in the anticodon loop at A25 and
U26, and in the 3’-end of the acceptor stem downstream of nucleotides A44 and A45.
RNase V1 leads to cleavages mainly in the predicted anticodon stem at positions A14, U17-
A20, U31-A33, U36, and in the acceptor stem at positions U3, A4 and U43. Surprisingly, RNase
V1 cuts after U6 and A7 that are also cleaved by nuclease S1, and which are located in the
bulge region of the 2D model.
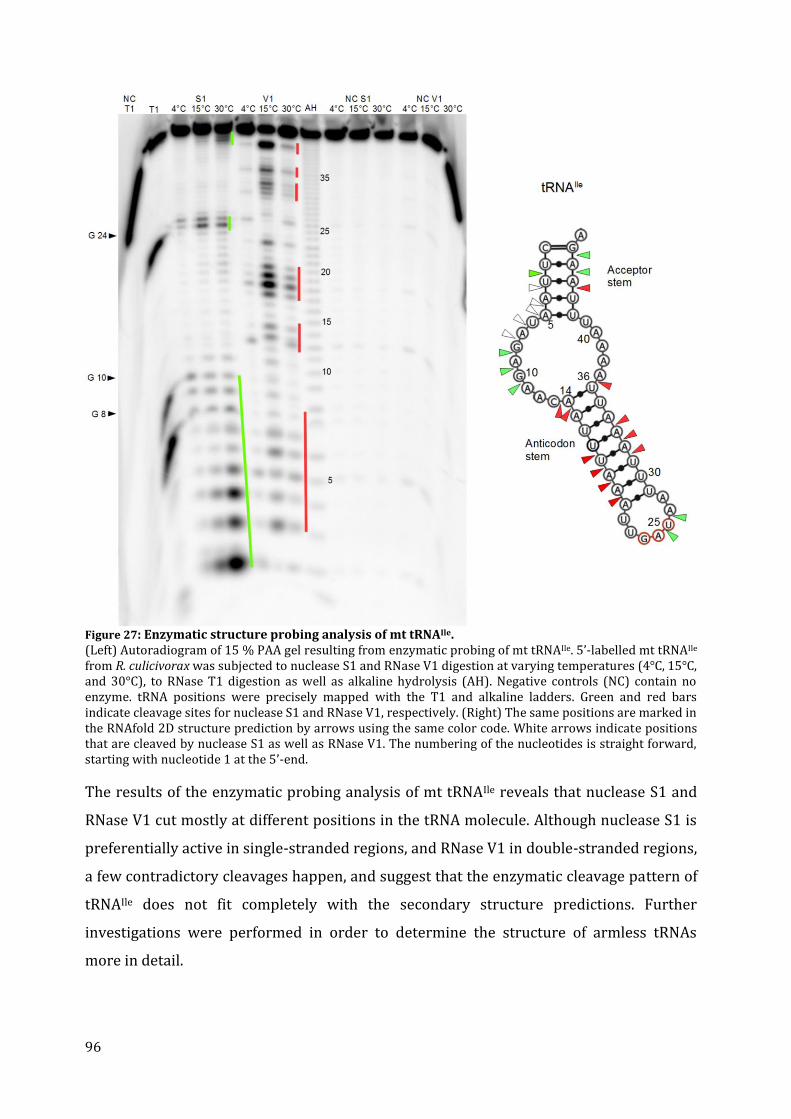
96
Figure 27: Enzymatic structure probing analysis of mt tRNAIle. (Left) Autoradiogram of 15 % PAA gel resulting from enzymatic probing of mt tRNAIle. 5’-labelled mt tRNAIle
from R. culicivorax was subjected to nuclease S1 and RNase V1 digestion at varying temperatures (4°C, 15°C, and 30°C), to RNase T1 digestion as well as alkaline hydrolysis (AH). Negative controls (NC) contain no enzyme. tRNA positions were precisely mapped with the T1 and alkaline ladders. Green and red bars indicate cleavage sites for nuclease S1 and RNase V1, respectively. (Right) The same positions are marked in the RNAfold 2D structure prediction by arrows using the same color code. White arrows indicate positions that are cleaved by nuclease S1 as well as RNase V1. The numbering of the nucleotides is straight forward, starting with nucleotide 1 at the 5’-end.
The results of the enzymatic probing analysis of mt tRNAIle reveals that nuclease S1 and
RNase V1 cut mostly at different positions in the tRNA molecule. Although nuclease S1 is
preferentially active in single-stranded regions, and RNase V1 in double-stranded regions,
a few contradictory cleavages happen, and suggest that the enzymatic cleavage pattern of
tRNAIle does not fit completely with the secondary structure predictions. Further
investigations were performed in order to determine the structure of armless tRNAs
more in detail.
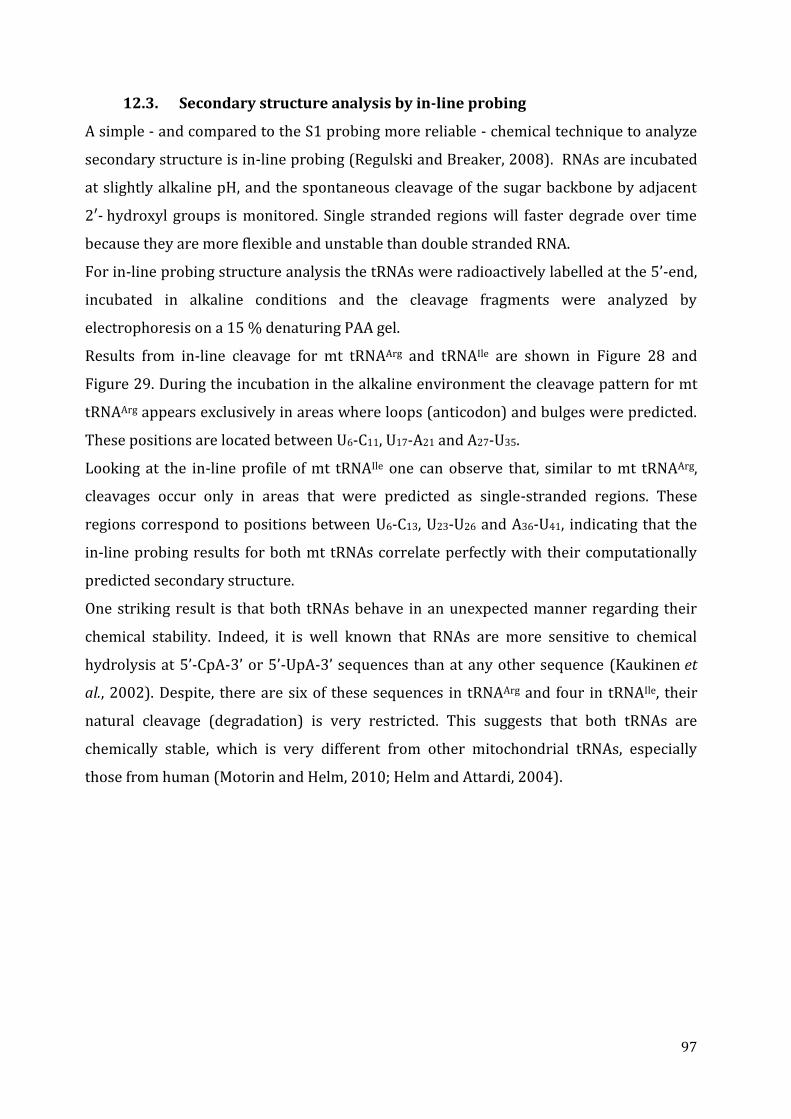
97
12.3. Secondary structure analysis by in-line probing
A simple - and compared to the S1 probing more reliable - chemical technique to analyze
secondary structure is in-line probing (Regulski and Breaker, 2008). RNAs are incubated
at slightly alkaline pH, and the spontaneous cleavage of the sugar backbone by adjacent
2′- hydroxyl groups is monitored. Single stranded regions will faster degrade over time
because they are more flexible and unstable than double stranded RNA.
For in-line probing structure analysis the tRNAs were radioactively labelled at the 5’-end,
incubated in alkaline conditions and the cleavage fragments were analyzed by
electrophoresis on a 15 % denaturing PAA gel.
Results from in-line cleavage for mt tRNAArg and tRNAIle are shown in Figure 28 and
Figure 29. During the incubation in the alkaline environment the cleavage pattern for mt
tRNAArg appears exclusively in areas where loops (anticodon) and bulges were predicted.
These positions are located between U6-C11, U17-A21 and A27-U35.
Looking at the in-line profile of mt tRNAIle one can observe that, similar to mt tRNAArg,
cleavages occur only in areas that were predicted as single-stranded regions. These
regions correspond to positions between U6-C13, U23-U26 and A36-U41, indicating that the
in-line probing results for both mt tRNAs correlate perfectly with their computationally
predicted secondary structure.
One striking result is that both tRNAs behave in an unexpected manner regarding their
chemical stability. Indeed, it is well known that RNAs are more sensitive to chemical
hydrolysis at 5’-CpA-3’ or 5’-UpA-3’ sequences than at any other sequence (Kaukinen et
al., 2002). Despite, there are six of these sequences in tRNAArg and four in tRNAIle, their
natural cleavage (degradation) is very restricted. This suggests that both tRNAs are
chemically stable, which is very different from other mitochondrial tRNAs, especially
those from human (Motorin and Helm, 2010; Helm and Attardi, 2004).
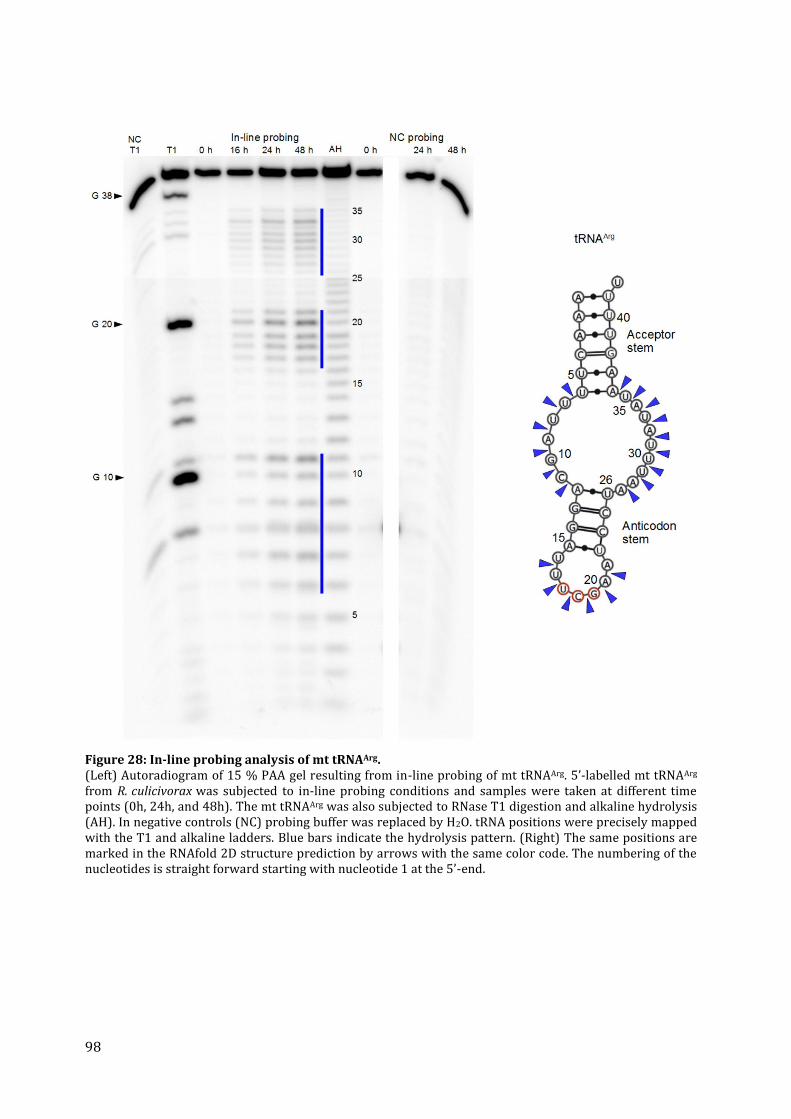
98
Figure 28: In-line probing analysis of mt tRNAArg. (Left) Autoradiogram of 15 % PAA gel resulting from in-line probing of mt tRNAArg. 5’-labelled mt tRNAArg
from R. culicivorax was subjected to in-line probing conditions and samples were taken at different time points (0h, 24h, and 48h). The mt tRNAArg was also subjected to RNase T1 digestion and alkaline hydrolysis (AH). In negative controls (NC) probing buffer was replaced by H2O. tRNA positions were precisely mapped with the T1 and alkaline ladders. Blue bars indicate the hydrolysis pattern. (Right) The same positions are marked in the RNAfold 2D structure prediction by arrows with the same color code. The numbering of the nucleotides is straight forward starting with nucleotide 1 at the 5’-end.
99
Figure 29: In-line probing analysis of mt tRNAIle. (Left) Autoradiogram of 15 % PAA gel resulting from in-line probing of mt tRNAIle. 5’-labelled mt tRNAIle
from R. culicivorax was subjected to in-line probing conditions and samples were taken at different time points (0h, 16h, 24h, and 48h). The mt tRNAIle was also subjected to RNase T1 digestion and alkaline hydrolysis (AH). In negative controls (NC) probing buffer was replaced by H2O. tRNA positions were precisely mapped with the T1 and alkaline ladders. Blue bars indicate the hydrolysis pattern. (Right) The same positions are marked in the RNAfold 2D structure prediction by arrows with the same color code. The numbering of the nucleotides is straight forward starting with nucleotide 1 at the 5’-end.
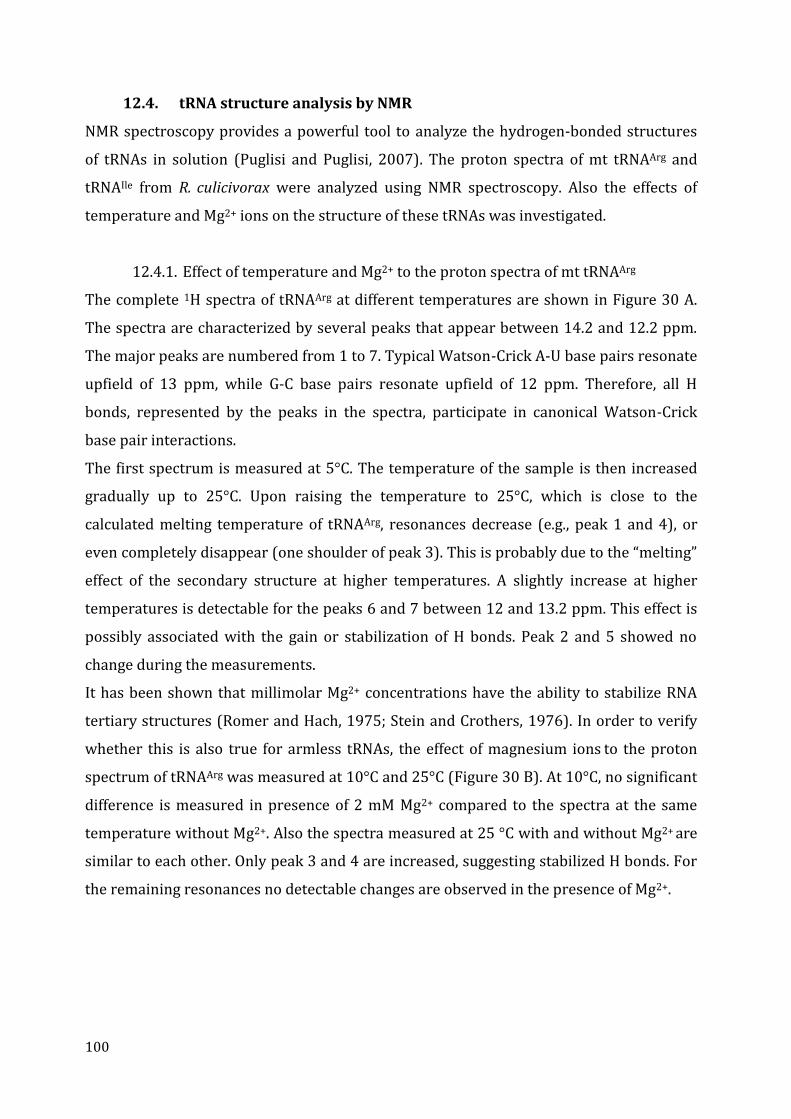
100
12.4. tRNA structure analysis by NMR
NMR spectroscopy provides a powerful tool to analyze the hydrogen-bonded structures
of tRNAs in solution (Puglisi and Puglisi, 2007). The proton spectra of mt tRNAArg and
tRNAIle from R. culicivorax were analyzed using NMR spectroscopy. Also the effects of
temperature and Mg2+ ions on the structure of these tRNAs was investigated.
12.4.1. Effect of temperature and Mg2+ to the proton spectra of mt tRNAArg
The complete 1H spectra of tRNAArg at different temperatures are shown in Figure 30 A.
The spectra are characterized by several peaks that appear between 14.2 and 12.2 ppm.
The major peaks are numbered from 1 to 7. Typical Watson-Crick A-U base pairs resonate
upfield of 13 ppm, while G-C base pairs resonate upfield of 12 ppm. Therefore, all H
bonds, represented by the peaks in the spectra, participate in canonical Watson-Crick
base pair interactions.
The first spectrum is measured at 5°C. The temperature of the sample is then increased
gradually up to 25°C. Upon raising the temperature to 25°C, which is close to the
calculated melting temperature of tRNAArg, resonances decrease (e.g., peak 1 and 4), or
even completely disappear (one shoulder of peak 3). This is probably due to the “melting”
effect of the secondary structure at higher temperatures. A slightly increase at higher
temperatures is detectable for the peaks 6 and 7 between 12 and 13.2 ppm. This effect is
possibly associated with the gain or stabilization of H bonds. Peak 2 and 5 showed no
change during the measurements.
It has been shown that millimolar Mg2+ concentrations have the ability to stabilize RNA
tertiary structures (Romer and Hach, 1975; Stein and Crothers, 1976). In order to verify
whether this is also true for armless tRNAs, the effect of magnesium ions to the proton
spectrum of tRNAArg was measured at 10°C and 25°C (Figure 30 B). At 10°C, no significant
difference is measured in presence of 2 mM Mg2+ compared to the spectra at the same
temperature without Mg2+. Also the spectra measured at 25 °C with and without Mg2+ are
similar to each other. Only peak 3 and 4 are increased, suggesting stabilized H bonds. For
the remaining resonances no detectable changes are observed in the presence of Mg2+.
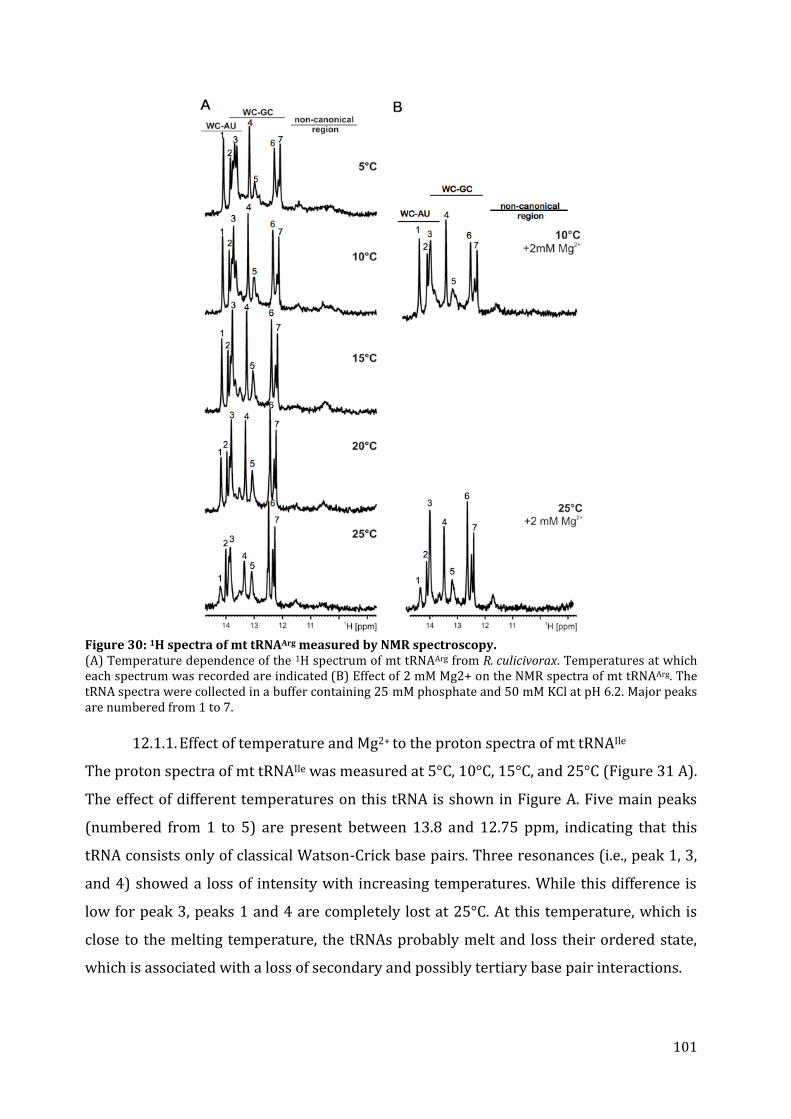
101
Figure 30: 1H spectra of mt tRNAArg measured by NMR spectroscopy. (A) Temperature dependence of the 1H spectrum of mt tRNAArg from R. culicivorax. Temperatures at which each spectrum was recorded are indicated (B) Effect of 2 mM Mg2+ on the NMR spectra of mt tRNAArg. The tRNA spectra were collected in a buffer containing 25 mM phosphate and 50 mM KCl at pH 6.2. Major peaks are numbered from 1 to 7.
12.1.1. Effect of temperature and Mg2+ to the proton spectra of mt tRNAIle
The proton spectra of mt tRNAIle was measured at 5°C, 10°C, 15°C, and 25°C (Figure 31 A).
The effect of different temperatures on this tRNA is shown in Figure A. Five main peaks
(numbered from 1 to 5) are present between 13.8 and 12.75 ppm, indicating that this
tRNA consists only of classical Watson-Crick base pairs. Three resonances (i.e., peak 1, 3,
and 4) showed a loss of intensity with increasing temperatures. While this difference is
low for peak 3, peaks 1 and 4 are completely lost at 25°C. At this temperature, which is
close to the melting temperature, the tRNAs probably melt and loss their ordered state,
which is associated with a loss of secondary and possibly tertiary base pair interactions.

102
Figure 31: 1H spectra of tRNAIle measured by NMR spectroscopy. (A) Temperature dependence of the 1H spectrum of tRNAIle from R. culicivorax. Temperatures at which each spectrum was recorded are indicated (B) Effect of 2 mM Mg2+ on the NMR spectra of mt tRNAArg. The tRNA spectra were collected in a buffer containing 25 mM phosphate and 50 mM KCl at pH 6.2. Major peaks are numbered from 1 to 5.
In contrast, peak 2 shows an improved resolution at higher temperatures. It seems that
this change has a stabilizing effect to the H bonds associated to this peak. No detectable
changes are observed for peak 5.
After the addition of Mg2+ to a final concentration of 2 mM the proton spectra of mt
tRNAIle was measured at 5°C, 15°C, and 25°C (Figure 31 B). Magnesium has no significant
effect on the structure of mt tRNAIle at low temperature. There are only minor changes
detectable at moderate temperatures compared to the spectra without magnesium. Peaks
2 and 3 are slightly decreased at 15 °C, and peak 5 is slightly increased at 25 °C.
Potentially, magnesium has simultaneously a degrading, and a stabilizing effect on
different H bonds in the tRNA structure represented by these peaks.
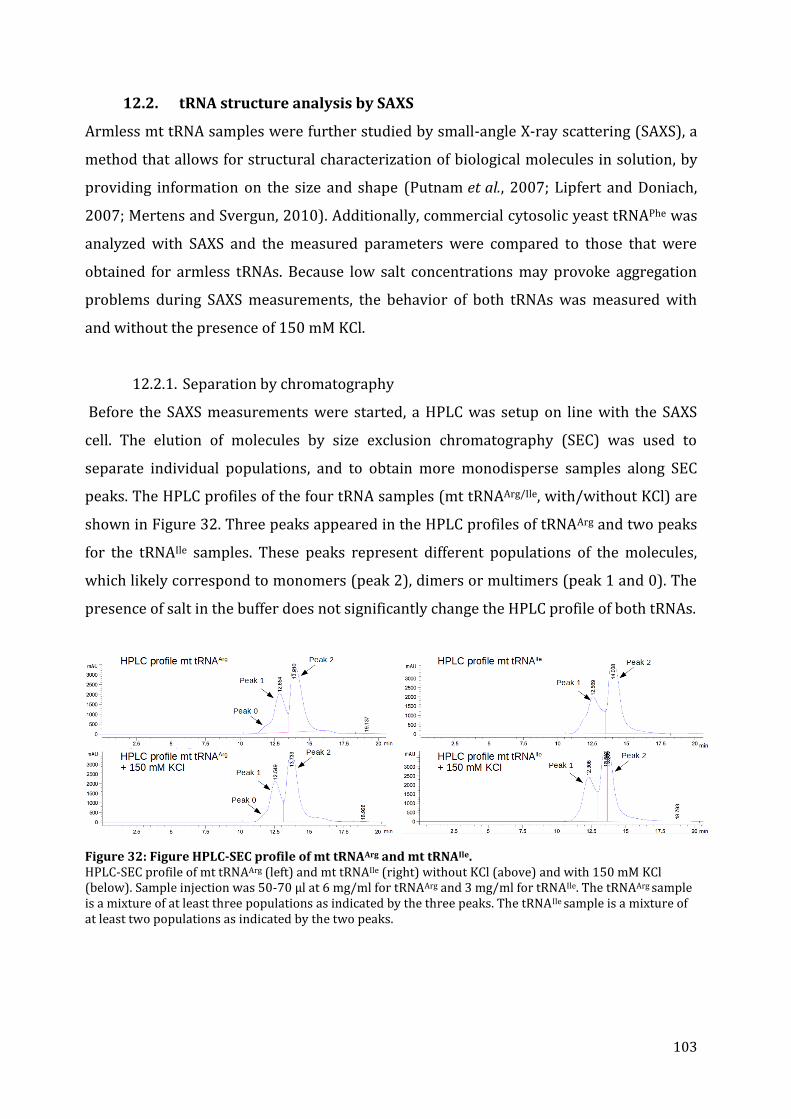
103
12.2. tRNA structure analysis by SAXS
Armless mt tRNA samples were further studied by small-angle X-ray scattering (SAXS), a
method that allows for structural characterization of biological molecules in solution, by
providing information on the size and shape (Putnam et al., 2007; Lipfert and Doniach,
2007; Mertens and Svergun, 2010). Additionally, commercial cytosolic yeast tRNAPhe was
analyzed with SAXS and the measured parameters were compared to those that were
obtained for armless tRNAs. Because low salt concentrations may provoke aggregation
problems during SAXS measurements, the behavior of both tRNAs was measured with
and without the presence of 150 mM KCl.
12.2.1. Separation by chromatography
Before the SAXS measurements were started, a HPLC was setup on line with the SAXS
cell. The elution of molecules by size exclusion chromatography (SEC) was used to
separate individual populations, and to obtain more monodisperse samples along SEC
peaks. The HPLC profiles of the four tRNA samples (mt tRNAArg/Ile, with/without KCl) are
shown in Figure 32. Three peaks appeared in the HPLC profiles of tRNAArg and two peaks
for the tRNAIle samples. These peaks represent different populations of the molecules,
which likely correspond to monomers (peak 2), dimers or multimers (peak 1 and 0). The
presence of salt in the buffer does not significantly change the HPLC profile of both tRNAs.
Figure 32: Figure HPLC-SEC profile of mt tRNAArg and mt tRNAIle. HPLC-SEC profile of mt tRNAArg (left) and mt tRNAIle (right) without KCl (above) and with 150 mM KCl (below). Sample injection was 50-70 µl at 6 mg/ml for tRNAArg and 3 mg/ml for tRNAIle. The tRNAArg sample is a mixture of at least three populations as indicated by the three peaks. The tRNAIle sample is a mixture of at least two populations as indicated by the two peaks.
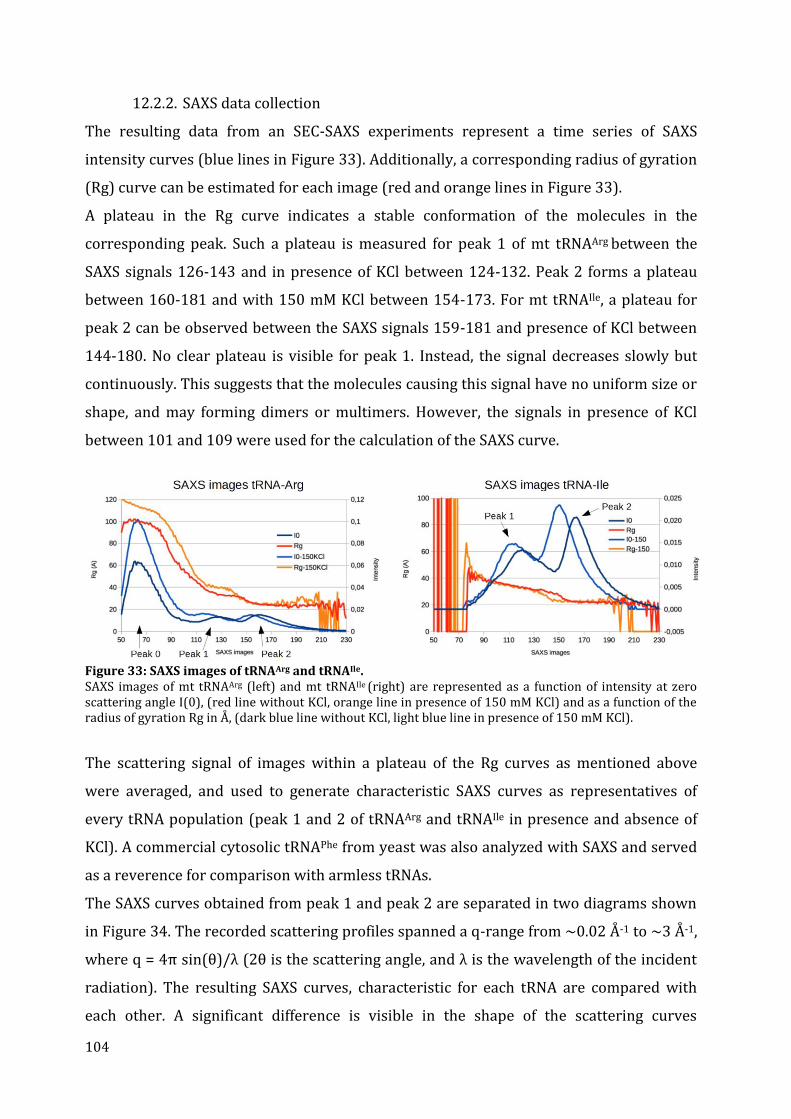
104
12.2.2. SAXS data collection
The resulting data from an SEC-SAXS experiments represent a time series of SAXS
intensity curves (blue lines in Figure 33). Additionally, a corresponding radius of gyration
(Rg) curve can be estimated for each image (red and orange lines in Figure 33).
A plateau in the Rg curve indicates a stable conformation of the molecules in the
corresponding peak. Such a plateau is measured for peak 1 of mt tRNAArg between the
SAXS signals 126-143 and in presence of KCl between 124-132. Peak 2 forms a plateau
between 160-181 and with 150 mM KCl between 154-173. For mt tRNAIle, a plateau for
peak 2 can be observed between the SAXS signals 159-181 and presence of KCl between
144-180. No clear plateau is visible for peak 1. Instead, the signal decreases slowly but
continuously. This suggests that the molecules causing this signal have no uniform size or
shape, and may forming dimers or multimers. However, the signals in presence of KCl
between 101 and 109 were used for the calculation of the SAXS curve.
Figure 33: SAXS images of tRNAArg and tRNAIle. SAXS images of mt tRNAArg (left) and mt tRNAIle (right) are represented as a function of intensity at zero scattering angle I(0), (red line without KCl, orange line in presence of 150 mM KCl) and as a function of the radius of gyration Rg in Å, (dark blue line without KCl, light blue line in presence of 150 mM KCl).
The scattering signal of images within a plateau of the Rg curves as mentioned above
were averaged, and used to generate characteristic SAXS curves as representatives of
every tRNA population (peak 1 and 2 of tRNAArg and tRNAIle in presence and absence of
KCl). A commercial cytosolic tRNAPhe from yeast was also analyzed with SAXS and served
as a reverence for comparison with armless tRNAs.
The SAXS curves obtained from peak 1 and peak 2 are separated in two diagrams shown
in Figure 34. The recorded scattering profiles spanned a q-range from ∼0.02 Å-1 to ∼3 Å-1,
where q = 4π sin(θ)/λ (2θ is the scattering angle, and λ is the wavelength of the incident
radiation). The resulting SAXS curves, characteristic for each tRNA are compared with
each other. A significant difference is visible in the shape of the scattering curves
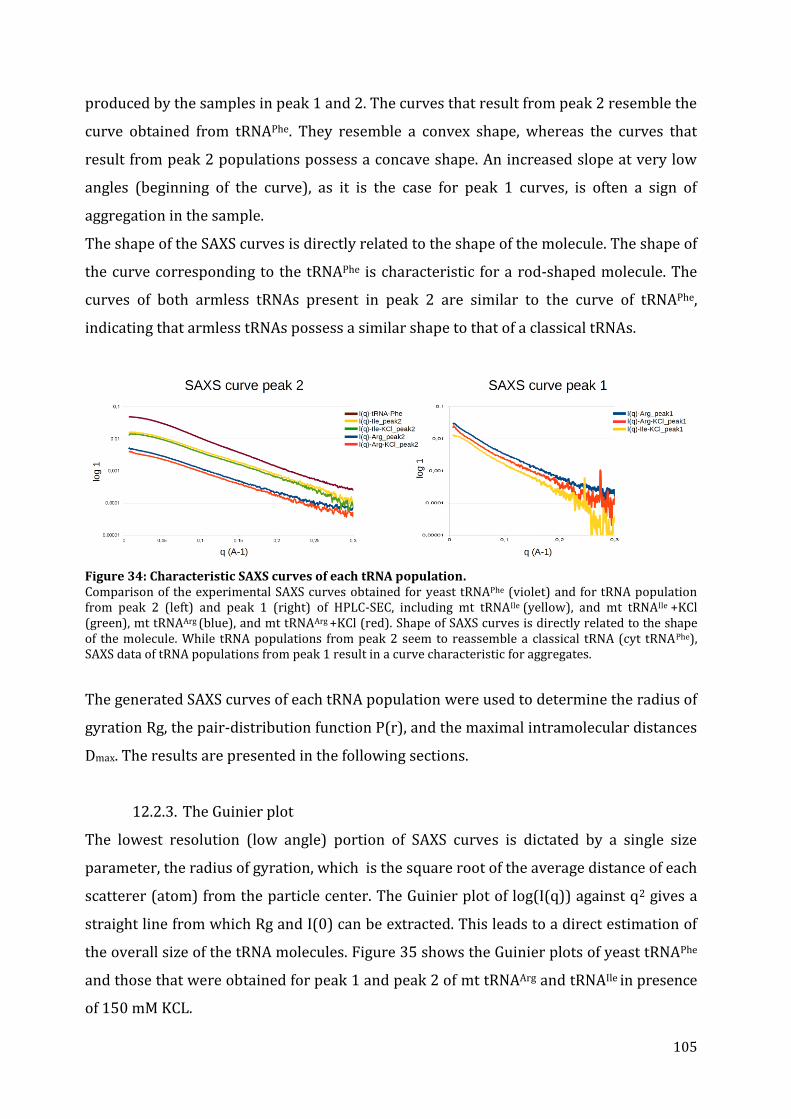
105
produced by the samples in peak 1 and 2. The curves that result from peak 2 resemble the
curve obtained from tRNAPhe. They resemble a convex shape, whereas the curves that
result from peak 2 populations possess a concave shape. An increased slope at very low
angles (beginning of the curve), as it is the case for peak 1 curves, is often a sign of
aggregation in the sample.
The shape of the SAXS curves is directly related to the shape of the molecule. The shape of
the curve corresponding to the tRNAPhe is characteristic for a rod-shaped molecule. The
curves of both armless tRNAs present in peak 2 are similar to the curve of tRNAPhe,
indicating that armless tRNAs possess a similar shape to that of a classical tRNAs.
Figure 34: Characteristic SAXS curves of each tRNA population. Comparison of the experimental SAXS curves obtained for yeast tRNAPhe (violet) and for tRNA population from peak 2 (left) and peak 1 (right) of HPLC-SEC, including mt tRNAIle (yellow), and mt tRNAIle +KCl (green), mt tRNAArg (blue), and mt tRNAArg +KCl (red). Shape of SAXS curves is directly related to the shape of the molecule. While tRNA populations from peak 2 seem to reassemble a classical tRNA (cyt tRNAPhe), SAXS data of tRNA populations from peak 1 result in a curve characteristic for aggregates.
The generated SAXS curves of each tRNA population were used to determine the radius of
gyration Rg, the pair-distribution function P(r), and the maximal intramolecular distances
Dmax. The results are presented in the following sections.
12.2.3. The Guinier plot
The lowest resolution (low angle) portion of SAXS curves is dictated by a single size
parameter, the radius of gyration, which is the square root of the average distance of each
scatterer (atom) from the particle center. The Guinier plot of log(I(q)) against q2 gives a
straight line from which Rg and I(0) can be extracted. This leads to a direct estimation of
the overall size of the tRNA molecules. Figure 35 shows the Guinier plots of yeast tRNAPhe
and those that were obtained for peak 1 and peak 2 of mt tRNAArg and tRNAIle in presence
of 150 mM KCL.
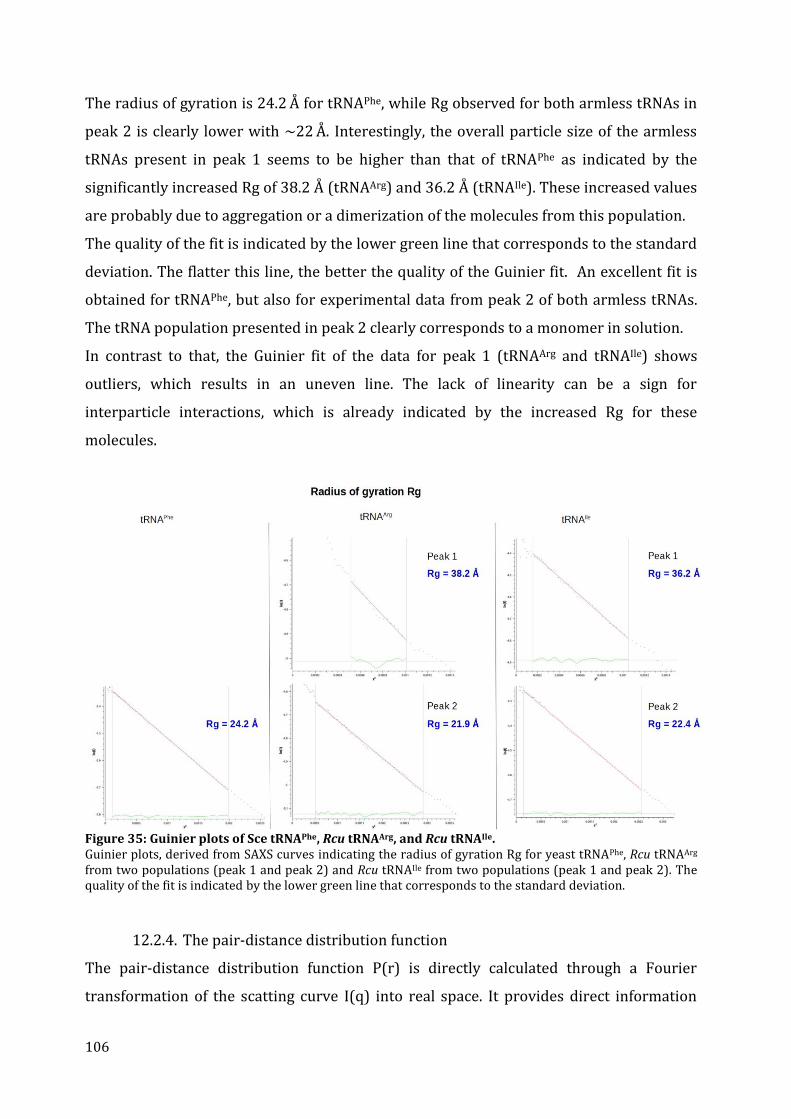
106
The radius of gyration is 24.2 Å for tRNAPhe, while Rg observed for both armless tRNAs in
peak 2 is clearly lower with ~22 Å. Interestingly, the overall particle size of the armless
tRNAs present in peak 1 seems to be higher than that of tRNAPhe as indicated by the
significantly increased Rg of 38.2 Å (tRNAArg) and 36.2 Å (tRNAIle). These increased values
are probably due to aggregation or a dimerization of the molecules from this population.
The quality of the fit is indicated by the lower green line that corresponds to the standard
deviation. The flatter this line, the better the quality of the Guinier fit. An excellent fit is
obtained for tRNAPhe, but also for experimental data from peak 2 of both armless tRNAs.
The tRNA population presented in peak 2 clearly corresponds to a monomer in solution.
In contrast to that, the Guinier fit of the data for peak 1 (tRNAArg and tRNAIle) shows
outliers, which results in an uneven line. The lack of linearity can be a sign for
interparticle interactions, which is already indicated by the increased Rg for these
molecules.
Figure 35: Guinier plots of Sce tRNAPhe, Rcu tRNAArg, and Rcu tRNAIle. Guinier plots, derived from SAXS curves indicating the radius of gyration Rg for yeast tRNAPhe, Rcu tRNAArg from two populations (peak 1 and peak 2) and Rcu tRNAIle from two populations (peak 1 and peak 2). The quality of the fit is indicated by the lower green line that corresponds to the standard deviation.
12.2.4. The pair-distance distribution function
The pair-distance distribution function P(r) is directly calculated through a Fourier
transformation of the scatting curve I(q) into real space. It provides direct information
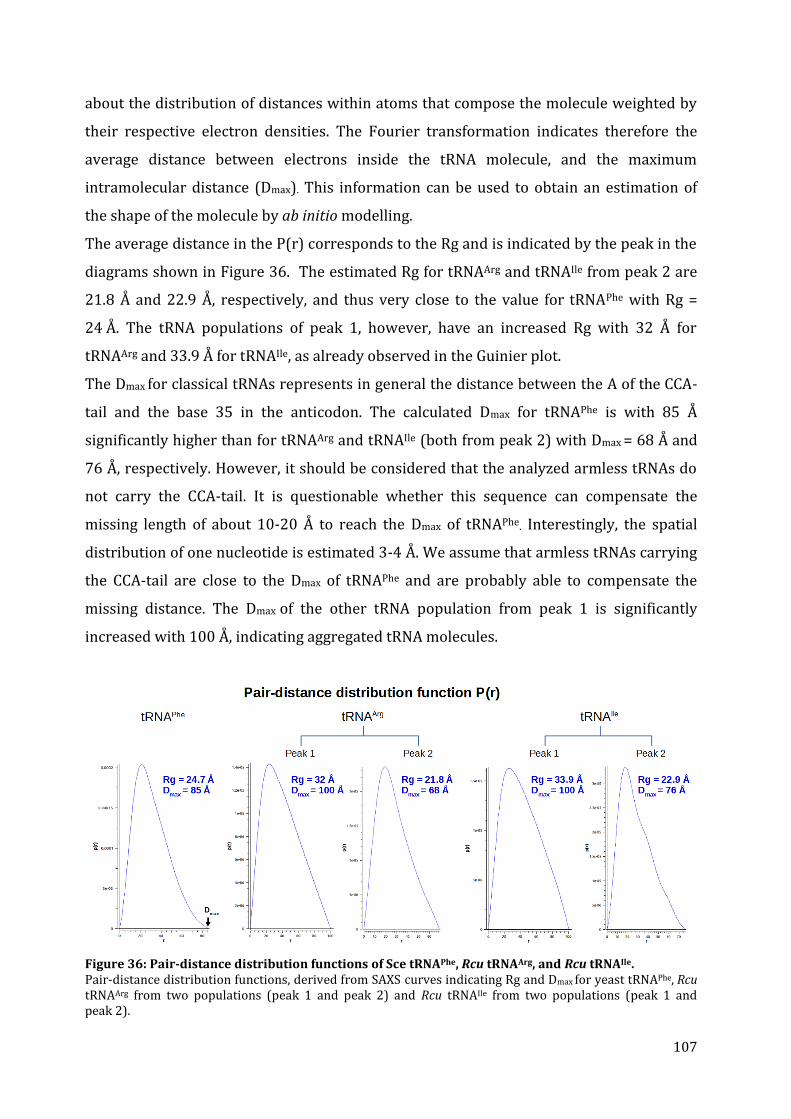
107
about the distribution of distances within atoms that compose the molecule weighted by
their respective electron densities. The Fourier transformation indicates therefore the
average distance between electrons inside the tRNA molecule, and the maximum
intramolecular distance (Dmax). This information can be used to obtain an estimation of
the shape of the molecule by ab initio modelling.
The average distance in the P(r) corresponds to the Rg and is indicated by the peak in the
diagrams shown in Figure 36. The estimated Rg for tRNAArg and tRNAIle from peak 2 are
21.8 Å and 22.9 Å, respectively, and thus very close to the value for tRNAPhe with Rg =
24 Å. The tRNA populations of peak 1, however, have an increased Rg with 32 Å for
tRNAArg and 33.9 Å for tRNAIle, as already observed in the Guinier plot.
The Dmax for classical tRNAs represents in general the distance between the A of the CCA-
tail and the base 35 in the anticodon. The calculated Dmax for tRNAPhe is with 85 Å
significantly higher than for tRNAArg and tRNAIle (both from peak 2) with Dmax = 68 Å and
76 Å, respectively. However, it should be considered that the analyzed armless tRNAs do
not carry the CCA-tail. It is questionable whether this sequence can compensate the
missing length of about 10-20 Å to reach the Dmax of tRNAPhe. Interestingly, the spatial
distribution of one nucleotide is estimated 3-4 Å. We assume that armless tRNAs carrying
the CCA-tail are close to the Dmax of tRNAPhe and are probably able to compensate the
missing distance. The Dmax of the other tRNA population from peak 1 is significantly
increased with 100 Å, indicating aggregated tRNA molecules.
Figure 36: Pair-distance distribution functions of Sce tRNAPhe, Rcu tRNAArg, and Rcu tRNAIle. Pair-distance distribution functions, derived from SAXS curves indicating Rg and Dmax for yeast tRNAPhe, Rcu tRNAArg from two populations (peak 1 and peak 2) and Rcu tRNAIle from two populations (peak 1 and peak 2).
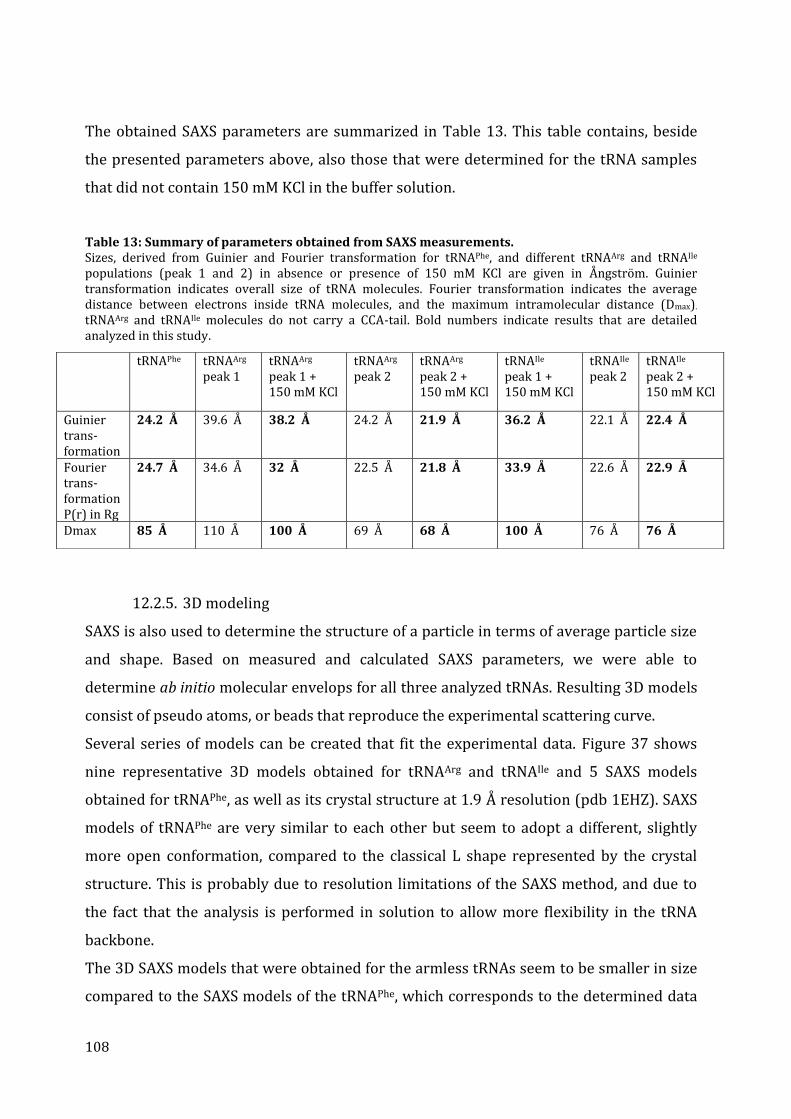
108
The obtained SAXS parameters are summarized in Table 13. This table contains, beside
the presented parameters above, also those that were determined for the tRNA samples
that did not contain 150 mM KCl in the buffer solution.
Table 13: Summary of parameters obtained from SAXS measurements. Sizes, derived from Guinier and Fourier transformation for tRNAPhe, and different tRNAArg and tRNAIle populations (peak 1 and 2) in absence or presence of 150 mM KCl are given in Ångström. Guinier transformation indicates overall size of tRNA molecules. Fourier transformation indicates the average distance between electrons inside tRNA molecules, and the maximum intramolecular distance (Dmax).
tRNAArg and tRNAIle molecules do not carry a CCA-tail. Bold numbers indicate results that are detailed analyzed in this study.
12.2.5. 3D modeling
SAXS is also used to determine the structure of a particle in terms of average particle size
and shape. Based on measured and calculated SAXS parameters, we were able to
determine ab initio molecular envelops for all three analyzed tRNAs. Resulting 3D models
consist of pseudo atoms, or beads that reproduce the experimental scattering curve.
Several series of models can be created that fit the experimental data. Figure 37 shows
nine representative 3D models obtained for tRNAArg and tRNAIle and 5 SAXS models
obtained for tRNAPhe, as well as its crystal structure at 1.9 Å resolution (pdb 1EHZ). SAXS
models of tRNAPhe are very similar to each other but seem to adopt a different, slightly
more open conformation, compared to the classical L shape represented by the crystal
structure. This is probably due to resolution limitations of the SAXS method, and due to
the fact that the analysis is performed in solution to allow more flexibility in the tRNA
backbone.
The 3D SAXS models that were obtained for the armless tRNAs seem to be smaller in size
compared to the SAXS models of the tRNAPhe, which corresponds to the determined data
tRNAPhe tRNAArg peak 1
tRNAArg peak 1 + 150 mM KCl
tRNAArg peak 2
tRNAArg peak 2 + 150 mM KCl
tRNAIle peak 1 + 150 mM KCl
tRNAIle peak 2
tRNAIle peak 2 + 150 mM KCl
Guinier trans-formation
24.2 Å 39.6 Å 38.2 Å 24.2 Å 21.9 Å 36.2 Å 22.1 Å 22.4 Å
Fourier trans-formation P(r) in Rg
24.7 Å 34.6 Å 32 Å 22.5 Å 21.8 Å 33.9 Å 22.6 Å 22.9 Å
Dmax 85 Å 110 Å 100 Å 69 Å 68 Å 100 Å 76 Å 76 Å
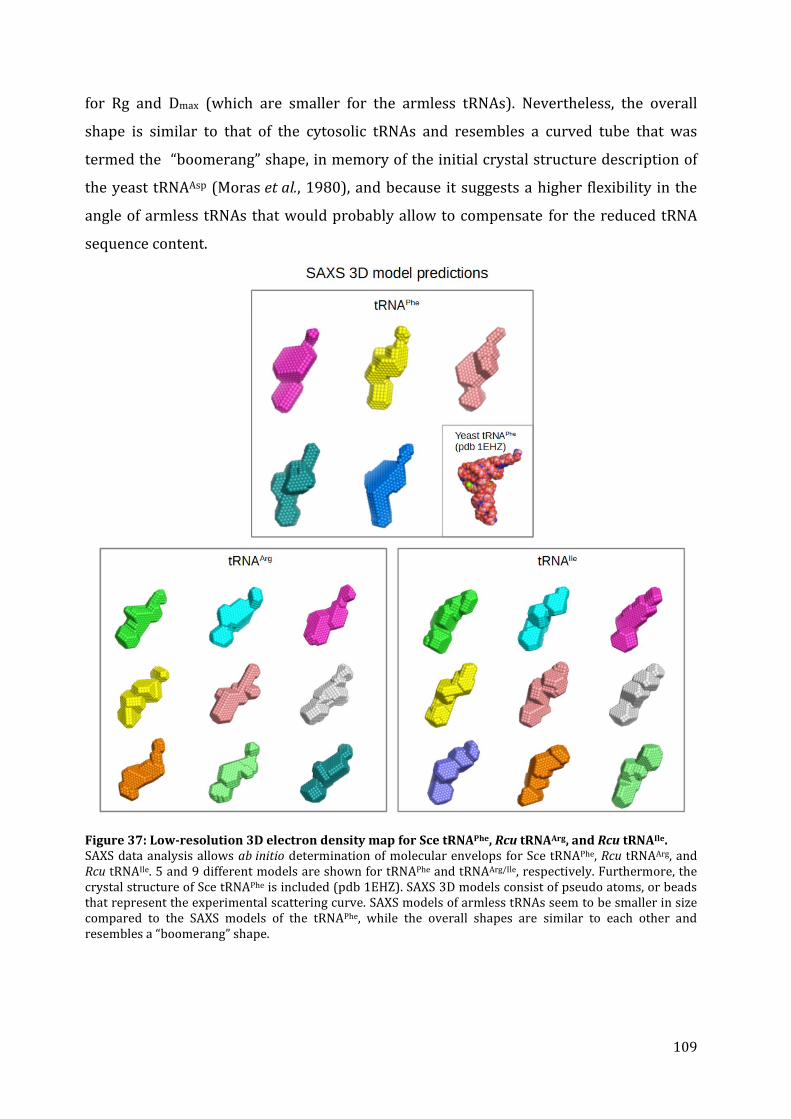
109
for Rg and Dmax (which are smaller for the armless tRNAs). Nevertheless, the overall
shape is similar to that of the cytosolic tRNAs and resembles a curved tube that was
termed the “boomerang” shape, in memory of the initial crystal structure description of
the yeast tRNAAsp (Moras et al., 1980), and because it suggests a higher flexibility in the
angle of armless tRNAs that would probably allow to compensate for the reduced tRNA
sequence content.
Figure 37: Low-resolution 3D electron density map for Sce tRNAPhe, Rcu tRNAArg, and Rcu tRNAIle. SAXS data analysis allows ab initio determination of molecular envelops for Sce tRNAPhe, Rcu tRNAArg, and Rcu tRNAIle. 5 and 9 different models are shown for tRNAPhe and tRNAArg/Ile, respectively. Furthermore, the crystal structure of Sce tRNAPhe is included (pdb 1EHZ). SAXS 3D models consist of pseudo atoms, or beads that represent the experimental scattering curve. SAXS models of armless tRNAs seem to be smaller in size compared to the SAXS models of the tRNAPhe, while the overall shapes are similar to each other and resembles a “boomerang” shape.
110
13. Discussion
Transfer RNAs play a major and essential role in protein biosynthesis. The accuracy of
their functionality is mostly directly correlated with a correct folding into precisely
defined secondary and tertiary structures that are recognized by several proteins. Thus,
the detailed determination of structural features is of high importance for the
understanding of tRNA functions. In a more general sense, RNA folding is important for
any RNA function. Moreover, and per se, RNA folding and 3D organization of RNA
undergoes a very large variety of possibilities, which makes a major difference with DNA
structures. It is thus of interest to explore if very small tRNAs possess unprecedented
folding features or if they are based on already known motifs and features.
The discovery of armless tRNA, missing both, D-and T-arm, leads to the question in which
2D and 3D structure they fold, and whether, despite from their reduced size, they
represent functional molecules that can still be recognized by important interacting
proteins. One aim of this thesis was to elucidate the structural properties of armless
mitochondrial tRNAArg and tRNAIle from the nematode worm R. culicivorax.
13.1. Structural characteristics of in vitro transcribed mt tRNAArg and mt
tRNAIle
Structural properties of in vitro transcribed mt tRNAArg and mt tRNAIle from R. culicivorax
were analyzed using appropriate methods, such as enzymatic and chemical (in-line)
probing to identify secondary structures, and biophysical methods like NMR spectroscopy
and SAXS to identify tertiary interactions, and to analyze the 3D shape of these molecules.
The results of enzymatic structure probing revealed that the cleavage pattern of RNase V1
digestion is mainly specific for regions predicted as double-stranded. The nuclease S1 is
mainly active in the single-stranded regions of the predicted secondary tRNA structures.
Although, a few regions remained undigested or were ambiguously cleaved by this
nuclease, making a complete structural determination of both armless tRNA substrates a
difficult task. Nuclease S1 is known for its partially unspecific cleavage pattern (M. Mörl,
personal communication) Nevertheless, we conclude that the cleavage profile of
enzymatic probing corresponds at least partially to the 2D structure of armless tRNAs
that was predicted by in silico analyses (Wende et al., 2014).
The in-line structure probing approach was used to complete the 2D structure profile of
armless tRNAs for regions that could only ambiguously be resolved by enzymatic probing.

111
This technique uses the natural tendency for RNAs to degrade slowly through a
nucleophilic “in-line” attack of the 2’OH to the phosphorus center (Regulski and Breaker,
2008). The speed of this reaction is strongly dependent on the structural environment of
each RNA linkage: single-stranded RNA degrades faster because of missing of stabilizing
base pair interactions. Interestingly, in-line probing revealed a very detailed and clear
result for secondary structure profiles of both studied mt tRNAs. Exactly three regions
could be determined to be accessible for degradation. These regions correspond perfectly
with single stranded sequence stretches in bulge regions and anticodon loops of the
secondary structure prediction for both mt tRNAs (Wende et al., 2014). In-line probing is
thus preferable to nuclease S1 for the analysis of single-stranded domains.
Surprisingly, no internal tertiary interactions in the bulge regions were detected by this
approach. In general, the 3D structure of classical tRNAs is stabilized by long-range base
pair interactions, and base stacking, especially between D- and T-loop regions (Giegé,
2008). Although both, D-and T-arm, are missing in armless tRNAs, we initially supposed
that specific tertiary interactions would be needed to allow a formation of stable 3D
structures. However, based on our results, this seems not to be the case, which could be
confirmed by NMR spectroscopy (see below).
Another striking observation was that the structures appeared to be stable and robust
under different conditions since no alternative conformations and no unspecific
damage/degradation could be detected, despite their primary composition in favor of
ApU sequences due to high A and U nucleotide content (76 % and 87 % for tRNAArg and
tRNAIle, respectively). Usually, ApU and CpU sequences are preferred cleavage positions in
RNA molecules (Sissler et al., 2008). This high stability of armless tRNAs is a very
particular characteristic compared to other in vitro transcribed mt tRNAs (Sampson and
Uhlenbeck, 1988; Derrick and Horowitz, 1993; Alexandrov et al., 2006; Bhaskaran et al.,
2012), and is further discussed in section 13.2 of this chapter.
Regarding enzymatic and in-line structure probing analysis, we conclude that both, mt
tRNAArg and mt tRNAIle from R. culicivorax form a hairpin-shaped secondary structure.
This includes an internal double bulge replacing both, the D- and T-arm, in the secondary
cloverleaf structure as compared to classical tRNAs. We found no hints for any internal
long-range nucleotide interaction.
112
NMR spectroscopy is a powerful technique to detect tertiary intramolecular interactions
and has been widely applied for structure determination of proteins, DNA, and RNA so far
(Varani et al., 2004). In this study NMR spectroscopy was used for the structural analysis
of Rcu armless mt tRNAArg and mt tRNAIle.
The results of this investigation revealed that all detected resonances corresponding to
nucleotide interactions in both tRNAs were present between 14-12 ppm in the 1H spectra,
corresponding to classical Watson-Crick AU and GC base pair interactions.
Here, again the armless tRNAs show an overall stable conformation even under different
conditions (absence and presence of Mg2+). Mg2+ ions are known to stabilize the tRNA
structure (Draper, 2004). However, this effect could not be observed here because no
significant change in the spectra of both tRNAs (with and without Mg2+) was detected.
Only the change in temperature had an impact on the conformation of the tRNAs. This
was monitored by resonance that disappeared at higher temperatures (20-25°C), which
was close to the calculated melting temperature (Tm=27°C) of both tRNA molecules.
Decreasing resonances correspond to the loss of nucleotide interactions and indicate a
melting effect of the corresponding molecules.
In conclusion, the NMR measurements confirm that the analyzed armless mt tRNAs are
exclusively composed of classical Watson-Crick base pairs forming helices that contribute
to the secondary structure. No signal for long-range base interactions was detectable,
suggesting the absence of internal tertiary interactions in the bulge regions. This absence
is remarkable since such interactions usually stabilize 3D structures of RNAs, and in
particular tRNAs (Westhof and Auffinger, 2001; Giegé et al., 2012).
SAXS was used to measure physical characteristics related to shapes and tertiary
dimensions of classical and armless mt tRNAs. This method allows to compare
determined physical parameters as well as calculated 3D shapes representing molecular
envelopes with the features of classical tRNAs. The results of the size exclusion
chromatography (SEC-)SAXS experiments revealed the existence of different tRNA
populations (three for tRNAArg, and two for tRNAIle). The SAXS parameters Rg, P(r), and
Dmax determined for each population indicate that they correspond to tRNA monomers
(peak 2) and to tRNA dimers or multimers (peak 0 and 1). tRNA aggregates are
characterized by significantly increased values for the determined parameters.
113
For comparison with the classical tRNAPhe only the values obtained for the monomeric
tRNA populations were used. The overall size (Rg) derived from the Guinier
transformation and the pair–distribution function for armless tRNA molecules is slightly
lower compared to tRNAPhe indicating a more compact shape of armless mt tRNAs
compared to the classical tRNA.
Another interesting result represents the determination of Dmax of the tRNA molecules.
The Dmax calculated by SAXS for tRNAPhe was 85 Å. This is significantly increased compared
to the Dmax of 75 Å that can be determined for the crystal structure of the same tRNA. This
raises the question, how this difference can be explained? The distance between the ends
of the two arms is usually 75 Å, and corresponds to the distance between phosphates 76
and 34 in the crystal structure of yeast tRNAPhe, which adopts an L-shape with an angle of
90° (pdb 1EHZ) (Shi and Moore, 2000). Indeed, it has been demonstrated that the tRNAPhe
core can exhibit higher intrinsic flexibility in solution (Friederich et al., 1998). We suggest
that Dmax effectively reflects the opening of the angle of this tRNA molecule, which is
probably more important in solution than in a crystal, which selects a priori a more stable
form. We suggest a similar intrinsic flexibility for armless tRNAs, which concerns mainly
the hinge of these molecules. The presence of many A/U nucleotides, and the
simultaneous absence of nucleotide interactions within the bulge regions support this
hypothesis.
The maximal distances determined for armless tRNAs seem extremely small with 68 Å
and 76 Å compared to tRNAPhe (Dmax=85 Å). However, it should be considered that in
contrast to tRNAPhe, armless tRNA transcripts do not carry a CCA-tail. Since the size of an
individual nucleotide is approximately 3-4 Å, the maximal distance of armless tRNAs
could be extended theoretically by approximately 10 Å. This hypothesis has to be
confirmed by SAXS analysis of armless tRNAs carrying the CCA-tail. If we consider an
increased intrinsic flexibility for armless tRNAs with a CCA-tail, the maximum size of
these molecules in solution would be comparable to that of classical tRNAs. These
molecules are probably no longer restricted to the typical L-shape, but possess a more
relaxed form that is more likely to correspond to a boomerang-shaped structure. We
suppose that this characteristic intrinsic flexibility of armless tRNAs allows interactions
with important partner proteins, and preserves therefore tRNA biosynthesis and protein
translation processes in nematode mitochondria.
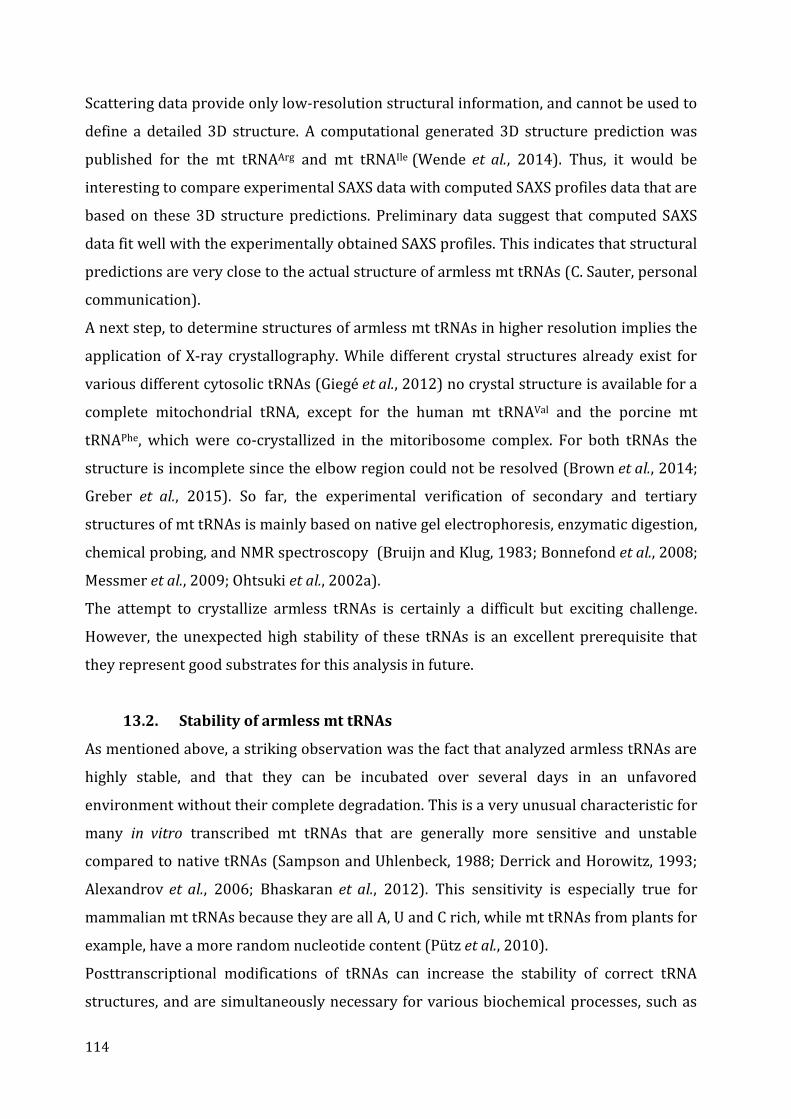
114
Scattering data provide only low-resolution structural information, and cannot be used to
define a detailed 3D structure. A computational generated 3D structure prediction was
published for the mt tRNAArg and mt tRNAIle (Wende et al., 2014). Thus, it would be
interesting to compare experimental SAXS data with computed SAXS profiles data that are
based on these 3D structure predictions. Preliminary data suggest that computed SAXS
data fit well with the experimentally obtained SAXS profiles. This indicates that structural
predictions are very close to the actual structure of armless mt tRNAs (C. Sauter, personal
communication).
A next step, to determine structures of armless mt tRNAs in higher resolution implies the
application of X-ray crystallography. While different crystal structures already exist for
various different cytosolic tRNAs (Giegé et al., 2012) no crystal structure is available for a
complete mitochondrial tRNA, except for the human mt tRNAVal and the porcine mt
tRNAPhe, which were co-crystallized in the mitoribosome complex. For both tRNAs the
structure is incomplete since the elbow region could not be resolved (Brown et al., 2014;
Greber et al., 2015). So far, the experimental verification of secondary and tertiary
structures of mt tRNAs is mainly based on native gel electrophoresis, enzymatic digestion,
chemical probing, and NMR spectroscopy (Bruijn and Klug, 1983; Bonnefond et al., 2008;
Messmer et al., 2009; Ohtsuki et al., 2002a).
The attempt to crystallize armless tRNAs is certainly a difficult but exciting challenge.
However, the unexpected high stability of these tRNAs is an excellent prerequisite that
they represent good substrates for this analysis in future.
13.2. Stability of armless mt tRNAs
As mentioned above, a striking observation was the fact that analyzed armless tRNAs are
highly stable, and that they can be incubated over several days in an unfavored
environment without their complete degradation. This is a very unusual characteristic for
many in vitro transcribed mt tRNAs that are generally more sensitive and unstable
compared to native tRNAs (Sampson and Uhlenbeck, 1988; Derrick and Horowitz, 1993;
Alexandrov et al., 2006; Bhaskaran et al., 2012). This sensitivity is especially true for
mammalian mt tRNAs because they are all A, U and C rich, while mt tRNAs from plants for
example, have a more random nucleotide content (Pütz et al., 2010).
Posttranscriptional modifications of tRNAs can increase the stability of correct tRNA
structures, and are simultaneously necessary for various biochemical processes, such as
115
an accurate translation and a correct processing of tRNAs (Kirino and Suzuki, 2005; Helm,
2006). Many mt tRNAs exhibit several different modifications, which seem to be of great
importance (Suzuki and Suzuki, 2014). For the nematode A. suum, e.g., it has been shown
that the modification m1A9 is indispensable for the structure and function of most mt
tRNAs (Sakurai et al., 2005). Furthermore, for mt tRNAArg, additional modifications have
been detected, e.g., m1A8, Ψ22, 26, 29, 35, Ψ(U)35, 51, and m1G34 (Suzuki and Suzuki, 2014).
Several modifications have also been determined for mt tRNAIle. For example, the bovine
mt tRNAIle includes, among others, modifications at positions m1G9, m22G26, Ψ27, t6A37, and
m1A58 (Watanabe et al., 1997)(Figure 38).
Figure 38: Modified nucleotides in 2D structure of A. suum mt tRNAArg and B. taurus mt tRNAIle. (A) Post-transcriptional modifications of A. suum mt tRNAArg. The positions of modified nucleotides m1A, m1G, m22G, and Ψ are indicated. Letters in parentheses indicate residues partially modified. (B) Post-transcriptional modifications of bovine mt tRNAIle. Newly identified modified bases are represented in bold type. The positions of modified nucleotides m1A, m1G, m22G, t6A, and Ψ are indicated (modified from Watanabe et al., 1997; Suzuki and Suzuki, 2014).
It would be interesting to verify whether armless mt tRNAs are also modified in vivo in
R. culicivorax and if so, whether these modifications have an influence on the structure
and stability of the tRNA transcript and their structures.
13.3. Evolution of armless mt tRNAs
The motivation to study characteristic structural and functional features of armless mt
tRNAs from R. culicivorax was based on the previous findings regarding the degeneracy of
mt tRNA genes (Jühling et al., 2012a). In general, most animal mt tRNAs, possess some
special features compared to cytosolic tRNAs. They have shortened loop sequences and
stem sequences, and structural domains are less conserved. A very prominent example is
116
the mt tRNASer that is lacking the complete D-arm in most animal mitochondria. During
the recent years, other mt tRNAs with extremely truncated sequences have been
identified also in other animal lineages. Even complete set of all mt tRNAs to be truncated
tRNAs were identified, especially in molluscs, arthropods, and nematodes, which exhibit
mt tRNAs with the most extreme reduction of tRNA gene sizes (Yamazaki et al., 1997;
Masta, 2000; Wolstenholme et al., 1987; Jühling et al., 2012b).
The high diversity of mt tRNA genes led to the conclusion that armless mt tRNAs seem not
to be an exception only, but are actually the general rule for many organism (Jühling et al.,
2012b). The observation that truncated mt tRNA genes are very conserved in many
organisms throughout different animal lineages led to the consideration to accept
“bizarre” tRNAs as “normal” situation.
The discovery of these reduced tRNA sequences (which is in many studies still based on
computational predictions only) raises the question, where (i.e., in which animal linages),
how, and why armless mt tRNAs did arise during evolution. It is still a challenging task to
give a complete and satisfying answer to these questions. Theories about mt tRNA
evolution are very complex. However, it was shown that the evolution of mt tRNAs is also
highly dependent on evolutionary aspects of the organisms. This may explain the high
diversity of sequences and structures, e.g., when comparing plant and animal mt tRNAs
(Salinas-Giegé et al., 2015).
However, the answer whether reduced mt tRNA sequences appear only in phylogenetic
niches (such as extremely truncated mt tRNAs that have been identified only in
nematodes and arthropods, so far) or also in other species will surely soon be better
understood thanks to the incredible improvement of sequencing and bioinformatics tools.
This will led to an increased availability of mitochondrial genome sequences, and thus to
an improved identification of maybe even unknown tRNA structures. Since extremely
reduced mt tRNAs have only been discovered in the last few years, it is very likely that
more and more truncated tRNAs will be found in the near future, maybe even in
organisms that have already been studied, but in which no complete set of mt tRNA genes
could be identified yet.
The tRNA degeneracy is highly interesting in the context of adaptation and co-evolution
partner proteins. During tRNA biosynthesis, tRNAs have to be recognized by a variety of
proteins, such as maturation enzymes, modification enzymes, aminoacyl-tRNA
117
synthetases, elongation factors, and ribosomes. The flexibility of the interplay between
tRNAs and their interacting partner proteins is probably one factor for the occurrence of
armless tRNAs. If partner proteins had not evolved the ability to compensate for the RNA,
the prerequisite that would have favored the evolution of armless tRNAs would not exist.
However, this process is certainly the result of co-evolutional events between both, mt
tRNAs and partner proteins. Hereby, tRNA structures are probably mostly governed by
enzymes that have to recognize all tRNAs at once (e.g., CCA-adding enzymes, elongation
factors, and ribosomes), and not by enzymes that interact only with one or a subset of
tRNAs (e.g., aminoacyl-tRNA synthetase) (Watanabe et al., 2014). It could already be
shown that two nuclear encoded EF-Tu homologs exist in nematode mitochondria. They
are specialized to D-arm or T-arm lacking mt tRNAs thanks to a C-terminal extensions
(Ohtsuki and Watanabe, 2007; Watanabe et al., 2014). Another example are enlarged
proteins that compensate for reduced 12S and 16S rRNA sequences in mammalian
mitoribosomes (Mears et al., 2002; Sharma et al., 2003). The different mode of
compensation of interacting proteins may represent one explanation why truncated mt
tRNAs have evolved, but further investigations are still needed to better understand the
exact binding and recognition between armless mt tRNAs and their co-evolved partner
proteins (Fujishima and Kanai, 2014).
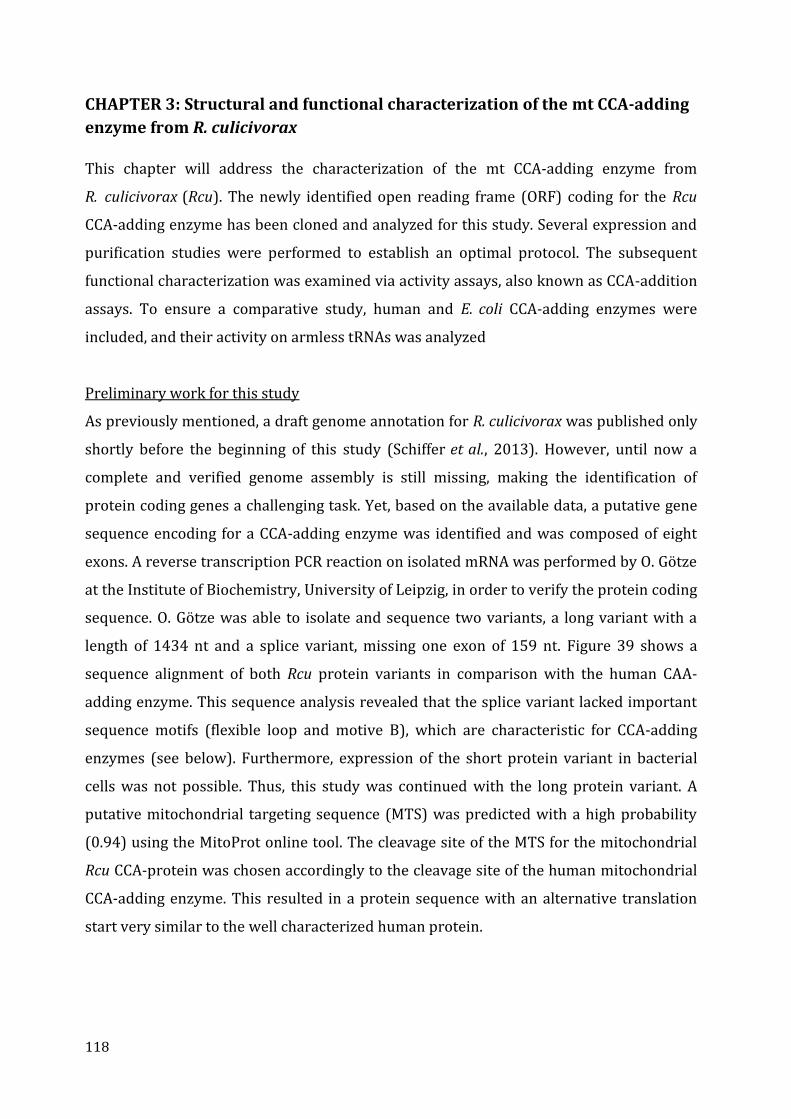
118
CHAPTER 3: Structural and functional characterization of the mt CCA-adding
enzyme from R. culicivorax
This chapter will address the characterization of the mt CCA-adding enzyme from
R. culicivorax (Rcu). The newly identified open reading frame (ORF) coding for the Rcu
CCA-adding enzyme has been cloned and analyzed for this study. Several expression and
purification studies were performed to establish an optimal protocol. The subsequent
functional characterization was examined via activity assays, also known as CCA-addition
assays. To ensure a comparative study, human and E. coli CCA-adding enzymes were
included, and their activity on armless tRNAs was analyzed
Preliminary work for this study
As previously mentioned, a draft genome annotation for R. culicivorax was published only
shortly before the beginning of this study (Schiffer et al., 2013). However, until now a
complete and verified genome assembly is still missing, making the identification of
protein coding genes a challenging task. Yet, based on the available data, a putative gene
sequence encoding for a CCA-adding enzyme was identified and was composed of eight
exons. A reverse transcription PCR reaction on isolated mRNA was performed by O. Götze
at the Institute of Biochemistry, University of Leipzig, in order to verify the protein coding
sequence. O. Götze was able to isolate and sequence two variants, a long variant with a
length of 1434 nt and a splice variant, missing one exon of 159 nt. Figure 39 shows a
sequence alignment of both Rcu protein variants in comparison with the human CAA-
adding enzyme. This sequence analysis revealed that the splice variant lacked important
sequence motifs (flexible loop and motive B), which are characteristic for CCA-adding
enzymes (see below). Furthermore, expression of the short protein variant in bacterial
cells was not possible. Thus, this study was continued with the long protein variant. A
putative mitochondrial targeting sequence (MTS) was predicted with a high probability
(0.94) using the MitoProt online tool. The cleavage site of the MTS for the mitochondrial
Rcu CCA-protein was chosen accordingly to the cleavage site of the human mitochondrial
CCA-adding enzyme. This resulted in a protein sequence with an alternative translation
start very similar to the well characterized human protein.
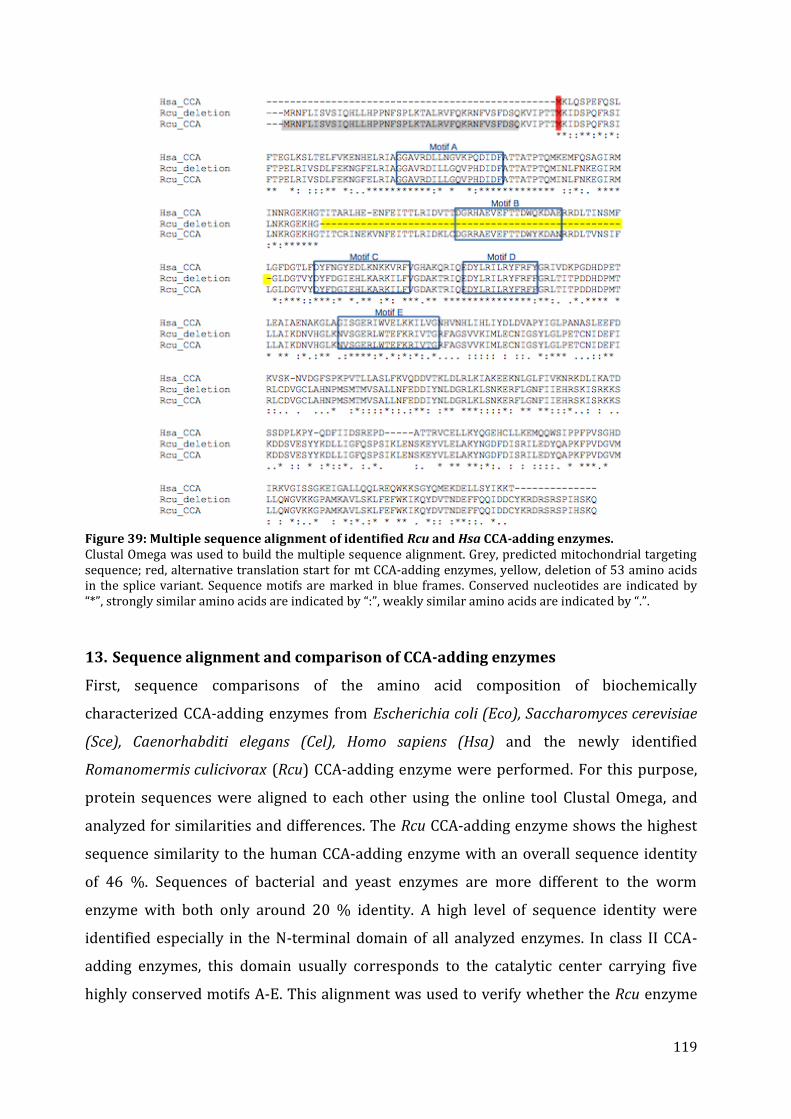
119
Figure 39: Multiple sequence alignment of identified Rcu and Hsa CCA-adding enzymes. Clustal Omega was used to build the multiple sequence alignment. Grey, predicted mitochondrial targeting sequence; red, alternative translation start for mt CCA-adding enzymes, yellow, deletion of 53 amino acids in the splice variant. Sequence motifs are marked in blue frames. Conserved nucleotides are indicated by “*”, strongly similar amino acids are indicated by “:”, weakly similar amino acids are indicated by “.”.
13. Sequence alignment and comparison of CCA-adding enzymes
First, sequence comparisons of the amino acid composition of biochemically
characterized CCA-adding enzymes from Escherichia coli (Eco), Saccharomyces cerevisiae
(Sce), Caenorhabditi elegans (Cel), Homo sapiens (Hsa) and the newly identified
Romanomermis culicivorax (Rcu) CCA-adding enzyme were performed. For this purpose,
protein sequences were aligned to each other using the online tool Clustal Omega, and
analyzed for similarities and differences. The Rcu CCA-adding enzyme shows the highest
sequence similarity to the human CCA-adding enzyme with an overall sequence identity
of 46 %. Sequences of bacterial and yeast enzymes are more different to the worm
enzyme with both only around 20 % identity. A high level of sequence identity were
identified especially in the N-terminal domain of all analyzed enzymes. In class II CCA-
adding enzymes, this domain usually corresponds to the catalytic center carrying five
highly conserved motifs A-E. This alignment was used to verify whether the Rcu enzyme
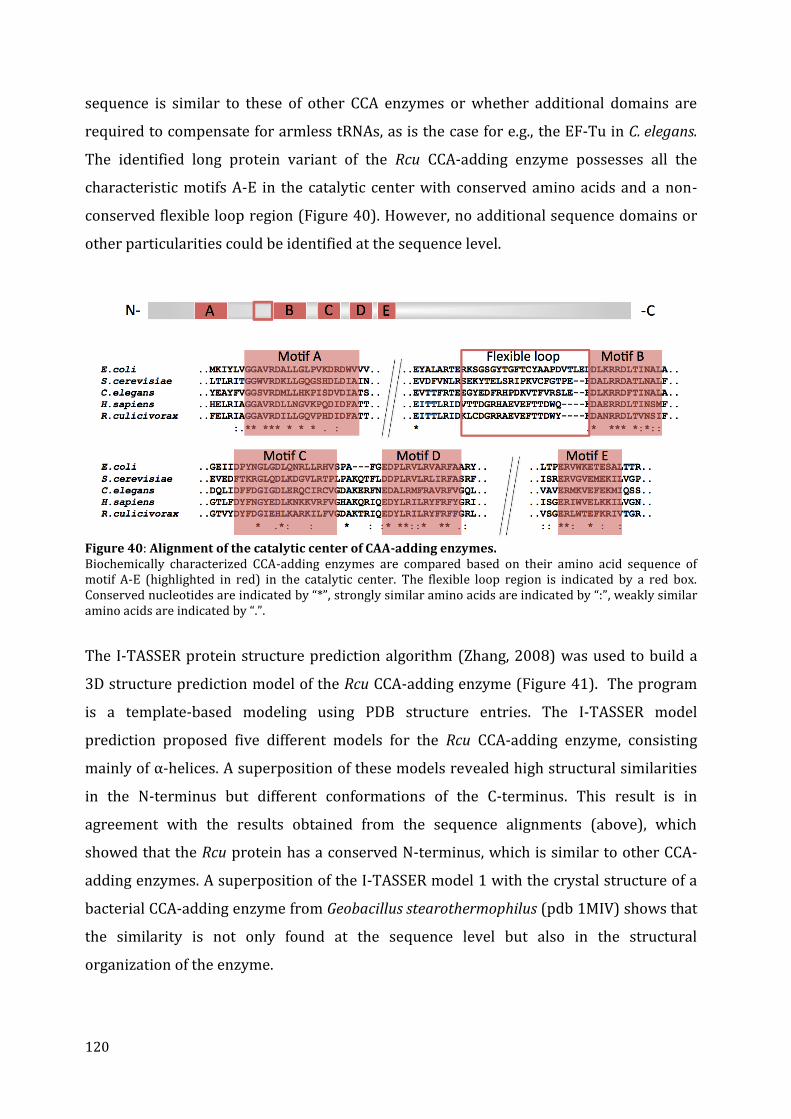
120
sequence is similar to these of other CCA enzymes or whether additional domains are
required to compensate for armless tRNAs, as is the case for e.g., the EF-Tu in C. elegans.
The identified long protein variant of the Rcu CCA-adding enzyme possesses all the
characteristic motifs A-E in the catalytic center with conserved amino acids and a non-
conserved flexible loop region (Figure 40). However, no additional sequence domains or
other particularities could be identified at the sequence level.
Figure 40: Alignment of the catalytic center of CAA-adding enzymes. Biochemically characterized CCA-adding enzymes are compared based on their amino acid sequence of motif A-E (highlighted in red) in the catalytic center. The flexible loop region is indicated by a red box. Conserved nucleotides are indicated by “*”, strongly similar amino acids are indicated by “:”, weakly similar amino acids are indicated by “.”.
The I-TASSER protein structure prediction algorithm (Zhang, 2008) was used to build a
3D structure prediction model of the Rcu CCA-adding enzyme (Figure 41). The program
is a template-based modeling using PDB structure entries. The I-TASSER model
prediction proposed five different models for the Rcu CCA-adding enzyme, consisting
mainly of α-helices. A superposition of these models revealed high structural similarities
in the N-terminus but different conformations of the C-terminus. This result is in
agreement with the results obtained from the sequence alignments (above), which
showed that the Rcu protein has a conserved N-terminus, which is similar to other CCA-
adding enzymes. A superposition of the I-TASSER model 1 with the crystal structure of a
bacterial CCA-adding enzyme from Geobacillus stearothermophilus (pdb 1MIV) shows that
the similarity is not only found at the sequence level but also in the structural
organization of the enzyme.
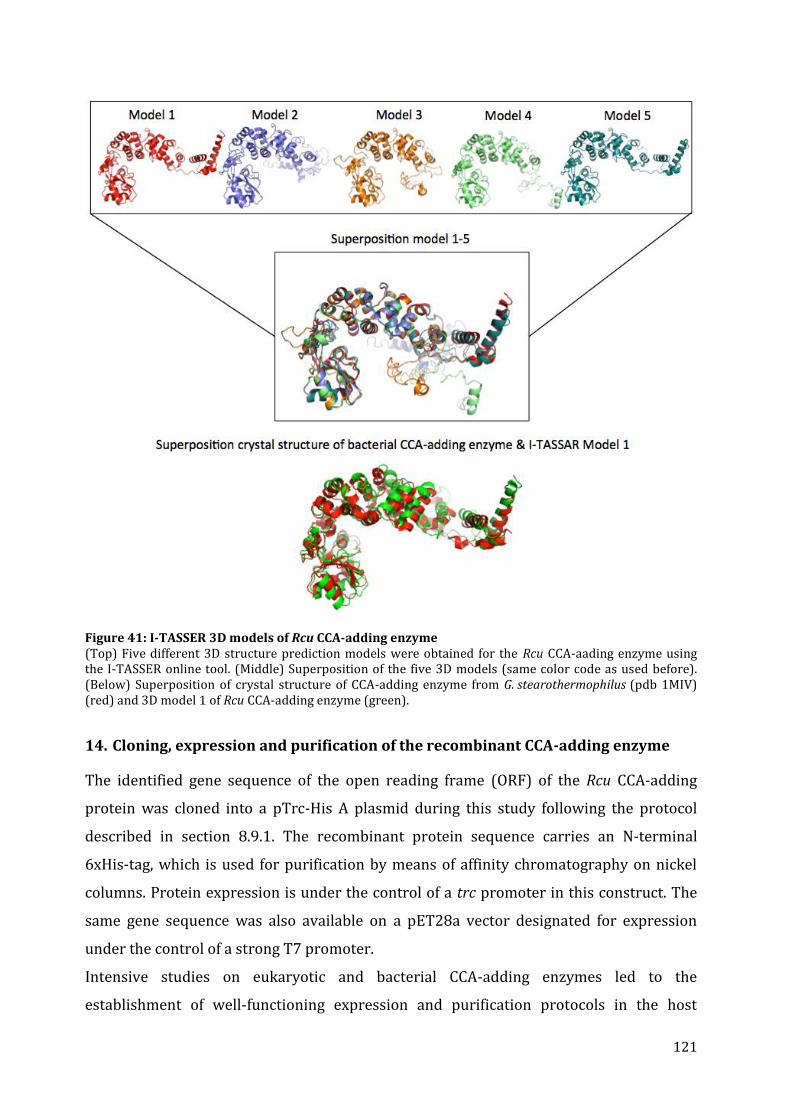
121
Figure 41: I-TASSER 3D models of Rcu CCA-adding enzyme (Top) Five different 3D structure prediction models were obtained for the Rcu CCA-aading enzyme using the I-TASSER online tool. (Middle) Superposition of the five 3D models (same color code as used before). (Below) Superposition of crystal structure of CCA-adding enzyme from G. stearothermophilus (pdb 1MIV) (red) and 3D model 1 of Rcu CCA-adding enzyme (green).
14. Cloning, expression and purification of the recombinant CCA-adding enzyme
The identified gene sequence of the open reading frame (ORF) of the Rcu CCA-adding
protein was cloned into a pTrc-His A plasmid during this study following the protocol
described in section 8.9.1. The recombinant protein sequence carries an N-terminal
6xHis-tag, which is used for purification by means of affinity chromatography on nickel
columns. Protein expression is under the control of a trc promoter in this construct. The
same gene sequence was also available on a pET28a vector designated for expression
under the control of a strong T7 promoter.
Intensive studies on eukaryotic and bacterial CCA-adding enzymes led to the
establishment of well-functioning expression and purification protocols in the host
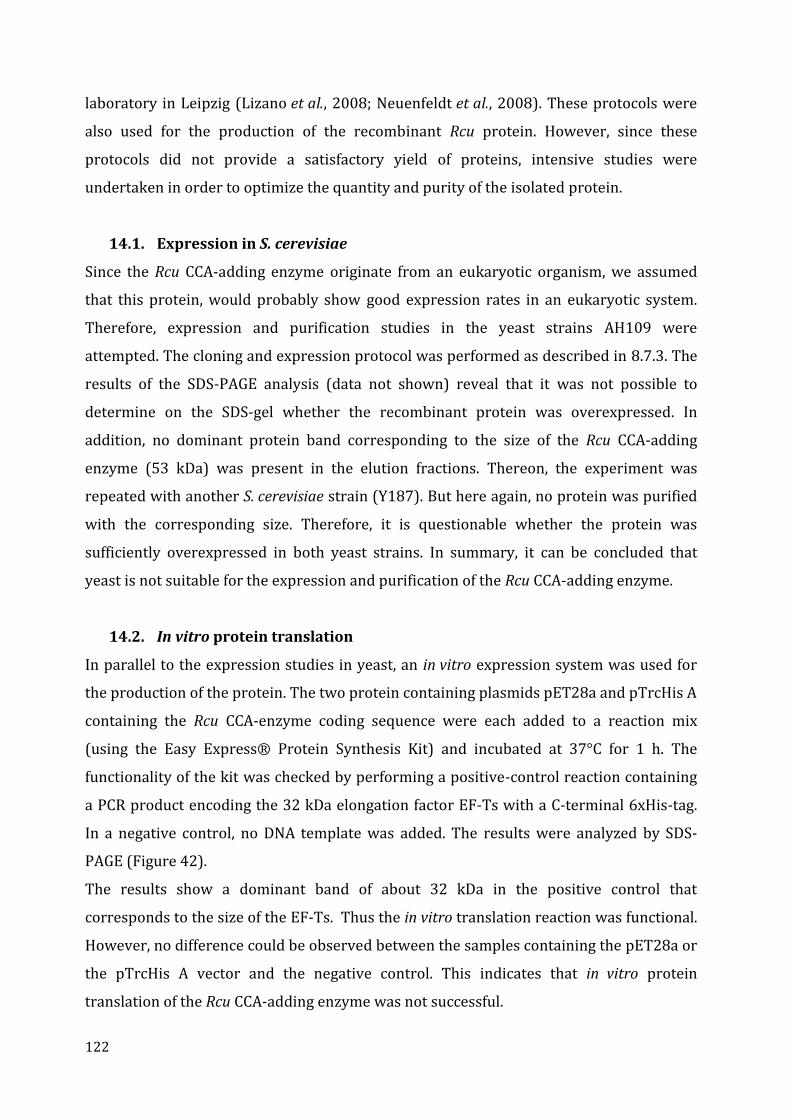
122
laboratory in Leipzig (Lizano et al., 2008; Neuenfeldt et al., 2008). These protocols were
also used for the production of the recombinant Rcu protein. However, since these
protocols did not provide a satisfactory yield of proteins, intensive studies were
undertaken in order to optimize the quantity and purity of the isolated protein.
14.1. Expression in S. cerevisiae
Since the Rcu CCA-adding enzyme originate from an eukaryotic organism, we assumed
that this protein, would probably show good expression rates in an eukaryotic system.
Therefore, expression and purification studies in the yeast strains AH109 were
attempted. The cloning and expression protocol was performed as described in 8.7.3. The
results of the SDS-PAGE analysis (data not shown) reveal that it was not possible to
determine on the SDS-gel whether the recombinant protein was overexpressed. In
addition, no dominant protein band corresponding to the size of the Rcu CCA-adding
enzyme (53 kDa) was present in the elution fractions. Thereon, the experiment was
repeated with another S. cerevisiae strain (Y187). But here again, no protein was purified
with the corresponding size. Therefore, it is questionable whether the protein was
sufficiently overexpressed in both yeast strains. In summary, it can be concluded that
yeast is not suitable for the expression and purification of the Rcu CCA-adding enzyme.
14.2. In vitro protein translation
In parallel to the expression studies in yeast, an in vitro expression system was used for
the production of the protein. The two protein containing plasmids pET28a and pTrcHis A
containing the Rcu CCA-enzyme coding sequence were each added to a reaction mix
(using the Easy Express® Protein Synthesis Kit) and incubated at 37°C for 1 h. The
functionality of the kit was checked by performing a positive-control reaction containing
a PCR product encoding the 32 kDa elongation factor EF-Ts with a C-terminal 6xHis-tag.
In a negative control, no DNA template was added. The results were analyzed by SDS-
PAGE (Figure 42).
The results show a dominant band of about 32 kDa in the positive control that
corresponds to the size of the EF-Ts. Thus the in vitro translation reaction was functional.
However, no difference could be observed between the samples containing the pET28a or
the pTrcHis A vector and the negative control. This indicates that in vitro protein
translation of the Rcu CCA-adding enzyme was not successful.
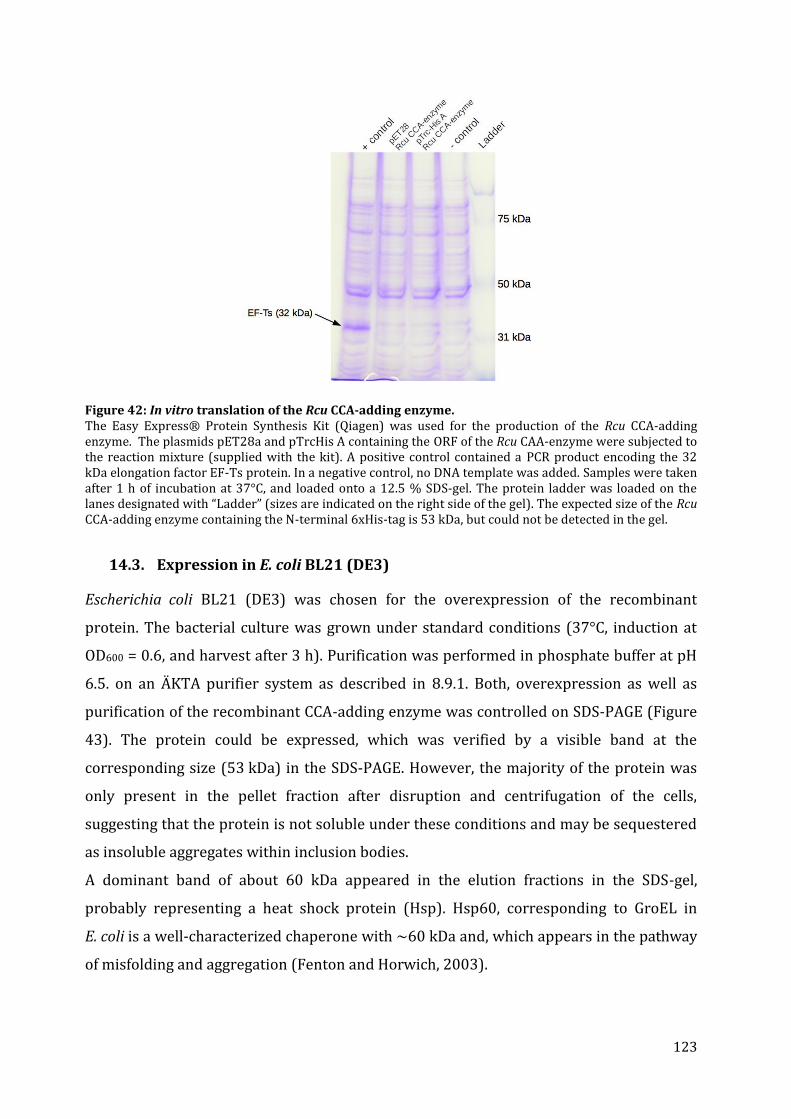
123
Figure 42: In vitro translation of the Rcu CCA-adding enzyme. The Easy Express® Protein Synthesis Kit (Qiagen) was used for the production of the Rcu CCA-adding enzyme. The plasmids pET28a and pTrcHis A containing the ORF of the Rcu CAA-enzyme were subjected to the reaction mixture (supplied with the kit). A positive control contained a PCR product encoding the 32 kDa elongation factor EF-Ts protein. In a negative control, no DNA template was added. Samples were taken after 1 h of incubation at 37°C, and loaded onto a 12.5 % SDS-gel. The protein ladder was loaded on the lanes designated with “Ladder” (sizes are indicated on the right side of the gel). The expected size of the Rcu CCA-adding enzyme containing the N-terminal 6xHis-tag is 53 kDa, but could not be detected in the gel.
14.3. Expression in E. coli BL21 (DE3)
Escherichia coli BL21 (DE3) was chosen for the overexpression of the recombinant
protein. The bacterial culture was grown under standard conditions (37°C, induction at
OD600 = 0.6, and harvest after 3 h). Purification was performed in phosphate buffer at pH
6.5. on an ÄKTA purifier system as described in 8.9.1. Both, overexpression as well as
purification of the recombinant CCA-adding enzyme was controlled on SDS-PAGE (Figure
43). The protein could be expressed, which was verified by a visible band at the
corresponding size (53 kDa) in the SDS-PAGE. However, the majority of the protein was
only present in the pellet fraction after disruption and centrifugation of the cells,
suggesting that the protein is not soluble under these conditions and may be sequestered
as insoluble aggregates within inclusion bodies.
A dominant band of about 60 kDa appeared in the elution fractions in the SDS-gel,
probably representing a heat shock protein (Hsp). Hsp60, corresponding to GroEL in
E. coli is a well-characterized chaperone with ~60 kDa and, which appears in the pathway
of misfolding and aggregation (Fenton and Horwich, 2003).
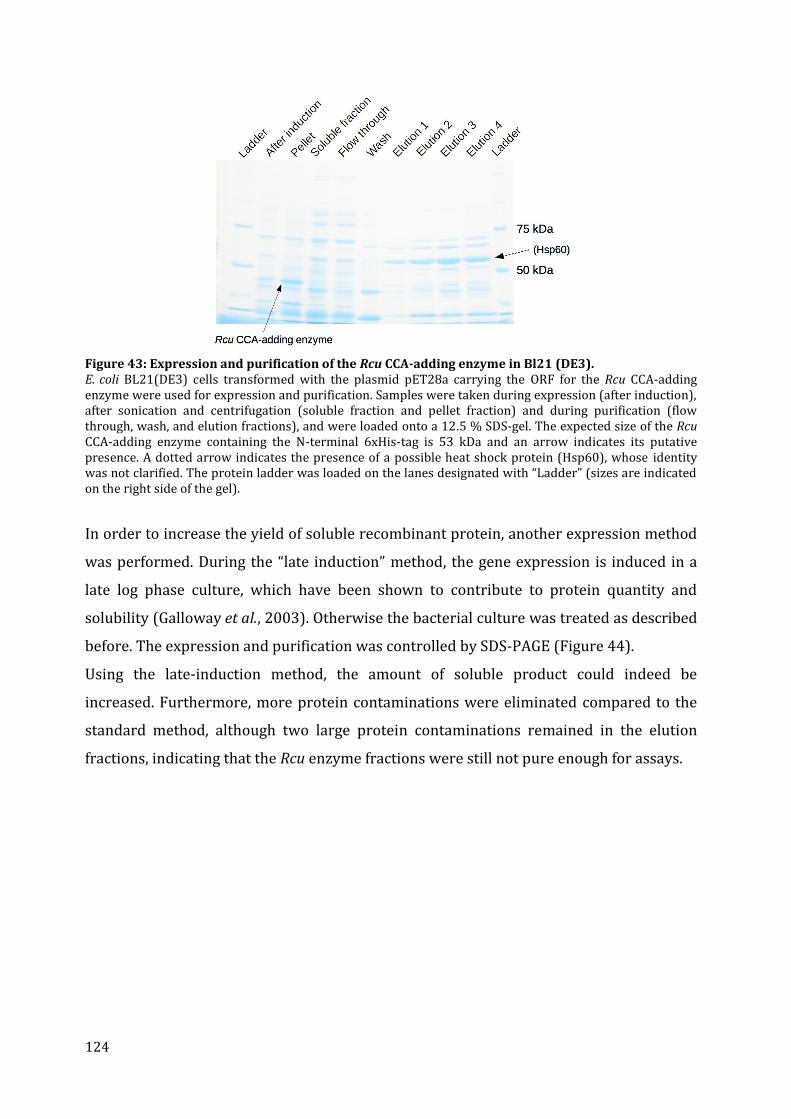
124
Figure 43: Expression and purification of the Rcu CCA-adding enzyme in Bl21 (DE3). E. coli BL21(DE3) cells transformed with the plasmid pET28a carrying the ORF for the Rcu CCA-adding enzyme were used for expression and purification. Samples were taken during expression (after induction), after sonication and centrifugation (soluble fraction and pellet fraction) and during purification (flow through, wash, and elution fractions), and were loaded onto a 12.5 % SDS-gel. The expected size of the Rcu CCA-adding enzyme containing the N-terminal 6xHis-tag is 53 kDa and an arrow indicates its putative presence. A dotted arrow indicates the presence of a possible heat shock protein (Hsp60), whose identity was not clarified. The protein ladder was loaded on the lanes designated with “Ladder” (sizes are indicated on the right side of the gel).
In order to increase the yield of soluble recombinant protein, another expression method
was performed. During the “late induction” method, the gene expression is induced in a
late log phase culture, which have been shown to contribute to protein quantity and
solubility (Galloway et al., 2003). Otherwise the bacterial culture was treated as described
before. The expression and purification was controlled by SDS-PAGE (Figure 44).
Using the late-induction method, the amount of soluble product could indeed be
increased. Furthermore, more protein contaminations were eliminated compared to the
standard method, although two large protein contaminations remained in the elution
fractions, indicating that the Rcu enzyme fractions were still not pure enough for assays.
125
Figure 44: Expression and purification of the Rcu CCA-adding enzyme in Bl21 (DE3) following the late-induction protocol. E. coli BL21 (DE3) cells transformed with the plasmid pET28a carrying the ORF of the Rcu CCA-adding enzyme were used for expression and purification. Samples were taken during expression (before and after induction), after sonication and centrifugation (soluble fraction and pellet fraction) and during purification (flow through, wash, and elution fractions), and were loaded onto a 12.5 % SDS-gel. The expected size of the Rcu CCA-adding enzyme containing the N-terminal 6xHis-tag is 53 kDa. The protein ladder was loaded on the lanes designated with “Ladder” (sizes are indicated on the left side of the gel).
14.4. Expression in E. coli Rosetta-gami 2
The eukaryotic codon usage of the Rcu protein could lead to problems in expression in
E. coli. In order to limit this factor, a special E. coli strain was used that contains codons
rarely used in E. coli. The Rosetta-gami 2 strain allows for enhanced disulfide bond
formation and enhanced expression of eukaryotic proteins. This strain carries an
additional plasmid, pRARE2, which supplies tRNAs with rare codons, AUA, AGG, AGA,
CUA, CCC, GGA, and CGG under the control of their native promoter. Indeed, the Rcu CCA-
adding gene sequence carries 40 of these rarely used codons.
The use of the Rosetta-gami 2 cells resulted in an improvement of the expression rate of
the Rcu CCA-adding enzyme (Figure 45). However, the presence of protein contamination
could not be reduced, which is illustrated by the strong band at 60 kDa in the SDS-gel. The
size of 60 kDa corresponds to the E. coli chaperone GroEL.
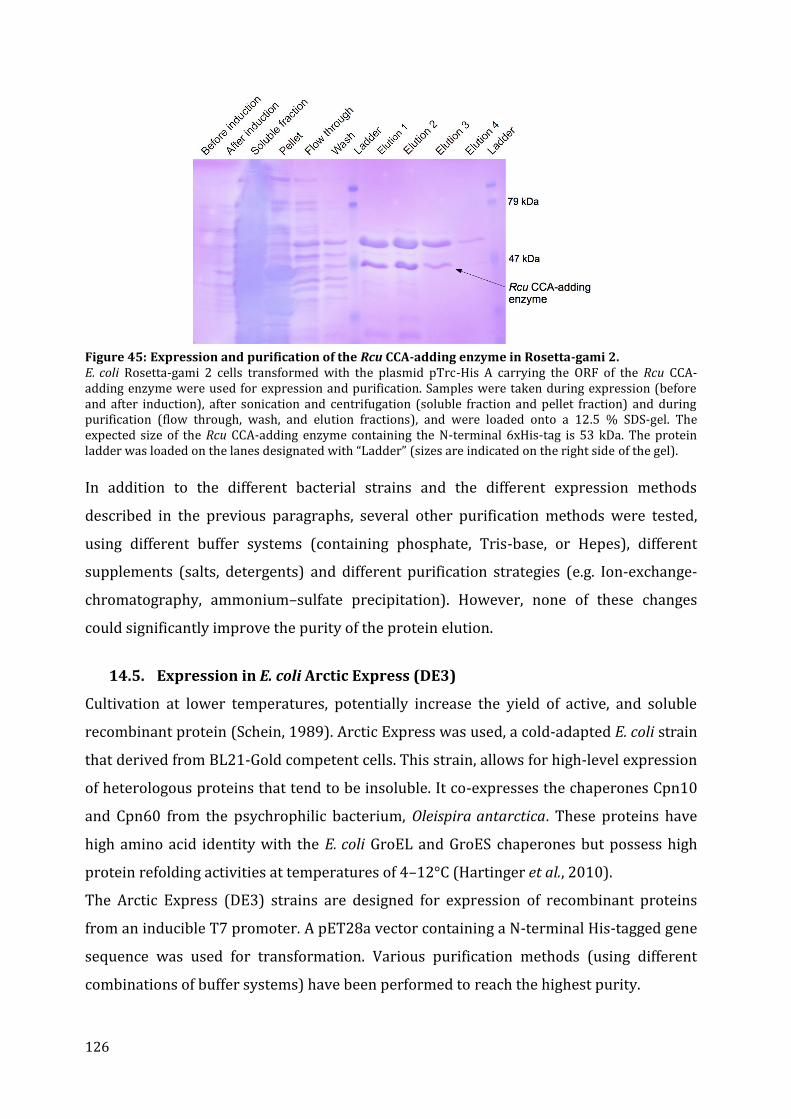
126
Figure 45: Expression and purification of the Rcu CCA-adding enzyme in Rosetta-gami 2. E. coli Rosetta-gami 2 cells transformed with the plasmid pTrc-His A carrying the ORF of the Rcu CCA-adding enzyme were used for expression and purification. Samples were taken during expression (before and after induction), after sonication and centrifugation (soluble fraction and pellet fraction) and during purification (flow through, wash, and elution fractions), and were loaded onto a 12.5 % SDS-gel. The expected size of the Rcu CCA-adding enzyme containing the N-terminal 6xHis-tag is 53 kDa. The protein ladder was loaded on the lanes designated with “Ladder” (sizes are indicated on the right side of the gel).
In addition to the different bacterial strains and the different expression methods
described in the previous paragraphs, several other purification methods were tested,
using different buffer systems (containing phosphate, Tris-base, or Hepes), different
supplements (salts, detergents) and different purification strategies (e.g. Ion-exchange-
chromatography, ammonium–sulfate precipitation). However, none of these changes
could significantly improve the purity of the protein elution.
14.5. Expression in E. coli Arctic Express (DE3)
Cultivation at lower temperatures, potentially increase the yield of active, and soluble
recombinant protein (Schein, 1989). Arctic Express was used, a cold-adapted E. coli strain
that derived from BL21-Gold competent cells. This strain, allows for high-level expression
of heterologous proteins that tend to be insoluble. It co-expresses the chaperones Cpn10
and Cpn60 from the psychrophilic bacterium, Oleispira antarctica. These proteins have
high amino acid identity with the E. coli GroEL and GroES chaperones but possess high
protein refolding activities at temperatures of 4–12°C (Hartinger et al., 2010).
The Arctic Express (DE3) strains are designed for expression of recombinant proteins
from an inducible T7 promoter. A pET28a vector containing a N-terminal His-tagged gene
sequence was used for transformation. Various purification methods (using different
combinations of buffer systems) have been performed to reach the highest purity.
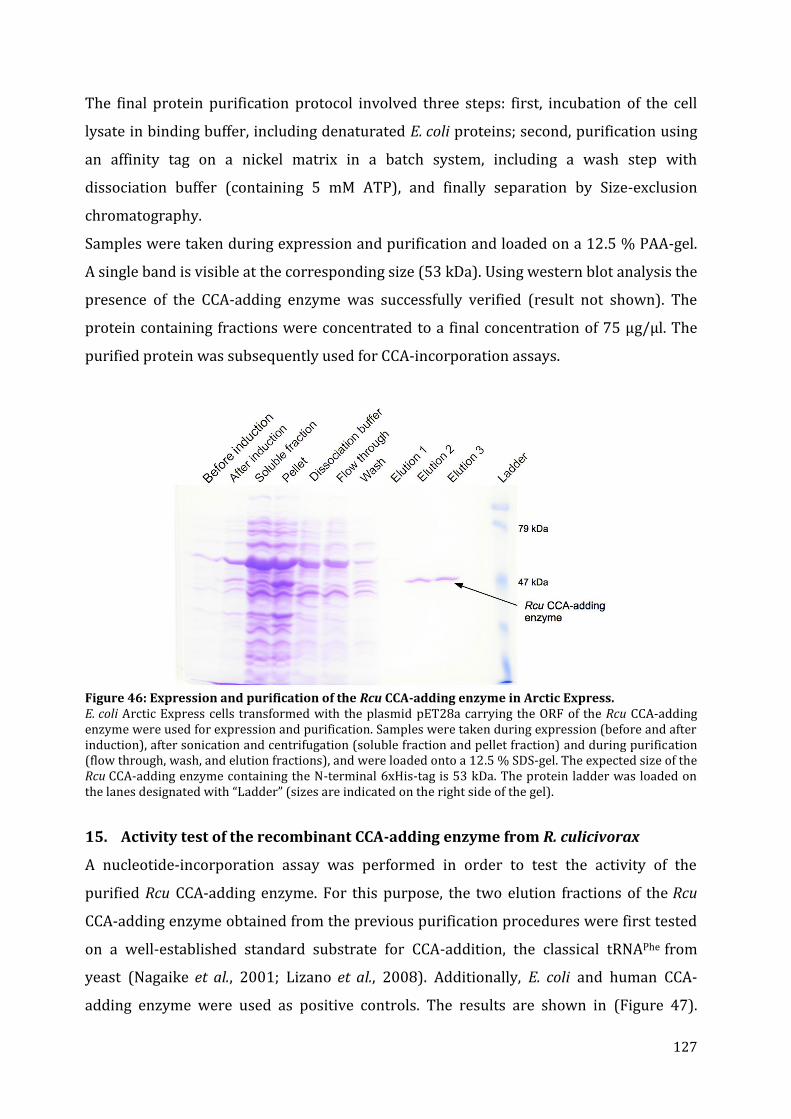
127
The final protein purification protocol involved three steps: first, incubation of the cell
lysate in binding buffer, including denaturated E. coli proteins; second, purification using
an affinity tag on a nickel matrix in a batch system, including a wash step with
dissociation buffer (containing 5 mM ATP), and finally separation by Size-exclusion
chromatography.
Samples were taken during expression and purification and loaded on a 12.5 % PAA-gel.
A single band is visible at the corresponding size (53 kDa). Using western blot analysis the
presence of the CCA-adding enzyme was successfully verified (result not shown). The
protein containing fractions were concentrated to a final concentration of 75 µg/µl. The
purified protein was subsequently used for CCA-incorporation assays.
Figure 46: Expression and purification of the Rcu CCA-adding enzyme in Arctic Express. E. coli Arctic Express cells transformed with the plasmid pET28a carrying the ORF of the Rcu CCA-adding enzyme were used for expression and purification. Samples were taken during expression (before and after induction), after sonication and centrifugation (soluble fraction and pellet fraction) and during purification (flow through, wash, and elution fractions), and were loaded onto a 12.5 % SDS-gel. The expected size of the Rcu CCA-adding enzyme containing the N-terminal 6xHis-tag is 53 kDa. The protein ladder was loaded on the lanes designated with “Ladder” (sizes are indicated on the right side of the gel).
15. Activity test of the recombinant CCA-adding enzyme from R. culicivorax
A nucleotide-incorporation assay was performed in order to test the activity of the
purified Rcu CCA-adding enzyme. For this purpose, the two elution fractions of the Rcu
CCA-adding enzyme obtained from the previous purification procedures were first tested
on a well-established standard substrate for CCA-addition, the classical tRNAPhe from
yeast (Nagaike et al., 2001; Lizano et al., 2008). Additionally, E. coli and human CCA-
adding enzyme were used as positive controls. The results are shown in (Figure 47).
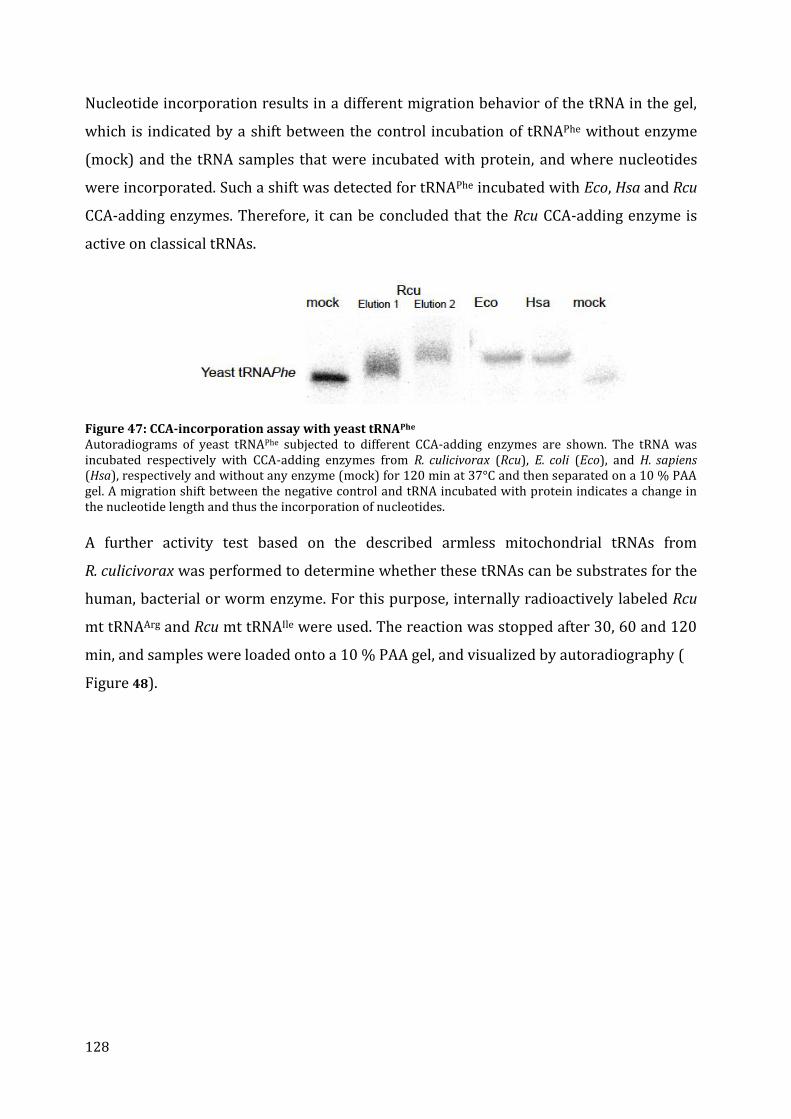
128
Nucleotide incorporation results in a different migration behavior of the tRNA in the gel,
which is indicated by a shift between the control incubation of tRNAPhe without enzyme
(mock) and the tRNA samples that were incubated with protein, and where nucleotides
were incorporated. Such a shift was detected for tRNAPhe incubated with Eco, Hsa and Rcu
CCA-adding enzymes. Therefore, it can be concluded that the Rcu CCA-adding enzyme is
active on classical tRNAs.
Figure 47: CCA-incorporation assay with yeast tRNAPhe
Autoradiograms of yeast tRNAPhe subjected to different CCA-adding enzymes are shown. The tRNA was incubated respectively with CCA-adding enzymes from R. culicivorax (Rcu), E. coli (Eco), and H. sapiens (Hsa), respectively and without any enzyme (mock) for 120 min at 37°C and then separated on a 10 % PAA gel. A migration shift between the negative control and tRNA incubated with protein indicates a change in the nucleotide length and thus the incorporation of nucleotides.
A further activity test based on the described armless mitochondrial tRNAs from
R. culicivorax was performed to determine whether these tRNAs can be substrates for the
human, bacterial or worm enzyme. For this purpose, internally radioactively labeled Rcu
mt tRNAArg and Rcu mt tRNAIle were used. The reaction was stopped after 30, 60 and 120
min, and samples were loaded onto a 10 % PAA gel, and visualized by autoradiography (
Figure 48).
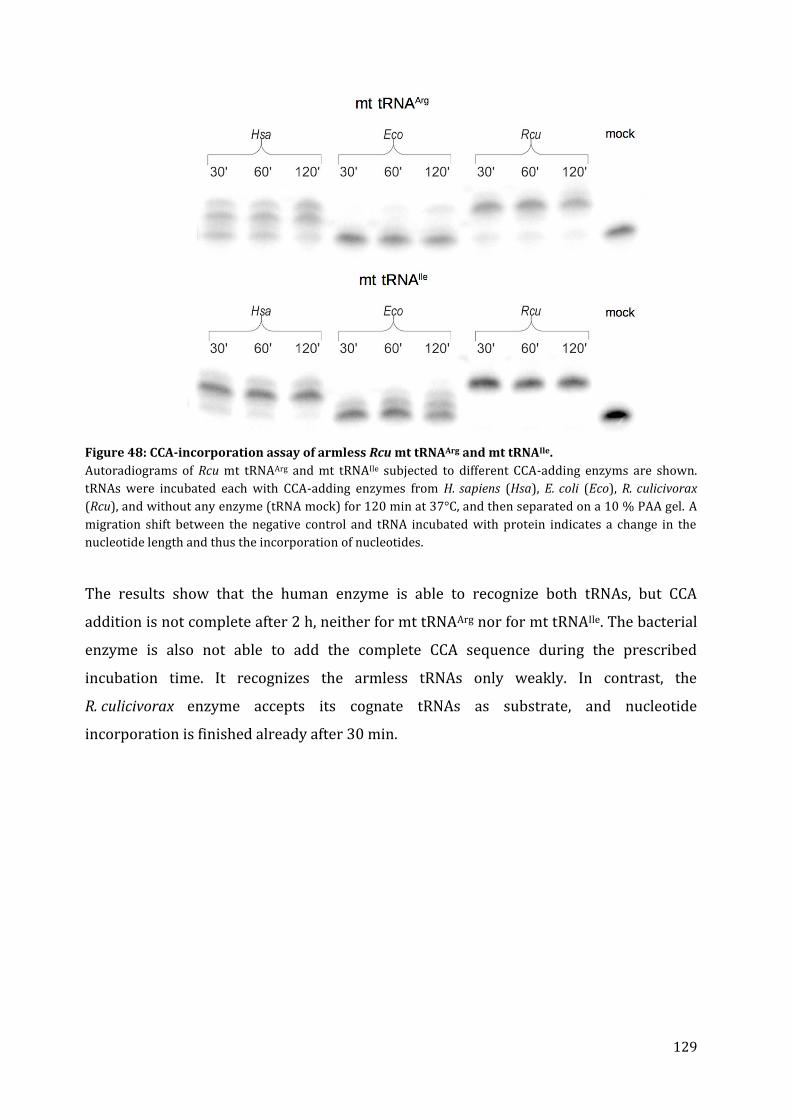
129
Figure 48: CCA-incorporation assay of armless Rcu mt tRNAArg and mt tRNAIle.
Autoradiograms of Rcu mt tRNAArg and mt tRNAIle subjected to different CCA-adding enzyms are shown.
tRNAs were incubated each with CCA-adding enzymes from H. sapiens (Hsa), E. coli (Eco), R. culicivorax
(Rcu), and without any enzyme (tRNA mock) for 120 min at 37°C, and then separated on a 10 % PAA gel. A
migration shift between the negative control and tRNA incubated with protein indicates a change in the
nucleotide length and thus the incorporation of nucleotides.
The results show that the human enzyme is able to recognize both tRNAs, but CCA
addition is not complete after 2 h, neither for mt tRNAArg nor for mt tRNAIle. The bacterial
enzyme is also not able to add the complete CCA sequence during the prescribed
incubation time. It recognizes the armless tRNAs only weakly. In contrast, the
R. culicivorax enzyme accepts its cognate tRNAs as substrate, and nucleotide
incorporation is finished already after 30 min.
130
16. Discussion
16.1. Preparation of mt CCA-adding enzyme from R. culicivorax
The newly identified ORF coding for the Rcu CCA-adding enzyme was cloned for
overexpression and purification of the corresponding mature protein. Standard
purification protocols for the human and bacterial CCA-adding enzymes, well established
in the host laboratory in Leipzig (Lizano et al., 2008; Neuenfeldt et al., 2008), could not be
applied for the purification of the Rcu CCA-adding enzyme due to low protein quantity,
and due to the inability to eliminate bacterial contaminations. These correspond mainly
to heat shock proteins (bacterial chaperones). Analyses of large-scale protein expression
trials demonstrated that purification of eukaryotic proteins in bacterial cells can be
difficult in high yield. Only 10 % of eukaryotic proteins can be expressed in E. coli in
soluble form (Galloway et al., 2003; Graslund et al., 2008). Additional factors should be
considered that might alter the expression of a eukaryotic protein in a prokaryotic hosts,
e.g., codon bias or codon preference, stability of mRNAs and protein folding (Sahdev et al.,
2008; Khow and Suntrarachun, 2012). Additionally, the right choice about the buffer
system used for protein purification is often a critical question because an appropriate
buffer solution can help to improve the stability and can protect the integrity of protein
molecules (Graslund et al., 2008). Accordingly, several expression and purification
strategies were tested, including different expression systems (E. coli BL21 (DE3),
Rosetta-gami 2, Arctic Express (DE3), and yeast cells), different expression methods
(standard, late or cold induction), different buffer compositions (different pH, buffer,
salts), and several purification approaches (Affinity chromatography via HPLC or batch
purification, IEC, and SEC). Unfortunately, neither the expression in E. coli BL21 (DE3) or
Rosetta-gami 2 strains, nor in yeast cells worked optimally. In addition, no change in the
expression approaches or buffer compositions led to a significant improvement of
expression and purification of Rcu CCA-adding enzymes. Only the use of E. coli Arctic
Express cells resulted in a sufficient yield of soluble protein. This improved protein
solubility is probably due to the low growth temperatures, and due to the co-expression
of GroEL/GroES chaperone homologues that promote proper refolding of the
recombinant protein (Ferrer et al., 2003). A disadvantage of this strategy is that these
chaperones are often co-purified (Haacke et al., 2009), which was also the case in this
study. The undesired co-purification of chaperones seemed to be a very serious and
131
general problem that is described in different publications. Different solutions were
proposed how co-purification can be prevented (Joseph and Andreotti, 2008; Hartinger et
al., 2010; Rial and Ceccarelli, 2002; Belval et al., 2015). These protocols are, however,
often specially adapted to a certain protein of interest, and are therefore not applicable
for any protein in general. In the case of the Rcu CCA-adding enzyme, a combination of the
methods described by (Rial and Ceccarelli, 2002; Joseph and Andreotti, 2008) turned out
to be the most successful approach to reduce the amount of unwanted chaperone
contamination. This method includes incubation of the soluble protein fraction with
denatured E. coli proteins, and an additional washing step with a special dissociation
buffer. The denatured E. coli proteins are added to compete with the recombinant protein
for binding to the chaperones, and thereby may facilitate the release of chaperones from
the expressed recombinant protein. The dissociation buffer contained 5 mM ATP because
it could be shown that GroEL/GroES activity is ATP-dependent (Tyagi et al., 2009). The
purification protocol is finalized by size exclusion chromatography, which is necessary to
allow the complete elimination of chaperone contaminations in elution fractions.
16.2. Functional characterization of CCA-adding enzymes
Purified protein was tested for its ability to incorporate nucleotides to the 3'-end of
armless tRNAs (in vitro transcripts lacking the CCA). For a comparative analysis, classic
cytosolic tRNAs, human mt and Eco CCA-adding enzymes were purified and included into
this study.
The results show that the Rcu CCA-adding enzyme is active, and able to recognize armless
tRNAs as well as a cytosolic tRNA. The incorporation of the “CCA” sequence was
completed for all substrates. However, heterologous Hsa and Eco CCA-adding enzymes
seem not to be fully compatible with armless tRNAs. These results comply with the theory
of an evolutionary adaptation of the Rcu CCA-adding enzyme to the unusual structure of
armless tRNAs, or a co-evolution of both partners. Interestingly, Tomari and colleagues
obtained a similar result when studying the mt CCA-adding enzyme from the nematode
C. elegans. They could demonstrate that C. elegans CCA-adding enzymes exhibit a broad
substrate specificity toward nematode mt tRNAs lacking the entire T- or D-arms (Tomari
et al., 2002). However, also those CCA-adding enzymes can still recognize canonical
tRNAs.
132
The results of the CCA-incorporation assay demonstrate that the human CCA-enzyme
weakly recognizes armless mt tRNAs and partially adds nucleotides. In contrast, the
bacterial enzyme does not recognize the armless tRNAs as its substrate. E. coli does not
possess any unusual tRNAs, but only classical tRNAs that are present in its cytosol. The
fact that the Eco CCA-adding enzyme does not recognize armless mt tRNAs from
R. culicivorax suggests that the ability to modify unconventional tRNAs was not acquired
by bacterial enzymes during evolution. Interestingly, it could already been shown that the
Eco enzyme does also not recognize other animal mt tRNAs that show even less structural
deviations than nematode mt tRNAs (Nagaike et al., 2001).
In contrast to bacterial CCA-adding enzymes, eukaryotic CCA-adding enzymes have to
recognize two sets of tRNAs, cytosolic tRNAs with highly conserved structures, and
simultaneously mt tRNAs partially lacking highly conserved sequences, which is
considered to be important for CCA addition (Li et al., 1996). Another study has shown
that the human mt CCA-adding enzyme efficiently repairs mt tRNAs besides cytosolic
tRNAs (Nagaike et al., 2001). Thus, eukaryotic mitochondrial CCA-adding enzymes have
probably adapted evolutionarily to their cognate mt tRNAs. The adaptation of the human
CCA-adding enzyme to animal mt tRNA structures results in a relaxed substrate
specificity, which may explain the partial ability to recognize armless tRNAs from
R. culicivorax. Interestingly, this lowered substrate specificity toward tRNAs seems to be a
characteristic feature also of other mitochondrial enzymes, such as mt aminoacyl-tRNA
synthetases (Kumazawa et al., 1991) and elongation factors (Schwartzbach and Spremulli,
1991).
Since the CCA-adding enzyme from R. culicivorax recognizes both, cytosolic as well as
armless mt tRNAs, we assume that this enzyme has adapted to the reduced size of armless
tRNAs without losing the ability to recognize classical tRNAs and their extended
structures. Consequently, no complete adaptation, which is exclusively intended for the
recognition of armless tRNAs, happened during evolution. A decisive difference to the
elongation factor EF-Tu in other nematodes is that the Rcu CCA-adding enzyme is not
structurally distinguished from its bacterial counterpart (no additional or missing
domains), while the mitochondrial EF-Tus from, e.g., C. elegans show a C-terminal
elongation. This raises the question for the decisive factor that led to this rather slight
adaptation. Possible answers to this question will be discussed in the next section, where
differences between Rcu and Eco CCA-adding enzymes are examined.
133
The various approaches applied in this thesis work to establish an optimal expression and
purification protocol for the preparation of the Rcu CCA-adding enzyme, as well as for the
initial experiments to test protein functionality in regards to cytosolic and armless mt
tRNAs, provide an excellent basis for further characterization of these enzymes.
Purified Rcu CCA-adding enzyme can be used to characterize its nucleotide incorporation
activity with different tRNA substrates by determining kinetic parameters, i.e., Km and kcat.
These values need to be compared to those already determined for the E. coli and human
CCA-adding enzymes in combination with canonical and bovine mt tRNAs (Nagaike et al.,
2001). It has been shown that the human mt CCA-adding enzyme recognized efficiently
mt tRNAs with non-conserved T-loop and unusual structures, while the Eco CCA-adding
enzyme recognized only cytosolic tRNAs. As an outlook, a comparative study on different
CCA-adding enzymes from human, E. coli and R. culicivorax in combination with armless
mt tRNAs and other (mt) tRNA substrates would complete the characterization of Rcu
CCA-adding enzymes, and could, e.g., help to validate its superior efficiency for CCA-
incorporation also for other unconventional tRNA structures.
16.3. Structural characterization of Rcu CCA adding enzyme in an evolutionary
context
The amino acid sequence of the Rcu CCA-adding enzyme was aligned to other CCA-adding
enzymes from different organisms. These alignments contributed to understand the
secondary organizations of these enzymes. In comparison with the human mt CCA-adding
enzyme, an overall sequence identity of 46 % can be observed for the Rcu CCA-adding
enzyme. In particular, the N-terminal domain, typically corresponding to the catalytic site
(responsible for the recognition and addition of nucleotides) has a high level of identity
(66 %), while the C-terminal domain is more variable. It was shown that substrate
binding of CCA-adding enzymes takes place at its low conserved C-terminal region
(Tomita et al., 2004; Tretbar et al., 2011). I-TASSER analysis revealed 5 putative 3D
models, of the Rcu CCA-adding enzyme. All of them exhibit different conformation of the
C-terminal, indicating a putative high flexibility of this domain. Thus, we suspect that a
flexible C-terminus of the Rcu CCA-adding enzyme has adapted to allow for recognizing
armless tRNAs. It would be interesting to verify this hypothesis by creating protein
chimeras, e.g., by exchanging C-terminal parts of Eco CCA-adding enzymes with these
134
from Rcu CCA-adding enzymes. The study of several enzyme chimeras, including
exchanges in N-terminal and/or C-terminal regions has been successfully performed
already, and helped to decipher the role of these domains in CCA-adding enzymes (Betat
et al., 2004; Neuenfeldt et al., 2008; Toh et al., 2009).
Studies on the CCA-adding enzyme from E. coli have also shown that it is possible to
delete large portions of the C-terminal region without losing the CCA-adding activity
(Betat et al., 2004). The generation of C-terminal deletion variants of the R. culicivorax
enzyme would bring further insights into the importance of this part for recognizing and
processing armless tRNAs.
Other highly interesting methods that can be used to measure, e.g., protein interaction,
enzymatic activity, or conformational changes are, e.g., fluorescent labelling of proteins
(FRET) (Toseland, 2013; Jager et al., 2006), Electron paramagnetic resonance (EPR), and
electron spin resonance (ESR) spectroscopy. Especially, the EPR/ESP approach has been
applied for a CCA-adding enzymes already (Ernst et al., 2015). These methods may help to
understand inter-domain movements and, to determine the structural features of the Rcu
CCA-adding enzyme more in detail.
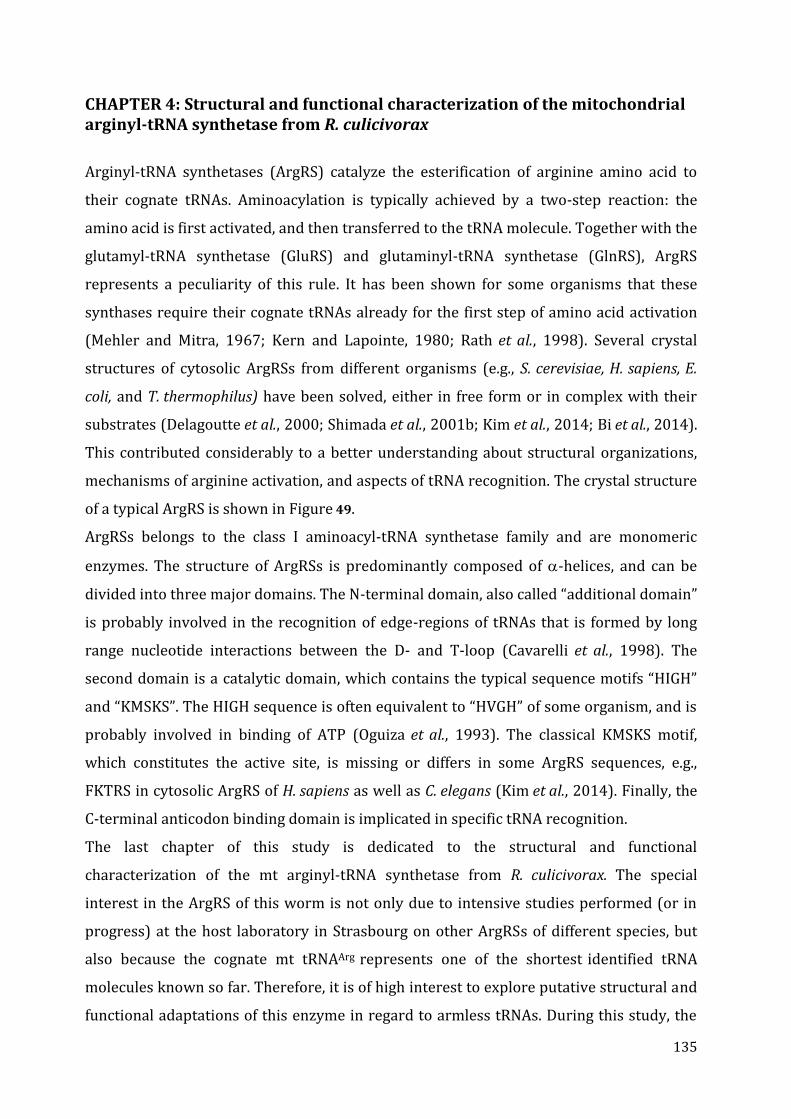
135
CHAPTER 4: Structural and functional characterization of the mitochondrial arginyl-tRNA synthetase from R. culicivorax
Arginyl-tRNA synthetases (ArgRS) catalyze the esterification of arginine amino acid to
their cognate tRNAs. Aminoacylation is typically achieved by a two-step reaction: the
amino acid is first activated, and then transferred to the tRNA molecule. Together with the
glutamyl-tRNA synthetase (GluRS) and glutaminyl-tRNA synthetase (GlnRS), ArgRS
represents a peculiarity of this rule. It has been shown for some organisms that these
synthases require their cognate tRNAs already for the first step of amino acid activation
(Mehler and Mitra, 1967; Kern and Lapointe, 1980; Rath et al., 1998). Several crystal
structures of cytosolic ArgRSs from different organisms (e.g., S. cerevisiae, H. sapiens, E.
coli, and T. thermophilus) have been solved, either in free form or in complex with their
substrates (Delagoutte et al., 2000; Shimada et al., 2001b; Kim et al., 2014; Bi et al., 2014).
This contributed considerably to a better understanding about structural organizations,
mechanisms of arginine activation, and aspects of tRNA recognition. The crystal structure
of a typical ArgRS is shown in Figure 49.
ArgRSs belongs to the class I aminoacyl-tRNA synthetase family and are monomeric
enzymes. The structure of ArgRSs is predominantly composed of -helices, and can be
divided into three major domains. The N-terminal domain, also called “additional domain”
is probably involved in the recognition of edge-regions of tRNAs that is formed by long
range nucleotide interactions between the D- and T-loop (Cavarelli et al., 1998). The
second domain is a catalytic domain, which contains the typical sequence motifs “HIGH”
and “KMSKS”. The HIGH sequence is often equivalent to “HVGH” of some organism, and is
probably involved in binding of ATP (Oguiza et al., 1993). The classical KMSKS motif,
which constitutes the active site, is missing or differs in some ArgRS sequences, e.g.,
FKTRS in cytosolic ArgRS of H. sapiens as well as C. elegans (Kim et al., 2014). Finally, the
C-terminal anticodon binding domain is implicated in specific tRNA recognition.
The last chapter of this study is dedicated to the structural and functional
characterization of the mt arginyl-tRNA synthetase from R. culicivorax. The special
interest in the ArgRS of this worm is not only due to intensive studies performed (or in
progress) at the host laboratory in Strasbourg on other ArgRSs of different species, but
also because the cognate mt tRNAArg represents one of the shortest identified tRNA
molecules known so far. Therefore, it is of high interest to explore putative structural and
functional adaptations of this enzyme in regard to armless tRNAs. During this study, the
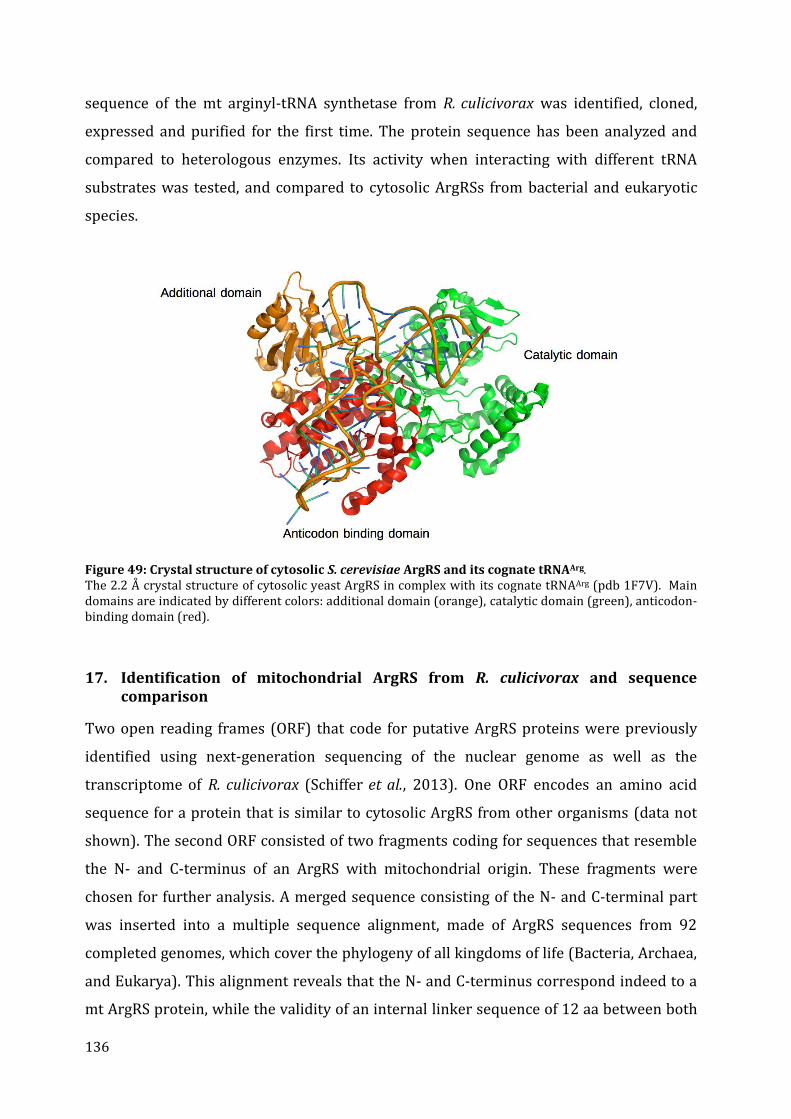
136
sequence of the mt arginyl-tRNA synthetase from R. culicivorax was identified, cloned,
expressed and purified for the first time. The protein sequence has been analyzed and
compared to heterologous enzymes. Its activity when interacting with different tRNA
substrates was tested, and compared to cytosolic ArgRSs from bacterial and eukaryotic
species.
Figure 49: Crystal structure of cytosolic S. cerevisiae ArgRS and its cognate tRNAArg. The 2.2 Å crystal structure of cytosolic yeast ArgRS in complex with its cognate tRNAArg (pdb 1F7V). Main domains are indicated by different colors: additional domain (orange), catalytic domain (green), anticodon-binding domain (red).
17. Identification of mitochondrial ArgRS from R. culicivorax and sequence comparison
Two open reading frames (ORF) that code for putative ArgRS proteins were previously
identified using next-generation sequencing of the nuclear genome as well as the
transcriptome of R. culicivorax (Schiffer et al., 2013). One ORF encodes an amino acid
sequence for a protein that is similar to cytosolic ArgRS from other organisms (data not
shown). The second ORF consisted of two fragments coding for sequences that resemble
the N- and C-terminus of an ArgRS with mitochondrial origin. These fragments were
chosen for further analysis. A merged sequence consisting of the N- and C-terminal part
was inserted into a multiple sequence alignment, made of ArgRS sequences from 92
completed genomes, which cover the phylogeny of all kingdoms of life (Bacteria, Archaea,
and Eukarya). This alignment reveals that the N- and C-terminus correspond indeed to a
mt ArgRS protein, while the validity of an internal linker sequence of 12 aa between both
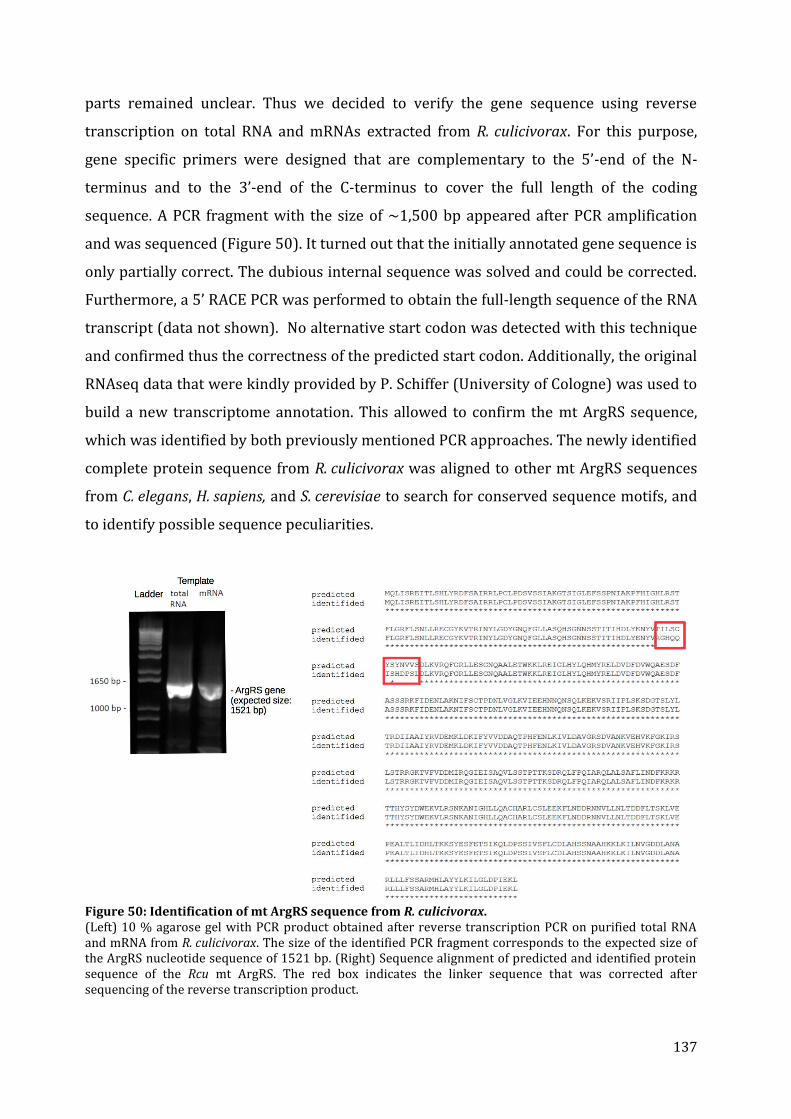
137
parts remained unclear. Thus we decided to verify the gene sequence using reverse
transcription on total RNA and mRNAs extracted from R. culicivorax. For this purpose,
gene specific primers were designed that are complementary to the 5’-end of the N-
terminus and to the 3’-end of the C-terminus to cover the full length of the coding
sequence. A PCR fragment with the size of ~1,500 bp appeared after PCR amplification
and was sequenced (Figure 50). It turned out that the initially annotated gene sequence is
only partially correct. The dubious internal sequence was solved and could be corrected.
Furthermore, a 5’ RACE PCR was performed to obtain the full-length sequence of the RNA
transcript (data not shown). No alternative start codon was detected with this technique
and confirmed thus the correctness of the predicted start codon. Additionally, the original
RNAseq data that were kindly provided by P. Schiffer (University of Cologne) was used to
build a new transcriptome annotation. This allowed to confirm the mt ArgRS sequence,
which was identified by both previously mentioned PCR approaches. The newly identified
complete protein sequence from R. culicivorax was aligned to other mt ArgRS sequences
from C. elegans, H. sapiens, and S. cerevisiae to search for conserved sequence motifs, and
to identify possible sequence peculiarities.
Figure 50: Identification of mt ArgRS sequence from R. culicivorax. (Left) 10 % agarose gel with PCR product obtained after reverse transcription PCR on purified total RNA and mRNA from R. culicivorax. The size of the identified PCR fragment corresponds to the expected size of the ArgRS nucleotide sequence of 1521 bp. (Right) Sequence alignment of predicted and identified protein sequence of the Rcu mt ArgRS. The red box indicates the linker sequence that was corrected after sequencing of the reverse transcription product.

138
Figure 51: Schematic overview and sequence alignment of ArgRS. (Top) Schematic representation of the functional domains of mt AspRS compared to mt ArgRS from R. culicivorax. An mt ArgRS is typically composed of a mitochondrial targeting sequence (MTS) (blue) that is cleaved after mitochondrial import, an additional domain (orange), a catalytic domain (green), and an anticodon binding domain (red). (Below) Cytosolic and mitochondrial ArgRS from different organism are compared based on their amino acid sequence. The conserved sequence motifs of class I synthetases, i.e., “HIGH” and “KMSKS”, are highlighted in green boxes. Conserved nucleotides are indicated by “*”, similar amino acids are indicated by “:” in the bottom line. Numbers in brackets indicate positions of the first residues in the given alignment in the amino acid sequence of corresponding ArgRS. Eco, Escherichia coli; Hsa, Homo sapiens; Sce, Saccharomyces cerevisiae; Cel, Caenorhabditis elegans, Rcu, Romanomermis culicivorax.
Additionally, bacterial and cytosolic ArgRS from C. elegans, H. sapiens, and S. cerevisiae
were used to complete this comparative analysis (Figure 51). The alignment reveals that
the Rcu mt ArgRS possesses conserved residues that correspond partially to the typical
sequence motifs “HIGH” and “KMSKS”. In this case the last motif is equivalent to LSTRRG.
It is striking that the Rcu mt ArgRS exhibits the smallest size in the alignment with only
507 aa (58 kDa). Another rather small enzyme is the mt ArgRS from C. elegans with 512
aa. The remaining enzymes are longer than 570 aa. This size difference is particularly
remarkable in the additional domain, which is completely absent in the Rcu mt ArgRS
sequence. Only a few residues remain, which may form a putative mitochondrial targeting
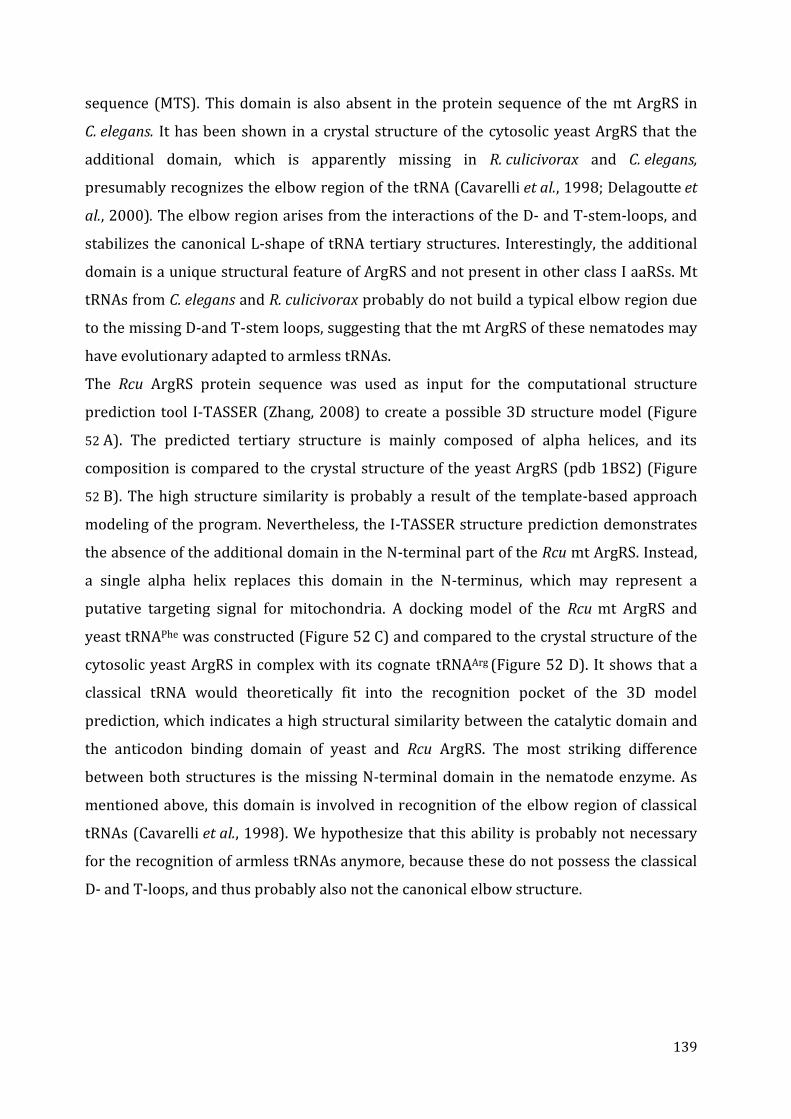
139
sequence (MTS). This domain is also absent in the protein sequence of the mt ArgRS in
C. elegans. It has been shown in a crystal structure of the cytosolic yeast ArgRS that the
additional domain, which is apparently missing in R. culicivorax and C. elegans,
presumably recognizes the elbow region of the tRNA (Cavarelli et al., 1998; Delagoutte et
al., 2000). The elbow region arises from the interactions of the D- and T-stem-loops, and
stabilizes the canonical L-shape of tRNA tertiary structures. Interestingly, the additional
domain is a unique structural feature of ArgRS and not present in other class I aaRSs. Mt
tRNAs from C. elegans and R. culicivorax probably do not build a typical elbow region due
to the missing D-and T-stem loops, suggesting that the mt ArgRS of these nematodes may
have evolutionary adapted to armless tRNAs.
The Rcu ArgRS protein sequence was used as input for the computational structure
prediction tool I-TASSER (Zhang, 2008) to create a possible 3D structure model (Figure
52 A). The predicted tertiary structure is mainly composed of alpha helices, and its
composition is compared to the crystal structure of the yeast ArgRS (pdb 1BS2) (Figure
52 B). The high structure similarity is probably a result of the template-based approach
modeling of the program. Nevertheless, the I-TASSER structure prediction demonstrates
the absence of the additional domain in the N-terminal part of the Rcu mt ArgRS. Instead,
a single alpha helix replaces this domain in the N-terminus, which may represent a
putative targeting signal for mitochondria. A docking model of the Rcu mt ArgRS and
yeast tRNAPhe was constructed (Figure 52 C) and compared to the crystal structure of the
cytosolic yeast ArgRS in complex with its cognate tRNAArg (Figure 52 D). It shows that a
classical tRNA would theoretically fit into the recognition pocket of the 3D model
prediction, which indicates a high structural similarity between the catalytic domain and
the anticodon binding domain of yeast and Rcu ArgRS. The most striking difference
between both structures is the missing N-terminal domain in the nematode enzyme. As
mentioned above, this domain is involved in recognition of the elbow region of classical
tRNAs (Cavarelli et al., 1998). We hypothesize that this ability is probably not necessary
for the recognition of armless tRNAs anymore, because these do not possess the classical
D- and T-loops, and thus probably also not the canonical elbow structure.
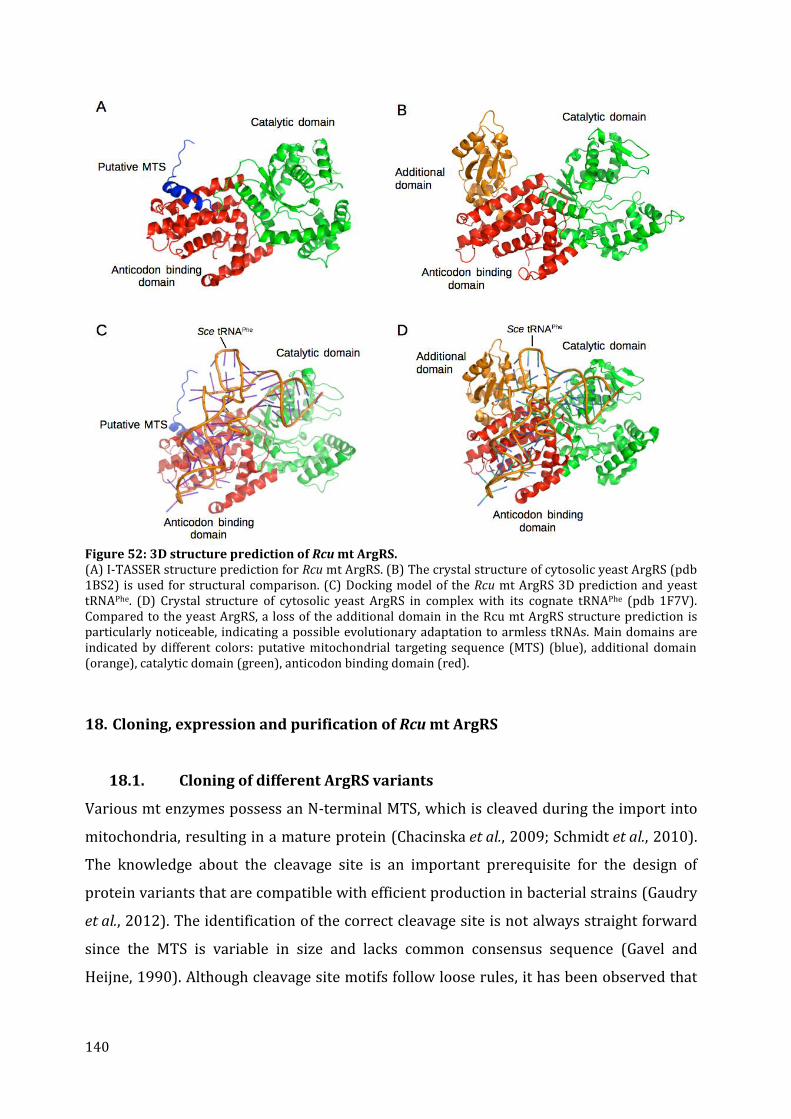
140
Figure 52: 3D structure prediction of Rcu mt ArgRS. (A) I-TASSER structure prediction for Rcu mt ArgRS. (B) The crystal structure of cytosolic yeast ArgRS (pdb 1BS2) is used for structural comparison. (C) Docking model of the Rcu mt ArgRS 3D prediction and yeast tRNAPhe. (D) Crystal structure of cytosolic yeast ArgRS in complex with its cognate tRNAPhe (pdb 1F7V). Compared to the yeast ArgRS, a loss of the additional domain in the Rcu mt ArgRS structure prediction is particularly noticeable, indicating a possible evolutionary adaptation to armless tRNAs. Main domains are indicated by different colors: putative mitochondrial targeting sequence (MTS) (blue), additional domain (orange), catalytic domain (green), anticodon binding domain (red).
18. Cloning, expression and purification of Rcu mt ArgRS
18.1. Cloning of different ArgRS variants
Various mt enzymes possess an N-terminal MTS, which is cleaved during the import into
mitochondria, resulting in a mature protein (Chacinska et al., 2009; Schmidt et al., 2010).
The knowledge about the cleavage site is an important prerequisite for the design of
protein variants that are compatible with efficient production in bacterial strains (Gaudry
et al., 2012). The identification of the correct cleavage site is not always straight forward
since the MTS is variable in size and lacks common consensus sequence (Gavel and
Heijne, 1990). Although cleavage site motifs follow loose rules, it has been observed that
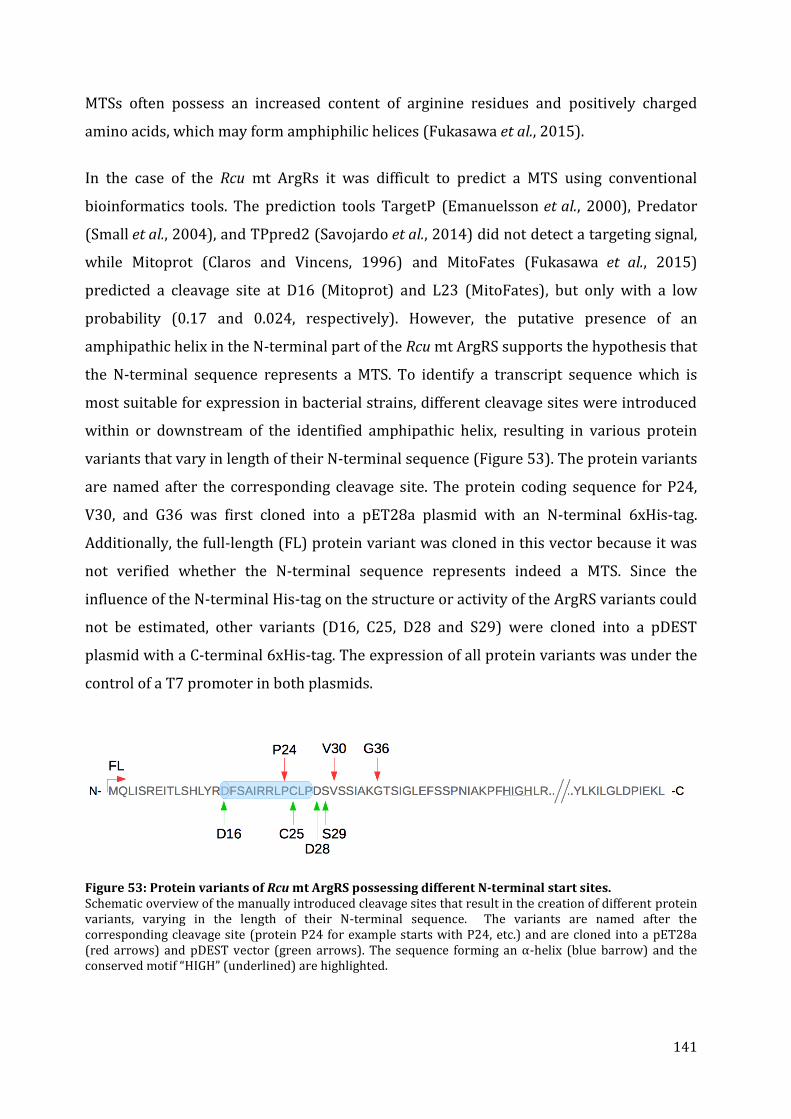
141
MTSs often possess an increased content of arginine residues and positively charged
amino acids, which may form amphiphilic helices (Fukasawa et al., 2015).
In the case of the Rcu mt ArgRs it was difficult to predict a MTS using conventional
bioinformatics tools. The prediction tools TargetP (Emanuelsson et al., 2000), Predator
(Small et al., 2004), and TPpred2 (Savojardo et al., 2014) did not detect a targeting signal,
while Mitoprot (Claros and Vincens, 1996) and MitoFates (Fukasawa et al., 2015)
predicted a cleavage site at D16 (Mitoprot) and L23 (MitoFates), but only with a low
probability (0.17 and 0.024, respectively). However, the putative presence of an
amphipathic helix in the N-terminal part of the Rcu mt ArgRS supports the hypothesis that
the N-terminal sequence represents a MTS. To identify a transcript sequence which is
most suitable for expression in bacterial strains, different cleavage sites were introduced
within or downstream of the identified amphipathic helix, resulting in various protein
variants that vary in length of their N-terminal sequence (Figure 53). The protein variants
are named after the corresponding cleavage site. The protein coding sequence for P24,
V30, and G36 was first cloned into a pET28a plasmid with an N-terminal 6xHis-tag.
Additionally, the full-length (FL) protein variant was cloned in this vector because it was
not verified whether the N-terminal sequence represents indeed a MTS. Since the
influence of the N-terminal His-tag on the structure or activity of the ArgRS variants could
not be estimated, other variants (D16, C25, D28 and S29) were cloned into a pDEST
plasmid with a C-terminal 6xHis-tag. The expression of all protein variants was under the
control of a T7 promoter in both plasmids.
Figure 53: Protein variants of Rcu mt ArgRS possessing different N-terminal start sites. Schematic overview of the manually introduced cleavage sites that result in the creation of different protein variants, varying in the length of their N-terminal sequence. The variants are named after the corresponding cleavage site (protein P24 for example starts with P24, etc.) and are cloned into a pET28a (red arrows) and pDEST vector (green arrows). The sequence forming an α-helix (blue barrow) and the conserved motif “HIGH” (underlined) are highlighted.
142
18.2. Expression of FL, P24, V30, G36 in E. coli
The gene sequences of full-length ArgRS and variants P24, V30, and G36 were cloned into
a pET28a vector with a N-terminal 6xHis-tag. These constructs were transferred into
BL21 (DE3) and Arctic Express (DE3) E. coli strains. Expression was performed following
the described protocol in 8.6.6. Cell extracts containing the expressed protein variants
were disrupted through sonication, and were centrifuged afterwards. Soluble fractions as
well as cell extract of disrupted cells were loaded and separated in a 10 % SDS-gel.
Protein bands were detected by Western blot analysis using anti-His antibodies (Figure
54). In BL21 cells, only the full-length protein was expressed, however, it was not present
in the soluble fraction. No bands are detected for the other proteins variants suggesting
that they are probably unstable, toxic or are degraded in E. coli BL21.
Figure 54: Solubility test of recombinant expressed protein variants FL, P24, V30, and G36. FL, P24, V30, G36 are expressed in BL21 (DE3) (left) and Arctic Express (DE3) (right). Cell extracts and soluble cell lysate fractions were loaded and separated onto a 10 % SDS-gel and detected by Western blot analysis using anti-His antibodies. The expected size of the Rcu mt ArgRS variants containing the N-terminal His-tag is 58 kDa. Arrows indicate the position of the mt ArgRS variants. Protein ladder was loaded on the lanes designated with “Ladder” (sizes are indicated on the left side of the blots).
Expression in Arctic Express cells leads to an increased solubility at least for variant P24
and V30. The full-length protein is probably also expressed and soluble, but the result
remains unclear due to an overload of corresponding samples onto the gel. Dominant
bands appear at the expected size for ArgRS variants of 58 kDa, except for V30, which
appears to be smaller than expected. A re-sequencing of the corresponding plasmid
revealed a point mutation that introduced an early stop codon resulting in a shorter
amino acid sequence, and thus in a smaller protein size.
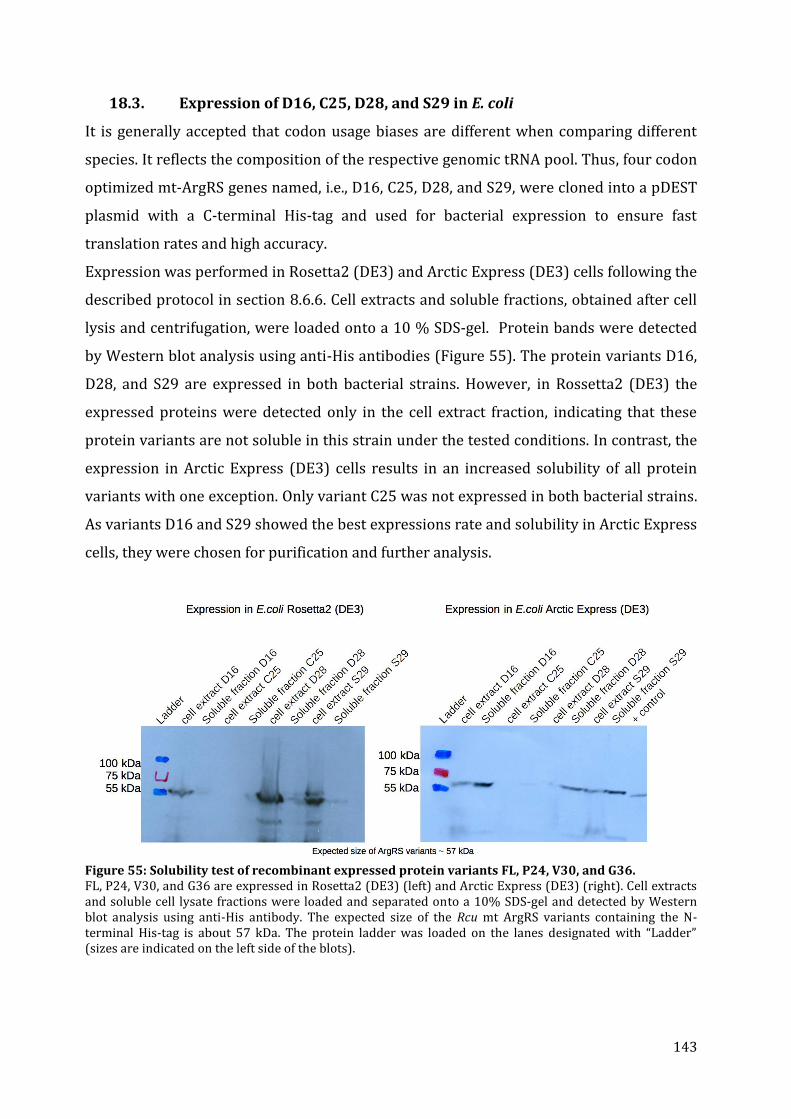
143
18.3. Expression of D16, C25, D28, and S29 in E. coli
It is generally accepted that codon usage biases are different when comparing different
species. It reflects the composition of the respective genomic tRNA pool. Thus, four codon
optimized mt-ArgRS genes named, i.e., D16, C25, D28, and S29, were cloned into a pDEST
plasmid with a C-terminal His-tag and used for bacterial expression to ensure fast
translation rates and high accuracy.
Expression was performed in Rosetta2 (DE3) and Arctic Express (DE3) cells following the
described protocol in section 8.6.6. Cell extracts and soluble fractions, obtained after cell
lysis and centrifugation, were loaded onto a 10 % SDS-gel. Protein bands were detected
by Western blot analysis using anti-His antibodies (Figure 55). The protein variants D16,
D28, and S29 are expressed in both bacterial strains. However, in Rossetta2 (DE3) the
expressed proteins were detected only in the cell extract fraction, indicating that these
protein variants are not soluble in this strain under the tested conditions. In contrast, the
expression in Arctic Express (DE3) cells results in an increased solubility of all protein
variants with one exception. Only variant C25 was not expressed in both bacterial strains.
As variants D16 and S29 showed the best expressions rate and solubility in Arctic Express
cells, they were chosen for purification and further analysis.
Figure 55: Solubility test of recombinant expressed protein variants FL, P24, V30, and G36. FL, P24, V30, and G36 are expressed in Rosetta2 (DE3) (left) and Arctic Express (DE3) (right). Cell extracts and soluble cell lysate fractions were loaded and separated onto a 10% SDS-gel and detected by Western blot analysis using anti-His antibody. The expected size of the Rcu mt ArgRS variants containing the N-terminal His-tag is about 57 kDa. The protein ladder was loaded on the lanes designated with “Ladder” (sizes are indicated on the left side of the blots).
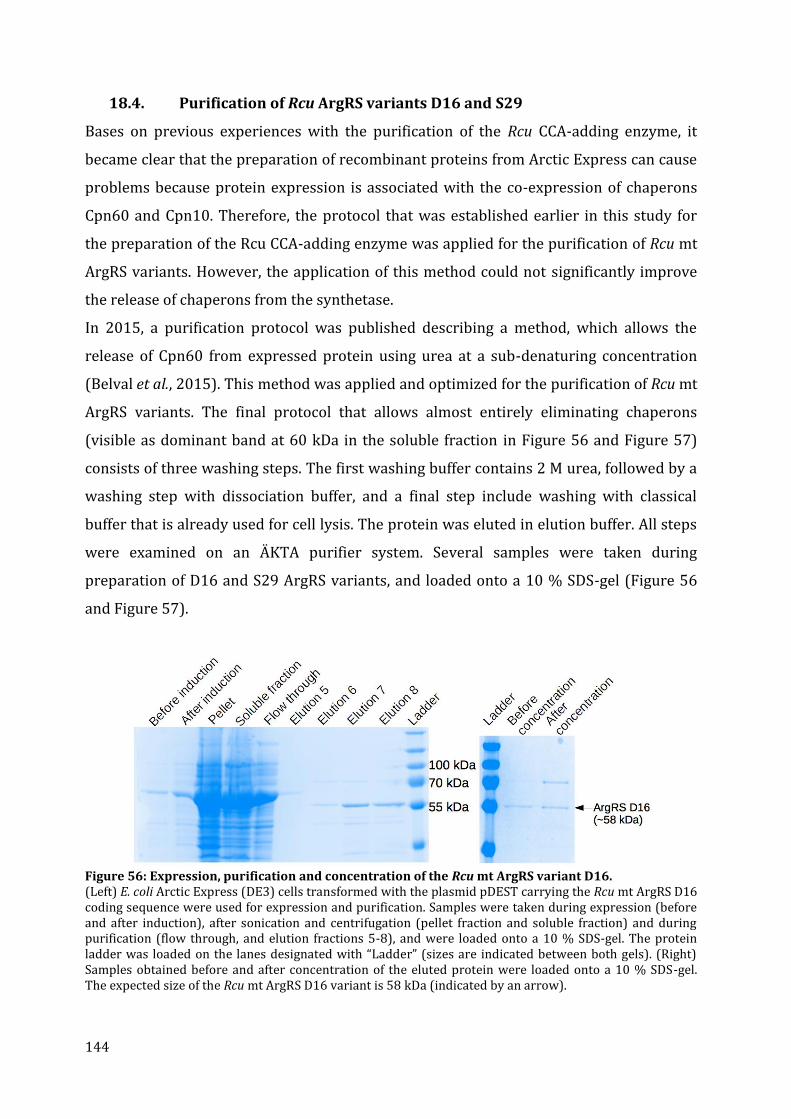
144
18.4. Purification of Rcu ArgRS variants D16 and S29
Bases on previous experiences with the purification of the Rcu CCA-adding enzyme, it
became clear that the preparation of recombinant proteins from Arctic Express can cause
problems because protein expression is associated with the co-expression of chaperons
Cpn60 and Cpn10. Therefore, the protocol that was established earlier in this study for
the preparation of the Rcu CCA-adding enzyme was applied for the purification of Rcu mt
ArgRS variants. However, the application of this method could not significantly improve
the release of chaperons from the synthetase.
In 2015, a purification protocol was published describing a method, which allows the
release of Cpn60 from expressed protein using urea at a sub-denaturing concentration
(Belval et al., 2015). This method was applied and optimized for the purification of Rcu mt
ArgRS variants. The final protocol that allows almost entirely eliminating chaperons
(visible as dominant band at 60 kDa in the soluble fraction in Figure 56 and Figure 57)
consists of three washing steps. The first washing buffer contains 2 M urea, followed by a
washing step with dissociation buffer, and a final step include washing with classical
buffer that is already used for cell lysis. The protein was eluted in elution buffer. All steps
were examined on an ÄKTA purifier system. Several samples were taken during
preparation of D16 and S29 ArgRS variants, and loaded onto a 10 % SDS-gel (Figure 56
and Figure 57).
Figure 56: Expression, purification and concentration of the Rcu mt ArgRS variant D16. (Left) E. coli Arctic Express (DE3) cells transformed with the plasmid pDEST carrying the Rcu mt ArgRS D16 coding sequence were used for expression and purification. Samples were taken during expression (before and after induction), after sonication and centrifugation (pellet fraction and soluble fraction) and during purification (flow through, and elution fractions 5-8), and were loaded onto a 10 % SDS-gel. The protein ladder was loaded on the lanes designated with “Ladder” (sizes are indicated between both gels). (Right) Samples obtained before and after concentration of the eluted protein were loaded onto a 10 % SDS-gel. The expected size of the Rcu mt ArgRS D16 variant is 58 kDa (indicated by an arrow).
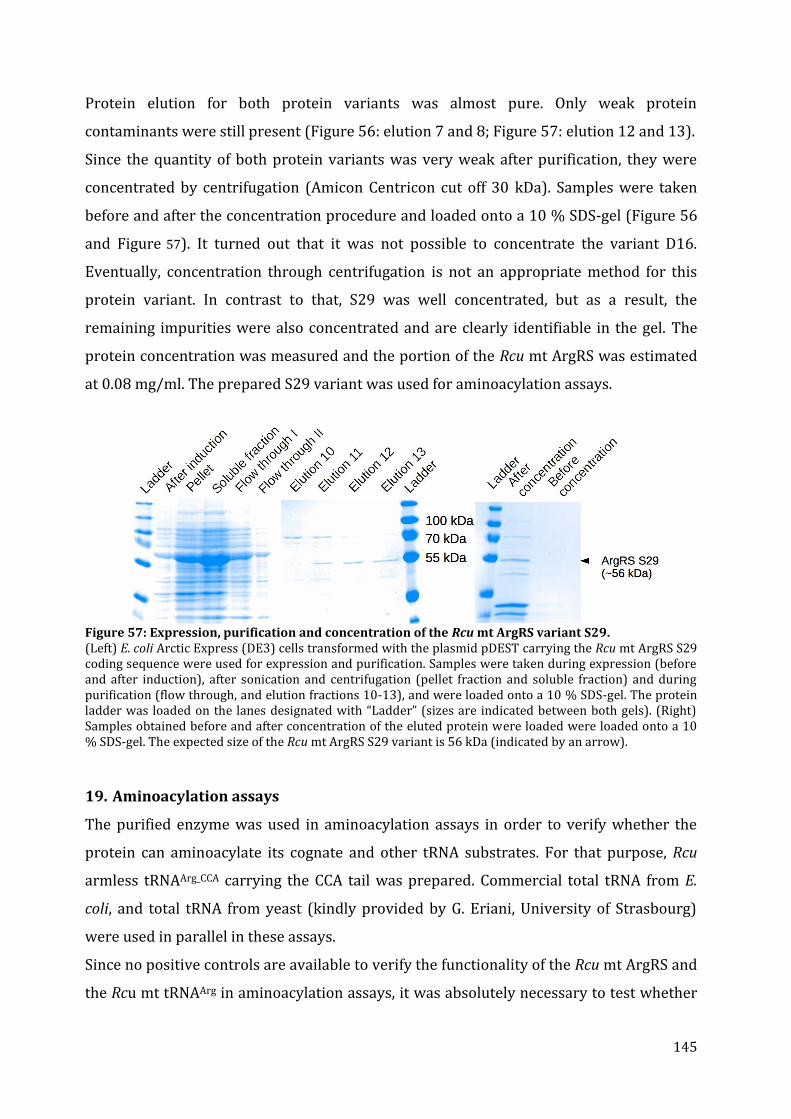
145
Protein elution for both protein variants was almost pure. Only weak protein
contaminants were still present (Figure 56: elution 7 and 8; Figure 57: elution 12 and 13).
Since the quantity of both protein variants was very weak after purification, they were
concentrated by centrifugation (Amicon Centricon cut off 30 kDa). Samples were taken
before and after the concentration procedure and loaded onto a 10 % SDS-gel (Figure 56
and Figure 57). It turned out that it was not possible to concentrate the variant D16.
Eventually, concentration through centrifugation is not an appropriate method for this
protein variant. In contrast to that, S29 was well concentrated, but as a result, the
remaining impurities were also concentrated and are clearly identifiable in the gel. The
protein concentration was measured and the portion of the Rcu mt ArgRS was estimated
at 0.08 mg/ml. The prepared S29 variant was used for aminoacylation assays.
Figure 57: Expression, purification and concentration of the Rcu mt ArgRS variant S29. (Left) E. coli Arctic Express (DE3) cells transformed with the plasmid pDEST carrying the Rcu mt ArgRS S29 coding sequence were used for expression and purification. Samples were taken during expression (before and after induction), after sonication and centrifugation (pellet fraction and soluble fraction) and during purification (flow through, and elution fractions 10-13), and were loaded onto a 10 % SDS-gel. The protein ladder was loaded on the lanes designated with “Ladder” (sizes are indicated between both gels). (Right) Samples obtained before and after concentration of the eluted protein were loaded were loaded onto a 10 % SDS-gel. The expected size of the Rcu mt ArgRS S29 variant is 56 kDa (indicated by an arrow).
19. Aminoacylation assays
The purified enzyme was used in aminoacylation assays in order to verify whether the
protein can aminoacylate its cognate and other tRNA substrates. For that purpose, Rcu
armless tRNAArg_CCA carrying the CCA tail was prepared. Commercial total tRNA from E.
coli, and total tRNA from yeast (kindly provided by G. Eriani, University of Strasbourg)
were used in parallel in these assays.
Since no positive controls are available to verify the functionality of the Rcu mt ArgRS and
the Rcu mt tRNAArg in aminoacylation assays, it was absolutely necessary to test whether
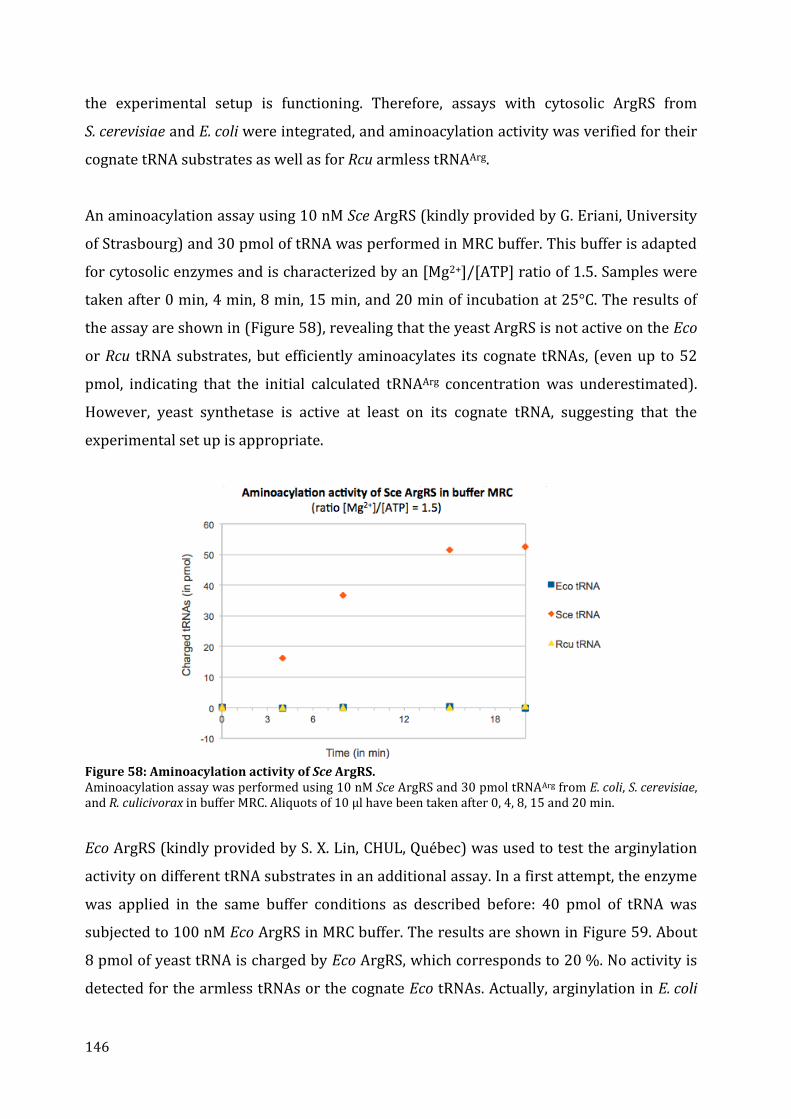
146
the experimental setup is functioning. Therefore, assays with cytosolic ArgRS from
S. cerevisiae and E. coli were integrated, and aminoacylation activity was verified for their
cognate tRNA substrates as well as for Rcu armless tRNAArg.
An aminoacylation assay using 10 nM Sce ArgRS (kindly provided by G. Eriani, University
of Strasbourg) and 30 pmol of tRNA was performed in MRC buffer. This buffer is adapted
for cytosolic enzymes and is characterized by an [Mg2+]/[ATP] ratio of 1.5. Samples were
taken after 0 min, 4 min, 8 min, 15 min, and 20 min of incubation at 25°C. The results of
the assay are shown in (Figure 58), revealing that the yeast ArgRS is not active on the Eco
or Rcu tRNA substrates, but efficiently aminoacylates its cognate tRNAs, (even up to 52
pmol, indicating that the initial calculated tRNAArg concentration was underestimated).
However, yeast synthetase is active at least on its cognate tRNA, suggesting that the
experimental set up is appropriate.
Figure 58: Aminoacylation activity of Sce ArgRS. Aminoacylation assay was performed using 10 nM Sce ArgRS and 30 pmol tRNAArg from E. coli, S. cerevisiae, and R. culicivorax in buffer MRC. Aliquots of 10 μl have been taken after 0, 4, 8, 15 and 20 min.
Eco ArgRS (kindly provided by S. X. Lin, CHUL, Québec) was used to test the arginylation
activity on different tRNA substrates in an additional assay. In a first attempt, the enzyme
was applied in the same buffer conditions as described before: 40 pmol of tRNA was
subjected to 100 nM Eco ArgRS in MRC buffer. The results are shown in Figure 59. About
8 pmol of yeast tRNA is charged by Eco ArgRS, which corresponds to 20 %. No activity is
detected for the armless tRNAs or the cognate Eco tRNAs. Actually, arginylation in E. coli

147
is a well-established system and shows normally excellent aminoacylation activity. We
suspected that commercial purchased Eco tRNAs were damaged or otherwise not useable.
For subsequent experiments, total Eco tRNAs were prepared in house and tested. Test
aminoacylation reactions on freshly prepared Eco tRNAs have been performed by A.
Gaudry, University of Strasbourg (Figure 60).
Figure 59: Aminoacylation activity of Eco ArgRS. Aminoacylation assay was performed using 100 nM Eco ArgRS and 40 pmol tRNAArg from E. coli, S. cerevisiae, and R. culicivorax in buffer MRC. Aliquots of 10 μl have been taken after 0, 4, 8, 15 and 20 min.
Proper buffer conditions for the E. coli enzymes in activity assays have been described
before (Igloi and Schiefermayr, 2009). These protocols revealed an adapted [Mg2+]/[ATP]
ratio of 2.5, but no substantial change of the other buffer components. An adapted buffer
(named MRE) was prepared and tested again with Eco ArgRS and the three different tRNA
substrates. The results are shown in Figure 60.
The enzyme efficiently aminoacylates its cognate tRNA (in house preparation).
Interestingly, the Eco ArgRS does also recognize yeast tRNAs in the adapted MRE buffer.
Up to 58 pmol tRNA are charged, corresponding to an increase of approximately 10-fold,
compared to the test performed with the MRC buffer. These results indicate that arginyl-
tRNA synthetases are probably sensitive to buffer conditions, especially to the
[Mg2+]/[ATP] ratio, which needs apparently to be optimized for every ArgRS.
The E. coli enzyme shows no activity with the Rcu tRNAs. We assume that the armless Rcu
mt tRNAArg represents probably not an appropriate substrate for the E. coli enzyme due to
its extreme size reduction.
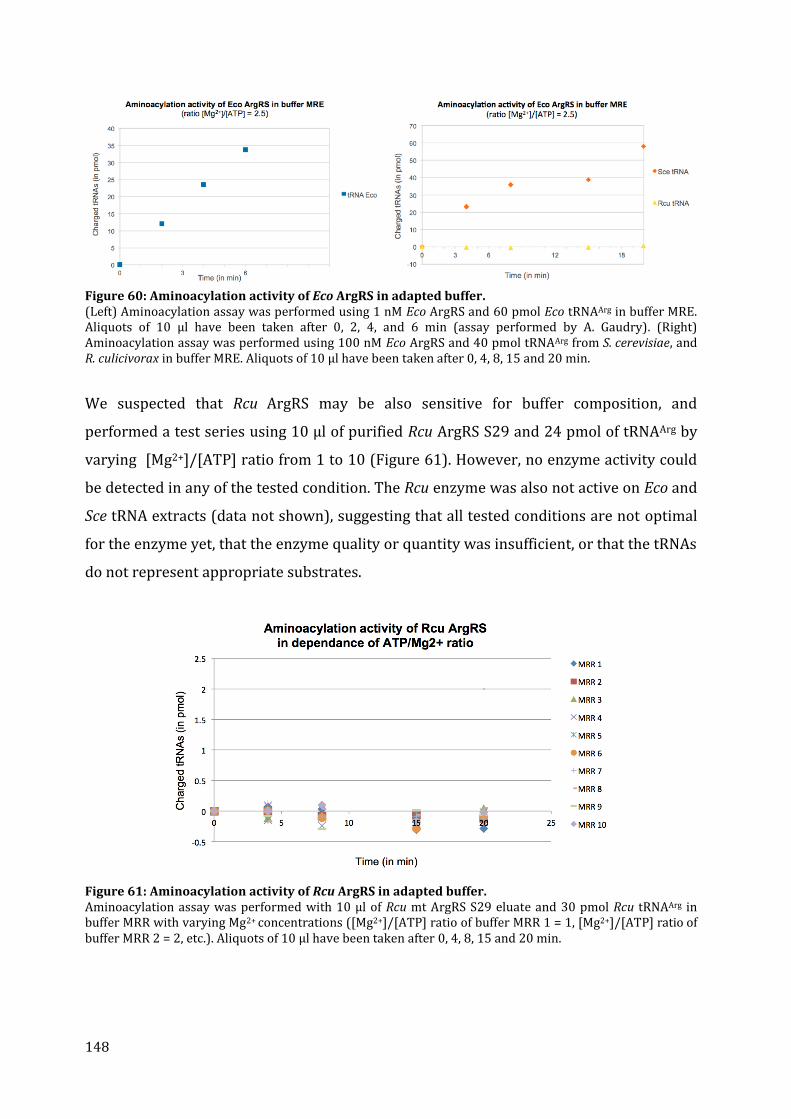
148
Figure 60: Aminoacylation activity of Eco ArgRS in adapted buffer. (Left) Aminoacylation assay was performed using 1 nM Eco ArgRS and 60 pmol Eco tRNAArg in buffer MRE. Aliquots of 10 μl have been taken after 0, 2, 4, and 6 min (assay performed by A. Gaudry). (Right) Aminoacylation assay was performed using 100 nM Eco ArgRS and 40 pmol tRNAArg from S. cerevisiae, and R. culicivorax in buffer MRE. Aliquots of 10 μl have been taken after 0, 4, 8, 15 and 20 min.
We suspected that Rcu ArgRS may be also sensitive for buffer composition, and
performed a test series using 10 µl of purified Rcu ArgRS S29 and 24 pmol of tRNAArg by
varying [Mg2+]/[ATP] ratio from 1 to 10 (Figure 61). However, no enzyme activity could
be detected in any of the tested condition. The Rcu enzyme was also not active on Eco and
Sce tRNA extracts (data not shown), suggesting that all tested conditions are not optimal
for the enzyme yet, that the enzyme quality or quantity was insufficient, or that the tRNAs
do not represent appropriate substrates.
Figure 61: Aminoacylation activity of Rcu ArgRS in adapted buffer. Aminoacylation assay was performed with 10 µl of Rcu mt ArgRS S29 eluate and 30 pmol Rcu tRNAArg in buffer MRR with varying Mg2+ concentrations ([Mg2+]/[ATP] ratio of buffer MRR 1 = 1, [Mg2+]/[ATP] ratio of buffer MRR 2 = 2, etc.). Aliquots of 10 μl have been taken after 0, 4, 8, 15 and 20 min.
149
20. Discussion
20.1. Identification and preparation of Rcu mt ArgRS
The initial (published) annotation predicted two fragments that showed similarity for N-
terminal and C-terminal parts compared to ArgRS sequences from other organism, that
were identified by multiple sequence alignments. Nevertheless, a linker sequence
between both fragments remained unclear, but could successfully be identified by reverse
transcription PCR. In addition, the Rcu mt ArgRS sequence was complemented and
confirmed by an own annotation, based on the original RNA-seq data. These studies led to
the identification of the nucleotide sequence coding for the Rcu mt ArgRS, and revealed
the first complete and verified sequence of an aminoacyl-tRNA synthetase from R.
culicivorax. This protein is available for structural and functional analysis now.
Many proteins that are translated in the cytosol but dedicated to mitochondria, carry
often a N-terminal MTS, which leads to a mature protein after cleavage of the precursor
protein (Schmidt et al., 2010). With regards to protein characterization, the
determination of correct cleavage sites is not only important for efficient expression and
purification of the mature proteins, but also for the determination of their activities.
Several cleavage motifs are known. However, they lack a common consensus sequence
(Gavel and Heijne, 1990). MTSs are often characterized by positively charged amino acids
and may form amphiphilic helices. This and other sequence features are used by
bioinformatics tools for the prediction of cleavage sites (Fukasawa et al., 2015).
It was extremely difficult to identify the precise cleavage site of the Rcu mt ArgRS
sequence. Commonly used prediction tools either did not detected a precise cleavage site
at all (TargetP, Predotar, and TPpred2), or predicted a cleavage site only with a low
probability (MitoProt, MitoFates). In some cases a wrongly predicted cleavage site led to
weak protein amounts after bacterial expression. Only the correction by the removal or
addition of several N-terminal amino acids, as it was the case for the human mt LysRS
(Bullard et al., 2000; Yao et al., 2003) and the human mt AspRS (Gaudry et al., 2012;
Neuenfeldt et al., 2013) led to soluble active proteins. The identification of the correct
cleavage site demands special caution and should be moreover experimentally
determined. For this reason, eight Rcu mt ArgRS variants, which differ in the definition of
their N-terminus of the mature proteins (lacking the putative MTS), were cloned and
tested for expression, purification and activity. However, it should also be considered that
150
the putative MTS of the Rcu mt ArgRS may not be cleaved and that a full-length protein is
active in R. culicivorax.
We observed that most variants were not suitable for expression in BL21 (DE3) and
Rosetta (DE3) E. coli strains, as they were not detectable by Western blot analysis or they
were only present as aggregates in the pellet fraction. The best yield, sufficient for
purification, was obtained by expression in E. coli Arctic Express cells at low temperature
for the protein variants D16, D28, and S29. Several other studies reported already about
the increased solubility of recombinant expressed protein in this bacterial strain (Gopal
and Kumar, 2013; Belval et al., 2015).
However, the main disadvantage of this cell line is that the two cold-adapted chaperons
Cpn60 and Cpn10, which are co-expressed to allow the proper folding of the recombinant
protein, are also often co-purified and thus impair the purity of the eluted protein
solution. An appropriate purification protocol has to be adapted for every recombinant
expressed protein when using this cell line because the described protocols in the
literature and also the newly developed protocol for the purification of the Rcu CCA-
adding enzyme with denatured proteins and dissociation buffer did not led to an
improved purification. The only protocol that finally led to a significantly release from
chaperons consisted of a washing step with 2M urea in combination with a dissociation
buffer. The urea concentration is under denaturing condition, and is compatible with
affinity chromatography on nickel columns (Belval et al., 2015). Only one of the
numerously tested variants, i.e., S29, was finally achieved in very small quantities and
could be used for initial aminoacylation assays.
20.2. Functional characterization of Eco, Sce and Rcu (S29) ArgRS interacting
with armless mt tRNAArg
Aminoacylation assays were performed in order to characterize arginylation activity of
the prepared mt-ArgRS variant S29 from R. culicivorax. The protein was subjected to in
vitro transcribed armless mt tRNAArg_CCA and total tRNA extracts from E. coli and yeast.
Arginylation of Sce and Eco ArgRS have been intensively studied already (Sissler et al.,
1996, 1998; McShane et al., 2016; Tamura et al., 1992; Aldinger et al., 2012), and have
thus been used in this study to monitor and confirm the functionality of the experimental
setup and to perform a comparative analysis of the test results. Eco and Sce ArgRSs have
therefore been tested with their cognate tRNAs as well as with armless tRNAs from
151
R. culicivorax. We confirmed that both cytosolic enzymes recognize their cognate tRNAs
as substrates.
We could also show that the E. coli and yeast enzymes have optimal activities in distinct
buffers with [Mg2+]/[ATP] ratio of 2.5 and 1.5, respectively. This observation is of
particular importance for the E. coli synthetase, where the charging level increases 10-
fold in low [Mg2+]/[ATP] MRE buffer compared to high [Mg2+]/[ATP] MRC buffer. We
conclude that reaction buffers are not only important for maintaining pH and solubility of
enzymes, but also may influence enzyme activity, and therefore need to be carefully
selected and optimized for each aaRS.
However both, Eco and Sce ArgRS, did not recognize the armless tRNAArg from
R. culicivorax. We assume that truncated tRNAs are probably not appropriate substrates
due to missing structural identity elements, which have been reported to be important for
tRNAArg recognition. Indeed, identity elements determine the specific recognition
between aminoacyl-tRNA synthetases and tRNAs (Vasil’eva and Moor, 2007). In most
tRNAs, the majority of recognition determinants are located in the anticodon and the
acceptor stem region (Giegé et al., 1998). In addition to leucine and serine, arginine is
genetically encoded by six different codons, which means that a corresponding synthetase
must be able to recognize six different tRNA molecules with six different anticodons. This
leads to the assumption that additional identity elements are required, beside those
present in anticodons and acceptor stems, to maintain nevertheless specificity (McShane
et al., 2016).
It has been demonstrated for Eco tRNAArg that identity elements are present in three
distinct regions: within C35 and G/U36 in the anticodon loop, within the discriminator base
G73 or C73, which contribute only modestly to recognition, and within A20 in the single-
stranded region of the D-loop (Tamura et al., 1992). A20 is highly conserved among the
tRNAArg species in most organisms (Sprinzl, 1998), and is one of the major identity
elements of tRNAArg (Shimada et al., 2001a). Since classical D-arms and loops are not
present in armless tRNAsArg, arginylation activity of Eco ArgRS seems to be strongly
dependent on the presence of this major recognition element at position 20, and because
it has been shown elsewhere that Eco ArgRS could not recognize animal mt tRNAArg (Buck
and Nass, 1969; Igloi and Leisinger, 2014), it was likely that the Eco enzyme did not
aminoacylate the armless mt tRNAs from R. culicivorax due to the absence of A20.
152
Interestingly, tRNAArg does not exhibit a conserved A20 in S. cerevisiae and most animal
mitochondria. Instead, this nucleotide is often replaced by U, dihydrouridine (D), or C at
position 20 (Sprinzl, 1998). It has been demonstrated that C35 and G/U36 in yeast tRNAArg
are essential for aminoacylation, and therefore represent major identity elements (Sissler
et al., 1996). Rcu tRNAsArg possesses both identity elements (i.e., C35 and U36), and should
therefore theoretically be accepted by Sce ArgRS. However, armless mt tRNAsArg are not
aminoacylated by this enzyme. This leads to the question, whether specific recognition
elements exist for mt arginyl tRNAs. In 2014, Igloi and Leisinger presented a large study
on identity rules of mt tRNAsArg from a wide range of animal taxa, and revealed that
identity elements of metazoan mt tRNAsArg stayed highly conserved during evolution.
Their identity elements resemble those that have been identified for the cytoplasmic
system in yeast. However, the authors hypothesize that alternative identity elements, or a
modulated recognition mechanism may exist for nematode mt tRNAs (Igloi and Leisinger,
2014).
Concerning armless tRNAsArg from R. culicivorax it is possible that major identity elements
are present in the anticodon loop, which is supported by the presence of conserved
nucleotides C35 and U36. It would be interesting to study, and to identify the presence of
possible other identity elements for Rcu tRNAArg, once enzyme activity is determined. For
this purpose, different tRNA mutants that carry point mutations could be prepared and
tested. However, it should be considered that probably not only single nucleotides are
responsible for tRNA recognition, but the whole particular tRNA architectures of armless
tRNAs may play an important role.
So far, no enzyme activity could be obtained for Rcu mt-ArgRS neither with armless mt
tRNAs, nor with cytosolic tRNAs under the tested conditions. Several reasons may be
responsible for this phenomen: (i) It is possible that the quantity or quality of the enzyme
was not sufficient. The preparation of this enzyme variant, i.e., S29, was performed under
suboptimal conditions. Expression was only possible in Arctic Express cells, and yielded
only in low quantities. Additionally, eluted protein was still contaminated by other
proteins, whose impact on structure and functionality of the ArgRS is unknown. Further
investigations are needed to improve the yield and purity of Rcu mt ArgRS.
(ii) It could be possible that S29, which represents the protein variant that is best
producible by protein preparation compared to the other tested protein variants, is only
153
poorly active. Therefore, further protein variants need to be screened to identify
alternatives that can be expressed and purified, and that are suitable for activity analysis.
(iii) Since we were able to show that Eco ArgRS is sensitive to the buffer conditions, we
conclude that adapting buffer conditions is crucial for studies on all involved synthetases.
Therefore, a series of tests with different buffer compositions, varying in the ratio of
[Mg2+]/[ATP], was performed. However, the S29 variant showed no activity under any of
the tested conditions. (iv) The in vitro transcribed tRNA substrates were carefully
prepared, following the described protocol. However, it is still unknown whether Rcu
ArgRS accepts in vitro products, or only in vivo synthesized tRNAs carrying
posttranscriptional modifications. Although, it is usually possible to aminoacylate
unmodified substrates, the impact of modification is still unclear and is maybe much more
important for the stability of armless tRNAs. Each of the mentioned problems still needs
to be further investigated to ultimately perform successful aminoacylation studies.
An interesting alternative assay to classical aminoacylation assays would be binding tests,
in which the affinity of enzymes to the tRNAs could be determined, as described by
(McShane et al., 2016). In such an experiment, also referred to as electrophoretic mobility
shift assay (EMSA), tRNAs and enzymes are incubated together, and separated by
electrophoresis. A shift between both samples (tRNAs with and without enzyme) would
indicate tRNA binding. Since aminoacylation is normally a two-step reaction, one could
additionally detect the activation of amino acids. However, it has been shown that ArgRSs
require usually tRNAs for amino acid activation. If this is a characteristic also for Rcu mt-
ArgRS, it would make this analysis to perform more challenging.
20.3. Co-evolution of Rcu mt ArgRS and armless tRNAs
Once the complete protein sequence of Rcu mt-ArgS was identified, it was compared and
aligned to other ArgRSs of different organisms. A multiple sequence alignment revealed
that the mt-ArgRS sequence that we propose for R. culicivorax, can be assigned to a
subgroup of cytosolic and mitochondrial sequences from eukaryotes, and is more distant
to bacterial ArgRS sequences. The conserved sequence motif “HIGH” and an eqivalent
sequence to the conserved “KMSKS” motif could be identified in this comparison.
Nevertheless, a striking observation was made in the N-terminal region of the nematode
protein. Typically, the N-terminal region contains a structural domain of about 100 amino
acids, which is unique among the class I of aaRSs (Bi et al., 2014). It has been
154
demonstrated by crystal structure analysis that this additional N-terminal domain
interacts with the D-loop of tRNAs, and is thus involved in the recognition of the elbow
region (outer corner of the L-shape), formed by long range D- and T-loop interactions in
classical tRNAs (Cavarelli et al., 1998; Shimada et al., 2001a). A sequence comparison and
an I-TASSER 3D structure prediction demonstrate that this additional domain is not
present in the Rcu enzyme, and seem to be also absent, or at least truncated, in equivalent
enzymes of at least one other nematode (C. elegans). The loss of this structural domain
may indicate a co-evolutionary adaptation to armless tRNAsArg in which the typical elbow
region does not exist.
Interestingly, recent studies revealed that co-evolution interferes with different mutation
rates between mitochondrial and nuclear DNA encoded factors in animals, indicating that
nuclear encoded proteins have a higher mutation rate, and evolve therefore faster than
their cytosolic counterparts (e.g., mitochondrial ribosomal proteins as compared to
cytosolic ribosomal proteins, or mt aaRS compared to cyt aaRS) (Levin et al., 2014; Adrion
et al., 2016). Beside the animal mitoribosome, that seems to compensate reduced RNA
content by an extension of protein content (Sharma et al., 2003; Mears et al., 2006), other
proteins, e.g., involved in interactions with mt tRNAs, are known for their mitochondrial-
nuclear co-evolution. Examples of these proteins, for which co-evolutionary processes
related to truncated mt tRNAs have been reported, are elongation factors EF-Tu1 and EF-
Tu2 in the nematodes C. elegans and Trichinella (Ohtsuki et al., 2001; Arita et al., 2006).
Both, mt EF-Tu1 and mt EF-Tu2, possess a specific C-terminal extension which allows
these enzymes to interact with mt tRNAs lacking T- or D-arms (Watanabe et al., 2014).
Furthermore, one single enzyme, i.e., the mammalian mt SerRS, can recognize canonical
tRNAsSer as well as D-armless mt-tRNAsSer. This particular recognition mechanism is
accomplished through small N- and C-terminal extensions (Chimnaronk et al., 2005). The
given examples show a tendency to an increased protein content in nuclear encoded mt
proteins, which is supposed to compensate for the loss of RNA content in mitochondria
(Suzuki et al., 2001). This is in contrast to the observation that we made for the Rcu mt
ArgRS, where the protein content is reduced. The intended function of an extra domain
(recognition of the elbow region) appears to be no longer necessary for the functionality
of this protein, resulting in a loss of this domain. However, it is possible that this
evolutionary adaptation is not limited to Rcu mt ArgRS, but may also be the case for other
mt ArgRS of species carrying armless mt tRNAs as already indicated in C. elegans.

155
CONCLUSION & PERSPECTIVES
156
21. The role of tRNAs in the RNA world
Since the central dogma of molecular biology was proposed in 1950, the role of RNAs in
protein synthesis has been widely appreciated. Fundamental research has shown how
important different RNAs are for these processes. While mRNAs are essential for the
transcription process and rRNAs built up ribosomes, tRNAs represent the physical linkage
between the genetic code and the amino acid sequence of proteins during translation
(Lodish H, Berk A, Zipursky SL, et al., 2000).
tRNAs and rRNAs belong to the group of non-coding RNAs (ncRNAs), because they are not
translated into a protein. Beside them, a variety of other ncRNAs (e.g., snRNAs, RNAi,
miRNAs, and siRNAs), were shown to be indispensable for many cellular processes
(Mattick and Makunin, 2006).
Even though tRNAs represent one of the oldest molecule discovered in all domains of life,
they are still fascinating study objects (Fujishima and Kanai, 2014). Classical tRNAs are
characterized by a cloverleaf secondary structure, which is composed of 4 domains: the
amino acid accepting stem, the D-arm, the anticodon arm, and the T-arm. Their tertiary
structures resemble the letter “L”. This general structure is mainly conserved over all
kingdoms of life. In eukaryotes, protein translation is not restricted to the nucleus, but
also takes place in organelles, such as chloroplasts and mitochondria. Mitochondria
encode a specific set of tRNAs in their own genome, and possess an appropriate
translation machinery. In contrast to cytoplasmic tRNAs, metazoan mt tRNAs show
unusual structures with reduced sizes, and can even lack complete arms. More and more
unusual mt tRNAs, which exhibit extremely truncated sequences, have been discovered in
different animal lineages over the last years (Yamazaki et al., 1997; Masta, 2000;
Wolstenholme et al., 1987; Jühling et al., 2012b). Truncated mt tRNAs have evolved to an
extreme case in nematode species. The roundworm Romanomermis culicivorax belongs to
the group of nematode species, that were predicted to carry truncated mt tRNAs that even
lack both, D-arm and T-arm, and were thus called “armless” tRNAs. Armless tRNAs were
predicted to be considerably smaller than their cytosolic counterparts with about 45 nt as
compared to 76 nt. This discovery has led to many questions concerning their
functionality as well as the molecular mechanisms of co-evolution that I tended to answer
during this thesis work.

157
21.1. Do armless tRNAs exist in vivo?
The improvement of specialized bioinformatics tools allows now for the detection of
bizarre tRNA genes. This led to the discovery of the shortest tRNA genes identified,
lacking both lateral arms (Jühling et al., 2012a; Jühling et al., 2012b). These discoveries
are mainly based on computational predictions. Structural or functional experimental
validations were not performed for most of these predicted mt tRNAs, so far.
However, S. Wende and colleagues were able to show recently, that such putative tRNA
genes are indeed transcribed in R. culicivorax. They could prove the existence of six of
these armless mitochondrial tRNAs by sequencing of RNA extracts using 5’- and 3’-RACE
PCR (Wende et al., 2014). Each of the identified in vivo transcripts carried the nucleotides
C-C-A at its 3’ end, while not encoded in the mt genome. This study provides therefore
first hints for the existence of functional armless mt tRNAs in vivo. Their structural and
functional characterization were the main objectives of this study. These results lead to a
significant contribution to the knowledge about these specific molecules, whose role has
not been fully elucidated, yet.
21.2. Do armless tRNAs fold into classical structures?
The approaches used in this study provided details about the size and shape of the
armless mt tRNAs, and led to the reconstruction of secondary and tertiary structure
predictions. This allowed us to compare structural properties with those from classical
tRNAs, and to identify the minimal architectural requirements of tRNA structures, that are
still compatible with their functionality.
Based on the performed secondary structure analysis, we conclude that armless mt tRNAs
in R. culicivorax form a hairpin-shaped secondary structure. This includes an internal
double bulge replacing both, D- and T-arms, in the secondary cloverleaf structure as
compared to classical tRNAs. We found no hint for any internal long-range nucleotide
interactions, which could be confirmed by additional NMR measurements. We conclude
that armless mt tRNAs are exclusively composed of classical Watson-Crick bases pairs
forming helices that contribute solely to the formation of secondary structures.
Scattering data obtained from SAXS analysis provided physical parameters that allowed
the reconstruction of low-resolution 3D models. In contrast to the L-shape structure of
cytosolic tRNA, the tertiary structure models of armless tRNAs resemble rather a
158
boomerang-shape. This suggests that armless mt tRNAs possess high intrinsic flexibility,
that can compensate the predicted truncated maximal distance between the extremities
despite their reduced size. Thus, intrinsic flexibility probably facilitates armless tRNAs to
interact with partner proteins, and preserves therefore tRNA biosynthesis and protein
translation processes in nematode mitochondria.
21.1. Are armless tRNAs biological relevant?
During this study, Rcu CCA-adding enzymes and mt ArgRS coding sequences have been
identified, and were cloned for the first time. The recombinant proteins have been studied
for their interaction with cognate and cytosolic tRNAs in CCA-incorporations assays and
aminoacylation assays, respectively. These experiments could be performed only after
establishing appropriate expression and purification protocols. The capacity to recognize
different tRNA substrates has been compared to the activity of heterologous enzymes
from human, yeast, and E. coli.
We could show that the Rcu CCA-adding enzyme is active, and can efficiently recognize
armless tRNAs as well as a cytosolic tRNA, indicating a broad substrate specificity.
However, heterologous Eco and Hsa CCA-adding enzymes seem to be not or only partially
compatible with armless tRNAs. We conclude that the incorporation of nucleotides by
CCA-adding enzymes works best with the cognate enzyme, and that the Rcu enzyme has
adapted to the small size of armless mt tRNA during evolution. This study provides
therefore in vitro evidence for a biological relevance of armless mt tRNAs, especially in
terms of CCA-adding processes.
We supposed that Rcu mt ArgRS possesses a MTS, like many other mt proteins do, to
allow for their import into mitochondria. Many efforts have thus been made to identify a
protein variant (deprived of the putative MTS) that is most compatible with expression
and purification protocols. So far, only one of the different tested enzyme variants, i.e.,
S29, could be obtained in low quantity and quality. However, it could be used for
aminoacylation assays. The results of this initial study reveal that the Rcu enzyme does
not recognize either armless tRNAs, nor cytosolic tRNAs under the tested conditions. A
comparative analysis with cytosolic ArgRS from yeast and E. coli showed that both
enzymes have optimal activities in distinct buffers with [Mg2+]/[ATP] ratio of 2.5 and 1.5,
respectively. These initially obtained data lead to our assumption that reaction buffers
have to be carefully selected and optimized for each ArgRS. Since both, E. coli and yeast
159
ArgRS, do not aminoacylate armless tRNAsArg, we suppose that truncated tRNAs are not
an appropriate substrate, most likely due to missing identity elements.
21.3. Did evolutionary adaptation take place?
Possible co-evolution events have been revealed during this study, concerning mostly
tRNAs and proteins that are partner in the mitochondrial translation machinery.
Identified sequences of the Rcu CCA-adding enzyme, and the mt ArgRS have been
analyzed using multiple sequence alignments, including heterologous enzymes from
different organism as references. Furthermore, bioinformatic structure prediction tools
have been used to build 3D models of these enzymes to provide insights into their co-
evolution with armless tRNAs.
Compared to other class II CCA-adding enzymes, the Rcu CCA-adding enzyme shows high
sequence similarity, especially in its N-terminal catalytic core, while the C-terminal
domain, which is involved in tRNA recognition, is less conserved. A high flexibility of the
C-terminal region may be a possible reason why the Rcu CCA-adding enzyme has adapted
to armless mt tRNAs without losing its ability to recognize cytosolic tRNAs at the same
time. However, it is almost impossible to determine, based only on sequence
comparisons, whether the C-terminal part contains the decisive factor that is responsible
for the recognition of armless tRNAs. This is the case because CCA-adding enzymes
usually show a high degree of variation, but no sequence conservation when comparing
their C-terminal regions among each other. It is conceivable, that through the creation of
protein mutants or protein chimeras, specific elements of the Rcu CCA-adding enzymes
that play a decisive role in the recognition of armless tRNAs, will be identified.
Typically, the structure of ArgRSs contains an additional N-terminal domain. It is involved
in the recognition of the edge-region of tRNAs. Both, Sequence comparison and a 3D
structure prediction highlight that this additional domain is missing in the R. culicivorax
enzyme. It seems that the loss of this structural domain indicates a co-evolutionary
adaptation to armless tRNAArg, for which the typical elbow region does not exist. It will
become possible to explore this hypothesis, once active Rcu mt ArgRS will be obtained.
However, the main structural differences between classical and Rcu mt ArgRS concerning
tRNA recognition are schematically represented in Figure 62. The figure illustrates the
characteristic loss of the N-terminal domain for the Rcu mt ArgRS, in combination with
the ability of armless tRNAs to compensate the typical distances between the acceptor
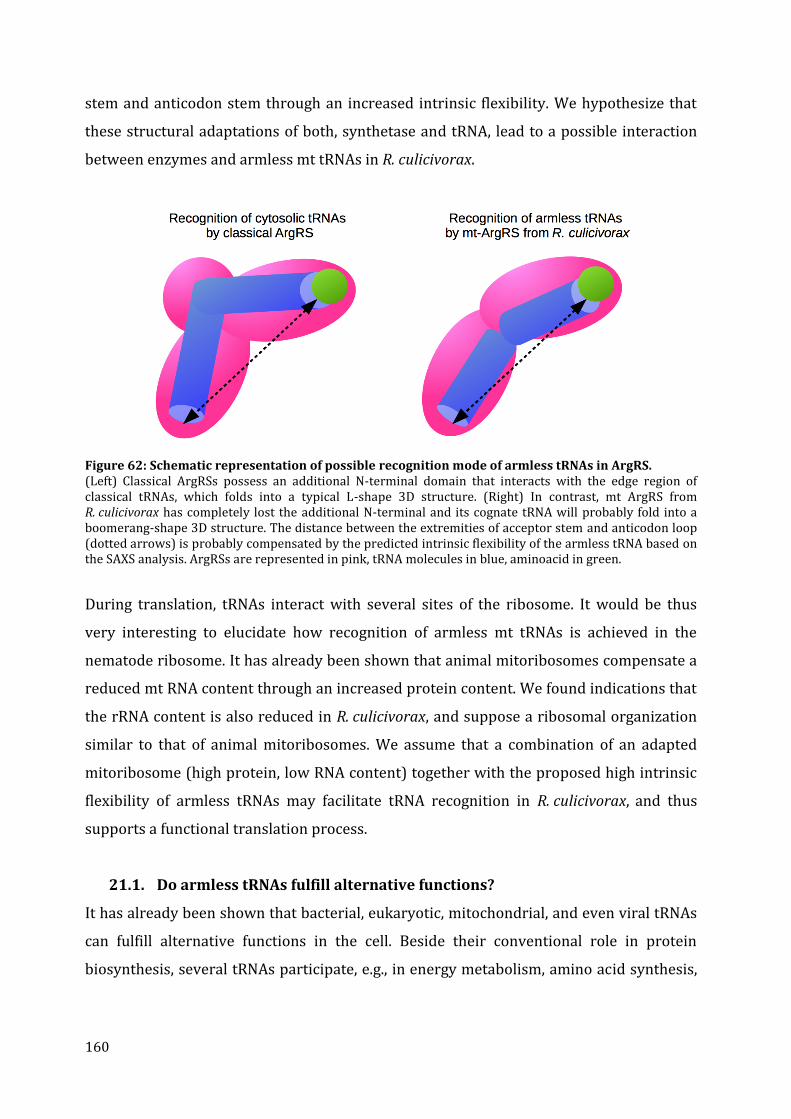
160
stem and anticodon stem through an increased intrinsic flexibility. We hypothesize that
these structural adaptations of both, synthetase and tRNA, lead to a possible interaction
between enzymes and armless mt tRNAs in R. culicivorax.
Figure 62: Schematic representation of possible recognition mode of armless tRNAs in ArgRS. (Left) Classical ArgRSs possess an additional N-terminal domain that interacts with the edge region of classical tRNAs, which folds into a typical L-shape 3D structure. (Right) In contrast, mt ArgRS from R. culicivorax has completely lost the additional N-terminal and its cognate tRNA will probably fold into a boomerang-shape 3D structure. The distance between the extremities of acceptor stem and anticodon loop (dotted arrows) is probably compensated by the predicted intrinsic flexibility of the armless tRNA based on the SAXS analysis. ArgRSs are represented in pink, tRNA molecules in blue, aminoacid in green.
During translation, tRNAs interact with several sites of the ribosome. It would be thus
very interesting to elucidate how recognition of armless mt tRNAs is achieved in the
nematode ribosome. It has already been shown that animal mitoribosomes compensate a
reduced mt RNA content through an increased protein content. We found indications that
the rRNA content is also reduced in R. culicivorax, and suppose a ribosomal organization
similar to that of animal mitoribosomes. We assume that a combination of an adapted
mitoribosome (high protein, low RNA content) together with the proposed high intrinsic
flexibility of armless tRNAs may facilitate tRNA recognition in R. culicivorax, and thus
supports a functional translation process.
21.1. Do armless tRNAs fulfill alternative functions?
It has already been shown that bacterial, eukaryotic, mitochondrial, and even viral tRNAs
can fulfill alternative functions in the cell. Beside their conventional role in protein
biosynthesis, several tRNAs participate, e.g., in energy metabolism, amino acid synthesis,
161
regulation of transcription, translation processes, and protein degradation (Kirchner and
Ignatova, 2015).
Latest studies in RNA research revealed that small non-coding RNAs play an highly
important role in cellular processes. The development of breakthrough next-generation
sequencing (NGS) technologies combined with RNA biochemical studies has dramatically
advanced our understanding of the cellular transcriptome, and revealed the existence of
various different small non-coding RNAs with divers functions (Derks et al., 2014).
Armless mitochondrial tRNAs should be considered as members of this family of
molecules. We can therefore assume that armless tRNAs from R. culicivorax could also
perform alternative functions. Until today, new forms and functions of small non-coding
RNAs are discovered regularly. Almost a new research field has been developed with the
discovery of tRNA-derived fragments, which are involved in a variety of metabolic
processes with different functions in various organisms of all kingdoms of life (Nolte-'t
Hoen et al., 2012; Shigematsu et al., 2014; Pliatsika et al., 2016). It is possible that armless
tRNAs give rise to such tRFs, or function in a similar manner. This demonstrates that
much more work is required to completely understand contribution of armless mt tRNAs
to cellular functions.
22. General conclusion and perspectives
The present work has contributed to decipher structural properties of armless
mitochondrial tRNAs. Furthermore, the functionality of the Rcu CCA-adding enzyme has
been determined. Aminoacylation activity of the Rcu mt ArgRS could not be proven, so far.
Structural particularities of both tRNA interacting partner proteins have been elucidated
and suggest evidence for co-evolutionary adaptation of the proteins and armless tRNAs.
However, this work still represents a starting point for more profound studies as many
questions still remain unanswered.
Since this thesis work was part of a joint PhD program between the University of Leipzig
and the University of Strasbourg, biological aspects concerning armless mt tRNAs and
their interacting partner proteins will be further elucidated in both host laboratories.
In Leipzig, Oliver Hennig will further study and characterize the enzymatic activity of the
Rcu CCA-adding enzyme by determining kinetic parameters during his thesis work.
Characteristic features of armless tRNAs (not only from R. culicivorax) and enzymes
chimeras will play a central role for his work to determine, e.g., recognition modes and
162
parameters. In Strasbourg, Agnès Gaudry will continue to determine optimal assay
conditions to allow a characterization of enzymatic activities of the Rcu mt ArgRS. It
would be also very interesting to analyze characteristic features of other partner proteins
that interact with armless tRNAs in R. culicivorax, such as EF-Tu, RNase Z, or RNAse P.
Here, the group of Philippe Giegé in Strasbourg is already in progress to analyze the mt
RNase P of this interesting nematode worm. Additionally, further studies are needed to
finally verify 3D structures of armless tRNAs in detail. The collaboration with Claude
Sauter (University of Strasbourg) represented already a great starting point for an initial
tertiary structure analysis, but can be continued, e.g., with crystallographic studies. As
shown in this study, armless mt tRNAs are very stable, and may therefore represent
appropriate substrates for crystal structure analysis.
Transfer RNAs play a central role in the origin and evolution of fundamental biological
processes, and have fascinated many scientists for over 60 years now. Since they belong
to the class of RNAs, they have already largely contributed to our understanding in RNA
structure and biology (Phizicky and Hopper, 2015). The fact that tRNAs, and RNAs in
general, have a great influence on our organism is clearly shown by the long list of Nobel
Prize laureates who have been awarded for their work in the field of RNA biology. For
example, for the discoveries concerning the molecular structure of nucleic acids (Wilkins,
Crick and Watson in 1962), for the discovery of the catalytic properties of RNAs (S.
Altman, T. R. Check in 1989), for the discovery of RNA interference (A. Z. Fire and C. C.
Mello in 2006), and for studies of the structure and function of the ribosome (A. Yonath, V.
Ramakrishnan, and Thomas A. Steitz in 2009), just to mention a few of them.
Many other discoveries concerning, e.g., RNA biogenesis, processing and regulation
(reviewed in (Phizicky and Hopper, 2015) are very interesting and crucial for our
understanding of RNA biology. The discovery of armless tRNAs in mitochondria, and their
structural as well as functional characterization, represent also very exciting discoveries
in my opinion.
I am sure that with the development of new technologies or the improvement of already
existing tools (e.g., NGS tools, spectrometric methods, growth conditions, and others),
many new discoveries are just waiting to be investigated, and will further delight our
understanding about tRNA and RNA biology.

163
RÉSUMÉ & ZUSAMMENFASSUNG
164
Résumé
Les ARN de transfert (ARNt) jouent un rôle fondamental dans la biosynthèse des
protéines. Ils sont en effet des partenaires clés de la machinerie ribosomique de la
traduction de l’information génétique en protéines, en fournissant les acides aminés
spécifiques permettant la synthèse progressive de la chaîne peptidique à partir du
message codé sur l’ARN messager. Molécules « adaptatrices » imagées d’un point de vue
théorique comme une nécessité par Francis Crick en 1958 avant même leur découverte,
les ARNt ont fait l’objet d’études incessantes depuis lors et restent aujourd’hui encore au
centre de nombreuses découvertes (Crick, 1955; Phizicky and Hopper, 2015). Ces petits
ARN non codants ont, de manière classique une structure largement conservée avec une
constitution moyenne de 75 nucléotides. Leur structure secondaire ressemble à une
feuille de trèfle, qui se compose de quatre tiges et trois boucles: la tige acceptrice, sur
laquelle sera estérifié l'acide aminé correspondant à l'ARNt, le bras D, le bras de
l'anticodon, qui reconnaît et s'associe aux codons de l'ARN messager, et le bras T. La
structure tertiaire ressemble à la lettre L, l’anticodon étant à l’une des extrémités et la
fixation de l’acide aminé se faisant à l’autre (Giegé et al., 2012). Les structures secondaires
et tertiaires sont complétées par l’action d’une série d’enzymes de maturation et de
modifications post-transcriptionnelles. Les ARNt matures sont alors substrats de la
famille d’enzymes, les aminoacyl-ARNt synthétases, qui chargent les ARNt avec leur acide
spécifique. Chez les eucaryotes, il coexiste une machinerie de synthèse protéique
cytosolique et une machinerie dans les organelles, tels que les chloroplastes et les
mitochondries. Ainsi, il existe également des jeux d’ARNt dédiés à ces synthèses,
partiellement ou totalement codés par les génomes de ces organelles (Salinas-Giegé et al.,
2015). Les mitochondries, en particulier des animaux, codent pour un ensemble complet
d’ARNt dans leur propre génome permettant une traduction appropriée de l’information
génétique de l’ADN mitochondrial.
Alors que les ARNt cytoplasmiques ont des motifs structuraux fortement conservés, les
ARNt des mitochondries des animaux présentent des structures inhabituelles, des
dégénérescences et bizarreries diverses. Nombreux sont ceux qui ont une taille réduite,
ont perdu des éléments de structures typiques, ou ont perdu des domaines complets. Un
165
cas extrême de ces écarts structuraux a été trouvé dans les mitochondries d’Enoplea (une
classe de vers nématodes). Ces ARNt nouvellement découverts sont dépourvus aussi bien
du bras D que du bras T et ont été appelés ARNt "manchots". Romanomermis culicivorax
correspond à un représentant des Enoplea dans le génome mitochondrial duquel de
nombreux gènes d’ARNt prédisent l’existence de tels ARNt manchots (Jühling et al.,
2012b). Des premiers indices quant à l’existence d’ARNt manchots dans des extraits de
R. culicivorax ont rapidement été apportés par le séquençage de petits ARN, et de leur
possible activité biologique, par la démonstration d’un événement de maturation post-
transcriptionnelle, à savoir l’incorporation du triplet terminal CCA non codé par le gène
(Wende et al., 2014).
L’objet de cette thèse concerne la caractérisation d’ARNt "manchots" portant sur leurs
propriétés structurales et l’étude de différents aspects de leur fonctionnalité, en
particulier leur interaction avec deux enzymes partenaires, l’ARNt nucleotidyltransferase
(CCAse) - une enzyme de maturation, et l’aminoacyl-ARNt synthétase. Pour cette étude,
nous avons choisi de caractériser les ARNtArg et ARNtIle mitochondriaux de R. culicivorax.
Dans un premier temps la structure en solution des deux ARNt (obtenu par transcription
in vitro) a été établie. Les approches telles que le sondage enzymatique et chimique, la
spectroscopie de résonance magnétique nucléaire (RMN), et la diffusion des rayons X aux
petits angles (small angle X-ray scattering ou SAXS) ont été utilisées. Ceci a permis de
définir les éléments de structure secondaire, de rechercher des interactions
intramoléculaires ainsi que d’aborder les enveloppes globales de structures
tridimensionnelles. Les protéines partenaires, à savoir la CCAse de R. culicivorax et
l’arginyl-ARNt synthétase mitochondriale ont été identifiés à partir d’un génome
partiellement annoté, et clonés par amplification à partir d’ARN total extrait du ver, et
surexprimées afin de défricher certaines de leurs propriétés fonctionnelles, en particulier
leur capacité à reconnaître les ARNt manchots comme substrats. Ainsi, des essais
d'incorporation de CCA et d'aminoacylation ont été effectués. Certaines propriétés de ces
enzymes sont également comparées à celles des enzymes homologues d’E. coli, de la
levure et de la mitochondrie humaine (en cours d’étude dans les laboratoires hôtes) afin
de décrypter les relations évolutives des couples ARNt manchots/protéines partenaires
de R. culicivorax.

166
Analyse de la structure de deux ARNt manchots
Afin d'étudier la structure des ARNtArg et ARNtIle de R. culicivorax, les gènes
correspondants ont été clonés et les ARN obtenus par transcription in vitro. Trois
approches différentes et complémentaires d’analyses structurales ont été utilisées : i) les
sondages enzymatique et chimique (in-line probing), ii) la spectroscopie RMN et iii) la
diffusion des rayons X aux petits angles (SAXS).
Les approches de sondage enzymatique et chimique sont des méthodes permettant
l'étude de la structure en identifiant les régions de l'ARN en simple ou double brin. Les
résultats de cette analyse ont révélé que les deux ARNt forment une structure secondaire
en forme d’épingle à cheveux comprenant un double renflement (bulge) aux endroits
remplaçant les deux bras latéraux dans une structure secondaire en feuille de trèfle
classique. Les données collectées par cette approche n’ont pas permis de détecter la
présence d'interactions nucléotidiques internes au sein des renflements. Les structures
sont stables et robustes (pas de dégradations, pas de conformations alternatives) malgré
leur composition primaire très biaisée en faveur des nucléotides A et U (76 % et 87 %
pour ARNtArg et ARNtIle respectivement).
En utilisant la spectroscopie RMN qui est une technique puissante pour détecter les
interactions intramoléculaires tertiaires nous pouvons confirmer que les ARNt manchots
possèdent exclusivement des paires de bases classiques Watson-Crick formant les hélices
de la structure secondaire. Aucun signal en faveur de paires de bases inhabituelles n’a été
détecté, suggérant l’absence d’interactions tertiaires dans les zones des renflements. Cette
absence est remarquable puisque de telles interactions servent à stabiliser les structures
3D des ARN et des ARNt en particulier.
Le SAXS nous a servi à mesurer certaines caractéristiques physiques reliées à la forme et
aux dimensions de la structure 3D des ARNt. Cela nous a permis de calculer des formes
3D (enveloppes moléculaires) pour chacun des deux ARNt qui, sans être identiques, sont
très comparables à celles obtenues par l'analyse SAXS d’un ARNt « classique » (ARNtPhe de
levure). Etonnamment, la dimension maximale de ces objets en solution (correspondant à
la distance maximale entre les atomes les plus éloignés dans la structure) est du même
ordre. Une différence concerne une plus grande variabilité des enveloppes pour les ARNt
manchots, suggérant une plus grande flexibilité intrinsèque de la structure 3D.
Les résultats obtenus par les différentes méthodes utilisées montrent que les transcrits in
vitro des ARNt manchots ont apparemment une structure très simple, qui se compose de
167
paires de bases classiques de type Watson-Crick formant deux hélices séparées par un
renflement central, que les structures ne contiennent pas de connexions tertiaires
internes particulières qu'elles sont chimiquement stables et ne conduisent pas à des
structures secondaires alternatives. Au niveau 3D cependant une plus grande
souplesse/flexibilité anticipe une adaptabilité plus importante pour l'interaction avec les
protéines partenaires.
L’ARNt nucleotidyltransferases (CCAse) de R. culicivorax
Habituellement, dans les eucaryotes un seul gène de la CCAse existe codant à la fois pour
l'enzyme cytosolique et une enzyme mitochondriale. L'enzyme mitochondriale est
produite à partir d’un codon d'initiation alternatif et contient une «séquence d’adressage
mitochondrial" (MTS), localisée à l'extrémité N-terminale. La MTS est clivée au cours du
processus d'importation, résultant en une protéine mature. Le seul gène codant pour une
CCAse que nous avons détecté dans le génome nucléaire de R. culicivorax possède un site
de clivage très similaire à celui de l’enzyme humain lequel nous avons utilisé pour le
clonage.
La séquence protéique résultant du gène cloné a été alignée à d’autres CCAses de
différents organismes. Ces alignements ont permis de conforter l’organisation secondaire.
En comparaison avec la CCAse mitochondriale humaine nous constatons une identité de
séquence globale de 46 %. En particulier, le domaine N-terminal, correspondant
classiquement au site catalytique (responsable et de l’addition des nucléotides) a un taux
d’identité élevé (66 %) alors que le domaine C-terminal, dont la fonction est de la
reconnaitre les ARNt, présentent un degré élevé de variation. Les séquences de la bactérie
et de la levure sont plus éloignées de la séquence du ver avec seulement 21 % d’identité.
La séquence du gène de la CCAse a été clonée en vue d’une surexpression et purification
de l’enzyme mature correspondante. Un protocole de purification pour les CCAse
humaines et bactériennes bien établi dans le laboratoire hôte à Leipzig n'a pas pu être
appliqué pour la purification de l'enzyme de R. culicivorax en raison du faible rendement
et de l’impossibilité d’éliminer des contaminants bactériens. Par conséquent, plusieurs
souches bactériennes ont été testées en vue d’une expression suffisante, et un protocole
de purification mis au point. La protéine finalement purifiée et a été testée pour ses
capacités à incorporer des nucléotides C-C-A à l’extrémité 3’ des ARNt manchots
(transcrits in vitro dépourvus du CCA). Pour une analyse comparative, un ARNt classique
168
cytosolique ainsi que les CCAses mitochondriale humaine et d’E. coli ont aussi été
purifiées et testées.
Les résultats montrent que l'enzyme de R. culicivorax est active: elle est capable de
reconnaître les ARNt manchots et reconnaît également les ARNt classiques.
L'incorporation de la séquence CCA se fait de manière complète pour tous les substrats.
Cependant, fait intéressant, les CCAses hétérologues ont beaucoup de difficultés à
reconnaître les ARNt manchots. Alors que l'enzyme humaine reconnaît encore faiblement
les ARNt bizarres et ajoute partiellement les nucléotides CCA, l’enzyme bactérienne ne
reconnaît pas du tout les ARNt manchots comme substrat.
Ces résultats sont en faveur soit d’une adaptation évolutive de l'enzyme du ver à la
structure inhabituelle de ses ARNt mitochondriaux soit d’une coévolution des deux
partenaires. Le fait que l'enzyme d’E. coli ne reconnaisse pas les ARNt mitochondriaux
manchots de R. culicivorax, suggère que l’évolution n’a pas permit à cette enzyme de
s’adapter à ces ARNt non classiques, due à l’absence de mitochondrie chez les bactéries.
Contrairement à l’enzyme humaine, qui elle s’est adapté évolutivement à ses ARNt
mitochondriaux bizarres. D’où leur capacité partielle à reconnaître les ARNt manchots de
R. culicivorax.
L’arginyl-ARNt synthétase (ArgRS) mitochondriale de R. culicivorax
La séquence du gène de l’ArgRS mitochondriale de R. culicivorax a été prédite par
annotation du génome, puis complétée et corrigée par une annotation propre basée sur
les données d'origine RNA-seq et par PCR à transcription inverse. Le gène ainsi défini a
été cloné en vue de la surexpression de la protéine à des fins d’analyse enzymatiques. La
séquence protéique a alors été comparée et alignée à d'autres ArgRS de différents
organismes à l'aide d'outils bio-informatiques. Alors que la séparation entre les grands
groupes d’espèces est peu visible pour les ArgRS, la séquence d’ArgRS que nous
proposons pour R. culicivorax se trouve dans un sous-groupe de séquences cytosoliques
et mitochondriales d’eucaryotes et est très distante des séquences d’ArgRS bactériennes.
Habituellement, la structure secondaire d’une ArgRS est composée d'un domaine
catalytique, d’un domaine de liaison à l’anticodon et d’un domaine N-terminal qui est
impliqué dans la reconnaissance de l’ARNt. Ce dernier domaine est absent dans l’enzyme
de R. culicivorax et est également absent ou tronqué pour les enzymes équivalentes dans
d’autres nématodes. De manière intéressante la reconnaissance de l’ARNt se fait au
169
niveau du coude du L, formé par l’interaction des boucles D et T d’un ARNt classique.
Cette perte pourrait signifier une adaptation aux ARNt manchots (pour lesquels le coude
du L n’existe pas) et représente peut-être un indice pour un événement co-évolutif entre
ARN et protéine partenaire.
Comme d’autres protéines qui sont dédiés aux mitochondries, l’ArgRS porte aussi une
«séquence d’adressage mitochondrial" (MTS) à l'extrémité N-terminale. Dans ce cas il
était plus difficile à identifier le précis site de clivage. Pour cette raison, 8 variantes de
l’ArgRS qui diffèrent dans la définition de l'extrémité N-terminale de la protéine mature
(dépourvue du MTS), ont été clonés et testés pour l’expression, la purification et l’activité.
Nous avons observé que seulement quelques variantes ne s’agrègent pas et juste une
seule variante que nous avons nommé S29, a pu être obtenu en très faibles quantités et a
été testé.
Les tests d’aminoacylation ont été effectués avec l’enzyme purifiée et l’ARNtArg manchot et
l'ARNt totaux d’E. coli et de la levure. Pour contrôler et comparer la fonctionnalité de
l’essai, les ArgRS d’E. coli et de la levure ont été également utilisées et testées avec leurs
ARNt homologues et celui de R. culicivorax. Les enzymes d’E. coli et de la levure ont des
activités optimales dans des tampons distincts, où les rapport [Mg2+]/[ATP] sont de 2,5 et
1,5, respectivement. Alors que nous avons pu confirmer que chacune de ces deux
enzymes reconnaissent leur substrat homologue, mais que aucune de ces deux enzymes
ne reconnait pas le transcrit de l’ARNtArg de R. culicivorax. En outre, l'enzyme de
R. culicivorax n’était active ni avec les ARNt manchots ni avec les ARNt classiques. Cela
peut avoir plusieurs raisons. Entre autre il est possible que la quantité ou la qualité de
l’enzyme ne soit pas suffisante ou que cette enzyme soit également sensible aux
conditions de la réaction. Nous avons donc effectué une série de tests avec des
compositions de tampon différentes. Mais jusqu'à présent l'enzyme ne montre aucune
activité dans les conditions testées.
Conclusion & Perspectives
Nos travaux apportent des éléments en faveur d’une réalité biologique pour les ARNt les
plus petits au monde, du moins en ce qui concerne des informations de structure et la
maturation par la CCAse. Nos travaux ont également permis de déchiffrer des éléments de
coévolution entre les partenariats ARN/protéine de la machinerie traductionnelle des
mitochondries.
170
Grâce aux résultats obtenus on comprend mieux leurs caractéristiques structurelles aussi
bien des ARNt que des deux protéines étudiées. Les approches utilisées dans cette étude
ont fourni des détails sur la taille et la forme des ARNt mitochondriaux manchots. À partir
de ces investigations nous sommes capable de reconstruire une prédiction de structure
secondaire et tertiaire. Cela permet une comparaison avec les structures des ARNt
classiques et d'identifier les éléments les plus minimes d'un ARNt qui sont compatible
avec la vie. En effet, il a déjà été montré que des mini-hélices d’ARNt peuvent être des
substrats pour la CCAse et être aminoacylées. Ceci suggère que la taille et la structure
ARNt manchots tels que découverts dans les Enoplea ne sont peut-être pas les formes les
plus petites d’ARNt qui existent dans le vivant. D'autres études sont nécessaires afin de
résoudre la structure 3D de manière détaillée. À ce jour, aucune structure cristalline
complète d’un ARNt mitochondrial n’existe, ce qui rend cette démarche un challenge
important mais difficile.
Pour la première fois nous avons purifié des protéines recombinantes de R. culicivorax, en
particulier la CCAse et l’ArgRS mitochondriale et nous avons étudié leur interaction avec
les ARNt. Les deux protéines du ver ressemblent en séquence et structure plus à leurs
homologues d’eucaryote en particulier celles d’autres nématodes. Cependant nous avons
identifié des changements structuraux pour les deux enzymes, qui pourraient être
l’expression d’une adaptation aux ARNt manchots.
Concernant la CCAse, il nous reste à vérifier si l'extrémité C-terminale de la CCAse est en
effet un facteur responsable pour l’acceptance des ARNt manchots comme substrat.
Cependant nous pouvons conclure que l'incorporation de nucléotides par la CCAse
fonctionne le mieux avec l'enzyme apparentée comme l’enzyme du ver qui s’est adaptée
apparemment à la taille réduite des ARNt mitochondriaux manchots au cours de
l'évolution.
L’étude de l’arginyl-ARNt synthétase nous a fourni des indications en termes de
coévolution des protéines. Concernant le changement structural de l’ArgRS, il semble que
la perte du domaine N-terminal soit une adaptation évolutive à la perte des deux bras de
cet ARNt bizarre. Nous serons en mesure d’explorer cette hypothèse, une fois qu’une
ArgRS mitochondriale active de R. culicivorax sera obtenue. Au cours des tests
d’aminoacylation les autres enzymes d’E. coli et de la levure ont aminoacylé les ARNt
classiques mais pas l’ARNt manchot, nous en concluons que sa déviation structurelle est
probablement trop extrême pour ces enzymes.
171
Enfin, les petits ARN non-codants jouent un rôle de plus en plus important dans notre vie.
Ils sont impliqués dans une variété des processus métaboliques avec différentes
fonctions. Les petits ARNt mitochondriaux manchots devrait faire partie à ce membre de
cette famille de molécules. Nous pouvons donc supposer que les ARNt manchots de
R. culicivorax peuvent également exécuter des fonctions alternatives. Leur caractérisation
structurale et fonctionnelle mène certainement à une contribution importante à ces
molécules spécifiques dont leur rôle n'a pas encore été complètement élucidé.
172
Zusammenfassung
Transfer RNAs (tRNAs) übernehmen eine wichtige Rolle bei der Proteinbiosynthese,
indem sie die spezifischen Aminosäuren für die schrittweise Synthese der Peptidkette
bereitstellen und somit als Bindeglied zwischen dem genetische Code der Boten-RNA
(mRNA) und der Aminosäuresequenz der Proteine fungieren. Bereits vor ihrer
Entdeckung um 1958, wurde die Notwendigkeit bestimmter "Adapter" Moleküle von
Francis Crick vorausgesagt (Crick, 1955). Seitdem waren diese faszinierenden Moleküle
von entscheidender Bedeutung für viele Entdeckungen und sie sind nach wie vor Zentrum
zahlreicher Studien (Phizicky and Hopper, 2015). Diese kleinen nicht-codierende RNAs
besitzen eine charakteristische hoch konservierte Struktur mit durchschnittlich 75
Nukleotiden. Die Sekundärstruktur ähnelt einem Kleeblatt, das aus vier Domänen besteht:
dem Akzeptor-Stamm, auf dem die Aminosäure an die tRNA geladen wird, dem D-Arm,
dem Anticodon-Stamm, welcher die Codons der mRNA erkennt und verbindet, und dem
T-Arm. Die Tertiärstruktur gleicht dem Buchstaben L, wobei der Anticodon-Stamm die
eine Achse und der Akzeptor-Stamm die andere Achse der L-Struktur bildet (Giegé et al.,
2012). Sekundär- und Tertiärstruktur werden von zahlreicher Reifungs- und
Modifikationsenzymen erkannt und prozessiert. Reife tRNAs sind auch Substrate von
Aminoacyl-tRNA-Synthetasen. Diese Familie von Enzymen beladen die tRNA mit ihrer
spezifischen Aminosäure. In Eukaryoten koexistiert neben der zytosolischen
Proteinsynthesemaschinerie auch solch eine Maschinerie in den Organellen, wie den
Chloroplasten und den Mitochondrien. Folglich gibt es ein zusätzliches Set an tRNAs,
welches komplett oder teilweise auf dem Genom dieser Organellen kodiert ist und für
deren Proteinsynthesen bestimmt ist. Vor allem tierische Mitochondrien, kodieren einen
vollständigen Satz von tRNAs in ihrem eigenem Genom, welches für die richtige
Übersetzung der genetischen Information der mitochondrialen DNA verantwortlich ist
(Salinas-Giegé et al., 2015).
Während die zytosolischen tRNAs hochkonservierte Strukturmotive haben, zeigen die
tRNAs von tierischen Mitochondrien ungewöhnlichen Strukturen und Eigenarten. Viele
mitochondriale tRNAs haben eine reduzierte Größe und typische Strukturelemente sind
teileweise oder komplett verloren gegangen. Ein extremer Fall dieser minimalisierten
tRNAs wurde in den Mitochondrien von Enoplea, welche zur Klasse der Nematoden
gehören, gefunden. Diesen neu entdeckten tRNAs fehlen sowohl der D-Arm, als auch der
173
T-Arm. Sie wurden deshalb „armlose“ tRNAs genannt. Der Rundwurm Romanomermis
culicivorax ist ein typischer Vertreter der Enoplea, in dessen mitochondrialem Genom
solche armlosen tRNAs vorhergesagt wurden (Jühling et al., 2012b). Die Existenz dieser
armlosen tRNAs wurde durch Sequenzierung von RNA Extrakten aus R. culicivorax
nachgewiesen. Außerdem konnte gezeigt werden, dass zumindest ein post-
transkriptioneller Reifungsprozess erfolgt, was auf eine mögliche biologische Aktivität
der kleinen tRNAs hindeutet (Wende et al., 2014).
Das Ziel dieser Arbeit ist die Charakterisierung von „armlosen“ tRNAs. Dabei sollen vor
allem ihre strukturellen Eigenschaften und ihrer Funktionalität, insbesondere in Bezug
auf ihre Interaktion mit Partnernproteinen, wie der tRNA-Nukleotidyltransferase und der
Aminoacyl-tRNA-Synthetase untersucht werden. Für diese Studie wurden beispielhaft die
armlose mitochondriale tRNAArg und tRNAIle aus R. culicivorax charakterisiert. Zunächst
wurde die Struktur der beiden tRNAs, die durch in vitro Transkription hergestellt wurden,
mit Hilfe verschiedener Methoden, wie dem enzymatischen und chemischen Probing, der
Kernspinresonanzspektroskopie (NMR) und der Kleinwinkel-Röntgenstreuung (SAXS)
analysiert. Dies erlaubte uns ihre Sekundärstruktur zu definieren, sowie intramolekulare
Wechselwirkungen und den globalen Umfang ihrer dreidimensionalen Struktur zu
bestimmen. Die Partnerproteine, wie die tRNA-Nukleotidyltransferase und die Arginyl-
tRNA-Synthetase, wurden aus dem teilweise annotiertem Genom von R. culicivorax
kloniert und exprimiert. Darüber hinaus wurden einige ihrer Eigenschaften identifiziert,
vor allem in Bezug auf ihre Funktionalität gegenüber armlosen tRNAs. So wurden z.B.
CCA-Additionstest und Aminoacylierungstest durchgeführt. Die strukturellen und
funktionellen Eigenschaften wurden mit denen homologer Proteine aus E. coli, der
Bäckerhefe (S. cerevisiae) und denen aus humanen Mitochondrien (die ebenfalls in den
jeweiligen Arbeitsgruppen untersucht werden) verglichen. Dies gab uns auch die
Möglichkeit die evolutionären Beziehungen von zwischen armlosen tRNAs und ihren
Partnerproteinen aus R. culicivorax zu charakterisieren.
Strukturanalyse von armlosen mitochondrialen tRNAs
Um die Struktur der mt tRNAArg und tRNAIle aus R. culicivorax zu untersuchen, wurden die
entsprechenden Gene kloniert und durch in vitro Transkription hergestellt. Drei
174
verschiedene Methoden wurden für eine komplementäre Strukturanalysen verwendet: i)
enzymatisches und chemisches Probing, ii) NMR-Spektroskopie und iii) SAXS.
Enzymatisches und chemisches Probing sind spezifische Verfahren, um einzel- oder
doppelsträngige Bereiche in der Sekundärstruktur einer RNA zu identifizieren. Die
Ergebnisse dieser Analysen zeigen, dass beide tRNAs eine Haarnadel-ähnliche
Sekundärstruktur bilden mit einer zentralen Ausbuchtung (bulge), die die beiden
seitlichen Arme in einer klassischen Kleeblattstruktur ersetzt. Die Ergebnisse dieser
Methoden zeigen auch, dass offenbar keine internen Wechselwirkungen der Nukleotide
innerhalb der Ausbuchtung gebildet werden. Die Strukturen sind stabil und robust (keine
Beschädigungen, keine alternativen Konformationen) trotz ihrer primären, sehr
einseitigen Zusammensetzung aus A und U Nukleotiden (jeweils 76 % und 87 % für
tRNAArg und tRNAIle).
Mittels NMR-Spektroskopie, welches eine sehr gute Methode ist, um tertiäre
intramolekulare Wechselwirkungen zu identifizieren, konnten wir bestätigen, dass die
armlosen tRNAs für die Ausbildung der Sekundärstruktur ausschließlich klassische
Watson-Crick-Basenpaarungen eingehen. Es wurde kein Signal für ungewöhnliche
Basenpaarungen nachgewiesen, was auf eine Abwesenheit von tertiären
Wechselwirkungen in dem Bereich der Ausbuchtung hindeutet. Solche
Wechselwirkungen werden normalerweise oft für die Stabilisierung der 3D-Strukturen
von RNAs und insbesondere tRNAs eingesetzt.
Mit Hilfe von SAXS wurden einige interessante physikalische Eigenschaften der tRNA, wie
Größe, Form, sowie die Dimension ihrer 3D-Struktur gemessen. Dadurch konnten wir 3D-
Modelle mit niedriger Auflösung konstruieren, und diese mit dem 3D-Modell einer
„klassischen“ tRNA vergleichen, das ebenfalls mittels SAXS generiert wurde. Obwohl die
3D-SAXS Modelle der armlosen tRNAs mit der einer „klassischen“ tRNA (tRNAPhe aus der
Hefe) nicht identisch sind, sind sie in ihrer Form doch sehr ähnlich. Ein erster
offensichtlicher Unterschied, den wir festgestellt haben, betrifft die größere Variabilität
des Umfangs der armlosen tRNAs, welches auf eine größere innere Flexibilität hindeutet.
Was dazu führt, dass die 3D Struktur der armlosen tRNAs nicht einer typischen L-Form,
sondern eher einer „Boomerang-Form“ ähnelt.
Die Ergebnisse der unterschiedlichen Methoden, zeigen dass die in vitro transkribierten
armlosen tRNAs offenbar eine sehr einfache Struktur haben, die sich aus zwei Helices mit
klassischen Watson-Crick Basenpaarungen zusammengesetzt. Die zwei Helices werden
175
durch eine zentrale Ausbuchtung getrennt, die keine spezifischen internen tertiären
Basenpaarungen enthält. Die Struktur der armlosen tRNAs ist chemisch stabil und bildet
augenscheinlich keine alternativen Sekundärstrukturen. Jedoch nehmen wir aufgrund der
konstruierten 3D-Struktur eine größere Flexibilität für die Interaktion mit
Partnerproteinen an.
Die tRNA Nukleotidyltransferase (CCA-addierendes Enzym) aus R. culicivorax
Die CCA-Sequenz am 3‘-Ende einer tRNA ist eine wichtige Voraussetzung für deren
Aminoacylierung. Sie ist in den meisten Organismen nicht kodiert, sondern wird mit Hilfe
des CCA-addierenden Enzyms post-transkriptionell addiert (Betat et al., 2010).
Üblicherweise existiert bei Eukaryoten ein Gen, welches sowohl für das zytosolische, als
auch das mitochondriale kodiert. Das mitochondriale Enzym wird von einem alternativen
Startcodon transkribiert und enthält eine mitochondriale Import-Sequenz (mitochondrial
Targeting-Sequence, MTS) am N-terminalen Ende. Die MTS wird während des
Importprozesses gespalten, wodurch ein „reifes“ Protein entsteht. Das für das CCA-
addierende Enzym kodierende Gen, welches wir in dem Kerngenom von R. culicivorax
identifiziert haben, besitzt eine Spaltungsstelle, die der des menschlichen Enzyms sehr
ähnlich ist. Diese Spaltungsstelle wurde für eine Klonierung des Gens verwendet. Die
Proteinsequenz des CCA-addierendes Enzyms aus R. culicivorax wurde mit der von
homologen Proteinen aus anderen Organismen verglichen. Im Vergleich mit dem human
mitochondrialen CCA-addierenden Enzym konnten wir eine 46 %-ige Sequenzidentität
feststellen. Insbesondere der N-Terminus, der typischerweise, die katalytisch aktiven
Domänen enthält (Erkennung und die Prozessierung der tRNAs) ist zu 66 % identisch,
während die C-terminale Domäne, ein erhöhtes Maß an Variabilität darstellt. Die
Sequenzen der entsprechenden Enzyme aus E. coli und S. cerevisiae sind jeweils nur mit
21 % zu der Proteinsequenz aus R. culicivorax identisch.
Die Gensequenz des CCA-addierenden Enzyms wurde für die Überexpression und
Reinigung des entsprechenden Enzyms kloniert. Reinigungsprotokolle, welche bereits für
das humane und das bakteriellen CCA-addierende Enzym in der Leipziger Arbeitsgruppe
etabliert waren, konnten aufgrund von niedriger Ausbeute und bakteriellen
Verunreinigungen für die Reinigung des Enzyms aus R. culicivorax nicht übernommen
werden. Es wurden daher mehrere Bakterienstämme getestet, um eine ausreichende
Expression zu erzielen und alternative Reinigungsprotokolle wurden dementsprechend
176
entwickelt. Ein Protokoll, welches die Verwendung eines speziellen Dissoziationspuffers
enthielt, gefolgt von einer Gelfiltration führte zur erfolgreichen Reinigung des Proteins.
Das gereinigte Protein wurde im Hinblick auf seine Kapazität getestet, die CCA Sequenz an
das 3'-Ende der armlosen tRNAs zuzufügen. Für eine vergleichende Analyse, wurden
zusätzlich zu den armlosen tRNAs auch eine klassisches zytosolische tRNA verwendet.
Außerdem wurde das humane sowie ein bakterielles CCA-addierende Enzym gereinigt
und getestet.
Die Ergebnisse dieser Tests zeigen, dass das R. culicivorax Enzym in der Lage ist, sowohl
die armlosen tRNAs als auch die klassischen tRNAs zu erkennen und zu prozessieren. Die
Einarbeitung der CCA-Sequenz ist für alle Substrate vollständig abgeschlossen.
Interessanterweise haben im Gegensatz dazu die heterologen Enzyme große
Schwierigkeiten die armlosen tRNAs zu erkennen. Während das humane Enzym diese
tRNAs noch schwach erkennt und teilweise Nukleotide einbaut, nimmt das bakterielle
Enzym die beiden armlosen tRNAs als Substrat nicht an. Das CCA-addierenden Enzym aus
R. culicivorax, hat demzufolge ein großes Substratspektrum. Im Gegensatz dazu toleriert
das bakterielle Enzym keine strukturellen Varianten. Anscheinend begünstigte eher eine
„leichte adaptive“ Evolution das Enzym aus R. culicivorax diese große Substratvarianz zu
akzeptieren und nicht unbedingt eine komplette und uneingeschränkte Anpassung nur an
armlose tRNAs.
Die mitochondrialen Arginyl-tRNA-Synthetase (ArgRS) aus R. culicivorax
Die Gensequenz der mt ArgRS aus R. culicivorax wurde durch reverse Transkriptions-PCR
identifiziert und konnte durch eine eigene Annotation von originalen RNA-seq Daten
bestätigt werden. Die Proteinsequenz wurde mittels bioinformatischer Methoden mit
ArgRS Sequenzen aus verschiedenen Organismen verglichen. Die Familie der ArgRSs hat
eine komplexe Evolutionsgeschichte ohne eindeutig erkennbare Cluster. Die identifizierte
ArgRS Sequenz aus R. culicivorax ist von einer bakteriellen Untergruppe weit entfernt,
kann aber zu den zytosolischen und mitochondrialen Sequenzen von eukaryotischen
Organismen eingeordnet werden. Durch diesen Vergleich haben wir eine interessante
Eigenschaft für das Protein feststellen können. Üblicherweise besteht die Proteinstruktur
einer ArgRS aus einer katalytischen Domäne, einer Bindungsdomäne und einer N-
terminalen Domäne, die die Ellenbogenregion in der L-Struktur einer herkömmlichen
tRNA erkennt, welche durch die Wechselwirkung der D- und T-Schleifen gebildet wird.
177
Diese N-terminale Domäne ist nicht länger in der Struktur des Enzyms aus R. culicivorax
vorhanden und fehlt teilweise oder ganz auch in der ArgRS Proteinsequenz von anderen
Nematoden. Dieser Verlust könnte auf eine mögliche Anpassung auf armlose tRNAs (für
die die Ellbogenregion nicht existiert) hindeuten und könnte auch ein Hinweis auf ein ko-
evolutionäres Ereignis zwischen RNA und Proteinpartner darstellen.
Proteine, welche im Zytosol translatiert, aber zu den Mitochondrien transportiert werden,
tragen in der Regel am N-Terminus eine "mitochondriale Import-Sequenz" (MTS). Die
MTS wird während des Importprozesses abgespalten, wodurch ein „reifes“ Protein
resultiert. Oftmals ist es schwierig, die spezifische Spaltungsstelle zu identifizieren, da die
MTS in ihrer Aminosäurezusammensetzung und -länge variiert. Um ein funktionelles
rekombinantes Protein zu erhalten, wurden 8 ArgRS-Varianten, die sich in der Länge
ihrer N-terminalen Sequenz unterscheiden, kloniert und ihre Eigenschaften bezüglich
Expression, Reinigung und Aktivität getestet. Wir stellten fest, dass nur einige Varianten
während der Expression nicht aggregieren. Die Variante, die sich am besten reinigen und
konzentrieren ließ war S29 und wurde für nachfolgende Experimente verwendet.
Aminoacylierungstests wurden mit dem gereinigten Enzym und der armlosen tRNAArg
durchgeführt. Um die Funktionalität des Versuchs zu kontrollieren, wurde ein
Vergleichstest mit der ArgRS aus E. coli und Hefe und deren homologe tRNAs, sowie der
amlosen tRNAArg aus R. culicivorax durchgeführt. Die ArgRS aus E. coli und Hefe haben
optimale Aktivitäten in unterschiedlichen Puffern, die sich hauptsächlich im [Mg2+]/[ATP]
Verhältnis unterscheiden. Wir konnten zeigen, dass beide Enzyme ihre eigenen tRNAs,
aber nicht diese von R. culicivorax aminoacylieren. Das R. culicivorax Enzym hat weder die
armlosen tRNAs noch die klassischen tRNAs als Substrat erkannt. Dafür können mehrere
Ursachen in Frage kommen. Zum Einem ist es möglich, dass die Enzymkonzentration oder
Qualität nicht ausreichend waren oder dass es, wie das E. coli Enzym empfindlich
gegenüber Reaktionsbedingungen ist. Wir führten daher eine Reihe von Tests mit
verschiedenen Pufferzusammensetzungen durch. Bisher konnte aber in keinem der
getesteten Reaktionsbedingungen Enzymaktivität nachgewiesen werden.
Fazit und Ausblick
Wir konnten zeigen, dass die kleinsten tRNA der Welt eine funktionelle Rolle haben,
zumindest was die Prozessierung mit CCA-addierenden Enzymen betrifft und sie somit
wahrscheinlich eine echte biologische Bedeutung haben.
178
Mit Hilfe der erzielten Ergebnisse können wir nun ihre strukturellen Eigenschaften besser
charakterisieren. Dank der in dieser Studie verwendeten Methoden können wir nun
genaue Angaben über die Größe und Form der armlosen mt tRNAs machen. Wir sind in
der Lage eine detaillierte Sekundärstruktur Vorhersage zu konstruieren. Dies ermöglicht
einen Vergleich mit den klassischen tRNAs und die kleinst-möglichen Strukturelemente
einer tRNA zu identifizieren, die mit dem Leben kompatibel sind. Darüber hinaus sind
weitere Untersuchungen notwendig, um die 3D-Struktur mehr im Detail aufzuklären, was
dazu beitragen wird, die Funktionalität von armlosen tRNA besser zu verstehen. Da
bisher noch keine vollständig aufgelöste Kristallstruktur einer mt tRNA existiert, stellt
dieses Vorhaben eine schwierige, aber sehr spannende Herausforderung dar.
In dieser Studie wurden zum ersten Mal rekombinante Proteine aus R. culicivorax,
nämlich das CCA-addierenden Enzymen und die mt ArgRS, exprimiert und gereinigt.
Sequenz und Struktur beide Proteine ähneln mehr ihren eukaryotischen als bakteriellen
Homologen, insbesondere denen aus anderen Nematoden. Allerdings konnten wir auch
strukturelle Veränderungen für beide Enzyme feststellen, welche eine Anpassung an die
armlosen tRNAs darstellen könnte. Es muss noch überprüft werden, ob das nicht-
konservierten C-terminale Ende des CCA-addierenden Enzyms tatsächlich eine
Bedeutung für die Akzeptanz von armlosen tRNAs als Substrat hat, oder ob andere
Faktoren eine Rolle spielen. Was die mt ArgRS betrifft, so scheint es, dass der Verlust der
N-terminalen Domäne eine evolutionäre Antwort auf den Verlust der beiden Arme dieser
seltsamen tRNA ist. Der Nachweis von enzymatischer Aktivität für die ArgRS aus
R. culicivorax würde diese Hypothese endgültig unterstützen.
Während dieser Arbeit wurde die Interaktion zwischen den in der Translation beteiligten
tRNAs und zwei ihrer Partnerproteinen untersucht. Die Analyse des CCA-addierenden
Enzyms und der Arginyl-tRNA Synthetase bietet interessante Einblicke in Bezug auf die
Koevolution von Proteinen. So konnten wir feststellen, dass der Nukleotideneinbau bei
armlosen tRNAs am besten mit verwandten CCA-addierenden Enzym aus R. culicivorax
funktioniert, welches sich offenbar erfolgreich auf die reduzierte Größe der armlosen
mitochondrialen tRNA im Laufe der Evolution angepasst.
Während der Aminoacylierungstests zeigte die ArgRS aus R. culicivorax bisher keine
Aktivität unter den getesteten Bedingungen. Wir schließen daraus, dass wir die
Testbedingungen, sowie die Menge und Qualität des Enzyms optimieren müssen.
179
Letztendlich, spielen kleine nicht-kodierende RNAs eine immer größere Rolle in unserem
Leben, da sie mit einer Vielzahl an unterschiedlichen Funktionen an wichtigen
Stoffwechselprozessen beteiligt sind. Kleine mt armlose tRNAs kann man auch zu den
Mitgliedern dieser Familie von Molekülen zählen. Neben ihrer zentralen Rolle in der
Proteinsynthese, haben einige tRNAs auch alternative Funktionen. Ihnen wurde z.B. der
Einfluss auf Replikation, Transkription oder Proteinexpression nachgewiesen. Man kann
deshalb vermuten, dass die armlosen tRNAs aus R. culicivorax eventuell auch noch
alternative Funktionen ausführen. Ihre strukturelle und funktionelle Charakterisierung
führt sicherlich zum besseren Verständnis diese spezifischen Moleküle.
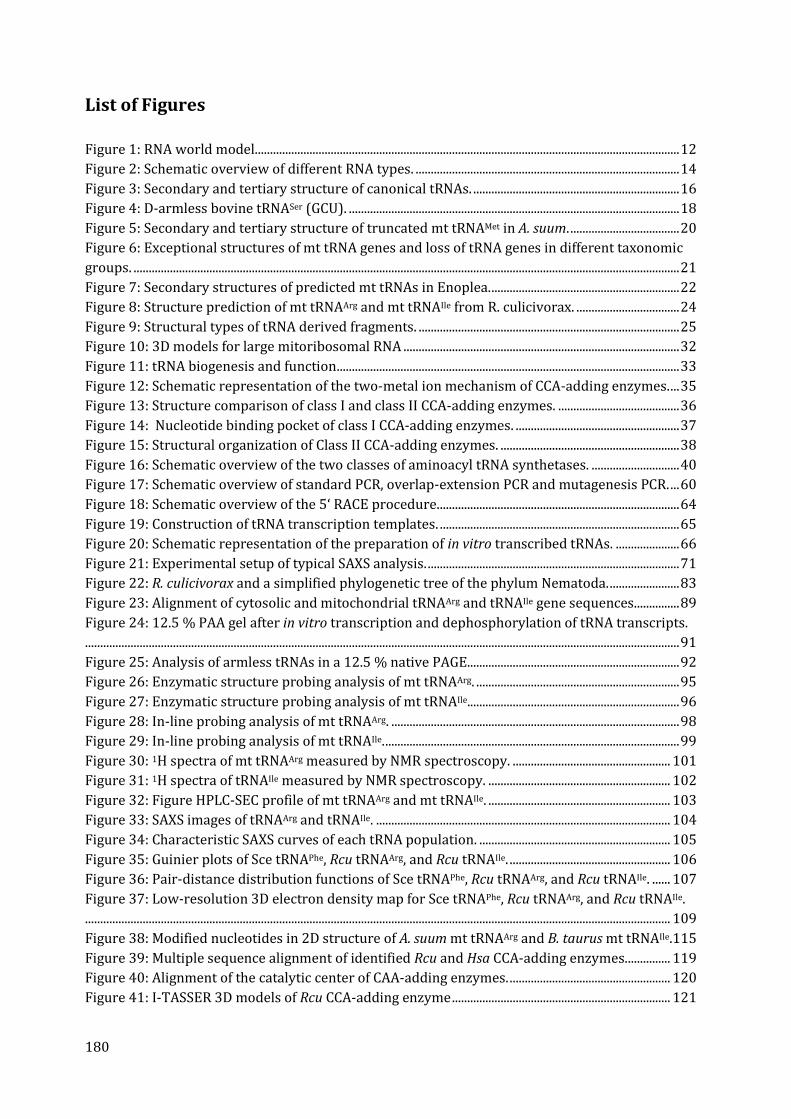
180
List of Figures
Figure 1: RNA world model. ........................................................................................................................................... 12
Figure 2: Schematic overview of different RNA types. ....................................................................................... 14
Figure 3: Secondary and tertiary structure of canonical tRNAs. .................................................................... 16
Figure 4: D-armless bovine tRNASer (GCU). ............................................................................................................. 18
Figure 5: Secondary and tertiary structure of truncated mt tRNAMet in A. suum. .................................... 20
Figure 6: Exceptional structures of mt tRNA genes and loss of tRNA genes in different taxonomic
groups. .................................................................................................................................................................................... 21
Figure 7: Secondary structures of predicted mt tRNAs in Enoplea. .............................................................. 22
Figure 8: Structure prediction of mt tRNAArg and mt tRNAIle from R. culicivorax. .................................. 24
Figure 9: Structural types of tRNA derived fragments. ...................................................................................... 25
Figure 10: 3D models for large mitoribosomal RNA ........................................................................................... 32
Figure 11: tRNA biogenesis and function ................................................................................................................. 33
Figure 12: Schematic representation of the two-metal ion mechanism of CCA-adding enzymes. ... 35
Figure 13: Structure comparison of class I and class II CCA-adding enzymes. ........................................ 36
Figure 14: Nucleotide binding pocket of class I CCA-adding enzymes. ...................................................... 37
Figure 15: Structural organization of Class II CCA-adding enzymes. ........................................................... 38
Figure 16: Schematic overview of the two classes of aminoacyl tRNA synthetases. ............................. 40
Figure 17: Schematic overview of standard PCR, overlap-extension PCR and mutagenesis PCR. ... 60
Figure 18: Schematic overview of the 5‘ RACE procedure. ............................................................................... 64
Figure 19: Construction of tRNA transcription templates. ............................................................................... 65
Figure 20: Schematic representation of the preparation of in vitro transcribed tRNAs. ..................... 66
Figure 21: Experimental setup of typical SAXS analysis. ................................................................................... 71
Figure 22: R. culicivorax and a simplified phylogenetic tree of the phylum Nematoda. ....................... 83
Figure 23: Alignment of cytosolic and mitochondrial tRNAArg and tRNAIle gene sequences. .............. 89
Figure 24: 12.5 % PAA gel after in vitro transcription and dephosphorylation of tRNA transcripts.
.................................................................................................................................................................................................... 91
Figure 25: Analysis of armless tRNAs in a 12.5 % native PAGE...................................................................... 92
Figure 26: Enzymatic structure probing analysis of mt tRNAArg. ................................................................... 95
Figure 27: Enzymatic structure probing analysis of mt tRNAIle...................................................................... 96
Figure 28: In-line probing analysis of mt tRNAArg. ............................................................................................... 98
Figure 29: In-line probing analysis of mt tRNAIle. ................................................................................................. 99
Figure 30: 1H spectra of mt tRNAArg measured by NMR spectroscopy. .................................................... 101
Figure 31: 1H spectra of tRNAIle measured by NMR spectroscopy. ............................................................ 102
Figure 32: Figure HPLC-SEC profile of mt tRNAArg and mt tRNAIle. ............................................................ 103
Figure 33: SAXS images of tRNAArg and tRNAIle. ................................................................................................. 104
Figure 34: Characteristic SAXS curves of each tRNA population. ............................................................... 105
Figure 35: Guinier plots of Sce tRNAPhe, Rcu tRNAArg, and Rcu tRNAIle. ..................................................... 106
Figure 36: Pair-distance distribution functions of Sce tRNAPhe, Rcu tRNAArg, and Rcu tRNAIle. ...... 107
Figure 37: Low-resolution 3D electron density map for Sce tRNAPhe, Rcu tRNAArg, and Rcu tRNAIle.
................................................................................................................................................................................................. 109
Figure 38: Modified nucleotides in 2D structure of A. suum mt tRNAArg and B. taurus mt tRNAIle.115
Figure 39: Multiple sequence alignment of identified Rcu and Hsa CCA-adding enzymes. .............. 119
Figure 40: Alignment of the catalytic center of CAA-adding enzymes. ..................................................... 120
Figure 41: I-TASSER 3D models of Rcu CCA-adding enzyme ........................................................................ 121
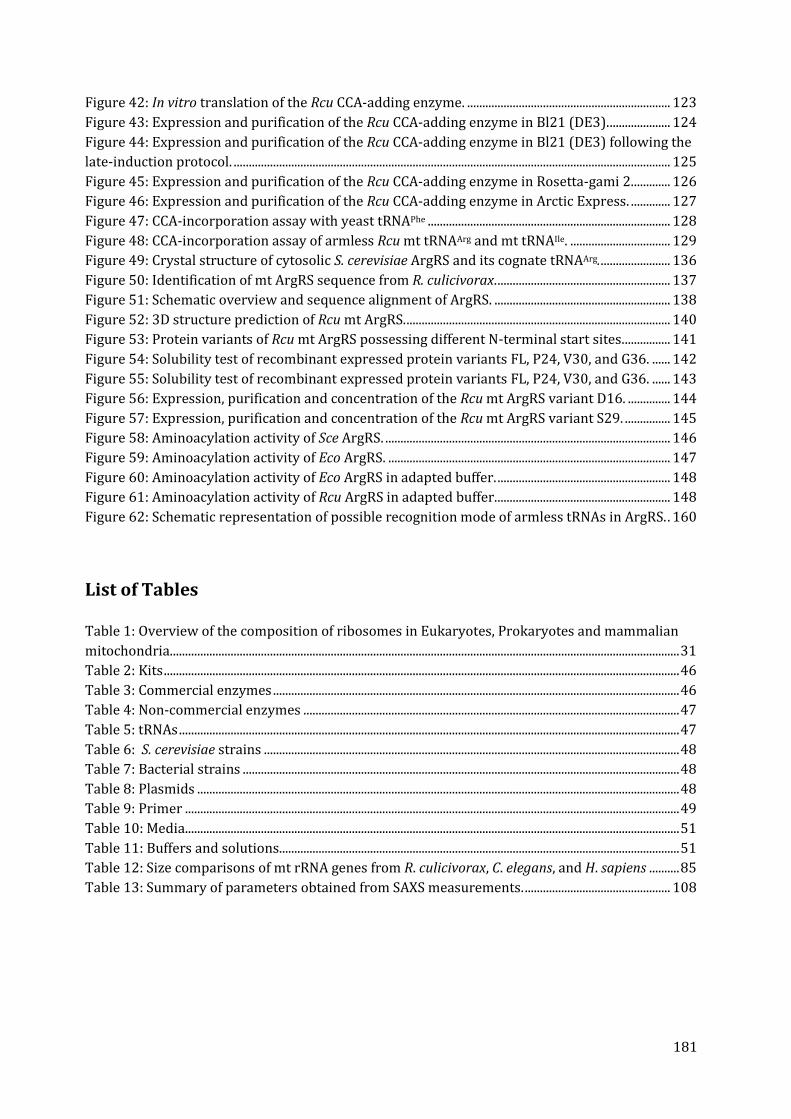
181
Figure 42: In vitro translation of the Rcu CCA-adding enzyme. ................................................................... 123
Figure 43: Expression and purification of the Rcu CCA-adding enzyme in Bl21 (DE3). .................... 124
Figure 44: Expression and purification of the Rcu CCA-adding enzyme in Bl21 (DE3) following the
late-induction protocol. ................................................................................................................................................ 125
Figure 45: Expression and purification of the Rcu CCA-adding enzyme in Rosetta-gami 2. ............ 126
Figure 46: Expression and purification of the Rcu CCA-adding enzyme in Arctic Express. ............. 127
Figure 47: CCA-incorporation assay with yeast tRNAPhe ................................................................................ 128
Figure 48: CCA-incorporation assay of armless Rcu mt tRNAArg and mt tRNAIle. ................................. 129
Figure 49: Crystal structure of cytosolic S. cerevisiae ArgRS and its cognate tRNAArg. ....................... 136
Figure 50: Identification of mt ArgRS sequence from R. culicivorax. ......................................................... 137
Figure 51: Schematic overview and sequence alignment of ArgRS. .......................................................... 138
Figure 52: 3D structure prediction of Rcu mt ArgRS. ....................................................................................... 140
Figure 53: Protein variants of Rcu mt ArgRS possessing different N-terminal start sites. ............... 141
Figure 54: Solubility test of recombinant expressed protein variants FL, P24, V30, and G36. ...... 142
Figure 55: Solubility test of recombinant expressed protein variants FL, P24, V30, and G36. ...... 143
Figure 56: Expression, purification and concentration of the Rcu mt ArgRS variant D16. .............. 144
Figure 57: Expression, purification and concentration of the Rcu mt ArgRS variant S29. ............... 145
Figure 58: Aminoacylation activity of Sce ArgRS. .............................................................................................. 146
Figure 59: Aminoacylation activity of Eco ArgRS. ............................................................................................. 147
Figure 60: Aminoacylation activity of Eco ArgRS in adapted buffer. ......................................................... 148
Figure 61: Aminoacylation activity of Rcu ArgRS in adapted buffer. ......................................................... 148
Figure 62: Schematic representation of possible recognition mode of armless tRNAs in ArgRS. . 160
List of Tables Table 1: Overview of the composition of ribosomes in Eukaryotes, Prokaryotes and mammalian
mitochondria. ....................................................................................................................................................................... 31
Table 2: Kits .......................................................................................................................................................................... 46
Table 3: Commercial enzymes ...................................................................................................................................... 46
Table 4: Non-commercial enzymes ............................................................................................................................ 47
Table 5: tRNAs ..................................................................................................................................................................... 47
Table 6: S. cerevisiae strains ......................................................................................................................................... 48
Table 7: Bacterial strains ................................................................................................................................................ 48
Table 8: Plasmids ............................................................................................................................................................... 48
Table 9: Primer ................................................................................................................................................................... 49
Table 10: Media ................................................................................................................................................................... 51
Table 11: Buffers and solutions.................................................................................................................................... 51
Table 12: Size comparisons of mt rRNA genes from R. culicivorax, C. elegans, and H. sapiens .......... 85
Table 13: Summary of parameters obtained from SAXS measurements. ................................................ 108

182
183
References
Abelson, J., Trotta, C.R. and Li, H. (1998), “tRNA splicing”, J. Biol. Chem., Vol. 273 No. 21, pp. 12685–
12688.
Adrion, J.R., White, P.S. and Montooth, K.L. (2016), “The Roles of Compensatory Evolution and
Constraint in Aminoacyl tRNA Synthetase Evolution”, Molecular biology and evolution, Vol. 33
No. 1, pp. 152–161.
Alberts B, Johnson A, Lewis J, et al. (Ed.) (2002), The RNA World and the Origins of Life.
Aldinger, C.A., Leisinger, A.-K. and Igloi, G.L. (2012), “The influence of identity elements on the
aminoacylation of tRNA(Arg) by plant and Escherichia coli arginyl-tRNA synthetases”, The
FEBS journal, Vol. 279 No. 19, pp. 3622–3638.
Alexandrov, A., Chernyakov, I., Gu, W., Hiley, S.L., Hughes, T.R., Grayhack, E.J. and Phizicky, E.M.
(2006), “Rapid tRNA decay can result from lack of nonessential modifications”, Molecular cell,
Vol. 21 No. 1, pp. 87–96.
Altman, S. (2000), “The road to RNase P”, Nat. Struct. Biol., Vol. 7 No. 10, pp. 827–828.
Aravind, L. and Koonin, E.V. (1999), “DNA polymerase beta-like nucleotidyltransferase
superfamily: identification of three new families, classification and evolutionary history”,
Nucleic acids research, Vol. 27 No. 7, pp. 1609–1618.
Arcari, P. and Brownlee, G.G. (1980), “The nucleotide sequence of a small (3S) seryl-tRNA
(anticodon GCU) from beef heart mitochondria”, Nucleic acids research, Vol. 8 No. 22, pp.
5207–5212.
Arita, M., Suematsu, T., Osanai, A., Inaba, T., Kamiya, H., Kita, K., Sisido, M., Watanabe, Y.-I. and
Ohtsuki, T. (2006), “An evolutionary 'intermediate state' of mitochondrial translation systems
found in Trichinella species of parasitic nematodes: co-evolution of tRNA and EF-Tu”, Nucleic
acids research, Vol. 34 No. 18, pp. 5291–5299.
Asin-Cayuela, J. and Gustafsson, C.M. (2007), “Mitochondrial transcription and its regulation in
mammalian cells”, Trends in biochemical sciences, Vol. 32 No. 3, pp. 111–117.
Augustin, M.A., Reichert, A.S., Betat, H., Huber, R., Mörl, M. and Steegborn, C. (2003), “Crystal
structure of the human CCA-adding enzyme: insights into template-independent
polymerization”, Journal of molecular biology, Vol. 328 No. 5, pp. 985–994.
Azevedo, J.L. and Hyman, B.C. (1993), “Molecular characterization of lengthy mitochondrial DNA
duplications from the parasitic nematode Romanomermis culicivorax”, Genetics, Vol. 133 No.
4, pp. 933–942.
Ban, N., Nissen, P., Hansen, J., Moore, P.B. and Steitz, T.A. (2000), “The complete atomic structure
of the large ribosomal subunit at 2.4 A resolution”, Science, Vol. 289 No. 5481, pp. 905–920.
Barker, D.G. and Winter, G. (1982), “Conserved cysteine and histidine residues in the structures of
the tyrosyl and methionyl-tRNA synthetases”, FEBS Lett, Vol. 145 No. 2, pp. 191–193.
Belval, L., Marquette, A., Mestre, P., Piron, M.-C., Demangeat, G., Merdinoglu, D. and Chich, J.-F.
(2015), “A fast and simple method to eliminate Cpn60 from functional recombinant proteins
produced by E. coli Arctic Express”, Protein expression and purification, Vol. 109, pp. 29–34.
Berglund, A.-K., Spanning, E., Biverstahl, H., Maddalo, G., Tellgren-Roth, C., Maler, L. and Glaser, E.
(2009), “Dual targeting to mitochondria and chloroplasts: characterization of Thr-tRNA
synthetase targeting peptide”, Molecular plant, Vol. 2 No. 6, pp. 1298–1309.
Betat, H., Rammelt, C., Martin, G. and Mörl, M. (2004), “Exchange of regions between bacterial
poly(A) polymerase and the CCA-adding enzyme generates altered specificities”, Molecular
cell, Vol. 15 No. 3, pp. 389–398.
184
Betat, H., Rammelt, C. and Morl, M. (2010), “tRNA nucleotidyltransferases: ancient catalysts with
an unusual mechanism of polymerization”, Cellular and molecular life sciences CMLS, Vol. 67
No. 9, pp. 1447–1463.
Beuning, P.J. and Musier-Forsyth, K. (1999), “Transfer RNA recognition by aminoacyl-tRNA
synthetases”, Biopolymers, Vol. 52 No. 1, pp. 1–28.
Bhaskaran, H., Rodriguez-Hernandez, A. and Perona, J.J. (2012), “Kinetics of tRNA folding
monitored by aminoacylation”, RNA (New York, N.Y.), Vol. 18 No. 3, pp. 569–580.
Bi, K., Zheng, Y., Gao, F., Dong, J., Wang, J., Wang, Y. and Gong, W. (2014), “Crystal structure of E.
coli arginyl-tRNA synthetase and ligand binding studies revealed key residues in arginine
recognition”, Protein & cell, Vol. 5 No. 2, pp. 151–159.
Bjork, G.R. and Hagervall, T.G. (2014), “Transfer RNA Modification: Presence, Synthesis, and
Function”, EcoSal Plus, Vol. 6 No. 1.
Bonnefond, L., Fender, A., Rudinger-Thirion, J., Giegé, R., Florentz, C. and Sissler, M. (2005),
“Toward the full set of human mitochondrial aminoacyl-tRNA synthetases: characterization of
AspRS and TyrRS”, Biochemistry, Vol. 44 No. 12, pp. 4805–4816.
Bonnefond, L., Florentz, C., Giegé, R. and Rudinger-Thirion, J. (2008), “Decreased aminoacylation
in pathology-related mutants of mitochondrial tRNATyr is associated with structural
perturbations in tRNA architecture”, RNA (New York, N.Y.), Vol. 14 No. 4, pp. 641–648.
Bonnefond, L., Frugier, M., Touze, E., Lorber, B., Florentz, C., Giegé, R., Sauter, C. and Rudinger-
Thirion, J. (2007), “Crystal structure of human mitochondrial tyrosyl-tRNA synthetase reveals
common and idiosyncratic features”, Structure (London, England 1993), Vol. 15 No. 11, pp.
1505–1516.
Bralley, P., Chang, S.A. and Jones, G.H. (2005), “A phylogeny of bacterial RNA
nucleotidyltransferases: Bacillus halodurans contains two tRNA nucleotidyltransferases”,
Journal of bacteriology, Vol. 187 No. 17, pp. 5927–5936.
Brindefalk, B., Viklund, J., Larsson, D., Thollesson, M. and Andersson, S.G.E. (2007), “Origin and
evolution of the mitochondrial aminoacyl-tRNA synthetases”, Molecular biology and evolution,
Vol. 24 No. 3, pp. 743–756.
Brown, A., Amunts, A., Bai, X.-c., Sugimoto, Y., Edwards, P.C., Murshudov, G., Scheres, S.H.W. and
Ramakrishnan, V. (2014), “Structure of the large ribosomal subunit from human
mitochondria”, Science (New York, N.Y.), Vol. 346 No. 6210, pp. 718–722.
Brown, W.M., George, M., JR and Wilson, A.C. (1979), “Rapid evolution of animal mitochondrial
DNA”, Proceedings of the National Academy of Sciences of the United States of America, Vol. 76
No. 4, pp. 1967–1971.
Bruijn, M.H. de and Klug, A. (1983), “A model for the tertiary structure of mammalian
mitochondrial transfer RNAs lacking the entire 'dihydrouridine' loop and stem”, The EMBO
journal, Vol. 2 No. 8, pp. 1309–1321.
Bruijn, M.H. de, Schreier, P.H., Eperon, I.C., Barrell, B.G., Chen, E.Y., Armstrong, P.W., Wong, J.F. and
Roe, B.A. (1980), “A mammalian mitochondrial serine transfer RNA lacking the
"dihydrouridine" loop and stem”, Nucleic acids research, Vol. 8 No. 22, pp. 5213–5222.
Buck, C.A. and Nass, M.M. (1969), “Studies on mitochondrial tRNA from animal cells”, Journal of
molecular biology, Vol. 41 No. 1, pp. 67–82.
Bullard, J.M., Cai, Y.C., Demeler, B. and Spremulli, L.L. (1999), “Expression and characterization of a
human mitochondrial phenylalanyl-tRNA synthetase”, Journal of molecular biology, Vol. 288
No. 4, pp. 567–577.
185
Bullard, J.M., Cai, Y.C. and Spremulli, L.L. (2000), “Expression and characterization of the human
mitochondrial leucyl-tRNA synthetase”, Biochimica et biophysica acta, Vol. 1490 No. 3, pp.
245–258.
Bullwinkle, T.J. and Ibba, M. (2014), “Emergence and evolution”, Topics in current chemistry, Vol.
344, pp. 43–87.
Cannell, I.G., Kong, Y.W. and Bushell, M. (2008), “How do microRNAs regulate gene expression?”,
Biochemical Society transactions, Vol. 36 Pt 6, pp. 1224–1231.
Cao, J. (2014), “The functional role of long non-coding RNAs and epigenetics”, Biological
procedures online, Vol. 16, p. 11.
Cavarelli, J., Delagoutte, B., Eriani, G., Gangloff, J. and Moras, D. (1998), “L-arginine recognition by
yeast arginyl-tRNA synthetase”, The EMBO journal, Vol. 17 No. 18, pp. 5438–5448.
Ceballos, M. and Vioque, A. (2007), “tRNase Z”, Protein Pept. Lett., Vol. 14 No. 2, 137‐145 %
2424025.
Cech, T.R. (1986), “A model for the RNA-catalyzed replication of RNA”, Proc. Natl. Acad. Sci. U.S.A.,
Vol. 83 No. 12, pp. 4360–4363.
Cech, T.R. (2012), “The RNA worlds in context”, Cold Spring Harb Perspect Biol, Vol. 4 No. 7,
a006742.
Chacinska, A., Koehler, C.M., Milenkovic, D., Lithgow, T. and Pfanner, N. (2009), “Importing
mitochondrial proteins: machineries and mechanisms”, Cell, Vol. 138 No. 4, pp. 628–644.
Chihade, J.W., Hayashibara, K., Shiba, K. and Schimmel, P. (1998), “Strong selective pressure to use
G:U to mark an RNA acceptor stem for alanine”, Biochemistry, Vol. 37 No. 25, pp. 9193–9202.
Chimnaronk, S., Gravers Jeppesen, M., Suzuki, T., Nyborg, J. and Watanabe, K. (2005), “Dual-mode
recognition of noncanonical tRNAs(Ser) by seryl-tRNA synthetase in mammalian
mitochondria”, The EMBO journal, Vol. 24 No. 19, pp. 3369–3379.
Cho, H.D., Tomita, K., Suzuki, T. and Weiner, A.M. (2002), “U2 small nuclear RNA is a substrate for
the CCA-adding enzyme (tRNA nucleotidyltransferase)”, The Journal of biological chemistry,
Vol. 277 No. 5, pp. 3447–3455.
Chomczynski, P. and Sacchi, N. (1987), “Single-step method of RNA isolation by acid guanidinium
thiocyanate-phenol-chloroform extraction”, Analytical biochemistry, Vol. 162 No. 1, pp. 156–
159.
Clark, B.F. and Nyborg, J. (1997), “The ternary complex of EF-Tu and its role in protein
biosynthesis”, Current opinion in structural biology, Vol. 7 No. 1, pp. 110–116.
Claros, M.G. and Vincens, P. (1996), “Computational method to predict mitochondrially imported
proteins and their targeting sequences”, European journal of biochemistry / FEBS, Vol. 241 No.
3, pp. 779–786.
Cole, C., Sobala, A., Lu, C., Thatcher, S.R., Bowman, A., Brown, J.W.S., Green, P.J., Barton, G.J. and
Hutvagner, G. (2009), “Filtering of deep sequencing data reveals the existence of abundant
Dicer-dependent small RNAs derived from tRNAs”, RNA (New York, N.Y.), Vol. 15 No. 12, pp.
2147–2160.
Crick, F. (1970), “Central Dogma of Molecular Biology”, Nature, Vol. 227 No. 5258, pp. 561–563.
Crick, F.H. (1955), “From DNA to protein on degenerate templates and the adapter hypothesis: a
note for the RNA Tie Club”, RNA Tie Club, 1955.
Crick, F.H. (1968), “The origin of the genetic code”, J. Mol. Biol., Vol. 38 No. 3, pp. 367–379.
Delagoutte, B., Moras, D. and Cavarelli, J. (2000), “tRNA aminoacylation by arginyl-tRNA
synthetase: induced conformations during substrates binding”, The EMBO journal, Vol. 19 No.
21, pp. 5599–5610.
186
Derks, K.W.J., Hoeijmakers, J.H.J. and Pothof, J. (2014), “The DNA damage response: the omics era
and its impact”, DNA repair, Vol. 19, pp. 214–220.
Derrick, W.B. and Horowitz, J. (1993), “Probing structural differences between native and in vitro
transcribed Escherichia coli valine transfer RNA: evidence for stable base modification-
dependent conformers”, Nucleic acids research, Vol. 21 No. 21, pp. 4948–4953.
Di Giulio, M. (1995), “Was it an ancient gene codifying for a hairpin RNA that, by means of direct
duplication, gave rise to the primitive tRNA molecule?”, Journal of theoretical biology, Vol. 177
No. 1, pp. 95–101.
Di Giulio, M. (2012), “The 'recently' split transfer RNA genes may be close to merging the two
halves of the tRNA rather than having just separated them”, Journal of theoretical biology, Vol.
310, pp. 1–2.
Diebel, K.W., Zhou, K., Clarke, A.B. and Bemis, L.T. (2016), “Beyond the Ribosome: Extra-
translational Functions of tRNA Fragments”, Biomarker insights, Vol. 11 Suppl 1, pp. 1–8.
Divan, A. (Ed.) (2013), Tools and techniques in biomolecular science, Impr.: 1, Oxford Univ. Press,
Oxford.
Doherty, E.A. and Doudna, J.A. (2001), “Ribozyme structures and mechanisms”, Annual review of
biophysics and biomolecular structure, Vol. 30, pp. 457–475.
Doublie, S., Tabor, S., Long, A.M., Richardson, C.C. and Ellenberger, T. (1998), “Crystal structure of
a bacteriophage T7 DNA replication complex at 2.2 A resolution”, Nature, Vol. 391 No. 6664,
pp. 251–258.
Draper, D.E. (2004), “A guide to ions and RNA structure”, RNA, Vol. 10 No. 3, pp. 335–343.
Du, X. (2003), “Tertiary structure base pairs between D- and TpsiC-loops of Escherichia coli
tRNALeu play important roles in both aminoacylation and editing”, Nucleic acids research, Vol.
31 No. 11, pp. 2865–2872.
Duechler, M., Leszczynska, G., Sochacka, E. and Nawrot, B. (2016), “Nucleoside modifications in the
regulation of gene expression: focus on tRNA”, Cellular and molecular life sciences CMLS, Vol.
73 No. 16, pp. 3075–3095.
Dupasquier, M., Kim, S., Halkidis, K., Gamper, H. and Hou, Y.-M. (2008), “tRNA integrity is a
prerequisite for rapid CCA addition: implication for quality control”, Journal of molecular
biology, Vol. 379 No. 3, pp. 579–588.
Eddy, S.R. (2001), “Non-coding RNA genes and the modern RNA world”, Nature reviews. Genetics,
Vol. 2 No. 12, pp. 919–929.
El Yacoubi, B., Bailly, M. and Crecy-Lagard, V. de (2012), “Biosynthesis and function of
posttranscriptional modifications of transfer RNAs”, Annual review of genetics, Vol. 46, pp. 69–
95.
Emanuelsson, O., Nielsen, H., Brunak, S. and Heijne, G. von (2000), “Predicting subcellular
localization of proteins based on their N-terminal amino acid sequence”, Journal of molecular
biology, Vol. 300 No. 4, pp. 1005–1016.
Emara, M.M., Ivanov, P., Hickman, T., Dawra, N., Tisdale, S., Kedersha, N., Hu, G.-F. and Anderson, P.
(2010), “Angiogenin-induced tRNA-derived stress-induced RNAs promote stress-induced
stress granule assembly”, The Journal of biological chemistry, Vol. 285 No. 14, pp. 10959–
10968.
Eriani, G., Delarue, M., Poch, O., Gangloff, J. and Moras, D. (1990), “Partition of tRNA synthetases
into two classes based on mutually exclusive sets of sequence motifs”, Nature, Vol. 347 No.
6289, pp. 203–206.
187
Ernst, F.G.M., Rickert, C., Bluschke, A., Betat, H., Steinhoff, H.-J. and Mörl, M. (2015), “Domain
movements during CCA-addition: a new function for motif C in the catalytic core of the human
tRNA nucleotidyltransferases”, RNA biology, Vol. 12 No. 4, pp. 435–446.
Evans, D., Marquez, S.M. and Pace, N.R. (2006), “RNase P: interface of the RNA and protein
worlds”, Trends Biochem. Sci., Vol. 31 No. 6, pp. 333–341.
Fenton, W.A. and Horwich, A.L. (2003), “Chaperonin-mediated protein folding. Fate of substrate
polypeptide”, Quarterly Reviews of Biophysics, Vol. 36 No. 2, pp. 229–256.
Fernandez-Vizarra, E., Berardinelli, A., Valente, L., Tiranti, V. and Zeviani, M. (2007), “Nonsense
mutation in pseudouridylate synthase 1 (PUS1) in two brothers affected by myopathy, lactic
acidosis and sideroblastic anaemia (MLASA)”, Journal of medical genetics, Vol. 44 No. 3, pp.
173–180.
Ferrer, M., Chernikova, T.N., Yakimov, M.M., Golyshin, P.N. and Timmis, K.N. (2003), “Chaperonins
govern growth of Escherichia coli at low temperatures”, Nature biotechnology, Vol. 21 No. 11,
pp. 1266–1267.
Florentz, C., Pütz, J., Jühling, F., Schwenzer, H., Stadler, P.F., Lorber, B., Sauter, C. and Sissler, M.
(2013), “Translation in Mammalian Mitochondria: Order and Disorder Linked to tRNAs and
Aminoacyl-tRNA Synthetases”, in Duchêne, A.-M. (Ed.), Translation in Mitochondria and Other
Organelles, Springer Berlin Heidelberg, Berlin, Heidelberg, pp. 55–83.
Franke, D. and Svergun, D.I. (2009), “DAMMIF, a program for rapid ab-initio shape determination
in small-angle scattering”, Journal of applied crystallography, Vol. 42 Pt 2, pp. 342–346.
Frechin, M., Duchene, A.-M. and Becker, H.D. (2009), “Translating organellar glutamine codons: a
case by case scenario?”, RNA biology, Vol. 6 No. 1, pp. 31–34.
Friederich, M.W., Vacano, E. and Hagerman, P.J. (1998), “Global flexibility of tertiary structure in
RNA: yeast tRNAPhe as a model system”, Proceedings of the National Academy of Sciences of the
United States of America, Vol. 95 No. 7, pp. 3572–3577.
Fujishima, K. and Kanai, A. (2014), “tRNA gene diversity in the three domains of life”, Frontiers in
genetics, Vol. 5, p. 142.
Fukai, S., Nureki, O., Sekine, S., Shimada, A., Tao, J., Vassylyev, D.G. and Yokoyama, S. (2000),
“Structural basis for double-sieve discrimination of L-valine from L-isoleucine and L-threonine
by the complex of tRNA(Val) and valyl-tRNA synthetase”, Cell, Vol. 103 No. 5, pp. 793–803.
Fukasawa, Y., Tsuji, J., Fu, S.-C., Tomii, K., Horton, P. and Imai, K. (2015), “MitoFates: improved
prediction of mitochondrial targeting sequences and their cleavage sites”, Molecular & cellular
proteomics MCP, Vol. 14 No. 4, pp. 1113–1126.
Gakh, O., Cavadini, P. and Isaya, G. (2002), “Mitochondrial processing peptidases”, Biochimica et
Biophysica Acta (BBA) - Molecular Cell Research, Vol. 1592 No. 1, pp. 63–77.
Galloway, C.A., Sowden, M.P. and Smith, H.C. (2003), “Increasing the yield of soluble recombinant
protein expressed in E. coli by induction during late log phase”, BioTechniques, Vol. 34 No. 3,
524-6, 528, 530.
Gaudry, A., Lorber, B., Neuenfeldt, A., Sauter, C., Florentz, C. and Sissler, M. (2012), “Re-designed N-
terminus enhances expression, solubility and crystallizability of mitochondrial protein”,
Protein engineering, design & selection PEDS, Vol. 25 No. 9, pp. 473–481.
Gavel, Y. and Heijne, G. von (1990), “Cleavage-site motifs in mitochondrial targeting peptides”,
Protein engineering, Vol. 4 No. 1, pp. 33–37.
Gebetsberger, J. and Polacek, N. (2013), “Slicing tRNAs to boost functional ncRNA diversity”, RNA
biology, Vol. 10 No. 12, pp. 1798–1806.
Giegé, R. (2008), “Toward a more complete view of tRNA biology”, Nature structural & molecular
biology, Vol. 15 No. 10, pp. 1007–1014.
188
Giegé, R. and Eriani, G. (2001), “Transfer RNA Recognition and Aminoacylation by Synthetases”, in
Ltd, J.W.&.S. (Ed.), eLS, John Wiley & Sons, Ltd, Chichester, UK.
Giegé, R., Jühling, F., Pütz, J., Stadler, P., Sauter, C. and Florentz, C. (2012), “Structure of transfer
RNAs: similarity and variability”, Wiley interdisciplinary reviews. RNA, Vol. 3 No. 1, pp. 37–61.
Giegé, R. and Lapointe, J. (2009), Transfer RNA Aminoacylation and Modified Nucleosides, DNA and
RNA Modification Enzymes:Structure, Mechanism, Function and Evolution, Molecular Biology
Intelligence Unit, Landes Bioscience, Austin.
Giegé, R., Sissler, M. and Florentz, C. (1998), “Universal rules and idiosyncratic features in tRNA
identity”, Nucleic acids research, Vol. 26 No. 22, pp. 5017–5035.
Gilbert, W. (1986), “Origin of life: The RNA world”, Nature, Vol. 319 No. 6055, 618 % 20473316.
Gobert, A., Gutmann, B., Taschner, A., Gossringer, M., Holzmann, J., Hartmann, R.K., Rossmanith, W.
and Giege, P. (2010), “A single Arabidopsis organellar protein has RNase P activity”, Nat.
Struct. Mol. Biol., Vol. 17 No. 6, pp. 740–744.
Goodarzi, H., Liu, X., Nguyen, H.C.B., Zhang, S., Fish, L. and Tavazoie, S.F. (2015), “Endogenous
tRNA-Derived Fragments Suppress Breast Cancer Progression via YBX1 Displacement”, Cell,
Vol. 161 No. 4, pp. 790–802.
Gopal, G.J. and Kumar, A. (2013), “Strategies for the production of recombinant protein in
Escherichia coli”, The protein journal, Vol. 32 No. 6, pp. 419–425.
Graslund, S., Nordlund, P., Weigelt, J., Hallberg, B.M., Bray, J., Gileadi, O., Knapp, S., Oppermann, U.,
Arrowsmith, C., Hui, R., Ming, J., dhe-Paganon, S., Park, H.-w., Savchenko, A., Yee, A., Edwards,
A., Vincentelli, R., Cambillau, C., Kim, R., Kim, S.-H., Rao, Z., Shi, Y., Terwilliger, T.C., Kim, C.-Y.,
Hung, L.-W., Waldo, G.S., Peleg, Y., Albeck, S., Unger, T., Dym, O., Prilusky, J., Sussman, J.L.,
Stevens, R.C., Lesley, S.A., Wilson, I.A., Joachimiak, A., Collart, F., Dementieva, I., Donnelly, M.I.,
Eschenfeldt, W.H., Kim, Y., Stols, L., Wu, R., Zhou, M., Burley, S.K., Emtage, J.S., Sauder, J.M.,
Thompson, D., Bain, K., Luz, J., Gheyi, T., Zhang, F., Atwell, S., Almo, S.C., Bonanno, J.B., Fiser, A.,
Swaminathan, S., Studier, F.W., Chance, M.R., Sali, A., Acton, T.B., Xiao, R., Zhao, L., Ma, L.C.,
Hunt, J.F., Tong, L., Cunningham, K., Inouye, M., Anderson, S., Janjua, H., Shastry, R., Ho, C.K.,
Wang, D., Wang, H., Jiang, M., Montelione, G.T., Stuart, D.I., Owens, R.J., Daenke, S., Schutz, A.,
Heinemann, U., Yokoyama, S., Bussow, K. and Gunsalus, K.C. (2008), “Protein production and
purification”, Nature methods, Vol. 5 No. 2, pp. 135–146.
Gray, M.W. (2012), “Mitochondrial evolution”, Cold Spring Harbor perspectives in biology, Vol. 4 No.
9, a011403.
Greber, B.J. and Ban, N. (2016), “Structure and Function of the Mitochondrial Ribosome”, Annual
review of biochemistry, Vol. 85, pp. 103–132.
Greber, B.J., Bieri, P., Leibundgut, M., Leitner, A., Aebersold, R., Boehringer, D. and Ban, N. (2015),
“Ribosome. The complete structure of the 55S mammalian mitochondrial ribosome”, Science
(New York, N.Y.), Vol. 348 No. 6232, pp. 303–308.
Grosjean, H. (2015), “RNA modification: the Golden Period 1995-2015”, RNA (New York, N.Y.), Vol.
21 No. 4, pp. 625–626.
Grosjean, H., Sprinzl, M. and Steinberg, S. (1995), “Posttranscriptionally modified nucleosides in
transfer RNA. Their locations and frequencies”, Biochimie, Vol. 77 1-2, pp. 139–141.
Guerrier-Takada, C., Gardiner, K., Marsh, T., Pace, N. and Altman, S. (1983), “The RNA moiety of
ribonuclease P is the catalytic subunit of the enzyme”, Cell, Vol. 35 3 Pt 2, pp. 849–857.
Gustilo, E.M., Vendeix, F.A. and Agris, P.F. (2008), “tRNA's modifications bring order to gene
expression”, Current opinion in microbiology, Vol. 11 No. 2, pp. 134–140.
189
Haacke, A., Fendrich, G., Ramage, P. and Geiser, M. (2009), “Chaperone over-expression in
Escherichia coli: apparent increased yields of soluble recombinant protein kinases are due
mainly to soluble aggregates”, Protein expression and purification, Vol. 64 No. 2, pp. 185–193.
Haiser, H.J., Karginov, F.V., Hannon, G.J. and Elliot, M.A. (2008), “Developmentally regulated
cleavage of tRNAs in the bacterium Streptomyces coelicolor”, Nucleic acids research, Vol. 36
No. 3, pp. 732–741.
Hartinger, D., Heinl, S., Schwartz, H.E., Grabherr, R., Schatzmayr, G., Haltrich, D. and Moll, W.-D.
(2010), “Enhancement of solubility in Escherichia coli and purification of an aminotransferase
from Sphingopyxis sp. MTA144 for deamination of hydrolyzed fumonisin B(1)”, Microbial cell
factories, Vol. 9, p. 62.
He, L. and Hannon, G.J. (2004), “MicroRNAs: small RNAs with a big role in gene regulation”, Nature
reviews. Genetics, Vol. 5 No. 7, pp. 522–531.
Hegg, L.A., Kou, M. and Thurlow, D.L. (1990), “Recognition of the tRNA-like structure in tobacco
mosaic viral RNA by ATP/CTP:tRNA nucleotidyltransferases from Escherichia coli and
Saccharomyces cerevisiae”, The Journal of biological chemistry, Vol. 265 No. 29, pp. 17441–
17445.
Helm, M. (2006), “Post-transcriptional nucleotide modification and alternative folding of RNA”,
Nucleic acids research, Vol. 34 No. 2, pp. 721–733.
Helm, M. and Attardi, G. (2004), “Nuclear control of cloverleaf structure of human mitochondrial
tRNA(Lys)”, Journal of molecular biology, Vol. 337 No. 3, pp. 545–560.
Holm, L. and Sander, C. (1995), “DNA polymerase beta belongs to an ancient
nucleotidyltransferase superfamily”, Trends in biochemical sciences, Vol. 20 No. 9, pp. 345–347.
Holman, K.M., Wu, J., Ling, J. and Simonovic, M. (2016), “The crystal structure of yeast
mitochondrial ThrRS in complex with the canonical threonine tRNA”, Nucleic acids research,
Vol. 44 No. 3, pp. 1428–1439.
Holzmann, J., Frank, P., Loffler, E., Bennett, K.L., Gerner, C. and Rossmanith, W. (2008), “RNase P
without RNA: identification and functional reconstitution of the human mitochondrial tRNA
processing enzyme”, Cell, Vol. 135 No. 3, pp. 462–474.
Honda, S., Loher, P., Shigematsu, M., Palazzo, J.P., Suzuki, R., Imoto, I., Rigoutsos, I. and Kirino, Y.
(2015), “Sex hormone-dependent tRNA halves enhance cell proliferation in breast and
prostate cancers”, Proceedings of the National Academy of Sciences of the United States of
America, Vol. 112 No. 29, E3816-25.
Hopper, A.K., Pai, D.A. and Engelke, D.R. (2010), “Cellular dynamics of tRNAs and their genes”,
FEBS letters, Vol. 584 No. 2, pp. 310–317.
Hopper, A.K. and Phizicky, E.M. (2003), “tRNA transfers to the limelight”, Genes & development,
Vol. 17 No. 2, pp. 162–180.
Hou, Y.-M. and Yang, X. (2013), “Regulation of cell death by transfer RNA”, Antioxidants & redox
signaling, Vol. 19 No. 6, pp. 583–594.
Hyman, B.C. (1988), “Nematode Mitochondrial DNA: Anomalies and Applications”, Journal of
nematology, Vol. 20 No. 4, pp. 523–531.
Hyman, B.C., Beck, J.L. and Weiss, K.C. (1988), “Sequence amplification and gene rearrangement in
parasitic nematode mitochondrial DNA”, Genetics, Vol. 120 No. 3, pp. 707–712.
Ibba, M., Francklyn, C. and Cusack, S. (2009), The Aminoacyl-tRNA Synthetases, Molecular Biology
Intelligence Unit, Landes Bioscience, Austin.
Ibba, M. and Soll, D. (2000), “Aminoacyl-tRNA synthesis”, Annual review of biochemistry, Vol. 69,
pp. 617–650.
190
Igloi, G.L. and Leisinger, A.-K. (2014), “Identity elements for the aminoacylation of metazoan
mitochondrial tRNA(Arg) have been widely conserved throughout evolution and ensure the
fidelity of the AGR codon reassignment”, RNA biology, Vol. 11 No. 10, pp. 1313–1323.
Igloi, G.L. and Schiefermayr, E. (2009), “Amino acid discrimination by arginyl-tRNA synthetases as
revealed by an examination of natural specificity variants”, The FEBS journal, Vol. 276 No. 5,
pp. 1307–1318.
Ivanov, P., Emara, M.M., Villen, J., Gygi, S.P. and Anderson, P. (2011), “Angiogenin-induced tRNA
fragments inhibit translation initiation”, Molecular cell, Vol. 43 No. 4, pp. 613–623.
Jackman, J.E. and Alfonzo, J.D. (2013), “Transfer RNA modifications: nature's combinatorial
chemistry playground”, Wiley interdisciplinary reviews. RNA, Vol. 4 No. 1, pp. 35–48.
Jager, M., Nir, E. and Weiss, S. (2006), “Site-specific labeling of proteins for single-molecule FRET
by combining chemical and enzymatic modification”, Protein science a publication of the
Protein Society, Vol. 15 No. 3, pp. 640–646.
Jahn, D., Verkamp, E. and Soll, D. (1992), “Glutamyl-transfer RNA: a precursor of heme and
chlorophyll biosynthesis”, Trends in biochemical sciences, Vol. 17 No. 6, pp. 215–218.
Jochl, C., Rederstorff, M., Hertel, J., Stadler, P.F., Hofacker, I.L., Schrettl, M., Haas, H. and
Huttenhofer, A. (2008), “Small ncRNA transcriptome analysis from Aspergillus fumigatus
suggests a novel mechanism for regulation of protein synthesis”, Nucleic acids research, Vol. 36
No. 8, pp. 2677–2689.
Joseph, R.E. and Andreotti, A.H. (2008), “Bacterial expression and purification of interleukin-2
tyrosine kinase: single step separation of the chaperonin impurity”, Protein expression and
purification, Vol. 60 No. 2, pp. 194–197.
Joyce, G.F. (1996), “Building the RNA world. Ribozymes”, Current biology CB, Vol. 6 No. 8, pp. 965–
967.
Jühling, F., Mörl, M., Hartmann, R.K., Sprinzl, M., Stadler, P.F. and Pütz, J. (2009), “tRNAdb 2009:
compilation of tRNA sequences and tRNA genes”, Nucleic acids research, Vol. 37 Database
issue, D159-62.
Jühling, F., Pütz, J., Bernt, M., Donath, A., Middendorf, M., Florentz, C. and Stadler, P.F. (2012a),
“Improved systematic tRNA gene annotation allows new insights into the evolution of
mitochondrial tRNA structures and into the mechanisms of mitochondrial genome
rearrangements”, Nucleic acids research, Vol. 40 No. 7, pp. 2833–2845.
Jühling, F., Pütz, J., Florentz, C. and Stadler, P.F. (2012b), “Armless mitochondrial tRNAs in Enoplea
(Nematoda)”, RNA biology, Vol. 9 No. 9, pp. 1161–1166.
Kamareddine, L. (2012), “The biological control of the malaria vector”, Toxins, Vol. 4 No. 9, pp.
748–767.
Karakozova, M., Kozak, M., Wong, C.C.L., Bailey, A.O., Yates, J.R.3., Mogilner, A., Zebroski, H. and
Kashina, A. (2006), “Arginylation of beta-actin regulates actin cytoskeleton and cell motility”,
Science (New York, N.Y.), Vol. 313 No. 5784, pp. 192–196.
Kaukinen, U., Lyytikainen, S., Mikkola, S. and Lonnberg, H. (2002), “The reactivity of
phosphodiester bonds within linear single-stranded oligoribonucleotides is strongly
dependent on the base sequence”, Nucleic acids research, Vol. 30 No. 2, pp. 468–474.
Kern, D. and Lapointe, J. (1980), “Catalytic mechanism of glutamyl-tRNA synthetase from
Escherichia coli. Reaction pathway in the aminoacylation of tRNAGlu”, Biochemistry, Vol. 19
No. 13, pp. 3060–3068.
Khow, O. and Suntrarachun, S. (2012), “Strategies for production of active eukaryotic proteins in
bacterial expression system”, Asian Pacific Journal of Tropical Biomedicine, Vol. 2 No. 2, pp.
159–162.
191
Kim, H.S., Cha, S.Y., Jo, C.H., Han, A. and Hwang, K.Y. (2014), “The crystal structure of arginyl-tRNA
synthetase from Homo sapiens”, FEBS letters, Vol. 588 No. 14, pp. 2328–2334.
Kim, S.H., Suddath, F.L., Quigley, G.J., McPherson, A., Sussman, J.L., Wang, A.H., Seeman, N.C. and
Rich, A. (1974), “Three-dimensional tertiary structure of yeast phenylalanine transfer RNA”,
Science (New York, N.Y.), Vol. 185 No. 4149, pp. 435–440.
Kinouchi, M. and Kurokawa, K. (2006), “tRNAfinder: A Software System To Find All tRNA Genes in
the DNA Sequence Based on the Cloverleaf Secondary Structure”, Journal of Computer Aided
Chemistry, Vol. 7, pp. 116–124.
Kirchner, S. and Ignatova, Z. (2015), “Emerging roles of tRNA in adaptive translation, signalling
dynamics and disease”, Nature reviews. Genetics, Vol. 16 No. 2, pp. 98–112.
Kirino, Y. and Suzuki, T. (2005), “Human mitochondrial diseases associated with tRNA wobble
modification deficiency”, RNA biology, Vol. 2 No. 2, pp. 41–44.
Kiss, T. (2002), “Small nucleolar RNAs: an abundant group of noncoding RNAs with diverse
cellular functions”, Cell, Vol. 109 No. 2, pp. 145–148.
Klimov, P.B. and Oconnor, B.M. (2009), “Improved tRNA prediction in the American house dust
mite reveals widespread occurrence of extremely short minimal tRNAs in acariform mites”,
BMC genomics, Vol. 10, p. 598.
Klipcan, L., Levin, I., Kessler, N., Moor, N., Finarov, I. and Safro, M. (2008), “The tRNA-induced
conformational activation of human mitochondrial phenylalanyl-tRNA synthetase”, Structure
(London, England 1993), Vol. 16 No. 7, pp. 1095–1104.
Klipcan, L., Moor, N., Finarov, I., Kessler, N., Sukhanova, M. and Safro, M.G. (2012), “Crystal
structure of human mitochondrial PheRS complexed with tRNA(Phe) in the active "open"
state”, Journal of molecular biology, Vol. 415 No. 3, pp. 527–537.
Kobylinski, K.C., Sylla, M., Black, W., 4th. and Foy, B.D. (2012), “Mermithid nematodes found in
adult Anopheles from southeastern Senegal”, Parasites & vectors, Vol. 5, p. 131.
Konarev, P.V., Volkov, V.V., Sokolova, A.V., Koch, M.H.J. and Svergun, D.I. (2003), “PRIMUS. A
Windows PC-based system for small-angle scattering data analysis”, Journal of Applied
Crystallography, Vol. 36 No. 5, pp. 1277–1282.
Konarska, M.M. and Query, C.C. (2005), “Insights into the mechanisms of splicing: more lessons
from the ribosome”, Genes & development, Vol. 19 No. 19, pp. 2255–2260.
Kumar, P., Mudunuri, S.B., Anaya, J. and Dutta, A. (2015), “tRFdb: a database for transfer RNA
fragments”, Nucleic Acids Res, Vol. 43 Database issue, D141‐145.
Kumazawa, Y., Himeno, H., Miura, K. and Watanabe, K. (1991), “Unilateral aminoacylation
specificity between bovine mitochondria and eubacteria”, Journal of biochemistry, Vol. 109 No.
3, pp. 421–427.
LaRue, B., Newhouse, N., Nicoghosian, K. and Cedergren, R.J. (1981), “The evolution of multi-
isoacceptor tRNA families. Sequence of tRNA Leu CAA and tRNA Leu CAG from Anacystis
nidulans”, The Journal of biological chemistry, Vol. 256 No. 4, pp. 1539–1543.
Laslett, D. and Canback, B. (2004), “ARAGORN, a program to detect tRNA genes and tmRNA genes
in nucleotide sequences”, Nucleic acids research, Vol. 32 No. 1, pp. 11–16.
Lee, C., Kramer, G., Graham, D.E. and Appling, D.R. (2007), “Yeast mitochondrial initiator tRNA is
methylated at guanosine 37 by the Trm5-encoded tRNA (guanine-N1-)-methyltransferase”,
The Journal of biological chemistry, Vol. 282 No. 38, pp. 27744–27753.
Lee, T. and Feig, A.L. (2008), “The RNA binding protein Hfq interacts specifically with tRNAs”, RNA
(New York, N.Y.), Vol. 14 No. 3, pp. 514–523.
Lee, Y.S., Shibata, Y., Malhotra, A. and Dutta, A. (2009), “A novel class of small RNAs: tRNA-derived
RNA fragments (tRFs)”, Genes & development, Vol. 23 No. 22, pp. 2639–2649.

192
Lehman, N. (2010), “RNA in evolution”, Wiley Interdiscip Rev RNA, Vol. 1 No. 2, 202‐213 %
4339100.
Levin, L., Blumberg, A., Barshad, G. and Mishmar, D. (2014), “Mito-nuclear co-evolution: the
positive and negative sides of functional ancient mutations”, Frontiers in genetics, Vol. 5, p.
448.
Levitt, M.H. (2013), Spin Dynamics: Basics of Nuclear Magnetic Resonance, 2., Auflage, John Wiley &
Sons, New York, NY.
Levy R, Hertlein BC, Petersen JJ, Doggett DW and Miller TW (1979), “Aerial application of
Romanomermis culicivorax (Mermithidae: Nematoda) to control Anopheles and Culex
mosuqitoes in southwest Florida”, Mosquito News No. 39, pp. 20–25.
Li, F., Xiong, Y., Wang, J., Cho, H.D., Tomita, K., Weiner, A.M. and Steitz, T.A. (2002), “Crystal
structures of the Bacillus stearothermophilus CCA-adding enzyme and its complexes with ATP
or CTP”, Cell, Vol. 111 No. 6, pp. 815–824.
Li, Z., Gillis, K.A., Hegg, L.A., Zhang, J. and Thurlow, D.L. (1996), “Effects of nucleotide substitutions
within the T-loop of precursor tRNAs on interaction with ATP/CTP:tRNA
nucleotidyltransferases from Escherichia coli and yeast”, The Biochemical journal, 314 (Pt 1),
pp. 49–53.
Li, Z., Sun, Y. and Thurlow, D.L. (1997), “RNA minihelices as model substrates for ATP/CTP:tRNA
nucleotidyltransferase”, The Biochemical journal, 327 (Pt 3), pp. 847–851.
Lipfert, J. and Doniach, S. (2007), “Small-angle X-ray scattering from RNA, proteins, and protein
complexes”, Annual review of biophysics and biomolecular structure, Vol. 36, pp. 307–327.
Lizano, E., Scheibe, M., Rammelt, C., Betat, H. and Mörl, M. (2008), “A comparative analysis of CCA-
adding enzymes from human and E. coli: differences in CCA addition and tRNA 3'-end repair”,
Biochimie, Vol. 90 No. 5, pp. 762–772.
Lodish H, Berk A, Zipursky SL, et al. (2000), The Three Roles of RNA in Protein Synthesis.
Lowe, T.M. and Eddy, S.R. (1997), “tRNAscan-SE: a program for improved detection of transfer
RNA genes in genomic sequence”, Nucleic acids research, Vol. 25 No. 5, pp. 955–964.
Lynch, D.C. and Attardi, G. (1976), “Amino acid specificity of the transfer RNA species coded for by
HeLa cell mitochondrial DNA”, Journal of molecular biology, Vol. 102 No. 1, pp. 125–141.
Machnicka, M.A., Milanowska, K., Osman Oglou, O., Purta, E., Kurkowska, M., Olchowik, A.,
Januszewski, W., Kalinowski, S., Dunin-Horkawicz, S., Rother, K.M., Helm, M., Bujnicki, J.M. and
Grosjean, H. (2013), “MODOMICS: a database of RNA modification pathways--2013 update”,
Nucleic acids research, Vol. 41 Database issue, D262-7.
Martin, G. and Keller, W. (1996), “Mutational analysis of mammalian poly(A) polymerase
identifies a region for primer binding and catalytic domain, homologous to the family X
polymerases, and to other nucleotidyltransferases”, The EMBO journal, Vol. 15 No. 10, pp.
2593–2603.
Martin, G. and Keller, W. (2004), “Sequence motifs that distinguish ATP(CTP):tRNA nucleotidyl
transferases from eubacterial poly(A) polymerases”, RNA (New York, N.Y.), Vol. 10 No. 6, pp.
899–906.
Martin, G. and Keller, W. (2007), “RNA-specific ribonucleotidyl transferases”, RNA (New York,
N.Y.), Vol. 13 No. 11, pp. 1834–1849.
Masta, S.E. (2000), “Mitochondrial sequence evolution in spiders: intraspecific variation in tRNAs
lacking the TPsiC Arm”, Molecular biology and evolution, Vol. 17 No. 7, pp. 1091–1100.
Mattick, J.S. and Makunin, I.V. (2005), “Small regulatory RNAs in mammals”, Human molecular
genetics, 14 Spec No 1, R121-32.
193
Mattick, J.S. and Makunin, I.V. (2006), “Non-coding RNA”, Human molecular genetics, 15 Spec No 1,
R17-29.
McClain, W.H. (1993), “Rules that govern tRNA identity in protein synthesis”, Journal of molecular
biology, Vol. 234 No. 2, pp. 257–280.
McManus, M.T. and Sharp, P.A. (2002), “Gene silencing in mammals by small interfering RNAs”,
Nature reviews. Genetics, Vol. 3 No. 10, pp. 737–747.
McShane, A., Hok, E., Tomberlin, J., Eriani, G. and Geslain, R. (2016), “The Enzymatic Paradox of
Yeast Arginyl-tRNA Synthetase: Exclusive Arginine Transfer Controlled by a Flexible
Mechanism of tRNA Recognition”, PLoS ONE, Vol. 11 No. 2, e0148460.
Mears, J.A., Cannone, J.J., Stagg, S.M., Gutell, R.R., Agrawal, R.K. and Harvey, S.C. (2002), “Modeling a
Minimal Ribosome Based on Comparative Sequence Analysis”, Journal of molecular biology,
Vol. 321 No. 2, pp. 215–234.
Mears, J.A., Sharma, M.R., Gutell, R.R., McCook, A.S., Richardson, P.E., Caulfield, T.R., Agrawal, R.K.
and Harvey, S.C. (2006), “A structural model for the large subunit of the mammalian
mitochondrial ribosome”, Journal of molecular biology, Vol. 358 No. 1, pp. 193–212.
Mehler, A.H. and Mitra, S.K. (1967), “The activation of arginyl transfer ribonucleic acid synthetase
by transfer ribonucleic acid”, The Journal of biological chemistry, Vol. 242 No. 23, pp. 5495–
5499.
Mertens, H.D.T. and Svergun, D.I. (2010), “Structural characterization of proteins and complexes
using small-angle X-ray solution scattering”, Journal of structural biology, Vol. 172 No. 1, pp.
128–141.
Messmer, M., Pütz, J., Suzuki, T., Suzuki, T., Sauter, C., Sissler, M. and Catherine, F. (2009), “Tertiary
network in mammalian mitochondrial tRNAAsp revealed by solution probing and phylogeny”,
Nucleic acids research, Vol. 37 No. 20, pp. 6881–6895.
Miller, S.B., Yildiz, F.Z., Lo, J.A., Wang, B. and D'Souza, V.M. (2014), “A structure-based mechanism
for tRNA and retroviral RNA remodelling during primer annealing”, Nature, Vol. 515 No. 7528,
pp. 591–595.
Moras, D., Comarmond, M.B., Fischer, J., Weiss, R., Thierry, J.C., Ebel, J.P. and Giege, R. (1980),
“Crystal structure of yeast tRNAAsp”, Nature, Vol. 288 No. 5792, pp. 669–674.
Morozova, O. and Marra, M.A. (2008), “Applications of next-generation sequencing technologies in
functional genomics”, Genomics, Vol. 92 No. 5, pp. 255–264.
Motorin, Y. and Helm, M. (2010), “tRNA stabilization by modified nucleotides”, Biochemistry, Vol.
49 No. 24, pp. 4934–4944.
Mudge, S.J., Williams, J.H., Eyre, H.J., Sutherland, G.R., Cowan, P.J. and Power, D.A. (1998), “Complex
organisation of the 5'-end of the human glycine tRNA synthetase gene”, Gene, Vol. 209 1-2, pp.
45–50.
Nagaike, T., Suzuki, T., Tomari, Y., Takemoto-Hori, C., Negayama, F., Watanabe, K. and Ueda, T.
(2001), “Identification and characterization of mammalian mitochondrial tRNA
nucleotidyltransferases”, The Journal of biological chemistry, Vol. 276 No. 43, pp. 40041–
40049.
Nagao, A., Suzuki, T., Katoh, T., Sakaguchi, Y. and Suzuki, T. (2009), “Biogenesis of glutaminyl-mt
tRNAGln in human mitochondria”, Proceedings of the National Academy of Sciences of the
United States of America, Vol. 106 No. 38, pp. 16209–16214.
Navarre, W.W. and Schneewind, O. (1999), “Surface proteins of gram-positive bacteria and
mechanisms of their targeting to the cell wall envelope”, Microbiology and molecular biology
reviews MMBR, Vol. 63 No. 1, pp. 174–229.
194
Neuenfeldt, A., Just, A., Betat, H. and Mörl, M. (2008), “Evolution of tRNA nucleotidyltransferases: a
small deletion generated CC-adding enzymes”, Proceedings of the National Academy of Sciences
of the United States of America, Vol. 105 No. 23, pp. 7953–7958.
Neuenfeldt, A., Lorber, B., Ennifar, E., Gaudry, A., Sauter, C., Sissler, M. and Florentz, C. (2013),
“Thermodynamic properties distinguish human mitochondrial aspartyl-tRNA synthetase from
bacterial homolog with same 3D architecture”, Nucleic acids research, Vol. 41 No. 4, pp. 2698–
2708.
Nevo-Dinur, K., Govindarajan, S. and Amster-Choder, O. (2012), “Subcellular localization of RNA
and proteins in prokaryotes”, Trends in genetics TIG, Vol. 28 No. 7, pp. 314–322.
Nissen, P., Kjeldgaard, M., Thirup, S.r., Polekhina, G., Reshetnikova, L., Clark, B.F.C. and Nyborg, J.
(1995), “Crystal Structure of the Ternary Complex of Phe-tRNAPhe, EF-Tu, and a GTP Analog”,
Science, Vol. 270 No. 5241, pp. 1464–1472.
Noller, H.F. (2012), “Evolution of protein synthesis from an RNA world”, Cold Spring Harbor
perspectives in biology, Vol. 4 No. 4, a003681.
Nolte-'t Hoen, E., Buermans, H.P.J., Waasdorp, M., Stoorvogel, W., Wauben, M.H.M. and 't Hoen,
Peter A C (2012), “Deep sequencing of RNA from immune cell-derived vesicles uncovers the
selective incorporation of small non-coding RNA biotypes with potential regulatory functions”,
Nucleic acids research, Vol. 40 No. 18, pp. 9272–9285.
O'Brien, T.W. (1971), “The general occurrence of 55 S ribosomes in mammalian liver
mitochondria”, The Journal of biological chemistry, Vol. 246 No. 10, pp. 3409–3417.
O'Brien, T.W. (2002), “Evolution of a protein-rich mitochondrial ribosome: implications for
human genetic disease”, Gene, Vol. 286 No. 1, pp. 73–79.
Oguiza, J.A., Malumbres, M., Eriani, G., Pisabarro, A., Mateos, L.M., Martin, F. and Martin, J.F. (1993),
“A gene encoding arginyl-tRNA synthetase is located in the upstream region of the lysA gene in
Brevibacterium lactofermentum: regulation of argS-lysA cluster expression by arginine”,
Journal of bacteriology, Vol. 175 No. 22, pp. 7356–7362.
Ohtsuki, T., Kawai, G. and Watanabe, K. (2002a), “The minimal tRNA. Unique structure of Ascaris
suum mitochondrial tRNA SerUCU having a short T arm and lacking the entire D arm”, FEBS
letters, Vol. 514 No. 1, pp. 37–43.
Ohtsuki, T., Sato, A., Watanabe, Y.-I. and Watanabe, K. (2002b), “A unique serine-specific
elongation factor Tu found in nematode mitochondria”, Nature structural biology, Vol. 9 No. 9,
pp. 669–673.
Ohtsuki, T., Watanabe, Y., Takemoto, C., Kawai, G., Ueda, T., Kita, K., Kojima, S., Kaziro, Y., Nyborg, J.
and Watanabe, K. (2001), “An "elongated" translation elongation factor Tu for truncated
tRNAs in nematode mitochondria”, The Journal of biological chemistry, Vol. 276 No. 24, pp.
21571–21577.
Ohtsuki, T. and Watanabe, Y.-I. (2007), “T-armless tRNAs and elongated elongation factor Tu”,
IUBMB life, Vol. 59 No. 2, pp. 68–75.
Ojala, D., Montoya, J. and Attardi, G. (1981), “tRNA punctuation model of RNA processing in human
mitochondria”, Nature, Vol. 290 No. 5806, pp. 470–474.
Okabe, M., Tomita, K., Ishitani, R., Ishii, R., Takeuchi, N., Arisaka, F., Nureki, O. and Yokoyama, S.
(2003), “Divergent evolutions of trinucleotide polymerization revealed by an archaeal CCA-
adding enzyme structure”, The EMBO journal, Vol. 22 No. 21, pp. 5918–5927.
Okimoto, R., Macfarlane, J.L., Clary, D.O. and Wolstenholme, D.R. (1992), “The mitochondrial
genomes of two nematodes, Caenorhabditis elegans and Ascaris suum”, Genetics, Vol. 130 No.
3, pp. 471–498.
195
Okimoto, R., Macfarlane, J.L. and Wolstenholme, D.R. (1994), “The mitochondrial ribosomal RNA
genes of the nematodes Caenorhabditis elegans and Ascaris suum: consensus secondary-
structure models and conserved nucleotide sets for phylogenetic analysis”, Journal of
molecular evolution, Vol. 39 No. 6, pp. 598–613.
Okimoto, R. and Wolstenholme, D.R. (1990), “A set of tRNAs that lack either the T psi C arm or the
dihydrouridine arm: towards a minimal tRNA adaptor”, The EMBO journal, Vol. 9 No. 10, pp.
3405–3411.
Orgel, L.E. (1968), “Evolution of the genetic apparatus”, J. Mol. Biol., Vol. 38 No. 3, pp. 381–393.
Palade, G.E. (1955), “A small particulate component of the cytoplasm”, The Journal of biophysical
and biochemical cytology, Vol. 1 No. 1, pp. 59–68.
Petersen, J.J. and Chapman, H.C. (1979), “Checklist of mosquito species tested against the
nematode parasite Romanomermis culicivorax”, Journal of medical entomology, Vol. 15 5-6, pp.
468–471.
Petersen, J.J. and Cupello, J.M. (1981), “Commercial development and future prospects for
entomogenous nematodes”, Journal of nematology, Vol. 13 No. 3, pp. 280–284.
Petoukhov, M.V., Franke, D., Shkumatov, A.V., Tria, G., Kikhney, A.G., Gajda, M., Gorba, C., Mertens,
H.D.T., Konarev, P.V. and Svergun, D.I. (2012), “New developments in the ATSAS program
package for small-angle scattering data analysis”, Journal of applied crystallography, Vol. 45 Pt
2, pp. 342–350.
Phizicky, E.M. and Hopper, A.K. (2015), “tRNA processing, modification, and subcellular dynamics:
past, present, and future”, RNA, Vol. 21 No. 4, pp. 483–485.
Platzer, E.G. (2007), “Mermithid nematodes”, Journal of the American Mosquito Control Association,
Vol. 23 2 Suppl, pp. 58–64.
Pliatsika, V., Loher, P., Telonis, A.G. and Rigoutsos, I. (2016), “MINTbase: a framework for the
interactive exploration of mitochondrial and nuclear tRNA fragments”, Bioinformatics, Vol. 32
No. 16, pp. 2481–2489.
Powers, T.O., Platzer, E.G. and Hyman, B.C. (1986), “Large mitochondrial genome and
mitochondrial DNA size polymorphism in the mosquito parasite, Romanomermis culicivorax”,
Current genetics, Vol. 11 No. 1, pp. 71–77.
Puglisi, E.V. and Puglisi, J.D. (2007), “Probing the conformation of human tRNA(3)(Lys) in solution
by NMR”, FEBS letters, Vol. 581 No. 27, pp. 5307–5314.
Putnam, C.D., Hammel, M., Hura, G.L. and Tainer, J.A. (2007), “X-ray solution scattering (SAXS)
combined with crystallography and computation: defining accurate macromolecular
structures, conformations and assemblies in solution”, Quarterly reviews of biophysics, Vol. 40
No. 3, pp. 191–285.
Pütz, J., Giegé, R. and Florentz, C. (2010), “Diversity and similarity in the tRNA world: overall view
and case study on malaria-related tRNAs”, FEBS letters, Vol. 584 No. 2, pp. 350–358.
Pütz, J., Puglisi, J.D., Florentz, C. and Giege, R. (1991), “Identity elements for specific
aminoacylation of yeast tRNA(Asp) by cognate aspartyl-tRNA synthetase”, Science (New York,
N.Y.), Vol. 252 No. 5013, pp. 1696–1699.
Raina, M. and Ibba, M. (2014), “tRNAs as regulators of biological processes”, Frontiers in genetics,
Vol. 5, p. 171.
Randau, L. and Soll, D. (2008), “Transfer RNA genes in pieces”, EMBO reports, Vol. 9 No. 7, pp. 623–
628.
Rath, V.L., Silvian, L.F., Beijer, B., Sproat, B.S. and Steitz, T.A. (1998), “How glutaminyl-tRNA
synthetase selects glutamine”, Structure (London, England 1993), Vol. 6 No. 4, pp. 439–449.
196
Regulski, E.E. and Breaker, R.R. (2008), “In-line probing analysis of riboswitches”, Methods in
molecular biology (Clifton, N.J.), Vol. 419, pp. 53–67.
Reiter, N.J., Osterman, A., Torres-Larios, A., Swinger, K.K., Pan, T. and Mondragon, A. (2010),
“Structure of a bacterial ribonuclease P holoenzyme in complex with tRNA”, Nature, Vol. 468
No. 7325, pp. 784–789.
Reuven, N.B., Zhou, Z. and Deutscher, M.P. (1997), “Functional Overlap of tRNA
Nucleotidyltransferase, Poly(A) Polymerase I, and Polynucleotide Phosphorylase”, Journal of
Biological Chemistry, Vol. 272 No. 52, pp. 33255–33259.
Reznik, E., Miller, M.L., Senbabaoglu, Y., Riaz, N., Sarungbam, J., Tickoo, S.K., Al-Ahmadie, H.A., Lee,
W., Seshan, V.E., Hakimi, A.A. and Sander, C. (2016), “Mitochondrial DNA copy number
variation across human cancers”, eLife, Vol. 5.
Rial, D.V. and Ceccarelli, E.A. (2002), “Removal of DnaK contamination during fusion protein
purifications”, Protein expression and purification, Vol. 25 No. 3, pp. 503–507.
Ribas de Pouplana, L. and Schimmel, P. (2001), “Aminoacyl-tRNA synthetases. Potential markers
of genetic code development”, Trends in biochemical sciences, Vol. 26 No. 10, pp. 591–596.
Rich, A. and Schimmel, P.R. (1977), “Structural organization of complexes of transfer RNAs with
aminoacyl transfer RNA synthetases”, Nucleic acids research, Vol. 4 No. 5, pp. 1649–1665.
Robertson, M.P. and Joyce, G.F. (2012), “The origins of the RNA world”, Cold Spring Harbor
perspectives in biology, Vol. 4 No. 5.
Robertus, J.D., Ladner, J.E., Finch, J.T., Rhodes, D., Brown, R.S., Clark, B.F. and Klug, A. (1974),
“Structure of yeast phenylalanine tRNA at 3 A resolution”, Nature, Vol. 250 No. 467, pp. 546–
551.
Roeder, R.G. and Rutter, W.J. (1969), “Multiple forms of DNA-dependent RNA polymerase in
eukaryotic organisms”, Nature, Vol. 224 No. 5216, pp. 234–237.
Romer, R. and Hach, R. (1975), “tRNA conformation and magnesium binding. A study of a yeast
phenylalanine-specific tRNA by a fluorescent indicator and differential melting curves”,
European journal of biochemistry / FEBS, Vol. 55 No. 1, pp. 271–284.
Rossmanith, W. (2011), “Localization of human RNase Z isoforms: dual nuclear/mitochondrial
targeting of the ELAC2 gene product by alternative translation initiation”, PLoS ONE, Vol. 6 No.
4, e19152.
Roy, H. and Ibba, M. (2008), “RNA-dependent lipid remodeling by bacterial multiple peptide
resistance factors”, Proceedings of the National Academy of Sciences of the United States of
America, Vol. 105 No. 12, pp. 4667–4672.
Rudinger, J., Blechschmidt, B., Ribeiro, S. and Sprinzl, M. (1994), “Minimalist aminoacylated RNAs
as efficient substrates for elongation factor Tu”, Biochemistry, Vol. 33 No. 19, pp. 5682–5688.
Sahdev, S., Khattar, S.K. and Saini, K.S. (2008), “Production of active eukaryotic proteins through
bacterial expression systems: a review of the existing biotechnology strategies”, Molecular and
cellular biochemistry, Vol. 307 1-2, pp. 249–264.
Sakurai, M., Ohtsuki, T. and Watanabe, K. (2005), “Modification at position 9 with 1-
methyladenosine is crucial for structure and function of nematode mitochondrial tRNAs
lacking the entire T-arm”, Nucleic acids research, Vol. 33 No. 5, pp. 1653–1661.
Salinas-Giegé, T., Giegé, R. and Giege, P. (2015), “tRNA biology in mitochondria”, International
journal of molecular sciences, Vol. 16 No. 3, pp. 4518–4559.
Sambrook, J., Fritsch, E.F. and Maniatis, T. (1989), Molecular cloning: A laboratory manual, 2. ed., 5.
print, Cold Spring Harbor Laboratory Press, Plainview, NY.
197
Sampson, J.R. and Uhlenbeck, O.C. (1988), “Biochemical and physical characterization of an
unmodified yeast phenylalanine transfer RNA transcribed in vitro”, Proceedings of the National
Academy of Sciences of the United States of America, Vol. 85 No. 4, pp. 1033–1037.
Sanger, F., Nicklen, S. and Coulson, A.R. (1977), “DNA sequencing with chain-terminating
inhibitors”, Proceedings of the National Academy of Sciences of the United States of America, Vol.
74 No. 12, pp. 5463–5467.
Sato, A., Watanabe, Y.-I., Suzuki, T., Komiyama, M., Watanabe, K. and Ohtsuki, T. (2006),
“Identification of the residues involved in the unique serine specificity of Caenorhabditis
elegans mitochondrial EF-Tu2”, Biochemistry, Vol. 45 No. 36, pp. 10920–10927.
Savojardo, C., Martelli, P.L., Fariselli, P. and Casadio, R. (2014), “TPpred2: improving the prediction
of mitochondrial targeting peptide cleavage sites by exploiting sequence motifs”,
Bioinformatics (Oxford, England), Vol. 30 No. 20, pp. 2973–2974.
Schein, C.H. (1989), “Production of soluble recombinant proteins in bacteria”, BioTechnology No. 7,
pp. 1141–1148.
Schiffer, P.H., Kroiher, M., Kraus, C., Koutsovoulos, G.D., Kumar, S., Camps, J.I.R., Nsah, N.A.,
Stappert, D., Morris, K., Heger, P., Altmuller, J., Frommolt, P., Nurnberg, P., Thomas, W.K.,
Blaxter, M.L. and Schierenberg, E. (2013), “The genome of Romanomermis culicivorax:
revealing fundamental changes in the core developmental genetic toolkit in Nematoda”, BMC
genomics, Vol. 14, p. 923.
Schimmel, P. (1987), “Aminoacyl tRNA synthetases: general scheme of structure-function
relationships in the polypeptides and recognition of transfer RNAs”, Annual review of
biochemistry, Vol. 56, pp. 125–158.
Schluenzen, F., Tocilj, A., Zarivach, R., Harms, J., Gluehmann, M., Janell, D., Bashan, A., Bartels, H.,
Agmon, I., Franceschi, F. and Yonath, A. (2000), “Structure of functionally activated small
ribosomal subunit at 3.3 angstroms resolution”, Cell, Vol. 102 No. 5, pp. 615–623.
Schmidt, O., Pfanner, N. and Meisinger, C. (2010), “Mitochondrial protein import: from proteomics
to functional mechanisms”, Nature reviews. Molecular cell biology, Vol. 11 No. 9, pp. 655–667.
Schürer, H., Lang, K., Schuster, J. and Mörl, M. (2002), “A universal method to produce in vitro
transcripts with homogeneous 3' ends”, Nucleic acids research, Vol. 30 No. 12, e56.
Schuwirth, B.S., Borovinskaya, M.A., Hau, C.W., Zhang, W., Vila-Sanjurjo, A., Holton, J.M. and Cate,
J.H.D. (2005), “Structures of the bacterial ribosome at 3.5 A resolution”, Science (New York,
N.Y.), Vol. 310 No. 5749, pp. 827–834.
Schwartzbach, C.J. and Spremulli, L.L. (1991), “Interaction of animal mitochondrial EF-Tu.EF-Ts
with aminoacyl-tRNA, guanine nucleotides, and ribosomes”, The Journal of biological
chemistry, Vol. 266 No. 25, pp. 16324–16330.
Serganov, A. and Patel, D.J. (2007), “Ribozymes, riboswitches and beyond: regulation of gene
expression without proteins”, Nature reviews. Genetics, Vol. 8 No. 10, pp. 776–790.
Shamseldean, M.M. and Platzer, E.G. (1989), “Romanomermis culicivorax: penetration of larval
mosquitoes”, Journal of invertebrate pathology, Vol. 54 No. 2, pp. 191–199.
Sharma, M.R., Koc, E.C., Datta, P.P., Booth, T.M., Spremulli, L.L. and Agrawal, R.K. (2003), “Structure
of the Mammalian Mitochondrial Ribosome Reveals an Expanded Functional Role for Its
Component Proteins”, Cell, Vol. 115 No. 1, pp. 97–108.
Sheppard, K., Yuan, J., Hohn, M.J., Jester, B., Devine, K.M. and Soll, D. (2008), “From one amino acid
to another: tRNA-dependent amino acid biosynthesis”, Nucleic acids research, Vol. 36 No. 6, pp.
1813–1825.
Shi, H. and Moore, P.B. (2000), “The crystal structure of yeast phenylalanine tRNA at 1.93 A
resolution: a classic structure revisited”, RNA (New York, N.Y.), Vol. 6 No. 8, pp. 1091–1105.

198
Shi, P.Y., Maizels, N. and Weiner, A.M. (1998), “CCA addition by tRNA nucleotidyltransferase:
polymerization without translocation?”, The EMBO journal, Vol. 17 No. 11, pp. 3197–3206.
Shigematsu, M., Honda, S. and Kirino, Y. (2014), “Transfer RNA as a source of small functional
RNA”, J Mol Biol Mol Imaging, Vol. 1 No. 2, % 26117139.
Shimada, A., Nureki, O., Goto, M., Takahashi, S. and Yokoyama, S. (2001a), “Structural and
mutational studies of the recognition of the arginine tRNA-specific major identity element,
A20, by arginyl-tRNA synthetase”, Proceedings of the National Academy of Sciences of the
United States of America, Vol. 98 No. 24, pp. 13537–13542.
Shimada, A., Nureki, O., Goto, M., Takahashi, S. and Yokoyama, S. (2001b), THERMUS
THERMOPHILUS ARGINYL-TRNA SYNTHETASE.
Sissler, M., Giege, R. and Florentz, C. (1996), “Arginine aminoacylation identity is context-
dependent and ensured by alternate recognition sets in the anticodon loop of accepting tRNA
transcripts”, The EMBO journal, Vol. 15 No. 18, pp. 5069–5076.
Sissler, M., Giege, R. and Florentz, C. (1998), “The RNA sequence context defines the mechanistic
routes by which yeast arginyl-tRNA synthetase charges tRNA”, RNA (New York, N.Y.), Vol. 4 No.
6, pp. 647–657.
Sissler, M., Lorber, B., Messmer, M., Schaller, A., Putz, J. and Florentz, C. (2008), “Handling
mammalian mitochondrial tRNAs and aminoacyl-tRNA synthetases for functional and
structural characterization”, Methods (San Diego, Calif.), Vol. 44 No. 2, pp. 176–189.
Small, I., Peeters, N., Legeai, F. and Lurin, C. (2004), “Predotar: A tool for rapidly screening
proteomes for N-terminal targeting sequences”, Proteomics, Vol. 4 No. 6, pp. 1581–1590.
Smith, D.R. (2016), “The past, present and future of mitochondrial genomics: have we sequenced
enough mtDNAs?”, Brief Funct Genomics, Vol. 15 No. 1, pp. 47–54.
Sobala, A. and Hutvagner, G. (2011), “Transfer RNA-derived fragments: origins, processing, and
functions”, Wiley interdisciplinary reviews. RNA, Vol. 2 No. 6, pp. 853–862.
Sobala, A. and Hutvagner, G. (2013), “Small RNAs derived from the 5' end of tRNA can inhibit
protein translation in human cells”, RNA biology, Vol. 10 No. 4, pp. 553–563.
Sprinzl, M. (1998), “Compilation of tRNA sequences and sequences of tRNA genes”, Nucleic acids
research, Vol. 26 No. 1, pp. 148–153.
Sprinzl, M. and Cramer, F. (1979), “The -C-C-A end of tRNA and its role in protein biosynthesis”,
Progress in nucleic acid research and molecular biology, Vol. 22, pp. 1–69.
Stein, A. and Crothers, D.M. (1976), “Conformational changes of transfer RNA. The role of
magnesium(II)”, Biochemistry, Vol. 15 No. 1, pp. 160–168.
Steitz, T.A. (1998), “A mechanism for all polymerases”, Nature, Vol. 391 No. 6664, pp. 231–232.
Steitz, T.A., Smerdon, S.J., Jager, J. and Joyce, C.M. (1994), “A unified polymerase mechanism for
nonhomologous DNA and RNA polymerases”, Science (New York, N.Y.), Vol. 266 No. 5193, pp.
2022–2025.
Sugiura, I., Nureki, O., Ugaji-Yoshikawa, Y., Kuwabara, S., Shimada, A., Tateno, M., Lorber, B., Giege,
R., Moras, D., Yokoyama, S. and Konno, M. (2000), “The 2.0 A crystal structure of Thermus
thermophilus methionyl-tRNA synthetase reveals two RNA-binding modules”, Structure, Vol. 8
No. 2, pp. 197–208.
Sun, F.-J. and Caetano-Anolles, G. (2008), “The origin and evolution of tRNA inferred from
phylogenetic analysis of structure”, Journal of molecular evolution, Vol. 66 No. 1, pp. 21–35.
Suzuki, T., Nagao, A. and Suzuki, T. (2011), “Human mitochondrial tRNAs: biogenesis, function,
structural aspects, and diseases”, Annual review of genetics, Vol. 45, pp. 299–329.
Suzuki, T. and Suzuki, T. (2014), “A complete landscape of post-transcriptional modifications in
mammalian mitochondrial tRNAs”, Nucleic acids research, Vol. 42 No. 11, pp. 7346–7357.
199
Suzuki, T., Terasaki, M., Takemoto-Hori, C., Hanada, T., Ueda, T., Wada, A. and Watanabe, K. (2001),
“Structural compensation for the deficit of rRNA with proteins in the mammalian
mitochondrial ribosome. Systematic analysis of protein components of the large ribosomal
subunit from mammalian mitochondria”, The Journal of biological chemistry, Vol. 276 No. 24,
pp. 21724–21736.
Svergun, D., Barberato, C. and Koch, M.H.J. (1995), “CRYSOL – a Program to Evaluate X-ray
Solution Scattering of Biological Macromolecules from Atomic Coordinates”, Journal of Applied
Crystallography, Vol. 28 No. 6, pp. 768–773.
Svergun, D.I. (1992), “Determination of the regularization parameter in indirect-transform
methods using perceptual criteria”, Journal of Applied Crystallography, Vol. 25 No. 4, pp. 495–
503.
Svergun, D.I. and Koch, M.H.J. (2003), “Small-angle scattering studies of biological macromolecules
in solution”, Rep. Prog. Phys No. 66, pp. 1735–1782.
Sylvester, J.E., Fischel-Ghodsian, N., Mougey, E.B. and O'brien, T.W. (2004), “Mitochondrial
ribosomal proteins. Candidate genes for mitochondrial disease”, Genetics in Medicine, Vol. 6
No. 2, pp. 73–80.
Tamura, K., Himeno, H., Asahara, H., Hasegawa, T. and Shimizu, M. (1992), “In vitro study of E.coli
tRNA Arg and tRNA Lys identity elements”, Nucleic Acids Research, Vol. 20 No. 9, pp. 2335–
2339.
Tang, S.-N. and Huang, J.-F. (2005), “Evolution of different oligomeric glycyl-tRNA synthetases”,
FEBS letters, Vol. 579 No. 6, pp. 1441–1445.
The ENDCODE project consortium (2012), “An integrated encyclopedia of DNA elements in the
human genome”, Nature, Vol. 489 No. 7414, pp. 57–74.
Thompson, D.M. and Parker, R. (2009), “The RNase Rny1p cleaves tRNAs and promotes cell death
during oxidative stress in Saccharomyces cerevisiae”, The Journal of cell biology, Vol. 185 No. 1,
pp. 43–50.
Tocchini-Valentini, G.D., Fruscoloni, P. and Tocchini-Valentini, G.P. (2009), “Processing of
multiple-intron-containing pretRNA”, Proc. Natl. Acad. Sci. U.S.A., Vol. 106 No. 48, pp. 20246–
20251.
Toh, Y., Takeshita, D., Numata, T., Fukai, S., Nureki, O. and Tomita, K. (2009), “Mechanism for the
definition of elongation and termination by the class II CCA-adding enzyme”, The EMBO
journal, Vol. 28 No. 21, pp. 3353–3365.
Tolkunova, E., Park, H., Xia, J., King, M.P. and Davidson, E. (2000), “The human lysyl-tRNA
synthetase gene encodes both the cytoplasmic and mitochondrial enzymes by means of an
unusual alternative splicing of the primary transcript”, The Journal of biological chemistry, Vol.
275 No. 45, pp. 35063–35069.
Tomari, Y., Suzuki, T. and Ueda, T. (2002), “tRNA recognition by CCA-adding enzyme”, Nucleic
acids research. Supplement (2001) No. 2, pp. 77–78.
Tomita, K., Fukai, S., Ishitani, R., Ueda, T., Takeuchi, N., Vassylyev, D.G. and Nureki, O. (2004),
“Structural basis for template-independent RNA polymerization”, Nature, Vol. 430 No. 7000,
pp. 700–704.
Toseland, C.P. (2013), “Fluorescent labeling and modification of proteins”, Journal of chemical
biology, Vol. 6 No. 3, pp. 85–95.
Tretbar, S., Neuenfeldt, A., Betat, H. and Mörl, M. (2011), “An inhibitory C-terminal region dictates
the specificity of A-adding enzymes”, Proceedings of the National Academy of Sciences of the
United States of America, Vol. 108 No. 52, pp. 21040–21045.
200
Tyagi, N.K., Fenton, W.A. and Horwich, A.L. (2009), “GroEL/GroES cycling: ATP binds to an open
ring before substrate protein favoring protein binding and production of the native state”,
Proceedings of the National Academy of Sciences of the United States of America, Vol. 106 No.
48, pp. 20264–20269.
Tzameli, I. (2012), “The evolving role of mitochondria in metabolism”, Trends in endocrinology and
metabolism: TEM, Vol. 23 No. 9, pp. 417–419.
Valadkhan, S. and Gunawardane, L.S. (2013), “Role of small nuclear RNAs in eukaryotic gene
expression”, Essays in biochemistry, Vol. 54, pp. 79–90.
Varani, G., Chen, Y. and Leeper, T.C. (2004), “NMR studies of protein-nucleic acid interactions”,
Methods in molecular biology (Clifton, N.J.), Vol. 278, pp. 289–312.
Vasil’eva, I.A. and Moor, N.A. (2007), “Interaction of aminoacyl-tRNA synthetases with tRNA.
General principles and distinguishing characteristics of the high-molecular-weight substrate
recognition”, Biochemistry (Moscow), Vol. 72 No. 3, pp. 247–263.
Vörtler, S. and Mörl, M. (2010), “tRNA-nucleotidyltransferases: highly unusual RNA polymerases
with vital functions”, FEBS letters, Vol. 584 No. 2, pp. 297–302.
Watanabe, K. (2010), “Unique features of animal mitochondrial translation systems”, Proceedings
of the Japan Academy, Series B, Vol. 86 No. 1, pp. 11–39.
Watanabe, Y.-i., Tsurui, H., Ueda, T., Furusihima-Shimogawara, R., Takamiya, S., Kita, K., Nishikawa,
K. and Watanabe, K. (1997), “Primary sequence of mitochondrial tRNAArg of a nematode
Ascaris suum. Occurrence of unmodified adenosine at the first position of the anticodon”,
Biochimica et Biophysica Acta (BBA) - Gene Structure and Expression, Vol. 1350 No. 2, pp. 119–
122.
Watanabe, Y.-I., Suematsu, T. and Ohtsuki, T. (2014), “Losing the stem-loop structure from
metazoan mitochondrial tRNAs and co-evolution of interacting factors”, Frontiers in genetics,
Vol. 5, p. 109.
Watson, J.D. and Crick, F.H. (1953), “Molecular structure of nucleic acids; a structure for
deoxyribose nucleic acid”, Nature, Vol. 171 No. 4356, pp. 737–738.
Webster, T., Tsai, H., Kula, M., Mackie, G.A. and Schimmel, P. (1984), “Specific sequence homology
and three-dimensional structure of an aminoacyl transfer RNA synthetase”, Science, Vol. 226
No. 4680, pp. 1315–1317.
Weiner, A.M. and Maizels, N. (1999), “The Genomic Tag Hypothesis. Modern Viruses as Molecular
Fossils of Ancient Strategies for Genomic Replication, and Clues regarding the Origin of
Protein Synthesis”, Biological Bulletin, Vol. 196 No. 3, p. 327.
Wende, S., Bonin, S., Gotze, O., Betat, H. and Morl, M. (2015), “The identity of the discriminator
base has an impact on CCA addition”, Nucleic acids research, Vol. 43 No. 11, pp. 5617–5629.
Wende, S., Platzer, E.G., Jühling, F., Pütz, J., Florentz, C., Stadler, P.F. and Mörl, M. (2014), “Biological
evidence for the world's smallest tRNAs”, Biochimie, Vol. 100, pp. 151–158.
Westhof, E. and Auffinger, P. (2001), “Transfer RNA Structure”, in eLS, John Wiley & Sons, Ltd,
Chichester, UK.
White, R.J. (2011), “Transcription by RNA polymerase III: more complex than we thought”, Nature
reviews. Genetics, Vol. 12 No. 7, pp. 459–463.
Widmann, J., Di Giulio, M., Yarus, M. and Knight, R. (2005), “tRNA creation by hairpin duplication”,
Journal of molecular evolution, Vol. 61 No. 4, pp. 524–530.
Williams, M.A., Johzuka, Y. and Mulligan, R.M. (2000), “Addition of non-genomically encoded
nucleotides to the 3'-terminus of maize mitochondrial mRNAs: truncated rps12 mRNAs
frequently terminate with CCA”, Nucleic acids research, Vol. 28 No. 22, pp. 4444–4451.
201
Wilson, D.N. and Doudna Cate, J.H. (2012), “The structure and function of the eukaryotic
ribosome”, Cold Spring Harbor perspectives in biology, Vol. 4 No. 5.
Wilusz, J.E., Sunwoo, H. and Spector, D.L. (2009), “Long noncoding RNAs: functional surprises
from the RNA world”, Genes & development, Vol. 23 No. 13, pp. 1494–1504.
Wilusz, J.E., Whipple, J.M., Phizicky, E.M. and Sharp, P.A. (2011), “tRNAs marked with CCACCA are
targeted for degradation”, Science (New York, N.Y.), Vol. 334 No. 6057, pp. 817–821.
Wolstenholme, D.R., Macfarlane, J.L., Okimoto, R., Clary, D.O. and Wahleithner, J.A. (1987), “Bizarre
tRNAs inferred from DNA sequences of mitochondrial genomes of nematode worms”,
Proceedings of the National Academy of Sciences of the United States of America, Vol. 84 No. 5,
pp. 1324–1328.
Wolstenholme, D.R., Okimoto, R. and Macfarlane, J.L. (1994), “Nucleotide correlations that suggest
tertiary interactions in the TV-replacement loop-containing mitochondrial tRNAs of the
nematodes, Caenorhabditis elegans and Ascaris suum”, Nucleic acids research, Vol. 22 No. 20,
pp. 4300–4306.
Woodson, S.A. and Koculi, E. (2009), “Analysis of RNA Folding by Native Polyacrylamide Gel
Electrophoresis”, in Biophysical, Chemical, and Functional Probes of RNA Structure, Interactions
and Folding: Part B, Methods in Enzymology, Vol. 469, Elsevier, pp. 189–208.
Xiong, Y., Li, F., Wang, J., Weiner, A.M. and Steitz, T.A. (2003), “Crystal structures of an archaeal
class I CCA-adding enzyme and its nucleotide complexes”, Molecular cell, Vol. 12 No. 5, pp.
1165–1172.
Xiong, Y. and Steitz, T.A. (2006), “A story with a good ending: tRNA 3'-end maturation by CCA-
adding enzymes”, Current opinion in structural biology, Vol. 16 No. 1, pp. 12–17.
Yamasaki, S., Ivanov, P., Hu, G.-F. and Anderson, P. (2009), “Angiogenin cleaves tRNA and
promotes stress-induced translational repression”, The Journal of cell biology, Vol. 185 No. 1,
pp. 35–42.
Yamazaki, N., Ueshima, R., Terrett, J.A., Yokobori, S., Kaifu, M., Segawa, R., Kobayashi, T., Numachi,
K., Ueda, T., Nishikawa, K., Watanabe, K. and Thomas, R.H. (1997), “Evolution of pulmonate
gastropod mitochondrial genomes: comparisons of gene organizations of Euhadra, Cepaea and
Albinaria and implications of unusual tRNA secondary structures”, Genetics, Vol. 145 No. 3, pp.
749–758.
Yao, Y.-N., Wang, L., Wu, X.-F. and Wang, E.-D. (2003), “Human mitochondrial leucyl-tRNA
synthetase with high activity produced from Escherichia coli”, Protein expression and
purification, Vol. 30 No. 1, pp. 112–116.
Yarus, M. (2011), “Getting past the RNA world: the initial Darwinian ancestor”, Cold Spring Harb
Perspect Biol, Vol. 3 No. 4.
Yokogawa, T., Kitamura, Y., Nakamura, D., Ohno, S. and Nishikawa, K. (2010), “Optimization of the
hybridization-based method for purification of thermostable tRNAs in the presence of
tetraalkylammonium salts”, Nucleic acids research, Vol. 38 No. 6, e89.
Yue, D., Maizels, N. and Weiner, A.M. (1996), “CCA-adding enzymes and poly(A) polymerases are
all members of the same nucleotidyltransferase superfamily: characterization of the CCA-
adding enzyme from the archaeal hyperthermophile Sulfolobus shibatae”, RNA (New York,
N.Y.), Vol. 2 No. 9, pp. 895–908.
Yusupov, M.M., Yusupova, G.Z., Baucom, A., Lieberman, K., Earnest, T.N., Cate, J.H. and Noller, H.F.
(2001), “Crystal structure of the ribosome at 5.5 A resolution”, Science, Vol. 292 No. 5518, pp.
883–896.
202
Zamecnik, P.C., Keller, E.B., Littlefield, J.W., Hoagland, M.B. and Loftfield, R.B. (1956), “Mechanism
of incorporation of labeled amino acids into protein”, Journal of cellular physiology.
Supplement, Vol. 47 Suppl 1, pp. 81–101.
Zhang, S., Sun, L. and Kragler, F. (2009), “The phloem-delivered RNA pool contains small
noncoding RNAs and interferes with translation”, Plant physiology, Vol. 150 No. 1, pp. 378–
387.
Zhang, Y. (2008), “I-TASSER server for protein 3D structure prediction”, BMC bioinformatics, Vol.
9, p. 40.
Zhao, F., Ohtsuki, T., Yamada, K., Yoshinari, S., Kita, K., Watanabe, Y.-I. and Watanabe, K. (2005),
“Isolation and physiochemical properties of protein-rich nematode mitochondrial ribosomes”,
Biochemistry, Vol. 44 No. 25, pp. 9232–9237.
Zhu, L. and Deutscher, M.P. (1987), “tRNA nucleotidyltransferase is not essential for Escherichia
coli viability”, The EMBO journal, Vol. 6 No. 8, pp. 2473–2477.
203
Curriculum vitae Personal information Name: Tina Jühling (née Müller) Adresse: Kahllachweg 5, D-77694 Kehl Email: tina.mueller@uni-leipzig;de [email protected] Date of birth: 25.07.1988 Place of birth: Haldensleben School education 1995 – 1999 Grundschule Bruno-Beye-Ring, Magdeburg 1999 – 2001 Sekundarschule Freiherr-vom-Stein, Magdeburg 2001 – 2007 Gymnasium Otto-von-Guericke, Magdeburg 2007 Abitur Academic education 2008 – 2011 French/German studies in Human- and Molecular Biology,
(Universität des Saarlandes)/ and in Molecular and cellular biology (Université de Strasbourg)
2011 – 2013 Master studies in Molecular and Cellular Biology, Philipps-Universität Marburg
2013 – 2015 International PhD program in Cotutelle de Thèse, Universität Leipzig (group of Prof. Dr. Mario Mörl, Institut für Biochemie)
2015 – 2016 PhD program continued at Université de Strasbourg (group of Prof. Dr. Catherine Florentz, IBMC/CNRS UPR 9002)

204
205
Eigenständigkeitserklärung
Hiermit erkläre ich, dass ich diese Arbeit selbstständig verfasst und keine anderen als die angegebenen Quellen und Hilfsmittel verwendet habe. Strasbourg, 5. November 2016

206
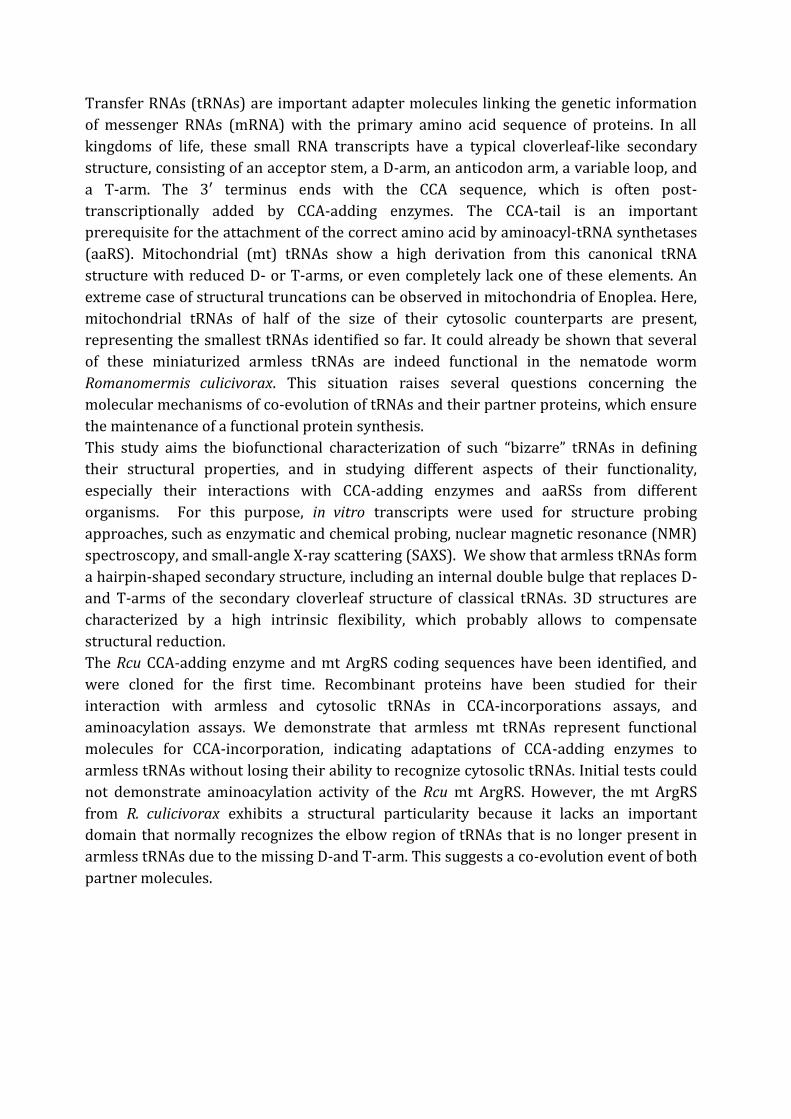
Transfer RNAs (tRNAs) are important adapter molecules linking the genetic information
of messenger RNAs (mRNA) with the primary amino acid sequence of proteins. In all
kingdoms of life, these small RNA transcripts have a typical cloverleaf-like secondary
structure, consisting of an acceptor stem, a D-arm, an anticodon arm, a variable loop, and
a T-arm. The 3′ terminus ends with the CCA sequence, which is often post-
transcriptionally added by CCA-adding enzymes. The CCA-tail is an important
prerequisite for the attachment of the correct amino acid by aminoacyl-tRNA synthetases
(aaRS). Mitochondrial (mt) tRNAs show a high derivation from this canonical tRNA
structure with reduced D- or T-arms, or even completely lack one of these elements. An
extreme case of structural truncations can be observed in mitochondria of Enoplea. Here,
mitochondrial tRNAs of half of the size of their cytosolic counterparts are present,
representing the smallest tRNAs identified so far. It could already be shown that several
of these miniaturized armless tRNAs are indeed functional in the nematode worm
Romanomermis culicivorax. This situation raises several questions concerning the
molecular mechanisms of co-evolution of tRNAs and their partner proteins, which ensure
the maintenance of a functional protein synthesis.
This study aims the biofunctional characterization of such “bizarre” tRNAs in defining
their structural properties, and in studying different aspects of their functionality,
especially their interactions with CCA-adding enzymes and aaRSs from different
organisms. For this purpose, in vitro transcripts were used for structure probing
approaches, such as enzymatic and chemical probing, nuclear magnetic resonance (NMR)
spectroscopy, and small-angle X-ray scattering (SAXS). We show that armless tRNAs form
a hairpin-shaped secondary structure, including an internal double bulge that replaces D-
and T-arms of the secondary cloverleaf structure of classical tRNAs. 3D structures are
characterized by a high intrinsic flexibility, which probably allows to compensate
structural reduction.
The Rcu CCA-adding enzyme and mt ArgRS coding sequences have been identified, and
were cloned for the first time. Recombinant proteins have been studied for their
interaction with armless and cytosolic tRNAs in CCA-incorporations assays, and
aminoacylation assays. We demonstrate that armless mt tRNAs represent functional
molecules for CCA-incorporation, indicating adaptations of CCA-adding enzymes to
armless tRNAs without losing their ability to recognize cytosolic tRNAs. Initial tests could
not demonstrate aminoacylation activity of the Rcu mt ArgRS. However, the mt ArgRS
from R. culicivorax exhibits a structural particularity because it lacks an important
domain that normally recognizes the elbow region of tRNAs that is no longer present in
armless tRNAs due to the missing D-and T-arm. This suggests a co-evolution event of both
partner molecules.