Thermoelectric properties of A 0.05Mo 3Sb 5.4Te 1.6 (A = Mn, Fe, Co, Ni
22
Accepted Manuscript Title: Thermoelectric properties of A 0.05 Mo 3 Sb 5.4 Te 1.6 (A = Mn, Fe, Co, Ni) Authors: Hong Xu, Katja M. Kleinke, Tim Holgate, David Rossouw, Gianluigi Botton, Terry M. Tritt, H. Kleinke PII: S0925-8388(10)01331-9 DOI: doi:10.1016/j.jallcom.2010.05.124 Reference: JALCOM 22469 To appear in: Journal of Alloys and Compounds Received date: 13-5-2010 Revised date: 25-5-2010 Accepted date: 25-5-2010 Please cite this article as: H. Xu, K.M. Kleinke, T. Holgate, D. Rossouw, G. Botton, T.M. Tritt, H. Kleinke, Thermoelectric properties of A 0.05 Mo 3 Sb 5.4 Te 1.6 (A = Mn, Fe, Co, Ni), Journal of Alloys and Compounds (2008), doi:10.1016/j.jallcom.2010.05.124 This is a PDF file of an unedited manuscript that has been accepted for publication. As a service to our customers we are providing this early version of the manuscript. The manuscript will undergo copyediting, typesetting, and review of the resulting proof before it is published in its final form. Please note that during the production process errors may be discovered which could affect the content, and all legal disclaimers that apply to the journal pertain.
Transcript of Thermoelectric properties of A 0.05Mo 3Sb 5.4Te 1.6 (A = Mn, Fe, Co, Ni
Accepted Manuscript
Title: Thermoelectric properties of A0.05Mo3Sb5.4Te1.6
(A = Mn, Fe, Co, Ni)
Authors: Hong Xu, Katja M. Kleinke, Tim Holgate, DavidRossouw, Gianluigi Botton, Terry M. Tritt, H. Kleinke
PII: S0925-8388(10)01331-9DOI: doi:10.1016/j.jallcom.2010.05.124Reference: JALCOM 22469
To appear in: Journal of Alloys and Compounds
Received date: 13-5-2010Revised date: 25-5-2010Accepted date: 25-5-2010
Please cite this article as: H. Xu, K.M. Kleinke, T. Holgate, D. Rossouw, G. Botton,T.M. Tritt, H. Kleinke, Thermoelectric properties of A0.05Mo3Sb5.4Te1.6 (A = Mn, Fe,Co, Ni), Journal of Alloys and Compounds (2008), doi:10.1016/j.jallcom.2010.05.124
This is a PDF file of an unedited manuscript that has been accepted for publication.As a service to our customers we are providing this early version of the manuscript.The manuscript will undergo copyediting, typesetting, and review of the resulting proofbefore it is published in its final form. Please note that during the production processerrors may be discovered which could affect the content, and all legal disclaimers thatapply to the journal pertain.

Page 1 of 21
Accep
ted
Man
uscr
ipt
1
Journal of Alloys and Compounds
Thermoelectric properties of A0.05Mo3Sb5.4Te1.6 (A = Mn, Fe, Co, Ni) Hong Xu,1 Katja M. Kleinke,1 Tim Holgate,2 David Rossouw,3 Gianluigi Botton,3 Terry M. Tritt2 and H. Kleinke1,* 1. Department of Chemistry, University of Waterloo, Waterloo, Ontario, Canada N2L 3G1. 2. Department of Physics and Astronomy, Clemson University, Clemson, SC, USA 29634-0978 3. Materials Science and Engineering, McMaster University, Hamilton, Ontario, Canada, L8S 4L7 *. Corresponding author: [email protected] (Holger Kleinke) ABSTRACT. Mo3Sb7-xTex was earlier reported to be a promising p-type thermoelectric material for high temperature applications, with Ni0.06Mo3Sb5.4Te1.6 achieving a ZT of 0.93 at 1023 K. In order to investigate the effect of using different transition metal atoms and to further improve the thermoelectric properties, a variety of transition metal atoms (Mn, Fe, Co and Ni) were intercalated into the voids of empty Sb atom cubes. Our results indicate that Fe0.05Mo3Sb5.4Te1.6 and Ni0.05Mo3Sb5.4Te1.6 exhibit a higher power factor than Mo3Sb5.4Te1.6. Fe0.05Mo3Sb5.4Te1.6 demonstrates the highest ZT value at 673 K (ZT = 0.31), significantly higher than Mo3Sb5.4Te1.6. Thermal analysis proves Ni0.05Mo3Sb5.4Te1.6 to be phase stable at least until 1250 K in an inert atmosphere, an important prerequisite for high temperature applications. Keywords: antimonide, telluride, electronic structure, physical properties
Page 2 of 21
Accep
ted
Man
uscr
ipt
2
1. Introduction With the depletion of natural resources, the exploration of the alternative energy resources is becoming more and more imperative for sustainable development. Thermoelectric materials are attracting extensive interest because of their potential of converting temperature gradients into electricity [1]. Several automotive companies, such as General Motors, BMW, Ford and Toyota, are working on thermoelectric-based exhaust heat recovery to reduce the fuel consumption [2]. Moreover, thermoelectric materials are also employed as power supply in a variety of applications, such as radioactive thermoelectric generators (RTG) in spaceships (Voyager and Cassini) and for data gathering and telecommunication in remote terrestrial areas [3]. Thermoelectric materials are typically semiconductor with narrow band gaps, composed of heavy elements and comprising complicated crystal structures [4-7]. Thermoelectric materials are ranked by their dimensionless figure-of-merit, ZT = TS2σ/κ, with T being the average absolute temperature between the hot and the cold side of the thermoelectric device. A high Seebeck coefficient (S), high electrical conductivity (σ) and low thermal conductivity (κ) are essential to achieve high ZT values. The thermoelectric efficiency depends on ZT and the temperature gradient via equation (1):
HCH
CH
TTZTZT
TTT
/111
++−+
⋅−
=η (1)
The relatively low efficiency currently restricts wider applications of the thermoelectric energy conversion. Developing materials that can work at higher temperature (thus providing a higher temperature difference) with high ZT would significantly improve the thermoelectric efficiency. To date, the only commercial thermoelectric material for such high temperature applications is a solid solution of Si1-xGex. n-type Si0.8Ge0.2 exhibits a ZT of 1 around 1173 K, however the p-type Si0.8Ge0.2 only showed a ZT of 0.6 at similar temperature [8]. Other leading thermoelectric materials for high temperature applications include the p-type Yb14MnSb11 with ZT = 1.1 at 1275 K [9] and n-type AgPb18SbTe20 with ZT = 2.2 at 800 K [10]. About ten years ago, the Kleinke group commenced to investigate the thermoelectric properties of Mo3Sb7-xTex [11] and its variants with intercalated transition metal atoms [12-14]. Gascoin et al. showed in 2007 that Mo3Sb5.4Te1.6 attains ZT = 0.80 at 1050 K [15], and in 2009, Candolfi et al. identified Mo3Sb7 as one of the best p-type thermoelectric metals with a ZT = 0.11 at 800 K [16]. They also reported on the magnetic and thermoelectric properties of Mo3Sb7-xTex [17] and Mo3-xRuxSb7 [18, 19]. Thus far, the highest ZT value achieved within this series of compounds is ZT = 0.93 at 1023 K, exhibited by Ni0.06Mo3Sb5.4Te1.6 [20]. In this paper, we examine the effect of using different transition metal atoms, i.e. Mn, Fe, and Co. 2. Experimental section 2.1. Syntheses and analyses All samples were prepared from the elements: molybdenum (powder, -100 mesh, 99.95%), antimony (powder, -100 mesh, 99.5%), tellurium (broken ingot, 99.99%), iron (powder, < 10 µm,
Page 3 of 21
Accep
ted
Man
uscr
ipt
3
99.9%) and nickel (powder, -200 mesh, 99.9%) were acquired from Alfa Aesar; manganese (powder, -50 mesh, 99.9%) and cobalt (powder, -100 mesh, 99.9%) were purchased from Aldrich. As shown in 2002/3 via single crystal structure determinations, less than 0.10 metal atoms (A = Mg, Fe, Co, and Ni) per formula unit can be added into the cubes of Sb2 atoms (there is only one cube for two formula units Mo3Sb7-xTex; completing filling would result in the formula of A0.5Mo3Sb7-xTex) [12, 20]. Therefore, an intermediate amount of 0.05 was chosen for all transition metal atoms. All the elements were weighed in the desired stoichiometric ratio, then mixed and loaded into silica tubes in the argon-filled glove box. These tubes were evacuated and sealed under vacuum, followed by heating in resistance furnaces at 993 K over a period of 10 days. The resulting products were thoroughly ground and analyzed via X-ray powder diffraction, utilizing INEL's powder diffractometer with a position sensitive detector. If any side product peaks were found, e.g. MoTe2 or unreacted Sb, the samples were reloaded into new silica tubes to repeat the heating procedure. In most cases, these peaks disappeared during the second heating step. Only samples without any visible side products were sent to the Complex and Advanced Materials Laboratories (CAML) at Clemson University for the preparation of hot-pressed pellets and subsequent physical properties measurements on these pellets. Differential scanning calorimetry (DSC) was used to investigate the thermal stability of Mo3Sb7 and Ni0.05Mo3Sb5.4Te1.6. The calorimetry experiment was performed between 300 K and 1473 K with computer controlled NETZSCH STA 409PC Luxx with a heating rate of 10 K/min. The samples were sealed in small silica ampoules under vacuum and placed into a flowing argon atmosphere for the measurement, as described before [21]. A hot-pressed pellet of the nominal composition Ni0.05Mo3Sb5.4Te1.6 was analyzed employing the LEO 1530 scanning electron microscope (SEM) with integrated EDAX Pegasus 1200, using an acceleration voltage of 20 kV. A part of this pellet was sent to McMaster University as well for high resolution transmission electron microscope (HRTEM) analysis on the Cs corrected FEI Titan TEM with a 300 keV acceleration voltage. TEM samples were prepared by low angle wedge tripod polishing. The thin tip of the wedge was ion milled at liquid nitrogen temperature to electron transparency. 2.2. Electronic structure calculations The LMTO method (LMTO = linear muffin tin orbitals) with the atomic spheres approximation (ASA) [22, 23] was utilized for the electronic structure calculations. The density functional theory with local density approximation (LDA) was employed to treat the exchange and correlation energies [24]. Although A0.05Mo3Sb5.4Te1.6 was the nominal composition investigated here, Ni0.125Mo3Sb5.5Te1.5 was depicted as a model in order not to use a too large unit cell. Ni0.125Mo3Sb5.5Te1.5 and Mo3Sb5.5Te1.5 were calculated based on our crystallographic data obtained for Mo3Sb7 from the year 2002 [11], where half of the Sb1 atoms were substituted by Te atoms. The space group was thereby reduced from Im3¯m to I4/mmm, while retaining the unit cell size of Mo3Sb7 model. Next, we doubled the unit cell in order to fill only a quarter of the voids, necessitated by the 0.125 Ni per formula unit. The following wavefunctions were used: for Ni 4s, 4p, and 3d; for Mo 5s, 5p, 4d and 4f included via the downfolding technique [25]; for Sb and Te
Page 4 of 21
Accep
ted
Man
uscr
ipt
4
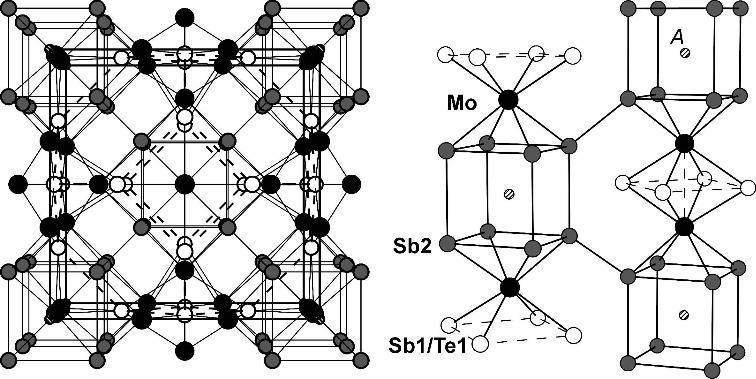
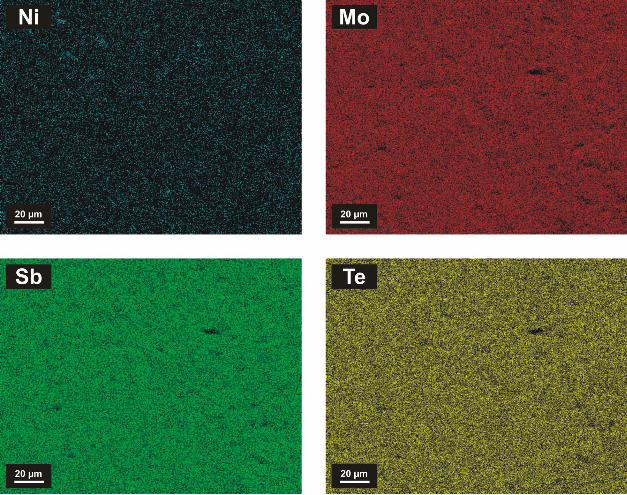
5s, 5p, and 5d, 4f (the last two downfolded). 256 k points of the first Brillouin zone were selected via an improved tetrahedron method [26]. 2.3. Physical property measurements Thermoelectric property measurements were carried out at CAML at Clemson University. All samples were hot-pressed under 175 MPa at 993 K for one hour. The densities achieved were at least 96% of the theoretical maximum. Seebeck coefficient and electrical conductivity were determined at low temperature via a custom-built apparatus, with estimated errors of ±1 µVK-1 for the Seebeck coefficient and ±3% for the conductivity [27]. Subsequently, high temperature data were collected simultaneously on the ULVAC ZEM-2, and then scaled to match the 300 K data obtained from the custom-built apparatus. High temperature thermal conductivity data was calculated from the material density (ρ), thermal diffusivity (α) and specific heat (Cp) via the relationship of κ = ραCp. Thermal diffusivity was measured utilizing a laser flash system (NETZSCH LFA 457) with an estimated error of ±3%, and specific heat measurements were carried out on NETZSCH DSC system. These measurement setups were described previously [13, 14]. 3. Results and discussion 3.1. Crystal structure The Mo3Sb7-xTex crystallizes in the Ir3Ge7 structure type with the space group Im3¯m. Because the structure of Mo3Sb7-xTex was described in detail before [11], only a brief summary is given here. The transition metal atom A is located in the cube formed by eight Sb2 atoms. These Sb2 atoms are part of a square Mo(Sb,Te)8 antiprism, and two such antiprisms share a face comprised of Sb1/Te1 (Figure 1). The Sb2 atoms participate in intermediate Sb2–Sb2 bonds of 3.1 Å along the edges of the cube, and are also connected to the Sb2 atoms of the neighboring cubes via the shortest Sb2–Sb2 distance (2.9 Å). As we proposed in 2002, the Sb1 sites are partially occupied by Te1 atoms because Te has the higher electronegativity and prefers to occupy the site with less anion-anion bonding, such as the S atoms in ZrSiS [28] and CeAsS [29]. That supposition was confirmed via neutron diffraction by Candolfi et al. in 2008 [30]. A longer distance of 3.3 Å (dashed lines) occurs along the edges of the (Sb1/Te1)4 square between the Mo atoms. All of these interactions contribute to the density of states, DOS, around the Fermi level [31]. In general, the chains of Mo3Sb7-xTex are comprised of Sb2 cube – Mo – Sb1/Te1 square – Mo – Sb2 cube – Mo… Three such chains penetrate each other at the Sb2 cubes to construct the three-dimensional structure. The transition metal atoms A = Mn, Fe, Co, Ni are intercalated into the Sb2 cubes to form eight A–Sb2 bonds of 2.6 – 2.7 Å [12]. Figure 1 here 3.2. Electron microscopy The SEM map screens of the composing elements of Ni0.05Mo3Sb5.4Te1.6 are shown in Figure 2. The distribution of Ni, Mo, Sb and Te appeared to be quite homogeneous throughout the sample.
Page 5 of 21
Accep
ted
Man
uscr
ipt
5
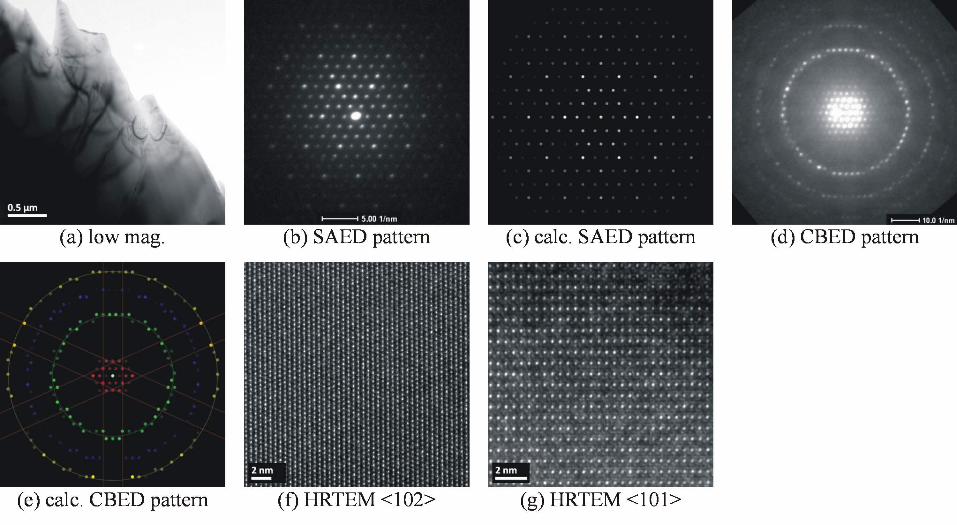
Figure 2 here Bright field TEM images show large single crystal regions in the sample (Figure 3). Bend contours are apparent in thin regions where the crystal lattice is strained. The residual stain in the lattice is likely due to the mechanical thinning process. The SAED pattern is in good agreement with the one calculated [32] for the <102> zone axis orientation. The CBED pattern imaged down the same <102> zone axis displays m3m symmetry, consistent with the proposed space group Im3¯
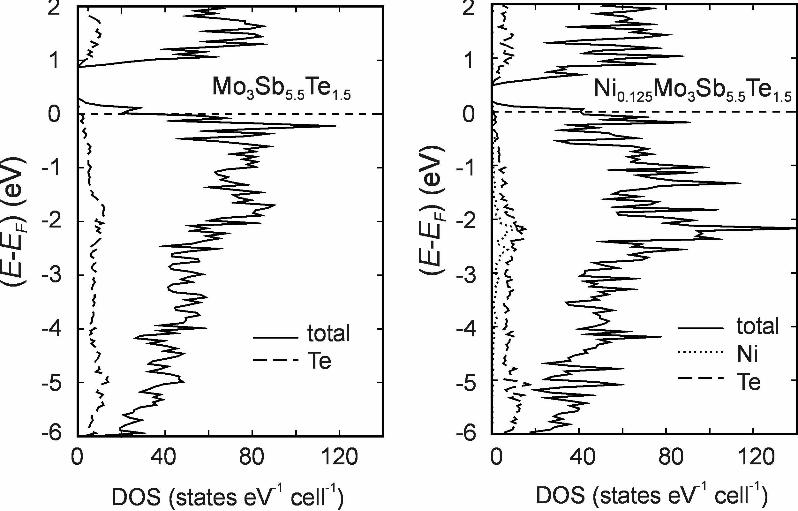
m. Higher order Laue zones and Kikuchi lines are also visible in the CBED pattern and are in good agreement with the calculations. Finally, HRTEM phase contrast images reveal individual atomic columns in the lattice oriented down the <102> and <101> zone axis, indicating the high crystallinity of Ni0.05Mo3Sb5.4Te1.6. The somewhat mottled appearance in Figure 3(g) is likely due to the presence of a thin amorphous layer on the surface of the sample. No nanostructured domains were detected. Figure 3 here 3.3. Electronic structure Our previous calculation showed Mo3Sb5Te2 (with its 55 valence electrons) to be a semiconductor with a band gap of 0.6 eV [20]. As discussed previously [33], adding Ni will not significantly alter the valence electron concentration, as its d states were almost completely found below the Fermi level (EF) in case of Ni0.25Mo3Sb5Te2. Mo3Sb5.5Te1.5 with its fewer valence electrons is to be considered a p-doped semiconductor, where the top of the valence band is empty (left part of Figure 4). By analogy, the same should be true for Mo3Sb5.4Te1.6. Adding Ni to p-type Mo3Sb5.5Te1.5 appears to reduce this material to some small extent, because some Ni d states are unfilled at the top of the valence band of Ni0.125Mo3Sb5.5Te1.5 (dotted line in the right part of Figure 4). Also, the number of states at EF appears to be slightly higher, but that may be an artifact of the calculation and the hypothetical character of the model with 0.125 Ni. In any case, Hall effect measurements yielded a higher charge carrier concentration of Ni0.05Mo3Sb5.4Te1.6, compared to Mo3Sb5.4Te1.6 [13], which may be a consequence of the larger number of states at EF. Figure 4 here Because of the high correlation in compounds with partially filled 3d orbitals, the cases with e.g. A = Mn and Fe cannot be reliably computed within the LMTO method. Nevertheless, the transition metal atom A in general contributes to the valence band, and changes the band gap size and number of states at EF. For example, Mo3Sb5.5Te1.5 has a band gap of 0.57 eV, and adding 0.125 Ni reduces the band gap to 0.30 eV. In conclusion, while a significant effect of using different transition metals A onto the physical properties is expected, it is hard to quantify. 3.4. Physical properties All of our samples show reasonably high electrical conductivity values above 10+3 Ω-1cm-1 at 300 K. In each case, the electrical conductivity (σ) decreases with increasing temperature (Figure

Page 6 of 21
Accep
ted
Man
uscr
ipt
6
5), typical for a degenerate semiconductor, as the charge carrier concentration is basically independent of the temperature [13]. Ni0.05Mo3Sb5.4Te1.6 demonstrates the highest σ (1800 Ω-1cm-
1 at 320 K), and Co0.05Mo3Sb5.4Te1.6 the lowest with 1500 Ω-1cm-1 at 320 K). The difference of 20% is much higher than the estimated error of 3%. The sample without 3d element (called "no A") exhibits the second highest σ (1740 Ω-1cm-1 at 320 K). Mn0.05Mo3Sb5.4Te1.6 and Fe0.05Mo3Sb5.4Te1.6 have virtually identical electrical conductivity values at 320 K, namely 1650 Ω-1cm-1. With increasing temperature, σ of Fe0.05Mo3Sb5.4Te1.6 decreases slightly slower. Figure 5 here The Seebeck coefficient measurements confirmed that all title compounds are p-type semiconductors with Seebeck values (S) between +55 µVK-1 and +65 µVK-1 around 320 K (Figure 6). With an experimental error of 1 µVK-1, the differences are significant. S increases in all cases with increasing temperature, typical for samples with constant charge carrier concentration, reaching a maximum of +170 µVK-1 at 950 K in case of Fe0.05Mo3Sb5.4Te1.6. The samples with the highest electrical conductivity, Ni0.05Mo3Sb5.4Te1.6 and Mo3Sb5.4Te1.6, have the lowest Seebeck coefficient values. Fe0.05Mo3Sb5.4Te1.6 has the highest Seebeck coefficient, indicating that its derivative of the DOS at EF is large – see equation (2) [34, 35].
EEDOS
EDOSS
F ∂∂
=)([
)(1 (2)
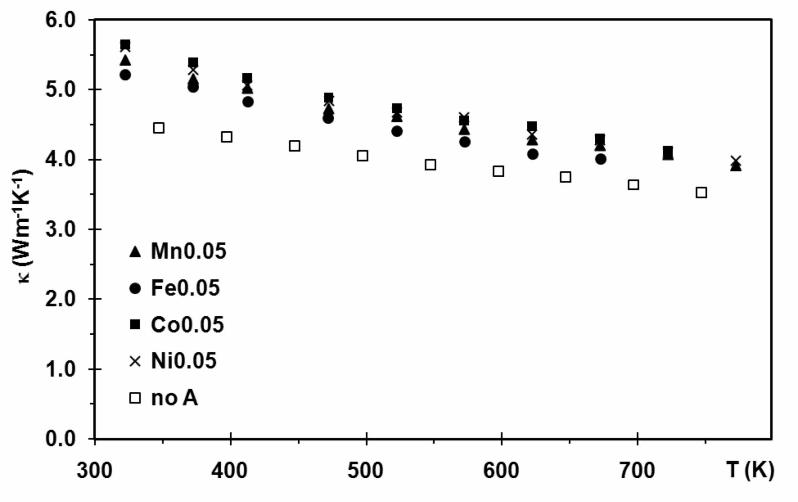
Figure 6 here The power factor (P.F. = S2σ) reflects the combined impact of Seebeck coefficient and electrical conductivity onto ZT (sometimes P.F. is alternatively defined as the product of S2, σ and T). Because of its highest Seebeck coefficient and intermediate electrical conductivity, Fe0.05Mo3Sb5.4Te1.6 exhibits the highest power factor in the whole temperature range measured (Figure 7), with P.F.(320 K) = 7.0 µWcm-1K-2 and P.F.(950 K) = 27.6 µWcm-1K-2, respectively. Ni0.05Mo3Sb5.4Te1.6, Mn0.05Mo3Sb5.4Te1.6 and Mo3Sb5.4Te1.6 have very comparable power factor values below 570 K. With rising temperature, P.F. of Ni0.05Mo3Sb5.4Te1.6 increases faster. For example, Ni0.05Mo3Sb5.4Te1.6 has a P.F.(770 K) = 20.2 µWcm-1K-2, Mn0.05Mo3Sb5.4Te1.6 a P.F.(770 K) = 17.9 µWcm-1K-2 and Mo3Sb5.4Te1.6 a P.F.(800 K) = 18.1 µWcm-1K-2. Co0.05Mo3Sb5.4Te1.6 has the lowest power factor within this series of samples mostly due to its lowest electrical conductivity. All the power factor values mentioned above are significantly higher than the power factor of Yb14MnSb11, one of the leading p-type thermoelectric materials, which exhibits its maximum P.F. = 6 µWcm-1K-2 at 1200 K [9]. Figure 7 here Last, the thermal conductivity, being the sum of the lattice contribution (κL) and the contribution from the charge carriers (κel), is generally decreasing with increasing temperature

Page 7 of 21
Accep
ted
Man
uscr
ipt
7
(Figure 8), as κL decreases because of the increasing lattice vibration and κel as seen in the electrical conductivity measurements. All quaternary antimonide-tellurides A0.05Mo3Sb5.4Te1.6 (A = Mn, Co, Fe, Ni) have higher thermal conductivity values than Mo3Sb5.4Te1.6, with κ between 5.2 Wm-1K-1 (Fe0.05Mo3Sb5.4Te1.6) and 5.6 Wm-1K-1 (Co0.05Mo3Sb5.4Te1.6) at 320 K and 2.1 Wm-
1K-1 (Fe0.05Mo3Sb5.4Te1.6) to 2.7 Wm-1K-1 (Co0.05Mo3Sb5.4Te1.6) at 670 K, compared to 4.5 Wm-
1K-1 for Mo3Sb5.4Te1.6 at 320 K. The observation of a 13% - 20% lower κ of Mo3Sb5.4Te1.6 is consistent with the low temperature data presented earlier [13], and compares well with the data on Mo3Sb5.4Te1.6 presented by Gascoin et al. [15]. That difference must come from the lattice contributions, because the electrical conductivity values and thus the electronic contributions are comparable; in fact, Mo3Sb5.4Te1.6 exhibits the second highest electrical conductivity of the materials investigated here. The fact that the thermal conductivity increases upon intercalation of the 3d transition metal atoms indicates that the additional atoms act as space fillers rather than rattlers, decreasing the porosity of the material. Figure 8 here Compared with the thermal conductivity of Yb14MnSb11, the high thermal conductivity of these antimonide-tellurides is their main disadvantage. The very low thermal conductivity of Yb14MnSb11 (e.g., 0.8 Wm-1K-1 at 300 K) results in high ZT values in spite of its relatively small power factor [9]. Because the thermal conductivity was measured at different temperatures than Seebeck coefficient and electrical conductivity, linear fits of the power factor (S2σ) combined with the measured thermal conductivity (κ) were used to determine ZT. The uncertainty of the ZT values is estimated to be 5% - 7%. The thus calculated ZT curves increase rapidly with increasing temperature (Figure 9) because of the simultaneous increase of P.F. (and T) and decrease of κ. Fe0.05Mo3Sb5.4Te1.6 presents the largest ZT values here, which may be extrapolated to reach ZT = 0.85 at 1023 K like Yb14MnSb11 [9]. Co0.05Mo3Sb5.4Te1.6 has the lowest ZT, and Ni0.05Mo3Sb5.4Te1.6, Mo3Sb5.4Te1.6 and MnMo3Sb5.4Te1.6 exhibit very comparable ZT values in the whole temperature range, varying from 0.03 at 322 K to 0.39 at 772 K. Figure 9 here 3.5. Thermal analysis DSC measurements for Ni0.05Mo3Sb5.4Te1.6 and Mo3Sb7 were carried out at the University of Waterloo. The downtrend of the Ni0.05Mo3Sb5.4Te1.6 curve below 1100 K is caused by an overcorrection of the baseline (Figure 10). The decomposition of Mo3Sb7 into the elements Mo and Sb occurs at 1263 K, and the decomposition of Ni0.05Mo3Sb5.4Te1.6 peaks at 1326 K. Both of these two temperatures are much higher than the earlier reported decomposition temperature of Mo3Sb7 of 1073 K [36]. X-ray diagrams obtained after these experiments revealed the existence of Mo, Sb, NixMo3(Sb,Te)7 and MoTe2. Apparently Ni0.05Mo3Sb5.4Te1.6 can endure higher temperatures than Mo3Sb7, likely of a consequence of the additional filled bonding states because of the larger valence electron concentration [31].
Page 8 of 21
Accep
ted
Man
uscr
ipt
8
Figure 10 here 4. Conclusions
The high temperature thermoelectric properties of A0.05Mo3Sb5.4Te1.6 (A = Mn, Fe, Co and
Ni) and Mo3Sb5.4Te1.6 were examined and compared in this paper. Compared to other
thermoelectrics, these samples exhibit high power factor values, but also rather high thermal
conductivity. Adding Fe and Ni can increase the power factor of A0.05Mo3Sb5.4Te1.6 over that of
Mo3Sb5.4Te1.6; however, the thermal conductivity is increased in all cases with addition of
transition metal atoms.
An enhancement of the thermoelectric ZT value, compared to Mo3Sb5.4Te1.6, was achieved
upon addition of Fe and Ni atoms. The best compound Fe0.05Mo3Sb5.4Te1.6 obtains ZT = 0.31 at
673 K. This value is higher than that of Ni0.05Mo3Sb5.4Te1.6 (ZT = 0.27 at 673 K), but lower than
the value of Ni0.06Mo3Sb5.4Te1.6 (ZT = 0.34 at 673 K) that we reported in 2009 [20]. The latter
reaches ZT > 0.9 above 1000 K. We will attempt to lower the thermal conductivity during
ongoing research, for example via different consolidation techniques after ball-milling and via
using nanocomposites.
Acknowledgments Financial support from NSERC and Canada Research Chair program (CRC for H.K.) is appreciated. We acknowledge the partial support from the Donors of the American Chemical Society Petroleum Research Fund. We further appreciate the support from a DOE/EPSCoR Implementation Grant (#DE-FG02-04ER-46139) and from the SC EPSCoR Office, Clemson University and McMaster University for the work highlighted in this paper.
Page 9 of 21
Accep
ted
Man
uscr
ipt
9
References [1] T. M. Tritt, Science 283 (1999) 804-805. [2] J. Yang, T. Caillat, Mat. Res. Bull. 31 (2006) 224-229. [3] D. M. Rowe, CRC Handbook of Thermoelectrics, CRC Press, Boca Raton, FL,
1995. [4] T. M. Tritt, Science 272 (1995) 1276-1277. [5] F. J. DiSalvo, Science 285 (1999) 703-706. [6] G. J. Snyder, E. S. Toberer, Nature Mater. 7 (2008) 105-114. [7] E. S. Toberer, A. F. May, G. J. Snyder, Chem. Mater. 22 (2010) 624-634. [8] C. B. Vining, W. Laskow, J. O. Hanson, R. R. Van der Beck, P. D. Gorsuch, J.
Appl. Phys. 69 (1991) 4333-4340. [9] S. R. Brown, S. M. Kauzlarich, F. Gascoin, G. J. Snyder, Chem. Mater. 18
(2006) 1873-1877. [10] K. F. Hsu, S. Loo, F. Guo, W. Chen, J. S. Dyck, C. Uher, T. Hogan, E. K.
Polychroniadis, M. G. Kanatzidis, Science 303 (2004) 818-821. [11] E. Dashjav, A. Szczepenowska, H. Kleinke, J. Mater. Chem. 12 (2002) 345-349. [12] N. Soheilnia, E. Dashjav, H. Kleinke, Can. J. Chem. 81 (2003) 1157-1163. [13] H. Zhang, J. He, B. Zhang, Z. Su, T. M. Tritt, N. Soheilnia, H. Kleinke, J.
Electron. Mater. 36 (2007) 727-731. [14] H. Xu, N. Soheilnia, H. Zhang, P. N. Alboni, T. M. Tritt, H. Kleinke, Mater.
Res. Soc. Symp. Proc. 1044 (2008) 459-467. [15] F. Gascoin, J. Rasmussen, G. J. Snyder, J. Alloys Compd. 427 (2007) 324-329. [16] C. Candolfi, B. Lenoir, A. Dauscher, E. Guilmeau, J. Hejtmánek, J. Tobola, B.
Wiendlocha, S. Kaprzyk, Phys. Rev. B 79 (2009) 035114/035111-035114/035116. [17] C. Candolfi, B. Lenoir, A. Dauscher, J. Hejtmánek, J. Tobola, Phys. Rev. B 79
(2009) 235108/235101-235108/235112. [18] C. Candolfi, B. Lenoir, J. Leszczynski, A. Dauscher, E. Guilmeau, J. Appl.
Phys. 105 (2009) 083701/083701-083701/083704. [19] C. Candolfi, B. Lenoir, J. Leszczynski, A. Dauscher, J. Tobola, S. J. Clarke, R.
I. Smith, Inorg. Chem. 48 (2009) 5216-5323. [20] H. Xu, K. M. Kleinke, T. Holgate, H. Zhang, Z. Su, T. M. Tritt, H. Kleinke, J.
Appl. Phys. 105 (2009) 053703/053701-053703/053705. [21] M. Zelinska, A. Assoud, C. Graf, H. Kleinke, Inorg. Chem. 49 (2010) 1090-
1093. [22] O. K. Andersen, Phys. Rev. B 12 (1975) 3060-3083. [23] H. L. Skriver, The LMTO Method, Springer, Berlin, Germany, 1984. [24] L. Hedin, B. I. Lundqvist, J. Phys. C 4 (1971) 2064-2083. [25] W. R. L. Lambrecht, O. K. Andersen, Phys. Rev. B 34 (1986) 2439-2449. [26] P. E. Blöchl, O. Jepsen, O. K. Andersen, Phys. Rev. B 49 (1994) 16223-16233. [27] A. L. Pope, R. T. Littleton IV, T. M. Tritt, Rev. Sci. Instrum. 72 (2001) 3129-
3131. [28] F. Jellinek, H. Hahn, Naturwiss. 49 (1962) 103. [29] R. Ceolin, N. Rodier, P. Khodadad, J. Less-Common Met. 53 (1977) 137-140.

Page 10 of 21
Accep
ted
Man
uscr
ipt
10
[30] C. Candolfi, B. Lenoir, A. Dauscher, J. Tobola, S. J. Clarke, R. I. Smith, Chem. Mater. 20 (2008) 6556-6561.
[31] J. Xu, H. Kleinke, J. Comput. Chem. 29 (2008) 2134-2143. [32] P. Stadelmann, JEMS - Java Electron Microscopy Software, version
2.0819W2005, EPFL, Switzerland, 2001. [33] H. Kleinke, Chem. Mater. 22 (2010) 604-611. [34] N. F. Mott, H. Jones, The Theory of the Properties of Metals and Alloys, Dover
Publications, New York, NY, 1958. [35] G. D. Mahan, J. O. Sofo, Proc. Natl. Acad. Sci. USA 93 (1996) 7436-7439. [36] P. Jensen, A. Kjekshus, T. Skansen, Acta Chem Scand. 20 (1966) 403-416.
Page 11 of 21
Accep
ted
Man
uscr
ipt
11
Figure captions. Figure 1. Crystal structure of AxMo3Sb7-xTex (left) and fragments of its chains (right). Figure 2. SEM map screens of different elements of Ni0.05Mo3Sb5.4Te1.6. Figure 3. TEM images of Ni0.05Mo3Sb5.4Te1.6. Figure 4. Density of states of Mo3Sb5.5Te1.5 (left) and Ni0.125Mo3Sb5.5Te1.5 (right). Figure 5. Electrical conductivity of A0.05Mo3Sb5.4Te1.6 (A = Mn, Fe, Co, Ni) and Mo3Sb5.4Te1.6. Figure 6. Seebeck coefficient of A0.05Mo3Sb5.4Te1.6 (A = Mn, Fe, Co, Ni) and Mo3Sb5.4Te1.6. Figure 7. Power factor (P.F.) of A0.05Mo3Sb5.4Te1.6 (A = Mn, Fe, Co, Ni) and Mo3Sb5.4Te1.6. Figure 8. Thermal conductivity of A0.05Mo3Sb5.4Te1.6 (A = Mn, Fe, Co, Ni) and Mo3Sb5.4Te1.6. Figure 9. Thermoelectric figure of merit ZT of A0.05Mo3Sb5.4Te1.6 (A = Mn, Fe, Co, Ni) and Mo3Sb5.4Te1.6. Figure 10. DSC curves of Ni0.05Mo3Sb5.4Te1.6 and Mo3Sb7.
Page 12 of 21
Accep
ted
Man
uscr
ipt
Page 13 of 21
Accep
ted
Man
uscr
ipt
Page 14 of 21
Accep
ted
Man
uscr
ipt
Page 15 of 21
Accep
ted
Man
uscr
ipt

Page 16 of 21
Accep
ted
Man
uscr
ipt

Page 17 of 21
Accep
ted
Man
uscr
ipt

Page 18 of 21
Accep
ted
Man
uscr
ipt
Page 19 of 21
Accep
ted
Man
uscr
ipt

Page 20 of 21
Accep
ted
Man
uscr
ipt

Page 21 of 21
Accep
ted
Man
uscr
ipt