The structure, dynamics, and energetics of protein adsorption—lessons learned from adsorption of...
16
MAGNETIC RESONANCE IN CHEMISTRY Magn. Reson. Chem. 2007; 45: S32–S47 Published online in Wiley InterScience (www.interscience.wiley.com) DOI: 10.1002/mrc.2123 Review The structure, dynamics, and energetics of protein adsorption – lessons learned from adsorption of statherin to hydroxyapatite Gil Goobes, 1∗$ Rivka Goobes, 2 Wendy J. Shaw, 1# James M. Gibson, 2† Joanna R. Long, 2‡ Vinodhkumar Raghunathan, 1 Ora Schueler-Furman, 3†† Jennifer M. Popham, 1 David Baker, 3 Charles T. Campbell, 1 Patrick S. Stayton 2 and Gary P. Drobny 1∗ 1 Department of Chemistry, University of Washington, Seattle WA 98195, USA 2 Department of Bioengineering, University of Washington, Seattle WA 98195, USA 3 Department of Biochemistry, University of Washington, Seattle WA 98195, USA Received 23 July 2007; Revised 27 September 2007; Accepted 1 October 2007 Proteins are found to be involved in interaction with solid surfaces in numerous natural events. Acidic proteins that adsorb to crystal faces of a biomineral to control the growth and morphology of hard tissue are only one example. Deducing the mechanisms of surface recognition exercised by proteins has implications to osteogenesis, pathological calcification and other proteins functions at their adsorbed state. Statherin is an enamel pellicle protein that inhibits hydroxyapatite nucleation and growth, lubricates the enamel surface, and is recognized by oral bacteria in periodontal diseases. Here, we highlight some of the insights we obtained recently using both thermodynamic and solid state NMR measurements to the adsorption process of statherin to hydroxyapatite. We combine macroscopic energy characterization with microscopic structural findings to present our views of protein adsorption mechanisms and the structural changes accompanying it and discuss the implications of these studies to understanding the functions of the protein adsorbed to the enamel surfaces. Copyright 2007 John Wiley & Sons, Ltd. KEYWORDS: solid-state NMR; protein; structure; adsorption; recoupling; magic angle spinning; calorimetry INTRODUCTION TO BIOMINERALIZATION AND BACTERIAL ADHESION TO MINERALIZED TISSUE Elaborate mechanisms are used by living organisms to form organic–inorganic composites in hard tissues through the interaction of proteins, and ultimately cells, with inorganic mineral phases. The enhanced mechanical properties of bio- composites such as bone and teeth thus result from the Ł Correspondence to: Gil Goobes and Gary P. Drobny, Department of Chemistry, University of Washington, Box 351700, Seattle WA 98195, USA. E-mail: [email protected]; [email protected] $ Current address: Department of Chemistry, Bar Ilan University, Ramat Gan 52900, Israel. # Current address: Pacific Northwest National Laboratory, Richland, WA 99352, USA. † Current address: Department of Chemistry and Chemical Biology, Rensselaer Polytechnic Institute, Troy, NY 12180, USA. ‡ Current address: Department of Biochemistry and Molecular Biology, McKnight Brain Institute, University of Florida, Gainesville, FA 32610, USA. †† Current address: Department of Molecular Genetics and Biotechnology, Hebrew University, Hadassah Medical School, Jerusalem 91120, Israel. operation of proteins that regulate osteogenesis microscop- ically at the organic–inorganic interface. The underlying molecular mechanisms of biomineralization regulation are of major importance to dentistry and medicine, as impairment of biomineralization processes can lead to osteoporosis, den- tal calculus, arthritis, and pathological mineralization of the form observed in atherosclerotic plaque, artificial heart valve calcification, and kidney stone. 1–3 A better understanding of the biomolecular mechanisms used to promote or slow down crystal growth could provide important design principles for the development of mineralization promoters or blockers in dentistry, orthopedics, urology, and cardiology. Similarly, insights into how these proteins recognize and assemble in bioactive form on inorganic mineral phases could also aid in the development of better surface coatings providing enhanced biocompatibility of implantable devices and for hard tissue engineering and regeneration technologies. Understanding the function of any protein requires that the structure of the molecule be defined within its biological environment; in this case, the fold of a biomineralization protein in contact with the crystal surface of the mineral. In addition, the precise nature of the interactions between the protein and the crystal which underlie the recognition Copyright 2007 John Wiley & Sons, Ltd.
Transcript of The structure, dynamics, and energetics of protein adsorption—lessons learned from adsorption of...

MAGNETIC RESONANCE IN CHEMISTRYMagn. Reson. Chem. 2007; 45: S32–S47Published online in Wiley InterScience(www.interscience.wiley.com) DOI: 10.1002/mrc.2123
Review
The structure, dynamics, and energetics of proteinadsorption – lessons learned from adsorption ofstatherin to hydroxyapatite
Gil Goobes,1∗$ Rivka Goobes,2 Wendy J. Shaw,1# James M. Gibson,2† Joanna R. Long,2‡
Vinodhkumar Raghunathan,1 Ora Schueler-Furman,3†† Jennifer M. Popham,1 David Baker,3
Charles T. Campbell,1 Patrick S. Stayton2 and Gary P. Drobny1∗
1 Department of Chemistry, University of Washington, Seattle WA 98195, USA2 Department of Bioengineering, University of Washington, Seattle WA 98195, USA3 Department of Biochemistry, University of Washington, Seattle WA 98195, USA
Received 23 July 2007; Revised 27 September 2007; Accepted 1 October 2007
Proteins are found to be involved in interaction with solid surfaces in numerous natural events. Acidicproteins that adsorb to crystal faces of a biomineral to control the growth and morphology of hardtissue are only one example. Deducing the mechanisms of surface recognition exercised by proteins hasimplications to osteogenesis, pathological calcification and other proteins functions at their adsorbed state.Statherin is an enamel pellicle protein that inhibits hydroxyapatite nucleation and growth, lubricates theenamel surface, and is recognized by oral bacteria in periodontal diseases. Here, we highlight some ofthe insights we obtained recently using both thermodynamic and solid state NMR measurements to theadsorption process of statherin to hydroxyapatite. We combine macroscopic energy characterization withmicroscopic structural findings to present our views of protein adsorption mechanisms and the structuralchanges accompanying it and discuss the implications of these studies to understanding the functions ofthe protein adsorbed to the enamel surfaces. Copyright 2007 John Wiley & Sons, Ltd.
KEYWORDS: solid-state NMR; protein; structure; adsorption; recoupling; magic angle spinning; calorimetry
INTRODUCTION TO BIOMINERALIZATIONAND BACTERIAL ADHESION TOMINERALIZED TISSUE
Elaborate mechanisms are used by living organisms to formorganic–inorganic composites in hard tissues through theinteraction of proteins, and ultimately cells, with inorganicmineral phases. The enhanced mechanical properties of bio-composites such as bone and teeth thus result from the
ŁCorrespondence to: Gil Goobes and Gary P. Drobny, Departmentof Chemistry, University of Washington, Box 351700, Seattle WA98195, USA. E-mail: [email protected];[email protected]$Current address: Department of Chemistry, Bar Ilan University,Ramat Gan 52900, Israel.#Current address: Pacific Northwest National Laboratory,Richland, WA 99352, USA.†Current address: Department of Chemistry and Chemical Biology,Rensselaer Polytechnic Institute, Troy, NY 12180, USA.‡Current address: Department of Biochemistry and MolecularBiology, McKnight Brain Institute, University of Florida,Gainesville, FA 32610, USA.††Current address: Department of Molecular Genetics andBiotechnology, Hebrew University, Hadassah Medical School,Jerusalem 91120, Israel.
operation of proteins that regulate osteogenesis microscop-ically at the organic–inorganic interface. The underlyingmolecular mechanisms of biomineralization regulation are ofmajor importance to dentistry and medicine, as impairmentof biomineralization processes can lead to osteoporosis, den-tal calculus, arthritis, and pathological mineralization of theform observed in atherosclerotic plaque, artificial heart valvecalcification, and kidney stone.1 – 3 A better understanding ofthe biomolecular mechanisms used to promote or slow downcrystal growth could provide important design principles forthe development of mineralization promoters or blockers indentistry, orthopedics, urology, and cardiology. Similarly,insights into how these proteins recognize and assemblein bioactive form on inorganic mineral phases could alsoaid in the development of better surface coatings providingenhanced biocompatibility of implantable devices and forhard tissue engineering and regeneration technologies.
Understanding the function of any protein requires thatthe structure of the molecule be defined within its biologicalenvironment; in this case, the fold of a biomineralizationprotein in contact with the crystal surface of the mineral.In addition, the precise nature of the interactions betweenthe protein and the crystal which underlie the recognition
Copyright 2007 John Wiley & Sons, Ltd.

Structural and Thermodynamic Studies of Statherin Adsorption to Hydroxyapatite S33
process must be understood. This requires knowledge of thecontacts formed between amino acid side chains and ionsin the crystal faces and contributions of water molecules tothese interactions.
The biological context, in which the protein functions,includes not only the mineralized tissue surface but alsoother proteins, glycoproteins, cells, and pathogens that itinteracts with. For an oral cavity protein like statherin, thetooth enamel pellicle constituents as well as microbial cellsserve as its biological microenvironment. These microbialcells, which adhere to the surface of the tooth, colonizeand develop into films that are central to oral cavity diseasesfrom gingivitis to periodontitis. Their attachment is currentlyconceived to be through binding to statherin and otherproteins adsorbed to enamel and other oral cavity surfaces.Several works have shown that statherin and proline-richproteins (PRPs) adsorbed to hydroxyapatite (HAP) serveas receptors for adhesion of colonizing bacteria to enamelsurfaces. These salivary proteins are recognized by fimbriae,antennae systems in the microorganism cells, solely whenadsorbed to HAP and show no binding capabilities to the freeprotein. The binding sites in both statherin and fimbrillin, themonomeric unit of these antennae systems, were identifiedlater on.
Investigations of protein–mineral interactions are typi-cally carried out using techniques that characterize macro-scopic quantities of the protein’s adsorption to the mineralcrystals. Equilibrium properties such as protein–crystalbinding constants are derived from adsorption isotherm (AI)measurements, and kinetic parameters comparing the crys-tal growth rate in the presence and absence of the proteinadsorbed are obtained from constant composition kineticsmeasurements.4,5 In addition, binding enthalpies and affini-ties for proteins to mineral surfaces can be derived fromisothermal titration calorimetry (ITC) measurements, as wehave recently shown.6,7 When observations from the twotechniques are merged, remarkable insights can be obtainedabout the driving forces for adsorption and the differentmechanisms of binding to the surface. These techniques canhelp identify residues in the protein that are involved ininteraction with the mineral surface indirectly by mutagene-sis work;7 however, to probe the actual interaction interfacedirectly, one must utilize microscopic techniques.
High-resolution spectroscopic methods provide detailedinformation about the atomic level structure of the protein onthe crystal faces, under physical conditions that are biolog-ically relevant. Invaluable information about the secondarystructural motifs and tertiary folding that characterize theadsorbed protein, together with information on the interac-tion of protein side chains with atoms on the crystal face, maylead to an understanding of how particular proteins promoteor inhibit nucleation. Molecular level structure informationfor proteins that interact with crystals8 and proteins thatdirectly control calcification processes9 in hard tissue is veryscarce. Basic questions about how the proteins attach tothe crystal surfaces and whether acidic residues are directlyinvolved in binding to calcium phosphate surfaces remainlargely unanswered at the fundamental molecular level. In
order to develop a better structure–function level under-standing of the protein-crystal molecular recognition, wehave begun to utilize solid-state NMR techniques to deter-mine the structure of proteins and peptides on HAP surfacesand captured along the way interesting molecular dynamicsinformation for the proteins on the biomineral surface.
Solid-state NMR spectroscopy is the method of choice toinvestigate protein structure at biomaterial interfaces, despitethe complex nature of the protein surface problem. Structuraldetermination that includes defining the secondary andtertiary structures of the adsorbed protein and by implicationof any structural changes that occur upon binding to thesurface can be approached using this spectroscopic method.Concurrently, the chemical composition and structure atthe interface of the protein side chains and the crystalsurface can be deduced. Motional features of the adsorbedprotein that are observable under NMR time scale can alsobe detected. Measurements in these systems are carried outunder hydrated conditions in a buffer that partially simulatesion concentration in saliva and pellicle environments.
Principal information regarding adsorption characteris-tics of proteins on surfaces can be inferred from a combinedapproach that utilizes microscopic high-resolution measure-ments and macroscopic thermodynamic characterizationthat provide information about the binding mechanismsof protein molecules to the surface. For statherin adsorp-tion to HAP, we found that complementary insights fromsolid-state NMR measurements and from ITC and adsorp-tion isotherms provided further insights into the structure ofthe active protein, the underlying mechanisms of adsorptionand the relation between structures in the bound adsorbedstate, and the different functions that statherin carries in theoral cavity.
In this review, we highlight recent work that providesinsights into the structure–function relationships of theprotein in contact with the mineral crystal and with bacterialcells that employ it as a means of adhering to enamelsurfaces. This work also provides guidelines for studyingother protein–crystal systems in molecular detail.
BIOPHYSICAL METHODS FOR THE STUDY OFPROTEIN ADSORPTION THERMODYNAMICSONTO CRYSTALLINE MINERAL SURFACES
Protein adsorption mechanisms onto surfaces have beenexplored by calorimetry in the field of chromatography,studying adsorption of proteins to support materials and inthe field of biomaterial research, investigating the adsorp-tion of proteins onto surfaces of polymers and colloids.10 – 14
Thermodynamic characterization can provide mechanisticinsights into the basis of protein function. The free energyof adsorption is derived from equilibrium-binding isothermanalysis after adopting model assumptions. Independentmeasurement of the adsorption enthalpy through calorimet-ric techniques permits separable quantification of enthalpicand entropic contributions to the free energy change, thusproviding us with better comprehension of the mechanisticaspects of adsorption.6
Copyright 2007 John Wiley & Sons, Ltd. Magn. Reson. Chem. 2007; 45: S32–S47DOI: 10.1002/mrc

S34 G. Goobes et al.
Isothermal titration calorimetryIn order to adapt ITC to measurements of proteins adsorbedto surfaces, we revisited the basic equations that describe theheat exchange during titration of protein aliquots into a cellcontaining crystalline mineral with predetermined surfacearea in a recent publication.6 We have outlined the necessarymodifications to the ITC equations that describe the titrationcurve and the approach to normalizing the surface areaand expressed it in terms of the effective concentration ofsurface sites available for protein binding. In equilibrium,the adsorption constant, Kads, is given by
Kads D �
�1 � ��[C]�1�
where � is the fractional coverage and [C] is the concentrationof free protein. This concentration is related to the totalconcentration of the protein through
[C] D Ct � �M0t �2�
where the product �Mt0 describes the concentration of
adsorbed protein in equilibrium. The quantity Mt0 describes
the molar concentration of adsorption sites on the surfaceper unit volume in the ITC cell and in general is not readilyknown since a binding site for a particular protein moleculeis not easy to define. We proposed using the informationobtained from the independent AI measurements of statherinto HAP and Brunauer, Emmett, and Teller (BET) measure-ments of the mineral surface area in order to calculate Mt
0.This quantity is obtained by multiplying Nmax, the maximumnumber of sites accessible to the protein on the HAP surface,by the surface area (SA) of HAP and by the density of HAPin the suspension inserted into the ITC cell as follows:
Mt0 D Nmax
[moles
m2
]ð SA
[m2
gr
]ð D
[grL
]. �3�
This approach to calculating Mt0 relies on the BET
technique to define the total surface area and can belimited by accessibility differences of surface sites to proteinmolecules versus small molecules in gaseous phase actuallyused in the BET experiment. Rearranging the equilibriumconstant equation to the following form:
� D Kads[C]1 C Kads[C]
�4�
and plugging Eqns (2) and (3) into it, the fractional coverage� attains a quadratic form
�2 � �
[1 C Ct
Mt0 C 1
KadsMt0
]C Ct
Mt0 D 0 �5�
which can be solved in terms of the total concentration ofprotein Ct, the total concentration of adsorption sites Mt
0,and the adsorption equilibrium constant Kads.
The total measured heat content of the solution in theITC cell is then given by
Q D �M0tHV0 D Mt
0HV0
2
1 C Ct
Mt0 C 1
KadsMt0
�√(
1 C Ct
Mt0 C 1
KadsMt0
)2
� 4Ct
Mt0
�6�
where V0 is the working ITC cell volume and H is theenthalpy change during the adsorption reaction. The titrationcurve is obtained from the differential heat content betweeninjection i � 1 and i using the following expression:
Q�i� D Q�i�� Q�i � 1�C dVi
V0
[Q�i�C Q�i � 1�
2
]�7�
measured with addition of protein aliquots of volume dVi
injected into the cell containing the mineral suspension.In cases where only a fraction of the protein molecules,
which adsorb to HAP, display a heat of adsorption that ismeasurable with calorimetry, the quantity Mt
0 is replaced by˛Mt
0 where ˛ is the fraction of all sites in which adsorptionis accompanied by enthalpy change. The values of Kads, H,and ˛ are then derived by minimizing a calculated curvebased on Eqn (6) to experimental titration curve measuredin the calorimeter. If we assume that the sites A whereadsorption is accompanied by heat change and B sites whereadsorption is thermoneutral populate independently andeach with a simple Langmuirian mechanism, which impliesno interactions between the protein molecules that adsorb,and that the A site population nearly reaches saturationbefore significant population of the B sites occurs, then thefractional coverage of A is still well approximated by Eqn (5)with ˛M0
t in place of Mt0.
Equilibrium adsorption isothermIn the adsorption experiments, known amounts of statherinin phosphate buffer were equilibrated for 4 h with HAPsuspension at temperatures of 24 and of 37 °C. Afterincubation, the protein concentrations in the supernatantfollowing centrifugation of the suspension were determinedusing a Micro BCA protein assay reagent kit (Pierce),recording the absorbance at 562 nm on a safire2 TECANplate reader as described before.6 The difference between theinitial concentration and the measured one, i.e. the amountof adsorbed statherin, is normalized to the number of molesadsorbed per unit area by dividing it by surface area times thedensity of HAP in the suspension and plotted either versus[C] or log[C]. The AI curve can be fitted to various modelsof adsorption to extract adsorption parameters such as themaximal coverage and adsorption equilibrium constant.
NMR TECHNIQUES FOR THE STUDY OFPROTEIN STRUCTURE ON CRYSTALLINEMINERAL SURFACES
Solid-state NMR has been extensively used to investigatethe structures of silica and alumina surfaces15 – 17 and smallmolecules adsorbed to surfaces of catalysts.18 – 20 In addition,13C MAS NMR spectroscopy has been used to study theincorporation of carbonate ions in bone and syntheticapatites,21 and 31P NMR experiments have been used tocharacterize phosphate species in inorganic precipitates inbiological systems.22 – 24
Quantitative structural data can be obtained via ori-entational constraints and/or distance and torsion angleconstraints. Angular constraints, usually obtained from mag-netic interaction tensors located in the backbone of proteins
Copyright 2007 John Wiley & Sons, Ltd. Magn. Reson. Chem. 2007; 45: S32–S47DOI: 10.1002/mrc

Structural and Thermodynamic Studies of Statherin Adsorption to Hydroxyapatite S35
oriented in mono-domain lipid bilayers, have been usedto determine the orientation of helices in transmembraneproteins embedded in lipid bilayers.25 Distance and torsionangle constraints have been acquired for proteins in micro-crystalline form26 as well as in fibrils formed by ˇ-amyloidpeptides.27
The solid-state NMR techniques used to obtain structuraldata of proteins adsorbed onto biomaterial surfaces to datewere reviewed before;28,29 therefore, only a brief descriptionof each technique is provided here. Dipolar recoupling witha windowless sequence (DRAWS)30 experiments were usedto determine the torsion angles around the protein backboneand its secondary structure. Preparation of double-quantumcoherence using DRAWS dipolar recoupling (DQDRAWS)allows monitoring of the buildup of double quantum coher-ence as a function of the DRAWS mixing time to determinedipolar couplings and hence internuclear distances withoutinterference from background single-quantum signals. Asin the simple DRAWS experiment, the DQDRAWS filteringexperiment can quantify the carbonyl–carbonyl distance andhence the backbone torsion angle ϕ.
Rotational echo double resonance (REDOR)31 experi-ments were used to measure distances between the nuclearspins of different atoms on the protein and to elucidatesecondary and tertiary constraints on the structure of theadsorbed protein. REDOR was also employed to measuredistances between atoms on the protein side chains and onthe surface of the crystal. In a recent work, we showed thatthe application of the REDOR experiment to certain I2S spinsystems (where I and S are heteronuclear spins) can be usedfor complete characterization of the internuclear distancesin the spin triad. The reference measurement acquired typ-ically in every REDOR experiment is utilized to obtain thehomonuclear dipolar information in the I2 spin pair and thenormalized dephasing measurement to deduce the two IScouplings and distances. The details of this REDOR-SEDRAapproach were reviewed before.29 Here, we mention brieflythe principles of the technique and demonstrate its applica-tion in elucidating constraints on the structure of adsorbedstatherin using as little as two separate measurements.
Simple excitation for dephasing of rotational-echo ampli-tudes (SEDRA)32,33 was proposed for the measurement ofthe internuclear distance between two homonuclear spinsby recovery of the dipolar interaction under magic anglespinning using a train of 180° pulses applied in synchronywith the rotation period. Performing REDOR measurementsusing alternating 180° pulses on I2S spin triads with obser-vation of the I spins renders the reference experiment aneffective action describable by the SEDRA Hamiltonian. TheSEDRA pulse experiment is sensitive to the relative orien-tation of the chemical shift anisotropies (CSAs) of the twohomonuclear spins. In proteins, one can utilize this in orderto extract the backbone dihedral angles between consecutiveamino acid residues. In particular, the principle componentsof the carbonyl carbon CSA tensor have known directions inthe peptide bond molecular frame. Therefore, the orientationof two CSA tensors can serve as a sensitive probe of theRamachandran angles (ϕ, ) between the two atoms. The dis-tance between the carbonyl carbon atoms and the ϕ angle are
interdependent; so, the SEDRA dephasing basically dependssolely on the two torsion angles.
STATHERIN FUNCTION AT THE INTERFACEOF SALIVA AND TOOTH ENAMEL SURFACES
In this review, we summarize various studies that wecarried out on a salivary protein, statherin, involved inseveral functions in the oral cavity but mostly associatedwith the regulation of HAP crystal nucleation and growthin saliva. Tooth enamel structural integrity is maintainedthrough the supersaturation of saliva with respect to calciumand phosphate salts and through the lubricative action ofproteins in the pellicle coating the oral surfaces.34 – 38 Theviscoelastic properties of statherin, PRPs, and mucins in thesalivary pellicle reduce the mastication load on the toothsurfaces 20-fold.38,39 Statherin and PRPs inhibit formation ofmineral precipitates termed accretions on the tooth surface byinhibiting both spontaneous calcium phosphate precipitationand HAP secondary crystal growth.5,40 – 46 Statherin canachieve these properties by binding calcium ions in solutionand by adsorbing to HAP surfaces with a significant bindingaffinity and coverage.6,47,48 The N-terminus of statherincontains a pSpSEE (where pS is phosphorylated serine)acidic motif that is also found in larger calcium-bindingproteins such as osteopontin, as well as in biomineralizationproteins that regulate calcium carbonate crystallization inlower organisms.49 The effects of statherin on HAP crystalgrowth kinetics have been described before.5,50 Nancollas hasdemonstrated that derivative peptides from the N-terminusof statherin display comparable functional activities incontrolling HAP growth to the full length protein.4,51 Thiswork has stimulated investigations of the proximity anddynamics of side chains in an N-terminal fragment ofstatherin to the surface of HAP.52 – 54
The recognition and binding of statherin and PRPs bymicrobial organisms was later on linked with the onset ofperiodontal diseases, which are marked by the adherence andcolonization of various bacteria to supra- and subgingivalsurfaces.55 – 57 Statherin and the PRPs mediate the adhesionof bacterial species to the tooth surface.58 – 63 These organismspreferentially adhere to immobilized statherin on HAP sur-faces rather than to the free protein in solution,60,63 leading tothe hypothesis that surface adsorption exposes receptor sitesin statherin to bacterial fimbrillin binding. Recent studiesidentified the C-terminal residues 29–43 and residues 33–39in statherin as binding domains for Porphyromonas gingivalisand Fusobacterium nucleatum fimbriae respectively.61,63
DIFFERENTIAL MECHANISMS OF STATHERINADSORPTION TO HAP
The adsorption of statherin as well as other salivary proteinsonto HAP were previously studied by equilibrium-bindingisotherm measurements.4,5,47,48,64 The work reviewed herehighlights our recent studies6 on the enthalpic and entropiccontributions to the free energy of the adsorption and the heatcapacity change involved in the adsorption process derivedfrom measurements performed at different temperatures.ITC and equilibrium AI analysis were used to determine
Copyright 2007 John Wiley & Sons, Ltd. Magn. Reson. Chem. 2007; 45: S32–S47DOI: 10.1002/mrc

S36 G. Goobes et al.
thermodynamic parameters of statherin adsorption ontoHAP crystals. The results are evident of two types of bindingmechanisms having distinguishable enthalpy and entropythat we have used to generate a two-site model on thesurface of HAP, providing a new insight into the mechanismof the statherin function on biological surfaces.
Isothermal titration calorimetry (ITC)The ITC experiment was carried out by repetitive injections offixed volume of the protein (0.16 mM) into the calorimeter cellcontaining a sample of HAP crystals (2 mg/ml). Figure 1(a)shows the ITC measurement of adsorption at 25 °C, wherethe top graph depicts the heat signal change in the cell withtime for statherin adsorption and the bottom graph showsthe titration curve generated by time integration of the heatsignal through the injections and plotted as a function of theratio between total injected statherin concentration, Ct, andthe maximal concentration of statherin sites on HAP, Mt
0. Thethermodynamic parameters of binding were derived fromfitting the ITC curve after calculation of Mt
0 using informationfrom separate measurements as outlined in the Section on
‘Biophysical Methods for the Study of Protein AdsorptionThermodynamics onto Crystalline Mineral Surfaces’. Theinflection point in the titration appears at a ratio of 0.23between Ct and Mt
0, although unity is expected, providedthe AI measurement probes the same adsorption process asthe ITC measurement. Moreover, at the end of the titration,one would expect the excess of protein that is added tothe cell to be detectable as free protein. Yet, extensionof the titration with 12 additional injections resulted inno change to the measured heat, and when the ITC cellcontent was taken out and the concentration of free proteindetermined, less than 10% of the total protein added wasleft in solution. On the basis of these observations and usingadditional experiments designed to confirm that there areno time scale differences in the mixing of protein withmineral in the two experiments and that the adsorptionis a reversible process, we could distinguish two processesinvolved in the adsorption of statherin to HAP. An initialexothermic binding with an apparent heat of adsorption ofabout 3 kcal/mol followed by a thermoneutral one where theenthalpy of adsorption drops to around zero after injecting
-0.1 0.0 0.1 0.2 0.3 0.4 0.5 0.6
-3
-2
-1
0
1-0.5
-0.4
-0.3
-0.2
-0.1
0.0
0.10 10 20 30 40 50
Time (min)
The
rmal
pow
er(µ
cal /
sec
)
Molar Ratio, Ct / Mt'
Hea
t rel
ease
per
inje
ctio
n(k
cal /
mol
e)
0.0 0.1 0.2 0.3 0.4 0.5 0.6-5
-4
-3
-2
-1
0
Molar Ratio, Ct / Mt'
Hea
t rel
ease
per
inje
ctio
n(k
cal /
mol
e)
(a) (b)
Figure 1. (a) ITC profile of the titration of HAP (2 mg/ml) with statherin (0.16 mM) performed at 25 °C in PB.6 (b) Titration curvescorrected for heat of dilution obtained for the titration of HAP (2 mg/ml) with statherin (0.16 mM) and depicted as a function of themolar ratio between the total injected statherin concentration, Ct, and the molar concentration of HAP adsorption sites, M0
t,performed at 15 °C (�), 20 °C (�), 25 °C (ž), 30 °C (°), and 37 °C (�) in PB. Data points were fit as described in the materials andmethods.
Table 1. The apparent thermodynamic parameters for statherin adsorption onto HAP,obtained from ITC measurements at different temperatures
Temp(°C) ˛
H(kcal/mole)
TS0
(kcal/mole)G0
(kcal/mole)K
(1/M)
15 0.21 �5.4 š 0.4 2.1 š 0.3 �7.4 š 0.1 �4.3 š 0.8�ð 105
20 0.18 �4.0 š 0.4 4.1 š 0.2 �8.1 š 0.2 �1.1 š 0.4�ð 106
25 0.21 �2.7 š 0.1 6.8 š 0.2 �9.5 š 0.4 �9.5 š 5.8�ð 106
30 0.13 �1.8 š 0.2 8.0 š 0.2 �9.8 š 0.3 �1.2 š 0.6�ð 107
37 0.11 �1.6 š 0.4 8.5 š 0.3 �10.1 š 0.5 �1.4 š 1.0�ð 107
Copyright 2007 John Wiley & Sons, Ltd. Magn. Reson. Chem. 2007; 45: S32–S47DOI: 10.1002/mrc

Structural and Thermodynamic Studies of Statherin Adsorption to Hydroxyapatite S37
only enough statherin to occupy about 30% of the sites onthe HAP.
Titration curves for statherin adsorption onto HAPmeasured at a range of temperatures between 15 and37 °C are shown in Fig. 1(b). The equilibrium associationconstant, K, the apparent adsorption enthalpy change,Happ, and the fraction of adsorption sites that have thisenthalpy of adsorption, ˛, were derived from minimizationof a theoretical curve (Eqn (6)) against the calorimetrydata.6 The apparent standard Gibbs free energy change(G0
app) and the standard entropy change (S0app) derived
from these experiments are summarized in Table 1. Theapparent enthalpy of adsorption increases from �5.4 to�1.6 kcal/mol (decreasing in absolute value), while theentropy of adsorption increases nearly fourfold between15 and 37 °C. The Gibbs free energy change and the fractionof sites that are occupied through an exothermic adsorptionvary to a lesser extent as the temperature is increased.
Equilibrium adsorption isotherm measurementsThe equilibrium AI for statherin onto HAP at 24 °C isshown in Fig. 2 as the moles of adsorbed protein per unit ofsurface area, N, versus log of the free statherin equilibriumconcentration [C]. The points in the AI measurement arecollected in different experiments with variable[C], allowingthe adsorption complex to equilibrate for 4 h.
A simple model based on independence of the adsorbingmolecules gives rise to the Langmuir equation
N D KNmax[C]1 C K[C]
. �8�
It is identical to Eqns (1) and (4), describing the ITCexperiment with the fractional coverage described as
0.0E+00
1.0E-07
2.0E-07
3.0E-07
4.0E-07
5.0E-07
6.0E-07
7.0E-07
-7.8 -7.3 -6.8 -6.3 -5.8 -5.3 -4.8
Log C
N (
mol
e / m
2 )
Figure 2. Adsorption isotherm data for the binding of statherinonto HAP (2 mg/ml at 1.42 ml) at 24 °C plotted versus the logof the equilibrium concentration.6 The dotted line is the best fitto the Langmuir model. The solid bold line is the best fit to thebimodal model, where 21% of the protein molecules bindaccording to a Langmuir model and 79% according to anattractive model, as given in Eqns (10–12). The dashed line isthat same fit to bimodal model but with applying ˛ and KA
values obtained from the ITC measurements (Table 2, ITCbimodal fit). The solid thin line represents generated adsorptionisotherm to A sites, applying ˛ and KA values from ITC at 25 °C(Table 1).
� D N/Nmax. The data in Fig. 2 are reasonably well fit bythis simple first-order Langmuir AI, as shown by the dottedline, with best-fit values of K D 5.0 �š1.0�ð 105 M�1 andNmax D 6.7 �š0.3�ð 10�7 mol m�2. These values are withinthe same order of magnitude as those previously reported,5
with minor differences that may be attributed to variations insolution conditions. The asymptotic value of Nmax indicatessaturation of the surface of HAP by the first layer of pro-tein molecules. Addition of more molecules did not result inchange to the isotherm curve and therefore we consider thepossibility of multilayer adsorption unlikely.
The Mt0 value (calculated using this Nmax value in Eqn (3))
is much larger than the concentration of sites that have ameasurable heat of adsorption according to the ITC data,as reflected in the low values for ˛ (0.11–0.21) in Table 1.That is, the calorimetric results do not coincide with thebinding isotherm data in that the latter gives a much highersaturation coverage when both are independently analyzedassuming a first-order Langmuir AI. Also, the ITC data givean equilibrium constant that is more than tenfold largerthan the isotherm data. A very similar equilibrium AI wasalso measured at 37 °C (data not shown).6 The saturationcoverage and equilibrium constant are almost independentof temperature.
The calorimetric results were combined with the equilib-rium AI data to estimate the enthalpy associated with adsorp-tion versus fractional coverage of surface sites, N/Nmax,, at25 and 37 °C. The results are shown in Fig. 3. The y-axisconversion from moles injected to moles adsorbed was madeusing the equilibrium AI (Fig. 2), with the assumption thatequilibrium was reached after each calorimetry injection.From the figure, it is clearly seen that at low coverage theadsorption is driven by an exothermic enthalpy, but that theheat of adsorption drops to near zero by ¾40% of saturationat 25 °C and only ¾20% of saturation at 37 °C.
We interpret these results and those in Table 1 asindicating that there are two types of sites on the HAP: A-type sites with a measurable heat of adsorption and a largerequilibrium constant which populate first but which only
-1.0
-0.5
0.0
0.5
1.0
1.5
2.0
2.5
3.0
3.5
0.0 0.1 0.2 0.3 0.4 0.5
25°C37°C
N / Nmax
-∆H
(K
cal /
mo
le)
Figure 3. Plot of heat of adsorption (�H per mole ofadsorbed protein) versus coverage at 25 °C (ž) and 37 °C (�).The data was fit using Eqns (12–13) and applying the ˛ and KA
values from the ITC for A sites (Table 1) and the rest of theparameters from the bimodal fit to the isotherm data6 (Table 2,ITC bimodal fit).
Copyright 2007 John Wiley & Sons, Ltd. Magn. Reson. Chem. 2007; 45: S32–S47DOI: 10.1002/mrc
S38 G. Goobes et al.
account for ¾16�š5�% of the total sites; and B-type sites withno measurable heat of adsorption and a far weaker bindingconstant. Such a two-state model is not surprising, since itis well known that protein adsorption onto surfaces is nota simple one-step process.14,65 – 67 Note that the B sites eitherhave a heat of adsorption that is really negligible or, sincethe calorimeter is insensitive to heat that is deposited tooslowly, they may also have a substantial heat of adsorptionbut simply populate too slowly to give measurable heat.
From Table 1, it is clear that entropy makes the dominantcontribution to the free energy of adsorption even atlow coverage where adsorption is exothermic. Adsorptionbeyond ¾30% of saturation appears to be entirely due tothe increase in entropy, unless any heat of adsorption isdelivered too slowly to measure. We also fit the bindingisotherm data of Fig. 2 with a simple model involving twofirst-order Langmuir-type adsorption sites, each populatedindependently and with different equilibrium constants. Inthis case, the overall coverage is expressed as the sum of thetwo processes and Eqn 4 becomes
�total D ˛ Ð �A C �1 � ˛� Ð �B D ˛KA[C]
1 C KA[C]
C �1 � ˛�KB[C]
1 C KB[C]�9�
where ˛ is the fraction of sites that are A type.Fitting the binding isotherm data in Fig. 2 to this model
gave similar values for KA and KB with no noticeably betterquality fit than a single-site model. However, the datacould be fit better by such a model if we assumed thatthe equilibrium constant for the B sites, KB, increases withincreasing coverage of B sites. In this case, KB must be treatedas a function of � and therefore becomes K0
B:
K0B D KB C ˇ� D �B
�1 � �B�[C]C ˇ�B �10�
where ˇ is a correction term to the equilibrium constant thataccounts for attractive interactions between the assembledmolecules and is proportional to �. To express the coveragedependence on [C] in the process of adsorption to site B,Eqn (9) can be rearranged as follows:
�B D 12ˇ[C]
[ˇ[C] � K0
B[C] � 1
š√�1 C K0
B[C] � ˇ[C]�2 C 4K0Bˇ[C]2
]�11�
We then simply substitute the expression for �B in Eqn (8)with the one in Eqn (10). Figure 2 shows that such a modelfits the isotherm very well (solid bold line).
The KA value determined by AI is tenfold smaller than theequilibrium constants determined from ITC fitting at similartemperatures (Table 1). This is probably because of the verylow population of the A-type sites that have a measurableheat of adsorption (¾16% of the total), coupled with the factthat the adsorption isotherms have no data points belowthis coverage. This renders their fits very insensitive to theparameters that define the A-type sites. For example, if themuch more populous B sites have some heterogeneity, it islikely that the two different types of sites that result fromfitting the isotherm data correspond to subpopulations of Bsites, missing the contribution from A sites almost entirely.
For the purpose of comparison between the equilibrium-binding isotherm and the ITC experiment, we have generateda putative binding isotherm of process A by applying KA
and ˛ values that were obtained from the ITC measurement.Figure 2 depicts the measured binding isotherm (solid datapoints) and the simulation for process A alone (solid thinline) using the parameters determined for it by fitting theITC data at the closest temperature (25 °C), listed in Table 1.It is notable that process A reaches saturation rapidly andits contribution to the binding isotherm is at the early stagesof the adsorption where the equilibrium concentrations arelow. Owing to lack of sensitivity of the BCA assay at thoselow protein concentrations, we could not conduct a bindingisotherm mimicking the ITC experiment.
Figure 2 also displays a fit of the binding isotherm datausing another bimodal model in which both the KA and˛ values were assumed to be those determined from thebest-fit to the ITC measurements in Table 1 (dashed line).The other three parameters were determined to give thebest fit to the data, and are listed in Table 2. We call thisthe ‘ITC bimodal model’. Given the data statistics, there isno significant difference in the quality of this fit and thatof the bimodal fit given above that had more adjustableparameters. Both give good fits to the data. They differstrongly only below 15% of saturation, where there are nodata. This new fit represents the best bimodal model thatis most consistent with all of the data (i.e., both the ITCdata and AI). The binding isotherm at 37 °C was similarlyanalyzed and the recovered parameters are given in Table 2.
To isolate the coverage change in process A relative tothe total coverage in Eqn (10), one can write the differential
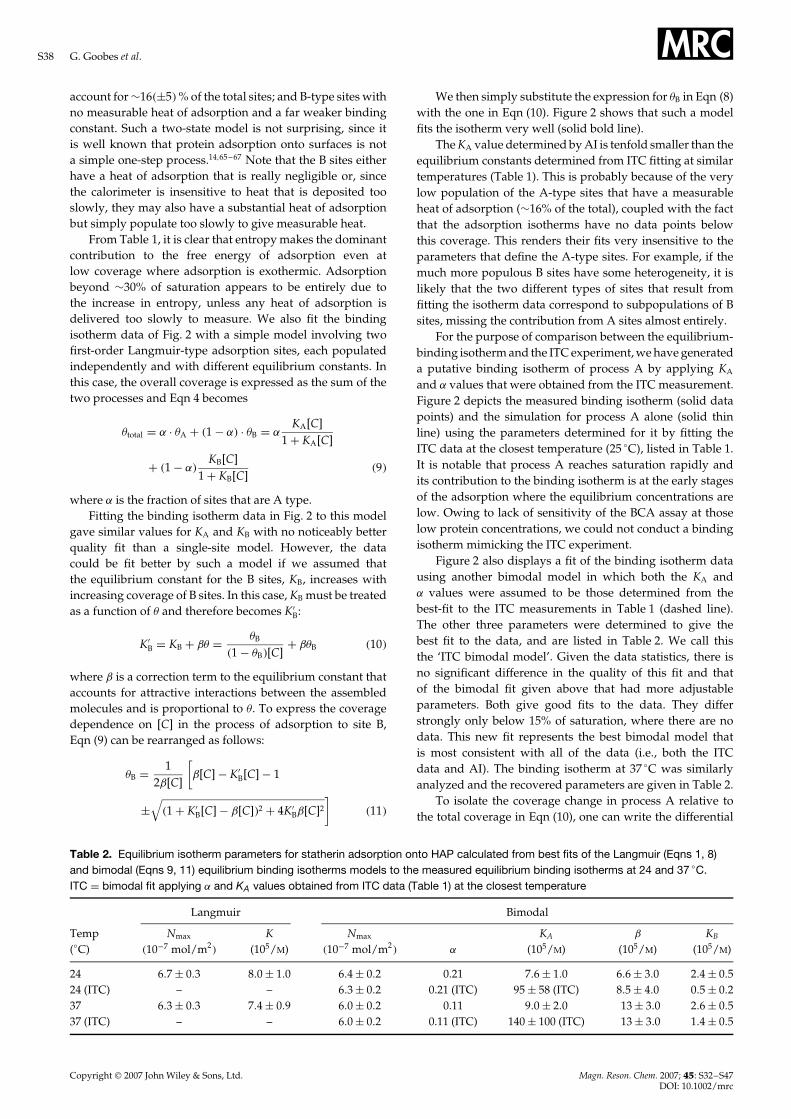
Table 2. Equilibrium isotherm parameters for statherin adsorption onto HAP calculated from best fits of the Langmuir (Eqns 1, 8)and bimodal (Eqns 9, 11) equilibrium binding isotherms models to the measured equilibrium binding isotherms at 24 and 37 °C.ITC D bimodal fit applying ˛ and KA values obtained from ITC data (Table 1) at the closest temperature
Langmuir Bimodal
Temp(°C)
Nmax
�10�7 mol/m2�
K(105/M)
Nmax
�10�7 mol/m2� ˛
KA
(105/M)ˇ
(105/M)KB
(105/M)
24 6.7 š 0.3 8.0 š 1.0 6.4 š 0.2 0.21 7.6 š 1.0 6.6 š 3.0 2.4 š 0.524 (ITC) – – 6.3 š 0.2 0.21 (ITC) 95 š 58 (ITC) 8.5 š 4.0 0.5 š 0.237 6.3 š 0.3 7.4 š 0.9 6.0 š 0.2 0.11 9.0 š 2.0 13 š 3.0 2.6 š 0.537 (ITC) – – 6.0 š 0.2 0.11 (ITC) 140 š 100 (ITC) 13 š 3.0 1.4 š 0.5
Copyright 2007 John Wiley & Sons, Ltd. Magn. Reson. Chem. 2007; 45: S32–S47DOI: 10.1002/mrc

Structural and Thermodynamic Studies of Statherin Adsorption to Hydroxyapatite S39
change in process A versus the total coverage:
d
NA
/Nmax
N/
Nmax
D ˛ Ð
(d�A
d�total
)�12�
This is advantageous when we would like to followexclusive contributions due to process A that involves anenthalpy change, while process B involves no change inheat. This function is utilized to extract the actual bindingenthalpy change due to the association,Hassoc, of process Afrom measurement of apparent enthalpy changeHapp withcoverage as follows:
Happ�N/
Nmax� D Hassoc Ðd�NA
/Nmax�
d�N/
Nmax��13�
The experimental data in Fig. 3 was fit with the aboveequation, applying the KA value from the ITC for A sites(Table 1) and the rest of the parameters from the ITC bimodalmodel to the isotherm data. The resulting value of Hassoc
from this fitting is �3.3 and �2.1 kcal/mol for 25 and 37 °Crespectively. These values are slightly higher than the ITCHapp values (Table 1). This is because a few B-type sitesare also being populated during the ITC injections, so thatthe A-type sites only correspond to about 80% of the totaladsorption during ITC in this model (Fig. 2). To give thesame amount of heat, the adsorption heat per mole of A-typeadsorbate must then be scaled up by 25%.
The effect of temperature on the adsorptionenthalpyThe change in the reaction enthalpy with temperaturedefines the reaction’s heat capacity change, Cp. Its valuefor statherin adsorption on A sites of HAP was calculatedby plotting the adsorption enthalpies measured by ITC atdifferent temperatures (data not shown).6 The positive Cpobserved for statherin adsorption to HAP are discussedin Section ‘Views of Statherin Structure and AssemblyMechanisms on HAP Surfaces’.
STRUCTURAL NMR MEASUREMENTS OF FREEAND HAP-BOUND STATHERIN
Simulations of the N-terminus secondary structure basedon its amino acid sequence predicted the existence of
an ˛-helix in this region. Circular dichroism and NMRmeasurements68,69 found that in water statherin is struc-turally disordered while under less polar conditions, in 50%trifluoroethanol (TFE)/water mixture, statherin assumesan ˛-helical structure at the N-terminal region (residues1–16), a polyproline type II (PII) helix in the intermediateregion (residues 19–35), and a 310 helix in the C-terminalregion (residues 36–43).68 We have carried out 2D nuclearOverhauser enhancement spectroscopy (NOESY) and TotalCorrelation Spectroscopy (TOCSY) experiments of statherinin phosphate buffer solution and in phosphate buffer solu-tion with 4 mM of calcium chloride added at temperaturesof 285 and 278 K. All 2D spectra of statherin (data notshown) exhibit limited cross peaks at the amide–amideregion, demonstrating no substantial structuring of dissolvedstatherin in phosphate buffer with and without the additionof calcium ions.
Statherin samples are prepared for solid-state NMR mea-surements by adsorbing quantities of protein that are lowerthan the saturation coverage to minimize interference fromintermolecular interactions in the structural measurements.The accumulated measurements are successful in providingus with a solid basis for construction of the three-dimensionalmodel of statherin’s structure at its adsorbed state. Initialinvestigation of full length surface-bound statherin providedus with secondary structure information of the protein’sN-terminus.70 Recent work achieved both secondary struc-ture data in the C-terminal bacterial binding domainand tertiary structural constraints on the surface-boundprotein.71
Backbone structure of the N-terminalHAP-binding domainTo probe the molecular backbone structure of statherin onHAP under buffered, hydrated conditions, isotopic labelswere selectively incorporated at the pS2, pS3, F7, L8, I11, andG12 backbone carbonyl carbons or nitrogens in five differentsamples of statherin. Details of all DQDRAWS and REDORmeasurements on the N-terminus of statherin were reportedelsewhere.70 Here, we show, for example, the backbone ϕangle determination with the DQDRAWS techniques at thepS2pS3 positions. In Fig. 4(a), the buildup of DQ coherence
0.0
0.2
0.4
0.6
0.8
1.0
0 5 10 15 20 25
mixing time (ms)
norm
aliz
ed in
tens
ity
S/S
0
0 2 4 6 8 100.0
0.2
0.4
0.6
0.8
1.0
mixing time (ms)
(a) (b)
Figure 4. (a) DQDRAWS buildup curves for hydrated, surface-adsorbed pS2pS3 statherin (♦), lyophilized, bound pS2pS3 Statherin(◊), and simulations for � torsion angles of �60° ( ), �85° ( . . . . .), and a combination of 35% ˛-helix (�57°) and 65% ˇ-sheet(�120°) (- - - - ). The increase in torsion angle on lyophilization correlates well with the loss of ˛-helical secondary structure.(b) REDOR dephasing curves for hydrated, surface-adsorbed pS3F7 Statherin(♦) and simulations for a carbon–nitrogen distance of4.2 A ( ). The pS3F7 distance across the hydrogen bond fits best to a distance of 4.2 A, indicating that the region is welldescribed by an ideal ˛-helix.70.
Copyright 2007 John Wiley & Sons, Ltd. Magn. Reson. Chem. 2007; 45: S32–S47DOI: 10.1002/mrc

S40 G. Goobes et al.
is plotted for statherin adsorbed onto HAP crystals and fullyhydrated (solid blue diamonds) and for lyophilized samples(empty red diamonds). The solid line drawn through thehydrated protein data is the DQDRAWS simulation for an˛-helical secondary structure. 13C–15N REDOR was usedto measure the (i) to (i C 4) distances in pS3F7 and L8G12labeled protein samples. As an example measurement, weshow the carbonyl-amide REDOR measurement in the pS3F7labeled protein (Fig. 4(b)). The composite results defined thisN-terminal, 12 amino acid–long HAP-binding domain as˛-helical on HAP surface. The strongly acidic N-6 regiondisplays a nearly ideal ˛-helical distance of 4.2 A across thepS3F7 hydrogen bond, while the helix across the L8G12hydrogen-bonding position has a longer pitch at 4.8 A.70
The ˛-helix has been previously suggested as a generalstructural mechanism for aligning acidic side chain residueswith HAP, either through lattice matching or throughmore general electrostatic complementarity.9 Our data areconsistent with this hypothesis and further point to thepossible importance of bridging water in protein–HAPrecognition.
The dynamic properties of the immobilized protein area critical aspect of molecular recognition at the proteinbiomineral interface, and related to the function of proteinsonce adsorbed. Measurements of the dynamic propertiesof statherin in the presence and absence of water providevaluable evidence that a binding footprint is centeredon the acidic residues in the N-terminal pentapeptideregion. The 13C rotating frame relaxation, T1�, valuesremain largely unchanged for the phosphoserines, indicatinglittle or no motion is present in either the lyophilizedor hydrated states. However, the T1� relaxation constantsare considerably shorter in the hydrated samples at theF7, L8, I11, and G12 positions, indicating motion on thekilohertz time scale when water is present. Figure 4(a) showschanges to the DQ buildup curve in the pS2–pS3 doublycarbon-labeled statherin sample under hydrated conditionsversus lyophilized conditions and normalized to the naturalabundance methyl region to account for any differences inthe amounts of bound protein.
Secondary structure of the C-terminal bacterialbinding domainPlacement of isotopic labels for REDOR and DQDRAWSNMR studies of the 15 N-terminal amino acids was guidedby solution NMR studies and circular dichroism data,which indicated that the HAP-recognition region was verylikely structured as an ˛ helix. In the case of the C-terminal domain, little prior knowledge of local secondarystructure existed to guide placement of isotopic labels. Wetherefore implemented structural modeling as a guidelinefor placement of isotopic labels at locations with highprobabilities for significant measurements of secondarystructural elements and tertiary folding constraints.
Since no structural homologues were available for thesequence of human statherin, the ab initio protocol of thestructure modeling program ROSETTA72 was used to gener-ate structural models of the protein. Nearly all 1000 modelsin the starting set predicted that the protein’s N-terminus(residues 3–15) is ˛-helical, as previously demonstrated
residue number
100%
20%
16 24 32 4080%
40%
60%
80%
extendedhelicalloop
Figure 5. Modeling statherin structure using the ROSETTA abinitio algorithm.71 The following histogram shows thepercentage of the three basic secondary motifs along thebackbone in the predicted 31-model cluster. Thisrepresentation of the prediction data with other informationthat emphasizes the common features between the modelswere used to select sites on the protein for incorporation ofisotope-enriched nuclei and solid-state NMR experimentalinvestigations.
experimentally. The models were then divided into subsetsbased on their structural similarity with the largest clusterconsisting of 31 models. The histogram showing the per-centage of an extended, helix, or loop backbone secondarystructure for this subset is depicted in Fig. 5. In this repre-sentation of the secondary motif distribution, an ˛-helicalsegment at the C-terminus of the protein (residues 32–40) ispredicted. The intermediate segment has a higher structuraldispersion that can be identified at residues G19 and P31.Selection of an isotope labeling scheme for the protein samplewas derived from analysis of the torsion angles and distancesbetween pairs of atoms across the models and using onlypositions that are conserved in the protein between differentspecies. Histograms of these structural parameters for theselected label positions are given in Fig. 6. Two consecutivecarbonyl atoms on residues 33 and 34 were 13C labeled andan amide on tyrosine 38 was 15N labeled to extract the sec-ondary structure in this region. Replacement of hydrogenwith a fluorine atom on the 40 position of proline 23 wasemployed for long-range carbon–fluorine distance measure-ments between carbonyl carbon labels in the C-terminus andthe sidechain of a proline near the protein center. The follow-ing labels, DpSpSEEKFLRRIGRFGYGY[2-13C]G19PYQ[4′-19F]P23VPEQPLYPQ[1-13C]P33[1-13C]Y34QPQ[15N]Y38QQYTF were therefore incorporated in the synthesis ofstatherin.
Using this labeling scheme, 13C–15N REDOR measure-ments provided us with the (ϕ, ) angles, the carbon–carbon(CC) distance, and the carbon–nitrogeon (CN) distances.Additional information relating the CN dipolar vector tothe CSA principal axis system enabled the geometry of the13C–13C–15N spin triad to be fully characterized. The ref-erence experiment (S0) usually carried out as part of theREDOR measurement is analogous to a SEDRA experimentand therefore induced recoupling of the carbonyl carbon
Copyright 2007 John Wiley & Sons, Ltd. Magn. Reson. Chem. 2007; 45: S32–S47DOI: 10.1002/mrc

Structural and Thermodynamic Studies of Statherin Adsorption to Hydroxyapatite S41
P33-Y34 φ angle
0
2
4
6
8
10
-116 -109 -101 -93 -86 -78 -70 -63 -55 -47
P33-Y34 ψ angle
0
4
8
12
16
20
-39 -20 -2 16 34 52 70 88 107 125
C-N distance P33-Y38 (Å)
0
2
4
6
8
10
5.4 5.8 6.1 6.4 6.7 7.0 7.4 7.7 8.0 8.3
C-N distance Y34-Y38 (Å)
0
2
4
6
8
10
12
3.7 3.9 4.1 4.3 4.5 4.8 5.0 5.2 5.4 5.6
P33-P23 C-F distance (Å)
0
2
4
6
8
10
6.2 7.3 8.5 9.6 10.8 11.9 13.1 14.2 15.4 16.5
Y34-P23 C-F distance (Å)
0
2
4
6
8
3.5 4.7 5.9 7.1 8.3 9.5 10.7 11.9 13.1 14.3
(a)
(f)(d)(b)
(e)(c)
Figure 6. Histograms showing distribution of torsion angles and distances between labels across the 31-model cluster.71 (a) angleand (b) angle values for the backbone torsion angles between the two carbonyl labels [1-13C]P33 and [1-13C]Y34.Nitrogen–carbon distances between the (c) [15N]Y38 label and the [1-13C]P33 label and between the (d) [15N]Y38 label and the[1-13C]Y34 label. Fluorine–carbon distances between the (e) [40-19F]P23 label and the [1-13C]P33 label and between the(f) [40-19F]P23 label and the [1-13C]Y34 label.
dipolar couplings due to a nonzero difference CSA tensor(Fig. 7(a)). Analysis of the carbonyl carbon signal dephasingcurve obtained in the S0 experiment in terms of the torsionangles between the two labels gave rise to a pair of angleswithout ambiguity. The resulting angles are consistent with acompact ˛-helical conformation of the backbone at this posi-tion (Fig. 8(a)). The 13C–15N REDOR curve (Fig. 7(b)) gaverise to a [1-13C]Y34-[15N]Y38 distance of 4.0 A (Fig. 8(b))that is indicative of a hydrogen bond stabilizing the ˛-helical structure deduced from the S0 experiment. Followingextraction of the [1-13C]P33-[15N]Y38 distance (Fig. 8(c)), theangle between the [1-13C]Y34-[15N]Y38 and the [1-13C]P33-[13C]Y34 vectors was determined to be 95�š5�°, implyingthat the hydrogen bond is nearly parallel to the helix axis.In case of a compact backbone conformation in particular,this typical C�i � 1�� C�i�� N�i C 4� labeling scheme can beinformative and extends the information derived due to atriangulation effect. In special cases, where the carbonyl CSAorientation in the peptide molecular axis is not known, themeasurement is complicated by added unknown parameters.It is noted that, whenever an extended conformation of thebackbone exists, a 13C–13C–15N spin triad is not expected tobe fully determined. Owing to the low sensitivity of REDORNMR to 13C–15N distances larger than 7 A, a negative result,i.e. no REDOR dephasing, would be expected, which wouldexclude the presence of a compact conformation in favor ofan extended one.
Tertiary constraints on statherin foldThe [40-19F] label inserted on residue P23 provided us withanother triangulation using long range 13C–19F REDORmeasurements of the 13C–13C–19F spin triad. The completecharacterization of the spin interactions in the 13C–13C spinpair was utilized to extract from the REDOR dephasingexperiment both, the two carbon–fluorine (CF) distances
and their vector orientation, relative to the carbonyl carbonsCSA principal axis system. The 13C–19F REDOR curve(Fig. 7(c)) demonstrates that the C-terminus labels are inproximity to the fluorine label, constraining the distancesof these labels from the [40-19F]P23 label to 8.8 and 10.3 A(Fig. 8(d) and (e)). The two labeled carbonyl carbons areunresolved in the 13C NMR spectra, and thus the assignmentof the closer carbon atom cannot be made. The detectablecarbon–fluorine distances demonstrate that the C-terminus˛-helical domain is folded back onto the center domain ofthe protein containing residue P23.
Proximity of protein sidechains to crystal surfacesThe strength of interaction between statherin and the HAPsurfaces relies on bonds created between side chains onthe protein and exposed groups on the surfaces to whichthat protein adsorbs. Distance measurements between sidechains on the SN15 derivative and NMR active 31P atomson the HAP surface were used to learn about the proximityof particular residues to the surface. Nitrogen–phosphorous(NP) REDOR measurements were carried out on a 15Nε(K6)-labeled SN15 sample.52,53 Analysis of REDOR measurementin the case where an atom on the protein might becoupled to several phosphate groups on the surface wasdetailed in two publications.53,73 Analysis of the REDORdata yields at least two possible geometries of the 15N spinto multiple 31P spins in the HAP surface. The relativelyshort distances to the phosphorous atom imply possiblehydrogen bonds created upon adsorption. A �2 analysis ofthe data given before53 is shown in Fig. 9(a). It assumes anitrogen–phosphorous–phosphorous (NPP) system with a31P–31P effective dipolar coupling of 600 Hz, and shows awell-defined minimum for 15N–31P distances of 3.8 and 4.8 Afrom the 31P spins (Fig. 9(a), filled circles). In addition, to thesimplified three spin model, we have simulated a 15N spin
Copyright 2007 John Wiley & Sons, Ltd. Magn. Reson. Chem. 2007; 45: S32–S47DOI: 10.1002/mrc

S42 G. Goobes et al.
-0.2
0.0
0.2
0.4
0.6
0.8
1.0
1.2
0 5 10 15 20 25 30 35
(a)S
0
0.0
0.2
0.4
0.6
0.8
1.0
1.2
0 10 20 30 40
S/S
0S
/S0
(b)
(c)
0.0
0.2
0.4
0.6
0.8
1.0
1.2
0 5 10 15
time (ms)
Figure 7. 13C NMR decay curves showing the carbon signalintensity as a function of the length of time for which theSEDRA and REDOR pulses are applied.71 (a) 13C signal decayin the REDOR reference experiment (S0) showing SEDRA-typedephasing behavior due to recoupling of the 13C–13C dipolarinteraction. The solid line is the best fit simulation of this decaycurve, varying the backbone dihedral angles (,) exclusively.(b) 13C–15N and (c) 13C–19F REDOR NMR decay curvesshowing the carbon signal intensity as a function of the lengthof REDOR mixing time normalized to the respective S0
experiment. Solid lines indicate the best fits to these decaycurves based on �2 analysis of simulations, varying the threefree parameters that these calculations depend on, asdescribed in Fig. 8. Data for the 13C–15N and 13C–19F REDORdata were measured at different fields. Here only the S0 for the13C–19F REDOR experiment is conveniently shown. The S0
data for the 13C–15N REDOR measurement was publishedelsewhere (See Fig. 7 in the support information of Ref. 71). Itshows an extended decay time and was similarly fit to thebackbone torsion angles in consistency with the data shownhere.
from the lysine side chain approaching two spins on the (004)crystal plane of HAP, as shown in Fig. 9(b). These spins areconnected to six other spins at distances shown in Table 3
in Ref. 48. We obtained a fit similar to the one obtainedfrom the simple model, described above, but with slightlydifferent 15N–31P distances of 3.9 and 4.4 A (Fig. 9(a), filledpentagons).
Although acidic and basic amino acids are thought toconstitute the primary means by which proteins interactwith apatitic surfaces, the role of aromatic rings has attractedour attention. Constant composition techniques have shownthat phenylalanine has the highest HAP affinity constant ofthe nonpolar amino acids,74 and, because the N-terminusof statherin has two phenylalanines, the role these residuesplay in surface recognition is of interest.
Two samples containing 13C labels on the phenyl ring ofphenylalanine 7 (F7) and phenylalanine 14 (F14) were boundto HAP.54 Isotropic chemical shifts, CSAs, NMR line widthinformation, 13C rotating frame relaxation measurements, aswell as direct detection of correlations between 13C spins onprotein side chains, and 31P spins in the crystal surface with13C–31P REDOR NMR show that, in the peptide fragmentderived from the N-terminal 15 amino acids of salivarystatherin (i.e. SN15), the side chain of the phenylalaninenearest to the C-terminus of the peptide (F14) is dynamicallyconstrained and oriented near the surface, whereas the sidechain of the phenylalanine located in the middle of thepeptide (F7) is more mobile and is oriented away from theHAP surface, as shown in Fig. 10. The relative dynamics andproximities of F7 and F14 to the surface together with priordata obtained for the side chain of SN15’s unique lysine (K6)were used to construct a new picture for the structure ofthe surface-bound peptide and its orientation to the crystalsurface.
VIEWS OF STATHERIN STRUCTURE ANDASSEMBLY MECHANISMS ON HAP SURFACES
ITC and equilibrium AI results shown in this study indicatethat only a fraction of the protein adsorbs to the mineralsurface with detectable heat and that most of the proteinadsorbs through a process that is accompanied by nodetectable heat change. The following discussion interpretsthis finding in the context of a two-binding-site model that isimplicitly based on the assumption of monolayer coveragelimits. The protein molecules may adsorb onto the surfacethrough a variety of orientations; however, from the solid-state NMR results, it is clear that the globular structureof the protein is intact even if it binds through differentparts of its external surface. Molecular simulation programsare emerging that strive to predict protein structure andorientation on surfaces.75,76 The binding isotherm shownhere (Fig. 2) exhibits a single deflection point in the curveand not the typical detectable steps in concentration atmonolayer completion that is characteristic of multilayeradsorption.14,77
The adsorption of statherin to HAP is an exothermicprocess. However, this heat is relatively low and it isin fact the entropy that makes the dominant contributionto the free energy of adsorption. Moreover, entropy isthe only contribution to the adsorption process to site B.For all temperatures above 20 °C, the entropy contributiondominates adsorption even at the lowest fractional coverage
Copyright 2007 John Wiley & Sons, Ltd. Magn. Reson. Chem. 2007; 45: S32–S47DOI: 10.1002/mrc

Structural and Thermodynamic Studies of Statherin Adsorption to Hydroxyapatite S43
rC(Y34)-N(Y38) (Å)
χ2 va
lue
αα
χ2 va
lue
0
10
20
30
40
50
60
2 3 4 5 6 7 8 9
0
50
100
150
200
250
300
5 7 9 11 13 15 17
φ
30
4070
70
250
250
250
250
500
800
1000
-150
150
-100
-50
-80 -60
50
100
0ψ
(a)
(b) (c)
(d) (e)
rC(P33)-N(Y38) (Å)
confidence level (1∗σ)
confidence level (1∗σ)
rC''-F(P23) (Å)
4.5 5 5.5 6 6.5
9 10 11 12
0
50
100
150
200
250
300
0
50
100
150
200
250
300
8.2
8.2
2020
40
40
80
80
80
80
160
160
17
17
1919 21
21
23
2732
rC'-F(P23) (Å)
χ2 projection atC(Y34)-N(Y38) = 4.0 Å
χ2 projection atC'' -F(P23) = 9.0 Å
-180 -160 -140 -120 -100
Figure 8. �2 analysis of simulated SEDRA and REDOR NMR curves to the experimental data shown in Fig. 7. The simulations of theSEDRA data (the REDOR S0 experiment) were carried out with the Ramachandran angles (,) as free parameters (�2 D �2�,�).The simulations of the REDOR data were carried out with the length of the heteronuclear dipolar vectors and the angle ˛ as freeparameters (�2 D �2�rC�P33���F or N�, rC�Y34���F or N�, ˛�. The angle ˛ is the rotation angle of the heteronuclear vectors around the CCvector and defines the polar angles of these vectors in the C(P33) carbonyl carbon CSA frame. The resultant dephasing curves werenormalized to the calculated S0 curve to obtain standard S/S0 curves. (a) Contour map of the �2 value in the S0 experiment as afunction of the Ramachandran angles (,). (b) Cross section of the �2 function along the rC�Y34��N�Y38� parameter showing the dataare best fit by simulations using a value of 4 A. (c) The contour plot of the �2�rC�P33��N�Y38�, ˛� function along the minimum of thefunction at rC�Y34��N�Y38� D 4 A. (d) Cross section of the �2 function along the rC00�F�P23� parameter showing the data are best fit bysimulations using a value of 9 A. (e) The contour plot of the �2�rC0�F�P23�, ˛� function along the minimum of the function atrC00�F�P23� D 9 A. Here, we denote the two carbons as C0 and C00 since they are indistinguishable in the 13C spectrum. Confidencelevel of 1 Ł � is shown as the lowest contour in (a), (c), and (e) and the solid black line in (b) and (d).
where A sites dominate, and even below this temperaturefor any coverage above ¾10% of saturation. Adsorption ofproteins to surfaces is often entropy driven and, in particular,the adsorption of two other salivary proteins PRP1 andPRP3 onto HAP.64 The increase in entropy upon statherinadsorption is attributed to displacement of water moleculesfrom the surface of the mineral and the solvation layer in theprotein to solution.
We proposed that, at higher coverage, hydrophobic inter-actions are formed between coadsorbed protein moleculesupon adsorption.6 Also consistent with the data is that suchinteractions are usually characterized by high entropy due tothe release of bound water to the solution.78,79 The enthalpyof such interactions is composed of the enthalpy of packingof hydrophobic residues and the dehydration enthalpies ofdifferent residues. These two enthalpies are expected to have
Copyright 2007 John Wiley & Sons, Ltd. Magn. Reson. Chem. 2007; 45: S32–S47DOI: 10.1002/mrc

S44 G. Goobes et al.
Figure 9. (a) Statistical �2 analysis of 15N–31P REDOR data of 15N K6 in SN15 to HAP indicates a well-defined minimum atdistances of 3.8 and 4.8 A, suggesting a possible hydrogen bond between the K6 side chain and the HAP atoms.53 The filledsquares are the experimental data, while the filled circles denote the simulation that gives rise to the �2 minimum and the pentagonsindicate the multiple spin simulation of a 15N K6 approaching the (004) crystal plane of hydroxyapatite (parameters used for thesimulation are defined thoroughly in (b)). (b) Model of a 15N K6 side chain of SN15 approaching the (004) crystal plane ofhydroxyapatite. The figure depicts all the spins that were used in the above-mentioned simulation. The dark circles denote the 31Pspins, while the lighter shaded circle depicts the 15N spin on the lysine side chain. The blocks on the peptide depict the six acidicN-terminal residues of SN15.
opposite signs,80 which could explain the approximately zeroenthalpy observed for the B-site-binding regime.
The temperature dependence of the adsorption thermo-dynamics determined from ITC shows that the change in theenthalpy upon adsorption to site A becomes less exothermicwith increased temperature (Fig. 11, Table 1). The change inenthalpy with temperature resulted in a positive Cp valueof 194�š7� cal K�1 mol�1 at 25 °C (Table 3 in Ref. 6). Thispositive Cp together with the observed positive S is incon-sistent with this interaction being dominated by hydrophobicinteractions common to protein–protein and protein–ligandinteractions.81,82 It is therefore reasonable that the positiveCp value observed here reflects an electrostatic interactionlikely between the charged N-terminus of statherin and theionic HAP surface sites.
We describe now the findings we obtained from thestructural studies using NMR techniques and discuss in thefollowing views and lessons to adsorption and functions ofstatherin that can be gained from the macroscopic and atomiclevel studies.
The dipolar recoupling measurements described inSections on ‘Backbone structure of the N-terminal HAPbinding domain, ‘Secondary structure of the C-terminalbacterial binding domain’, and ‘Tertiary constraints onstatherin fold’ were used in conjunction with the ROSETTAstructure prediction algorithm to construct the folding ofthe mineral-bound protein. Refinement of the statherinstructure was done by constraining the original 1000 modelset with the long CF distance measurements and thegeometric measurements in the C-terminus. The resultanteight structures, aligned along the backbone atoms in thetwo helices, are given in Fig. 11. They exhibit an averagepair root-mean-square deviation (RMSD) of 2.5 A with
higher structural dispersion in the intermediate region whereconstraints have not yet been measured. The small foldedcore is created by the folding of the C-terminus helical region(33–38) back onto the intermediate region through a loopregion defined by proline residues. The C-terminus helix canbe tilted at different angles with respect to the N-terminushelix due to the limited number of constraints between thetwo regions. The resultant torsion angle and distance valuesare not 1 : 1 correlated with maxima in the calculated valuesin the histograms of Fig. 6 (e.g. � angle). Only a single modelout of the eight is common to the 31-model cluster used forlabeling selection underscoring the predisposition that thepredicted structure serves as a guideline for selection of labelsites. The ROSETTA program thus successfully narrowedthe search for structural elements in the folded protein andthen enabled a construction of the protein fold based on theexperimental distance constraints.
The view of the structure of surface-bound statherinthat emerges from NMR measurements and structuralmodeling by ROSETTA is that of a protein with an ˛-helicalsecondary structure encompassing the first 12 amino acidsin the N-terminus. This region is known to be necessaryfor HAP binding and, accordingly, 15N–31P and 13C–31PREDOR measurements detected close approaches betweensurface phosphate groups and side chains of basic andaromatic amino acids. In addition, the C-terminus (whichis known to contain a binding site for bacterial antennaproteins) is also helically structured. Long-distance 13C–19Fmeasurements show that, unlike the condition in solutionwhere statherin appears unfolded and displays a 310 helicalstructure near the C-terminus, on the mineral surface theC-terminal ˛ helix is folded over the intermediate region ofthe protein.
Copyright 2007 John Wiley & Sons, Ltd. Magn. Reson. Chem. 2007; 45: S32–S47DOI: 10.1002/mrc

Structural and Thermodynamic Studies of Statherin Adsorption to Hydroxyapatite S45
Figure 10. (a) Three different orientations of the phenyl ringwith respect to the HAP surface were considered: (i) the ringplane is parallel to the HAP surface, (ii) the ring plane isperpendicular to the HAP surface with one meta- and oneortho- carbon closest to the surface, and (iii) the ring plane isperpendicular to the HAP surface with the para- carbon closestto the surface. (b) REDOR analysis of both the samples boundto HAP is shown. The experimental data and best simulatedfits are shown for both samples. (c) A �2 map is shown for theF14 sample, based on the orientations (i) and (ii) depicted inFig. 10(a). (d) A modified SN15 model with peptide bound toHAP is presented, in which the C-terminus loses its ˛-helicity,and both the K6 and F14 side chains are within close proximityof the HAP surface54.
NFigure 11. Superposition of the eight models that agree withthe constraints derived from the solid-state NMRmeasurements.71 These models are derived from the full set of1000 models. Alignment of the models in the figure was basedon the root-mean-square deviation calculation of segments(1–15) and (33–38) between the eight models. The N-terminusof the protein is denoted in the figure.
The next stage toward obtaining a detailed structureof the protein and its preferred orientation on the surface ofHAP is to complement additional constraints on the structureand additional information regarding the proximity andhence interaction strength of the protein outer shell with asimulative effort that accounts for the potential energy thatthe protein encounters at the different faces of the mineral asit adsorbs.83 The degree to which the structure of statherincan be influenced by the surface potential is not known yet,although for other proteins it was reported that changes assevere as total unfolding, especially on hydrophobic surfaces,are often observed. Current protein structure predictionprograms cannot predict the folded state of a protein inthe presence of another macromolecule or surface startingfrom an unfolded or random coil conformation. The ultimategoal of computational technique development would be toassert the experimental observation of a transition from anunfolded state to an active folded state upon exposure to thepotential energy of the surface.83
CONCLUSIONS
Isothermal titration microcalorimetry can detect even lowheats involved in the adsorption of a protein to a mineralsurface. It was successfully utilized to probe the thermo-dynamics of statherin adsorption onto HAP crystals. Whenanalyzed in conjunction with results collected from AI, aclearer understanding of various adsorption mechanismswas achieved. At low coverage, statherin adsorbs onto
Copyright 2007 John Wiley & Sons, Ltd. Magn. Reson. Chem. 2007; 45: S32–S47DOI: 10.1002/mrc
S46 G. Goobes et al.
HAP with a significant favorable free energy change thatis driven by both entropy and enthalpy. At higher coverage,the adsorption becomes enthalpically neutral and is drivensolely by the positive entropy change associated with therelease of bound water molecules. The higher affinity ofthe protein to the mineral at low coverage may be associ-ated with adsorption to high energy surface sites like crystalgrowth sites and/or with a decreased affinity as a functionof increased coverage due to unfavorable protein–proteininteractions that lower the net free energy of adsorption. Byblocking crystal growth sites first, statherin can inhibit HAPcrystal growth at relatively low coverage as was previouslyreported.4,5
The NMR studies of HAP-bound statherin have givenseveral insights with biological ramifications. Statherin bindsto fimbrillar systems in several bacterial microorganismsonly when adsorbed onto HAP. The binding site forfimbrillin, the monomeric unit of the fimbriae, is at theC-terminus of statherin. The conformational change in thisregion to an ˛-helical motif upon adsorption as detected bysolid-state NMR provides a clear avenue for the selectiverecognition of surface immobilized statherin by bacteria. TheC-terminus of statherin has previously been associated withthe lubricative action of statherin on tooth enamel. The helicalmotif at this region might have viscoelastic properties thathelp reduce wear of enamel surfaces. The lubricative actionof statherin in concert with other proteins in the pelliclelayer covering tooth surfaces should be greatly influencedby the structure that the protein adopts when adsorbed.Furthermore, if a cooperative mechanism of wear reductionbetween different proteins exists, recognition of statherinby different pellicle proteins requires that it adopts a stablestructure in the pellicle.
The thermodynamic measurements showed that thespontaneous adsorption of statherin to the HAP surfacehas a positive entropy change as the dominant contributionfor almost all the temperature range studied. The structuralwork implies reduction in the protein’s motional degreesof freedom due to formation of secondary motifs andstructuring of the protein upon adsorption. The increasein the degree of disorder upon binding of the protein tothe surface of the mineral crystallites is therefore associatedwith the release of bound water around the outer surfaceof the protein and on the surfaces of the crystallites toallow for interaction between the two. The relatively lowmagnitude of the binding enthalpy, ¾4 kcal/mol, is notreadily expected, given the number of charged residues inthe protein at the working pH. Higher enthalpic contributionto the free energy might have been expected and thislower actual value may be important for the control ofadsorption and desorption of the protein from the surfacesin response to functional needs and signals. The involvementof proton transfer in the adsorption process shown before6
has a biological significance as well, given the fact that thesaliva is exposed to major variations in pH. These studiesprovide a strong basis for future statherin structure–functionstudies and additional measurements that map the residuesalong the peptide chain that are involved in the interactionwith mineral surface. Other important insights about the
function of the protein may be gained from studying theadsorbed complex of statherin with other tooth pellicleproteins as several studies have implied that these proteinsform suprastructures on the enamel surface and may enhancetheir functionality by cooperative mechanism.
Statherin is a good model system whose structuraltransition upon adsorption to HAP crystallites provides leadsfor the structural basis for the function of biomineralizationproteins. Many extracellular matrix proteins like osteopontinhave segments in their primary sequence that are similarto statherin and have been found to be unstructured insolution.84 In the case of statherin, the folding of the proteinon the mineral surface may remove hydrophilic residuesfrom solution, thus preventing further HAP nucleation.Previous studies have underscored the role of the C-terminusin retardation of HAP nucleation by statherin. The tertiaryfolding of statherin is the basis for its inhibition of bothprimary and secondary crystallization of HAP, and thisfolding is naturally induced by contact between the HAPsurface and the protein. Thus, a protein that is unstructured insolution may nevertheless be functional on a surface where afolding transition occurs. This remarkable feature of statherinprovides with a unique case of surface-induced structuring,which reverses the common paradigm observed in manyproteins where surface-induced unfolding is observed.
AcknowledgementsThis work was supported by the NSF (Grants EEC 9529161 and DMR0110505) and the NIH (National Dental Institute (RO1 DE-12554),and the Institute of General Medicine (RO1 GM074511)). We thankDr Rajan Paranji for his help in running the NMR experiments ofstatherin in solution and Dr Nicholas Breen for proof-reading themanuscript and for helpful discussions.
REFERENCES1. Schoen FJ, Harasaki H, Kim KM, Anderson HC, Levy RJ.
J. Biomed. Mater. Res. 1988; 22: 11.2. Coe FL, Parks JH, Asplin JR. N. Engl. J. Med. 1992; 327: 1141.3. McCarty DJ. Dis. Mon. 1994; 40: 258.4. Raj PA, Johnsson M, Levine MJ, Nancollas GH. J. Biol. Chem.
1992; 267: 5968.5. Johnsson M, Richardson CF, Bergey DJ, Levine MJ, Nancol-
las GH. Arch. Oral Biol. 1991; 36: 631.6. Goobes R, Goobes G, Campbell CT, Stayton PS. Biochemistry
2006; 45: 5576.7. Goobes R, Goobes G, Shaw WJ, Campbell CT, Drobny GP,
Stayton PS. Biochemistry 2007; 46: 4725.8. Sicheri F, Young DSC. Nature 1995; 375: 427.9. Hoang QQ, Sicheri F, Howard AJ. Nature 2003; 425: 977.
10. Lee VA, Craig RG, Filisko FE, Zand R. J. Colloid Interface Sci.2005; 288: 6.
11. Norde W, Lyklema J. J. Colloid Interface Sci. 1978; 66: 257.12. Koutsoukos PG, Norde W, Lyklema J. J. Colloid Interface Sci. 1983;
95: 385.13. Chiu TH, Nyilas E, Lederman DM. Trans. Am. Soc. Artif. Intern.
Organs 1976; 22: 498.14. Haynes CA, Norde W. J. Colloid Interface Sci. 1995; 169: 313.15. Pan VH, Tao T, Zhou JW, Maciel GE. J. Phys. Chem. B 1999; 103:
6930.16. Sindorf DW, Maciel GE. J. Am. Chem. Soc. 1983; 105: 1848.17. Brunner E, Seydoux R, Haake M, Pines A, Reimer JA. J. Magn.
Reson. 1998; 130: 145.18. Wang P-K, Slichter CP. Phys. Rev. Lett. 1984; 53: 82.19. Hwang S-J, Petucci C, Raftery D. J. Am. Chem. Soc. 1998; 120:
4388.
Copyright 2007 John Wiley & Sons, Ltd. Magn. Reson. Chem. 2007; 45: S32–S47DOI: 10.1002/mrc

Structural and Thermodynamic Studies of Statherin Adsorption to Hydroxyapatite S47
20. Tong YY, Rice C, Wieckowski A, Oldfield E. J. Am. Chem. Soc.2000; 122: 11921.
21. Beshah K, Rey C, Glimcher MJ, Schimizu M, Griffin RG. J. Magn.Reson. 1990; 84: 17.
22. Yesinowski JP. Nuclear magnetic resonance of calciumphosphates. In Calcium Phosphates in Biological and IndustrialSystems, Amjad Z (ed). Kluwer Academic Publishers: Boston,1988.
23. Wu Y, Ackerman JL, Strawich ES, Rey C, Kim HM, Glimcher MJ.Calcif. Tissue Int. 2003; 72: 610.
24. Bak M, Thomsen JK, Jakobsen HJ, Petersen SE, Petersen TE,Nielsen NC. J. Urol. 2000; 164: 856.
25. Denny JK, Wang JF, Cross TA, Quine JR. Biophys. J. 2001; 80:1555.
26. Castellani F, van Rossum B, Diehl A, Schubert M, Rehbein K,Oschkinat H. Nature 2002; 420: 98.
27. Tycko R. Prog. Nucl. Magn. Reson. 2003; 42: 53.28. Drobny GP, Stayton PS, Long JR, Louie EA, Karlsson T,
Popham JM, Oyler NA, Bower PV, Shaw WJ. Structural studiesof peptides at biomaterial interfaces using double quantumsolid state NMR spectroscopy. In Biological Solid State NMR,Ramamoorthy A (ed). Taylor & Francis: New York, 2005.
29. Goobes G, Stayton PS, Drobny GP. Prog. Nucl. Magn. Reson.Spectrosc. 2007; 50: 71.
30. Gregory D, Mitchell D, Stringer JA, Kiihne S, Shiels JC,Callahan J, Mehta MA, Drobny GP. Chem. Phys. Lett. 1995; 246:654.
31. Gullion T, Schaefer J. J. Magn. Reson. 1989; 81: 196.32. Gullion T, Vega S. Chem. Phys. Lett. 1992; 194: 423.33. Bennet AE, Ok JH, Griffin RG, Vega S. J. Chem. Phys. 1992; 96:
8624.34. Schupbach P, Oppenheim FG, Lendenmann U, Lamkin MS,
Yao Y, Guggenheim B. Eur. J. Oral Sci. 2001; 109: 60.35. Li J, Helmerhorst EJ, Yao Y, Nunn ME, Troxler RF, Oppen-
heim FG. Arch. Oral Biol. 2004; 49: 379.36. Vitkov L, Hannig M, Nekrashevych Y, Krautgartner WD. Eur. J.
Oral Sci. 2004; 112: 320.37. Yin A, Margolis H, Yao Y, Grogan J, Oppenheim FG. Arch. Oral
Biol. 2006; 51: 102.38. Douglas WH, Reeh ES, Ramasubbu N, Raj PA, Bhandary KK,
Levine MJ. Biochem. Biophys. Res. Commun. 1991; 180: 91.39. Hahn Berg IC, Lindh L, Arnebrant T. Biofouling 2004; 20: 65.40. Proctor GB, Hamdan S, Carpenter SH, Wilde P. Biochem. J. 2005;
389: 111.41. Hay DI, Moreno EC. In Human Saliva: Clinical Chemistry and
Microbiology, Vol. I, Tenovuo JO (ed). CRC Press: Boca Raton,1989; 131.
42. Schlesinger DH, Hay DI. J. Biol. Chem. 1977; 252: 1689.43. Raj PA, Marcus E, Sukumaran DK. Biopolymers 1992; 45: 51.44. Schwartz SS, Hay DI, Schluckebier SK. Calcif. Tissue Int. 1992; 50:
511.45. Campbell AA, Ebrahimpour A, Perez L, Smesko SA, Nancol-
las GH. Calcif. Tissue Int. 1989; 45: 122.46. Jensen JL, Lamkin MS, Oppenheim FG. J. Dent. Res. 1992; 71:
1569.47. Johnsson M, Levine MJ, Nancollas GH. Crit. Rev. Oral Biol. Med.
1993; 4: 371.
48. Moreno EC, Kresak M, Hay DI. Arch. Oral Biol. 1978; 23: 525.49. Waite JH, Qin X. Biochemistry 2001; 40: 2887.50. Aoba T, Moreno EC, Hay DI. Calcif. Tissue Int. 1984; 36: 651.51. Wikiel K, Burke EM, Perich JW, Reynolds EC, Nancollas GH.
Arch. Oral Biol. 1994; 39: 715.52. Gibson JM, Raghunathan V, Popham JM, Stayton PS, Drobny
GP. J. Am. Chem. Soc. 2005; 127: 9350.53. Raghunathan V, Gibson JM, Goobes G, Popham JM, Louie AE,
Stayton PS, Drobny GP. J. Phys. Chem. B 2006; 110: 9324.54. Gibson JM, Popham JM, Raghunathan V, Stayton PS, Drobny
GP. J. Am. Chem. Soc. 2006; 128: 5364.55. Lamont RJ, Jenkinson HF. Microbiol. Mol. Biol. Rev. 1998; 62: 1244.56. Dodds MWJ, Johnson DA, Yeh C-K. J. Dent. 2005; 33: 223.57. Rudney JD, Chen R. Arch. Oral Biol. 2004; 49: 523.58. Gibbons RJ, Hay DI. Infect. Immun. 1988; 56: 439.59. Gibbons RJ, Hay DI, Schlesinger DH. Infect. Immun. 1991; 59:
2948.60. Xie H, Gibbons R, Hay D. Oral Microbiol. Immunol. 1991; 6: 257.61. Amano A, Kataoka K, Raj PA, Genco RJ, Shizukuishi S. Infect.
Immun. 1996; 64: 4249.62. Nagata H, Sharma A, Sojar HT, Amano A, Levine MJ, Genco RJ.
Infect. Immun. 1997; 65: 422.63. Sekine S, Kataoka K, Tanaka M, Nagata H, Kawakami T,
Akaji K, Aimoto S, Shizukuishi S. Microbiology 2004; 150: 2373.64. Moreno EC, Kresak M, Hay DI. Calcif. Tissue Int. 1984; 36: 48.65. Gray JJ. Curr. Opin. Struct. Biol. 2004; 14: 110.66. Mura-Galelli MJ, Voegel JC, Behr S, Bres EF, Schaaf P. Proc. Natl.
Acad. Sci. 1991; 88: 5557.67. Ramsden JJ. Chem. Soc. Rev. 1995; 24: 73.68. Naganagowda GA, Gururaja TL, Levine MJ. J. Biomol. Struct.
Dyn. 1998; 16: 91.69. Elgavish GA, Hay DI, Schlesinger DH. Int. J. Pept. Protein Res.
1984; 23: 230.70. Long JR, Shaw WJ, Stayton PS, Drobny GP. Biochemistry 2001;
40: 15451.71. Goobes G, Goobes R, Schueler-Furman O, Baker D, Stayton PS,
Drobny GP. Proc. Natl. Acad. Sci. U.S.A. 2006; 103: 16083.72. Rohl CA, Strauss CEM, Misura KMS, Baker D. Methods Enzymol.
2004; 383: 66.73. Goobes G, Raghunathan V, Louie EA, Gibson JM, Olsen GL,
Drobny GP. Solid State Nucl. Magn. Reson. 2006; 29: 242.74. Koutsopoulos S, Dalas E. Langmuir 2000; 16: 6739.75. Minton AP. Biophys. J. 1999; 76: 176.76. Sun Y, Welsh WJ, Latour RA. Langmuir 2005; 21: 5616.77. Norde W. Adv. Colloid Interface Sci. 1986; 25: 267.78. Robinson GW, Cho CH. Biophys. J. 1999; 77: 3311.79. Makhatadze GM, Privalov PL. J. Mol. Biol. 1993; 232: 660.80. Makhatadze GM, Privalov PL. J. Mol. Biol. 1993; 232: 639.81. Loladze VV, Ermolenko DN, Makhatadze GI. Protein Sci. 2001;
10: 1343.82. Sturtevant JM. Proc. Natl. Acad. Sci. 1977; 74: 2236.83. Makrodimitris K, Masica DL, Kim ET, Gray JJ. J. Am. Chem. Soc.
2007; 129: 13713.84. Fisher LW, Torchia DA, Fohr B, Young MF, Fedarko NS.
Biochem. Biophys. Res. Commun. 2001; 280: 465.
Copyright 2007 John Wiley & Sons, Ltd. Magn. Reson. Chem. 2007; 45: S32–S47DOI: 10.1002/mrc