The relationship between cortical beta oscillations and motor ...
257
1 The relationship between cortical beta oscillations and motor learning Svenja Espenhahn A dissertation submitted in partial fulfilment of the requirements for the degree of Doctor of Philosophy Institute of Neurology UCL November 2017
-
Upload
khangminh22 -
Category
Documents
-
view
1 -
download
0
Transcript of The relationship between cortical beta oscillations and motor ...
1
The relationship between cortical beta
oscillations and motor learning
Svenja Espenhahn
A dissertation submitted in partial fulfilment of the requirements for the degree
of Doctor of Philosophy
Institute of Neurology
UCL
November 2017

2

3
I, Svenja Espenhahn, confirm that the work presented in this thesis is my own.
Where information has been derived from other sources, I confirm that this has
been indicated in the thesis.
_______________________________________
Svenja Espenhahn, November 2017

4
Abstract
5
Abstract
The ability to learn and retain new motor skills is pivotal for everyday life activities
and motor rehabilitation after stroke. However, people show considerable
individual differences in motor learning. Understanding the neurophysiological
processes underlying these individual differences is of significant scientific and
clinical importance. At a mechanistic level, oscillations in the beta frequency
range (15–30 Hz), fundamental for motor control, reflect underlying cortical
inhibitory and excitatory mechanisms. As such, they may provide appropriate
biomarkers with which to bridge the gap between cellular and behavioural
accounts of cortical plasticity in both healthy and diseased states. This thesis
explores the interplay between cortical beta oscillations and individual differences
in short-term motor learning within the context of healthy ageing and after stroke.
First, I assess the test-retest reliability of resting and movement-related beta
estimates in a group of healthy subjects across several weeks. By demonstrating
that EEG-derived power measures of beta activity are highly reliable, I validate
the notion that these measures reflect meaningful individual differences that can
be utilized in basic research and in the clinic.
Second, I probe the neurophysiological mechanisms underlying natural inter-
individual differences in short-term motor learning. I demonstrate comparable
motor learning ability between young and elderly individuals, despite age-related
alterations in beta activity. Implementing a multivariate approach, I show that beta
dynamics explain some of the individual differences in post-training tracking
performance.
Third, I extend this line of research by focusing on stroke-related inter-individual
variations in motor learning. Employing the same tasks and analyses, I
demonstrate preserved, albeit reduced motor learning ability and no aberrant
beta activity after stroke. Beta dynamics explained some of the individual
differences in stroke patients’ performance 24 hours after training, and may thus
offer novel targets for therapeutic interventions.

6

Acknowledgements
7
Acknowledgements
Four years have passed since I moved to London and started to pursue my MRC-
funded 4-year PhD in Clinical Neuroscience at UCL. During this time, I have had
the pleasure of learning from and working with many remarkable people, who
have directly and indirectly contributed to my PhD journey. I am truly thankful to
all of the people who have made these past 4 years stimulating and enjoyable.
First, and foremost, I want to thank my primary supervisor Nick Ward. He has
been accommodating of my interests, and has patiently advised me through the
occasionally rough waters of a doctorate. I would also like to thank my second
supervisor Joern Diedrichsen who has taught me to stay close to the data and
patiently provided me with his expertise. It has been a privilege to learn from
these two experts in their fields.
I have plundered the time of many talented colleagues over the last four years,
but the mentorship of Holly Rossiter and Bernadette van Wijk has been an
imperturbable and consistent source of guidance, encouragement and support.
With characteristic generosity, gentleness and diligence, they have instructed
and inspired at every step of the journey. They have been the first ports of call
whenever something has gone awry and a source of focus by emphasizing how
to best spend my finite amount of energy and time. Thanks for being such
exemplary mentors and role models!
I would also like to thank Archy de Berker. With incredible patience and
generosity, he has taught me the ropes of coding and has spent many hours with
me in the lab, offering not only technical support that made the experiments
possible but precious optimism and good humour. Being German, I am in awe
with his incredible productivity and efficiency. I am grateful to Nellie Redman who
has been a superb student to supervise. She has entertained participants and lab
members alike, and has been an absolute joy to work with. I also wish to thank
Josh Hadwen and Chris Seers for providing technical support whenever
switching a PC on and off was not the solution to a problem.

Acknowledgements
8
I will look back at my years at Queen Square with great fondness because of the
wonderful people I have met and the many friends I have made. I am thankful to
the 4th floor gang and feel privileged to call you my friends:
Louise Marshall, Ella Clark and Andy Watson who have introduced me to the
British tea drinking culture and guided me through ‘typically British’ traditions.
Graziella Quattrocchi (aka Bella Brunetta) and Anna Kuppuswamy who have
infused the 4th floor with cultural anecdotes and delicacies; Will de Doncker, Alex
Galvez Pol and Sasha Ondobaka who never fell short of laughter provoking ways
to make me forget about the bumps in the winding road to completing my
doctorate. I feel privileged to have shared so many wonderful memories with all
of you, from plank challenges and sporting events to travels and culinary
excursions. You were the icing on my PhD cake, and have put up with my
progressively worsening running addiction over the course of my PhD (maybe
there is a correlation there?). Thank you so much for everything!!!
I am much indebted to the many friends I made in London, who have made
London the city I fell in love with and my time here the best time of my life (at least
so far). There are too many inspiring and fascinating people to name them all but
Amy, Marion, Adrien and Mark deserve a special mention for always offering a
listening ear, moral support, healthy food and a good night out. The lovely runners
from Advent Running with whom I have shared many miles and smiles in and
around London, keeping me sane during the PhD rollercoaster. A special mention
also goes to my best friend, Jenny, who always says what needs to be said, even
if I don’t want to hear it and who rides every rollercoaster with me.
Finally, I would like to thank my parents, Gerlind and Erich, and my brother Jens
for their continued encouragement, generosity and understanding of my constant
wish to live and experience other countries. From near or far, you have supported
me to go ‘my way’ which will always be a windy rather than straight trail, hopefully
up and down some mountains (the best view comes after the hardest climb).
Thank you!
9
Table of contents
Abstract ..................................................................................................... 5
Acknowledgements .......................................................................................... 7
Table of contents .............................................................................................. 9
List of Figures ................................................................................................. 13
List of Tables ................................................................................................... 15
Abbreviations .................................................................................................. 16
Introduction .............................................................................. 19
1.1 Motor learning: a key feature of human motor control ......................... 19
1.1.1 Motor learning in the lab: motor skill learning vs motor adaptation ......... 20
7.1.2 Neural correlates of motor skill learning ................................................. 27
7.1.3 Role of M1 in motor skill learning: acquisition and consolidation ............ 29
7.2 The interaction of motor learning with brain plasticity .......................... 31
7.2.1 Motor learning-related plasticity in M1 ................................................... 31
7.3 Recovery from stroke through plasticity and motor learning ................ 37
7.3.1 The burden of stroke ............................................................................. 38
7.3.2 Individual differences in motor recovery after stroke .............................. 39
7.3.3 Spontaneous biological recovery: a window of opportunity .................... 41
7.3.4 Plasticity during recovery from stroke .................................................... 43
7.3.5 Motor learning after stroke ..................................................................... 49
7.4 Bridging the gap: biomarkers of plasticity ............................................ 50
7.5 Neuronal oscillations as biomarkers .................................................... 51
7.5.1 Beta oscillations in motor control ........................................................... 53
7.5.2 Generation and modulation of beta oscillations: GABA linkage .............. 54
7.5.3 Alterations in beta oscillations ................................................................ 57
7.6 Thesis overview ................................................................................... 60
7.7 Acknowledgement of contributions ...................................................... 62
Acquisition and analysis of EEG signals ............................... 63
2.1 Neurophysiological basis of EEG ......................................................... 63
Table of contents
10
2.1.1 Advantages and limitations of EEG ........................................................ 65
2.2 Considerations for high-quality EEG recordings .................................. 68
2.3 Analysis of EEG signals in the time-frequency domain ........................ 69
2.3.1 Pre-processing of EEG signals .............................................................. 71
2.3.2 Time-frequency analysis using wavelet transform .................................. 72
Methods .................................................................................... 75
3.1 Experimental design ............................................................................ 75
3.2 Motor tasks .......................................................................................... 77
3.2.1 Apparatus .............................................................................................. 78
3.2.2 Continuous tracking task to assay motor learning .................................. 79
3.2.3 Simple motor task to engender reliable beta oscillatory dynamics ......... 88
3.3 Controlling for confounding factors ...................................................... 89
3.4 Subject recruitment .............................................................................. 91
3.4.1 Sample size ........................................................................................... 92
3.5 Electroencephalography (EEG) ........................................................... 92
3.6 Electromyography (EMG) .................................................................... 94
3.7 Data analysis ....................................................................................... 94
3.7.1 Kinematic data ....................................................................................... 94
3.7.2 EEG data ............................................................................................... 97
3.8 Statistical analysis ............................................................................... 99
3.8.1 Stepwise multiple linear regression ...................................................... 100
3.8.2 Validation of model consistency ........................................................... 101
Intra-individual reliability of movement-related beta
oscillations ................................................................................................. 103
4.1 Abstract ............................................................................................. 103
4.2 Introduction ........................................................................................ 104
4.3 Methods ............................................................................................. 106
4.3.1 Subjects ............................................................................................... 106
4.3.2 Experimental design ............................................................................ 106
4.3.3 EEG recording ..................................................................................... 109
4.3.4 Data analysis ....................................................................................... 109
Table of contents
11
4.3.5 Statistical Analysis ............................................................................... 112
4.4 Results ............................................................................................... 113
4.4.1 Behavioural results .............................................................................. 113
4.4.2 Spectral power and peak frequency measures .................................... 114
4.5 Discussion ......................................................................................... 125
4.5.1 Movement-related beta oscillations show high test-retest reliability ..... 125
4.5.2 Conclusion ........................................................................................... 129
Predicting individual differences in motor skill learning .... 131
5.1 Abstract .............................................................................................. 131
5.2 Introduction ........................................................................................ 132
5.3 Methods ............................................................................................. 134
5.3.1 Subjects .............................................................................................. 134
5.3.2 Experimental design ............................................................................ 135
5.3.3 EEG recording ..................................................................................... 140
5.3.4 Data analysis ....................................................................................... 140
5.3.5 Statistical analysis ............................................................................... 145
5.4 Results ............................................................................................... 147
5.4.1 Presence of motor skill learning with healthy ageing ............................ 148
5.4.2 Changes in spectral power measures with age and training ................ 153
5.4.3 Prediction of post-training tracking performance from a combination of
neurophysiological and behavioural measures .................................................. 158
5.5 Discussion ......................................................................................... 165
5.5.1 Training induces performance improvements independent of age ....... 165
5.5.2 Beta oscillations are altered with ageing and motor learning................ 167
5.5.3 Beta oscillations are predictive of motor learning effects ...................... 171
5.5.4 Conclusion ........................................................................................... 174
Predicting individual differences in motor learning after
stroke ................................................................................................. 175
6.1 Abstract .............................................................................................. 175
6.2 Introduction ........................................................................................ 176
6.3 Methods ............................................................................................. 178
6.3.1 Subjects .............................................................................................. 178
Table of contents
12
6.3.2 Experimental design ............................................................................ 180
6.3.3 EEG recording ..................................................................................... 185
6.3.4 Data analysis ....................................................................................... 186
6.3.5 Statistical analysis ............................................................................... 189
6.4 Results ............................................................................................... 192
6.4.1 Functional assessment ........................................................................ 192
6.4.2 Reduction of motor skill learning after stroke ....................................... 194
6.4.3 Changes in spectral power measures with training .............................. 200
6.4.4 Prediction of patients’ post-training tracking performance from a
combination of neurophysiological, behavioural and functional/clinical measures ....
............................................................................................................ 204
6.5 Discussion ......................................................................................... 207
6.5.2 Reduced training-related performance improvements in stroke patients
compared to healthy controls ............................................................................. 208
6.5.3 Beta oscillations are unaffected by stroke but altered with motor learning..
............................................................................................................ 210
6.5.4 Beta oscillations are predictive of tracking performance retention ........ 212
6.5.5 Conclusion ........................................................................................... 214
General discussion ................................................................ 215
7.1 Key findings ....................................................................................... 215
7.2 Clinical implications for rehabilitation ................................................. 217
7.3 Methodological considerations and future directions ......................... 218
7.4 Concluding remarks ........................................................................... 220
Appendix ................................................................................................. 221
References ................................................................................................. 225
List of Figures
13
List of Figures
Figure 1.1 | Schematics of typical motor learning tasks in the lab. 21
Figure 1.2 | Temporal phases in the process of motor skill learning. 23
Figure 1.3 | Neural correlates of motor learning in humans. 28
Figure 1.4 | Repetitive TMS over M1 disrupts early motor consolidation. 30
Figure 1.5 | Representational changes in motor maps with skill training. 33
Figure 1.6 | Effect of tDCS on extended time course of motor skill learning. 37
Figure 1.7 | The top 10 causes of death world-wide in 2015. 39
Figure 1.8 | Proportional recovery of motor function after stroke. 41
Figure 1.9 | Reinitiation of critical period after induction of second stroke. 42
Figure 1.10 | Cortical excitability changes following stroke. 46
Figure 1.11 | Fluoxetine improves upper limb recovery. 48
Figure 1.12 | Pharmacologically induced beta oscillations depend on GABA. 55
Figure 1.13 | Effect of cTBS on cortical excitability and M1 beta power. 58
Figure 1.14 | Reduced beta desynchronization in Parkinson’s disease. 59
Figure 2.1 | Schematic of electrical fields generated by cortical neurons. 65
Figure 2.2 | Two-dimensional comparison of human brain imaging tools. 67
Figure 2.3 | Trade-off between time and frequency resolution. 73
Figure 3.1 | Timeline of experiment in Chapter 4. 76
Figure 3.2 | Timeline of experiments in Chapter 5 and Chapter 6. 77
Figure 3.3 | Experimental set-up used during all motor tasks. 79
Figure 3.4 | Design of continuous tracking task. 81
Figure 3.5 | Difficulty-matched sequences. 85
Figure 3.6 | Linear regression model of actual wrist movement time data. 86
Figure 3.7 | Adaptive procedure for individual target velocity adjustment. 87
Figure 3.8 | Design of simple motor task. 89
Figure 3.9 | Illustration of linear regression approach. 96
Figure 3.10 | Schematic of crossvalidation approach for model assessment. 102
Figure 4.1 | Experimental setup and measurements. 108
Figure 4.2 | Beta peak frequency detection. 112
Figure 4.3 | Average movement-related changes in spectral power. 115
Figure 4.4 | Test-retest reliability of beta-band activity. 119
List of Figures
14
Figure 4.5 | Intraclass correlation coefficient (ICC) analysis. 121
Figure 4.6 | Intraclass correlation coefficients as a function of trial number. 122
Figure 4.7 | Between-sessions correlation coefficients. 124
Figure 5.1 | Timeline of experiment employing EEG and motor learning. 136
Figure 5.2 | Experimental setup and paradigms. 138
Figure 5.3 | Linear regression approach for exemplary healthy subject. 141
Figure 5.4 | Angular displacement and respective changes in beta activity. 144
Figure 5.5 | Motor skill learning of young and elderly subjects. 149
Figure 5.6 | Correlations of subjects’ performance between time points. 152
Figure 5.7 | Alterations in beta power and corresponding topographic maps. 157
Figure 5.8 | Prediction of tracking performance at T2. 160
Figure 5.9 | Prediction of tracking performance at T4. 163
Figure 6.1 | Timeline of experiment employing EEG and motor learning. 181
Figure 6.2 | Experimental setup and paradigms. 184
Figure 6.3 | Movement-related changes in spectral power after stroke. 189
Figure 6.4 | Patients’ functional/clinical test scores. 193
Figure 6.5 | Motor learning performance of patients and healthy controls. 195
Figure 6.6 | Correlations of patients’ performance between time. 199
Figure 6.7 | Changes in beta power and corresponding topographic maps. 203
Figure 6.8 | Prediction of stroke patients’ tracking performance at T4. 206

List of Tables
15
List of Tables
Table 4.1 | Summary of kinematic measures acquired during the performance of
the simple motor task for each EEG session. 114
Table 4.2 | ANOVA results for spectral power and peak frequency estimates.
117
Table 5.1 | Characteristics of young and elderly subject groups. 148
Table 5.2 | ANOVA results of subjects’ tracking performance at different time
points during the motor learning process. 151
Table 5.3 | Summary of kinematic measures acquired during the performance of
the simple motor task for each age group. 154
Table 5.4 | ANOVA results for spectral power measures of healthy ageing
subjects. 155
Table 5.5 | Comparison of prediction accuracy for performance at T2. 162
Table 5.6 | Comparison of prediction accuracy for performance at T4. 164
Table 6.1 | Characteristics of chronic stroke patients. 180
Table 6.2 | Group characteristics of stroke patients and healthy controls. 194
Table 6.3 | ANOVA results of patients’ and healthy controls’ tracking
performance at different time points. 198
Table 6.4 | Summary of kinematic measures acquired during the performance of
the simple motor task for patients and healthy controls. 200
Table 6.5 | ANOVA results for spectral power of stroke patients and controls 201
Table 6.6 | Comparison of prediction accuracy for stroke patients’ performance
at T4. 207
Abbreviations
16
Abbreviations
ANOVA ANalysis Of VAriance
ARAT Action Research Arm Test
AROM Active Range Of Movement
BB Baseline Beta
BDNF Brain-Derived Neurotrophic Factors
BOLD Blood Oxygenation Level-Dependent
CAR Common Average Reference
CIMT Constraint-Induced Movement Therapy
CST CorticoSpinal Tract
cTBS Continuous Theta Burst Stimulation
D Dominant
DLPFC DorsoLateral Prefrontal Cortex
DMS DorsoMedial Striatum
DV Dependent Variable
ECR Extensor Carpi Radialis
EEG ElectroEncephaloGraphy
EMG ElectroMyoGraphy
EPSP Excitatory PostSynaptic Potential
ERD Event-Related Desynchronization
ERP Event-Related Potential
ERS Event-Related Synchronization
FCR Flexor Carpi Radialis
FDI First Dorsal Interossei
FLAME Fluoxetine for Motor recovery After stroke
FM Fugl-Meyer
fMRI Functional Magnetic Resonance Imaging
FSS Fatigue Severity Scale
ICC Intraclass Correlation Coefficient

Abbreviations
17
IPSP Inhibitory PostSynaptic Potential
IV Independent Variable
KP Knowledge of Performance
KR Knowledge of Result
LACI Lacunar Infarct
LFP Local Field Potential
LOOCV Leave-One-Out Cross-Validation
M1 Primary Motor Cortex
MCA Middle Cerebral Artery
MEG MagnetoEncephaloGraphy
MEP Motor-Evoked Potential
MRBD Movement-Related Beta Desynchronization
MRI Magnetic Resonance Imaging
MT Movement Time
ND Non-Dominant
NFI Neurological Fatigue Index
NHNN National Hospital for Neurology and Neurosurgery
NHPT Nine Hole Peg Test
PCA Principle Component Analysis
PCA Posterior Cerebral Artery
PD Parkinson’s Disease
PIC Peri-Infarct Cortex
PM PreMotor
PMBR Post-Movement Beta Rebound
PPC Posterior Parietal Cortex
PV Peak Velocity
RMSE Root Mean Squared Error
RT Reaction Time
SART Sustained Attention To Response Test
SD Standard Deviation
Abbreviations
18
SEM Standard Error of the Mean
SICI Short-interval IntraCortical Inhibition
SMA Supplementary Motor Area
SNR Signal-to-Noise Ratio
SPM Statistical Parametric Mapping
SRTT Serial Reaction Time Task
SSRI Selective Serotonin Reuptake Inhibitor
STFT Short-Term Fourier Transform
SVIPT Sequential Visual Isometric Pinch Task
ti Target position at time i
TF Time-Frequency
TMS Transcranial Magnetic Stimulation
TS Time since Stroke
UL Upper Limb
VAS Visual Analogue Scale
W Width
wi Wrist position at time i
A Amplitude (Distance)
Introduction
19
Introduction
This thesis explores candidate biomarkers with which to bridge the gap between
cellular and behavioural accounts of cortical plasticity by investigating the
interplay between these neurophysiological markers and individual differences in
short-term motor learning in both healthy and diseased states. It builds on a large
body of physiological, pharmacological, behavioural and neuroimaging work
proposing a role for cortical plasticity in motor skill learning and recovery after
stroke. In this chapter, I review and draw together insights from the existing
literature, and highlight the translational value of the questions addressed in this
thesis. I define key terms that will be used throughout, and present an overview
of the following chapters.
1.1 Motor learning: a key feature of human motor control
Successful interaction with the world and other people requires the ability to learn
and adapt our motor behaviour to an ever-changing environment. Motor learning
is the process associated with practice or experience rather than maturation that
leads to a fairly permanent change in a person’s ability to perform motor skills
(“ability to reliably deliver accurate execution” (Kitago and Krakauer, 2013)).
These motor skills such as writing, playing an instrument or using a touchscreen
require, for example, smooth co-activation of muscle groups into a specific
sequence, multi-joint movement synergies, and eye-body coordinated actions
(Schmidt, R. A. and Lee, 1999). The goal of motor learning, in general, is to
improve performance and acquire new motor skills, which is fundamental to
human development. The process itself is dynamic as changes are mostly
unpredictable. Thus, it allows an individual to progress from novice to expert in a
particular motor skill, and to flexibly maintain motor abilities throughout the
lifespan (Schmidt and Wrisberg, 2008a; Willingham, 1998; Wolpert et al., 2011).
Consequently, the capacity to (re)learn and retain new motor skills is essential
for accommodating neurophysiological changes that often occur gradually with
ageing and suddenly following neurological injury. However, daily life experience
makes it evident that people show considerable inter-individual differences in
their capacity to learn and retain new skills (Frensch and Miner, 1994; Golenia et
Introduction
20
al., 2014; Tubau et al., 2007; Unsworth and Engle, 2005; Vegter et al., 2014),
possibly due to variations in the structure and function of brain regions involved
in motor control (Tamás Kincses et al., 2008; Tomassini et al., 2011).
Understanding the neurophysiological processes underlying these differences in
the capacity to learn is of significant scientific and clinical importance for
improving long-term rehabilitative outcomes in the elderly and patients with brain
injury (Stinear, 2010; Ward, 2017).
1.1.1 Motor learning in the lab: motor skill learning vs motor adaptation
In order to study the cognitive processes and neural substrates mediating the
ability to learn motor behaviour in the laboratory, a variety of tasks and
experimental paradigms have been used. In general, these tasks fall into two
categories (for review see (Doyon et al., 2003; Kitago and Krakauer, 2013;
Krakauer and Mazzoni, 2011a; Willingham et al., 1989)). The first is motor
adaptation, in which our capacity to compensate and return to baseline
performance following externally induced perturbations (i.e. prisms, rotations,
force fields) is tested (Figure 1.1A) (Krakauer et al., 2000; Martin et al., 1996;
Shadmehr and Mussa-Ivaldi, 1994a). Individuals, in general, rapidly reduce
performance errors and once adapted, show ‘after-effects’ and have to gradually
‘de-adapt’ their behaviour with practice back to the original state when the
perturbations are removed again. Importantly, adaptation does not require the
acquisition of new motor synergies. Motor adaptation will not be discussed further
here, as it was not used to probe motor learning in this thesis and a
comprehensive review of both types of learning would be beyond the scope of
this thesis.
The second is motor skill learning, the incremental acquisition of sequential
movements into well-executed behaviour with lasting improvements beyond
baseline performance (Figure 1.1B) (Karni et al., 1995; Nissen and Bullemer,
1987). In contrast to motor adaptation, this form of motor learning involves the
acquisition of new movement patterns and/or muscle synergies. Thus, the
acquisition of motor skill takes longer than adaptation, and sometimes does not
reach plateau level for years (i.e. learning to play the violin) (Karni and Sagi,
1993). In both animals and humans, motor skill learning is typically measured by
Introduction
21
a reduction in reaction time, the number of errors, and changes in the speed-
accuracy trade-off, and/or by a change in muscle activation patterns and
kinematics (e.g. (Hikosaka et al., 1995; Reis et al., 2009; Shadmehr and
Brashers-Krug, 1997).
In general, motor adaptation and motor skill learning both involve learning novel
kinematic and dynamic mappings between motor outputs and sensory inputs,
determined by the structure of the task (Wolpert et al., 2011). However, in the
case of motor adaptation, these adjustments are mostly temporary, limiting its
use in the clinic. In contrast, due to the durable effects of motor skill learning, this
type of learning plays a central role for post-stroke recovery and has important
implications for neurorehabilitation (Kitago and Krakauer, 2013; Krakauer, 2006).
Thus, this thesis is concerned with motor skill learning in relation to smooth
movements of the wrist.
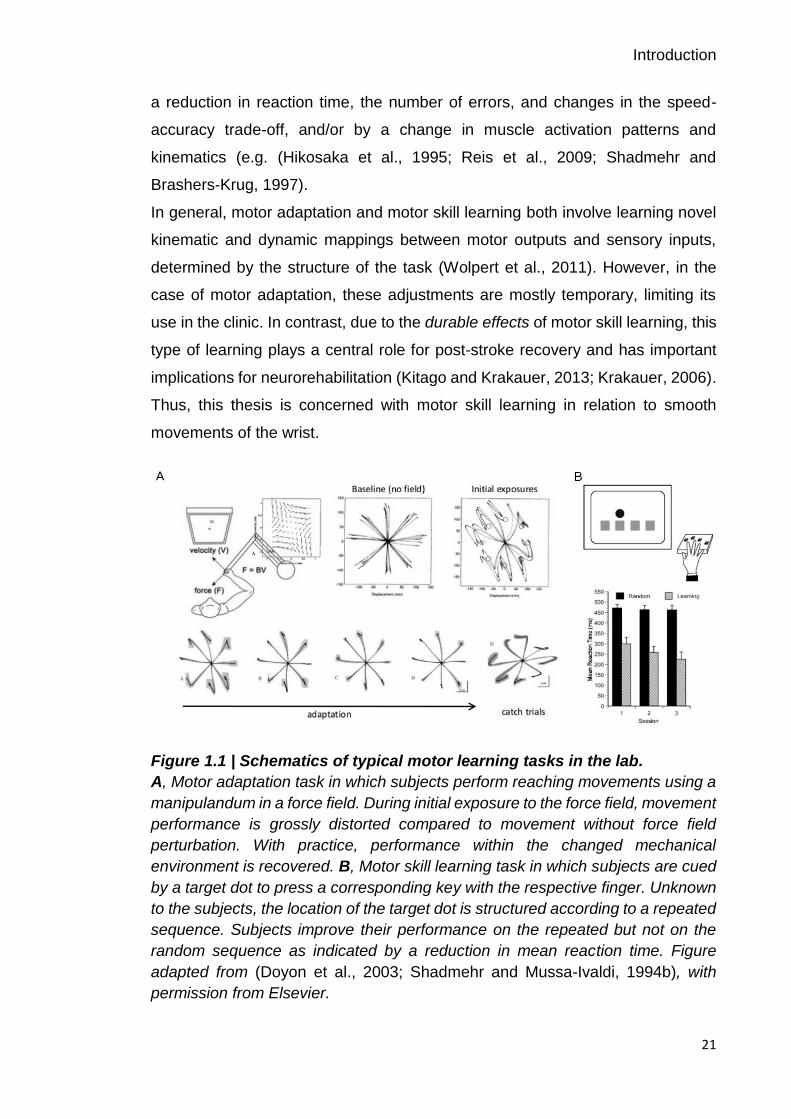
Figure 1.1 | Schematics of typical motor learning tasks in the lab.
A, Motor adaptation task in which subjects perform reaching movements using a
manipulandum in a force field. During initial exposure to the force field, movement
performance is grossly distorted compared to movement without force field
perturbation. With practice, performance within the changed mechanical
environment is recovered. B, Motor skill learning task in which subjects are cued
by a target dot to press a corresponding key with the respective finger. Unknown
to the subjects, the location of the target dot is structured according to a repeated
sequence. Subjects improve their performance on the repeated but not on the
random sequence as indicated by a reduction in mean reaction time. Figure
adapted from (Doyon et al., 2003; Shadmehr and Mussa-Ivaldi, 1994b), with
permission from Elsevier.

Introduction
22
1.1.1.1 Phases in the process of motor skill learning
The incremental acquisition of motor skills follows behaviourally relevant phases.
Initially, motor skills develop relatively fast within a single training session (fast
learning) and later more slowly, with further improvements developing
incrementally over multiple training sessions (slow learning) (Figure 1.2) (for
review see (Brashers-Krug et al., 1996a; Doyon and Benali, 2005; Doyon and
Ungerleider, 2002b; Doyon et al., 2003; Halsband and Lange, 2006; Luft and
Buitrago, 2005; Magill, 2011; Robertson et al., 2004a; Schmidt and Wrisberg,
2008b)). Of note, the relative duration of the fast and slow phases in motor
learning is highly task-specific depending on factors such as movement
complexity (Dayan and Cohen, 2011). For example, learning a simple key-press
sequence could only last minutes, while learning to play the violin may take
months, or even years.
However, in order for motor learning to be truly useful, the learned motor skill
needs to be retained, following a short or longer time delay, with or without sleep,
in which the task is not practised, commonly referred to as offline learning
(Brashers-Krug et al., 1996b; Doyon and Benali, 2005; Karni and Sagi, 1993;
Muellbacher et al., 2002; Robertson et al., 2005; Walker et al., 2002). This
process involves the consolidation of motor memories, resulting in either a
stabilization or enhancement of a motor memory encoded during practice
(Hotermans et al., 2006; Robertson et al., 2004a; Walker, 2005). In general,
enhancement refers to an increase in performance that exceeds the performance
level prior to the time delay.
However, during the initial stages of the consolidation process, motor memories
are fragile and susceptible to interference through practice of a competing task
within a certain time window. When interference occurs within the first ~6 hours
following training, for example due to learning on a competing motor task, the
consolidation of the motor memory is disrupted and thus, retention is
compromised (Brashers-Krug et al., 1996b; Karni and Sagi, 1993; Korman et al.,
2007a). Once a motor skill is mastered and the motor memory properly encoded,
it can be maintained for long periods of time (long-term retention) and readily
retrieved with reasonable performance. An additional interesting concept is the
term transfer or generalization which refers to the ability to apply a motor skill
Introduction
23
learned in a specific context to a novel task or context, thereby saving a
considerable amount of time and effort attached with the learning process.
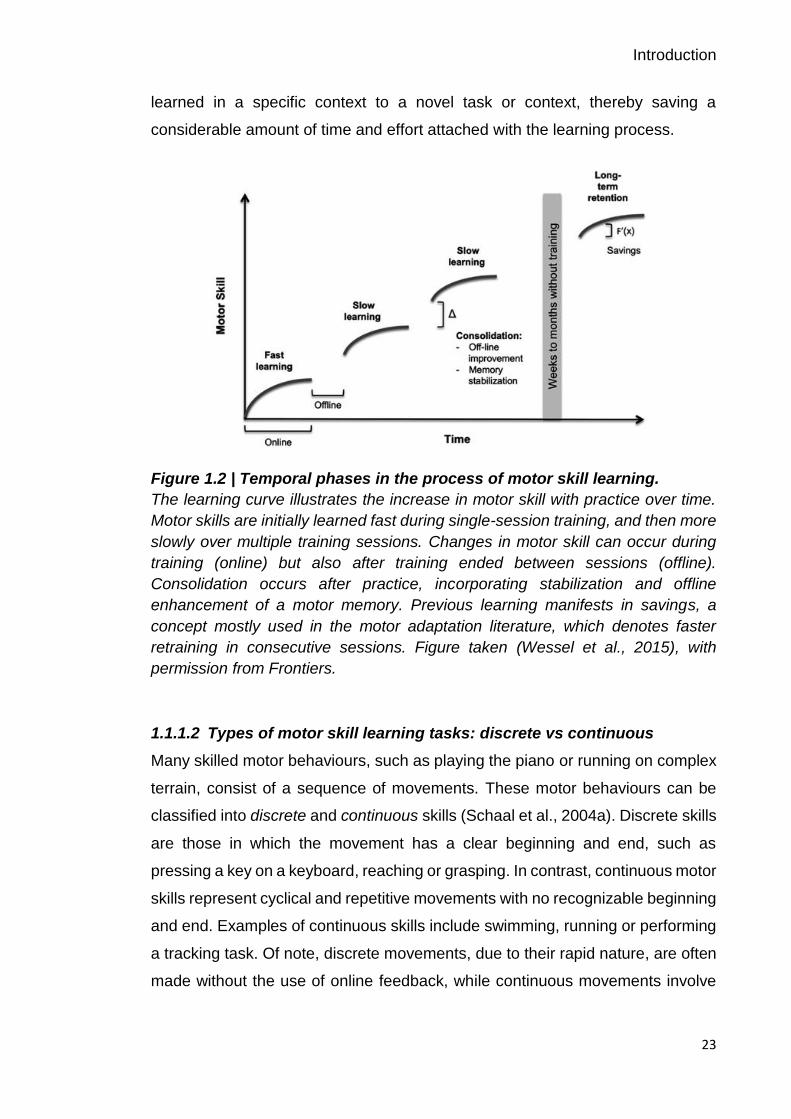
Figure 1.2 | Temporal phases in the process of motor skill learning.
The learning curve illustrates the increase in motor skill with practice over time.
Motor skills are initially learned fast during single-session training, and then more
slowly over multiple training sessions. Changes in motor skill can occur during
training (online) but also after training ended between sessions (offline).
Consolidation occurs after practice, incorporating stabilization and offline
enhancement of a motor memory. Previous learning manifests in savings, a
concept mostly used in the motor adaptation literature, which denotes faster
retraining in consecutive sessions. Figure taken (Wessel et al., 2015), with
permission from Frontiers.
1.1.1.2 Types of motor skill learning tasks: discrete vs continuous
Many skilled motor behaviours, such as playing the piano or running on complex
terrain, consist of a sequence of movements. These motor behaviours can be
classified into discrete and continuous skills (Schaal et al., 2004a). Discrete skills
are those in which the movement has a clear beginning and end, such as
pressing a key on a keyboard, reaching or grasping. In contrast, continuous motor
skills represent cyclical and repetitive movements with no recognizable beginning
and end. Examples of continuous skills include swimming, running or performing
a tracking task. Of note, discrete movements, due to their rapid nature, are often
made without the use of online feedback, while continuous movements involve

Introduction
24
the modification/correction of movements while they are being executed using
sensory feedback (Schaal et al., 2004b; Seidler et al., 2004).
Most of the studies examining motor skill learning have utilized discrete tasks
such as the classical and most established serial reaction time task (SRTT), in
which subjects perform a series of button presses (Nissen and Bullemer, 1987;
Willingham et al., 1989). Studies employing continuous tasks, commonly utilize
continuous tracking tasks, which are characterised by a moving target that
subjects attempt to follow with a device (i.e. joystick, computer mouse or other
specialised devices) via certain limb movements (Pew, 1974; Shea et al., 2001a;
Wulf and Schmidt, 1997). In both paradigms, the subject is often unaware that
the sequence of events is not random but consists of a continuous cycle of the
same (repeated) sequence embedded in random sequences (implicit learning).
Learning on both tasks is measured as either a reduction in reaction time (i.e.
SRT task, Figure 1.1B) or an improvement in tracking accuracy (i.e. tracking
task). In general, changes in performance are evident for both repeated and
random sequences; however, performance on the repeated sequence compared
to the random sequence is generally improved. Thus, not only generalized motor
components of the task are learned but also characteristics of the specific
sequence, which is typically referred to as sequence-specific learning (Wulf and
Schmidt, 1997).
Awareness about the structured nature of the repeated sequence to be learned
has emerged as an influential factor for sleep-dependent memory consolidation
as discussed later in section 1.1.1.3. Two types of awareness can be
distinguished. If awareness is explicit, participants are aware of the task
regularities, whereas if it is implicit, participants do not have conscious awareness
of the task regularities (Willingham, 1998). Few, if any tasks have purely explicit
or implicit characteristics (Shanks and St. John, 1994) and thus, the debate about
the overlap of implicit and explicit learning remains open.
1.1.1.3 Factors facilitating motor skill learning
The amount of practice on a task is generally considered the most important
factor for permanent improvements in the ability to perform a motor skill - “practice
makes perfect” as the old adage goes. This positive relationship between practice

Introduction
25
and skill has been mathematically modelled and referred to as the power law of
practice (Newell and Rosenbloom, 1980). Nevertheless, numerous studies have
proposed several factors that can facilitate and optimize the learning of motor
skills, with a strong emphasis on movement feedback, practice distribution
(massed vs distributed practice), scheduling (blocked vs random practice),
variation of motor tasks (constant vs variable practice), and sleep (Kitago and
Krakauer, 2013; Magill, 2011).
Feedback during a motor task has been shown to modulate motor skill acquisition
(for reviews see (Magill, 1994; Schmidt, 1991; Sigrist et al., 2013; Swinnen,
1996). Intrinsic feedback, in the form of sensory-perceptual information that is a
natural part of performing the skill, is indispensable for performance and learning.
Augmented or extrinsic feedback provides an addition to the normally available
task intrinsic feedback. Two types of performance-related information are
commonly used: information about the outcome of performing a skill (termed
Knowledge of Result, KR) and information about movement characteristics that
led to the outcome (termed Knowledge of Performance, KP). Typically, these
sources of information are provided after the performance of the skill, but can
also be provided during the movement. However, augmented feedback is not
necessary for learning and, under certain circumstances, can even be detrimental
(i.e. erroneous feedback or concurrent feedback when it distracts attention away
from intrinsic feedback), highlighting the necessity of designing valuable
feedback in order to motivate, reinforce and speed up learning. Thus, when
designing a motor learning experiment, variables such as the type of feedback,
which performance-related information to provide, and timing and frequency of
feedback need to be considered.
Although practice is the most effective way of improving performance during
training, the structure of practice influences long-term retention of motor skills.
Distributing practice sessions across days, thereby introducing rest periods, has
consistently been shown to be beneficial for motor skill learning as compared to
massed practice, where learning is crammed into one long session without
breaks (e.g. (Arthur et al., 2010; Dail and Christina, 2004; Shea et al., 2000)), for
review see (Smith and Scarf, 2017)). This effect termed distributed-practice or
spacing effect has been known for more than a century (Ebbinghaus, 1885), with

Introduction
26
memory consolidation taking place over periods of rest and sleep between
sessions, which is thought to be the mechanism underlying the performance-
enhancing impact of the spacing effect. The influence of practice structure on
memory consolidation and retention of acquired motor skills also has potential
clinical applications for improving neurorehabilitative interventions after brain
injury (for review see e.g. (Muratori et al., 2013). Several studies have further
shown that introducing task variability during practice improves retention (e.g.
(Moxley, 1979; Shea and Kohl, 1990; Wulf and Schmidt, 1997)). In addition,
practice under interleaved or random practice order degrades performance
during the acquisition phase, but it results in superior retention and transfer
performance compared to blocked practice schedules. This rather
counterintuitive phenomenon is referred to as contextual interference (CI),
describing the beneficial effect of interference during practice for skill learning
(Magill and Hall, 1990; Shea and Morgan, 1979). However, it should be noted
that practice under conditions of high contextual interference (i.e. random
practice order), where practice takes place on a variety of tasks makes the
identification of the cause of performance improvements challenging.
In recent years, a growing literature has suggested that sleep plays a crucial role
in learning and memory consolidation across a variety of skill domains, with a
wide belief that it benefits memory consolidation (for reviews see (Diekelmann
and Born, 2010; Stickgold et al., 2001)). Evidence that a night of sleep triggers
performance improvements, whereas an equivalent period of wakefulness merely
leads to performance stabilization, mainly stems from studies employing explicit
motor-sequence learning tasks (Korman et al., 2007; Walker et al., 2002).
Notably, the process of sleep-dependent consolidation appears to be reduced
with ageing (Brown et al., 2009; Spencer et al., 2007; Wilson et al., 2012), most
likely due to age-related changes in sleep patterns (Ohayon et al., 2004). Some
studies, however, claim that the observed sleep-dependent performance
enhancement is an artefact of the study design and is no longer evident when
controlling for confounding factors such as fatigue and reactive inhibition (Brawn
et al., 2010; Nettersheim et al., 2015; Rickard et al., 2008).
Notably, sleep does not appear to be beneficial for learning of implicit motor-
sequence tasks (Al-Sharman and Siengsukon, 2014; Robertson et al., 2004b;
Introduction
27
Siengsukon and Al-sharman, 2011), implying a modulatory effect of an
individual’s awareness of learning a new skill on the benefits of sleep. The role of
sleep in consolidating motor memories further has implications in clinical settings
as stroke patients have shown sleep-dependent improvements in motor
performance for both implicit and explicit motor learning (Siengsukon and Boyd,
2009, 2008; Siengsukon et al., 2015).
Together, these and other factors should be taken into account when designing
learning studies in order to maximise motor learning in healthy adults and, in the
context of stroke-related brain damage, may have consequences for movement
rehabilitation, which depends on motor learning and consolidation.
1.1.2 Neural correlates of motor skill learning
Over the past few years, a plethora of animal and neuroimaging studies have
demonstrated that several brain structures, including sensorimotor networks and
higher-order associative networks, are critical for the acquisition and/or retention
of skilled motor behaviour (e.g. (Dayan and Cohen, 2011; Doyon and Benali,
2005; Doyon and Ungerleider, 2002a; Doyon et al., 2003; Floyer-Lea, 2005;
Grafton et al., 1992; Sanes and Donoghue, 2000)). In humans, the neural
substrates of the fast and slow components of motor learning have been studied
with functional magnetic resonance imaging (fMRI) and positron emission
tomography (PET). These methods measure task-related modulations of blood
oxygenation level-dependent (BOLD) signals or regional cerebral blood flow
(rCBF), thereby providing indirect measures of cortical activity.
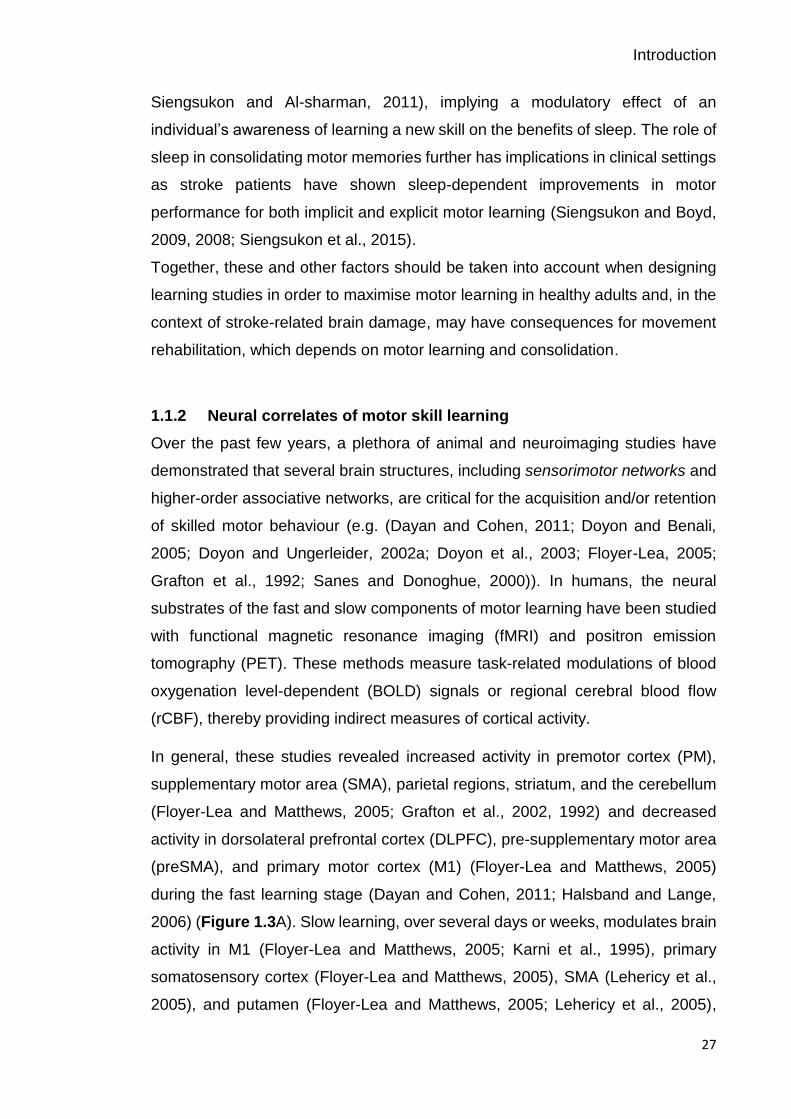
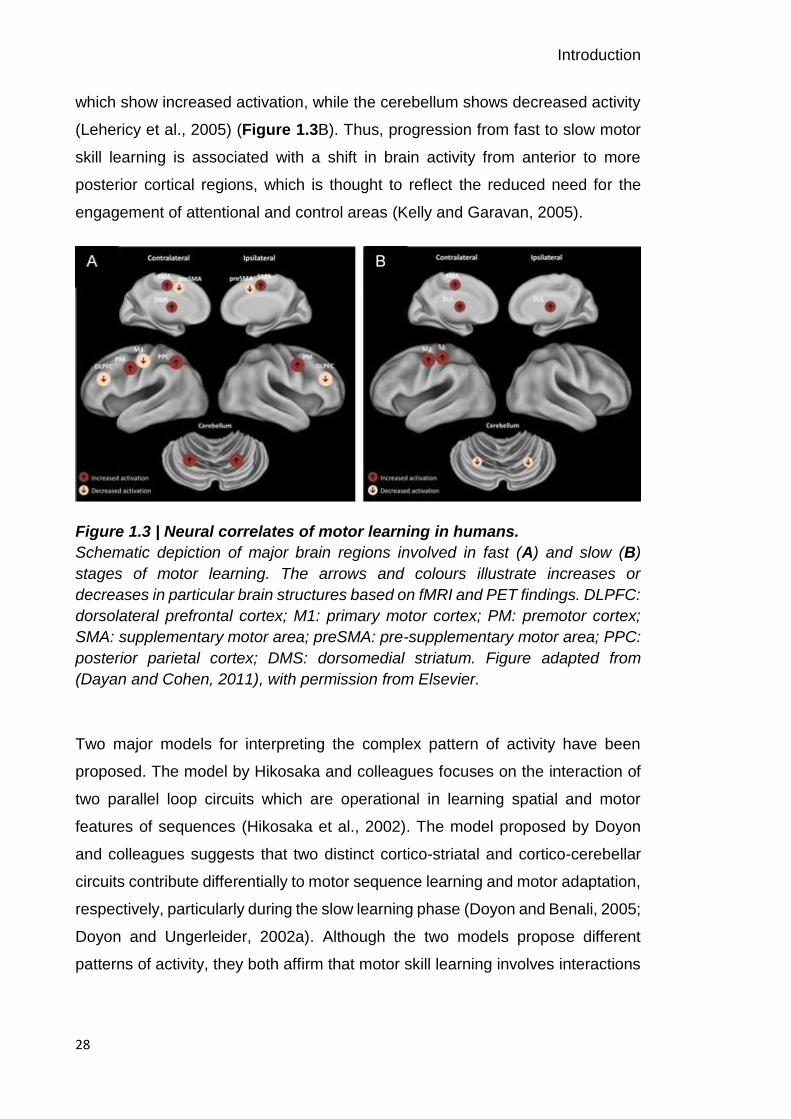
In general, these studies revealed increased activity in premotor cortex (PM),
supplementary motor area (SMA), parietal regions, striatum, and the cerebellum
(Floyer-Lea and Matthews, 2005; Grafton et al., 2002, 1992) and decreased
activity in dorsolateral prefrontal cortex (DLPFC), pre-supplementary motor area
(preSMA), and primary motor cortex (M1) (Floyer-Lea and Matthews, 2005)
during the fast learning stage (Dayan and Cohen, 2011; Halsband and Lange,
2006) (Figure 1.3A). Slow learning, over several days or weeks, modulates brain
activity in M1 (Floyer-Lea and Matthews, 2005; Karni et al., 1995), primary
somatosensory cortex (Floyer-Lea and Matthews, 2005), SMA (Lehericy et al.,
2005), and putamen (Floyer-Lea and Matthews, 2005; Lehericy et al., 2005),
Introduction
28
which show increased activation, while the cerebellum shows decreased activity
(Lehericy et al., 2005) (Figure 1.3B). Thus, progression from fast to slow motor
skill learning is associated with a shift in brain activity from anterior to more
posterior cortical regions, which is thought to reflect the reduced need for the
engagement of attentional and control areas (Kelly and Garavan, 2005).
Figure 1.3 | Neural correlates of motor learning in humans.
Schematic depiction of major brain regions involved in fast (A) and slow (B)
stages of motor learning. The arrows and colours illustrate increases or
decreases in particular brain structures based on fMRI and PET findings. DLPFC:
dorsolateral prefrontal cortex; M1: primary motor cortex; PM: premotor cortex;
SMA: supplementary motor area; preSMA: pre-supplementary motor area; PPC:
posterior parietal cortex; DMS: dorsomedial striatum. Figure adapted from
(Dayan and Cohen, 2011), with permission from Elsevier.
Two major models for interpreting the complex pattern of activity have been
proposed. The model by Hikosaka and colleagues focuses on the interaction of
two parallel loop circuits which are operational in learning spatial and motor
features of sequences (Hikosaka et al., 2002). The model proposed by Doyon
and colleagues suggests that two distinct cortico-striatal and cortico-cerebellar
circuits contribute differentially to motor sequence learning and motor adaptation,
respectively, particularly during the slow learning phase (Doyon and Benali, 2005;
Doyon and Ungerleider, 2002a). Although the two models propose different
patterns of activity, they both affirm that motor skill learning involves interactions

Introduction
29
between cortical and subcortical circuits associated with cognitive and control
functions, which are important for motor skill learning.
1.1.3 Role of M1 in motor skill learning: acquisition and consolidation
As discussed above, motor learning is associated with activity in a distributed
network of cortical structures, including sensorimotor and higher-order
associative brain areas. However, non-invasive brain stimulation (NIBS) methods
have been used to investigate the functional role of particular brain regions in
motor learning, and most have focused on M1, a key structure in the control of
voluntary movements. Given this premise and the fact that motor deficits are
amongst the most common impairments after stroke-related brain damage, the
motor system is the focus of the current work.
Studies employing transcranial magnetic stimulation (TMS) were able to
associate different aspects of motor learning with M1, e.g. acquisition and
consolidation of motor skills (Muellbacher et al., 2002; Pascual-Leone et al.,
1994). For example, synchronous application of single pulse TMS, a procedure
that stimulates neurons in a small area underneath the coil, over M1 engaged in
thumb abduction learning resulted in enhanced motor memory encoding and
longevity (Butefisch, 2004). Importantly, this effect was specific to the
synchronous Hebbian stimulation of M1 that drives the training motions and was
not evident when TMS was applied between movements.
An influential study conducted by Muellbacher and colleagues further
demonstrated that the role of M1 in consolidation can dissociate from initial motor
skill acquisition (Muellbacher et al., 2002). By applying repetitive transcranial
magnetic stimulation (rTMS), a procedure that interferes with cortical functioning,
to M1, they showed that retention of behavioural improvements on a thumb-to-
finger opposition task was disrupted when applied immediately after training. The
disruptive effect was specific for M1 in a time-dependent manner as rTMS applied
6 hours after practice or to other cortical areas such as DLPFC did not impact
retention (Figure 1.4). These findings highlight the involvement of M1 during the
early stage of motor consolidation. Also, rTMS applied over M1 immediately after
practice of a SRTT degrades over-day but not overnight improvements, indicative
Introduction
30
of different consolidation processes relating in a different manner to M1 and a
role of sleep in rescuing memories (Robertson et al., 2005).
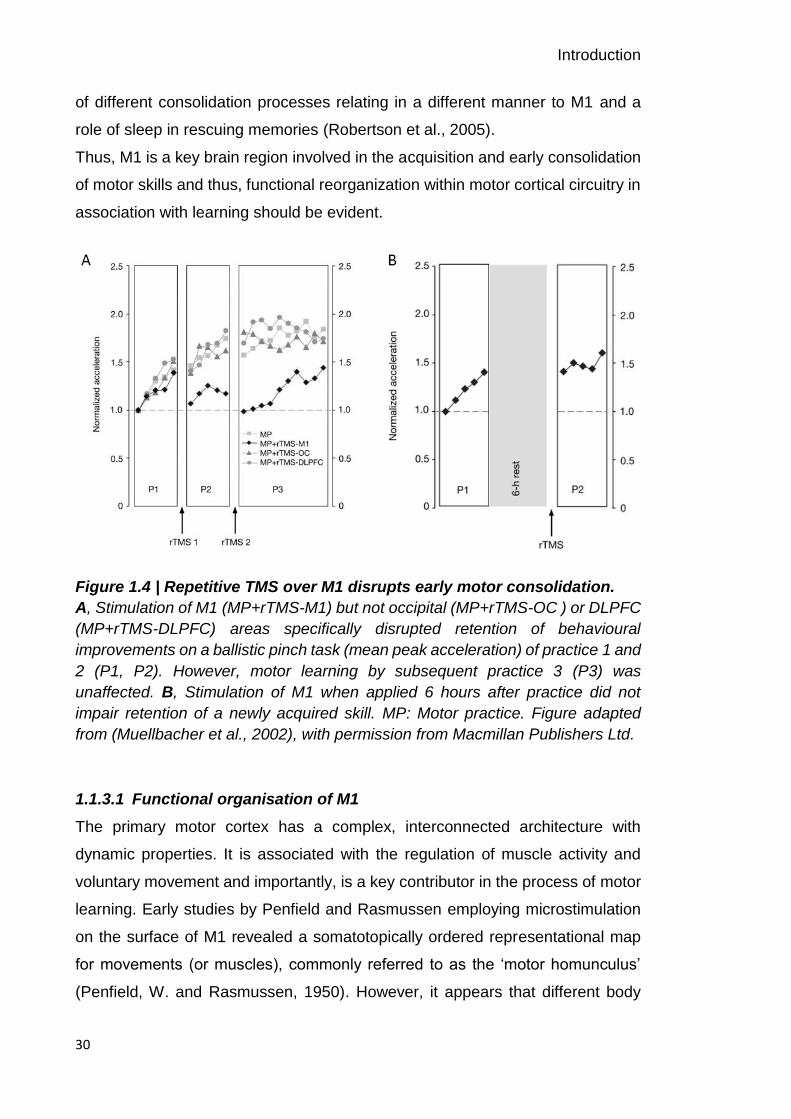
Thus, M1 is a key brain region involved in the acquisition and early consolidation
of motor skills and thus, functional reorganization within motor cortical circuitry in
association with learning should be evident.
Figure 1.4 | Repetitive TMS over M1 disrupts early motor consolidation.
A, Stimulation of M1 (MP+rTMS-M1) but not occipital (MP+rTMS-OC ) or DLPFC
(MP+rTMS-DLPFC) areas specifically disrupted retention of behavioural
improvements on a ballistic pinch task (mean peak acceleration) of practice 1 and
2 (P1, P2). However, motor learning by subsequent practice 3 (P3) was
unaffected. B, Stimulation of M1 when applied 6 hours after practice did not
impair retention of a newly acquired skill. MP: Motor practice. Figure adapted
from (Muellbacher et al., 2002), with permission from Macmillan Publishers Ltd.
1.1.3.1 Functional organisation of M1
The primary motor cortex has a complex, interconnected architecture with
dynamic properties. It is associated with the regulation of muscle activity and
voluntary movement and importantly, is a key contributor in the process of motor
learning. Early studies by Penfield and Rasmussen employing microstimulation
on the surface of M1 revealed a somatotopically ordered representational map
for movements (or muscles), commonly referred to as the ‘motor homunculus’
(Penfield, W. and Rasmussen, 1950). However, it appears that different body
Introduction
31
parts show a distributed representation with extensive overlap, with a system of
horizontal connections functionally associating motor cortex neurons into
dynamically structured assemblies (Sanes and Donoghue, 2000). These
organizational principles of motor representations have important consequences
for motor learning as well as recovery after stroke as they provide a basis for
flexible reorganization of networks as discussed in the next section.
1.2 The interaction of motor learning with brain plasticity
Over the last two decades, neuroimaging and non-invasive brain stimulation in
humans coupled with insights from animal studies have demonstrated that the
acquisition of motor skills is associated with significant neural plasticity within the
brain (e.g. (Dayan and Cohen, 2011; Doyon and Benali, 2005)). While previously
thought to be a physiologically static organ, these findings have advanced the
idea that the neural circuitry as well as the functional properties of neurons within
different brain areas are malleable and retain a degree of plasticity throughout life
(e.g. (Bavelier et al., 2010; Hensch, 2005)). In particular, changes within M1 have
been evidenced to make fundamental contributions to learning and remembering
of motor skills. In the following section, I thus focus on plasticity, here defined as
“changes in the strength of synaptic connections in response to either an
environmental stimulus or an alteration in synaptic activity in a network” (Murphy
and Corbett, 2009a), within the primary motor cortex in the context of motor
learning. Neural plasticity has been shown to be induced not only in response to
practice and experience, but also as a result of pathological changes such as
stroke, which will be discussed in detail later in this thesis (see section 1.3.2).
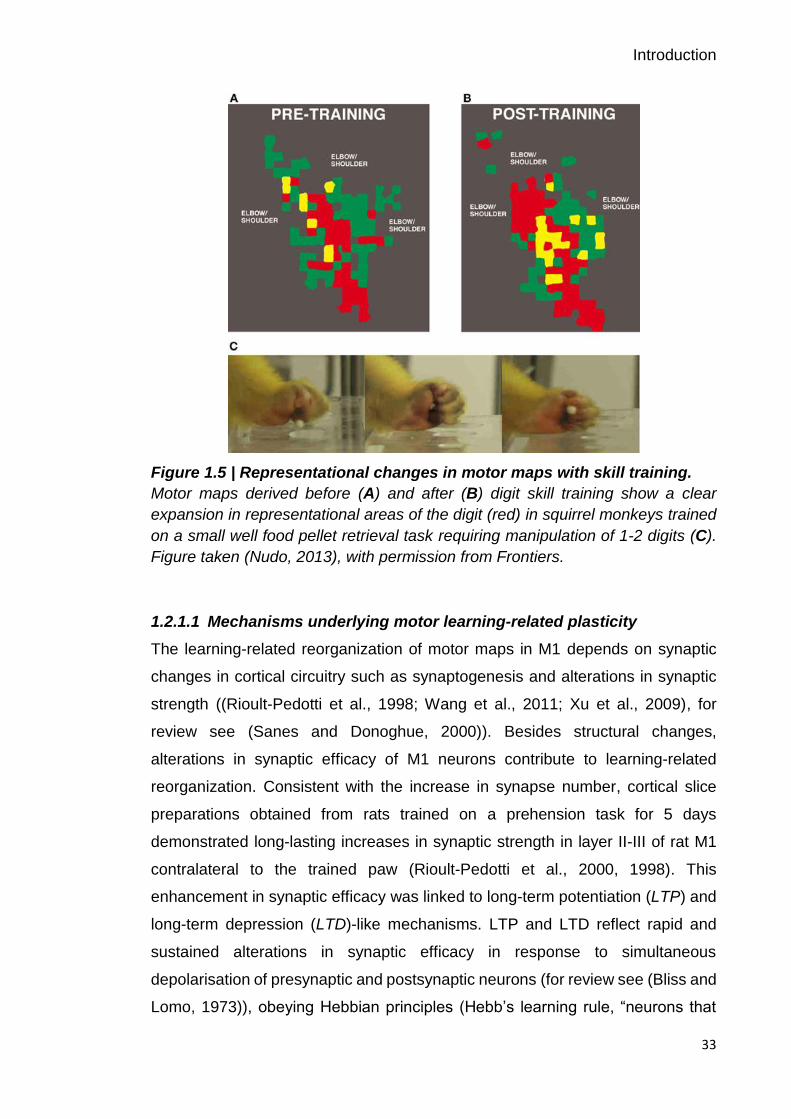
1.2.1 Motor learning-related plasticity in M1
The brain’s capacity for motor learning induced cortical reorganization of M1 has
been observed in various animal models and in humans. Adult rats trained on a
prehension task that requires animals to reach for and grasp a food pellet show
an expansion of forelimb movement representations (evoked with
microstimulation) within motor cortex (Kleim et al., 1998). Similar expansions of
finger representations with digit training, at the expense of wrist and forearm
representations, were evidenced in squirrel monkeys (Figure 1.5) (Nudo and

Introduction
32
Milliken, 1996), demonstrating a dynamic relationship between motor skill
learning and motor cortical plasticity. It is important to note that reorganization of
motor maps is not simply due to repetitive activity of muscle groups involved in
movement execution but is specific to the trained task (Kleim et al., 1998; Molina-
Luna et al., 2008; Plautz et al., 2000). For example, simple lever pressing in rats
(Kleim et al., 1998) and repetitive performance of digit movements (~13,000
movements) in squirrel monkeys (Plautz et al., 2000) was insufficient to drive
changes in M1 motor maps.
Consistently, in humans, imaging studies using PET (Grafton et al., 2002, 1992)
or fMRI (Karni et al., 1995) and functional testing with TMS (Pascual-Leone et al.,
1995, 1994) have demonstrated reorganizational changes in M1 with motor skill
learning. Structural changes in grey matter have also been reported in individuals
with highly developed motor skills (Draganski et al., 2004). Taken together, these
studies imply that changes in motor cortex representations are specific for the
trained skill and confined to the cortical area involved in the movement.
Understanding the mechanisms that mediate such plastic changes is
fundamental in order to exploit the brain’s capacity for learning induced
reorganization.
Introduction
33
Figure 1.5 | Representational changes in motor maps with skill training.
Motor maps derived before (A) and after (B) digit skill training show a clear
expansion in representational areas of the digit (red) in squirrel monkeys trained
on a small well food pellet retrieval task requiring manipulation of 1-2 digits (C).
Figure taken (Nudo, 2013), with permission from Frontiers.
1.2.1.1 Mechanisms underlying motor learning-related plasticity
The learning-related reorganization of motor maps in M1 depends on synaptic
changes in cortical circuitry such as synaptogenesis and alterations in synaptic
strength ((Rioult-Pedotti et al., 1998; Wang et al., 2011; Xu et al., 2009), for
review see (Sanes and Donoghue, 2000)). Besides structural changes,
alterations in synaptic efficacy of M1 neurons contribute to learning-related
reorganization. Consistent with the increase in synapse number, cortical slice
preparations obtained from rats trained on a prehension task for 5 days
demonstrated long-lasting increases in synaptic strength in layer II-III of rat M1
contralateral to the trained paw (Rioult-Pedotti et al., 2000, 1998). This
enhancement in synaptic efficacy was linked to long-term potentiation (LTP) and
long-term depression (LTD)-like mechanisms. LTP and LTD reflect rapid and
sustained alterations in synaptic efficacy in response to simultaneous
depolarisation of presynaptic and postsynaptic neurons (for review see (Bliss and
Lomo, 1973)), obeying Hebbian principles (Hebb’s learning rule, “neurons that
Introduction
34
fire together, wire together”, (Hebb, 1949)). Interestingly, learning-induced LTP is
associated with temporary occlusion of the ability to induce LTP in the trained
hemisphere (but not in the untrained hemisphere) which is thought to be mediated
by the saturation of synaptic modification (Rioult-Pedotti et al., 2007, 2000, 1998).
Similar results were obtained in an in vivo animal model introduced by Monfils
and colleagues (Monfils and Teskey, 2004).
Corroborative evidence that motor skill learning is associated with LTP-like
plasticity has been obtained in humans using non-invasive brain stimulation
techniques (Cantarero et al., 2013; Rosenkranz et al., 2007; Stefan et al., 2006;
Ziemann et al., 2004). These studies provide direct evidence for synaptic
modifications in M1 circuitry accompanying acquisition of a new motor skill
through mechanisms of motor cortical LTP, and imply that M1 is a dynamic
substrate for motor learning (Sanes and Donoghue, 2000).
At the molecular level, substantial evidence supports the idea that the modulation
of gamma-aminobutyric acid (GABA), the major inhibitory neurotransmitter in the
adult brain, is necessary for synaptic changes in M1 associated with motor
learning (Clarkson et al., 2010; Hess et al., 1996; Sanes and Donoghue, 2000;
Trepel and Racine, 2000). In particular, a decrease in GABAergic inhibitory
activity is essential for LTP-like plasticity to occur within M1. For example, focal
application of the GABA antagonist bicuculline facilitates LTP-like activity
(Castro-Alamancos et al., 1995) and unmasks existing horizontal connections in
M1 in animal models (Jacobs and Donoghue, 1991). While a reduction in
GABAergic inhibition facilitates the ability to induce LTP-like plasticity, preventing
a decrease in GABA prohibits LTP-like plasticity (Castro-Alamancos et al., 1995;
Trepel and Racine, 2000), thereby highlighting the importance of the balance
between cortical excitatory and inhibitory processes within M1 circuits for motor
learning-related plasticity.
Evidence implying that changes in the balance between excitation and inhibition
determine motor cortex plasticity in humans comes from pharmacological
elevation of GABA levels with lorazepam which results in suppression of use-
dependent plasticity in motor cortex (Buetefisch et al., 2000; Pleger et al., 2003).
In addition, magnetic resonance spectroscopy (MRS) studies demonstrated a
reduction in M1 GABA concentration during short-term learning of a visuo-motor

Introduction
35
tracking task, with the decrease in GABA being specific to motor learning and not
evident in response to a task without a learning component (Floyer-Lea et al.,
2006). Consistent with this role of GABA, individual differences in the
responsiveness of the GABA system have recently been linked to the degree to
which subjects learnt on a motor sequence task (Stagg et al., 2011a). Specifically,
subjects who showed greater learning of the task also showed a greater decrease
in their GABA levels in response to M1 stimulation, suggesting that the intrinsic
ability to decrease GABA within the cortex is important for the early phase of
motor learning and might, at least partly, explain individual differences in the
ability to learn new motor skills.
In summary, these findings strongly support the hypothesis that modulations of
GABAergic inhibition are essential for the induction of motor cortical plasticity
observed with motor learning and, therefore represent targets for promoting the
capacity for motor learning in the intact brain, and importantly in patients with
motor impairments due to brain damage.
1.2.1.2 Non-invasive brain stimulation can facilitate motor learning
As discussed previously (see section 1.1.3), non-invasive brain stimulation
methods have been used to explore the functional role of M1 during initial motor
learning and consolidation (Muellbacher et al., 2002; Robertson et al., 2005). In
addition, cortical excitability and LTP-like plasticity can be modulated using NIBS
techniques and thus, may be utilized in order to promote motor skill acquisition
and subsequent retention. If the modulation of cortical GABAergic activity is
necessary for plasticity and human motor learning to occur, NIBS protocols
should modulate learning.
Transcranial direct current stimulation (tDCS) allows the transient modulation of
cortical excitability in a polarity-specific manner. Anodal tDCS delivered over M1
has been shown to decrease GABA levels (Stagg et al., 2011a, 2009), thus
leading to an increase in cortical excitability and improved performance on a
variety of motor learning tasks (Antal et al., 2004; Nitsche et al., 2003; Reis et al.,
2009; Stagg et al., 2011a; Tecchio et al., 2010; Vines et al., 2006). In contrast,
cathodal tDCS appears to have no effect on learning (Nitsche et al., 2003; Reis
et al., 2009). However, the timing of the application of tDCS relative to motor
Introduction
36
learning has a differential effect since it exhibits a facilitatory effect only when
applied during the motor task. If applied prior to training on a motor task, learning
can be unchanged (Kuo et al., 2008) or actually be slowed (Stagg et al., 2011a).
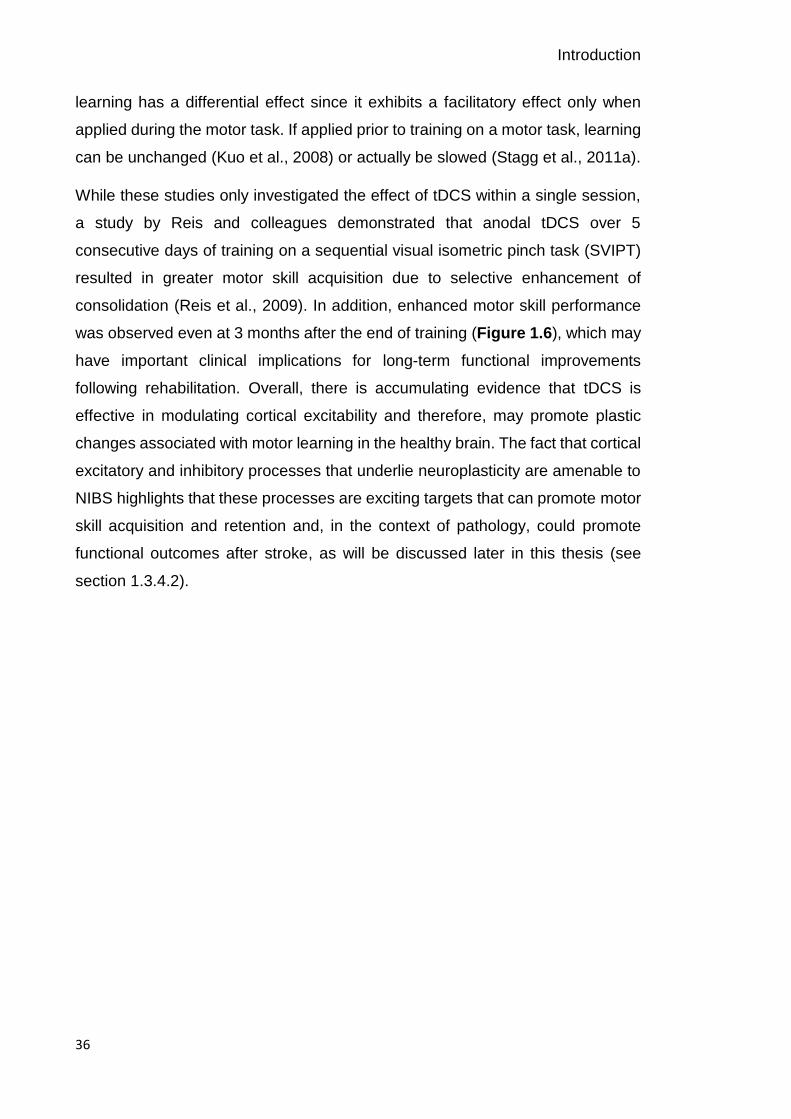
While these studies only investigated the effect of tDCS within a single session,
a study by Reis and colleagues demonstrated that anodal tDCS over 5
consecutive days of training on a sequential visual isometric pinch task (SVIPT)
resulted in greater motor skill acquisition due to selective enhancement of
consolidation (Reis et al., 2009). In addition, enhanced motor skill performance
was observed even at 3 months after the end of training (Figure 1.6), which may
have important clinical implications for long-term functional improvements
following rehabilitation. Overall, there is accumulating evidence that tDCS is
effective in modulating cortical excitability and therefore, may promote plastic
changes associated with motor learning in the healthy brain. The fact that cortical
excitatory and inhibitory processes that underlie neuroplasticity are amenable to
NIBS highlights that these processes are exciting targets that can promote motor
skill acquisition and retention and, in the context of pathology, could promote
functional outcomes after stroke, as will be discussed later in this thesis (see
section 1.3.4.2).

Introduction
37
Figure 1.6 | Effect of tDCS on extended time course of motor skill learning.
A, The cortical target for tDCS over left M1 was determined using TMS. Subjects
trained over 5 consecutive days on the SVIPT, with 20 min of anodal or sham
tDCS applied over M1. Retention of skill was tested at 5 follow-up sessions (day
8, day 15, day 29, day 57, and day 85). B, Learning curves for the sham (white
diamond) and anodal tDCS (grey square) groups. While both groups started with
comparable skills at the beginning of day 1, the anodal tDCS group showed
greater skill acquisition over the course of training than the sham group. C, Skill
remained superior with anodal tDCS (grey square) compared to sham (white
diamond) at all time points over a 3-month follow-up period. Figure adapted (Reis
et al., 2009), with permission from National Academy of Sciences.
1.3 Recovery from stroke through plasticity and motor learning
The consequences of stroke are often devastating, with the majority of stroke
survivors suffering from persistent motor deficits. Stroke recovery is a complex
process. A substantial amount of work in animals has been undertaken to
elucidate the molecular and cellular events that underlie the profound structural
and functional reorganization that occurs during the first weeks and months after
focal brain injury (for review see e.g. (Cramer, 2008; Krakauer et al., 2012;

Introduction
38
Murphy and Corbett, 2009)). Evidence from these studies suggest a time-limited
window of heightened neural plasticity early post-stroke during which most
recovery from impairment occurs due to spontaneous biological recovery and
increased responsiveness to motor training. The presence of a critical period of
plasticity thus advocates for the delivery of behavioural training early after stroke,
but many stroke patients nevertheless continue to improve in the chronic phase.
Post-stroke recovery and rehabilitation rely on mechanisms of learning and
neural plasticity (Krakauer, 2006) and thus, understanding the underlying neural
processes enabling both, are of great interest for optimizing the timing, intensity
and amount of post-stroke rehabilitation in order to maximise patient outcomes
(Kitago and Krakauer, 2013; Krakauer, 2006).
1.3.1 The burden of stroke
Stroke is a major global health problem, being the second most common cause
of death and the leading cause of long-term physical disability worldwide (Figure
1.7) (Feigin, 2016; Feigin et al., 2014; World Health Organization, 2010).
Although rates of stroke mortality are declining worldwide, a growing number of
people will have to cope with the consequences of stroke. Because of this and
demographic changes (i.e. ageing of the population and health transitions in
developing countries), the global socio-economic burden of stroke is likely to grow
in the future, with a predicted rise in stroke survivors from 25 million in 2013 to 70
million by 2030 (Feigin, 2016; Feigin et al., 2014). The majority of strokes are
ischaemic in origin and result in sensorimotor impairments. Cognitive
impairments are evident as well in patients with stroke. Loss of function is due to
death of neurons in the infarcted tissue and cell dysfunction in the surrounding
areas. Recovery from stroke is often incomplete, with ~80% of stroke survivors
experiencing motor impairments on one side of the body, which leave them
incapable of performing daily activities and thus, dependent on others for their
care (Langhorne et al., 2009). In particular, recovery of upper limb function is
unacceptably poor and a major contributor to reduced quality of life (Kwakkel et
al., 2003; Nakayama et al., 1994; Raghavan, 2015). Thus, more effective stroke
rehabilitation to maximise recovery and long-term outcomes is an important
clinical and scientific goal.

Introduction
39
Figure 1.7 | The top 10 causes of death world-wide in 2015.
Stroke is the second most common cause of death after heart diseases,
accounting for a combined 15 million deaths in 2015. Cause group: yellow:
communicable, maternal, perinatal, and nutritional conditions; blue: non-
communicable diseases; green: injuries. Figure taken from (World Health
Organization, 2016).
1.3.2 Individual differences in motor recovery after stroke
Motor recovery after stroke, the improvement in movement ability over time, is
complex and variable across patients, making accurate predictions of motor
recovery and treatment response difficult (Prabhakaran et al., 2015; Stinear,
2010). Of note, improvement in movement ability after stroke can be achieved

Introduction
40
through either true recovery or compensation. The first refers to the restitution of
the same motor patterns as before injury, while the latter denotes the
performance of a movement using alternative motor patterns compared to the
pre-morbid state (Levin et al., 2009). For example, a patient with hand weakness
can reacquire the ability to use a touchpad through regaining normal movement
patterns of the affected hand, through use of alternative muscles of the affected
hand, or through learning to use the unaffected hand. Despite differences in the
underlying neuronal mechanisms, they both require learning (Kitago and
Krakauer, 2013). In this thesis, the term recovery is used without a formal
distinction between the mechanisms of true recovery and compensation;
however, it is important to note that the motor learning task employed here did
not allow for compensation-related improvements.
A commonly cited factor influencing long-term functional recovery is the initial
degree of motor impairment, which is quantified by the proportional recovery rule
(Kwakkel et al., 2003; Prabhakaran et al., 2015). In general, patients with mild-
to-moderate deficits are predicted to regain 70 % of their initially lost function by
3 months after stroke, but this proportional relationship does not apply for patients
who present with high initial severity. Within this patient subgroup, roughly 50 %
of patients have good (proportional) recovery, whereas no substantial recovery
is seen in the other half (Figure 1.8). The reasons for this clinical phenomenon
are unclear, but understanding the underlying neurophysiological processes and
identifying factors that are important for recovery would be instrumental in
providing novel therapeutic targets for improving post-stroke recovery.
Introduction
41
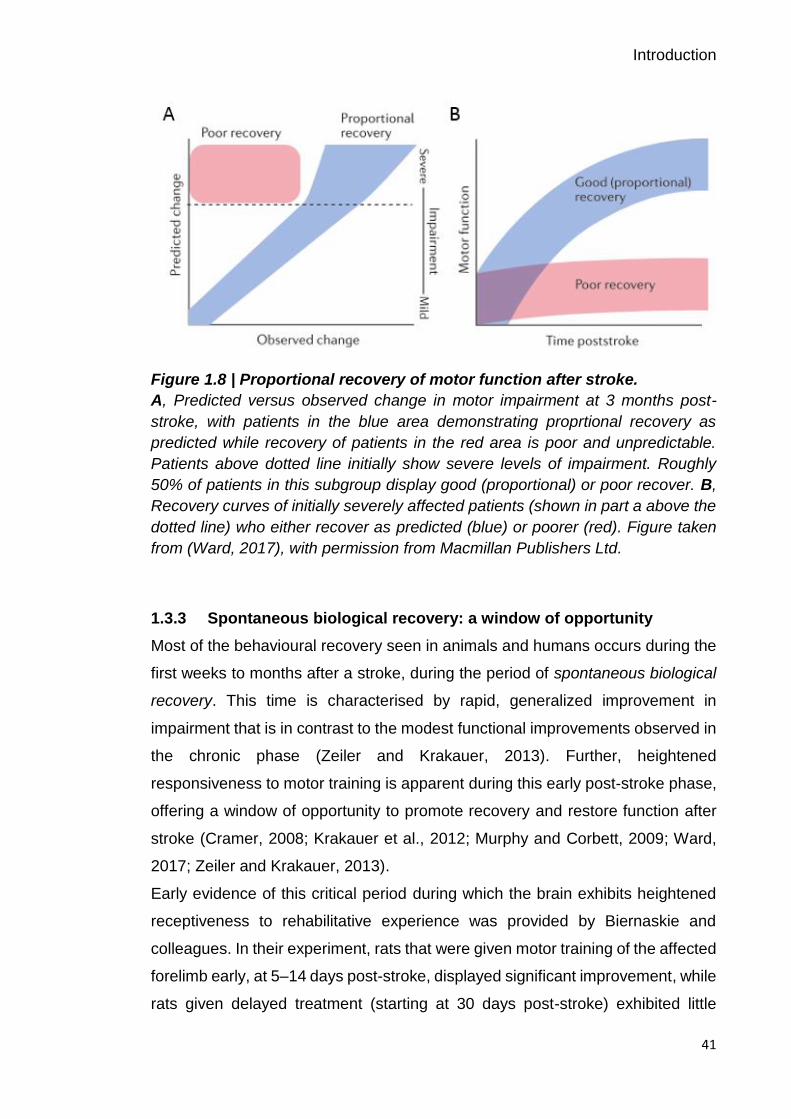
Figure 1.8 | Proportional recovery of motor function after stroke.
A, Predicted versus observed change in motor impairment at 3 months post-
stroke, with patients in the blue area demonstrating proprtional recovery as
predicted while recovery of patients in the red area is poor and unpredictable.
Patients above dotted line initially show severe levels of impairment. Roughly
50% of patients in this subgroup display good (proportional) or poor recover. B,
Recovery curves of initially severely affected patients (shown in part a above the
dotted line) who either recover as predicted (blue) or poorer (red). Figure taken
from (Ward, 2017), with permission from Macmillan Publishers Ltd.
1.3.3 Spontaneous biological recovery: a window of opportunity
Most of the behavioural recovery seen in animals and humans occurs during the
first weeks to months after a stroke, during the period of spontaneous biological
recovery. This time is characterised by rapid, generalized improvement in
impairment that is in contrast to the modest functional improvements observed in
the chronic phase (Zeiler and Krakauer, 2013). Further, heightened
responsiveness to motor training is apparent during this early post-stroke phase,
offering a window of opportunity to promote recovery and restore function after
stroke (Cramer, 2008; Krakauer et al., 2012; Murphy and Corbett, 2009; Ward,
2017; Zeiler and Krakauer, 2013).
Early evidence of this critical period during which the brain exhibits heightened
receptiveness to rehabilitative experience was provided by Biernaskie and
colleagues. In their experiment, rats that were given motor training of the affected
forelimb early, at 5–14 days post-stroke, displayed significant improvement, while
rats given delayed treatment (starting at 30 days post-stroke) exhibited little
Introduction
42
recovery (Biernaskie et al., 2004). Although the debate about the optimal timing
of rehabilitation continues (Kozlowski et al., 1996; Risedal et al., 1999), these
results, together with recent clinical findings (Horn et al., 2005; Salter et al., 2006),
lend strong support to the existence of an early post-stroke phase of heightened
brain plasticity which interacts with types of behavioural training, and advocates
that early initiation of rehabilitation is more effective.
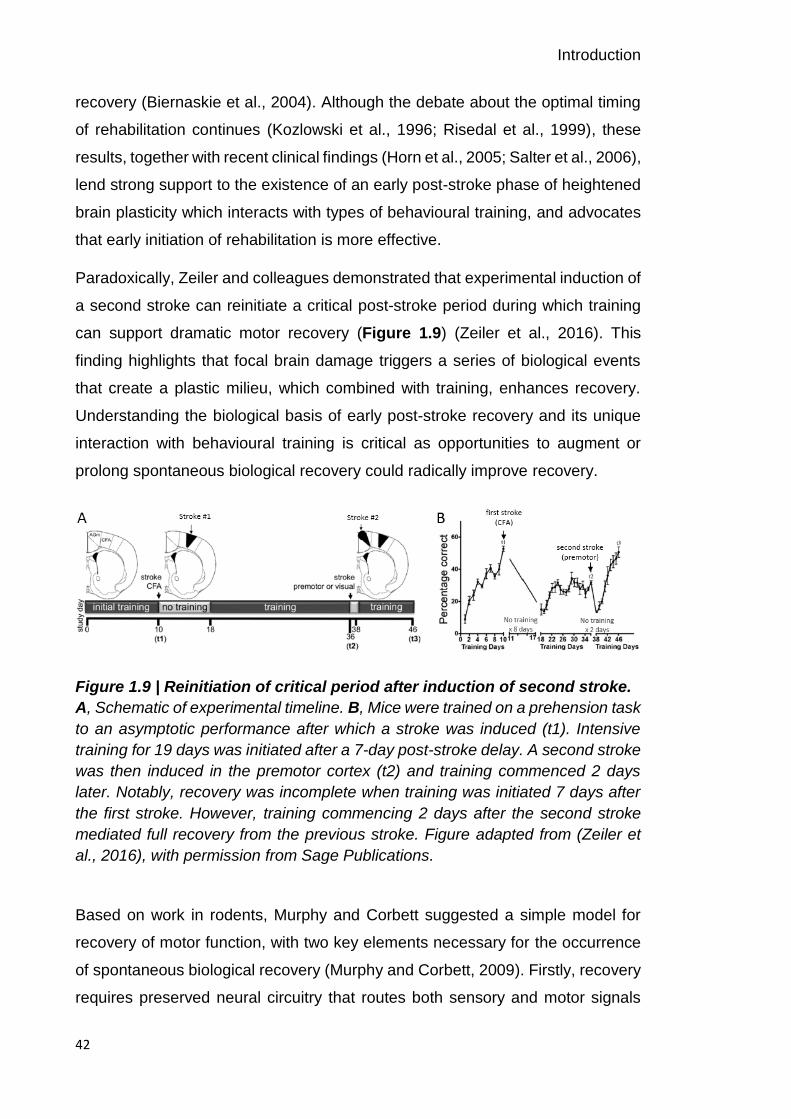
Paradoxically, Zeiler and colleagues demonstrated that experimental induction of
a second stroke can reinitiate a critical post-stroke period during which training
can support dramatic motor recovery (Figure 1.9) (Zeiler et al., 2016). This
finding highlights that focal brain damage triggers a series of biological events
that create a plastic milieu, which combined with training, enhances recovery.
Understanding the biological basis of early post-stroke recovery and its unique
interaction with behavioural training is critical as opportunities to augment or
prolong spontaneous biological recovery could radically improve recovery.
Figure 1.9 | Reinitiation of critical period after induction of second stroke.
A, Schematic of experimental timeline. B, Mice were trained on a prehension task
to an asymptotic performance after which a stroke was induced (t1). Intensive
training for 19 days was initiated after a 7-day post-stroke delay. A second stroke
was then induced in the premotor cortex (t2) and training commenced 2 days
later. Notably, recovery was incomplete when training was initiated 7 days after
the first stroke. However, training commencing 2 days after the second stroke
mediated full recovery from the previous stroke. Figure adapted from (Zeiler et
al., 2016), with permission from Sage Publications.
Based on work in rodents, Murphy and Corbett suggested a simple model for
recovery of motor function, with two key elements necessary for the occurrence
of spontaneous biological recovery (Murphy and Corbett, 2009). Firstly, recovery
requires preserved neural circuitry that routes both sensory and motor signals
Introduction
43
during behavioural interventions and thus, allows post-stroke remapping of
sensorimotor functions from damaged brain areas to intact tissue. The second
part of the model refers to an increase in the potential for plasticity early post-
stroke. In the work presented here, I will focus on the second part of the model,
the brain’s intrinsic capacity to react as a highly dynamic system that changes in
response to injury, as discussed next, and experience (see section 1.2).
1.3.4 Plasticity during recovery from stroke
An extensive body of work in animal models of stroke and neuroimaging of
humans have provided insight into the molecular and physiological events
underlying post-stroke motor recovery. Gradual reorganization of the motor
system and recovery of movement after stroke begins early and involves brain
regions distant to the damaged site. In animal models of stroke, Nudo and Milliken
demonstrated profound reorganization in the damaged hemisphere 3-4 months
after focal lesioning of M1 in monkeys, which co-occurred with spontaneous
recovery of animals, without any specific training (Nudo and Milliken, 1996). The
cortical changes included loss of the areal extend of digit representation adjacent
to the insult, and increased adjacent proximal (elbow and shoulder)
representations. However, in animals that underwent rehabilitative training with
the impaired limb, the shrinkage of the hand representation could be prevented
(Nudo et al., 1996b), supporting the functional significance of post-stroke training
for cortical reorganization. Again, there is evidence that early training is more
effective and that delaying training does not prevent shrinkage of motor maps
within the affected M1 (Barbay et al., 2009). Of note, the training consisted of
restricting the use of the unimpaired hand, thereby enforcing the use of the
affected hand, a therapy commonly known as constraint-induced movement
therapy (CIMT) in humans (Wolf et al., 2006).
Over the last 15 years, numerous studies in humans have demonstrated similar
reorganisation of motor maps, with shifts in activity to more lateral and posterior
regions, which correlates with clinical improvement (Jaillard et al., 2005; Rossini
et al., 1998; Traversa et al., 1997a). Using TMS, it has been demonstrated that
motor cortex excitability is reduced near the site of stroke injury, and the cortical
representation of the affected muscles is decreased (Traversa et al., 1997b).

Introduction
44
Together, the above results illustrate that reorganization in M1 networks of the
affected cortex and beyond occurs in relation to recovery after stroke, however,
it remains to be determined whether these new motor maps produce and control
movements in the same way as did the damaged region.
Apart from changes in the ipsilesional (affected) hemisphere, increased
movement-related activation of the contralesional (unaffected) hemisphere has
been shown in human fMRI and PET studies, highlighting an initial pattern of
over-activation of motor cortical networks. Over time, this activity normalizes into
a more lateralised and ‘physiological’ activity pattern as the patient recovers
motor function (Johansen-Berg, 2002a; Marshall et al., 2000a; Ward et al., 2003a,
2003b). Persistence of contralesional activity in M1 (Carey et al., 2006;
Johansen-Berg, 2002b) and secondary motor areas (Ward et al., 2003a) is
associated with poor recovery. However, the functional role of more widespread
neural activation within the motor cortex network after stroke, being either
adaptive or maladaptive, and its contribution to recovery remains controversial
(Di Pino et al., 2014; Fridman et al., 2004; Lotze et al., 2006; Murase et al., 2004;
Ward and Cohen, 2004).
1.3.4.1 Mechanisms underlying plasticity during stroke recovery
Although some of the spontaneous biological recovery observed after stroke is
likely due to resolution of cerebral oedema, resolution of inflammation, and
normalization of metabolic disturbances in the acute and subacute phase
(Cramer, 2008; Guadagno et al., 2006; Heiss et al., 1998), structural and
functional reorganization over the weeks and months following the stroke play a
major role. The structural changes that have been observed in animal models of
stroke include neuronal growth, synaptogenesis, and the proliferation of dendritic
spines in the area adjacent to the lesion, the peri-infarct cortex (PIC), and
surrounding areas (for review see e.g. (Carmichael, 2012; Cramer and Chopp,
2000; Cramer, 2008; Murphy and Corbett, 2009)).
In addition to these structural changes, stroke triggers alterations in neuronal
excitability through GABA and glutamate signalling (Carmichael, 2012).
Immediately after stroke, excitotoxicity mediated by the excitatory

Introduction
45
neurotransmitter glutamate contributes to cell death, whereas inhibitory
GABAergic signalling can counteract this neurotoxicity (Lai et al., 2014). Thus,
this phase is characterised by elevated cortical excitability with deleterious
effects. However, the beneficial and detrimental effects of GABA and glutamate
signalling seem to reverse after the hyperacute stroke period (up to 3 days post-
stroke) (Clarkson et al., 2010). Specifically, changes to the balance between
cortical excitatory and inhibitory processes are crucial for the potential for
plasticity and may, in the context of stroke, reopen critical periods of heightened
plasticity in the adult brain similar to that seen during normal development
(Bavelier et al., 2010; Benali et al., 2008). Consequently, interest in assessing
cortical excitatory and inhibitory mechanisms as a biomarker of the potential for
post-stroke plasticity is growing.
In support of this rational, in-vitro and animal work has suggested that reduced
GABAergic and increased glutamatergic signalling (Que et al., 1999) leads to
expanded and less-specific receptive fields (Alia et al., 2016; Winship and
Murphy, 2008), enhanced LTP (Hagemann et al., 1998), facilitation of
downstream changes in neuronal structure (Chen et al., 2011), and re-mapping
of motor representations to intact cortical areas (Takatsuru et al., 2009).
Restitution of neuronal activity induced by stroke-related hyperexcitability has
been interpreted as a homeostatic response to injury (Murphy and Corbett, 2009).
For example, increased excitatory glutamatergic signalling through AMPA
receptors with downstream induction of brain-derived neurotrophic factors
(BDNF) is associated with improved recovery in mouse models of stroke
(Clarkson et al., 2011). In addition, reduction in GABAergic inhibition is evident in
the first few weeks after stroke due to downregulation of GABA receptors (Que
et al., 1999) and reduction in inhibitory interneurons (Zeiler et al., 2013). These
findings corroborate the idea that homeostatic restitution of neuronal activity
(Murphy and Corbett, 2009) is mediated by both increased glutamatergic and
reduced GABAergic signalling.
In contrast, recent work suggested that the dominant response to stroke may in
fact be excessive peri-lesional inhibition mediated through extrasynaptic
GABAergic signalling, which impedes functional plasticity. Interestingly, the
administration of an extrasynaptic GABA-receptor inverse agonist (α5IA)

Introduction
46
reversed this effect and lead to improved motor recovery (Clarkson et al., 2010;
Lake et al., 2015). These findings highlight that the plasticity of the brain that
occurs after stroke is important as it may facilitate or hinder recovery of function.
Figure 1.10 | Cortical excitability changes following stroke.
Post-stroke hypoexcitability and hyperexcitability is observed in peri-infarct
cortex. Figure taken from (Carmichael, 2012).
In humans, corroborative evidence that GABAergic signalling is one of the key
modulators of plasticity has also been obtained using TMS (Swayne et al., 2008),
MRS (Blicher et al., 2015), and PET (Kim et al., 2014). These studies mostly
report a decrease in inhibitory activity after stroke.
The abundant evidence from animal studies and recent neuroimaging studies in
humans clearly suggest that, beyond the hyperacute stroke period, alterations in
cortical inhibitory and excitatory mechanisms are important for the potential for
plasticity and therefore, represent novel and exciting therapeutic targets for
promoting recovery post-stroke. In particular, inhibitory GABAergic and excitatory
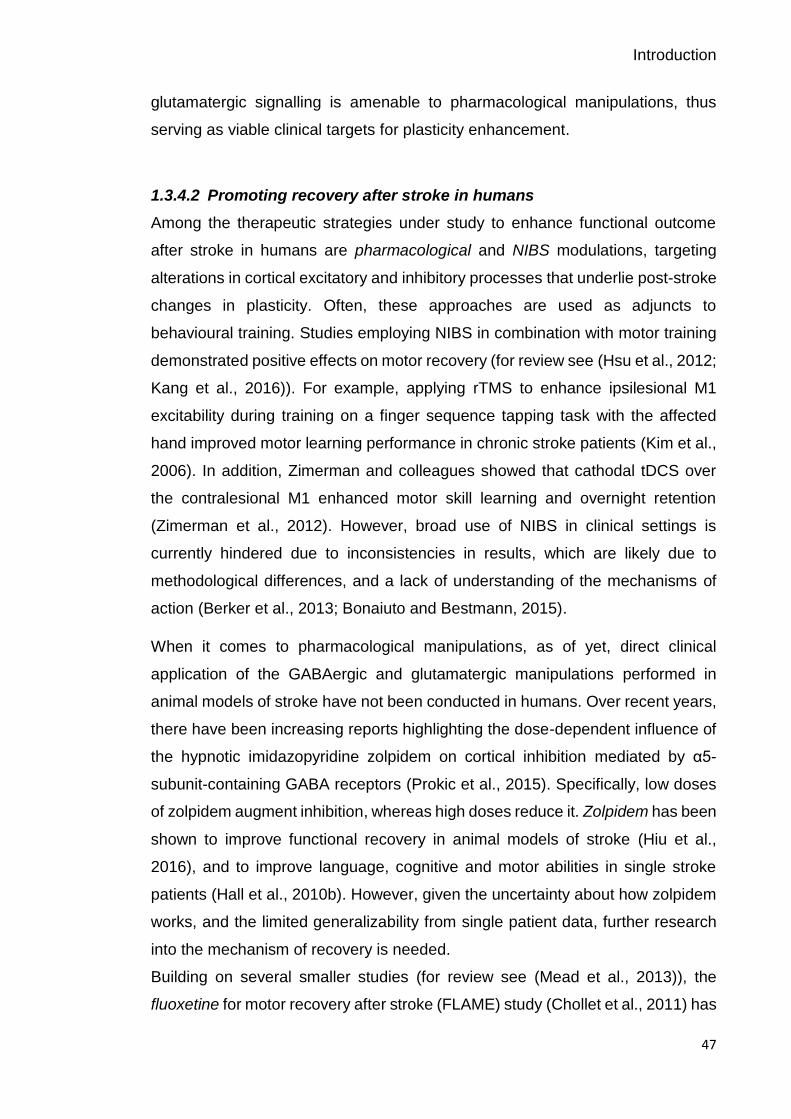
Introduction
47
glutamatergic signalling is amenable to pharmacological manipulations, thus
serving as viable clinical targets for plasticity enhancement.
1.3.4.2 Promoting recovery after stroke in humans
Among the therapeutic strategies under study to enhance functional outcome
after stroke in humans are pharmacological and NIBS modulations, targeting
alterations in cortical excitatory and inhibitory processes that underlie post-stroke
changes in plasticity. Often, these approaches are used as adjuncts to
behavioural training. Studies employing NIBS in combination with motor training
demonstrated positive effects on motor recovery (for review see (Hsu et al., 2012;
Kang et al., 2016)). For example, applying rTMS to enhance ipsilesional M1
excitability during training on a finger sequence tapping task with the affected
hand improved motor learning performance in chronic stroke patients (Kim et al.,
2006). In addition, Zimerman and colleagues showed that cathodal tDCS over
the contralesional M1 enhanced motor skill learning and overnight retention
(Zimerman et al., 2012). However, broad use of NIBS in clinical settings is
currently hindered due to inconsistencies in results, which are likely due to
methodological differences, and a lack of understanding of the mechanisms of
action (Berker et al., 2013; Bonaiuto and Bestmann, 2015).
When it comes to pharmacological manipulations, as of yet, direct clinical
application of the GABAergic and glutamatergic manipulations performed in
animal models of stroke have not been conducted in humans. Over recent years,
there have been increasing reports highlighting the dose-dependent influence of
the hypnotic imidazopyridine zolpidem on cortical inhibition mediated by α5-
subunit-containing GABA receptors (Prokic et al., 2015). Specifically, low doses
of zolpidem augment inhibition, whereas high doses reduce it. Zolpidem has been
shown to improve functional recovery in animal models of stroke (Hiu et al.,
2016), and to improve language, cognitive and motor abilities in single stroke
patients (Hall et al., 2010b). However, given the uncertainty about how zolpidem
works, and the limited generalizability from single patient data, further research
into the mechanism of recovery is needed.
Building on several smaller studies (for review see (Mead et al., 2013)), the
fluoxetine for motor recovery after stroke (FLAME) study (Chollet et al., 2011) has
Introduction
48
generated interest in serotonin-selective reuptake inhibitors (SSRI) for promoting
motor recovery. In this placebo-controlled trial, patients within 5–10 days post-
stroke were started on a 3-month oral fluoxetine intervention, which lead to
improved upper limb recovery (Figure 1.11). This study was the first to show that
physiotherapy with early fluoxetine administration to moderate-to-severely
impaired stroke patients enhances motor recovery after 3 months, although the
long-term effects remain unknown. In a mouse model, fluoxetine administration
24 hours after stroke was able to prolong the critical period of post-stoke
plasticity, thus maintaining maximal levels of responsiveness to motor training
(Ng et al., 2015). This beneficial effect was mediated through the reduction of
inhibitory interneuron expression in the intact cortex.
Clearly, plasticity-modifying interventions are a promising treatment strategy with
great potential for improving outcomes after stoke. However, clinical trials will only
be successful if the biological targets are known and measurable in humans, thus
allowing for a mechanistic approach.
Figure 1.11 | Fluoxetine improves upper limb recovery.
Patients were randomly assigned to fluoxetine (20 mg daily) or placebo for 3
months starting 5–10 days after stroke. All patients had physiotherapy. Upper
limb function was evaluated using the Fugl-Meyer motor scale (FMMS). Figure
taken from (Chollet et al., 2011), with permission from Elsevier.

Introduction
49
1.3.5 Motor learning after stroke
Post-stroke recovery and rehabilitation depend on mechanisms of learning and
brain plasticity (Krakauer, 2006). As outlined above, stroke results in major
neuroplastic changes at the structural and functional level at the primary site of
insult and connected regions. Therefore, it may be expected that learning in
individuals with stroke would be altered. Only few studies have examined the
motor skill learning capability of individuals after stroke and most have focused
on learning with the upper extremities (i.e. (L. a Boyd and Winstein, 2004; Boyd
and Winstein, 2006, 2001; Dovern et al., 2016; Hardwick et al., 2017; Orrell et al.,
2007; Platz et al., 1994; Pohl et al., 2006; Vidoni and Boyd, 2009; Winstein et al.,
1999)). Given the heterogeneity of stroke and the greater movement variability in
patients with stroke, it may be difficult to detect specific learning effects in this
population. In fact, depending on the lesion location and/or extent, different motor
learning aspects could be impaired.
Nonetheless, these few studies have claimed preserved motor skill learning in
stroke patients. Winstein and colleagues demonstrated that patients with middle
cerebral artery stroke retain the ability to learn with their contralesional
(unaffected) arm on an elbow extension-flexion reversal task, however they
exhibited lower accuracy and greater variability in their movements compared to
healthy controls (Winstein et al., 1999). Using the unaffected arm has the
advantage of dissociating an individual’s motor learning ability from his/her motor
deficits but does not allow the exploration of learning deficits specific for the
affected arm.
In addition, Boyd and colleagues revealed implicit motor sequence learning on
the SRTT and the continuous tracking task in patients with sensorimotor (Boyd
and Winstein, 2001) and basal ganglia stroke (L. A. Boyd and Winstein, 2004),
respectively. Interestingly, explicit information interfered with implicit learning
regardless of the type of task (continuous versus discrete task) (Boyd and
Winstein, 2006).
A more recent study further highlighted that stroke patients with a wide range of
impairment were able to learn on a serial voluntary isometric elbow force task
using their ipsilesional (affected) arm, however, their overall level of performance
achieved through training was still affected by their motor impairment (Hardwick

Introduction
50
et al., 2017). Since these findings were derived from patients in the chronic phase
of stroke, it is debatable whether well-recovered patients have achieved their
level of performance through preserved motor learning or if preserved motor
learning is just an epiphenomenon of a well-recovered patient. In addition, the
variety of motor tasks employed to assess motor learning deficits in patients,
relying on different learning processes and associated with various functional and
anatomical brain structures (Kitago and Krakauer, 2013; Krakauer and Mazzoni,
2011b), makes it difficult to synthesize findings across studies. Nonetheless, the
above-discussed results provide strong support for preserved motor learning
capability of individuals’ post-stroke, despite abnormal patterns of neural
activation and persistent motor impairments that are commonly observed
following stroke.
1.4 Bridging the gap: biomarkers of plasticity
As outlined above, mechanisms of learning-related and post-stroke plasticity
appear to be modulated by the balance between excitatory glutamatergic and
inhibitory GABAergic processes in the brain as demonstrated in animal models.
Consequently, these processes represent exciting and novel therapeutic targets.
However, animal models have critical limitations and thus, biomarkers of cortical
excitability in humans are needed to bridge the gap between cellular and
behavioural accounts of cortical function and plasticity in both healthy and
diseased states. A biomarker is an indicator of disease state that reflects
underlying molecular and/or cellular events that are difficult to measure directly
in humans (Aronson and Ferner, 2017). Without a valid biomarker that links
observed behaviour to underlying biological processes, demonstrating efficacy of
therapeutic therapies that aim to promote plasticity is difficult. In the clinical
context, an appropriate biomarker would thus improve decision-making about
when and for how long plasticity-modifying interventions such as fluoxetine or
NIBS should be administered, and which individuals are most likely to respond.
Although behavioural, clinical and demographic measures contribute to predictive
models of response to treatment and long-term outcome after stroke, they
incompletely characterize inter-individual differences and as such, neuroimaging
measures might provide greater insight into the capacity for reorganization (Burke

Introduction
51
and Cramer, 2014; Ward, 2017). Several tools have been utilized with the aim of
identifying suitable biomarkers in humans (e.g. (Lindenberg et al., 2012; Riley et
al., 2011; Saunders et al., 1995; Ward et al., 2003b; Wu et al., 2015)), however,
most of these have considerable limitations for studying stroke patients. For
example, BOLD fMRI is an indirect measure of neural activity and depends on
neurovascular coupling (coupling between neuronal activity, blood flow, and
oxygen consumption), which might be altered after stroke (Blicher et al., 2012).
The non-invasive method of TMS directly assess cortical excitability and has
been extensively used to investigate motor physiology after stroke. However, its
reliance on the presence of evoked responses in affected muscles (Motor Evoked
Potential, MEP), rather than measurements of spontaneous or task-related brain
activity limits, its utility for studying patients with motor paresis (Currà et al., 2002).
MRS can measure GABA levels directly, but it is currently unclear how MRS-
GABA concentration relates to the pool of GABA available for measurement (i.e.
intracellular, extracellular, or synaptic GABA) (Dyke et al., 2017; Stagg, 2014;
Stagg et al., 2011b).
Alternative methods are electroencephalography (EEG) (Berger, 1929) and
magnetoencephalography (MEG) (Cohen, 1972), which directly record the
electrical or magnetic field generated by neuronal populations on the scalp
surface with millisecond time resolution. The EEG and MEG are very close
methodologies, since they both measure the summation of currents of
postsynaptic fields from cortical pyramidal cells. Although MEG provides a higher
spatial resolution, EEG is a more cost-effective and accessible tool for exploring
neuronal mechanisms underlying cognitive and motor processes in clinical
populations (Lopes da Silva, 2013). Based on this, the EEG was chosen as the
imaging methodology in this thesis, providing surrogate measures of neuronal
function. For more details about the principles of EEG acquisition and analysis,
please refer to Chapter 2.
1.5 Neuronal oscillations as biomarkers
Neuronal oscillations, which are ubiquitous in the brain, have been accepted to
be an integral part of neural communication and information processing (Buzsaki,
2006), and their underlying physiological mechanisms are fairly well understood

Introduction
52
(Buzsáki et al., 2012). The concept of neuronal oscillations is usually credited to
Hans Berger, who was the first physiologist to describe the rhythmic fluctuations
in the excitability of neurons or populations of neurons in the human brain
(Berger, 1929). Oscillatory activity in groups of neurons, as measured by EEG
and MEG, generally arises from the feedback interactions between inhibitory
interneurons and excitatory pyramidal cells. Simplistically, when a population of
pyramidal cells becomes active, they continue to excite each other, resulting in
increasing excitation. The inhibitory interneurons within this population also
become active and increasingly inhibit the excitatory cells. Eventually the activity
of the inhibitory interneurons decreases, allowing pyramidal cells to increase their
excitatory activity again. This alternating balance between states of excitation and
inhibition is the basic underlying mechanism of a neuronal oscillation (Buzsaki,
2006). Macroscopic EEG and MEG signals reflect a conglomerate of oscillations
at different frequencies, which are categorized into characteristic frequency
bands, comprising the delta band (δ, 0.5-3.5 Hz), theta band (θ, 4-7 Hz), alpha
band (α, 8-12 Hz), beta band (β, 15-30 Hz) and gamma band (γ, >30 Hz), with
somewhat arbitrary and variable boundaries. Although these classical frequency
bands are still being used, nowadays, functional frequency bands tend to be
defined in a data-driven approach (Donner and Siegel, 2011).
Over the last years, a massive upsurge in the interest in neuronal oscillations has
demonstrated their task- and state-dependent modulation in a number of
cognitive, perceptual, and motor processes (see e.g. (Buzsaki, 2006)). Apart from
their well-documented involvement in physiological processes, abnormalities in
neuronal oscillations have been reported in various pathophysiological
conditions, such as schizophrenia (Uhlhaas and Singer, 2006), Parkinson’s
disease (Brown and Marsden, 1999; Heida et al., 2014; Heinrichs-Graham et al.,
2014; Little and Brown, 2014) and stroke (Rossiter et al., 2014a; Shiner et al.,
2015). Consequently, interest in investigating the mechanisms mediating the
generation of cortical activity to further our understanding of normal brain
functioning and pathophysiology is rising. The work presented in this thesis
focuses on neuronal oscillations in the beta-band frequency primarily originating
from sensorimotor cortex, as these are fundamental for motor behaviour and
Introduction
53
control (Engel and Fries, 2010; Pfurtscheller et al., 1996; van Wijk et al., 2012),
and potentially for motor recovery after stroke (Ward, 2017, 2015).
1.5.1 Beta oscillations in motor control
Traditionally, early studies have interpreted beta-band activity as a sensorimotor-
related phenomenon (Baker et al., 1999, 1997; Murthy and Fetz, 1996; Stancak
and Pfurtscheller, 1995), but research has also suggested their role in higher
cognitive processing (for review see e.g. (Donner and Siegel, 2011; Engel and
Fries, 2010)). Thus, interest in beta oscillations has recently undergone a major
renaissance.
Beta oscillations are prominent at rest and characteristically modulated with
movement in large parts of the sensorimotor cortex network, with two well-
described patterns of movement-related oscillatory dynamics. In particular, prior
to and during movement, beta power is suppressed (Movement-Related Beta
Desynchronization, MRBD) (Pfurtscheller and Berghold, 1989; Salmelin and Hari,
1994; Stancak and Pfurtscheller, 1995). This suppression of beta activity is
sustained as long as the effector is moving (Erbil and Ungan, 2007; Stancak and
Pfurtscheller, 1995; Wheaton et al., 2009) or as changes in muscle contraction
appear (Omlor et al., 2011). Following movement termination, beta power
increases above pre-movement levels approximately 0.5 s post-movement (Post-
Movement Beta Rebound, PMBR) (Jurkiewicz et al., 2006; Pfurtscheller et al.,
1998a; Salmelin and R. Hari, 1994; Stancak and Pfurtscheller, 1995).
These spectral characteristics are classically described as event-related
desynchronization (ERD) and synchronization (ERS) (Pfurtscheller and Lopes,
1999), and are somewhat spatially distinct, with MRBD typically observed in both
contralateral and ipsilateral sensorimotor cortices during unimanual movements,
while PMBR typically shows a contralateral preponderance (Salmelin and Hari,
1994; Stancak and Pfurtscheller, 1995). A rather simplistic view on ERD/ERS
phenomena is that MRBD indexes activation of sensorimotor cortex (Pfurtscheller
and Lopes, 1999) associated with an increase in corticospinal excitability (Chen
et al., 1998), while PMBR is thought to reflect a state of active motor cortical
inhibition (Solis-Escalante et al., 2012).
Introduction
54
Several movement parameters have been shown to modulate the time course of
MRBD and PMBR (for review see (Kilavik et al., 2013; Van Wijk et al., 2012)).
Strikingly, the beta rhythm also exhibits suppression and rebound-like dynamics
during motor imagery (McFarland et al., 2000; Nakagawa et al., 2011), movement
observation (Babiloni et al., 2002), passive movement (Alegre et al., 2002), and
tactile stimulation (Gaetz and Cheyne, 2006).
Owing to their prominent occurrence at rest, beta oscillations have been
postulated to correspond to an ‘idling rhythm’ of the motor system (Salmelin and
Hari, 1994). This theory has been revised with the current view that beta
oscillations are associated with the maintenance of the current sensorimotor
state, or the ‘status quo’, at the expense of new movement (Engel and Fries,
2010; Jenkinson and Brown, 2011). In support, inducing beta synchrony with 20
Hz transcranial alternating-current stimulation was shown to slow volitional
movements (Joundi et al., 2012; Pogosyan et al., 2009). This effect was shown
to be specific for the beta-band, as entrainment with 5 Hz oscillations did not
suppress movement. Similarly, Gilbertson and colleagues demonstrated a
slowing of movement when it was initiated during spontaneous burst of beta
oscillations in the ongoing resting-state activity (Gilbertson et al., 2005a).
Although these findings establish a causal link between beta oscillatory activity
and concurrent motor behaviour, their distinct modulation by a variety of
functional processes explain why their functional role is still debated (Engel and
Fries, 2010; Jenkinson and Brown, 2011; Pfurtscheller et al., 1996).
1.5.2 Generation and modulation of beta oscillations: GABA linkage
Studies in animals and humans suggest that beta oscillations are the summed
output of excitatory glutamatergic pyramidal cells temporally aligned by inhibitory
GABAergic interneurons (Jensen et al., 2005; Murakami and Okada, 2006;
Yamawaki et al., 2008). As such, they are dependent on the balance between
excitatory and inhibitory processes within these neuronal circuits (Buzsaki, 2006;
Murakami and Okada, 2006; Yamawaki et al., 2008) and may reflect the potential
for both local and network plasticity (Traub et al., 2004).
Recent modelling and in vitro work in combination with pharmacology have
shown that beta oscillations are generated in deep cortical layer V of sensory and

Introduction
55
motor cortex and were robust to various neurotransmitter blockers. Notably,
administration of the GABA-A receptor blockers such as bicuculline (Roopun et
al., 2006) and pictotoxin (Yamawaki et al., 2008) resulted in abolished beta
oscillations (Figure 1.12). These findings in animal slices suggest that the cortical
networks supporting beta oscillations in M1 critically depend on GABAergic
signalling. While this work provides strong evidence for the dependence of beta
oscillations on GABAergic mechanisms, it did rely on pharmacologically induced
excitatory drive, a condition that may not be reproduced in vivo.
Figure 1.12 | Pharmacologically induced beta oscillations depend on GABA.
Oscillations in the beta-band were elicited in animal slices by co-application of
kainic acid (glutamate receptor agonist) and carbachol (muscarinic receptor
agonist). Properties of M1 network oscillations were then examined using
pharmacological manipulations at GABA receptors. Extracellular voltage
recordings and associated power spectra showing the effects of picrotoxine (A),
pentobarbital (B), and zolpidem (C). While beta oscillations were abolished by
the GABA-A receptor antagonist picrotoxine, pentobarbital and zolpidem
modulated beta oscillations, indicating their dependence on GABAergic signalling
within M1 networks. Figure taken from (Yamawaki et al., 2008), with permission
from Elsevier.
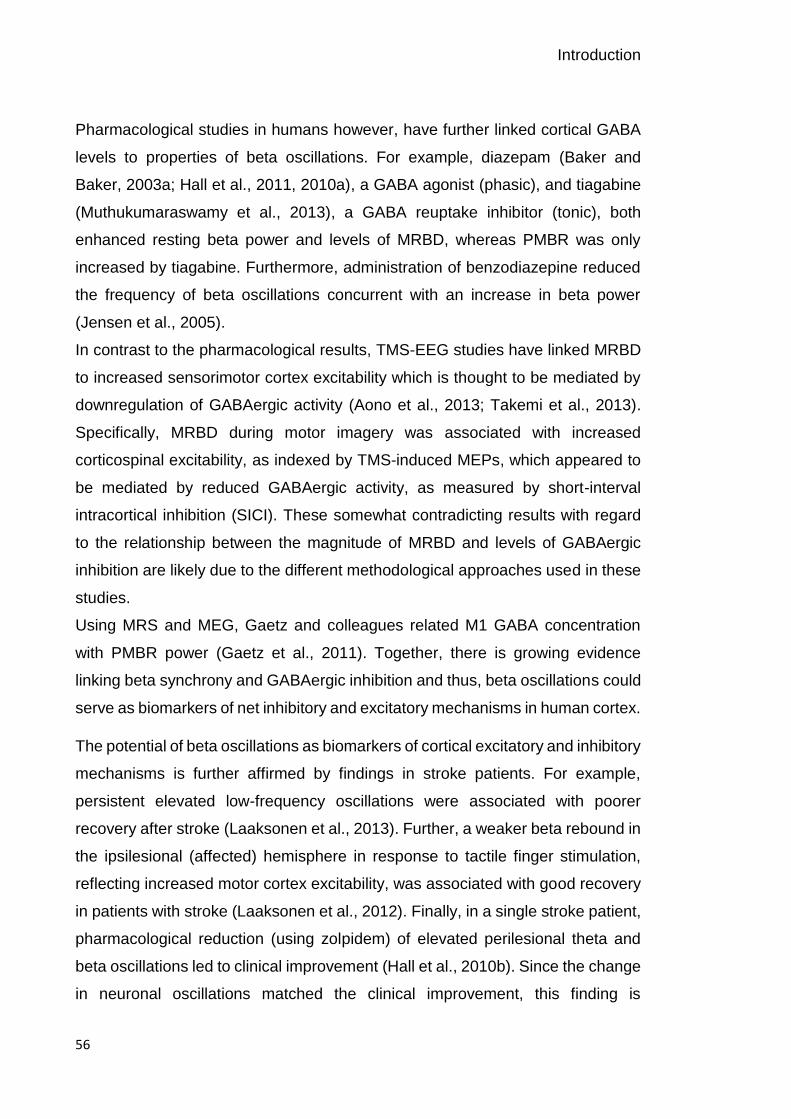
Introduction
56
Pharmacological studies in humans however, have further linked cortical GABA
levels to properties of beta oscillations. For example, diazepam (Baker and
Baker, 2003a; Hall et al., 2011, 2010a), a GABA agonist (phasic), and tiagabine
(Muthukumaraswamy et al., 2013), a GABA reuptake inhibitor (tonic), both
enhanced resting beta power and levels of MRBD, whereas PMBR was only
increased by tiagabine. Furthermore, administration of benzodiazepine reduced
the frequency of beta oscillations concurrent with an increase in beta power
(Jensen et al., 2005).
In contrast to the pharmacological results, TMS-EEG studies have linked MRBD
to increased sensorimotor cortex excitability which is thought to be mediated by
downregulation of GABAergic activity (Aono et al., 2013; Takemi et al., 2013).
Specifically, MRBD during motor imagery was associated with increased
corticospinal excitability, as indexed by TMS-induced MEPs, which appeared to
be mediated by reduced GABAergic activity, as measured by short-interval
intracortical inhibition (SICI). These somewhat contradicting results with regard
to the relationship between the magnitude of MRBD and levels of GABAergic
inhibition are likely due to the different methodological approaches used in these
studies.
Using MRS and MEG, Gaetz and colleagues related M1 GABA concentration
with PMBR power (Gaetz et al., 2011). Together, there is growing evidence
linking beta synchrony and GABAergic inhibition and thus, beta oscillations could
serve as biomarkers of net inhibitory and excitatory mechanisms in human cortex.
The potential of beta oscillations as biomarkers of cortical excitatory and inhibitory
mechanisms is further affirmed by findings in stroke patients. For example,
persistent elevated low-frequency oscillations were associated with poorer
recovery after stroke (Laaksonen et al., 2013). Further, a weaker beta rebound in
the ipsilesional (affected) hemisphere in response to tactile finger stimulation,
reflecting increased motor cortex excitability, was associated with good recovery
in patients with stroke (Laaksonen et al., 2012). Finally, in a single stroke patient,
pharmacological reduction (using zolpidem) of elevated perilesional theta and
beta oscillations led to clinical improvement (Hall et al., 2010b). Since the change
in neuronal oscillations matched the clinical improvement, this finding is

Introduction
57
particularly interesting as it further highlights the potential of beta oscillations as
biomarkers of excitatory and inhibitory processes that can be utilized to
demonstrate efficacy of therapeutic therapies.
1.5.3 Alterations in beta oscillations
Cortical beta oscillations are thought to be fundamental for motor behaviour and
control, and alterations in these oscillations are a candidate mechanism for
movement pathologies. While changes in beta oscillatory activity have been
observed in a number of settings, not all of them are representative of a
pathological state.
1.5.3.1 Alterations in beta oscillations with ageing and motor learning
Normal development and ageing are characterized by significant alterations in
beta oscillatory activity. For example, Rossiter and colleagues showed that
ageing was associated with greater resting beta power and stronger MRBD
(Rossiter et al., 2014b) and argued, in line with previous animal and pharmaco-
MEG studies, that these changes reflect increased inhibitory activity and
therefore, potentially reduced potential for plasticity in the elderly. Similarly,
during typical development from child to adolescent, the magnitude of MRBD and
PMBR increases (Gaetz et al., 2010), suggesting a maturational process of motor
cortical inhibition. As such, these measures may be implicated in the processes
governing motor learning in children and adults, and help predict recovery of
motor function following stoke.
Although, associations between beta oscillations and motor performance suggest
a crucial role in brain function, their role in motor learning is not well established.
Few studies have reported changes in beta oscillations in the context of motor
learning. In these studies, greater MRBD (Boonstra et al., 2007; Houweling et al.,
2008; Pollok et al., 2014) and PMBR (Mary et al., 2015) after compared to before
training was linked to better performance on unimanual and bimanual motor
learning tasks. The authors argued that these changes in beta power might
represent neurophysiological markers of plasticity processes taking place during
motor learning as discussed in section 1.2. Similarly, changes in beta power at
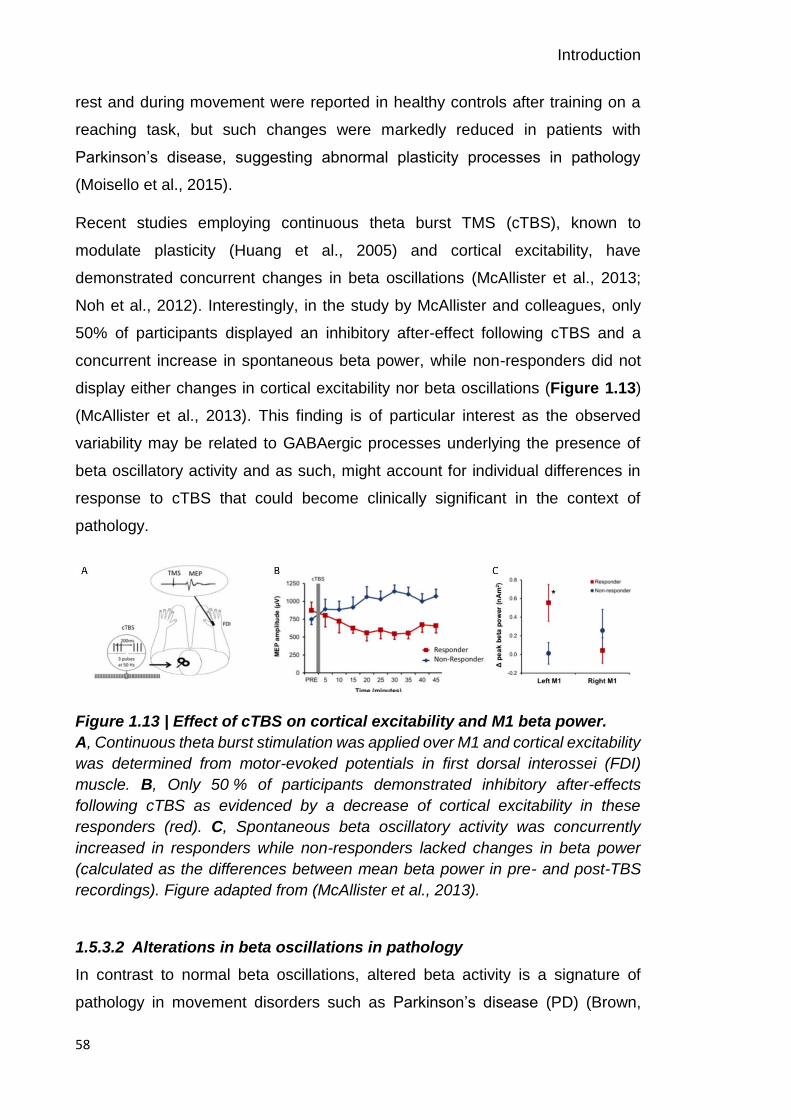
Introduction
58
rest and during movement were reported in healthy controls after training on a
reaching task, but such changes were markedly reduced in patients with
Parkinson’s disease, suggesting abnormal plasticity processes in pathology
(Moisello et al., 2015).
Recent studies employing continuous theta burst TMS (cTBS), known to
modulate plasticity (Huang et al., 2005) and cortical excitability, have
demonstrated concurrent changes in beta oscillations (McAllister et al., 2013;
Noh et al., 2012). Interestingly, in the study by McAllister and colleagues, only
50% of participants displayed an inhibitory after-effect following cTBS and a
concurrent increase in spontaneous beta power, while non-responders did not
display either changes in cortical excitability nor beta oscillations (Figure 1.13)
(McAllister et al., 2013). This finding is of particular interest as the observed
variability may be related to GABAergic processes underlying the presence of
beta oscillatory activity and as such, might account for individual differences in
response to cTBS that could become clinically significant in the context of
pathology.
Figure 1.13 | Effect of cTBS on cortical excitability and M1 beta power.
A, Continuous theta burst stimulation was applied over M1 and cortical excitability
was determined from motor-evoked potentials in first dorsal interossei (FDI)
muscle. B, Only 50 % of participants demonstrated inhibitory after-effects
following cTBS as evidenced by a decrease of cortical excitability in these
responders (red). C, Spontaneous beta oscillatory activity was concurrently
increased in responders while non-responders lacked changes in beta power
(calculated as the differences between mean beta power in pre- and post-TBS
recordings). Figure adapted from (McAllister et al., 2013).
1.5.3.2 Alterations in beta oscillations in pathology
In contrast to normal beta oscillations, altered beta activity is a signature of
pathology in movement disorders such as Parkinson’s disease (PD) (Brown,
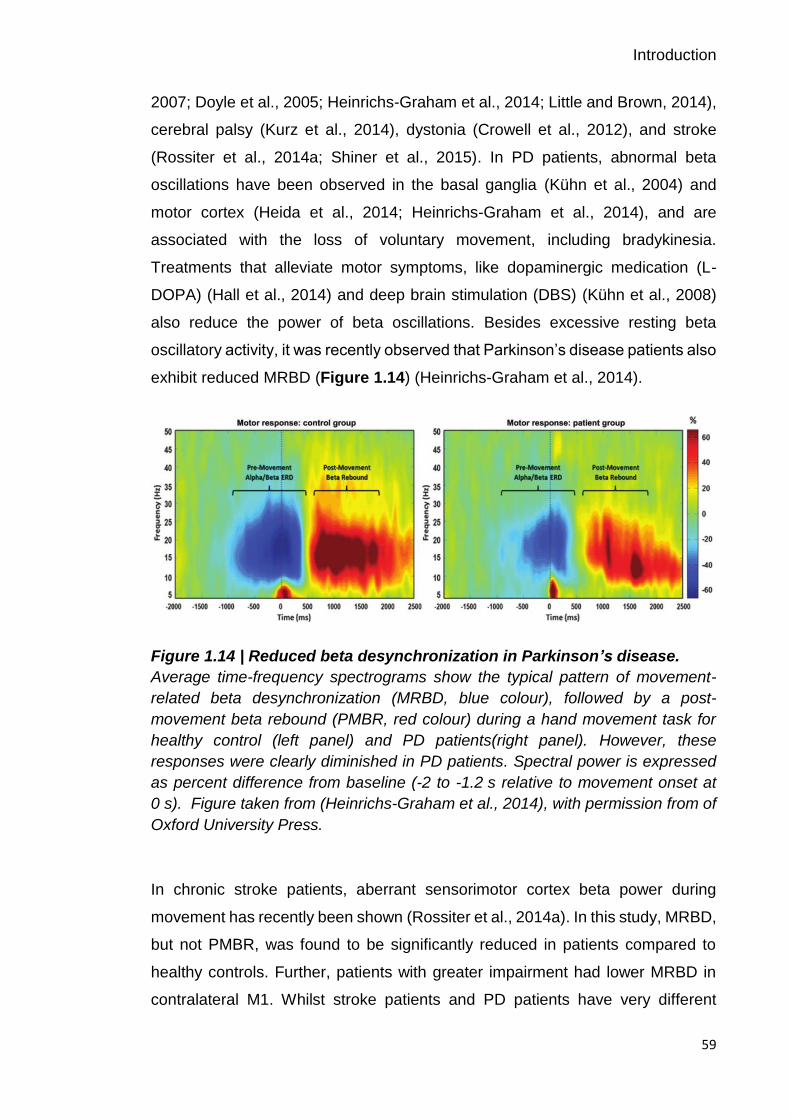
Introduction
59
2007; Doyle et al., 2005; Heinrichs-Graham et al., 2014; Little and Brown, 2014),
cerebral palsy (Kurz et al., 2014), dystonia (Crowell et al., 2012), and stroke
(Rossiter et al., 2014a; Shiner et al., 2015). In PD patients, abnormal beta
oscillations have been observed in the basal ganglia (Kühn et al., 2004) and
motor cortex (Heida et al., 2014; Heinrichs-Graham et al., 2014), and are
associated with the loss of voluntary movement, including bradykinesia.
Treatments that alleviate motor symptoms, like dopaminergic medication (L-
DOPA) (Hall et al., 2014) and deep brain stimulation (DBS) (Kühn et al., 2008)
also reduce the power of beta oscillations. Besides excessive resting beta
oscillatory activity, it was recently observed that Parkinson’s disease patients also
exhibit reduced MRBD (Figure 1.14) (Heinrichs-Graham et al., 2014).
Figure 1.14 | Reduced beta desynchronization in Parkinson’s disease.
Average time-frequency spectrograms show the typical pattern of movement-
related beta desynchronization (MRBD, blue colour), followed by a post-
movement beta rebound (PMBR, red colour) during a hand movement task for
healthy control (left panel) and PD patients(right panel). However, these
responses were clearly diminished in PD patients. Spectral power is expressed
as percent difference from baseline (-2 to -1.2 s relative to movement onset at
0 s). Figure taken from (Heinrichs-Graham et al., 2014), with permission from of
Oxford University Press.
In chronic stroke patients, aberrant sensorimotor cortex beta power during
movement has recently been shown (Rossiter et al., 2014a). In this study, MRBD,
but not PMBR, was found to be significantly reduced in patients compared to
healthy controls. Further, patients with greater impairment had lower MRBD in
contralateral M1. Whilst stroke patients and PD patients have very different

Introduction
60
pathologies, they both share the feature of reduced MRBD in M1 in conjunction
with deficits in motor control. Thus, it may be that both patient groups are unable
to modulate beta-band power, which results in abnormal inhibition of behavioural
changes. These findings highlight the functional role of beta oscillations for motor
behaviour and are in line with the proposed ‘status quo’ hypothesis of beta
synchrony maintaining the current sensorimotor state while compromising flexible
motor control (Engel and Fries, 2010).
1.6 Thesis overview
To summarise, this thesis explores the interplay between spectral characteristics
of beta oscillations, as candidate biomarkers of cortical inhibitory and excitatory
mechanisms, and individual differences in short-term motor learning. In a series
of experiments, I seek to understand the neurophysiological processes
underlying an individual’s ability to learn and retain new motor skills in the context
of healthy ageing and after stroke. Specifically, this thesis aimed to address the
following principal research questions:
1. How does natural inter-individual variation in cortical beta oscillations
seen with ageing relate to a person’s ability to learn and retain new motor
skills? Which spectral characteristics of beta oscillatory activity – resting
or movement-related (dynamic) – are linked to individual differences in
motor learning?
2. How are stroke-related changes in beta oscillations associated with a
patient’s ability to relearn motor skills? Which spectral characteristics of
beta oscillatory activity after stroke – resting or movement-related
(dynamic) – are linked to individual differences in motor learning?
Understanding the relationship between cortical beta oscillations and individual
differences in motor learning may offer novel targets for therapeutic interventions
designed to promote rehabilitative outcomes after brain injury.

Introduction
61
In Chapter 2, I discuss the neurophysiological correlates underlying the EEG
signal, some considerations with regard to its acquisition, and provide an
overview of the principles behind time-frequency analysis.
In Chapter 3, I introduce the methodological techniques implemented and
summarise the experimental considerations made in the design of the motor
tasks used in this thesis. Specifically, I describe the development of a novel
instantiation of the continuous tracking task so that it was possible to promote
optimal learning across healthy ageing adults and stroke patients.
In Chapter 4, I focus on the test-retest reliability of beta oscillatory estimates,
which are used in the following experimental chapters. I introduce EEG-derived
measures of resting and movement-related beta activity and demonstrate their
highly reliable nature across several weeks, a prerequisite for exploring the
longitudinal relationship between beta oscillatory activity and individual variation
in the capacity to learn a new motor skill.
In Chapter 5, I combine neuroimaging and motor learning in 40 healthy ageing
adults to characterise the influence of natural inter-individual variations in beta-
band activity on motor learning ability during a continuous tracking task. Using
the standard measures of resting and movement-related beta activity introduced
in the previous chapter, I explore their respective relation with an individual’s
ability to learn and retain new motor skills.
In Chapter 6, I focus on individual differences in motor learning in a clinical
population of stroke survivors. Specifically, I use the same motor tasks and the
same analysis pipeline to assess the impact of stroke on the relationship between
beta activity and motor learning in 18 chronic stroke survivors.
Finally, in Chapter 7, I draw together the key findings from the different lines of
research presented in this thesis, discuss the implications of this work for basic
and clinical research, and outline some limitations and future directions.

Introduction
62
1.7 Acknowledgement of contributions
I gratefully acknowledge Joern Diedrichsen’s assistance in developing the motor
learning task employed in Chapter 5 and Chapter 6. I thank Archy de Berker for
his guidance during coding and technical testing of the motor tasks used
throughout Chapter 4, Chapter 5, and Chapter 6. I also thank Holly Rossiter and
Bernadette van Wijk for providing guidance and supervision in EEG data analysis
throughout Chapter 4, Chapter 5, and Chapter 6. I am grateful for Nellie
Redman’s support during testing in Chapter 5. Lastly, I gratefully acknowledge
Fatima Jichi for her statistical support in sample size calculation.

Acquisition and analysis of EEG signals
63
Acquisition and analysis of EEG signals
In the last years, our understanding of brain-behaviour relationships has
dramatically improved due to advances in non-invasive brain imaging techniques.
Human brain imaging techniques typically are categorised into metabolic-based
(i.e. mainly fMRI and PET) and electrophysiological-based (i.e. mainly EEG and
MEG) approaches, which allow the assessment of brain activity during
performance of a task with varying spatial and temporal precision.
Electrophysiological techniques are generally considered to have excellent
temporal resolution but relatively poor spatial sensitivity, while metabolic
techniques are assumed to have high spatial resolution, but rather poor temporal
precision. As such, the use of a brain imaging tool depends on its suitability to
address the research question, for example if the research question asks ‘where
in the brain a task-related process occurs’, metabolic techniques are the optimal
imaging modality. On the other hand, brain imaging techniques with high temporal
resolution are invaluable and exceptional tools for the study of complex, dynamic
cognitive and motor processes that occur within tens to hundreds of milliseconds.
Since EEG was the chosen brain imaging tool to address the research questions
of this thesis, in this chapter, I will specifically discuss the neurophysiological
events that underlie the generation of the EEG signal, highlight advantages and
limitations of employing this imaging technique in healthy and patient populations,
and provide an overview of the principles behind EEG time-frequency analysis,
including preprocessing and signal decomposition using the powerful wavelet
transform employed in the work presented in this thesis. Please refer to Chapter
3 for specific details regarding the implemented EEG data analysis pipeline used
in the subsequent chapters.
2.1 Neurophysiological basis of EEG
EEG uses electrodes placed on the scalp to record the summed excitatory and
inhibitory postsynaptic potentials of populations of neurons, most likely pyramidal
cells, which are aligned parallel to each other and perpendicular to the cortical
surface. The synchronous activity of approximately 10,000–50,000 neurons
within this spatial organization then generates an electrical field that is powerful
Acquisition and analysis of EEG signals
64
enough to be picked up by means of electrodes from the scalp (Lopes da Silva,
2011; Murakami and Okada, 2006).
When neurotransmitters activate ion channels on the cell membrane of these
neurons, either generating an excitatory or inhibitory postsynaptic potential
(EPSP, IPSP), intra- and extracellular currents flow, creating an electrical field
surrounding the neurons. For example, influx of positive ions into the cell (mostly
Na+ and Ca+) creates an excitatory postsynaptic potential and an extracellular
‘sink’ (lack of positive ions in extracellular medium), with a concurrent
redistribution of ions within the neuron leading to an outward flow of ions, creating
an extracellular ‘source’ (excess of positive ions in extracellular medium) at the
level of the soma. These synaptic actions thus result in dipolar sink-source
configurations that generate time-varying electrical currents surrounding the
neurons (Figure 2.1A) (Buzsaki, 2006; Nunez and Srinivasan, 2006).
In accordance with Maxwell’s equation for electromagnetism, the electrical fields
simultaneously create magnetic fields. These electric and magnetic fields form
the building blocks of EEG and MEG signals, respectively (Buzsáki et al., 2012;
Lopes da Silva, 2013, 2011). The direction of the electrical current flow is
important as EEG and MEG vary in terms of their sensitivity towards the dipole
orientation. Whereas EEG can detect both tangentially and radially oriented
sources, MEG is mainly sensitive to tangentially oriented sources which protrude
outside the head (Figure 2.1B) (Ahlfors et al., 2010; Cohen and Cuffin, 1991).
To reach the head surface, the neuronal signals need to travel through electrical
tissues with different conductive properties (e.g. cerebrospinal fluid, skull and
scalp). Unlike the EEG signal, which is attenuated and distorted by these various
electrical tissues, the magnetic field measured by MEG passes through these
tissues unimpeded (Lopes da Silva, 2013; Nunez and Srinivasan, 2009).
In summary, EEG measures the super-position of electric postsynaptic activity of
populations of pyramidal cells that travels to the head surface due to volume
conduction.

Acquisition and analysis of EEG signals
65
Figure 2.1 | Schematic of electrical fields generated by cortical neurons.
A, An idealized pyramidal cell showing the patterns of intra- and extracellular
current flow caused by activity at an excitatory synapse. An excitatory
postsynaptic potential (EPSP) is associated with the generation of an active
current sink in the extracellular medium next to the synapse. The current that
flows in at the synaptic side is compensated by currents flowing in the opposite
direction (passive source) at the level of the soma. This dipolar sink-source
configuration around the neurons is reflected in local field potentials (LFPs). The
electrical current flow also generates a magnetic field (red ellipse). B, Different
dipole orientations with respect to the skull contribute differentially to EEG and
MEG signals. While EEG is sensitive to both radial (a) and tangential (b) dipoles,
tangential diploes (b) will contribute the strongest signal to MEG. In addition,
electrical fields can cancel each other out or only contribute a weak signal to the
EEG if the dipoles are on opposing sides of the sulcus (c) or are further away
from the recording electrode (d). Figures taken from (Cohen, 2014; Lopes da
Silva, 2013), with permission from Elsevier.
2.1.1 Advantages and limitations of EEG
Among the existing non-invasive brain imaging techniques for the study of human
brain function, electrophysiological techniques such as EEG and MEG are
classically considered to possess excellent temporal resolution, but a relatively
poor spatial sensitivity (Figure 2.2). The high temporal precision in the
millisecond range allows capturing very fast and complex dynamic changes in
brain activity that occur with neurocognitive processes. In contrast, techniques
such as fMRI that rely on indirect measures of hemodynamic response do not
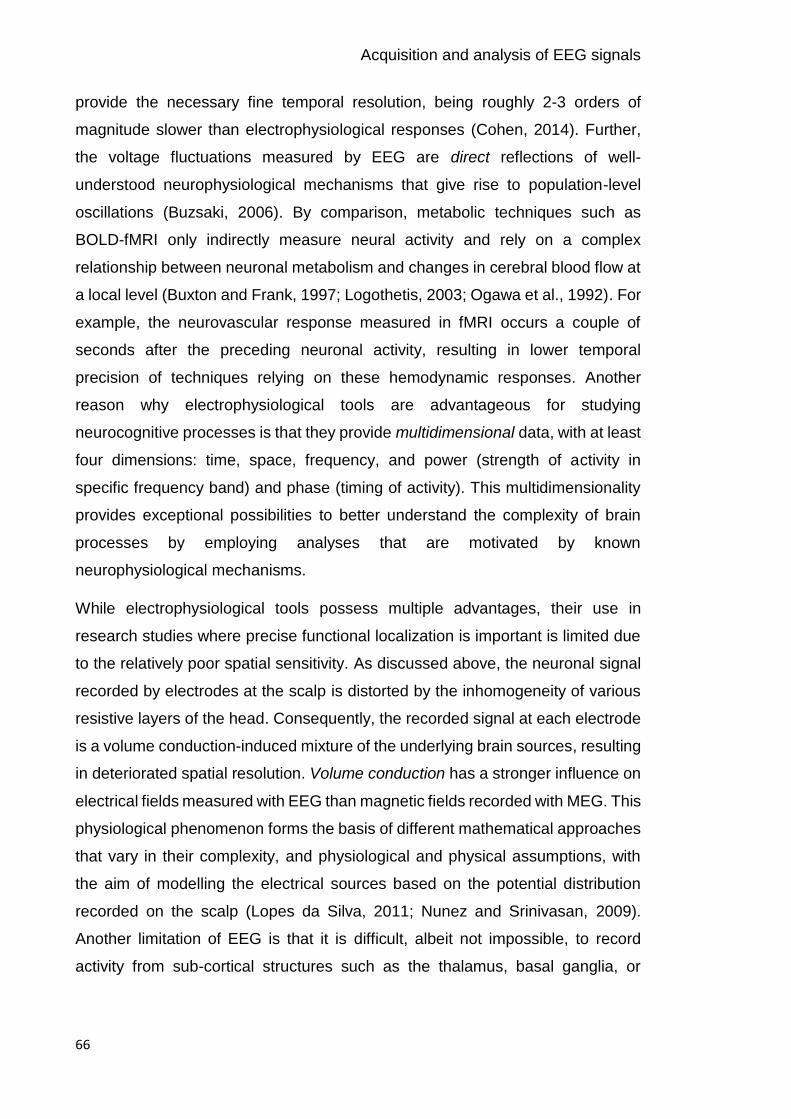
Acquisition and analysis of EEG signals
66
provide the necessary fine temporal resolution, being roughly 2-3 orders of
magnitude slower than electrophysiological responses (Cohen, 2014). Further,
the voltage fluctuations measured by EEG are direct reflections of well-
understood neurophysiological mechanisms that give rise to population-level
oscillations (Buzsaki, 2006). By comparison, metabolic techniques such as
BOLD-fMRI only indirectly measure neural activity and rely on a complex
relationship between neuronal metabolism and changes in cerebral blood flow at
a local level (Buxton and Frank, 1997; Logothetis, 2003; Ogawa et al., 1992). For
example, the neurovascular response measured in fMRI occurs a couple of
seconds after the preceding neuronal activity, resulting in lower temporal
precision of techniques relying on these hemodynamic responses. Another
reason why electrophysiological tools are advantageous for studying
neurocognitive processes is that they provide multidimensional data, with at least
four dimensions: time, space, frequency, and power (strength of activity in
specific frequency band) and phase (timing of activity). This multidimensionality
provides exceptional possibilities to better understand the complexity of brain
processes by employing analyses that are motivated by known
neurophysiological mechanisms.
While electrophysiological tools possess multiple advantages, their use in
research studies where precise functional localization is important is limited due
to the relatively poor spatial sensitivity. As discussed above, the neuronal signal
recorded by electrodes at the scalp is distorted by the inhomogeneity of various
resistive layers of the head. Consequently, the recorded signal at each electrode
is a volume conduction-induced mixture of the underlying brain sources, resulting
in deteriorated spatial resolution. Volume conduction has a stronger influence on
electrical fields measured with EEG than magnetic fields recorded with MEG. This
physiological phenomenon forms the basis of different mathematical approaches
that vary in their complexity, and physiological and physical assumptions, with
the aim of modelling the electrical sources based on the potential distribution
recorded on the scalp (Lopes da Silva, 2011; Nunez and Srinivasan, 2009).
Another limitation of EEG is that it is difficult, albeit not impossible, to record
activity from sub-cortical structures such as the thalamus, basal ganglia, or
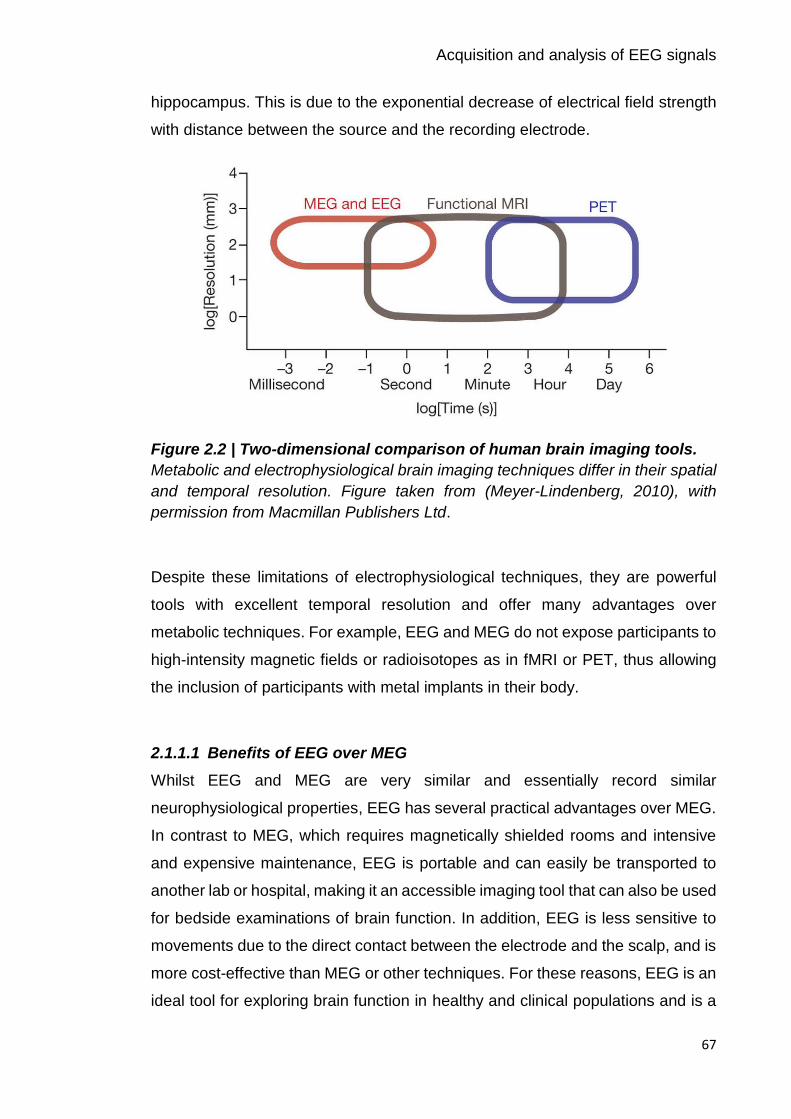
Acquisition and analysis of EEG signals
67
hippocampus. This is due to the exponential decrease of electrical field strength
with distance between the source and the recording electrode.
Figure 2.2 | Two-dimensional comparison of human brain imaging tools.
Metabolic and electrophysiological brain imaging techniques differ in their spatial
and temporal resolution. Figure taken from (Meyer-Lindenberg, 2010), with
permission from Macmillan Publishers Ltd.
Despite these limitations of electrophysiological techniques, they are powerful
tools with excellent temporal resolution and offer many advantages over
metabolic techniques. For example, EEG and MEG do not expose participants to
high-intensity magnetic fields or radioisotopes as in fMRI or PET, thus allowing
the inclusion of participants with metal implants in their body.
2.1.1.1 Benefits of EEG over MEG
Whilst EEG and MEG are very similar and essentially record similar
neurophysiological properties, EEG has several practical advantages over MEG.
In contrast to MEG, which requires magnetically shielded rooms and intensive
and expensive maintenance, EEG is portable and can easily be transported to
another lab or hospital, making it an accessible imaging tool that can also be used
for bedside examinations of brain function. In addition, EEG is less sensitive to
movements due to the direct contact between the electrode and the scalp, and is
more cost-effective than MEG or other techniques. For these reasons, EEG is an
ideal tool for exploring brain function in healthy and clinical populations and is a

Acquisition and analysis of EEG signals
68
promising tool for the identification of widely available and cost-effective
biomarkers of cortical function.
2.2 Considerations for high-quality EEG recordings
“There is no substitute for clean data” (Luck, 2005) and as such, acquiring high-
quality EEG data is the first crucial step for scientific investigations. Like other
brain imaging techniques, EEG is susceptible to various forms of noise (i.e.
biological/subject-related or technical), which represent challenges for analysis
and interpretation of EEG data. In order to deal with and reduce noise, and thus
ensure optimal data quality, several technical and practical considerations can be
applied, both at the time of EEG recording and during data pre-processing. For
example, the quality of the EEG system and set-up, the experimental design, the
preparation of the subject, and general acquisition settings are some of the
factors that should be taken into account (Gross et al., 2013) and some are
outlined next.
Since EEG measures the difference of electrical potential (typically in microvolts,
µV) between each scalp electrode and a reference electrode, this reference
should ideally be unaffected by brain activity, because any activity present in the
reference electrode, including noise, will be reflected as activity in the scalp
electrodes. Typically chosen reference electrodes are averaged mastoids, vertex
or ear lobes (Luck, 2005). In addition, a ground electrode prevents the
accumulation of static charge (Picton et al., 2000), preventing noisy signals in the
EEG.
Standard EEG systems comprise 32 or 64 electrodes whereas technological
advances have brought about high-resolution EEG caps that can include up to
256 electrodes. While more electrodes are useful to increase the signal-to-noise
ratio (SNR) and to perform source reconstruction analysis to localise various EEG
components, practical considerations such as preparation time and data storage
need to be taken into account. Specifically, most EEG caps require the
application of electroconductive gel to form a physical bridge between the skin
and the recording electrode, reducing the electrical impedance. As such,
preparation time increases as a function of the number of electrodes and can be
Acquisition and analysis of EEG signals
69
problematic for studies of challenging populations such as children and patients.
Since high impedances distort the EEG signal, it is desirable to obtain
homogenous impedance values ideally below 5 kΩ across the electrode montage
(Luck, 2005; Picton et al., 2000). Asking subjects to wash their hair and to avoid
hair spray or gels, and the use of abrasive skin preparation pastes and conductive
gels help to record a clean EEG signal.
The positioning of electrodes on the scalp is important because different lobes of
cerebral cortex are related to different brain functions. The standard method for
electrode placement is the international 10–20 system (Jasper et al., 1958), which
positions electrodes relative to landmarks, the nasion, inion, and pre-auricular
points. This system ensures that results of an EEG study can be replicated by
other laboratories and allows consistent electrode placement in the case of long-
term monitoring.
Another factor is the sampling frequency/rate, which determines the temporal
resolution of the EEG data and needs to be sufficiently high to capture the
frequencies of interest in the respective study. Typically, the sampling rate should
be at least twice the highest frequency of interest (Nyquist theorem, (Srinivasan
et al., 1998)), however, in practice more data points per oscillation cycle increase
SNR and thus, allow for better high-frequency activity estimation. Obtaining a
satisfactory SNR requires the recording of a sufficient number of trials, taking into
account exclusion of trials due to subject-related (i.e. eye-movements, sweating)
and technical (i.e. line noise, impedance fluctuation) artefacts. In general, the
number of trials depends on how big the observed effect is, how reliable the EEG
dynamics under investigation are (for example see Chapter 4), and the specific
analyses that will be performed. Again, a practical consideration in this regard is
that participant’s vigilance may not remain constant with many trial repetitions
and that long EEG recordings may not be tolerated by every subject population.
2.3 Analysis of EEG signals in the time-frequency domain
EEG data comprise the volume-conducted summation of neural synchrony within
and among neural assemblies and thus, provide an opportunity to translate the
neurophysiological mechanisms that modulate these oscillations to human EEG
studies, and to gain new insights into the neuronal underpinnings of sensory,
Acquisition and analysis of EEG signals
70
perceptual, motor and cognitive processes, as well as their pathologies. The
recorded EEG signal, expressed as a time series, is suitable for a variety of
analyses, including event-related potentials (ERPs) analysis and time-frequency
(TF) analysis. While ERPs are simple and fast to compute, and their peak
amplitudes and latencies provide insight into the nature and timing of neural
events underlying discrete sensory and cognitive processes (Luck, 2005; Makeig
et al., 2004), ERP averaging filters out most of the dynamic and multidimensional
activity in the EEG signal. For example, oscillations at various frequencies
represent multiple co-occurring and interacting neural processes in the brain that
do not have a representation in the ERP.
Hence, time-frequency analysis approaches can capture many different aspects
of the EEG signal by decomposing it into time-locked magnitude and phase
information for each frequency. As such, this approach offers a more refined and
detailed investigation of the brain’s event-related oscillatory activity, with changes
in EEG power being interpreted in terms of changes in the underlying neural
synchrony, as exemplified by the concepts of event-related synchronization and
desynchronization (ERD/ERS) (Pfurtscheller and Aranibar, 1977; Pfurtscheller
and Lopes, 1999).
Interest in the field of time-frequency dynamics is proliferating due to ample
opportunities for exploratory data analysis, however, the large number of analysis
methods used to process EEG data, and their complexity, presents a problem for
the development of unified analysis environments. For example, time-frequency
transformation methods include the short-term Fourier transform (STFT) (Gabor,
1946), continuous or discrete wavelet transform (Daubechies, 1992; Mallat,
1989), and Hilbert transform (Lyons, 2004), which are all based on linear
convolution. A comprehensive survey of the various time-frequency
decomposition methods is beyond the scope of this thesis, but fortunately these
methods tend to return similar results (Le Van Quyen et al., 2001), so I will focus
on time-frequency decomposition using the continuous Morlet wavelet transform,
as implemented in SPM and employed in the work presented here.
Acquisition and analysis of EEG signals
71
2.3.1 Pre-processing of EEG signals
Before subjecting recorded EEG signals to advanced time-series data analysis
and statistical analysis, a number of critical pre-processing steps are usually
applied in order to attenuate noise retained in the data, without losing valuable
information contained in the signal. Although it is crucial to obtain clean high-
quality data by minimizing biological and technical noise during EEG data
acquisition (as outlined above), the EEG signal inevitably represents a mixture of
signal and noise. Therefore, in order to make inferences about true task-related
activity changes, rather than noise, different pre-processing strategies need to be
applied, however no standardized procedure exists. Since the choice of
transformations applied to the data generally depend on the type of advanced
data analysis and their tolerance to noise, here, only the commonly applied pre-
processing steps are briefly outlined (Cohen, 2014).
Due to the complex interaction between bad electrodes and referencing, the first
step generally involves the removal or interpolation of bad electrodes prior to re-
referencing and further pre-processing steps. Filtering the EEG data using high-
pass, low-pass and notch filters removes high frequency artefacts (i.e. due to
muscle contraction or aliasing), low-frequency drifts (i.e. due to sweating or drifts
in electrode impedance), and electrical line noise typically occurring at 50 Hz or
60 Hz. Since the EEG signal is usually recorded at a high sampling rate, but most
research focuses on frequencies typically below 100 Hz, next the signal is
downsampled in order to save processing time and disk space. It is important to
point out that it is essential to perform downsampling after filtering with regards
to the Nyquist theorem (Srinivasan et al., 1998).
Investigating task-related changes in the EEG requires epoching of continuous
data around triggers that mark particular experimental events (time = 0). For time-
frequency-based analyses, the length of the epochs should be longer than the
analysed time period in order to provide “buffer zones”, which can later be
removed. These buffers avoid edge artefacts in the wavelet analysis that result
from applying filters to sharp edges, such as the first and last points of the EEG
epochs (Cohen, 2014).

Acquisition and analysis of EEG signals
72
Finally, artefacts in individual trials should be detected and removed by means of
visual inspection or automatic detection procedures. Rejecting EEG trials with
artefacts larger than a preset value is the most commonly used automatic method
in research settings. While automatic procedures are fast and free of user bias,
they only work efficiently for well-known artefacts. As such, visual inspection of
the data should be performed independent of whether automatic artefact rejection
approaches are employed in order to ascertain robust performance of the applied
automatic method (Gross et al., 2013). It is common for EEG studies to monitor
behavioural and physiological events during the recording and as such, this
information can additionally be used to guide the identification and removal of
artefacts based on i.e. task performance, electromyography (EMG) or oculomotor
activity. Since trial rejection can lead to large amounts of useful information being
discarded, it once again stresses the importance of minimizing noise during the
time of recording to ensure optimal data. Another strategy that can be applied
uses signal-processing techniques to deal with artefacts, especially those that
arise from eye movements and blinks, while preserving the EEG signal. These
artefact correction methods rely on linear transformation or regression techniques
(Ille et al., 2002; Schlögl et al., 2007; Wallstrom et al., 2004).
2.3.2 Time-frequency analysis using wavelet transform
Once the EEG signal has been pre-processed, the signal can be spectrally
decomposed using a variety of transformation methods that extract two
characteristics of the sine wave at a given frequency: magnitude and phase. This
is accomplished by convolution, a windowed transformation centered on an EEG
segment that multiplies the raw data. In general, a sliding time window is
employed in order to characterize changes in the time-frequency representation
of power. This can be done either with a time window that has a fixed length, or
decreases in length with increased frequency. The latter principle underlies the
class of frequently applied continuous wavelet transforms, which are
advantageous since they allow flexible optimization for either high frequency
resolution or time resolution (Cohen, 2014).
Wavelets are a waveform of limited duration that have an average value of zero
and which are computed by multiplying an envelope function (e.g. Gaussian

Acquisition and analysis of EEG signals
73
function) with a complex oscillation. One common type of biologically plausible
wavelet is a Morlet wavelet that has the largest magnitude at the centre time point
and tapers off to zero at both ends. Morlet wavelets are well suited for localizing
frequency information in time, but have a poorer frequency resolution. This
illustrates an important property of wavelets and other common decomposition
methods, which strike a compromise between time and frequency resolution
(Figure 2.3). It is common practice to use fewer cycles of the wavelet for lower
frequencies and more cycles for higher frequencies (e.g. (Le Van Quyen et al.,
2001)). Regardless of the decomposition method applied, the resulting
magnitude and phase characteristics of EEG oscillations for every trial, time point,
frequency and electrode are extracted and can be used to calculate numerous
measures that describe different aspects of dynamic brain function. Additionally,
the application of source localization methods to temporal dynamics of spectral
power reveals the source of oscillatory activation
Figure 2.3 | Trade-off between time and frequency resolution.
Spectral decomposition of EEG/MEG signals represents a trade-off between
precision in the time and frequency domain. In general, the larger the time window
used for time-frequency estimation, the greater the frequency resolution but at

Acquisition and analysis of EEG signals
74
the expense of poorer time resolution. Wavelets (third row) are generated by
multiplying a Gaussian (top row) with a short (A) or long (B) duration with a
complex oscillation (second row).Convolving an ERP with the wavelet, then
results in the time-frequency spectrogram (bottom row) with different time and
frequency resolutions depending on the length of the Gaussian. Figure taken from
(Herrmann et al., 2014), with permission of Springer.
2.3.2.1 Time-frequency power
The power of an oscillation refers to the amplitude or height of the sine wave’s
peak. Since time-frequency power obeys a 1/f scaling, whereby power at high
frequencies has a much smaller magnitude than power at lower frequencies
(Linkenkaer-Hansen et al., 2001), raw event-related power is not the most
informative. In order to observe event-related changes in the EEG signal, power
is typically normalized with respect to a pre-event baseline. Several baseline
normalization methods are commonly used, such as simple baseline subtraction,
decibel conversion or expressing power in percentage relative to a baseline.
While different baseline transformations yield similar results, they are not identical
and express power on different scales (i.e. logarithmic vs linear). The normalized
power is then averaged across trials. Two types of signal power can be
distinguished based on their phase-relationship to the stimulus. While evoked
power refers to changes in oscillatory power that are phase-locked to the stimulus
onset, induced power is not. To estimate evoked power, the signal is averaged
across trials prior to time-frequency analysis, whereas the estimation of induced
power requires that time-frequency decomposition is performed first for each trial
first and the ensuing power is then averaged (David et al., 2006).
Besides power, other measures can be derived such as phase-locking factor
(PLF) (Lachaux et al., 1999), which provides information regarding the phase
angle consistency of oscillations with respect to an event’s onset, or coherence,
which refers to the coupling of frequency spectra between EEG channels as a
proxy of the brain’s regional and interregional connectivity.
Methods
75
Methods
In this chapter, I introduce the methodological techniques implemented in this
thesis to investigate the oscillatory correlates of individual differences in learning
and retention of newly acquired motor skills. I outline the temporal structure of the
studies, how the applied methods were developed and summarise the
experimental considerations that were made.
3.1 Experimental design
In order to interrogate the neurophysiological processes underlying an
individual’s ability to learn and retain motor skills, it was necessary to establish
that EEG-derived beta oscillatory measures are stable over time, validating the
notion that these measures reflect meaningful individual differences. Since the
reliability of EEG-derived measures might vary as a function of frequency band,
brain region and type of task (Friedrich et al., 2013; Krause et al., 2001; Neuper
et al., 2005), I firstly established the intra-individual reliability of beta oscillatory
measures for the specific motor task applied (Chapter 4). For this purpose, I
repeatedly tested healthy subjects on a simple motor task (see section 3.2.3 for
details) over a period of approximately 12 weeks. The time interval between
sessions varied from one week for the first five sessions to six weeks between
the fifth and sixth EEG session. By using variable time intervals between EEG
sessions (Figure 3.1), it was possible to test for a systematic influence of interval
length (i.e. 1 week, 2 weeks, 5 weeks) on test-retest reliability, which is of
relevance for studies designed to test longitudinal changes in clinical and non-
clinical populations or therapeutic interventions.

Methods
76
Figure 3.1 | Timeline of experiment in Chapter 4.
Subjects’ EEG was repeatedly recorded over six sessions during the
performance of the simple motor task. The time interval between sessions varied
from one week for the first five sessions (S1–S5) to six weeks between the fifth
and sixth EEG session (S6).
In Chapter 5 and Chapter 6, I then combined neuroimaging and motor learning
in order to probe the link between beta oscillatory activity and the degree to which
individuals learn and retain newly acquired motor skills in the context of healthy
ageing and after stroke. Specifically, subjects underwent short-term training on a
motor learning task (see section 3.2.2 for details), and were subsequently
retested for their ability to retain the acquired motor skill following a short or longer
time delay: 45–60 min (retest1 on day 1) and 24 hours (retest2 on day 2) after
initial training. Fatigue or boredom associated with practice can temporarily
depress performance (Adams, 1961; Brawn et al., 2010; Rickard et al., 2008;
Schmidt and Wrisberg, 2008b), resulting in an underestimation of the actual level
of learning. Thus, the purpose of the retest1 session was to allow any temporary
effects that the training session might have created to dissipate, thus only leaving
the fairly permanent learning effects. The purpose of the retest2 session was to
additionally allow motor memory consolidation to occur and thus, assess
retention of the previously acquired motor skill after a night’s sleep.
Electroencephalography (EEG) recorded during the performance of a separate
motor task, not used during training, was used to assess beta oscillatory activity
before (Pre), immediately after (Post1) and 24-hours after (Post2) the initial
training phase (Figure 3.2). This experimental design enabled investigating
whether (i) pre-training or (ii) post-training beta oscillatory activity is associated
with individual differences in short-term motor learning behaviour. By recording
beta oscillatory activity during the performance of a separate task, not used for

Methods
77
training, but which employed comparable motion features, it was possible to
investigate the generic properties of brain activity and their relation to motor
learning.
Figure 3.2 | Timeline of experiments in Chapter 5 and Chapter 6.
EEG was recorded during the performance of a simple motor task before (Pre)
and at two time points after the training phase (Post1 and Post2). Performance
on the motor learning task was retested after a time delay on the same day
(retest1 on day 1, 45–60 min after initial training) and the following day (retest2
on day 2, 24-hours after initial training).
3.2 Motor tasks
For the purposes of this thesis, it was necessary to design two motor tasks, one
that assayed an individual’s motor learning capacity (Chapter 5 and Chapter 6),
and one that elicited reliable EEG-derived beta oscillatory dynamics (Chapter 4,
Chapter 5 and Chapter 6). For Chapter 5 and Chapter 6, employing principles
from previous motor learning studies (e.g. (Al-Sharman and Siengsukon, 2014;
L. a Boyd and Winstein, 2004; Boyd and Winstein, 2006; Pew, 1974; Shea et al.,
2001b; Siengsukon and Boyd, 2009; Wulf and Schmidt, 1997)), I developed a
novel instantiation of the continuous tracking task. Specifically, the motor learning
task required subjects to perform wrist flexion and extension movements in order
to continuously track a target moving along a smooth trajectory on a fixed arc at
an individually adjusted velocity. For Chapter 4, 5, and 6, I developed a separate
simple motor task that required subjects to perform visually cued wrist flexion and
extension movements to engender strong, reproducible movement-related beta
dynamics. In order to allow for greater motor improvements with training, both
motor tasks were performed with the non-dominant (Chapter 4 and Chapter 5)
or contralesional (affected) hand (Chapter 6). All tasks were presented using my

Methods
78
own custom written software routines in Matlab (version R2013b; The
MathWorks, Inc., Natick, MA, USA).
3.2.1 Apparatus
As dexterous movements are often impossible for people with upper limb (UL)
impairment, and might be compromised with healthy ageing (Martin et al., 2015),
I chose to implement motor tasks that employed wrist movements with reduced
dexterity demands compared to finger movements (i.e. more gross than fine
movements). By implementing an instrumented wrist rig with a built-in
potentiometer, developed by a group in Southampton (Burridge et al., 2009; Turk
et al., 2008), it was possible to record the angular displacement around the wrist
joint in the horizontal plane (maximum range 180°, 90° into flexion and extension,
respectively). Throughout all experiments, subjects were seated in front of a
computer monitor (41 x 25 cm) with their non-dominant hand or contralesional
(affected) hand rested in the moulded splint of the wrist rig (Figure 3.3). The wrist
rig’s cuff was inflated to a comfortable level, and the forearm strapped to a
cushioned arm support with the shoulder joint in a neutral position and the elbow
joint angle between 80°–90° of flexion. This set-up prevented hand and arm
movement during the experiments, thus ensuring that movements were restricted
to the wrist.
Wrist angular displacement was sensed by the potentiometer, fixed with its axis
coaxial to the axis of rotation of the wrist joint. A displacement of 0° indicated a
neutral position of the wrist, with the hand being in the same plane as the forearm.
The angular position of the wrist was continuously sampled at 100 Hz via a data
acquisition box containing A/D and D/A converters (USB-1408FS and USB-
1608FS, respectively, Measurement Computing, Norton, MA, USA) and sent via
an optical USB link (Rover 200, Amplicon, Brighton, UK) to the computer for
storage and display. The subject’s angular position of the wrist was continuously
displayed on the computer monitor (refresh rate 60 Hz) as a cursor in the form of
a red circle – hereafter referred to as “wrist cursor”. Flexion movement of the left
wrist moved the wrist cursor to the right, while wrist extension caused the cursor
to move left and vice versa.
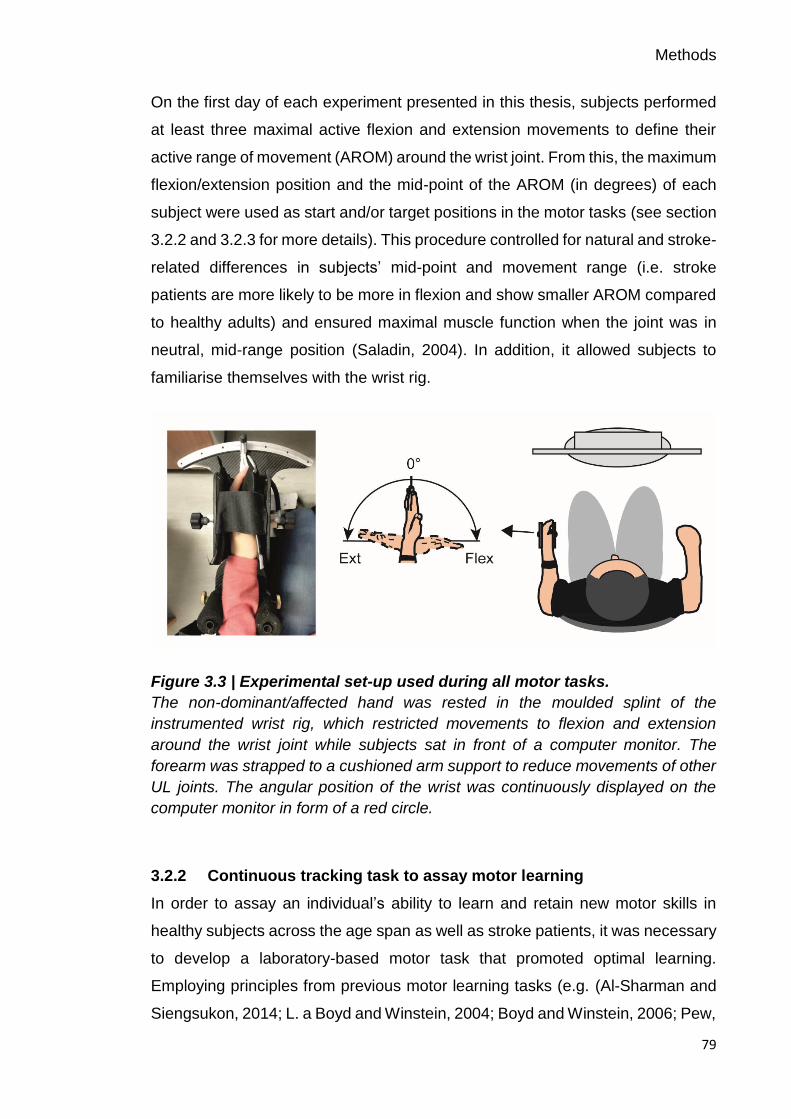
Methods
79
On the first day of each experiment presented in this thesis, subjects performed
at least three maximal active flexion and extension movements to define their
active range of movement (AROM) around the wrist joint. From this, the maximum
flexion/extension position and the mid-point of the AROM (in degrees) of each
subject were used as start and/or target positions in the motor tasks (see section
3.2.2 and 3.2.3 for more details). This procedure controlled for natural and stroke-
related differences in subjects’ mid-point and movement range (i.e. stroke
patients are more likely to be more in flexion and show smaller AROM compared
to healthy adults) and ensured maximal muscle function when the joint was in
neutral, mid-range position (Saladin, 2004). In addition, it allowed subjects to
familiarise themselves with the wrist rig.
Figure 3.3 | Experimental set-up used during all motor tasks.
The non-dominant/affected hand was rested in the moulded splint of the
instrumented wrist rig, which restricted movements to flexion and extension
around the wrist joint while subjects sat in front of a computer monitor. The
forearm was strapped to a cushioned arm support to reduce movements of other
UL joints. The angular position of the wrist was continuously displayed on the
computer monitor in form of a red circle.
3.2.2 Continuous tracking task to assay motor learning
In order to assay an individual’s ability to learn and retain new motor skills in
healthy subjects across the age span as well as stroke patients, it was necessary
to develop a laboratory-based motor task that promoted optimal learning.
Employing principles from previous motor learning tasks (e.g. (Al-Sharman and
Siengsukon, 2014; L. a Boyd and Winstein, 2004; Boyd and Winstein, 2006; Pew,

Methods
80
1974; Shea et al., 2001b; Siengsukon and Boyd, 2009; Wulf and Schmidt, 1997),
a complex continuous tracking task was utilized, requiring subjects to perform
smooth wrist movements in the wrist rig. The idea that “motor tasks represent
different challenges for performers of different abilities” suggests that by adjusting
task difficulty with regard to an individual’s skill level, motor learning can be
optimized (challenge point framework, (Guadagnoli and Lee, 2004)). Therefore,
factors such as task difficulty appropriate for an individual’s level of motor system
and cognitive function, and the respective implemented task characteristics are
outlined in the following sections.
3.2.2.1 Task design
The task involved tracking a circular target (in yellow) that moved back and forth
along a fixed arc through a predefined sequence of 12 positions (Figure 3.4). The
target always started and finished at the individual AROM mid-point position. In
Chapter 5, the maximum range of the target motion was defined as ±45° around
the AROM mid-point position of each subject (90° in total). In Chapter 6 the
maximum range of the target motion was reduced slightly, ranging from -30° to
+30° around the AROM mid-point position (60° in total), to allow the inclusion of
patients with more severe motor impairment and thus, smaller AROM.
Each block of the task consisted of two types of sequences, one random and one
repeated sequence presented in random order, with a 3 s stationary target
between both. Thus, within each block, subjects were given variable practice on
the two types of sequences. The repeated sequence was identical throughout
each block of the training and retest sessions, and randomly selected from a pool
of 57 predefined, difficulty-matched sequences. Each random sequence was
encountered only once; however, the same set of difficulty-matched sequences
was used across subjects to ensure comparable learning processes between
individuals. This design allowed differentiating between sequence-specific
(repeated sequence) and general (random sequence) skill learning (Wulf and
Schmidt, 1997) as discussed in Chapter 1 section 1.1.1, while accounting for
ordering effects such as fatigue or boredom (Adams, 1961). Please refer to
section 3.2.2.2 and section 3.2.2.3 for details about the training and the
sequences.

Methods
81
Figure 3.4 | Design of continuous tracking task.
A, Subjects were trained to track a target (yellow circle) moving back and forth
along a fixed arc as accurately and smoothly as possible. Online visual feedback
in terms of a colour change of the wrist cursor (red to green) was provided at
times when the wrist cursor was located inside the circular target. B, Original
recordings during the continuous tracking task at the beginning and end of the
initial training are shown for the repeated sequence of an example subject. The
solid black line represents the motion of the target, while the dashed red line
represents the motion of the wrist. C, Between-block display of feedback score (-
100 to 100; positive value in green reflects improvement, while decrements were
displayed as negative values in red), reflecting the performance in the current
block relative to the performance in the previous block, and forced-choice
question about awareness of repeated sequence.
3.2.2.2 Training
Each healthy subject (Chapter 5) and stroke patient (Chapter 6) was trained on
the continuous tracking task for 40 blocks (20–40 min), with each block
presenting both types of sequences (random and repeated). The number of
blocks, and thus time spent on the task, was chosen to ensure that subjects’
tracking performance improved beyond pre-training levels, considering the power
law of practice (see Chapter 1 section 1.1.1.3, (Newell and Rosenbloom, 1980)),
Methods
82
while minimising performance-dampening factors associated with practicing too
long, thus aiming for optimal training benefits. Subjects’ tracking performance
was retested at two different time points: 45–60 min (retest1 on day 1; 5 blocks)
and 24 hours (retest2 on day 2; 10 blocks) after initial training (Figure 3.2). These
retest sessions allowed (i) temporary effects such as fatigue or boredom that build
up over the course of training (Brawn et al., 2010; Rickard et al., 2008) to
dissipate, thus only leaving the fairly permanent learning effects, and (ii)
consolidation of motor memories to occur, resulting in stabilization, decrement or
enhancement of acquired motor skills after a night’s sleep (Robertson et al.,
2004a; Walker, 2005). Importantly, subjects were retested on the identical
repeated sequence that they encountered during the training phase.
Instructions to move the wrist so as to shift the red wrist cursor to match the
movement of the target as ‘accurately and smoothly as possible’ were given at
each session. Tracking performance was defined as the accuracy (in Root Mean
Square Error; RMSE) with which the subject tracked the target movement. Please
refer to section 3.7.1.1 for details about kinematic analysis.
As discussed in Chapter 1 section 1.1.1.3, extrinsic feedback has been shown
to generally enhance a person’s ability to learn (for review see (Magill, 1994;
Schmidt, 1991; Sigrist et al., 2013; Swinnen, 1996)). As such, online visual
feedback in terms of a colour change of the wrist cursor (from red to green) was
provided at times when the subject positioned the wrist cursor inside the circular
target (Figure 3.4A). In addition, at the end of each block, subjects were made
aware of their change in tracking performance by presenting a score on the
screen, which reflected the performance in the current block relative to the
performance in the previous block. Therefore, each training block was inter-
leaved with at least 30 s of rest, reducing the accumulation of fatigue or
attentional factors.
Prior to the start of training, subjects received explicit verbal information regarding
the presence of a repeated sequence along with a random sequence in every
block. However, they were not shown the repeated sequence. To determine the
time point at which participants gained explicit knowledge of the repeated
sequence, after each block they had to decide (forced-choice) which of the two
sequences within each block the repeated sequence was – i.e. tell the

Methods
83
experimenter whether it was the first or second sequence they tracked within the
block (Figure 3.4C). The trajectories of the target and subject’s wrist cursor did
not leave a residual trace on the screen and hence, subjects could not visualize
the entire target sequence.
3.2.2.3 Difficulty-matched sequences
A set of different sequences of approximately equivalent difficulty were selected
based on a pilot study of N = 4 independent subjects to ensure that changes in
tracking performance were associated with learning and not with general
variability due to differences in sequence difficulty or saliency. Each sequence
was composed of six evenly spaced positions, three in flexion and extension
range, respectively (i.e. 0: position 1/6: AROM midpoint ±45°, position 2/5: AROM
midpoint ±30° and position 3/4: AROM midpoint ±15°), repeated twice, and
started and ended at the individual AROM mid-point (Figure 3.5A). Sequences
only differed in the order of these positions (i.e. AROM midpoint–4–3–1–4–6–5–
2–4–2–6–2–1–AROM midpoint) and were matched for the number of flexion and
extension movements (median = 6) as well as absolute path length (median =
36). In total, 57 pre-designed, difficulty-matched sequences were used
throughout the experiments in Chapter 5 and Chapter 6 from which the repeated
sequence was randomly selected for each participant. Even though sequences
were difficulty-matched, the random assignment of a different repeated sequence
for each subject additionally guarded against the possibility of selecting a
repeated sequence that was easier to track or more identifiable. This was a
methodological issue identified in the tracking task originally used by Wulf and
Schmidt (Chambaron et al., 2006; Wulf and Schmidt, 1997).
3.2.2.4 Smooth target trajectories
In order to ensure smooth target motion through the sequence positions, the
minimum jerk trajectories (Flash and Hogan, 1985; Hogan, 1984) were generated
– i.e. movement paths that have the smallest possible rate of change in
acceleration (jerk). In general, if the target moved from its location x = xi to x = xn

Methods
84
in t = d seconds, the minimum jerk trajectory was calculated using the following
function:
𝑥(𝑡) = 𝑥𝑖 + (𝑥𝑛 − 𝑥𝑖) ∗ 10𝑡/𝑑3 − 15𝑡/𝑑4 + 6𝑡/𝑑5
Equation 3.1
This fifth-order polynomial was piece-wise computed between the current
position xi and the next position xn given a desired time for the point-to-point
movement. The resulting trajectories have smooth position curves (Figure 3.5B)
and resemble a bell-shaped velocity profile with the target accelerating and
decelerating between successive positions. This is important, as previous studies
have demonstrated that tracking performance improves with the target following
biologically plausible trajectories compared to non-biological motion (Carlini and
French, 2014; Pozzo et al., 2006).
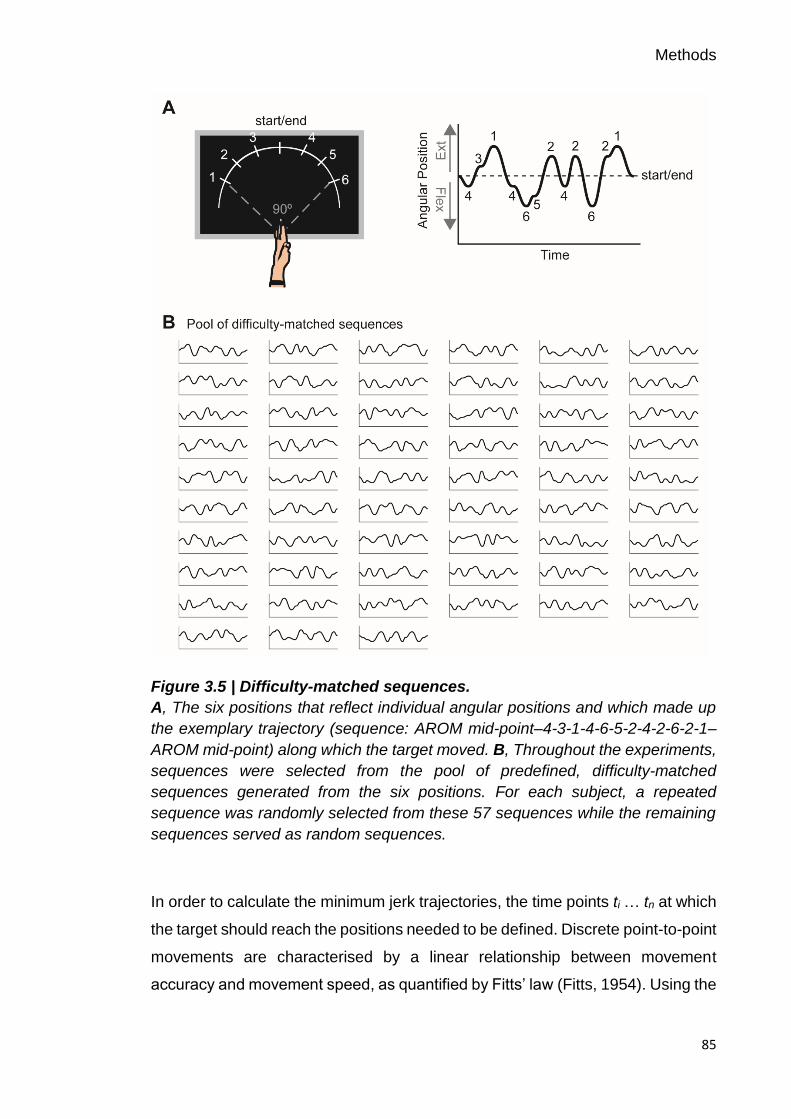
Methods
85
Figure 3.5 | Difficulty-matched sequences.
A, The six positions that reflect individual angular positions and which made up
the exemplary trajectory (sequence: AROM mid-point–4-3-1-4-6-5-2-4-2-6-2-1–
AROM mid-point) along which the target moved. B, Throughout the experiments,
sequences were selected from the pool of predefined, difficulty-matched
sequences generated from the six positions. For each subject, a repeated
sequence was randomly selected from these 57 sequences while the remaining
sequences served as random sequences.
In order to calculate the minimum jerk trajectories, the time points ti … tn at which
the target should reach the positions needed to be defined. Discrete point-to-point
movements are characterised by a linear relationship between movement
accuracy and movement speed, as quantified by Fitts’ law (Fitts, 1954). Using the

Methods
86
logarithmic model proposed by Fitts, movement time (MT) is a function of the
target width (W) relative to the distance (A) as described by the following function:
MT = a + b ∗ 𝑙𝑜𝑔2 (2𝐴
𝑊) ,
Equation 3.2
where a and b are empirical constants. Fitts’ law thus demonstrates that there is
a speed-accuracy trade-off when performing aimed rapid movements. The
constants a and b were experimentally determined based on regression analysis
of pilot movement time data acquired from the wrist rig (N = 1; only A was
randomly changed). Please refer to Figure 3.6 for values of a and b.
Figure 3.6 | Linear regression model of actual wrist movement time data.
The relationship between movement time (MT) and the index of difficulty, defined
as log2(2A/W), was fitted as MT=155.8 + 282.3 * log2(2A/W), with R2=0.91. The
constant a was defined as 155.8 ms, a time specific to the apparatus, while the
slope coefficient, b, was 282.3 ms.
3.2.2.5 Individualisation of target velocity
Previous motor learning studies employed tracking tasks that either used a fixed
target velocity (Al-Sharman and Siengsukon, 2014; Ao et al., 2015; Siengsukon
and Al-sharman, 2011; Siengsukon and Boyd, 2009; Wadden et al., 2015) or a
percentage of an individual’s maximum movement speed (Wu et al., 2014).
However, to avoid any between-subject differences in baseline tracking
performance at the beginning of the training, and to ensure sufficient room for

Methods
87
learning-related improvement in healthy subjects and stroke patients, I chose to
implement an adaptive up-down staircase procedure that individually determined
the average velocity with which the target moved along the arc.
On any given trial of this procedure, the target velocity was adjusted
(e.g. increased or decreased) dependent on the subject’s preceding tracking
performance, using five different step sizes. Initially, the target velocity was slow
and thus, easy to track (initial target velocity = 34.8 deg/s). Then, the target
velocity was modified until a pre-specified performance criterion range
(15±0.9 RMSE) was reached, using varying step sizes dependent on the current
tracking performance relative to the criterion range (95–100 % criterion:
0.0025 ms; 90–95 criterion: 0.005 ms; 75–90 % criterion: 0.010ms; 50–75 %
criterion: 0.025 ms; and ≤ 50 % criterion: 0.050 ms). The staircase was
interrupted when the tracking performance in three consecutive trials achieved
the criterion, and the final target velocity was defined as the mean velocity of
these last three trials (Figure 3.7). On average, this procedure took ~2±0.50 min.
The individually determined target velocity with which subjects were
subsequently trained on the continuous tracking task was applied to all sessions.
Additionally, this procedure allowed for habituation to the task on day 1, thus
reducing large warm-up decrements at the beginning of the training phase
(Adams, 1961).
Figure 3.7 | Adaptive procedure for individual target velocity adjustment.
Example performance of three subjects (left: young subject; middle: elderly
subject; right: stroke patient) on the adaptive up-down staircase procedure. The
target velocity started off slow and was then adjusted using five different step
sizes until a pre-specified criterion range was achieved (grey dashed lines) for at
least three consecutive trials.

Methods
88
3.2.3 Simple motor task to engender reliable beta oscillatory dynamics
By implementing a separate simple motor task with controlled wrist movements,
it was possible to engender stereotypical movement-related modulations in beta
oscillations in order to link them to individual differences in motor learning. The
task required subjects to respond to the trial-wise presentation of one of two
visual targets by performing wrist movements in the wrist rig while EEG was
recorded. During each trial, wrist movements were always initiated from the same
start position located at the centre of the screen, which represented the subject’s
individual AROM mid-point (see section 3.2.1 for details about AROM
measurement). The cue to perform wrist flexion or extension movements was the
random appearance of one of two squared targets (in blue) located on the left or
right and equidistant from the central start position (Figure 3.8). Each of the
targets represented the subject’s maximum wrist flexion or extension position.
This design controlled for the end position of the movement and ensured that the
movement distance in each condition was the same; however, the actual
movement distance between subjects was different based on their AROM.
Subjects were instructed to move the wrist upon presentation of the target so as
to shift the red wrist cursor from the central start position to match the position of
the target in a ‘quick and discrete movement’. They were also asked to move as
soon as possible and to avoid anticipation or guessing of target appearance. The
target position was displayed for 3 s and subjects had to maintain the wrist cursor
inside the blue target until being cued to return to the initial start position. Once
subjects returned to the start position, the next cue to move was delivered
following a delay of 7±1 s. This time interval between task epochs was chosen to
account for the longevity of movement-related beta activities (Jurkiewicz et al.,
2006), thus avoiding temporal overlap of neuronal activity. The task comprised
120 trials (60 trials for flexion and extension, respectively), and subjects were
instructed to minimize eye movements by focusing on a centrally located fixation
cross. Movement execution was analysed with regard to reaction time (RT,
interval between visual cue and movement onset), movement time (MT, interval
between movement onset and movement termination) and peak velocity (PV).
Please refer to section 3.7.1.2 for details about kinematic analysis.
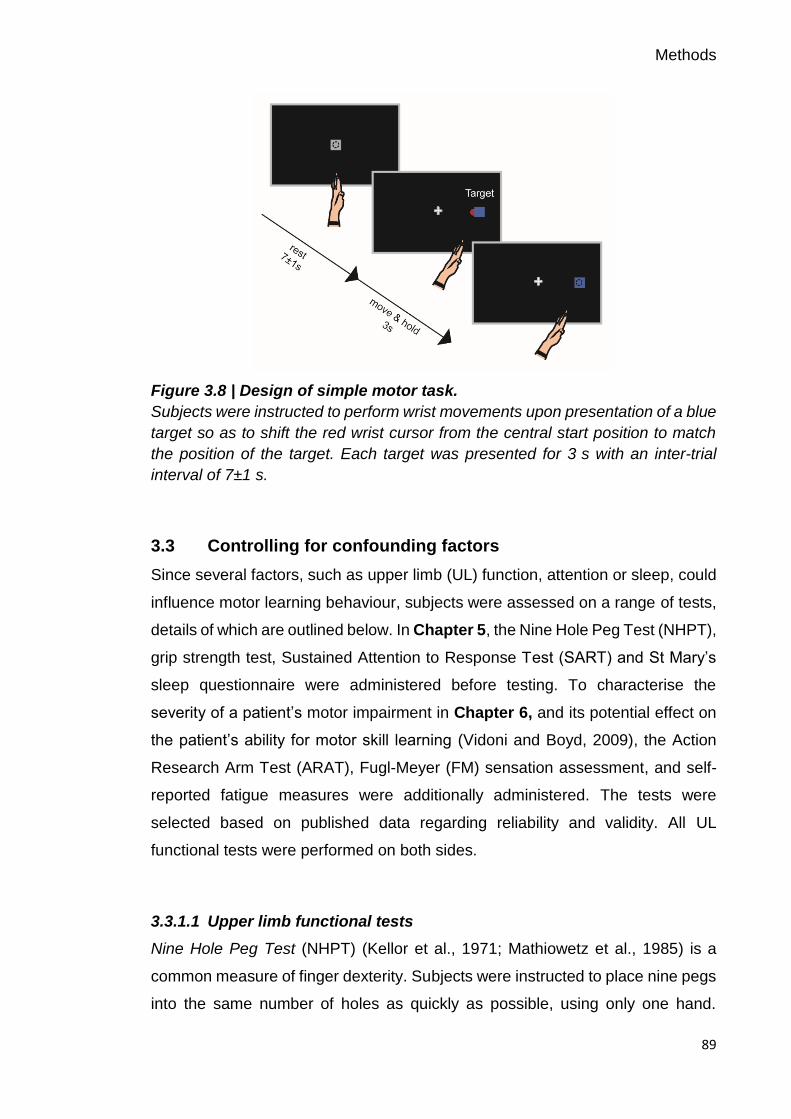
Methods
89
Figure 3.8 | Design of simple motor task.
Subjects were instructed to perform wrist movements upon presentation of a blue
target so as to shift the red wrist cursor from the central start position to match
the position of the target. Each target was presented for 3 s with an inter-trial
interval of 7±1 s.
3.3 Controlling for confounding factors
Since several factors, such as upper limb (UL) function, attention or sleep, could
influence motor learning behaviour, subjects were assessed on a range of tests,
details of which are outlined below. In Chapter 5, the Nine Hole Peg Test (NHPT),
grip strength test, Sustained Attention to Response Test (SART) and St Mary’s
sleep questionnaire were administered before testing. To characterise the
severity of a patient’s motor impairment in Chapter 6, and its potential effect on
the patient’s ability for motor skill learning (Vidoni and Boyd, 2009), the Action
Research Arm Test (ARAT), Fugl-Meyer (FM) sensation assessment, and self-
reported fatigue measures were additionally administered. The tests were
selected based on published data regarding reliability and validity. All UL
functional tests were performed on both sides.
3.3.1.1 Upper limb functional tests
Nine Hole Peg Test (NHPT) (Kellor et al., 1971; Mathiowetz et al., 1985) is a
common measure of finger dexterity. Subjects were instructed to place nine pegs
into the same number of holes as quickly as possible, using only one hand.

Methods
90
Subjects performed three timed repetitions, and the average score, expressed as
the number of pegs/sec, was taken for each individual.
Grip strength is a dynamometer measurement of the maximum force produced
during a five-finger grip. With verbal encouragement from the experimenter,
subjects squeezed the dynamometer with maximum isometric effort. The average
score of three attempts, in pounds, was taken for each individual.
Action Research Arm Test (ARAT) (Yozbatiran et al., 2008) is an assessment of
a patient’s ability to handle objects of varying sizes, weights and shapes with their
contralesional (affected) and ipsilesional (unaffected) limb. It consists of 19 items
and each of the four subscales - grasp, grip, pinch, and gross movement - are
ordered according to ascending difficulty. Patients are scored on a four-level
ordinal scale (0-3) and the maximum score is 57 for each arm, with a higher score
indicating better arm motor function.
3.3.1.2 Sensation assessment
Fugl-Meyer sensation and proprioception is an assessment of upper limb
sensation in patients. Sensation was assessed as absent, impaired, or normal for
light touch (with a cotton ball) and proprioception (small alterations in the position)
of the contralesional (affected) UL without visual input. The maximum score is 12,
with a lower score indicating loss of sensation in the affected UL.
3.3.1.3 Cognitive test
Sustained Attention to Response Test (SART) (Robertson et al., 1997) is a
computerised task that assesses an individual’s ability to sustain their attention
during a ~4 min long task. Subjects were asked to respond to the appearance of
a number from 1–9 by pressing a button, except when the number 3 appeared.
In total 225 trials are presented, of which 25 demand withholding a button press
in response to the number 3. Subjects were instructed to give equal importance
to accuracy and speed. The total error score (max score 225) and average
reaction time [ms] were measured.
Methods
91
3.3.1.4 Self-reported measures
In order to record self-reported measures of fatigue and sleep, computerised
versions of the following tests were implemented using visual analogue scales
(VAS) (see Appendix).
Fatigue Severity Scale (FSS) (Johansson et al., 2014; Krupp et al., 1989) and the
Neurological Fatigue Index (NFI) (Mills et al., 2012) are validated scales that
assess the impact of fatigue on stroke patients. The FSS consists of 7
statements, such as “Fatigue interferes with my physical functioning”. Patients
respond using a 7-point scale where low values indicate disagreement and high
values indicate agreement. The NFI consists of 12 statements and patients
respond using a 4-point scale: “strongly disagree”, “disagree”, “agree”, and
“strongly disagree”. The average score was taken for each patient, with higher
scores indicating higher fatigue.
St Mary’s sleep questionnaire (adapted from (Ellis et al., 1981)) is a self-reported
assessment of the quality of sleep. Subjects respond to questions such as “At
what time did you fall asleep last night?” and their sleep quantity [hours] and
quality (from 1–8) was evaluated for both nights before testing.
3.4 Subject recruitment
Subjects were independently recruited for each study. Healthy subjects (Chapter
4 and Chapter 5) were recruited from a volunteer database at the Institute of
Cognitive Neuroscience and the Sobell Department of Motor Neuroscience and
Movement Disorders, Institute of Neurology. Patients with chronic stroke
(Chapter 6) were recruited from a database of stroke patients at the Sobell
Department of Motor Neuroscience and Movement Disorders, Institute of
Neurology, which contains details from ~150 stroke patients. All studies were
approved by the National Hospital for Neurology and Neurosurgery, UCL
Hospitals NHS Foundation Trust and the local research ethics committee at
University College London where the study was conducted. All subjects gave
written informed consent in accordance with the Declaration of Helsinki. Please
refer to individual chapters for details about subject characteristics and inclusion
and exclusion criteria.

Methods
92
3.4.1 Sample size
In order to explore and detect a significant relationship between beta oscillatory
activity and individual differences in motor learning behaviour, I performed a
sample size calculation based on linear regression testing for association, with
four key explanatory variables (i) beta oscillatory signals, (ii) age, (iii) level of
impairment, and (iv) time since stroke (early and late). Estimates for a link
between beta oscillations and motor learning were taken from a study showing
an inverse correlation between the amount of beta power suppression and
improvements in a serial reaction time task (Pollok et al., 2014) (Pearson r=-0.67,
p<0.01, N = 15). The sample size calculation was based on the formula by Sokal
and Rohlf (Sokal and Rohlf, 2009) with a ρ2 = 0.25 (practical values suggested
by (Linnet, 1987) range from 0.1 to 0.3):
𝑛1 = (Z1−𝛼 + 𝑍1−𝛽)2 / C(r)2 + 3
(1 − 𝜌2)
Equation 3.3
Where the Fisher’s transformation is:
𝐶(𝑟) =1
2∗ log (
1 + r
1 − r)
Equation 3.4
In order to allow for comparison between healthy subjects and stroke patients, a
Bonferroni correction was applied, which set the type I error rate (α) equal to α/
number of comparisons. With these assumptions, an α value of 0.025 (α = 0.05 /
2) and a power (1–β, where β = type II error rate) of 0.8, a total of 36 healthy
subjects and 36 stroke patients were required. To account for the possibility of
drop-out and non-compliance, it was planned to recruit 40 healthy subjects in
Chapter 5 (20 young and 20 elderly adults), and 20 chronic stroke patients in
Chapter 6.
3.5 Electroencephalography (EEG)
As discussed in the Chapter 1 section 1.5, neuronal oscillations may be a marker
of GABAergic inhibitory and glutamatergic excitatory processes (Jensen et al.,
2005; Murakami and Okada, 2006; Yamawaki et al., 2008), which are one major
mechanism through which the potential for plasticity is regulated (Bavelier et al.,

Methods
93
2010; Benali et al., 2008; Traub et al., 2004). Thus, I used EEG to non-invasively
measure neuronal oscillations and reveal appropriate biomarkers to assess net
inhibitory and excitatory mechanisms in human cortex. EEG has several
advantages, making it a powerful method for scientific and clinical research as
discussed in more detail in Chapter 2 section 2.1.1. In particular, EEG does not
rely on intact neurovascular coupling (Blicher et al., 2012) which might be altered
after stroke, nor the presence of MEPs in affected muscles, both of which hinder
the use of fMRI and TMS in stroke patients. Furthermore, the high temporal
resolution of the spectral data allow the examination of state-dependent
dynamics during task-related movements (Lopes da Silva, 2013), which might
play an important role in the mechanisms of motor impairment after stroke.
While subjects performed the simple motor task (Chapter 4, Chapter 5 and
Chapter 6), scalp EEG (ANT Neuro, Asalab, The Netherlands) was continuously
recorded at 2084Hz using 64 electrodes mounted on an elastic cap (waveguard
EEG cap, ANT Neuro). Two EEG caps with different size ranges were used to
account for varying head sizes of subjects. The 64 electrodes were evenly
distributed over the scalp according to the international 10-20 EEG system. To
ensure comparable positioning of the EEG electrodes on separate days, the
distance between nasion and inion, and left and right preauricular points was
recorded for each subject. In order to lower the electrical impedance and allow
for the recording of a clearer electrical signal, an abrasive electrolyte gel (Abralyt
2000, Easycap GmbH, Germany) was used. In addition, subjects were asked to
wash their hair and to avoid hair spray or gels on the day of testing. The
impedance was kept below ≤5 kΩ and the EEG signal was referenced to Cz
during recordings. In order to align the oscillatory activity time-course with
experimental events occurring in the simple motor task (e.g. the precise timing of
the visual cues), separate triggers for each condition (flexion, extension) were
sent via the testing computer’s parallel port to the EEG system. For all EEG
recordings, subjects were asked to remain relaxed and minimize eye movements
by focusing on a centrally located fixation cross presented on the computer
screen.
Methods
94
3.6 Electromyography (EMG)
Throughout both motor tasks, movements of the non-dominant hand (Chapter 4
and Chapter 5) or contralesional (affected) hand (Chapter 6) were monitored by
surface EMG using bipolar electrodes (Kendall ECG neonatal electrodes,
Henleys Medical Supplies Ltd., UK) in a belly-tendon montage placed on the wrist
extensor (extensor carpi radialis, ECR) and flexor (flexor carpi radialis, FCR)
muscles. The ground electrode was positioned on the elbow. The raw EMG signal
was amplified and band-pass filtered (10 Hz to 500 Hz; D360 amplifier, Digitimer,
Hertfordshire, UK) and digitized at an A/D rate of 1 kHz per channel (CED Micro
1401, Cambridge Electronic Design, Cambridgeshire, UK). Please note that EMG
was purely recorded for monitoring purposes and not analysed in this thesis.
3.7 Data analysis
In order to link an individual’s cortical activity to his/her ability to learn and retain
new motor skills, the raw kinematic and EEG data needed to be reduced to
interpretable concepts or definitions. In the following, I describe the analysis
pipeline for (I) the measurement of different aspects of motor learning behaviour
and (II) the measurement of spectral dynamics of beta oscillations at EEG sensor
level. Analysis pipelines were identical between chapters unless stated
otherwise. All analyses were conducted using my own custom-written routines in
Matlab (version R2016a; The MathWorks Inc., Natick, MA, USA) and the SPM12
toolbox (Wellcome Trust Centre for Neuroimaging, www.fil.ion.ucl.ac.uk/spm).
For visualization of specific EEG data aspects, the fieldtrip toolbox ((Oostenveld
et al., 2011), www.ru.nl/fcdonders/fieldtrip/) was additionally employed.
3.7.1 Kinematic data
3.7.1.1 Continuous tracking task
The behavioural measure “tracking performance” on the continuous tracking task
(e.g. how accurately subjects tracked the target movement) in Chapter 5 and
Chapter 6 was parameterized by Root Mean Square Error (RMSE), a measure
that has been implemented by other motor learning studies (Al-Sharman and
Siengsukon, 2014; Boyd and Winstein, 2006; Roig et al., 2014; Siengsukon and
Methods
95
Boyd, 2009). RMSE captures the deviation of the wrist position (wi) from the target
position (ti), and serves as a composite measure of temporal and spatial
measurements of time lag and distance as calculated using the following
equation:
𝑅𝑀𝑆𝐸 = √∑ (𝑡𝑖 − 𝑤𝑖)2/𝑁𝑁𝑖=1 ,
Equation 3.5
where N is the total number of time samples of the sequence in each block. RMSE
was calculated for repeated and random sequences separately and averaged
across each block for the training and retest sessions. Thereby, smaller RMSE
values reflect better tracking performance. To quantify not only skill acquisition
over the course of training but also the ability to retain acquired motor skills after
training ended, performance during the first and last block of training and retest
sessions were probed.
However, performance on individual blocks are poor and noisy measures of
individual performance, and may be additionally biased by the warm-up
decrement at the beginning or fatigue at the end (Adams, 1961). As a solution,
and instead of simple averaging, I adopted a similar approach to a previous
learning study (Waters-Metenier et al., 2014), fitting a linear regression model
across 5 blocks at the beginning and end of individual training and retest
sessions. Using this fit, a corrected performance estimate of the first and last
blocks was derived and used for further analyses (see Figure 3.9).
The analysis then concentrated on six time points in order to assess tracking
performance across time: first block of training (T0), last block of training (T1),
first block of retest1 (T2), last block of retest1 (T3), first block of retest2 (T4), and
last block of retest2 (T5). As discussed in Chapter 1 section 1.1.1.1, various
processes can occur during time periods during which the task is not practised,
such as dissipitation of temporary effects (e.g. fatigue or boredom) (Brawn et al.,
2010; Rickard et al., 2008) and motor memory consolidation, which may result in
skill stabilization, enhancement or decrements (Hotermans et al., 2006;
Robertson et al., 2004a; Walker, 2005). As such, tracking performance at T2 is
most likely to reflect permanent learning effects unaffected by training-induced

Methods
96
temporary effects such as fatigue or boredom due to prolonged training, while
performance at T4 likely indexes retention of the acquired motor skill overnight,
due to motor memory consolidation. In the work presented, absolute levels of
performance rather than normalized changes (i.e. difference between baseline
and post-training performance) were used to assess the effect of training to avoid
the conceptual pitfall associated with additive or multiplicative normalization
approaches (Kitago and Krakauer, 2010). By implementing this analysis
approach, it was possible to interrogate the effects of age (Chapter 5) and stroke
(Chapter 6) on motor learning behaviour (referring to the performance on the
continuous tracking task), and assess changes in tracking performance at various
time points.
Figure 3.9 | Illustration of linear regression approach.
Dots represent performance in individual blocks on both types of sequences,
random and repeated, respectively, for an example subject from Chapter 5 during
training and retest sessions. Black lines represent linear regression models
across 5 blocks at the beginning and end of individual sessions. Corrected
performance estimates were derived from these linear regression models at six
different time points (T0 = first block of training, T1 = last block of training, T2 =
first block of retest1, T3 = last block of retest1, T4 = first block of retest2, and T5

Methods
97
= last block of retest2) and used for subsequent assessment of changes in
tracking performance with training.
3.7.1.2 Simple motor task
Movement execution during the simple motor task was analysed with regard to
reaction time (RT, interval between visual cue and movement onset), movement
time (MT, interval between movement onset and movement termination) and
peak velocity (PV). To this end, the angular position of the wrist, sampled at
100 Hz, was first filtered with a second-order zero-phase shift, low-pass
Butterworth filter (cut-off frequency of 10 Hz) and then, differentiated to calculate
velocity. Movement onset was defined as the time when the velocity of the wrist
exceeded a threshold of 5 % of the maximum velocity and sustained this speed
for at least 100 ms. Movement termination was defined as the time when the
velocity fell below the threshold for that trial for at least 500 ms (see Figure 4.1C
for exemplary wrist angular displacement and velocity profile). For each subject,
trials in which the movement was initiated before the cue signal (e.g. anticipatory
response), reaction time was excessively long (e.g. omitted response;
>mean ± 2.5 SD), or movement time was excessively long (e.g. response not
compliant with task demand of ‘quick and discrete’ movement; >mean ± 2.5 SD)
were discarded. As I will demonstrate in Chapter 4, movement kinematics of the
simple motor task were stable across sessions, a crucial prerequisite to engender
reliable EEG-derived beta oscillatory dynamics.
3.7.2 EEG data
In order to verify whether neuronal oscillations at beta frequency, associated with
motor system function, relate to an individual’s ability to acquire a new motor skill,
the raw EEG signal was pre-processed and time-frequency decomposed. The
following analysis pipeline was applied to EEG signals recorded during the
performance of the simple motor task in Chapter 4, Chapter 5, and Chapter 6.
The EEG signal was first offline re-referenced to the average signal across all
electrodes (Common Average Reference, CAR; (Mcfarland et al., 1997))
following removal of flat or very noisy electrodes. This technique removes
common activity unrelated to specific cortical processes, thereby leading to

Methods
98
spatially more localized activity patterns. Then, the signal was bandpass filtered
between 5–100 Hz, additionally filtered with a 50 Hz notch filter to reduce line
noise contamination, and downsampled to 300 Hz. Data were epoched from -1
to 9 s relative to visual cue onset (0 s) in order to probe cortical activity during
different movement phases (i.e. rest, movement, post-movement) of the simple
motor task. Although, the use of the wrist rig minimized undesired hand and arm
movement, poorly performed trials due to e.g. anticipatory or omitted responses
(see section 3.7.1.2) were excluded and the remaining EEG trials were visually
scrutinized. Trials containing artefacts, such as muscle activation or large eye
blinks, were additionally removed. Since the recorded EEG signal reflects a
mixture of cortical activity of different frequencies, artefact-free EEG time-series
from each single trial were decomposed into their time-frequency representations
in the 5–45 Hz range with frequency steps of 0.1 Hz in order to characterise
changes in the beta frequency band with task performance. A Morlet wavelet with
7 cycles for each frequency was used for the continuous wavelet transformation.
Then, power was averaged across all trials and rescaled in order to show
changes in power (P) relative to the corresponding pre-movement baseline
period (-1–0 s prior to cue onset), expressed as percentages of this baseline
power (Pref):
% power =𝑃 − 𝑃𝑟𝑒𝑓
𝑃𝑟𝑒𝑓∗ 100
Equation 3.6
Thus, a positive value indicates higher frequency band-specific power compared
to pre-movement baseline power and vice versa.
Spectral power time-series were then derived from a pre-selection of electrodes
overlying the sensorimotor cortices, both contralateral and ipsilateral to the
moving hand (MRBD: ‘C4’ ‘CP4’ ‘CP2’ and ‘C3’ ‘CP3’ ‘CP1’ for contra- and
ipsilateral hemispheres, respectively; PMBR: ‘C2’ ‘C4’ ‘CP4’ and ‘C1’ ‘C3’ ‘CP3’
for contra- and ipsilateral hemispheres, respectively). These electrodes were
selected based on the independent dataset presented in Chapter 4, which
showed that the most prominent task-related changes in beta activity were
observed in these electrodes when performing the simple motor task. These
bilateral electrodes were pooled as contralateral and ipsilateral regions of
Methods
99
interest, respectively. Please refer to Chapter 4 for details about electrode
selection from an orthogonal contrast (Kilner, 2013; Kriegeskorte et al., 2009).
Next, time-frequency windows were chosen based on peak changes in beta
activity in time-frequency maps of these bilateral sensorimotor regions, which
revealed clear movement-related beta-band (15–30Hz, (Jurkiewicz et al., 2006;
Van Wijk et al., 2012; Yamawaki et al., 2008)) activity in two distinct time windows
of interest in all experiments. This information was used to optimize the alignment
of constant duration (1 s) and width (15 Hz) time-frequency windows to capture
maximum Movement-Related Beta Desynchronization (MRBD), occurring
between cue onset and movement termination, and Post-Movement Beta
Rebound (PMBR), which emerges after movement cessation. Selected time-
frequency windows and electrodes applied to all subjects and sessions in
Chapter 4, Chapter 5 and Chapter 6, and were not adjusted individually. Please
refer to individual chapters for specifics about time-frequency window alignment,
which, in the case of PMBR, was shown to differ between younger and elder
adults in Chapter 5.
For each individual subject in each experiment, percentage decrease (MRBD)
and increase (PMBR) in beta power were extracted from the respective 1 s time
windows and averaged separately for each EEG session for the chosen
electrodes over each hemisphere. The absolute pre-movement (resting) baseline
beta (BB) power from -1 to 0 s relative to cue onset was also obtained. In Chapter
4, I additionally determined individual beta peak frequency for corresponding time
windows (BB, MRBD, and PMBR) and show that these measures are less reliable
compared to spectral power. Please refer to Chapter 4 for details about peak
frequency detection.
3.8 Statistical analysis
Unless stated otherwise, all data were assessed using parametric statistical tests
following confirmation of normal distribution of data using Kolmogorov-Smirnov
test. Specifically, a continuum of conventional statistical methods, including
ANOVAs, t-tests, Pearson’s correlations and stepwise multiple linear
regressions, were used to analyse the information present in the kinematic and
Methods
100
neurophysiological data acquired during the two motor tasks. In Chapter 4,
Intraclass Correlation Coefficient (ICC) were additionally employed to assess the
intra-subject reliability of the various estimates of beta activity under investigation
in this thesis. Significance for all procedures was set at a p-value below 0.05 and
effect sizes were measured using partial eta squared (ƞ2). Details of the various
ANOVAs, t-tests, correlational analyses, and ICCs are described in the relevant
chapters. All statistical procedures were performed using the statistical package
SPSS (IBM SPSS Statistics for Windows, Version 22.0, Armonk, NY: IBM Corp)
and custom-written Matlab routines.
Since the main objective of this work was to explore the oscillatory correlates of
individual differences in motor learning, and their predictive value (Chapter 5 and
Chapter 6), while accounting for possible influences of behavioural performance
on the motor learning task, as well as functional/clinical and demographic
characteristics, stepwise multiple linear regressions within leave-one-out cross-
validation (LOOCV) were performed. In the next section, I will briefly outline the
implemented statistical approach in more detail.
3.8.1 Stepwise multiple linear regression
Stepwise multiple linear regression is a multivariate method, which is used for
predicting the relationship between a single dependent variable (DV) and various
independent variables (IV), whilst removing or retaining variables based on their
statistical contribution. By removing candidate variables that do not significantly
contribute to the ability of the model to predict the dependent variable, this type
of regression analysis finds the “linear combination of predictors that correlate
maximally with the outcome variable” (Field, 2013).
The stepwise linear regression procedure with forward and backward algorithm
and inclusion/exclusion probability levels of αEnter<0.05/ αExclude>0.1 was
implemented using the ‘stepwiselm’ function contained in Matlab’s Statistics and
Machine Learning Toolbox. The stepwise method creates an initial model where
the most statistically significant independent variable is added to the model for
predicting the dependent variable (p<αEnter). Then, at every new iteration, a new
variable is added until there are no more variables that satisfy the p<αEnter
condition. Each time a predictor is added to the model, a backward elimination

Methods
101
method is applied to remove the least statistically significant variable (p>αExclude),
thus constantly reassessing the model. Hence, the stepwise procedure selects
the best predicting variables that maximally account for variance in the dependent
variable on a purely data-driven basis. However, since this type of linear
regression might be prone to overfitting, which is associated with models that
perform well on one data set but do not generalize to new data sets, a
cross-validation procedure was implemented.
3.8.2 Validation of model consistency
Cross-validation assesses the accuracy of a model across different samples, thus
evaluating whether the same set of predictors generalize to a different population
(Arlot and Celisse, 2010; Field, 2013). The approach consists in randomly
splitting the acquired data into a training and a test set. By fitting a regression
model to the training set, its accuracy on the test set can be evaluated, providing
an indication of the predictive strength of the regression model. In this thesis,
model performance was assessed employing the leave-one-out cross-validation
(LOOCV) approach. In this case, on any given fold of this K-fold procedure, only
one fold is spared as the test set, while the remaining data samples are used to
build the regression model (Figure 3.10). This cross-validation method is an
established procedure for assessing generalization of results to an independent
data set, particularly with smaller sample sizes (Huang et al., 2011; Kang et al.,
2014).
Methods
102
Figure 3.10 | Schematic of crossvalidation approach for model assessment.
A leave-one-out cross-validation (LOOCV) approach was employed in order to
assess the accuracy of the regression model to predict the dependent variable in
a different sample. This approach uses N-1 data samples to train the model and
then the model predicts the remaining test sample. The process is repeated N
times and the accuracy of the model is quantified by the correlation between
actual and predicted data. N is the total number of samples.
103
Intra-individual reliability of movement-
related beta oscillations
This chapter is based on work previously published as:
Espenhahn, S., de Berker, A. O., van Wijk, B. C. M., Rossiter, H. E.,
Ward, N. S. (2016) Movement-related beta oscillations show high intra-
individual reliability. NeuroImage 147, 175–185
4.1 Abstract
Despite increasing use of beta oscillatory activity in basic and clinical research,
surprisingly little is known about their test-retest reliability. Identification of the
oscillatory correlates underlying individual differences in the ability to learn and
retain new motor skills requires establishing that beta measures are stable over
time in healthy populations. In this chapter, I evaluate the intra-individual reliability
of beta-band oscillations over six sessions, focusing on changes in beta activity
during movement (Movement-Related Beta Desynchronization, MRBD) and after
movement termination (Post-Movement Beta Rebound, PMBR). Subjects’ EEG
was recorded while they performed the simple motor task introduced in Chapter
3. I assessed Intraclass Correlation Coefficients (ICC) and between-session
correlations for spectral power and peak frequency measures of movement-
related and resting beta activity.
Movement-related and resting beta power from both sensorimotor cortices was
highly reliable across sessions. Resting beta power yielded highest reliability
(average ICC=0.903), followed by MRBD (average ICC=0.886) and PMBR
(average ICC=0.663). Notably, peak frequency measures yielded lower ICC
values compared to the assessment of spectral power, particularly for movement-
related beta activity (ICC=0.386–0.402). The results highlight that power
measures of movement-related beta oscillations are highly reliable, while
corresponding peak frequency measures show greater intra-individual variability
across sessions. Importantly, the finding that beta power estimates show high
intra-individual reliability over time serves to validate the notion that these
measures reflect meaningful individual differences that can be utilized in basic
research and clinical studies.
Intra-individual reliability of movement-related beta oscillations
104
4.2 Introduction
Oscillatory activity is ubiquitous in the brain and considered essential for the
encoding and processing of information (Buzsáki and Draguhn, 2004). Neuronal
oscillations in the beta frequency band (15–30 Hz), prevalent in sensorimotor
cortex, are related to motor activity, as supported by a range of
electroencephalography (EEG) and magnetoencephalography (MEG) studies
showing a modulation of beta oscillations with active and passive movement
(Alegre et al., 2002), motor imagery (McFarland et al., 2000; Nakagawa et al.,
2011) and movement observation (Babiloni et al., 2002) (for review see (Kilavik
et al., 2013)). Beta power decreases just prior to and during movement
(Movement-Related Beta Desynchronization, MRBD), followed by a transient
post-movement increase above pre-movement levels (Post-Movement Beta
Rebound, PMBR) (Pfurtscheller and Lopes Da Silva, 1999; Pfurtscheller et al.,
1998b; Salmelin and Hari, 1994; Stancak and Pfurtscheller, 1995), with each of
these dynamics differentially modulated by experimental factors (for review see
(Kilavik et al., 2013; Van Wijk et al., 2012)). MRBD is typically observed in both
contralateral and ipsilateral sensorimotor cortices during unimanual movements,
while PMBR typically shows a contralateral preponderance (Salmelin and Hari,
1994; Stancak and Pfurtscheller, 1995).
In addition to changes in power within the beta frequency band, individual peak
frequency has been shown to be a behaviourally meaningful parameter of
oscillatory activity (Kilavik et al., 2012) that differs across regions within the
sensorimotor cortex (Salmelin and Hari, 1994), and which is of increasing interest
considering recent attention on extrinsic neurostimulation approaches for
modulating motor outputs (Guerra et al., 2016; Joundi et al., 2012; Pogosyan et
al., 2009). However, despite extensive research, the functional relevance of beta
oscillatory activity is still debated (Engel and Fries, 2010; Jenkinson and Brown,
2011; Pfurtscheller et al., 1996).
Direct manipulation of beta oscillations through the application of transcranial
alternating current stimulation (tACS) at beta frequency can produce a slowing of
movements (Joundi et al., 2012; Pogosyan et al., 2009) suggesting a causal role
of sensorimotor beta oscillatory activity in motor control. As outlined in Chapter
Intra-individual reliability of movement-related beta oscillations
105
1, alterations in beta activity are also observed in disease states such as stroke
(Rossiter et al. 2014) and Parkinson’s disease (Brown, 2007; Heida et al., 2014;
Heinrichs-Graham et al., 2013; Little and Brown, 2014). Both patient populations
show a reduction in the amplitude of MRBD together with deficits in some aspects
of motor control, suggesting that MRBD may be a general assay of the state of
the motor system, irrespective of the underlying pathophysiology. In addition,
changes in beta oscillations have been observed with ageing, with resting beta
power increasing as a function of age (Rossiter et al. 2014; Heinrichs-Graham &
Wilson 2016), and the amplitude of MRBD and PMBR increasing during
development (Gaetz et al., 2010).
Given its potential role as neurophysiological marker of motor system function
and dysfunction, rhythmic activity at beta frequencies has received considerable
interest in both basic and clinical research (Nicolo et al., 2015; Takemi et al.,
2015; Ward, 2015; Wu et al., 2015). Measurements of beta activity may provide
insight into the dynamics of disease, potentially providing a clinically relevant
biomarker. However, despite prevalent use of EEG/MEG to explore beta
oscillatory dynamics in normal brain functioning and pathology, to the best of my
knowledge, no studies have systematically assessed their test-retest reliability
across multiple recordings. If measures of beta oscillations in healthy individuals
are highly variable between separate sessions (high intra-individual variability),
EEG assays of beta oscillatory activity are unlikely to be useful as biomarkers
(Mayeux, 2004). Reliable spectral estimates of oscillatory activity are therefore a
prerequisite for studies designed to test longitudinal changes in clinical and non-
clinical populations or therapeutic interventions.
Based on these considerations, at the beginning of my PhD, I assessed the test-
retest reliability of spectral power and peak frequency measures of movement-
related beta activity in a group of healthy subjects across several weeks. Since
MRBD and PMBR estimates quantify movement-related changes in beta power
relative to a pre-movement (resting) baseline, and recent work by Heinrichs-
Graham and colleagues (Heinrichs-Graham and Wilson, 2016) suggests a direct
relationship between MRBD and pre-movement baseline beta activity, the
reliability of beta oscillations during the pre-movement (resting) baseline period
Intra-individual reliability of movement-related beta oscillations
106
of the motor task was additionally evaluated. For measures of beta oscillations to
be reliable and therefore useful biomarkers in basic and clinical research it is
essential that these measures (I) display small within-subject variability and (II)
do not change as a function of between-session time interval.
4.3 Methods
4.3.1 Subjects
Six healthy subjects (3 females, mean age ±SD = 27±4.7 years) took part in the
study to assess the test-retest reliability of movement-related beta oscillations
over six EEG sessions (S1–S6 in Figure 4.3, Figure 4.4, Figure 4.7). The time
interval between sessions varied from one week for the first five sessions (range
= 5–9 days, mean between-session time interval ±SD = 7±1 days) to six weeks
between the fifth and sixth EEG session (range = 39–50 days, mean between-
session time interval ±SD = 43±4 days; Figure 4.1A). This interval design was
chosen to test for a systematic influence of interval length on test-retest reliability.
All subjects were right-handed according to the Edinburgh Handedness Inventory
(Oldfield, 1971), had normal or corrected-to-normal vision, and fulfilled the
following inclusion criteria: (a) no history of neurological or psychiatric disease;
(b) no physical disability of the arms or wrists; and (c) no use of drugs affecting
the central nervous system or self-reported abuse of any drugs. To minimize
circadian fluctuations in beta oscillatory levels (Toth et al., 2007; Wilson et al.,
2014), all subjects were tested in the time between 9am and 1pm after giving
written informed consent.
4.3.2 Experimental design
Subjects performed visually cued wrist flexion and extension with their non-
dominant (left) hand rested in the instrumented wrist rig (see Chapter 3) during
EEG recording. For a detailed description of the simple motor task, please refer
to Chapter 3 section 3.2.3. Briefly, during each trial, wrist movements were
always initiated from the same start position located at the centre of the screen
that represented the mid-point of a subject’s individual AROM (see Chapter 3
section 3.2.1 for details about AROM measurement). The cue to perform wrist

Intra-individual reliability of movement-related beta oscillations
107
flexion or extension movements was the random appearance of one of two
targets (in blue) located equidistant from the central start position (Figure 4.1B,
upper panel). Each of the targets represented the subject’s maximum wrist flexion
or extension position. Subjects were instructed to move the wrist upon
presentation of the target so as to shift the red wrist cursor from the central start
position to match the position of the target in a ‘quick and discrete’ movement.
They were also asked to move as soon as possible and to avoid anticipation or
guessing of target appearance. The target position was displayed for 3 s and
subjects had to maintain the wrist cursor inside the blue target until being cued to
return to the initial start position. Once subjects returned to the start position, the
next cue to move was delivered following a delay of 7±1 s. The task comprised
120 trials (60 trials for flexion and extension, respectively), and subjects were
instructed to minimize eye movements by focusing on a centrally located fixation
cross.

Intra-individual reliability of movement-related beta oscillations
108
Figure 4.1 | Experimental setup and measurements.
A, Timeline of experiment. Subjects’ EEG was repeatedly recorded over six
sessions (S1–S6) during the performance of the simple motor task. B,
Experimental paradigm. Subjects sat in front of a computer monitor and were
instructed to perform wrist movements to move the wrist cursor (red circle) from
the initial start position (grey square) to one of two target positions (blue squares)
upon target presentation. C, Calculation of reaction time (RT), movement time
(MT) and peak velocity (PV) where the grey patch represents target presentation.
Velocity profile (blue line) and wrist angular displacement (red line) are shown for
one trial of an example participant. D, Topographical distribution (top panel) and
time-frequency map (bottom panel) of movement-related beta activity.
Topographical plots of grand-average beta power revealed electrodes of peak
change (highlighted as black-and-white disks) overlying contra- and ipsilateral
Intra-individual reliability of movement-related beta oscillations
109
sensorimotor cortices. Time-frequency map for pooled electrodes contralateral to
moving hand showing two distinct time windows of peak changes in beta activity
(MRBD: 1–2 s; PMBR: 6–7 s).
4.3.3 EEG recording
Scalp EEG was continuously recorded at 2084 Hz by 64 electrodes mounted on
an elastic cap according to the international 10-20 EEG system. The impedance
was kept below ≤5 kΩ and the EEG signal was referenced to Cz during recording.
The timing of the visual cue (blue target) in the motor task was marked in the
simultaneous EEG recording, with separate triggers for each condition (flexion,
extension). Muscle activity was monitored by surface electromyography (EMG)
on the wrist extensor (extensor carpi radialis, ECR) and flexor (flexor carpi
radialis, FCR) muscles of the non-dominant arm.
4.3.4 Data analysis
Analyses were conducted using custom-written routines in Matlab and the
SPM12 toolbox (Wellcome Trust Centre for Neuroimaging,
www.fil.ion.ucl.ac.uk/spm). The fieldtrip toolbox ((Oostenveld et al., 2011),
www.ru.nl/fcdonders/fieldtrip/) was additionally employed for EEG data
visualization. Statistical analyses were performed using SPSS and custom-
written Matlab routines.
4.3.4.1 Behavioural data
A detailed description of the kinematic data analysis has been provided in
Chapter 3 section 3.7.1.2. In brief, the angular position of the wrist was filtered
and differentiated to calculate velocity. Movement onset was defined as the time
when the velocity of the wrist exceeded a threshold of 5 % of the maximum
velocity and sustained this speed for at least 100 ms. Movement termination was
defined as the time when the velocity fell below the threshold for that trial for at
least 500 ms. For each subject, trials in which the movement was initiated before
the cue signal, reaction time was excessively long (>mean ±2.5 SD), or
movement time was excessively long (>mean ± 2.5 SD) were discarded (average
~7 % of trials). Reaction time (RT), movement time (MT), and peak velocity (PV)
Intra-individual reliability of movement-related beta oscillations
110
were calculated on the remaining trials (average 111±2) for each individual trial
(Figure 4.1C) and then averaged within each subject for each experimental
condition.
4.3.4.2 Spectral power and peak frequency measures
Pre-processing and time-frequency analysis of EEG data recorded during the
performance of the simple motor task has been detailed in Chapter 3 section
3.7.2. In brief, the raw EEG signal was first offline re-referenced to the average
signal across all electrodes, bandpass filtered between 5–100 Hz, additionally
filtered with a 50Hz notch filter, and downsampled to 300 Hz. Data were epoched
from -1 to 9 s relative to visual cue onset (0 s). Poorly performed trials (see
section 4.3.4.1) were excluded and the remaining EEG trials were visually
scrutinized. Trials containing artefacts (e.g. muscle activation or large eye blinks)
were additionally removed. For each session, on average 92±10 artefact-free
EEG trials remained for further analyses, and number of trials did not differ
between conditions (p>0.4) or sessions (p>0.1, repeated-measures ANOVA).
Artefact-free EEG time-series from each single trial were decomposed into their
time-frequency representations in the 5–45 Hz range with frequency steps of
0.1 Hz. A 7-cycle Morlet wavelet was used for the continuous wavelet
transformation. Power was averaged across trials and rescaled in order to show
changes in power relative to the corresponding pre-movement baseline period (-
1–0 s prior to cue onset) (Equation 3.6).
To select electrodes and time-frequency windows of interest that were orthogonal
to potential differences between sessions and conditions, firstly activity in the a
priori chosen beta frequency band (15–30Hz, (Jurkiewicz et al., 2006; Van Wijk
et al., 2012; Yamawaki et al., 2008)), grand-averaged over subjects, sessions
and conditions was examined. Then, electrodes of peak change in beta
oscillations were selected from topographical distributions of normalized power
(% power), plotted for several time points after cue onset. The topographical
maps revealed clear movement-related beta activity (MRBD, PMBR) overlying
the sensorimotor cortices, both contralateral and ipsilateral to the moving hand
(Figure 4.1C; MRBD: ‘C4’ ‘CP4’ ‘CP2’ and ‘C3’ ‘CP3’ ‘CP1’ for contra- and
ipsilateral hemispheres, respectively; PMBR: ‘C2’ ‘C4’ ‘CP4’ and ‘C1’ ‘C3’ ‘CP3’
Intra-individual reliability of movement-related beta oscillations
111
for contra- and ipsilateral hemispheres, respectively). These bilateral electrodes
were pooled as contra- and ipsilateral regions of interest, respectively. Note that
PMBR was located slightly more anterior to the central midline than the MRBD,
consistent with previous EEG (Pfurtscheller et al., 1996) and MEG (Salmelin and
Hari, 1994) studies.
Next, time-frequency windows were chosen based on peak changes in beta
activity in time-frequency maps of these bilateral sensorimotor regions, which
revealed clear movement-related beta-band activity in two distinct time windows
of interest (Figure 4.1D). This information was used to optimize the alignment of
constant duration (1 s) and width (15 Hz) time-frequency windows to capture
maximum MRBD (1–2 s relative to cue onset), occurring between cue onset and
movement termination, and PMBR (6–7 s relative to cue onset), which emerges
after movement termination. Selected time-frequency windows and electrodes
applied to all subjects and sessions, and were not adjusted individually.
Subsequently, for each individual subject, session and condition, mean
percentage decrease (MRBD) and increase (PMBR) in beta power were
extracted from the respective 1s time windows and averaged over the pre-
selected electrodes for each hemisphere. The absolute pre-movement (resting)
baseline beta (BB) power from -1 to 0 s relative to cue onset was also obtained
and assessed for reliability.
In addition, individual beta peak frequency was determined semi-automatically
for each corresponding time window (BB: -1–0 s; MRBD: 1–2 s, PMBR: 6–7 s).
The peak frequency for the MRBD and PMBR were determined as the
frequencies having the largest change in spectral power compared to baseline
beta power. For the absolute power of baseline beta (BB), first the 1/f shape of
the power spectrum was eliminated by fitting and subsequent subtraction of a
straight line after log-log transformation (see e.g. (Nikulin and Brismar, 2006),
Figure 4.2). All peaks were selected from the 15–30 Hz frequency range with
0.1 Hz resolution. Cases where no clear peak was present (e.g. Subject 5
Session 1 contra- and ipsilateral hemisphere, and Session 2 contralateral
hemisphere), were left out of the analyses.
In total, 12 different beta parameter estimates were used for subsequent analysis:
pre-movement beta baseline (absolute power and peak frequency), MRBD
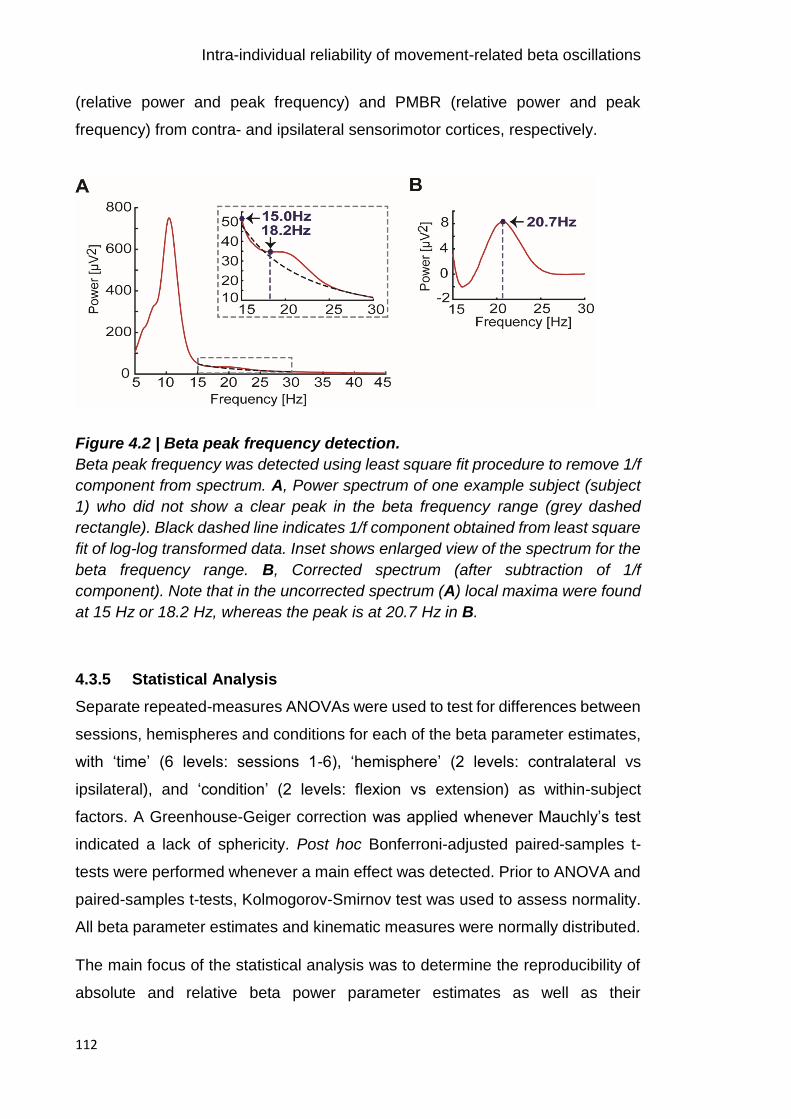
Intra-individual reliability of movement-related beta oscillations
112
(relative power and peak frequency) and PMBR (relative power and peak
frequency) from contra- and ipsilateral sensorimotor cortices, respectively.
Figure 4.2 | Beta peak frequency detection.
Beta peak frequency was detected using least square fit procedure to remove 1/f
component from spectrum. A, Power spectrum of one example subject (subject
1) who did not show a clear peak in the beta frequency range (grey dashed
rectangle). Black dashed line indicates 1/f component obtained from least square
fit of log-log transformed data. Inset shows enlarged view of the spectrum for the
beta frequency range. B, Corrected spectrum (after subtraction of 1/f
component). Note that in the uncorrected spectrum (A) local maxima were found
at 15 Hz or 18.2 Hz, whereas the peak is at 20.7 Hz in B.
4.3.5 Statistical Analysis
Separate repeated-measures ANOVAs were used to test for differences between
sessions, hemispheres and conditions for each of the beta parameter estimates,
with ‘time’ (6 levels: sessions 1-6), ‘hemisphere’ (2 levels: contralateral vs
ipsilateral), and ‘condition’ (2 levels: flexion vs extension) as within-subject
factors. A Greenhouse-Geiger correction was applied whenever Mauchly’s test
indicated a lack of sphericity. Post hoc Bonferroni-adjusted paired-samples t-
tests were performed whenever a main effect was detected. Prior to ANOVA and
paired-samples t-tests, Kolmogorov-Smirnov test was used to assess normality.
All beta parameter estimates and kinematic measures were normally distributed.
The main focus of the statistical analysis was to determine the reproducibility of
absolute and relative beta power parameter estimates as well as their
Intra-individual reliability of movement-related beta oscillations
113
corresponding peak frequencies. For this, Pearson correlations were used to
assess reliability between two EEG sessions, while Intraclass Correlation
Coefficients (ICC) (McGraw and Wong, 1996; Shrout and Fleiss, 1979), based
on two-way random effects analysis of variance, were computed to assess the
degree of consistency between all six sessions. The ICC method has been widely
used (Muthukumaraswamy et al., 2010; Plichta et al., 2012; Tan et al., 2016a,
2015) and assesses the reliability of repeated measures of an individual’s beta
parameters by comparing the proportion of within-subject variability to all sources
of variance; thus, a high ICC value means that within-subject variability is low and
that most of the variance is caused by differences between subjects. Following
Landis and Koch (1977) suggestions, ICC was rated on the following agreement
level: 0.2–0.4 fair, 0.4–0.6 moderate, 0.6–0.8 substantial and >0.8 almost perfect
(Landis and Koch, 1977). ICCs were assessed for both movement-related and
absolute pre-movement baseline beta activity derived from both sensorimotor
cortices. To account for multiple comparisons in the ICC analysis, the significance
level was Bonferroni-corrected (corrected p values: 0.05/12 for beta parameter
estimates and 0.05/6 for kinematic measures). In addition, exploratory Monte-
Carlo simulations (50 iterations) were performed to investigate the minimum
number of trials (5–50 trials; max trial number was limited by the smallest number
of remaining trials across subjects and sessions) required to obtain highly reliable
(ICC>0.8) beta power measures.
4.4 Results
Behavioural and EEG data during the performance of the simple motor task
across six separate sessions for six healthy subjects are reported.
4.4.1 Behavioural results
All subjects were able to perform the motor task. The kinematic measures are
summarised in Table 4.1 for each of the six EEG sessions. As expected, reaction
time (RT), movement time (MT) and peak velocity (PV) in the motor task were
stable across separate sessions, as confirmed by a lack of main effect of ‘time’
for all kinematic measures [RT: F(5,20)=2.242, p=0.156; MT: F(5,20)=3.661,
p=0.087; PV: F(5,20)=0.414, p=0.709, all Greenhouse-Geisser corrected].
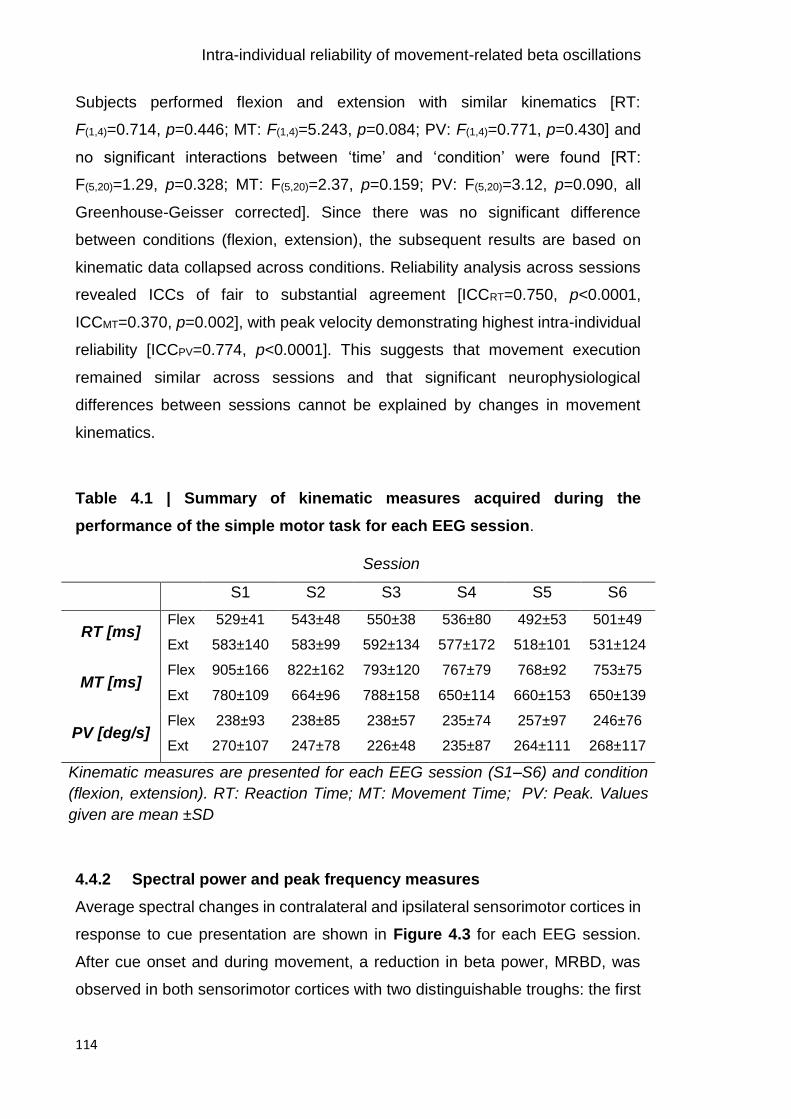
Intra-individual reliability of movement-related beta oscillations
114
Subjects performed flexion and extension with similar kinematics [RT:
F(1,4)=0.714, p=0.446; MT: F(1,4)=5.243, p=0.084; PV: F(1,4)=0.771, p=0.430] and
no significant interactions between ‘time’ and ‘condition’ were found [RT:
F(5,20)=1.29, p=0.328; MT: F(5,20)=2.37, p=0.159; PV: F(5,20)=3.12, p=0.090, all
Greenhouse-Geisser corrected]. Since there was no significant difference
between conditions (flexion, extension), the subsequent results are based on
kinematic data collapsed across conditions. Reliability analysis across sessions
revealed ICCs of fair to substantial agreement [ICCRT=0.750, p<0.0001,
ICCMT=0.370, p=0.002], with peak velocity demonstrating highest intra-individual
reliability [ICCPV=0.774, p<0.0001]. This suggests that movement execution
remained similar across sessions and that significant neurophysiological
differences between sessions cannot be explained by changes in movement
kinematics.
Table 4.1 | Summary of kinematic measures acquired during the
performance of the simple motor task for each EEG session.
Session
S1 S2 S3 S4 S5 S6
RT [ms] Flex
Ext
529±41
583±140
543±48
583±99
550±38
592±134
536±80
577±172
492±53
518±101
501±49
531±124
MT [ms] Flex
Ext
905±166
780±109
822±162
664±96
793±120
788±158
767±79
650±114
768±92
660±153
753±75
650±139
PV [deg/s] Flex
Ext
238±93
270±107
238±85
247±78
238±57
226±48
235±74
235±87
257±97
264±111
246±76
268±117
Kinematic measures are presented for each EEG session (S1–S6) and condition
(flexion, extension). RT: Reaction Time; MT: Movement Time; PV: Peak. Values
given are mean ±SD
4.4.2 Spectral power and peak frequency measures
Average spectral changes in contralateral and ipsilateral sensorimotor cortices in
response to cue presentation are shown in Figure 4.3 for each EEG session.
After cue onset and during movement, a reduction in beta power, MRBD, was
observed in both sensorimotor cortices with two distinguishable troughs: the first
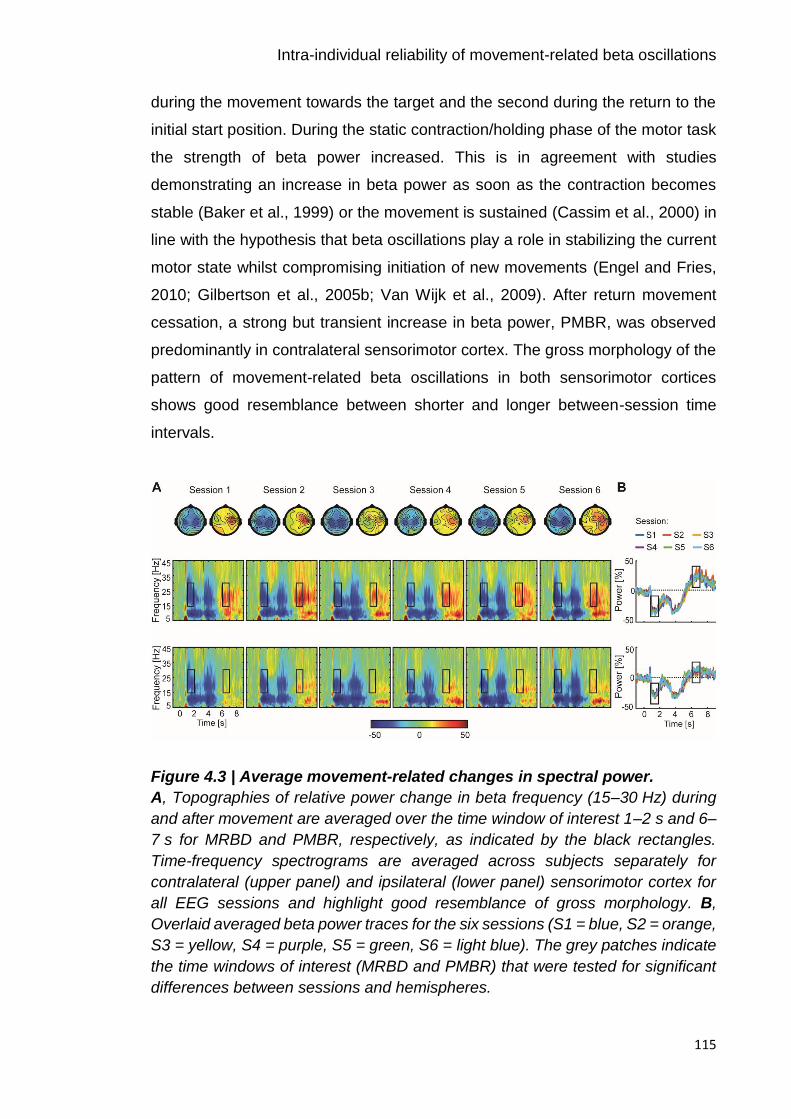
Intra-individual reliability of movement-related beta oscillations
115
during the movement towards the target and the second during the return to the
initial start position. During the static contraction/holding phase of the motor task
the strength of beta power increased. This is in agreement with studies
demonstrating an increase in beta power as soon as the contraction becomes
stable (Baker et al., 1999) or the movement is sustained (Cassim et al., 2000) in
line with the hypothesis that beta oscillations play a role in stabilizing the current
motor state whilst compromising initiation of new movements (Engel and Fries,
2010; Gilbertson et al., 2005b; Van Wijk et al., 2009). After return movement
cessation, a strong but transient increase in beta power, PMBR, was observed
predominantly in contralateral sensorimotor cortex. The gross morphology of the
pattern of movement-related beta oscillations in both sensorimotor cortices
shows good resemblance between shorter and longer between-session time
intervals.
Figure 4.3 | Average movement-related changes in spectral power.
A, Topographies of relative power change in beta frequency (15–30 Hz) during
and after movement are averaged over the time window of interest 1–2 s and 6–
7 s for MRBD and PMBR, respectively, as indicated by the black rectangles.
Time-frequency spectrograms are averaged across subjects separately for
contralateral (upper panel) and ipsilateral (lower panel) sensorimotor cortex for
all EEG sessions and highlight good resemblance of gross morphology. B,
Overlaid averaged beta power traces for the six sessions (S1 = blue, S2 = orange,
S3 = yellow, S4 = purple, S5 = green, S6 = light blue). The grey patches indicate
the time windows of interest (MRBD and PMBR) that were tested for significant
differences between sessions and hemispheres.

Intra-individual reliability of movement-related beta oscillations
116
Estimates of power change during movement (MRBD) and after movement
cessation (PMBR) were both unaffected by ‘time’ or ‘condition’ (F-statistics and
p-values of all ANOVAS are summarized in Table 4.2). In addition, while no main
effect of ‘hemisphere’ on the magnitude of MRBD was found, PMBR was
significantly stronger in contralateral than ipsilateral sensorimotor cortex
[F(1,5)=7.03, p=0.045, effect size ƞp2=0.584], indicating contralateral
predominance of the beta power rebound. Throughout the pre-movement
baseline period, absolute power estimates were similar across all sessions,
conditions and both sensorimotor cortices. Likewise, no significant ‘time x
condition’, ‘time x hemisphere’, ‘hemisphere x condition’ or ‘time x hemisphere x
condition’ interaction effects were found for any of the spectral power measures.
Peak frequency of beta activity in the pre-movement baseline period as well as
in the time window in which MRBD occurred did not differ significantly within
subjects between sessions, conditions or hemispheres. In contrast, PMBR peak
frequency varied as a function of ‘time’ (F(5,25)=2.70, p=0.044, effect size
ƞp2=0.351), but not ‘condition’ or ‘hemisphere’. Finally, there were no significant
interactions for any of the peak frequency measures (Table 4.2).
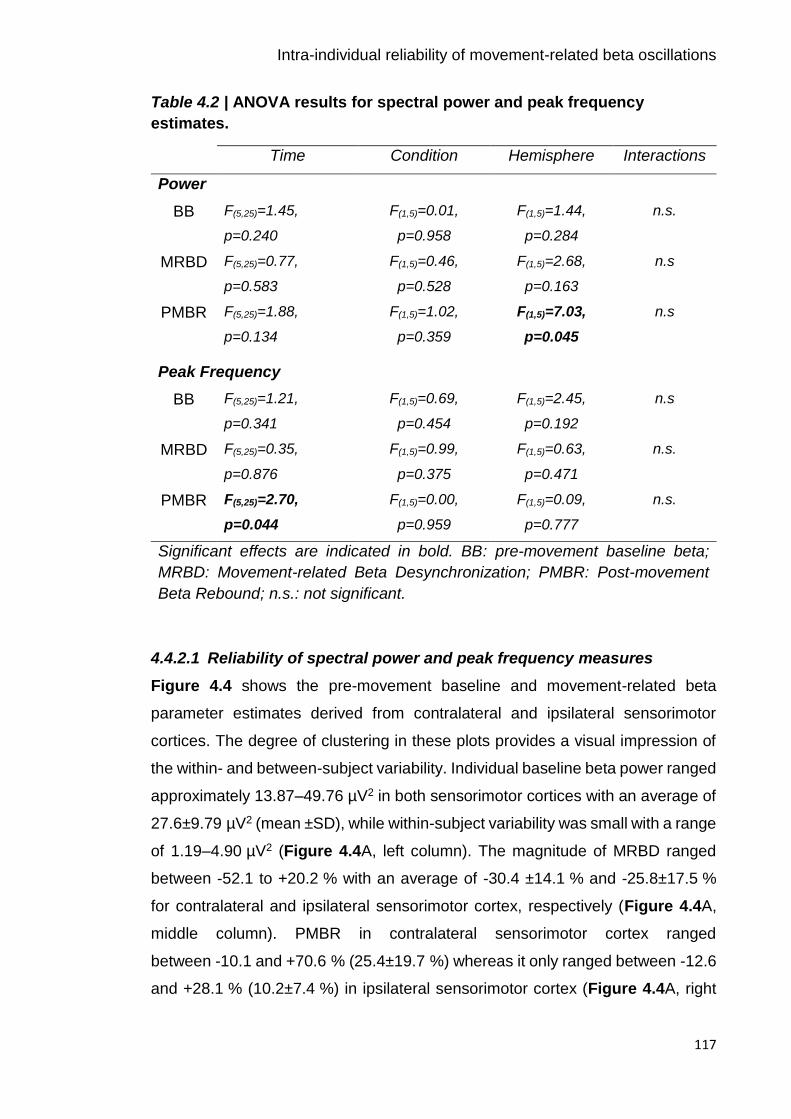
Intra-individual reliability of movement-related beta oscillations
117
Table 4.2 | ANOVA results for spectral power and peak frequency
estimates.
Time Condition Hemisphere Interactions
Power
BB F(5,25)=1.45,
p=0.240
F(1,5)=0.01,
p=0.958
F(1,5)=1.44,
p=0.284
n.s.
MRBD F(5,25)=0.77,
p=0.583
F(1,5)=0.46,
p=0.528
F(1,5)=2.68,
p=0.163
n.s
PMBR F(5,25)=1.88,
p=0.134
F(1,5)=1.02,
p=0.359
F(1,5)=7.03,
p=0.045
n.s
Peak Frequency
BB F(5,25)=1.21,
p=0.341
F(1,5)=0.69,
p=0.454
F(1,5)=2.45,
p=0.192
n.s
MRBD F(5,25)=0.35,
p=0.876
F(1,5)=0.99,
p=0.375
F(1,5)=0.63,
p=0.471
n.s.
PMBR F(5,25)=2.70,
p=0.044
F(1,5)=0.00,
p=0.959
F(1,5)=0.09,
p=0.777
n.s.
Significant effects are indicated in bold. BB: pre-movement baseline beta;
MRBD: Movement-related Beta Desynchronization; PMBR: Post-movement
Beta Rebound; n.s.: not significant.
4.4.2.1 Reliability of spectral power and peak frequency measures
Figure 4.4 shows the pre-movement baseline and movement-related beta
parameter estimates derived from contralateral and ipsilateral sensorimotor
cortices. The degree of clustering in these plots provides a visual impression of
the within- and between-subject variability. Individual baseline beta power ranged
approximately 13.87–49.76 µV2 in both sensorimotor cortices with an average of
27.6±9.79 µV2 (mean ±SD), while within-subject variability was small with a range
of 1.19–4.90 µV2 (Figure 4.4A, left column). The magnitude of MRBD ranged
between -52.1 to +20.2 % with an average of -30.4 ±14.1 % and -25.8±17.5 %
for contralateral and ipsilateral sensorimotor cortex, respectively (Figure 4.4A,
middle column). PMBR in contralateral sensorimotor cortex ranged
between -10.1 and +70.6 % (25.4±19.7 %) whereas it only ranged between -12.6
and +28.1 % (10.2±7.4 %) in ipsilateral sensorimotor cortex (Figure 4.4A, right

Intra-individual reliability of movement-related beta oscillations
118
column). By contrast, within-subject variability for MRBD and PMBR power
measures was small and fell within a range of ~2–7 % per subject.
Individual peak frequencies during the pre-movement baseline period fell within
a frequency range of 17.4 to 23.9 Hz (19.8±1.5 Hz) and displayed small within-
subject variability of 0.2–1.6 Hz (Figure 4.4B, left column). In comparison, peak
frequencies of movement-related beta oscillations spanned frequencies from
16.2–29.1 Hz with an average of 20.8±2.2 Hz for MRBD (Figure 4.4B, middle
column) and 22.7±3.7 Hz for PMBR (Figure 4.4B, right column). Notably, within-
subject variability was relatively large and ranged from approximately 0.4–4.8 Hz
per subject.

Intra-individual reliability of movement-related beta oscillations
119
Figure 4.4 | Test-retest reliability of beta-band activity.
Test-retest reliability of spectral power (A) and peak frequency (B) measures
across separate sessions (S1–S6). Individual values were extracted for each
EEG session from pre-selected electrodes overlying contralateral (grey shading)
and ipsilateral sensorimotor cortex and distinct time windows (BB: -1–0 s; MRBD:
1–2 s; PMBR: 6–7 s). The degree of clustering gives a visual impression of the

Intra-individual reliability of movement-related beta oscillations
120
within-subject and between-subject variation. Black horizontal bars represent
grand-mean (across sessions) for each subject.
For a quantitative measure of repeatability of beta oscillations, Intraclass
Correlation Coefficients (ICC) were calculated for spectral power of the selected
time windows (pre-movement baseline, MRBD and PMBR) and the
corresponding peak frequency. Overall, ICC values indicated almost perfect
reliability for power measures [mean ICC=0.832, ICC range=0.490–0.912,
p<0.001; refer to Figure 4.5A], but only moderate reliability for peak frequency
estimates [mean ICC=0.537, ICC range=0.231–0.929, p<0.033; refer to Figure
4.5B]. ICC values were consistently highest for pre-movement baseline beta
power [contralateral sensorimotor cortex: ICC=0.894, p<0.0001; ipsilateral
sensorimotor cortex: ICC=0.907, p<0.0001], followed by MRBD [contralateral
sensorimotor cortex: ICC=0.859, p<0.0001; ipsilateral sensorimotor cortex:
ICC=0.907, p<0.0001] and PMBR power measures [contralateral sensorimotor
cortex: ICC=0.818, p<0.0001; ipsilateral sensorimotor cortex: ICC=0.420,
p<0.001]. Interestingly, ICC values derived for pre-movement baseline beta and
MRBD power estimates yielded slightly higher reliability for ipsilateral than
contralateral sensorimotor cortex, while reliability of PMBR power estimates was
higher for contralateral sensorimotor cortex. The lower ICC value for PMBR
power from ipsilateral sensorimotor cortex was likely due to low between-subject
variability, with most values ranging between 0 % and 20 %, thereby primarily
reflecting random fluctuations around the baseline level (Figure 4.4A).
Assessment of peak frequency yielded a similar reliability trend, with pre-
movement baseline beta peak frequency showing highest ICC values
[contralateral sensorimotor cortex: ICC=0.717, p<0.0001; ipsilateral sensorimotor
cortex: ICC=0.929, p<0.001], followed by MRBD [contralateral sensorimotor
cortex: ICC=0.540, p<0.0001; ipsilateral sensorimotor cortex: ICC=0.231,
p<0.05] and PMBR peak frequency [contralateral sensorimotor cortex:
ICC=0.483, p<0.01; ipsilateral sensorimotor cortex: ICC=0.321, p<0.01]. Beyond
the lower reliability of peak frequency measures compared to spectral power
measures of beta activity, movement-related beta peak frequency estimates
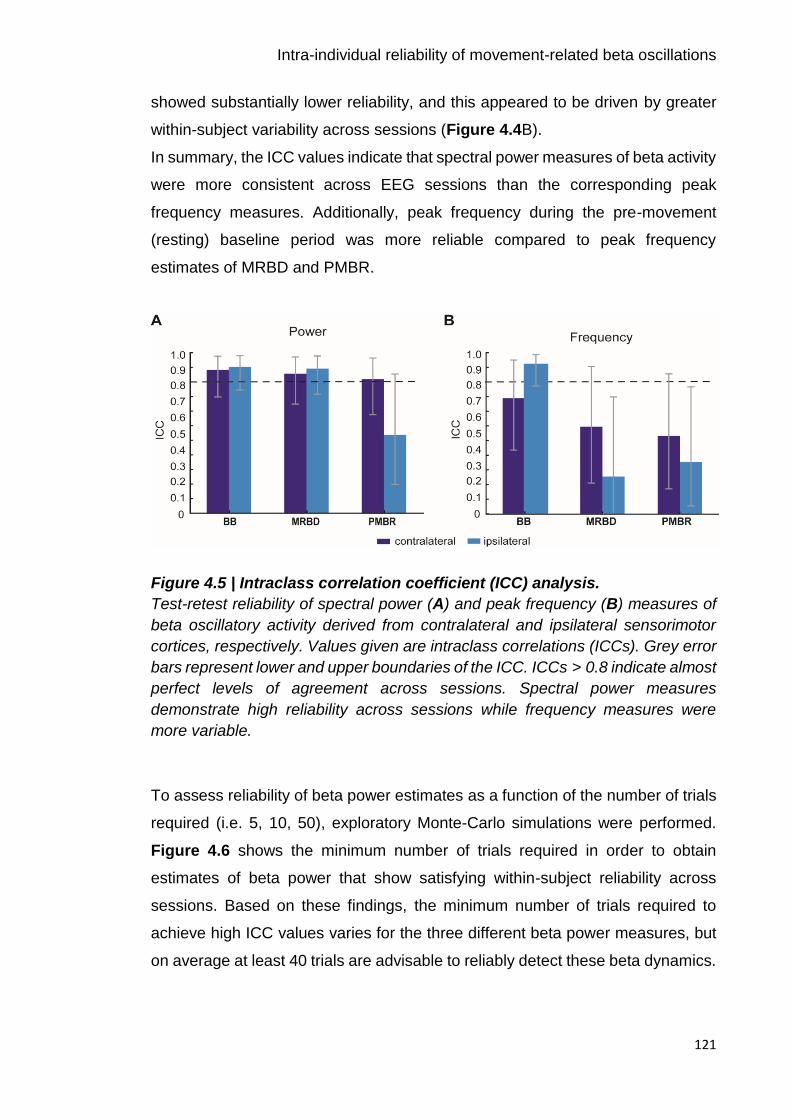
Intra-individual reliability of movement-related beta oscillations
121
showed substantially lower reliability, and this appeared to be driven by greater
within-subject variability across sessions (Figure 4.4B).
In summary, the ICC values indicate that spectral power measures of beta activity
were more consistent across EEG sessions than the corresponding peak
frequency measures. Additionally, peak frequency during the pre-movement
(resting) baseline period was more reliable compared to peak frequency
estimates of MRBD and PMBR.
Figure 4.5 | Intraclass correlation coefficient (ICC) analysis.
Test-retest reliability of spectral power (A) and peak frequency (B) measures of
beta oscillatory activity derived from contralateral and ipsilateral sensorimotor
cortices, respectively. Values given are intraclass correlations (ICCs). Grey error
bars represent lower and upper boundaries of the ICC. ICCs > 0.8 indicate almost
perfect levels of agreement across sessions. Spectral power measures
demonstrate high reliability across sessions while frequency measures were
more variable.
To assess reliability of beta power estimates as a function of the number of trials
required (i.e. 5, 10, 50), exploratory Monte-Carlo simulations were performed.
Figure 4.6 shows the minimum number of trials required in order to obtain
estimates of beta power that show satisfying within-subject reliability across
sessions. Based on these findings, the minimum number of trials required to
achieve high ICC values varies for the three different beta power measures, but
on average at least 40 trials are advisable to reliably detect these beta dynamics.
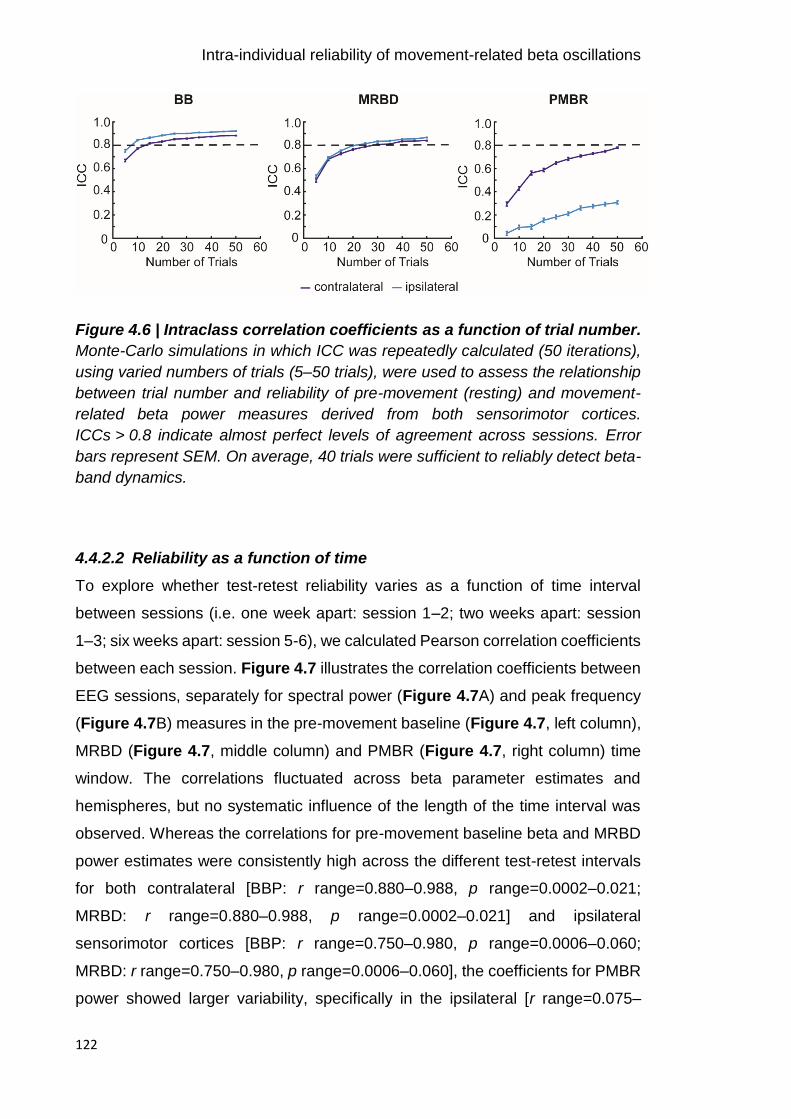
Intra-individual reliability of movement-related beta oscillations
122
Figure 4.6 | Intraclass correlation coefficients as a function of trial number.
Monte-Carlo simulations in which ICC was repeatedly calculated (50 iterations),
using varied numbers of trials (5–50 trials), were used to assess the relationship
between trial number and reliability of pre-movement (resting) and movement-
related beta power measures derived from both sensorimotor cortices.
ICCs > 0.8 indicate almost perfect levels of agreement across sessions. Error
bars represent SEM. On average, 40 trials were sufficient to reliably detect beta-
band dynamics.
4.4.2.2 Reliability as a function of time
To explore whether test-retest reliability varies as a function of time interval
between sessions (i.e. one week apart: session 1–2; two weeks apart: session
1–3; six weeks apart: session 5-6), we calculated Pearson correlation coefficients
between each session. Figure 4.7 illustrates the correlation coefficients between
EEG sessions, separately for spectral power (Figure 4.7A) and peak frequency
(Figure 4.7B) measures in the pre-movement baseline (Figure 4.7, left column),
MRBD (Figure 4.7, middle column) and PMBR (Figure 4.7, right column) time
window. The correlations fluctuated across beta parameter estimates and
hemispheres, but no systematic influence of the length of the time interval was
observed. Whereas the correlations for pre-movement baseline beta and MRBD
power estimates were consistently high across the different test-retest intervals
for both contralateral [BBP: r range=0.880–0.988, p range=0.0002–0.021;
MRBD: r range=0.880–0.988, p range=0.0002–0.021] and ipsilateral
sensorimotor cortices [BBP: r range=0.750–0.980, p range=0.0006–0.060;
MRBD: r range=0.750–0.980, p range=0.0006–0.060], the coefficients for PMBR
power showed larger variability, specifically in the ipsilateral [r range=0.075–
Intra-individual reliability of movement-related beta oscillations
123
0.900, p range=0.014–0.888] compared to the contralateral [r range=0.602–
0.971, p range=0.006–0.207] hemisphere. The notable hemispheric variation in
test-retest reliability of PMBR potentially resulted from the absence of an
ipsilateral peak in PMBR. While spectral power measures of beta activity
demonstrated consistently high between-session correlations, correlation
coefficients for peak frequency estimates varied widely. Particularly low
coefficients were obtained for movement-related beta activity from contralateral
[MRBD: r range=-0.427–0.920, p range=0.009–0.743; PMBR: r range=0.161–
0.957, p range=0.003–0.760] and ipsilateral [MRBD: r range=-0.559–0.954, p
range=0.003–0.958; PMBR: r range=-0.438–0.796, p range=0.035–0.916]
sensorimotor cortex, while peak frequency of pre-movement baseline beta
activity was somewhat more consistent between sessions [contralateral
sensorimotor cortex: r range=0.285–0.935, p range=0.006–0.642; ipsilateral
sensorimotor cortex: range=0.439–0.975, p range=0.0009–0.384].

Intra-individual reliability of movement-related beta oscillations
124
Figure 4.7 | Between-sessions correlation coefficients.
Between-session (S1–S6) correlation coefficients and corresponding intraclass
correlation coefficients (ICCs) for spectral power and peak frequency estimates
for contralateral (grey shading) and ipsilateral sensorimotor cortices. The colour
bar indicates the correlation coefficients (r) presented in the matrices.
Intra-individual reliability of movement-related beta oscillations
125
4.5 Discussion
By implementing a longitudinal design, it was possible to characterise the intra-
individual reliability of sensor-derived EEG-based oscillatory measures in the
power and frequency domain, and assess their reliability as a function of time
interval between sessions.
4.5.1 Movement-related beta oscillations show high test-retest reliability
The present study assessed the test-retest reliability of movement-related and
pre-movement (resting) beta oscillatory activity in a group of healthy subjects
across several weeks. The aim was to determine whether EEG-derived spectral
power and peak frequency measures of beta oscillations (I) show small within-
subject variability and (II) are stable as a function of between-session time
interval, two prerequisites for their use as clinically relevant biomarkers. The
present results demonstrate that spectral power estimates of resting (BB:
average ICC=0.901) and movement-related beta activity (MRBD: average
ICC=0.883; PMBR: average ICC=0.619) are remarkably consistent across
sessions. In addition, corresponding peak frequency measures yielded lower ICC
values compared to the assessment of spectral power. While pre-movement
baseline beta peak frequency was highly reliable across sessions, peak
frequency measures of movement-related beta activity displayed greater within-
subject variability (MRBD: average ICC=0.386; PMBR: average ICC=0.402). The
respective between-session correlation coefficients further corroborate these
findings. This suggests that measures of spectral power as well as resting peak
frequency reflect stable individual activation patterns that could be used to
evaluate functional dynamic changes in the brain, such as the impact of disease
or treatment administration.
Abundant evidence exists for the reliability of spontaneous resting-state beta
activity within the same recording session and between sessions with time
intervals of days, weeks and up to years (e.g. Pollock et al. 1991; Burgess &
Gruzelier 1993; Kondacs & Szabo 1999; McEvoy et al. 2000; Nikulin & Brismar
2004; Corsi-Cabrera et al. 2007; Napflin et al. 2007; Martin-Buro et al. 2016)).
However, there is no such literature on movement-related beta oscillations, even
though these beta-band dynamics appear to be especially interesting in the study
Intra-individual reliability of movement-related beta oscillations
126
of individual differences related to tracking performance. Studies investigating
event-related oscillatory activity using cognitive and imagery tasks highlight that
their reliability varies as a function of frequency band, brain region and type of
task (Friedrich et al., 2013; Krause et al., 2001; Neuper et al., 2005).
Whilst beta oscillations have shown acceptable between-session reliability
(Cronbach’s alpha > 0.7) during motor imagery (Friedrich et al., 2013), little is
known regarding reliability during active movements. An indirectly related study
from Wilson and colleagues (Wilson et al. 2014) found a linear increase from
morning (9:00) to afternoon (16:00) in the amplitude of MRBD and PMBR during
a finger tapping task, but small variability over three consecutive days, indicating
the reliability of movement-related beta-band signatures. The current study
augments the work by Wilson and colleagues by systematically assessing the
reliability of spectral power and peak frequency estimates of movement-related
beta activity across several weeks.
Compared to previous studies, the motor task utilized in this study involved wrist
flexion and extension, which are known to elicit stronger PMBR compared to
finger and thumb movement (Pfurtscheller et al., 1998a). As a result, consistent
with prior findings, bilateral suppression of beta oscillatory activity during
movement (Gross et al., 2005; Pfurtscheller et al., 1996; Salmelin and Hari, 1994)
and clear beta rebound after movement termination, which was significantly
larger for contralateral compared to ipsilateral motor cortex (Salmelin and Hari,
1994; Stancak and Pfurtscheller, 1995) was found. Rau et al. (2003)
demonstrated that ipsilateral MRBD corresponds to increased cortical excitability
of ipsilateral M1, in line with the argument that MRBD indicates activation of the
sensorimotor cortex (Pfurtscheller and Berghold, 1989; Pfurtscheller and Lopes,
1999; Rau et al., 2003). However, ipsilateral MRBD has also been proposed to
reflect neural processes inhibiting mirror movements through interhemispheric
inhibition (Jurkiewicz et al., 2006; Van Wijk et al., 2012). In contrast, PMBR has
been associated with inhibition of movement initiation (Gilbertson et al., 2005b)
in conjunction with decreased corticospinal excitability (Chen et al., 1998).
Although the functional role of ipsilateral activity in unimanual motor tasks is not
fully understood, the different contra- and ipsilateral modulation patterns for
Intra-individual reliability of movement-related beta oscillations
127
MRBD and PMBR imply that these beta-band dynamics are, at least to a certain
degree, independent processes with distinct functional significance.
The high test-retest reliability of movement-related beta power measures suggest
that they might be useful in repeated-measures studies, for example,
investigating longitudinal changes in clinical and non-clinical populations or
assessing the impact of pharmacological interventions. ICC values for MRBD and
PMBR estimates were comparably high in both contralateral and ipsilateral
sensorimotor cortices, except for PMBR from the ipsilateral hemisphere, which
was markedly lower. A reliable measure (high ICC) requires small within-subject
variance relative to between-subject variance. Closer inspection suggests that
the reduced reliability observed for the ipsilateral PMBR was related to the low
between-subject variability of this power estimate (see Figure 4.4A). In line with
previous studies demonstrating a contralateral preponderance of PMBR
(Salmelin and Hari, 1994; Stancak and Pfurtscheller, 1995), the ipsilateral PMBR
estimates likely reflect random fluctuation around the baseline level, which
explains the low between-subject variability and therefore, the lower ICC value.
Individual variability in EEG-derived estimates of beta-band oscillations can be
accounted for not only by neural signals of the brain but also by the conductivity
of the electrical tissue between the current source and the recording electrode
(Buzsáki et al., 2012; Lopes da Silva, 2011). While factors such as pyramidal cell
density, cortical microarchitecture, skull thickness and skin conductance affect
sensor-derived measures of neuronal oscillations and thus are likely to account
for subject-specific differences, they are also expected to be stable over time and
therefore also contribute to low intra-individual variability. Accordingly, the
present findings that test-retest reliability of beta oscillatory activity was
independent of between-session time intervals may be attributed to these stable
individual differences and a consistent behaviour during the performance of the
motor task. However, it should be noted that some of the spectral power
measures were less reliable than others (i.e. ipsilateral PMBR), demonstrating
that reliability of sensor-derived measures is not solely due to these
morphological differences but reflects the variable stability of different neural
signals.
Intra-individual reliability of movement-related beta oscillations
128
Compared to spectral power, peak frequency displayed greater within-subject
variability (see Figure 4.4B). Although peak frequency during the pre-movement
baseline period yielded the highest measures of reliability, test-retest reliability
was lower compared to spectral power measures, in particular for contralateral
sensorimotor cortex. Peak frequency estimates of MRBD and PMBR displayed
fair-to-moderate reliability. Importantly, the reduced test-retest reliability of
movement-related beta peak frequency compared to resting peak frequency
seems to be related to the active engagement of the motor system. It should be
noted that peak detection for pre-movement baseline beta in some cases was
ambiguous when the power spectra showed no clear peak in the beta range even
after compensation for the 1/f effect. Furthermore, some subjects displayed
double frequency peaks during movement-related beta modulation in line with
previous studies suggesting a functional subdivision into low and high
frequencies within the beta band (Litvak et al., 2011; Oswal et al., 2016; Van Wijk
et al., 2016). These factors might be reasons why ICC values were lower.
While measures of beta activity may be affected by a variety of factors, the
present study provides evidence that these signatures are highly reliable and
consistent over several weeks in a small sample of healthy subjects. The almost
perfect intra-individual reliability and high number of sessions provide support to
the finding of stable beta power measures. This is important as EEG is an
excellent tool for the identification of widely-available and cost-effective
biomarkers that might have the potential to bridge the gap between cellular and
behavioural accounts of cortical function and plasticity in both healthy and
diseased states (Ward, 2015). Establishing the reproducibility of neuronal
oscillations is crucial for the identification of EEG-derived biomarkers, with
substantial clinical utility for patient stratification and prediction of treatment
response.
A potential limitation of this study is the sample of healthy young subjects, which
limits the generalizability of the reliability results. In particular, resting and
movement-related beta-band estimates have been shown to be modulated by
healthy ageing (Gaetz et al. 2010; Rossiter et al. 2014; Heinrichs-Graham &
Wilson 2016) and pathology (Brown 2007; Heinrichs-Graham et al. 2013; Heida
et al. 2014; Rossiter et al. 2014) possibly resulting in different reliability patterns.
Intra-individual reliability of movement-related beta oscillations
129
Future studies should thus determine the reliability of movement-related beta-
band activity across the lifespan and in the context of movement disorders.
4.5.2 Conclusion
In conclusion, this study is the first to comprehensively evaluate the reliability of
spectral power and peak frequency measures of movement-related beta
oscillations across several weeks. The present study highlights that spectral
power measures of EEG-derived oscillatory signatures associated with the
performance of a motor task are highly reproducible. This finding is important as
it suggests that measurements of beta-band power reflect meaningful and
reliable individual differences in the motor system that may be utilized as
biomarkers in clinical and/or longitudinal research. In addition, the assessments
indicate that beta peak frequencies are more variable across sessions which
should be taken into account when using extrinsic neurostimulation at beta
frequency (Guerra et al., 2016; Joundi et al., 2012; Pogosyan et al., 2009).
Overall, the highly reproducible nature of beta oscillations suggests that they may
be an appropriate assay for longitudinal studies and/or clinical studies employing
sensor-derived EEG-based oscillatory read-outs.

130

Predicting individual differences in motor skill learning
131
Predicting individual differences in motor
skill learning
5.1 Abstract
People vary in their capacity to learn and retain new motor skills, but the
electrophysiological mechanisms underlying individual differences in motor
learning are incompletely understood. The findings reported in Chapter 4 served
to validate the notion that EEG-derived measures of beta-band activity reflect
meaningful individual differences, a prerequisite for exploring their relationship
with motor learning behaviour in humans. Employing a multivariate approach, I
here investigate whether these standard measures of resting and movement-
related beta power from bilateral sensorimotor cortex could explain inter-
individual differences in motor learning behaviour. Twenty young (18–30 years)
and twenty elderly (62–77 years) healthy adults were trained on the continuous
tracking task introduced in Chapter 3 and subsequently retested at two different
time points after initial training (45–60 min and 24 hours later). Scalp EEG was
recorded during the performance of the simple motor task before each training
and retest session.
Although short-term motor learning was comparable between young and elderly
individuals, elderly subjects exhibited higher resting beta power and movement-
related beta desynchronization (MRBD). Multivariate modelling within leave-one-
out cross-validation (LOOCV) revealed that a combination of subjects’ behaviour
on the continuous tracking task together with movement-related beta activity
significantly predicted performance levels 45–60 min, but not 24 hours after initial
training. Crucially, pre-training levels of movement-related beta activity helped to
explain individual differences in performance in a way that behaviour alone could
not. In the context of disease, these findings suggest that measurements of beta-
band activity may offer novel targets for therapeutic interventions designed to
promote rehabilitative outcomes after brain injury.
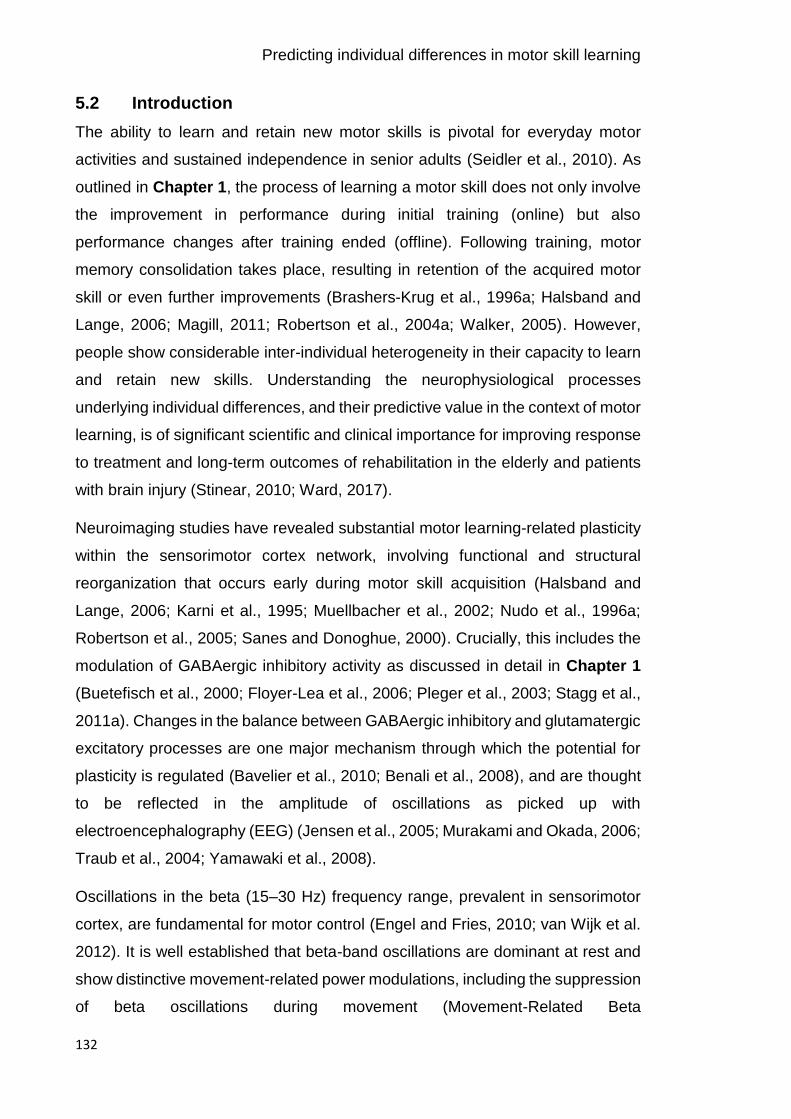
Predicting individual differences in motor skill learning
132
5.2 Introduction
The ability to learn and retain new motor skills is pivotal for everyday motor
activities and sustained independence in senior adults (Seidler et al., 2010). As
outlined in Chapter 1, the process of learning a motor skill does not only involve
the improvement in performance during initial training (online) but also
performance changes after training ended (offline). Following training, motor
memory consolidation takes place, resulting in retention of the acquired motor
skill or even further improvements (Brashers-Krug et al., 1996a; Halsband and
Lange, 2006; Magill, 2011; Robertson et al., 2004a; Walker, 2005). However,
people show considerable inter-individual heterogeneity in their capacity to learn
and retain new skills. Understanding the neurophysiological processes
underlying individual differences, and their predictive value in the context of motor
learning, is of significant scientific and clinical importance for improving response
to treatment and long-term outcomes of rehabilitation in the elderly and patients
with brain injury (Stinear, 2010; Ward, 2017).
Neuroimaging studies have revealed substantial motor learning-related plasticity
within the sensorimotor cortex network, involving functional and structural
reorganization that occurs early during motor skill acquisition (Halsband and
Lange, 2006; Karni et al., 1995; Muellbacher et al., 2002; Nudo et al., 1996a;
Robertson et al., 2005; Sanes and Donoghue, 2000). Crucially, this includes the
modulation of GABAergic inhibitory activity as discussed in detail in Chapter 1
(Buetefisch et al., 2000; Floyer-Lea et al., 2006; Pleger et al., 2003; Stagg et al.,
2011a). Changes in the balance between GABAergic inhibitory and glutamatergic
excitatory processes are one major mechanism through which the potential for
plasticity is regulated (Bavelier et al., 2010; Benali et al., 2008), and are thought
to be reflected in the amplitude of oscillations as picked up with
electroencephalography (EEG) (Jensen et al., 2005; Murakami and Okada, 2006;
Traub et al., 2004; Yamawaki et al., 2008).
Oscillations in the beta (15–30 Hz) frequency range, prevalent in sensorimotor
cortex, are fundamental for motor control (Engel and Fries, 2010; van Wijk et al.
2012). It is well established that beta-band oscillations are dominant at rest and
show distinctive movement-related power modulations, including the suppression
of beta oscillations during movement (Movement-Related Beta

Predicting individual differences in motor skill learning
133
Desynchronization, MRBD) and a rebound after movement cessation (Post-
Movement Beta Rebound, PMBR) (Pfurtscheller and Lopes Da Silva, 1999;
Pfurtscheller et al., 1998a; Salmelin and R. Hari, 1994; Stancak and Pfurtscheller,
1995). While their relationship with motor behaviour is well established, the
functional role of resting and dynamic movement-related beta activity for the
capacity to both learn and retain new motor skills remains unclear.
The main objective of this study was to (I) explore the neurophysiological
mechanisms associated with individual differences in short-term motor learning
behaviour in healthy ageing subjects. By including both young and elderly
subjects, inter-subject variability was maximised, because alterations in beta
oscillations have been seen with ageing (Gaetz et al., 2010; Heinrichs-Graham
and Wilson, 2016; Rossiter et al., 2014b), and previous studies have suggested
an age-related reduction in the potential for plasticity (Chollet, 2013; Fathi et al.,
2010; Tecchio et al., 2008; Todd et al., 2010). Given the link between beta
oscillations and both inhibitory GABAergic activity (Hall et al., 2011, 2010a;
Jensen et al., 2005; Muthukumaraswamy et al., 2013) and learning (Boonstra et
al., 2007; Houweling et al., 2008; Pollok et al., 2014), I hypothesized that beta
oscillatory activity can account for differences in the capacity to learn and retain
new motor skills. Importantly, my chosen EEG measures of resting and
movement-related beta-band power have previously been shown to have high
intra-subject reliability (Espenhahn et al., 2016), a prerequisite for exploring the
longitudinal relationship between individual neurophysiological variations and
differences in the capacity to learn a new motor skill.
Since ageing is thought to affect both the potential for plasticity (Chollet, 2013;
Fathi et al., 2010; Tecchio et al., 2008; Todd et al., 2010) and the ability for motor
learning (for review see (Ren et al., 2013; Seidler, 2006; Voelcker-Rehage,
2008)), although this seems to be dependent on the nature of the task, secondary
objectives were to assess (II) whether the ability to learn and retain new motor
skills deteriorates with age, and (III) whether age-related changes in properties
of beta oscillations are in line with, and/or augment previous findings (Gaetz et
al., 2010; Heinrichs-Graham and Wilson, 2016; Rossiter et al., 2014b).

Predicting individual differences in motor skill learning
134
5.3 Methods
5.3.1 Subjects
Forty subjects took part in the present study over two consecutive days. Two
subjects had to be excluded because they either did not comply with the task
requirements (n = 1 young; subject 17) or later disclosed a neurological disease
(n = 1 elderly; subject 24). Thus, nineteen young (mean age = 25±4 years, range
18–30 years, 1 left-handed; for more details see Table 5.1) and nineteen elderly
(mean age = 69±4 years, range 62–77 years, 1 left-handed) subjects were
included for analyses (N = 38). All subjects had normal or corrected-to-normal
vision, and fulfilled the following inclusion criteria: (a) no history of neurological or
psychiatric disease; (b) no physical disability of the arms or wrists; (c) no use of
drugs affecting the central nervous system or self-reported abuse of any drugs
(e.g. analgesics, anticonvulsants, muscle relaxants, sedatives, hypnotics); and
(d) age within specified range (18–30 years or 60–80 years). To minimize
circadian fluctuations in beta oscillatory levels (Toth et al., 2007; Wilson et al.,
2014), all subjects were tested in the time between 9am and 2pm after giving
written informed consent. In addition, subjects were instructed to abstain from
alcohol and caffeine the evening and morning before the testing.
At the beginning of the experiment, subjects underwent functional assessments
to quantify upper limb (UL) motor ability, including NHPT (Kellor et al., 1971;
Mathiowetz et al., 1985b) and grip strength task. Performance on the SART
(Robertson et al., 1997) was used as a proxy of cognitive functioning (see Table
5.1). Since sleep has been shown to affect motor memory consolidation (Korman
et al., 2007; Walker et al., 2002; Wilson et al., 2012), on both days, subjects
additionally provided information about their sleep (computerised version of St.
Mary’s Hospital sleep questionnaire (Ellis et al., 1981)) for the nights preceding
testing. Please refer to Chapter 3 section 3.3 for details about the various tests.

Predicting individual differences in motor skill learning
135
5.3.2 Experimental design
The experimental design is illustrated in Figure 5.1. Since the primary objective
of this study was to explore whether cortical beta-band activity is associated with
individual differences in motor learning capacity, I here combined neuroimaging
and motor learning on the continuous tracking task introduced in Chapter 3
section 3.2.2. All subjects trained with their non-dominant hand on the continuous
tracking task over a single training session (40 blocks; 20–40 min) with the aim
of improving tracking performance beyond pre-training levels. The tracking task
involved two types of sequences within each block, a random and a repeated
sequence. Improvement on the random sequence is a measure of general skill
learning, whilst any additional improvement on the repeated sequence reflects
sequence-specific motor learning of the precise sequence pattern (Wulf and
Schmidt, 1997). Tracking performance was defined as the accuracy (measured
in RMSE) with which subject’s wrist movement tracked the target movement
(Figure 5.2A). Participants’ tracking performance was retested at two different
time points: 45–60 min (retest1 on day 1; 5 blocks) and 24 hours (retest2 on day
2; 10 blocks) after initial training. These retest sessions allowed (i) temporary
effects (e.g. fatigue or boredom) that build up over the course of training (Brawn
et al., 2010; Rickard et al., 2008) to dissipate, thus only leaving the fairly
permanent learning effects and (ii) consolidation of motor memories to occur,
which may result in retention, decrement or even enhancement of the previously
acquired motor skill after a night’s sleep (Robertson et al., 2004a; Walker, 2005).
EEG recorded during the performance of the simple motor task was used to
assess pre-movement (resting) and movement-related beta activity before (Pre),
immediately after (Post1) and 24-hours after (Post2) the initial training phase. On
day 1, prior to the motor tasks, the mid-point and maxima of an individual’s
maximum AROM (see Chapter 3 section 3.2.1 for details) around the wrist joint
was measured and subsequently used as start and/or target positions in the
continuous tracking task and simple motor task, respectively.
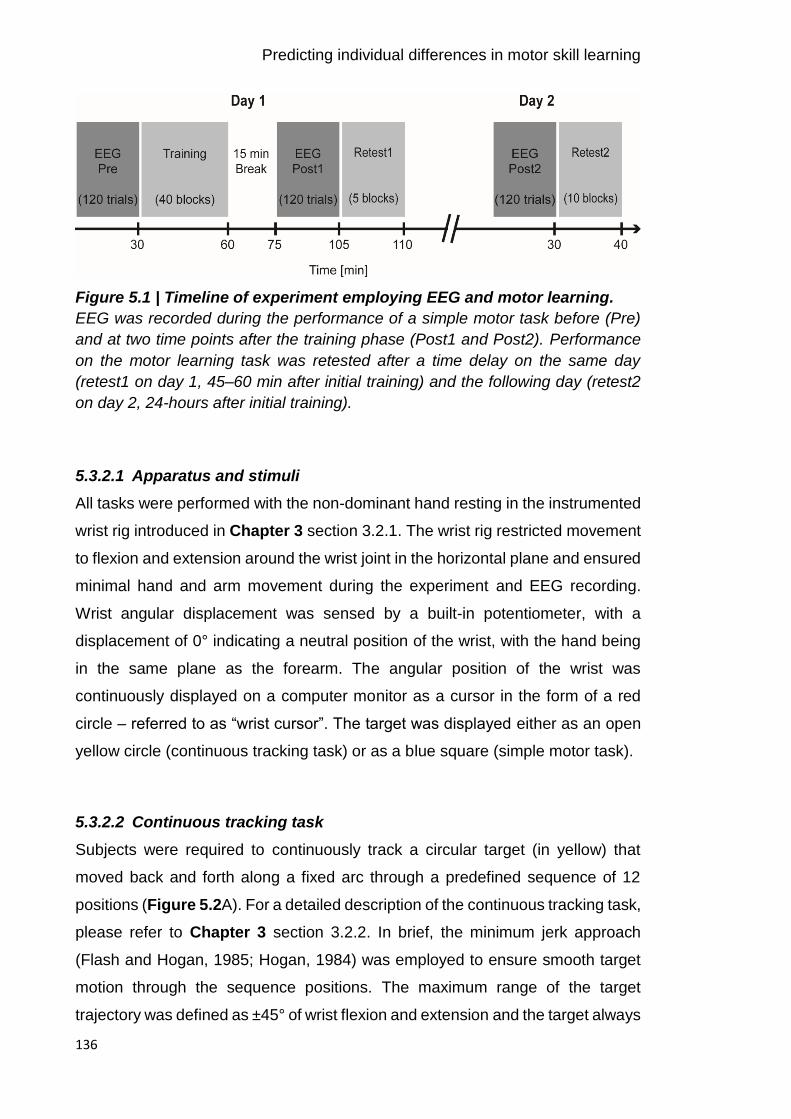
Predicting individual differences in motor skill learning
136
Figure 5.1 | Timeline of experiment employing EEG and motor learning.
EEG was recorded during the performance of a simple motor task before (Pre)
and at two time points after the training phase (Post1 and Post2). Performance
on the motor learning task was retested after a time delay on the same day
(retest1 on day 1, 45–60 min after initial training) and the following day (retest2
on day 2, 24-hours after initial training).
5.3.2.1 Apparatus and stimuli
All tasks were performed with the non-dominant hand resting in the instrumented
wrist rig introduced in Chapter 3 section 3.2.1. The wrist rig restricted movement
to flexion and extension around the wrist joint in the horizontal plane and ensured
minimal hand and arm movement during the experiment and EEG recording.
Wrist angular displacement was sensed by a built-in potentiometer, with a
displacement of 0° indicating a neutral position of the wrist, with the hand being
in the same plane as the forearm. The angular position of the wrist was
continuously displayed on a computer monitor as a cursor in the form of a red
circle – referred to as “wrist cursor”. The target was displayed either as an open
yellow circle (continuous tracking task) or as a blue square (simple motor task).
5.3.2.2 Continuous tracking task
Subjects were required to continuously track a circular target (in yellow) that
moved back and forth along a fixed arc through a predefined sequence of 12
positions (Figure 5.2A). For a detailed description of the continuous tracking task,
please refer to Chapter 3 section 3.2.2. In brief, the minimum jerk approach
(Flash and Hogan, 1985; Hogan, 1984) was employed to ensure smooth target
motion through the sequence positions. The maximum range of the target
trajectory was defined as ±45° of wrist flexion and extension and the target always
Predicting individual differences in motor skill learning
137
started and finished at the individual mid-point position of each subject’s AROM.
Each block consisted of two sequences, one random and one repeated sequence
presented in randomised order, with a 3 s stationary target between both. The
repeated sequence was identical throughout initial training (40 blocks), and retest
sessions (retest1 on day 1: 5 blocks; retest2 on day 2: 10 blocks) and randomly
selected from a pool of 57 difficulty-matched sequences. Please refer to Chapter
3 section 3.2.2.3 for details about the sequences. Each random sequence was
encountered only once; however, the same set of difficulty-matched sequences
was used across subjects. Subjects were instructed to move their wrist so as to
shift the red wrist cursor to match the movement of the target as ‘accurately and
smoothly as possible’.
Prior to the training session, the average velocity with which the target moved
along the arc was individually determined in order to ensure that the task was of
equal difficulty for everyone at the beginning of the training and left enough room
for improvement in performance. For this purpose, an adaptive up-down staircase
procedure, which on any given trial, adjusted (increased/decreased) the target
velocity dependent on the subject’s preceding tracking performance until a pre-
specified criterion range was reached was implemented. On average, subjects
reached the criterion in 14.4±4.5 trials and there was no difference in the number
of trials required between groups (t(1,36)=0.94, p=0.072). The individually
determined target velocity with which subjects were subsequently trained on the
continuous tracking task was applied to all sessions and did not significantly differ
between young (mean velocity ±SD = 55.38±6.92 deg/s) and elderly (mean
velocity ±SD = 50.78±9.41 deg/s) subjects [t(1,36)=1.71, p=0.095]. Please refer to
Chapter 3 section 3.2.2.5 for details about the adaptive staircase procedure used
for individual determination of target velocity.
During initial training and retest sessions, online visual feedback in terms of a
colour change of the wrist cursor (from red to green) was provided at times when
the subject positioned the wrist cursor inside the circular target. In addition, at the
end of each block, subjects were made aware of their change in tracking
performance by presenting a score on the screen. Prior to the start of training,
subjects received explicit verbal information regarding the presence of a repeated

Predicting individual differences in motor skill learning
138
sequence along with a random sequence in every block. However, they were not
shown the repeated sequence. To determine the time point at which participants
gained explicit knowledge of the repeated sequence, after each block they had
to decide (forced-choice) which of the two sequences within each block the
repeated sequence was – i.e. tell the experimenter whether it was the first or
second sequence they tracked within the block (Figure 3.4C). The trajectories of
the target and subject’s wrist cursor did not leave a residual trail on the screen
and hence, subjects could not visualize the entire target sequence.
Figure 5.2 | Experimental setup and paradigms.
A, Subjects were trained to track a target (yellow circle) moving back and forth
along a fixed arc as accurately and smoothly as possible. Online visual feedback
in terms of a colour change of the wrist cursor (red to green) was provided at
times when the wrist cursor was located inside the circular target. Original
recordings during the continuous tracking task at the beginning and end of the
initial training are shown for the repeated sequence of an example participant (A,
lower panel). The solid black line represents the motion of the target, while the
dashed red line represents the motion of the wrist. B, For the simple motor task,
Predicting individual differences in motor skill learning
139
subjects were instructed to perform wrist flexion and extension to move the wrist
cursor (red circle) from the initial start position (grey square) to one of two target
positions (blue square) upon target presentation. C, During both tasks, subjects
sat in front of a computer monitor with their non-dominant hand rested in the wrist
rig that restricted movement to flexion and extension around the wrist joint.
5.3.2.3 Simple motor task
The simple motor task served to link individual differences in motor learning of
the continuous tracking task with inter-subject differences in standard measures
of EEG-derived beta power. For a detailed description of the simple motor task,
please refer to Chapter 3 section 3.2.3. Briefly, subjects performed visually cued
wrist flexion and extension with their non-dominant hand during EEG recording.
During each trial, wrist movements were always initiated from the same start
position displayed at the centre of the screen that represented the mid-point of a
subject’s individual AROM (see Chapter 3 section 3.2.1 for details about AROM
measurement). The cue to perform wrist flexion or extension movements was the
random appearance of one of two targets (in blue), on the left or right, equidistant
from the central start position (Figure 5.2B). Each of the targets represented the
subject’s maximum wrist flexion or extension position. Subjects were instructed
to move their wrist upon presentation of the target so as to shift the red wrist
cursor from the central start position to match the position of the target in a ‘quick
and discrete’ movement. They were also asked to move as soon as possible and
to avoid anticipation or guessing of target appearance. The target position was
displayed for 3 s and subjects had to maintain the wrist cursor inside the blue
target until being cued to return to the initial start position. Once subjects returned
to the start position, the next cue to move was delivered following a delay of 7±1 s.
The task comprised 120 trials, and subjects were instructed to minimize eye
movements by focusing on a centrally located fixation cross. As described in
detail in Chapter 3 section 3.7.1.2, kinematic data of individual wrist movements
were analysed with regard to reaction time (RT), movement time (MT), and peak
velocity (PV) and averaged per experimental condition on an average of 110±4
remaining trials. Since movement time and peak velocity were highly correlated
(r>0.8), only reaction time and movement time were reported.

Predicting individual differences in motor skill learning
140
5.3.3 EEG recording
Scalp EEG was continuously recorded at 2084 Hz using 64 electrodes mounted
on an elastic cap according to the international 10-20 EEG system. The
impedance was kept below ≤5 kΩ and the EEG signal was referenced to Cz
during recording. The timing of the visual cue (blue target) in the motor task was
marked in the simultaneous EEG recording, with separate markers for each
condition (flexion, extension). Surface EMG using bipolar electrodes in a belly-
tendon montage placed on the wrist extensor (extensor carpi radialis, ECR) and
flexor (flexor carpi radialis, FCR) muscles monitored movements of the non-
dominant hand.
5.3.4 Data analysis
Analyses were conducted using custom-written routines in Matlab and the
SPM12 toolbox (Wellcome Trust Centre for Neuroimaging). The fieldtrip toolbox
(Oostenveld et al., 2011) was additionally employed for EEG data visualization.
Statistical analyses were performed using SPSS and custom-written Matlab
routines.
5.3.4.1 Motor learning data
For a detailed description of the kinematic data analysis, please refer to Chapter
3 section 3.7.1.1. In brief, the behavioural measure “tracking performance” on the
continuous tracking task was parametrized by RMSE (see Equation 3.5), an
established composite measure of temporal and spatial measurements of time
lag and distance (Al-Sharman and Siengsukon, 2014; Boyd and Winstein, 2006;
Roig et al., 2014; Siengsukon and Boyd, 2009). Thereby, smaller RMSE values
reflect better tracking performance. RMSE was calculated for repeated and
random sequences separately and averaged across each block of the training
and retest sessions.
As the beginning and end of individual training and retest sessions might not be
representative of actual tracking performance (e.g. due to warm-up decrement at
the beginning or fatigue at the end), a linear regression model was fitted across
the first and last 5 blocks of individual training and retest sessions (approach
adopted from (Waters-Metenier et al., 2014)). This fit provided a corrected
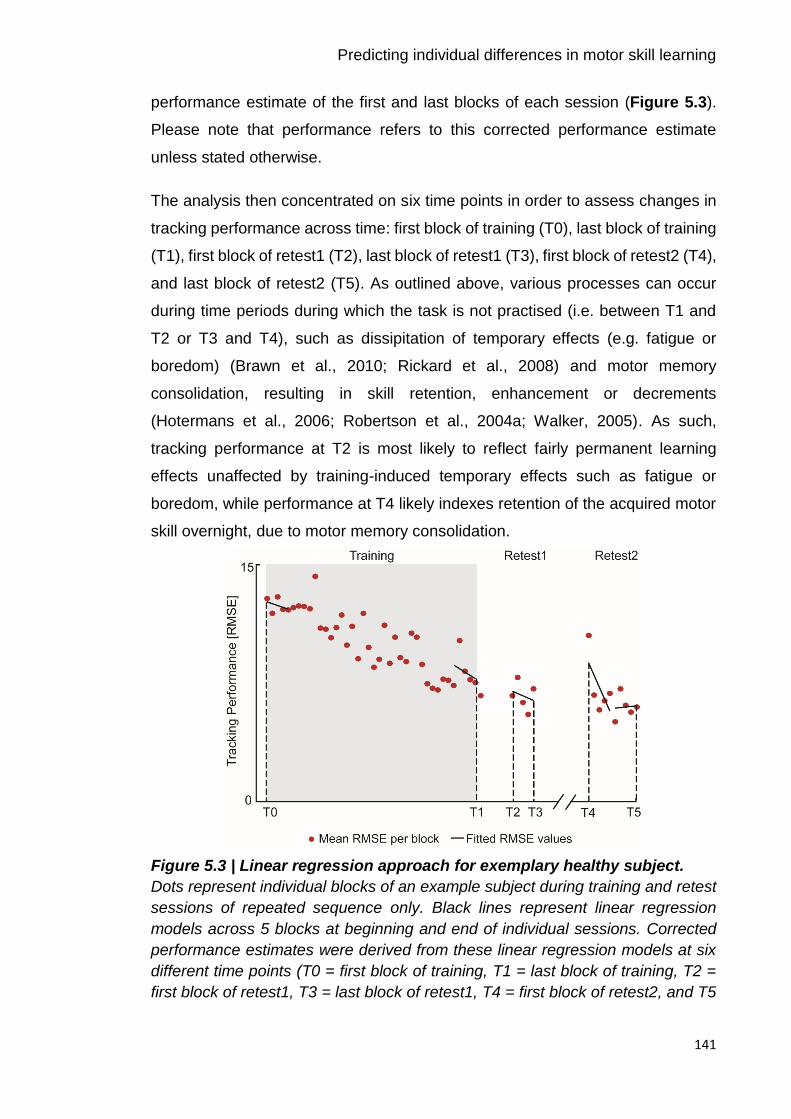
Predicting individual differences in motor skill learning
141
performance estimate of the first and last blocks of each session (Figure 5.3).
Please note that performance refers to this corrected performance estimate
unless stated otherwise.
The analysis then concentrated on six time points in order to assess changes in
tracking performance across time: first block of training (T0), last block of training
(T1), first block of retest1 (T2), last block of retest1 (T3), first block of retest2 (T4),
and last block of retest2 (T5). As outlined above, various processes can occur
during time periods during which the task is not practised (i.e. between T1 and
T2 or T3 and T4), such as dissipitation of temporary effects (e.g. fatigue or
boredom) (Brawn et al., 2010; Rickard et al., 2008) and motor memory
consolidation, resulting in skill retention, enhancement or decrements
(Hotermans et al., 2006; Robertson et al., 2004a; Walker, 2005). As such,
tracking performance at T2 is most likely to reflect fairly permanent learning
effects unaffected by training-induced temporary effects such as fatigue or
boredom, while performance at T4 likely indexes retention of the acquired motor
skill overnight, due to motor memory consolidation.
Figure 5.3 | Linear regression approach for exemplary healthy subject.
Dots represent individual blocks of an example subject during training and retest
sessions of repeated sequence only. Black lines represent linear regression
models across 5 blocks at beginning and end of individual sessions. Corrected
performance estimates were derived from these linear regression models at six
different time points (T0 = first block of training, T1 = last block of training, T2 =
first block of retest1, T3 = last block of retest1, T4 = first block of retest2, and T5
Predicting individual differences in motor skill learning
142
= last block of retest2) and used to subsequently assess changes in performance
with training.
5.3.4.2 Spectral power measures
Pre-processing and time-frequency analysis of EEG data recorded during the
performance of the simple motor task has been detailed in Chapter 3 section
3.7.2. Briefly, the raw EEG signal was first offline re-referenced to the average
signal across all electrodes, bandpass filtered between 5–100 Hz, additionally
filtered with a 50 Hz notch filter, and downsampled to 300 Hz. Data were epoched
from -1 to 9 s relative to visual cue onset (0 s). Poorly performed trials (see
section 5.3.2.3) were excluded and the remaining EEG trials were visually
scrutinized. Trials containing artefacts (e.g. muscle activation or large eye blinks)
were additionally removed. For each session, on average 91±12 and 87±15
artefact-free EEG trials remained for younger and older subjects, respectively,
and the number of trials did not significantly differ between conditions (p>0.1) or
groups (p>0.3, repeated-measures ANOVA). Artefact-free EEG time-series from
each single trial were decomposed into their time-frequency representations in
the 5–45 Hz range with frequency steps of 0.1 Hz. A 7-cycle Morlet wavelet was
used for the continuous wavelet transformation. Power was averaged across
trials and rescaled in order to show changes relative to the corresponding pre-
movement baseline period (-1–0 s prior to cue onset) (Equation 3.6).
Spectral power time-series were then derived from a pre-selection of electrodes
overlying the sensorimotor cortices, both contralateral and ipsilateral to the
moving hand. These electrodes were selected based on the independent dataset
presented in Chapter 4 which showed that the most prominent task-related
changes in beta activity were observed in these electrodes when performing the
simple motor task (MRBD: ‘C4’ ‘CP4’ ‘CP2’ and ‘C3’ ‘CP3’ ‘CP1’ for contra- and
ipsilateral hemispheres, respectively; PMBR: ‘C2’ ‘C4’ ‘CP4’ and ‘C1’ ‘C3’ ‘CP3’
for contra- and ipsilateral hemispheres, respectively). These bilateral electrodes
were pooled as contralateral and ipsilateral regions of interest, respectively.
To select time-frequency windows of interest that were orthogonal to potential
differences between conditions (flexion and extension) when the simple motor

Predicting individual differences in motor skill learning
143
task was performed (Pre, Post1, and Post2), I averaged over conditions,
sessions, and subjects for each group separately. Then, specific time-frequency
windows were chosen based on peak changes in beta activity in time-frequency
maps of the bilateral sensorimotor regions, which, consistent with Chapter 4,
revealed clear movement-related beta-band activity in two distinct time windows
of interest. This information was used to optimize the alignment of constant
duration and width time-frequency windows to capture maximum MRBD (1–2 s
relative to cue onset; mean peak latency: young group: 1.31±0.23 s, elderly
group: 1.64±0.03 s), occurring between cue onset and movement termination,
and PMBR (young group: 5.5–6.5 s relative to cue onset; elderly group: 6–7 s
relative to cue onset; mean peak latency: young group: 5.85±0.16s, elderly group:
6.63±0.39 s), which emerges after movement cessation. This was done for young
and elderly subjects separately because of known age-related reduction of beta
peak frequency (Rossiter et al., 2014b). Indeed, in elderly subjects peak changes
in beta activity after movement cessation (PMBR) appeared at lower beta
frequencies (10–25 Hz) and ~500 ms later compared to younger subjects,
however this could not be explained by age-related differences in return
movement kinematics (Figure 5.4A). Selected time-frequency windows and
electrodes applied to all subjects and sessions, and were not adjusted
individually.
Subsequently, for each individual subject, percentage decrease (MRBD) and
increase (PMBR) in beta power were extracted from the respective 1 s time
windows and averaged separately for each EEG session (Pre, Post1 and Post2)
for the pre-selected electrodes over each hemisphere. The absolute pre-
movement (resting) baseline beta (BB) power from -1 to 0 s relative to cue onset
was also obtained and assessed for age-related differences and training-related
changes.
In total, 6 different beta power estimates were used for subsequent analyses: pre-
movement baseline beta (absolute power), MRBD (relative power) and PMBR
(relative power) from contra- and ipsilateral sensorimotor cortices, respectively.
As demonstrated in Chapter 4, these spectral power measures have high intra-
subject reliability (Espenhahn et al., 2016), a prerequisite for exploring the

Predicting individual differences in motor skill learning
144
relationship between these beta oscillatory estimates and individual differences
in motor learning.
Figure 5.4 | Angular displacement and respective changes in beta activity.
A, Group-averaged angular position trajectory (grey curve) and beta power time
courses for contra- and ipsilateral sensorimotor cortex for young (left panel) and
elderly (right panel) subjects, respectively. Movement kinematics were similar
between both groups and illustrate the movement towards the target, the static
contraction/holding phase, and the return movement to the initial start position.
B, Time-frequency maps from contralateral and ipsilateral sensorimotor cortex
show two distinct time windows of peak changes in beta activity (MRBD and
PMBR) indicated by black rectangles. Please note that the PMBR in elderly
subjects occurred at lower beta frequencies (10–25 Hz) and ~500 ms later
Predicting individual differences in motor skill learning
145
compared to younger subjects. These time-frequency windows were tested for
significant differences between groups and EEG sessions.
5.3.5 Statistical analysis
Before (I) investigating the relationship between beta-band activity and individual
differences in motor learning, a series of conventional analyses were first
conducted to assess (II) whether young and elderly subjects learned to a similar
extent on the continuous tracking task (their behaviour), and (III) whether beta-
band activity was altered with training or ageing (neurophysiology).
To assess whether tracking performance improved across training and was
maintained, enhanced or decreased at retest sessions, a repeated-measures
ANOVA on tracking performance score (RMSE) was performed, with ‘group’ (2
levels: young vs elderly) as between-subject factor and ‘sequence type’ (2 levels:
repeated vs random) and ‘time’ (5 levels: T0 vs T1 vs T2 vs T3 vs T4) as within-
subject factors. Additionally, to ensure comparable baseline performance and
thus, allow for direct comparison between age groups, a repeated-measures
ANOVA of tracking performance at T0 (baseline) was used.
Since beta oscillations have been shown to be altered with ageing (Gaetz et al.,
2010; Rossiter et al., 2014b) and motor learning (Boonstra et al., 2007; Houweling
et al., 2008; Mary et al., 2015; Pollok et al., 2014), measures of resting and
movement-related beta activity were evaluated applying separate repeated-
measures ANOVAs with ‘group’ (2 levels: young vs elderly) as between-subject
factor and ‘hemisphere’ (2 levels: contralateral vs ipsilateral) and EEG ‘session’
(3 levels: Pre vs Post1 vs Post2) as within-subject factors.
A Greenhouse-Geiger correction was applied whenever Mauchly’s test indicated
a lack of sphericity. Post hoc Bonferroni-adjusted t-tests were performed
whenever main effects and interaction effects were detected in the ANOVAs.
Prior to ANOVAs and post hoc t-tests, Kolmogorov-Smirnov test was used to
affirm normal distribution of the data. Results were considered significant if
p-values were below 0.05. All data presented in the text and tables are
represented as mean ±SD unless stated otherwise.
Predicting individual differences in motor skill learning
146
5.3.5.1 Regression analysis combining neurophysiological and
behavioural measures
Finally, a multiple linear regression approach was employed in order to
investigate whether spectral power measures of beta-band activity relate to
individual differences in the capacity for motor learning, accounting for
multicollinearity between neurophysiological (Heinrichs-Graham and Wilson,
2016) and behavioural performance measures. Specifically, separate stepwise
multiple linear regression models (with forward and backward algorithm;
inclusion/exclusion probability levels: αEnter<0.05/ αExclude>0.1) were used to select
those variables that provided a unique contribution to explaining tracking
performance at T2 and T4 for the repeated and random sequence, respectively.
Tracking performance at T2 reflects fairly permanent learning effects unaffected
by training-induced temporary effects such as fatigue or boredom, while
performance at T4 indexes retention of the acquired motor skill overnight,
reflecting motor memory consolidation. Specifically, a combination of
neurophysiological measures, including (a) baseline beta power, (b) MRBD, and
(c) PMBR from both sensorimotor cortices, as well as behavioural performance
measures during the training session, i.e. (d) tracking performance at T0 and (e)
at T1, were used to explain performance at T2, while behavioural performance
measures during retest1, i.e. (f) at T2 and (g) T3, were further included to explain
performance at T4. In addition, functional and demographic information such as
age, motor function, cognitive function and sleep characteristics were equally
included. All predictors were z-scored before analysis to produce regression
coefficients (β) of comparable magnitude.
To avoid overfitting and evaluate the predictive strength of each regression
model, a leave-one-out cross-validation (LOOCV) approach was employed (Arlot
and Celisse, 2010; Picard and Cook, 1984). For this purpose, at each iteration
the regression model was fitted on data from N-1 subjects (training set), with the
removed subject being used as a test set for assessing model performance. This
cross-validation method is an established procedure for assessing generalization
of results to an independent data set, particularly with smaller sample sizes
(Huang et al., 2011; Kang et al., 2014). The strength of the prediction model was
quantified in terms of the correlation coefficient between actual and predicted
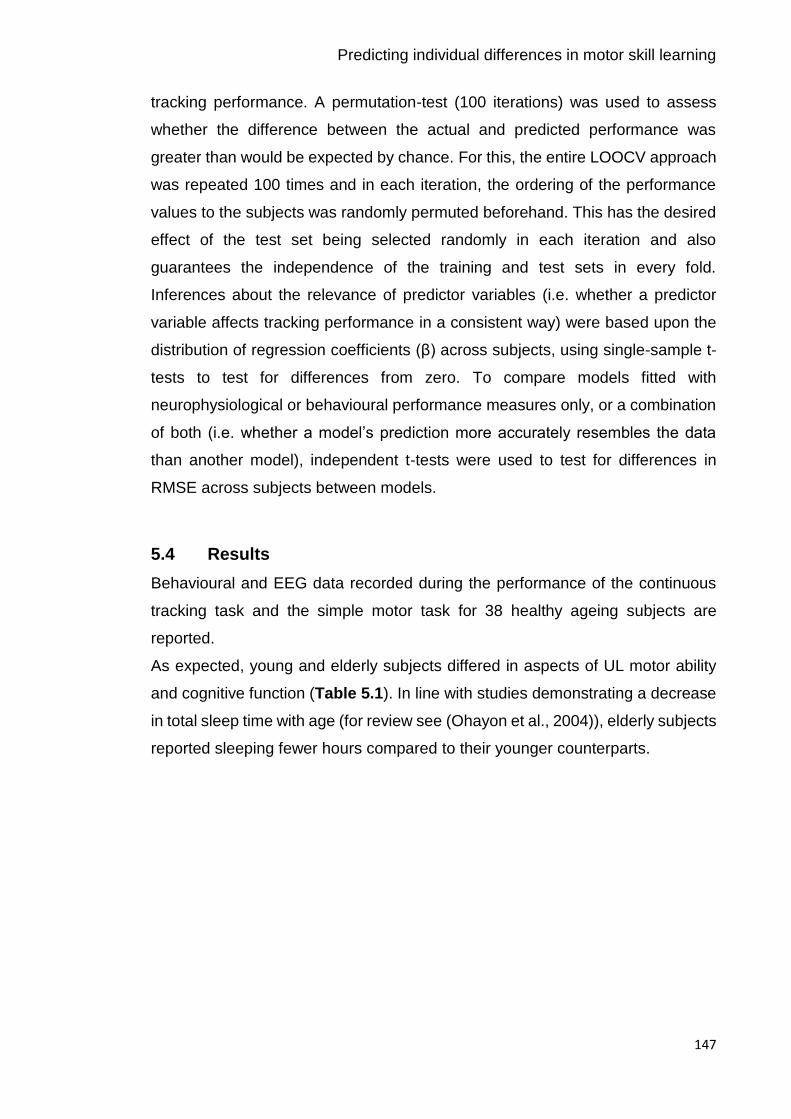
Predicting individual differences in motor skill learning
147
tracking performance. A permutation-test (100 iterations) was used to assess
whether the difference between the actual and predicted performance was
greater than would be expected by chance. For this, the entire LOOCV approach
was repeated 100 times and in each iteration, the ordering of the performance
values to the subjects was randomly permuted beforehand. This has the desired
effect of the test set being selected randomly in each iteration and also
guarantees the independence of the training and test sets in every fold.
Inferences about the relevance of predictor variables (i.e. whether a predictor
variable affects tracking performance in a consistent way) were based upon the
distribution of regression coefficients (β) across subjects, using single-sample t-
tests to test for differences from zero. To compare models fitted with
neurophysiological or behavioural performance measures only, or a combination
of both (i.e. whether a model’s prediction more accurately resembles the data
than another model), independent t-tests were used to test for differences in
RMSE across subjects between models.
5.4 Results
Behavioural and EEG data recorded during the performance of the continuous
tracking task and the simple motor task for 38 healthy ageing subjects are
reported.
As expected, young and elderly subjects differed in aspects of UL motor ability
and cognitive function (Table 5.1). In line with studies demonstrating a decrease
in total sleep time with age (for review see (Ohayon et al., 2004)), elderly subjects
reported sleeping fewer hours compared to their younger counterparts.
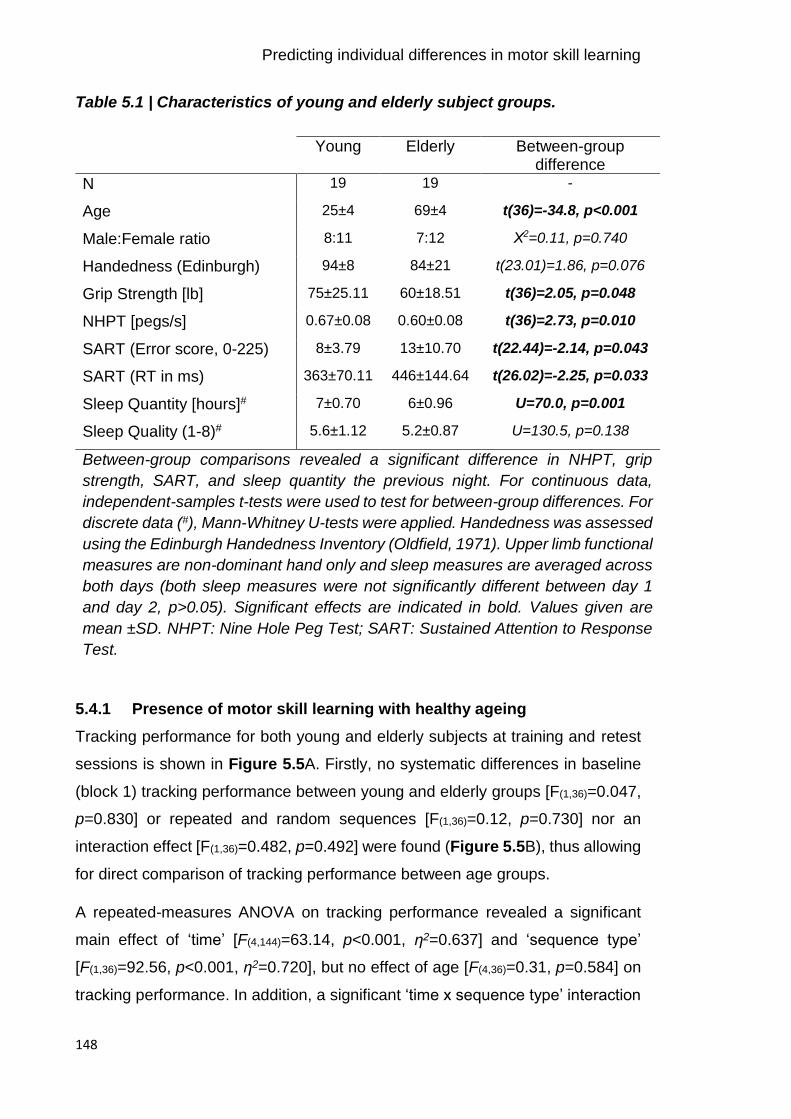
Predicting individual differences in motor skill learning
148
Table 5.1 | Characteristics of young and elderly subject groups.
Young Elderly Between-group difference
N 19 19 -
Age 25±4 69±4 t(36)=-34.8, p<0.001
Male:Female ratio 8:11 7:12 Χ2=0.11, p=0.740
Handedness (Edinburgh) 94±8 84±21 t(23.01)=1.86, p=0.076
Grip Strength [lb] 75±25.11 60±18.51 t(36)=2.05, p=0.048
NHPT [pegs/s] 0.67±0.08 0.60±0.08 t(36)=2.73, p=0.010
SART (Error score, 0-225) 8±3.79 13±10.70 t(22.44)=-2.14, p=0.043
SART (RT in ms) 363±70.11 446±144.64 t(26.02)=-2.25, p=0.033
Sleep Quantity [hours]# 7±0.70 6±0.96 U=70.0, p=0.001
Sleep Quality (1-8)# 5.6±1.12 5.2±0.87 U=130.5, p=0.138
Between-group comparisons revealed a significant difference in NHPT, grip
strength, SART, and sleep quantity the previous night. For continuous data,
independent-samples t-tests were used to test for between-group differences. For
discrete data (#), Mann-Whitney U-tests were applied. Handedness was assessed
using the Edinburgh Handedness Inventory (Oldfield, 1971). Upper limb functional
measures are non-dominant hand only and sleep measures are averaged across
both days (both sleep measures were not significantly different between day 1
and day 2, p>0.05). Significant effects are indicated in bold. Values given are
mean ±SD. NHPT: Nine Hole Peg Test; SART: Sustained Attention to Response
Test.
5.4.1 Presence of motor skill learning with healthy ageing
Tracking performance for both young and elderly subjects at training and retest
sessions is shown in Figure 5.5A. Firstly, no systematic differences in baseline
(block 1) tracking performance between young and elderly groups [F(1,36)=0.047,
p=0.830] or repeated and random sequences [F(1,36)=0.12, p=0.730] nor an
interaction effect [F(1,36)=0.482, p=0.492] were found (Figure 5.5B), thus allowing
for direct comparison of tracking performance between age groups.
A repeated-measures ANOVA on tracking performance revealed a significant
main effect of ‘time’ [F(4,144)=63.14, p<0.001, ƞ2=0.637] and ‘sequence type’
[F(1,36)=92.56, p<0.001, ƞ2=0.720], but no effect of age [F(4,36)=0.31, p=0.584] on
tracking performance. In addition, a significant ‘time x sequence type’ interaction
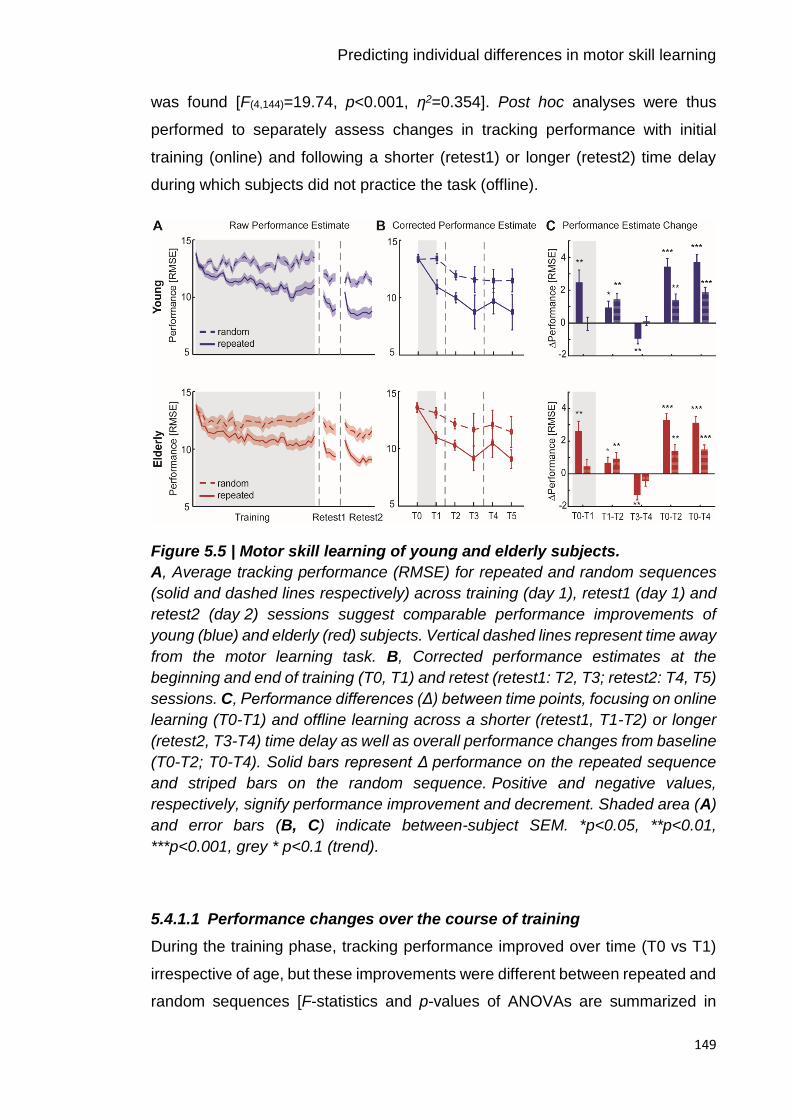
Predicting individual differences in motor skill learning
149
was found [F(4,144)=19.74, p<0.001, ƞ2=0.354]. Post hoc analyses were thus
performed to separately assess changes in tracking performance with initial
training (online) and following a shorter (retest1) or longer (retest2) time delay
during which subjects did not practice the task (offline).
Figure 5.5 | Motor skill learning of young and elderly subjects.
A, Average tracking performance (RMSE) for repeated and random sequences
(solid and dashed lines respectively) across training (day 1), retest1 (day 1) and
retest2 (day 2) sessions suggest comparable performance improvements of
young (blue) and elderly (red) subjects. Vertical dashed lines represent time away
from the motor learning task. B, Corrected performance estimates at the
beginning and end of training (T0, T1) and retest (retest1: T2, T3; retest2: T4, T5)
sessions. C, Performance differences (Δ) between time points, focusing on online
learning (T0-T1) and offline learning across a shorter (retest1, T1-T2) or longer
(retest2, T3-T4) time delay as well as overall performance changes from baseline
(T0-T2; T0-T4). Solid bars represent Δ performance on the repeated sequence
and striped bars on the random sequence. Positive and negative values,
respectively, signify performance improvement and decrement. Shaded area (A)
and error bars (B, C) indicate between-subject SEM. *p<0.05, **p<0.01,
***p<0.001, grey * p<0.1 (trend).
5.4.1.1 Performance changes over the course of training
During the training phase, tracking performance improved over time (T0 vs T1)
irrespective of age, but these improvements were different between repeated and
random sequences [F-statistics and p-values of ANOVAs are summarized in
Predicting individual differences in motor skill learning
150
Table 5.2]. Post hoc analyses revealed a significant improvement in tracking
performance of ~19 % for the repeated sequence [t(37)=5.43, p<0.001, ƞ2=0.443]
(Figure 5.5C). This was not seen for the random sequence [t(37)=0.69, p=0.489],
indicating that improvements primarily occurred via a sequence-specific learning
effect which appeared to be unaffected by ageing.
5.4.1.2 Performance changes after training on the same day – retest1
After establishing that young and elderly subjects showed a comparable ability to
learn the sequence-specific motor skill, next tracking performance at retest1 was
examined. During the short time delay between the end of the initial training and
the retest1 session (T1 vs T2), tracking performance significantly improved
without further training for both the repeated and random sequence. Across
groups, tracking performance on the repeated sequence improved by 7 %
[t(37)=3.17, p=0.003, ƞ2=0.215], while a 9 % improvement was observed for the
random sequence [t(37)=4.71, p<0.001, ƞ2=0.382], indicating a boost in
performance early after initial training (45-60 min) (Figure 5.5C). Please note that
the performance improvement on the repeated sequence did not reach
significance in the elderly subject group [t(18)=1.93, p=0.070]. Overall,
performance significantly improved from T0 to T2 not only for the repeated
sequence (25 % improvement) [t(37)=10.91, p<0.001], but also the random
sequence (10 % improvement) [t(37)=5.31, p<0.001], despite the non-significant
general learning across training.
5.4.1.3 Performance changes after training 24 hours later – retest2
Finally, changes in tracking performance, without practice, at 24 hours (retest2)
after initial training were assessed. Performance significantly deteriorated from
T3 to T4 irrespective of age, but dependent on the type of sequence. Post hoc
analyses revealed that while tracking performance on the random sequence was
retained overnight [t(37)=-1.21, p=0.236], significant performance decrements (i.e.
overnight forgetting) of ~13 % were observed for the repeated sequence
[t(37)=-5.79, p<0.001, ƞ2=0.478] (Figure 5.5C). Thus, while training-related
improvements in general tracking performance were retained for at least
24 hours, overnight forgetting that was specific to the repeated sequence
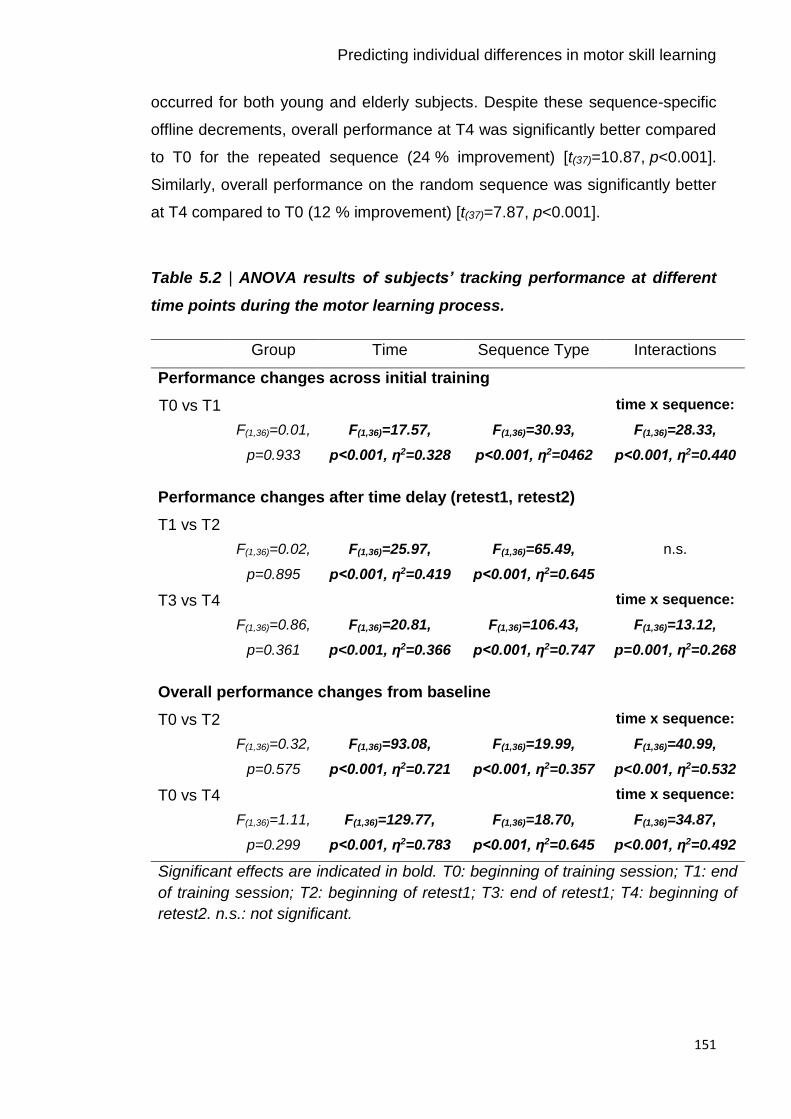
Predicting individual differences in motor skill learning
151
occurred for both young and elderly subjects. Despite these sequence-specific
offline decrements, overall performance at T4 was significantly better compared
to T0 for the repeated sequence (24 % improvement) [t(37)=10.87, p<0.001].
Similarly, overall performance on the random sequence was significantly better
at T4 compared to T0 (12 % improvement) [t(37)=7.87, p<0.001].
Table 5.2 | ANOVA results of subjects’ tracking performance at different
time points during the motor learning process.
Group Time Sequence Type Interactions
Performance changes across initial training
T0 vs T1
F(1,36)=0.01,
p=0.933
F(1,36)=17.57,
p<0.001, ƞ2=0.328
F(1,36)=30.93,
p<0.001, ƞ2=0462
time x sequence:
F(1,36)=28.33,
p<0.001, ƞ2=0.440
Performance changes after time delay (retest1, retest2)
T1 vs T2
F(1,36)=0.02,
p=0.895
F(1,36)=25.97,
p<0.001, ƞ2=0.419
F(1,36)=65.49,
p<0.001, ƞ2=0.645
n.s.
T3 vs T4
F(1,36)=0.86,
p=0.361
F(1,36)=20.81,
p<0.001, ƞ2=0.366
F(1,36)=106.43,
p<0.001, ƞ2=0.747
time x sequence:
F(1,36)=13.12,
p=0.001, ƞ2=0.268
Overall performance changes from baseline
T0 vs T2
F(1,36)=0.32,
p=0.575
F(1,36)=93.08,
p<0.001, ƞ2=0.721
F(1,36)=19.99,
p<0.001, ƞ2=0.357
time x sequence:
F(1,36)=40.99,
p<0.001, ƞ2=0.532
T0 vs T4
F(1,36)=1.11,
p=0.299
F(1,36)=129.77,
p<0.001, ƞ2=0.783
F(1,36)=18.70,
p<0.001, ƞ2=0.645
time x sequence:
F(1,36)=34.87,
p<0.001, ƞ2=0.492
Significant effects are indicated in bold. T0: beginning of training session; T1: end
of training session; T2: beginning of retest1; T3: end of retest1; T4: beginning of
retest2. n.s.: not significant.
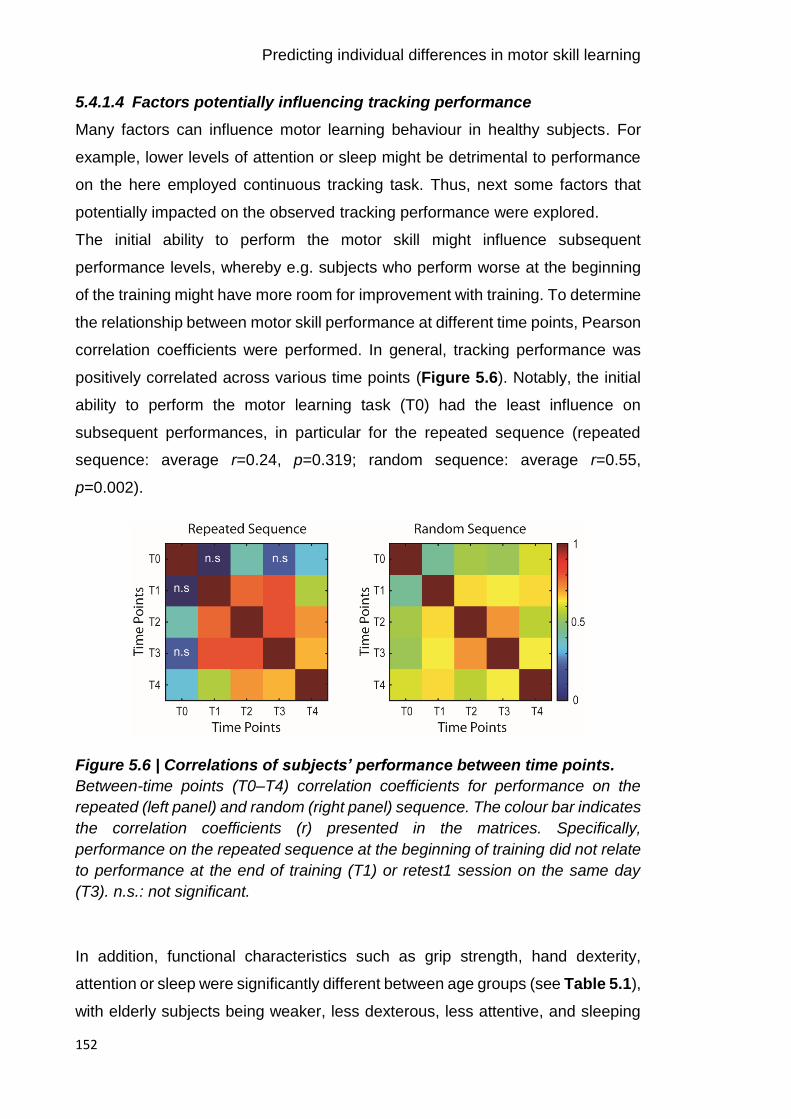
Predicting individual differences in motor skill learning
152
5.4.1.4 Factors potentially influencing tracking performance
Many factors can influence motor learning behaviour in healthy subjects. For
example, lower levels of attention or sleep might be detrimental to performance
on the here employed continuous tracking task. Thus, next some factors that
potentially impacted on the observed tracking performance were explored.
The initial ability to perform the motor skill might influence subsequent
performance levels, whereby e.g. subjects who perform worse at the beginning
of the training might have more room for improvement with training. To determine
the relationship between motor skill performance at different time points, Pearson
correlation coefficients were performed. In general, tracking performance was
positively correlated across various time points (Figure 5.6). Notably, the initial
ability to perform the motor learning task (T0) had the least influence on
subsequent performances, in particular for the repeated sequence (repeated
sequence: average r=0.24, p=0.319; random sequence: average r=0.55,
p=0.002).
Figure 5.6 | Correlations of subjects’ performance between time points.
Between-time points (T0–T4) correlation coefficients for performance on the
repeated (left panel) and random (right panel) sequence. The colour bar indicates
the correlation coefficients (r) presented in the matrices. Specifically,
performance on the repeated sequence at the beginning of training did not relate
to performance at the end of training (T1) or retest1 session on the same day
(T3). n.s.: not significant.
In addition, functional characteristics such as grip strength, hand dexterity,
attention or sleep were significantly different between age groups (see Table 5.1),
with elderly subjects being weaker, less dexterous, less attentive, and sleeping
Predicting individual differences in motor skill learning
153
fewer hours compared to their younger counterparts. However, these functional
characteristics were not associated with subjects’ performance at any time point
(all p>0.05).
Lastly, the acquisition of knowledge regarding the repeated sequence might
interact with how well subjects learn and maintain the sequence-specific
performance level. Young subjects were better in gaining awareness of the
repeated sequence during the initial training (95±8.8 % correct) compared to
elderly subjects (84±16.5 % correct) [Mann-Whitney U=100.5, p=0.018]. The
younger group also performed better at correctly recognizing the repeated
sequence at retest2, 24 hours after the initial training (young: 96±10.0 % correct;
elderly: 83±22.2 % correct) [U=98, p=0.015], indicating less forgetting in younger
subjects. However, these age-related differences in the level of awareness of the
repeated sequence did not relate to subjects’ tracking performance at any time
point (all p>0.4).
5.4.2 Changes in spectral power measures with age and training
All subjects were able to perform the simple motor task used during EEG
recording and there were no significant differences in movement kinematics
between age groups neither for the movement towards the target [RT:
F(1,36)=0.02, p=0.896; MT: F(1,36)=1.14, p=0.293] nor the return movement towards
the initial start position [RT: F(1,36)=0.61, p=0.441; MT: F(1,36)=0.58, p=0.450]
(Table 5.3). Average spectral changes in contralateral and ipsilateral
sensorimotor cortices in response to wrist movement are shown in Figure 5.4B
before (Pre) and at two time points (Post1 and Post2) after the initial training.
General features of the spectral changes in beta activity induced by the simple
motor task have been detailed in Chapter 4 (Espenhahn et al., 2016). Briefly, a
reduction in beta power, MRBD, was observed in both sensorimotor cortices
during movement towards the target and during return movement to the initial
start position. Following return movement cessation, a strong but transient
increase in beta power, PMBR, with a contralateral preponderance was
observed.

Predicting individual differences in motor skill learning
154
Table 5.3 | Summary of kinematic measures acquired during the
performance of the simple motor task for each age group.
Young Elderly
RT [ms] 989±55 975±44
MT [ms] 1166±250 1056±332
PV [deg/s] 124±55 185±93
Kinematic measures are presented for each EEG session (S1–S6)
and condition (flexion, extension). RT: Reaction Time; MT:
Movement Time; PV: Peak. Values given are mean ±SD
5.4.2.1 Resting beta power
Analysis of absolute beta power during the pre-movement (resting) baseline
period demonstrated a significant effect of age, with elderly subjects exhibiting
higher absolute beta power in both contralateral and ipsilateral sensorimotor
cortices (Figure 5.7A, F-statistics and p-values of all ANOVAs are summarized
in Table 5.4), consistent with previous observations (Heinrichs-Graham and
Wilson, 2016; Rossiter et al., 2014b). While there was no hemispheric difference,
absolute beta power was significantly different between EEG sessions. Post-hoc
analyses revealed a significant but transient increase in beta power immediately
after training (Post1) in both contralateral [Pre vs Post1: t(37)=-2.98, p=0.011;
Post1 vs Post2: t(37)=2.59, p=0.032] and ipsilateral [Pre vs Post1: t(37)=-4.60,
p<0.001; Post1 vs Post2: t(37)=2.48, p=0.05] sensorimotor cortex which returned
back to pre-training levels on day 2 [Pre vs Post2: t(37)=0.28, p=1.00]. In addition,
there was a trend for a ‘group x session’ interaction effect [F(2,72)=2.66, p=0.077,
ƞp2=0.075] indicating that the increase immediately after the training phase
predominantly occurred in elderly subjects.

Predicting individual differences in motor skill learning
155
Table 5.4 | ANOVA results for spectral power measures of healthy ageing
subjects.
Group Hemisphere Session Interactions
BB
F(1,36)=7.01,
p=0.012,
np2=0.163
F(1,36)=1.80,
p=0.188
F(2,72)=7.06,
p=0.002,
np2=0.164
n.s.
MRBD
F(1,36)=10.78,
p=0.002,
ƞp2=0.230
F(1,36)=31.81,
p<0.001,
ƞp2=0.469
F(2,72)=3.29,
p=0.043,
ƞp2=0.084
3-way:
F(2,72)=4.10,
p=0.021,
ƞp2=0.102
PMBR
F(1,36)=0.01,
p=0.939
F(1,36)=21.99,
p<0.001,
ƞp2=0.379
F(2,72)=4.17,
p=0.019,
ƞp2=0.104
n.s.
Significant effects are indicated in bold. BB: Pre-movement baseline beta;
MRBD: Movement-Related Beta Desynchronization; PMBR: Post-Movement
Beta Rebound; n.s.: not significant.
5.4.2.2 Movement-related beta power changes
Averaged beta power changes during movement (MRBD) and after movement
cessation (PMBR) in both sensorimotor cortices and topographic maps are
shown in Figure 5.7C-D. Interestingly, the magnitude of MRBD and PMBR were
differentially affected by age. Elderly subjects showed a greater beta power
decrease in both sensorimotor cortices during the movement towards the target
than their younger counterparts (Figure 5.7C) consistent with previous findings
(Heinrichs-Graham and Wilson, 2016; Rossiter et al., 2014b). In contrast, the
magnitude of the power increase after movement termination was not
significantly different between young and elderly subjects (Figure 5.7D). As
expected, a significant hemispheric difference in the magnitude of MRBD and
PMBR indicated that both beta-band dynamics were overall more pronounced in
the hemisphere contralateral to the moving hand. Also, a marginally significant
effect of ‘session’ and a significant ‘group x hemisphere x session’ interaction was

Predicting individual differences in motor skill learning
156
found for MRBD. Post hoc analyses indicated that the age-related difference in
the magnitude of MRBD was significant in both sensorimotor cortices
[contralateral sensorimotor cortex F(1,36)=12.93, p=0.001, ƞp2=0.264; ipsilateral
sensorimotor cortex: F(1,36)=8.12, p=0.007, ƞp2=0.184], but a significant linear
reduction in the magnitude of MRBD across sessions was only found in the
ipsilateral hemisphere [F(2,72)=4.26, p=0.018, ƞp2=0.106].
In addition, a decrease in the magnitude of PMBR across sessions was found,
but no interactions. Post hoc analyses showed that this decrease in PMBR across
sessions was restricted to the ipsilateral sensorimotor cortex and elderly subjects
only [F(2,36)=7.47, p=0.002, ƞp2=0.293]. Inspection of the topographical distribution
of PMBR (Figure 5.7D, right panel) confirmed a training-related change in PMBR,
with elderly subjects exhibiting a more bilateral distribution of PMBR prior to
training which shifted towards a contralateral preponderance following training.
Lastly, neither pre-movement beta power nor movement-related beta dynamics
from either contralateral or ipsilateral sensorimotor cortex were related to any
functional characteristics (i.e. grip strength, NHPT, SART), after controlling for
age (all p>0.05).
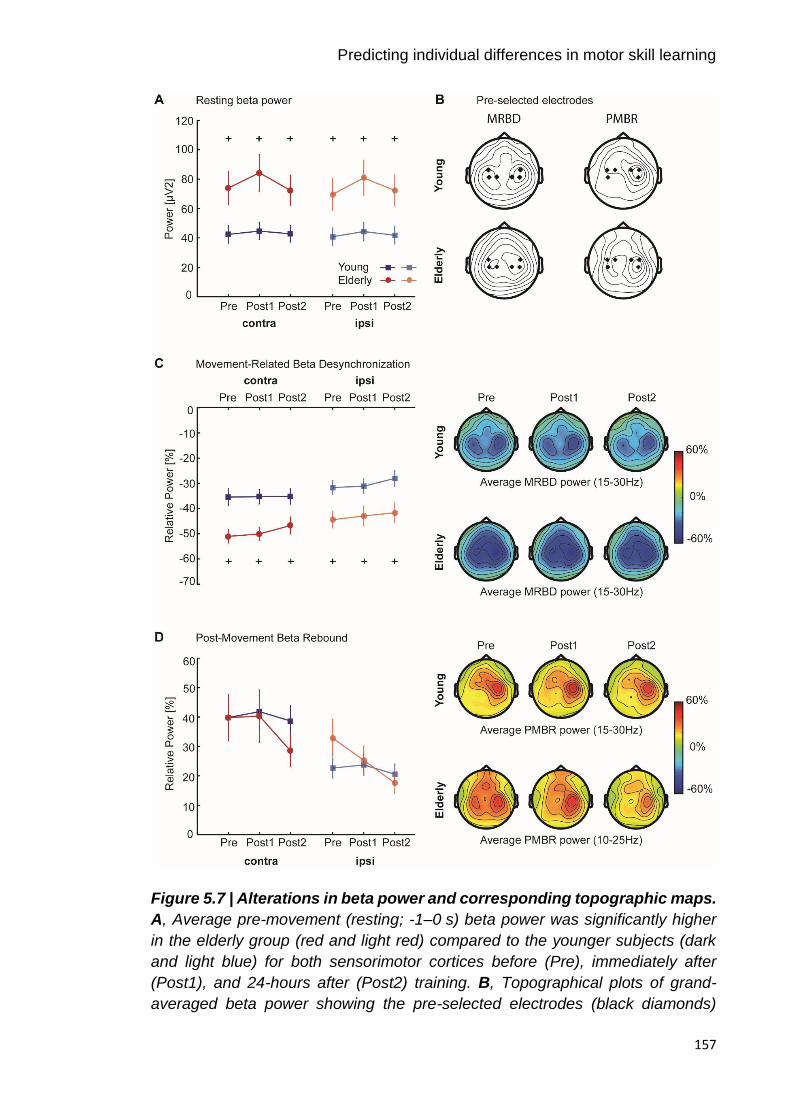
Predicting individual differences in motor skill learning
157
Figure 5.7 | Alterations in beta power and corresponding topographic maps.
A, Average pre-movement (resting; -1–0 s) beta power was significantly higher
in the elderly group (red and light red) compared to the younger subjects (dark
and light blue) for both sensorimotor cortices before (Pre), immediately after
(Post1), and 24-hours after (Post2) training. B, Topographical plots of grand-
averaged beta power showing the pre-selected electrodes (black diamonds)

Predicting individual differences in motor skill learning
158
which were pooled as contralateral and ipsilateral regions of interest. C-D, Power
in the movement (1–2s; MRBD) and post-movement time window (5.5–6.5 s/
6-7 s; PMBR) before (Pre), immediately after (Post1), and 24-hours after (Post2)
training derived from contralateral and ipsilateral sensorimotor cortices of young
(dark and light blue) and elderly (red and light red) subjects indicated a differential
effect of age upon these beta dynamics. Error bars indicate between-subject
SEM. Significant between-group differences are indicated with a ‘+’.
Topographical distributions (right panels) of movement-related beta activity show
differential contralateral and ipsilateral modulation patterns for MRBD and PMBR.
Note, that PMBR in elderly subjects showed a bilateral distribution before training
compared to the contralateral preponderance in younger subjects (D, right panel),
but this topographical distribution shifted towards a more contralateral PMBR
after the initial training.
5.4.3 Prediction of post-training tracking performance from a
combination of neurophysiological and behavioural measures
In order to gain insight into the role of beta activity in explaining motor learning
behaviour, a stepwise multiple linear regression approach within a leave-one-out
cross-validation (LOOCV) was utilized. As a first step, I assessed whether a
combination of neurophysiological (beta power measures), behavioural
(performance on the motor learning task) and functional characteristics,
accounting for multicollinearity between measures, explains individual tracking
performance at two different time points, shortly after the training (T2) and 24
hours after (T4), respectively. Performance at T2 was used as an index of fairly
permanent learning effects, while T4 provides a reflection of the maintenance of
the acquired motor skill overnight. Consequently, I next evaluated the contribution
of neurophysiological and behavioural measures alone in predicting tracking
performance.
5.4.3.1 Prediction of tracking performance at T2
Pre- and post-training beta activity (Pre, Post1), and behavioural performance at
T0 and T1, as well as functional characteristics (age, attention, motor ability,
sleep) were explored as potential predictors of tracking performance at T2 (total
number of predictors = 22) using stepwise linear regression.

Predicting individual differences in motor skill learning
159
This analysis approach revealed that 74 % of the variance in performance on the
repeated sequence was predicted by a combination of these variables [r=0.86,
p<0.001] (Figure 5.8A). By assessing which predictor variables consistently
affected tracking performance, neurophysiological and behavioural performance
measures, but none of the functional characteristics, were shown to consistently
affect performance. Specifically, initial and final performance during the training
phase (T0, T1) exerted a large effect upon performance at T2, as captured by
large positive regression coefficients [T0: t(37)=156.85, p<0.001; T1: t(37)=284.36,
p<0.001]. Despite controlling for tracking performance during the initial learning,
pre-training MRBD in ipsilateral sensorimotor cortex significantly influenced
performance at T2 [t(37)=-24.72, p<0.001] (Figure 5.8B). Since the beta power
decrease is expressed as a negative percentage value (relative to baseline), the
negative coefficient value implies that smaller magnitude of MRBD in ipsilateral
sensorimotor cortex prior to training predicts better tracking performance.
Similarly, a partial correlation analysis including performance during training as
confounding covariates, showed a significant negative correlation between
MRBD and performance at T2 [r=-0.38, p=0.021].
Further, performance on the random sequence was significantly predicted by a
combination of neurophysiological and behavioural performance measures,
however only 36 % of the variance in tracking performance could be explained
[r=0.60, p<0.001] (Figure 5.8C). Beyond behavioural performance during the
training phase [T0: t(37)=2.06, p=0.046; T1: t(37)=76.01, p<0.001], pre-training
MRBD [t(37)=-4.64, p<0.001] and post-training PMBR [t(37)=-46.94, p<0.001] from
contralateral sensorimotor cortex, respectively, consistently affected tracking
performance (Figure 5.8D). The negative coefficient values for the
neurophysiological measures imply better tracking performance with smaller
magnitude of MRBD prior to training and greater magnitude of PMBR after
training. However, partial correlation analysis with performance during training as
confounding covariates remained significant only for post-training PMBR
[r=-0.38, p=0.023].
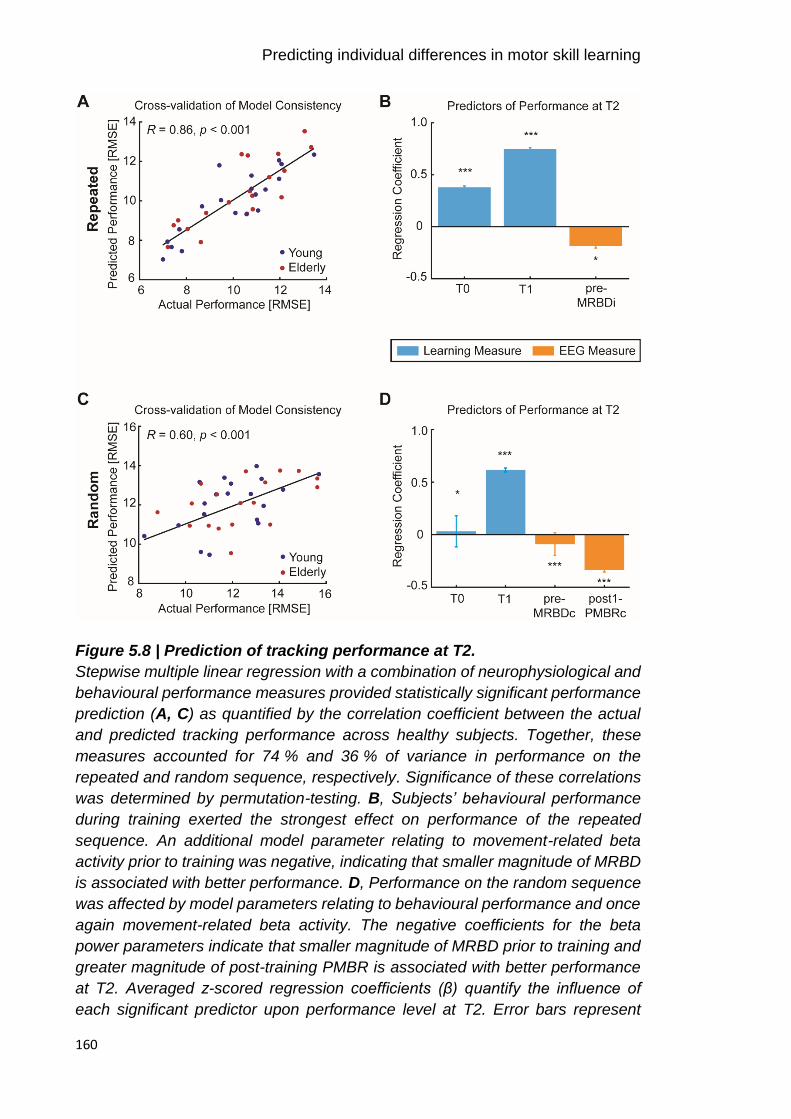
Predicting individual differences in motor skill learning
160
Figure 5.8 | Prediction of tracking performance at T2.
Stepwise multiple linear regression with a combination of neurophysiological and
behavioural performance measures provided statistically significant performance
prediction (A, C) as quantified by the correlation coefficient between the actual
and predicted tracking performance across healthy subjects. Together, these
measures accounted for 74 % and 36 % of variance in performance on the
repeated and random sequence, respectively. Significance of these correlations
was determined by permutation-testing. B, Subjects’ behavioural performance
during training exerted the strongest effect on performance of the repeated
sequence. An additional model parameter relating to movement-related beta
activity prior to training was negative, indicating that smaller magnitude of MRBD
is associated with better performance. D, Performance on the random sequence
was affected by model parameters relating to behavioural performance and once
again movement-related beta activity. The negative coefficients for the beta
power parameters indicate that smaller magnitude of MRBD prior to training and
greater magnitude of post-training PMBR is associated with better performance
at T2. Averaged z-scored regression coefficients (β) quantify the influence of
each significant predictor upon performance level at T2. Error bars represent

Predicting individual differences in motor skill learning
161
SEM. Single-sample t-tests to test for differences from zero were employed.
*p<0.05, **p<0.01, ***p<0.001.
To examine more precisely this relationship between neurophysiological and
behavioural performance measures for predicting tracking performance at T2,
regression analyses with neurophysiological or behavioural performance
measures alone, or a combination of both were performed and compared with
regard to their predictive strength (summary of comparison is provided in Table
5.5).
Neurophysiological measures alone did not explain performance on the repeated
sequence whereas behavioural performance measures alone did significantly
explain individual variation in tracking performance, echoing a strong effect of
behaviour. However, when neurophysiological measures were combined with
behavioural performance measures, the prediction accuracy significantly
improved, exceeding the information provided by behavioural performance
parameters alone [t(1,37)=37.84, p<0.001]. Similarly, while behavioural
performance measures alone also significantly explained performance on the
random sequence, neurophysiological measures alone were not of significant
predictive value. However, when combined with behavioural performance
measures, they again significantly improved the prediction accuracy compared to
a model containing behavioural performance parameters alone [t(1,37)=12.10,
p<0.001]. These results suggest that beta oscillatory measures explain some of
the individual differences in performance and improve predictions, but only when
accounting for the strong effect of behaviour.

Predicting individual differences in motor skill learning
162
Table 5.5 | Comparison of prediction accuracy for performance at T2.
Predictor variables R R2 Mean
RMSE
Sum
RMSE
Performance on repeated sequence
Neurophysiology -0.59 -0.35 0.98 37
Behaviour 0.85*** 0.72 0.52 20
Neurophysiology + Behaviour 0.86*** 0.74 0.48 18
Performance on random sequence
Neurophysiology 0.22 0.05 0.93 35
Behaviour 0.60*** 0.36 0.73 28
Neurophysiology + Behaviour 0.60*** 0.36 0.69 26
Regression models were fitted with neurophysiological (pre- and post-training
(Pre, Post1) BB, MRBD, and PMBR from both sensorimotor cortices) and
behavioural performance measures (tracking performance at T0 and T1) alone,
and a combination of both. The predictive strength is quantified by the correlation
(R) between the actual and predicted performance, based on LOOCV. Beta
oscillatory measures in combination with behavioural performance estimates best
predicted performance at T2 (blue ink). RMSE are averaged and summed across
the 38 subjects. RMSE: Root Mean Square Error. *p<0.05, **p<0.01, ***p<0.001.
5.4.3.2 Prediction of tracking performance at T4
Pre- and post-training beta activity (Pre, Post1, Post2), and behavioural
performance at training (T0, T1) and retest1 (T2, T3) sessions as well as
functional characteristics (age, attention, motor ability, sleep) were explored as
potential predictors of tracking performance at T4 (total number of
predictors = 29).
Separate regression models, using these potential predictor variables,
significantly predicted performance 24 hours after the initial training for both the
repeated and random sequence, with models accounting for 36 % and 64 % of
variance, respectively [repeated sequence: r=60, p<0.001, Figure 5.9A; random
sequence: r=0.80, p<0.001, Figure 5.9C]. Assessing the relevance of individual
variables for tracking performance revealed that behavioural performance, but
not neurophysiological measures exerted an effect upon performance at T4.
Specifically, tracking performance during the retest1 session related to

Predicting individual differences in motor skill learning
163
performance on both repeated [T2: t(37)=2.24, p=0.031; T3: t(37)=22.60, p<0.001]
and random [T2: t(37)=78.17, p<0.001] sequence, while initial performance was a
significant parameter only for the performance of the random sequence [T0:
t(37)=81.09, p<0.001] (Figure 5.9B, D). Interestingly, sleep quantity the night prior
to the retest2 session was of relevance in explaining tracking performance
24 hours after training, with more sleep relating to better performance [repeated
sequence: t(37)=-3.36, p=0.002; random sequence: t(37)=-34.46, p<0.001].
Figure 5.9 | Prediction of tracking performance at T4.
Stepwise multiple linear regression with a combination of behavioural
performance and functional characteristics provided statistically significant
performance prediction (A, C) as quantified by the correlation coefficient between
the actual and predicted tracking performance across healthy subjects. Together
these measures accounted for 36 % and 64 % of variance in performance on the
repeated and random sequence, respectively. Significance of these correlations
was determined by permutation-testing. B, Subjects’ behavioural performance

Predicting individual differences in motor skill learning
164
during retest1 exerted the strongest effect on performance of the repeated
sequence. An additional model parameter relating to sleep quantity the night
before was negative, indicating that longer sleep duration is associated with
better performance. D, Performance on the random sequence was affected by
model parameters relating to behavioural performance at the beginning of
training and retest1 session, respectively. Again, sleep duration was a predictive
variable. Averaged z-scored regression coefficients (β) quantify the influence of
each significant predictor upon performance level at T4. Error bars represent
SEM. Single-sample t-tests to test for differences from zero were employed.
*p<0.05, **p<0.01, ***p<0.001.
In line, comparison of the contribution of neurophysiological and behavioural
performance measures echoed the result that beta oscillatory measures did not
have any independent explanatory value (summary of comparison is provided in
Table 5.6). However, while sleep quantity alone did not significantly explain
tracking performance, it significantly improved the predictive strength compared
to models with behavioural performance measures only [repeated sequence:
t(1,37)=3.18, p=0.003; random sequence: t(1,37)=25.78, p<0.001].
Table 5.6 | Comparison of prediction accuracy for performance at T4.
Predictor variables R R2 Mean
RMSE
Sum
RMSE
Performance on repeated sequence
Neurophysiology -0.30 -0.09 0.97 37
Behaviour 0.62*** 0.38 0.69 26
Neurophysiology + Behaviour 0.62*** 0.36 0.69 26
Behaviour + Functional characteristics
(Sleep)
0.60*** 0.36 0.68 25
Performance on random sequence
Neurophysiology -0.07 -0.01 1.0 108
Behaviour 0.76*** 0.58 0.58 73
Neurophysiology+Behaviour 0.71*** 0.50 0.58 73
Behaviour + Functional characteristics
(Sleep)
0.80*** 0.66 0.51 67

Predicting individual differences in motor skill learning
165
Regression models were fitted with neurophysiological (pre- and post-training
(Pre, Post1, Post2) BB, MRBD, and PMBR from both sensorimotor cortices)
and behavioural performance measures (tracking performance at T0, T1, T2
and T3) alone, and a combination of both. The predictive strength is quantified
by the correlation (R) between the actual and predicted performance, based on
LOOCV. A combination of behavioural performance measures and sleep
quantity best predicted performance at T4 (blue ink). RMSE values are
averaged and summed across the 38 subjects. RMSE: Root Mean Square
Error. *p<0.05, **p<0.01, ***p<0.001.
5.5 Discussion
By employing a continuous tracking task assaying individuals’ motor learning
capacity and acquiring standard measures of EEG-derived beta power, the
present work reported several key findings:
1. Firstly, young and elderly subjects showed comparable ability to learn and
retain a motor skill with short-term training.
2. Secondly, resting beta power and MRBD were altered with ageing, but no
age-related modulations in the magnitude of PMBR were observed.
3. Finally, by implementing a multivariate approach that accounted for
multicollinearity of the various measures, it was possible to explore the
complex relationship between cortical beta activity and the degree to which
healthy ageing individuals learn and retain new motor skills. Specifically, prior
behaviour played a strong role in predicting future tracking performance, but
here I have been able to show a significant contribution of beta oscillatory
activity to the prediction of motor learning.
5.5.1 Training induces performance improvements independent of age
Preserved ability to develop new motor skills with practice over time is crucial for
functional independence and quality of life with advancing age. Ageing is
associated with changes in the central and peripheral nervous system that can
limit its sensorimotor functioning (for review see (Ketcham and Stelmach, 2001;
Lustig et al., 2009; Seidler et al., 2010)), potentially causing motor learning
deficits. Although advanced age has been argued to reduce the ability to acquire
a new motor skill (Boyd et al., 2008; Ehsani et al., 2015; Harrington and Haaland,
1992; Howard and Howard, 1997; McNay and Willingham, 1998; Shea et al.,

Predicting individual differences in motor skill learning
166
2006) dependent on the nature of the task (Seidler, 2006; Voelcker-Rehage,
2008), or alternatively exert a detrimental effect on motor memory consolidation
(Brown et al., 2009; Howard and Howard, 1989; Spencer et al., 2007; Wilson et
al., 2012) , there is no consensus over the capability of the ageing brain for motor
learning.
The present study employed a laboratory-based motor task to conduct a finely
controlled assessment of the ability to learn in healthy ageing adults. By matching
baseline performance, it was possible to directly compare the amount learned by
young versus elderly subjects. Although young and elderly individuals in the
current study demonstrated differences in motor function, cognition and sleep,
short-term motor learning for both sequence-specific (repeated sequence) and
general (random sequence) motor skills as well as their changes after training
ended (offline) were comparable between both age groups. This lack of age-
related deficits in motor learning may be attributed to the task requirements of
wrist movements as opposed to fine finger movements (Voelcker-Rehage, 2008).
Alternatively, older adults might exhibit compensatory strategies in order to
support comparable task performance (e.g. (Boudrias et al., 2012; Mattay et al.,
2002; Reuter-Lorenz et al., 2000, 1999; Stern, 2009; Ward et al., 2008; Wu and
Hallett, 2005)). As such, recruitment of additional brain regions, beyond those
used in younger adults might explain similar performance levels between age
groups found in this study. Although, brain activity was not measured during the
performance of the motor learning task, more widespread activation as well as
bilateral activation of sensorimotor areas in elderly adults was noticeable during
the performance of the simple motor task, echoing compensatory mechanisms in
the ageing brain.
After training ended, tracking performance improved without further training
(offline) on the same day for both the sequence-specific and general motor skill.
This “early boost” in performance (Albouy et al., 2006; Hotermans et al., 2008,
2006) may simply be attributable to the dissipation of temporary effects such as
boredom and fatigue that build up over the course of initial training (Brawn et al.,
2010; Rickard et al., 2008) and which were the reasons for focusing on T2 as a
measure of fairly permanent early learning (as opposed to T1). Although, the
experimental design attempted to minimize the accumulation of fatigue during
Predicting individual differences in motor skill learning
167
training by providing subjects with ample rest between blocks, closer inspection
of tracking performance in Figure 5.5A still suggests a small decline in
performance towards the end of the training phase. Alternatively, previous
studies suggested that the “early boost” of performance represents an
active/labile state of motor memory with functional relevance for long-term motor
memory consolidation (Albouy et al., 2006; Hotermans et al., 2008, 2006;
Muellbacher et al., 2002; Nettersheim et al., 2015; Schmitz et al., 2009).
Differential changes in tracking performance on the two types of sequences were
observed 24 hours after initial training. Specifically, while training-related
improvements in general motor skill were retained, overnight forgetting occured
for the sequence-specific motor skill, related to the explicit memory of the
sequence structure. As discussed in detail in Chapter 1 section 1.1.1.3, sleep
plays a fundamental role in learning and memory consolidation. Although, the
process of sleep-dependent consolidation appears to be reduced with ageing
(Brown et al., 2009; Spencer et al., 2007; Wilson et al., 2012), most likely due to
age-related changes in sleep patterns (Ohayon et al., 2004), no significant
difference in performance levels following a night’s sleep was evident between
young and elderly subjects in the current study, despite older adults reporting
reduced sleep quantity. In addition, changes in performance overnight did not
correlate with sleep measures alone. Nevertheless, a potential influence of sleep
cannot entirely be ruled out as perhaps sleep parameters others than the here
used self-reported measures might drive sleep-dependent processes mediating
motor sequence consolidation (e.g. EEG-measured sleep spindles, (Barakat et
al., 2013; Fogel et al., 2017).
5.5.2 Beta oscillations are altered with ageing and motor learning
Although short-term motor learning was comparable between young and elderly
individuals on the continuous tracking task, pre-movement (resting) beta power
and levels of MRBD were significantly increased in the elderly, consistent with
prior literature (Gaetz et al., 2010; Heinrichs-Graham and Wilson, 2016; Rossiter
et al., 2014b). At a mechanistic level, a wealth of animal and human literature
suggests that oscillatory activity in the beta-band reflects underlying inhibitory
GABAergic activity (Hall et al., 2011, 2010a; Jensen et al., 2005;

Predicting individual differences in motor skill learning
168
Muthukumaraswamy et al., 2013; Roopun et al., 2006; Yamawaki et al., 2008).
For example, increased baseline beta power (Hall et al., 2010a; Jensen et al.,
2005; Muthukumaraswamy et al., 2013), enhanced MRBD (Hall et al., 2011;
Muthukumaraswamy et al., 2013), enhanced PMBR (Gaetz et al., 2011), and
reduced beta frequency (Jensen et al., 2005) have been demonstrated with
pharmacologically increased levels of GABAergic inhibition. In this respect, the
age-related changes in beta power at rest and during movement observed in the
current study might reflect increased GABAergic inhibition in both contralateral
and ipsilateral sensorimotor cortex in older subjects.
Age-related changes in cortical excitation and inhibition have been evidenced in
a number of TMS studies, however no consensus with regard to the direction of
alterations in GABAergic inhibition exists (Heise et al., 2013; Kossev et al., 2002;
Marneweck et al., 2011; McGinley et al., 2010; Peinemann et al., 2001; Smith et
al., 2009), most likely due to methodological differences with regard to stimulus
parameters, target muscle and age group selection. Notwithstanding, altered
inhibitory activity might underlie the age-dependent reduction in cortical plasticity
observed in studies assessing TMS-induced (Fathi et al., 2010; Muller-Dahlhaus
et al., 2008; Tecchio et al., 2008; Todd et al., 2010) and practice-dependent
plasticity (Rogasch et al., 2009; Sawaki et al., 2003). These findings together with
the age-related increase in beta power suggest that both performance on the
simple motor task and the continuous tracking task should be disrupted, but this
does not seem to be the case. It might be that decreased plasticity does not
necessarily equate to poor tracking performance or learning (i.e. floor and ceiling
effects) and that beta oscillations, as candidate biomarkers of the potential for
plasticity, are not necessarily linearly related to learning.
Another possible explanation for the observed increase in beta power with age
might be neuroanatomical changes associated with typical ageing. While factors
such as skull thickness, conductivity of the electrical tissues, grey matter volume
and pyramidal cell density can be altered with ageing and affect sensor-derived
measures of neuronal oscillations (Fjell et al., 2014; Hamalainen et al., 1993;
McGinnis et al., 2011; Terribilli et al., 2011; Wendel et al., 2010), they are also
expected to influence EEG estimates in equal measures and therefore, do not
explain the differential effect of age on movement-related beta dynamics

Predicting individual differences in motor skill learning
169
observed in the current study (i.e. age-related modulation was observed only for
MRBD, but not PMBR). As such, changes in spectral power measures most likely
reflect underlying changes in the functional properties of neuronal circuits
generating beta oscillations.
Despite previous findings pointing to an increase in the magnitude of PMBR as a
function of age in healthy developing individuals (Gaetz et al., 2010) and an
absence in elderly subjects in a go/no-go tasks (Schmiedt-Fehr et al., 2016), no
significant differences in the magnitude of PMBR between young and elderly
adults were found in the present work. In line with findings of lower beta peak
frequency with ageing (Rossiter et al., 2014b), peak changes in PMBR were
observed at lower frequencies and ~500 ms later compared to the younger
subjects, a finding independent of behavioural differences between age groups
(i.e. movement time or peak velocity). It is therefore unlikely that the lack of age-
related changes in the magnitude of PMBR and the later occurrence of PMBR in
older individuals are artefacts of movement variability or temporal overlap of
neuronal activity (see Chapter 3 section 3.2.3 for details about inter-trial interval
selection) or suboptimal time-frequency window selection (see section 5.3.4.2),
but rather might reflect maturational differences in the cortical networks
generating these distinct beta dynamics and their link to different types of
GABAergic inhibition (phasic vs tonic) (Hall et al., 2011; Muthukumaraswamy et
al., 2013). The differential effect of age on MRBD and PMBR together with their
well described differential modulation in contra- and ipsilateral hemispheres (Van
Wijk et al., 2012) support the notion that these beta-band dynamics are, at least
to a certain degree, independent processes with distinct functional significance.
Interestingly, elderly subjects demonstrated a more bilateral topographic
distribution of PMBR, echoing the idea of greater involvement of the ipsilateral
hemisphere in motor control with advanced age (e.g. (Boudrias et al., 2012;
Mattay et al., 2002; Reuter-Lorenz et al., 2000, 1999; Stern, 2009; Ward et al.,
2008)). However, this observation was not statistically significant and additional
analysis of PMBR ratio (contralateral PMBR divided by ipsilateral PMBR) did also
not reveal a significant temporal evolution of PMBR with training in elderly
subjects [F(2,36)=2.18, p=0.128].
Predicting individual differences in motor skill learning
170
Few studies have reported changes in beta oscillations in the context of motor
learning. These studies demonstrated changes in movement-related beta
dynamics such as increased MRBD and PMBR with training and argued that
these changes in movement-related beta dynamics reflect early plastic changes
in sensorimotor cortex associated with motor learning (Boonstra et al., 2007;
Houweling et al., 2008; Mary et al., 2015; Moisello et al., 2015; Nelson et al.,
2017; Pollok et al., 2014) as discussed in Chapter 1 section 1.2. Unexpectedly,
and possibly due to methodological differences such as type of motor learning
task, task complexity and study design, movement-related beta activity in the
current study was not enhanced following motor training. Corroborating previous
findings of training-related changes in beta power at rest (Moisello et al., 2015;
Nelson et al., 2017), pre-movement (resting) beta power was significantly
enhanced after training. This training-related modulation of beta power might be
related to a reduction in cortical excitability due to the saturation of LTP-like
plasticity (temporary occlusion) with motor learning (Cantarero et al., 2013;
Rioult-Pedotti et al., 2007, 2000, 1998; Rosenkranz et al., 2007; Stefan et al.,
2006; Ziemann et al., 2004). Consistent with the concept of temporary
suppression of cortical plasticity by neuronal mechanisms involved in motor
learning, the observed increase in beta power was transient as it returned to
original pre-training levels after a night’s sleep. Further supporting evidence for
this interpretation comes from studies demonstrating an association between
increased beta power and GABAergic inhibitory processes (Hall et al., 2011,
2010a; Jensen et al., 2005; Muthukumaraswamy et al., 2013; Roopun et al.,
2006; Yamawaki et al., 2008) as well as decreased cortical excitability (McAllister
et al., 2013; Noh et al., 2012)
Alternatively, since alterations in beta power have also been observed with motor
fatigue (Fry et al., 2017; Shigihara et al., 2013; Tecchio et al., 2006), the transient
increase in beta power might be related to training-induced fatigue effects. A
potential influence of fatigue cannot be ruled out and it would be interesting in the
future to explore the relationship between beta oscillations and fatigue, and their
respective influences on motor learning.

Predicting individual differences in motor skill learning
171
5.5.3 Beta oscillations are predictive of motor learning effects
As discussed above, changes in the properties of beta oscillations, predominantly
in contralateral sensorimotor areas, have been observed with motor learning. For
instance, the change in the magnitude of MRBD has been linked to superior
motor learning and is thought to reflect reorganization of neural activity during
motor skill acquisition (Boonstra et al., 2007; Houweling et al., 2008; Pollok et al.,
2014). This is further supported by studies reporting altered training-related
changes with ageing (Mary et al., 2015) and in pathology (Moisello et al., 2015;
Nelson et al., 2017), suggesting abnormal plasticity processes. However, the
functional role of these training-related changes in beta activity has yet to be
elucidated. Given that, in my data, motor learning appears to occur without
training-related changes in beta activity, cortical beta activity may be only one of
several mechanisms important for motor learning.
In the current study, a multivariate approach combining neurophysiological and
behavioural measures was employed in order to explore the complex relationship
between beta oscillatory activity and motor skill learning, providing greater insight
into the predictive role of beta oscillations. Implementing a regression approach
with leave-one-out cross-validation (LOOCV) accounted for co-varying
neurophysiological (Heinrichs-Graham and Wilson, 2016) and performance
measures (see section 5.4.1.4), while reducing model overfitting and assessing
the generalizability of results to predict new data. My findings highlight that
estimates of movement-related beta activity provide a significant contribution to
predicting individual differences in tracking performance, but only after
accounting for the predictive effect of prior behaviour. Specifically, while
measures of beta dynamics alone did not explain tracking performance, the linear
combination of these measures together with measures of behavioural
performance accounted for 74 % and 36 % of the total variance in early post-
training sequence-specific and general tracking performance, respectively, and
significantly exceeded the information provided by performance measures alone.
This emphasizes that even though behavioural measures were the strongest
predictors of motor learning, including EEG-derived beta oscillations, which
provide greater insight into cortical processes underlying the potential for
Predicting individual differences in motor skill learning
172
plasticity, helps to explain individual differences in a way that behaviour alone
cannot.
Within models, pre-training level of movement-related beta activity was a
significant predictor, such that subjects who exhibited smaller MRBD prior to
training performed better on the task. Consistent with insight gleaned from animal
and pharmacological studies linking properties of beta oscillations to GABAergic
inhibition (Hall et al., 2011, 2010a; Jensen et al., 2005; Muthukumaraswamy et
al., 2013; Roopun et al., 2006; Yamawaki et al., 2008), smaller pre-training
MRBD, reflecting lower GABAergic inhibition, may facilitate motor learning
induced LTP-like plasticity and result in better post-training tracking performance.
However, rather unexpectedly, in the model predicting sequence-specific tracking
performance, MRBD in the ipsilateral rather than contralateral sensorimotor
cortex was related to early motor learning. Ipsilateral suppression of beta
oscillatory activity during unimanual movement is a well established phenomenon
(Gross et al., 2005; Pfurtscheller et al., 1996; Salmelin and Hari, 1994), but its
functional role is not fully understood. It has been proposed that ipsilateral MRBD
does not merely reflect interhemispheric ‘cross-talk’ between motor cortices that
facilitates movements, but may be a consequence of neural processes inhibiting
mirror movements through interhemispheric inhibition (Jurkiewicz et al., 2006;
Van Wijk et al., 2012). Since EMG was not recorded from both hands, it cannot
be verified whether reduced ipsilateral MRBD is associated with mirror
movements, even though subjects were instructed to relax their non-moving UL
and were monitored by the experimenter throughout EEG recordings.
Interestingly, post-training level of PMBR was identified as a significant predictor
of general motor learning only, implying that the two types of learning might, at
least to a certain degree, relate to independent neural networks with distinct
functional significance for motor learning. In line with previous motor learning
studies (Boonstra et al., 2007; Houweling et al., 2008; Mary et al., 2015; Pollok
et al., 2014), greater post-training PMBR might reflect neural processes that
facilitate practice-dependent sensorimotor reorganization after training. While
beta activity, and by inference PMBR, has been suggested to promote the status
quo of motor states (Engel and Fries, 2010; Gilbertson et al., 2005b) and has
been associated with the processing of sensory afference (Alegre et al., 2002;

Predicting individual differences in motor skill learning
173
Cassim et al., 2001), Tan and colleagues have recently proposed a unifying
theory in which PMBR is modulated by the history of task-relevant errors and is
related to the uncertainty associated with feedforward predictions (Tan et al.,
2016b, 2014). An alternative explanation might thus be that greater post-training
PMBR, reflecting better accuracy (or less error) during the previous training,
might then preserve motor commands or forward models that require little
updating. However, the current work was not designed to study the role of beta-
band dynamics for error monitoring, and thus, this interpretation is purely
speculative.
Despite beta activity being linked to post-training tracking performance on the
same day, tracking performance 24 hours after training was not predicted by beta
oscillatory measures, but rather behavioural performance. Interestingly, longer
sleep duration appeared beneficial for retention of tracking performance on both
the repeated and random sequence, most likely due sleep-dependent motor
memory consolidation (Al-Sharman and Siengsukon, 2014; Diekelmann and
Born, 2010; Fischer et al., 2002; Nettersheim et al., 2015; Walker, 2005; Walker
et al., 2002). The unique contribution of sleep for tracking performance retention
should be taken into account in order to maximise motor learning in healthy adults
and, in the context of stroke-related brain damage, may have consequences for
movement rehabilitation, which depends on motor learning and consolidation.
Together, these findings highlight the importance of multivariate approaches for
identifying key factors that contribute to the prediction of motor learning.
Specifically, the link between movement-related beta dynamics and early phase
motor learning suggests that these neurophysiological measures might, at least
partly, explain individual performance differences in a way that behaviour alone
cannot. It is important to note that the effect of beta oscillations was only revealed
after accounting for behavioural effects, and that measures of beta-band activity
were not predictive by themselves. However, given a complex and dynamic
system, it might not be surprising that cortical oscillations may be only one of
several factors important for motor learning. Clearly, multivariate approaches
provide the best opportunity to detect these influences and interactions, in the
same model. While motor sequence learning has been shown to elicit widespread
activity changes in the cortical-striatal network (Dayan and Cohen, 2011; Doyon

Predicting individual differences in motor skill learning
174
et al., 2003), the current study focused on beta oscillatory activity as candidate
biomarkers of the potential for plasticity in sensorimotor cortex. This was not
meant to imply that practice-dependent plasticity was confined to sensorimotor
cortex, but rather was based on previous work demonstrating the crucial role of
sensorimotor cortex for motor learning and early consolidation (Muellbacher et
al., 2002; Nudo et al., 1996a; Plautz et al., 2000; Robertson et al., 2005). Clearly,
further work is required to understand the complex relationship between neuronal
activity and motor learning, but my results demonstrate a unique contribution of
the pre-training state of cortical beta oscillations for post-training tracking
performance, and an important role of sleep for long-term retention of acquired
motor skills. Both findings have important implications for therapeutic
interventions in patient populations.
5.5.4 Conclusion
In conclusion, the current results show that the state of the brain’s sensorimotor
cortex as captured by beta oscillatory activity prior to training provides a unique
contribution to the prediction of individual differences in early post-training
tracking performance. It demonstrates the potential of neurophysiological
measures to enhance prediction accuracy and implies that accessible
measurements of beta activity, as markers of net inhibitory and excitatory
mechanisms in humans, reflect meaningful individual differences in the motor
system that can be utilized in basic research and clinical studies.
Predicting individual differences in motor learning after stroke
175
Predicting individual differences in motor
learning after stroke
6.1 Abstract
Stroke is the leading neurological cause of physical disability in the world today.
Recovery of skilled movement after stroke is reliant on physical training to
‘relearn’ lost motor skills, but stroke patients show considerable heterogeneity in
recovery potential. The factors that lead to inter-individual differences in the
recovery process itself are not clear, but their identification would allow accurate
prediction of motor recovery and provide novel and important targets for
promoting post-stroke rehabilitative outcomes. Since the experiment in Chapter
4 revealed that estimates of movement-related beta activity explain some of the
individual differences observed in the ability to learn in healthy adults, I here
extend this line of research to investigate the relationship between cortical beta
oscillations and motor learning after stroke.
Eighteen stroke survivors (50–74 years; 90±50 months post-stroke) were trained
on the continuous tracking task introduced in Chapter 3 and subsequently
retested after initial training (45–60 min and 24 hours later). Scalp EEG was
recorded during the performance of the simple motor task before each training
and retention session. To compare patients’ capacity for motor learning and
assess stroke-related changes in beta activity, age-matched healthy controls
were selected from the study in Chapter 5.
Despite preserved motor learning capacity, the level of performance change
achieved by stroke patients was significantly smaller compared to healthy
controls. However, patients did not show altered resting nor movement-related
beta activity. Multivariate modelling within leave-one-out cross-validation
(LOOCV) revealed that stroke patients’ behaviour combined with movement-
related beta dynamics on the day of training best predicted their performance
levels 24 hours after training, independent of motor impairment, age and lesion
side. Thus, while cortical beta oscillations may offer novel targets for therapeutic
interventions, combining behavioural measures with neuroimaging has the
potential to increase prediction accuracy and might provide the basis for
stratification in restorative trials.
Predicting individual differences in motor learning after stroke
176
6.2 Introduction
Globally, the impact of stroke-related impairment remains high, with persistent
upper limb deficits being a common post-stroke outcome reducing quality of life
(Feigin et al., 2014; Raghavan, 2015). Post-stroke rehabilitation is fundamentally
a process of learning new or relearning lost motor skills through repetitive training.
However, stroke survivors show considerable inter-individual differences in
recovery potential, making predictions about treatment response challenging (Di
Pino et al., 2014; Stinear, 2010). The reasons for this clinical phenomenon are
unclear, but understanding the underlying neurophysiological processes would
provide novel and important targets for improving post-stroke upper limb
recovery.
As discussed in Chapter 1 section 1.3.3, evidence from animal models and
humans suggest that training during the time-limited window of spontaneous
biological recovery that occurs early after stroke may have a synergistic effect
(Biernaskie et al., 2004; Krakauer et al., 2012; Zeiler and Krakauer, 2013), with
heightened effects of training on recovery compared to training in the chronic
phase (Hardwick et al., 2017). Crucially, these time-dependent modulations in the
potential for plasticity are, at least partly, due to alterations in cortical inhibitory
and excitatory mechanisms (Carmichael, 2012; Cramer, 2008; Murphy and
Corbett, 2009; Zeiler et al., 2013). Early stroke-induced hyperexcitability triggered
by reduced GABAergic inhibition and increased glutamatergic excitation (Que et
al., 1999) facilitates long-term potentiation (LTP) (Hagemann et al., 1998),
downstream changes in neuronal structure (Chen et al., 2011), and remapping of
sensorimotor functions to intact cortical areas (Takatsuru et al., 2009). Further,
the idea that GABAergic inhibitory mechanisms are involved in stroke recovery is
supported by studies in humans using pharmacological manipulation (Chollet et
al., 2011; Hall et al., 2010b) or neuroimaging techniques such as transcranial
magnetic stimulation (Swayne et al., 2008), magnetic resonance spectroscopy
(Blicher et al., 2015) and positron emission tomography (Kim et al., 2014).
Consequently, understanding how to take advantage of post-stroke alterations in
cortical inhibition and excitation to promote recovery is an important clinical and
scientific goal.

Predicting individual differences in motor learning after stroke
177
Bridging the gap between cellular and behavioural accounts of post-stroke
recovery, requires an appropriate biomarker reflecting underlying biological
processes that predict recovery and treatment response in a way that behaviour
alone cannot (Aronson and Ferner, 2017; Ward, 2017). Since neuronal
oscillations at beta frequency, measured non-invasively with EEG and MEG, are
fundamental for motor control control (Engel and Fries, 2010; van Wijk et al.
2012) and have recently been linked to GABAergic activity (Hall et al., 2011,
2010a; Jensen et al., 2005; Muthukumaraswamy et al., 2013), properties of beta
activity may provide insight into the dynamics of disease, potentially providing a
clinically relevant biomarker of net inhibitory and excitatory mechanisms in human
cortex. Recent evidence suggests that sensorimotor cortex beta power is altered
after stroke, with beta activity closely tied to the degree of motor impairment (Hall
et al., 2010b; Laaksonen et al., 2012; Rossiter et al., 2014a; Shiner et al., 2015;
Thibaut et al., 2017). Although relevant for motor control and sensorimotor
pathology, and allegedly instrumental to motor learning (Boonstra et al., 2007;
Houweling et al., 2008; Pollok et al., 2014), little is known about the relationship
between beta oscillations and motor learning after stroke.
Thus, the current study aimed to (I) explore the neurophysiological mechanisms
associated with individual differences in motor learning after stroke. In order to
ensure that patients could perform the continuous tracking task and that the
performance of the wrist movement was not prevented by their motor
impairments, here well-recovered patients who were at least 6 months post-
stroke, commonly referred to as the chronic phase, were tested. Since
behavioural and functional/clinical measures only incompletely characterize inter-
individual differences in response to treatment and motor recovery (see Chapter
1 section 1.3.2), and following on from the findings in Chapter 5, I hypothesized
that post-stroke measurements of beta oscillatory activity, reflecting alterations in
cortical excitatory and inhibitory signalling, might provide additional insight into
individual differences in the response to motor learning after stroke.
Despite abnormal patterns of brain activity that occur after stroke (Chollet et al.,
1991; Johansen-Berg, 2002; Marshall et al., 2000; Ward et al., 2003a; Weiller et
al., 1993), the few studies that examined stroke patients’ capacity for motor
learning suggest that they retain the ability to learn ((Krakauer, 2006), also see

Predicting individual differences in motor learning after stroke
178
Chapter 1 section 1.3.5 for more details), even at the chronic stage. Given
evidence that the contralesional hemisphere is not “unaffected” after stroke, and
its functional role for motor recovery is yet to be fully elucidated (Graziadio et al.,
2012; Johansen-Berg et al., 2002; Murase et al., 2004; Riecker et al., 2010; Ward
and Cohen, 2004; Werhahn et al., 2003), measures of beta oscillatory activity
from both contralesional (unaffected) and ipsilesional (affected) sensorimotor
cortex were explored. Since only few studies have explored motor learning after
stroke, secondary objectives were to investigate (II) whether stroke patients
demonstrate comparable learning as age-matched healthy adults, and (III)
explore whether abnormal movement-related beta oscillations as reported in
previous studies (Rossiter et al., 2014a; Shiner et al., 2015) persist in patients
with low level of impairment (well-recovered).
6.3 Methods
6.3.1 Subjects
Eighteen stroke patients with a first-time ischaemic lesion took part in the present
study over two consecutive days. Two patients had to be excluded because of
technical problems during data acquisition (patient 13, patient 18). Thus, sixteen
stroke patients (mean age = 64±8 years, range 50–74 years, 1 ambidextrous, for
more details see Table 6.1) were included for analyses (N=16).
All patients were in the chronic stage, having suffered a stroke more than 6
months ago (time since stroke 90±50 months, range 42–220 months).
Specifically, the time since stroke was distributed as follows: one patient greater
than 180 months (15 years), four patients between 120–180 months (10–15
years), five patients between 60–120 months (5–10 years), and six patients
between 36–60 months (3–5 years).
All patients had normal or corrected-to-normal vision, and fulfilled the following
inclusion criteria: (a) no reported history of other neurological or psychiatric
disease; (b) no language or cognitive deficits sufficient to impair cooperation in
the experiment; (c) no use of drugs affecting the central nervous system or self-
reported abuse of any drugs (e.g. analgesics, anticonvulsants, muscle relaxants,
sedatives, hypnotics); and (d) active range of motion around the affected wrist
Predicting individual differences in motor learning after stroke
179
greater than 60° in total. To minimize circadian fluctuations in beta oscillatory
levels (Toth et al., 2007; Wilson et al., 2014), all patients were tested in the time
between 9am and 2pm after giving written informed consent. In addition, patients
were instructed to abstain from alcohol and caffeine the evening and morning
before the testing.
At the beginning of the experiment, stroke patients underwent a battery of
functional assessments to quantify upper limb (UL) motor ability, including ARAT
(Yozbatiran et al., 2008), NHPT (Kellor et al., 1971; Mathiowetz et al., 1985b),
and grip strength test. Since sensory loss is common after stroke (Tyson et al.,
2008), patients’ sensation was tested using the FM sensation and proprioception
assessment. Performance on the SART (Sustained Attention To Response Test)
(Robertson et al., 1997) was used as a proxy of cognitive functioning. In addition,
patients provided information about their level of fatigue (computerised version of
FSS-7 and NFI (Johansson et al., 2014; Krupp et al., 1989; Mills et al., 2012))
and their sleep (computerised version of St. Mary’s Hospital sleep questionnaire
(Ellis et al., 1981)) on the nights preceding testing. Please refer to Chapter 3
section 3.3 for details about various tests.
In order to evaluate how motor learning, beta oscillatory activity and their
relationship are altered after stroke, twenty age-matched healthy controls (mean
age = 68±5 years, range 53–77 years) were selected from the elderly subject
group in the study presented in Chapter 5. Please note that in order to select an
age-matched healthy control group, one subject that previously did not match the
inclusion and exclusion criteria due to the age specification of that study (age
range 60–80 years), was now included.
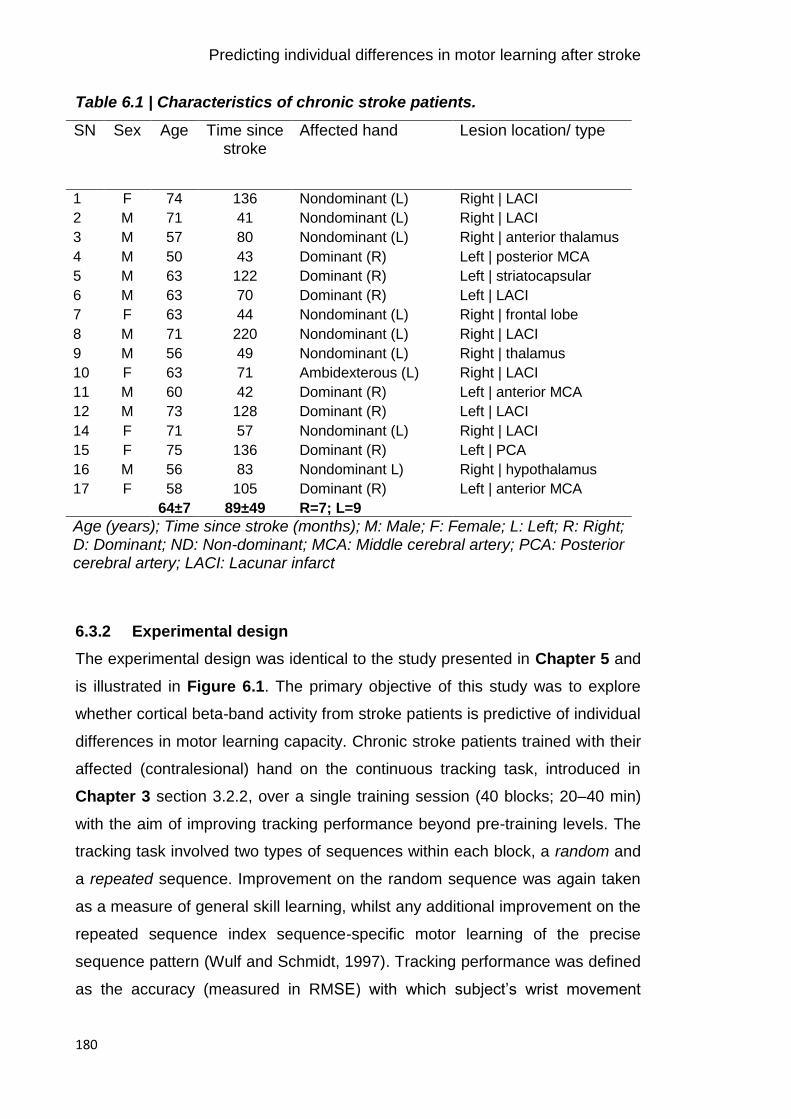
Predicting individual differences in motor learning after stroke
180
Table 6.1 | Characteristics of chronic stroke patients.
SN Sex Age Time since stroke
Affected hand Lesion location/ type
1 F 74 136 Nondominant (L) Right | LACI
2 M 71 41 Nondominant (L) Right | LACI
3 M 57 80 Nondominant (L) Right | anterior thalamus
4 M 50 43 Dominant (R) Left | posterior MCA
5 M 63 122 Dominant (R) Left | striatocapsular
6 M 63 70 Dominant (R) Left | LACI
7 F 63 44 Nondominant (L) Right | frontal lobe
8 M 71 220 Nondominant (L) Right | LACI
9 M 56 49 Nondominant (L) Right | thalamus
10 F 63 71 Ambidexterous (L) Right | LACI
11 M 60 42 Dominant (R) Left | anterior MCA
12 M 73 128 Dominant (R) Left | LACI
14 F 71 57 Nondominant (L) Right | LACI
15 F 75 136 Dominant (R) Left | PCA
16 M 56 83 Nondominant L) Right | hypothalamus
17 F 58 105 Dominant (R) Left | anterior MCA
64±7 89±49 R=7; L=9
Age (years); Time since stroke (months); M: Male; F: Female; L: Left; R: Right; D: Dominant; ND: Non-dominant; MCA: Middle cerebral artery; PCA: Posterior cerebral artery; LACI: Lacunar infarct
6.3.2 Experimental design
The experimental design was identical to the study presented in Chapter 5 and
is illustrated in Figure 6.1. The primary objective of this study was to explore
whether cortical beta-band activity from stroke patients is predictive of individual
differences in motor learning capacity. Chronic stroke patients trained with their
affected (contralesional) hand on the continuous tracking task, introduced in
Chapter 3 section 3.2.2, over a single training session (40 blocks; 20–40 min)
with the aim of improving tracking performance beyond pre-training levels. The
tracking task involved two types of sequences within each block, a random and
a repeated sequence. Improvement on the random sequence was again taken
as a measure of general skill learning, whilst any additional improvement on the
repeated sequence index sequence-specific motor learning of the precise
sequence pattern (Wulf and Schmidt, 1997). Tracking performance was defined
as the accuracy (measured in RMSE) with which subject’s wrist movement

Predicting individual differences in motor learning after stroke
181
tracked the target movement (Figure 6.2). Patient’s tracking performance was
retested at two different time points: 45–60 min (retest1 on day 1; 5 blocks) and
24 hours (retest2 on day 2; 10 blocks) after the initial training session. These
retest sessions allowed (i) temporary effects (e.g. fatigue or boredom) that build
up over the course of training (Brawn et al., 2010; Rickard et al., 2008) to
dissipate, thus only leaving the fairly permanent learning effects and (ii)
consolidation of motor memories to occur, which either results in stabilization or
even enhancement of acquired motor skill performance after a night’s sleep
(Robertson et al., 2004a; Walker, 2005).
EEG recorded during the performance of the simple motor task was used to
assess pre-movement (resting) and movement-related beta activity before (Pre),
immediately after (Post1) and 24-hours after (Post2) the initial training phase. On
day 1, prior to the motor tasks, the mid-point and maxima of a patient’s maximum
AROM (see Chapter 3 section 3.2.1 for details) around the wrist joint was
measured (mean AROM = 113.3±20.5 deg) and subsequently used as start
and/or target positions in the continuous tracking task and simple motor task,
respectively.
Figure 6.1 | Timeline of experiment employing EEG and motor learning.
EEG was recorded during the performance of a simple motor task before (Pre)
and at two time points after the training phase (Post1 and Post2). Retention of
motor skill acquisition was assessed on the same day (45–60 min, retest1 on
day 1) and the following day (24-hours, retest2 on day 2).

Predicting individual differences in motor learning after stroke
182
6.3.2.1 Apparatus and stimuli
In accordance with the previous studies presented in this thesis, patients were
comfortably seated with their contralesional (affected) hand resting in the
instrumented wrist rig (see Chapter 3 section 3.2.1). The wrist rig restricted
movement to flexion and extension around the wrist joint and ensured minimal
hand and arm movement during the experiment. The angular position of the wrist,
sensed by the build-in potentiometer of the wrist rig, was continuously displayed
on a computer monitor as a cursor in the form of a red circle – referred to as “wrist
cursor”. The target in both motor tasks was displayed as either an open yellow
circle (continuous tracking task) or as a blue square (simple motor task).
6.3.2.2 Continuous tracking task
Stroke patients were required to continuously track a circular target (in yellow)
that moved back and forth along a fixed arc through a predefined sequence of 12
positions (Figure 6.2A). For a detailed description of the continuous tracking task
please refer to Chapter 3 section 3.2.2. In brief, the minimum jerk approach
(Flash and Hogan, 1985; Hogan, 1984) was employed to ensure smooth target
motion through the sequence positions. The maximum range of the target
trajectory was defined as ±30° of wrist flexion and extension and the target always
started and finished at the individual mid-point position of each patient’s AROM.
Each block consisted of two sequences, one random and one repeated sequence
presented in randomised order, with a 3 s stationary target between both. The
repeated sequence was identical throughout initial training (40 blocks), and retest
sessions (retest1 on day 1: 5 blocks; retest2 on day 2: 10 blocks) and randomly
selected from the same pool of 57 difficulty-matched sequences used Chapter
5. Please refer to Chapter 3 section 3.2.2.3 for details about the sequences. Each
random sequence was encountered only once; however, the same set of
difficulty-matched sequences was used across subjects. Patients were instructed
to move their wrist so as to shift the red wrist cursor to match the movement of
the target as ‘accurately and smoothly as possible’.
Prior to the training, the average velocity with which the target moved along the
arc was determined on an individual basis in order to ensure that the task was of
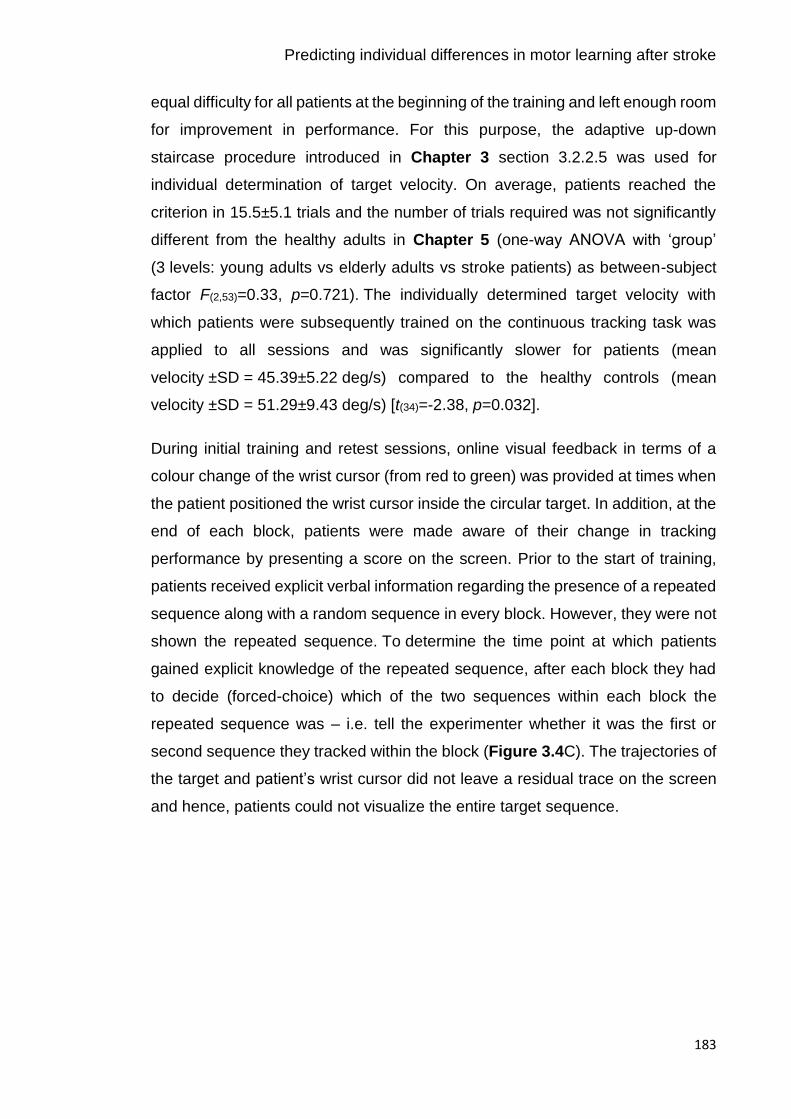
Predicting individual differences in motor learning after stroke
183
equal difficulty for all patients at the beginning of the training and left enough room
for improvement in performance. For this purpose, the adaptive up-down
staircase procedure introduced in Chapter 3 section 3.2.2.5 was used for
individual determination of target velocity. On average, patients reached the
criterion in 15.5±5.1 trials and the number of trials required was not significantly
different from the healthy adults in Chapter 5 (one-way ANOVA with ‘group’
(3 levels: young adults vs elderly adults vs stroke patients) as between-subject
factor F(2,53)=0.33, p=0.721). The individually determined target velocity with
which patients were subsequently trained on the continuous tracking task was
applied to all sessions and was significantly slower for patients (mean
velocity ±SD = 45.39±5.22 deg/s) compared to the healthy controls (mean
velocity ±SD = 51.29±9.43 deg/s) [t(34)=-2.38, p=0.032].
During initial training and retest sessions, online visual feedback in terms of a
colour change of the wrist cursor (from red to green) was provided at times when
the patient positioned the wrist cursor inside the circular target. In addition, at the
end of each block, patients were made aware of their change in tracking
performance by presenting a score on the screen. Prior to the start of training,
patients received explicit verbal information regarding the presence of a repeated
sequence along with a random sequence in every block. However, they were not
shown the repeated sequence. To determine the time point at which patients
gained explicit knowledge of the repeated sequence, after each block they had
to decide (forced-choice) which of the two sequences within each block the
repeated sequence was – i.e. tell the experimenter whether it was the first or
second sequence they tracked within the block (Figure 3.4C). The trajectories of
the target and patient’s wrist cursor did not leave a residual trace on the screen
and hence, patients could not visualize the entire target sequence.
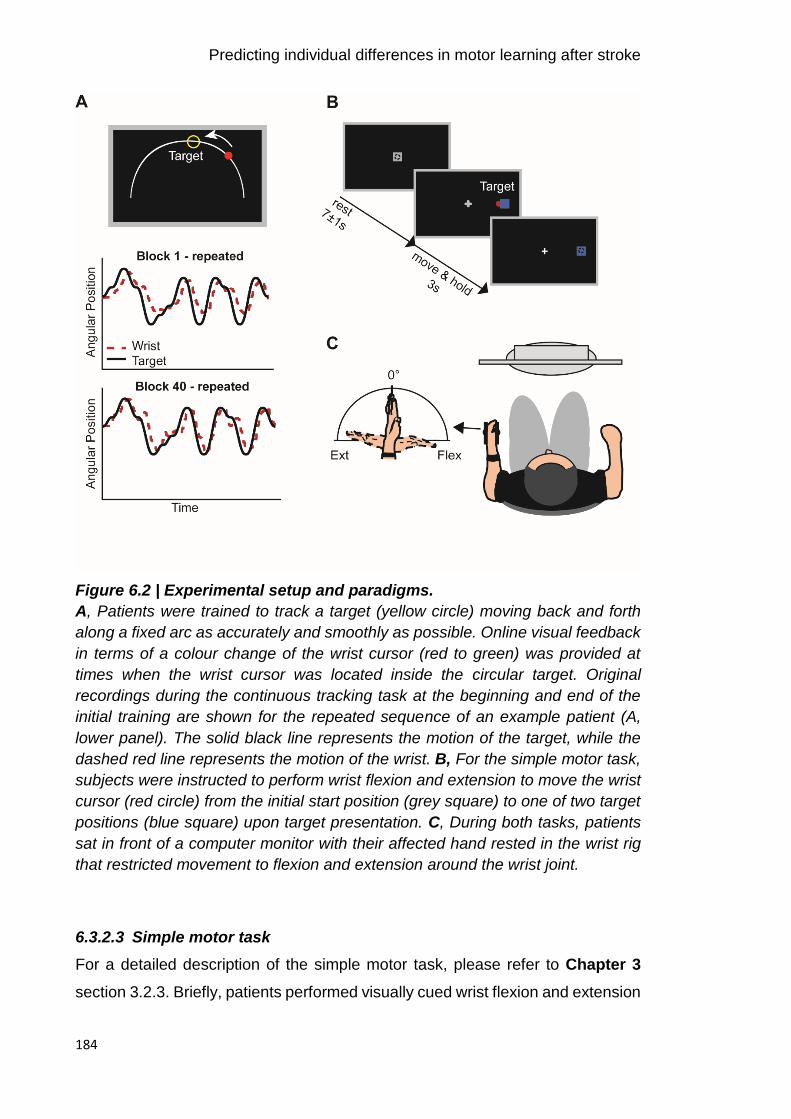
Predicting individual differences in motor learning after stroke
184
Figure 6.2 | Experimental setup and paradigms.
A, Patients were trained to track a target (yellow circle) moving back and forth
along a fixed arc as accurately and smoothly as possible. Online visual feedback
in terms of a colour change of the wrist cursor (red to green) was provided at
times when the wrist cursor was located inside the circular target. Original
recordings during the continuous tracking task at the beginning and end of the
initial training are shown for the repeated sequence of an example patient (A,
lower panel). The solid black line represents the motion of the target, while the
dashed red line represents the motion of the wrist. B, For the simple motor task,
subjects were instructed to perform wrist flexion and extension to move the wrist
cursor (red circle) from the initial start position (grey square) to one of two target
positions (blue square) upon target presentation. C, During both tasks, patients
sat in front of a computer monitor with their affected hand rested in the wrist rig
that restricted movement to flexion and extension around the wrist joint.
6.3.2.3 Simple motor task
For a detailed description of the simple motor task, please refer to Chapter 3
section 3.2.3. Briefly, patients performed visually cued wrist flexion and extension
Predicting individual differences in motor learning after stroke
185
movements with their contralesional (affected) hand during EEG recording.
During each trial, wrist movements were always initiated from the same start
position displayed at the centre of the screen that represented the mid-point of a
patient’s individual AROM. The cue to perform wrist flexion or extension
movements was the random appearance of one of two targets (in blue), on the
left or right, equidistant from the central start position (Figure 6.2B). Each of the
targets represented the patient’s maximum wrist flexion or extension position.
Stroke patients were instructed to move their wrist upon presentation of the target
so as to shift the red wrist cursor from the central start position to match the
position of the target in a ‘quick and discrete’ movement. They were also asked
to move as soon as possible and to avoid anticipation or guessing of target
appearance. The target position was displayed for 3 s and patients had to
maintain the wrist cursor inside the blue target until being cued to return to the
initial start position. Once patients returned to the start position, the next cue to
move was delivered following a delay of 7±1 s. The task comprised 120 trials,
and patients were instructed to minimize eye movements by focusing on a
centrally located fixation cross. As described in detail in Chapter 3 section
3.7.1.2, kinematic data of individual wrist movements were analysed with regard
to reaction time (RT), movement time (MT), and peak velocity (PV) and averaged
per experimental condition on an average of 109±4 remaining trials. Since
movement time and peak velocity were highly correlated (r>0.7), only reaction
time and movement time were reported.
6.3.3 EEG recording
Scalp EEG was continuously recorded at 2084 Hz using 64 electrodes mounted
on an elastic cap according to the international 10-20 EEG system. The
impedance was kept below ≤5 kΩ and the EEG signal was referenced to Cz
during recording. The timing of the visual cue (blue target) in the motor task was
marked in the simultaneous EEG recording, with separate markers for each
condition (flexion, extension). Surface EMG using bipolar electrodes in a belly-
tendon montage placed on the wrist extensor (extensor carpi radialis longus) and
flexor (flexor carpi radialis) muscles monitored movements of the affected hand.

Predicting individual differences in motor learning after stroke
186
6.3.4 Data analysis
Analyses were conducted using custom-written routines in Matlab and the
SPM12 toolbox (Wellcome Trust Centre for Neuroimaging,
www.fil.ion.ucl.ac.uk/spm). The fieldtrip toolbox ((Oostenveld et al., 2011),
www.ru.nl/fcdonders/fieldtrip/) was additionally employed for EEG data
visualization. Statistical analyses were performed using SPSS and custom-
written Matlab routines.
6.3.4.1 Functional assessment measures
ARAT, grip strength, and NHPT test scores were normalized by expressing the
affected UL score relative to the unaffected UL. Adopting a similar approach as
previous studies (Rossiter et al., 2014a; Ward et al., 2003a), a principle
component analysis (PCA) was performed on ARAT, NHPT, grip strength and
sensation assessment in order to create a single sensorimotor impairment score
unaffected by floor and ceiling effects in individual scores. The first principle
component was extracted to generate a PCA sensorimotor impairment score,
whereby a lower PCA score corresponds to greater impairment. The same
procedure was used to generate an overall score of the level of fatigue
experienced by patients, based on FSS and NFI ratings, with lower PCA scores
reflecting lower levels of fatigue.
6.3.4.2 Motor learning measures
Analysis of kinematic data was identical to Chapter 5 and a detailed description
can be found in Chapter 3 section 3.7.1.1. In brief, the behavioural measure
“tracking performance” on the continuous tracking task was parametrized by
RMSE (see Equation 3.5), an established composite measure of temporal and
spatial measurements of time lag and distance (Al-Sharman and Siengsukon,
2014; Boyd and Winstein, 2006; Roig et al., 2014; Siengsukon and Boyd, 2009),
with smaller RMSE values reflecting better tracking performance. RMSE was
calculated for repeated and random sequences separately and averaged across
each block of the training and retest sessions.

Predicting individual differences in motor learning after stroke
187
As the beginning and end of individual training and retest sessions might not be
representative of actual tracking performance (e.g. due to warm-up decrement at
the beginning or fatigue at the end), a linear regression model was fitted across
the first and last 5 blocks of individual training and retest sessions (approach
adopted from (Waters-Metenier et al., 2014)). This fit provided a corrected
performance estimate of the first and last blocks of each session (please refer to
Chapter 3 section 3.7.1.1 for illustration of this approach). Please note that
performance refers to this corrected performance estimate unless stated
otherwise.
The analysis then concentrated on six time points in order to assess changes in
tracking performance across time: first block of training (T0), last block of training
(T1), first block of retest1 (T2), last block of retest1 (T3), first block of retest2 (T4),
and last block of retest2 (T5). As outlined in Chapter 1 section 1.1.1.1, various
processes can occur during time periods during which the task is not practised
(i.e. between T1 and T2 or T3 and T4), such as dissipitation of temporary effects
(e.g. fatigue or boredom) (Brawn et al., 2010; Rickard et al., 2008) and motor
memory consolidation, resulting in skill retention, enhancement or decrements
(Hotermans et al., 2006; Robertson et al., 2004a; Walker, 2005). As such,
tracking performance at T2 is most likely to reflect fairly permanent learning
effects unaffected by training-induced temporary effects such as fatigue or
boredom, while performance at T4 likely indexes retention of the acquired motor
skill overnight, due to motor memory consolidation.
6.3.4.3 Neurophysiological measures
Pre-processing and time-frequency analysis of EEG data recorded during the
performance of the simple motor task has been detailed in Chapter 3 section
3.7.2 and followed the same procedure as in Chapter 5. Briefly, the raw EEG
signal was first offline re-referenced to the average signal across all electrodes,
bandpass filtered between 5–100 Hz, additionally filtered with a 50 Hz notch filter,
and downsampled to 300 Hz. Data were epoched from -1 to 9 s relative to visual
cue onset (0 s) and poorly performed trials (see 6.3.2.3 Simple motor task) were
excluded. The remaining EEG trials were visually scrutinized and trials containing

Predicting individual differences in motor learning after stroke
188
artefacts (e.g. muscle activation or large eye blinks) were additionally removed.
For each session, on average 82±17 artefact-free EEG trials remained, and the
number of trials did not differ between conditions (p>0.9, repeated-measures
ANOVA). Artefact-free EEG time-series from each single trial were then
decomposed into their time-frequency representations in the 5–45 Hz range with
frequency steps of 0.1 Hz. A 7-cycle Morlet wavelet was used for the continuous
wavelet transformation. Power was averaged across trials and rescaled in order
to show changes relative to the corresponding pre-movement baseline period
(-1–0 s prior to cue onset) (Equation 3.6).
Spectral power time-series were then derived from electrodes pre-selected from
the independent data presented in Chapter 4 overlying both sensorimotor
cortices (MRBD: ‘C4’ ‘CP4’ ‘CP2’ and ‘C3’ ‘CP3’ ‘CP1’ for contra- and ipsilateral
hemispheres, respectively; PMBR: ‘C2’ ‘C4’ ‘CP4’ and ‘C1’ ‘C3’ ‘CP3’ for contra-
and ipsilateral hemispheres, respectively). These bilateral electrodes were
pooled as contralateral and ipsilateral regions of interest, respectively.
To select time-frequency windows of interest that were orthogonal to potential
differences between conditions (flexion and extension) when the simple motor
task was performed (Pre, Post1, and Post2), I averaged over conditions,
sessions, and all patients. Then, specific time-frequency windows were chosen
based on peak changes in beta activity in time-frequency maps of the bilateral
sensorimotor regions, which revealed clear movement-related beta-band activity
in two distinct time windows of interest. This information was used to optimize the
alignment of constant duration and width time-frequency windows to capture
maximum MRBD (1–2 s relative to cue onset; mean peak latency: 1.66±0.08 s),
occurring between cue onset and movement termination, and PMBR (6–7 s
relative to cue onset; mean peak latency: 6.47±0.14 s), which emerges after
movement cessation (Figure 6.3). In line with the elderly subject group in
Chapter 5 and known age-related reduction of beta peak frequency (Rossiter et
al., 2014b), patients’ peak changes in beta activity after movement cessation
appeared at lower beta frequencies compared to young healthy subjects (10–
25 Hz). Selected time-frequency windows and electrodes applied to all stroke
patients and sessions, and were not adjusted individually.

Predicting individual differences in motor learning after stroke
189
Subsequently, for each individual patient, percentage decrease (MRBD) and
increase (PMBR) in beta power were extracted from the respective 1 s time
windows and averaged separately for each EEG session (Pre, Post1 and Post2)
for the pre-selected electrodes over each hemisphere. The absolute pre-
movement (resting) baseline beta (BB) power from -1 to 0 s relative to cue onset
was also obtained.
In total, the same 6 highly reliable beta parameter estimates as in Chapter 5 were
used for subsequent analyses: pre-movement baseline beta (absolute power),
MRBD (relative power) and PMBR (relative power) from contra- and ipsilateral
sensorimotor cortices, respectively.
Figure 6.3 | Movement-related changes in spectral power after stroke.
Time-frequency spectrograms are averaged across patients separately for
contralateral (upper panel) and ipsilateral (lower panel) sensorimotor cortex for
each EEG session (Pre, Post1, and Post2). The right hand panel displays
overlaid beta power traces for the three sessions. The black rectangles indicate
the time windows of interest of peak changes in beta activity (MRBD and PMBR).
Please note that PMBR occurred at lower beta frequencies (10–25 Hz) compared
to MRBD. These time-frequency windows were tested for significant differences
between groups and EEG sessions.
6.3.5 Statistical analysis
Before (I) investigating the relationship between beta-band activity and individual
differences in motor learning, a series of conventional analyses were first
Predicting individual differences in motor learning after stroke
190
conducted to assess (II) whether stroke patients ability to learn on the continuous
tracking task (their behaviour) was comparable to the age-matched healthy
control subjects, and (III) whether stroke-related alterations in beta-band activity
(neurophysiology) were present in the here examined well-recovered patient
group.
To assess whether tracking performance improved across training and was
maintained, enhanced or decreased at retest sessions, a repeated-measures
ANOVA on tracking performance score (RMSE) was performed, with ‘group’ (2
levels: patients vs controls) as between-subject factor and ‘sequence type’ (2
levels: repeated vs random) and ‘time’ (5 levels: T0 vs T1 vs T2 vs T3 vs T4) as
within-subject factors. Additionally, to ensure comparable baseline performance
and thus, allow for direct comparison between stroke patients and healthy
controls, a repeated-measures ANOVA of tracking performance at the beginning
of training (T0) was used.
Standard measures of resting and movement-related beta activity were evaluated
applying separate repeated-measures ANOVAs with ‘group’ (2 levels: patients vs
controls) as between-subject factor and ‘hemisphere’ (2 levels: contralateral vs
ipsilateral) and EEG ‘session’ (3 levels: Pre vs Post1 vs Post2) as within-subject
factors.
A Greenhouse-Geiger correction was applied whenever Mauchly’s test indicated
a lack of sphericity. Post hoc Bonferroni-adjusted t-tests were performed
whenever main effects and interaction effects were detected in the ANOVAs.
Prior to ANOVAs and post hoc t-tests, Kolmogorov-Smirnov test was used to
affirm normal distribution of the data. Results were considered significant if
p-values were below 0.05. All data presented in the text and tables are
represented as mean ±SD unless stated otherwise.
6.3.5.1 Regression analysis combining neurophysiological, behavioural
and clinical measures
Finally, a multiple linear regression approach was employed in order to
investigate whether post-stroke spectral power measures of beta-band activity
relate to individual differences in the capacity for motor learning, accounting for
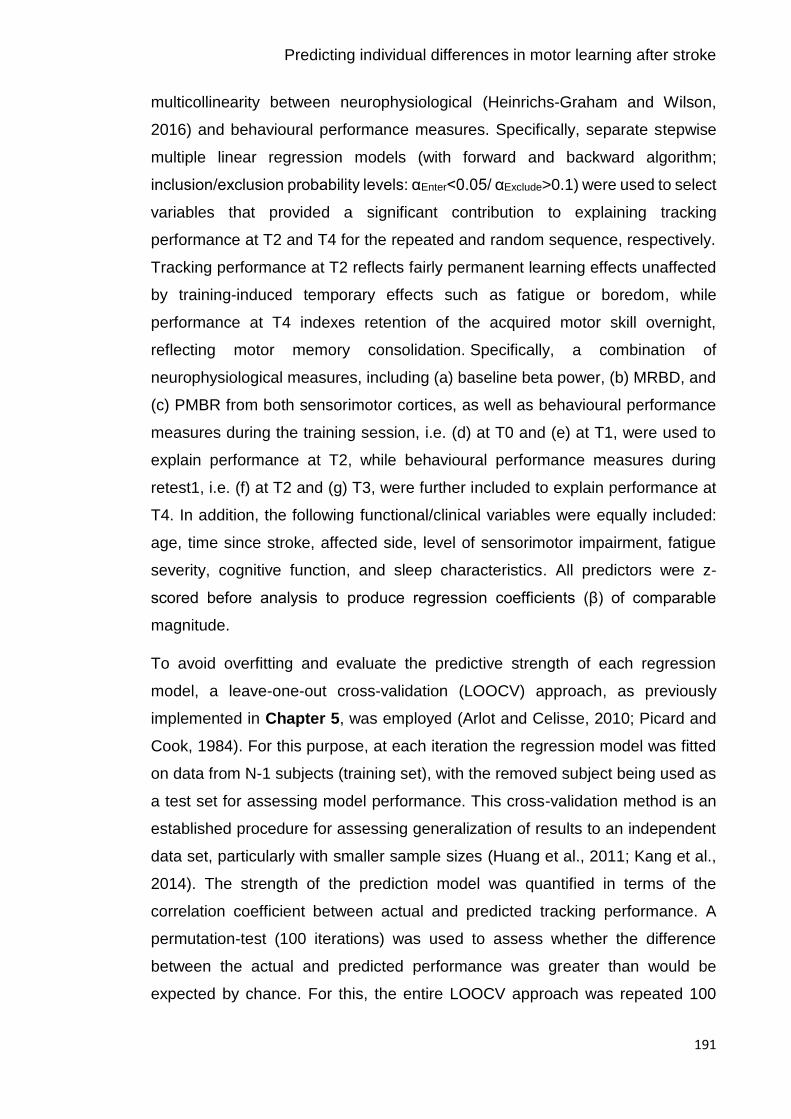
Predicting individual differences in motor learning after stroke
191
multicollinearity between neurophysiological (Heinrichs-Graham and Wilson,
2016) and behavioural performance measures. Specifically, separate stepwise
multiple linear regression models (with forward and backward algorithm;
inclusion/exclusion probability levels: αEnter<0.05/ αExclude>0.1) were used to select
variables that provided a significant contribution to explaining tracking
performance at T2 and T4 for the repeated and random sequence, respectively.
Tracking performance at T2 reflects fairly permanent learning effects unaffected
by training-induced temporary effects such as fatigue or boredom, while
performance at T4 indexes retention of the acquired motor skill overnight,
reflecting motor memory consolidation. Specifically, a combination of
neurophysiological measures, including (a) baseline beta power, (b) MRBD, and
(c) PMBR from both sensorimotor cortices, as well as behavioural performance
measures during the training session, i.e. (d) at T0 and (e) at T1, were used to
explain performance at T2, while behavioural performance measures during
retest1, i.e. (f) at T2 and (g) T3, were further included to explain performance at
T4. In addition, the following functional/clinical variables were equally included:
age, time since stroke, affected side, level of sensorimotor impairment, fatigue
severity, cognitive function, and sleep characteristics. All predictors were z-
scored before analysis to produce regression coefficients (β) of comparable
magnitude.
To avoid overfitting and evaluate the predictive strength of each regression
model, a leave-one-out cross-validation (LOOCV) approach, as previously
implemented in Chapter 5, was employed (Arlot and Celisse, 2010; Picard and
Cook, 1984). For this purpose, at each iteration the regression model was fitted
on data from N-1 subjects (training set), with the removed subject being used as
a test set for assessing model performance. This cross-validation method is an
established procedure for assessing generalization of results to an independent
data set, particularly with smaller sample sizes (Huang et al., 2011; Kang et al.,
2014). The strength of the prediction model was quantified in terms of the
correlation coefficient between actual and predicted tracking performance. A
permutation-test (100 iterations) was used to assess whether the difference
between the actual and predicted performance was greater than would be
expected by chance. For this, the entire LOOCV approach was repeated 100
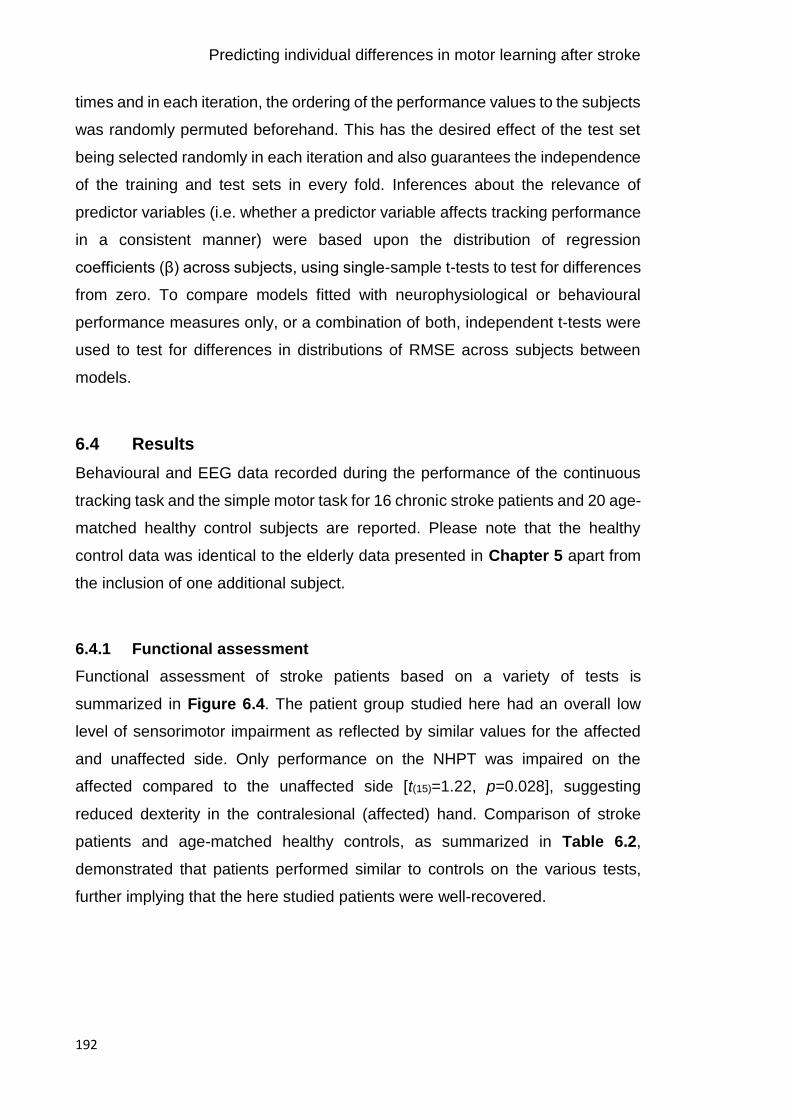
Predicting individual differences in motor learning after stroke
192
times and in each iteration, the ordering of the performance values to the subjects
was randomly permuted beforehand. This has the desired effect of the test set
being selected randomly in each iteration and also guarantees the independence
of the training and test sets in every fold. Inferences about the relevance of
predictor variables (i.e. whether a predictor variable affects tracking performance
in a consistent manner) were based upon the distribution of regression
coefficients (β) across subjects, using single-sample t-tests to test for differences
from zero. To compare models fitted with neurophysiological or behavioural
performance measures only, or a combination of both, independent t-tests were
used to test for differences in distributions of RMSE across subjects between
models.
6.4 Results
Behavioural and EEG data recorded during the performance of the continuous
tracking task and the simple motor task for 16 chronic stroke patients and 20 age-
matched healthy control subjects are reported. Please note that the healthy
control data was identical to the elderly data presented in Chapter 5 apart from
the inclusion of one additional subject.
6.4.1 Functional assessment
Functional assessment of stroke patients based on a variety of tests is
summarized in Figure 6.4. The patient group studied here had an overall low
level of sensorimotor impairment as reflected by similar values for the affected
and unaffected side. Only performance on the NHPT was impaired on the
affected compared to the unaffected side [t(15)=1.22, p=0.028], suggesting
reduced dexterity in the contralesional (affected) hand. Comparison of stroke
patients and age-matched healthy controls, as summarized in Table 6.2,
demonstrated that patients performed similar to controls on the various tests,
further implying that the here studied patients were well-recovered.

Predicting individual differences in motor learning after stroke
193
Figure 6.4 | Patients’ functional/clinical test scores.
A, Upper limb motor function of the contralsional (affected) UL assessed by
ARAT, NHPT and grip strength test was expressed as a percentage of the
unaffected side in 16 stroke patients. (B) Self-reported fatigue was quantified
using two computerised questionnaires, FSS-7 and NFI. Fatigue severity
reported by the stroke patients ranged across a broad spectrum of fatigue levels.
(C) UL sensation as measured by the FM sensation and proprioception
assessment showed normal sense of touch or sensation, except for four patients
who showed reduced sense of touch (hypoesthesia). (D) Patients showed good
cognitive abilities as shown by relatively low error scores (max 225) and fast
reaction times. The boxplots show the distribution of the data points, with the
horizontal line representing the median and the black dots representing outliers.

Predicting individual differences in motor learning after stroke
194
Table 6.2 | Group characteristics of stroke patients and healthy controls.
Patients Controls Between-group difference
N 16 20 -
Age 64±8 68±5 t(25.2)=-1.84, p=0.078
Male:Female ratio 11:5 8:12 Χ2=2.94, p=0.086
Handedness (Edinburgh) 87±24 85±21 t(34)=-0.21, p=0.833
Grip Strength [lb] 66±26.04 63±21.03 t(34)=0.41, p=0.682
NHPT [pegs/s] 0.57±0.13 0.60±0.07 t(34)=-0.93, p=0.362
SART (Error score, 0-225) 13±8.97 13±10.73 t(34)=0.13, p=0.897
SART (RT in ms) 456±114.3 451±142.9 t(34)=0.108, p=0.915
Sleep Quantity [hours]# 7±1.02 6±0.94 U=93.5, p=0.033
Sleep Quality (1-8)# 4.7±1.57 5.2±0.87 U=141.0, p=0.560
Between-group comparisons only revealed a significant difference in sleep
quantity the previous night. For continuous data, independent-samples t-tests
were used to test for between-group differences. For discrete data (#), Mann-
Whitney U-tests were applied. Handedness was assessed using the Edinburgh
Handedness Inventory (Oldfield, 1971). Upper limb functional measures are
affected hand/non-dominant hand only and sleep measures are averaged across
both days (both sleep measures were not significantly different between day 1
and day 2, p>0.1). Significant effects are indicated in bold. Values given are
mean ±SD. NHPT: Nine Hole Peg Test; SART: Sustained Attention to Response
Test.
6.4.2 Reduction of motor skill learning after stroke
Tracking performance of chronic stroke patients and healthy age-matched
controls at training and retest sessions is shown in Figure 6.5A. Testing for
systematic differences in tracking performance at baseline (block 1) did not reveal
a significant difference between patients and healthy controls [F(1,34)=0.42,
p=0.523] or repeated and random sequences [F(1,34)=0.002, p=0.969] nor an
interaction effect [F(1,34)=0.051, p=0.823], thus allowing direct comparison of t
performance between both groups.
A repeated-measures ANOVA on tracking performance revealed a significant
main effect of ‘time’ [F(4,136)=32.33, p<0.001, ƞ2=0.487], ‘sequence type’
[F(1,34)=55.216, p<0.001, ƞ2=0.619] and ‘group’ [F(1,34)=4.80, p=0.035, ƞ2=0.124].

Predicting individual differences in motor learning after stroke
195
In addition, significant interactions between ‘time x group’ [F(4,136)=4.25, p=0.006,
ƞ2=0.111], ‘time x sequence type’ [F(4,136)=10.98, p<0.001, ƞ2=0.244], and
‘sequence type x group’ [F(1,34)=5.58, p=0.024, ƞ2=0.141] were found. Post hoc
analyses were thus performed to separately assess changes in motor
performance with initial training (online) and following a shorter (retest1) or longer
(retest2) time delay during which subjects did not practice the task (offline),
focusing on how stroke patients’ motor learning differs from healthy controls.
Figure 6.5 | Motor learning performance of patients and healthy controls.
A, Average tracking performance (RMSE) for repeated and random sequences
(solid and dashed lines respectively) across training (day 1), retest1 (day 1) and
retest2 (day 2) sessions for chronic stroke patients (green) and healthy controls
(orange). Vertical dashed lines represent time away from the motor learning task.
B, Corrected performance estimates at the beginning and end of training (T0, T1)
and retest (retest1: T2, T3; retest2: T4, T5) sessions. C, Performance differences
(Δ) between time points, focusing on online learning (T0-T1) and offline learning
over a shorter (retest1, T1-T2) or longer (retest2, T3-T4) time delay delay as well
as overall performance changes from baseline (T0-T2; T0-T4). Solid bars
represent Δ performance on the repeated sequence and striped bars on the
random sequence. Positive and negative values, respectively, signify
performance improvement and decrement. Shaded area (A) and error bars (B,
C) indicate between-subject SEM. *p<0.05, **p<0.01, ***p<0.001, grey *p<0.1
(trend).

Predicting individual differences in motor learning after stroke
196
6.4.2.1 Performance over the course of training
During the training phase, stroke patients did not significantly improve their
tracking performance [T0 vs T1; F-statistics and p-values of ANOVAs are
summarized in Table 6.3] for neither the repeated [t(15)=1.62, p=0.127] nor
random sequence [t(15)=-0.73, p=0.476], but a significant difference between
sequences at T1 was observed [t(15)=-3.37, p=0.004, ƞ2=0.431]. In comparison,
the healthy control group demonstrated significant sequence-specific learning
[t(19)=4.72, p<0.0001, ƞ2=0.539] (Figure 6.5C). Closer inspection of the tracking
performance in Figure 6.5A shows a decline in performance towards the end of
the training phase, suggesting that temporary effects such as fatigue or boredom
might have depressed performance towards the end of training.
6.4.2.2 Performance at retest1
Because stroke patients did not significantly improve their performance over the
course of training, their performance levels on the repeated sequence at T1 and
T2 were significantly different from the healthy control group [T1: t(30.8)=2.82,
p=0.008; T2: t(34)=2.73, p=0.010]. However, patients and healthy controls had
similar performance levels on the random sequence [T1: t(27.56)=0.94, p=0.354;
T2: t(31.09)=1.62, p=0.115]. Across the short time period between T1 and T2,
patients’ tracking performance significantly improved by 7 % without further
training for the repeated sequence only [t(15)=3.72, p=0.002, ƞ2=0.480], while
there was a trend for the random sequence [t(15)=1.95, p=0.070]. This indicates a
boost in performance early after the initial training (45-60 min) comparable to the
healthy controls [t(34)=0.56, p=0.582], which might be due to the dissipation of
training-induced temporary effects (Figure 6.5C).
In line, patients’ overall performance significantly improved from T0 to T2 for the
repeated sequence (11 % improvement) [t(15)=4.53, p<0.001], but not random
sequence. This indicates that patients actually learned, but that the learning
effects were masked at the end of training, most likely due to temporary effects.
However, these learning-related improvements were significantly smaller
compared to the healthy control group [repeated sequence: t(34)=-3.55, p=0.001;
random sequence: t(34)=-1.90, p=0.066].
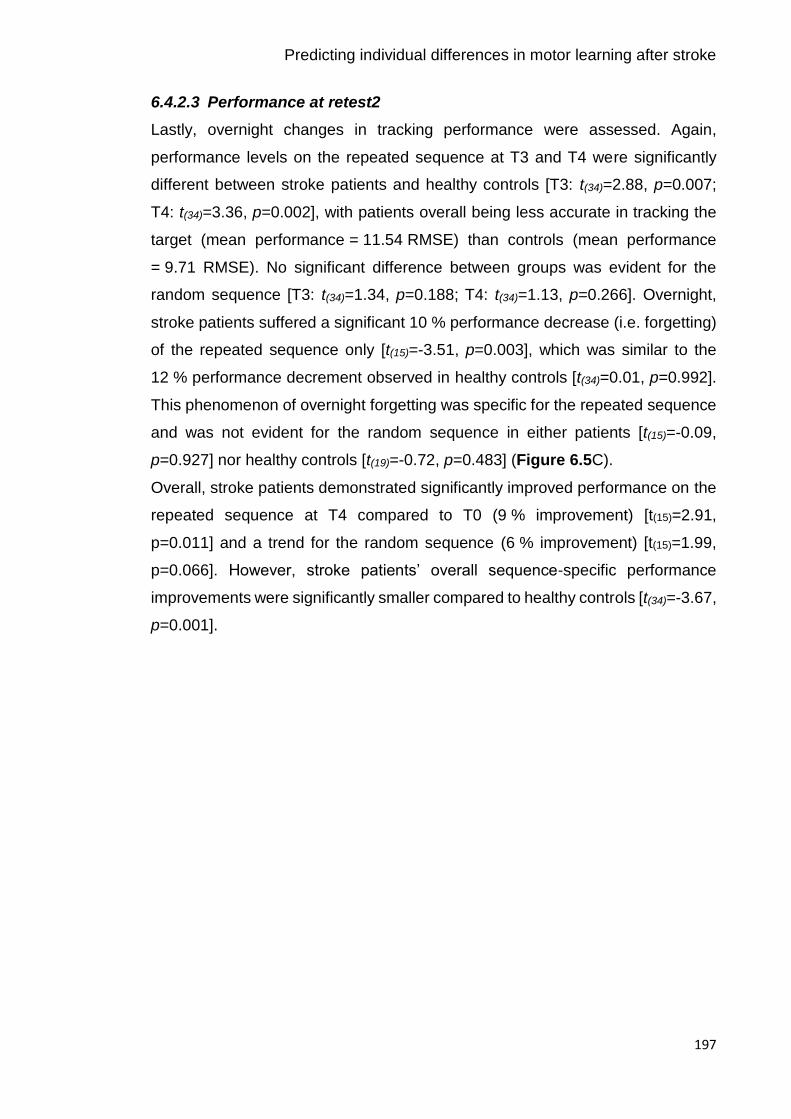
Predicting individual differences in motor learning after stroke
197
6.4.2.3 Performance at retest2
Lastly, overnight changes in tracking performance were assessed. Again,
performance levels on the repeated sequence at T3 and T4 were significantly
different between stroke patients and healthy controls [T3: t(34)=2.88, p=0.007;
T4: t(34)=3.36, p=0.002], with patients overall being less accurate in tracking the
target (mean performance = 11.54 RMSE) than controls (mean performance
= 9.71 RMSE). No significant difference between groups was evident for the
random sequence [T3: t(34)=1.34, p=0.188; T4: t(34)=1.13, p=0.266]. Overnight,
stroke patients suffered a significant 10 % performance decrease (i.e. forgetting)
of the repeated sequence only [t(15)=-3.51, p=0.003], which was similar to the
12 % performance decrement observed in healthy controls [t(34)=0.01, p=0.992].
This phenomenon of overnight forgetting was specific for the repeated sequence
and was not evident for the random sequence in either patients [t(15)=-0.09,
p=0.927] nor healthy controls [t(19)=-0.72, p=0.483] (Figure 6.5C).
Overall, stroke patients demonstrated significantly improved performance on the
repeated sequence at T4 compared to T0 (9 % improvement) [t(15)=2.91,
p=0.011] and a trend for the random sequence (6 % improvement) [t(15)=1.99,
p=0.066]. However, stroke patients’ overall sequence-specific performance
improvements were significantly smaller compared to healthy controls [t(34)=-3.67,
p=0.001].
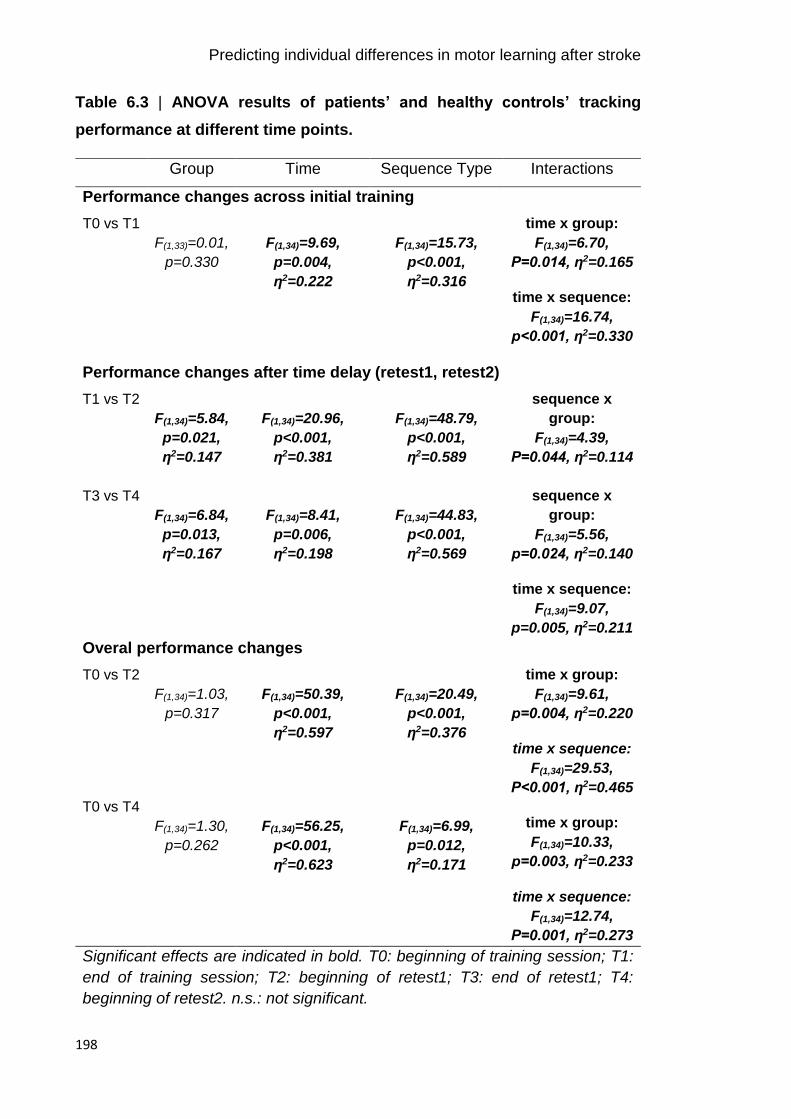
Predicting individual differences in motor learning after stroke
198
Table 6.3 | ANOVA results of patients’ and healthy controls’ tracking
performance at different time points.
Group Time Sequence Type Interactions
Performance changes across initial training
T0 vs T1
F(1,33)=0.01,
p=0.330
F(1,34)=9.69,
p=0.004,
ƞ2=0.222
F(1,34)=15.73,
p<0.001,
ƞ2=0.316
time x group:
F(1,34)=6.70,
P=0.014, ƞ2=0.165
time x sequence:
F(1,34)=16.74,
p<0.001, ƞ2=0.330
Performance changes after time delay (retest1, retest2)
T1 vs T2
F(1,34)=5.84,
p=0.021,
ƞ2=0.147
F(1,34)=20.96,
p<0.001,
ƞ2=0.381
F(1,34)=48.79,
p<0.001,
ƞ2=0.589
sequence x
group:
F(1,34)=4.39,
P=0.044, ƞ2=0.114
T3 vs T4
F(1,34)=6.84,
p=0.013,
ƞ2=0.167
F(1,34)=8.41,
p=0.006,
ƞ2=0.198
F(1,34)=44.83,
p<0.001,
ƞ2=0.569
sequence x
group:
F(1,34)=5.56,
p=0.024, ƞ2=0.140
time x sequence:
F(1,34)=9.07,
p=0.005, ƞ2=0.211
Overal performance changes
T0 vs T2
F(1,34)=1.03,
p=0.317
F(1,34)=50.39,
p<0.001,
ƞ2=0.597
F(1,34)=20.49,
p<0.001,
ƞ2=0.376
time x group:
F(1,34)=9.61,
p=0.004, ƞ2=0.220
time x sequence:
F(1,34)=29.53,
P<0.001, ƞ2=0.465
T0 vs T4
F(1,34)=1.30,
p=0.262
F(1,34)=56.25,
p<0.001,
ƞ2=0.623
F(1,34)=6.99,
p=0.012,
ƞ2=0.171
time x group:
F(1,34)=10.33,
p=0.003, ƞ2=0.233
time x sequence:
F(1,34)=12.74,
P=0.001, ƞ2=0.273
Significant effects are indicated in bold. T0: beginning of training session; T1:
end of training session; T2: beginning of retest1; T3: end of retest1; T4:
beginning of retest2. n.s.: not significant.

Predicting individual differences in motor learning after stroke
199
6.4.2.4 Factors potentially influencing tracking performance
Functional characteristics and awareness about the repeated sequence did not
relate to individuals’ tracking performance, but performance level at various time
points were related to one another. Therefore, I next evaluated whether these
inter-dependences also exist in chronic stroke patients. Again, the initial ability to
perform the motor skill appeared to have the least influence on subsequent
performances, for both the repeated sequence (average r=0.21, p=0.432) and
random sequence (average r=0.06, p=0.599) (Figure 6.6).
Figure 6.6 | Correlations of patients’ performance between time.
Between-time points (T0–T4) correlation coefficients for performance on the
repeated (left panel) and random (right panel) sequence. The colour bar indicates
the correlation coefficients (r) presented in the matrices.
There were no significant correlations between functional/clinical characteristics
such as motor impairment (indexed by PCA score), fatigue (FSS, NFI) or sleep
and patients’ tracking performance level (p>0.06). Compared to healthy controls,
patients similarly well gained awareness of the repeated sequence during initial
training (patients: 75±19.0 % correct; healthy controls: 80±15 % correct) [Mann-
Whitney U=136.0, p=0.459] and recognized the repeated sequence 24 hours
later, at retest2 (patients: 71±24 % correct; healthy controls: 84±22 correct)
[Mann-Whitney U=114.5, p=0.149]. The level of patients’ awareness/recognition
of the repeated sequence was unrelated to their performance on the motor
learning task.
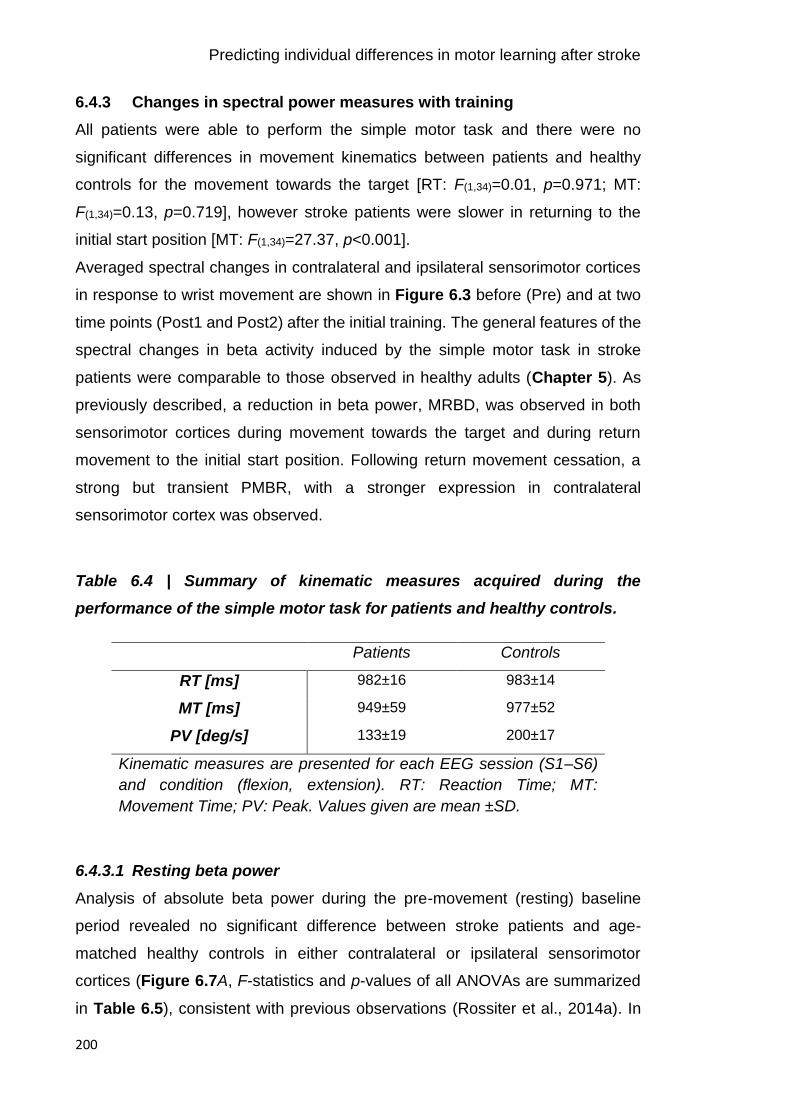
Predicting individual differences in motor learning after stroke
200
6.4.3 Changes in spectral power measures with training
All patients were able to perform the simple motor task and there were no
significant differences in movement kinematics between patients and healthy
controls for the movement towards the target [RT: F(1,34)=0.01, p=0.971; MT:
F(1,34)=0.13, p=0.719], however stroke patients were slower in returning to the
initial start position [MT: F(1,34)=27.37, p<0.001].
Averaged spectral changes in contralateral and ipsilateral sensorimotor cortices
in response to wrist movement are shown in Figure 6.3 before (Pre) and at two
time points (Post1 and Post2) after the initial training. The general features of the
spectral changes in beta activity induced by the simple motor task in stroke
patients were comparable to those observed in healthy adults (Chapter 5). As
previously described, a reduction in beta power, MRBD, was observed in both
sensorimotor cortices during movement towards the target and during return
movement to the initial start position. Following return movement cessation, a
strong but transient PMBR, with a stronger expression in contralateral
sensorimotor cortex was observed.
Table 6.4 | Summary of kinematic measures acquired during the
performance of the simple motor task for patients and healthy controls.
Patients Controls
RT [ms] 982±16 983±14
MT [ms] 949±59 977±52
PV [deg/s] 133±19 200±17
Kinematic measures are presented for each EEG session (S1–S6)
and condition (flexion, extension). RT: Reaction Time; MT:
Movement Time; PV: Peak. Values given are mean ±SD.
6.4.3.1 Resting beta power
Analysis of absolute beta power during the pre-movement (resting) baseline
period revealed no significant difference between stroke patients and age-
matched healthy controls in either contralateral or ipsilateral sensorimotor
cortices (Figure 6.7A, F-statistics and p-values of all ANOVAs are summarized
in Table 6.5), consistent with previous observations (Rossiter et al., 2014a). In

Predicting individual differences in motor learning after stroke
201
line with findings in Chapter 5, no hemispheric difference in beta power was
identified, but again a significant change in absolute beta power across EEG
sessions was identified. This change in absolute beta power was reflected by a
significantly increased beta power immediately after training (Post1) in both
contralateral [Pre vs Post1: t(35)=-4.06, p<0.001; Post1 vs Post2: t(35)=2.86,
p=0.007] and ipsilateral sensorimotor cortices [Pre vs Post1: t(35)=-3.27, p=0.002;
Post1 vs Post2: t(35)=2.22, p=0.033], which was transient in nature. However, this
effect was driven by the healthy control group and was not evident when
assessing the stroke patients alone [F(2,30)=1.45, p=0.250]. Lastly, no significant
interactions were found.
Table 6.5 | ANOVA results for spectral power of stroke patients and controls
Group Hemisphere Session Interactions
BB
F(1,34)=0.21,
p=0.653
F(1,34)=1.80,
p=0.188
F(2,68)=5.90,
p=0.004, np2=0.148
n.s.
MRBD
F(1,34)=2.22,
p=0.146
F(1,34)=21.06,
p<0.001, ƞp2=0.383
F(2,68)=.94,
p=0.004, ƞp2=0.149
n.s.
PMBR
F(1,34)=0.31,
p=0.576
F(1,34)=7.25,
p=0.011, ƞp2=0.176
F(2,68)=3.29,
p=0.043, ƞp2=0.088
n.s.
Significant effects are indicated in bold. BB: Pre-movement baseline beta;
MRBD: Movement-Related Beta Desynchronization; PMBR: Post-Movement
Beta Rebound; n.s.: not significant.
6.4.3.2 Movement-related beta power changes
Averaged beta power changes during movement (MRBD) and after movement
cessation (PMBR) for both stroke patients and healthy controls and topographic
maps are shown in Figure 6.7C-D. Interestingly, although MRBD was on average
~10 % smaller in patients compared to healthy controls, estimates of MRBD in
both contralateral and ipsilateral sensorimotor cortex were not significantly
different between groups (Figure 6.7C). Similarly, estimates of PMBR were
Predicting individual differences in motor learning after stroke
202
comparable between stroke patients and age-matched healthy controls (Figure
6.7D). As expected and observable in the topographical distributions, in particular
for the PMBR, a significant hemispheric difference in the magnitude of both
MRBD and PMBR was observed for patients and healthy controls, indicating that
both beta-band dynamics were overall more pronounced in the hemisphere
contralateral to the moving hand. Finally, a significant effect of ‘session’ was
found for both movement-related beta dynamics. Post hoc analyses revealed a
significant reduction across sessions in both contralateral [F(2,68)=6.33, p=0.003,
ƞp2=0.157] and ipsilateral sensorimotor cortex [F(2,68)=3.31, p=0.043, ƞp
2=0.089]
for the magnitude of MRBD, but only in ipsilateral sensorimotor cortex for PMBR
[F(2,68)=4.66, p=0.013, ƞp2=0.120].
Since previous studies reported that movement-related beta measures correlate
with motor impairment (Rossiter et al., 2014a; Shiner et al., 2015), I next
examined whether resting and movement-related beta power was associated
with clinical or behavioural parameters acquired on day 1. However, no
correlations between beta power measures and motor impairment were
identified. Interestingly, absolute baseline beta power from both sensorimotor
cortices and across all sessions was positively correlated with the level of fatigue
(average across sessions; contralateral sensorimotor cortex: r=0.67, p=0.004;
ipsilateral sensorimotor cortex: r=0.71, p=0.002). In other words, beta power was
enhanced in stroke patients with more severe fatigue. However, closer inspection
revealed that this effect was driven by one stroke patient with severe fatigue.

Predicting individual differences in motor learning after stroke
203
Figure 6.7 | Changes in beta power and corresponding topographic maps.
A, Average pre-movement (resting) beta power of young and elderly groups from
both sensorimotor cortices. Power in the pre-movement time window (-1–0 s)
before (Pre), immediately after (Post1), and 24-hours after (Post2) training was
derived from contralateral and ipsilateral sensorimotor cortices of young (dark
and light blue) and elderly (red and light red) subjects. B, Topographical plots of
grand-averaged beta power showing the pre-selected electrodes (black
Predicting individual differences in motor learning after stroke
204
diamonds) which were pooled as contralateral and ipsilateral regions of interest.
C-D, Power in the movement (1–2 s; MRBD) and post-movement time window
(6–7 s; PMBR) before (Pre), immediately after (Post1), and 24-hours after (Post2)
training derived from contralateral and ipsilateral sensorimotor cortices of stroke
patients (green and light green) and age-matched healthy controls (orange and
light orange). Error bars indicate between-subject SEM. Significant between-
group differences are indicated with a ‘+’ ( grey ‘+’ indicates trend). Topographical
distributions (right panels) of movement-related beta activity show contralateral
and ipsilateral modulation patterns for MRBD and PMBR.
6.4.4 Prediction of patients’ post-training tracking performance from a
combination of neurophysiological, behavioural and
functional/clinical measures
In order to gain insight into the role of beta activity in explaining motor learning
behaviour after stroke, a stepwise multiple linear regression approach within a
LOOCV was utilized. In the next sections, I firstly assessed whether a
combination of neurophysiological (beta power measures), behavioural
(performance on the motor learning task) and functional/clinical characteristics
can explain stroke patients’ tracking performance at two different time points,
shortly after training (T2) and 24 hours later (T4). To reiterate, performance at T2
was used as an index of fairly permanent learning effects, while T4 provides a
reflection of the maintenance of the acquired motor skill overnight. Next, the
contribution of neurophysiological and behavioural measures alone in predicting
motor performance was explored.
6.4.4.1 Prediction of patients’ tracking performance at T2
Pre- and post-training beta activity (Pre, Post1), and behavioural performance at
T0 and T1, as well as functional/clinical characteristics (age, time since stroke,
lesion side, motor impairment, fatigue severity, attention, sleep) were explored as
potential predictors of tracking performance at T2 (total number of
predictors = 23), using stepwise linear regression.
None of these variables significantly explained performance on the repeated
sequence [r=0.32, n.s.]. Similarly, performance on the random sequence could
not be significantly predicted based on a combination of neurophysiological,
behavioural and clinical measures [r=-0.34, n.s.].

Predicting individual differences in motor learning after stroke
205
6.4.4.2 Prediction of patients’ tracking performance at T4
Pre- and post-training beta activity (Pre, Post1, Post2), and behavioural
performance at training (T0, T1) and retest1 (T2, T3) sessions as well as
functional/clinical characteristics (age, time since stroke, lesion side, motor
impairment, fatigue severity, attention, sleep) were explored as potential
predictors of tracking performance at T4 (total number of predictors = 31).
While performance on the random sequence could not be predicted from these
variables [r=0.03, n.s.], performance on the repeated sequence was significantly
predicted, accounting for 81 % of variance [r=0.91, p<0.001] (Figure 6.8A).
Beyond the behavioural performance at the end of training [T1: t(15)=-4.26,
p<0.001] and during retest1 [T2: t(15)=14.14, p<0.001; T3: t(15)=7.81, p<0.001], the
magnitude of contralateral (ipsilesional) PMBR immediately after training (Post1)
consistently affected the level of performance on the next day, at T4 [t(15)=4.79,
p<0.001] (Figure 6.8B). The positive coefficient for the beta power measure
suggests that lower PMBR following training is associated with better
performance 24 hours later. An additional parameter relating to the time post-
stroke demonstrated that greater time since stroke was beneficial for tracking
performance [t(15)=-2.58, p=0.021]. Similarly, a partial correlation analysis with
performance measures and time since stroke as confounding covariates showed
a significant positive correlation between post-training PMBR in contralateral
(ipsilesional) sensorimotor cortex and performance at T4 [r=0.78, p=0.005]. In
other words smaller rebound is related to better performance at T4 (note that
higher RMSE denotes worse performance).
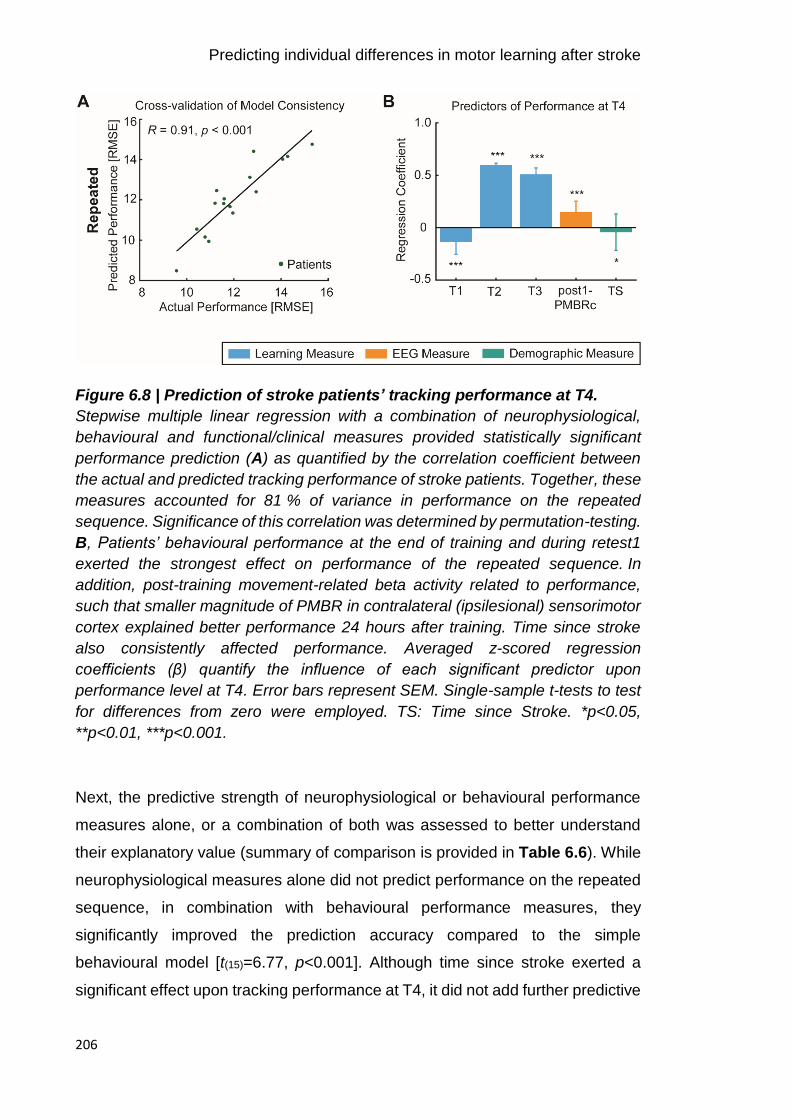
Predicting individual differences in motor learning after stroke
206
Figure 6.8 | Prediction of stroke patients’ tracking performance at T4.
Stepwise multiple linear regression with a combination of neurophysiological,
behavioural and functional/clinical measures provided statistically significant
performance prediction (A) as quantified by the correlation coefficient between
the actual and predicted tracking performance of stroke patients. Together, these
measures accounted for 81 % of variance in performance on the repeated
sequence. Significance of this correlation was determined by permutation-testing.
B, Patients’ behavioural performance at the end of training and during retest1
exerted the strongest effect on performance of the repeated sequence. In
addition, post-training movement-related beta activity related to performance,
such that smaller magnitude of PMBR in contralateral (ipsilesional) sensorimotor
cortex explained better performance 24 hours after training. Time since stroke
also consistently affected performance. Averaged z-scored regression
coefficients (β) quantify the influence of each significant predictor upon
performance level at T4. Error bars represent SEM. Single-sample t-tests to test
for differences from zero were employed. TS: Time since Stroke. *p<0.05,
**p<0.01, ***p<0.001.
Next, the predictive strength of neurophysiological or behavioural performance
measures alone, or a combination of both was assessed to better understand
their explanatory value (summary of comparison is provided in Table 6.6). While
neurophysiological measures alone did not predict performance on the repeated
sequence, in combination with behavioural performance measures, they
significantly improved the prediction accuracy compared to the simple
behavioural model [t(15)=6.77, p<0.001]. Although time since stroke exerted a
significant effect upon tracking performance at T4, it did not add further predictive

Predicting individual differences in motor learning after stroke
207
strength to the combination of neurophysiological and behavioural measures
[t(15)=2.02, n.s.].
Table 6.6 | Comparison of prediction accuracy for stroke patients’
performance at T4.
Predictor variables R R2 Mean
RMSE
Sum
RMSE
Performance on repeated sequence
Neurophysiology 0.20 0.04 0.66 11
Behaviour 0.90*** 0.81 0.32 5
Neurophysiology + Behaviour 0.92*** 0.85 0.21 3
Neurophsyiology + Behaviour + Functional
characetristics (Time since stoke)
0.91*** 0.81 0.18 3
Performance on random sequence
Neurophysiology -0.43 -0.18 0.94 15
Behaviour 0.10 0.01 0.83 13
Neurophysiology + Behaviour 0.03 0.00 0.82 13
Regression models were fitted with neurophysiological (pre- and post-training
(Pre, Post1, Post2) BB, MRBD, and PMBR from both sensorimotor cortices) and
behavioural performance measures (tracking performance at T0, T1, T2 and T3)
alone, and a combination of both, and additionally demographic information. The
predictive strength is quantified by the correlation (R) between the actual and
predicted performance, based on LOOCV. A combination of oscillatory beta
measures and behavioural performance estimates best predicted performance
on the repeated sequence (blue ink). RMSE values are averaged and summed
across the 16 subjects. RMSE: Root Mean Square Error. *p<0.05, **p<0.01,
***p<0.001.
6.5 Discussion
By examining the motor learning capacity of well-recovered, chronic stroke
patients and acquiring standard measures of EEG-derived beta power, the
current study reported several key findings:
Predicting individual differences in motor learning after stroke
208
1. Firstly, stroke patients’ ability to learn the continuous tracking task was
preserved, but the overall level of performance achieved with short-term
training was significantly reduced compared to healthy controls.
2. Secondly, no stroke-related alterations were evident in the properties of
beta oscillations, although an effect for MRBD in the direction reported
by previous studies was observed (Rossiter et al., 2014a; Shiner et al.,
2015).
3. Following on from Chapter 5, by implementing a multivariate approach,
the relationship between cortical beta activity and the degree to which
patients in the chronic phase post-stroke learn and retain new motor skills
was explored. Crucially, although behaviour played a strong role, beta
oscillatory activity significantly contributed to the prediction of 81 % of the
variance in tracking performance 24 hours after initial training.
6.5.2 Reduced training-related performance improvements in stroke
patients compared to healthy controls
Reacquisition of motor skills through rehabilitation is paramount to recovery from
motor impairment after stroke and has been proposed to be a form of learning
(Kitago and Krakauer, 2013; Krakauer, 2006). By assessing stroke patients’
capacity to learn a motor skill with their affected hand, and compare their
performance to healthy controls, my results indicate that stroke patients are able
to improve their performance on a trained task. However, despite a preserved
ability to learn, the overall level of performance achieved by patients was
significantly lower compared to the healthy control group, indicating stroke-
related motor learning deficits that result in overall smaller performance gains.
Analysis of stroke patients’ performance did not reveal significant improvements
with initial training. This was most likely due to temporary effects such as fatigue
and boredom depressing performance temporarily at the end of training (see
Figure 6.5A) (Adams, 1961; Brawn et al., 2010; Rickard et al., 2008; Schmidt
and Wrisberg, 2008b), thus resulting in an underestimation of the actual post-
training performance level in patients. Allowing the temporary effects from the
training to dissipate (i.e. rest between training and retest1 session), revealed that
stroke patients actually were able to improve their performance, indicating
Predicting individual differences in motor learning after stroke
209
preserved motor learning capacity after stroke. This pitfall also highlights the
importance of identifying appropriate target behaviour and selecting valid
measures to assess (fairly permanent) gains in performance related to training,
and further justifies my motivation to predict performance at T2 (as opposed to
T1). Crucially, by matching baseline performance, it was possible to directly
compare the training-related changes in performance of stroke patients to healthy
age-matched controls. Hence, my results demonstrate that even though stroke
patients were able to learn on the task, their post-training level of performance
was significantly lower compared to healthy adults, even though offline learning
was similar. As such, stroke patients demonstrated overall smaller performance
gains with short-term motor learning. This suggests that matched performance
does not necessarily imply that both groups have the same ability to improve and
that even though the ability to learn is preserved, it is impaired compared to
healthy controls.
Taken together with the existing studies discussed in Chapter 1 section 1.3.5,
my results support the notion that motor learning is preserved in stroke patients,
most likely due to the distributed nature of the neural network supporting learning
(Doyon and Ungerleider, 2002a; Karni et al., 1995; Sanes and Donoghue, 2000).
However, it is difficult to draw unifying conclusions due to differences in tasks,
duration of practice, effectors, patient characteristics, and outcome measures. In
particular, most studies have used the difference between baseline and post-
training performance as a measure of motor learning, however, this type of
analysis might be conceptually mistaken since normalization, either additive or
multiplicative, can lead to contradictory results (Kitago and Krakauer, 2010).
Thus, as opposed to normalized changes, here the absolute level of performance
was assessed, which allowed to reveal that despite both groups demonstrating
improvements in task performance and similar patterns of change in performance
with rest (e.g. early boost and overnight forgetting), final levels of performance
were significantly different between stroke patients and healthy controls.
It could be argued that inclusion of well-recovered patients with mostly no overt
impairment might compromise the study, however I view this as a strength as it
allowed the investigation of motor learning independent of potentially obscuring
influences of motor impairments. Furthermore, it clearly shows that well-

Predicting individual differences in motor learning after stroke
210
recovered patients with ‘normal’ motor control remain different to healthy adults
in terms of their ability to learn, most likely due to lesion-induced structural and
functional changes in the neural networks supporting motor learning. Since the
present study examined motor learning in chronic stroke patients over a short,
single training session, it is possible that prolonged training (i.e. weeks) could
lead to greater performance improvements. For example, patients might have a
slower rate of improvement (Wadden et al., 2017), but are actually able to achieve
the same level of performance as healthy adults with prolonged training. The
amount or “dose” of practice required for stroke patients to learn is an important
topic in rehabilitation, and it has been shown that the dose required for training-
related neuroplasticity to occur and thus, exert a positive influence on outcome is
fairly high (Lohse et al., 2014). Therefore, it would be interesting in the future to
investigate whether stroke patients can further improve on the motor learning task
given an adequate dose of training or whether they reach a performance plateau
that remains categorically different to healthy adults (Hardwick et al., 2017).
6.5.3 Beta oscillations are unaffected by stroke but altered with motor
learning
In contrast to normal beta oscillations, aberrant beta activity is a signature of
sensorimotor pathology (Brown, 2007; Doyle et al., 2005; Heida et al., 2014;
Heinrichs-Graham et al., 2014; Kühn et al., 2004; Little and Brown, 2014; Rossiter
et al., 2014a; Shiner et al., 2015). Impairment in beta rebound after stroke has
previously been demonstrated with tactile stimulation (Laaksonen et al., 2012).
More recently, MEG studies have also demonstrated stroke-related alterations in
the properties of beta oscillations in the motor system. Specifically, the magnitude
of movement-related beta dynamics was significantly reduced, with these
dynamics also exhibiting a more bilateral pattern in patients compared to healthy
controls (Rossiter et al., 2014a; Shiner et al., 2015). In addition, these studies
revealed that greater motor impairment was associated with lower magnitude
MRBD and PMBR in ipsilesional sensorimotor cortex, suggesting that the
dynamic modulation of beta oscillations may be important for motor control.
Given these findings, rather unexpectedly, the current results did not reveal
significant differences in the magnitude of MRBD and PMBR from both
Predicting individual differences in motor learning after stroke
211
sensorimotor cortices between stroke patients and age-matched healthy controls.
A possible explanation for the lack of stroke-related alterations in beta activity
might be the narrow spectrum of post-stroke impairment in the current patient
group, representing well-recovered patients with mostly no overt functional motor
impairments compared to previous studies of moderate-to-severely impaired
patients. For example, stroke patients in the study by Rossiter and colleagues
presented with an average ARAT score of 45±19 for the contralesional (affected)
hand (maximum score 57) (Rossiter et al., 2014a), while patients in the current
study had a homogeneous score of 56±0.5, and similar motor abilities of the
affected and unaffected upper limb. Given that effective recovery of motor
function is associated with a normalization of brain activity back towards a pattern
seen in healthy controls (Johansen-Berg, 2002; Ward et al., 2003a), it appears
likely that the lack of post-stoke alteration in beta dynamics is due to restitution
of nearly ‘normal’ beta activity in my well-recovered patient cohort.
An alternative explanation might be the rather small sample of well-recovered
patients. Although the study by Shiner and colleagues detected aberrant
movement-related beta activity with as little as 10 chronic stroke patients (Shiner
et al., 2015), this is most likely due to the heterogeneous sample of patients with
a broad spectrum of motor functions. Indeed, closer inspection and post hoc
analyses of beta power revealed that the magnitude of MRBD from contralateral
sensorimotor cortex was significantly reduced in patients compared to healthy
controls, or showed a trend, for two of the three EEG sessions. This suggests
that a larger cohort would have likely yielded a significant effect for MRBD in the
direction reported by previous studies.
Interestingly, my results indicated that stroke patients who reported higher fatigue
severity, exhibited higher beta power across both sensorimotor cortices. Whilst
this effect was mainly driven by one stroke patient, it is an interesting and novel
finding possibly linking beta oscillations and subjective levels of post-stroke
fatigue. In particular, higher beta power in chronic stroke patients might reflect
greater GABAergic inhibition consistent with recent findings of low excitability of
cortical and subcortical inputs that drive motor cortex output with high fatigue
(Kuppuswamy et al., 2015). Given the sparse literature on fatigue and cortical
oscillations, with most studies investigating the effect of mental and physical
Predicting individual differences in motor learning after stroke
212
fatigue, but not chronic, post-stroke fatigue on resting and movement-related beta
activity (Fry et al., 2017; Shigihara et al., 2013; Tecchio et al., 2006), future
studies with a greater number of stroke patients and a broader spectrum of post-
stroke fatigue severity might be worthwhile to provide new perspectives on the
neural mechanisms underlying fatigue and its implications for motor learning after
brain damage. In the context of the current study, post-stroke fatigue besides
lesion location, level of motor impairment, and time since stroke was thus
considered as another source of variability in response to motor learning.
In accordance with previous studies (Rossiter et al., 2014a), no difference in the
overall power of pre-movement (resting) beta activity was observed between
patients and controls or hemispheres. However, while healthy controls
demonstrated a transient post-training increase in beta activity that returned to
pre-training levels on day 2, stroke patients did not show a comparable pattern.
Since the training-related modulation of beta power might be a marker of
temporary suppression of LTP-like plasticity after motor learning, the lack of
modulation observed in stroke patients might represent altered plasticity
processes, potentially explaining the overall reduced ability to learn compared to
the healthy cohort. However, whether this physiological response to training, i.e.
a temporary increase in beta power, is necessary for practice-dependent
plasticity processes to occur, and if absent or reduced, results in reduced motor
learning ability, needs to be further investigated.
6.5.4 Beta oscillations are predictive of tracking performance retention
As discussed in Chapter 1 section 1.4, behavioural, clinical and demographic
measures contribute to predictive models of response to treatment and long-term
outcome after stroke (Hope et al., 2013; Kwakkel et al., 2003; Prabhakaran et al.,
2015; Shelton and Reding, 2001). Incorporating neuroimaging data that reveal
the mechanisms underlying post-stroke plasticity and heterogeneity of motor
recovery and response to rehabilitative training is likely to provide greater insight
into the capacity for reorganization (Burke and Cramer, 2014; Ward, 2017). Thus,
here, the predictive role of EEG-derived beta oscillations for post-stroke motor
learning was explored, using a multivariate approach combining behavioural,
clinical and neurophysiological measures.

Predicting individual differences in motor learning after stroke
213
My findings provide evidence that retention of sequence-specific tracking
performance 24 hours after initial training can be successfully predicted by a
combination of behavioural and beta oscillatory measures. In particular, even
though performance scores had the strongest effect upon post-training
performance levels, incorporating beta oscillatory measures enhanced the ability
to predict stroke patients’ capacity to retain a newly acquired motor skill, such
that a total of 81 % of variance was explained. Even though the type of beta
measure and the direction of the association was different to the healthy subjects
in Chapter 5, this generally supports the idea that estimates of movement-related
beta activity provide a significant contribution to predicting individual differences
in tracking performance not only in healthy, but also clinical population. The ability
to accurately predict patients’ capacity for motor learning is important for
individualised treatment planning and patient stratification of novel treatment
approaches (Stinear, 2010; Ward, 2017).
To date, most studies have investigated the relationship between properties of
cortical beta oscillations and post-stroke motor impairment (Hall et al., 2010b;
Laaksonen et al., 2012; Rossiter et al., 2014a; Shiner et al., 2015; Thibaut et al.,
2017), but to the best of my knowledge, no study has explored the relationship
between beta oscillatory power and post-stroke motor learning capacity. When
controlling for behavioural performance, post-training contralateral (ipsilesional)
PMBR related to performance levels retained 24 hours after training, with patients
who exhibited lower PMBR after training, performing better after a night’s sleep.
Given the link between beta oscillations and GABAergic inhibition (Hall et al.,
2011, 2010a; Jensen et al., 2005; Muthukumaraswamy et al., 2013; Roopun et
al., 2006; Yamawaki et al., 2008), smaller post-training PMBR, reflecting lower
GABAergic inhibition might facilitate cortical plasticity associated with motor
learning and early consolidation, thus resulting in better motor skill retention. This
general interpretation is in line with MRS and PET studies reporting decreases in
GABA levels being associated with better motor recovery after stroke (Blicher et
al., 2015; Kim et al., 2014). Since plasticity is activity dependent, it should be
noted that variability in post-training performance was explained not by resting
beta activity but specifically by event-related (dynamic) changes in beta power,
which are more closely related to motor function. This also demonstrates the
Predicting individual differences in motor learning after stroke
214
importance of using EEG/MEG in order to follow these dynamic changes in
cortical excitatory and inhibitory processes. Thus, EEG-derived measures of beta
oscillations, as markers of net inhibitory and excitatory mechanisms in humans,
might improve our understanding of how motor skills are acquired on an individual
level, beyond information provided by behavioural scores, which are unlikely to
adequately reflect an individual’s potential for cortical reorganisation in response
to motor learning.
Although evidence suggest heightened responsiveness to motor training during
the early post-stroke phase, likely due to increased potential for cortical plasticity
(Cramer, 2008; Krakauer et al., 2012; Murphy and Corbett, 2009; Ward, 2017;
Zeiler and Krakauer, 2013), the current study only included stroke patients in the
chronic phase. This was motivated by practical considerations in their
recruitment. In addition, as the sample size was relatively small with variable
lesion location and time post-stroke, a deeper understanding of the relationship
between cortical beta oscillations and motor learning should be achieved in a
larger patient population including acute stroke patients in order to determine
whether beta oscillatory measures early after stroke can similarly explain
differences in motor learning capacity. Clearly, further work is required to
understand the complex relationship between neuronal activity and motor
learning after stroke, but the present results open new interesting lines of
investigation, in particular for future rehabilitation research that employs
predictive models of motor learning. Specifically, the predictive methodological
approach may not only specify if the individual may respond to training but also
provide an indication of when to best provide rehabilitation.
6.5.5 Conclusion
In conclusion, the current results extend my previous findings on the unique
contribution of beta oscillatory dynamics in explaining individual differences in
motor learning. Specifically, it demonstrates the potential of neurophysiological
measures to enhance prediction of retained tracking performance of a previously
learned motor skill and suggest that beta oscillations may have value as
biomarkers of cortical function and plasticity after stoke.
General discussion
215
General discussion
The brain’s intrinsic potential to react as a highly dynamic system that changes
in response to motor learning and injury is paramount for everyday life activities
and functional recovery after stroke. In this thesis, I have attempted to bridge the
gap between cellular and behavioural accounts of cortical plasticity by
investigating the relationship between cortical beta oscillations, as candidate
biomarkers of net excitatory and inhibitory processes in humans, and individual
differences in the ability to learn and retain new motor skills in both healthy
(Chapter 5) and diseased states (Chapter 6). I have demonstrated that
properties of beta-band activity help to explain individual differences in
performance in both healthy individuals and stroke patients in a way that
behaviour alone could not. These findings built upon the demonstration that the
here employed beta power estimates show high intra-individual reliability over
time, validating the notion that these measures reflect meaningful individual
differences that can be utilized in basic and clinical research (Chapter 4).
Together, the work presented here suggests that measures of beta oscillations
provide useful predictive information about an individual’s motor learning
capacity, beyond information provided by behavioural characteristics.
Since each experimental chapter contains a relatively extensive discussion of the
issues pertinent to that study, in this summary I draw together the main findings
of the experiments, outline the implications of this body of work, and discuss
some limitations and future extensions to the field.
7.1 Key findings
The work presented here is founded upon a large body of physiological,
pharmacological, behavioural and neuroimaging studies proposing a role for
cortical plasticity in motor skill learning and recovery after stroke. Having ventured
into several research fields such as motor learning, neuronal oscillations and
stroke, the experiments presented provide novel findings that advance these
respective fields. The key findings are summarised below.
Given the massive upsurge in the interest in neuronal oscillations, and in
particular rhythmic activity at beta frequencies, due to their potential role as
General discussion
216
neurophysiological marker of motor system function and dysfunction (Nicolo et
al., 2015; Takemi et al., 2015; Ward, 2015; Wu et al., 2015), in Chapter 4, I
established for the first time that, given careful execution of experimental
conditions, movement-related beta dynamics show high intra-individual reliability.
The highly reproducible nature validated the notion that these measures are an
appropriate assay for longitudinal and clinical studies, and was a prerequisite for
the subsequent enquiry.
Based on daily life experience that people show considerable inter-individual
differences in their ability to learn, I then started to explore the neurophysiological
processes underlying these differences, which is of significant clinical importance
for improving long-term rehabilitative outcomes after brain injury (Stinear and
Byblow, 2014; Stinear, 2010; Ward, 2017). In Chapter 5, I firstly demonstrated
that elderly adults show comparable motor learning as their younger
counterparts, supporting the view of preserved motor learning with advancing age
(for review on the debate see (Seidler, 2006; Voelcker-Rehage, 2008)).
Corroborating previous findings (Gaetz et al., 2010; Heinrichs-Graham and
Wilson, 2016; Rossiter et al., 2014b), I further show that elderly subjects exhibited
higher resting beta power and MRBD in both contralateral and ipsilateral
sensorimotor cortex, implying increased GABAergic inhibition, and potentially
reduced cortical plasticity in the elderly. By implementing a multivariate approach
with LOOCV, accounting for multicollinearity between measures and allowing
generalization of results, I then revealed that pre-training movement-related beta
activity explains some of the individual differences in motor learning, but only after
accounting for behaviour. As such, the state of the brain’s sensorimotor cortex
prior to learning, as captured by beta oscillatory activity, might provide useful
predictive information that can be utilized in basic research and clinical studies.
Finally, in Chapter 6, I explored the neurophysiological processes underlying
individual differences in motor learning after stroke. I showed that chronic stroke
patients have a preserved ability for motor learning, although reduced when
compared to healthy controls. Unexpectedly, and contradicting previous findings
(Rossiter et al., 2014a; Shiner et al., 2015), possibly due to various factors such
as sample size and level of impairment, no significant stroke-related alterations
in resting or movement-related beta activity were observed. Multivariate

General discussion
217
modelling, taking into account behavioural, clinical and demographic
characteristics, then revealed that post-training movement-related beta activity
explains some of the variation observed in 24-hour retention of the previously
acquired motor skill in stroke patients.
Together, the findings in Chapter 5 and Chapter 6 indicate that beta oscillations
may have value as biomarkers of cortical function and plasticity in the healthy as
well as lesioned brain. Although further studies with larger cohorts are needed to
establish a robust link between individual differences in motor learning and beta
oscillatory dynamics, the novel findings illustrate the potential value of
incorporating cortical oscillatory measures, reflecting neurophysiological
mechanisms, together with behavioural information to enhance prediction
accuracy.
7.2 Clinical implications for rehabilitation
The reason for wanting to understand the relationship between cortical beta
oscillations and individual differences in motor learning is the desperate clinical
need for improved restorative treatments to maximize outcomes after stroke. As
discussed in Chapter 1, accumulating evidence suggests that NIBS and
pharmacological approaches represent promising treatment strategies to
dramatically improving patients’ outcome (Chollet et al., 2011; Kim et al., 2006;
Zimerman et al., 2012). However, current implementation of plasticity-modifying
interventions in phase III trials lack a clear mechanistic approach and are thus
unlikely to succeed (Ward, 2008). To achieve progress, the biological
mechanisms underlying the observed behaviour need to be understood in
humans. Appropriate biomarkers that bridge the gap between cellular and
behavioural accounts of cortical function and plasticity in both healthy and
diseased states, would help to demonstrate efficacy of therapeutic therapies in
the elderly and stroke patients, improve decision-making about who and when to
treat, and allow individualised treatment planning rather than a ‘one size fits all’
approach. For example, given the discussed post-stroke structural and functional
changes, with evidence for an early critical window of heightened plasticity, the
timing of rehabilitative treatment will clearly have a major effect on patients’
outcome.

General discussion
218
The growing interest in biomarkers that predict patients’ motor recovery and
outcomes has led to the identification of several anatomical and functional
measures that carry predictive potential beyond the early clinical assessment of
motor impairment (Kwakkel et al., 2003; Prabhakaran et al., 2015). For example,
patients with intact TMS-induced MEPs in their affected UL typically experience
better motor recovery. In addition, more extensive lesion-induced corticospinal
tract (CST) damage accounts for worse UL motor recovery (for review see
(Bembenek and Kurczych, 2011; Burke and Cramer, 2014; Stinear, 2010)), while
incorporating information about damage to cortical and subcortical areas involved
in sensorimotor function together with information about CST damage is better
able to predict motor outcome (Rondina et al., 2016). Recent attempts with EEG
demonstrated that greater post-stroke resting functional connectivity in the beta
frequency was associated with better subsequent clinical improvement (Nicolo et
al., 2015; Wu et al., 2015). However, since no single clinical nor
neurophysiological/neuroimaging measure has been able to accurately explain
individual recovery potential, combining these measures might provide greater
insight into the capacity for reorganization and might provide the optimal
approach for prediction of long-term outcomes after stroke.
Approaches incorporating a combination of clinical and/or neurophysiological
and/or neuroimaging measures into predictive models of long-term outcome have
been undertaken (Quinlan et al., 2015; Stinear et al., 2017, 2012), but the
predictive role of neuroimaging measures needs to be further explored.
Notwithstanding, neuroimaging/neurophysiological measures might have an
ascending role in individualised treatment planning and clinical decision making.
In that regard, EEG that can be rapidly performed at the bedside is a promising
tool for the identification of widely available and cost-effective biomarkers that
advance our understanding of cortical function in health and disease.
7.3 Methodological considerations and future directions
As I demonstrated in Chapter 5 and Chapter 6, EEG-derived oscillatory
measures hold the potential to extend the insights offered by animal and
pharmacological studies of the mechanisms contributing to learning and post-
stroke recovery. Importantly, by designing a motor learning task that optimally
General discussion
219
promotes learning in healthy and clinical populations as outlined in Chapter 3,
and ensuring that the employed EEG-derived beta oscillatory measures are
highly reliable within individuals as shown in Chapter 4, it was possible to
demonstrate a link between beta oscillatory dynamics and individual differences
in motor learning. However, further studies are clearly needed to establish the
robustness and generalizability of these findings, with the aim of translating them
into the clinical setting.
In particular, the work presented here focused on stroke patients in the chronic
phase post stroke with well-recovered motor functions. The emphasis on chronic
stroke was motivated by practical considerations in their recruitment as well as
their relatively stable levels of motor function, which allows attributing changes in
performance to the experimental training. However, given heightened
responsiveness to training during the critical period early after stroke (Biernaskie
et al., 2004; Zeiler and Krakauer, 2013), future studies in acute stroke patients
with a broad spectrum of motor impairments are needed to further shed light upon
the mechanisms underlying early spontaneous biological recovery, and how to
better take advantage of or augment this window of opportunity to maximise
therapeutic effects. Along these lines, longitudinal studies should investigate the
evolution of oscillatory measures, including event-related dynamics, associated
with recovery from stroke with and without rehabilitative interventions. Further,
some pharmacological agents are known to have an impact on both GABAergic
inhibition and properties of beta oscillations (Baker and Baker, 2003b; Hall et al.,
2011; Jensen et al., 2005; Muthukumaraswamy et al., 2010). Future studies
should thus manipulate the balance between excitatory and inhibitory
mechanisms in order evaluate the concurrent changes in beta oscillatory
dynamics and motor learning behaviour, thus strengthening the here identified
association between both.
Since rehabilitation interventions are based on motor learning principles, the
choice and accuracy of metrics to examine different features of movement
behaviour and learning is important. As highlighted in Chapter 6, rather than
using normalized performance (e.g. relative to baseline) which might be
conceptually fraught (Kitago and Krakauer, 2010), the current work assessed
learning based on absolute performance levels at two different time points. While

General discussion
220
inaccurate deduction of learning caused by inadequate metric selection, might for
example suggest a failure of training, when in fact poor choice of outcome
measures rather than a lack of efficacy of training is the problem, it highlights the
pitfall associated with the diversity of analytical approaches employed in the field
of motor learning. Currently there are no standard procedures regarding the
choice of outcome measures (Huang and Krakauer, 2009), which makes
comparisons between motor learning studies difficult. As such, in order to
advance our understanding of motor learning in humans, and its underlying
processes, a unified approach needs to be developed in the future.
7.4 Concluding remarks
The picture that this thesis paints is one of a complex relationship between the
brain and behaviour, with a potential role of EEG-derived cortical oscillations for
motor learning in the healthy and diseased brain. My research and that of others
suggests promising routes to a better understanding of the biological
mechanisms underlying motor learning and recovery from stroke, with important
translational value. Although all the work reported here is based on a laboratory-
based motor learning task, my hope is that future work incorporating various
sources of information about the neurophysiological mechanisms by which the
human brain supports learning of different motor aspects will lead to clinical
advances in how rehabilitative treatments for stroke are delivered, helping stroke
survivors in their daily struggle to regain lost motor functions.
Even though spontaneous brain activity emerges without an external force, for a brain
to be useful it should adapt to the outside world.
György Buzsaki in Rhythms of the brain, 2006

Appendix
221
Appendix
Edinburgh Handedness Inventory
Handedness
Which hand do you use for the following activities? Do you ever use the other hand?
Which hand do you use when? Left
No pref Right
Do you ever use the other hand
1 Writing
2 Drawing
3 Throwing
4 Using scissors
5 Using toothbrush
6 Using knife (without fork)
7 Using spoon
8 Using broom (upper hand)
9 Striking match
10 Opening box (holding lid)
11 Holding a computer mouse
12 Using a key to unlock a door
13 Holding a hammer
14 Holding a brush or comb
15 Holding a cup while drinking
Mark Cohen, 2008 adapted from Oldfield (1971). Neuropsychologia.
Subject DOB:_________________
Date:________________________
Experimenter:_________________

Appendix
222
Fatigue Severity Scale (FSS)
Please read each statement below and rate your agreement or disagreement with
the statements using numbers between 1 and 7 based on how you felt in the last
one week. A low value (e.g. 1) indicates strong disagreement and a high value
(e.g. 7) indicates strong agreement.
1. I am easily fatigues.
2. Fatigue causes frequent problems for me.
3. My fatigue prevents sustained physical functioning.
4. Fatigue interferes with carrying out certain duties and responsibilities.
5. Fatigue is among my three most disabling symptoms.
6. Fatigue interferes with my work, family or social life.
Neurological Fatigue Index (NFI)
For each statement please state if you 1. strongly disagree, 2. disagree, 3. agree,
4. strongly agree based on how you have been feeling in the past two weeks.
1. I can become tired easily.
2. Sometimes I lose my body strength.
3. My limbs can become very heavy.
4. My body can’t keep up with what I want to do.
5. The longer I do something the more difficult it becomes.
6. Sometimes I have no option but to simply stop what I have been doing.
7. I usually get tired on most days.
8. I can become weak even if I am not doing anything.
9. Sometimes I really have to concentrate on what are usually simple things.
10. I have problems with my speech when I am tired.
11. My coordination gets worse as the day goes on
12. Mental effort really takes it out on me

Appendix
223
St Mary’s sleep questionnaire
This questionnaire refers to your sleep over the past 24 hours.
1. At what time did you settle down for the night?
2. At what time did you fall asleep last night?
3. At what time did you finally wake this morning?
4. At what time did you get up this morning?
5. Was your sleep:
- Very light
- Light
- Fairly light
- Light average
- Deep average
- Fairly deep
- Deep
- Very deep
6. How many times did you wake up?
7. How much sleep did you have last night?
8. How much sleep did you have during the day, yesterday?
9. How well did you sleep last night?
- Very badly
- Badly
- Fairly badly
- Fairly well
- Well
- Very well

Appendix
224
References
225
References
Adams, J.A., 1961. The second facet of forgetting: a review of warmup decrement. Psychol. Bull. 58, 257–273.
Ahlfors, S.P., Han, J., Belliveau, J.W., Hämäläinen, M.S., 2010. Sensitivity of MEG and EEG to source orientation. Brain Topogr. 23, 227–232.
Albouy, G., Ruby, P., Phillips, C., Luxen, A., Peigneux, P., Maquet, P., 2006. Implicit oculomotor sequence learning in humans: Time course of offline processing. Brain Res. 1090, 163–171.
Alegre, M., Labarga, A., Gurtubay, I.G., Iriarte, J., Malanda, A., Artieda, J., 2002. Beta electroencephalograph changes during passive movements: Sensory afferences contribute to beta event-related desynchronization in humans. Neurosci. Lett. 331, 29–32.
Alia, C., Spalletti, C., Lai, S., Panarese, A., Micera, S., Caleo, M., 2016. Reducing GABAA-mediated inhibition improves forelimb motor function after focal cortical stroke in mice. Sci. Rep. 6, 37823.
Al-Sharman, A., Siengsukon, C., 2014. Time rather than sleep appears to enhance off-line learning and transfer of learning of an implicit continuous task. Nat. Sci. Sleep 6, 27–36.
Antal, A., Nitsche, M.A., Kincses, T.Z., Kruse, W., Hoffmann, K.P., Paulus, W., 2004. Facilitation of visuo-motor learning by transcranial direct current stimulation of the motor and extrastriate visual areas in humans. Eur. J. Neurosci. 19, 2888–2892.
Ao, D., Song, R., Tong, K.Y., 2015. Sensorimotor control of tracking movements at various speeds for stroke patients as well as age-matched and young healthy subjects. PLoS One 10, 1–15.
Aono, K., Miyashita, S., Fujiwara, Y., Kodama, M., 2013. Relationship between Event-related Desynchronization and Cortical Excitability in Healthy Subjects and Stroke Patients. Tokai J. Exp. Clin. Med. 38, 123–128.
Arlot, S., Celisse, A., 2010. A survey of cross-validation procedures for model selection. Stat. Surv. 4, 40–79.
Aronson, J.K., Ferner, R.E., 2017. Biomarkers - a general review. Curr. Protoc. Pharmacol. 76, 9.23.1–9.23.17.
Arthur, W.J., Day, E.A., Villado, A.J., Boatman, P.R., Kowollik, V., Bennett, W.J., Bhupatkar, A., 2010. The Effect of Distributed Practice on Immediate Posttraining, and Long-Term Performance on a Complex Command-and-Control Simulation Task. Hum. Perform. 23, 428–445.
Babiloni, C., Babiloni, F., Carducci, F., Cincotti, F., Cocozza, G., Del Percio, C., Moretti, D. V., Rossini, P.M., 2002. Human cortical electroencephalography (EEG) rhythms during the observation of simple aimless movements: A high-resolution EEG study. Neuroimage 17, 559–572.

References
226
Baker, M.R., Baker, S.N., 2003a. The effect of diazepam on motor cortical oscillations and corticomuscular coherence studied in man. J. Physiol. 546, 931–942.
Baker, M.R., Baker, S.N., 2003b. The effect of diazepam on motor cortical oscillations and corticomuscular coherence studied in man. J. Physiol. 546, 931–942.
Baker, S.N., Kilner, J.M., Pinches, R.N., Lemon, E.M., 1999. The role of synchrony and oscillations in the motor output. Exp. Brain Res. 128, 109–117.
Baker, S.N., Olivier, E., Lemon, R.N., 1997. Coherent oscillations in monkey motor cortex and hand muscle EMG show task-dependent modulation. J. Physiol. 501, 225–241.
Barakat, M., Carrier, J., Debas, K., Lungu, O., Fogel, S., Vandewalle, G., Hoge, R.D., Bellec, P., Karni, A., Ungerleider, L.G., Benali, H., Doyon, J., 2013. Sleep spindles predict neural and behavioral changes in motor sequence consolidation. Hum. Brain Mapp. 34, 2918–2928.
Barbay, S., Plautz, E.J., Friel, K.M., Frost, S.B., Dancause, N., Stowe, M., Nudo, R.J., 2009. Behavioral and neurophysiological effects of delayed training following a small ischemic infarct in primary motor cortex of squirrel monkeys. Brain 169, 106–116.
Bavelier, D., Levi, D.M., Li, R.W., Dan, Y., Hensch, T.K., 2010. Removing brakes on adult brain plasticity: from molecular to behavioural interventions. J. Neurosci. 30, 14964–14971.
Bembenek, J., Kurczych, K., 2011. The prognostic value of motor-evoked potentials in motor recovery and functional outcome after stroke− a systematic review of the literature. Funct Neurol. 27, 79–84.
Benali, A., Weiler, E., Benali, Y., Dinse, H.R., Eysel, U.T., 2008. Excitation and inhibition jointly regulate cortical reorganization in adult rats. J. Neurosci. 28, 12284–12293.
Berger, H., 1929. Uber das elektroenkephalogramm des Menschen. Arch. Psychiatr. Nervenkr. 87, 527–570.
Berker, A.O. de, Bikson, M., Bestmann, S., 2013. Predicting the behavioral impact of transcranial direct current stimulation: issues and limitations. Front. Hum. Neurosci. 7.
Biernaskie, J., Chernenko, G., Corbett, D., 2004. Efficacy of rehabilitative experience declines with time after focal ischemic brain injury. J. Neurosci. 24, 1245–1254.
Blicher, J.U., Near, J., Næss-Schmidt, E., Stagg, C.J., Johansen-Berg, H., Nielsen, J.F., Østergaard, L., Ho, Y.-C.L., 2015. GABA Levels Are Decreased After Stroke and GABA Changes During Rehabilitation Correlate With Motor Improvement. Neurorehabil. Neural Repair 29, 278–86.
Blicher, J.U., Stagg, C.J., O’Shea, J., Østergaard, L., MacIntosh, B.J.,

References
227
Johansen-Berg, H., Jezzard, P., Donahue, M.J., 2012. Visualization of altered neurovascular coupling in chronic stroke patients using multimodal functional MRI. J. Cereb. blood flow Metab. 32, 2044–2054.
Bliss, T.V.P., Lomo, T., 1973. Long-lasting potentiation of synaptic transmission in the dentate area of the anaesthetized rabbit following stimulation of the perforant path. J. Physiol. 232, 331–356.
Bonaiuto, J.J., Bestmann, S., 2015. Understanding the nonlinear physiological and behavioral effects of tDCS through computational neurostimulation, in: Progress in Brain Research. pp. 75–103.
Boonstra, T.W., Daffertshofer, A., Breakspear, M., Beek, P.J., 2007. Multivariate time-frequency analysis of electromagnetic brain activity during bimanual motor learning. Neuroimage 36, 370–377.
Boudrias, M.H., Gonçalves, C.S., Penny, W.D., Park, C. hyun, Rossiter, H.E., Talelli, P., Ward, N.S., 2012. Age-related changes in causal interactions between cortical motor regions during hand grip. Neuroimage 59, 3398–3405.
Boyd, L. a, Winstein, C.J., 2004. Cerebellar stroke impairs temporal but not spatial accuracy during implicit motor learning. Neurorehabil. Neural Repair 18, 134–43.
Boyd, L.A., Vidoni, E.D., Siengsukon, C., 2008. Multidimensional motor sequence learning is impaired in older but not younger or middle-aged adults. Phys. Ther. 88, 351–62.
Boyd, L.A., Winstein, C.J., 2006. Explicit Information Interferes with Implicit Motor Learning of Both Continuous and Discrete Movement Tasks After Stroke. J. Neurol. Phys. Ther. 30, 10–12.
Boyd, L.A., Winstein, C.J., 2004. Providing explicit information disrupts implicit motor learning after basal ganglia stroke. Learn. Mem. 11, 388–96.
Boyd, L.A., Winstein, C.J., 2001. Implicit motor-sequence learning in humans following unilateral stroke : the impact of practice and explicit knowledge. Neurosci. Lett. 298, 65–69.
Brashers-Krug, T., Shadmehr, R., Bizzi, E., 1996. Consolidation in human motor memory. Nature 382, 252–255.
Brawn, T.P., Fenn, K.M., Nusbaum, H.C., Margoliash, D., 2010. Consolidating the Effects of Waking and Sleep on Motor-Sequence Learning. J. Neurosci. 30, 13977–13982.
Brown, P., 2007. Abnormal oscillatory synchronisation in the motor system leads to impaired movement. Curr. Opin. Neurobiol. 17, 656–64.
Brown, P., Marsden, C.D., 1999. Bradykinesia and impairment of EEG desynchronization in Parkinson’s disease. Mov. Disord. 14, 423–429.
Brown, R.M., Robertson, E.M., Press, D.Z., 2009. Sequence skill acquisition and off-line learning in normal aging. PLoS One 4, 1–5.
Buetefisch, C.M., Davis, B.C., Wise, S.P., Sawaki, L., Kopylev, L., Classen, J.,
References
228
Bu, C.M., Cohen, L.G., 2000. Mechanisms of use-dependent plasticity in the human motor cortex. PNAS 97, 3661–3665.
Burgess, A., Gruzelier, J., 1993. Individual reliability of amplitude distribution in topographical mapping of EEG. Electroencephalogr. Clin. Neurophysiol. 86, 219–223.
Burke, E., Cramer, S.C., 2014. Biomarkers and predictors of restorative therapy effects after stroke. Curr. Neurol. Neurosci. Rep. 13, 1–14.
Burridge, J.H., Turk, R., Notley, S. V, Pickering, R.M., Simpson, D.M., 2009. The relationship between upper limb activity and impairment in post-stroke hemiplegia. Disabil. Rehabil. 31, 109–17.
Butefisch, C.M., 2004. Enhancing Encoding of a Motor Memory in the Primary Motor Cortex By Cortical Stimulation. J. Neurophysiol. 91, 2110–2116.
Buxton, R.B., Frank, L.R., 1997. A model for the coupling between cerebral blood flow and oxygen metabolism during neural stimulation. J. Cereb. Blood Flow Metab. 17, 64–72.
Buzsaki, G., 2006. Rhythms of the brain. Oxford University Press, Oxford.
Buzsáki, G., Anastassiou, C., Koch, C., 2012. The origin of extracellular fields and currents - EEG, ECoG, LFP and spikes. Nat. Rev. Neurosci. 13, 407–20.
Buzsáki, G., Draguhn, A., 2004. Neuronal oscillations in cortical networks. Science (80-. ). 304, 1926–9.
Cantarero, G., Tang, B., O’Malley, R., Salas, R., Celnik, P., 2013. Motor Learning Interference Is Proportional to Occlusion of LTP-Like Plasticity. J. Neurosci. 33, 4634–4641.
Carey, L.M., Abbott, D.F., Egan, G.F., O’Keefe, G.J., Jackson, G.D., Bernhardt, J., Donnan, G.A., 2006. Evolution of Brain Activation with Good and Poor Motor Recovery after Stroke. Neurorehabil. Neural Repair 20, 24–41.
Carlini, A., French, R., 2014. Visual tracking combined with hand-tracking improves time perception of moving stimuli. Sci. Rep. 4, 1–6.
Carmichael, S.T., 2012. Brain excitability in stroke: the yin and yang of stroke progression. Arch. Neurol. 69, 161–167.
Cassim, F., Monaca, C., Szurhaj, W., J-L, B., L, D., P, D., J-D, G., 2001. Does post-movement beta synchronization reflect an idling motor cortex? Neuroreport 17, 3859–3863.
Cassim, F., Szurhaj, W., Sediri, H., Devos, D., Bourriez, J.L., Poirot, I., Derambure, P., Defebvre, L., Guieu, J.D., 2000. Brief and sustained movements: Differences in event-related (de)synchronization (ERD/ERS) patterns. Clin. Neurophysiol. 111, 2032–2039.
Castro-Alamancos, M. a, Donoghue, J.P., Connors, B.W., 1995. Different forms of synaptic plasticity in somatosensory and motor areas of the neocortex. J. Neurosci. 15, 5324–5333.
References
229
Chambaron, S., Ginhac, D., Ferrel-Chapus, C., Perruchet, P., 2006. Implicit learning of a repeated segment in continuous tracking: a reappraisal. Q. J. Exp. Psychol. (Hove). 59, 845–54.
Chen, J.L., Lin, W.C., Cha, J.W., So, P.T., Kubota, Y., Nedivi, W., 2011. Structural basis for the role of inhibition in facilitating adult brain plasticity. Nat. Neurosci. 14, 587–594.
Chen, R., Yaseen, Z., Hallett, M., 1998. Time Course of Corticospinal Excitability in Reaction Time and Self-Paced Movements. Annu. Neurol. 44, 317–325.
Chollet, F., 2013. Pharmacologic approaches to cerebral aging and neuroplasticity: insights from the stroke model. Dialogues Clin. Neurosci. 15, 67–76.
Chollet, F., DiPiero, V., Wise, R.J., Brooks, D.J., Dolan, R.J., Frackowiak, R.S., 1991. The functional anatomy of motor recovery after stroke in humans: a study with positron emission tomography. Ann. Neurol. 29, 63–71.
Chollet, F., Tardy, J., Albucher, J.-F., Thalamas, C., Berard, E., Lamy, C., Bejot, Y., Deltour, S., Jaillard, A., Niclot, P., Guillon, B., Moulin, T., Marque, P., Pariente, J., Arnaud, C., Loubinoux, I., 2011. Fluoxetine for motor recovery after acute ischaemic stroke (FLAME): a randomised placebo-controlled trial. Lancet. Neurol. 10, 123–130.
Clarkson, A.N., Huang, B.S., Macisaac, S.E., Mody, I., Carmichael, S.T., 2010. Reducing excessive GABA-mediated tonic inhibition promotes functional recovery after stroke. Nature 468, 305–309.
Clarkson, A.N., Overman, J.J., Zhong, S., Mueller, R., Lynch, G., Carmichael, S.T., 2011. Repair AMPA Receptor-Induced Local Brain-Derived Neurotrophic Factor Signaling Mediates Motor Recovery after Stroke. J. Neurosci. 31, 3766–3775.
Cohen, D., 1972. Magnetoencephalography: detection of the brain’s electrical activity with a superconducting magnetometer. Science 11, 664–666.
Cohen, D., Cuffin, B.N., 1991. EEG versus MEG localization accuracy: Theory and experiment. Brain Topogr. 4, 95–103.
Cohen, X.M., 2014. Analyzing Neural Time Series Data., MIT Press.
Corsi-Cabrera, M., Galindo-Vilchis, L., Del-Rio-Portilla, Y., Arce, C., Ramos-Loyo, J., 2007. Within-subject reliability and inter-session stability of EEG power and coherent activity in women evaluated monthly over nine months. Clin. Neurophysiol. 118, 9–21.
Cramer, S.C., 2008. Repairing the human brain after stroke: I. Mechanisms of spontaneous recovery. Ann. Neurol. 63, 272–287.
Cramer, S.C., Chopp, M., 2000. Recovery recapitulates ontogeny. Trends Neurosci. 23, 265–271.
Crowell, A.L., Ryapolova-Webb, E.S., Ostrem, J.L., Galifianakis, N.B., Shimamoto, S., Lim, D.A., Starr, P.A., 2012. Oscillations in sensorimotor

References
230
cortex in movement disorders: An electrocorticography study. Brain 135, 615–630.
Currà, A., Modugno, N., Inghilleri, M., Manfredi, M., Hallett, M., Berardelli, A., 2002. Transcranial magnetic stimulation techniques in clinical investigation. Neurology 59, 1851–1859.
Dail, T.K., Christina, R.W., 2004. Distribution of practice and metacognition in learning and long-term retention of a discrete motor task. Res. Q. Exerc. Sport 75, 148–155.
Daubechies, I., 1992. Ten Lectures on Wavelets (CBMS-NSF Regional Conference Series in Applied Mathematics), Society for Industrial and Applied Mathematics SIAM.
David, O., Kilner, J.M., Friston, K.J., 2006. Mechanisms of evoked and induced responses in MEG/EEG. Neuroimage 31, 1580–1591.
Dayan, E., Cohen, L.G., 2011. Neuroplasticity subserving motor skill learning. Neuron 72, 443–454.
Di Pino, G., Pellegrino, G., Assenza, G., Capone, F., Ferreri, F., Formica, D., Ranieri, F., Tombini, M., Ziemann, U., Rothwell, J.C., Di Lazzaro, V., 2014. Modulation of brain plasticity in stroke: a novel model for neurorehabilitation. Nat. Rev. Neurol. 10, 597–608.
Diekelmann, S., Born, J., 2010. The memory function of sleep. Nat. Rev. Neurosci. 11, 114–126.
Donner, T.H., Siegel, M., 2011. A framework for local cortical oscillation patterns. Trends Cogn. Sci. 15, 191-199.
Dovern, A., Fink, G.R., Timpert, D.C., Saliger, J., Karbe, H., Weiss, P.H., Koch, I., 2016. Timing Matters? Learning of Complex Spatiotemporal Sequences in Left-hemisphere Stroke Patients. J. Cogn. Neurosci. 28, 223–236.
Doyle, L.M.F., Kühn, A.A., Hariz, M., Kupsch, A., Schneider, G.H., Brown, P., 2005. Levodopa-induced modulation of subthalamic beta oscillations during self-paced movements in patients with Parkinson’s disease. Eur. J. Neurosci. 21, 1403–1412.
Doyon, J., Benali, H., 2005. Reorganization and plasticity in the adult brain during learning of motor skills. Curr. Opin. Neurobiol. 15, 161–167.
Doyon, J., Penhune, V.B., Ungerleider, L.G., 2003. Distinct contributions of the cortico-striatal and cortico-cerebellar systems to motor skill learning. . Neuropsychologia 41, 252–262.
Doyon, J., Ungerleider, L., 2002a. Functional anatomy of motor skill learning. Neuropsychology of Memory, Guilford Press, New York.
Doyon, J., Ungerleider, L.G., 2002b. Functional anatomy of motor skill learning. Neuropsychology of Memory, Guilford Press, New York.
Draganski, B., Gaser, C., Busch, V., Schuierer, G., Bogdahn, U., May, A., 2004. Neuroplasticity: Changes in grey matter induced by training. Nature 427, 311–312.
References
231
Dyke, K., Pépés, S.E., Chen, C., Kim, S., Sigurdsson, H.P., Draper, A., Husain, M., Nachev, P., Gowland, P.A., Morris, P.G., Jackson, S.R., 2017. Comparing GABA-dependent physiological measures of inhibition with proton magnetic resonance spectroscopy measurement of GABA using ultra-high-field MRI. Neuroimage 152, 360–370.
Ebbinghaus, H., 1885. Uber das Gedachtnis. New York, NY: Dover.
Ehsani, F., Abdollahi, I., Bandpei, M.A.M., Zahiri, N., Jaberzadeh, S., 2015. Motor learning and movement performance: Older versus younger adults. Basic Clin. Neurosci. 6, 231–238.
Ellis, B.W., Johns, M.W., Lancaster, R., Raptopoulos, P., Angelopoulos, N., Priest, R.G., 1981. The St . Mary ’ s Hospital Sleep Questionnaire : A Study of Reliability. Sleep 4, 93–97.
Engel, A.K., Fries, P., 2010. Beta-band oscillations - signalling the status quo? Curr. Opin. Neurobiol. 20, 156–165.
Erbil, N., Ungan, P., 2007. Changes in the alpha and beta amplitudes of the central EEG during the onset, continuation, and offset of long-duration repetitive hand movements. Brain Res. 1169, 44–56.
Espenhahn, S., de Berker, A.O., Van Wijk, B.C.M., Rossiter, H.E., Ward, N.S., 2016. Movement-related beta oscillations show high intra-individual reliability. Neuroimage 147, 175–185.
Fathi, D., Ueki, Y., Mima, T., Koganemaru, S., Nagamine, T., Tawfik, A., Fukuyama, H., 2010. Effects of aging on the human motor cortical plasticity studied by paired associative stimulation. Clin. Neurophysiol. 121, 90–93.
Feigin, V.L. et al., 2016. Update on the Global Burden of ischaemic and haemorrhagic stroke in 1990-2013: The GBD 2013 study. Neuroepidemiology 45, 161–176.
Feigin, V.L., Forouzanfar, M.H., Krishnamurthi, R., Mensah, G.A., Bennett, D.A., Moran, A.E., Sacco, R.L., Anderson, L., Donnell, M.O., Venketasubramanian, N., Barker-collo, S., Lawes, C.M.M., Wang, W., Shinohara, Y., Witt, E., Ezzati, M., 2014. Global and regional burden of stroke during 1990-2010: findings from the Global Burden of Disease Study 2010. Lancet 383, 245–254.
Field, A., 2013. Discovering Statistics using IBM SPSS Statistics. Discov. Stat. using IBM SPSS Stat. 297–321.
Fischer, S., Hallschmid, M., Elsner, A.L., Born, J., 2002. Sleep forms memory for finger skills. PNAS 99, 11987–11991.
Fitts, P.M., 1954. The Information Capacity of the Human Motor System in Controlling the Amplitude of Movement. J. Exp. Psychol. 121, 262–269.
Fjell, A.M., Westlye, L.T., Grydeland, H., Amlien, I., Espeseth, T., Reinvang, I., Raz, N., Dale, A.M., Walhovd, K.B., 2014. Accelerating cortical thinning: Unique to dementia or universal in aging? Cereb. Cortex 24, 919–934. d
Flash, T., Hogan, N., 1985. The Coordination of Arm Movements: An
References
232
experimentally confirmed Mathematical Model. J. Neurosci. 5, 1688–1703.
Floyer-Lea, A., 2005. Distinguishable Brain Activation Networks for Short- and Long-Term Motor Skill Learning. J. Neurophysiol. 94, 512–518.
Floyer-Lea, A., Matthews, P.M., 2005. Distinguishable Brain Activation Networks for Short- and Long-Term Motor Skill Learning. J. Neurophysiol. 94, 512–518.
Floyer-Lea, A., Wylezinska, M., Kincses, T., Matthews, P.M., 2006. Rapid modulation of GABA concentration in human sensorimotor cortex during motor learning. J. Neurophysiol. 95, 1639–1644.
Fogel, S., Vien, C., Karni, A., Benali, H., Carrier, J., Doyon, J., 2017. Sleep spindles: a physiological marker of age-related changes in gray matter in brain regions supporting motor skill memory consolidation. Neurobiol. Aging 49, 154–164.
Frensch, P. a, Miner, C.S., 1994. Effects of presentation rate and individual differences in short-term memory capacity on an indirect measure of serial learning. Mem. Cognit. 22, 95–110.
Fridman, E. a, Hanakawa, T., Chung, M., Hummel, F., Leiguarda, R.C., Cohen, L.G., 2004. Reorganization of the human ipsilesional premotor cortex after stroke. Brain 127, 747–58.
Friedrich, E.V.C., Scherer, R., Neuper, C., 2013. Stability of event-related (de-) synchronization during brain-computer interface-relevant mental tasks. Clin. Neurophysiol. 124, 61–9.
Fry, A., Mullinger, K.J., O’Neill, G.C., Brookes, M.J., Folland, J.P., 2017. The effect of physical fatigue on oscillatory dynamics of the sensorimotor cortex. Acta Physiol. 220, 370–381.
Gabor, D., 1946. Theory of communication. J. Inst. Electr. Eng.
Gaetz, W., Cheyne, D., 2006. Localization of sensorimotor cortical rhythms induced by tactile stimulation using spatially filtered MEG. Neuroimage 30, 899–908.
Gaetz, W., Edgar, J.C., Wang, D.J., Roberts, T.P.L., 2011. Relating MEG measured motor cortical oscillations to resting γ-aminobutyric acid (GABA) concentration. Neuroimage 55, 616–21.
Gaetz, W., MacDonald, M., Cheyne, D., Snead, O.C., 2010. Neuromagnetic imaging of movement-related cortical oscillations in children and adults: Age predicts post-movement beta rebound. Neuroimage 51, 792–807.
Gilbertson, T., Lalo, E., Doyle, L., Di Lazzaro, V., Cioni, B., Brown, P., 2005a. Existing motor state is favored at the expense of new movement during 13-35 Hz oscillatory synchrony in the human corticospinal system. J. Neurosci. 25, 7771–9.
Gilbertson, T., Lalo, E., Doyle, L., Di Lazzaro, V., Cioni, B., Brown, P., 2005b. Existing motor state is favored at the expense of new movement during 13-35 Hz oscillatory synchrony in the human corticospinal system. J. Neurosci.

References
233
25, 7771–9.
Golenia, L., Schoemaker, M.M., Mouton, L.J., Bongers, R.M., 2014. Individual differences in learning a novel discrete motor task. PLoS One 9.
Grafton, S.T., Hazeltine, E., Ivry, R.B., 2002. Motor sequence learning with the nondominant left hand: A PET functional imaging study. Exp. Brain Res. 146, 369–378.
Grafton, S.T., Mazziota, J.C., Presty, S., Friston, K., Frackowiak, R.S.J., Phelps, M.E., 1992. Functional Anatomy of Human Procedural Learning Determined with Regional Cerebral Blood Flow and PET. J. Neurosci. 12, 2542–2548.
Graziadio, S., Tomasevic, L., Assenza, G., Tecchio, F., Eyre, J.A., 2012. The myth of the “unaffected” side after unilateral stroke: Is reorganisation of the non-infarcted corticospinal system to re-establish balance the price for recovery? Exp. Neurol. 238, 168–175.
Gross, J., Baillet, S., Barnes, G.R., Henson, R.N., Hillebrand, A., Jensen, O., Jerbi, K., Litvak, V., Maess, B., Oostenveld, R., Parkkonen, L., Taylor, J.R., van Wassenhove, V., Wibral, M., Schoffelen, J.M., 2013. Good practice for conducting and reporting MEG research. Neuroimage 65, 349-363.
Gross, J., Pollok, B., Dirks, M., Timmermann, L., Butz, M., Schnitzler, A., 2005. Task-dependent oscillations during unimanual and bimanual movements in the human primary motor cortex and SMA studied with magnetoencephalography. Neuroimage 26, 91–8.
Guadagno, J. V., Warburton, E.A., Jones, P.S., Day, D.J., Aigbirhio, F.I., Fryer, T.D., Harding, S., Price, C.J., Green, H.A., Barret, O., Gillard, J.H., Baron, J.C., 2006. How affected is oxygen metabolism in DWI lesions? A combined acute stroke PET-MR study. Neurology 67, 824–829.
Guadagnoli, M.A., Lee, T.D., 2004. Challenge Point: A Framework for Conceptualizing the Effects of Various Practice Conditions in Motor Learning. J. Mot. Behav. 36, 212–224.
Guerra, A., Pogosyan, A., Nowak, M., Tan, H.-R.M., Ferreri, F., Di Lazzaro, V., Brown, P., 2016. Phase Dependency of the Human Primary Motor Cortex and Cholinergic Inhibition Cancelation During Beta tACS. Cereb. cortex 1–15.
Hagemann, G., Redecker, C., Neumann-haefelin, T., Freund, H., Witte, O.W., 1998. Increased Long-Term Potentiation in the Surround of Experimentally Induced Focal -Cortical Infarction. Annu. Neurol. 44, 255–258.
Hall, S.D., Barnes, G.R., Furlong, P.L., Seri, S., Hillebrand, A., 2010a. Neuronal network pharmacodynamics of GABAergic modulation in the human cortex determined using pharmaco-magnetoencephalography. Hum. Brain Mapp. 31, 581–594.
Hall, S.D., Prokic, E.J., McAllister, C.J., Ronnqvist, K.C., Williams, a C., Yamawaki, N., Witton, C., Woodhall, G.L., Stanford, I.M., 2014. GABA-mediated changes in inter-hemispheric beta frequency activity in early-
References
234
stage Parkinson’s disease. Neuroscience 281C, 68–76.
Hall, S.D., Stanford, I.M., Yamawaki, N., McAllister, C.J., Rönnqvist, K.C., Woodhall, G.L., Furlong, P.L., 2011. The role of GABAergic modulation in motor function related neuronal network activity. Neuroimage 56, 1506–1510.
Hall, S.D., Yamawaki, N., Fisher, A.E., Clauss, R.P., Woodhall, G.L., Stanford, I.M., 2010b. GABA(A) alpha-1 subunit mediated desynchronization of elevated low frequency oscillations alleviates specific dysfunction in stroke--a case report. Clin. Neurophysiol. 121, 549–555.
Halsband, U., Lange, R.K., 2006. Motor learning in man: a review of functional and clinical studies. J. Physiol. Paris 99, 414–24.
Hamalainen, M., Hari, R., Ilmoniemi, R.J., Knuutila, J., Lounasmaa, O. V, 1993. Magnetoencephalography - theory, instrumentation, and applications to noninvasive studies of the working human brain. Rev. Mod. Phys. 65, 413–497.
Hardwick, R.M., Rajan, V.A., Bastian, A.J., Krakauer, J.W., Celnik, P.A., 2017. Motor Learning in Stroke. Neurorehabil. Neural Repair 31, 178–189.
Harrington, D.L., Haaland, K.Y., 1992. Skill learning in the elderly: diminished implicit and explicit memory for a motor sequence. Psychol. Aging 7, 425–434.
Hebb, D.O., 1949. The Organization of Behavior. Wiley, New York.
Heida, T., Poppe, N.R., de Vos, C.C., van Putten, M.J. a M., van Vugt, J.P.P., 2014. Event-related mu-rhythm desynchronization during movement observation is impaired in Parkinson’s disease. Clin. Neurophysiol. 125, 1819–1825.
Heinrichs-Graham, E., Wilson, T.W., 2016. Is an absolute level of cortical beta suppression required for proper movement? Magnetoencephalographic evidence from healthy aging. Neuroimage 134, 514–521.
Heinrichs-Graham, E., Wilson, T.W., Santamaria, P.M., Heithoff, S.K., Torres-Russotto, D., Hutter-Saunders, J. a L., Estes, K. a, Meza, J.L., Mosley, R.L., Gendelman, H.E., 2013. Neuromagnetic Evidence of Abnormal Movement-Related Beta Desynchronization in Parkinson’s Disease. Cereb. Cortex 1–10.
Heinrichs-Graham, E., Wilson, T.W., Santamaria, P.M., Heithoff, S.K., Torres-Russotto, D., Hutter-Saunders, J.A.L., Estes, K.A., Meza, J.L., Mosley, R.L., Gendelman, H.E., 2014. Neuromagnetic evidence of abnormal movement-related beta desynchronization in Parkinson’s disease. Cereb. Cortex 24, 2669–2678.
Heise, K.-F., Zimerman, M., Hoppe, J., Gerloff, C., Wegscheider, K., Hummel, F.C., 2013. The aging motor system as a model for plastic changes of GABA-mediated intracortical inhibition and their behavioral relevance. J. Neurosci. 33, 9039–49.
Heiss, W.D., Grond, M., Thiel, a, von Stockhausen, H.M., Rudolf, J., Ghaemi,
References
235
M., Löttgen, J., Stenzel, C., Pawlik, G., 1998. Tissue at risk of infarction rescued by early reperfusion: a positron emission tomography study in systemic recombinant tissue plasminogen activator thrombolysis of acute stroke. J. Cereb. Blood Flow Metab. 18, 1298–1307.
Hensch, T.K., 2005. Critical period plasticity in local cortical circuits. Nat. Rev. Neurosci. 6, 877–888.
Herrmann, C.S., Rach, S., Vosskuhl, J., Strüber, D., 2014. Time-frequency analysis of event-related potentials: A brief tutorial. Brain Topogr.
Hess, G., Aizenman, C.D., Donoghue, J.P., 1996. Conditions for the induction of long-term potentiation in layer II/III horizontal connections of the rat motor cortex. J. Neurophysiol. 75, 1765–1778.
Hikosaka, O., Nakamura, K., Sakai, K., Nakahara, H., 2002. Central mechanisms of motor skill learning. Curr. Opin. Neurobiol. 12, 217–222.
Hikosaka, O., Rand, M.K., Miyachi, S., Miyashita, K., 1995. Learning of sequential movements in the monkey: process of learning and retention of memory. J. Neurophysiol. 74, 1652–1661.
Hiu, T., Farzampour, Z., Paz, J.T., Wang, E.H.J., Badgely, C., Olson, A., Micheva, K.D., Wang, G., Lemmens, R., Tran, K. V., Nishiyama, Y., Liang, X., Hamilton, S.A., O’Rourke, N., Smith, S.J., Huguenard, J.R., Bliss, T.M., Steinberg, G.K., 2016. Enhanced phasic GABA inhibition during the repair phase of stroke: A novel therapeutic target. Brain 139, 468–480.
Hogan, N., 1984. An organizing principle for a class of voluntary movements 4, 2745–2754.
Hope, T.M.H., Seghier, M.L., Leff, A.P., Price, C.J., 2013. Predicting outcome and recovery after stroke with lesions extracted from MRI images. NeuroImage Clin. 2, 424–433.
Horn, S.D., DeJong, G., Smout, R.J., Gassaway, J., James, R., Conroy, B., 2005. Stroke rehabilitation patients, practice, and outcomes: Is earlier and more aggressive therapy better? Arch. Phys. Med. Rehabil. 86.
Hotermans, C., Peigneux, P., De Noordhout, A.M., Moonen, G., Maquet, P., 2008. Repetitive transcranial magnetic stimulation over the primary motor cortex disrupts early boost but not delayed gains in performance in motor sequence learning. Eur. J. Neurosci. 28, 1216–1221.
Hotermans, C., Peigneux, P., Noordhout, A.M. De, Moonen, G., Maquet, P., 2006. Early boost and slow consolidation in motor skill learning. Learn. Mem. 580–583.
Houweling, S., Daffertshofer, A., van Dijk, B.W., Beek, P.J., 2008. Neural changes induced by learning a challenging perceptual-motor task. Neuroimage 41, 1395–407.
Howard, D. V, Howard, J.H., 1989. Age differences in learning serial patterns: direct versus indirect measures. Psychol. Aging 4, 357–64.
Howard, J.H., Howard, D. V., 1997. Age differences in implicit learning of higher
References
236
order dependencies in serial patterns. Psychol. Aging 12, 634–656.
Hsu, W.-Y., Cheng, C.-H., Liao, K.-K., Lee, I.-H., Lin, Y.-Y., 2012. Effects of repetitive transcranial magnetic stimulation on motor functions in patients with stroke: a meta-analysis. Stroke 43, 1849–1857.
Huang, V.S., Krakauer, J.W., 2009. Robotic neurorehabilitation: a computational motor learning perspective. J. Neuroeng. Rehabil. 6, 5.
Huang, X., Qin, G., Fang, Y., 2011. Optimal Combinations of Diagnostic Tests Based on AUC. Biometrics 67, 568–576.
Huang, Y.Z., Edwards, M.J., Rounis, E., Bhatia, K.P., Rothwell, J.C., 2005. Theta burst stimulation of the human motor cortex. Neuron 45, 201–206.
Ille, N., Berg, P., Scherg, M., 2002. Artifact correction of the ongoing EEG using spatial filters based on artifact and brain signal topographies. J. Clin. Neurophysiol. 19, 113–24.
Jacobs, K.M., Donoghue, J.P., 1991. Reshaping the Cortical Motor Map by Unmasking Latent Intracortical Connections. Science 251, 944–947.
Jaillard, A., Martin, C.D., Garambois, K., François Lebas, J., Hommel, M., 2005. Vicarious function within the human primary motor cortex? A longitudinal fMRI stroke study. Brain 128, 1122–1138.
Jasper, H., Klem, G., Luders, H., Elger, C., 1958. The ten-twenty electrode system of the International Federation. Electroencephalogr. Clin. Neurophysiol. 10, 371–375.
Jenkinson, N., Brown, P., 2011. New insights into the relationship between dopamine, beta oscillations and motor function. Trends Neurosci. 34, 611–8.
Jensen, O., Goel, P., Kopell, N., Pohja, M., Hari, R., Ermentrout, B., 2005. On the human sensorimotor-cortex beta rhythm: sources and modeling. Neuroimage 26, 347–355.
Johansen-Berg, H., 2002. Correlation between motor improvements and altered fMRI activity after rehabilitative therapy. Brain 125, 2731–2742.
Johansen-Berg, H., Rushworth, M.F.S., Bogdanovic, M.D., Kischka, U., Wimalaratna, S., Matthews, P.M., 2002. The role of ipsilateral premotor cortex in hand movement after stroke. Proc. Natl. Acad. Sci. 99, 14518–14523.
Johansson, S., Kottorp, A., Lee, K.A., Gay, C.L., Lerdal, A., 2014. Can the Fatigue Severity Scale 7-item version be used across different patient populations as a generic fatigue measure--a comparative study using a Rasch model approach. Health Qual. Life Outcomes 12, 24.
Joundi, R. a, Jenkinson, N., Brittain, J.-S., Aziz, T.Z., Brown, P., 2012. Driving oscillatory activity in the human cortex enhances motor performance. Curr. Biol. 22, 403–7.
Jurkiewicz, M.T., Gaetz, W.C., Bostan, A.C., Cheyne, D., 2006. Post-movement beta rebound is generated in motor cortex: evidence from neuromagnetic
References
237
recordings. Neuroimage 32, 1281–1289.
Kang, L., Liu, A., Tian, L., 2014. Linear combination methods to improve diagnostic/prognostic accuracy on future observations. Stat. Methods Med. Res. 25, 1359–1380.
Kang, N., Summers, J.J., Cauraugh, J.H., 2016. Transcranial direct current stimulation facilitates motor learning post-stroke: a systematic review and meta-analysis. J. Neurol. Neurosurg. Psychiatry 87, 345–355.
Karni, A., Meyer, G., Jezzard, P., Adams, M.M., Turner, R., Ungerleider, L.G., 1995. Functional MRI evidence for adult motor cortex plasticity during motor skill learning. Nature 377, 155–158.
Karni, A., Sagi, D., 1993. The time course of learning a visual skill. Nat. Lett. 365, 250–252.
Kellor, M., Frost, J., Silberberg, N., Iversen, I., Cummings, R., 1971. Hand strength and dexterity. Am. J. Occup. Ther. 25, 77–83.
Kelly, A.M.C., Garavan, H., 2005. Human functional neuroimaging of brain changes associated with practice. Cereb. Cortex 15, 1089–1102.
Ketcham, C.J., Stelmach, G.E., 2001. Age-related declines in motor control., in: Handbook of the Psychology of Aging. pp. 313–348.
Kilavik, B.E., Ponce-Alvarez, A., Trachel, R., Confais, J., Takerkart, S., Riehle, A., 2012. Context-related frequency modulations of macaque motor cortical LFP beta oscillations. Cereb. Cortex 22, 2148–2159.
Kilavik, B.J., Zaepffel, M., Brovelli, A., MacKay, W.A., Riehle, A., 2013. The ups and downs of beta oscillations in sensorimotor cortex. Exp. Neurol. 245, 15–26.
Kilner, J.M., 2013. Bias in a common EEG and MEG statistical analysis and how to avoid it. Clin. Neurophysiol. 124, 2062–3.
Kim, Y.H., You, S.H., Ko, M.H., Park, J.W., Lee, K.H., Jang, S.H., Yoo, W.K., Hallett, M., 2006. Repetitive transcranial magnetic stimulation-induced corticomotor excitability and associated motor skill acquisition in chronic stroke. Stroke 37, 1471–1476.
Kim, Y.K., Yang, E.J., Cho, K., Lim, J.Y., Paik, N.-J., 2014. Functional Recovery After Ischemic Stroke Is Associated With Reduced GABAergic Inhibition in the Cerebral Cortex: A GABA PET Study. Neurorehabil. Neural Repair 28, 576–583.
Kitago, T., Krakauer, J.W., 2013. Motor learning principles for neurorehabilitation. Neurol. Rehabil. 110, 93 – 103.
Kitago, T., Krakauer, J.W., 2010. Losing control: Brain vs spinal cord. Neurology 74, 1250–1251.
Kleim, J. a, Barbay, S., Nudo, R.J., 1998. Functional reorganization of the rat motor cortex following motor skill learning. J. Neurophysiol. 80, 3321–5.
Kondacs, Â., Szabo, Â., 1999. Long-term intra-individual variability of the
References
238
background EEG in normals. Clin. Neurophysiol. 110, 1708–1716.
Korman, M., Doyon, J., Doljansky, J., Carrier, J., Dagan, Y., Karni, A., 2007. Daytime sleep condenses the time course of motor memory consolidation. Nat. Neurosci. 10, 1206–13.
Kossev, A.R., Schrader, C., Däuper, J., Dengler, R., Rollnik, J.D., 2002. Increased intracortical inhibition in middle-aged humans; a study using paired-pulse transcranial magnetic stimulation. Neurosci. Lett. 333, 83–86.
Kozlowski, D. a, James, D.C., Schallert, T., DA, K., DC, J., T., S., 1996. Use-dependent exaggeration of neuronal injury after unilateral sensorimotor cortex lesions. J. Neurosci. 16, 4776–4786.
Krakauer, J.W., 2006. Motor learning : its relevance to stroke recovery and neurorehabilitation. Curr. Opin. Neurol. 19, 84–90.
Krakauer, J.W., Carmichael, S.T., Corbett, D., Wittenberg, G.F., 2012. Getting neurorehabilitation right: what can be learned from animal models? Neurorehabil. Neural Repair 26, 923–31.
Krakauer, J.W., Mazzoni, P., 2011. Human sensorimotor learning: Adaptation, skill, and beyond. Curr. Opin. Neurobiol. 21, 636–644.
Krakauer, J.W., Pine, Z.M., Ghilardi, M.F., Ghez, C., 2000. Learning of visuomotor transformations for vectorial planning of reaching trajectories. J. Neurosci. 20, 8916–8924.
Krause, C.M., Sillanmäki, L., Häggqvist, A., Heino, R., 2001. Test-retest consistency of the event-related desynchronization/event-related synchronization of the 4-6, 6-8, 8-10 and 10-12 Hz frequency bands during a memory task. Clin. Neurophysiol. 112, 750–757.
Kriegeskorte, N., Simmons, W.K., Bellgowan, P.S.F., Baker, C.I., 2009. Circular analysis in systems neuroscience: the dangers of double dipping. Nat. Neurosci. 12, 535–40.
Krupp, L., LaRocca, N., Muir-Nash, J., 1989. The fatigue severity scale: application to patients with multiple sclerosis and systemic lupus erythematosus. Arch. Neurol. 46, 1121–1123.
Kühn, A.A., Kempf, F., Brücke, C., Gaynor Doyle, L., Martinez-Torres, I., Pogosyan, A., Trottenberg, T., Kupsch, A., Schneider, G.-H., Hariz, M.I., Vandenberghe, W., Nuttin, B., Brown, P., 2008. High-frequency stimulation of the subthalamic nucleus suppresses oscillatory beta activity in patients with Parkinson’s disease in parallel with improvement in motor performance. J. Neurosci. 28, 6165-6173.
Kühn, A.A., Williams, D., Kupsch, A., Limousin, P., Hariz, M., Schneider, G.H., Yarrow, K., Brown, P., 2004. Event-related beta desynchronization in human subthalamic nucleus correlates with motor performance. Brain 127, 735–746.
Kuo, M.F., Unger, M., Liebetanz, D., Lang, N., Tergau, F., Paulus, W., Nitsche, M.A., 2008. Limited impact of homeostatic plasticity on motor learning in humans. Neuropsychologia 46, 2122–2128.

References
239
Kuppuswamy, A., Clark, E. V., Turner, I.F., Rothwell, J.C., Ward, N.S., 2015. Post-stroke fatigue: a deficit in corticomotor excitability? Brain 138, 136–148.
Kurz, M.J., Becker, K.M., Heinrichs-Graham, E., Wilson, T.W., 2014. Neurophysiological abnormalities in the sensorimotor cortices during the motor planning and movement execution stages of children with cerebral palsy. Dev. Med. Child Neurol. 56, 1072–1077.
Kwakkel, G., Kollen, B.J., Van der Grond, J. V., Prevo, A.J.H., 2003. Probability of regaining dexterity in the flaccid upper limb: Impact of severity of paresis and time since onset in acute stroke. Stroke 34, 2181–2186.
Laaksonen, K., Helle, L., Parkkonen, L., Kirveskari, E., Mäkelä, J.P., Mustanoja, S., Tatlisumak, T., Kaste, M., Forss, N., 2013. Alterations in Spontaneous Brain Oscillations during Stroke Recovery. PLoS One 8.
Laaksonen, K., Kirveskari, E., Mäkelä, J.P., Kaste, M., Mustanoja, S., Nummenmaa, L., Tatlisumak, T., Forss, N., 2012. Effect of afferent input on motor cortex excitability during stroke recovery. Clin. Neurophysiol. 123, 2429–2436.
Lachaux, J.P., Rodriguez, E., Martinerie, J., Varela, F.J., 1999. Measuring phase synchrony in brain signals. Hum. Brain Mapp. 8, 194–208.
Lai, T.W., Zhang, S., Wang, Y.T., 2014. Excitotoxicity and stroke: Identifying novel targets for neuroprotection. Prog. Neurobiol. 115, 157-188.
Lake, E.M.R., Chaudhuri, J., Thomason, L., Janik, R., Ganguly, M., Brown, M., McLaurin, J., Corbett, D., Stanisz, G.J., Stefanovic, B., 2015. The effects of delayed reduction of tonic inhibition on ischemic lesion and sensorimotor function. J. Cereb. Blood Flow Metab. 35, 1601–9.
Landis, J.R., Koch, G.G., 1977. The Measurement of Observer Agreement for Categorical Data Data for Categorical of Observer Agreement The Measurement. Biometrics 33, 159–174.
Langhorne, P., Coupar, F., Pollock, A., 2009. Motor recovery after stroke: a systematic review. Lancet Neurol. 8, 741–754.
Le Van Quyen, M., Foucher, J., Lachaux, J., Rodriguez, E., Lutz, a, Martinerie, J., Varela, F.J., 2001. Comparison of Hilbert transform and wavelet methods for the analysis of neuronal synchrony. J. Neurosci. Methods 111, 83–98.
Lehericy, S., Benali, H., Van de Moortele, P.-F., Pelegrini-Issac, M., Waechter, T., Ugurbil, K., Doyon, J., 2005. Distinct basal ganglia territories are engaged in early and advanced motor sequence learning. Proc. Natl. Acad. Sci. 102, 12566–12571.
Levin, M.F., Kleim, J.A., Wolf, S.L., 2009. What Do Motor “Recovery” and “Compensation” Mean in Patients Following Stroke? Neurorehabil. Neural Repair 23, 313–319.
Lindenberg, R., Zhu, L.L., Rüber, T., Schlaug, G., 2012. Predicting functional motor potential in chronic stroke patients using diffusion tensor imaging.

References
240
Hum. Brain Mapp. 33, 1040–1051.
Linkenkaer-Hansen, K., Nikouline, V. V, Palva, J.M., Ilmoniemi, R.J., 2001. Long-range temporal correlations and scaling behavior in human brain oscillations. J. Neurosci. 21, 1370–7.
Linnet, K., 1987. Comparison of quantitative diagnostic testst: type I error, power, and sample size. Stat. Med. 6, 147–158.
Little, S., Brown, P., 2014. The functional role of beta oscillations in Parkinson’s disease. Park. Relat. Disord. 20, 44–48.
Litvak, V., Jha, A., Eusebio, A., Oostenveld, R., Foltynie, T., Limousin, P., Zrinzo, L., Hariz, M.I., Friston, K., Brown, P., 2011. Resting oscillatory cortico-subthalamic connectivity in patients with Parkinson’s disease. Brain 134, 359–374.
Logothetis, N.K., 2003. The underpinnings of the BOLD functional magnetic resonance imaging signal. J. Neurosci. 23, 3963–3971.
Lohse, K.R., Lang, C.E., Boyd, L.A., 2014. Is more better? Using metadata to explore dose-response relationships in stroke rehabilitation. Stroke 45, 2053–2058.
Lopes da Silva, F., 2013. EEG and MEG: relevance to neuroscience. Neuron 80, 1112–11128.
Lopes da Silva, F., 2011. Biophysical aspects of EEG and MEG generation., in: Schomer, D.L., Lopes Da Silva, F.H. (Eds.), Niedermeyer’s Electroencephalography: Basic Principles, Clinical Applications and Related Fields. Lippincott Williams &Wilkins, Philadelphia, pp. 91–110.
Lotze, M., Markert, J., Sauseng, P., Hoppe, J., Plewnia, C., Gerloff, C., 2006. The role of multiple contralesional motor areas for complex hand movements after internal capsular lesion. J. Neurosci. 26, 6096–6102.
Luck, S.J., 2005. An Introduction to the Event-Related Potential Technique. Monogr. Soc. Res. Child Dev. 78, 388.
Luft, A.R., Buitrago, M.M., 2005. Stages of motor skill learning. Mol Neurobiol 32, 205–216.
Lustig, C., Shah, P., Seidler, R., Reuter-Lorenz, P.A., 2009. Aging, training, and the brain: A review and future directions. Neuropsychol. Rev. 19, 504-522.
Lyons, R.G., 2004. Understanding Digital Signal Processing, Angewandte Chemie International Edition.
Magill, R. a., 1994. The Influence of Augmented Feedback on Skill Learning Depends on Characteristics of the Skill and the Learner. Quest 46, 314–327.
Magill, R.A., 2011. Motor learning and control: Concepts and applications., 9th ed. McGraw-Hill.
Magill, R.A., Hall, K.G., 1990. A review of the contextual interference effect in motor skill acquisition. Hum. Mov. Sci. 9, 241–289.
References
241
Makeig, S., Debener, S., Onton, J., Delorme, A., 2004. Mining event-related brain dynamics. Trends Cogn. Sci. 8, 204-210.
Mallat, S.G., 1989. A Theory for Multiresolution Signal Decomposition: The Wavelet Representation. IEEE Trans. Pattern Anal. Mach. Intell. 11, 674–693.
Marneweck, M., Loftus, A., Hammond, G., 2011. Short-interval intracortical inhibition and manual dexterity in healthy aging. Neurosci. Res. 70, 408–414.
Marshall, R.S., Perera, G.M., Lazar, R.M., Krakauer, J.W., Constantine, R.C., DeLaPaz, R.L., 2000. Evolution of cortical activation during recovery from corticospinal tract infarction. Stroke. 31, 656–61.
Martin, J. a, Ramsay, J., Hughes, C., Peters, D.M., Edwards, M.G., 2015. Age and grip strength predict hand dexterity in adults. PLoS One 10, 1–18.
Martin, T. a, Keating, J.G., Goodkin, H.P., Bastian, a J., Thach, W.T., 1996. Throwing while looking through prisms: I. Focal olivocerebellar lesions impair adaptation. Brain 119, 1183–1198.
Martin-Buro, M.C., Garces, P., Maestu, F., 2016. Test-retest reliability of resting-state magnetoencephalography power in sensor and source space. Hum. Brain Mapp. 37, 179–190.
Mary, A., Bourguignon, M., Wens, V., Op de Beeck, M., Leproult, R., De Tiège, X., Peigneux, P., 2015. Aging reduces experience-induced sensorimotor plasticity. A magnetoencephalographic study. Neuroimage 104, 59–68.
Mathiowetz, V., Weber, K., Kashman, N., Volland, G., 1985. Adult norms for the Nine Hole Peg Test of finger dexterity. Occup. Ther. J. Res. 5, 24–38.
Mattay, V.S., Fera, F., Tessitore, A., Hariri, A.R., Das, S., Callicott, J.H., Weinberger, D.R., 2002. Neurophysiological correlates of age-related changes in human motor function. Neurology 58, 630–5.
Mayeux, R., 2004. Biomarkers: potential uses and limitations. NeuroRx J. Am. Soc. Exp. Neurother. 1, 182–8.
McAllister, C.J., Ronnqvist, K.C., Stanford, I.M., Woodhall, G.L., Furlong, P.L., Hall, S.D., 2013. Oscillatory Beta Activity Mediates Neuroplastic Effects of Motor Cortex Stimulation in Humans. J. Neurosci. 33, 7919–7927.
McEvoy, L.K., Smith, M.E., Gevins, A., 2000. Test-retest reliability of cognitive EEG. Clin. Neurophysiol. 111, 457– 463.
Mcfarland, D.J., Mccane, L.M., David, S. V, Wolpaw, J.R., 1997. Spatial filter selection for EEG - based communication. Electroencephalogr. Clin. Neurophysiol. 103, 386–394.
McFarland, D.J., Miner, L.A., Vaughan, T.M., Wolpaw, J.R., 2000. Mu and beta rhythm topographies during motor imagery and actual movements. Brain Topogr. 12, 177–186.
McGinley, M., Hoffman, R.L., Russ, D.W., Thomas, J.S., Clark, B.C., 2010. Older adults exhibit more intracortical inhibition and less intracortical
References
242
facilitation than young adults. Exp. Gerontol. 45, 671–8.
McGinnis, S.M., Brickhouse, M., Pascual, B., Dickerson, B.C., 2011. Age-Related changes in the thickness of cortical zones in humans. Brain Topogr. 24, 279–291.
McGraw, K.O., Wong, S.P., 1996. Forming inferences about some intraclass correlations coefficients. Psychol. Methods 1, 390–390.
McNay, E.C., Willingham, D.B., 1998. Deficit in learning of a motor skill requiring strategy, but not of perceptuomotor recalibration, with aging. Learn. Mem. 4, 411–420.
Mead, G.E., Hsieh, C.-F., Hackett, M., 2013. Selective serotonin reuptake inhibitors for stroke recovery. JAMA 310, 1066–7.
Meyer-Lindenberg, A., 2010. From maps to mechanisms through neuroimaging of schizophrenia. Nature 468, 194–202.
Mills, R.J., Pallant, J.F., Koufali, M., Sharma, A., Day, S., Tennant, A., Young, C. a, 2012. Validation of the Neurological Fatigue Index for stroke (NFI-Stroke). Health Qual. Life Outcomes 10, 51.
Moisello, C., Blanco, D., Lin, J., Panday, P., Kelly, S.P., Quartarone, A., Di Rocco, A., Cirelli, C., Tononi, G., Ghilardi, M.F., 2015. Practice changes beta power at rest and its modulation during movement in healthy subjects but not in patients with Parkinson’s disease. Brain Behav. 5, 1–14.
Molina-Luna, K., Hertler, B., Buitrago, M.M., Luft, A.R., 2008. Motor learning transiently changes cortical somatotopy. Neuroimage 40, 1748–1754.
Monfils, M.-H., Teskey, G.C., 2004. Skilled-learning-induced potentiation in rat sensorimotor cortex : A transient form of behavioural long-term potentiation. Neuroscience 125, 329–336.
Moxley, S.E., 1979. Schema:The variability of practice hypothesis. J. Mot. Behav. 11, 65–70.
Muellbacher, W., Ziemann, U., Wissel, J., Dang, N., Ko, M., Facchini, S., Boroojerdi, B., Poewe, W., 2002. Early consolidation in human primary motor cortex. Nature 415, 640–644.
Muller-Dahlhaus, J.F.M., Orekhov, Y., Liu, Y., Ziemann, U., 2008. Interindividual variability and age-dependency of motor cortical plasticity induced by paired associative stimulation. Exp. Brain Res. 187, 467–475.
Murakami, S., Okada, Y., 2006. Contributions of principal neocortical neurons to magnetoencephalography and electroencephalography signals. J. Physiol. 575, 925–936.
Murase, N., Duque, J., Mazzocchio, R., Cohen, L.G., 2004. Influence of Interhemispheric Interactions on Motor Function in Chronic Stroke. Annu. Neurol. 55, 400–409.
Muratori, L.M., Lamberg, E.M., Quinn, L., Duff, S. V, 2013. Applying principles of motor learning and control to upper extremity rehabilitation. J. Hand Ther. 26, 94–102.

References
243
Murphy, T.H., Corbett, D., 2009. Plasticity during stroke recovery: from synapse to behaviour. Nat. Rev. Neurosci. 10, 861–872.
Murthy, V.N., Fetz, E.E., 1996. Oscillatory activity in sensorimotor cortex of awake monkeys: synchronization of local field potentials and relation to behavior. J. Neurophysiol. 76, 3949–3967.
Muthukumaraswamy, S.D., Myers, J.F.M., Wilson, S.J., Nutt, D.J., Lingford-Hughes, A., Singh, K.D., Hamandi, K., 2013. The effects of elevated endogenous GABA levels on movement-related network oscillations. Neuroimage 66, 36–41.
Muthukumaraswamy, S.D., Singh, K.D., Swettenham, J.B., Jones, D.K., 2010. Visual gamma oscillations and evoked responses: Variability, repeatability and structural MRI correlates. Neuroimage 49, 3349–3357.
Nakagawa, K., Aokage, Y., Fukuri, T., Kawahara, Y., Hashizume, A., Kurisu, K., Yuge, L., 2011. Neuromagnetic beta oscillation changes during motor imagery and motor execution of skilled movements. Neuroreport 22, 217–222.
Nakayama, H., Jorgensen, H.S., Raaschou, H.O., Olsen, T.S., 1994. Recovery of upper extremity function in stroke patients: the Copenhagen Stroke Study. Arch Phys Med Rehabil 75, 394–398.
Napflin, M., Wildi, M., Sarnthein, J., 2007. Test-retest reliability of resting EEG spectra validates a statistical signature of persons. Clin. Neurophysiol. 118, 2519–2524.
Nelson, A.B., Moisello, C., Lin, J., Panday, P., Ricci, S., Canessa, A., Di Rocco, A., Quartarone, A., Frazzitta, G., Isaias, I.U., Tononi, G., Cirelli, C., Ghilardi, M.F., 2017. Beta Oscillatory Changes and Retention of Motor Skills during Practice in Healthy Subjects and in Patients with Parkinson’s Disease. Front. Hum. Neurosci. 11, 1–12.
Nettersheim, A., Hallschmid, M., Born, J., Diekelmann, S., 2015. The Role of Sleep in Motor Sequence Consolidation: Stabilization Rather Than Enhancement. J. Neurosci. 35, 6696–6702.
Neuper, C., Grabner, R.H., Fink, A., Neubauer, A.C., 2005. Long-term stability and consistency of EEG event-related (de-)synchronization across different cognitive tasks. Clin. Neurophysiol. 116, 1681–94.
Newell, A., Rosenbloom, P.S., 1980. Mechanisms of skill acquisition and the law of practice. Cogn. Ski. their Acquis. 6, 1–55.
Ng, K.L., Gibson, E.M., Hubbard, R., Yang, J., Caffo, B., O’Brien, R.J., Krakauer, J.W., Zeiler, S.R., 2015. Fluoxetine maintains a state of heightened responsiveness to motor training early after stroke in a mouse model. Stroke 46, 2951–2960.
Nicolo, P., Rizk, S., Magnin, C., Pietro, M. Di, Schnider, A., Guggisberg, A.G., 2015. Coherent neural oscillations predict future motor and language improvement after stroke. Brain 138, 3048–3060.
Nikulin, V. V., Brismar, T., 2006. Phase synchronization between alpha and

References
244
beta oscillations in the human electroencephalogram. Neuroscience 137, 647–657.
Nikulin, V. V., Brismar, T., 2004. Long-range temporal correlations in alpha and beta oscillations: Effect of arousal level and test-retest reliability. Clin. Neurophysiol. 115, 1896–1908.
Nissen, M.J., Bullemer, P., 1987. Attention Requirements of Learning: Evidence from Performance Measures. Cogn. Psychol. 19, 1–32.
Nitsche, M.A., Schauenburg, A., Lang, N., Liebetanz, D., Exner, C., Paulus, W., Tergau, F., 2003. Facilitation of Implicit Motor Learning by Weak Transcranial Direct Current Stimulation of the Primary Motor Cortex in the Human. J. Cogn. Neurosci. 15, 619–626.
Noh, N.A., Fuggetta, G., Manganotti, P., Fiaschi, A., 2012. Long lasting modulation of cortical oscillations after continuous theta burst transcranial magnetic stimulation. PLoS One 7.
Nudo, R.J., 2013. Recovery after brain injury: mechanisms and principles. Front. Hum. Neurosci. 7, 1–14.
Nudo, R.J., Milliken, G.W., 1996. Reorganization of Movement Representations in Primary Motor Cortex Following Focal Ischemic Infarcts in Adult Squirrel Monkeys. J. Neurophysiol. 75, 2144–2149.
Nudo, R.J., Milliken, G.W., Jenkins, W.M., Merzenich, M.M., 1996a. Use-Dependent Primary Motor Alterations of Movement Representations Cortex of Adult Squirrel Monkeys. J. Neurosci. 16, 785–807.
Nudo, R.J., Wise, B.M., SiFuentes, F., Milliken, G.W., 1996b. Neural substrates for the effect of rehabilitative training on motor recovery after ischaemic stroke. Science 21, 1791–1794.
Nunez, P.L., Srinivasan, R., 2009. Electric Fields of the Brain: The neurophysics of EEG, Electric Fields of the Brain: The neurophysics of EEG.
Nunez, P.L., Srinivasan, R., 2006. Electric Fields of the Brain, Oxford University Press.
Ogawa, S., Tank, D.W., Menon, R., Ellermann, J.M., Kim, S.G., Merkle, H., Ugurbil, K., 1992. Intrinsic signal changes accompanying sensory stimulation: Functional brain mapping with magnetic resonance imaging. Proc. Natl. Acad. Sci. U. S. A. 89, 5951–5955.
Ohayon, M.M., Carskadon, M.A., Guilleminault, C., Vitiello, M. V, 2004. Meta-Analysis of Quantitative Sleep Parameters From Childhood to Old Age in Healthy Individuals : Developing Normative Sleep Values Across the Human Lifespan. Sleep 27, 1255–1273.
Oldfield, R.C., 1971. The assessment and analysis of handedness: The Edinburgh inventory. Neuropsychologia 97–113.
Omlor, W., Patino, L., Mendez-Balbuena, I., Schulte-Monting, J., Kristeva, R., 2011. Corticospinal Beta-Range Coherence Is Highly Dependent on the Pre-stationary Motor State. J. Neurosci. 31, 8037–8045.

References
245
Oostenveld, R., Fries, P., Maris, E., Schoffelen, J.M., 2011. FieldTrip: Open source software for advanced analysis of MEG, EEG, and invasive electrophysiological data. Comput. Intell. Neurosci. 2011.
Orrell, A.J., Eves, F.F., Masters, R.S.W., Macmahon, K.M.M., 2007. Implicit sequence learning processes after unilateral stroke. Neuropsychol. Rehabil. 17, 335–354.
Oswal, A., Beudel, M., Zrinzo, L., Limousin, P., Hariz, M., Foltynie, T., Litvak, V., Brown, P., 2016. Deep brain stimulation modulates synchrony within spatially and spectrally distinct resting state networks in Parkinson’s disease. Brain 139, 1482–1496.
Pascual-Leone, A., Grafman, J., Hallett, M., 1994. Modulation of cortical motor output maps during development of implicit and explicit knowledge. Science 263, 1287.
Pascual-Leone, A., Nguyet, D., Cohen, L.G., Brasil-Neto, J.P., Cammarota, A., Hallett, M., 1995. Modulation of muscle responses evoked by transcranial magnetic stimulation during the acquisition of new fine motor skills. J. Neurophysiol. 74, 1037–1045.
Peinemann, a, Lehner, C., Conrad, B., Siebner, H.R., 2001. Age-related decrease in paired-pulse intracortical inhibition in the human primary motor cortex. Neurosci. Lett. 313, 33–36.
Penfield, W. and Rasmussen, T., 1950. The cerebral cortex of man.
Pew, R.W., 1974. Levels of analysis in motor control. Brain Res. 71, 393–400.
Pfurtscheller, G., Aranibar, A., 1977. Event-related cortical desynchronization detected by power measurements of scalp EEG. Electroencephalogr. Clin. Neurophysiol. 42, 817–826.
Pfurtscheller, G., Berghold, A., 1989. Patterns of cortical activation during planning of voluntary movement. Electroecephalography Clin. Neurophysiol. 72, 250–258.
Pfurtscheller, G., Lopes Da Silva, F.H., 1999. Event-related EEG/MEG synchronization and desynchronization: Basic principles. Clin. Neurophysiol. 110, 1842-1857.
Pfurtscheller, G., Lopes, F.H., 1999. Event-related EEG / MEG synchronization and desynchronization : basic principles. Clin. Neurophysiol. 110, 1842–1857.
Pfurtscheller, G., Stancák, A., Neuper, C., 1996. Post-movement beta synchronization. A correlate of an idling motor area? Electroencephalogr. Clin. Neurophysiol. 98, 281–293.
Pfurtscheller, G., Zalaudek, K., Neuper, C., 1998a. Event-related beta synchronization after wrist, finger and thumb movement. Electroencephalogr. Clin. Neurophysiol. - Electromyogr. Mot. Control 109, 154–160.
Pfurtscheller, G., Zalaudek, K., Neuper, C., 1998b. Event-related beta

References
246
synchronization after wrist, finger and thumb movement. Electroencephalogr. Clin. Neurophysiol. Mot. Control 109, 154–160.
Picard, R.R., Cook, R.D., 1984. Cross-validation of regression models. J. Am. Stat. Assoc. 79, 575–583.
Picton, T.W., Bentin, S., Berg, P., Donchin, E., Hillyard, S. a, Johnson, R., Miller, G.A., Ritter, W., Ruchkin, D.S., Rugg, M.D., Taylor, M.J., Johnson Jr., R., Miller, G.A., Ritter, W., Ruchkin, D.S., Rugg, M.D., Taylor, M.J., 2000. Guidelines for using human event-related potentials to study cognition: recording standards and publication criteria. Psychophysiology 37, 127–152.
Platz, T., Denzler, P., Kaden, B., Mauritz, K.-H., 1994. Motor learning recovery from hemiparesis. Neuropsychologia 32, 1209–1223.
Plautz, E.J., Milliken, G.W., Nudo, R.J., 2000. Effects of repetitive motor training on movement representations in adult squirrel monkeys: role of use versus learning. Neurobiol. Learn. Mem. 74, 27–55.
Pleger, B., Schwenkreis, P., Dinse, H.R., Ragert, P., Höffken, O., Malin, J.-P., Tegenthoff, M., 2003. Pharmacological suppression of plastic changes in human primary somatosensory cortex after motor learning. Exp. brain Res. 148, 525–32.
Plichta, M.M., Schwarz, A.J., Grimm, O., Morgen, K., Mier, D., Haddad, L., Gerdes, A.B.M., Sauer, C., Tost, H., Esslinger, C., Colman, P., Wilson, F., Kirsch, P., Meyer-Lindenberg, A., 2012. Test-retest reliability of evoked BOLD signals from a cognitive-emotive fMRI test battery. Neuroimage 60, 1746–1758.
Pogosyan, A., Gaynor, L.D., Eusebio, A., Brown, P., 2009. Boosting cortical activity at Beta-band frequencies slows movement in humans. Curr. Biol. 19, 1637–1641.
Pohl, P.S., McDowd, J.M., Filion, D., Richards, L.G., Stiers, W., 2006. Implicit learning of a motor skill after mild and moderate stroke. Clin. Rehabil. 20, 246–253.
Pollock, V.E., Schneider, L.S., Lyness, S.A., 1991. Reliability of topographic quantitative EEG amplitude in healthy late-middle-aged and elderly subjects. Electroencephalogr. Clin. Neurophysiol. 79, 20–26.
Pollok, B., Latz, D., Krause, V., Butz, M., Schnitzler, A., 2014. Changes of motor-cortical oscillations associated with motor learning. Neuroscience 275, 47–53.
Pozzo, T., Papaxanthis, C., Petit, J.L., Schweighofer, N., Stucchi, N., 2006. Kinematic features of movement tunes perception and action coupling. Behav. Brain Res. 169, 75–82.
Prabhakaran, S., Zarahn, E., Riley, C., Speizer, A., Chong, J.Y., Lazar, R.M., Marshall, R.S., Krakauer, J.W., 2015. Inter-individual variability in the capacity for motor recovery after ischemic stroke. Neurorehabil. Neural Repair 22, 64–71.

References
247
Prokic, E.J., Weston, C., Yamawaki, N., Hall, S.D., Jones, R.S.G., Stanford, I.M., Ladds, G., Woodhall, G.L., 2015. Cortical oscillatory dynamics and benzodiazepine-site modulation of tonic inhibition in fast spiking interneurons. Neuropharmacology 95, 192–205.
Que, M., Witte, O.W., Neumann-Haefelin, T., Schiene, K., Schroeter, M., Zilles, K., 1999. Changes in GABAA and GABAB receptor binding following cortical photothrombosis: a quantitative receptor autoradiographic study. Neuroscience 93, 1233–1240.
Quinlan, E.B., Dodakian, L., See, J., McKenzie, A., Le, V., Wojnowicz, M., Shahbaba, B., Cramer, S.C., 2015. Neural function, injury, and stroke subtype predict treatment gains after stroke. Ann. Neurol. 77, 132–145.
Raghavan, P., 2015. Upper Limb Motor Impairment After Stroke. Phys. Med. Rehabil. Clin. N. Am. 26, 599-610
Rau, C., Plewnia, C., Hummel, F., Gerloff, C., 2003. Event-related desynchronization and excitability of the ipsilateral motor cortex during simple self-paced finger movements. Clin. Neurophysiol. 114, 1819–1826.
Reis, J., Schambra, H.M., Cohen, L.G., Buch, E.R., Fritsch, B., Zarahn, E., Celnik, P.A., Krakauer, J.W., 2009. Noninvasive cortical stimulation enhances motor skill acquisition over multiple days through an effect on consolidation. PNAS 5, 1590–1595.
Ren, J., Wu, Y.D., Chan, J.S.Y., Yan, J.H., 2013. Cognitive aging affects motor performance and learning. Geriatr. Gerontol. Int. 13, 19–27.
Reuter-Lorenz, P.A., Jonides, J., Smith, E.E., Hartley, A., Miller, A., Marshuetz, C., Koeppe, R.A., 2000. Age Differences in the Frontal Lateralization of Verbal and Spatial Working Memory Revealed by PET. J. Cogn. Neurosci. 12, 174–187.
Reuter-Lorenz, P.A., Stanczak, L., Miller, A.C., 1999. Neural Recruitment and Cognitive Aging: Two Hemispheres Are Better Than One, Especially as You Age. Psychol. Sci. 10, 494–500.
Rickard, T.C., Cai, D.J., Rieth, C.A., Jones, J., Ard, M.C., 2008. Sleep does not enhance motor sequence learning. J. Exp. Psychol. Learn. Mem. Cogn. 34, 834–842.
Riecker, A., Gröschel, K., Ackermann, H., Schnaudigel, S., Kassubek, J., Kastrup, A., 2010. The role of the unaffected hemisphere in motor recovery after stroke. Hum. Brain Mapp. 31, 1017–1029.
Riley, J.D., Le, V., Der-Yeghiaian, L., See, J., Newton, J.M., Ward, N.S., Cramer, S.C., 2011. Anatomy of stroke injury predicts gains from therapy. Stroke 42, 421–426.
Rioult-Pedotti, M.-S., Donoghue, J.P., Dunaevsky, a, 2007. Plasticity of the synaptic modification range. J. Neurophysiol. 98, 3688–3695.
Rioult-Pedotti, M.-S., Friedman, D., Donoghue, J.P., 2000. Learning-Induced LTP in Neocortex. Science 80, 533–537.

References
248
Rioult-Pedotti, M.-S., Friedman, D., Hess, G., Donoghue, J.P., 1998. Strengthening of horizontal cortical connections following skill learning. Nat. Neurosci. 1, 230–234.
Risedal, a, Zeng, J., Johansson, B.B., 1999. Early training may exacerbate brain damage after focal brain ischemia in the rat. J. Cereb. blood flow Metab. 19, 997–1003.
Robertson, E.M., Pascual-leone, A., Miall, R.C., 2004a. Current concepts in procedural consolidation 5, 1–7.
Robertson, E.M., Pascual-Leone, A., Press, D.Z., 2004b. Awareness Modifies the Skill-Learning Benefits of Sleep. Curr. Biol. 14, 208–212.
Robertson, E.M., Press, D.Z., Pascual-Leone, A., 2005. Off-line learning and the primary motor cortex. J. Neurosci. 25, 6372–8.
Robertson, I.H., Manly, T., Andrade, J., Baddeley, B.T., Yiend, J., 1997. “Oops”: Performace correlates of everyday attention failures in traumatic brain injured and normal subjects. Neuropsychologia 35, 747–758.
Rogasch, N.C., Dartnall, T.J., Cirillo, J., Nordstrom, M. a, Semmler, J.G., 2009. Corticomotor plasticity and learning of a ballistic thumb training task are diminished in older adults. J. Appl. Physiol. 107, 1874–83.
Roig, M., Ritterband-Rosenbaum, A., Lundbye-Jensen, J., Nielsen, J.B., 2014. Aging increases the susceptibility to motor memory interference and reduces off-line gains in motor skill learning. Neurobiol. Aging 35, 1892–900.
Rondina, J.M., Filippone, M., Girolami, M., Ward, N.S., 2016. Decoding post-stroke motor function from structural brain imaging. NeuroImage Clin. 12, 372–380.
Roopun, A.K., Middleton, S.J., Cunningham, M.O., Lebeau, F.E.N., Bibbig, A., Whittington, M.A., Traub, R.D., 2006. A beta2-frequency (20 –30 Hz) oscillation in nonsynaptic networks of somatosensory cortex. PNAS 103, 15646–15650.
Rosenkranz, K., Kacar, A., Rothwell, J.C., 2007. Differential modulation of motor cortical plasticity and excitability in early and late phases of human motor learning. J. Neurosci. 27, 12058–12066.
Rossini, P.M., Caltagirone, C., Castriota-Scanderbeg, a, Cicinelli, P., Del Gratta, C., Demartin, M., Pizzella, V., Traversa, R., Romani, G.L., Centro, I., Giovanni, S., 1998. Hand motor cortical area reorganization in stroke: a study with fMRI, MEG and TCS maps. Neuroreport 9, 2141–2146.
Rossiter, H.E., Boudrias, M.-H., Ward, N.S., 2014a. Do movement-related beta oscillations change after stroke? J. Neurophysiol. 112, 2053–2058.
Rossiter, H.E., Davis, E.M., Clark, E. V., Boudrias, M.-H., Ward, N.S., 2014b. Beta oscillations reflect changes in motor cortex inhibition in healthy ageing. Neuroimage 91, 360–365.
Saladin, K.S., 2004. Anatomy and Physiology: The unity of form and function,

References
249
3rd ed. McGraw-Hill, New York, NY.
Salmelin, R., Hari, R., 1994. Spatiotemporal characteristics of sensorimotor neuromagnetic rhythms related to thumb movement. Neuroscience 60, 537–550.
Salmelin, R., R. Hari, 1994. Spatiotemporal characteristics of sensorimotor neuromagnetic rhythms related to thumb movement. Neuroscience 60, 537–550.
Salter, K., Jutai, J., Hartley, M., Foley, N., Bhogal, S., Bayona, N., Teasell, R., 2006. Impact of Early Vs Delayed Admission To Rehabilitation on Functional Outcomes in Persons With Stroke. J. Rehabil. Med. 38, 113–117.
Sanes, J.N., Donoghue, J.P., 2000. Plasticity and primary motor cortex. Annu. Rev. Neurosci. 23, 393–415.
Saunders, D.E., Clifton, A.G., Brown, M.M., 1995. Measurement of Infarct Size Using MRI Predicts Prognosis in Middle Cerebral Artery Infarction. Stroke 26, 2272–2276.
Sawaki, L., Yaseen, Z., Kopylev, L., Cohen, L.G., 2003. Age-dependent changes in the ability to encode a novel elementary motor memory. Ann. Neurol. 53, 521–524.
Schaal, S., Sternad, D., Osu, R., Kawato, M., 2004a. Rhythmic arm movement is not discrete. Nat. Neurosci. 7, 1137–1279.
Schaal, S., Sternad, D., Osu, R., Kawato, M., 2004b. Rhythmic arm movement is not discrete. Nat. Neurosci. 7, 1137–1279.
Schlögl, A., Keinrath, C., Zimmermann, D., Scherer, R., Leeb, R., Pfurtscheller, G., 2007. A fully automated correction method of EOG artifacts in EEG recordings. Clin. Neurophysiol. 118, 98–104.
Schmidt, R. A., Lee, T.D., 1999. Motor control and learning, 3rd Human . ed. Champaign, IL, USA.
Schmidt, R.A., Wrisberg, C.A., 2008. Motor learning and performance: a situation-based learning approach, booksgooglecom.
Schmidt, R.S., 1991. Frequent augmented feedback can degrade learning: evidence and interpretations., in: Tutorials in Motor Neuroscience. 59–75.
Schmiedt-Fehr, C., Mathes, B., Kedilaya, S., Krauss, J., Basar-Eroglu, C., 2016. Aging differentially affects alpha and beta sensorimotor rhythms in a go/nogo task. Clin. Neurophysiol. 127, 3234–3242.
Schmitz, R., Schabus, M., Perrin, F., Luxen, A., Maquet, P., Peigneux, P., 2009. Recurrent boosting effects of short inactivity delays on performance: an ERPs study. BMC Res. Notes 2, 170.
Seidler, R.D., 2006. Differential effects of age on sequence learning and sensorimotor adaptation. Brain Res. Bull. 70, 337–46.
Seidler, R.D., Bernard, J. a, Burutolu, T.B., Fling, B.W., Gordon, M.T., Gwin,
References
250
J.T., Kwak, Y., Lipps, D.B., 2010. Motor control and aging: links to age-related brain structural, functional, and biochemical effects. Neurosci. Biobehav. Rev. 34, 721–33.
Seidler, R.D., Noll, D.C., Thiers, G., 2004. Feedforward and feedback processes in motor control. Neuroimage 22, 1775–83.
Shadmehr, R., Brashers-Krug, T., 1997. Functional stages in the formation of human long-term motor memory. J. Neurosci. 17, 409–19.
Shadmehr, R., Mussa-Ivaldi, F. a., 1994a. Adaptive representation of dynamics during learning of a motor task. J. Neurosci. 14, 3208–3224.
Shadmehr, R., Mussa-Ivaldi, F. a., 1994b. Adaptive Task of Dynamics during Learning of a Motor. J. Neurosci. 74, 17.
Shanks, D.R., St. John, M.F., 1994. Characteristics of dissociable human learning systems. Behav. Brain Sci. 17, 367–395.
Shea, C.H., Kohl, R.M., 1990. Specificity and variability of practice. Res. Q. Exerc. Sport 61, 169–177.
Shea, C.H., Lai, Q., Black, C., Park, J.-H., 2000. Spacing practice sessions across days benefits the learning of motor skills. Hum. Mov. Sci. 19, 737–760.
Shea, C.H., Park, J.-H., Braden, H.W., 2006. Age-related effects in sequential motor learning. Phys. Ther. 86, 478–88.
Shea, C.H., Wulf, G., Whitacre, C. a, Park, J.H., 2001. Surfing the implicit wave. Q. J. Exp. Psychol. A. 54, 841–862.
Shea, J.B., Morgan, R.L., 1979. Contextualual interference effects on the acquisition, retention, and transfer of motor skill. J. Exp. Psychol. 5, 179–187.
Shelton, F.N., Reding, M.J., 2001. Effect of lesion location on upper limb motor recovery after stroke. Stroke 32, 107–112.
Shigihara, Y., Tanaka, M., Ishii, A., Kanai, E., Funakura, M., Watanabe, Y., 2013. Two types of mental fatigue affect spontaneous oscillatory brain activities in different ways. Behav. Brain Funct. 9, 2.
Shiner, C.T., Tang, H., Johnson, B.W., McNulty, P.A., 2015. Cortical beta oscillations and motor thresholds differ across the spectrum of post-stroke motor impairment, a preliminary MEG and TMS study. Brain Res. 1629, 26–37.
Shrout, P.E., Fleiss, J.L., 1979. Intraclass Correlations : Uses in Assessing Rater Reliability. Psychol. Bull. 86, 420–428.
Siengsukon, C., Al-Dughmi, M., Al-Sharman, A., Stevens, S., 2015. Sleep parameters, functional status, and time post-stroke are associated with offline motor skill learning in people with chronic stroke. Front. Neurol. 6.
Siengsukon, C., Al-sharman, A., 2011. Sleep promotes offline enhancement of an explicitly learned discrete b. Nat. Sci. Sleep 3, 39–46.
References
251
Siengsukon, C., Boyd, L. a, 2009. Sleep to learn after stroke: implicit and explicit off-line motor learning. Neurosci. Lett. 451, 1–5.
Siengsukon, C., Boyd, L.A., 2008. Sleep Enhances Implicit Motor Skill Learning in Individuals Poststroke. Top. Stroke Rehabil. 15, 1–12.
Sigrist, R., Rauter, G., Riener, R., Wolf, P., 2013. Augmented visual, auditory, haptic, and multimodal feedback in motor learning: A review. Psychon. Bull. Rev. 20, 21–53.
Smith, A.E., Ridding, M.C., Higgins, R.D., Wittert, G.A., Pitcher, J.B., 2009. Age-related changes in short-latency motor cortex inhibition. Exp. Brain Res. 198, 489–500.
Smith, C.D., Scarf, D., 2017. Spacing repetitions over long timescales: A review and a reconsolidation explanation. Front. Psychol. 8, 1–17.
Sokal, R.R., Rohlf, F.J., 2009. Introduction to Biostatistics: Second Edition, New York.
Solis-Escalante, T., Müller-Putz, G.R., Pfurtscheller, G., Neuper, C., 2012. Cue-induced beta rebound during withholding of overt and covert foot movement. Clin. Neurophysiol. 123, 1182–1190.
Spencer, R.M.C., Gouw, A.M., Ivry, R.B., 2007. Age-related decline of sleep-dependent consolidation. Learn. Mem. 14, 480–484.
Srinivasan, R., Tucker, D.M., Murias, M., 1998. Estimating the spatial Nyquist of the human EEG. Behav. Res. Methods, Instruments, Comput. 30, 8–19.
Stagg, C.J., 2014. Magnetic Resonance Spectroscopy as a tool to study the role of GABA in motor-cortical plasticity. Neuroimage. 86, 19-27.
Stagg, C.J., Bachtiar, V., Johansen-Berg, H., 2011a. The role of GABA in human motor learning. Curr. Biol. 21, 480–4.
Stagg, C.J., Bachtiar, V., Johansen-Berg, H., 2011b. What are we measuring with GABA magnetic resonance spectroscopy? Commun. Integr. Biol. 4, 573–5.
Stagg, C.J., Best, J.G., Stephenson, M.C., O’Shea, J., Wylezinska, M., Kincses, Z.T., Morris, P.G., Matthews, P.M., Johansen-Berg, H., 2009. Polarity-Sensitive Modulation of Cortical Neurotransmitters by Transcranial Stimulation. J. Neurosci. 29, 5202–5206.
Stancak, J.A., Pfurtscheller, G., 1995. Desynchronization and recovery of beta rhythms during brisk and slow self-paced finger movements in man. Neurosci. Lett. 196, 21–24.
Stefan, K., Wycislo, M., Gentner, R., Schramm, A., Naumann, M., Reiners, K., Classen, J., 2006. Temporary occlusion of associative motor cortical plasticity by prior dynamic motor training. Cereb. Cortex 16, 376–385.
Stern, Y., 2009. Cognitive reserve. Neuropsychologia.
Stickgold, R., Hobson, J.A., Fosse, R., Fosse, M., 2001. Sleep , Learning , and Dreams : Off-line Memory Reprocessing. Science (80-. ). 294, 1052–1058.
References
252
Stinear, C.M., 2010. Prediction of recovery of motor function after stroke. Lancet. Neurol. 9, 1228–32.
Stinear, C.M., Barber, P.A., Petoe, M., Anwar, S., Byblow, W.D., 2012. The PREP algorithm predicts potential for upper limb recovery after stroke. Brain 135, 2527–2535.
Stinear, C.M., Byblow, W.D., 2014. Predicting and accelerating motor recovery after stroke. Curr. Opin. Neurol. 1.
Stinear, C.M., Byblow, W.D., Ackerley, S.J., SmithMarie-Claire, Borges, V.M., Barber, P.A., 2017. PREP2: A biomarker-based algorithm for predicting upper limb function after stroke. Ann. Clin. Transl. Neurol.
Swayne, O.B.C., Rothwell, J.C., Ward, N.S., Greenwood, R.J., 2008. Stages of motor output reorganization after hemispheric stroke suggested by longitudinal studies of cortical physiology. Cereb. Cortex 18, 1909–1922.
Swinnen, S.P., 1996. Information feedback for motor skill learning: a review, in: Advances in Motor Learning and Control. 37–66.
Takatsuru, Y., Fukumoto, D., Yoshitomo, M., Nemoto, T., Tsukada, H., Nabekura, J., 2009. Neuronal circuit remodeling in the contralateral cortical hemisphere during functional recovery from cerebral infarction. J. Neurosci. 29, 10081–6.
Takemi, M., Masakado, Y., Liu, M., Ushiba, J., 2015. Sensorimotor event-related desynchronization represents the excitability of human spinal motoneurons. Neuroscience 297, 58–67.
Takemi, M., Masakado, Y., Liu, M., Ushiba, J., 2013. Event-related desynchronization reflects downregulation of intracortical inhibition in human primary motor cortex. J. Neurophysiol. 110, 1158–1166.
Tamás Kincses, Z., Johansen-Berg, H., Tomassini, V., Bosnell, R., Matthews, P.M., Beckmann, C.F., 2008. Model-free characterization of brain functional networks for motor sequence learning using fMRI. Neuroimage 39, 1950–1958.
Tan, H.-R.M., Gross, J., Uhlhaas, P.J., 2016a. MEG sensor and source measures of visually induced gamma-band oscillations are highly reliable. Neuroimage 137, 34–44.
Tan, H.-R.M., Gross, J., Uhlhaas, P.J., 2015. MEG-measured auditory steady-state oscillations show high test-retest reliability: A sensor and source-space analysis. Neuroimage 122, 417–426.
Tan, H.-R.M., Jenkinson, N., Brown, P., 2014. Dynamic neural correlates of motor error monitoring and adaptation during trial-to-trial learning. J. Neurosci. 34, 5678–88.
Tan, H.-R.M., Wade, C., Brown, P., 2016b. Post-Movement Beta Activity in Sensorimotor Cortex Indexes Confidence in the Estimations from Internal Models. J. Neurosci. 36, 1516–1528.
Tecchio, F., Porcaro, C., Zappasodi, F., Pesenti, A., Ercolani, M., Rossini, P.M.,
References
253
2006. Cortical short-term fatigue effects assessed via rhythmic brain-muscle coherence. Exp. Brain Res. 174, 144–151.
Tecchio, F., Zappasodi, F., Assenza, G., Tombini, M., Vollaro, S., Barbati, G., Rossini, P.M., 2010. Anodal transcranial direct current stimulation enhances procedural consolidation. J. Neurophysiol. 104, 1134–40.
Tecchio, F., Zappasodi, F., Pasqualetti, P., De Gennaro, L., Pellicciari, M.C., Ercolani, M., Squitti, R., Rossini, P.M., 2008. Age dependence of primary motor cortex plasticity induced by paired associative stimulation. Clin. Neurophysiol. 119, 675–682.
Terribilli, D., Schaufelberger, M.S., Duran, F.L.S., Zanetti, M. V., Curiati, P.K., Menezes, P.R., Scazufca, M., Amaro, E., Leite, C.C., Busatto, G.F., 2011. Age-related gray matter volume changes in the brain during non-elderly adulthood. Neurobiol. Aging 32, 354–368.
Thibaut, A., Simis, M., Battistella, L.R., Fanciullacci, C., Bertolucci, F., Huerta-Gutierrez, R., Chisari, C., Fregni, F., 2017. Using brain oscillations and corticospinal excitability to understand and predict post-stroke motor function. Front. Neurol. 8.
Todd, G., Kimber, T.E., Ridding, M.C., Semmler, J.G., 2010. Reduced motor cortex plasticity following inhibitory rTMS in older adults. Clin. Neurophysiol. 121, 441–7.
Tomassini, V., Jbabdi, S., Kincses, Z.T., Bosnell, R., Douaud, G., Pozzilli, C., Matthews, P.M., Johansen-Berg, H., 2011. Structural and functional bases for individual differences in motor learning. Hum. Brain Mapp. 32, 494–508.
Toth, M., Kiss, A., Kosztolanyi, P., Kondakor, I., 2007. Diurnal alterations of brain electrical activity in healthy adults: A LORETA study. Brain Topogr. 20, 63–76. doi:10.1007/s10548-007-0032-3
Traub, R.D., Bibbig, A., LeBeau, F.E.N., Buhl, E.H., Whittington, M. a, 2004. Cellular mechanisms of neuronal population oscillations in the hippocampus in vitro. Annu. Rev. Neurosci. 27, 247–278.
Traversa, R., Cicinelli, P., Bassi, A., Rossini, P.M., Bernardi, G., 1997. Mapping of Motor Cortical Reorganization After Stroke: A Brain Stimulation Study With Focal Magnetic Pulses. Stroke 28, 110–117
Trepel, C., Racine, R.J., 2000. GABAergic modulation of neocortical long-term potentiation in the freely moving rat. Synapse 35, 120–128.
Tubau, E., Escera, C., Carral, V., Corral, M.J., 2007. Individual differences in sequence learning and auditory pattern sensitivity as revealed with evoked potentials. Eur. J. Neurosci. 26, 261–264.
Turk, R., Notley, S. V, Pickering, R.M., Simpson, D.M., Wright, P.A., Burridge, J.H., 2008. Reliability and sensitivity of a wrist rig to measure motor control and spasticity in poststroke hemiplegia. Neurorehabil. Neural Repair 22, 684–696.
Tyson, S.F., Hanley, M., Chillala, J., Selley, A.B., Tallis, R.C., 2008. Sensory loss in hospital-admitted people with stroke: characteristics, associated

References
254
factors, and relationship with function. Neurorehabil. Neural Repair 22, 166–72.
Uhlhaas, P.J., Singer, W., 2006. Neural synchrony in brain disorders: relevance for cognitive dysfunctions and pathophysiology. Neuron 52, 155–68.
Unsworth, N., Engle, R.W., 2005. Individual differences in working memory capacity and learning: Evidence from the serial reaction time task. Mem. Cognit. 33, 213–220.
van Wijk, B.C.M., Beek, P.J., Daffertshofer, A., 2012. Neural synchrony within the motor system: what have we learned so far? Front. Hum. Neurosci. 6, 1–15.
Van Wijk, B.C.M., Beek, P.J., Daffertshofer, A., 2012. Differential modulations of ipsilateral and contralateral beta (de)synchronization during unimanual force production. Eur. J. Neurosci. 36, 2088–97.
Van Wijk, B.C.M., Beudel, M., Jha, A., Oswal, A., Foltynie, T., Hariz, M.I., Limousin, P., Zrinzo, L., Aziz, T.Z., Green, A.L., Brown, P., Litvak, V., 2016. Subthalamic nucleus phase-amplitude coupling correlates with motor impairment in Parkinson’s disease. Clin. Neurophysiol. 127, 2010–2019.
Van Wijk, B.C.M., Daffertshofer, A., Roach, N., Praamstra, P., 2009. A role of beta oscillatory synchrony in biasing response competition? Cereb. Cortex 19, 1294–1302. doi:10.1093/cercor/bhn174
Vegter, R.J.K., Lamoth, C.J., De Groot, S., Veeger, D.H.E.J., Van Der Woude, L.H.V., 2014. Inter-individual differences in the initial 80 minutes of motor learning of handrim wheelchair propulsion. PLoS One 9, 21–24.
Vidoni, E.D., Boyd, L.A., 2009. Preserved motor learning after stroke is related to the degree of proprioceptive deficit. Behav. Brain Funct. 5, 36.
Vines, B.W., Nair, D.G., Schlaug, G., 2006. Contralateral and ipsilateral motor effects after transcranial direct current stimulation. Cogn. Neurosci. Neuropsychol. 17, 671–674.
Voelcker-Rehage, C., 2008. Motor-skill learning in older adults-a review of studies on age-related differences. Eur. Rev. Aging Phys. Act. 5, 5–16.
Wadden, K.P., Asis, K. De, Mang, C.S., Neva, J.L., Peters, S., Lakhani, B., Boyd, L.A., 2017. Predicting Motor Sequence Learning in Individuals With Chronic Stroke. Neurorehabil. Neural Repair 31, 95–104.
Wadden, K.P., Woodward, T.S., Metzak, P.D., Lavigne, K.M., Lakhani, B., Auriat, A.M., Boyd, L. a, 2015. Compensatory motor network connectivity is associated with motor sequence learning after subcortical stroke. Behav. Brain Res. 286, 136–145.
Walker, M.P., 2005. A refined model of sleep and the time course of memory formation. Behav. Brain Sci. 28, 51–64; discussion 64–104.
Walker, M.P., Brakefield, T., Morgan, A., Hobson, J.A., Stickgold, R., 2002. Practice With Sleep Makes Perfect : Sleep-Dependent Motor Skill Learning. Neuron 35, 205–211.

References
255
Wallstrom, G.L., Kass, R.E., Miller, A., Cohn, J.F., Fox, N.A., 2004. Automatic correction of ocular artifacts in the EEG: A comparison of regression-based and component-based methods. Int. J. Psychophysiol. 53, 105–119.
Wang, L., Conner, J.M., Rickert, J., Tuszynski, M.H., 2011. Structural plasticity within highly specific neuronal populations identifies a unique parcellation of motor learning in the adult brain. Proc. Natl. Acad. Sci. 108, 2545–2550.
Ward, N.S., 2017. Restoring brain function after stroke — bridging the gap between animals and humans. Nat. Publ. Gr. 13, 244–255.
Ward, N.S., 2015. Using oscillations to understand recovery after stroke. Brain 138, 2802–2813.
Ward, N.S., 2008. Getting lost in translation. Curr. Opin. Neurol. 21, 625–627.
Ward, N.S., Brown, M.M., Thompson, a J., Frackowiak, R.S.J., 2003a. Neural correlates of motor recovery after stroke: a longitudinal fMRI study. Brain 126, 2476–2496.
Ward, N.S., Brown, M.M., Thompson, A.J., Frackowiak, R.S.J., 2003b. Neural correlates of outcome after stroke: a cross-sectional fMRI study. Brain 126, 1430–1448.
Ward, N.S., Cohen, L.G., 2004. Mechanisms Underlying Recovery of Motor Function After Stroke. Arch. Neurol. 61, 1844–1848.
Ward, N.S., Swayne, O.B.C., Newton, J.M., 2008. Age-dependent changes in the neural correlates of force modulation: An fMRI study. Neurobiol. Aging 29, 1434–1446.
Waters-Metenier, S., Husain, M., Wiestler, T., Diedrichsen, J., 2014. Bihemispheric transcranial direct current stimulation enhances effector-independent representations of motor synergy and sequence learning. J. Neurosci. 34, 1037–50.
Weiller, C., Ramsay, S.C., Wise, R.J., Friston, K.J., Frackowiak, R.S., 1993. Individual patterns of functional reorganization in the human cerebral cortex after capsular infarction. Ann. Neurol. 33, 181–189.
Wendel, K., V??is??nen, J., Seemann, G., Hyttinen, J., Malmivuo, J., 2010. The influence of age and skull conductivity on surface and subdermal bipolar EEG leads. Comput. Intell. Neurosci. 2010.
Werhahn, K.J., Conforto, A.B., Kadom, N., Hallett, M., Cohen, L.G., 2003. Contribution of the ipsilateral motor cortex to recovery after chronic stroke. Ann. Neurol. 54, 464–472.
Wessel, M.J., Zimerman, M., Hummel, F.C., 2015. Non-Invasive Brain Stimulation: An Interventional Tool for Enhancing Behavioral Training after Stroke. Front. Hum. Neurosci. 9.
Wheaton, L., Fridman, E., Bohlhalter, S., Vorbach, S., Hallett, M., 2009. Left parietal activation related to planning, executing and suppressing praxis hand movements. Clin. Neurophysiol. 120, 980–986.
Willingham, D.B., 1998. A neuropsychological theory of motor skill learning.
References
256
Psychol. Rev. 105, 558–584.
Willingham, D.B., Nissen, M.J., Bullemer, P., 1989. On the development of procedural knowledge. Exp. Psychol. Learn. Mem. Cogn. 15, 1047–1060.
Wilson, J.K., Baran, B., Pace-Schott, E.F., Ivry, R.B., Spencer, R.M.C., 2012. Sleep modulates word-pair learning not motor sequence learning in halthy older adults. Neurobiol. Aging 33, 991–1000.
Wilson, T.W., Heinrichs-Graham, E., Becker, K.M., 2014. Circadian modulation of motor-related beta oscillatory responses. Neuroimage 102, 531–539.
Winship, I.R., Murphy, T.H., 2008. In Vivo Calcium Imaging Reveals Functional Rewiring of Single Somatosensory Neurons after Stroke. J. Neurosci. 28, 6592–6606.
Winstein, C.J., Merians, A., Sullivan, K.J., 1999. Motor Learning after Unilateral Brain Damage. Neuropsychologia 39, 975–987.
Wolf, S.L., Winstein, C.J., Miller, J.P., Morris, D., 2006. Effect of Constraint-Induced Movement. J. Am. Med. Assoc. 296, 2095–2104.
Wolpert, D.M., Diedrichsen, J., Flanagan, J.R., 2011. Principles of sensorimotor learning. Nat. Rev. Neurosci. 12, 739–51.
World Health Organization, 2016. WHO Global Health Observatory. World Heal. Organ. URL http://apps.who.int/gho/data/view.main.HEALTHEXPCAPARM
World Health Organization, 2010. International classification of functioning, disability and health (ICF)., World Health Organization. Geneva, Switzerland.
Wu, J., Quinlan, E.B., Dodakian, L., McKenzie, A., Kathuria, N., Zhou, R.J., Augsburger, R., See, J., Le, V.H., Srinivasan, R., Cramer, S.C., 2015. Connectivity measures are robust biomarkers of cortical function and plasticity after stroke. Brain 1–11.
Wu, J., Srinivasan, R., Kaur, A., Cramer, S.C., 2014. Resting-state cortical connectivity predicts motor skill acquisition. Neuroimage 91, 84–90.
Wu, T., Hallett, M., 2005. The influence of normal human ageing on automatic movements. J. Physiol. 562, 605–615.
Wulf, G., Schmidt, R.A., 1997. Variability of practice and implicit motor learning. J. Exp. Psychol. 23, 987–1006.
Xu, T., Yu, X., Perlik, A.J., Tobin, W.F., Zweig, J.A., Tennant, K., Jones, T., Zuo, Y., 2009. Rapid formation and selective stabilization of synapses for enduring motor memories. Nature 462, 915–919.
Yamawaki, N., Stanford, I.M., Hall, S.D., Woodhall, G.L., 2008. Pharmacologically induced and stimulus evoked rhythmic neuronal oscillatory activity in the primary motor cortex in vitro. Neuroscience 151, 386–395.
Yozbatiran, N., Der-Yeghiaian, L., Cramer, S.C., 2008. A Standardised Approach to Perfroming the Action Research Arm Test. Neurorehabilitation
References
257
& Neural Repair 22, 78–90.
Zeiler, S.R., Gibson, E.M., Hoesch, R.E., Li, M.Y., Worley, P.F., Brien, R.J.O., Krakauer, J.W., 2013. Medial premotor cortex shows a reduction in inhibitory markers and mediates recovery in a mouse model of focal stroke. Stroke 44, 483–489.
Zeiler, S.R., Hubbard, R., Gibson, E.M., Zheng, T., Ng, K., O’Brien, R., Krakauer, J.W., 2016. Paradoxical Motor Recovery From a First Stroke After Induction of a Second Stroke. Neurorehabil. Neural Repair 30, 794–800.
Zeiler, S.R., Krakauer, J.W., 2013. The interaction between training and plasticity in the poststroke brain. Curr. Opin. Neurol. 26, 609–616.
Ziemann, U., Ilić, T. V, Iliać, T. V, Pauli, C., Meintzschel, F., Ruge, D., 2004. Learning modifies subsequent induction of long-term potentiation-like and long-term depression-like plasticity in human motor cortex. J. Neurosci. 24, 1666–1672.
Zimerman, M., Heise, K.F., Hoppe, J., Cohen, L.G., Gerloff, C., Hummel, F.C., 2012. Modulation of training by single-session transcranial direct current stimulation to the intact motor cortex enhances motor skill acquisition of the paretic hand. Stroke. 43, 2185–91.