The nutritional transition and diet-related chronic diseases in Asia: implications for prevention
131
FCND DP No. FCND DP No. 105 105 FCND DISCUSSION PAPER NO. 105 Food Consumption and Nutrition Division International Food Policy Research Institute 2033 K Street, N.W. Washington, D.C. 20006 U.S.A. (202) 862–5600 Fax: (202) 467–4439 March 2001 FCND Discussion Papers contain preliminary material and research results, and are circulated prior to a full peer review in order to stimulate discussion and critical comment. It is expected that most Discussion Papers will eventually be published in some other form, and that their content may also be revised. THE NUTRITIONAL TRANSITION AND DIET-RELATED CHRONIC DISEASES IN ASIA: IMPLICATIONS FOR PREVENTION Barry M. Popkin, Sue Horton, and Soowon Kim
Transcript of The nutritional transition and diet-related chronic diseases in Asia: implications for prevention
F C N D D P N o . F C N D D P N o . 1 0 51 0 5
FCND DISCUSSION PAPER NO. 105
Food Consumption and Nutrition Division
International Food Policy Research Institute 2033 K Street, N.W.
Washington, D.C. 20006 U.S.A. (202) 862–5600
Fax: (202) 467–4439
March 2001 FCND Discussion Papers contain preliminary material and research results, and are circulated prior to a full peer review in order to stimulate discussion and critical comment. It is expected that most Discussion Papers will eventually be published in some other form, and that their content may also be revised.
THE NUTRITIONAL TRANSITION AND DIET-RELATED
CHRONIC DISEASES IN ASIA: IMPLICATIONS FOR PREVENTION
Barry M. Popkin, Sue Horton, and Soowon Kim

ii
ABSTRACT
The nutritional transition currently occurring in Asia is one facet of a more general demographic/nutritional/epidemiological transition that accompanies development and urbanization. The nutritional transition is marked by a shift away from relatively monotonous diets of varying nutritional quality toward an industrialized diet that is usually more varied, includes more preprocessed food, more food of animal origin, more added sugar and fat, and often more alcohol. This is accompanied by shift in the structure of occupations and leisure toward reduced physical activity, and leads to a rapid increase in the numbers of overweight and obese.
The accompanying epidemiological transition is marked by a shift away from endemic deficiency and infectious diseases toward chronic diseases such as obesity, adult-onset diabetes, hypertension, stroke, hyperlipidaemia, coronary heart disease, and cancer. Obesity is now a major public health problem in Asia. Obesity is a problem of the urban poor as well as the rich, and the urban poor have the added predisposing factors associated with low birthweight.
Costs of chronic disease are estimated for China and Sri Lanka. The current and projected costs of these diseases are estimated in terms of lost work output due to mortality and health care costs. In China in 1995, diet-related chronic diseases accounted for 41.6 percent of all deaths and 22.5 percent of all hospital expenditures. The economic costs for this diet-related component are estimated as 2.1 percent of gross domestic product. Diet-related chronic disease is projected to increase to 52.0 percent of all deaths in China by 2025. At that time, dietary factors (principally overweight) will account for an increased share of chronic disease, and childhood factors will decline in significance.
In Sri Lanka, diet-related chronic diseases currently account for 18.3 percent of all deaths and 10.2 percent of public hospital expenditures (but 16.7 percent of all hospital expenditures). The current loss attributable to diet-related chronic disease is estimated as 0.3 percent of GDP. In 2025, chronic diseases are expected to account for 20.9 percent of all deaths. Currently, dietary factors account for 10-20 percent of these chronic diseases. By 2025, dietary factors (particularly overweight) will increase in importance to account for 18-40 percent of chronic disease, and the importance of low birthweight as a predisposing factor will increase.
Few program and policy options to address these issues have been undertaken in Asia. Agricultural policy is important, and the relatively cheap availability of vegetable oil may have had dramatic (adverse) dietary effects in Asia. Price policy has considerable

iii
potential, in particular the pricing of oils. Promoting a traditional diet has been quite helpful in holding down fat intake and obesity in Korea. Health promotion efforts in Mauritius succeeded in reversing several adverse trends contributing to coronary heart disease. Thailand has successfully used mass media for other health promotion efforts and is moving to pilot schemes in the area of chronic disease. And Singapore has been the leader in the region in exercise promotion and weight control in schools.

iv
CONTENTS Acknowledgments............................................................................................................... ix Executive Summary.............................................................................................................x 1. Introduction......................................................................................................................1 2. The Nutritional Transition in Asia: Dietary and Related Factors Leading to
Increases in Chronic Diseases .........................................................................................3
Fetal/Infant Insults and Related Effects (Lbw, Stunting) ....................................... 5 Shifts in the Structure of the Diet ........................................................................... 6 Shifts in Physical Activity Patterns ....................................................................... 11 Urbanization.......................................................................................................... 12
3. The Importance of the Nutritional Transition for Health...............................................13
Diet-Related Chronic Diseases ............................................................................. 13 Diets That Increase the Risk of Chronic Diseases .......................................... 14 General Mortality Trends in Asia ................................................................... 15 Diet-Related Conditions that Increase the Risk of Chronic Diseases ............. 20 Obesity: The Effect of Diet and Physical Activity on the Risk of
Chronic Diseases............................................................................................. 23 The Major Chronic Diseases........................................................................... 26 Health Costs .......................................................................................................... 28 Case Study: China ........................................................................................... 30 Case Study: Sri Lanka..................................................................................... 37
4. Program Options for Diet-Related Interventions to Control Epidemic Chronic
Diseases in Asia .............................................................................................................42
Agricultural Development ..................................................................................... 45 Price Mechanisms ................................................................................................. 46 Preservation of Traditional Diets .......................................................................... 46 Use of Mass Media ............................................................................................... 47 School-Based Programs ........................................................................................ 48
5. Proposals for Policies and Programs Addressing Epidemic Chronic Diet-Related
Diseases in Asia .............................................................................................................49 Appendix Tables ................................................................................................................54

v
Figures................................................................................................................................70 References ........................................................................................................................103
TABLES
1 Country groups for nutritional transition analysis ...................................................4 2 The proportion of economically able men and women aged 18 to 65
employed in each sector of work ...........................................................................11 3 The possible effects of dietary intake and body composition on
noncommunicable diseases....................................................................................16 4 Trends in the proportion of deaths, by cause during the 1960s-90s ......................18 5 Current costs (economic costs of hospital resources and human costs) of
major diet-related chronic disease in China ...........................................................32 6 Summary of costs of diet-related chronic disease in China ...................................33 7 Estimated contribution of diet to chronic disease in China, 1995 .........................35 8 Estimated contribution of diet to chronic disease in China, 2025 .........................35 9 Summary of costs of major diet-related chronic disease in Sri Lanka ..................38 10 Estimated contribution of diet to chronic disease in Sri Lanka, 1995 ...................41 11 Estimated contribution of diet to chronic disease in Sri Lanka, 2025 ...................41 12 Low birthweight prevalence across the Asian Region (the most recent data
for each country from the 1990s) ...........................................................................55 13 Stunting prevalence across the Asian Region (the most recent data for each
country from the 1990s for children ages 2-6).......................................................56 14 Trends in food available for consumption from 1962-96 for Asian
countries grouped by income levels (annual quantity of food in kg/capita) ..........57 15 Trends in the proportion of energy available for consumption, by source
from 1962-96..........................................................................................................59

vi
16 TV ownership in each country grouping (per 1,000 people) .................................60 17 Trends in the proportion of the population residing in urban areas, by
country groupings in Asia ......................................................................................61 18 The prevalence of obesity across the Asian Region (BMI distribution)................63 19 Health data for cost calculations, China .................................................................64 20 Hospital costs for chronic diseases, China, per 1,000 population .........................65 21 Pathways for calculation of dietary effects on chronic disease (PAR’s)
1995 (2025), China ................................................................................................66 22 Health data for cost calculations, Sri Lanka ..........................................................67 23 Data and assumptions used to estimate costs for chronic diseases,
Sri Lanka, 1995 ......................................................................................................68 24 Pathways for calculation of dietary effects on chronic disease (PAR’s),
1995 (2025), Sri Lanka ..........................................................................................69
FIGURES 1 The prevalence of low birthweight in Asia (last data point in the 1990s) .............71 2 The prevalence of stunting in Asia (last data point in the 1990s)..........................72 3 Trends in per capita food available for consumption, lower low-income
group of Asian countries........................................................................................73 4 Trends in per capita food available for consumption, high income group
of Asian countries ..................................................................................................74 5 Trends in per capita food available for consumption of cereals and starch
roots, Asian country groups, by income ................................................................75 6 Trends in per capita food available for consumption of diary and egg
products, Asian county groups, by income............................................................76 7 Trends in per capita food available for consumption of fruits and
vegetables, Asian country groups, by income .......................................................77

vii
8 Trends in per capita food available for consumption of added animal fats, Asian country groups, by income...................................................................78
9 Trends in per capita food available for consumption of added vegetable
oils, Asian country groups, by income...................................................................79 10 Trends in per capita food available for consumption of added sugar,
Asian country groups, by income ..........................................................................80 11 Trends in total energy available for consumption and the sources of energy,
high income countries of Asia ...............................................................................81 12 Trends in total energy available for consumption and the sources of energy,
middle income countries of Asia ...........................................................................82 13 Trends in total energy available for consumption and the sources of energy,
small island countries of Asia ................................................................................83 14 Trends in total energy available for consumption and the sources of energy,
upper low-income countries of Asia ......................................................................84 15 Trends in total energy available for consumption and the sources of energy,
lower low-income countries of Asia ......................................................................85 16 The proportion of adult males engaged in agriculture occupations .......................86 17 The proportion of adult females engaged in agriculture occupations ....................87 18 Ownership of television in Asia.............................................................................88 19 Trends in the proportion of persons residing in urban areas in Asia .....................89 20 Mortality trends in China and India, 1990 and 2020 .............................................90 21 The prevalence of obesity in Asian countries, by gender ......................................91 22 The prevalence of obesity in urban and rural areas in Asian countries .................92 23 The prevalence of obesity in China, Indonesia, Kyrgyz Republic, and
Viet Nam, by income tertile ...................................................................................93

viii
24 The proportion of all households with both underweight and overweight members in the same household in China, Indonesia, the Kyrgyz Republic, and Viet Nam.........................................................................................................94
25 Important pathways for diet-related chronic disease .............................................95 26 Relative risks for coronary heart disease ...............................................................96 27 Relative risks for stroke .........................................................................................97 28 Relative risks for diabetes......................................................................................98 29 Main pathways for diet effects, 1995, China .........................................................99 30 Main pathways for diet effects, 2025, China .......................................................100 31 Causal web of societal influences on obesity prevalence ....................................101 32 The development of policy and environmental interventions to promote
physical activity ...................................................................................................102

ix
ACKNOWLEDGMENTS
The authors thank the two country teams, namely the group from the Chinese Academy of Preventive Medicine led by Professors Chen Chunming and Jin Shuigao, and the group from Hector Kobbekaduwa Agrarian Research and Training Institute (HARTI), Sri Lanka, led by Indra Tudawe, Senior Researcher. The country teams provided invaluable data and extremely useful discussions regarding current policy and future priorities in the area of chronic disease. The analysis in this paper draws very heavily on the country studies. In addition, Dr. Srinath Reddy of the All India Institute of Medical Sciences provided invaluable information. Dr. Robert Beaglehole and Mr. Geoffrey Cannon are thanked for their extensive help in reviewing this document as is Dr. Catherine Geissler for her suggestions. The final version of this document benefited from comments from Joseph Hunt, in particular, and also Armin Bauer of Strategic Planning Department, Asian Development Bank, as well as other participants of the Regional Seminar on RETA 5824, “Nutrition Trends, Policies and Strategies in Asia and the Pacific,” Manila, August, 2000. Our colleagues in this effort, most particularly Stuart Gillespie and Lawrence Haddad, are also thanked for helping in numerous ways. We wish to thank Colleen Doak, Jodi Stookey, and Youfa Wang for exceptional research assistance and also Ms. Frances Dancy and Mr. Tom Swasey for administrative and graphics design help.
Barry M. Popkin and Soowon Kim Department of Nutrition and Carolina Population Center University of North Carolina at Chapel Hill Sue Horton Munk Centre for International Studies University of Toronto

x
EXECUTIVE SUMMARY
The nutritional transition currently occurring in Asia is one facet of a more general demographic/nutritional/epidemiological transition that accompanies development and urbanization. The nutritional transition itself is marked by a shift away from relatively monotonous diets of varying nutritional quality, based on the indigenous staple grain or root, local legumes, vegetables and fruits, and limited food of animal origin. Instead, an industrialized diet is adopted, usually more varied, including more preprocessed food, more food of animal origin, more added sugar and fat, and often more alcohol. This is accompanied by a shift in the structure of occupations and leisure toward reduced physical activity, and leads to a rapid increase in the numbers of overweight and obese.
The accompanying epidemiological transition is marked by a shift away from endemic deficiency and infectious diseases (for which poor nutrition is a risk factor) toward chronic diseases. Of these chronic diseases, major diet-related ones include tooth decay, obesity, adult-onset diabetes, hypertension, peripheral vascular disease and stroke, hyperlipidaemia, angina and coronary heart disease, and a number of cancers. These diseases also have nondietary causes and individuals may be genetically predisposed; nevertheless, diet is also an important contributory factor.
We examine the nutritional and epidemiological aspects of this transition for Asia, using four country groupings by income level (lower-low, upper-low, middle, and high), and a fifth grouping for small islands. Case studies of the costs of the key diet-related chronic diseases were undertaken for China and Sri Lanka.
Section 2 examines the dietary and related factors that contribute to chronic disease in Asia. Given the rapidity of economic growth in many countries, current adults may have increased susceptibility to chronic diseases, since their dietary and activity patterns have vastly changed from when they were young. Also, as children, these same adults faced fetal and early childhood insults related to inadequate nutrition. The lower income countries in south and Southeast Asia still have high levels of low birthweight (LBW) and stunting, and thus the related public health problems will continue well into the future.
We use country-level food disappearance data to examine diet changes in the five country groupings. These confirm the broad patterns discussed above, although with some important variations. Consumption of dairy products show variability, with lower

xi
intakes relative to per capita income in the high-income group, and higher intakes relative to per capita income in the lower-low income group. This variability is related to traditional diets, which in Korea (high-income) contain few dairy products, but which in India (lower-low income) contain relatively high levels of dairy products and ghee (a highly saturated fat product). Of concern is the fact that although food disappearance data indicate increased availability of vegetables and fruit, this is not confirmed by food consumption data in the two case-study countries.
Section 3 examines the epidemiological transition in Asia, and estimates for two countries the associated economic and human costs. We use data on the proportion of deaths by cause for two selected countries in each of the country groups. The general trends suggest that at an early stage in the epidemiological transition, even when the proportion of deaths due to infectious and malnutrition diseases remain high, hemorrhagic stroke is an important cause of death. Hypertension and stroke continue to increase with development, unless countries have adequate resources to contain rates of hypertension. At a later stage of the transition, the full range of cardiovascular diseases emerges as the primary cause of chronic disease deaths. Finally, as incomes continue to rise, deaths from various cancers increase in absolute and relative importance. (High rates of selected cancers, however—related to unique dietary patterns—might occur at much lower income levels in specific countries.)
Some notable variations around the broad general pattern include the emerging epidemic of adult-onset diabetes in urban India, the very high levels of obesity and related conditions in the small islands, and the particularly high levels of cardiovascular disease (CVD) in countries with high-fat diets (e.g., Kyrgyz Republic) but relatively lower levels in countries with lower-fat diets (e.g., South Korea).
We discuss briefly the epidemiological literature. The fetal-programming hypothesis (of Barker and others) is of particular interest in Asia, where adults who were undernourished as children are now faced with urban industrialized diets. More studies of these effects are needed for Asian populations, where patterns of fat deposition may render adults even more susceptible to adverse chronic disease outcomes. Stunting is also a risk factor, even for those with normal birthweight, although here again more studies are necessary for Asia.
Obesity is now a major public health problem in Asia. There is evidence that the international standards used to delineate overweight and obesity may not be appropriate for Asia. Metabolic diseases in Asia tend to occur at lower Body Mass Index (BMI) cutoffs than in industrialized countries. We use data on obesity for eight countries to

xii
represent the patterns occurring across the country groups. Across countries, obesity tends to increase with level of development and urbanization, with some variations (such as the relatively higher levels independent of income in the small islands). South Korea is a special case: the lower obesity level in this country is related to the higher vegetable and lower fat diet (Kim, Moon, and Popkin 2000). However, within the four countries for which we have data, obesity is not very strongly correlated to income. The exception is Indonesia, where income is likely a proxy for urbanization. Obesity is a problem of the urban poor as well as the rich, and the urban poor have the added predisposing factors associated with LBW.
A particular public health problem is related to the fact that 3–15 percent of households contain both an underweight and an overweight individual, usually an underweight child and an overweight non-elderly adult. Expressed differently, in 30–60 percent of households where a household member is underweight, another individual is overweight. This has implications for policy interventions, and indicates that it is simplistic to assume that communicable diseases are associated with poverty and noncommunicable diseases with affluence.
In order to make estimates of costs of chronic disease in the two case studies, we trace the relative risks of underlying diet-related factors (overweight, dietary fat, fruit and vegetable intake) as well as early childhood risk factors (LBW and stunting), onto five important diet-related chronic diseases (hypertension, diabetes, stroke, coronary heart disease [CHD], and cancer). Further study is necessary to refine these estimates for Asian populations. We estimate the current costs of these diseases in terms of lost work output due to mortality and health care costs, expressed both in dollars and as a share of gross domestic product (GDP). We further attempt conservative estimates of the proportion of these diseases attributable to dietary causes, both for 1995 and 2025. This analysis excludes the economic costs of lost days of work and lower productivity due to morbidity from these same diet-related chronic diseases.
In China in 1995, diet-related chronic diseases accounted for 41.6 percent of all deaths and 22.5 percent of all hospital expenditures. The economic costs for this diet-related component are estimated as 2.1 percent of GDP, of which three-quarters is the cost to the hospital system. We estimate that in China, at minimum, one-fifth to one-quarter of these diseases are attributable to dietary factors. Tracing these diseases back to childhood factors suggests that the low birthweight of those who are currently adults accounts for at least 10 percent of stroke and CHD, one-third of diabetes, and almost one-half of hypertension. When the mortality projections from Murray and Lopez (1996) are used, diet-related chronic disease is projected to increase to 52.0 percent of all deaths by

xiii
2025. At that time, dietary factors (principally overweight) will account for an increased share of chronic disease (between 32 and 53 percent, depending on the condition). Childhood factors will decline in significance (stunting is expected to account for between 6 and 22 percent of the chronic diseases).
In Sri Lanka, diet-related chronic diseases currently account for 18.3 percent of all deaths and 10.2 percent of public hospital expenditures (but 16.7 percent of all hospital expenditures). The current loss attributable to diet-related chronic disease is estimated as 0.3 percent of GDP. In 2025, chronic diseases are expected to account for 20.9 percent of all deaths. Currently, dietary factors account for 10–20 percent of these chronic diseases (low birthweight accounts for 1.4–18 percent of chronic diseases, with the greatest impact being on diabetes). By 2025, dietary factors (particularly overweight) will increase in importance to account for 18–40 percent of chronic disease, and the importance of low birthweight as a predisposing factor will increase.
Section 4 briefly reviews the program options. National nutrition policies have had impressive effects in developed countries (particularly Norway), and China has started in this direction by issuing national dietary guidelines. Agricultural policy is important, and the relatively cheap availability of vegetable oil may have had dramatic (adverse) dietary effects in Asia. Price policy has considerable potential, in particular the pricing of oils. Promoting a traditional diet has been quite helpful in holding down fat intake and obesity in Korea. Health promotion efforts in Mauritius succeeded in reversing several adverse trends contributing to CHD. Thailand has successfully used mass media for other health promotion efforts and is moving to pilot schemes in the area of chronic disease. Singapore has been the leader in the region in exercise promotion and weight control in schools, through the “Trim and Fit Scheme.”
Section 5 concludes this study by briefly outlining elements of future programs. These should include, first and foremost, national food and agricultural policies that consider diet-related chronic diseases. Key program elements include agricultural policy shifts, promotion of traditional healthful eating patterns, use of the mass media to build public awareness regarding diet and exercise, and school-based programs. China has gone the furthest toward a national plan, and needs increased capacity to link economic policy to nutritional concerns. There is not enough experience in Asia as yet to move to full-scale programs. However, there is a clear need for a life-cycle strategy for urban nutrition. What is emerging is a clear need for a life-cycle strategy for urban nutrition. There are also unique important capacity building components that could be begun immediately. Implementation and evaluation of pilot studies will also be necessary.

xiv
Finally, it is important to continue to do research on the underlying causes of the demographic/nutritional/epidemiological transition.
Finally, we reiterate the point that noncommunicable disease affects the (urban) poor as well as the rich of Asia. Obesity in three of the four countries examined is not clearly related to higher income. The data show that noncommunicable disease interventions will be most important for the Asian poor over the next half-century. That 20–60 percent of households that have an undernourished member also have an overweight one is indicative of our need to address these issues as issues of poverty and not of wealth.

1. INTRODUCTION
The food supplies and therefore the diets of economically developing countries are now generally in rapid transition. This nutritional transition is accompanied by equally rapid changes in levels of physical activity and body composition. This nutritional transition can be seen as part of a more general demographic/nutritional/ epidemiological transition. The demographic transition, from generally rural societies with low life expectancy at birth and families with many children to generally urban societies with higher life expectancy at birth and fewer children, has been well documented. The epidemiological transition that follows the demographic transition is also fairly well understood: in general, the dominant diseases shift from endemic deficiency and infectious diseases, mostly of earlier life, to epidemic chronic diseases, generally of later life (Omran 1971).
There is now enough evidence to propose a general theory of causally as well as chronologically linked demographic/nutritional/epidemiological transition. Put simply, the theory proposes that when populations face massive social and technological change that includes increasing urbanization as a key component, the pattern of their food supplies and therefore their diets, with associated factors, also changes; and, consequently, disease patterns also change. Historically, this general transition can be traced in countries that are now economically developed, e.g., Britain between the sixteenth and eighteenth centuries as it went through agrarian and industrial revolutions. Now, in Latin America, Africa, and the Asian countries studied in this review, the linked transitions are taking place much faster, and in some cases extremely rapidly.
Assuming the validity of the general theory, it follows that a fuller understanding of the transitions in economically developing countries is vital as a basis for policymaking, not only in the field of public health, but in all policy arenas. Furthermore, if it is true that various diet-related diseases become epidemic at a speed that is a function of the velocity of demographic and nutritional change, and if, moreover, they emerge as epidemics in a demonstrably predictable sequence, the implications for public policymaking are immense. This review gives some indicators for Asia.
As elsewhere in the world, the nutritional transition in Asia is a central part of a sequence that begins with a demographic transition away from rural toward a much more urban society; technological change combined with increased urbanization that leads to a shift from physically active to sedentary occupations; increased use of labor-saving devices at work and home; and changes in income profiles.

2
The nutritional transition itself is marked by a shift from relatively monotonous diets of varying nutritional quality, based on the indigenous staple grain or root, locally grown legumes, vegetables and fruits, and limited food of animal origin (except among prosperous subpopulations), to what can be described as relatively industrialized diets, usually more varied, including more preprocessed food, more food of animal origin, more sugar and fat, more processed drinks and foods, and often more alcohol. The most immediately obvious result of the combination of such energy-dense diets with physically inactive lives is a rapid increase in numbers of overweight and obese people.
The epidemiological transition is marked by a shift from predominantly endemic deficiency diseases (themselves caused by inadequate diet) and infectious diseases (the risk of which is often increased by poor nutrition), to predominantly epidemic chronic diseases. Chronic diet-related diseases vary in severity and significance. These certainly or probably include tooth decay and various gastrointestinal disorders; obesity; adult-onset diabetes; hypertension, peripheral vascular disease, and stroke; hyperlipidemia, angina, and coronary heart disease; and a number of cancers, including those of the mouth, throat, esophagus, lung, stomach, breast, prostate, colon, and rectum. Most of these diseases also have nondietary causes, e.g., use of tobacco and lung cancer. They are also often hereditary, but any inherited genetic predisposition to disease is usually unmasked only as a result of inappropriate environmental factors, including diet.
Section 2 of this review describes the nutritional transition in Asia, and includes a discussion of key nutrition-related changes that contribute to key chronic diseases. These include, among others, fetal and infant nutrition insults and poor dietary and activity patterns. We do not discuss other behaviors that are changing concurrently in Asia and also contribute to these same diseases, such as increased tobacco use and air pollution. Section 3 reviews chronic diseases affected by these dietary and related lifestyle changes. Section 3 then examines the health and economic cost consequences of the trends, while Section 4 reviews intervention options. Finally, Section 5 addresses program and policy options.
Sri Lanka and China were selected as cases for obtaining the health cost data. In Section 3, when possible, data are presented for each country to set the stage for the economic analysis in Section 4.
Different countries in Asia are at different stages of the nutritional transition. Also, there are large subpopulations within even the poorest Asian countries that already face a heavy burden from diet-related chronic diseases. For instance, urban residents and residents in several wealthier states such as the Punjab in India have a very different

3
dietary, body composition, and chronic disease profile than Indians from other residential backgrounds. Indeed, residents of urban areas in India have very high rates of obesity and suffer many key cardiovascular diseases (Reddy and Yusuf 1998; Committee on Research 1998). There are also subpopulations in most Asian countries that face conditions of food insecurity and undernutrition. While there are significant differences in the undernutrition profiles of Asian men and women, gender inequality in obesity will be shown to be smaller than in other regions of the developing world.
We are unable to provide a full sense of the diversity within each Asian country, as this review makes a necessarily broad sweep of countries in Asia. We present our analysis for country groupings when possible (mainly for data on food ); for other purposes, we present countries representative of each grouping. The diverse countries covered in this review are those supported by the Asian Development Bank (ADB), and we therefore also include Western Pacific countries. The countries of the ADB region are grouped for this analysis and review according to programmatic and policy needs related to the nutritional transition. While a large number of indicators could be used to create typologies, we have used only national per capita income. The groupings are noted in Table 1.
We attempt, when possible, to present data for all countries and regions, or at least sample countries within each region. The exception is the economic cost calculations for the two pilot countries. We worked with our collaborators in those countries to collect data on health care costs.
We created a separate grouping for the small islands mainly in the western Pacific region, which are in a relatively advanced stage of epidemiological and nutritional transition and face some of the greatest problems of diet-related chronic diseases. Their needs, their institutional and logistical infrastructure, the underlying causes of their nutrition-related problems, and their ability to absorb loans are very different from the larger countries of the region.
2. THE NUTRITIONAL TRANSITION IN ASIA: DIETARY AND RELATED FACTORS LEADING TO INCREASES IN CHRONIC DISEASES
A large number of case studies, undertaken by us as well as others, present detailed information from surveys of households and individuals in a number of Asian countries. These studies all show marked shifts in the structure of foods and diets

4
Table 1: Country groupings for nutritional transition analysis
Transition grouping Country name 1998 GNP per capita High income
Singapore
30,060
Hong Kong, China 23,670 (GDP) Korea, Rep. 7,970 Middle income Malaysia 3,600 Thailand 2,200 Kazakhstan 1,310 The Philippines 1,050 Small islands Fiji 2,110 Micronesia, Fed. Sts. 1,800 Tonga 1,690 Marshall Islands 1,540 Vanuatu 1,270 Maldives 1,230 Kiribati 1,180 Samoa 1,020 Papua New Guinea 890 Solomon Islands 750 Cook Islands - Nauru - Tuvalu - Low income Upper Uzbekistan 870 Sri Lanka 810 China 750 Indonesia 680 Lower Pakistan 480 India 430 Mongolia 400 Bangladesh 350 Kyrgyz Republic 350 Tajikistan 350 Lao PDR 330 Viet Nam 330 Cambodia 280 Nepal 210 Afghanistan <760 Bhutan <760 Myanmar <760

5
consumed. Typically, there are dramatic increases in overall fat intake, a corresponding reduction in the proportion of energy from starchy staple foods, accompanied by a shift from coarse grains and legumes toward more refined grains (mainly rice and wheat); greater intake of meat, fish, dairy products, and edible oils (e.g., Popkin et al. 1993; Popkin 1994; 1998). The general effect is to make diets less bulky and denser in energy.
There are important variants in some Asian countries. For instance, the increase in fat intake and decrease in vegetable intake is far less in South Korea than might be expected (Kim, Moon, and Popkin 2000). Unfortunately, in an increasing number of Asian countries, the nutritional transition is associated with a reduction in fruit and vegetable intake. However, there is a general marked shift in the structure of the food supplies and diets in the countries studied as well as in economically developing world in general (Drewnowski and Popkin 1997; Shetty and James 1994).
These changes have not been systematically documented in any region of the world. Certainly no one has attempted to look at Asia as an entity and attempt to understand these shifts in food supplies, diet, physical activity, and body composition. This review looks at trends at the national level within Asia and at some of the factors that evidently predict high levels of chronic disease. These include LBW and stunting, inappropriate diets, low levels of physical activity, and urbanization. We mainly use country-level analyses, but also use household- and individual-level studies. A broad approach using averages inevitably neglects the enormous heterogeneity within countries.
FETAL/INFANT INSULTS AND RELATED EFFECTS (LBW, STUNTING)
A growing set of studies suggests that perinatal and infant nutrition insults affect predisposition to cardiovascular disease (CVD), obesity, hypertension, and adult-onset diabetes, and hence would make these early nutrition-related insults a contributor—albeit not the main contributor—to diet-related chronic diseases. We consider this factor to be of special importance in rapidly developing countries such as those of Asia where high rates of LBW and stunting are accompanied by concurrent rapid shifts in diets, activity patterns, and increased obesity. In the next section, we provide a sense of the linkages and rationale for this inclusion. The concern for fetal and infant problems relates to the vast fetal origins literature (Barker 1992; 1994; 1997). Low birthweight associated with thinness and stunting have both been linked with these adverse risk profiles, but the mechanisms are unclear, and this leads to uncertainly about what intervention options are best (e.g., Lucas, Fewtrell, and Cole 1999; Waterland and Garza 1999). There are very high levels of LBW among the lower low-income countries, particularly the south Asian

6
countries and Laos. There is enormous heterogeneity in LBW prevalence between countries in the same groupings. Figure 2 provides a sense of the levels of LBW in Asia (see also Appendix Table 12). These examples are drawn from the World Health Organization (WHO) LBW registry, from which we tried to select results that fit a range of studies for each country. An excellent review of the south Asian region has been used to supplement these data (Sachdev 1997a).
We could not find systematic data on the proportion of LBW babies who were born with disproportionate intrauterine growth retardation (IUGR), that is, intrauterine growth retarded with a low ponderal index (PI). In one 12-month birth cohort sample of all pregnancies in 33 communities representative of the metropolitan Cebu region of the Philippines, 36.7 percent of LBW babies had a low PI (disproportionate at birth) (Adair and Popkin 1988). We return to this topic when we discuss the fetal programming issue and the effects of LBW on subsequent increased likelihood of a range of cardiovascular-related outcomes.
We constrained ourselves to use of datasets from large nationally representative surveys for our analysis of stunting (defined as two Z-scores below the height-for-weight standard and using children aged 2–5.9 years for our sample). The data presented come from nationally representative surveys, so we have confidence in their results. We find a very high prevalence of stunting in Bangladesh and Indonesia (countries with higher levels of LBW) (Figure 2, see also Appendix Table 13), but we also find high levels in other upper- as well as lower-low income countries and the only small island country for which we have data. Elsewhere researchers have shown a decline in the proportion of children who are stunted in Asia, albeit one that is slower than the reductions in wasting and LBW (ACC/SCN/IFPRI 2000).
SHIFTS IN THE STRUCTURE OF THE DIET
We document the diet trends described above for Asia using food disappearance data. These are the only comparable data for each country of the region. The shifts in the dietary patterns (both in terms of overall energy sufficiency and the structure of food consumed) presented by examining these food disappearance data and those from household food surveys are similar. In general, Asian food supplies are becoming less dependent on local production and evidently more diverse, and frequently monotonous diets based on starchy staple grains and roots are becoming replaced by diets that include much more fat, more foods of animal origin, and often more sugary food and drink, much of which is produced elsewhere in the country or imported (Popkin 1998). At the same

7
time, the shift toward diets that are notably more energy-dense, containing much more fat, more added sugar, and sometimes more alcohol, with a marked reduction of starchy staples is evidently having the effect of increasing the incidence of diet-related chronic diseases, some of which have become epidemic in Asian countries with remarkable speed.
The Food and Agriculture Organization of the United Nations (FAO) food disappearance data for the period of 1961–1997 measure in a completely comparable manner the total food available for human consumption. Food available for consumption sums up total food production plus imports minus exports, minus losses from processing at the mill level, minus food fed to animals. These data reasonably approximate in all countries the food trends at the national level. They do not reflect actual consumption, however, as there are additional losses in the food chain that link producers and mills to the consumers. Typically, scholars who have compared food disappearance data with household and individual food intake data estimate that disappearance data measure about 20–27 percent more food available for consumption than the actual consumption levels, but there is little research to allow us to select the actual level for each country. In addition, it is important to note that a greater proportion of perishable foods is lost, wasted, or discarded between production and consumption than is the case with nonperishable foods. This would mean that food balance data overestimate the amount of fruits and vegetables available for consumption relative to grains and tubers. To the extent that the assumptions of food extraction and perishability have not been adjusted over time, it is possible that improvements in storage and distribution of food, in particular for more perishable fruits and vegetables, might underestimate intake today more than they did two decades ago.
Aggregate disappearance data also measure aggregate consumption and do not measure food distribution to regions, urban or rural populations, let alone to households of various income levels and individuals in various age-gender groupings. In addition, by examining Asia in terms of country groupings, we lose the detail of between-country variations.
Several transition country groups are dominated by one or two countries with large populations, e.g., in the high-income group by South Korea, in the middle-income group by Thailand and the Philippines, in the small islands by Papua New Guinea, in the upper-low income group by China, and in the lower-low income group by India.
The graphs and tables present weighted averages for each country using the 1996 population figures to create a weighted value for each grouping of countries. All results

8
are presented as three-year averages in terms of annual per capita food available for consumption. Each data point in every five years was connected with lines and the graphs are shown continuously.
The total energy available for consumption has increased across the region, and most countries are experiencing large shifts in the structure of their diet. The data for aggregate food available for consumption are summarized in Appendix Table 14. Then, the proportion of energy by components is examined for each country grouping. The graphs on the trends in per capita food availability are presented for contrasting ends of the income spectrum—the lower-low income and high-income countries in Figures 3 and 4, respectively. There are marked differences among the lowest-income countries, dominated by India, showing an actual increase in cereal and starchy root availability but more modest increases in other foods. In contrast, the highest-income countries have decreased their cereals/starchy roots supply, tripled their fruit and vegetable availability, and increased their dairy/egg, meat/poultry, and added sugar availability.
There is a marked decline in cereal and starchy roots available for consumption, the items that provided much of the energy in the diet of Asians in past centuries, except for increases among lower-low income and a slight increase among upper-low income countries (Figure 5). These aggregate trends mask a marked shift away from so-called coarse and higher-fiber grains to rice and wheat, which are usually refined (e.g., Guo, Popkin, and Zhai 1999; Guo et al. 2001; Popkin et al. 1993).
In contrast, among all countries there is a marked increase in availability of eggs and dairy products (see Figure 6). Surprisingly, the highest level of intake is found among the lower-low income countries—in part because of the importance of South Korea among the high-income countries, which traditionally has consumed low amounts of dairy products. Hong Kong has a high dairy product supply, but it accounts for little of the total weighted average in the high-income group. Also, as India is the predominant factor in the lower-low income group, and is a high dairy consuming country, dairy availability in the lower-low income group is high relative to other groups. This is important, since eggs and dairy products are such important sources of saturated fats. Indian consumption of ghee, a particularly highly saturated fat product, is important in that high consumption of saturated fat is closely related to chronic diseases.
Trends in meat and dairy products, which are major sources of saturated fat, with their large adverse effects on a range of chronic diseases, are next examined. Projections from the International Food Policy Research Institute (IFPRI) show very rapid annual growth in consumption of meat and dairy products and also total consumption from 1993

9
to 2020 (Delgado et al. 1999). For China, meat and dairy consumption are projected to increase at a 3 percent and 2.8 percent rate per year. The rates of increase for other east Asian countries are about 2 percent, and for southeast Asia about 2.8 percent (Delgado et al. 1999). Other research from China finds a much higher income elasticity and rate of change in meat and dairy product consumption (Guo et al. 2000).
Fruit and vegetable availability has increased markedly for the high- and upper-low income countries. It remains very high for the small islands and is improving slightly for the middle- and lower-low income countries (Figure 7).
More unsettling is the continued reduction in fruit and vegetable intake indicated by household surveys in China and several other countries. Household food consumption data from Sri Lanka show a marked decline in fruit and vegetable consumption over the 1978–1995 period. In 1981–1985 in two national household consumption studies, urban and rural households in Sri Lanka averaged about 340 grams per capita, and this dropped to 215 grams per capita per day in 1995. These figures are derived from highly comparable national food expenditure and consumption surveys that utilize nationally representative samples to study month-long food consumption patterns.
Food availability increases are most marked for all countries in the region for both added animal fats and vegetable oils. The levels of availability are particularly high for edible vegetable oils, which vary in origin from the red palm oils to coconut oils to corn, soybean, and cottonseed oil from country to country. In Sri Lanka and the Philippines, for example, coconut oil is a major source of saturated fat. In Malaysia, more edible oil comes from red palm oil, which has a higher P:S (polyunsaturated to saturated fat) ratio, a more healthful alternative. Also, while the processing of these edible oils varies greatly, there is no systematic research on their composition. For instance, one study has found transfatty acid levels of about 50 percent in “Dalda,” a vegetable ghee widely consumed in India (Willett, personal communication, 2000). Figures 8 and 9 show that the high-income countries have already moved to very high levels of added fats available in the food supply but the low-income countries—both upper- and lower-low income—have shown very rapid recent increases in availability of these items. Increased edible oil is a key reason for the marked increases in energy density of the Asian diet (e.g., Drewnowski and Popkin 1997; Guo, Popkin, and Zhai 1999).
Availability of sugar, added in food production and at home, is increasing among the middle- and high-income countries and is high in all countries except the upper-low income ones (see Figure 10). In particular, note the high level for lower-low income countries and the contrasting very low level for upper-low income countries. This latter

10
result relates mainly to the very low levels of added sugar consumed by the Chinese as compared to south Asians.
These trends in food availability indicate a marked shift in the structure of the food supplies and diets of Asian countries. In general, Asian diets now contain less starchy staple grains and roots, and more fat, sugar, and foods of animal origin. There are parallel changes in availability of total energy and in macronutrients.1 These trends match fairly well more accurate household- and individual-level data on trends in sources of energy. The high-income countries in Asia, as demonstrated in Figure 11, have shifted away from diets dominated by complex carbohydrates to diets with more fats, added sugar, and protein (see, also, Appendix Table 15). These countries have energy available for consumption over 3,000 kilocalories (kcal) per capita per day. Figures 11 to 15 present these same energy source data for the other country groupings. The bulk of the Asian population has fewer than 3,000 kcal available for consumption, and as already indicated, actual consumption is lower.
In summary, food supplies and diets in Asia are rapidly changing in nature, in ways that have positive as well as negative outcomes. On the one hand, adequate and more diverse diets improve micronutrients status and so decrease incidence of deficiency diseases. Allen and Gillespie (2000) show that dairy foods and foods of animal origin contain nutrients that can improve the nutritional quality of otherwise monotonous diets.
1In Figures 11 through 15, we created subcategories within the macronutrients to emphasize some of the changes in availability of sources of energy. For energy from carbohydrates, we separated energy from added sugar to meaningfully describe the increase in availability of added sugar in terms of its energy contribution. To do this, we took energy from sweeteners in food balance sheets for “energy from added sugar” and simply subtracted this from energy from total carbohydrate to get “energy from carbohydrate excluding added sugar.” This is a rough estimate for both because energy from sweeteners comes, though minimally, from other nutrients as well. Similarly, for “energy from added animal fat,” we took energy from animal fats in the food balance sheets (such as butter, ghee, and fish liver oil). In the food balance sheets, the term “animal fats” means a limited category of foods. It includes only animal fats that are added, and does not include any other fat of animal origin such as the fats present in meats. At the same time, energy from added animal fat also includes a minimal amount of energy from other nutrients, as in the case of added sugar. Then we made a very rough approximation for “energy from vegetable oil” by subtracting energy from added animal fats from total fat energy. It is , therefore, essentially “energy from fat excluding added animal fats.” “Energy from vegetable oil” in the figures is different from calories from vegetable oil given in the food balance sheets. From the food balance sheets, calories from animal fats and calories from vegetable oils do not add up to energy from total fat, because there are other sources of fat in the food supply besides added animal fats and vegetable oils . Even though this is a very rough approximation for both the energy from added animal fats and vegetable oils, we chose to take this approach to give an idea of the increasing trends of energy availability from both of the fat sources and to distinguish these in any possible way that is comprehensive. We note here again that while it is labeled this way in the figures, energy from fat excluding added animal fats is not necessarily equal to energy from vegetable oils.

11
But on the other hand, the rapid shift toward more energy-dense diets containing more fat, more saturated fat, often more sugar, and more foods of animal origin is evidently contributing to the increasing incidence of chronic diseases.
SHIFTS IN PHYSICAL ACTIVITY PATTERNS
Reduced moderate-to-vigorous physical activity by persons of all ages and corresponding habitual inactivity accompany the nutritional transition (Popkin 1998). One of the most inexorable shifts with modernization and industrialization is the reduction of physical activity at work and home for both men and women. The only information from Asia available at the national level is on the occupational distribution of men and women in each of our country groupings. As occupations shift from agriculture and manual labor to manufacturing and the service sector, levels of energy expended naturally drop. Few studies have measured the equally profound shifts in activity within any occupation. In China, these shifts toward reduced activity within the same occupation have been related to increased obesity (Paeratakul et al. 1998). In Figures 16 and 17, we present the data for each region for men and women for the proportion in agriculture, service, and manufacturing (see also Table 2). These national data on the structure of employment are based on large, continuous national surveys of employment. Men in Asia in all groupings are shifting from agriculture toward industry and service jobs much more than women.
Table 2: The proportion of economically able men and women aged 18 to 65 employed in each sector of work
Percent agriculture Percent industry Percent service Region 1960 1970 1980 1990 1960 1970 1980 1990 1960 1970 1980 1990 Male High income 7* 4.2* 24.3 14.4 52.4* 51.5* 32.2 37.7 40.6* 44.3* 38.2 45.4 Middle income 64.1 57.2 50.9 51.6 14 17.5 19.2 18.8 22 25.3 30 28.7 Small islands 80.5 75.7 70.8 66.8 8.4 9.2 10.2 10.6 11.2 15.1 19.1 22.6 Upper low Income 79.9 73.5 69 66.8 6.8 12 15.3 16.4 13.3 14.5 15.7 16.8 Lower low Income 71.4 67.9 63.6 59.4 11.2 12.6 13.9 16.3 17.4 19.6 22.6 24.4 Female High income 9.7* 4.7* 31.5 17.8 49.7* 61.2* 27.6 29.9 40.7* 34.2* 37.8 50.8 Middle income 49.7 42.3 36.5 40.9 18.3 17.7 17.8 15.1 32 40 45.7 42.6 Small islands 92.7 91.2 78.8 75 2.5 3.1 4.9 6.6 17.3 16.6 16.3 18.3 Upper low income 84.5 80.1 75 72.9 6.3 8 12.2 13.3 9.2 11.9 12.9 13.8 Lower low Income 82.7 79.5 81 74.4 8.9 10.5 9.8 14.3 8.8 10.6 9.2 11.4

12
We have found no studies from Asia of another dimension of activity, the mode of transportation. The shift away from walking and cycling to mass transit and cars represents a major change in regular physical activity and thus energy expenditure.
Increased inactivity outside work is also apparent. One of the most remarkable changes in Asia is an explosion of new information sources and ways of reaching households in the most isolated villages and towns. The expansion of mass media has the potential to play a major role as a source of consumer knowledge and attitudes. The percentage of households that own TVs has increased dramatically throughout Asia, in particular in China and the higher-income countries. For instance, in China, Chinese Health and Nutrition Survey (CHNS) data show that in even the lowest income tertile, TV ownership increased from 43 percent of households in 1989 to 76 percent in 1993, to 89 percent ownership in 1997. Habitual TV watching affects diet and activity patterns. Diets may change as a result of exposure to advertising and role models in the programs themselves, and as a result of snacking while watching TV. Also, watching TV is itself a sedentary activity, and displaces more active leisuretime activities. There is a vast literature in higher-income countries that has linked TV use to greater inactivity and obesity, but no studies to date have focused on child or adult TV viewing and its effects in Asia.
Weighted averages for TV ownership per 1,000 people for the country groupings in each time period have been created. As is clear, the explosion of TV ownership began much earlier for higher-income countries but now has reached all countries in the region. The level and the rate of increase in ownership are far greater in the upper-lower and middle-income countries. Figure 18 provides these regional data, and Appendix Table 16 presents country data.
URBANIZATION
During the last half century there has been a large shift of population from rural to urban areas throughout the economically developing world. Urbanization is occurring more slowly in Asia than in Latin America, the Middle East, and Africa. In Asia, the rate of increase in population in urban areas in the period from the 1960s to the present has been over four times greater than in rural areas. The proportion of the urban Asian population has doubled in the past three decades and the trend continues (see Figure 19 and Appendix Table 17). In this century, rural Asia will lose population while the urban areas will grow (United Nations 1995). As people move into cities, their food supplies, diets, and body composition change. High levels of obesity are particularly apparent in

13
lower- and middle-income countries. Urban occupational structures, transportation and food market systems, housing markets, and concentration of population combine to create quite different patterns of food supply and demand and time allocation (Popkin 1999). The consequence is overnutrition, which means that people eat more than they need, which leading to overweight, obesity, and other major chronic diseases such as heart disease. In the economically developing world, rapid urbanization results in the coexistence of malnutrition and obesity within many households (discussed in Section 3).
Elsewhere we review in detail diet and activity patterns linked with urban residence (Popkin 1999). The urban diet, even in very low-income countries and among the poorest areas of cities, contains much more energy from fats and sugar. The food is much more likely to be processed, and most often consists of more highly refined cereals and sugars and fewer unrefined, staple foods than the rural diet. Even poor people in urban areas can afford processed foods relatively high in fat and also in refined starches and sugars. Edible oil, in particular, can be very cheap. This enables people on low incomes to prepare meals that approximate to those eaten only by higher-income groups in previous decades (Drewnowski and Popkin 1997). Further, the higher intake of processed food incorporates much more salt in the urban diet, another factor linked with higher rates of hypertension in urban Asia.
In general, in Asia, urban diets are more diverse than those eaten by rural people, and contain more animal food generally (and therefore more animal protein), and often more micronutrients. However, the effect of relatively energy-dense diets and physical inactivity is to increase the incidence of overweight, obesity, and other diet-related chronic diseases.
3. THE IMPORTANCE OF THE NUTRITIONAL TRANSITION FOR HEALTH
DIET-RELATED CHRONIC DISEASES
It has been agreed for many years that the nature and quality of diet affect the risk of acquiring a number of chronic diseases, including those that have for half a century been the major causes of premature death in the economically developed world (Cannon 1992; Committee on Diet and Health 1989). Such diseases vary in severity. They include diseases that are disagreeable, notably tooth decay and various gut disorders; that are disabling, such as adult-onset diabetes, obesity, and osteoporosis; and that are deadly, notably cardiovascular disease (with its precursors, hyperlipidaemia and angina),

14
cerebrovascular disease (and its precursor, hypertension), and cancer (Committee on Diet and Health 1989). A recent major report (WCRF 1997) specifies the major cancers the risk of which is modified by food and nutrition (including alcohol), and to physical activity and body composition; these include cancers of the mouth, throat, and esophagus, lung, breast, endometrium, stomach, colon, and rectum. Some of these cancers are also caused by nondietary factors, notably use of tobacco with cancers of the mouth, throat, esophagus, and lung. Similar reports have focused on diet-related factors and CVD (Committee on Diet and Health 1989; Krauss et al. 1998; Labarthe 1998; WHO 1990).
It is possible that additional chronic diseases are related to diet. The cancer report cited above lists other cancers for which the evidence of relationship with diet is inconclusive. And some scientists propose mechanisms that indicate that chronic diseases of any system of the body, including the nervous system, may be affected by diet and associated factors, although epidemiological research on such diseases is unconvincing.
An early report (Trowell and Burkitt 1985) proposed that chronic diseases tend to emerge and become epidemic as a result of a transition to diets to which human physiology is not adapted, in a predictable order. Thus, overweight and obesity, adult-onset diabetes, and cerebrovascular disease become public health problems within a generation, and severe gut diseases, notably colon and rectal cancer, emerge later, whereas coronary heart disease (CHD) and breast cancer may take two generations to become epidemic. This hypothesis, based on observation and anecdote, has tended to be supported by epidemiological studies but has not been rigorously studied in the form hypothesized (e.g., see WCRF 1997).
Diets That Increase the Risk of Chronic Diseases
As noted above, a large number of consensus documents and summary conferences have established that there is a confluence of risks for various specific chronic diseases linked with certain diet and lifestyle patterns. Broadly, diets that increase the risk of chronic diseases are relatively high in total fat, saturated fat, sugar, salt, alcohol, refined grains, and foods of animal origin, whereas diets that protect against chronic diseases are relatively high in minimally processed grains, legumes, fiber, vegetables, fruits, and other foods of plant origin. Estimates of the extent to which chronic diseases can be reduced by appropriate diets and lifestyles have been made for cancer, and cluster around an estimate of 30 to 40 percent (WCRF 1997). Comparable estimates, based on epidemiological and other analyses, could be made for other major chronic diseases.

15
It is noted that plant-based diets that are also monotonous, very high in starchy staple grains or roots, with few vegetables and fruits or foods of animal origin, increase the risk of deficiency diseases. Such “poverty diets” (WCRF 1997) emphasize the need for plant-based diets to be varied and not too high in grains or roots of one type.
Perhaps the most important aspect of these findings is that the linked demographic and nutritional transitions produce lifestyle shifts that to date are associated with rapid increases in the risk of major diet-related chronic diseases. This conclusion emphasizes the importance of the subject matter of this review, and of further research to underpin effective policies and programs designed to control epidemic chronic diseases. As noted above, there is a wide range of evidence linking changes in food supplies, diets, and associated factors with chronic disease incidence. In Table 3, we summarize the major relationships between various components of the diet and chronic diseases. We discuss many of these points briefly next, describing first the general mortality trends and then examining in turn effects of fetal programming, impaired postnatal growth (stunting and obesity), and adult diet and inactivity, on the two diseases that are now the major causes of premature death in many countries in transition: cardiovascular disease and cancer.
It is still commonly supposed that infectious and deficiency diseases are the main public health problems throughout Asia, but the next section’s review of shifts in mortality reveals a more complex picture.
General Mortality Trends in Asia
While these endemic pathologies remain very important, infectious and parasitic diseases, which once amounted to the bulk of all deaths in Asia, no longer represent the major cause of death in any country represented in this study. In the countries furthest along on the nutritional transition, such as Singapore, with higher fat diets and higher rates of obesity, cancer and cardiovascular diseases together account for close to 60 percent of deaths, a rate similar to North America and Western Europe. In China and South Korea, more than half of deaths are now caused by these two clusters of chronic disease, which are also important causes of death in less developed countries.
However, there are no systematic data on morbidity available across the region. Few countries in Asia have quality representative morbidity data for a meaningful period. But we can construct from WHO sources reasonably reliable trends on the proportion of deaths by cause for selected countries in each grouping to provide a sense of mortality trends across the region. The cause of death data are not uniformly collected and

16
Table 3: The possible effects of dietary intake and body composition on noncommunicable diseasesa
Dietary factor
Mechanism
Health outcomes
Excess energy intake↑
Adipose tissue development↑, metabolic changes
NIDDM↑(a), CHD↑(a), hormone-dependent (e.g., breast) or GI (e.g., colorectal) cancers ↑(a), osteoarthritis ↑(a), gallbladder disease↑(a)
Total fat ↑
Passive overconsumption, IR↑
NIDDM↑(b), CHD↑(a), prostate cancer↑(b), breast cancer↑(c), colorectal cancer↑(b)
Animal fat↑
Unclear, fat metabolism by-products
Colon cancer↑(b)
Saturated fat↑
TC↑, LDL-C↑, TG↑, HDL-C↓
Arteriosclerosis ↑(a), CHD↑(a), hypertension↑(b), NIDDM↑(b)
Trans-fatty acids↑
LDL-C↑, HDL-C↓, TC↑, immune system↓
Cancers↑ (d), CHD↑ (c)
Monounsaturated fatty acids↑
LDL-C↓
Cancers↓(c), CHD↓(b)
Polyunsaturated fatty acids↑
HDL-C↑, some are anti-inflammatory
Cancers↑(b), CHD↓(b)
Sodium↑
Abnormal renal function↑, disturbed electrolyte balance↑
Hypertension↑(a), stroke↑(a)
Antioxidants↓
Oxidize LDL-C, change functions
CHD↑(b)
Dietary fiber↓
TC↑, HDLC↓, IR↑, TG↑
CHD↑(b), NIDDM↑(b), Stroke↑(c), colon cancer (c)↑
Fetal malnutrition/stunting↑
Central adipose tissue↑, IR↑, metabolic changes
NIDDM↑ (b), hypertension↑ (b), CHD↑ (b)
Fruits and vegetables ↑
Prevent oxidization LDL-C, fiber↑
Stroke↓ (b), cancers↓ (a)
Notes: TC (total cholesterol); LDL-C (low-density lipoprotein cholesterol); TG (triglyicerides); HDL-C (high-
density lipoprotein cholesterol); IR (insulin resistance). Category of the relationship between dietary factors and health outcomes: a: well established; b: fairly well established but data not complete; c: still under debate; d: suggestive data to date.
a Epidemiological studies support much of what is noted here but much controversy surrounds this literature; in particular the mechanisms that are presented in the table. In addition, we omitted the effects o f reduced physical activity that are most important in increasing obesity, reducing fitness, and increasing insulin resistance.
classified across the region (cf. Arriaga 1998). Death registrations are fully operational in only a few Asian countries and there are many gaps, but these data at the national level provide a reasonable approximation of mortality trends. These death data are felt to be incomplete in many countries, so we focus on the proportion of deaths by cause rather than the age-specific rates or overall rates of death by cause. We do not attempt to replicate here the most important global burden of disease (GBD) study that developed

17
cause of death trends for the Asian region (Murray and Lopez 1996).2 We can use these data to provide a broad sense of the trends these countries face. In Table 4 we present, for two randomly selected countries in each economic grouping, trends in the proportion of deaths for as many time points from the last four decades as are available. The five categories are for infectious and parasitic diseases, cancers, diabetes, and cardiovascular disease, and all other causes (including accidents, a major component). It is important to note that we could not obtain detailed age-specific mortality data, so we could not create age-standardized trends.
Murray and Lopez (1996) have created a consistent series of death by cause for India and China for 1990 and 2020. Figure 20 presents these data, which show that India will experience a marked reduction in mortality related to the large decline in death caused by infectious and parasitic infections. In contrast, China will experience an increase in mortality, related to the large increase in noncommunicable diseases (NCDs), in particular, CVD and cancer, combined with an ageing of the population. India’s deaths from these same diseases will also increase, reducing the size of the overall death rate decline.
At very early stages of economic development and nutritional transition in Asia, when infectious and parasitic infection-related mortality is still very high, the chronic disease that causes major mortality is hemorrhagic stroke. Hypertension and stroke rates continue to increase with economic development, the cause of the stroke usually being arteriosclerotic plaque (Committee on Research 1998). Where resources allow, treatment of hypertension may lead to decreased cerebrovascular disease, as has occurred in South Korea. In India, like China, a vast country whose regions and rural/urban areas are at different stages of transition, the most remarkable epidemic is of adult-onset diabetes and related conditions (Reddy and Yusuf 1998).
At a later stage of the nutritional transition in Asia, the full range of CVDs emerges as the primary cause of chronic disease deaths. For instance, in Fiji where major diet and lifestyle shifts have been followed by very high levels of obesity, diabetes, and other causes of coronary heart disease, by the 1970s, over a third of deaths were caused by CVD. The same high rate was shown in the first cause-of-death data reported for
2Murray and Lopez’s work predicts a major increase in the burden of disease from chronic diseases in the Asian region over the next two decades. Their work is based on demographic projections of these same poorly measured mortality data, while the work in this review focuses on the nutritional transition-related dynamics that will be a major factor driving this change. Our work suggests, in fact, that these nutrition-transition related changes, if anything, are accelerating even faster than they project.

18
Table 4: Trends in the proportion of deaths, by cause during the 1960s-90s Group/Country Disease 1960s 1970s 1980s 1990s High income Singapore (Year) (1967*) (1975) (1987) (1996) Infectious disease 14.8 18.2 12.5 14.4 Cancer 14.2 18.2 23.8 25.6 Diabetes - 2.3 3.7 2.1 CVD 8.2 28.3 35.5 37.8 Other 62.8 33.0 24.5 20.2 Korea, Rep. (Year) (1987*) (1995*) Infectious Disease 5.8 4.6 Cancer 16.7 21.0 Diabetes 1.4 3.3 CVD 22.0 21.1 Other 54.2 50.0 Middle income Malaysia (Year) (1965) (1976) (1987) a (1996) a Infectious disease 18.5 17.6 12.0 13.7 Cancer 6.5 8.9 10.4 10.1 Diabetes 0.8 1.5 - - CVD 9.1 20.0 18.9 18.9 Other 65.0 52.0 58.7 57.3 Thailand (Year) (1966) (1975) (1987) (1995) a Infectious disease 14.0 17.2 7.3 6.4 Cancer 1.5 3.2 7.3 9.3 Diabetes 0.2 0.5 0.9 1.3 CVD 2.5 4.4 3.5 15.5 Other 81.2 74.7 81.1 67.5 Small islands Fiji (Year) (1970) a (1985) Infectious disease 10.4 15.2 Cancer 7.5 10.1 Diabetes 3.4 5.5 CVD 20.6 36.0 Other 58.0 33.2 Upper low income Sri Lanka (Year) (1967) (1975) (1988) (1991) Infectious disease 6.4 10.1 12.2 9.5 Cancer 3.7 3.7 5.7 5.9 Diabetes 1.3 1.2 1.2 1.3 CVD 11.9 10.3 30.2 29.8 Other 76.7 74.7 50.7 53.5 China* (Year) (1987) a (1994) a Infectious disease 19.3 20.5 Cancer 15.9 19.3 Diabetes - - CVD 27.5 28.2 Other 37.3 32.0 Lower low income Kyrgyzstan (Year) (1995) Infectious disease 12.4 Cancer 8.4 Diabetes 1.0 CVD 36.8 Other 41.5 India (Year) (1975) (1987) Infectious disease 29.9 17.4 Cancer 3.6 3.6 Diabetes 0 1.3 CVD 8.9 9.2 Other 57.6 68.4 a Data are based on the Asia book; data before 1975 and after 1990 are not available.

19
Kyrgyzstan in the 1990s. The Kyrgyz Republic has one of the highest levels of obesity and also consumes one of the highest fat diets in the region (Popkin et al. 1997). In 1993, Kyrgyz adults consumed over 30.4 percent of energy from fat, according to a nationally representative survey that used 24-hour recalls to measure dietary intake. It took Singapore until the 1980s to reach the high level of CVD deaths recorded in Fiji in 1970.
In South Korea, at a relatively late stage of transition, what is remarkable is the lower level of death from CVD. We suggest that this is because of notably high intakes of vegetables and low intake of fat, and therefore relatively low levels of obesity than might be expected in a country with the income level of South Korea (Kim, Moon, and Popkin 2000).
At a later stage of the nutritional transition, in countries with relatively high average incomes, deaths from various cancers increase in absolute and relative importance. The rates of death from cancer in general in Singapore and South Korea are around 21 to 26 percent of total deaths, and in China almost 20 percent of total deaths, similar to the rates in economically developed countries. Elsewhere in Asia, 5–10 percent of deaths are caused by cancer. Mortality by site-specific cancers may vary greatly by country; the significance of these patterns in this context is discussed elsewhere (WCRF 1997).
One chronic disease directly linked to obesity and inactivity for which there are relatively good Asian data is adult-onset diabetes. Research by the International Diabetes Institute (Zimmet, McCarty, and de Courten 1997) estimates that the number of persons in Asia with adult-onset diabetes could reach 138 million by 2010. Estimates are based on the best available adult-onset diabetes measures for each country but for few countries are there high quality, reliable measures of adult-onset diabetes. Existing data and projections are 51.2 million cases in 1994, 94.7 million in 2000, and 138.1 million in 2010. This group and WHO have developed country-specific estimates of the prevalence of diabetes. WHO has projected that the most rapid increase in diabetes will be in India, where the 1997 estimate of diabetes cases is 20.8 million, projected to rise to 57.2 million by 2025. In China, the current 1997 figure is 17.1 million cases, projected to rise to 37.6 million by 2025.
We now briefly review two pathologies intimately related to diet that are believed or known to increase the risk of various chronic diseases. First, we review the effect of nutritional and other insults to fetal and infant health. This field of study, sometimes known as “the Barker hypothesis,” has not yet reached the position of consensus, but in our view, it is highly plausible, and if valid, has very major implications for Asian

20
countries. We then review the effect of overweight and obesity (itself a disease) on major life-threatening diseases. We end this section with a brief review of the major chronic diseases—CVD and cancer—regarding their risk factors.
Diet-Related Conditions That Increase the Risk of Chronic Diseases
Fetal Programming. There have been extensive reviews of the effects of fetal and infant insults on health. David Barker and colleagues at the University of Southampton (Barker 1992; 1994; 1997) have brought into the mainstream medical literature the notion of metabolic programming, i.e., that early insults operating at a critical period in development result in long-term changes in the structure or function of an organism. The effects are particularly apparent on the set of hormonal conditions termed syndrome X (obesity, hyperlipidemia, abnormal hormone metabolism, adult-onset diabetes, hypertension, stroke, and CHD).
The key insults to the infant growing in the womb and after birth are combinations of undernutrition or malnutrition of the mother or child, in either case caused by diets that are low or deficient in key micro- and macronutrients. In the case of obesity, the hypothesis is that fetal growth retardation results in metabolic changes that are adaptive under nutritionally stressful circumstances in utero. A similar argument can be made for postnatal growth retardation manifested as stunting. As the child grows, the metabolic efficiencies that served well in conditions of undernutrition become maladaptive with overnutrition, leading to the development of abnormal lipid profiles, altered glucose and insulin metabolism, and obesity. The critical element for this report is that fetal programming does not lead by itself to increased morbidity and mortality. Rather it shifts the metabolism in a manner that makes LBW infants more susceptible if faced with a richer, more energy-dense diet, reduced physical activity, and increased adiposity as a child or an adult.
Evidence in support of the programming hypothesis is growing on two fronts. There is an extensive animal literature, which assesses the effects of experimental manipulation of the pre- and early postnatal environment. Human studies are much more difficult, since they require detailed information about status at birth, early postnatal growth, and health or anthropometric status in older children and adults. For the most part, studies have relied on current status assessment of children or adults, with data for infancy obtained from medical records. There are few prospective studies that have been done. Most of the extensive research linking birth outcomes with hypertension, diabetes,

21
and CHD are found in developed countries, but studies in developing countries are beginning to emerge (e.g., Stein et al. 1996).
There are two critical questions that lead to tentative use of the results of this work to date. One is that while the epidemiology is clear that there is a relationship, the question is whether this is the result of a continuity of the same environmental insults that faced the fetus and the infant. In other words, are there forces occurring during pregnancy and infancy that affect the biology of the infant in ways that subsequent environmental factors cannot? The second is that we are unsure what the biological mechanisms are and without this understanding, we run the risk of selecting inappropriate interventions (e.g., Lucas, Fewtrell, and Cole 1999; Waterland and Garza 1999). The most important work to date in terms of addressing these concerns are studies in Asia that not only have studied the prenatal environment and measured these pregnancy outcomes, but have subsequently measured the environmental insults that come after infancy. The Philippines studies noted below are an example of very carefully designed studies of this type.
Some of the best reviews are those of these early nutrition insults on hypertension, adult-onset diabetes, and CHD. Leon and Koupilova have just completed a meta-analysis of studies linking birthweight with blood pressure and hypertension (Leon and Koupilova, 2001). The best 27 studies show an average of 1.70 mmHg reduction in systolic blood pressure per 1 kilogram increase in birthweight (-2.10, -1.30) over the full range of birthweight, though these studies have either excluded or not considered the very high birthweight gestational diabetes-related births. The diastolic research is weaker and also less consistent with a range of associations in the -0.3 to -1.7 mmHg per kilogram increase in birthweight. It is clear that obesity potentiates this birthweight-hypertension relationship. Also with every decade of age, the slope of the birthweight-systolic blood pressure effect increases by -0.35 mmHg per kilogram increase in birthweight. A smaller set of studies has examined the relationship of birthweight and adult-onset diabetes. Problems related with insulin production and insulin resistance, both felt to be important in the etiology of adult-onset diabetes, appear to be affected by fetal development. Barker (1997) reviews the limited number of studies. The results of extant studies indicate an important role for fetal development as a determinant of adult-onset diabetes, but it is hard to select a specific risk ratio. While the definitions have not always been consistent on what is included as CHD, the general result is clear. Low birthweight, in particular low ponderal index thin births, appear to be most related to CHD (Barker 1997).
Work by the Barker group (Barker 1992; Godfrey and Barker 1995) also suggests that the long-term health risks of IUGR are greater for disproportionate-IUGR infants, that is those with a low ponderal index (i.e., who are thinner). In the last several years,

22
much research has shown that for the programming to be expressed, subsequent catch-up growth and obesity are needed. Then the effects of these risk factors are enhanced (see a recent summary set of papers in a book commissioned by NIH: Barker 2001). Low birthweight, in particular low ponderal index thin births, appears to be most related to CHD (Barker 1998). This would lessen the risk of CHD in Asian babies compared with those born in high-income countries, since a much smaller proportion of Asian babies are born with low ponderal indices (PI) (Adair and Popkin 1988; Barker 1992). The major new and exciting work on this topic comes from Asia. Earlier we cited one study for the Philippines that showed 36.7 percent of LBW babies had a low PI (Adair and Popkin 1988). Further studies of this same birth cohort from the Philippines provide strong support of this hypothesis. Girls who are relatively thin at birth, but who grow rapidly in the first six months, have earlier menarche (Adair 2000). Similarly, girls who were relatively thin at birth but relatively fat as adolescents have higher blood pressure and total cholesterol than those who stayed thin or those who are relatively heavy at adolescence but not thin at birth (Kuzawa and Adair 2000).
As with adult-onset diabetes, the risk of CHD for LBW or LBW-low PI births seems compounded by subsequent adiposity. While Lucas et al. posit that this method of analysis might measure a different mechanism than that posited by Barker, it is clear that LBW and LBW-low PI births are at a two- to fourfold greater risk of CHD in the environments studied (Lucas, Fewtrell, and Cole 1999). This means that the remarkable nutritional transition that Asia is undergoing will lead to far worse CVD morbidity patterns than one might suspect because of current and recent past high levels of low birthweight/IUGR births and the subsequent fetal programming effects.
Postnatal effects: Stunting. Underweight during infancy and stunting in early childhood are also risk factors for subsequent obesity. In some cases, infant and early childhood growth retardation result from the same underlying factors that cause IUGR (e.g., poverty, poor maternal nutrition, poor weaning diet, and consequent increased risk of infections: Cebu Study Team 1991; Guilkey et al. 1989). IUGR increases the risk of stunting in infancy and later childhood (Adair and Guilkey 1996). Independent of IUGR, many children in developing countries, and indeed impoverished and undernourished children in North America and other developed nations, become stunted during infancy as the result of inappropriate weaning practices, repeated infections, and poor diet—all in the context of poverty (Adair and Guilkey 1997). The highest incidence of stunting occurs in the weaning period and soon after. Early childhood stunting is not readily

23
reversible when children remain in the same poor environments. Improved diets and other environmental effects, however, will lead to catch-up growth (Adair 1999).
The stunting-obesity effect is supported with data from a number of North and Latin American studies; and several studies from China, Brazil, and Guatemala indicate an important stunting effect in developing countries (Schroeder, Martorell, and Flores 1999; Forrester et al. 1996; Popkin, Richards, and Monteiro 1996; Sawaya et al. 1995; Sichieri, Siqueira, and Moura 2001; Yajnik et al. 1995). This limited literature produces odds ratios for the stunting effect on obesity that are quite high. All the results have relative risk ratios (RR) in the range of 2 to 8. For use in the subsequent economic analysis, we pick a conservative RR of 3 for obesity. We do not feel the literature supports any direct effect of stunting on hypertension, diabetes, or CHD; the literature on the effects of stunting has not studied this effect while controlling for LBW status. In the few longitudinal studies on the role of LBW as a cause of stunting in Asia, at least half or more of those children who were stunted were not LBW (e.g., Adair and Guilkey 1997). The literature is also too small to support a formal meta-analysis.
We have reviewed some of the data on fetal and infant insults because we consider that a consensus is developing on its validity and relevance, perhaps most of all in countries now in transition, including Asian countries. We now include a brief review on diet and levels of physical activity as well as body mass.
Obesity: The Effect of Diet and Physical Activity on the Risk of Chronic Diseases
There is a massive and growing literature on the causes of overweight and obesity. Obesity, itself a disease, also increases the risk of other major chronic diseases, notably CHD and some cancers. Appropriate approaches to obesity in adult life remain a matter of debate, but there is an established consensus, reflecting common sense and also the identification of biological mechanisms, that energy-dense diets increase the risk of overweight and obesity, as does physical inactivity; and that the incidence of overweight and obesity in any country can be seen as a function of the relative energy-density of diets and levels of habitual physical inactivity (IOTF/WHO 2000; Bray and Popkin 1998). A large literature shows that nutrient-dense diets with relatively low energy density and regular physical activity not only predict relatively low levels of obesity, but are also effective approaches in obesity reduction, and also will reduce the risk of other pathologies, such as adult-onset diabetes and CVD and certain cancers (e.g., USDHHS 1996).

24
Obesity is now a major public health problem in Asia. A generation ago, obesity was identified as a major problem perhaps only in the western Pacific islands. But a number of national surveys from several Asian countries show that the problem is greater than heretofore understood. It is also evident that overweight short of obesity (body mass indices between 25 and 30) are precursors of obesity and also can increase the risk of other diseases such as diabetes, hypertension, and CHD, among others.
There has been a growing body of research that shows that the international standards used to delineate who is overweight and obese are not appropriate for Asia. A Body Mass Index (BMI) of 25 in an Asian adult appears to have a far greater adverse metabolic effect than it does in a Caucasian adult (Deurenberg, Yap, and Staveren 1998). In fact, the WHO and the International Obesity Task Force formed a group of scientists and agencies in Asia to review this topic. This group held international meetings and has proposed a lower BMI cutoff of 23 for overweight and of 25 for obesity for Asians (IOTF/WHO 2000). The pattern is complex as there is extensive racial/ethnic heterogeneity in Asia. A BMI-morbidity relationship that seems to fit east and south Asians, for example, might not apply to people of the western Pacific, as this IOTF/WHO task force noted. In general, the report states that the pattern of metabolic disease is different, and perhaps Asians tend to put on abdominal fat preferentially. Conversely, those from the Pacific Islands tend to get disease at greater BMIs, but are prone to diabetes. It was concluded that the approach to obesity needed to be considered in a regional context and the suggested change would considerably affect who is considered overweight and obese in Asia. For instance, the China Health and Nutrition Survey in 1997 has only 2.6 percent obese according to current international BMI cutoffs of 30 but there would be 19 percent obese among these same adults if the cutoff were 25. With the overweight cutoff of 23 and the obesity cutoff of 25, total overweight and obesity in China would rise from 19.1 to 36.6 percent, or over a third of all Chinese. For the present report, we use the widely accepted WHO cutoffs of a BMI of 25 for overweight and 30 for obesity. We could change this if need be as we have all the datasets. As the example for China shows, use of the new standard would almost double the proportion at risk in China.
This analysis utilizes data from a series of nationally representative or nationwide surveys collected by our group (Kyrgyzstan and China), the World Bank (Viet Nam), Rand Corporation (Indonesia), and three governments (Malaysia, the Philippines, and South Korea). These surveys provide excellent samples of high quality for assessment of this problem. In all cases, weight and height data were gathered using standard World Bank or other protocols. We have data for countries representing the middle-, upper- and

25
lower-low income, and small island groupings. Kyrgyzstan, currently the poorest of these central Asian republics, had a much higher living standard when it was part of the former Soviet Union, so the higher meat and dairy and fat intake linked with its history up to 1992, and the occupational structure and activity pattern linked with that previous income, is not representative of its current position as a lower-income country (Popkin et al. 1997).
In most cases the gender differences in Asia are smaller and less consistent than those of Europe, Africa, and the Americas (cf., Popkin and Doak 1998). In terms of the levels of economic development and obesity, except for Nauru and the Kyrgyz republic, the results are as expected: relatively higher level of economic development is linked with higher obesity levels. These data are presented in Figure 21 and Appendix Table 18. The island nations such as Samoa and Nauru have been the subject of many studies of their high rates of obesity and related chronic diseases. (Nearly half the population in the Western Pacific region has a BMI above 30.)
Obesity levels are higher in urban than in rural areas in the countries with data. This relates to marked shifts both in dietary intake patterns and activity patterns between urban and rural residents. Figure 22 presents these data.
Obesity levels are not only associated with wealth. We have also examined the income-obesity relationships in the four Asian countries for which we had the nationally representative or nationwide survey datasets (see Figure 23). These figures are for all adults aged 18 and older. In Indonesia, there is a pronounced differential in overweight and obesity patterns by income tercile. In contrast, the income patterns are not so clear-cut in the other three countries. In Kyrgyzstan, the prevalence of overweight is constant across income groupings while it increases slightly for obesity. China shows a small increase among the top-income tercile, whereas Viet Nam shows no pattern.
There is one further complex situation that we do not fully understand. This relates to the large proportion of households in which underweight and overweight persons coexist. As more of Asia shifts toward a more energy-dense and lower fiber diet and lower activity level, we predict a major problem of coexistence of underweight and overweight in the same household. In Figure 24 we present evidence from several low-income countries in the Asian region where we have large nationwide surveys with anthropometric weight and height data for all members of the household. Households with both undernourished and overweight members represent 3–15 percent of households in these countries—levels far above chance (Doak et al. 2000). The underweight child coexisting with an overweight non-elderly adult was the predominant pair combination.

26
For this figure we used BMI cutoffs for all age groups so we are focusing on assessments reflecting current nutritional status rather than using stunting or other measures that would increase significantly the proportion of such households.
Our early analysis of this problem seems to suggest that the speed of the nutritional transition is increasing the likelihood that both problems will coexist in the same household (e.g., Doak et al. 2000). As the prevalence of undernutrition declines, there appears to be a shift in diet and activity patterns that leads to a greater occurrence of obesity as well as continued undernutrition among many households. Since there is evidence that the dietary shifts are occurring much more rapidly toward a higher energy density (a diet linked with obesity) among lower income households, we might expect increasing proportions of such households in the near future (Paeratakul et al. 1998; Guo et al. 2001). Furthermore, among households with underweight members, 30–60 percent also had overweight members. This research challenges the assumption that underweight and overweight are opposing public health concerns and illustrates the need for us to consider both in the development of public health programs in Asia that simultaneously address underweight and overweight.
The Major Chronic Diseases
Cardiovascular disease (CVD). CVD refers not just to heart conditions (coronary artery disease; valvular, muscular, and congenital disease), but also hypertension and conditions involving cerebral, carotid, and peripheral circulation. Typically diabetes is placed in a separate category. The impact of diet, together with physical activity and body composition, on the risk of CVD is not reviewed here simply because the consensus that CVD is related to diet is long established and not seriously challenged (Cannon 1992; Committee on Diet and Health 1989). The patterns of food supplies and of food and nutrition that modify the risk of CVD are also well known; and the governments of many countries in the economically developed world, and later some countries in the developing world, have issued dietary and other recommendations designed to control incidence of CVD (WHO 1990; Labarthe 1998).
The basic finding is that varied diets that are high in vegetables and fruits, in starchy staple foods (preferably in minimally processed form), and correspondingly relatively low in energy density, fats, saturated fats, sugar, and salt are most protective against heart disease. Such diets approximate those traditionally eaten in many countries in Asia, where public health problems have been those of food insecurity, undernutrition, and monotony of diets. However, when people have enough to eat and diets are varied,

27
diseases of undernutrition are not major public health problems. Table 3 summarizes these general relationships.
Additionally, there is conclusive evidence that regular physical activity maintained throughout life, together with nutrient-dense diets, protects not only against obesity (and therefore indirectly against heart disease), but also gives direct protection against diseases of the cardiovascular system. This finding has very important implications for Asia and other developing countries, where protective diets and lifestyles are not yet, as in developed countries, largely phenomena of the past. Programs and policies designed to control obesity and CVD in Asia should emphasize what is valuable in traditional and existing agriculture and food systems, food supplies, diets, and activity patterns.
Inappropriate diets are a major determinant of the risk of cerebrovascular diseases, including high blood pressure and stroke (Labarthe 1998). Dietary recommendations for preventing these pathologies are much the same as those for obesity and coronary heart disease, except for the added focus on consuming a lower salt diet for stroke and hypertension.
Cancer. Perhaps remarkably, there is also now consensus that in broad terms, the same diets and associated lifestyles that protect against obesity, diabetes, and cerebrovascular and cardiovascular diseases, also protect against cancer or, to be more precise, major cancers of the epithelium and hormone-related cancers that evidently become or remain epidemic as a consequence of the demographic-nutritional transitions (WCRF 1997). These cancers include those of the lung, breast, endometrium, colon, and rectum, and cancers that may be associated also with traditional diets, such as those of the mouth, throat, esophagus, and stomach. Table 3 summarizes these general relationships.
A recent major review of the literature on food, nutrition, and the prevention of cancer, taking a global perspective (WCRF 1997), includes a comprehensive set of dietary and associated recommendations. This review is notable in a number of ways. First, following other reports on diet and cancer, it quantifies the extent to which cancer incidence may in time be reduced by appropriate diets and associated lifestyles, proposing a range of 30–40 percent as an educated guess, based on a broad analysis of epidemiological findings. At 1995 levels, a decreased incidence of cancer of 30–40 percent corresponds to 3–4 million annual cases of cancer worldwide.

28
This report is also remarkable for its global perspective, and for its policy of reconciling its recommendations with those for other major chronic diseases, including obesity and CVD, adult-onset diabetes, and osteoporosis. With a few exceptions, the report found, consistent with the findings already summarized in this present review, that the pattern of food, nutrition, and physical activity that protects against cancer also protects against other chronic diseases, and has no deleterious effect on any other type of disease.
Current diet recommendations emphasize foods and dietary patterns more than individual dietary macro- and microconstituents. Food-based dietary guidelines are now generally accepted (FAO/WHO 1996). As already stated, in broad terms, diets that are most protective against chronic diseases—and most of all in generally sedentary populations—are mostly made up from foods of plant origin, are varied and high in nutrients but relatively low in energy, and include substantial amounts of vegetables, fruits, legumes, and minimally processed grains and other starchy staples. Correspondingly, such diets are relatively low in fat (especially saturated fat) and sugar, low in salt and alcohol, and in general contain modest amounts of foods of animal origin. The authors of the cancer report (WCRF 1997) emphasize the importance of year-round variety in diets, and also the value of small amounts of meat, fish, poultry, and dairy foods, especially when otherwise diets might be monotonous.
HEALTH COSTS
Epidemic, diet-related chronic disease imposes important human and economic costs. The Global Burden of Disease study quantifies the human costs in terms of disability and death (Murray and Lopez 1996). But to date, there are almost no estimates of the economic costs for developing countries, although there are studies for the United States, for example (Wolf and Colditz 1998), and a study in process for the Pacific islands (Dalton and Crowley 2000). In this section, we present our own estimates for such costs for two Asian countries, China and Sri Lanka, using cautious assumptions. Estimates are for current economic losses as well as losses projected for the year 2025, to give a sense of how the costs are evolving together with the nutrition and epidemiological transitions. These estimates should be treated as estimates rather than as definitive. They are intended to provide guidance to key areas for policy interventions, and to show how the relative costs of undernutrition (including deficiency) and overnutrition are changing over time.

29
We include human costs in terms of numbers of deaths, economic costs of hospital resources, and economic costs of premature mortality. We do not have data to estimate the cost of loss of work output due to morbidity, loss of workdays due to morbidity, or loss of productivity by those continuing to work with chronic diseases, so the costs presented are almost certainly underestimates.
The five diet-related chronic diseases included are hypertension, stroke, diabetes, CHD, and cancer. Of these, stroke, CHD, and cancer are major causes of premature death, and hypertension and diabetes (themselves life-threatening diseases at a late stage of pathology) increase the risk of stroke and heart disease.
Figure 25 diagrams the major causal pathways included in our model. The figure also includes some pathways that are important, but which we have not modeled. Pathways might be included but not modeled for one of two reasons. First, the epidemiological data may be as yet too limited, e.g., the effects of transfatty acid intake and CHD. Second, there may be overlapping effects. For example, we do not model the link between overweight and hypertension (although this is well established), because we are already modeling the effects of overweight on CHD directly, and it would not be appropriate to double-count by adding additionally indirect effects of overweight via hypertension on CHD. We focus on diet and do not include the unique additional effects of physical activity (except insofar as activity has indirect effects via energy imbalance and overweight status). However there are known to be direct effects of physical activity on hypertension, diabetes, and CHD, so again, our estimates are cautiously made.
The effect of inappropriate diets on disease risk is multidimensional. There are potentially overlapping effects (such as LBW via obesity on CHD, LBW via hypertension on CHD, and LBW via diabetes on CHD), but we have taken care not to double-count the effects when estimating overall effects. We can only add up the separate effects of different pathways, if the clinical studies (on which the relative risk estimates are based) also control for confounding effects. For example, to be able to add up the effects of LBW via overweight and via hypertension on CHD, it is necessary that the studies of the link between LBW and hypertension control for current weight, and that the studies of the link between hypertension and CHD also control for current weight. Since existing studies do not necessarily always adjust for confounding factors, we have to be cautious in adding up effects via different pathways (by assuming the maximum amount of overlap). Although in the cardiovascular and cancer epidemiology literature there is an attempt to control for other key biological confounding factors, the area of fetal and infant undernutrition is very new and only a few studies control for the key subsequent confounders (Labarthe 1998). For instance, the effects of LBW or LBW/low

30
ponderal index on adult-onset diabetes might want to control for obesity, another direct determinant of diabetes, but the studies to date have not adequately controlled for current weight.
Figures 26 through 28 provide details of the relative risks used for the calculations for CHD, stroke, and diabetes, respectively. These relative risks are drawn from the existing literature, using meta-analyses wherever possible, and several of the sources have been discussed in the previous section. One problem is that much of the literature is for populations in rich countries (often the United States). Moreover, the majority of the studies are of men. Hence, it is not clear how applicable these relative risks are for Asian populations, and for both men and women combined (data are not yet finely enough available for men and women separately). If anything, studies suggest that relative risks of some of these chronic conditions are even higher in Asian populations (e.g., Zimmet 1992; Zimmet, McCarty, and de Courten 1997). We also do not have separately relative risks for morbidity and mortality. These are not generally available, except for the literature on CHD where there have been the greatest number of studies, and even in the literature on CHD, there are not enough studies to be able to separate out all the pathways for mortality and morbidity.
Case Study: China
Appendix Table 19 summarizes the health data used for the cost calculations for China, including prevalence rates (for example, for overweight/obesity, hypertension, LBW, and stunting), and mortality rates from cancer, cardiovascular disease, and stroke, as well as from all causes. We use crude rather than age-specific mortality rates, since age-specific relative risk data have not yet been developed for Asia. However, age-specific mortality data are available, and the Murray and Lopez predictions for 2020 are based on age-specific projections. We present our analysis for the current period 1995, as well as a future period when the shifts in diet and obesity and the disease profile will considerably increase the costs. Part of the reason for deriving a prediction for 2025 is that investments in diet-related noncommunicable disease face a long lag time before the economic benefits are obtained. For instance, an investment in reducing LBW may not affect adult hypertension or adult-onset diabetes for 20–50 years.
For the predicted mortality rates for 2025, we have used Murray and Lopez (1996) baseline predictions for China 2020. These show very large increases in death rates for diet-related chronic diseases, consistent with our predictions for dietary patterns, obesity, and hypertension. Predictions for hypertension and saturated fat are made
31
assuming that rural areas catch up with current rates for urban areas, and that there are modest increases in urban areas (taking into account trends observed in other industrialized countries).
We assume, based on consumption data from the China Health and Nutrition Survey (CHNS), that fruit and vegetable intake will not increase markedly by 2025. Data from the 1991 CHNS, a large eight-province study that utilizes a three-day set of measured dietary data on 7,450 adults, found that only 20 percent of the sample consumed the recommended amount of 500–700 grams of fruit and vegetables. The Chinese nutrition society has established 500–700 grams of fruit and vegetables as the level recommended to be protective for chronic diseases (see Stookey et al. 2000).
The trends and projected proportions of overweight are important for our economic analysis. Recent data for China show a major shift in the proportion of the population that is overweight. For example, one study of 2,403 men and women from eight provinces in China in 1989 and 4,049 in 1997 found that 6.2 percent of the men and 11.2 percent of the women had a BMI of 25 or greater in 1989. By 1997 this almost tripled in men to 17.3 percent and doubled in women to 20.7 percent (the results are almost identical when a cohort is followed for eight years) (Bell, Keyou, and Popkin 2000). This is consistent with an acceleration in the rate of change of consumption of meat (mostly pork), edible oil, and other sources of fat in the diets of these same adults (Guo et al. 2001).
There is no simple way to use this information to predict the future course of obesity in China in the year 2025. There is no reason to believe the eight-year rate of increase in percentage points will not be matched. But we will be much more conservative. If the current annual rate of increase continued, we would have an additional 1.39 percent of Chinese men overweight each year or an added 39 percent in the 28 years from 1997 to 2025. For women, this would mean 1.35 percentage points increase in overweight per year, or an added 38 percentage points by 2025. Conservatively, we will assume male and female overweight in China will increase at only half of the percentage point increase we found for the 1989–1997 period. Thus an added 19.5 percent of men and 19 percent of all women will be overweight by 2025. This means the figures for overweight for Chinese men and women in 2025 are predicted to be 36.8 percent and 39.7 percent, respectively.
Hospital costs for China include most health system costs, since most health care occurs through outpatient visits to doctors at hospitals and through hospital stays. Doctors also prescribe the drugs required, which are sold at hospital pharmacies. Figures are not

32
available for medical expenditures other than for doctors and hospitals. In the 1980s, the nonhospital pharmaceutical sector was small, but there is evidence that this has grown rapidly, and accounted for as much as 15 percent of drug expenditures recently (more in large cities and less in rural areas [Gail Henderson, personal communication]).
Table 5 provides some initial information estimates of the costs of these chronic diseases in China. The human costs are large: the diet-related chronic diseases account for 2.57 million deaths annually, 41.6 percent of all deaths. Stroke is currently the major killer, with one in five Chinese deaths being due to this cause. Hypertension rates in China are high, not far behind U.S. rates, whereas obesity and saturated fat consumption are currently lower. Deaths from the diet-related chronic diseases will rise dramatically to 7.63 million total deaths expected in 2025, 52.0 percent of all deaths. Cancer alone will account for more than a quarter of all deaths in that year.
Table 5: Current costs (economic costs of hospital resources and human costs) of major diet-related chronic disease in China
Hospital costs in million yuan, 1998
Mortality rates per 100,000 persons in 1995
Condition Total Rural Urban Total
Cancer 14,838 82.83 106.33 90.58 Diabetes 6,954 3.78 11.97 6.24 CHD 33,800 23.09 44.83 29.61 Hypertension 15,695 - - - Stroke 23,699 87.03 106.33 90.20 Major diet-related
94,986
196.73
269.46
216.63
All causes
419,678
532.50
492.25
520.43
Source: Mortality: Reports on Chinese Disease Surveillance; hospital costs: 1998 National Health Services Survey.
Notes: Major diet-related diseases consist of diabetes, CHD, hypertension, stroke, and cancer. 8.09 Yuan (Renminbi) = US$1. Hospital costs are estimated based on number of outpatient visits per ’000 population, multiplied by average cost per visit, plus number of inpatient admissions per ’000 population, multiplied by average cost per hospital stay (cost data are broken down by individual disease category): see Appendix Table 20.
The economic costs of diet-related chronic disease are very large (see summary in Table 6). Total hospital spending on the diet-related chronic diseases is estimated as $11.74 billion (1.6 percent of GDP, and 22.6 percent of all hospital expenditures; hospital expenditures include most health system spending as discussed above). Hospital stays for

33
these chronic diseases are expensive: whereas the average hospital stay (averaged over urban and rural areas) costs about $300 and lasts 16 days, those for the diet-related chronic diseases average over $500 and last 20–30 days (Appendix Table 20).
Table 6: Summary of costs of diet-related chronic disease in China
Costs
1995 Estimates
Number of adult deaths annually 2.57 million (41.6 of all deaths) Annual hospital costs $11.74 billion (22.6% of hospital costs; 1.6% of GDP) Productivity losses due to premature death $3.41 billion (0.5% of GDP) Total monetary cost $17.50 billion (about 2.1% of GDP)
2025 predictions Number of adult deaths annually 7.63 million (52.0% of all deaths)
Source: Authors’ calculations, based on Appendix Tables 19 and 20, and Table 5. Note: US$1 = 8.09 yuan (Renminbi).
These diseases also have large economic costs in terms of lost productivity due to premature death. If each adult death from these conditions causes an average 10 years of lost productivity, then each adult death leads to a loss of GDP in present value terms of $2,210 (assuming annual current wages are $300/year, that real wages grow at 3 percent per annum, and using a 12 percent discount rate). There is an issue of labor surplus: underemployment exists in many developing countries, and unemployment is increasing in China. On the other hand, the $300/year figure for wages is a very modest one for a country with a per capita income more than twice that level. If we assume that about 60 percent of those over 18 are active in the labor market, then the annual losses due to premature death are $3.41 billion, or about 0.5 percent of GDP.
Thus, major diet-related chronic diseases cost about 2.1 percent of GDP annually, in lost productivity due to premature deaths and hospital costs (with hospital costs accounting for three-quarters of this loss). We do not have figures for loss of work output for patients who survived. However, a study for Tianjin (Tian 1999) gives figures for cost per patient hospitalized for stroke and heart attack that includes lost wages: the costs are about twice as high as the costs of hospitalization in city hospitals obtained from Appendix Table 20. This would imply that the losses of work output due to morbidity are similar in size to those from mortality, and that our estimate of 2.1 percent of GDP is

34
about 60 percent of the total cost. (This still omits costs of lost productivity due to those who were debilitated but treated as outpatients.)
How much chronic disease in China can be traced back to dietary causes? Detailed calculations in Appendix Table 21 lay out the population-attributable risks (PAR) for various adult diet and health factors, on the five chronic conditions, based on the paths identified in Figures 25 to 28. These conditions are also traced back to childhood stunting and low birthweight as appropriate. The most important pathways are then summarized in Table 7 (for 1995) and Table 8 (for 2025). Because of concerns about overlaps between different pathways, we pick out the single most important pathway for each condition. (Where the most important factor is hypertension, we also present the PAR for overweight). Hence the results are a minimum estimate of the effects of dietary factors.
For China in 1995, current dietary factors account for between one-fifth and one-quarter of each of the chronic diseases.
If adult conditions are traced back in turn to childhood factors, then the most important cause currently is low birthweight. We do not have good data for the extent of low birthweight in the past, when current adults were born. We use a conservative estimate that the incidence of low birthweight in 1965 was three times what it is now (rates in India are this high currently). We assume, based on current trends in China, that stunting has decreased more slowly than birthweight, and that it has fallen from around 45 percent 30 years or more ago, to 24 percent currently. This is consistent with improvements in women’s BMI (which affects birthweight), but slower improvement in infant complementary feeding (which affects stunting). LBW accounts for at least 10 percent of stroke and CHD, a third of diabetes, and almost half of hypertension in 1995, according to our calculations. One way to test this would be to examine regional patterns of diet-related chronic disease and compare with what is known about regional variation in birthweight. Another way to test this would be to look at morbidity and mortality due to diet-related chronic disease of rural-urban migrants.
For China in 2025, we project the pattern to change quite significantly (again, see Appendix Table 19 for the predicted morbidity and mortality patterns in 2025). The predictions are that hypertension rates will not increase much beyond the already very high rates in urban China (offsetting factors will be less LBW—an important source of higher risk of hypertension—but more overweight, associated with increased hypertension). However we predict incidence of overweight (including obesity) to rise
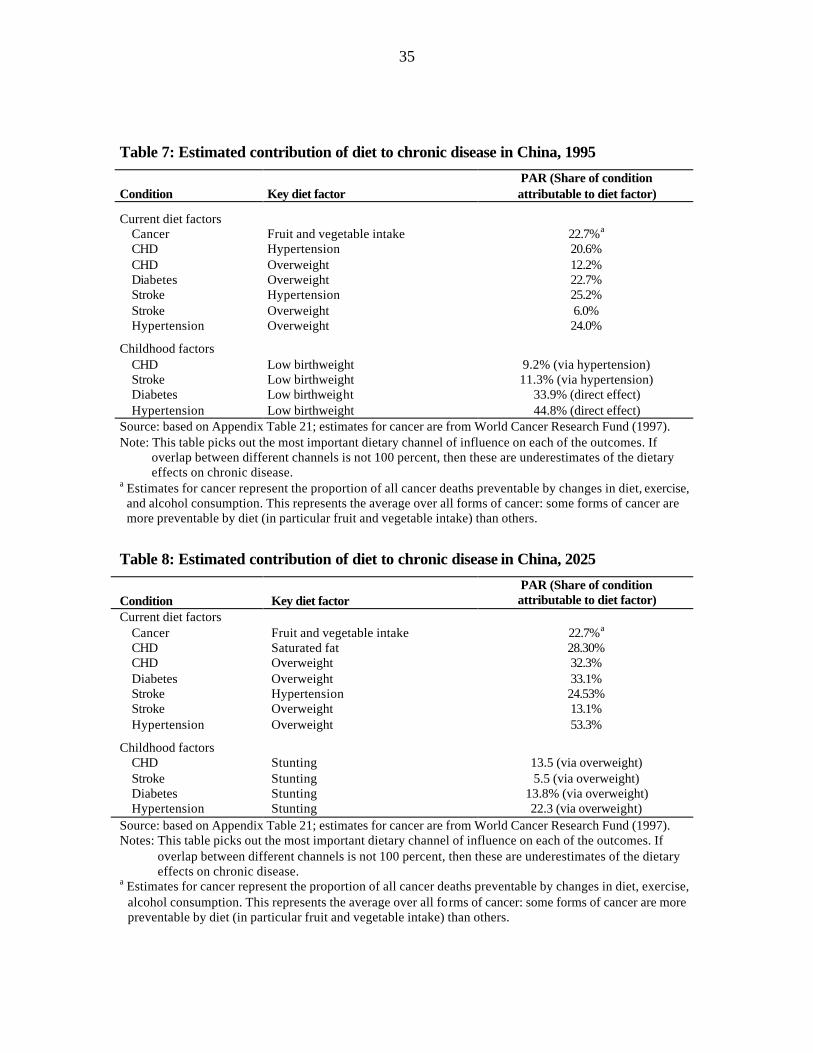
35
Table 7: Estimated contribution of diet to chronic disease in China, 1995
Condition Key diet factor PAR (Share of condition attributable to diet factor)
Current diet factors Cancer Fruit and vegetable intake 22.7%a CHD Hypertension 20.6% CHD Overweight 12.2% Diabetes Overweight 22.7% Stroke Hypertension 25.2% Stroke Overweight 6.0% Hypertension Overweight 24.0% Childhood factors CHD Low birthweight 9.2% (via hypertension) Stroke Low birthweight 11.3% (via hypertension) Diabetes Low birthweight 33.9% (direct effect) Hypertension Low birthweight 44.8% (direct effect) Source: based on Appendix Table 21; estimates for cancer are from World Cancer Research Fund (1997). Note: This table picks out the most important dietary channel of influence on each of the outcomes. If
overlap between different channels is not 100 percent, then these are underestimates of the dietary effects on chronic disease.
a Estimates for cancer represent the proportion of all cancer deaths preventable by changes in diet, exercise, and alcohol consumption. This represents the average over all forms of cancer: some forms of cancer are more preventable by diet (in particular fruit and vegetable intake) than others.
Table 8: Estimated contribution of diet to chronic disease in China, 2025
Condition Key diet factor PAR (Share of condition attributable to diet factor)
Current diet factors Cancer Fruit and vegetable intake 22.7%a CHD Saturated fat 28.30% CHD Overweight 32.3% Diabetes Overweight 33.1% Stroke Hypertension 24.53% Stroke Overweight 13.1% Hypertension Overweight 53.3% Childhood factors CHD Stunting 13.5 (via overweight) Stroke Stunting 5.5 (via overweight) Diabetes Stunting 13.8% (via overweight) Hypertension Stunting 22.3 (via overweight) Source: based on Appendix Table 21; estimates for cancer are from World Cancer Research Fund (1997). Notes: This table picks out the most important dietary channel of influence on each of the outcomes. If
overlap between different channels is not 100 percent, then these are underestimates of the dietary effects on chronic disease.
a Estimates for cancer represent the proportion of all cancer deaths preventable by changes in diet, exercise, alcohol consumption. This represents the average over all forms of cancer: some forms of cancer are more preventable by diet (in particular fruit and vegetable intake) than others.

36
quite sharply. This implies that overweight will become the main underlying factor for CHD, diabetes, and hypertension (with hypertension remaining the most important underlying factor for stroke). Overweight is predicted to account for a third of CHD and of diabetes, and more than half of all hypertension by 2025; thus, the importance of diet in chronic disease will intensify.
Tracing back the childhood factors, childhood stunting now becomes the main risk factor, accounting for between 5 and 22 percent of the four chronic conditions (excluding cancer, where childhood factors have not been studied). This is related to the much reduced level of LBW in 1995 as compared to 30 years earlier: although stunting is also reduced, the relative decline is smaller. Stunting in China has proven more resistant to improvement, related possibly to inadequacies in infant feeding patterns.
The differences between the major pathways are shown in Figure 29 (for 1995) and Figure 30 (for 2025). It is striking to note how the pathways shift from LBW-hypertension to stunting-overweight.
The change in pathways also has implications for costs. We do not have good enough data to predict hospital expenditures in 2025. However, what is clear from the 1995 data is that CHD accounts for about four times as much resources as stroke in relation to the number of deaths (if we take total expenditure on CHD divided by number of deaths from CHD and compare the result to total expenditure on stroke divided by number of deaths—even if hypertension were added to stroke expenditures, CHD expenses are still three times higher per death). Thus the increase in CHD, which is predicted to be proportionately much larger, is going to seriously increase health costs. One factor moderating the increase in costs would be improvements in patterns of care for CHD and stroke that permit length of hospital stay to decrease. As these diseases and the related patterns of care become more common, improved technology and disease management may reduce costs. On the other hand, China to date imports very little technology, and the push to open their markets to new medical technology could drastically increase medical care costs.
It is more difficult to predict the effect of increased cancer rates on hospital costs in 2025. Cancer expenditures are currently the lowest per death of the three major conditions. However, cancer treatment is still relatively new in China (since many cancers are diagnosed relatively late in relation to the possibilities for treatment), and it is quite likely that cancer care will become increasingly resource-intensive by 2025. Gardner and Halweil (2000) cite estimates by researchers at the WCRF that cancer treatment expenditures will increase by a factor of 25 in developing countries.

37
It is typically more expensive and less successful to intervene to affect overweight than to reduce hypertension. Although medical “quick fixes” are not necessarily desirable, there are modestly priced drugs such as diuretics for controlling hypertension: drugs to treat CHD cases are more expensive, and there is little experience with cost-effective population interventions that reduce overweight.
Hence, to reduce mortality and morbidity from diet-related chronic disease and the associated costs, it is important that China begin now to invest in policies to avert the scenario current trends project for 2025. The data here identify three key priorities. First, (a quick fix) is to monitor the population for hypertension, particularly in urban areas and particularly groups age 40 and above for whom CHD and stroke mortality become increasingly significant. Those identified with hypertension are candidates for treatment (usually drugs, but also behavior and diet modification). Second, there is a good case that China should continue to devote resources to reducing stunting, since stunting now has potentially deadly consequences when combined with diets of affluence in later life. Finally, it will be important to devote resources to those age groups where dietary modification and establishing healthy exercise patterns are possible. Current thinking and much evidence suggests that the right time to intervene is early in life before poor dietary and activity patterns become a part of ones lifestyle. To wait until chronic diseases become clinically evident at late stages in the disease process is cost-ineffective and very expensive in terms of treatment options. Possible interventions are discussed in the next section.
In China, one current issue is that exercise in schools is given much lower priority than academic studies, due to strong competition in the education system. Schoolchildren also spend increasing proportions of their time outside school in extra lessons, which reduces the time available for physical activity.
The data underscore the public health importance of diet-related chronic disease in China. We suggest that diet currently is responsible for about 20 percent of the diet-related chronic diseases specified, a figure that will rise to 25–45 percent by 2025 (varying by individual disease). The current costs are estimated conservatively as 2.4 percent of GDP, a figure that is expected to climb substantially by 2025.
Case Study: Sri Lanka
The costs of diet-related chronic diseases are also large and growing in Sri Lanka, although with a number of important differences from the case of China. Table 9

38
summarizes the key costs. Since Sri Lanka has successfully reduced communicable disease prevalence, the diet-related chronic diseases constituted 18.3 percent of all deaths in the mid-1990s (see Appendix Table 22 for mortality rates by cause for Sri Lanka). Sri Lanka’s rates for the diet-related chronic diseases, including obesity, are below those of India. It is also possible that in Sri Lanka the relatively weak reporting system for cause of death understates the share of the chronic diseases.
Table 9: Summary of costs of major diet-related chronic disease in Sri Lanka
Costs 1997 Estimates Number of deaths annually 19,847 (18.3% of all deaths) Annual hospital costs $12.6 m (16.7% of hospital costs; 0.1% of GDP) Productivity losses due to premature death $29 m (0.2% of GDP) Total monetary cost $41.6 m (0.3% of GDP) 2025 predictions Number of adult deaths annually 38,477 (20.9% of all deaths)
Source: Authors’ calculations, based on Appendix Tables 22 and 23, with assumptions as discussed in text.
We utilize data from India, a country with a comparable lifestyle and with adequate data, to make this project future obesity rates for Sri Lanka. For India, there are several representative surveys of the rural regions of the poorer states in the country and also one large-scale survey conducted in urban squatter areas. The large-scale survey showed 11.6 percent of women aged 12–47 were overweight. The 1975–1979, 1988–1990, and currently unpublished 1996–1997 figures come from the National Nutrition Monitoring Bureau (NNMB), National Institute of Nutrition (Sachdev 1997b). These surveys were conducted in the rural population of eight states. Available data on these states, which are mainly from Southern India, with its less energy dense vegetarian diet, indicate there is less diet-related chronic disease in this region and most likely less obesity. The comparative figures for these surveys for those overweight for 1975–1979, 1988–1990, and 1996–1997 are 2.3, 2.6, and 3.8 percent for men and 3.4, 4.1 and 6.0 percent for women, respectively. The sample sizes were very large (over 30,000 in 1996–1997). Elsewhere, we had data from two sample points only for women of childbearing age. These data showed that there was a 5.0 percentage point increase in the prevalence of obesity per 10-year period for women during the 1989–1994 period (Popkin and Doak 1998). We assumed that rates would increase by the same number of percentage points in Sri Lanka, although from a lower base, to make projections for the future.

39
The diet-related chronic diseases represent about 10.2 percent of estimated public hospital expenditures, but 16.7 percent of all hospital expenditures. These data were obtained from detailed estimates for the National Hospital for Sri Lanka that represents one-third of total public health expenditures, and an estimated 20.3 percent of total hospital expenditures (see details in Appendix Table 23). Figures for drug sales in pharmacies outside hospitals or for consultations with practitioners outside hospitals are not available: however, hospitals provide the large majority of care for these chronic diseases. The hospital costs for diet-related chronic disease were estimated as $12.6 million per annum (0.1 percent of GDP).
Public hospital costs in Sri Lanka are markedly lower than those in China (despite similar levels of per capita GDP) due to lower average length of stay. Average length of hospitalization, even for chronic diseases, is only six days in public hospitals, with the total cost per stay in a public hospital about $90. However, according to Samarasinghe and Akin (1994), inpatients in public facilities pay an additional cost per stay of about $25, largely for drugs. The cost per day in a public hospital in Sri Lanka is about 75 percent of the daily cost in China in terms of the public cost, but likely almost the same as in China if out-of-pocket expenditures are included. However private hospital costs in Sri Lanka are at least 250 percent as high as public hospital costs per patient, and patients tend to favor using private hospitals, particularly for chronic diseases.
Productivity losses due to premature mortality were estimated as $27 million or about 0.2 percent of GDP. These were estimated using estimated annual wages ($375), assuming that adult deaths from diet-related chronic disease resulted in, on average, 10 years of loss of market productivity, and that in the future real wages might increase at 1 percent per annum, and that future wages can be discounted by 12 percent per annum. Hence a premature death represents a loss of 10 years of work, which when appropriately discounted is valued at 6.559 times the annual wage. We also assume that 60 percent of those over age 18 work in the market. When added to the hospital costs, this suggests that the loss to GDP annually is about 0.3 percent. This figure underestimates the true costs, since we do not have data on morbidity associated with these diseases, nor on productivity losses associated with morbidity.
These costs are large and important. While they are an order of magnitude lower than the estimated costs due to childhood undernutrition in south Asia (see Horton 2001), they are sizable enough to be of policy significance.
Gwatkin and Guillot (2000) make the case that programs focusing on chronic disease tend to redistribute resources away from the poor. While the evidence supports

40
this, the LBW-stunting-chronic disease link suggests that there are complementarities in programming both for under- and overnutrition. Moreover, elsewhere we present research that points to a marked shift in the burden of diet-related chronic diseases toward the poor (Guo et al. 2000; Monteiro et al. 2000).
Projecting forward to 2025, the chronic diseases increase modestly to account for 20.9 percent of all deaths. We do not have enough information to project forward the hospital costs: however, these costs are likely to grow. As the population ages and as more funds go to the hospital system, the resources used to treat diseases such as CHD and cancer are likely to rise quite dramatically.
We also traced back these chronic diseases to the key dietary underpinnings (see Tables 10 and 11, based on Appendix Table 24). In 1995, more than 20 percent of cancer is attributable to one major aspect of diet (inadequate fruit and vegetable intake), 16 percent of CHD (attributable to saturated fat intake; diabetes is almost as important a contributing factor), and almost 10 percent each of diabetes, stroke, and hypertension (usually related to overweight, although again diabetes is almost as important for stroke). Tracing further back to childhood factors, LBW is the most important (and accounts for 18 percent in the case of diabetes).
Thus in Sri Lanka, childhood stunting is not as much a concern for the chronic diseases as is LBW. This reflects in part the fact that stunting levels are only marginally higher than LBW—due to the relatively good breastfeeding practices in Sri Lanka that help limit stunting. However Sri Lanka faces the widespread problem experienced throughout south Asia of low maternal BMI, which limits progress on birthweight.
The combination of LBW and diets high in saturated fats and added sugar (and possibly a greater genetic predisposition) render diabetes a particular concern. This becomes even more of a concern when we make projections to 2025 (Table 11). With little progress on birthweight and increases predicted in saturated fat intake, diabetes prevalence increases dramatically (by a factor of 2.7 according to Zimmet’s predictions), and contributes strongly to other chronic disease. In 2025 we estimate that dietary factors account for 40 percent of CHD (saturated fat intake) with diabetes close behind as a contributor to CHD (29 percent). Overweight accounts for 24 percent of diabetes, diabetes for 18 percent of stroke cases, and overweight for 27 percent of hypertension. LBW again is the most important underlying childhood cause for all four conditions (CHD, stroke, diabetes, hypertension) and its importance grows as compared to 1995.

41
Table 10: Estimated contribution of diet to chronic disease in Sri Lanka, 1995
Condition Key diet factor PAR (Share of condition attributable
to diet factor) Current diet factors Cancer Fruit and vegetable intake 22.7%a CHD Saturated fat intake 15.6% CHD Diabetes 12.9% Diabetes Overweight 8.5% Stroke Hypertension 8.9% Stroke Diabetes 7.5% Hypertension Overweight 8.9% Childhood factors CHD Low birthweight 2.4% (via diabetes) Stroke Low birthweight 1.4% (via diabetes) Diabetes Low birthweight 18.4% (direct effect) Hypertension Low birthweight 7.0% (direct effect) Source: based on Appendix Table 24; estimates for cancer are from World Cancer Research Fund (1997). Notes: This table picks out the most important dietary channel(s) of influence on each of the outcomes. If
overlap between different channels is not 100 percent, then these are underestimates of the dietary effects on chronic disease.
a Estimates for cancer represent the proportion of all cancer deaths preventable by changes in diet, exercise, alcohol consumption. This represents the average over all forms of cancer: some forms of cancer are more preventable by diet (in particular fruit and vegetable intake) than others.
Table 11: Estimated contribution of diet to chronic disease in Sri Lanka, 2025
Condition Key diet factor PAR (Share of condition attributable
to diet factor) Current diet factors Cancer Fruit and vegetable intake 22.7%a CHD Saturated fat 39.9% CHD Diabetes 28.8% Diabetes Overweight 24.3% Stroke Diabetes 18.2% Stroke Overweight 10.0% Hypertension Overweight 26.5% Childhood factors CHD Low birthweight 5.3% (via diabetes) Stroke Low birthweight 3.3% (via diabetes) Diabetes Low birthweight 26.4% (direct) Hypertension Stunting 8.6% (via overweight) Hypertension Low birthweight 6.2% (direct) Source: based on Appendix Table 24; estimates for cancer are from World Cancer Research Fund (1997). Notes: This table picks out the most important dietary channel(s) of influence on each of the outcomes. If
overlap between different channels is not 100 percent, then these are underestimates of the dietary effects on chronic disease.
a Estimates for cancer represent the proportion of all cancer deaths preventable by changes in diet, exercise, alcohol consumption. This represents the average over all forms of cancer: some forms of cancer are more preventable by diet (in particular fruit and vegetable intake) than others.

42
Thus, the current economic costs of diet-related chronic disease in Sri Lanka are appreciable, although they are less important than in China currently, and less important than current problems related to malnutrition. However, the costs will increase substantially in the future.
Thus, Sri Lanka represents a pattern likely to be visible all over South Asia, although costs in Sri Lanka, if anything, are lower than in other countries in the region. Sri Lanka has better performance on birthweight than other countries in South Asia, and likely lower hypertension and obesity rates than in India. In Sri Lanka, as elsewhere in south Asia, key policy priorities are diet (especially saturated fat intake and added sugar) and exercise. Although not all Sri Lankans consume meat, the importance of coconut milk in the diet is an important factor in saturated fat consumption. In the long run, improving birthweight is important, particularly because of the association of LBW with diabetes.
This initial review and analysis, with estimated current and projected estimates of the economic costs of chronic diseases, is necessarily very broad and makes a number of assumptions that can be challenged. However, we believe that any cost-benefit analysis based on more and better data as these emerge will indicate that the figures suggested here are underestimates. In our view, understanding and control of epidemic chronic diseases, in the context of endemic deficiency and infectious diseases, is a challenge that governments and other policymakers throughout Asia must face.
4. PROGRAM OPTIONS FOR DIET-RELATED INTERVENTIONS TO CONTROL EPIDEMIC CHRONIC DISEASES IN ASIA
This review shows that there is enormous potential benefit in policies and programs designed to effectively control epidemic chronic diseases in Asia. Furthermore, the dietary and other determinants of important chronic diseases are well understood, and the lines of approach already fairly well laid down. In particular, we strongly recommend approaches that focus on the nutrition of the mother and child from preconception to weaning and afterward, and then later in the preschool and school setting.
But so far, there is limited experience and few large-scale programs instituted in Asia, and even less evaluation. Furthermore, basic data on the nutrition—epidemiological transitions in most Asian countries—is lacking. Without such information, intervention programs will to some extent be guesswork and their results hard to assess. It is

43
encouraging to know that other interventions designed to control chronic disease, e.g., smoking control and even low-cost drug therapy, can be efficient and effective (Jha 1999). See for example, the Eastern Collaborative study estimates of the likely gains from BP reduction for stroke prevention (Eastern Stroke and Coronary Heart Disease Collaborative Research Group 1998).
Diet-related programs to control chronic diseases can and should be highly cost-effective, (CDC 1999). In the United States, for example, the government-backed campaign that had the effect of reducing national fat consumption by between 1 percent to 3 percent of total calories has been estimated to save $4.1 to $12.7 billion in medical costs and lost productivity over a decade. It is also estimated that increased physical activity as specified in other government-backed campaigns could cut 35 percent of excess CHD in the United States (CDC 1999). Figure 31, drawn from thinking on obesity prevention, provides an overview of the types of changes that can be made in any country at the national and community levels.
This review next looks at integrated national plans to improve nutrition, following the examples of Norway and Mauritius. It then continues on to examine individual policies and programs that can be components of a national program, including agricultural development, use of the price mechanism, promotion of traditional healthy diets, use of the media, and school-based programs. Policies with indirect effects via improved birthweight and decreased stunting are discussed in Allen and Gillespie (2000).
We do not summarize any policies or programs proposed or instituted in economically developed countries, as this is outside the scope of this paper. Besides, the many hundreds of such initiatives have limited application in Asia. Asian policymakers and their advisors should have a good knowledge of initiatives undertaken in North America, western Europe, and other developed countries. However, these generally address the issues consequent on the end stage of the demographic-nutritional-epidemiological transition, when traditional agricultural and food systems have mostly disappeared, and where long-established food culture has been largely replaced by an internationalized food supply. (There are exceptions, as in Mediterranean countries.) Asian countries generally are at an early or mid-transitional stage, and traditional agriculture and food systems and food culture still flourish or at least survive in Asia. On the whole, we feel that policies and programs for Asia should not follow the model of developed countries.
In Asia, there have so far been few systematic attempts to use food and nutrition policy to prevent NCDs and enhance adult health. Rather the focus to date has been on

44
food insecurity and many efforts in countries as diverse as Thailand, China, and Sri Lanka have been successful; and where there is a national commitment to address a health problem, a number of countries in Asia have the ability to make changes. The first step is to create a priority for change and the second is to examine the specific types of food price, credit, research, and education programs that will work in each country.
China is one of the few countries in Asia (and the world) to address nutrition and public health issues on a national level in terms of food supply systems. In 1993, the Chinese government organized the National Commission for Food Reform and Development. The State Council (1993) issued the first document that addressed future food production and marketing in terms of its significance for nutritional well-being. In effect, they issued the first Chinese dietary guidelines. These guidelines focus on the food and production to eliminate undernutrition and also dietary excess and obesity. These guidelines explicitly attempt to increase production and therefore consumption of considerably fish, seafood, poultry, and soybeans. The guidelines point out many difficulties the Chinese face since large pockets of undernutrition exist, but they do provide a clear policy basis for developing and implementing food and nutrition policy to shift the composition of the diet (see also Geissler 1999).3 What is unique about this proclamation and the ongoing government effort in China is the Ministry of Agriculture’s recognition of the need to achieve a more balanced diet for the Chinese people and of the role that the nutrition community is playing in this activity.
An example of a large-scale integrated national program is in Mauritius. The Ministry of Health created a nationwide effort focused on the prevention of coronary heart disease. This small island republic in the Indian Ocean found such a high level of cardiovascular disease in 1987 that it launched a broad comprehensive health promotion program that used price policy, other legislative and fiscal measures, and widespread education activities in the community, workplace, schools, and the media. The results were remarkable: hypertension was reduced considerably, cigarette smoking in men and 3This comment about the Chinese dietary guidelines leads to consideration also of the unique phenomenon that exists—under- and overnutrition in the same Asian household. This finding challenges the assumption that underweight and overweight are opposing public health concerns, and illustrates the need for public health programs that are able to simultaneously address underweight and overweight. If large proportions of the households with an underweight member also contain an overweight member, programs targeting the reduction of underweight must be capable of addressing overweight as well. For example, public health policies that aim to reverse undernutrition for one household member by improving either the energy density of the household food supply or household food insecurity may have the undesired consequence of contributing to overweight and obesity in another member of an “at risk” household. This has been shown in unpublished research from Chile, where the programs that focused on undernutrition actually significantly enhanced the likelihood of overweight (Uauy, Albala, and Kain 2001).

45
women declined, heavy alcohol use declined, mean serum cholesterol decreased, and there was increased physical activity (Dowse et al. 1995; Uusitalo et al. 1996). However, obesity levels continued to increase and there was little change in the rate of glucose intolerance.
There are a series of policies and programs that form part of the national efforts, each of which are potentially very important, that we review next.
AGRICULTURAL DEVELOPMENT
Changes in agricultural systems may have a major effect on food supplies and therefore on diets (see Babu, Haddad, and Ruel 2000). One of the more important negative effects of agricultural development in Asia has been the set of initiatives that created the supply of very cheap edible oils throughout the developing world. The past five decades saw a revolution in the production and processing of oilseed-based fats. Initially, a rapid increase in the world demand for meat and its products and milk after World War II created a need for protein to provide animal feed. This was the motivating factor for the oilseed revolution. But the resultant growth in the availability of cheap fats may turn out to have had more impact on the human diet. Technological breakthroughs in the development of high-yield oilseeds and in the refining of high-quality vegetable oils have greatly reduced the cost of baking and frying fats, margarine, butter-like spreads, and salad and cooking oils in relation to animal-based products (Williams 1984).
Furthermore, a number of major economic and political initiatives led to the development of oil crops in Southeast Asia (palm oils) as well as in the United States, Brazil, and Argentina (soybean oils). The nutritional transition in developing nations typically begins with major increases in the domestic production and imports of oilseeds and vegetable oils rather than increased imports of meat and milk. Vegetable oils contribute far more energy to the human food supply than do meat or animal fats (Morgan 1993). Between 1991 and 1996/97 global production of vegetable fats and oils rose from 60 to 71 million metric tons. In contrast, the production of visible animal fats (butter and tallow) has remained steady at approximately 12 million metric tons. Principal vegetable oils include soybean, sunflower, rapeseed, palm, and peanut oil. With the exception of peanut oil, global availability of each has approximately tripled between 1961 and 1990. By the 1990s, soybeans accounted for the bulk of vegetable oil consumption worldwide. The production and exports of vegetable oils are promoted through direct subsidies, credit guarantees, food aid, and market development programs (USDA 1966; Morgan 1993).

46
This analysis also points out that fortification of edible oils may be a very poor alternative for Asia. Fortification of the oils would add an aura of healthfulness and help promote intake of a product whose health effects are quite mixed or negative.
In contrast to the livestock and oilseed areas, far less emphasis worldwide and in Asia has been placed on encouraging the horticulture of vegetables and fruits.
PRICE MECHANISMS
All Asian countries have policies that in one way or another affect the prices an availability of food. Governments engage in numerous direct and indirect methods to affect food prices, ranging from direct subsidies that lower the purchase price to subsidies and taxes on various inputs, e.g., fertilizer, insecticides, and credit programs. Import and export policies, research programs, and many other activities have profound effects on the cost of each food item.
Moreover, because many foods either complement or substitute for others, a change in the price of one item may change the consumption of other items considerably. For instance, we have noted that the reduced cost of pork in China increased consumption of pork and reduced intake of other major sources of protein, such as wheat and rice (Guo et al. 1999). And similarly, an increased cost for edible vegetable oil would have reduced intake of this food and increased consumption of many other foods. Alderman (1986) has effectively summarized the importance of price policy for its effects on increased energy intake and a related array of staple foods among low-income countries (see also Pitt and Rosenzweig 1986). Also research on micronutrient malnutrition has shown that price changes can effectively affect deficiencies in micronutrients by increasing fruit and vegetable intake and other food sources of micronutrients (Behrman, 1995; Bouis and Novenario-Reese 1998; Bouis 1991).
PRESERVATION OF TRADITIONAL DIETS
South Korea provides an example of the possible benefits of promotion of health through retention of the traditional diet. Despite the very rapid economic change and the very high per capita GNP, South Korea’s fat intake level and obesity level are approximately half of what would be expected for a country at its level of economic development (Kim, Moon, and Popkin 2000). In addition, its vegetable intake is much higher. One plausible explanation is that movements to retain the traditional diet have

47
been strong in South Korea. These include mass media campaigns, such as television programs that promote local foods, emphasizing their higher quality and the need to support local farmers. For example, KBS First station’s daily program Six O’clock My Village introduces famous products of South Korean villages and promotes consumption of traditional dishes. South Korea also promotes the concept of Sin-To-Bul-Yi, translated directly as “A body and a land are not two different things,” which is interpreted to mean that a person should eat foods produced in the land where he was born and lives.
Part of this effort is reflected in a unique training program offered by the Rural Development Administration. Beginning in the 1980s, the Home Management Division of the Rural Living Science Institute trained thousands of extension workers to provide monthly training sessions in cooking methods for traditional Korean foods, such as rice, kimchi (pickled and fermented Chinese cabbage), and fermented soybean food.4 These sessions are open to the general public in most districts in the country, and the program appears to reach a large audience (Rural Living Science Institute 1999).
USE OF MASS MEDIA
In Asia, Thailand’s experience in using mass media to promote maternal and child nutrition in the context of social marketing of condoms to protect against STD and HIV transmission are well documented. Components of the nutrition work are discussed in other studies (Allen and Gillespie 2000). But no experience exists yet in the health promotion area as it relates to diet-related NCDs. Thailand has recently begun a similar process with “healthy Thai” diet guidelines but this is in the initial stages where small pilots will be developed and an nationwide initiative will begin to be discussed. It will be important to evaluate these new pilots and create and evaluate pilot projects in other Asian countries before we can identify core NCD-related communication strategies.
Since there are no other Asian examples of use of the mass media (other than the Korean case discussed above), we discuss examples from Brazil and the United States. The Mauritius case discussed earlier also encompassed use of mass media.
Brazil is the only low-income country for which obesity rates have declined for large segments of the adult population. Among the upper 75 percent of the income levels, urban Brazilian women reduced their obesity level from 1989 to 1997 by over 28 percent
4The training of extension workers began before this as part of the Seamoul Undong movement and the UNICEF Applied Nutrition Programmes; however, the focus on the specific issues noted here began later.

48
(Monteiro et al. 2000).5 It is impossible to clearly ascribe causality to this trend, but the most likely causal agents come from the media (discussed in Monteiro et al. 2000). The first consistent publicly directed mass intervention aiming the control of obesity in Brazil was launched only in 1997 after the recorded decline (1989–1996). Moreover, this intervention is still restricted to some cities in the São Paulo State (Matsudo 1997).
In the United States, the “five-a-day” program (related to five servings of fruits and vegetables) has focused on large-scale education along with intensive localized efforts in an attempt to increase fruit and vegetable intake. This effort is part of a new generation of proactive initiatives by the U.S. National Institutes of Health but its impact is limited thus far (Subar et al. 1995). Moreover as with most U.S. diet-related NCD-linked initiatives, they are focused on single sectors and are limited initiatives that do not link legislation, regulations, price policies, and education initiatives.
SCHOOL-BASED PROGRAMS
Schools are an excellent setting for programs designed to protect or improve good nutrition, together with regular physical activity. Singapore has been a leader in the area of exercise promotion and weight control in schools. In the early 1990s, Singapore recognized the marked reduction in fitness and increased prevalence of obesity among school-age children as central health concerns. They developed the “Trim and Fit Scheme” 10-year program in 1992. This comprehensive program included training of principals (three days each year), a health education course for teachers on exercise and nutrition, a workshop for school vendors and canteen committees, an assessment of students, including the identification of at-risk/overweight students, a full set of materials and individual charts for each student, an increased provision of water coolers, reduction of the sugar level in all beverages provided in the school, increased school workouts for children and greater attention to the rigor of those offered in schools.
5Since 1992, after the disclosure of the findings of the 1989 national survey showing that obesity and not undernutrition was the main nutritional problem of the adult population in Brazil, several major TV networks and leading newspapers and magazines have produced, on an almost weekly basis , extensive information on the health consequences of obesity and the importance of avoiding energy-dense diets and increasing physical activity. Part of the media (particularly TV programs targeted to the female population) has also been engaged in promoting a—sometimes unrealistically—thin image for women. As we search for large-scale approaches to both reduce and prevent obesity, it will be important to understand thoroughly the Brazilian situation and others where we find significant declines in obesity.

49
The result has been a marked improvement in fitness and some evidence of a meaningful reduction in the obesity level. They found an 11 percent increase over three years in the proportion of children they tested to be fit and a considerable reduction in obesity. For example, during a one-year period in which they utilized the same BMI standard for obesity, they found a 1.2 percentage point (about 10 percent decline in prevalence rate) decline in the proportion of children who were deemed to be overweight (Ian Caterson, personal communication).6
An important point relates to the long-term effects of fetal programming. As noted above, the health risks of LBW and inter-uterine growth retardation are affected by subsequent obesity and inactivity and poor diets. The school system is a critical component of any system to monitor incipient obesity. Of course, other elements of long-term screening and health promotion are also needed.
5. PROPOSALS FOR POLICIES AND PROGRAMS ADDRESSING EPIDEMIC CHRONIC DIET-RELATED DISEASES IN ASIA
The rate of change of patterns of nutrition and of disease throughout Asia, including most of the countries studied here, is rapid. The rapid increase in adult obesity in China (an increase of over 1 percentage point per year) is indicative of this. The populations involved are so large, and the implications for the future welfare of the Asian region so apparent, that there is a clear need for policies and programs designed to fully understand what is happening and why and to address the issues in all their dimensions.
6 There has been research on this topic elsewhere. Research in the United States has shown that physical activity and dietary behavior during the school-age period have shifted toward patterns that have led to high obesity rates and early onset of many diet-related NCDs. For instance, one large-scale study among over 15,000 adolescents found that a very small proportion of children in this nationally representative sample of those aged 11–18 participated in physical education programs. Yet this same research found that participation in physical education classes would have a marked effect on improving physical activity of these adolescents (Gordon-Larsen, McMurray, and Popkin 2001). Other U.S. intervention research has shown that physical fitness can improve with interventions in the schools. A large-scale project in the elementary schools in the United States focused on education related to the benefits of heart-healthy eating and vigorous physical activities among 4,000 children. Child and Adolescent Trial for Cardiovascular Health (CATCH) was the largest school-based health promotion study ever done in the United States. The study involved nearly 100 ethnically and racially diverse elementary schools. It sought to determine if multicomponent health promotion efforts targeting both children’s behavior and the school environment, including classroom curricula, food service modifications, physical education changes, and family reinforcement, would reduce cardiovascular disease risk factors later in life. The result suggests that health behaviors initiated during the elementary school years persist into early adolescence (Nader et al. 1999).

50
However, in common with Latin America and Africa, countries in Asia have not yet paid much attention to the colossal transitions summarized in this review, or to their current and future impact. Asia has paid limited attention to the creation of large-scale and even smaller projects and policies that address the diet-related chronic diseases. Out of the above short review, one can see elements of programs that have been successful in limited ways. But there is little experience in Asia, and we feel it is important to undertake a series of smaller community-based projects as well as review and consideration of national policies to be initiated and seriously evaluated.
At the national level there are several elements that emerge. First and foremost are national efforts to create coordinated food and agricultural policies that consider diet-related chronic diseases. A second component is pricing policy. Third are the large-scale activities that promote important healthful components of traditional eating patterns, as in South Korea. Fourth are efforts such as those in Brazil to begin to build public awareness in a meaningful way of the elements of the food-based dietary guidelines and activity patterns. Finally, at the community and institution levels, the main effort that bears review is the Singapore school nutrition and fitness program. Clearly, reducing child obesity and inactivity represents a major aspect of any program. As has been noted by Swinburn and Eggers, there is a highly “obesogenic” environment emerging in most Asian countries. Environmental assessments and changes are needed (Egger and Swinburn 1997; Swinburn, Egger, and Raza 1999). The schools and preschools are the place to begin. There are few other community-based efforts that appear relevant at this time. One can extrapolate from current research and think of many other components of programs and policies, but few have seen actual large-scale implementation and evaluation.
The area of promotion of physical activity and reduction of inactivity seems to be focused on a combination of the provision of a more supportive environment (including programs and facilities in a range of settings) along with educational and behavioral change activities (Sallis, Bauman, and Pratt 1998). Figure 32 summarizes some of the options for improving physical activity considered in higher-income countries. Without some research and focus on these issues at the Asian country level, it is impossible to set priorities or consider program options at this time, in particular for disadvantaged groups. Most programs in the higher-income countries focus on improved leisure activity but little thought has been given to ways to enhance activity in Asian countries.
For school-based programs, the set of potential strategies needed to make the food environment more health-enhancing includes promoting meaningful ways of increasing consumption of lower-energy, denser, more healthful foods (e.g., fruits, vegetables, and

51
whole grains), and discouraging the consumption of foods high in fat and sodium. Similarly, attention to making healthy changes in physical activity is essential. There are a myriad of examples of what is needed, but only the most systematic efforts such as are found in Singapore tend to work.
Operations research is needed. It is clear that many of the program elements needed to create successful school nutrition or other national or local efforts require piloting and evaluation. It is also clear that most Asian countries’ energies in the nutrition sector continue to focus on problems of undernutrition, even when the costs of dietary-related NCDs are becoming greater. To break through this problem and assist member nations, the support of operations research and capacity building is needed. Clear examples of useful operations research projects could include testing elements in one Asian country from successful programs from another Asian country or another region of the world as we search for the development of unique preventive solutions for each country.
Many elements of a national plan must be country-specific. For instance, in China the promotion of consumption of selected key foods, in particular soybean foods, are seen as important. This includes a major shift in agriculture policy whereby soya is now classified as a cash crop rather than a staple and its pricing (amount paid for soya, etc.) will be more flexible. The Ministry of Agriculture will have more latitude to increase soya consumption, and is, for example, pushing for more foods with soya to be prepared. Another element relates to the 1999 qualitative Dietary Guidelines for Chinese Residents that reflect the multidimensionality of diet as well as the nutrition and epidemiological transitions in China. The proposed guidelines explicitly aim to reduce both extremes of poverty and excess, promote good health, enhance immunity, reduce the risks of stunting and rickets, as well as prevent cardiovascular disease, hypertension, osteoporosis, and some cancers. Also, China is considering ways to prevent further obesity, but no set of programs and policies has emerged yet.
It would be convenient if there were an obvious arsenal of programs and policies that had been tested and could be promoted. But this is not the case, as this review notes. Countries in Asia are not ready for large-scale program and policy initiatives to combat diet-related NCDs. However, there is a great urgency to begin such efforts. Moreover, development of food and nutrition and health policies for countries where problems of dietary excess and deficit exist side by side represents a new and pressing agenda. In such countries, the prevailing policies to promote agricultural and health changes to address problems of deficit are quite different from those needed to address problems of excess. In Asia, one important current effort has been related to the preparation and use of food-

52
based dietary guidelines. However, less has been done to promote in a systematic way consumption of this healthful diet. Other elements might emerge from the experiences discussed above and new programs that must be developed, tested, and evaluated for effectiveness and cost-effectiveness. At this point it is premature to think of developing national investment plans. However, funding and evaluating pilot studies is a key step forward. The need for action is most urgent in the richer countries, further along in the transition, where undernutrition is becoming an issue of the past. However, even the lower-low income countries have to think about the emerging problems in the urban areas; the impending diabetes epidemic in urban south Asia is a case in point. The small islands have their own particular problems with high levels of obesity and overweight. This analysis has clearly shown that the nutritional transition and diet-related chronic diseases in Asia are concentrated in urban areas. Inactivity is greater, consumption of a more energy-dense diet is greater, obesity is higher, and many of the other environmental factors that promote the noncommunicable diseases are found in greater concentration in urban areas. As a major component of an urban nutrition strategy, it would be most useful to include noncommunicable disease prevention focused on dietary, activity, and body composition changes.
Capacity building is a key need, as we have shown that Asian governments have invested very little in prevention of diet-related NCDs. Most Asian countries lack institutions to assist macroeconomic development planners to incorporate food and nutrition issues related to both under- and overnutrition, and some such as China already wish to develop this capability. Similarly, the development of trained personnel and institutions focused on creating a new array of monitoring, screening, and programs and policies related to the nutritional components of the NCDs is crucial. Elements that we have noted in this review focus on school health, trade and food production, licensing and pricing policies, national (particularly urban) monitoring, mass media, and the establishment of appropriate dietary guidelines to promote healthful elements of the traditional diet and the discouragement of unhealthful elements of new dietary patterns.
It is important to point out that this review shows that a strategy that views the elimination of communicable diseases as the only way to improve the health of the poor (e.g., Gwatkin and Guillot 2000; Gwatkin 2000) will miss important causes of poor health and survival among the poor. Diet-related NCDs are problems that poor Asians are increasingly facing.
This review also points out how little we know about the patterns and trends in diet and physical activity and the causes of these trends. Large forces of global trade, technological changes in work and leisure, mass media, and urbanization are linked with

53
these massive shifts in consumption and activity. Clearly, one of the challenges this review points out is a need for greater understanding of the programs, not only to address the negative effects of these changes, but also to better understand the underlying causes of these changes. The groupings that were presented in this report provide some glimpse of the common shifts in structures of dietary and activity patterns that emerge. Unfortunately with so little program and policy work undertaken in this region, it is too early to understand if the same set of programs and policies will work in countries with similar shifts in dietary and activity patterns. At this time, however, it is clear that several of the regional groupings are much further along in the nutritional transition and far more attention should be paid to the prevention of diet-related chronic diseases in these regions of Asia.

54
APPENDIX TABLES

55
Table 12: Low birthweight prevalence across the Asian Region (the most recent data for each country from the 1990s)
Country Prevalence of low birthweight 1990s Higher income
Singapore 7.3 Hong Kong 5 Korea, Rep. 1 Middle income
Malaysia 7.3 Thailand 8.2 The Philippines 11 Small islands
Fiji 12 Vanuatu 7.4 Maldives 25 Kiribati 3 Samoa 4 Papua New Guinea 16 Solomon Islands 20 Cook Islands 1 Tuvalu 3.3 Upper low income
Sri Lanka 25 corrected China 9 Indonesia 11 Lower low income
Pakistan 25 India 33 Bangladesh 50 Kyrgyz Republic 6 Tajikistan 7.4 Lao PDR 60 Viet Nam 10.8 Cambodia 18.4 Nepal 23.2 Afghanistan 20 Bhutan 40 corrected Myanmar 23.5
Source: WHO Division of Nutrition Surveillance data.

56
Table 13: Stunting prevalence across the Asian region (the most recent data for each country from the 1990s for children ages 2-6)
Country
Stunting
Year
Fiji
2.7
Sri Lanka
20.8
China
24
1993
Indonesia
42.2
1993
Bangladesh
54.6
Viet Nam
46.9
1993

57
Table 14: Trends in food available for consumption from 1962-96 for Asian countries grouped by income levels (annual quantity of food in kg/capita)
Food group Level 1962 1967 1972 1977 1982 1987 1992 1996 Cereals High income 175.6 192.8 217.3 210.9 184.6 184.4 163.2 163.3 Middle income 126.6 129.8 136.7 135.4 136.2 129.8 142.6 133.9 Small islands 36.4 43.2 50.8 55.1 61.5 68.1 74.8 88.0 Upper low income 122.5 145.0 153.0 165.3 194.3 200.9 197.4 192.1 Lower low income 147.8 144.2 151.8 148.9 154.7 159.5 164.7 171.9
Starchy roots High income 42.3 51.4 44.8 31.5 22.8 16.7 16.9 18.4 Middle income 28.6 25.1 20.3 37.9 29.7 28.3 31.3 31.4 Small islands 307.4 297.9 282.4 268.3 255.4 243.7 225.5 208.1 Upper low income 108.5 109.2 107.1 101.5 81.9 63.6 59.3 62.5 Lower low income 11.5 15.0 17.1 20.2 20.8 19.7 20.4 21.1
Cereals and starchy roots High income 217.8 244.2 262.1 242.4 207.4 201.0 180.1 181.7 Middle income 155.2 154.9 157.0 173.3 165.9 158.1 173.9 165.3 Small islands 343.8 341.2 333.2 323.3 316.9 311.8 300.3 296.0 Upper low income 231.0 254.2 260.1 266.8 276.3 264.4 256.7 254.7 Lower low income 159.3 159.3 168.9 169.1 175.5 179.3 185.1 193.0
Dairy High income 5.1 4.6 7.0 10.2 14.8 19.9 25.6 27.9 Middle income 12.4 14.5 14.7 17.6 16.8 18.8 34.5 40.8 Small islands 9.5 12.6 15.0 14.0 14.2 14.5 16.3 16.7 Upper low income 2.9 2.5 6.5 3.3 4.2 5.5 8.9 10.1 Lower low income 38.5 35.5 35.7 37.8 41.7 46.8 50.2 55.0
Eggs High income 2.4 3.2 5.0 6.0 7.3 8.7 9.5 9.7 Middle income 5.2 5.4 5.7 6.6 6.3 6.2 8.6 8.3 Small islands 0.7 0.7 0.8 0.8 1.0 1.1 1.2 1.3 Upper low income 1.8 1.8 1.9 2.1 2.6 4.7 7.2 12.5 Lower low income 0.4 0.5 0.6 0.7 0.8 1.1 1.2 1.3
Dairy and eggs High income 7.5 7.8 12.0 16.2 22.0 28.5 35.1 37.6 Middle income 17.6 19.9 20.4 24.2 23.1 25.0 43.1 49.1 Small islands 10.2 13.3 15.8 14.9 15.3 15.6 17.4 18.0 Upper low income 4.5 4.3 8.456 5.4 6.8 10.2 16.1 22.6 Lower low income 38.9 35.9 36.2 38.5 42.6 47.9 51.4 56.3 Meat/poultry High income 8.6 10.8 13.5 16.8 23.7 28.8 40.2 48.1 Middle income 12.7 15.2 15.0 15.8 18.1 18.7 27.7 30.6 Small islands 15.9 17.8 20.9 22.8 22.9 25.5 27.9 27.3 Upper low income 4.6 8.6 9.2 9.4 13.7 19.2 26.9 35.2 Lower low income 4.9 5.0 4.9 4.9 5.3 5.8 6.5 6.9
Fish, seafood High income 15.9 22.0 32.0 39.5 44.7 49.0 48.7 51.7 Middle income 17.5 24.8 28.3 29.2 29.9 30.0 31.6 31.4 Small islands 18.3 23.1 30.1 26.8 36.9 39.4 30.4 25.5 Upper low income 5.5 5.6 5.5 6.2 6.5 10.1 14.2 22.7 Lower low income 3.6 4.2 4.5 4.2 4.1 4.4 5.1 5.4 (continued)

58
Table 14 (continued)
Food group Level 1962 1967 1972 1977 1982 1987 1992 1996 Fruits High income 11.5 19.9 26.1 33.5 44.6 55.1 82.8 94.9 Middle income 81.8 81.0 73.3 100.0 109.6 105.3 88.0 93.5 Small islands 176.3 179.5 181.7 181.1 176.6 168.6 173.6 165.9 Upper low income 16.3 14.4 13.9 14.3 17.5 28.0 33.1 51.5 Lower low income 26.6 28.1 26.0 25.4 27.0 29.1 29.8 33.4
Vegetables High income 70.4 84.4 97.1 168.7 171.2 160.5 167.6 169.5 Middle income 47.6 47.0 48.7 47.6 47.6 45.6 45.3 48.5 Small islands 65.7 69.6 70.5 70.0 71.5 73.0 71.7 67.9 Upper low income 59.1 42.2 36.7 38.2 47.8 71.8 88.6 123.2 Lower low income 32.5 35.3 37.5 38.8 41.1 43.8 44.4 46.3
Fruits and Vegetables High income 81.9 104.3 123.2 202.2 215.8 215.7 250.4 264.4 Middle income 129.4 128.0 121.9 147.7 157.2 151.0 133.3 142.0 Small islands 242.0 249.1 252.1 251.1 248.0 241.6 245.3 233.8 Upper low income 75.5 56.7 50.5 52.6 65.3 99.9 121.6 174.7 Lower low income 59.1 63.4 63.5 64.2 68.1 72.8 74.2 79.6
Animal fats High income 1.1 1.3 2.2 3.2 2.3 2.4 2.7 3.3 Middle income 0.7 1.0 1.0 1.0 1.0 1.0 1.8 1.4 Small islands 1.3 1.6 1.9 2.2 2.0 2.3 2.1 2.7 Upper low income 0.3 0.5 0.6 0.7 0.8 1.0 1.3 1.6 Lower low income 1.0 1.0 1.0 1.0 1.0 1.1 1.3 1.5 Added sugar High income 4.6 6.4 9.7 13.5 17.0 27.0 32.8 35.5 Middle income 12.1 15.7 17.0 20.5 20.6 22.4 26.2 31.7 Small islands 9.2 11.4 13.1 13.2 14.1 13.2 12.2 13.6 Upper low income 3.5 4.1 4.5 5.2 7.5 8.7 8.5 9.1 Lower low income 16.3 16.7 17.3 17.8 17.8 18.5 19.7 20.1 Note: Values are presented as a three-year average, weighted based on countries in groupings at each point in time.

59
Table 15: Trends in the proportion of energy available for consumption by source from 1962-96
% Energy from Transition group Year
Total energy (Kcal/d/capita) Carbohydrate Fat Protein Alcohol
High income 1962 2247.4 77.8 8.8 10.3 3.0 1967 2541.5 76.4 9.6 10.5 3.5 1972 2947.5 72.7 10.9 10.6 5.8 1977 3090.5 70.7 12.5 10.8 6.0 1982 2959.4 67.5 15.8 11.1 5.5 1987 3103.0 66.4 18.1 11.0 4.5 1992 3084.2 62.8 22.3 10.9 4.1 1996 3166.8 61.5 23.7 11.1 3.7
Middle income 1962 1908.3 75.2 15.4 8.9 0.5 1967 1994.7 73.9 15.8 9.2 1.1 1972 2049.5 74.4 15.0 9.5 1.1 1977 2213.2 73.9 15.3 9.0 1.7 1982 2257.7 72.7 15.9 9.1 2.3 1987 2254.1 70.9 17.1 9.1 2.8 1992 2474.1 68.0 18.8 9.7 3.5 1996 2497.0 67.3 19.0 9.8 3.7
Small islands 1962 1834.4 76.9 14.6 8.2 0.4 1967 1930.6 76.0 15.0 8.5 0.5 1972 2030.8 74.1 16.2 8.9 0.9 1977 2078.7 73.0 17.3 8.7 1.1 1982 2181.3 71.4 18.6 9.1 0.9 1987 2232.1 70.2 19.7 9.3 0.8 1992 2281.0 69.0 21.3 9.0 0.8 1996 2333.6 69.9 20.5 9.1 0.6
Upper low income 1962 1715.4 80.1 9.4 10.1 0.5 1967 1953.3 78.7 11.2 9.6 0.5 1972 2017.2 79.1 11.0 9.3 0.6 1977 2110.0 79.1 11.0 9.2 0.8 1982 2435.8 76.4 13.2 9.1 1.2 1987 2583.3 73.1 15.6 9.4 1.9 1992 2672.4 69.4 18.8 9.8 2.1 1996 2831.2 65.8 21.2 10.4 2.6
Lower low income 1962 2020.0 76.7 13.0 10.1 0.1 1967 1949.0 76.8 13.0 10.0 0.2 1972 2034.2 77.3 12.7 9.9 0.2 1977 2044.4 76.6 13.4 9.8 0.2 1982 2115.1 76.1 13.9 9.8 0.2 1987 2215.4 75.2 14.8 9.7 0.2 1992 2309.0 74.7 15.4 9.6 0.3 1996 2421.8 74.2 15.9 9.6 0.3
Notes: Values are presented as three-year averages, weighted based on countries in groupings at each point in time. % Energy from alcohol = 100 - (% Energy from carbohydrate + % Energy from protein + % Energy from fat)

60
Table 16: TV ownership in each country grouping (per 1,000 people)
Country 1965 1970 1975 1980 1985 1990 1995 High income Singapore 53.2 96.4 186.0 310.6 332.3 378.9 361.6 Hong Kong, China 13.5 112.6 190.4 221.1 233.7 271.7 366.3 Korea, Rep. 2.1 18.8 70.9 165.3 189.2 209.9 321.0 Middle income Malaysia 5.6 12.0 36.9 87.2 115.4 149.4 223.6 Thailand 6.5 7.0 12.1 21.4 98.4 106.8 159.9 Kazakhstan .. .. .. .. 266.2 281.9 275.1 The Philippines 3.7 10.7 17.6 21.7 27.4 49.4 125.9 Small islands Fiji .. .. .. .. .. 15.1 89.3 Micronesia, Fed. Sts. .. .. .. 1.2 4.4 5.0 21.0 Tonga .. .. .. .. .. .. 40.8 Vanuatu .. .. .. .. .. 9.3 11.8 Maldives .. .. .. 7.0 17.4 23.8 40.5 Kiribati .. .. .. .. .. 9.5 20.3 Samoa .. .. .. 16.1 31.8 38.8 42.2 Papua New Guinea .. .. .. .. .. 2.3 3.5 Upper low income Uzbekistan .. .. .. .. 176.7 181.2 189.8 Sri Lanka .. .. .. 2.4 27.9 34.8 77.4 China 0.1 0.8 1.3 5.1 38.1 157.9 247.9 Indonesia 0.0 0.7 9.6 19.9 39.3 58.5 183.3 Lower low income Pakistan 0.2 1.5 5.1 11.0 13.3 18.4 23.1 India 0.0 0.1 0.8 2.5 5.2 32.0 61.3 Mongolia .. 0.8 2.4 3.4 23.6 63.1 61.6 Bangladesh 0.1 0.1 0.3 0.9 2.6 4.9 7.1 Kyrgyz Republic .. .. .. .. 225.6 229.3 .. Tajikistan .. .. .. .. 175.5 189.1 258.0 Lao PDR .. .. .. .. .. 7.1 9.8 Viet Nam .. .. .. .. 33.4 39.0 163.3 Cambodia 1.1 2.7 4.2 5.4 6.9 7.7 8.3 Nepal .. .. .. .. 1.2 1.8 3.1 Afghanistan .. .. .. 2.8 6.9 9.0 9.9 Bhutan .. .. .. .. .. .. 17.2 Myanmar .. .. .. 0.0 0.5 2.8 6.8 Note: Values are presented as three-year average, weighted based on countries in groupings at each point
in time.

Table 17: Trends in the proportion of the population residing in urban areas by country groupings in Asia 3-yr avg
Regional Wt. Avg
3-yr avg
Regional Wt. Avg
3-yr avg
Regional Wt. Avg
3-yr avg
Regional Wt. Avg
3-yr avg
Regional Wt. Avg
3-yr avg
Regional Wt. Avg
3-yr avg
Regional Wt. Avg
3-yr avg
Regional Wt. Avg. Urban population
(% of total) 1960 1965 1970 1975 1980 1985 1990 1995
High income Singapore 100.0 39.1 100.0 42.6 100.0 49.4 100.0 55.8 100.0 63.2 100.0 70.1 100.0 77.5 100.0 83.8 Hong Kong, China 85.3 86.4 87.7 89.7 91.5 92.9 94.1 95.0 Korea, Rep. 28.6 32.6 40.6 48.1 56.8 65.0 73.7 81.1 Middle income Malaysia 27.3 25.1 29.9 26.3 33.5 27.8 37.7 30.1 42.0 32.4 45.9 35.7 49.7 39.1 53.6 42.4 Thailand 12.6 12.9 13.4 15.1 16.9 17.9 18.7 20.0 Kazakhstan 45.2 47.5 50.2 52.2 54.0 55.8 57.6 59.6 The Philippines 30.6 31.6 33.1 35.6 37.7 43.0 48.8 54.0 Small islands Fiji 30.3 8.5 32.6 10.4 34.8 13.8 36.6 15.9 37.8 17.2 38.5 18.3 39.3 19.4 40.6 20.6 Micronesia, Fed. Sts. 23.7 23.9 24.3 24.6 25.0 25.3 26.2 27.7 Tonga 18.0 19.6 20.3 20.5 23.8 29.1 35.1 40.9 Vanuatu 9.4 10.9 13.1 15.7 17.8 18.0 18.2 18.9 Maldives 11.3 11.6 13.7 18.0 22.2 25.3 25.9 26.9 Kiribati 16.9 20.5 25.6 29.9 31.7 33.5 34.6 35.7 Samoa 19.0 19.3 20.3 21.0 21.2 21.1 21.0 21.0 Papua New Guinea 3.2 5.3 9.6 11.8 13.0 14.0 15.0 16.0 Solomon Islands 8.6 8.8 8.9 9.2 10.5 12.4 14.6 17.0 Upper low income Uzbekistan 34.3 17.8 35.3 17.8 36.8 17.8 39.1 18.0 40.7 20.3 40.7 24.0 40.6 27.0 41.2 30.9 Sri Lanka 18.3 19.9 21.8 22.0 21.6 21.1 21.3 22.1 China 17.9 17.7 17.5 17.3 19.6 23.4 26.3 30.2 Indonesia 14.8 15.8 17.2 19.4 22.3 26.1 30.6 35.4 (continued)

1
Table 17 (continued)
Urban population
3-yr avg
Regional Wt. Avg
3-yr avg
Regional Wt. Avg
3-yr avg
Regional Wt. Avg
3-yr avg
Regional Wt. Avg
3-yr avg
Regional Wt. Avg
3-yr avg
Regional Wt. Avg
3-yr avg
Regional Wt. Avg
3-yr avg
Regional Wt. Avg.
(% of total) 1960 1965 1970 1975 1980 1985 1990 1995 Lower low income Pakistan 22.4 16.9 23.5 17.7 24.9 18.9 26.4 20.3 28.1 21.9 29.8 23.2 31.9 24.5 34.3 26.0 India 18.2 18.8 19.8 21.3 23.1 24.3 25.5 26.8 Mongolia 37.0 41.9 45.1 48.7 52.1 55.0 58.0 60.8 Bangladesh 5.3 6.2 7.6 9.3 11.3 13.4 15.7 18.3 Kyrgyz Republic 34.5 35.8 37.3 37.9 38.3 38.2 38.2 38.8 Tajikistan 33.6 35.2 36.7 35.5 34.3 33.2 32.3 32.2 Lao PDR 8.0 8.4 9.6 11.4 13.4 15.6 18.1 20.7 Viet Nam 15.0 16.4 18.2 18.8 19.2 19.6 19.7 19.4 Cambodia 10.4 10.8 11.5 10.5 12.4 14.8 17.5 20.4 Nepal 3.2 3.5 3.9 5.0 6.5 7.8 8.9 10.3 Afghanistan 8.3 9.4 11.0 13.3 15.5 16.9 18.2 19.9 Bhutan 2.6 2.8 3.1 3.5 3.9 4.4 5.2 6.0 Myanmar 19.6 21.0 22.8 23.8 24.0 24.0 24.6 25.8 Note: Weights are based on countries in groupings at each point in time.

63
Table 18: The prevalence of obesity across the Asian Region (BMI distribution)
BMI 25-29.9 BMI≥≥ 30 BMI ≥≥ 25 Male Female Male Female Male Female A. Classified by gender Malaysia 24 18.1 4.7 7.9 28.7 26 Philippines 11 11.8 1.7 3.4 12.7 15.2 Nauru 80.2 78.6 China 9.1 13.1 1.2 1.6 10.3 14.7 Indonesia 9.3 14.9 0.93 3 10.3 17.9 Kyrgyz Republic 26.3 25.6 5.1 11.8 31.3 37.3 Viet Nam 0.87 2.4 0.05 0.16 0.92 2.5 B. Classified for the total adult population by urban/rural residence status Urban Rural Urban Rural Urban Rural Year Thailand 24.6 2.4 27 1985 China 17.1 8.4 2.5 0.92 20.4 9.8 1993 Indonesia 18.6 7.1 3.3 1.1 21.8 8.1 1993 Kyrgyz Republic 27.8 24.7 9.6 7.7 37.4 32.4 1993 Viet Nam 3.9 0.95 0.21 0.08 4.1 1 1992-3
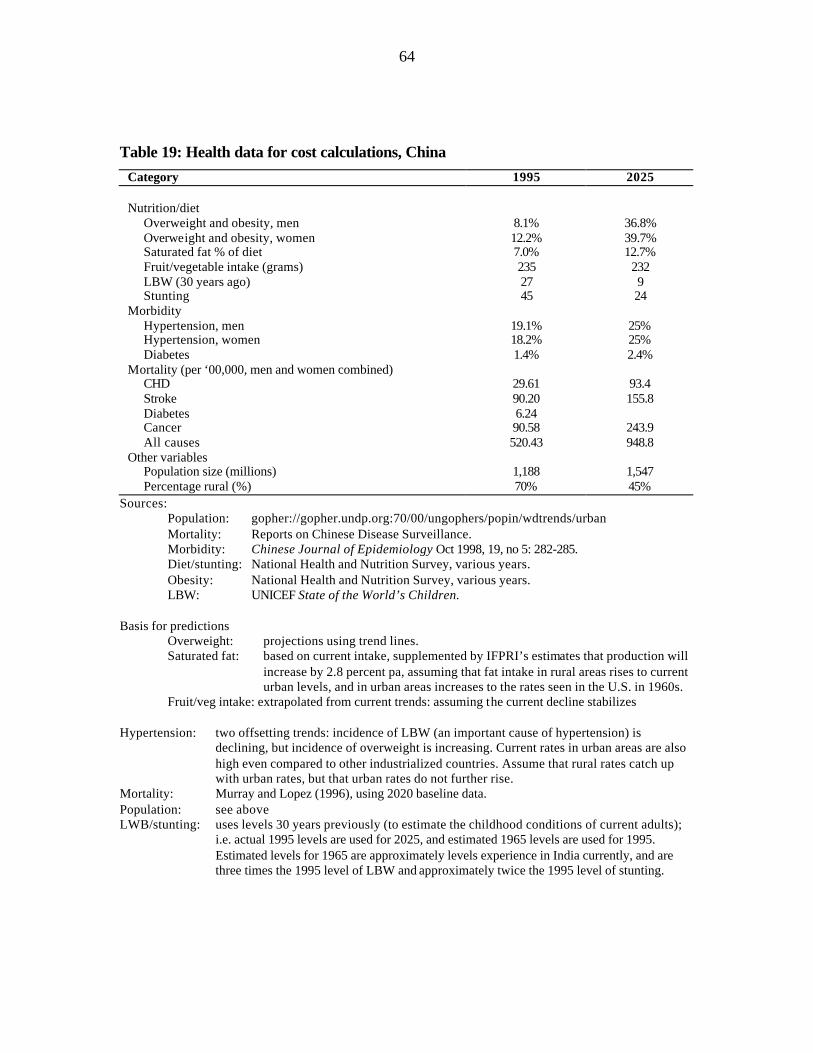
64
Table 19: Health data for cost calculations, China
Category 1995 2025 Nutrition/diet Overweight and obesity, men 8.1% 36.8% Overweight and obesity, women 12.2% 39.7% Saturated fat % of diet 7.0% 12.7% Fruit/vegetable intake (grams) 235 232 LBW (30 years ago) 27 9 Stunting 45 24 Morbidity Hypertension, men 19.1% 25% Hypertension, women 18.2% 25% Diabetes 1.4% 2.4% Mortality (per ‘00,000, men and women combined) CHD 29.61 93.4 Stroke 90.20 155.8 Diabetes 6.24 Cancer 90.58 243.9 All causes 520.43 948.8 Other variables Population size (millions) 1,188 1,547 Percentage rural (%) 70% 45%
Sources: Population: gopher://gopher.undp.org:70/00/ungophers/popin/wdtrends/urban Mortality: Reports on Chinese Disease Surveillance. Morbidity: Chinese Journal of Epidemiology Oct 1998, 19, no 5: 282-285. Diet/stunting: National Health and Nutrition Survey, various years. Obesity: National Health and Nutrition Survey, various years. LBW: UNICEF State of the World’s Children. Basis for predictions
Overweight: projections using trend lines. Saturated fat: based on current intake, supplemented by IFPRI’s estimates that production will
increase by 2.8 percent pa, assuming that fat intake in rural areas rises to current urban levels, and in urban areas increases to the rates seen in the U.S. in 1960s.
Fruit/veg intake: extrapolated from current trends: assuming the current decline stabilizes Hypertension: two offsetting trends: incidence of LBW (an important cause of hypertension) is
declining, but incidence of overweight is increasing. Current rates in urban areas are also high even compared to other industrialized countries. Assume that rural rates catch up with urban rates, but that urban rates do not further rise.
Mortality: Murray and Lopez (1996), using 2020 baseline data. Population: see above LWB/stunting: uses levels 30 years previously (to estimate the childhood conditions of current adults);
i.e. actual 1995 levels are used for 2025, and estimated 1965 levels are used for 1995. Estimated levels for 1965 are approximately levels experience in India currently, and are three times the 1995 level of LBW and approximately twice the 1995 level of stunting.

Table 20: Hospital costs for chronic diseases, China, per 1,000 population
Disease
Category
Prevalencea (1/1,000)
# of in-patient
visits per year (per
1,000 pop.)
# of out-
patient visits during last 2 wks/1,000
Average
cost for one out-patient visit (yuan)
Average days per
admission
Average cost per inpatient admitted (yuan)
Average cost
outpatient visits/yr/1,000
pop. (yuan)
Average cost
inpatient visits/yr/1,000
pop. (yuan)
Average cost
all visits/yr/1,000
pop. (yuan) Cancer Hospital total 1.2 0.8 0.8 326.2 31.3 8,172 6,360.9 6,129.0 12,489.9
City 2.3 1.5 1.4 375.8 38.5 11,894 13,288.3 17,841.0 31,129.3 Rural 0.8 0.5 0.6 281.0 25.4 5,092 4,018.3 2,546.0 6,564.3
Diabetes Hospital total 3.2 0.4 1.1 152.2 25.5 3,950 4,273.8 1,580.0 5,853.8
City 9.8 1.2 3.0 184.3 28.1 4,161 14,519.2 5,034.8 19,554.0 Rural 0.9 0.1 1.4 71.2 16.3 3,213 2,628.7 321.3 2,950.0
Heart disease Hospital total 14.2 2.3 6.6 117.2 21.1 3,626 20,111.5 8,339.8 28,451.3
City 34.5 5.0 11.4 174.5 25.8 5,214 51,767.2 26,070.0 77,837.2 Rural 7.4 1.4 5.0 70.8 15.5 1,754 9,167.2 2,455.6 11,622.8
Hypertension Hospital total 15.8 0.8 5.3 81.3 18.9 2,819 11,097.5 2,114.3 13,211.7
City 39.3 1.8 10.1 121.7 21.3 3,406 31,990.1 6,164.9 38,154.9 Rural 7.9 0.4 3.6 41.7 15.3 1,933 3,914.0 773.2 4,687.2
Stroke Hospital total 5.9 1.7 3.1 145.9 29.9 4,728 11,911.3 8,037.6 19,948.9
City 13.1 4.2 6.7 162.9 33.3 5,377 28,207.8 22,583.4 50,791.2 Rural 3.4 0.9 2.0 123.2 24.6 3,715 6,278.3 3,157.8 9,436.0
All dis. total Hospital total 157.5 35.4 163.9 63.1 16.0 2,384 268,894.3 84,369.8 353,264.1
City 273.3 48.3 161.9 118.6 22.6 4,037 499,234.8 194,946.7 694,181.6 Rural 118.4 31.0 164.6 44.7 12.6 1,532 191,298.1 47,538.0 238,836.1
Note: US$1 = 8.09 yuan (Renminbi). a Prevalence: self-reported prevalence of particular chronic illness.

66
Table 21: Pathways for calculation of dietary effects on chronic disease (PAR’s), 1995 (2025), China
Contribution of To: Size of direct effect in %
Size of indirect effect in % Pathway for indirect effect
Barker effects Stunting Overweight 55.6 (41.9) - - Low birth wt Hypertension 44.8 (10.5) - - Low birth wt Diabetes 33.9 (14.6) - - Effects on CHD Animal fat intake CHD 14.9 (28.3) - - Overweight CHD 12.2 (32.2) - - Hypertension CHD 20.6 (24.5) - - Diabetes CHD 6.5 (10.7) - - Stunting CHD - 6.8 (13.5) via overweight Low birthweight CHD - 9.2 (2.6) via hypertension Low birthweight CHD - 2.2 (0.3) via diabetes Effects on stroke Hypertension Stroke 25.2 (24.5) - - Diabetes Stroke 2.1 (10.7) - - Overweight Stroke - 6.0 (13.1) via hypertension Stunting Stroke - 3.4 (5.5) via overweight, hypertension Low birthweight Stroke - 11.3 (2.6) via hypertension Low birthweight Stroke - 0.7 (1.6) via diabetes Effects on hypertension Overweight Hypertension 24.0 (53.3) - - Low birthweight Hypertension 44.8 (10.5) - - Stunting Hypertension - 13.3 (22.3) via overweight Effects on diabetes Low birthweight Diabetes 33.9 (14.6) - - Overweight Diabetes 22.7 (33.1) - - Stunting Diabetes - 12.6 (22.0) via overweight Effects on cancer Fruit/vegetable intake Cancer 22.7 - -
Source: Authors’ calculations. Notes: relative risk data for cancer may not take fully into account the large fruit and vegetable deficiency
relative to recommended levels observed in China, and hence PAR above is tentative. For comparison, desired/recommended levels of nutrition-related variables are as follows: low birthweight 0 percent; stunting 0 percent; hypertension 0 percent; fruit/vegetable intake = 700 grams per day (Chinese recommended level); saturated fat intake 8-10 percent of dietary calories; overweight 0 percent.
- indicates not applicable.

67
Table 22: Health data for cost calculations, Sri Lanka
Category 1995 2025 Nutrition/diet
Overweight and obesity, men 3.8% 16% Overweight and obesity, women 6.0% 20% Saturated fat % of diet 9.8% 12% Fruit/vegetable intake (grams) 215 215 LBW prevalence (30 years ago) 25% 22% Stunting prevalence (30 years ago) 35% 24% Morbidity
Hypertension, men and women combined 16.2% 18.6% Diabetes 3.7% 10.1% Mortality (per 100,000, men and women combined)
CHD 39.8 58.7 Stroke 26.5 37.6 Other CVD 101.6 137.6 Cancer 28.6 50.6 All causes 562.4 735.5 Other variables
Population size (million) 18.1 25.1 Percentage of population urban 22.7% 42.6% Sources: Population: gopher://gopher.undp.org:70/00/ungophers/popin/wdtrends/urban
Mortality: Registrar General statistics based on death certificates Morbidity: Fourth National Health and Nutrition Survey 1995: Ministry of Plan
Implementation Diet: Central Bank Surveys Obesity: Fourth National Health and Nutrition Survey Stunting: REF NEEDED Low birthwight: UNICEF, State of the World’s Children.
Basis for predictions: Overweight: assumes percentage point increase similar to India’s (discussed in text). Saturated fat: based on current intake, and assuming that increases do not continue much above existing
high rate for urban India. Fruit/vegetable intake: assuming the current decline stabilizes. Hypertension: assumes that rural rate approaches current Indian rural rate, and urban rate approaches
current Indian urban rate, weighted by urban and rural population shares for 2025. Mortality: uses trend increases as for India in Murray and Lopez (1996) (baseline scenario), applied to data
for Sri Lanka for 1990s. For India, increases were 15.8 percent per decade for CHD, 14 percent per decade for cerebrovascular disease, 11.8 percent for other cardiovascular disease, 25 percent per decade for cancer, and 11.35 percent per decade for non-communicable diseases plus injuries. All percent increases are calculated on the base year (1995) rates.
Population: see above LBW/stunting uses levels 30 years previously (to estimate the childhood conditions of current adults);
i.e., actual 1995 levels are used for 2025, and estimated 1965 levels are used for 1995. Estimated levels for 1965 are assumed similar to rates for 1971 that are earliest available data.
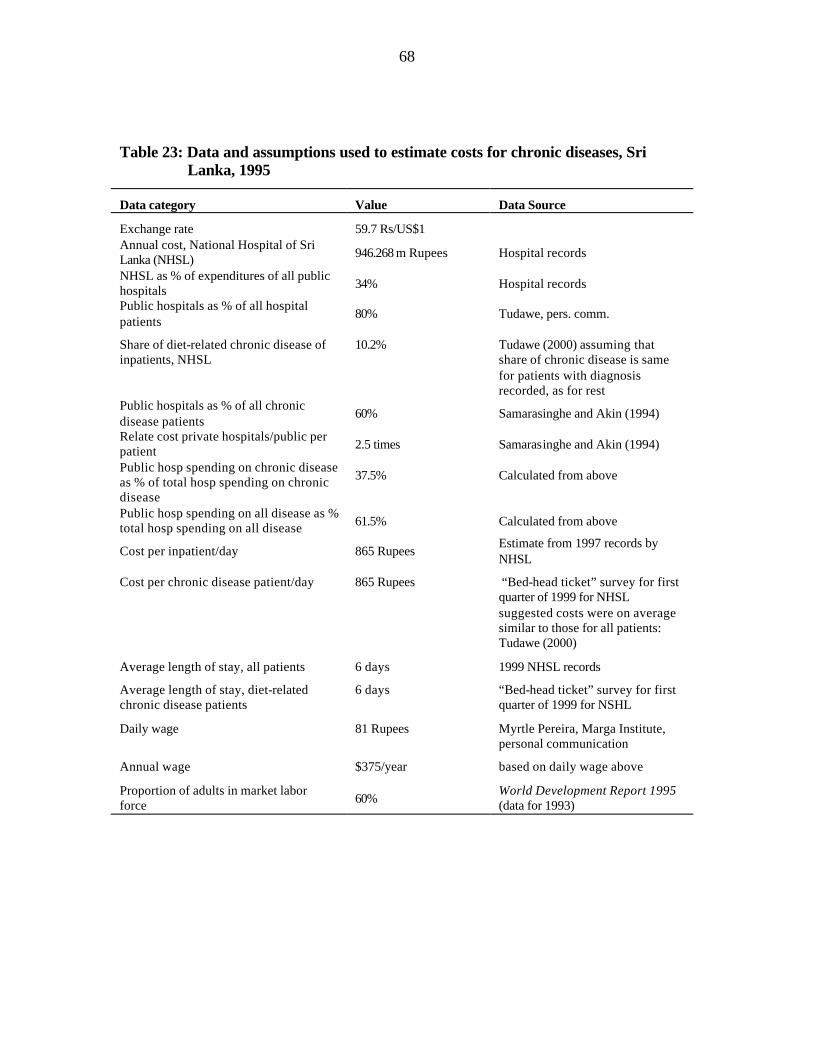
68
Table 23: Data and assumptions used to estimate costs for chronic diseases, Sri Lanka, 1995
Data category
Value
Data Source
Exchange rate
59.7 Rs/US$1
Annual cost, National Hospital of Sri Lanka (NHSL)
946.268 m Rupees
Hospital records
NHSL as % of expenditures of all public hospitals
34%
Hospital records
Public hospitals as % of all hospital patients
80%
Tudawe, pers. comm.
Share of diet-related chronic disease of inpatients, NHSL
10.2%
Tudawe (2000) assuming that share of chronic disease is same for patients with diagnosis recorded, as for rest
Public hospitals as % of all chronic disease patients
60%
Samarasinghe and Akin (1994)
Relate cost private hospitals/public per patient
2.5 times
Samarasinghe and Akin (1994)
Public hosp spending on chronic disease as % of total hosp spending on chronic disease
37.5%
Calculated from above
Public hosp spending on all disease as % total hosp spending on all disease
61.5%
Calculated from above
Cost per inpatient/day
865 Rupees
Estimate from 1997 records by NHSL
Cost per chronic disease patient/day
865 Rupees
“Bed-head ticket” survey for first quarter of 1999 for NHSL suggested costs were on average similar to those for all patients: Tudawe (2000)
Average length of stay, all patients
6 days
1999 NHSL records
Average length of stay, diet-related chronic disease patients
6 days
“Bed-head ticket” survey for first quarter of 1999 for NSHL
Daily wage
81 Rupees
Myrtle Pereira, Marga Institute, personal communication
Annual wage
$375/year
based on daily wage above
Proportion of adults in market labor force
60%
World Development Report 1995 (data for 1993)

69
Table 24: Pathways for calculation of dietary effects on chronic disease (PAR’s), 1995 (2025), Sri Lanka
Contribution of To: Size of direct effect in %
Size of indirect effect in % Pathway for indirect effect
Barker effects
Stunting overweight 55.6 (41.9) - - Low birthweight hypertension 44.8 (10.5) - - Low birthweight diabetes 33.9 (14.6) - - Effects on CHD Animal fat intake CHD 14.9 (28.3) - - Overweight CHD 12.2 (25.9) - - Hypertension CHD 20.6 (24.5) - - Diabetes CHD 6.5 (10.7) - - Stunting CHD - 6.8 (10.8) via overweight Low birthweight CHD - 9.2 (2.6) via hypertension Low birthweight CHD - 2.2 (0.3) via diabetes Effects on stroke Hypertension Stroke 25.2 (24.5) - - Diabetes Stroke 2.1 (10.7) - - Overweight Stroke - 6.0 (11.2) via hypertension Stunting Stroke - 3.4 (4.7) via overweight, hypertension Low birthweight Stroke - 11.3 (2.6) via hypertension Low birthweight Stroke - 0.7 (1.6) via diabetes Effects on hypertension Overweight Hypertension 24.0 (45.6) - - Low birthweight Hypertension 44.8 (10.5) - - Stunting Hypertension - 13.3 (19.1) via overweight Effects on diabetes Low birthweight Diabetes 33.9 (14.6) - - Overweight Diabetes 22.7 (44.8) - - Stunting Diabetes - 12.6 (18.8) via overweight Effects on cancer Fruit/vegetable intake Cancer 22.7 - -
Source: Authors’ calculations. Notes: For comparison, desired/recommended levels of nutrition-related variables are as follows: low birthweight 0% stunting 0% hypertension 0%
Fruit/vegetable intake no Sri Lankan standard: China recommends 700 gm/day; U.S. about 750 gm/day (5 servings)
saturated fat intake 8-10% of dietary calories overweight 0%
- indicates not applicable.

70
FIGURES

71
Figure 1: The prevalence of low birthweight in Asia (last data point in the 1990s)
0
10
20
30
40
50
60
Sin
gap
ore
Ho
ng
Ko
ng
, Ch
ina
Ko
rea, Rep
.
Malaysia
Th
ailand
Ph
ilipp
ines
Fiji
Van
uatu
Kirib
ati
Sa
mo
a
Pap
ua N
ew G
uin
ea
So
lom
on
Isla
nd
s
Co
ok Islan
ds
Tu
valu
Mald
ives
Sri L
anka
Ch
ina
Ind
on
esia
Pakistan
Ind
ia
Ban
glad
esh
Kyrg
yz Rep
ub
lic
Tajikistan
Lao
PD
R
Vie
tna
m
Cam
bo
dia
Ne
pa
l
Afg
han
istan
Bh
uta
n
My
an
ma
r
Per
cen
t HighIncome
MiddleIncome
SmallIslands
UpperLowIncome
LowerLowIncome

72
Figure 2: The prevalence of stunting in Asia (last data point in the 1990s)
2.7
20.824
42.2
54.6
46.9
0
10
20
30
40
50
60
Fiji* China* Bangladesh

73
Figure 3: Trends in per capita food available for consumption, lower low income group of Asian countries
0
5 0
1 0 0
1 5 0
2 0 0
1 9 6 2 1 9 6 7 1 9 7 2 1 9 7 7 1 9 8 2 1 9 8 7 1 9 9 2 1 9 9 6
Per
cap
ita
sup
ply
(kg
/yr,
wei
gh
ted
ave
rag
e)
Cereals/Starch roots Frui ts /Vegetables
0
15
30
45
60
1962 1967 1972 1977 1982 1987 1992 1996
Per
cap
ita
sup
ply
(kg
/yr,
wei
gh
ted
ave
rag
e)
Added sugar Added animal fats
Dai ry /Eggs Fish, seafood
Meat/poultry Added vegetable oi ls
A. High Consumption Foods B. Low Consumption Foods
Note: Values are presented as 3 -year average.

74
Figure 4: Trends in per capita food available for consumption, high income group of Asian countries
0
5 0
1 0 0
1 5 0
2 0 0
2 5 0
3 0 0
1 9 6 2 1 9 6 7 1 9 7 2 1 9 7 7 1 9 8 2 1 9 8 7 1 9 9 2 1 9 9 6
Per
cap
ita
sup
ply
(kg
/yr,
wei
gh
ted
ave
rag
e)
C e r e a l s / S t a r c h r o o t s F r u i t s / V e g e t a b l e s
0
1 0
2 0
3 0
4 0
5 0
1 9 6 2 1 9 6 7 1 9 7 2 1 9 7 7 1 9 8 2 1 9 8 7 1 9 9 2 1 9 9 6
Per
cap
ita
sup
ply
(kg
/yr,
wei
gh
ted
ave
rag
e)
A d d e d s u g a r A d d e d a n i m a l f a t s
D a i r y / E g g s F i s h , s e a f o o d
Mea t / pou l t r y A d d e d v e g e t a b l e o i l s
A. High Consumption Foods B. Low Consumption Foods
Note: Values are presented as 3-year average.

75
Figure 5: Trends in per capita food available for consumption of cereals and starch roots, Asian country groups, by income
0
5 0
1 0 0
1 5 0
2 0 0
2 5 0
3 0 0
3 5 0
4 0 0
1 9 6 2 1 9 6 7 1 9 7 2 1 9 7 7 1 9 8 2 1 9 8 7 1 9 9 2 1 9 9 6
Per
cap
ita
sup
ply
(kg
/yr,
wei
gh
ted
ave
rag
e)
H i g h i n c o m e M i d d l e i n c o m e S m a l l i s l a n d s
U p p e r l o w i n c o m e L o w e r l o w i n c o m e
Note: Values are presented as 3-year average, weighted for countries’ population size within each country grouping.

76
Figure 6: Trends in per capita food available for consumption of diary and egg products, Asian country groups, by income
0
1 0
2 0
3 0
4 0
5 0
6 0
1 9 6 2 1 9 6 7 1 9 7 2 1 9 7 7 1 9 8 2 1 9 8 7 1 9 9 2 1996
Per
cap
ita
sup
ply
(kg
/yr,
wei
gh
ted
ave
rag
e)
H i g h i n c o m e M i d d l e i n c o m e S m a l l i s l a n d s
U p p e r l o w i n c o m e L o w e r l o w i n c o m e
Note: Values are presented as 3 -year average, weighted for countries’ population size within each country grouping.

77
Figure 7: Trends in per capita food available for consumption of fruits and vegetables, Asian country groups, by income
0
50
100
150
200
250
300
1962 1967 1972 1977 1982 1987 1992 1996
Per
cap
ita
sup
ply
(kg
/yr,
wei
gh
ted
ave
rag
e)
High income Middle income Small islandsUpper low income Lower low income
Figure II-7: Trends in per Capita Food Available for Consumption of Fruits and Vegetables, Asian Countries Groups by Income
Note: Values are presented as 3-year average, weighted for countries’ population size within each country grouping .

78
Figure 8: Trends in per capita food available for consumption of added animal fats, Asian country groups, by income
0
0.5
1
1.5
2
2.5
3
3.5
1 9 6 2 1 9 6 7 1 9 7 2 1 9 7 7 1 9 8 2 1 9 8 7 1 9 9 2 1 9 9 6
Per
cap
ita
sup
ply
(kg
/yr,
wei
gh
ted
ave
rag
e)
H i g h i n c o m e M i d d l e i n c o m e S m a l l i s l a n d s
U p p e r l o w i n c o m e L o w e r l o w i n c o m e
Note: Values are presented as 3-year average, weighted for countries’ population size within each country grouping.

79
Figure 9: Trends in per capita food available for consumption of added vegetable oils, Asian country groups, by income
0
2
4
6
8
1 0
1 2
1 9 6 2 1 9 6 7 1 9 7 2 1 9 7 7 1 9 8 2 1 9 8 7 1 9 9 2 1 9 9 6
Per
cap
ita
sup
ply
(kg
/yr,
wei
gh
ted
ave
rag
e)
H i g h i n c o m e M i d d l e i n c o m e S m a l l i s l a n d s
U p p e r l o w i n c o m e L o w e r l o w i n c o m e
Note: Values are presented as 3-year average, weighted for countries’ population size within each country grouping.

80
Figure 10: Trends in per capita food available for consumption of added sugar, Asian country groups, by income
0
5
1 0
1 5
2 0
2 5
3 0
3 5
4 0
1 9 6 2 1 9 6 7 1 9 7 2 1 9 7 7 1 9 8 2 1 9 8 7 1 9 9 2 1 9 9 6
Per
cap
ita
sup
ply
(kg
/yr,
wei
gh
ted
ave
rag
e)
H i g h i n c o m e M i d d l e i n c o m e S m a l l i s l a n d s
U p p e r l o w i n c o m e L o w e r l o w i n c o m e
Note: Values are presented as 3-year average, weighted for countries’ population size within each country grouping.

81
Figure 11: Trends in total energy available for consumption and the sources of energy, high income countries of Asia
0
5 0 0
1 0 0 0
1 5 0 0
2 0 0 0
2 5 0 0
3 0 0 0
3 5 0 0
1 9 6 2 1 9 6 7 1 9 7 2 1 9 7 7 1 9 8 2 1 9 8 7 1 9 9 2 1 9 9 6
En
erg
y in
take
(kca
l)
Energy from carbohydrates excluding added sugar
Energy from added vegetable oil
Energy from added animal fatEnergy from protein
Energy from alcoholTotal energy intake
Energy from added sugar
Note: Values are presented as 3-year average.

82
Figure 12: Trends in total energy available for consumption and the sources of energy, middle income countries of Asia
0
5 0 0
1 0 0 0
1 5 0 0
2 0 0 0
2 5 0 0
3 0 0 0
3 5 0 0
1 9 6 2 1 9 6 7 1972 1977 1 9 8 2 1 9 8 7 1 9 9 2 1 9 9 6
En
erg
y i
nta
ke
(k
ca
l)
Energy from added sugarEnergy from added vegetable oil
Energy from added animal fat
Energy from protein
Energy from alcohol
Total energy intake
Energy from added sugar
Energy from carbohydrates excluding added sugar
Note: Values are presented as 3-year average.

83
Figure 13: Trends in total energy available for consumption and the sources of energy, small island countries of Asia
0
5 0 0
1 0 0 0
1 5 0 0
2 0 0 0
2 5 0 0
3 0 0 0
3 5 0 0
1 9 6 2 1 9 6 7 1 9 7 2 1 9 7 7 1 9 8 2 1 9 8 7 1 9 9 2 1 9 9 6
En
erg
y in
take
(kc
al)
Energy from added vegetable oil
Energy from added animal fat
Energy from protein
Energy from alcoholTotal energy intake
Energy from added sugar
Energy from carbohydrates excluding added sugar
Note: Values are presented as 3-year average.

84
Figure 14: Trends in total energy available for consumption and the sources of energy, upper low-income countries of Asia
0
5 0 0
1 0 0 0
1 5 0 0
2 0 0 0
2 5 0 0
3 0 0 0
3 5 0 0
1 9 6 2 1 9 6 7 1972 1977 1 9 8 2 1 9 8 7 1 9 9 2 1 9 9 6
En
erg
y in
take
(kca
l)
Energy from added sugar
Energy from added vegetable oil
Energy from added animal fat
Energy from protein
Energy from alcoholTotal energy intake
Energy from carbohydrates excluding added sugar
Note: Values are presented as 3-year average.

85
Figure 15: Trends in total energy available for consumption and the sources of energy, lower low income countries of Asia
0
5 0 0
1 0 0 0
1 5 0 0
2 0 0 0
2 5 0 0
3 0 0 0
3 5 0 0
1 9 6 2 1 9 6 7 1 9 7 2 1 9 7 7 1 9 8 2 1 9 8 7 1 9 9 2 1 9 9 6
En
erg
y in
take
(kca
l)
Energy from added vegetable oil
Energy from added animal fat
Energy from protein
Energy from alcoholTotal energy intake
Energy from added sugar
Energy from carbohydrates excluding added sugar
Note: Values are presented as 3-year average.

86
Figure 16: The proportion of adult males engaged in agriculture occupations
0
2 0
4 0
6 0
8 0
1 0 0
1 9 6 0 1 9 7 0 1 9 8 0 1 9 9 0
Pe
rce
nta
ge
H i g h I n c o m e M i d d l e I n c o m e S m a l l I s l a n d sU p p e r L o w I n c o m e L o w e r L o w I n c o m e
Note: Values are presented as weighted average based on countries’ population size within each country grouping.

87
Figure 17: The proportion of adult females engaged in agriculture occupations
0
2 0
4 0
6 0
8 0
1 0 0
1 9 6 0 1 9 7 0 1 9 8 0 1 9 9 0
Per
cen
tag
e
H i g h I n c o m e M i d d l e I n c o m e S m a l l I s l a n d s
U p p e r L o w I n c o m e L o w e r L o w I n c o m e
Note: Values are presented as weighted average based on countries’ population size within each country grouping.

88
Figure 18: Ownership of televisions in Asia
0
5 0
1 0 0
1 5 0
2 0 0
2 5 0
3 0 0
3 5 0
1 9 6 5 1 9 7 0 1 9 7 5 1 9 8 0 1 9 8 5 1 9 9 0 1 9 9 5
Nu
mb
er o
f T
elev
isio
n s
ets/
1000
peo
ple
H i g h I n c o m e M i d d l e I n c o m e S m a l l I s l a n d s
U p p e r L o w I n c o m e L o w e r L o w I n c o m e
Note: Values are presented as weighted average based on countries’ population size within each country grouping.

89
Figure 19: Trends in the proportion of persons residing in urban areas in Asia
0
2 0
4 0
6 0
8 0
1 0 0
1 9 6 1 1 9 6 5 1 9 7 0 1 9 7 5 1 9 8 0 1 9 8 5 1 9 9 0 1 9 9 5
Per
cen
tag
e
H i g h I n c o m e M i d d l e I n c o m e S m a l l I s l a n d s
U p p e r L o w I n c o m e L o w e r L o w I n c o m e
Note: Values are presented as 3-year average, weighted for countries’ population size within each country grouping.

90
Figure 20: Mortality trends in China and India, 1990 and 2020
1 1 7 1 0 61 8 6
9 73 3
4 7 1
1 8 8
2 0 9
1 0 7
2 4 45
52 2 6
3 0 9
2 6 7
3 8 9
1 2 2
2 5 2
1 1 7
1 2 9
5 9
1 0 6
1 2
9
0
2 0 0
4 0 0
6 0 0
8 0 0
1 0 0 0
1 2 0 0
1 9 9 0 2 0 2 0 1 9 9 0 2 0 2 0
Dea
th r
ates
per
100
,000
C V D
D i a b e t e s
Ma l i gnan t neop lasms
O t h e r n o n - c o m m u n i c a b l e d i s e a s e s
I n f e c t i o n s a n d p a r a s i t i c d i s e a s e s
A l l o the rs ( i n ju r ies , ma te rna l cond i t i ons & pe r ina ta l cond i t i ons )
Source: Murray and Lopez. 1996. Global Burden Disease (Harvard Univ. Pr)
China India

91
Figure 21: The prevalence of obesity in Asian countries, by gender
0
20
40
60
80
100
M a l e F e m . M a l e F e m . M a l e F e m . M a l e F e m . M a l e F e m . M a l e F e m . M a l e F e m . M a l e F e m . M a l e F e m .
Per
cen
t
B M I > = 3 0
BMI 25-29.9
Malaysia 1990
Philippines 1993
Nauru1994
China1992
Indonesia1993
Kyrgyz Republic1993
Vietnam1993
Source: Popkin and Doak, Nutr Rev,(1998) 56:106-14
Sri Lanka1995
South Korea1995

92
Figure 22: The prevalence of obesity in urban and rural areas in Asian countries
0
2 0
4 0
6 0
8 0
1 0 0
Urban Rural Urban Rural Urban Rural Urban Rural Urban Rural
Per
cen
t
B M I > = 3 0
B M I 2 5 - 2 9 . 9
Thailand1985
China1993
Kyrgyz Republic1993
Vietnam1992-3
Indonesia
Source: Popkin and Doak, NutrRev,(1998) 56:106-14

93
Figure 23: The prevalence of obesity in China, Indonesia, Kyrgyz Republic, and Viet Nam, by income tertile
1.26 1.71 1 . 9 63.43
6 . 8 2
11 .1610.52 10.50
15 .04
6 . 4 1
11.62
19 .28
24.84
25 .70
2 . 0 8
00.071.45
7.46
0 . 0 70 . 9 2
0.72 0 . 7 2
27.17
0
1 0
2 0
3 0
4 0
L o w M i d d l e H i g h L o w M i d d l e H i g h L o w M i d d l e H i g h L o w M i d d l e H i g h
Pe
rce
nt
China Indonesia Kyrgyz
25<BMI>30
BMI>30
Vietnam

94
Figure 24: The proportion of all households with both underweight and overweight members in the same household in China, Indonesia, the Kyrgyz Republic, and Viet Nam
8.1
9.8
14.7
3.1
0
5
1 0
1 5
2 0
C h i n a I n d o n e s i a K y r g y z R e p u b l i c V i e t n a m
Pe
rce
nt
Source: China Health and Nutrition Survey, 1993; Indonesian Family Life Survey, 1993;Kyrgyzstan Multipurpose Survey 1993; Vietnam Living Standards Survey, 1992-3.

95
Figure 25: Important pathways for diet-related chronic disease
Fruit/veg as% Diet
Saturated fatas % Diet
Overweight/obesity
Hypertension
CHD
Stunting
Low BirthWeight
Diabetes
Stroke
Cancer
effect modeled effect not modeled

96
Figure 26: Relative risks for coronary heart disease
Saturated Fatas % Diet
Overweight/obesity
Hypertension
Diabetes
CHD
Stunting
Low BirthWeight
f
gX1.25
X1.3h
X5i
a
X3b
X2c
X1.3d
X1.9e
effect modeled effect not modeled
References: a We assume that all low weight babies become stunted and in addition some normal birthweight babies
become stunted. Data on overlap between stunting and LBW are limited. b See text discussion in section III.A. c See text discussion in section III.A. d Leon and Kupilova (in press) cite Curhan et al. (1996) that RR of hypertension for birthweight <5 lbs;
birthweight > 10 lbs is 1.6: RR of hypertension for birthweight < 5 lbs: birthweight > lbs is assumed to be 1.3, using linear interpolation; controls for current BMI.
e Barker (1998), using Health Professional Study of USA for men, controls for current BMI. f Labarthe (1998) cites Keys (1980); data are cross-country regression averages for men, for ten-year
incidence of CHD that increases by 78 per 100,000 per 1 percent increase in saturated fat as percent of diet calories.
g Kannell et al. (1996), using Framingham study for 12-year age-adjusted CHD rates. RR here is averaged across three tertiles of subscapular skinfold thickness.
h Labarthe (1998), citing Collins and Peto (1994) for effects on CHD from treatment trials of hypertension associated with long-term decline of diastolic blood pressure of 5-6 mm Hg.
i Labarthe (1998) cites Will and Casper (1996) for death rates for ischemic heart disease averaged across men and women.
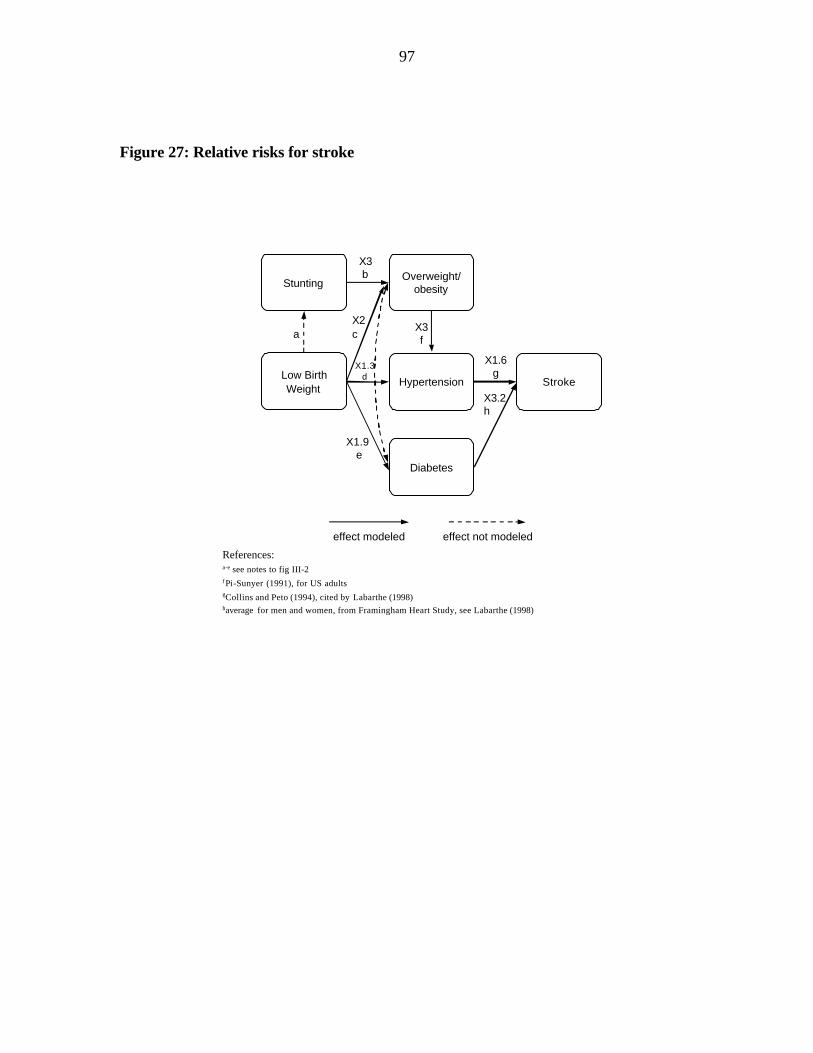
97
Figure 27: Relative risks for stroke
Overweight/obesity
Hypertension
Diabetes
Stroke
Stunting
Low BirthWeight
X1.6g
X3.2h
a
X3b
X2c
X1.3d
X1.9 e
X3f
References:a-e see notes to fig III-2f Pi-Sunyer (1991), for US adultsgCollins and Peto (1994), cited by Labarthe (1998)haverage for men and women, from Framingham Heart Study, see Labarthe (1998)
effect modeled effect not modeled

98
Figure 28: Relative risks for diabetes
Overweight/obesity
DiabetesStunting
Low BirthWeight
X2.9d
a
X3b
X2c
X1.9e
Referencesa,b,c,eas Figure III-2d RR for BMI>25/BMI<25 estimated from Pi-Sunyer (1991), using NHANES II
effect modeled effect not modeled

99
Figure 29: Main pathways for diet effects, 1995, China
22.7%
20.6%
22.7%
25.2%
Overweight/obesity
Hypertension
Saturated fatas % Diet CHD
Stunting
Low BirthWeight
Diabetes
Stroke
Fruit/veg as% Diet
Cancer
24.0%
Note: Percentages next to boxes indicate the estimated minimum contribution of key diet factor to each condition.

100
Figure 30: Main pathways for diet effects, 2025, China
Overweight/obesity
Hypertension
Saturated fatas % Diet CHD
Stunting
Low BirthWeight
Diabetes
Stroke
Fruit/veg as% Diet
Cancer 22.7%
32.3%
33.1%
24.5%
53.3%
Note: Percentages next to boxes indicate the estimated minimum contribution of key diet factor to each condition.

101
Figure 31: Causal web of societal influences on obesity prevalence
Globalizationof
Markets
ManufacturedImported
Food
Health CareSystem
Agriculture/Gardens/
Local Markets
TransportPolicy
LeisureActivity/Facilities
SchoolActivity
WorksiteFood
SchoolFood
OBESITY
PREVALENCE
EducationPolicy
PublicTransport
WorksiteExercise
Labor
HealthPolicy
FoodPolicy
Urbanization
Infections
FoodIntake:NutrientDensity
EnergyExpenditure
PublicSafety
Development
INTERNATIONALFACTORS
NATIONALSTATE
COMMUNITIES WORK/SCHOOL/
HOME
INDIVIDUAL
Source: Int’l Obesity Task Force (C. Ritenbaugh Kumanyika, Moriabia,Jeffrey, Antipatis)
Sanitation
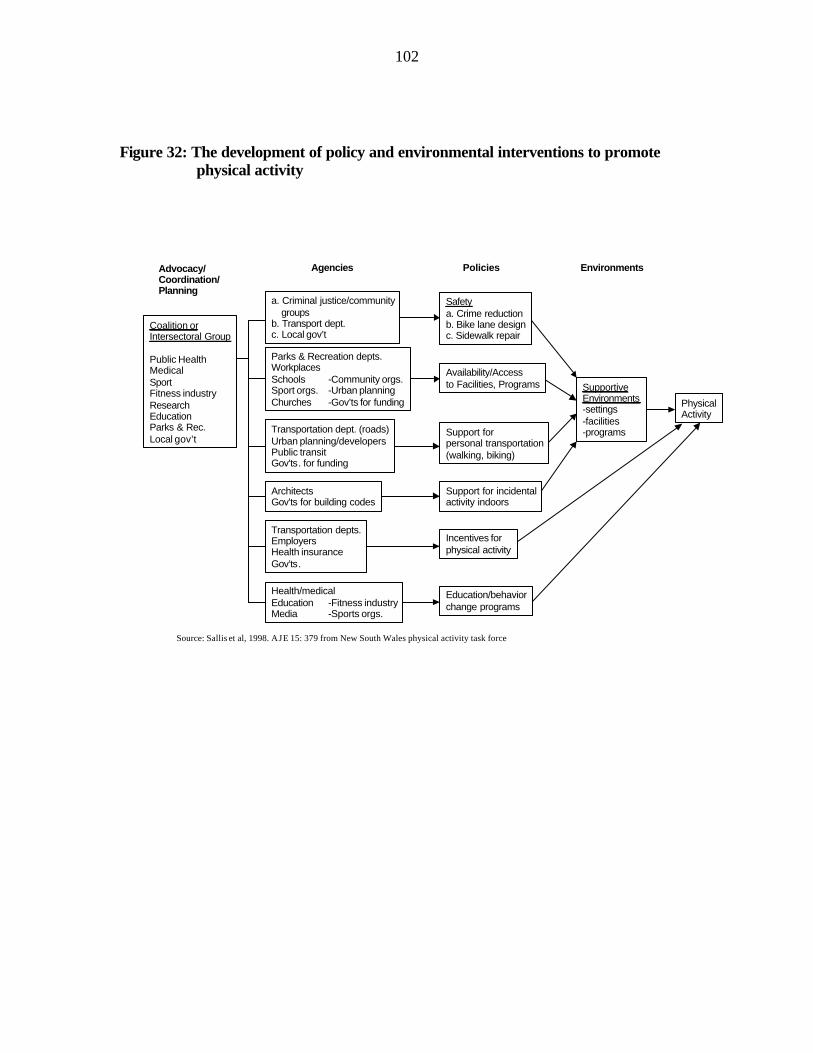
102
Figure 32: The development of policy and environmental interventions to promote physical activity
Education/behaviorchange programs
PhysicalActivity
Coalition orIntersectoral Group
Public HealthMedicalSportFitness industryResearchEducationParks & Rec.Local gov’t
a. Criminal justice/communitygroups
b. Transport dept.c. Local gov’t
Parks & Recreation depts.WorkplacesSchools -Community orgs.Sport orgs. -Urban planningChurches -Gov’ts for funding
Transportation dept. (roads)Urban planning/developersPublic transitGov’ts. for funding
ArchitectsGov’ts for building codes
Transportation depts.EmployersHealth insuranceGov’ts.
Health/medicalEducation -Fitness industryMedia -Sports orgs.
Safetya. Crime reductionb. Bike lane designc. Sidewalk repair
Availability/Accessto Facilities, Programs
Support forpersonal transportation(walking, biking)
Support for incidentalactivity indoors
SupportiveEnvironments-settings-facilities-programs
Incentives forphysical activity
Advocacy/Coordination/Planning
Agencies Policies Environments
Source: Sallis et al, 1998. AJE 15: 379 from New South Wales physical activity task force

103
REFERENCES
ACC/SCN/IFPRI (United Nations Administrative Committee on Coordination Sub-Committee on Nutrition/International Food Policy Research Institute). 2000. Fourth Report on the World Nutrition Situation. Geneva.
Adair, L. S. 1999. Filipino children exhibit catch-up growth from age 2 to 12 years. Journal of Nutrition 129 (6): 1140–1148.
Adair, L. S. 2000. Fetal programming of age at menarche? University of North Carolina at Chapel Hill, N.C: Unpublished manuscript.
Adair, L. S., and D. K. Guilkey. 1997. Age-specific determinants of stunting in Filipino children. Journal of Nutrition 127 (2): 314–320.
Adair, L. S., and B. M. Popkin. 1988. Birthweight, maturity, and proportionality in Filipino infants. Human Biology 60 (2): 319–339.
Alderman, H. 1986. The effect of food price and income changes on the acquisition of food by low-income households. International Food Policy Research Institute, Washington, D.C.
Allen, L. and S. Gillespie. 2000. Effectiveness of large-scale nutrition interventions. International Food Policy Research Institute, Washington, DC. Unpublished.
Arriaga, E. 1998. Causes of death in developing countries and in countries with economies in transition: An overview of current knowledge, data availability and novel methods of data collection. In Symposium on health and mortality. ESA/P/WP.139 New York: Population Division, United Nations.
Babu, S. C., L. Haddad, and M. Ruel. 2000. Food policy and nutrition security. International Food Policy Research Institute, Washington, DC.
Barker, D. J .P. 1992. Fetal and infant origins of adult disease: Papers. London: British Medical Journal Publishing.
Barker, D. J. P. 1994. Mothers, babies and disease in later life. London: British Medical Journal Publishing.
Barker, D. J. P. 1997. Mothers, babies and health in later life. 2nd edition. London: British Medical Journal Publishing.
104
Barker, D. 2001. The nutrition transition and its implications for the fetal origins hypothesis. In Fetal origins of cardiovascular and lung disease, ed. D. Barker. New York: Marcel Dekker, Inc.
Bell, C., G. Keyou, and B. Popkin. 2000. Adult weight change dynamics in China: 1989 to 1997. Chapel Hill, NC: University of North Carolina-Chapel Hill, Carolina Population Center.
Behrman, J. 1995. Household behavior and micronutrients: What we know and what we don’t know. Agricultural Strategies For Micronutrients Working Paper 2. Washington, DC: International Food Policy Research Institute.
Bouis, H. E. 1991. The determinants of household-level demand for micronutrients: An analysis for Philippine farm households. International Food Policy Research Institute, Washington, DC.
Bouis, H. E., and M. J. G. Novenario-Reese. 1998. The determinants of demand for micronutrients: An analysis of rural households in Bangladesh. Food Consumption and Nutrition Division Discussion Paper 40. International Food Policy Research Institute, Washington, DC.
Bray, G. A., and B. M. Popkin. 1998. Dietary fat intake does affect obesity! American Journal of Clinical Nutrition 68 (6):1157–1173.
Cannon, G. 1992. Food and health: The experts agree. London: Consumers’ Association.
CDC (Centers for Disease Control and Prevention). 1999. An ounce of prevention…what are the returns? Atlanta, Ga., U.S.A.: Centers for Disease Control Second Edition.
Cebu Study Team. 1991. Underlying and proximate determinants of child health: The Cebu Longitudinal Health and Nutrition Study. American Journal of Epidemiology 133 (2): 185-201.
Collins, R., and R. Peto. 1994. Antihypertensive drug therapy: Effects on stroke and coronary heart disease. In Textbook of hypertension, ed. J. D. Swales. Oxford: Blackwell Scientific Publications.
Committee on Diet and Health, Food and Nutrition Board, Commission on Life Sciences and National Research Council. 1989. Diet and health: Implications for reducing chronic disease risk. Washington, DC: National Academy Press.

105
Committee on Research. Development and Institutional Strengthening for Control of Cardiovascular Diseases in Developing Countries. 1998. Control of cardiovascular diseases in developing countries. Washington, DC: National Academy Press.
Curhan, G. C., G. M.Chertow, W. C. Willett, D. Speigelman, G. A. Colditz, J. E. Manson, et al. 1996. Birthweight and adult hypertension and obesity in women. Circulation 94: 1310–1315.
Dalton, A., and S. Crowley. 2000. The economics of non-communicable diseases in the Pacific Islands. World Bank, Washington, DC. Unpublished.
Delgado, C., M. Rosegrant, H. Steinfeld, S. Ehui, and C. Courbois. 1999. Livestock to 2020: The next food revolution. 2020 Vision Food, Agriculture, and the Environment Discussion Paper 28. Washington, DC: International Food Policy Research Institute.
Doak, C., L. S. Adair, C. Monteiro, and B. M. Popkin. 1999. Overweight and underweight co-exist in Brazil, China, and Russia. University of North Carolina, Carolina Population Center, Chapel Hill, N.C. Draft.
Dowse, G. K., H. Gareeboo, K. G. Alberti, P. Zimmet, J. Tuomilehto, et al. 1995. Changes in population cholesterol concentrations and other cardiovascular risk factor levels after five years of the noncommunicable disease intervention programme in Mauritius. British Medical Journal 311: 1255–1259.
Drewnowski, A., and B. M. Popkin. 1997. The nutrition transition: New trends in the global diet. Nutrition Reviews 55: 31–43.
Deurenberg, P., M. Yap, and W. A. Staveren. 1998. Body mass index and percent body fat: A meta-analysis among different ethnic groups. International Journal of Obesity 22: 1164–1171.
Eastern Stroke and Coronary Heart Disease Collaborative Research Group. 1998. Blood pressure, cholesterol, and stroke in eastern Asia. The Lancet 352: 1801–1807.
Egger, G., and B. A. Swinburn. 1997. An ecological approach to the obesity pandemic. British Medical Journal 315: 477–480.
FAO/WHO (Food and Agriculture Organization of the United Nations/World Health Organization). 1996. Preparation and use of food-based dietary guidelines. (WHO/NUT/96.6). Geneva: World Health Organization Nutrition Programme

106
Forrester, T. E., R. J. Wilks, F. I. Bennett, et al. 1996. Fetal growth and cardiovascular risk factors in Jamaican schoolchildren. British Medical Journal (Clinical Research Ed.) 312: 156–160.
Gardner, G., and B. Halweil. 2000. Nourishing the underfed and overfed. In State of the World 2000, ed. L. R. Brown. Washington, DC: The Worldwatch Institute.
Geissler, C. 1999. China: The soyabean-pork dilemma. Proceedings of the Nutrition Society 58: 345–353.
Godfrey, K. M., and D. J. P. Barker. 1995. Maternal nutrition in relation to fetal and placental growth. European Journal of Obstetrics and Gynecology 61: 15–22.
Gordon-Larsen, P., R.G. McMurray, B.M. Popkin. 2001. Environmental and sociodemographic determinants of adolescent physical activity and inactivity: The National Longitudinal Study of Adolescent Health Pediatrics. In press.
Guilkey, D. K., B. M. Popkin, J. S. Akin, and E. L. Wong. 1989. Prenatal care and pregnancy outcome in Cebu, Philippines. Journal of Development Economics 30 (2): 241-272.
Guo, X., B. M. Popkin, and F. Zhai. 1999. Patterns of change in food consumption and dietary fat intake in Chinese adults, 1989–1993. Food and Nutrition Bulletin 20 (3): 344–353.
Guo, X., T. A. Mroz, B. M. Popkin, and F. Zhai. 2000. Structural change in the impact of income on food consumption in China, 1989–93. Economic Development and Cultural Change 48 (4): 737–760.
Guo, X., B. M. Popkin, T. A. Mroz, and F. Zhai. 1999. Food price policy can favorably alter macronutrient intake in China. Journal of Nutrition 129 (5): 994–1001.
Gwatkin, D. R. 2000. Health inequalities and the health of the poor: What do we know? What can we do? Bulletin of the World Health Organization 78 (1): 3–17.
Gwatkin, D. R., and M. Guillot. 2000. The burden of disease among the global poor. Washington, DC: World Bank Human Development Network.
Horton, S. 2001. Opportunities for investments in nutrition in low-income Asia. Asian Development Review. In press.
IOTF/WHO (International Obesity Task Force/World Health Organization). 2000. The Asian-Pacific perspective: Redefining obesity and its treatment. Caulfield, Victoria, Canada: International Diabetes Institute.

107
Jha, P. 1999. Curbing the epidemic: Governments and the economics of tobacco control. Washington, DC: World Bank.
Kannel, W. B., R. B. d’Agostino, and J. L. Cobb. 1996. Effect of weight on cardiovascular disease. American Journal of Clinical Nutrition 63 (supplement): 419S-422S.
Keys, A. 1980. Seven countries. Cambridge, Mass., U.S.A.: Harvard University Press.
Kim, S., S. Moon, and B. M. Popkin. 2000. The nutrition transition in South Korea. American Journal of Clinical Nutrition 71 (1): 44–53.
Krauss, R. M., M. Winston, B. J. Fletcher, and S. M. Grundy.1998. Obesity: Impact on cardiovascular disease. Circulation 98: 1472–1476.
Kuzawa, C., and L. S. Adair. 2000. The CLHNS cardiovascular risk study: Modeling lifelong influences on blood pressure in Filipino adolescents. The FASEB Journal 14: A791.
Labarthe, D. R. 1998. Epidemiology and prevention of cardiovascular diseases: A global challenge. Gaithersburg, Md., U.S.A.: Aspen.
Leon, D. A., and I. Koupilova. 2001. Birthweight, blood pressure and hypertension: Epidemiological studies. In Fetal origins of cardiovascular and lung disease, ed. D. Barker. New York: Marcel Dekker. In press.
Lucas, A., M. S. Fewtrell, and T. J. Cole. 1999. Fetal origins of adult disease—The hypothesis revisited. British Medical Journal 319: 245–249.
Matsudo, V. K. R. 1997. Passport for health. World Health 50th year, No. 3, 16–17.
Monteiro C. A., M. H. D. A. Benicio, W. L. Conde, and B. M. Popkin. 2000. Shifting obesity trends in Brazil. European Journal of Clinical Nutrition 54 (4): 342–346.
Morgan, N. 1993. World vegetable oil consumption expands and diversifies. Food Review 16: 26–30.
Murray, C. J. L., and A. D. Lopez. 1996. The global burden of disease. Cambridge, Mass., U.S.A.: Harvard University Press.
Nader, P. R., E. J. Stone, L. A. Lytle, C. L. Perry, S. K. Osganian, et al. 1999. Three-year maintenance of improved diet and physical activity: The CATCH cohort. Child and Adolescent Trial for Cardiovascular Health. Archives of Pediatrics & Adolescent Medicine 153: 695–704.

108
Omran, A. R. 1971. The epidemiologic transition: A theory of the epidemiology of population change. Milbank Memorial Fund Quarterly 49 (4, pt. 1): 509–538.
Paeratakul, S., B. M. Popkin, K. Ge, L. S. Adair, and J. Stevens. 1998. Changes in diet and physical activity affect the body mass index of Chinese Adults. International Journal of Obesity 22: 424–432.
Pitt, M., and M. R. Rosenzweig. 1986. Agricultural prices, food consumption and the health and productivity of Indonesian farmers. In Agricultural household models: Extensions, applications and policy, ed. I. Singh, L. Squire, and J. Strauss, 153-182. Baltimore, Md., U.S.A.: Johns Hopkins University Press.
Popkin, B. M. 1994. The nutrition transition in low-income countries: An emerging crisis. Nutrition Reviews 52 (9): 285–298.
Popkin, B. M. 1998. The nutrition transition and its health implications in lower income countries. Public Health Nutrition 1: 5–21.
Popkin, B. M. 1999. Urbanization, lifestyle changes, and the nutrition transition. World Development 27: 1905-1916.
Popkin, B. M., and C. Doak. 1998. The obesity epidemic is a worldwide phenomenon. Nutrition Reviews 56: 106–114.
Popkin, B. M., M. K Richards, and C. Monteiro. 1996. Stunting is associated with overweight in children of four nations that are undergoing the nutrition transition. Journal of Nutrition 126: 3009–3016.
Popkin, B. M., K. Ge, et al. 1993. The nutrition transition in China: A cross-sectional analysis. European Journal of Clinical Nutrition 47: 333.
Popkin, B. M., L. Kohlmeier, N. Zohoori, A. Baturin, A. Martinchik, and A. Deev. 1997. Nutritional risk factors in the former Soviet Union. In Premature death in the new independent states, ed. J. L. Bobadilla, C. Costello, and F. Mitchell, 314-334. Committee on Population, Commission on Behavioral and Social Sciences and Education, National Research Council. Washington, DC: Academy Press.
Reddy, K. S., and S. Yusuf. 1998. The emerging epidemic of cardiovascular disease in developing countries. Circulation 97: 596–601.
Rural Living Science Institute, Rural Development Administration (South Korea). 1999. ’99 education training plan. Suwon, South Korea.

109
Sachdev, H. P. S. 1997a. Low birthweight in South Asia.. In Malnutrition in South Asia: A regional profile, ed. S. R. Gillespie, 23–50. ROSA Publication No. 5. Kathmandu, Nepal: UNICEF Regional Office for South Asia.
Sachdev, H. P. S. 1997b. Nutritional status of children and women in India: recent trends. Bulletin of the Nutrition Foundation of India 18 (3).
Sallis, J. F., A. Bauman, and M. Pratt. 1998. Environmental and policy interventions to promote physical activity. American Journal of Preventive Medicine 15: 379–397.
Samarasinghe, D., and J. S. Akin. 1994. Health strategy and financing study. Prepared for Government of Sri Lanka, Ministry of Health and Women’s Affairs.
Sawaya, A. L., G. Dallal, G. Solymos, et al. 1995. Obesity and malnutrition in a shantytown population in the city of Sao Paulo, Brazil. Obesity Research 3: 107s-115s.
Schroeder, D. G., R. Martorell, and R. Flores. 1999. Infant and child growth and fatness and fat distribution in Guatemalan adults. American Journal of Epidemiology 149: 177–185.
Shetty, P. S., and W. P. T. James. 1994. BMI distribution in developed and developing countries. Chapter 7. In Body mass index: A measure of chronic energy deficiency in adults. FAO Food and Nutrition Papers No. 56. Rome: Food and Agriculture Organization of the United Nations.
Sichieri, R., K. Siqueira, and A. Moura. 2001. Obesity and abdominal fatness associated with undernutrition early in life in a survey in Rio de Janeiro. International Journal of Obesity. In press.
State Council. 1993. An outline for reforming and developing China’s food structure in the 1990s. China Food Daily (June 16).
Stein, C. E., C. H. D. Fall, K. Kumaran, C. Osmond, V. Cox, and D. J. P. Barker. 1996. Fetal growth and coronary heart disease in South India. The Lances 348 (9037): 1269–1273.
Stookey, J. D., Y. Wang, K. Ge, H. Lin, and B. M. Popkin. 2000. Measuring diet quality in China: The INFH-UNC-CH diet quality index.
Subar, A, J. Heimendinger, B. Patterson, S. Krebs-Smith, E. Pivonka, and R. Kessler. 1995. Fruit and vegetable intake in the United States: The baseline survey of the Five A Day for Better Health program. American Journal of Health Promotion.

110
Swinburn, B., G Egger, and F. Raza. 1999. Dissecting obesogenic environments: The development and application of a framework for identifying and prioritizing environmental interventions for obesity. Preventive Medicine 29 (6 Pt 1): 563-570.
Tian, H. 1999. Chronic disease intervention project cost-effectiveness evaluation from 1991-96 in Tianjin city. In Chinese. Tianjin Municipal-Academic Station, September 1999. Unpublished.
Trowell, H., and D. Burkitt. 1985. Western diseases: Their causes and prevention. London: Edward Arnold.
Tudawe, I. 2000. Country report for RETA 5824. Colombo, Sri Lanka. Draft.
Uauy, R., C. Albala, and J. Kain. 2001. Obesity trends in Latin America: Transiting from under- to overweight. Journal of Nutrition 131: 893S-899S.
United Nations. 1995. World urbanization prospects: The 1994 revision: estimates and projections of urban and rural populations and of urban agglomerations. New York: Population Division, Department for Economic and Social Information and Policy Analysis, United Nations.
USDA (United States Department of Agriculture). 1966. U.S. fats and oils statistics, 1909–65. Statistical Bulletin No. 376, ERS. Washington, DC.
USDHHS (United States Department of Health and Human Services). 1996. Physical activity and health: A Report of the surgeon general. Atlanta, Ga., U.S.A.: Centers for Disease Control and Prevention, National Center for Chronic Disease Prevention and Health Promotion.
Uusitalo, U., E. J. Feskens, J. Tuomilehto, G. Dowse, U. Haw, et al. 1996. Fall in total cholesterol concentration over five years in association with changes in fatty acid composition of cooking oil in Mauritius: Cross sectional survey. British Medical Journal 313: 1044–1046.
Waterland, R.A., and C. Garza. 1999. Potential mechanisms of metabolic imprinting that lead to chronic disease. American Journal of Clinical Nutrition 69: 179–197.
WCRF (World Cancer Research Fund) in association with American Institute for Cancer Research. 1997. Food, nutrition and the prevention of cancer: A global perspective. Washington, DC: American Institute for Cancer Research.

111
WHO (World Health Organization). 1990. Diet, nutrition, and the prevention of chronic diseases: Report of a WHO Study Group. WHO Technical Report. Series 797. Geneva.
Will, J. C., and M. Casper. 1996. Death rates for ischemic heart disease among persons aged 45-64 years, by gender, diabetic status, and race, United States, 1986. American Journal of Public Health 86: 577.
Williams, G. W. 1984. Development and future direction of the world soybean market. Quarterly Journal of International Agriculture 23 (4): 319–337.
Wolf, A. M., and G. A. Colditz. 1998. Current estimates of the economic cost of obesity in the United States. Obesity Research 6: 97–106.
World Bank. 1995. World development report 1995. Washington, DC.
Yajnik, C. S., C. H. Fal, U. Vaidya, A. N. Pandit, A. Bavdekar, et al. 1995. Fetal growth and glucose and insulin metabolism in four-year-old Indian children. Diabetic Medicine 12 (4): 330–336.
Zimmet, P. Z. 1992. Challenges in diabetes epidemiology—From west to the rest. Kelly West Lecture 1991. Diabetes Care 15: 232-252.
Zimmet, P. Z., D. J. McCarty, and M. P. de Courten. 1997. The global epidemiology of non-insulin-dependent diabetes mellitus and the metabolic syndrome. Journal of Diabetes and its Complications 11 (2): 60–68.

FCND DISCUSSION PAPERS
01 Agricultural Technology and Food Policy to Combat Iron Deficiency in Developing Countries, Howarth E. Bouis, August 1994
02 Determinants of Credit Rationing: A Study of Informal Lenders and Formal Credit Groups in
Madagascar, Manfred Zeller, October 1994 03 The Extended Family and Intrahousehold Allocation: Inheritance and Investments in Children in the
Rural Philippines, Agnes R. Quisumbing, March 1995 04 Market Development and Food Demand in Rural China, Jikun Huang and Scott Rozelle, June 1995 05 Gender Differences in Agricultural Productivity: A Survey of Empirical Evidence, Agnes R.
Quisumbing, July 1995 06 Gender Differentials in Farm Productivity: Implications for Household Efficiency and Agricultural
Policy, Harold Alderman, John Hoddinott, Lawrence Haddad, and Christopher Udry, August 1995 07 A Food Demand System Based on Demand for Characteristics: If There Is "Curvature" in the Slutsky
Matrix, What Do the Curves Look Like and Why?, Howarth E. Bouis, December 1995 08 Measuring Food Insecurity: The Frequency and Severity of "Coping Strategies," Daniel G. Maxwell,
December 1995 09 Gender and Poverty: New Evidence from 10 Developing Countries, Agnes R. Quisumbing, Lawrence
Haddad, and Christine Peña, December 1995 10 Women's Economic Advancement Through Agricultural Change: A Review of Donor Experience,
Christine Peña, Patrick Webb, and Lawrence Haddad, February 1996 11 Rural Financial Policies for Food Security of the Poor: Methodologies for a Multicountry Research
Project, Manfred Zeller, Akhter Ahmed, Suresh Babu, Sumiter Broca, Aliou Diagne, and Manohar Sharma, April 1996
12 Child Development: Vulnerability and Resilience, Patrice L. Engle, Sarah Castle, and Purnima Menon,
April 1996 13 Determinants of Repayment Performance in Credit Groups: The Role of Program Design, Intra-Group
Risk Pooling, and Social Cohesion in Madagascar, Manfred Zeller, May 1996 14 Demand for High-Value Secondary Crops in Developing Countries: The Case of Potatoes in
Bangladesh and Pakistan, Howarth E. Bouis and Gregory Scott, May 1996 15 Repayment Performance in Group-Based credit Programs in Bangladesh: An Empirical Analysis,
Manohar Sharma and Manfred Zeller, July 1996 16 How Can Safety Nets Do More with Less? General Issues with Some Evidence from Southern Africa,
Lawrence Haddad and Manfred Zeller, July 1996 17 Remittances, Income Distribution, and Rural Asset Accumulation, Richard H. Adams, Jr., August 1996 18 Care and Nutrition: Concepts and Measurement, Patrice L. Engle, Purnima Menon, and Lawrence
Haddad, August 1996 19 Food Security and Nutrition Implications of Intrahousehold Bias: A Review of Literature, Lawrence
Haddad, Christine Peña, Chizuru Nishida, Agnes Quisumbing, and Alison Slack, September 1996

FCND DISCUSSION PAPERS
20 Macroeconomic Crises and Poverty Monitoring: A Case Study for India, Gaurav Datt and Martin Ravallion, November 1996
21 Livestock Income, Male/Female Animals, and Inequality in Rural Pakistan, Richard H. Adams, Jr.,
November 1996 22 Alternative Approaches to Locating the Food Insecure: Qualitative and Quantitative Evidence from
South India, Kimberly Chung, Lawrence Haddad, Jayashree Ramakrishna, and Frank Riely, January 1997
23 Better Rich, or Better There? Grandparent Wealth, Coresidence, and Intrahousehold Allocation, Agnes
R. Quisumbing, January 1997 24 Child Care Practices Associated with Positive and Negative Nutritional Outcomes for Children in
Bangladesh: A Descriptive Analysis, Shubh K. Kumar Range, Ruchira Naved, and Saroj Bhattarai, February 1997
25 Water, Health, and Income: A Review, John Hoddinott, February 1997 26 Why Have Some Indian States Performed Better Than Others at Reducing Rural Poverty?, Gaurav Datt
and Martin Ravallion, March 1997 27 "Bargaining" and Gender Relations: Within and Beyond the Household, Bina Agarwal, March 1997 28 Developing a Research and Action Agenda for Examining Urbanization and Caregiving: Examples
from Southern and Eastern Africa, Patrice L. Engle, Purnima Menon, James L. Garrett, and Alison Slack, April 1997
29 Gender, Property Rights, and Natural Resources, Ruth Meinzen-Dick, Lynn R. Brown, Hilary Sims
Feldstein, and Agnes R. Quisumbing, May 1997 30 Plant Breeding: A Long-Term Strategy for the Control of Zinc Deficiency in Vulnerable Populations,
Marie T. Ruel and Howarth E. Bouis, July 1997 31 Is There an Intrahousehold 'Flypaper Effect'? Evidence from a School Feeding Program, Hanan
Jacoby, August 1997 32 The Determinants of Demand for Micronutrients: An Analysis of Rural Households in Bangladesh,
Howarth E. Bouis and Mary Jane G. Novenario-Reese, August 1997 33 Human Milk—An Invisible Food Resource, Anne Hatløy and Arne Oshaug, August 1997 34 The Impact of Changes in Common Property Resource Management on Intrahousehold Allocation,
Philip Maggs and John Hoddinott, September 1997 35 Market Access by Smallholder Farmers in Malawi: Implications for Technology Adoption, Agricultural
Productivity, and Crop Income, Manfred Zeller, Aliou Diagne, and Charles Mataya, September 1997 36 The GAPVU Cash Transfer Program in Mozambique: An assessment, Gaurav Datt, Ellen Payongayong,
James L. Garrett, and Marie Ruel, October 1997 37 Why Do Migrants Remit? An Analysis for the Dominican Sierra, Bénédicte de la Brière, Alain de
Janvry, Sylvie Lambert, and Elisabeth Sadoulet, October 1997

FCND DISCUSSION PAPERS
38 Systematic Client Consultation in Development: The Case of Food Policy Research in Ghana, India, Kenya, and Mali, Suresh Chandra Babu, Lynn R. Brown, and Bonnie McClafferty, November 1997
39 Whose Education Matters in the Determination of Household Income: Evidence from a Developing
Country, Dean Jolliffe, November 1997 40 Can Qualitative and Quantitative Methods Serve Complementary Purposes for Policy Research?
Evidence from Accra, Dan Maxwell, January 1998 41 The Political Economy of Urban Food Security in Sub-Saharan Africa, Dan Maxwell, February 1998 42 Farm Productivity and Rural Poverty in India, Gaurav Datt and Martin Ravallion, March 1998 43 How Reliable Are Group Informant Ratings? A Test of Food Security Rating in Honduras, Gilles
Bergeron, Saul Sutkover Morris, and Juan Manuel Medina Banegas, April 1998 44 Can FAO's Measure of Chronic Undernourishment Be Strengthened?, Lisa C. Smith, with a Response
by Logan Naiken, May 1998 45 Does Urban Agriculture Help Prevent Malnutrition? Evidence from Kampala, Daniel Maxwell, Carol
Levin, and Joanne Csete, June 1998 46 Impact of Access to Credit on Income and Food Security in Malawi, Aliou Diagne, July 1998 47 Poverty in India and Indian States: An Update, Gaurav Datt, July 1998 48 Human Capital, Productivity, and Labor Allocation in Rural Pakistan, Marcel Fafchamps and Agnes R.
Quisumbing, July 1998 49 A Profile of Poverty in Egypt: 1997, Gaurav Datt, Dean Jolliffe, and Manohar Sharma, August 1998. 50 Computational Tools for Poverty Measurement and Analysis, Gaurav Datt, October 1998 51 Urban Challenges to Food and Nutrition Security: A Review of Food Security, Health, and Caregiving
in the Cities, Marie T. Ruel, James L. Garrett, Saul S. Morris, Daniel Maxwell, Arne Oshaug, Patrice Engle, Purnima Menon, Alison Slack, and Lawrence Haddad, October 1998
52 Testing Nash Bargaining Household Models With Time-Series Data, John Hoddinott and Christopher
Adam, November 1998 53 Agricultural Wages and Food Prices in Egypt: A Governorate-Level Analysis for 1976-1993, Gaurav
Datt and Jennifer Olmsted, November 1998 54 Endogeneity of Schooling in the Wage Function: Evidence from the Rural Philippines, John Maluccio,
November 1998 55 Efficiency in Intrahousehold Resource Allocation, Marcel Fafchamps, December 1998 56 How Does the Human Rights Perspective Help to Shape the Food and Nutrition Policy Research
Agenda?, Lawrence Haddad and Arne Oshaug, February 1999 57 The Structure of Wages During the Economic Transition in Romania, Emmanuel Skoufias, February
1999

FCND DISCUSSION PAPERS
58 Women's Land Rights in the Transition to Individualized Ownership: Implications for the Management of Tree Resources in Western Ghana, Agnes Quisumbing, Ellen Payongayong, J. B. Aidoo, and Keijiro Otsuka, February 1999
59 Placement and Outreach of Group-Based Credit Organizations: The Cases of ASA, BRAC, and
PROSHIKA in Bangladesh, Manohar Sharma and Manfred Zeller, March 1999 60 Explaining Child Malnutrition in Developing Countries: A Cross-Country Analysis, Lisa C. Smith and
Lawrence Haddad, April 1999 61 Does Geographic Targeting of Nutrition Interventions Make Sense in Cities? Evidence from Abidjan
and Accra, Saul S. Morris, Carol Levin, Margaret Armar-Klemesu, Daniel Maxwell, and Marie T. Ruel, April 1999
62 Good Care Practices Can Mitigate the Negative Effects of Poverty and Low Maternal Schooling on
Children's Nutritional Status: Evidence from Accra, Marie T. Ruel, Carol E. Levin, Margaret Armar-Klemesu, Daniel Maxwell, and Saul S. Morris, April 1999
63 Are Urban Poverty and Undernutrition Growing? Some Newly Assembled Evidence, Lawrence Haddad,
Marie T. Ruel, and James L. Garrett, April 1999 64 Some Urban Facts of Life: Implications for Research and Policy, Marie T. Ruel, Lawrence Haddad,
and James L. Garrett, April 1999 65 Are Determinants of Rural and Urban Food Security and Nutritional Status Different? Some Insights
from Mozambique, James L. Garrett and Marie T. Ruel, April 1999 66 Working Women in an Urban Setting: Traders, Vendors, and Food Security in Accra, Carol E. Levin,
Daniel G. Maxwell, Margaret Armar-Klemesu, Marie T. Ruel, Saul S. Morris, and Clement Ahiadeke, April 1999
67 Determinants of Household Access to and Participation in Formal and Informal Credit Markets in
Malawi, Aliou Diagne, April 1999 68 Early Childhood Nutrition and Academic Achievement: A Longitudinal Analysis, Paul Glewwe, Hanan
Jacoby, and Elizabeth King, May 1999 69 Supply Response of West African Agricultural Households: Implications of Intrahousehold Preference
Heterogeneity, Lisa C. Smith and Jean-Paul Chavas, July 1999 70 Child Health Care Demand in a Developing Country: Unconditional Estimates from the Philippines,
Kelly Hallman, August 1999 71 Social Capital and Income Generation in South Africa, 1993-98, John Maluccio, Lawrence Haddad,
and Julian May, September 1999 72 Validity of Rapid Estimates of Household Wealth and Income for Health Surveys in Rural Africa, Saul
S. Morris, Calogero Carletto, John Hoddinott, and Luc J. M. Christiaensen, October 1999 73 Social Roles, Human Capital, and the Intrahousehold Division of Labor: Evidence from Pakistan,
Marcel Fafchamps and Agnes R. Quisumbing, October 1999 74 Can Cash Transfer Programs Work in Resource-Poor Countries? The Experience in Mozambique, Jan
W. Low, James L. Garrett, and Vitória Ginja, October 1999

FCND DISCUSSION PAPERS
75 Determinants of Poverty in Egypt, 1997, Gaurav Datt and Dean Jolliffe, October 1999 76 Raising Primary School Enrolment in Developing Countries: The Relative Importance of Supply and
Demand, Sudhanshu Handa, November 1999 77 The Political Economy of Food Subsidy Reform in Egypt, Tammi Gutner, November 1999.
78 Determinants of Poverty in Mozambique: 1996-97, Gaurav Datt, Kenneth Simler, Sanjukta Mukherjee,
and Gabriel Dava, January 2000 79 Adult Health in the Time of Drought, John Hoddinott and Bill Kinsey, January 2000
80 Nontraditional Crops and Land Accumulation Among Guatemalan Smallholders: Is the Impact
Sustainable? Calogero Carletto, February 2000 81 The Constraints to Good Child Care Practices in Accra: Implications for Programs, Margaret Armar-
Klemesu, Marie T. Ruel, Daniel G. Maxwell, Carol E. Levin, and Saul S. Morris, February 2000 82 Pathways of Rural Development in Madagascar: An Empirical Investigation of the Critical Triangle of
Environmental Sustainability, Economic Growth, and Poverty Alleviation, Manfred Zeller, Cécile Lapenu, Bart Minten, Eliane Ralison, Désiré Randrianaivo, and Claude Randrianarisoa, March 2000
83 Quality or Quantity? The Supply-Side Determinants of Primary Schooling in Rural Mozambique,
Sudhanshu Handa and Kenneth R. Simler, March 2000 84 Intrahousehold Allocation and Gender Relations: New Empirical Evidence from Four Developing
Countries, Agnes R. Quisumbing and John A. Maluccio, April 2000 85 Intrahousehold Impact of Transfer of Modern Agricultural Technology: A Gender Perspective, Ruchira
Tabassum Naved, April 2000 86 Women’s Assets and Intrahousehold Allocation in Rural Bangladesh: Testing Measures of Bargaining
Power, Agnes R. Quisumbing and Bénédicte de la Brière, April 2000 87 Changes in Intrahousehold Labor Allocation to Environmental Goods Collection: A Case Study from
Rural Nepal, Priscilla A. Cooke, May 2000 88 The Determinants of Employment Status in Egypt, Ragui Assaad, Fatma El-Hamidi, and Akhter U.
Ahmed, June 2000 89 The Role of the State in Promoting Microfinance Institutions, Cécile Lapenu, June 2000 90 Empirical Measurements of Households’ Access to Credit and Credit Constraints in Developing
Countries: Methodological Issues and Evidence, Aliou Diagne, Manfred Zeller, and Manohar Sharma, July 2000
91 Comparing Village Characteristics Derived From Rapid Appraisals and Household Surveys: A Tale
From Northern Mali, Luc Christiaensen, John Hoddinott, and Gilles Bergeron, July 2000 92 Assessing the Potential for Food-Based Strategies to Reduce Vitamin A and Iron Deficiencies: A
Review of Recent Evidence, Marie T. Ruel and Carol E. Levin, July 2000 93 Mother-Father Resource Control, Marriage Payments, and Girl-Boy Health in Rural Bangladesh,
Kelly K. Hallman, September 2000

FCND DISCUSSION PAPERS
94 Targeting Urban Malnutrition: A Multicity Analysis of the Spatial Distribution of Childhood Nutritional Status, Saul Sutkover Morris, September 2000
95 Attrition in the Kwazulu Natal Income Dynamics Study 1993-1998, John Maluccio, October 2000 96 Attrition in Longitudinal Household Survey Data: Some Tests for Three Developing-Country Samples,
Harold Alderman, Jere R. Behrman, Hans-Peter Kohler, John A. Maluccio, Susan Cotts Watkins, October 2000
97 Socioeconomic Differentials in Child Stunting Are Consistently Larger in Urban Than in Rural Areas,
Purnima Menon, Marie T. Ruel, and Saul S. Morris, December 2000 98 Participation and Poverty Reduction: Issues, Theory, and New Evidence from South Africa, John
Hoddinott, Michelle Adato, Tim Besley, and Lawrence Haddad, January 2001 99 Cash Transfer Programs with Income Multipliers: PROCAMPO in Mexico, Elisabeth Sadoulet, Alain
de Janvry, and Benjamin Davis, January 2001 100 On the Targeting and Redistributive Efficiencies of Alternative Transfer Instruments, David Coady and
Emmanuel Skoufias, March 2001 101 Poverty, Inequality, and Spillover in Mexico’s Education, Health, and Nutrition Program, Sudhanshu
Handa, Mari-Carmen Huerta, Raul Perez, and Beatriz Straffon, March 2001 102 School Subsidies for the Poor: Evaluating a Mexican Strategy for Reducing Poverty, T. Paul Schultz,
March 2001 103 Targeting the Poor in Mexico: An Evaluation of the Selection of Households for PROGRESA,
Emmanuel Skoufias, Benjamin Davis, and Sergio de la Vega, March 2001 104 An Evaluation of the Impact of PROGRESA on Preschool Child Height, Jere R. Behrman and John
Hoddinott, March 2001